Te Pukapuka Houanga Whaimana o Aotearoa
Statistics New Zealand
In answer to a telephone call, email, visit or letter, Statistics New Zealand information analysts can provide statistical information, or tell you more about the department's other services, including how to access statistics on the INFOS computer database and the Statistics New Zealand website.
Website:
www.stats.govt.nz
Telephone: 0508-525-525 (toll free)
Email: info@stats.govt.nz
| AUCKLAND | WELLINGTON | CHRISTCHURCH |
|---|---|---|
| 70 Symonds Street | Aorangi House | Dollan House |
| Private Bag 92003 | 85 Molesworth Street | 401 Madras Street |
| Telephone: (09) 920-9100 | PO Box 2922 | Private Bag 4741 |
| Facsimile: (09) 920-9198 | Telephone: (04) 931-4600 | Telephone: (03) 964-8700 |
| Facsimile: (04) 931-4610 | Facsimile: (03) 964-8964 |
The New Zealand flag
The New Zealand flag is the symbol of the realm, government and people of New Zealand. The flag features, on a royal blue background, a Union Jack in the first quarter and four five-pointed red stars of the Southern Cross on the fly. The stars have white borders. The royal blue background is reminiscent of New Zealand's blue sea and clear sky, while the stars of the Southern Cross emphasise New Zealand's location in the South Pacific Ocean. The Union Jack gives recognition to New Zealand's historical foundations and the fact that the country was once a British colony and dominion.
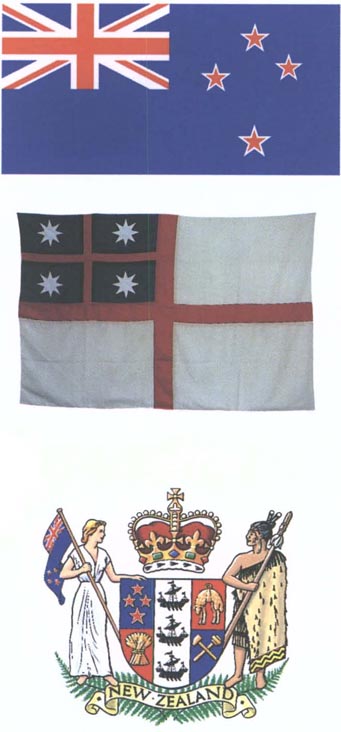
Te Hakituatahi o Aotearoa -
1835
The first flag
of New Zealand
For a detailed history of Te Hakituatahi o Aotearoa, see Chapter 3: Government. The flag features, on a white field, a red St George's Cross. In the upper canton next to the staff, on a blue field, a smaller St George's Cross in red, severed from the blue by a fimbriation of black half the width of the red, and, in the centre of each blue quarter, a white eight-pointed star.
The New Zealand coat of arms
New Zealand has had its own coat of arms since 1911. Before that the United Kingdom coat of arms (featuring a lion and a unicorn on either side of a shield and crown) was used. This design still adorns the top of the pediment on the Old Government Buildings in Lambton Quay, Wellington, which were built in 1875 to house the colony's public service, but which now house Victoria University's law school. One of the few specific changes to flow on from the granting of Dominion status in 1907 was the right for New Zealand to have its own coat of arms. The design was approved by royal warrant on 26 August 1911. The coat of arms was revised in 1956 following further constitutional changes when the country became the ‘Realm of New Zealand’ instead of the ‘Dominion of New Zealand’. Accordingly, the British lion holding aloft the Union Jack was replaced by St Edward's Crown, worn by Queen Elizabeth II at her coronation. At the same time, the dress of the figures at the side of the shield was revamped, some Victorian-looking scroll work at the base of the design was replaced by two ferns, and the motto ‘Onward’ was replaced with ‘New Zealand’.
New Zealand Official Yearbook
2004
ISSN 0078
0170
ISBN 0-478-26925-0
This book is copyright. Except for the purpose of fair review, no part may be stored or transmitted in any form or by any means, electronic or mechanical, including recording or storage in any information retrieval systems, without permission in writing from the publisher. No reproduction may be made, whether by photocopying or by any other means, unless a licence has been obtained from the publisher or their agent.
Copyright © Statistics New Zealand 2004.
Published in 2004 by David Bateman Ltd, 30 Tarndale Grove, Albany, Auckland, New Zealand.
Printed by PrintLink, Wellington, New Zealand.
Table of Contents
List of Figures
- 1.02. Climate norms
- 3.03. Voter turnout
- 4.01. Overseas representation
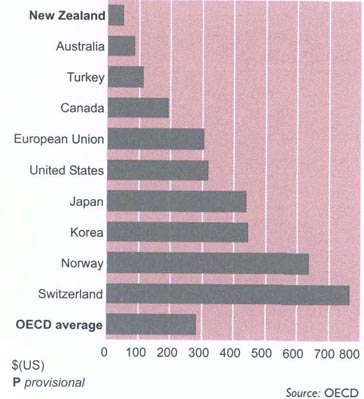
- 4.02. Net official development assistance
As proportion of gross national product Years ending 31 December1
- 5.06. Components of annual population changeNatural increase1 and net
migration2 Years ending 31 March
- 9.02. Tertiary attendance 2002
- 10.01. Convictions by offence type
- 10.02. Sentences for all offences
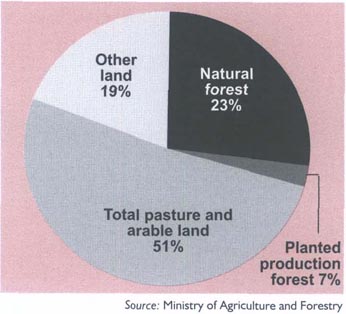
- 16.01. Land use
- 16.05. Parks of New Zealand
- 16.06. Whale sanctuaries
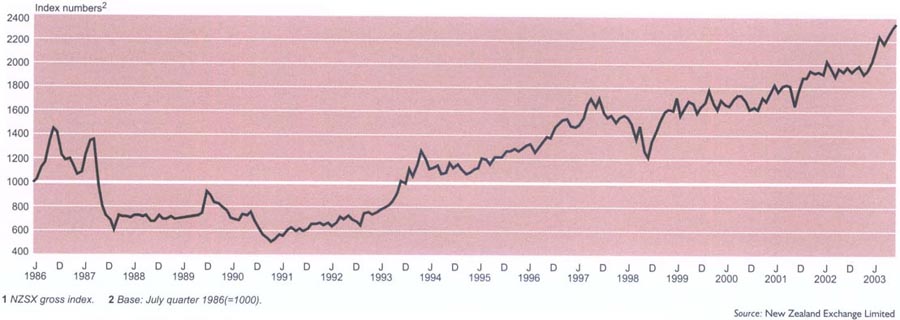
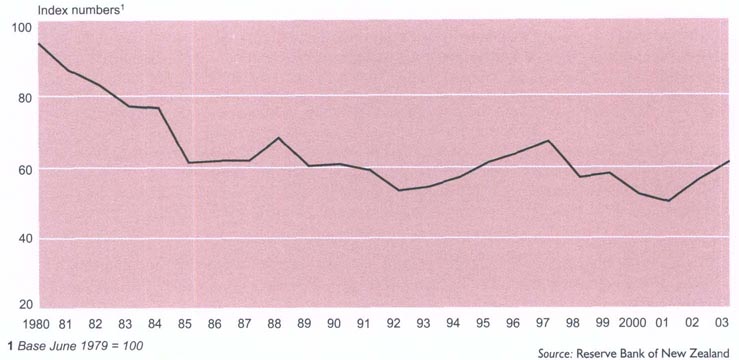
- 24.01. Share price
index1
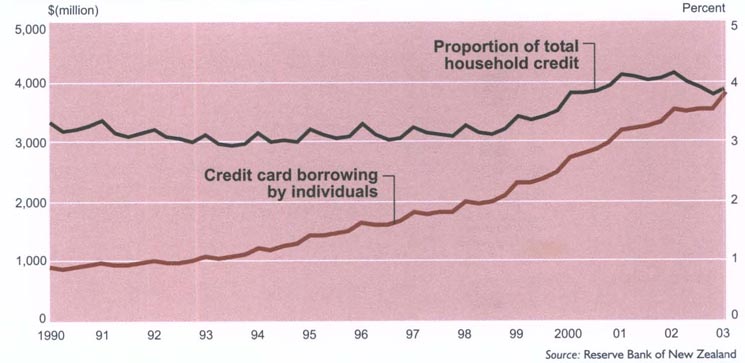
- 26.01. Credit card debt
- 26.02. Key market rates
- 26.03. Trade-weighted index
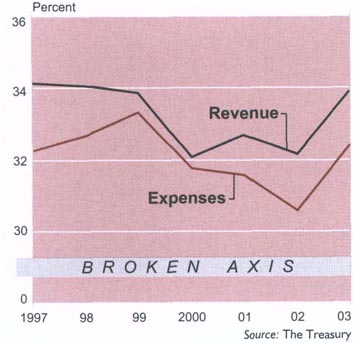
- 27.01. Revenue and expenses
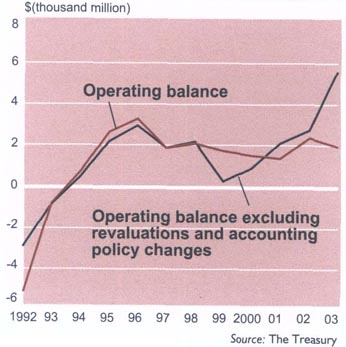
- 27.02. Operating balance
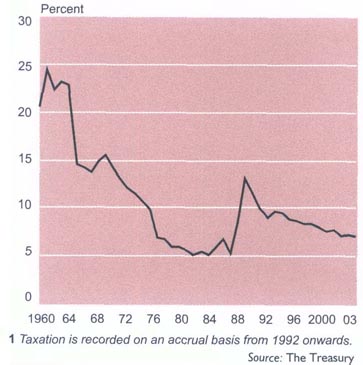
- 27.03. Customs and excise receipts
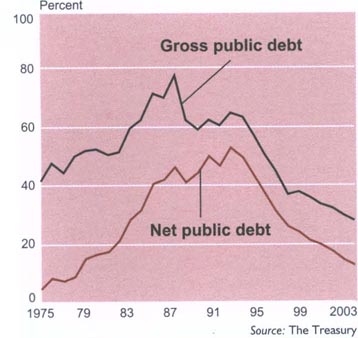
- 27.04. Public debt
List of Tables
- 1.02. Principal mountains
- 1.03. Principal rivers1
- 1.04. Principal lakes1
- 4.05. State of the navy
- 4.07. State of the army
- 4.09. State of the air force
- 6.04. Religious affiliation1
- 9.05. Secondary school leavers in 2002 By level of highest attainment,
gender and ethnic identification
- 9.13. Education 1875-2002
- 10.11. Sentencing for all offences1
- 10.13. Community-based sentences1
- 11.04. Magazine circulation1
- 11.08. Articles posted
- 11.1. 2001-2003 Stamp issues
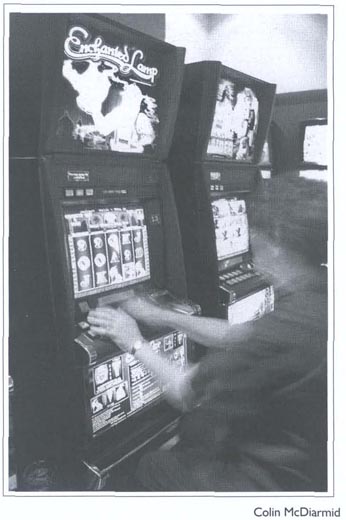
- 13.1. Gaming statistics
Non-inflation adjusted for years ending 30 June1 rounded to the nearest million
- 14.01. Movable public holidays
- 14.16. Median weekly earnings
Full-time wage and salary workers
By age and sex
Quarter ending 30 June 2003
- 16.01. Land
use1
- 18.03. Sheep categories
At 30 June
- 18.04. Cattle categories
At 30 June
- 18.06. Average net schedule prices
- 18.16. Pigs
At 30 June
- 23.04. Formed roads and streets
- 24.06. Credit card usage1
By value
- 27.09. Refinancing/repricing risk
Table of Contents
This 104th edition of the New Zealand Official Yearbook continues the tradition of providing a comprehensive picture of New Zealand society based on the most recent and accurate information available.
Any chronicle with a publishing history of more than 100 years needs to evolve to ensure that it continues to meet the needs and expectations of its users. In the case of the 2004 edition of the Yearbook, the result is a more concise, easy-to-read format, in some cases replacing the more technical content of the past.
At the same time, care has been taken to retain and build upon the statistical tables, graphs and historical time series which have been the hallmark of previous Yearbooks. These and sidebar stories and photographs highlight the changes that have occurred in many aspects of New Zealand life since production of the 2002 Yearbook.
Statistics New Zealand is aware that more and more people are turning to the internet for their informational needs, and each chapter of Yearbook 2004 provides a comprehensive list of website links to contributors and organisations mentioned. Further information on much of the statistical information included in the Yearbook can be found on Statistics New Zealand's comprehensive website, www.stats.govt.nz. However, for the more than 60 percent of New Zealand households in private dwellings which the 2001 Census showed did not have internet access, the Yearbook remains an invaluable reference tool.
I would like to offer special thanks to the New Zealand Official Yearbook 2004 team for the high standards they have achieved and to publisher David Bateman Ltd for providing a high-quality finished product.
On behalf of Statistics New Zealand, I would also like to thank the 400 businesses, government departments, non-government organisations, academic institutions and individuals for their time, effort and goodwill in providing and updating contributions to the Yearbook. Their high level of cooperation, not only with the Yearbook but with all our surveys, ensures the continuing high quality of our official statistics.

Brian Pink
Government Statistician
The New Zealand Official Yearbook 2004 was produced by the Information and Publishing Services Division of Statistics New Zealand, with the assistance of the many individuals and organisations listed in the ‘Contributors’ section at the end of each chapter, or below the sidebars. The department thanks them and the following:
Divisional Manager: Kevin Eddy
Publishing Services Manager: David Town
Editor: Paul Cavanagh
Production Editor: Marie Smith
Editorial support: Teresa Schischka
Illustrations research: Margaret Low
Typesetting: Horiana Honotapu
Graphics: Maureen Metcalfe, Sandra Mackenzie
Technical assistance: Kevin Tompson
As a new reader of the New Zealand Official Yearbook, you may be surprised at the range of the information within its pages. The following notes are to help familiarise you with the book.
The New Zealand Official Yearbook is published as a compendium of facts and figures on New Zealand and describes major changes in New Zealand's administrative, economic and financial framework in the two years since the preceding publication.
There are two likely ways you will look for information.
If your question is general, for example ‘How is New Zealand governed?’, then you will probably refer firstly to the Contents (overleaf), which lists chapter headings and major sections within chapters. In approaching the book this way, it is worth bearing in mind that the 27 chapters follow a ‘logical’ progression. The first few chapters describe the physical setting of New Zealand, as well as its history, its system of government and its international relations. A description of its people comes next, followed by its social framework and its institutions. Later chapters, beginning with an overview of the New Zealand workforce, describe the activities of the economy's constituent sectors.
If, on the other hand, your question is more specific, for example ‘How many casinos are there in New Zealand, and where are they located?’, then the book is thoroughly indexed. A brief note on the system used can be found at the beginning of the index.
Statistics New Zealand has made every effort to obtain, analyse and edit the information and statistics used in the New Zealand Official Yearbook 2004. However, Statistics New Zealand gives no warranty that the information or data supplied contains no errors, and will not be liable for any loss or damage caused by the use, directly or indirectly, of material contained in the Yearbook.

Table of Contents
Just after dawn in Wanaka.
New Zealand lies in the south-west Pacific Ocean and comprises two main and a number of smaller islands. Their combined area of 267,707 square kilometres is similar in size to Japan or the British Isles. Table 1.01 gives more details of the size of the islands.
The main North and South Islands are separated by Cook Strait, which, at its narrowest point, is 20 kilometres wide.
The North and South Islands lie on an axis running from north-east to south-west, except for the low-lying Northland peninsula.
The administrative boundaries of New Zealand extend from 33° to 53° south latitude, and from 160° east to 173° west longitude.
In addition to the main and nearby islands, New Zealand also includes the small inhabited outlying islands of the Chathams, 850 kilometres east of Christchurch; Raoul Island, in the Kermadec Group, 930 kilometres north-east of the Bay of Islands; and Campbell Island, 590 kilometres south of Stewart Island.
New Zealand also has jurisdiction over the territories of Tokelau and the Ross Dependency.
Table 1.01. Land area of New Zealand1
| Land area | Size (sq km) |
|---|---|
1Includes all internal waterways (lakes and rivers). 2Includes all offshore islands 20 square kilometres or larger, except those listed separately. Source: Land Information New Zealand | |
| North Island | 114,154 |
| South Island | 150,416 |
| Stewart Island/Rakiura | 1,681 |
| Chatham Islands | 963 |
| Raoul Island | 34 |
| Campbell Island/Motu Ihupuku | 113 |
| Offshore islands2 | 346 |
New Zealand is more than 1,600 kilometres long and 450 kilometres wide at its widest part, and has a long coastline (more than 18,000 kilometres) for its area. The coast is very indented in places, providing many natural harbours.
The country is also very mountainous, with about three-quarters of the land 200 metres or more above sea level.
In the North Island, the main ranges run generally north-east to south-west, parallel to the coast, from East Cape to Cook Strait, with further ranges and four volcanic peaks to the north-west.
The South Island is much more mountainous than the North Island, with the Southern Alps, a massive mountain chain, running nearly the length of the island. There are many outlying ranges to the Southern Alps in the north and the south-west of the South Island. New Zealand has at least 223 named peaks higher than 2,300 metres. Table 1.02 lists the highest mountains in both the North and South Islands.
Table 1.02. Principal mountains
| Mountain or peak | Elevation (metres) |
|---|---|
| North Island | |
1Taranaki or Egmont is the correct format for the dual name as prescribed in the 1986 Gazette. 2The Institute of Geological and Nuclear Sciences photogrametrically confirmed the height of Aoraki/Mt Cook as 3,754m after the 1991 slip from the peak. Source: Land Information New Zealand | |
| Ruapehu | 2,797 |
| Taranaki or Egmont1 | 2,518 |
| Ngauruhoe | 2,287 |
| Tongariro | 1,967 |
| South Island | |
| Aoraki/Mt Cook2 | 3,754 |
| Tasman | 3,497 |
| Dampier | 3,440 |
| Silberhorn | 3,300 |
| Hicks (St David's Dome) | 3,198 |
| Lendenfeldt | 3,194 |
| Torres | 3,163 |
| Teichelmann | 3,160 |
| Sefton | 3,157 |
| Malte Brun | 3,155 |
| Haast | 3,138 |
| Elie de Beaumont | 3,117 |
| Douglas | 3,085 |
| La Perouse | 3,079 |
| Heidinger | 3,066 |
| Minarets | 3,055 |
| Aspiring/Tititea | 3,033 |
| Glacier Peak | 3,007 |
There are 360 glaciers in the Southern Alps. The largest are, on the east, the Tasman (29 kilometres in length), Murchison (13 kilometres), Mueller (13 kilometres), Godley (13 kilometres) and Hooker (11 kilometres), and, on the west, the Fox (15 kilometres) and the Franz Josef (13 kilometres).
New Zealand's rivers (see Table 1.03) are mainly swift and difficult to navigate. They are important as sources of hydro-electric power, and artificial lakes have been created as part of major hydro-electric schemes.
Table 1.03. Principal rivers1
| River | Length (kms) |
|---|---|
1More than 150km in length from the mouth to the farthest point in the river system, irrespective of name, including estimated courses through lakes. Source: Land Information New Zealand | |
| North Island | |
| Flowing into the Pacific Ocean - | |
| Rangitaiki | 193 |
| Waihou | 175 |
| Mohaka | 172 |
| Ngaruroro | 154 |
| Flowing into the Tasman Sea - | |
| Waikato | 425 |
| Whanganui | 290 |
| Rangitikei | 241 |
| Manawatu | 182 |
| Whangaehu | 161 |
| Mokau | 158 |
| South Island | |
| Flowing into Cook Strait - | |
| Wairau | 169 |
| Flowing into the Pacific Ocean - | |
| Clutha/Matau | 322 |
| Taieri | 288 |
| Clarence | 209 |
| Waitaki | 209 |
| Waiau | 169 |
| Waimakariri | 161 |
| Flowing into Foveaux Strait - | |
| Mataura | 240 |
| Waiau | 217 |
| Oreti | 203 |
| Flowing into the Tasman Sea - | |
| Buller | 177 |
New Zealand's artificial lakes created by the South Island's hydro-electric schemes are identified in Table 1.04, which describes the country's principal lakes.
Table 1.04. Principal lakes1
| Lake | Maximum depth (metres) | Area (kms2) |
|---|---|---|
1Only lakes greater than 20 square kilometres in area are listed. Source: National Institute of Water and Atmospheric Research (depths) Land Information New Zealand (areas) | ||
| North Island | ||
| Taupo | 163 | 613 |
| Rotorua | 45 | 81 |
| Wairarapa | 3 | 77 |
| Waikaremoana | 248 | 50 |
| Tarawera | 87 | 41 |
| Rotoiti | 94 | 34 |
| Waikari | 2 | 34 |
| South Island | ||
| Te Anau | 417 | 344 |
| Wakatipu | 380 | 295 |
| Wanaka | 311 | 201 |
| Ellesmere | 2 | 197 |
| Pukaki | 99 | 172 |
| Manapouri | 444 | 139 |
| Hawea | 384 | 152 |
| Tekapo | 120 | 96 |
| Benmore (artificial) | 120 | 75 |
| Hauroko | 462 | 71 |
| Ohau | 129 | 59 |
| Poteriteri | uncharted | 44 |
| Brunner | 109 | 41 |
| Coleridge | 200 | 37 |
| Monowai | 161 | 32 |
| Aviemore (artificial) | 62 | 28 |
| Dunstan (artificial) | 70 | 27 |
| Rotoroa | 152 | 24 |
| McKerrow | 121 | 23 |
New Zealand is in an area of the world characterised by active volcanoes and frequent earthquakes. The ‘ring of fire’, as this area is known, forms a belt that surrounds the Pacific Ocean and is the surface expression of a series of boundaries between the plates that make up the earth's crust. The boundary between the Indo-Australian plate and the Pacific plate runs through New Zealand, and the processes from their collisions have had a profound effect on New Zealand's size, shape and geology.
Renewed mountain building in New Zealand between about six million years ago and the present is primarily responsible for the landscape of today.
Mountain chains have been built by folding and displacement of the earth's crust along faults or by flexing of the crustal plates due to sediment loading and unloading. Due to this activity, well-preserved tilted blocks bounded by fault scarps (steep faces hundreds or even thousands of metres high) are visible in the landscape of some regions.
Ongoing movement of the Pacific and Indo-Australian plates is responsible for continued earth strain in New Zealand, and this results in periodic rupture of faults, several of which caused major earthquakes during the past century.
Erosion, enhanced by climate, has transformed the landscape during this time, carving detailed patterns of peaks, ridges, valleys and gorges. The deposition of debris has built up alluvial plains, shingle fans and other construction forms.
At the coast, waves have eaten back headlands and built beaches, spits and bars. Glaciers have carved the sea-filled valleys of Fiordland and have occupied most valleys of the South Island, many of which now have lakes held in by terminal moraines. Sea level changes accompanied formation, and later melting, of global glacial ice. These changes affected the erosion and deposition of rivers and were responsible for the formation of many prominent river terraces.
Volcanic activity during the past few million years has played an important part in shaping the landscape of the central North Island. The largest volcanic outpourings of late geological times were in the region between Tongariro National Park and the Bay of Plenty coast.
The most recognisable volcanoes in New Zealand, all of which are active, include Ruapehu, Tongariro, Ngauruhoe, White Island, and Taranaki or Egmont. Other major volcanoes are less obvious but have even more dramatic impacts on the landscape. These are the caldera-forming volcanoes that are now occupied by large central North Island lakes. Lakes Taupo, Rotorua, and Tarawera can be thought of as upside down volcanoes.
Small volcanic cones, such as One Tree Hill, Mt Eden and Rangitoto, are an important part of the Auckland landscape. These are dormant, but the volcanic field is still regarded as posing a significant hazard.
The magnitude 6.6 Edgecumbe earthquake in the Bay of Plenty in 1987 severely twisted railway lines, causing this locomotive to disrail.
Living in New Zealand means living with earthquakes. There is an almost continuous belt of earthquake activity around the edge of the Pacific Ocean that affects the geological stability of many countries on the Pacific Rim, particularly New Zealand, the west coast of the United States, Chile, Peru, Japan and the Philippines. New Zealand's level of activity is similar to that of California, but slightly lower than that of Japan. A magnitude eight earthquake occurs in New Zealand about once a century, a magnitude seven earthquake averages out at once a decade and there is an average rate of one magnitude six earthquake a year.
New Zealand has many earthquakes because it straddles the boundary between two of the earth's great tectonic plates - the Pacific plate in the east and the Indo-Australian plate in the west, illustrated in figure 1.01. These two plates are converging obliquely at about 30 millimetres a year in Fiordland, increasing to about 50 millimetres a year at East Cape. The plates converge in different ways. In the North Island and the northern South Island, the Pacific plate sinks below the Indo-Australian plate.
Earthquakes originating within the subducting Pacific plate are less than 30 kilometres deep along the eastern coast, and become deeper westward.
In Fiordland and the region to the south, the Indo-Australian plate subducts beneath the Pacific plate, so the earthquake sources are shallow in the west and deeper in the east under Fiordland.
Between these two subduction zones, the crust of both plates is too buoyant to subduct, so the convergence is accommodated by uplift, which created the Southern Alps, and horizontal movement along the Alpine Fault. This results in parts of Nelson and western Otago, adjacent five million years ago, now being 450 kilometres apart.
The forces driving this sideways and upward movement create shallow earthquakes.
About two-thirds of New Zealand's earthquakes are deep, while shallow earthquakes originate within the earth's crust, which has an average thickness of 35 kilometres in New Zealand. Crustal earthquakes are responsible for almost all damage to property, and are widely scattered throughout New Zealand. In the Taupo volcanic zone, from White Island to Ruapehu, swarms of small earthquakes of similar magnitude are associated with the area's active volcanism. Although the number of shocks is alarming, they rarely cause damage.
Earthquake risk. The worst disaster that can reasonably be expected within a generation is a 7.5 magnitude earthquake on the segment of the Wellington fault within the city. It has a 12 percent probability of occurring within the next 30 years, and would affect 200,000 residential properties from Palmerston North to Nelson, as well as roads, bridges and dams, and services such as electricity, water and sewerage. The Institute of Geological and Nuclear Sciences (GNS) runs national and regional earthquake and volcano monitoring networks. A major upgrade of monitoring equipment commenced in 2001 with the Earthquake Commission providing core funding of $5 million a year over 10 years.
The new equipment is linked to GNS data centres via satellite and cellular and radio networks, permitting more rapid and reliable determinations of the location and magnitude of all significant earthquakes and volcanic activity within the New Zealand region. Such information underpins current and emerging research on geological hazards and is also available to civil defence and emergency management authorities and international earthquake centres worldwide.
New Zealand scientists undertake a large body of research aimed at improving understanding of, and ways to mitigate, seismic and volcanic risk in New Zealand. Mitigation measures include improved engineering design of buildings and infrastructure, better prepared communities and better regional planning.
The New Zealand region is characterised by both a high density of active volcanoes and a high frequency of eruptions. Volcanic activity in New Zealand occurs within the North Island and offshore to the north-east in the Kermadec Islands. In the past 150 years, volcanoes have killed more people than earthquakes (see Table 1.05), yet the scale and style of historically recorded volcanic activity is dwarfed by events known to have occurred in the past 2,000 to 5,000 years.
Volcanism. New Zealand volcanism is confined to five areas in the North Island - the Bay of Islands, Whangarei, Auckland, a zone extending from White Island to Ruapehu, and Taranaki or Egmont. The area from White Island to Ruapehu is known as the Taupo Volcanic Zone and is by far the most frequently active. There are three major types of volcano in New Zealand:
Volcanic fields such as Auckland, where each eruption builds a single small volcano (eg Mt Eden), which does not erupt again. The next eruption in the field occurs at a different place, the site of which cannot be predicted until the eruption is imminent.
Cone volcanoes such as Taranaki or Egmont and Ruapehu, where a succession of small eruptions occurs from roughly the same point on the earth's surface. The products of successive eruptions accumulate close to the vent to form a large cone, which is the volcano itself. The site of future eruptions can generally be predicted.
Caldera volcanoes such as Taupo and Rotorua. Eruptions at these volcanoes are occasionally so large that the ground surface collapses into the ‘hole’ left behind. For example, Lake Taupo infills a caldera formed in two episodes about 1,800 and 26,000 years ago.
The Taupo Volcanic Zone contains three frequently active cone volcanoes (Ruapehu, Tongariro/Ngauruhoe and White Island) and two of the most productive caldera volcanoes (Taupo and Okataina) in the world.
Casualties. Deaths due directly or indirectly to volcanism (and associated hydrothermal explosions) represent the biggest single source of fatalities from natural disasters in New Zealand since 1846. Economic loss due to volcanism, however, has been low compared with that from earthquakes or flooding. The cost of the 1995 and 1996 eruptions of Ruapehu has been estimated at $130 million. However, an assessment of the size and style of volcanic eruptions in the geologically recent past, coupled with consideration of the economic development of New Zealand, especially in the central North Island, shows that the record since 1846 represents only a fraction of the type and size of hazard posed by New Zealand volcanism.
Table 1.05. Deaths in volcanic areas since 1846
| Year | Location (eruption) | Cause - hazard | Fatalities |
|---|---|---|---|
| Source: Institute of Geological and Nuclear Sciences | |||
| 1846 | Waihi (Lake Taupo) | Debris avalanche/mudflow from thermal area | c60 |
| 1886 | Tarawera Rift | Large volcanic eruption | >108 |
| 1903 | Waimangu (Tarawera) | Hydrothermal explosion | 4 |
| 1910 | Waihi (Lake Taupo) | Debris avalanche/mudflow from thermal area | 1 |
| 1914 | White Island | Debris avalanche from crater wall | 11 |
| 1917 | Waimangu (Tarawera) | Hydrothermal explosion | 2 |
| 1953 | Tangiwai (Ruapehu) | Lahar and flood from crater lake | 151 |
| Total | >337 | ||
Surveillance. Volcanologists use three primary techniques to establish the ‘health’ of an active volcano:
Monitoring of volcanic earthquakes. This is done using closely-spaced networks of seismometers, designed to detect movement of magma (molten rock) below the surface and allow assessment of the possible onset and timing of eruptive activity. There are five volcano-seismic networks in New Zealand (Auckland, Bay of Plenty-Rotorua, Taranaki, Tongariro and Taupo).
Monitoring of ground deformation. This is done using precise geodetic surveys. The concept is that if magma is moving upwards before an eruption, it will cause the volcano to swell (ie the ground surface to rise), and this swelling can be detected. A novel version of this technique uses lakes at Taupo and Okataina as giant spirit levels.
Monitoring of volcanic gases. Magma at depth in the earth contains gases (carbon dioxide, together with various compounds of sulphur, chlorine and fluorine) dissolved in it. As the magma rises to shallow levels before an eruption, these gases are released and come to the surface via fumaroles. The temperatures and the abundance of the gases and their relative proportions give information on the state of the magma and how close to the surface it is.
In a volcanic crisis, practical steps can be taken to mitigate risk and lessen the threat to life, but this requires accurate perception of the onset of a crisis. This perception in turn depends on a knowledge of the ‘background’ or ‘normal’ levels of seismicity, ground movement and gas flux at the volcano, coupled with ‘real-time’ determination of any significant changes from this background. New Zealand has an active volcano surveillance programme to define these background levels.
New Zealand is surrounded by a large expanse of ocean, with Australia the nearest major land mass, about 1,600km to the west.
The climate of New Zealand is largely influenced by:
Its location in a latitude zone where the prevailing wind flow is westerly.
Its surrounding oceanic environment.
Its mountains, especially the main mountain chain, which modify weather systems as they pass eastwards, and which also provide a sheltering effect on the leeward side.
Day-to-day weather is mostly determined by a series of anticyclones and troughs of low pressure in the westerlies. Consequently. New Zealand's weather is changeable, typically with short periods of settled or unsettled weather. At times, the westerly regime breaks down and there are cold, southerly outbreaks, with snow in winter and sometimes spring; or northerly intrusions of warm, moist air when tropical depressions move southwards into New Zealand latitudes in the summer. The main mountain chain is a major barrier to weather systems approaching from the west. Consequently, there is a marked contrast between the climates of regions west and east of the mountains. This contrast is much greater than north-south climatic differences. Surrounding oceans have a moderating effect on temperatures in most northern and western regions. However, inland and eastern areas can experience large temperature variations. High temperatures usually occur in the east in warm, north-westerly wind conditions. These high temperatures are often followed by sudden falls in temperature, as cold fronts move up the east coast of both islands. Many parts of New Zealand are subject to extremes of wind and rain, occasionally causing wind damage to buildings and forests, and flooding as depressions with their fronts pass close to or over the country. The rugged terrain is an important factor in enhancement of wind strength and/or rainfall.
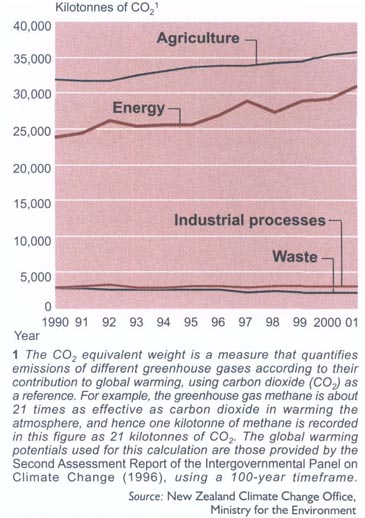
International climate change research reached a major milestone in January 2001 when the Intergovernmental Panel on Climate Change (IPCC) concluded there was comprehensive evidence of climate change during the 20th century caused by human activities. Key points raised in the IPCC report:
The global average surface temperature increased by about 0.6°C during the 20th century and sea levels in the tropical Pacific rose by about 2mm/year.
There was strong evidence that most of the warming was attributable to human activities (emissions of greenhouse gases and aerosols), and that anthropogenic (human-induced) climate change would persist for many centuries.
Projected increases in global mean temperatures from 1990 to 2100 for a range of plausible emission scenarios lie between 1.4 and 5.8°C. Global mean sea level changes lie between 9 and 88cm. Changes were expected in some extreme weather and climate events, including higher maximum temperatures and more hot days, more heavy rainfall events, and, in some areas, an increase in peak wind intensities.
What the warming climate will mean in detail for the South Pacific is still the subject of investigation by scientific researchers, with key emerging issues being changes in rainfall patterns and associated shifts in water resources and agricultural growing conditions.
Following is a summary of knowledge gained in the past decade about the effect of climate change on New Zealand.
Projected climate changes - Temperatures in New Zealand are likely to increase faster in the North Island than in the South Island, but generally less than global average temperatures. Rainfall is projected to increase in the west of the country and to decrease in many eastern regions. In the long term, rising seas are expected to increase erosion of vulnerable beaches and breach coastal protection structures more often.
Agriculture - The agricultural sector could benefit under climate change, but also faces risks. The key benefit to agriculture is likely to be from increased carbon dioxide concentrations, which could lead to greatly increased growth rates and water-use efficiency. In addition, warmer conditions and lengthened growing seasons could allow the long-term southward shift of climate-limited activities, and new crops and related industries could be introduced. The most significant risks include more droughts and floods in some areas, particularly in the east of New Zealand. Warmer temperatures could also make the growing of some current fruit crops in some northern areas uneconomical.
Native ecosystems - Climate change may add to pressure on ecosystems already under threat. Fragmented native forests of drier lowland environments in Northland, Waikato and Manawatu, and in the east from East Cape to Southland, are probably the most vulnerable to climate change.
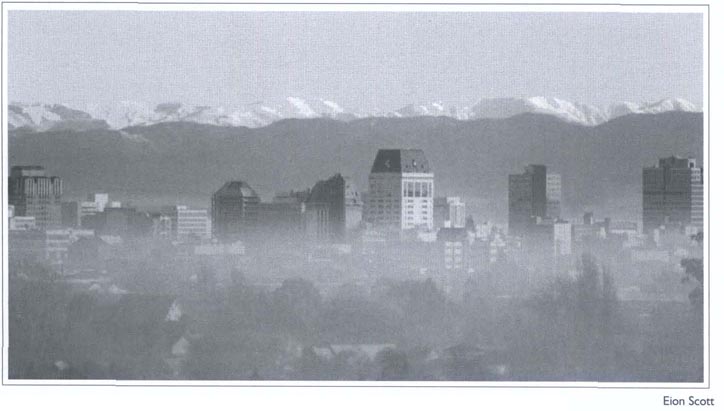
Urban environment, transport and energy - The main threat to the urban environment comes from possible increases in heavy rainfall, which would put pressure on drainage and stormwater systems and increase the risk of flooding in some areas. Warmer conditions will substantially reduce home heating costs, leading to reduced electricity demand during the peak winter season, but possibly increased demand for air conditioning during summer.
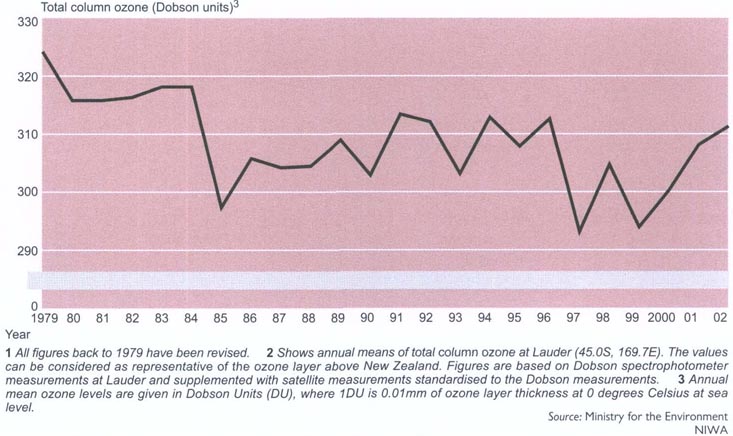
Health - Higher temperatures are expected to reduce winter illnesses, but could lead to higher death rates during summer. A warmer climate could also allow the spread of mosquitoes capable of transmitting diseases such as Ross River virus and dengue fever. Recent research has also found that climate change could lead to a delay in the recovery of the ozone layer. This would increase the period during which New Zealanders are exposed to high levels of ultraviolet radiation, which is known to lead to skin cancers. However, the possible effects of greenhouse gases on the ozone layer are still highly uncertain.
Table 1.06 lists predicted temperature and rainfall changes.
Table 1.06. Predicted changes in annual mean temperature and precipitation
Between 1970-1999 and
2070-2099
| Region | Temperature | Precipitation |
|---|---|---|
| Source: Ministry of Research, Science and Technology | ||
| Northland, Auckland | + 1.0° to +2.8°C | -10% to 0% |
| Western North Island from Waikato to Wellington | +0.8° to +2.7°C | 0% to +20% |
| Eastern North Island from Bay of Plenty to Wairarapa | +0.9° to +2.7°C | -20% to 0% |
| Nelson, Marlborough, to coastal Canterbury and Otago | +0.8° to +2.5°C | -20% to +5% |
| West Coast and Canterbury foothills | +0.6° to +2.5°C | +5% to +25% |
| Southland and inland Otago | +0.6° to +2.2°C | 0% to +30% |
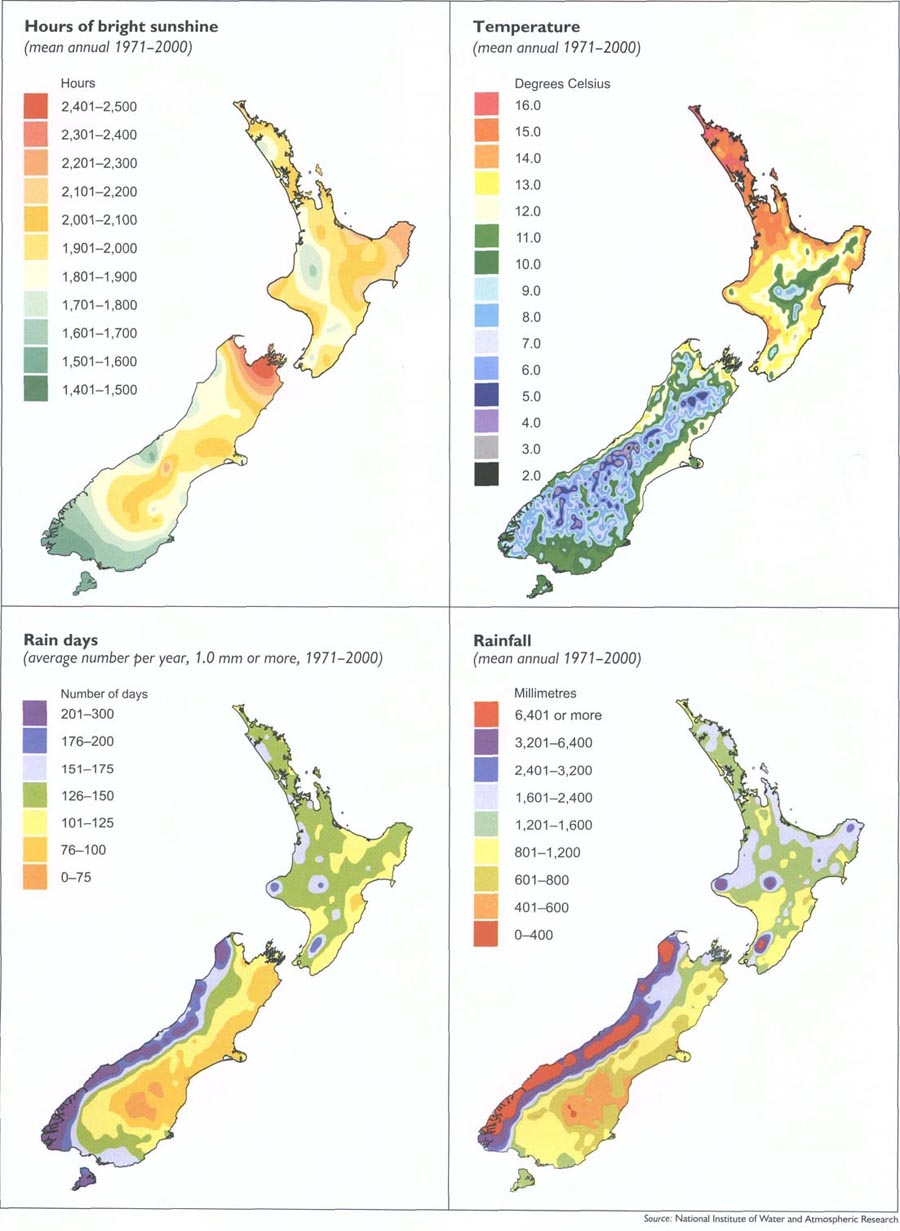
Climate extremes. The National Institute of Water and Atmospheric Research's annual climate summaries (available on its website www.niwa.cri.nz) contain detailed descriptions of extreme weather events for the year. These include extremes of temperatures and sunshine hours, and notable occurrences of snowfalls and frosts, droughts, floods and high rainfall, tornadoes, gales and high winds, and severe hailstorms. New Zealand's climate extremes as at 31 December 2003 are shown in Table 1.07 on page 10.
Figure 1.02 shows mean annual sunshine, temperature, rain days and rainfall for various parts of New Zealand. The maps are prepared by the National Institute of Water and Atmospheric Research (NIWA), and the mean annual figures are struck over a 30-year period to create what are referred to as ‘climate norms.’ The next ‘normal’ period for calculating mean annual figures will be 1981 to 2010.
2002. This year will be remembered for its high number of severe weather events and climate extremes. New records were set in many areas for rainfall, temperature and other climate extremes.
It was very dry in the Bay of Plenty, Nelson, Marlborough and North Otago, with above average sunshine hours in the eastern North Island, Westland and Southland.
One of the most notable severe weather events was the worst snowfall for many years in mid-Canterbury and inland Otago during June, leaving hundreds of travellers stranded, and thousands of homes without power.
A few days later, the ‘weather bomb’ brought high winds, intense rainfall and flooding in many northern and western areas, being especially severe over the Coromandel Peninsula.
Severe property damage was caused when slips sent an avalanche of water, mud and rocks into the township of Paekakariki, north of Wellington, in October 2003.
There were a dozen high-rainfall/flood-producing events and a high number of gale-force southerly wind episodes. Severe hailstorms hit throughout the country, and five tornadoes were reported. Lower than average pressures occurred south-east of the Chatham Islands with many more lows there than usual, bringing frequent stronger changeable westerly and south-westerly winds over the North Island, and southerlies and south-westerlies over the South Island. Seas around New Zealand were warmer than normal until October.
Analysis of month-by-month records for 2002 show:
The year's national average temperature was 12.5°C (the same as the 1961-1990 normal).
The highest recorded extreme air temperature for the year was 36.5°C, recorded at Darfield on 31 December, and the lowest -19.1°C (a new record low for June) at Tara Hills on the morning of 20 June.
The driest recorded centre was Alexandra, in Central Otago, with 371mm of rain for the year. Dunedin was the driest of the four main centres, with 647mm, and Wellington the wettest, with 1,250mm. Auckland received 1,075mm and Christchurch 785mm.
Christchurch was the sunniest of the three largest centres, with 2,166 sunshine hours, followed by Wellington (2,107 hours) and Auckland (2,034 hours). Nelson was the sunniest centre in 2002, with 2,580 hours, followed by Blenheim, with 2,534 hours. Tauranga recorded 2501 hours, well above average.
Table 1.07. Summary of New Zealand climate extremes
At 31 December 2003
| Source: National Institute of Water and Atmospheric Research | |||
|---|---|---|---|
| Rainfall Period | Amount (mm) | Location | Date |
| Highest | |||
| 10 minutes | 34 | Tauranga | 17 April 1948 |
| 1 hour | 109 | Leigh | 30 May 2001 |
| 12 hours | 473 | Colliers Creek (Hokitika Catchment) | 22 January 1994 |
| 24 hours | 682 | Colliers Creek (Hokitika Catchment) | 21-22 January 1994 |
| 48 hours | 1,049 | Waterfall, Cropp River (Hokitika Catchment) | 12-13 December 1995 |
| 1 calendar month | 2,927 | Waterfall, Cropp River (Hokitika Catchment) | December 1995 |
| 1 calendar year | 16,617 | Waterfall, Cropp River (Hokitika Catchment) | January-December 1998 |
| 365 days | 18,442 | Waterfall, Cropp River (Hokitika Catchment) | 29 October 1997-29 October 1998 |
| Lowest | |||
| 3 months | 9 | Cape Campbell | January-March 2001 |
| 6 months | 52 | Cape Campbell | Nov 2000-April 2001 |
| 12 months | 167 | Alexandra | Nov 1963-Oct 1964 |
| Longest rainless period | |||
| 71 days | 0 | Wai-iti, Marlborough | From 8 Feb 1939 |
| Temperature
extremes Location | Temperature (°C) | Date | |
| Highest air temperature | |||
| North Island | 39.2 | Ruatoria | 7 February 1973 |
| South Island | 42.4 | Rangiora | 7 February 1973 |
| Lowest air temperature | |||
| North Island | -13.6 | Chateau Tongariro | 7 July 1937 |
| South Island | -21.6 | Ophir | 3 July 1995 |
| Lowest grass minimum | -21.6 | Lake Tekapo | 4 August 1938 |
| Sunshine Location | Total (hours) | Date | |
| Highest in one year | |||
| North Island | 2,588 | Napier | 1994 |
| South Island | 2,711 | Nelson | 1931 |
| Highest in one month | |||
| North Island | 335 | Taupo | January 1950 |
| South Island | 336 | Nelson | December 1934 |
| Lowest in one year | |||
| North Island | 1,357 | Palmerston North | 1992 |
| South Island | 1,333 | Invercargill | 1983 |
| Lowest in one month | |||
| North Island | 27 | Taumarunui | June 2002 |
| South Island | 35 | Invercargill | June 1935 |
| Wind gusts Location | Speed (km/h) | Date | |
| North Island | 248 | Hawkins Hill, Wellington | 6 November 1959 and 4 July 1962 |
| South Island | 250 | Mt John, Canterbury | 18 April 1970 |
2003. This was a year of severe weather events and climate extremes involving very dry autumn conditions in many areas, extensive flooding and late snow storms. Overall, the year featured many new climate records and weather extremes. Analysis showed new records set in many months for rainfall, temperature and sunshine.
A very dry period from January through early May hit the southwest of the North Island and eastern regions of both islands, re-appearing in many eastern regions at the end of the year. There was a remarkably mild start to winter with the warmest June on record, followed by a very frosty July, and late frosts in October.
Five snowfall events occurred to low levels, and in October snowfall to the South Island hill country meant farmers lost thousands of newborn lambs to exposure.
There were at least 20 heavy rainfall events, of which nine produced floods, mainly in the North Island. The event producing the Paekakariki landslides in early October caused $2.5 million of damage.
NIWA analyses of month-by-month records for 2003 show:
The year's national average temperature was 12.7°C (0.1°C above the 1971-2000 normal).
The highest recorded extreme air temperature for the year was 36.0°C recorded at Middlemarch on 31 December. A late-summer heat wave occurred over the lower North Island, with new record maximum temperatures for any time of the year being recorded of 29.6°C at Paraparaumu on 28 February and 31.0°C at Levin on 2 March. June 2003 was the warmest in more than 150 years of measurement for New Zealand overall, with temperatures 2°C above average.
The lowest air temperature for the year was -14.8°C recorded at Tekapo on 13 July.
The driest rainfall recording locations were Alexandra, with 264.0mm, followed closely by Lauder, in Central Otago, with a record low 264.2mm of rain for the year. Christchurch was the driest of the four main centres, with 459mm, and Auckland the wettest, with 1,345mm. Of the regularly reporting gauges, the Cropp River gauge in Westland, inland in the headwaters of the Hokitika River, recorded the highest rainfall, with an annual total of 9,301mm.
Christchurch was the sunniest of the four main centres, with 2,362 sunshine hours, followed by Wellington (2,271 hours) and Auckland (2,047 hours). Dunedin recorded 1,971 hours. Nelson was the sunniest centre in 2003, with 2,707 hours, followed by Blenheim, with 2,663 hours.
The highest recorded wind gust for the year was 183 km/h at South West Cape (Stewart Island) on 16 November, with hurricane force northerlies and mean speeds as high as 132 km/h.
The islands of New Zealand separated from their nearest neighbours more than 80 million years ago.
Some of the original inhabitants endured times of turbulent change and violent upheaval, evolving and adapting to become part of a unique natural biota (or region). Other species died out (either nationally or regionally), unable to compete or survive environmental disturbances such as ice ages. For example, coconut palms were once found in New Zealand, and kauri, now confined to the north of the North Island, used to grow as far south as Canterbury. Over the years, the earliest inhabitants were joined by other plants and animals carried across the oceans by wind and current.
The pre-human community was notable for the absence of snakes, land mammals (apart from three species of bat) and many of the flowering plant families.
Whole orders and families were found only in New Zealand, including tuatara, moa and kiwi, all of the native lizards, and nearly 200 species of native earthworms.
Many remarkable plants, insects and birds evolved to fill ecological niches normally occupied by mammals. Others diversified to fill new territories created by sea-level fluctuations and land uplift.
With no mammalian predators on the ground, but avian predators everywhere, flightlessness was not a handicap, nor was size. Moa (11 species, some up to 3m tall) became extinct in pre-European times, but many other large flightless birds still remain, including kiwi, the nocturnal kākāpō (the only flightless parrot in the world) and weka (of the rail family).
Flightless insects are numerous, including many large beetles and 70 or so species of the cricket-like weta, found only in New Zealand.
New Zealand, with 84 species, has the most diverse seabird fauna of any country. Nearly half of all native bird species depend on the ocean for food, the feeding zones of some extending as far south as the Antarctic continent. New Zealand's extensive coastline and many islands offer a huge range of habitat, from estuary and mud-flat, to rocky cliffs and boulder bank.
The ocean itself is marvellously rich. There are about 400 different marine fish in the waters around New Zealand, as well as various species of seals, dolphins and porpoises. Twenty-nine species of whale have been recorded, and three of the largest (sperm, humpback and right) regularly migrate to New Zealand waters in spring and autumn.
The most widespread and complex type of forest in New Zealand is a podocarp (conifer) broadleaf association. It is generally found at lower altitudes and is characterised by a variety of species, a stratified canopy and an abundance of vines and epiphytic plants. Beech and kauri forests, by contrast, are much simpler in structure. New Zealand's beech species have close relatives in Australia and South America and the five different types of species in New Zealand have exploited habitats from valley floor to mountain tops. Kauri, true forest giants, dominate only in the warmer climes to the north.
Some of the most specialised plants are those occupying the alpine zone. A remarkable 25 percent of all New Zealand's plants can be found above the treeline. Ninety-three percent of all alpine plants are found only in New Zealand, compared with 80 percent for the rest of the higher plant species. Snow tussock herbfields are one of the most distinctive elements in this cold, windswept environment. Remarkably long-lived, some larger specimens may be several centuries old. Like beech trees, they seed infrequently, but in profusion.
A definitive feature of New Zealand's land-based plants and animals is their degree of specialisation and narrow habitat requirements (eg takahē/tussock grasslands; blue duck/fast flowing rivers and streams) and their evolution in the absence of mammalian predators (birds) or browsers (plants). This specialisation, and the adaptations which make New Zealand's wildlife so unique, render them extremely vulnerable to introduced predators, such as rats and cats; competitors, such as deer and possums; and loss of habitat.
The arrival of people in New Zealand heralded times of rapid change. Introduction (intentionally or accidentally) of exotic plants and animals, and the modification of habitat, radically affected native species populations. In the pre-1800 period, following the arrival and expansion of Māori, forest cover was reduced and 34 species became extinct, including moa, the adzebill and the flightless goose. In the much shorter post-1800 period of European settlement, the forest area was further reduced to around 25 percent of the land, nine more bird species became extinct and many more were threatened. Since 1840, more than 80 new species of mammals, birds and fish, and more than 1,800 plant species have been introduced, in many places totally changing the landscape and ecology.
One uniform time is kept throughout mainland New Zealand. This time is 12 hours ahead of Coordinated Universal Time (UTC) and is called New Zealand Standard Time (NZST). It is an atomic standard maintained by the Measurement Standards Laboratory, part of Industrial Research Ltd, Lower Hutt. One hour of daylight saving, called New Zealand Daylight Time (NZDT), which is 13 hours ahead of UTC, is observed from 2am (NZST) on the first Sunday in October, until 2am (NZST) on the third Sunday in March. Time kept in the Chatham Islands is 45 minutes ahead of that kept in New Zealand.
1.1 Land Information New Zealand (LINZ); Department of Geology, University of Canterbury; New Zealand Speleogical Soceity.
1.2 Institute of Geological and Nuclear Sciences Ltd; Department of Conservation.
1.3 National Institute of Water and Atmospheric Research Ltd (NIWA); Ministry of Research, Science and Technology.
1.4 Department of Conservation.
1.5 Industrial Research Ltd.
www.doc.govt.nz - Department of Conservation
www.gns.cri.nz - Institute of Geological and Nuclear Sciences Ltd
www.linz.govt.nz - Land Information New Zealand
www.weather.co.nz - Metservice
www.niwa.cri.nz - National Institute of Water and Atmospheric Research Ltd
www.terralinkinternational.com - Terralink International Ltd
Table of Contents
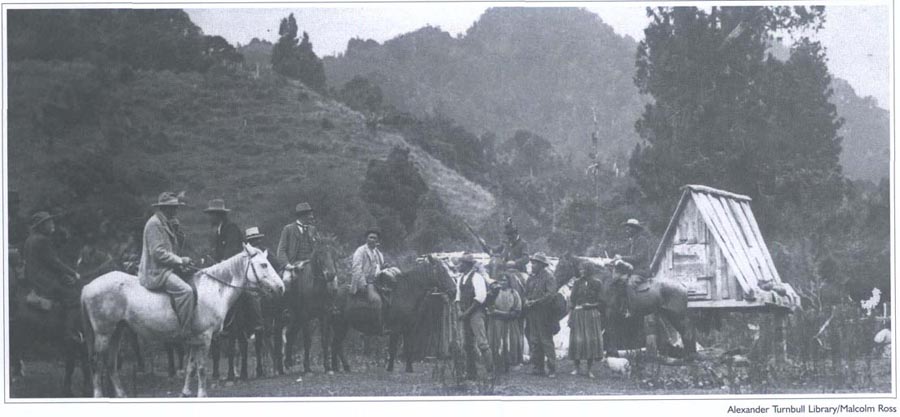
The Earl of Ranfurly (on grey horse), Governor of New Zealand from 1897 to 1904, rests with his party at a kainga on the Huia-rau Trail from Waikaremoana to Ruatoki in 1904.
The Polynesian ancestors of the Māori (meaning ‘ordinary’) people settled the main New Zealand islands (Aotearoa) about 800 years ago. They arrived - whether initially by accident or design is unclear - in waka (canoes) blown across the subtropics by prevailing north-east winds.
The settlers soon lost contact with their home islands and were forced to adapt to Aotearoa's more challenging physical environment. Annual cultivation of kumara (sweet potatoes) - a perennial crop in the tropics - was possible in the north through the underground winter storage of tubers. Birds, fish and small animals were caught and the resources of forests and oceans gathered. Large moa (flightless birds similar to emu), numerous in Te Wai Pounamu (the South Island), were eventually hunted to extinction. Fires lit to flush them out removed much of the forest east of the Southern Alps, and climatic changes made horticulture more difficult. Southern Māori increasingly lived in small hunter/gatherer groups and migrated seasonally to harvest resources.
Māori lived in groups of varying size that traced their descent from a common ancestor. Whānau (extended families of 10 to 30 people) were linked in hapū (subtribes), several of which made up an iwi. These distinctions were fluid: large whānau became hapū, and large hapū came to be seen as iwi, while other groups declined in status. iwi said to have arrived on the same migratory canoe were linked in loose confederations.
All aspects of Māori life were interrelated, with economic and social activities carried out on behalf of the whole community. While land belonged to large groups, smaller groups had rights to use specific areas and resources. Families were headed by kaumātua (elders) and communities by rangatira (chiefs), whose persons and possessions were tapu (spiritually protected). Tapu also safeguarded cultivations and urupā (burial grounds) and helped maintain social order. Tapu was regulated by tohunga (experts), who mediated spiritual forces, retained tribal history and knowledge, and had expertise in carving, tattooing and canoe building.
Tribal groups interacted through both trade and warfare. Regional products such as pounamu (jade or greenstone) and tītī (shearwaters or petrels, known as ‘muttonbirds’) were often transported long distances for bartering. Information was also exchanged among tribes. Travel was by waka, or on foot along beaches, riverbeds and ridges. There were footpaths in more densely populated areas, and tracks through forests.
One consequence of the slowness of travel was that even large iwi were unable to permanently conquer extensive areas. Instead, low-level warfare became endemic. Competition for mana (status) was complemented by competition for increasingly scarce land and resources. The concept of utu (reciprocity) generally ensured that at least one party to a dispute felt justified in maintaining it. Fighting usually occurred seasonally to fit in with cycles of subsistence. Most taua (raiding parties) made small-scale attacks, which caused few casualties. Sometimes, however, iwi were displaced into less desirable areas by military defeat or economic pressures. But many regions were occupied by the same descent group for long periods.
By the late 18th century, the Māori population may have been about 100,000. Most lived in the north of Te Ika a Māui (the North Island), where pressure for land and other resources had become intense. Here communities became larger, with many pā (fortified settlements) sited on hilltops and protected by ditches and palisades. Hunting and trapping had declined as population density increased; fish and shellfish now complemented crops. Some iwi now numbered many thousands, but Te Wai Pounamu remained sparsely populated.
Māori were generally relatively tall and sturdy, free from infectious diseases, adequately fed, and unlikely to die violently. Because of the dangers of childbirth, infant mortality and diet-related dental problems, Māori life expectancy was about 30 years. This was similar to that of Europeans in the 17th century.
The first Europeans to reach Aotearoa were probably Abel Tasman's Dutch East India Company expedition in 1642. After four men were killed by local Māori when a landing was attempted in Golden Bay, Tasman sailed up the west coast of Te Ika a Māui without finding the ‘treasures or matters of great profit’ he sought. While this experience discouraged other Europeans from following in his wake, the name of a Dutch province (Zeeland) was given to a jagged line on maps of the Pacific.
In 1769, two European expeditions visited Aotearoa. That of Frenchman Jean de Surville ill-treated Māori, provoking retaliation against later visitors. The arrival two months earlier of the English explorer James Cook, on a voyage with both scientific and economic goals, had enduring consequences. Cook's mostly peaceful interactions with ‘noble savages’ excited imaginations in Europe, and his discovery of Aotearoa's natural resources ensured it would not again be forgotten there. Cook led two further expeditions which visited Aotearoa in the course of systematic exploration of the South Pacific.
Following establishment of a penal colony at Sydney in 1788, New Zealand became an economic offshoot of New South Wales. Whaling and shore-based sealing began in the 1790s. Flax, timber, potatoes and pigs were being traded with visiting ships by the 1800s and Māori soon found they could barter this produce for firearms.
Muskets revolutionised Māori warfare. Fired in sufficient numbers, they generated enough terror to enable enemies who lacked them to be routed by traditional means. Unprecedentedly large and wide-ranging Ngā Puhi taua settled old scores and generated new grievances across Te Ika a Māui during the 1820s. Other iwi exploited temporary leads in local arms races, in some cases using sailing ships to launch surprise attacks. Thousands were killed or enslaved, and tens of thousands displaced, provoking enduring disputes about land rights. By 1840, the ‘Musket Wars’ had subsided into an uneasy balance of terror.
Regular contact with Europeans had other negative consequences. Desired products could be purchased only through debilitating labour, often in unhealthy environments. Māori were vulnerable to infectious diseases, from which many died from the 1790s. The Māori population probably fell by half during the 19th century.
Māori social structures were also disrupted. Mana became linked to the acquisition of European goods and the Pākehā (Europeans) who provided access to them. In the early 19th century, these were mostly whalers in the South Island - where communities soon included ‘half-caste’ children - and missionaries in the North Island. Māori initially resisted Christianity, but embraced the skills through which it was communicated - reading and writing. Literate slaves acquired status, while the mana of illiterate chiefs fell. Knowledge, previously held in common or tied to specific roles, could now be possessed and communicated by anyone.
Contact with the outside world also benefited Māori. Introduced animals and crops enabled improved diets. Knowledge gained through social interaction and literacy was supplemented by Māori who travelled the world as ships' crew. Māori gradually developed some resistance to European diseases, and Pākehā settlers remained relatively few - 1,000 to 2,000 by 1839.
From 1840, however, when the British sovereignty first proclaimed by Cook was reasserted, Māori control over Aotearoa was threatened. Humanitarian concerns in Britain were eased by the signing of an agreement with some 500 chiefs. The differing and contested meanings in Māori and English of this Treaty of Waitangi clouded subsequent inter-racial relations. Māori ceded kāwanatanga (a word derived from ‘governorship’, but rendered as ‘sovereignty’ in the English text) to the British Crown, in exchange for rights as British subjects. They retained their taonga (‘treasured possessions’, including land, forests and fisheries) and could sell land only to the Crown. Māori accepted that the Crown's local representatives would have jurisdiction over immigrants who were arriving in increasing numbers, but the extent of their authority over Māori remained unclear.
Three main waves of settlers arrived in the next half-century. In the first, five separate ‘colonies’ were planted around the coast by 1850 under the auspices of the privately-owned New Zealand Company. A sixth was the most important: Auckland became the seat of government in 1841. These ‘mere encampments on the fringes of Polynesia’ existed on Māori terms. Several were saved from starvation in their first years by food grown by Māori. Communication among them was by ship, and irregular - most had more frequent contact with Sydney than with each other.
Racial tolerance was soon strained. The New Zealand Company had purchased land hastily and with scant regard for actual ownership. Māori increasingly resisted further sales - especially at the low prices offered - of land which immigrants arrived expecting to occupy. Rumoured and actual wars in the 1840s were followed by a largely effective boycott of land sales from 1854. Māori remained a majority for whom the decisions of the newly-elected General Assembly were largely irrelevant.
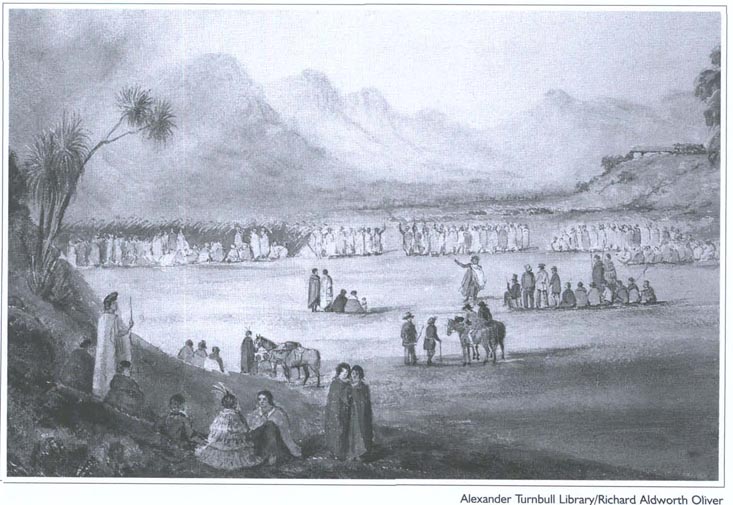
Artist's impression of Māori chief Te Rangihaeata (with arm outstretched) addressing Governor-in-Chief Sir George Grey (sitting) at Waikanae in 1851.
Governor George Grey had bought land and created institutions to assimilate Māori into British ways during his first term (1845-53). On his return in 1861, he employed more direct methods of establishing control. A war over land in Taranaki in 1860 had ended in stalemate. Grey decided to challenge the Kīngitanga (Māori sovereignty) movement in its Waikato heartland. A 14,000-strong army fought its way up the Waikato River in 1863-64 against strong resistance. War spread to Tauranga and both coasts of the North Island as messianic Pai Marire and Ringatū movements, which promised to expel the Pākehā, flourished. The strongest threat was posed by Titokowaru, who won several battles in southern Taranaki in 1868 before internal dissension lost him his army. With the flight of guerrilla leader Te Kooti to the ‘King's country’ in 1872, armed Māori resistance to British authority ended. The land of ‘rebels’ was confiscated, and much land belonging to ‘loyal’ Māori was also soon lost under a Native Land Court system which imposed individualised titles.
The second wave of immigration had begun in 1861 after the discovery of gold in Central Otago. Thousands of miners poured into Otago and Westland, swamping the ‘old identities’ of the carefully planned Otago and Canterbury settlements. From 1865, Chinese miners - the colony's first significant non-European immigrants - were brought in to rework the tailings.
The third influx of migrants, in the 1870s, was instigated by New Zealand's first ‘Think Big’ government, which provided assisted passages. Land opened for settlement by the wars required deforestation and conversion to farmland. The process was aided by railways which linked the main South Island towns in the 1870s, and those of the southern North Island by the early 1880s. Improved communications encouraged the abolition of separate provincial governments in 1876.
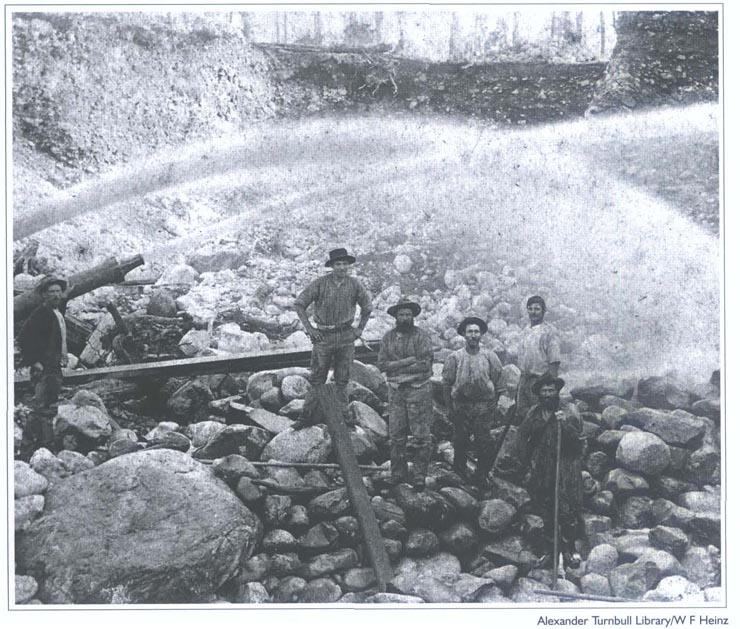
Recovering gold by sluicing on the West Coast in the 1880s.
The end of Māori autonomy was symbolised by the advance of a railway through the King Country in the 1880s. Because of difficult terrain, the Auckland-Wellington line was not completed until 1908. Dunedin and Auckland were now two days travel apart, compared with two weeks 40 years earlier. As use of telephones also increased - there were 33,000 by 1910 -New Zealand became more meaningfully a single country. From 1876, information that took up to 10 weeks to convey by letter could be transmitted to Britain instantaneously by undersea telegraph cable.
From the 1890s, refrigeration transformed New Zealand farming. Much of Waikato and Taranaki was soon covered by small, family-run dairy farms producing milk, and butter and cheese for export to Britain. Large runs in drier eastern areas had been growing wool for export since the 1850s; sheepmeat now also became a major export commodity. Coal steadily supplanted gold as the most important extracted mineral.
Politics, too, was transformed in the 1890s, when the ‘Continuous Ministry’ of run-holders and businessmen was replaced by a Liberal government supported by small farmers and the skilled workers of the growing and increasingly industrialised towns. New Zealand became the first country to grant women the vote in 1893. By 1900, when the Maori population had fallen to 46,000, the 750,000 Pākehā were evenly divided between the North and South islands.
The Liberals placed ‘ordinary working men’ and their families on farms - which promised them physical and mental health, and prosperity - by buying and subdividing large estates, and by acquiring much of the remaining Maori-owned land. Concern for the welfare of ageing ‘pioneers’ encouraged the introduction of old-age pensions for the ‘deserving poor’ in 1898; they were to be joined in the next 40 years by other worthy but narrowly defined groups, including war veterans and widows. Job security of urban workers was improved by provisions for the compulsory arbitration of employment disputes and regulation of wages.
Around 1900, Pakehā New Zealanders underlined their new sense of identity by rejecting an offer to join the new Australian federation, and accepting a change of status from ‘colony’ to ‘dominion’. They also seized a chance to prove themselves ‘better Britons’ by fighting Boers in South Africa. Living far from centres of culture and knowledge, ‘Maori-landers’ were proud of their adaptability and resourcefulness. Most of their innovations, such as mechanising the separation of cream from milk, were motivated by pragmatism. The imagination of the South Canterbury farmer Richard Pearse, who got off the ground before the Wright brothers, was exceptional.
The Liberal coalition began to unravel in the 1900s as the interests of small farmers and urban workers diverged. Farmers joined forces with urban employers in a Reform Party, while militant workers withdrew from the arbitration system and the ‘Liberal-Labour’ alliance. Social tensions came to a head in 1912-13, when Reform replaced the Liberals in power and crushed strikes led by a ‘red’ Federation of Labour. As in other settler societies, class war seemed imminent. But the threat had subsided by the time World War I broke out in mid-1914.
One hundred thousand New Zealanders served in the Great War alongside British forces. One in six were killed, many more came home as invalids, and another 8,000 to 9,000 New Zealanders died at the end of the war in the ‘Spanish flu’ pandemic. As their soldiers fought with distinction at Gallipoli, in Palestine and on the Western Front, New Zealanders' sense of identity within the Empire grew.
Still tied to Britain economically, New Zealand was buffeted by volatile commodity prices in the 1920s. Working-class aspirations now found political expression in the Labour Party, while Reform continued the tradition of activist government by creating producer boards to coordinate exports, and building a countrywide hydroelectric system. A conservative coalition failed to cope effectively with the Great Depression, and Labour won office in 1935.
Labour introduced a minimum wage, a 40-hour working week, compulsory unionism, a substantial state housing programme, and a comprehensive system of social security, which provided a safety net ‘from the cradle to the grave’. Labour also articulated an independent foreign policy. But this had limits: a balance of payments crisis in 1938 necessitated import and financial controls, which had the advantage of stimulating local industries.
New Zealand casualties in World War II were similar to those in World War I. While New Zealanders fought in North Africa and Europe, the country was garrisoned by United States forces training for the Pacific war. They made a substantial impression, especially on women. Aided by radio, the cinema and, later, television, the American invasion broadened New Zealanders' cultural horizons.
During World War II, Labour ‘manpowered’ both sexes and took control of the country's resources. Maori supported the war with unparalleled unanimity. A Maori Battalion was raised on tribal lines and a Maori War Effort Organisation coordinated civilian contributions. For the first time, Maori migrated to the cities in significant numbers, a trend which was to continue until the 1980s when manufacturing employment plummeted and rural life seemed more attractive. Successive governments worked to assimilate Maori into mainstream New Zealand life.
Young people made up a higher proportion of the population in the ‘baby-boom’ years after 1945. Growing up with British and American music, fashions and television programmes, they chafed at the modest expectations of their parents. There were jobs, homes, education and health care for all, although some consumer goods remained scarce. Family life in the suburbs, which transformed areas such as West Auckland and Wellington's Hutt Valley, was both satisfying and stultifying. Wider choices did become available: the contraceptive pill and recreational drugs brought new freedoms, experiences and dangers in the 1960s. The need to enlarge the paid workforce widened opportunities for women, and low-cost tertiary education expanded those of many working-class teenagers.
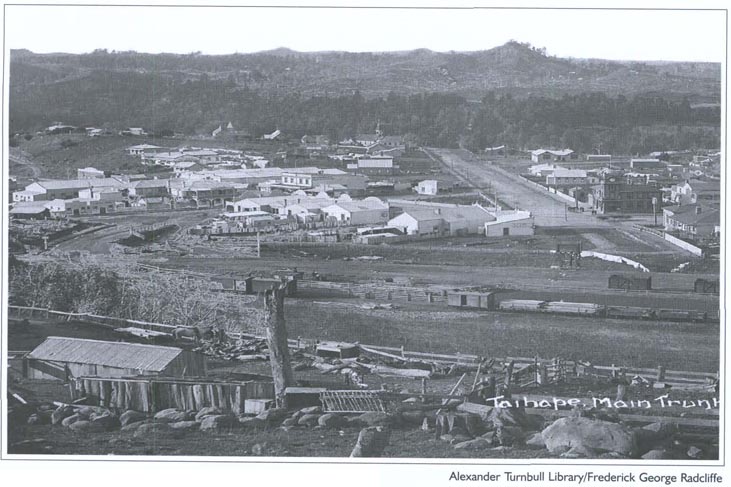
Taihape and the main trunk railway line in 1909.
The conservative National Party held power for most of the second half of the century. Until 1975, the terms of trade for New Zealand's primary exports (wool, meat, dairy products, timber) were high and so was the standard of living. Local manufacturing industries protected from foreign competition expanded further.
After energy crises in the 1970s, the terms of trade turned against most primary products and full employment disappeared. From the late 1970s, National attempted to increase New Zealand's energy self-sufficiency while subsidising farming incomes. Both policies were expensive failures.
The 1984-90 Labour government, and its National successor, challenged much that New Zealanders took for granted. Many government activities were corporatised and then privatised. Some fared poorly in private ownership - in 2001, the national airline and part of the railway system reverted to public ownership. Public education and health care, the social welfare system, and employees' rights were all constrained. The removal of most restrictions on economic activity encouraged both entrepreneurship and cultural diversity; the physical environment was more strongly protected; and New Zealand remained nuclear-free and robustly independent in foreign policy. Urban culture thrived as society was deregulated, and an influx of Pacific and East Asian immigrants increased New Zealand's ethnic diversity.
A Labour-led coalition government took office in 1999 and was re-elected in a slightly different form in 2002. Labour aimed to maintain the benefits of deregulation while reasserting a role for the state when markets failed. In a period of prosperity, its greatest challenge lay in Māori-Pākehā relations. After suffering disproportionately when full employment ended, Māori continued to lag in education, health and other social indicators.
Māori confronted the dominant culture directly from 1975 when a march reiterating land grievances generated much support. A statutory tribunal was established in the same year to investigate breaches of the Treaty of Waitangi. Others saw cultural renaissance as the key to empowerment, and schools in which only Māori was spoken, and Māori language radio stations, sprang up from 1981.
In the 1990s, the National government negotiated settlements of up to $170 million with individual iwi, and Māori entrepreneurship flourished. But many Māori feel entitled to a bigger share of national wealth. There have been several occupations of land whose ownership is disputed, and sales of artefacts have been disrupted. Māori increasingly assert rights to intellectual property under international law, and to the coastal foreshore and seabed under the Treaty of Waitangi. Indeed, many argue that the treaty requires the equal sharing of power between Māori and Pākehā; some that Māori sovereignty over Aotearoa has never been extinguished. Most New Zealanders, however, assume that all citizens have equal legal and political rights, an attitude that was reinforced in the 1990s by the introduction of an electoral system based on proportional representation. These debates seem likely to continue.
David Green, History Group, Ministry for Culture and Heritage
| c1300 | Archaeological evidence indicates Polynesian settlement established by this date. |
| 1642 | Dutch explorer Abel Janszoon Tasman discovers a land he calls Staten Landt, later named Nieuw Zeeland. |
| 1769 | British explorer James Cook makes first of three visits to New Zealand, taking possession of the country in the name of King George III. |
| 1790s | Sealing, deep-sea whaling, flax and timber trading begins, with some small temporary settlements. First severe introduced epidemic among Māori population. |
| 1791 | First visit by a whaling vessel, the William and Ann, to Doubtless Bay. |
| 1806 | First Pākehā women arrive in New Zealand. |
| 1814 | British missionary Samuel Marsden makes first visit to New Zealand. Anglican mission station established. Sheep, cattle, horses and poultry introduced. |
| 1815 | First Pākehā child, Thomas Holloway King, born in New Zealand. |
| 1819 | Raids on Taranaki and Te Whanganui-a-Tara regions by Ngā Puhi and Ngāti Toa people led by chiefs Patuone, Nene, Moetara, Tuwhare and Te Rauparaha. |
| 1820 | Ngā Puhi chief Hongi Hika visits England, meets King George IV and secures supply of muskets. |
| 1821 | Musket wars begin with raids by Hongi Hika and Te Morenga on southern iwi and continue throughout the decade. |
| 1822 | Ngāti Toa migration south to Cook Strait region, led by Te Rauparaha, begins. |
| 1823 | Wesleyan Missionary Society mission established. First Church of England marriage between Pākehā and Māori: Phillip Tapsell and Maria Ringa. |
| 1824 | Te Heke Niho-Puta migration of Taranaki iwi to the Kapiti Coast. Rawiri Taiwhanga in Bay of Islands sells dairy produce and other food supplies to visiting ships. |
| 1827 | Te Rauparaha's invasion of the South Island from Kapiti begins. |
| 1830 | First acorn planted at Waimate North where agricultural mission and school established. |
| 1831 | Whaling stations established at Tory Channel and Preservation Inlet. |
| 1833 | James Busby arrives in the Bay of Islands to take up appointment as British Resident in New Zealand. |
| 1834 | United Tribes' flag adopted by some 25 northern chiefs at Busby's suggestion. |
| 1835 | Declaration of Independence by the ‘United Tribes of New Zealand’ signed by 34 northern chiefs. |
| 1837 | New Zealand Association formed in London, becoming the New Zealand Colonisation Society in 1838 and the New Zealand Company in 1839, under the inspiration of Edward Gibbon Wakefield. William Colenso completes printing the New Testament in Māori, the first book printed in New Zealand. |
| 1838 | Bishop Pompallier founds Roman Catholic mission at Hokianga. |
| 1839 | William Hobson instructed to establish British rule in New Zealand, as a dependency of New South Wales. Colonel William Wakefield, of the New Zealand Company, arrives on the Tory to purchase land for a settlement. |
| 1840 | Treaty of Waitangi signed at Bay of Islands and later over most of the country. British sovereignty proclaimed. Hobson becomes first governor and sets up executive and legislative councils. New Zealand Company settlers arrive at Port Nicholson, Wellington. French settlers land at Akaroa. Local Māori initially provide food for these and later settlements. |
| 1841 | European settlements established at New Plymouth and Wanganui. Capital shifted from Russell to Auckland. |
| 1842 | Main body of settlers arrive at Nelson. |
| 1843 | Twenty-two European settlers and four Māori killed at a confrontation at Tua Marina, near Wairau, in Marlborough. Robert FitzRoy becomes governor. |
| 1844 | New Zealand Company suspends colonising operations due to financial difficulties. |
| 1845 | Hone Heke begins war in the north. George Grey becomes governor. Half of all adult Māori are at least partly literate. |
| 1846 | War in the north ends with capture of Ruapekapeka. Fighting between Māori and Pākehā around Wellington. Te Rauparaha captured by Grey. First New Zealand Constitution Act passed. Heaphy, Fox and Brunner begin exploring the West Coast. First steam vessel, HMS Driver, arrives in New Zealand. |
| 1848 | Settlement founded by Scottish Otago Association. Provinces of New Ulster and New Munster established. Coal discovered at Brunner on the West Coast. Earthquake centred in Marlborough damages most Wellington buildings. |
| 1850 | Canterbury settlement founded. |
| 1852 | Second New Zealand Constitution Act passed creating general assembly and six provinces with representative government. |
| 1853 | Idea of a Māori King canvassed by Tamihana Te Rauparaha and Matene Te Whiwhi. Many Māori agree not to sell any more land: 32 million acres have been bought by the government in the past five years. |
| 1854 | First session of general assembly opens in Auckland. |
| 1855 | Governor Thomas Gore Browne, appointed in 1854, arrives. Severe earthquake on both sides of Cook Strait. |
| 1856 | Henry Sewell forms first ministry under responsible government and becomes first premier. Edward Stafford forms first stable ministry. |
| 1858 | New Provinces Act passed. Te Wherowhero installed as first Māori King, taking name Potatau I. |
| 1859 | First session of new Hawke's Bay and Marlborough provincial councils. Gold discovered in Buller River. |
| 1860 | Waitara dispute develops into general warfare in Taranaki. Te Wherowhero dies and is replaced as Māori King by his son, Tawhiao. Kohimaramara Conference of Chiefs. |
| 1861 | Grey begins second governorship. Gold discovered at Gabriel's Gully and Otago goldrushes begin. First session of Southland provincial council. Bank of New Zealand incorporated at Auckland. |
| 1862 | First electric telegraph line opens - from Christchurch to Lyttelton. First gold shipment from Dunedin to London. |
| 1863 | War resumes in Taranaki and begins in Waikato when General Cameron crosses the Mangatawhiri stream. New Zealand Settlements Act passed to effect land confiscation. First steam railway in New Zealand opened. |
| 1864 | War in the Waikato ends after battle of Orakau. Māori defeat British at Gate Pa, Tauranga. Land in Waikato, Taranaki, Bay of Plenty and Hawke's Bay confiscated. Gold discovered in Marlborough and Westland. Arthur, George and Edward Dobson are the first Pākehā to cross what becomes known as Arthur's Pass. |
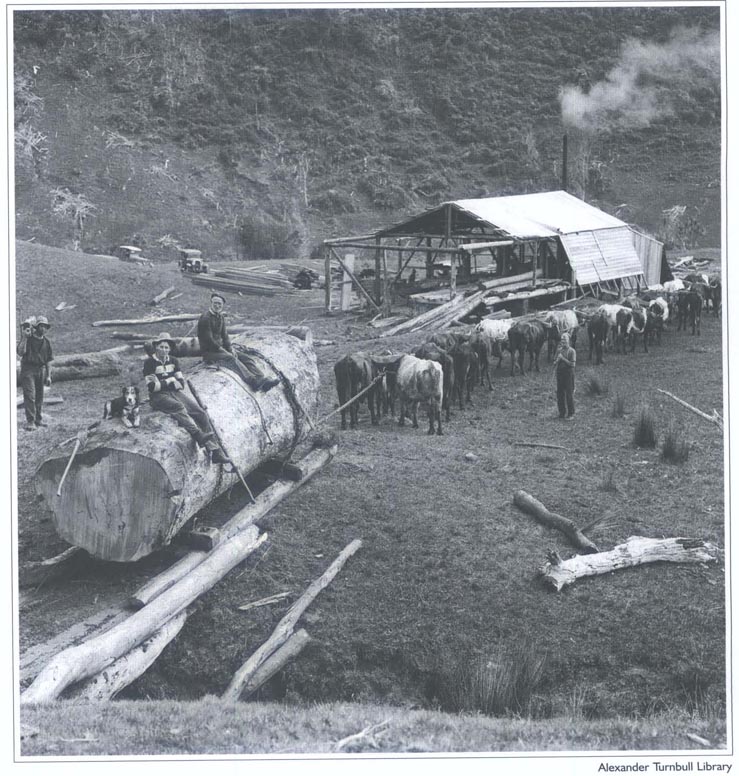 Bushmen take a break after hauling a kauri log with a team of bullocks to a sawmill in North Auckland around 1918. | |
| 1865 | Seat of government transferred from Auckland to Wellington. Native Land Court established. Māori resistance continues. Auckland streets lit by gas for first time. |
| 1866 | Cook Strait submarine telegraph cable laid. Cobb and Co coaches start running from Canterbury to the West Coast. |
| 1867 | Thames goldfield opens. Four Māori seats established in parliament. Lyttelton railway tunnel completed. Armed constabulary established. |
| 1868 | Māori resistance continues through campaigns of Te Kooti Arikirangi and Titokowaru. New Zealand's first sheep breed, the Corriedale, developed. |
| 1869 | New Zealand's first university, the University of Otago, established. |
| 1870 | Last imperial forces leave New Zealand. Vogel's public works and immigration policy begins. New Zealand University Act passed, establishing a federal system which lasts until 1961. Vogel announces national railway construction programme; more than 1,000 miles constructed by 1879. First rugby match in New Zealand played at Nelson. Auckland to San Francisco mail service begins. |
| 1871 | Deer released in Otago. |
| 1872 | Te Kooti retreats to the King Country and Māori armed resistance ceases. Telegraph communication links Auckland, Wellington and southern provinces. |
| 1873 | New Zealand Shipping Company established. |
| 1876 | Abolition of the provinces and establishment of local government by counties and boroughs. New Zealand-Australia telegraph cable established. |
| 1877 | Education Act passed, establishing national system of primary education. |
| 1878 | Completion of Christchurch-Invercargill railway. |
| 1879 | Triennial Parliaments Act passed. Vote is given to every male aged 21 and over. Kaitangata mine explosion; 34 people die. Annual property tax introduced. |
| 1881 | Parihaka community forcibly broken up by troops. Te Whiti, Tohu Kakahi and followers arrested and imprisoned. Wreck of SS Tararua; 131 people die. Auckland and Christchurch telephone exchanges open. |
| 1882 | First shipment of frozen meat leaves Port Chalmers for England on the Dunedin. |
| 1883 | Te Kooti pardoned; Te Whiti and other prisoners released. Direct steamer link established between New Zealand and Britain. |
| 1884 | King Tawhiao visits England with petition to the Queen and is refused access. First overseas tour by a New Zealand rugby team, to New South Wales. Construction of King Country section of North Island main trunk railway begins. |
| 1886 | Mt Tarawera erupts and Pink and White Terraces destroyed; 108 people die. Oil discovered in Taranaki. |
| 1887 | New Zealand's first national park, Tongariro, is presented to the nation by Te Heuheu Tukino IV. Reefton becomes first town to have electricity. First inland parcel post service. |
| 1888 | Birth of writer Katherine Mansfield. |
| 1889 | Abolition of non-residential or property qualification to vote. First New Zealand-built locomotive completed at Addington. |
| 1890 | Maritime strike involves 8,000 unionists. ‘Sweating’ Commission reports on employment conditions. First election on a one-man one-vote basis. |
| 1891 | John McKenzie introduces the first of a series of measures to promote closer land settlement. John Ballance becomes premier of first Liberal government. |
| 1892 | First meeting of national Kotahitanga Māori parliament. The Kingitanga sets up its own Kauhanganui parliament. |
| 1893 | Franchise extended to women. John Ballance dies and is succeeded by Richard John Seddon. Liquor licensing poll introduced. Elizabeth Yates becomes New Zealand's first woman mayor, of Onehunga. Banknotes become legal tender. |
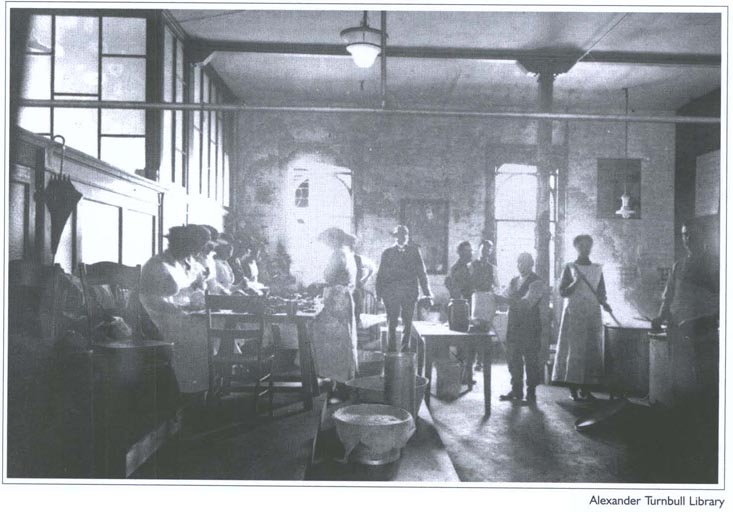 Nurses and laundry workers in Christchurch during the 1918 influenza epidemic. | |
| 1894 | Compulsory arbitration of industrial disputes and reform of employment laws. Advances to Settlers Act. Clark, Fyfe and Graham become the first people to climb Mt Cook. |
| 1896 | Brunner mine explosion; 67 people die. Census measures national population as 743,214. |
| 1897 | First of series of colonial, and later imperial, conferences in London. |
| 1898 | Old Age Pensions Act passed. First cars imported to New Zealand. |
| 1899 | New Zealand army contingent sent to South African war. First celebration of Labour Day. |
| 1900 | Māori Councils Act passed. Public Health Act passed setting up Department of Public Health in 1901. |
| 1901 | Cook and other Pacific islands annexed. Penny postage first used. |
| 1902 | Pacific cable begins operating between New Zealand, Australia and Fiji. |
| 1903 | Richard Pearse achieves semi-controlled flight near Timaru. |
| 1905 | The ‘Originals’ rugby team tours Britain and becomes known as the All Blacks. |
| 1906 | Seddon dies and is succeeded by William Hall-Jones as prime minister. |
| 1907 | New Zealand constituted as a dominion. Fire destroys parliament buildings. |
| 1908 | Auckland to Wellington main trunk railway line opens. Ernest Rutherford awarded Nobel Prize in Chemistry. New Zealand's population reaches 1 million. |
| 1909 | ‘Red’ Federation of Labour formed. SS Penguin wrecked in Cook Strait; 75 people die. Compulsory military training introduced. Stamp-vending machine invented and manufactured in New Zealand. |
| 1912 | William Massey wins vote in the house and becomes first Reform Party prime minister. Waihi miners strike. Malcolm Champion New Zealand's first Olympic gold medallist (as a member of the Australasian 200m freestyle relay swimming team). |
| 1913 | Waterfront strikes in Auckland and Wellington. |
| 1914 | World War I begins and German Samoa occupied. New Zealand Expeditionary Forces despatched to Egypt. Huntly coal mine disaster; 43 people die. |
| 1915 | New Zealand forces take part in Gallipoli campaign. Reform and Liberal form National War Cabinet. Britain announces its intention to purchase all New Zealand meat exports during war. |
| 1916 | New Zealand troops transfer to Western Front. Conscription introduced. Labour Party formed. |
| 1917 | Battle of Passchendaele - about 1,000 New Zealanders die. Six o'clock public house closing introduced. |
| 1918 | World War I ends. Influenza epidemic kills an estimated 8,500. Prohibition petition with 242,001 signatures presented to parliament. |
| 1919 | Women eligible for election to parliament. Massey signs Treaty of Versailles. First official airmail flight from Auckland to Dargaville. |
| 1920 | Anzac Day established. New Zealand gets League of Nations mandate to govern Western Samoa. First aeroplane flight across Cook Strait. |
| 1921 | New Zealand division of Royal Navy established. |
| 1923 | Otira tunnel opens. Ross Dependency proclaimed. Death of Katherine Mansfield. |
| 1926 | National public broadcasting begins under auspices of Radio Broadcasting Co Ltd. |
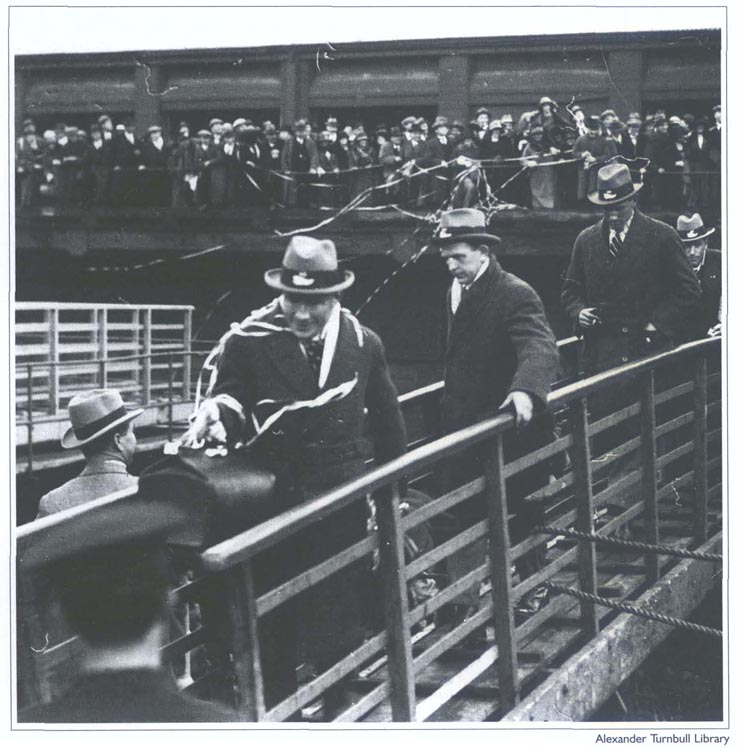 Members of the 1924 All Black rugby team board their ship en route to Sydney. | |
| 1928 | General election won by new United Party. Kingsford-Smith completes first trans-Tasman flight. |
| 1929 | Depression deepens. Severe earthquake in Murchison-Karamea district; 15 people die. First health stamps issued. |
| 1930 | Unemployment Board set up to provide relief work. |
| 1931 | Newly formed coalition government under George Forbes wins general election. Hawke's Bay earthquake; 261 die. Substantial reductions in public service wages and salaries. |
| 1932 | Compulsory arbitration of industrial disputes abolished. Unemployed riot in Auckland, Dunedin and Christchurch. Reductions in old age and other pensions. |
| 1933 | Elizabeth McCombs becomes first woman MP. Distinctive New Zealand coins first issued. |
| 1934 | First trans-Tasman airmail. |
| 1935 | First Labour government elected under Michael Joseph Savage. Air services begin across Cook Strait. |
| 1936 | Reserve Bank taken over by state. State housing programme launched. Guaranteed prices for dairy products introduced. National Party formed from former Coalition MPs. Inter-island trunk air services introduced. Jean Batten's record flight from England. Standard working week reduced from 44 to 40 hours for many workers. |
| 1937 | Federation of Labour unifies trade union movement. RNZAF set up as separate branch of armed forces. |
| 1938 | Social Security Act establishes revised pensions structure and the basis of a national health service. Import and exchange controls introduced. |
| 1939 | World War II begins. Second New Zealand Expeditionary Force formed and a Maori Battalion organised on tribal lines. Bulk purchases of farm products by Great Britain. HMS Achilles, on loan to New Zealand, takes part in Battle of the River Plate. |
| 1940 | Michael Joseph Savage dies and is succeeded by Peter Fraser. Sidney Holland becomes leader of opposition. Conscription for military service. German mines laid across Hauraki Gulf. |
| 1941 | Japan enters the war. Maori War Effort Organisation set up. Pharmaceutical and general practitioner medical benefits introduced. |
| 1942 | Economic stabilisation. New Zealand troops in Battle of EI Alamein. Food rationing introduced. Mobilisation of women for essential work. |
| 1943 | New Zealand troops take part in invasion of Italy. |
| 1944 | Australia-New Zealand Agreement provides for cooperation in the South Pacific. |
| 1945 | War in Europe ends on 8 May and in the Pacific on 15 August. New Zealand signs United Nations charter. Maori Social and Economic Advancement Act passed. National Airways Corporation founded. |
| 1946 | Family benefit of £1 a week becomes universal. Bank of New Zealand nationalised. |
| 1947 | Statute of Westminster adopted by New Zealand parliament. First public performance by National Orchestra. Mabel Howard becomes first woman cabinet minister. Fire in Ballantyne's department store, Christchurch; 41 people die. |
| 1948 | Protest campaign against exclusion of Maori players from 1949 rugby tour of South Africa. Polio epidemic closes schools. Ruapehu and Ngauruhoe erupt. Meat rationing ends. |
| 1949 | Referendum agrees to compulsory military training. National government elected. New Zealand gets first four navy frigates. |
| 1950 | Naval and ground forces sent to Korean War. Legislative Council abolished. Wool boom. Empire Games held in Auckland. |
| 1951 | Prolonged waterfront dispute - state of emergency proclaimed. ANZUS Treaty signed by United States, Australia and New Zealand. Maori Women's Welfare League established. |
| 1952 | Population passes 2 million. |
| 1953 | First tour by a reigning monarch, Queen Elizabeth II. Edmund Hillary and Sherpa Tensing Norgay first to climb Mt Everest. Railway disaster at Tangiwai; 151 people die. World sheep-shearing record set by Godfrey Bowen. |
| 1954 | New Zealand signs South-east Asia Collective Defence Treaty. New Zealand gains seat on United Nations Security Council. Social Credit gets 10 percent of vote in general election, but no seat in parliament. |
| 1955 | Pulp and paper mill opens at Kawerau. Rimutaka rail tunnel opens. |
| 1956 | New Zealand troops deployed in Malaya. |
| 1957 | National loses election; Walter Nash leads second Labour government. Last hanging. Scott Base established in Ross Dependency. Court of Appeal constituted. Dairy products gain 10 years of unrestricted access to Britain. |
| 1958 | PAYE tax introduced. Arnold Nordmeyer's 'Black Budget'. First geothermal electricity generated at Wairakei. First heart-lung machine used at Greenlane Hospital, Auckland. |
| 1959 | Antarctic Treaty signed with other countries involved in scientific exploration in Antarctica. Auckland harbour bridge opened. |
| 1960 | Regular television programmes begin in Auckland. National government elected. Government Service Equal Pay Act passed. |
| 1961 | New Zealand joins the International Monetary Fund. Capital punishment abolished. |
| 1962 | Western Samoa becomes independent. Sir Guy Powles becomes first ombudsman. New Zealand Māori Council established. Cook Strait rail ferry service begins. Taranaki gas well opens. Olympic gold medallist Peter Snell establishes mile and half-mile world athletic records. |
| 1964 | Marsden Point oil refinery opens near Whangarei. Cook Strait power cables laid. |
| 1965 | Free trade (NAFTA) agreement negotiated with Australia. New Zealand combat forces sent to support US troops in Vietnam amid public protests. Cook Islands becomes self-governing. |
| 1966 | International airport officially opens at Auckland. Te Ata-i-rangi-kaahu becomes first Māori Queen. |
| 1967 | Referendum extends hotel closing hours to 10pm. Decimal currency introduced. Lord Arthur Porritt becomes first New Zealand-born governor-general. Breath and blood tests introduced for suspected drinking drivers. |
| 1968 | Inter-island ferry Wahine sinks in storm in Wellington Harbour; 2 people die. Three die in Inangahua earthquake. |
| 1969 | Vote extended to 20-year-olds. National government wins fourth election in a row. First output from Glenbrook steel mill. |
| 1970 | Natural gas from Kapuni supplied to Auckland. |
| 1971 | New Zealand secures continued access of butter and cheese to the United Kingdom. Ngā Tamatoa protest at Waitangi celebrations. Tiwai Point aluminium smelter begins operating. Warkworth satellite communications station begins operation. |
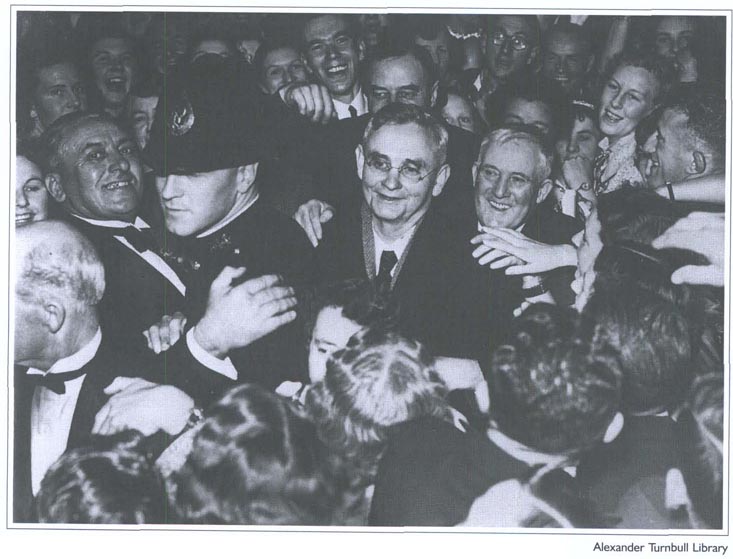 Prime Minister Michael Joseph Savage (wearing glasses) is greeted by an enthusiastic crowd during the 1938 general election at the end of the Labour Party's first term of government. | |
| 1972 | Labour government led by Norman Kirk elected. Equal Pay Act passed. |
| 1973 | Great Britain becomes a member of the EEC. Naval frigate despatched in protest against French nuclear testing in the Pacific. New Zealand's population reaches 3 million. Rugby tour by South Africa cancelled. Colour television introduced. |
| 1974 | Prime Minister Norman Kirk dies. Commonwealth Games held in Christchurch. Vote given to 18-year-olds. |
| 1975 | Robert Muldoon becomes prime minister after National election victory. Māori land march protests against land loss. Waitangi Tribunal established. |
| 1976 | Matrimonial Property Act passed. Pacific Islands overstayers deported. EEC import quotas for New Zealand butter set until 1980. Introduction of metric system of weights and measures. Subscriber toll dialling introduced. |
| 1977 | New Zealand's 200-mile exclusive economic zone established. Bastion Point occupied by Māori land protesters. |
| 1978 | Registered unemployed reaches 25,000. National government re-elected. |
| 1979 | Air New Zealand plane crashes on Mt Erebus, Antarctica; 257 people die. Carless days introduced to reduce petrol consumption. |
| 1980 | Saturday trading partially legalised. Eighty-day strike at Kinleith pulp and paper mill. |
| 1981 | South African rugby team's tour brings widespread disruption. |
| 1982 | Closer Economic Relations (CER) agreement signed with Australia. First kōhanga reo established. Year-long wage, price and rent freeze imposed - lasts until 1984. |
| 1983 | Visit by nuclear-powered United States Navy frigate Texas sparks protests. Official Information Act replaces Official Secrets Act. New Zealand Party founded. |
| 1984 | Labour Party wins snap general election. Finance Minister Roger Douglas begins deregulating economy. Te Hikoi ki Waitangi march and disruption of Waitangi Day celebrations. Auckland's population exceeds that of the South Island. Government devalues New Zealand dollar by 20 percent. |
| 1985 | Anti-nuclear policy leads to refusal of visit by American warship USS Buchanan. Greenpeace vessel Rainbow Warrior bombed and sunk by French agents in Auckland harbour. New Zealand dollar floated. Author Keri Hulme wins Booker Prize for The Bone People. First case of locally-contracted AIDS reported. Waitangi Tribunal given power to hear Māori land grievances arising since 1840. |
| 1986 | Homosexual Law Reform Bill passed. Royal Commission reports in favour of MMP electoral system. Jim Bolger becomes National Party leader. Soviet cruise ship, the Mikhail Lermontov, sinks in Marlborough Sounds. Goods and services tax introduced. First visit to New Zealand by a pope. |
| 1987 | Share prices plummet by 59 percent in four months. Labour wins general election. Māori Language Act passed making Māori an official language. Anti-nuclear legislation enacted. First Lotto draw. New Zealand's first heart transplant performed. New Zealand wins first rugby World Cup. |
| 1988 | Number of unemployed exceeds 100,000. Bastion Point land returned to Māori ownership. Electrification of North Island's main trunk line completed. New Zealand Post closes 432 post offices. Fisheries quota package announced for Māori iwi. |
| 1989 | Prime Minister David Lange suggests formal withdrawal from ANZUS. Jim Anderton founds New Labour Party. Lange resigns and Geoffrey Palmer becomes prime minister. Reserve Bank Act sets bank's role as one of maintaining price stability. First elections under revised local government structure. Sunday trading begins. Māori Fisheries Act passed. |
| 1990 | New Zealand celebrates its sesqui-centennial. Māori leaders inaugurate National Congress of Tribes. Dame Catherine Tizard becomes first woman governor-general. Geoffrey Palmer resigns as prime minister and is replaced by Mike Moore. National Party has landslide victory. Jim Bolger becomes prime minister. One and two cent coins withdrawn from circulation. Commonwealth Games held in Auckland. Telecom sold for $4.25 billion. Welfare payments cut. |
| 1991 | Welfare payments further reduced. Alliance Party formed. Employment Contracts Act passed. Number of unemployed exceeds 200,000 for first time. New Zealand troops join multinational force in the Gulf War. Avalanche reduces the height of Mt Cook by 10.5m. |
| 1992 | Government and Maori interests negotiate Sealord fisheries deal. Public health system reformed. State housing commercialised. New Zealand gets seat on United Nations Security Council. |
| 1993 | New Zealand First Party launched. National wins election without majority; Opposition MP Peter Tapsell becomes Speaker of the House, thus giving the government a majority. Referendum favours MMP electoral system. |
| 1994 | Government commits 250 soldiers to peacekeeping duty in Bosnia. Government proposes $1 billion cap for final settlement of Treaty of Waitangi claims. New Zealand's first casino opens in Christchurch. First fast-ferry passenger service begins operation across Cook Strait. |
| 1995 | Team New Zealand wins America's Cup. Occupation of Moutua Gardens, Wanganui. Conservative, Christian Heritage and United New Zealand Parties launched. Renewal of French nuclear tests results in New Zealand protest flotilla and navy ship Tui sailing for Mururoa Atoll. Commonwealth Heads of Government meeting in Auckland. New Zealand contingent returns from Bosnia. |
| 1996 | First legal sports betting at TAB. First MMP election brings National/New Zealand First coalition government. |
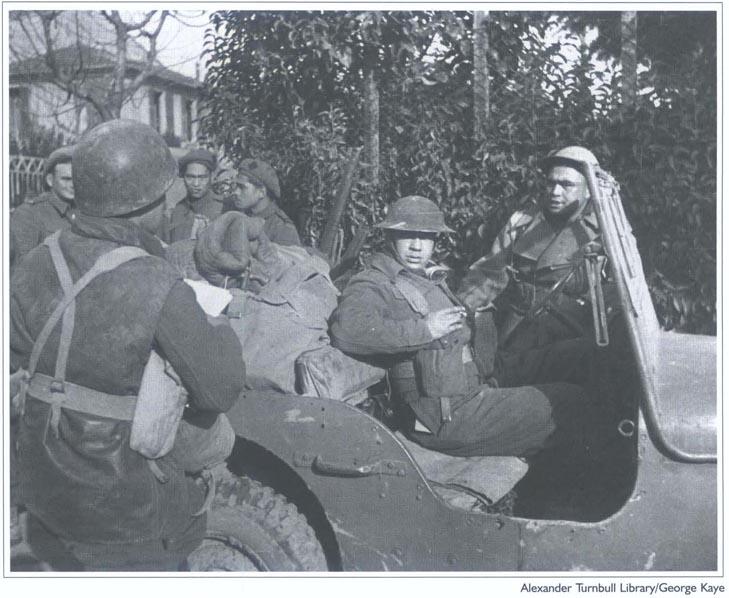 Damaged buildings after the 1931 Hawke's Bay earthquake. | |
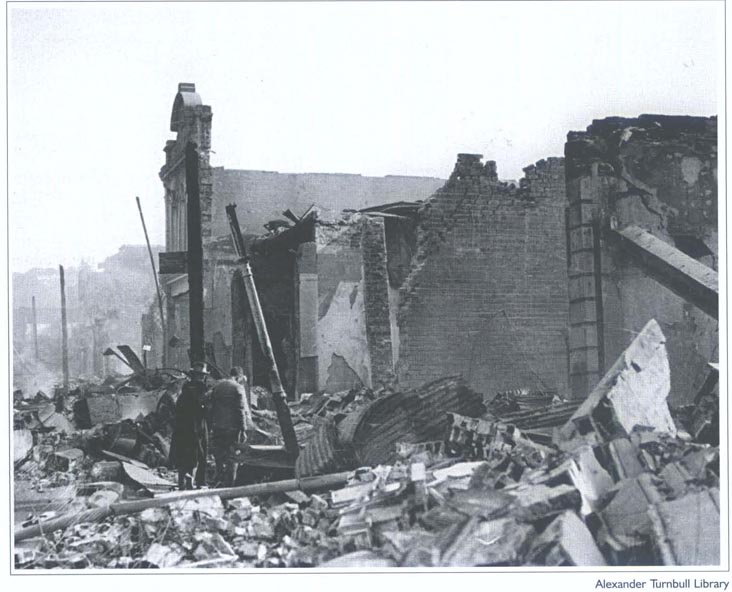 Soldiers of the Maori Battalion prepare to move up into the line in Italy during World War II. | |
| 1997 | A $170 million settlement signed with Ngāi Tahu. Jim Bolger resigns as prime minister after a National Party coup while he is overseas. Bolger replaced by New Zealand's first woman prime minister, Jenny Shipley. |
| 1998 | Auckland city businesses hit by power cut which continues for more than a month. New Zealand women's rugby team, the Black Ferns, becomes world champion. Coalition government dissolved, leaving Shipley's National Party as a minority government. |
| 1999 | New Zealand sends peacekeeping troops to East Timor. Auckland hosts the APEC world leaders' conference. Former prime minister Mike Moore becomes head of the World Trade Organisation. The minority National government loses the November election and Labour forms government in coalition with the Alliance party and with the support of the Greens, who enter parliament for the first time with seven seats. Legal drinking age lowered from 20 to 18 years. |
| 2000 | Air New Zealand gains ownership of Ansett Australia. Team New Zealand beats Italy's Prada 5-0 in the final series to retain the America's Cup. Labour government abolishes knighthoods. Dr Alan G MacDiarmid wins Nobel Prize for Chemistry for his part in the discovery and development of conductive polymers. |
| 2001 | New Zealand-borm Russell Crowe wins best actor Academy Award for his performance in Gladiator. New Zealand's largest company, Fonterra, is formed from merger of the New Zealand Dairy Group and Kiwi Dairies. Qantas New Zealand and Ansett collapse. Government injects $550 million to keep Air New Zealand flying after the company announces a $1.4 billion loss - the largest in New Zealand's corporate history. Government disbands RNZAF combat wing. Shipley resigns and Bill English becomes leader of the National Party. Former America's Cup yachtsman Sir Peter Blake murdered by pirates at the mouth of the Amazon. |
| 2002 | Labour wins election and forms a coalition government with Progressive Coalition and enters into a special arrangement with United Future. Rakiura, New Zealand's 14th National Park covering about 85 percent of Stewart Island, opens. Three New Zealanders among 185 killed in Bali terrorist bombing. Lowest road toll (402) since 1963. The Fellowship of the Ring, first film in The Lord of the Rings trilogy directed by New Zealand's Peter Jackson, wins four Oscars. |
| 2003 | New Zealand loses America's Cup to Swiss challenger Alinghi, skippered by Russell Courts, previously of Team New Zealand. Population reaches 4 million. Privy Council replaced by New Zealand Supreme Court. National caucus votes in Don Brash as leader, replacing English. World premier in Wellington of Return of the King, final film in The Lord of the Rings trilogy. |
2.1 David Green, History Group, Ministry for Culture and Heritage.
2.2 Statistics New Zealand, New Zealand Press Association.
Table of Contents
A parliamentary select committee at work in Wellington.
New Zealand's constitutional history can be traced back to the signing of the Treaty of Waitangi in 1840. The treaty is an agreement between the British Crown and Māori in which Māori gave the Crown rights to govern and the Crown guaranteed Māori full protection of their interests and status, and full citizenship rights. Five years earlier, on October 28 1835, an assembly of the Confederation of Chiefs of the United Tribes of New Zealand had proclaimed the country independent and signed a Declaration of Independence. New Zealand is a constitutional monarchy with a parliamentary government. Queen Elizabeth II has the title Queen of New Zealand. Table 3.01 lists Sovereigns of New Zealand since signing of the Treaty of Waitangi. A constitution is concerned with the establishment and composition of the legislative, executive and judicial branches of government, their powers and duties, and the relationship between these branches. New Zealand's Constitution Act 1986 brought together important statutory constitutional provisions and clarified rules relating to the governmental handover of power. The act deals with the principal components of New Zealand's statutory constitutional provisions: the sovereign, the executive, the legislature and the judiciary. Other key written sources of New Zealand's constitution include the Electoral Act 1993, the Imperial Laws Application Act 1988 (lists United Kingdom statutes still in force in New Zealand) and Standing Orders of the House of Representatives. Other sources of the constitution include constitutional conventions, New Zealand legislation and decisions of the courts.
Table 3.01. Sovereigns of New Zealand
| Monarch | Accession | Died | Age | Reigned (years) |
|---|---|---|---|---|
1Abdicated; reigned 325 days. Source: Statistics New Zealand | ||||
| House of Hanover | ||||
| Victoria | 1837 | 1901 | 81 | 63 |
| House of Saxe-Coburg | ||||
| Edward VII | 1901 | 1910 | 68 | 9 |
| House of Windsor | ||||
| George V | 1910 | 1936 | 70 | 25 |
| Edward VIII1 | 1936 | 1972 | 77 | |
| George VI | 1936 | 1952 | 56 | 15 |
| Elizabeth II | 1952 | |||
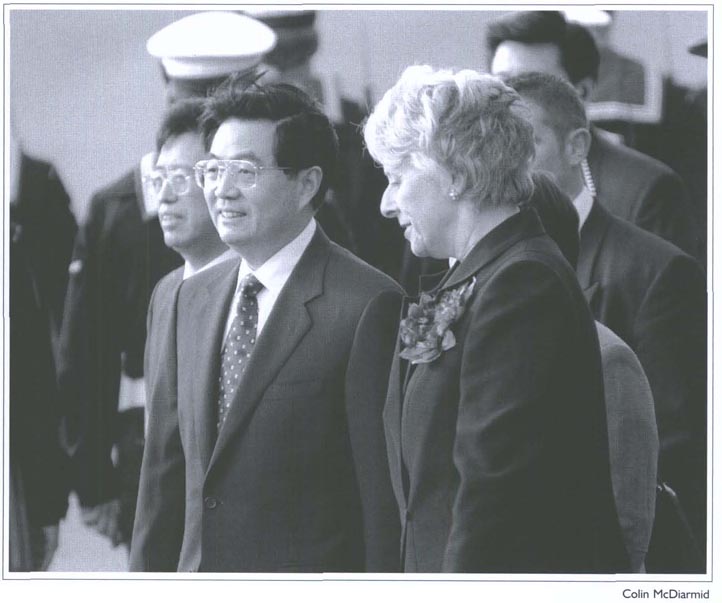
Welcoming high-ranking overseas dignitaries is an official duty of the Governor-General of New Zealand, Dame Silvia Cartwright.
The Governor-General of New Zealand is the representative of the Sovereign in New Zealand and exercises the royal powers derived from statute and the general law (prerogative powers). The powers of the governor-general are set out in the Letters Patent 1983 and it is for the courts to decide on the limits of these powers.
One of the governor-general's main constitutional functions is to arrange for the leader of the majority party in parliament to form a government.
The Crown is part of parliament and the governor-general's assent is required before bills can become law. The governor-general is required, however, by constitutional convention and the Letters Patent, to follow the advice of ministers. In extraordinary circumstances, the governor-general can reject advice if he or she believes a government is intending to act unconstitutionally. This is known as the reserve power.
The Sovereign appoints the governor-general on the prime minister's recommendation, normally for a term of five years.
Table 3.02 lists Lieutenant-Governors, Governors and Governors-General of New Zealand since signing of the Treaty of Waitangi.
Table 3.02. Vice-regal representatives
| Representative1 | Assumed office | Retired |
|---|---|---|
1Honours are specified only if held on retirement from office. Source: Office of the Governor-General | ||
| Dependency | ||
| Lieutenant-Governor | ||
| Captain William Hobson, RN | 30 Jan 1840 | 3 May 1841 |
| Crown colony | ||
| Governor | ||
| Captain William Hobson, RN | 3 May 1841 | 10 Sep 1842 |
| Captain Robert FitzRoy, RN | 26 Dec 1843 | 17 Nov 1845 |
| Captain George Grey | 18 Nov 1845 | 31 Dec 1847 |
| Governor-in-Chief Sir George Grey, KCB | 1 Jan 1848 | 7 Mar 1853 |
| Self-governing colony | ||
| Governor of New Zealand | ||
| Sir George Grey, KCB | 7 Mar 1853 | 31 Dec 1853 |
| Colonel Thomas Gore Browne, CB | 6 Sep 1855 | 2 Oct 1861 |
| Sir George Grey, KCB | 4 Dec 1861 | 5 Feb 1868 |
| Sir George Ferguson Bowen, GCMG | 5 Feb 1868 | 19 Mar 1873 |
| Rt Hon Sir James Fergusson, Bt | 14 Jun 1873 | 3 Dec 1874 |
| Marquess of Normanby, GCB, GCMG, PC | 9 Jan 1875 | 21 Feb 1879 |
| Self-governing colony | ||
| Governor of New Zealand | ||
| Sir Hercules George Robert Robinson, GCMG | 17 Apr 1879 | 8 Sep 1880 |
| Hon Sir Arthur Hamilton Gordon, GCMG | 29 Nov 1880 | 23 Jun 1882 |
| Lieutenant-General Sir William Francis Drummond Jervois, GCMG, CB | 20 Jan 1883 | 22 Mar 1889 |
| Earl of Onslow, GCMG | 2 May 1889 | 24 Feb 1892 |
| Earl of Glasgow, GCMG | 7 Jun 1892 | 6 Feb 1897 |
| Earl of Ranfurly, GCMG | 10 Aug 1897 | 19 Jun 1904 |
| Lord Plunket, GCMG, KCVO | 20 Jun 1904 | 7 Jun 1910 |
| Dominion | ||
| Lord Islington, KCMG, DSO, PC | 22 Jun 1910 | 2 Dec 1912 |
| Earl of Liverpool, GCMG, MVO, PC | 19 Dec 1912 | 27 Jun 1917 |
| Governor-General of New Zealand | ||
| Earl of Liverpool, GCB, GCMG, GBE, MVO, PC | 28 Jun 1917 | 7 Jul 1920 |
| Admiral of the Fleet Viscount Jellicoe, GCB, OM, GCVO | 27 Sep 1920 | 26 Nov 1924 |
| General Sir Charles Fergusson, BT, GCMG, KCB, DSO, MVO | 13 Dec 1924 | 8 Feb 1930 |
| Viscount Bledisloe, GCMG, KBE, PC | 19 Mar 1930 | 15 Mar 1935 |
| Viscount Galway, GCMG, DSO, OBE, PC | 12 Apr 1935 | 3 Feb 1941 |
| Marshal of the Royal Air Force Sir Cyril Louis Norton Newall, GCB, OM, GCMG, CBE, AM | 22 Feb 1941 | 19 Apr 1946 |
| Realm | ||
| Lieutenant-General the Lord Freyberg, VC, GCMG, KCB, KBE, DSO | 17 Jun 1946 | 15 Aug 1952 |
| Lieutenant-General the Lord Norrie, GCMG, GCVO, CB, DSO, MC | 2 Dec 1952 | 25 Jul 1957 |
| Viscount Cobham, GCMG, TD | 5 Sep 1957 | 13 Sep 1962 |
| Brigadier Sir Bernard Fergusson, GCMG, GCVO, DSO, OBE | 9 Nov 1962 | 20 Oct 1967 |
| Sir Arthur Espie Porritt, BT, GCMG, GCVO, CBE | 1 Dec 1967 | 7 Sep 1972 |
| Sir (Edward) Denis Blundell, GCMG, GCVO, KBE, QSO | 27 Sep 1972 | 5 Oct 1977 |
| Rt Hon Sir Keith Jacka Holyoake, KG, GCMG, CH, QSO | 26 Oct 1977 | 27 Oct 1980 |
| Hon Sir David Stuart Beattie, GCMG, GCVO, QSO, QC | 6 Nov 1980 | 10 Nov 1985 |
| Most Reverend Sir Paul Alfred Reeves, GCMG, GCVO, QSO | 20 Nov 1985 | 29 Nov 1990 |
| Dame Catherine Tizard, GCMG, GCVO, DBE, QSO | 13 Dec 1990 | 3 Mar 1996 |
| Rt Hon Sir Michael Hardie Boys, GNZM, GCMG, QSO | 21 Mar 1996 | 21 Mar 2001 |
| Dame Silvia Cartwright, PCNZM, DBE | 4 April 2001 | |
Since 1856, New Zealand has been a constitutional monarchy with a parliamentary system of government.
The government cannot act effectively without parliament, because it cannot raise or spend money without parliamentary approval.
For most categories of expenditure, this approval takes the form of an annual vote of funds to the government. Parliament has to be assembled regularly, therefore, and thus has the opportunity to hold the government to account.
The general election in 1996 was the first held in New Zealand under the Mixed Member Proportional (MMP) system, where voters have a party vote and an electorate vote.
Voters choose what party they want in parliament with their party vote and which person they want to represent their electorate with their electorate vote.
For the 2002 election, New Zealand was divided geographically into 62 general electorates and seven Māori ones. There were also 51 seats for list Members of Parliament.
The number of general electorates may change as the population changes.
People of Māori descent can choose whether to be on the Māori or general electoral rolls. The number of Māori seats may change as the number of voters on the Māori roll changes and the Māori population as a whole changes.
The Electoral Act 1993, which sets out the way the New Zealand electoral system works, is the only statute in New Zealand with entrenched provisions.
Being entrenched means that if certain changes to the act are made, for example the method of voting, they must be passed by either 75 percent of MPs, or a majority vote in a referendum of all voters on the electoral rolls.
Normally, a simple majority (51 percent) of MPs is all that is required to make changes to an act.
Table 3.03 lists the Premiers and Prime Ministers of New Zealand.
Table 3.03. Premiers and Prime Ministers of New Zealand
| Premier/prime minister1 | Term(s) of office | |
|---|---|---|
1Honours are specified only if held on retirement from office. Source: Office of the Clerk of the House of Representatives | ||
| Premiers | ||
| Henry Sewell | 7 May 1856-20 May 1856 | |
| William Fox | 20 May 1856-2 Jun 1856 | |
| Edward William Stafford | 2 Jun 1856-12 Jul 1861 | |
| William Fox | 12 Jul 1861-6 Aug 1862 | |
| Alfred Domett | 6 Aug 1862-30 Oct 1863 | |
| Frederick Whitaker, MLC | 30 Oct 1863-24 Nov 1864 | |
| Frederick Aloysius Weld | 24 Nov 1864-16 Oct 1865 | |
| Edward William Stafford | 16 Oct 1865-28 Jun 1869 | |
| William Fox | 28 Jun 1869-10 Sep 1872 | |
| Edward William Stafford | 10 Sep 1872-11 Oct 1872 | |
| George Marsden Waterhouse, MLC | 11 Oct 1872-3 Mar 1873 | |
| William Fox | 3 Mar 1873-8 Apr 1873 | |
| Sir Julius Vogel, KMG | 8 Apr 1873-6 Jul 1875 | |
| Daniel Pollen, MLC | 6 Jul 1875-15 Feb 1876 | |
| Sir Julius Vogel, KCMG | 15 Feb 1876-1 Sep 1876 | |
| Sir Harry Albert Atkinson, KCMG | 1 Sep 1876-13 Oct 1877 | |
| Sir George Grey, KCB | 13 Oct 1877-8 Oct 1879 | |
| John Hall | 8 Oct 1879-21 Apr 1882 | |
| Frederick Whitaker | 21 Apr 1882-25 Sep 1883 | |
| Sir Harry Albert Atkinson, KCMG | 25 Sep 1883-16 Aug 1884 | |
| Sir Robert Stout, KCMG | 16 Aug 1884-28 Aug 1884 | |
| Sir Harry Albert Atkinson, KCMG | 28 Aug 1884-3 Sep 1884 | |
| Sir Robert Stout, KCMG | 3 Sep 1884-8 Oct 1887 | |
| Sir Harry Albert Atkinson, KCMG | 8 Oct 1887-24 Jan 1891 | |
| John Ballance | Liberal | 24 Jan 1891-d 27 Apr 1893 |
| Rt Hon Richard John Seddon | Liberal | 1 May 1893-d 10 Jun 1906 |
| Prime Ministers | ||
| William Hall-Jones | Liberal | 21 Jun 1906-6 Aug 1906 |
| Rt Hon Sir Joseph George Ward, Bt, KCMG | Liberal | 6 Aug 1906-28 Mar 1912 |
| Thomas MacKenzie | Liberal | 28 Mar 1912-10 Jul 1912 |
| Rt Hon William Ferguson Massey | Reform | 10 Jul 1912-10 May 1925 |
| Sir Francis Henry Dillon Bell, GCMG, KC, MLC | Reform | 14 May 1925-30 May 1925 |
| Rt Hon Joseph Gordon Coates, MC | Reform | 30 May 1925-10 Dec 1928 |
| Rt Hon Sir Joseph George Ward, Bt, KCMG | United | 10 Dec 1928-28 May 1930 |
| Rt Hon George William Forbes | United | 28 May 1930-22 Sep 1931 |
| Coalition | 22 Sep 1931-6 Dec 1935 | |
| Rt Hon Michael Joseph Savage | Labour | 6 Dec 1935-d 27 Mar 1940 |
| Rt Hon Peter Fraser, CH | Labour | 1 Apr 1940-13 Dec 1949 |
| Rt Hon Sidney George Holland, CH | National | 13 Dec 1949-20 Sep 1957 |
| Rt Hon Sir Keith Jacka Holyoake, GCMG, CH | National | 20 Sep 1957-12 Dec 1957 |
| Rt Hon Walter Nash, CH | Labour | 12 Dec 1957-12 Dec 1960 |
| Rt Hon Sir Keith Jacka Holyoake, GCMG, CH | National | 12 Dec 1960-7 Feb 1972 |
| Rt Hon John Ross Marshall (later Sir) | National | 7 Feb 1972-8 Dec 1972 |
| Rt Hon Norman Eric Kirk | Labour | 8 Dec 1972-d 31 Aug 1974 |
| Rt Hon Wallace Edward Rowling (later Sir) | Labour | 6 Sep 1974-12 Dec 1975 |
| Rt Hon Sir Robert David Muldoon, GCMG, CH | National | 12 Dec 1975-26 Jul 1984 |
| Rt Hon David Russell Lange | Labour | 26 Jul 1984-8 Aug 1989 |
| Rt Hon Geoffrey Winston Russell Palmer (later Sir) | Labour | 8 Aug 1989-4 Sep 1990 |
| Rt Hon Michael Kenneth Moore | Labour | 4 Sep 1990-2 Nov 1990 |
| Rt Hon James Brendan Bolger | National | 2 Nov 1990-12 Oct 1996 |
| Coalition | 12 Oct 1996-8 Dec 1997 | |
| Rt Hon Jennifer Mary Shipley | Coalition | 8 Dec 1997-10 Dec 1999 |
| Rt Hon Helen Elizabeth Clark | Labour/Alliance | 10 Dec 1999-15 Aug 2002 |
| Rt Hon Helen Elizabeth Clark | Labour/Progressive | 15 Aug 2002- |
The power to make laws lies at the heart of New Zealand's parliamentary system.
This power is vested in the Parliament of New Zealand by the Constitution Act 1986. Parliament consists of the Sovereign (normally represented by the governor-general) and an elected House of Representatives.
Table 3.04 shows seats held by political parties after general elections since 1890.
The principal functions of parliament are to enact laws, to supervise the government's administration, to vote supply, to provide a government and to redress grievances by way of petition.
The Constitution Act forbids the house allocating public funds for any purpose unless first recommended by the Crown. At the same time, the law forbids the Crown taxing citizens without express parliamentary approval.
Under standing orders, private members are able to initiate proposals involving expenditure or taxation. However, the government has an absolute right to veto such proposals if, in its view, they would have more than a minor impact on the government's fiscal aggregates.
Perhaps the most important privilege of the House of Representatives is that of freedom of speech, guaranteed by the Bill of Rights 1688 and claimed by the Speaker upon confirmation in office by the governor-general.
Table 3.04. Seats held by political parties after general elections
| Election | Total | Liberal | Conservative | Labour | Act | NZ First | Alliance | Green | Other | Independent |
|---|---|---|---|---|---|---|---|---|---|---|
1Māori members whose party allegiances difficult to determine. 2Country Party. 3Rātana. 4Social Credit/Democrats. 5New Labour. 6Includes Speaker of the House. 7United. 8United Future 8 seats, Progressive Coalition 2 seats. Source: Office of the Clerk of the House of Representatives | ||||||||||
| 1890 | 74 | 38 | 25 | 41 | 7 | |||||
| 1893 | 74 | 51 | 13 | 41 | 6 | |||||
| 1896 | 74 | 39 | 25 | 41 | 6 | |||||
| 1899 | 74 | 49 | 19 | 41 | 2 | |||||
| 1902 | 80 | 47 | 19 | 41 | 10 | |||||
| 1905 | 80 | 58 | 16 | 6 | ||||||
| Reforms | ||||||||||
| 1908 | 80 | 50 | 26 | 1 | 3 | |||||
| 1911 | 80 | 33 | 37 | 4 | 6 | |||||
| 1914 | 80 | 33 | 41 | 6 | ||||||
| 1919 | 80 | 21 | 47 | 8 | 4 | |||||
| 1922 | 80 | 22 | 37 | 17 | 4 | |||||
| 1925 | 80 | 11 | 55 | 12 | 2 | |||||
| 1928 | 80 | 27 | 27 | 19 | 12 | 6 | ||||
| Coalition | ||||||||||
| 1931 | 80 | 51 | 24 | 12 | 4 | |||||
| National | ||||||||||
| 1935 | 80 | 19 | 53+23 | 22 | 4 | |||||
| 1938 | 80 | 25 | 53 | 2 | ||||||
| 1943 | 80 | 34 | 45 | 1 | ||||||
| 1946 | 80 | 38 | 42 | |||||||
| 1949 | 80 | 46 | 34 | |||||||
| 1951 | 80 | 50 | 30 | |||||||
| 1954 | 80 | 45 | 35 | |||||||
| 1957 | 80 | 39 | 41 | |||||||
| 1960 | 80 | 46 | 34 | |||||||
| 1963 | 80 | 45 | 35 | |||||||
| 1966 | 80 | 44 | 35 | 14 | ||||||
| 1969 | 84 | 45 | 39 | |||||||
| 1972 | 87 | 32 | 55 | |||||||
| 1975 | 87 | 55 | 32 | |||||||
| 1978 | 92 | 51 | 40 | 14 | ||||||
| 1981 | 92 | 47 | 43 | 24 | ||||||
| 1984 | 95 | 37 | 56 | 24 | ||||||
| 1987 | 97 | 40 | 57 | |||||||
| 1990 | 97 | 67 | 29 | 15 | ||||||
| 1993 | 99 | 50 | 456 | 2 | 2 | |||||
| 1996 | 120 | 446 | 37 | 8 | 17 | 13 | 17 | |||
| 1999 | 120 | 39 | 49 | 9 | 5 | 10 | 7 | 17 | ||
| 2002 | 120 | 27 | 52 | 9 | 13 | 9 | 108 | |||
The house meets in answer to a summons from the governor-general. Sessions of parliament are marked by a formal opening, when the government's legislative programme is described in the Speech from the Throne, read by the governor-general in the absence of the Sovereign. The session is either terminated by prorogation or, as is now usually the case, directly by dissolution of parliament. Unless there is a new session, the prime minister's statement at the start of business in the second and third years of the parliamentary term reviews public affairs and outlines the government's legislative and other policy intentions for the year ahead.
The Speaker, elected by the house, is the principal presiding officer, maintaining order in proceedings and ensuring standing orders are complied with. The Speaker is assisted by the Clerk of the House of Representatives, who notes all proceedings of the house and of any committee of the house, and provides advice on parliamentary law and custom.
Role of parties. For many years up to 1993, under the first past the post (FPP) system of electoral representation, the House of Representatives was characterised by the presence of two, large, dominant parties, with the majority party forming the government and the minority party the opposition.
This, however, has given way to multi-party representation under the mixed member proportional (MMP) system of electoral representation, adopted after two referendums, one indicative (1992) and one binding (1993).
The three general elections held since 1996 demonstrated that under MMP it is unlikely that any single party will command an absolute majority in the house and be able to form a government on its own account.
Because of the importance that parties have assumed within the political framework, the party caucus (a meeting of each party's Members of Parliament in closed session at regular intervals, once a week when parliament is in session) has become a primary means of developing policies and tactics.
Party representation. The general election on 27 July 2002 resulted again in the formation of a Labour-led minority coalition government. The Labour Party entered into a coalition government agreement with Jim Anderton's Progressive Coalition Party on 8 August 2002. An agreement was also concluded that day by the minority coalition government with United Future, which promised it would provide confidence and supply for the term of parliament to a Labour/Progressive government.
The new ministry was sworn in on 15 August 2002.
On 26 August 2002, a cooperation agreement was entered into by the government with the Green Party on agreed areas of policy development and legislation.
The third House of Representatives elected under MMP consisted of:
Labour 52 seats (45 electorate, 7 party list).
National 27 seats (21 electorate, 6 party list).
New Zealand First 13 seats (1 electorate, 12 party list).
ACT New Zealand 9 seats (9 party list).
Green Party 9 seats (9 party list).
United Future 8 seats (1 electorate, 7 party list).
Progressive Coalition 2 seats (1 electorate, 1 party list).
Legislative procedure. The legislative procedure starts in New Zealand when proposed laws are presented to the House of Representatives in the form of draft laws known as ‘bills’. Classes of bills are:
Government bills, which deal with matters of public policy and which are introduced by a minister.
Members' bills, which deal with matters of public policy and which are introduced by a Member of Parliament who is not a minister.
Local bills, which are promoted by local authorities to give them special powers or validate unlawful actions they may have taken, and which affect particular localities.
Private bills, promoted by individuals or bodies (such as companies or trusts) for their particular interest or benefit.
All types of bills follow a similar procedure in the house, with every bill being required to be ‘read’ three times. A local bill or a private bill must also comply with prescribed preliminary procedures, which entail advertising the bill before its introduction into the house. The number of members' bills that may be introduced and proceed at any one time to first reading is limited to four, chosen by ballot.
Under standing orders, a government bill is introduced by the Leader of the House informing the Clerk of the House on any working day, or by 1pm on a sitting day, of the government's intention to introduce the bill.
A member's bill or a local bill is introduced after notice of intention to introduce it is given and the bill's introduction has been announced to the house.
A private bill is introduced by presentation of a petition for the bill to the house. The bill is then set down for first reading on the third sitting day following.
Debate on the first reading is limited to 12 speeches in the case of a government bill, or six speeches of 10 minutes each for private bills and local bills, with the member in charge getting a five-minute right of reply. For members' bills, there may be up to two 10-minute speeches and eight five-minute speeches with a right of reply.
After its first reading, a bill is referred to a select committee of the house for consideration, unless it is an appropriation bill, an imprest supply bill, or a bill that has been accorded urgency for its passing. Select committee consideration of bills provides an opportunity for the public and interested bodies to make submissions in the expectation that better law will result. Committees also carry out scrutiny functions in relation to such matters as estimates, financial reviews and petitions. A committee must finally report to the house on a bill within six months of the bill being referred to it, unless the business committee extends that time. In its report recommending amendments to a bill, the committee must distinguish between those adopted unanimously by the committee and those adopted by a majority.
Following presentation of a select committee report on a bill, the report is set down for second reading on the third sitting day following. At the conclusion of debate on the report, the house decides whether to agree to the amendments recommended by the select committee by majority. The house then decides whether the bill should be read a second time. The second reading of a bill is directed to the principles and objects of the bill. A bill to which the house gives a second reading is set down for consideration in a committee of the whole house next sitting day, unless the business committee decides that the bill does not require consideration in committee. In committee, the bill is considered clause by clause or, if so instructed, part by part.
Once a bill has been fully considered by the committee, it is reported to the house with any amendments agreed to.
The house having adopted the report, the bill is then set down for third reading next sitting day. Debate on the third reading is limited to 12 speeches of 10 minutes each.
After a third reading has been given, a bill that has been passed by the house is forwarded to the governor-general for the Royal Assent. The bill then becomes an Act of Parliament and part of the law of New Zealand.
Sessions of parliament. The first session of the 47th New Zealand Parliament was called following the general election of 27 July 2002 and began sitting on 26 August 2002.
Salaries and allowances of parliamentarians. Salaries and allowances of parliamentarians are set by the Remuneration Authority and are shown in Table 3.05.
Table 3.05. Parliamentary salaries and allowances
| Salary | Annual salary or allowance payable from 1 November 20031 |
|---|---|
1Parliamentary Salaries and Allowances Determination (SR 2003/305). Source: Office of the Clerk of the House of Representatives | |
| Members of the Executive | $ |
| Prime Minister | 305,000 |
| Deputy Prime Minister | 218,000 |
| Minister in cabinet | 195,000 |
| Minister with portfolio outside cabinet | 165,000 |
| Minister without portfolio | 145,000 |
| Parliamentary Under-Secretary | 130,000 |
| Officers of the House of Representatives | |
| Speaker | 195,000 |
| Deputy Speaker | 140,000 |
| Assistant Speaker | 120,000 |
| Chair of Select Committee | 120,000 |
| Deputy Chair of Select Committee | 112,500 |
| Leaders of non-government parties | |
| Leader of the Opposition | 195,000 |
| Other party leaders (depending on number of MPs) | 120,000+ |
| Deputy leader of party with 25 MPs or more | 120,000 |
| Whips | |
| Senior Government Whip | 123,000 |
| Other whips (depending on number of MPs) | 120,000+ |
| Members of Parliament | |
| Member of Parliament | 110,000 |
| Salary | |
| Expenses allowance | |
| Prime Minister | 17,000 |
| Speaker | 16,000 |
| Other Members of Parliament | 12,815 |
One of the roles of the Speaker of the House of Representatives is to read the prayer at the beginning of each sitting day.
Table 3.06 lists Members of the House of Representatives during the 47th parliament.
Table 3.06. House of Representatives, 47th parliament
Prime Minister - Rt Hon Helen Clark Leader of the Opposition - Hon Bill English; Dr Don Brash (from 28 October 2003) Speaker - Rt Hon Jonathan Hunt Deputy Speaker - Ann Hartley Clerk of the House - D G McGee | ||||
|---|---|---|---|---|
| Member1 | Year of birth | Previous occupation | Electorate/list | Party |
1Names are given by which individual members prefer to be addressed. 2Resigned with effect on 25 July 2003. 3Declared elected 28 July 2003, replacing Graham Kelly. 4Resigned with effect on 17 May 2004. Re-elected Māori Party MP for Te Tai Hauauru electorate 10 July 2004. Source: Office of the Clerk of the House of Representatives | ||||
| Adams, Paul | 1948 | Business owner | list | United Future |
| Alexander, Marc | 1958 | Restaurateur | list | United Future |
| Anderton, Hon Jim | 1938 | Company director | Wigram | Prog. Coalition |
| Ardern, Shane | 1960 | Farmer | Taranaki/King Country | National |
| Awatere Huata, Donna | 1949 | Māori development consultant | list | ACT |
| Baldock, Larry | 1954 | Local authority member | list | United Future |
| Barker, Hon Rick | 1951 | Trade unionist | Tukituki | Labour |
| Barnett, Tim | 1958 | Voluntary sector manager | Christchurch Central | Labour |
| Benson-Pope, Hon David | 1950 | Teacher | Dunedin South | Labour |
| Beyer, Georgina | 1957 | Mayor | Wairarapa | Labour |
| Bradford, Sue | 1952 | Community development worker | list | Green |
| Brash, Dr Don | 1940 | Governor of Reserve Bank | list | National |
| Brown, Peter | 1939 | Company director | list | NZ First |
| Brownlee, Gerry | 1956 | Teacher | Ham | National |
| Burton, Hon Mark | 1956 | Community education organiser | Taupo | Labour |
| Carter, Hon Chris | 1952 | Electorate secretary | Te Atatu | Labour |
| Carter, Hon David | 1952 | Businessman, farmer | list | National |
| Carter, John | 1950 | Local government officer | Northland | National |
| Catchopole, Brent | 1953 | Marketing director | list | NZ First |
| Chadwick, Steve | 1948 | Nurse/midwife | Rotorua | Labour |
| Choudhary, Dr Ashraf | 1949 | University lecturer | list | Labour |
| Clark, Rt Hon Helen | 1950 | University lecturer | Mt Albert | Labour |
| Coddington, Deborah | 1953 | Journalist | list | ACT |
| Collins, Judith | 1959 | Lawyer | Clevedon | National |
| Connell, Brian | 1956 | Farmer | Rakaia | National |
| Copeland, Gordon | 1943 | Financial administrator | list | United Future |
| Cosgrove, Clayton | 1969 | Public relations executive | Waimakariri | Labour |
| Cullen, Hon Dr Michael | 1945 | University lecturer | list | Labour |
| Cunliffe, Hon David | 1963 | Management consultant | New Lynn | Labour |
| Dalziel, Hon Lianne | 1960 | Trade unionist | Christchurch East | Labour |
| Donald, Rod | 1957 | Voluntary sector administrator | list | Green |
| Donnelly, Hon Brian | 1949 | School principal | list | NZ First |
| Duncan, Helen | 1941 | Teacher, trade unionist | list | Labour |
| Dunne, Hon Peter | 1954 | Deputy chief executive officer | Ohariu/Belmont | United Future |
| Duynhoven, Hon Harry | 1955 | Teacher | New Plymouth | Labour |
| Dyson, Hon Ruth | 1957 | Employment consultant | Banks Peninsula | Labour |
| Eckhoff, Gerrard | 1947 | Farmer | list | ACT |
| English, Hon Bill | 1961 | Farmer | Clutha/Southland | National |
| Ewen-Street, Ian | 1950 | Organic farmer | list | Green |
| Fairbrother, Russell | 1944 | Lawyer | Napier | Labour |
| Field, Hon Taito Phillip | 1952 | Trade unionist | Mangere | Labour |
| Fitzsimons, Jeanette | 1945 | Organic farmer, environmental consultant | list | Green |
| Franks, Stephen | 1950 | Lawyer | list | ACT |
| Gallagher, Martin | 1952 | Company director, teacher | Hamilton West | Labour |
| Goff, Hon Phil | 1953 | University lecturer | Mt Roskill | Labour |
| Gosche, Hon Mark | 1955 | Trade unionist | Maungakiekie | Labour |
| Goudie, Sandra | 1953 | Farmer | Coromandel | National |
| Gudgeon, Bill | 1942 | Polytechnic lecturer | list | NZ First |
| Hartley, Ann | 1942 | Real estate agent | Northcote | Labour |
| Hawkins, Hon George | 1946 | Teacher | Manurewa | Labour |
| Heatley, Philip | 1967 | Engineer | Whangarei | National |
| Hereora, Dave | 1956 | Trade unionist | list | Labour |
| Hide, Rodney | 1956 | Economic consultant | list | ACT |
| Hobbs, Hon Marian | 1947 | Teacher | Wellington Central | Labour |
| Hodgson, Hon Pete | 1950 | Veterinarian | Dunedin North | Labour |
| Horomia, Hon Parekura | 1950 | Public servant, farmer | Ikaroa-Rawhiti | Labour |
| Hughes, Darren | 1977 | Executive secretary | Otaki | Labour |
| Hunt, Rt Hon Jonathan | 1938 | Teacher | list | Labour |
| Hutchison, Dr Paul | 1947 | Gynecologist | Port Waikato | National |
| Jones, Dail | 1944 | Lawyer | list | NZ First |
| Kedgley, Sue | 1948 | Author, local authority member | list | Green |
| Kelly, Graham2 | 1941 | Trade unionist | Mana | Labour |
| Key, John | 1961 | Investment banker | Helensville | National |
| King, Hon Annette | 1945 | Chief executive officer | Rongotai | Labour |
| Laban, Luamanuvao Winnie | 1955 | Family therapist | Mana | Labour |
| Locke, Keith | 1945 | Retail manager | list | Green |
| Mackey, Janet | 1953 | Real estate agent | East Coast | Labour |
| Mackey, Moana3 | 1974 | Executive assistant, biochemist | list | Labour |
| McCully, Hon Murray | 1953 | Public relations consultant | East Coast Bays | National |
| McNair, Craig | 1975 | Marketing manager | list | NZ First |
| Maharey, Hon Steve | 1953 | University lecturer | Palmerston North | Labour |
| Mahuta, Nanaia | 1970 | Archivist librarian | Tainui | Labour |
| Mallard, Hon Trevor | 1954 | Executive assistant | Hutt South | Labour |
| Mapp, Dr Wayne | 1952 | Law lecturer | North Shore | National |
| Mark, Ron | 1954 | Businessman, army officer | list | NZ First |
| Newman, Dr Muriel | 1950 | Tertiary/secondary teacher, businesswoman | list | ACT |
| O'Connor, Hon Damien | 1958 | Tourism operator | West Coast/Tasman | Labour |
| Ogilvie, Bernie | 1941 | Lecturer | list | United Future |
| Okeroa, Mahara | 1946 | Regional director | Te Tai Tonga | Labour |
| Paraone, Pita | 1945 | Public servant | list | NZ First |
| Parker, David | 1960 | Biotechnology businessman | Otago | Labour |
| Peck, Mark | 1953 | Trade unionist | Invercargill | Labour |
| Perry, Edwin | 1948 | Farm equipment salesman | list | NZ First |
| Peters, Jim | 1937 | School principal | list | NZ First |
| Peters, Rt Hon Winston | 1945 | Lawyer | Tauranga | NZ First |
| Pettis, Jill | 1952 | Education administrator | Whanganui | Labour |
| Pillay, Lynne | 1950 | Trade unionist | Waitakere | Labour |
| Power, Simon | 1969 | Lawyer | Rangitikei | National |
| Prebble, Hon Richard | 1948 | Lawyer | list | ACT |
| Rich, Katherine | 1968 | Businesswoman | list | National |
| Ririnui, Mita | 1951 | Minister of religion | Waiariki | Labour |
| Robertson, Ross | 1949 | Industrial engineer | Manukau East | Labour |
| Robson, Hon Matt | 1950 | Lawyer | list | Prog.Coalition |
| Roy, Heather | 1964 | Gallery contractor | list | ACT |
| Ryall, Hon Tony | 1964 | Accountant | Bay of Plenty | National |
| Samuels, Hon Dover | 1939 | Company director | Te Tai Tokerau | Labour |
| Scott, Lynda | 1956 | Geriatrician | Kaikoura | National |
| Shirley, Hon Ken | 1950 | Executive director | list | ACT |
| Simich, Hon Clem | 1939 | General manager | Tamaki | National |
| Smith, Hon Dr Lockwood | 1948 | Managing director | Rodney | National |
| Smith, Murray | 1953 | Lawyer | list | United Future |
| Smith, Hon Nick | 1964 | Engineer | Nelson | National |
| Sowry, Hon Roger | 1958 | Retail manager | list | National |
| Stewart, Barbara | 1952 | Training and development manager | list | NZ First |
| Sutton, Hon Jim | 1941 | Farmer | Aoraki | Labour |
| Swain, Hon Paul | 1951 | Trade unionist | Rimutaka | Labour |
| Tamihere, Hon John | 1960 | Chief executive, lawyer | Tamaki Makaurau | Labour |
| Tanczos, Nandor | 1966 | Business owner/director | list | Green |
| Te Heuheu, Hon Georgina | 1943 | Consultant, advocate Treaty of Waitangi issues | list | National |
| Tich, Lindsay | 1947 | Management consultant | Piako | National |
| Tizard, Hon Judith | 1956 | Electorate secretary | Auckland Central | Labour |
| Turei, Metira | 1970 | Lawyer | list | Green |
| Turia, Hon Tariana4 | 1944 | Iwi development worker | Te Tai Hauauru | Labour |
| Turner, Judy | 1957 | Teacher | list | United Future |
| Ward, Mike | 1942 | Local authority member | list | Green |
| Williamson, Hon Maurice | 1951 | Planning analyst | Pakuranga | National |
| Wilson, Hon Margaret | 1947 | University lecturer | list | Labour |
| Wong, Pansy | 1955 | Accountant | list | National |
| Woolerton, Doug | 1944 | Farmer | list | NZ First |
| Worth, Richard | 1948 | Lawyer | Epsom | National |
| Yates, Dianne | 1943 | Education officer | Hamilton East | Labour |
Helen Clark (1950-)  The first woman to be elected Prime Minister of New Zealand, Helen Clark was born in Hamilton in 1950. She grew up on a Waikato farm and was educated at Epsom Girls' Grammar School (Auckland) and the University of Auckland. It was there, in 1971, that she joined the Labour Party. She graduated MA (Hons) in 1974. From 1973 to 1975, Clark was a junior lecturer in political studies at Auckland University, becoming a lecturer in 1977. After unsuccessfully contesting the Piako seat in 1975, she was elected Labour Member of Parliament for Mt Albert in 1981. Clark convened the Government Caucus Committee on External Affairs and Security from 1984 to 1987 and was Minister of Conservation and Minister of Housing from 1987 to 1989. She became Minister of Health in January 1989 and Minister of Labour and deputy prime minister in August of that year. She chaired the Cabinet Social Equity Committee and served on seven other cabinet committees. Clark has also chaired two select committees, foreign affairs and defence, and disarmament and arms control. Following the Labour government's defeat in October 1990, Clark became deputy leader of the opposition. Three years later, on 1 December 1993, she succeeded Mike Moore as Labour's parliamentary leader and leader of the opposition. When Labour formed a government after the second MMP election on 27 November 1999, Clark became prime minister. She is also Minister for Arts, Culture and Heritage, and for the Security Intelligence Service. She has wide-ranging interests. As well as serving for many years on the Labour Party's New Zealand executive, Clark has been president of the Labour Youth Council, an executive member of the party's Auckland regional council, secretary of the Labour Women's Council and a member of the policy council. She has also represented the party at Socialist International congresses and conferences overseas. In 1986, Clark was awarded the annual peace prize of the Danish Peace Foundation for her work in promoting international peace and disarmament. She is married to Peter Davis and her leisure activities include reading, music and theatre, and hiking and cross-country skiing. Source: Department of the Prime Minister and Cabinet |
The executive government of New Zealand is carried out on behalf of the Sovereign (represented by the governor-general) by Ministers of the Crown who make up membership of the cabinet and the Executive Council. Ministers are responsible to parliament for their official actions by constitutional convention and are required to be Members of Parliament by the Constitution Act 1986.
After a general election, the governor-general invites the leader of the party, or parties, with the confidence of the House of Representatives to accept office as prime minister and form a government.
On the new prime minister's advice, the governor-general appoints a number of Members of Parliament ministers, generally with responsibilities for various areas of government administration (portfolios).
The governor-general may also appoint parliamentary under-secretaries, who are not ministers and not members of the Executive Council, to assist ministers.
Cabinet and the Executive Council. The cabinet and the Executive Council have separate functions. All ministers are members of the Executive Council, but not all ministers are in cabinet. The Executive Council is a formal body with formal functions, whereas cabinet is an informal body with deliberative functions.
The Executive Council tenders advice to the governor-general on the basis of policy formulated in cabinet.
The council is established under Clause VII of the Letters Patent and is the main vehicle for lawmaking by the executive. Authority to make statutory regulations, for example, is delegated by parliament to the governor-general in council.
The cabinet is, in effect, the highest policy-making body of government. It is the main vehicle by which the executive decides on major policy issues and legislative proposals, and it coordinates the work of ministers. The cabinet has a system of committees, which can examine subjects in detail and recommend specific policy measures to cabinet.
Proceedings of cabinet are informal and confidential, and decisions are usually made by consensus. By convention, cabinet accepts collective responsibility for its decisions, which ensures that, unless the matter is agreed to be one of party differentiation, once a decision is made, it will be publicly supported by all members of the government.
The Cabinet Office provides support services for the cabinet and its committees. The current Secretary of the Cabinet is also Clerk of the Executive Council.
The makeup of the New Zealand Government at 21 November 2003 is shown in Table 3.07.
Table 3.07. New Zealand Government
21 November
2003
| Governor-General of New Zealand | |
|---|---|
Her Excellency The Honourable Dame Silvia Cartwright, PCNZM, DBE (assumed office 4 April 2001). | |
| Executive Council | |
Membership of the Executive Council comprises all ministers, with the governor-general presiding. | |
| The | Cabinet |
| Source: Cabinet Office | |
| 1 | Rt Hon Helen Clark, Prime Minister, Minister for Arts, Culture and Heritage, Minister Responsible for Ministerial Services, Minister in Charge of the New Zealand Security Intelligence Service, Minister Responsible for the Government Communications Security Bureau. |
| 2 | Hon Dr Michael Cullen, Deputy Prime Minister, Minister of Finance, Minister of Revenue, Leader of the House. |
| 3 | Hon Jim Anderton, Minister for Economic Development, Minister for Industry and Regional Development, Minister Responsible for the Public Trust, Associate Minister of Health. |
| 4 | Hon Steve Maharey, Minister for Social Development and Employment, Minister of Housing, Minister of Broadcasting, Associate Minister of Education (Tertiary Education), Minister Responsible for Tertiary Education Commission. |
| 5 | Hon Phil Goff, Minister of Foreign Affairs and Trade, Minister of Justice, Minister of Pacific Island Affairs. |
| 6 | Hon Annette King, Minister of Health, Minister for Food Safety. |
| 7 | Hon Jim Sutton, Minister of Agriculture, Minister for Biosecurity, Minister of Forestry, Minister for Trade Negotiations, Minister for Rural Affairs. |
| 8 | Hon Trevor Mallard, Minister of Education, Minister of State Services, Minister for Sport and Recreation, Minister Responsible for the Education Review Office, Minister for the America's Cup, Associate Minister of Finance, Minister for Adult and Community Education. |
| 9 | Hon Pete Hodgson, Minister of Energy, Minister of Fisheries, Minister of Research. Science and Technology, Minister for Crown Research Institutes, Associate Minister for Industry and Regional Development, Associate Minister of Foreign Affairs and Trade, Convenor of the Ministerial Group on Climate Change. |
| 10 | Hon Margaret Wilson, Attorney-General (includes responsibility for Serious Fraud Office), Minister of Labour, Minister in Charge of Treaty of Waitangi Negotiations, Associate Minister of Justice, Associate Minister for Courts. |
| 11 | Hon Parekura Horomia, Minister of Māori Affairs, Associate Minister for Social Development and Employment, Associate Minister of Education, Associate Minister of Fisheries, Associate Minister of Forestry. |
| 12 | Hon Lianne Dalziel, Minister of Commerce, Minister of Immigration, Minister Responsible for the Law Commission, Associate Minister of Justice, Associate Minister of Education (Special Education). |
| 13 | Hon George Hawkins, Minister of Police, Minister of Internal Affairs, Minister of Civil Defence, Minister of Veterans' Affairs. |
| 14 | Hon Mark Burton, Minister of Defence, Minister for State Owned Enterprises, Minister of Tourism, Deputy Leader of the House. |
| 15 | Hon Paul Swain, Minister of Transport, Minister of Corrections, Minister of Communications, Minister for Information Technology, Associate Minister for Economic Development. |
| 16 | Hon Marian Hobbs, Minister for the Environment, Minister Responsible for Disarmament and Arms Control, Minister Responsible for Archives New Zealand, Minister Responsible for the National Library, Associate Minister for Biosecurity, Associate Minister of Education, Associate Minister of Foreign Affairs and Trade (Official Development Assistance), Minister Responsible for Urban Affairs. |
| 17 | Hon Ruth Dyson, Minister for the Accident Compensation Corporation, Minister for Senior Citizens, Minister of Women's Affairs, Minister for Disability Issues, Associate Minister of Health, Associate Minister for Social Development and Employment (CYF). |
| 18 | Hon John Tamihere, Minister of Youth Affairs, Minister for Land Information, Minister of Statistics, Minister for Small Business, Associate Minister of Māori Affairs, Associate Minister of Commerce. |
| 19 | Hon Chris Carter, Minister of Conservation, Minister of Local Government, Minister for Ethnic Affairs. |
| 20 | Hon Rick Barker, Minister for Courts, Minister of Customs, Associate Minister of Justice, Associate Minister for Social Development and Employment. |
| 21 | Hon Judith Tizard, Minister of Consumer Affairs, Associate Minister for Arts, Culture and Heritage, Associate Minister of Commerce, Associate Minister of Transport, Minister Responsible for Auckland Issues. |
| 22 | Hon Tariana Turia, Minister for the Community and Voluntary Sector, Associate Minister of Māori Affairs (Social Development), Associate Minister of Health, Associate Minister of Housing, Associate Minister for Social Development and Employment. |
| 23 | Hon Dover Samuels, Minister of State, Associate Minister for Economic Development, Associate Minister for Industry and Regional Development, Associate Minister of Tourism. |
| 24 | Hon Damien O'Connor, Minister for Racing, Associate Minister of Agriculture, Associate Minister for Rural Affairs, Associate Minister of Health, Associate Minister of Immigration. |
| 25 | Hon Harry Duynhoven, Minister of State, Associate Minister of Energy, Associate Minister of Transport (including Civil Aviation). |
| 26 | Hon Taito Phillip Field, Minister of State, Associate Minister of Justice, Associate Minister of Pacific Island Affairs, Associate Minister for Social Development and Employment. |
| 27 | Hon David Cunliffe, Minister of State, Associate Minister of Finance, Associate Minister of Revenue, Associate Minister of Communications, Associate Minister for Information Technology. |
| Parliamentary Under-secretary | |
| Mita Ririnui, Parliamentary Under-Secretary to the Minister of Conservation, the Minister of Corrections, and the Minister in Charge of Treaty of Waitangi Negotiations. | |
People 18 years and over have the right to vote in New Zealand's parliamentary elections. Enrolment as an elector is compulsory, but voting is not. To qualify for enrolment people must:
Be at least 18 years old.
Be New Zealand citizens or permanent residents.
Have lived continuously in New Zealand for at least a year at some time.
Have last lived continuously for one month in the electorate they are to be enrolled in.
Māori and people of Māori descent may choose to enrol for either a Māori or a general electorate, but may make the choice only at certain times. Māori may make the choice the first time they enrol, or at the time of the five-yearly Māori option exercise. The next Māori option will be in 2006.
Electoral rolls are maintained by the electoral enrolment centre, a division of New Zealand Post.
Voting. The conduct of polls is the responsibility of the Chief Electoral Office of the Ministry of Justice and is controlled by a returning officer in each electorate who arranges voting facilities and staff, conducts the election, supervises counting of votes and declares the result. Only people whose names are enrolled validly before an election are qualified to vote. Most electors cast their votes at polling booths in their electorates on polling day, but they may vote as special voters at booths outside their electorates. Special votes may also be cast before polling day at issuing offices, or at home because of sickness, travel or similar reasons. Provision is also made for voting overseas. Voting is by secret ballot. A preliminary count of ordinary votes is available for each electorate on election night and final results are normally available a fortnight later, once special and overseas votes have been counted.
Voting patterns in recent general elections are shown in Table 3.08.
Table 3.08. Voting patterns 1981-2002
| Year | Electors on master roll | Valid votes | Informal votes | Special votes disallowed | Proportion of votes cast to electors on master roll |
|---|---|---|---|---|---|
1Party votes rather than electorate votes. 2In 1999, there were 2,047,473 valid electorate votes cast and 37,908 informal electorate votes. In 2002, there were 1,9995,586 valid electorate votes and 33,289 informal electorate votes. 3In 2002, 15,156 special voters had both their electorate and their party vote disallowed, while 18,133 had their electorate votes disallowed but their party vote allowed because they voted in the wrong electorate. Source: Ministry of Justice | |||||
| Number | Percent | ||||
| 1981 | 2,034,747 | 1,801,303 | 8,998 | 50,263 | 91.44 |
| 1984 | 2,111,651 | 1,929,201 | 7,565 | 42,032 | 93.71 |
| 1987 | 2,114,656 | 1,831,777 | 11,184 | 40,433 | 89.06 |
| 1990 | 2,202,157 | 1,824,092 | 10,180 | 42,843 | 85.24 |
| 1993 | 2,321,664 | 1,922,796 | 11,364 | 43,932 | 85.20 |
| 1996 | 2,418,587 | 2,072,3591 | 8,1831 | 54,633 | 88.28 |
| 1999 | 2,509,365 | 2,065,4941,2 | 19,8871,2 | 41,884 | 84.77 |
| 2002 | 2,670,030 | 2,031,6171,2 | 8,6311,2 | 15,1563 | 76,98 |
Electoral boundaries. The boundaries of electorates are revised every five years after the Census of Population and Dwellings and the new boundaries come into effect at the expiry of the parliamentary term during which the revision is finalised.
The revision is based on electoral population figures provided by Statistics New Zealand.
Electoral boundaries are defined by the Representation Commission, which consists of a chairperson, four officials (the Surveyor-General, the Government Statistician, the Chief Electoral Officer and the Chairman of the Local Government Commission) and two members nominated by parliament to represent the government and the opposition.
Figures 3.01 and 3.02 show electoral boundaries for the general and Māori electoral districts for the 2002 and 2005 general elections.
When determining boundaries of Māori electoral districts, the commission is joined by the Chief Executive Officer of Te Puni Kōkiri and two Māori who are not public servants directly concerned with administration of the Electoral Act or Members of the House of Representatives. These two are nominated by parliament to represent the government and the opposition.
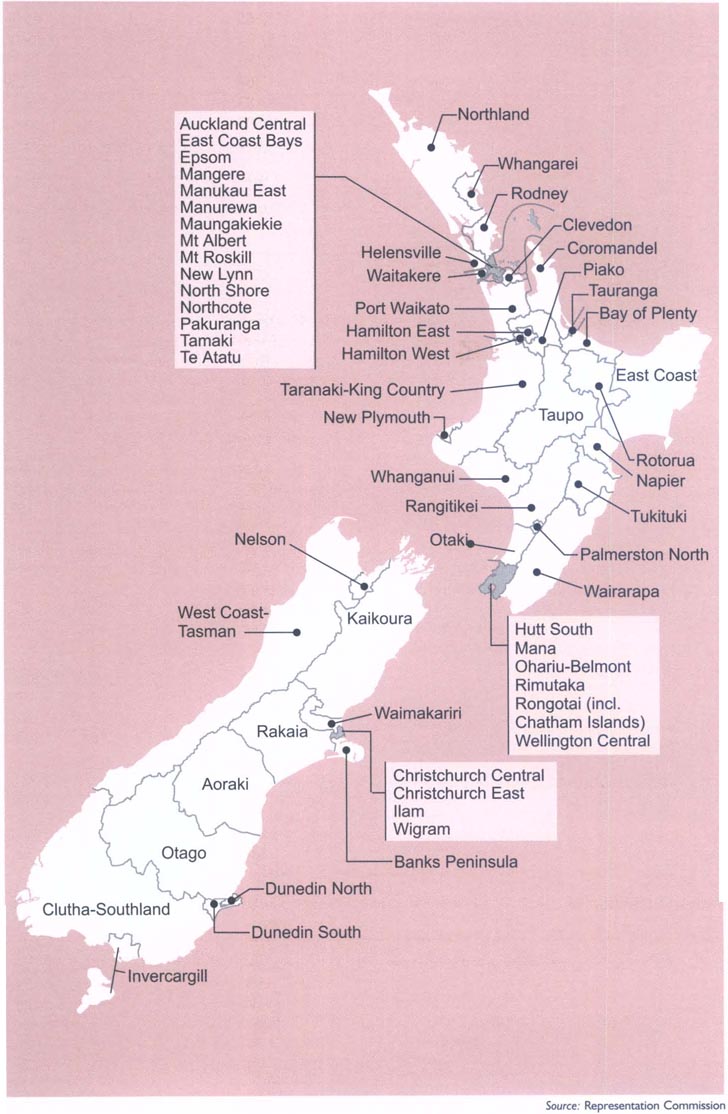
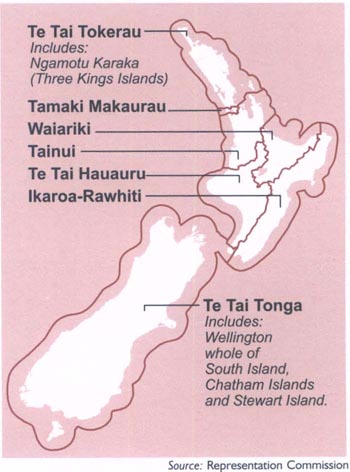
After proposed boundaries have been drawn up and published, objections and counter-objections are considered by the commission, which makes a final decision.
Under the Electoral Act 1993, the South Island is allocated 16 general electorates. The number of North Island general and Māori electorates are then calculated so that their electoral populations are approximately the same as those for South Island general electorates. The commission is also required to give consideration to community of interest, communication facilities, topographical features and any projected variation in the general electoral population of the electorates.
Based on the South Island general electoral population of 868,923, the South Island general electorate quota for the 2002 general election was 54,308, resulting in 46 North Island general electorates (quota 54,296) and seven Māori electorates (quota 53,099). All electorates have an allowance of 5 percent above or below their electoral population quota.
The next revision of electoral boundaries will take place in 2006.
General election voting. There were 2,670,030 electors on the master roll for the 2002 general election. A total of 2,055,404 votes were cast, representing a turnout of 76.98 percent of electors on the master roll. This was the lowest percentage turnout since the 69.15 percent recorded in 1978. The highest percentage turnout in recent elections was the 93.71 percent in 1984. In 1996, the turnout was 88.28 percent and in 1999 it was 84.77 percent. Figure 3.03 shows the percentage of enrolled voters voting in general elections from 1879 to 2002.
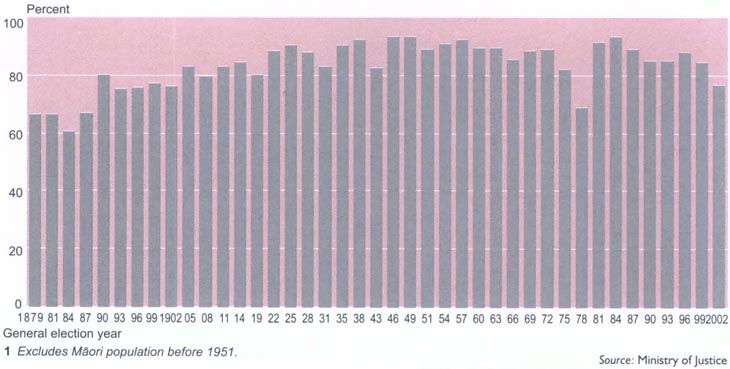
State sector is the collective term for all the organisations of central government in New Zealand. It comprises all organisations included in the annual financial statements of the Crown.
These include:
The New Zealand Public Service - departments and ministries listed in the first schedule to the State Sector Act 1988. At 30 October 2003, there were 35 departments/ministries in the public service:
Archives New Zealand - www.archives.govt.nz
Crown Law Office - www.crownlaw.govt.nz
Department of Child, Youth and Family Services - www.cyf.govt.nz
Department of Conservation - www.doc.govt.nz
Department of Corrections - www.corrections.govt.nz
Department of Internal Affairs - www.dia.govt.nz
Department of Labour - www.dol.govt.nz
Department of the Prime Minister and Cabinet - www.dpmc.govt.nz
Education Review Office - www.ero.govt.nz
Government Communications Security Bureau - www.gcsb.govt.nz
Inland Revenue Department - www.ird.govt.nz
Land Information New Zealand - www.linz.govt.nz
Ministry of Agriculture and Forestry - www.maf.govt.nz
Ministry for Culture and Heritage - www.mch.govt.nz
Ministry of Defence - www.defence.govt.nz
Ministry of Economic Development - www.med.govt.nz
Ministry of Education - www.minedu.govt.nz
Ministry for the Environment - www.mfe.govt.nz
Ministry of Fisheries - www.fish.govt.nz
Ministry of Foreign Affairs and Trade - www.mfat.govt.nz
Ministry of Health - www.moh.govt.nz
Ministry of Housing - www.minhousing.govt.nz
Ministry of Justice - www.justice.govt.nz
Ministry of Maori Development - www.tpk.govt.nz
Ministry of Pacific Island Affairs - www.minpac.govt.nz
Ministry of Research, Science and Technology - www.morst.govt.nz
Ministry of Social Development (trading as Work and Income New Zealand) - www.msd.govt.nz
Ministry of Transport - www.transport.govt.nz
Ministry of Women's Affairs - www.mwa.govt.nz
National Library of New Zealand - www.natlib.govt.nz
New Zealand Customs Service - www.customs.govt.nz
Serious Fraud Office - www.sfo.govt.nz
State Services Commission - www.ssc.govt.nz
Statistics New Zealand - www.stats.govt.nz
The Treasury - www.treasury.govt.nz
Departments outside the public service - departments in terms of the Public Finance Act 1989, but not listed in the first schedule to the State Sector Act 1988 and, consequently, not part of the public service. At 30 October 2003, there were six departments outside the public service:
New Zealand Defence Force - www.nzdf.mil.nz
New Zealand Police - www.police.govt.nz
New Zealand Security Intelligence Service - www.nzsis.govt.nz
Office of the Clerk - www.clerk.parliament.govt.nz
Parliamentary Counsel Office - www.pco.parliament.govt.nz
Parliamentary Service - www.ps.parliament.govt.nz
State-owned enterprises (SOEs) - companies listed in the first schedule to the State-Owned Enterprises Act 1986 that operate on commercial lines and are companies under the Companies Act 1991. They are required to be as profitable and as efficient as comparable businesses in the private sector. The government may purchase services from SOEs, but generally will do so on the same basis as other purchasers. The government's interest in SOEs is substantially in their ownership. The government's shareholding interests in SOEs are supported by the Crown Company Monitoring Advisory Unit (CCMAU), which is administratively linked to the Treasury. At 30 October 2003, there were 15 SOEs:
Agriquality New Zealand Limited - www.agriquality.com
Airways Corporation of New Zealand Limited - www.airways.co.nz
Asure New Zealand Limited - www.asure.co.nz
Electricity Corporation of New Zealand Limited - www.ecnz.co.nz
Genesis Power Limited - www.genesispower.co.nz
Landcorp Farming Limited - www.landcorp.co.nz
Meridian Energy Limited - www.meridianenergy.co.nz
Meteorological Service of New Zealand - www.metservice.co.nz
Mighty River Power Limited - www.mightyriverpower.co.nz
New Zealand Post Limited - www.nzpost.co.nz
New Zealand Railways Corporation - www.nzrailcorp.co.nz
Solid Energy New Zealand Limited - www.solidenergy.co.nz
Terralink NZ Limited (in liquidation) - www.terralinkinternational.com
Timberlands West Coast Limited - www.timberlands.co.nz
Transpower New Zealand Limited - www.transpower.co.nz
Air NZ Ltd is also included in the Crown's financial statements for disclosure purposes as if it were an SOE.
Crown entities - organisations listed in the fourth schedule to the Public Finance Act 1989. The fourth schedule can be amended to add, remove or change the name of a Crown entity by order-in-council. Crown entities make up a significant part of the state sector and include a wide variety of statutory corporations, statutory boards and authorities, corporations sole, Crown companies and trusts. The act establishes financial management and accountability provisions for bodies set up by the government or by legislation that depend wholly or partly on public funds. At 30 October 2003, Crown entities included 65 separate legal entities, as well as 21 district health boards, 32 reserves boards, 13 fish and game councils, 35 tertiary education institutions, 2,592 schools, 17 Crown-owned companies that included nine Crown Research Institutes, and six trusts. Most Crown entities are run by boards, who appoint chief executives. Some are companies subject to the Companies Act 1993 and to monitoring on the government's behalf by the Crown Company Monitoring Advisory Unit.
Offices of Parliament - The Office of the Ombudsmen, the Controller and Auditor-General and the Parliamentary Commissioner for the Environment are not part of the executive branch of the government, as their primary function is to provide a check on the executive's use of power and resources, but they report to parliament under the Public Finance Act.
The Reserve Bank of New Zealand - a stand-alone organisation included in the annual financial statements of the Crown.
The Māori Television Service is also part of the state sector.
At 30 June 2003, the number of staff employed in public service departments (excluding Crown entities and SOEs) was 33,129 (calculated on a full time equivalent basis). At 30 June 2001, the number was 30,355. When reform of the state sector began in the 1980s, about 70,000 people were permanent employees in government departments. Many jobs in government departments have shifted to Crown entities, SOEs or the private sector. The public service today is characterised by relatively small departments, which have defined roles in policy advice, service delivery, regulatory, or sectoral funding functions. Some bigger departments perform a combination of roles.
The Office of State Services Commissioner is central to New Zealand's politically neutral permanent public service.
As holder of a statutory office, the commissioner acts independently in a range of matters concerning operation of the public service and the state sector.
As Chief Executive of the State Services Commission, the commissioner is also responsible to the Minister of State Services for the commission's capability and performance.
The Office of State Services Commissioner descends directly from the Public Service Commission, established in 1912 to employ all public servants, so protecting the public service from political interference and preserving its political neutrality.
The commissioner no longer employs all public servants, but in his employment of chief executives of public service departments, he continues to act as a buffer between ministers and the public service.
The State Sector Act 1988 sets out the roles and responsibilities of the State Services Commissioner.
In summary, the commissioner:
Employs public service chief executives on behalf of the Crown and reviews their performances.
Sets standards of conduct and integrity for the public service.
Investigates and reports on matters relating to departmental performance.
Those roles relate primarily to individual departments and their chief executives, and are those most likely to involve the exercise of statutory powers.
The commissioner has four other responsibilities that relate to the operation of the public service or state sector as a whole. These are to:
Promote and develop policies and standards for personnel administration and equal employment opportunities for the public service.
Promote senior leadership development in the public service and ensure that the public service has shared values and performs to a high standard.
Advise the government on the structure of the state sector, including the allocation of functions among departments.
Negotiate collective employment agreements applicable to employees of government departments and to employees of the education service. These responsibilities have been delegated by the commissioner to departmental chief executives and to the Chief Executive of the Ministry of Education respectively.
Much of the work enabling the commissioner to discharge his or her responsibilities is carried out by the State Services Commission on the commissioner's behalf.
The commissioner is appointed by the governor-general on the recommendation of the prime minister.
Table 3.09 lists chief executives of government departments at 12 November 2003
Table 3.09. Chief executives of government departments1
| Department | Title | Name |
|---|---|---|
1At 12 November 2003. Source: State Services Commission | ||
| Ministry of Agriculture and Forestry | Chief Executive | Murray Sherwin |
| Archives New Zealand | Chief Archivist and Chief Executive | Dianne Macaskill |
| Department of Child, Youth and Family Services | Chief Executive | Jackie Pivac |
| Department of Conservation | Director-General and Chief Executive | Hugh Logan |
| Department of Corrections | Chief Executive | Mark Byers |
| Crown Law Office | Solicitor-General and Chief Executive | Terrance Arnold QC |
| Ministry for Culture and Heritage | Chief Executive | Martin Matthews |
| Ministry of Defence | Secretary of Defence and Chief Executive | Graham Fortune |
| Ministry of Economic Development | Chief Executive | Geoff Dangerfield |
| Ministry of Education | Secretary of Education and Chief Executive | Howard Fancy |
| Education Review Office | Chief Review Officer and Chief Executive | Karen Sewell |
| Ministry for the Environment | Secretary for the Environment and Chief Executive | Barry Carbon |
| Ministry of Fisheries | Chief Executive | Warwick Tuck |
| Ministry of Foreign Affairs and Trade | Secretary of Foreign Affairs and Trade and Chief Executive | Simon Murdoch |
| Government Communications Security Bureau | Director and Chief Executive | Dr Warren Tucker |
| Ministry of Health | Director-General and Chief Executive | Dr Karen Poutasi |
| Ministry of Housing | Chief Executive | Katrina Bach |
| Inland Revenue Department | Commissioner of Inland Revenue and Chief Executive | David Butler |
| Department of Internal Affairs | Secretary for Internal Affairs and Chief Executive | Christopher Blake |
| Ministry of Justice | Secretary of Justice and Chief Executive | Belinda Clark |
| Department of Labour | Secretary of Labour and Chief Executive | Dr James Buwalda |
| Land Information New Zealand | Chief Executive | Brendan Boyle |
| Ministry of Māori Development Te Puni Kōkiri | Chief Executive | Leith Comer |
| National Library | Chief Executive | Penny Carnaby |
| New Zealand Customs Service | Comptroller and Chief Executive | Robin Dare |
| Ministry of Pacific Island Affairs | Chief Executive | Fuimaono Les McCarthy |
| Department of Prime Minister and Cabinet | Chief Executive | Dr Mark Prebble |
| Ministry of Research, Science and Technology | Acting Chief Executive | Dr Helen Anderson |
| Serious Fraud Office | Director and Chief Executive | David Bradshaw |
| Ministry of Social Development | Chief Executive | Peter Hughes |
| State Services Commission | State Services Commissioner | Michael Wintringham |
| Statistics New Zealand | Government Statistician and Chief Executive | Brian Pink |
| Ministry of Transport | Secretary of Transport and Chief Executive | Alastair Bisley |
| The Treasury | Secretary to the Treasury and Chief Executive | John Whitehead |
| Ministry of Women's Affairs | Acting Chief Executive | Anne Carter |
The increasing number and diversity of limited liability companies owned by the Crown led it to establish the Crown Company Monitoring Advisory Unit (CCMAU) in 1993 to monitor the performance of these entities. CCMAU advises and supports primarily the Minister for State-owned Enterprises and the Minister for Crown Research Institutes. The shareholding ministers of other Crown companies (such as Television New Zealand, Radio New Zealand, Animal Control Products and three airport companies) receive advice from the unit in their role as monitors of the Crown's ownership interest, as does the Minister of Finance, who, as a shareholding minister, receives unit advice via the responsible minister and in joint reports from the unit and the Treasury.
One of CCMAU's chief functions is the provision of advice to shareholding ministers relating to the development of corporate intent targets and monitoring the performance of Crown companies against those targets. Other functions include the provision of advice on company restructuring, expansion, diversification and divestment plans; the management of ownership issues; and identification of prospective directors and advice on director remuneration.
The unit, while independent for advice purposes, is attached to the Treasury for administrative purposes.
The Controller and Auditor-General is an officer of parliament appointed by the governor-general under the Public Audit Act 2001. The position is independent of the executive government and only the governor-general, upon an address from the House of Representatives, can end tenure. The Controller and Auditor-General and the people acting under his or her delegation comprise the Audit Office.
The constitutionally important controller function of the Audit Office, as set out in the Public Finance Acts 1977 and 1989, is to act as a monitor on behalf of parliament and to control issues of money from the Crown bank account. The Audit Office has to be satisfied that all issues from the account for the government's expenditure requirements are within appropriations and other authorities granted by parliament. This role is crucial to the ability of parliament to control the supply of funds to the Crown, and, in certain circumstances, the Audit Office may prevent the issue of money.
The Audit Office also audits the financial statements of government departments, local authorities and most government-controlled corporations, boards and companies. The office plays a key part in ensuring adequate accountability by these organisations.
It also conducts periodic performance audits to ascertain whether public entities are carrying out their activities effectively and efficiently and are complying with their statutory obligations.
If shortcomings are discovered during an audit, the principal recourse of the Audit Office is to report to the management of the organisation, to a minister, or to parliament and its select committees.
The Official Information Act 1982 is based on the principle that information should be made available unless there is good reason for withholding it. The purposes of the act are to:
Increase availability of official information to the people of New Zealand.
Provide for proper access by bodies corporate to official information relating to themselves (access by individuals to their information is now governed by the Privacy Act 1993).
Protect official information consistent with the public interest and preservation of individual privacy.
With the exception of the Parliamentary Counsel Service, the Official Information Act 1982 covers all government departments, state-owned enterprises and a range of statutory bodies. It does not include courts, tribunals (in relation to their judicial function) or some judicial bodies. All local authorities and statutory boards are covered under either the Official Information Act 1982 or the Local Government Official Information and Meetings Act 1987. These acts provide special rights of access by bodies corporate to personal information about themselves.
Requests for access to official information can be made by a corporation sole and by a body of people, whether corporate or uncorporate. Protection of the privacy of natural persons may be overturned if it is in the public interest to make information available.
Among criteria to be considered when judging whether information should be withheld are whether, if the information were released, it would prejudice the security, defence or economic international relations of New Zealand; the maintenance of law and order; the effective conduct of public affairs; trade secrets and commercial sensitivity; personal privacy and the safety of any person.
Ombudsmen can review a decision to refuse to release information. This investigation is private and free. The formal recommendation of an ombudsman is binding unless overridden by the governor-general by order-in-council.
The principal function of ombudsmen is to enquire into complaints relating to administrative decisions of government departments and related organisations, hospitals and health authorities. Under the Ombudsmen Act 1975, there is provision for the appointment of a Chief Ombudsman and one or more ombudsmen in temporary or permanent positions.
All investigations undertaken by ombudsmen are conducted in private. When an ombudsman believes a complaint can be sustained, his opinion is reported to the government department or organisation concerned, along with any recommendation for action. A copy of this report is made available to the responsible minister. At the local government level, the ombudsman reports his finding to the organisation and provides a copy to the mayor or chairperson.
Ombudsmen also investigate recommendations made to ministers by government departments, organisations or employees. Similarly, they look into recommendations made to local body councils or boards by any committee, subcommittee, officer, employee or member.
It is also the responsibility of ombudsmen to investigate complaints on decisions for the request of official information. Under the Protected Disclosures Act 2000, ombudsmen can provide guidance and information to employees who have made, or who are considering making, a protected disclosure pursuant to the act, and they fulfil the ‘appropriate authority’ requirements of the act. Ombudsmen have no authority to investigate complaints against private companies and individuals, decisions of judges, complaints directed at ministerial decisions, or at the full council of local government. They can also decide that certain complaints, although within their sphere, are better suited to other avenues of administrative redress.
Table 3.10 details complaints made to the ombudsmen for the year ending 30 June 2003.
Table 3.1. Complaints to the ombudsmen
Year
ending 30 June 2003
| Action | Ombudsmen Act 1975 | Official Information Act 1982 | Local Government Official Information and Meetings Act 1987 |
|---|---|---|---|
- nil or zero Source: Office of the Ombudsmen | |||
| Declined, no jurisdiction | 79 | 9 | 1 |
| Declined or discontinued (section 17) | 441 | 55 | 19 |
| Resolved in course of investigation | 178 | 164 | 36 |
| Sustained, recommendation made | 11 | - | 3 |
| Sustained, no recommendation made | 11 | 2 | - |
| Not sustained | 63 | 94 | 15 |
| Formal investigation not undertaken, but explanation, advice or assistance given | 2,059 | 308 | 64 |
| Complaint transferred to | |||
| Privacy Commissioner | 15 | 32 | 3 |
| Health and Disability Commissioner | 2 | - | - |
| Police Complaints Authority | 25 | - | - |
| Still under investigation at 30 June | 427 | 271 | 31 |
| Total | 3,311 | 935 | 172 |
| Total 2002 | 3,796 | 863 | 201 |
The Office of the Privacy Commissioner Te Mana Matapono Matatapu is independent of the executive and of parliament and its functions are set out in the Privacy Act 1993.
One of the main purposes of the act is to promote and protect individual privacy. The act establishes 12 information privacy principles and four public register privacy principles. Both sets of principles are subject to any other law and apply to both public and private sectors.
Information privacy principles deal with the collection, security, use and disclosure of personal information, access to and correction of personal information, and the assignment and use of unique identifiers.
Public register privacy principles place some controls on the availability of public register information and its subsequent use.
The privacy commissioner has the power to issue codes of practice which may modify information privacy principles by prescribing different standards. Codes of practice can also prescribe how information privacy principles are to be applied or complied with. Codes replace the principles in particular contexts. The most important code issued by the commissioner is the Health Information Privacy Code 1994, which provides stringent controls on the collection, use and disclosure of personal health information by health agencies.
The Privacy Act also lays down rules controlling statutory information-matching programmes in the public sector. Information matching involves one government department comparing personal information collected for specific purposes with databases of personal information in other government departments held for different purposes. The act requires that an affected individual be given notice before adverse action is taken on the basis of a match.
The commissioner investigates complaints about breaches of a privacy principle, code of practice or information-matching rule. The investigation process emphasises conciliation. If a complaint cannot be settled, the privacy commissioner may refer it to the Director of Human Rights Proceedings, who may issue proceedings before the Human Rights Review Tribunal. Alternatively, aggrieved people may bring proceedings on their own behalf before the tribunal. The tribunal has the power to award a number of remedies (including a declaration that an action has caused interference with privacy), orders, damages and costs.
In the year ending 30 June 2003, the privacy commissioner referred three complaints to the Director of Human Rights Proceedings, and 23 complainants brought proceedings on their own initiative.
The privacy commissioner performs a general ‘watchdog’ role over privacy. In the June 2003 year, the commissioner made a number of reports to the Minister of Justice, and public statements on a range of issues affecting individual privacy. The commissioner examines new legislation and prepares reports on privacy issues and appears before parliamentary select committees considering bills.
The Official Information Act 1982 and the Local Government Official Information and Meetings Act 1987 require ombudsmen to consult with the commissioner on official information access requests where privacy is a possible ground for withholding information. In the year ending June 30 2003, 33 formal consultations under the two acts were completed.
The Office of the Privacy Commissioner website is www.privacy.org.nz
Table 3.11 details complaints made to the privacy commissioner in recent years.
Table 3.11. Complaints to the privacy commissioner
Years ending 30 June
| Action | 1999 | 2000 | 2001 | 2002 | 2003 |
|---|---|---|---|---|---|
| Source: Office of the Privacy Commissioner | |||||
| New complaints received | 1,003 | 798 | 881 | 1,044 | 928 |
| Complaints current at start of year | 1,068 | 1,126 | 966 | 1,041 | 1,039 |
| Number of complaints under process | 2,071 | 1,924 | 1,847 | 2,085 | 1,967 |
| Number of complaints closed during year | 895 | 966 | 806 | 1,049 | 915 |
| No jurisdiction | 56 | 45 | 36 | 16 | 23 |
| Complaints resolved without final opinion | 708 | 775 | 654 | 901 | 747 |
| Final opinion | 131 | 146 | 116 | 132 | 145 |
The Human Rights Act 1993 amalgamated the Race Relations Act 1971 and the Human Rights Commission Act 1977 and added five new prohibited grounds of discrimination. There are 13 prohibited grounds of discrimination: sex, marital status, religious belief, ethical belief, colour, race, ethnic or national origins, disability, age, political opinion, employment status, family status and sexual orientation. Areas in which it is unlawful to discriminate are employment; access to places, vehicles and facilities; provision of goods and services; provision of land, housing and other accommodation; and access to educational establishments. The act also contains provisions relating to racial disharmony, sexual harassment and racial harassment.
Amendments to the Human Rights Act in 2001 provide that the Human Rights Act non-discrimination standard applies to private sector activities, and to public sector activities only in relation to employment, racial harassment, sexual harassment, racial disharmony and victimisation.
The 2001 amendments also provide that the New Zealand Bill of Rights Act 1990 non-discrimination standard applies to all public sector activities except employment, racial harassment, sexual harassment, racial disharmony and victimisation. The protection which the public sector previously had from the full impact of the Human Rights Act expired on 31 December 2001.
The 2001 amendment also combined the Human Rights Commission and the Office of the Race Relations Conciliator into a new Human Rights Commission. This organisation is strategically focussed on general human rights education and advocacy, while retaining some discrimination complaints roles.
The Human Rights Commission's role in complaints is as the publicly-funded entry point for all complaints of discrimination, whether relating to government or non-government activity. The commission attempts to assist the parties to resolve complaints using mediation or other low-level dispute-resolution mechanisms.
If low-level resolution fails or is inappropriate, the complainant may approach the independent Director of Human Rights Proceedings for possible litigation assistance. Complainants may also take their own litigation or engage their own legal counsel.
The Human Rights Review Tribunal is the specialist tribunal to determine discrimination proceedings. Where a complaint is upheld, including complaints about government policies and practices, a wide range of remedies are available, for example damages and orders of specific performance. When a complaint concerns legislation or validly-made regulations, and the complaint is upheld, the sole remedy available is a declaration of inconsistency. This does not invalidate the legislation, but the responsible minister is required to bring the declaration to the attention of the House of Representatives, along with the executive's response to that declaration.
There are appeal rights from the tribunal to the high court and proceedings may also be removed to the high court if appropriate.
The Parliamentary Commissioner for the Environment - established by the Environment Act 1986 following reform of environmental administration in New Zealand - is an independent officer of parliament who reviews and provides advice on environmental issues and on the agencies and processes established by the government to manage the environment.
The primary objective of the commissioner's office is to maintain and improve the quality of the environment by providing advice to parliament, local councils, businesses, tangata whenua, communities and other public agencies. The commissioner may investigate any matter where the environment may be, or has been, adversely affected; assess the capability, performance and effectiveness of the New Zealand system of environmental management; and provide advice and information to help maintain and improve the quality of the environment.
During 2002/03, the commissioner initiated investigations into the primary production sector and the environmental sustainability of New Zealand's more intensive farms, into education for sustainable living, into the role of science in environmental policy and decision making, and into the environmental effects of cruise ships.
One environmental management audit was completed on developing a framework for assessing the environmental performance of the electricity sector.
The commissioner produced a new strategic plan in 2002, which maintains the direction of its predecessor but provides a shift in focus. Priority areas for investigation until 2007 were selected by considering environmental systems at risk, the drivers putting pressure on these systems, and environmental management responses. The priorities have been grouped into three broad areas: legislation and policies that impact on environmental sustainability; ecosystems at risk; and the performance of public authorities in meeting their environmental responsibilities.
The commissioner responded to 228 communications during 2002/03 from citizens, non-government organisations, select committees, public authorities and international correspondents requesting information or assistance on environmental issues. The commissioner's website is www.pce.govt.nz
Table 3.12 lists the number of reports and papers produced by the commissioner in recent years.
Table 3.12. Reports/ papers by the Parliamentary Commissioner for the
Environment
Years ending 30
June
| Activity | 2000 | 2001 | 2002 | 2003 |
|---|---|---|---|---|
| Source: Parliamentary Commissioner for the Environment | ||||
| Investigation reports | 32 | 37 | 35 | 81 |
| Information transfer papers or presentations | 242 | 291 | 189 | 147 |
| Total | 274 | 328 | 224 | 228 |
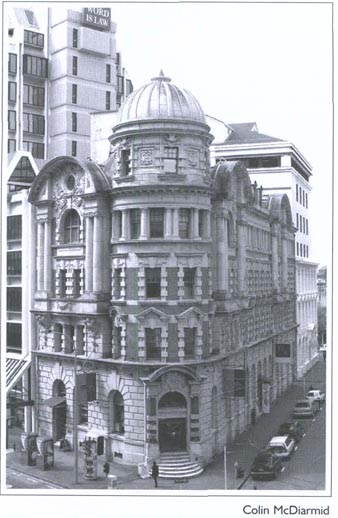
The Public Trust's former head office in Wellington is protected from exterior alteration by an Historic Places Trust heritage order.
Public Trust, the first organisation of its kind in the world, was launched in 1873 by an act of parliament to provide New Zealanders with the opportunity of writing a will, thereby decreasing the number of intestacies, and to provide executor and trustee services. Before its inception, problems had arisen with unscrupulous individuals cheating beneficiaries out of their inheritances.
Public Trust has been a self-funding government department operating, most recently, under the Public Trust Office Act 1957. However, the Public Trust Bill proposes changes to the office's status and structure. The bill proposes that:
The operations and undertakings of the Public Trust Office will be vested in a new statutory corporation to be known as Public Trust. The existing corporation sole (the Public Trustee), the Public Trust Office and the Public Trust Investment Board will be dissolved, and the new corporation will be their successor.
Public Trust will no longer be a government department, but will become a Crown entity subject to accountability and reporting arrangements under the Public Finance Act 1989.
Public Trust will have a board responsible to the minister for the management and operation of the organisation, including appointment of its chief executive.
Public Trust will continue to be responsible for carrying out existing public and social functions and to provide free wills and other non-commercial services when so requested and funded by the Crown.
Crown ownership of Public Trust is confirmed.
Provision is made for payment of dividends to the Crown, and also for a one-off payment of surplus capital immediately prior to establishment of the new corporation.
The independence of Public Trust in client matters is preserved and enhanced by a specific direction that it must, when managing and administering estates and in fulfilling any other fiduciary obligations, act in an independent manner free from any instruction or direction from the Crown.
With 35 outlets throughout New Zealand, Public Trust administers about 50,000 estates, trusts, funds and agencies. On behalf of individuals, it has a trustee role in relation to approximately $2 billion of assets, of which $1 billion are managed funds. In the corporate trustee area, Public Trust has a supervisory or trustee responsibility in relation to approximately $10 billion of assets. Public Trust's Common Fund stands at about $425 million, its Group Investment Funds at around $300 million and the retail Public Trust Investment Funds at about $250 million. Public Trust also holds the statutorily-required deposits of insurance companies.
Most Public Trust activities are commercial in nature, but it is also required to provide a number of statutory services that may not be income earning. These are of a regulatory, quasi-judicial, trustee of last resort, trustee-guardian or representative (ie in the case of legal incapacity) nature.
New Zealand has a system of local government largely independent of the central executive government. The system has, however, a subordinate role in the constitution, as the powers of local authorities are only those conferred by parliament.
Local authorities fall into three categories, regional, territorial and special purpose authorities. Many territorial authorities contain one or more communities administered by community boards, but these are not separate local authorities.
Six special purpose authorities are constituted under their own acts and one, Infrastructure Auckland, is constituted under the Local Government Act 2002, the statute constituting regional councils and territorial authorities. Boundaries are usually defined by the Local Government Commission, or the Minister of Local Government.
Local authorities have their own sources of income, independent of central government, with the basic source (apart from income from trading activities under the control of territorial authorities) local taxes on landed property (rates). Rates are set by local authorities themselves, subject to the Local Government (Rating) Act 2002.
Several important statutes apply not only to local authorities as defined in the Local Government Act 2002, but to a wider range of public bodies. These include the Local Government Official Information and Meetings Act 1987, the Local Authorities (Members' Interests) Act 1968 and the Local Electoral Act 2001. Local authorities derive their functions and powers not only from local government legislation, but from numerous other acts, such as the Resource Management Act 1991, the Transit New Zealand Act 1989, and the Building Act 1991.
Under Parliamentary Standing Orders, local authorities can promote legislation about matters affecting areas within their jurisdiction which they are not empowered to deal with already. When permanent or major additional powers are sought, a local bill must be prepared for the consideration of parliament. If this is enacted, it becomes a local act, and applies only to the body or bodies which promoted it.
Local authorities are answerable to their electorates through triennial local elections.
Legislation includes numerous provisions for local authorities to give public notice and receive public submissions before making certain important decisions. The Local Government Official Information and Meetings Act 1987 promotes open conduct of local authority meetings and sets out rights of access to official information. Local authorities may also come under the scrutiny of the ombudsmen, the Controller and Auditor-General and the Parliamentary Commissioner for the Environment. Any decision by a local authority may be reviewed by appeal to the high court, and decisions under the Resource Management Act 1991 may be appealed to the environment court. The Minister of Local Government may appoint a review authority when it is considered there has been serious mismanagement by a local authority, and may require the local authority to implement the review authority's recommendations.
New Zealand has 12 regional councils, 74 territorial authorities, 147 community boards and seven special authorities. The Local Government Act 2002 holds as central recognition of the existence of different communities in New Zealand, their separate identities and values, and the effective participation of local people in local government. Local authorities are required by statute to conduct their affairs in an open and proper manner, to separate their regulatory and non-regulatory activities and to adequately inform local communities of their activities. Emphasis is placed on setting objectives and measuring performance. Local authorities are permitted to corporatise or privatise their trading activities and may put out the delivery of services to competitive tender as an alternative to using in-house business units. Table 3.13 lists regional council, territorial authorities and numbers of councillors.
Table 3.13. Territorial authorities and councillors
| Cities/districts | Number of councillors1 | Council type |
|---|---|---|
1Based on October 1998 elections. Figures include mayors. 2Unitary authority (city or district council and regional council responsibilities). 3Trading name of Manawatu/Wanganui Regional Council. Source: Local Government New Zealand | ||
| Ashburton | 13 | District |
| Auckland | 20 | City |
| Auckland | 13 | Regional |
| Banks Peninsula | 8 | District |
| Buller | 12 | District |
| Carterton | 9 | District |
| Central Hawke's Bay | 11 | District |
| Central Otago | 14 | District |
| Chatham Islands | 9 | Council |
| Christchurch | 25 | City |
| Clutha | 15 | District |
| Dunedin | 15 | City |
| Environment Bay of Plenty | 12 | Regional |
| Environment Canterbury | 14 | Regional |
| Environment Southland | 9 | Regional |
| Environment Waikato | 14 | Regional |
| Far North | 11 | District |
| Franklin | 15 | District |
| Gisborne2 | 15 | District |
| Gore | 12 | District |
| Grey | 9 | District |
| Hamilton | 14 | City |
| Hastings | 16 | District |
| Hauraki | 14 | District |
| Hawke's Bay | 9 | Regional |
| Horizons3 | 11 | Regional |
| Horowhenua | 11 | District |
| Hurunui | 10 | District |
| Hutt City | 12 | City |
| Invercargill | 13 | City |
| Kaikoura | 8 | District |
| Kaipara | 11 | District |
| Kapiti Coast | 15 | District |
| Kawerau | 9 | District |
| Mackenzie | 11 | District |
| Manawatu | 11 | District |
| Manukau | 21 | City |
| Marlborough2 | 13 | District |
| Masterton | 11 | District |
| Matamata-Piako | 12 | District |
| Napier | 13 | City |
| Nelson2 | 13 | City |
| New Plymouth | 17 | District |
| Northland | 8 | Regional |
| North Shore | 16 | City |
| Opotiki | 11 | District |
| Otago | 12 | Regional |
| Otorohanga | 8 | District |
| Palmerston North | 16 | City |
| Papakura | 9 | District |
| Porirua | 14 | City |
| Queenstown-Lakes | 12 | District |
| Rangitikei | 12 | District |
| Rodney | 13 | District |
| Rotorua | 13 | District |
| Ruapehu | 12 | District |
| Selwyn | 12 | District |
| South Taranaki | 13 | District |
| South Waikato | 11 | District |
| South Wairarapa | 10 | District |
| Southland | 13 | District |
| Stratford | 11 | District |
| Taranaki | 10 | Regional |
| Tararua | 9 | District |
| Tasman2 | 14 | District |
| Taupo | 13 | District |
| Tauranga | 14 | City |
| Thames-Coromandel | 10 | District |
| Timaru | 13 | District |
| Upper Hutt | 11 | City |
| Waikato | 15 | District |
| Waimakariri | 15 | District |
| Waimate | 9 | District |
| Waipa | 13 | District |
| Wairoa | 10 | District |
| Waitakere | 15 | City |
| Waitaki | 16 | District |
| Waitomo | 11 | District |
| Wanganui | 13 | District |
| Wellington | 20 | City |
| Wellington | 13 | Regional |
| West Coast | 6 | Regional |
| Western Bay of Plenty | 13 | District |
| Westland | 13 | District |
| Whakatane | 14 | District |
| Whangarei | 14 | District |
An option available to most councils for the 2007 elections is the establishment of Māori wards or constituencies if communities call for a poll on the issue. If a minimum of 5 percent of electors request a poll, and the subsequent poll result is favoured by 50 percent or more of electors, the poll is binding.
Regional councils. Regional councils are directly elected, set their own rates and have a chairperson elected by their members. Their main functions are matters under the Resource Management Act 1991 and the Soil Conservation and Rivers Control Act; the control of pests and noxious plants; harbour regulations and marine pollution control; regional aspects of civil defence; an overview of transport planning; and control of passenger transport operators. Some regional councils also have other functions, such as those formerly undertaken by land drainage boards.
Territorial authorities. New Zealand's 74 territorial authorities consist of 16 city councils, 57 district councils and the Chatham Islands Council. Territorial authorities are directly elected, set their own rates and have a mayor elected by the people. They have a wide range of functions, including land use consents under the Resource Management Act 1991; noise and litter control; roading; water supply; sewage reticulation and disposal; rubbish collection and disposal; parks and reserves; libraries; land subdivision; pensioner housing; health inspection; liquor licensing; building consents; parking controls; and civil defence. New cities can either be constituted by Order in Council giving effect to a determination of the Local Government Commission, or be constituted by a reorganisation scheme, where a new district is formed and that district has a population of at least 50,000, is predominantly urban, is a distinct entity and a major centre of activity within the region.
Unitary authorities. Unitary authorities are territorial authorities which also have regional powers. Legislation in 1989 prevented any unitary authorities being established, other than in Gisborne. However, an amendment in 1992 not only created three more unitary authorities (Marlborough District, Tasman District and Nelson City), but made it possible for others to be created by submitting proposals to the Local Government Commission.
Community boards. A community board is primarily an advocate for its community and a means whereby the territorial authority can consult with the community. Any power the community board has is delegated by the territorial authority, but cannot include such powers as levying rates, appointing staff or owning property. Community boards are partly elected by the community and partly appointed by the territorial authority from among its own members, or are entirely elected. Community boards can be established anywhere in New Zealand to serve any number of inhabitants. They may be established upon the initiative either of a given number of electors of the territorial authority, or as provided in a reorganisation scheme. Community boundaries often coincide with those of wards (divisions of the district for electoral purposes). Boards have between four and 12 members.
The number of special purpose local authorities was greatly reduced following local body reform in 1989. Catchment boards, harbour boards, pest destruction boards and land drainage boards, among others, disappeared, with their functions reallocated either to regional councils or, to a lesser extent, territorial authorities.
Categories remaining include scenic and recreation boards.
There are also some one-off authorities such as the Aotea Centre Board of Management, the Canterbury Museum Trust Board, the Council of the Auckland Institute and Museum, the Otago Museum Trust Board, the Masterton Lands Trust, the Greytown Lands Trust and Infrastructure Auckland.
Infrastructure Auckland. Infrastructure Auckland was created in 1998 to help address the Auckland region's land and passenger transport and stormwater problems. As successor to the Auckland Regional Services Trust, Infrastructure Auckland inherited the assets of the trust, except those of Watercare Services Ltd, which were transferred to Auckland local authorities. Infrastructure Auckland's assets are estimated to be worth around $1 billion and include 80 percent of the shares in Ports of Auckland Ltd and 100 percent of America's Cup Village Ltd and Northern Disposal Systems Ltd. The mandate for this wealth as defined by legislation is to benefit the community as a whole by making grants to land and passenger transport and stormwater projects. When Infrastructure Auckland was initially set up, it was controlled by nine members, six former members of the Auckland Regional Services Trust and three appointed by an electoral college. From 1 July 1999, that number was reduced to seven members and from 1 January 2000, the electoral college has had sole power to appoint all members and the chairperson. The electoral college comprises eight members, made up of one member from each of the seven territorial authorities in the Auckland region and one from the Auckland Regional Council. Members representing Manukau and Auckland City Councils have three votes, members representing Waitakere and North Shore City have two votes, with the other four council representatives each having one vote. Apart from appointing and discharging members and the chairperson of Infrastructure Auckland, they also, among other things, monitor Infrastructure Auckland's performance.
Local government elections are held on the second Saturday in October every third year. The next elections will be in 2007.
All regional council, territorial authority, special purpose local authority and community board elections are conducted at the same time. At least once every six years, in the year before an election, regional and territorial authorities are required to review the number of members, the number and size of their electorates and whether or not community boards should be established. Electorates are known as wards in the case of territorial authorities and constituencies in the case of regions. Territorial authorities have the option of deciding whether members will be elected by the electors of wards, from the district as a whole, or a mixture of both. Regions must be divided into constituencies. The purpose of the review is to give effective representation to communities of interest and fair representation to electors. The review process provides for objections and appeals by the public. When necessary, final decisions are made by the Local Government Commission.
Voting procedures. Although postal voting is now universal, any territorial authority may decide whether an election is to be conducted by attendance at a polling booth, or by post. The method of casting a vote is similar to parliamentary elections. The surnames of candidates are printed on the ballot paper and electors place a tick after the name of the candidate they wish to vote for. The voting system currently used is ‘first past the post’, except for district health boards and 10 local authorities who use the single transferable vote (STV) system. Other local authorities have the option of using STV at future elections.
Local authority franchise. Every parliamentary elector is automatically qualified as a residential elector of a local authority if the address at which the person is registered on the electoral roll is within the district of the local authority. Ratepayers who are not residents are entitled to enrol and vote in any region, district or community in which they pay rates. Rolls are compiled by territorial authorities, who usually compile rolls and conduct elections for other authorities as well. Information for the residential electoral roll is obtained from the parliamentary electoral database, and the ratepayer roll is compiled from enrolment forms received from ratepayers.
Membership of local authorities. Subject to meeting certain residency and citizenship requirements, any person who is a parliamentary elector may be elected to a regional council or territorial authority or community board. In 1992, a prohibition was introduced on a person being a candidate for both a regional council and a territorial authority or community board within that region. Vacancies may be filled either by an election or by appointment, depending upon the timing of the vacancy.
Remuneration. Most boards and councils pay their chairperson or mayor an annual salary, while other members are paid a combination of a daily meeting allowance and an annual salary. Maximum and minimum salary and allowance levels are set by the Remuneration Authority, giving the council or board the discretion to decide the actual rate within the prescribed limits.
The Local Government Commission consists of three members, one of whom is the chairperson, appointed by the Minister of Local Government.
The commission has two major functions.
Firstly, as a quasi-judicial appeal authority, to hear and determine appeals against decisions of local authorities on proposed boundary alterations; appeals and objections relating to ward and membership proposals of a local authority following a representation review; and proposals for the constitution of communities.
Secondly, the commission has responsibilities relating to the consideration and processing of reorganisation proposals for the union or constitution of districts or regions. The commission may also carry out investigations of particular matters affecting local government and report on them to the Minister of Local Government.
The Local Government Act 2002 also requires the commission to review and report to the Minister of Local Government on the operation of that act and the Local Electoral Act 2001.
The review is being carried out in two phases.
First, it must report on any amendments it considers should be made to the acts before the 2007 local body elections.
Second, it must report on wider issues relating to the two acts as soon as practicable after the 2007 elections.
The New Zealand coat of arms is protected under the Flags, Emblems and Names Protection Act 1981 and its lawful use is confined to official purposes. The first quarter of the shield on the coat of arms depicts four stars as representative of the Southern Cross, then three ships symbolising the importance of New Zealand's sea trade; in the second quarter is a fleece representing the farming industry. The wheat sheaf in the third quarter represents the agricultural industry, while the crossed hammers in the fourth quarter represent the mining industry. The supporters on either side of the shield consist of a Māori Chieftain holding a taiaha (a Māori war weapon) and a European woman holding the New Zealand flag. Surmounting the arms is the St Edward's Crown which was used in the coronation ceremony of Her Majesty Queen Elizabeth II. The crown symbolises the fact that Her Majesty is Queen of New Zealand under the New Zealand Royal Titles Act 1953.
The flag previously known as the New Zealand ensign was declared the national flag of New Zealand under the Flags, Emblems and Names Protection Act 1981.
The national flag is the symbol of the realm, government and people of New Zealand.
The basis of the New Zealand flag is the Union flag (Jack) in the upper left quarter, and, on a blue ground to the right, the Southern Cross represented by four five-pointed red stars with white borders.
3.1 Ministry of Justice; Statistics New Zealand.
3.2 Office of the Clerk of the House of Representatives; Cabinet Office; Chief Electoral Office; Ministry of Justice.
3.3 State Services Commission; Office of the Controller and Auditor-General; Crown Company Monitoring Advisory Unit; Office of the Ombudsmen; Office of the Privacy Commissioner; Ministry of Justice; Office of the Parliamentary Commissioner for the Environment; Public Trust.
3.4 Local Government Commission; Department of Internal Affairs; Local Government New Zealand.
3.5 Ministry for Culture and Heritage.
www.elections.govt.nz - Electoral Commission
www.vuw.ac.nz/inst-policy-studies - Institute of Policy Studies
www.lawcom.govt.nz - Law Commission
www.localgovtnz.co.nz - Local Government New Zealand
www.parliament.govt.nz - Office of the Clerk of the House of Representatives
www.ombudsmen.govt.nz - Office of the Ombudsmen
www.pce.govt.nz - Parliamentary Commissioner for the Environment
www.pco.parliament.govt.nz - Parliamentary Counsel Office
www.parliament.govt.nz - Parliamentary Service
www.ssc.govt.nz - State Services Commission
www.justice.govt.nz - Ministry of Justice
www.dpmc.govt.nz - Department for Prime Minister and Cabinet
Table of Contents
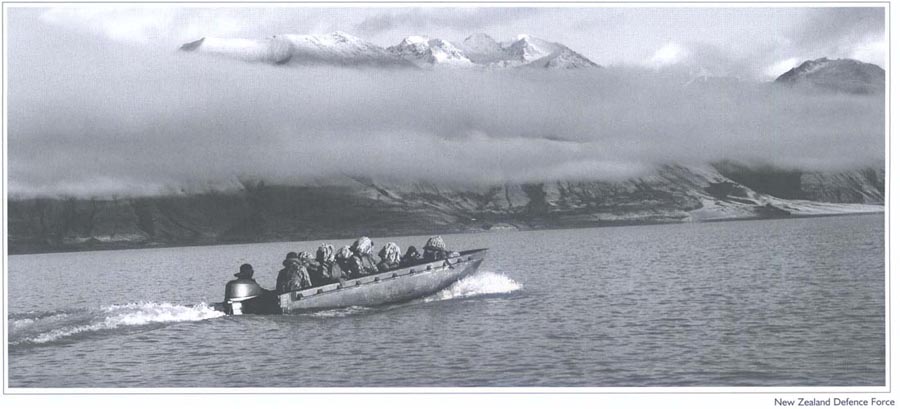
Soldiers involved in a water approach training exercise on Lake Tekapo.
The New Zealand Government established the then Department of External Affairs and began stationing diplomatic representatives overseas in 1943. Today, New Zealand has diplomatic and consular representation in more than 40 countries, with multiple accreditation allowing New Zealand representatives to cover another 80 countries and states from their bases.
On behalf of the government, the Ministry of Foreign Affairs and Trade (MFAT) Te Manatū Aorere is responsible for all major policy functions related to New Zealand's external relations. The main thrust of the ministry's work is directed at management of New Zealand's bilateral relations with other countries, and with its interests in international institutions. Other functions include management of development assistance, provision of consular services to New Zealanders abroad, and provision of operational and administrative support services to other New Zealand government agencies overseas.
The ministry is the official channel of communication between the New Zealand Government and other governments. It also administers Tokelau and undertakes external affairs and defence functions for the Cook Islands and Niue after consultations with their heads of government. The ministry consults closely with other government departments and agencies on domestic and international developments and their interrelationships. The New Zealand Trade Development Board is a particularly important partner in developing and implementing programmes to promote foreign exchange earnings.
The ministry also operates and administers the diplomatic and consular posts that represent and pursue New Zealand's interests overseas. The posts perform services on behalf of all government departments, offer assistance to New Zealanders overseas, whether travelling in official or private capacities, and issue passports and visas overseas. The Ministry of Foreign Affairs and Trade website is www.mfat.govt.nz
The Pacific is a key area in New Zealand's international relations. New Zealand enjoys a close association with Pacific Island nations, with 11 diplomatic missions and consulates in the region and accreditation to a further six.
Special relationships exist between New Zealand and the Cook Islands, Niue and Tokelau. The Cook Islands became a self-governing state in free association with New Zealand in 1965 and Niue followed in 1974. Tokelau is a non self-governing territory of New Zealand under the purview of the United Nations Committee on Decolonisation. Cook Islanders, Niueans and Tokelauans are New Zealand citizens.
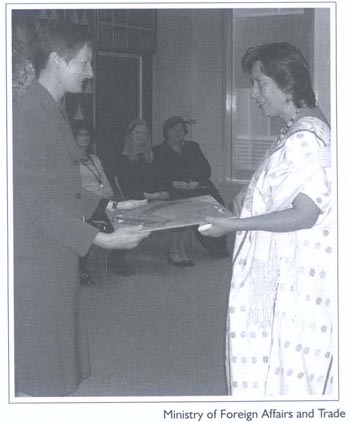
The Ministry of Foreign Affairs and Trade maintains contact with international organisations working on behalf of indigenous people.
Trade with the Pacific is important to New Zealand. Exports totalled $837 million for the year ending 30 June 2003, an increase of more than 70 percent in the two years since June 2001. Imports totalled $135 million in the year ending 30 June 2003, only $1 million more than two years before. Imports from Pacific countries have duty-free access on a non-reciprocal basis to New Zealand and Australian markets under the South Pacific Regional Trade and Economic Cooperation Agreement (SPARTECA).
New Zealand has developed extensive links with Pacific regional organisations. It was a founding member of the South Pacific Forum, formed in 1971 to promote regional cooperation, particularly in trade and economic development. Renamed the Pacific Islands Forum in 1999, it now comprises 16 Pacific countries and provides an opportunity to discuss regional and international issues of interest to the region, such as regional security, environmental issues, fisheries and economic development.
Pacific Islands Forum countries meet annually at heads of government level, with meetings throughout the year at ministerial and official levels to consider a variety of specific issues. New Zealand hosted the Pacific Islands Forum in August 2003. An important aspect of the forum's work is the annual Forum Economic Ministers' Meeting (FEMM). Since the first meeting in 1995, ministers have agreed on an action plan covering accountability principles, public sector reform initiatives, tariff reform and investment reform.
In 2003, the Pacific Agreement on Closer Economic Relations (PACER) came into force. The PACER is a framework agreement covering all Pacific Islands Forum countries, including Australia and New Zealand, and represents an important step in New Zealand's relations with Pacific countries. It provides for the development, over time, of arrangements to achieve closer trade and economic integration in the Pacific region.
The Pacific Island Countries Trade Agreement (PICTA), a free trade agreement among Pacific Islands Forum countries, came into force in late 2002. Over a period of 10 years, it will lead to establishment of a free trade area among Pacific island states.
The importance of fisheries as an economic resource in the Pacific led to completion in September 2000 of the Convention on the Conservation and Management of Highly Migratory Fish Stocks in the Western and Central Pacific Ocean (WCPFC). The convention is the first regional fisheries management arrangement to base itself on the 1995 United Nations Fish Stocks Agreement, and will lead to the establishment of a broad-based fisheries management organisation in the Pacific region, including both coastal states and distant water fishing nations. It was expected that the convention would come into force during 2004.
Other regional organisations of which New Zealand is a member include:
The Forum Fisheries Agency (FFA), which assists members with management and conservation of the region's marine resources.
The Secretariat of the Pacific Community (formerly the South Pacific Commission), which helps promote economic and social development in the region through work in agriculture, marine resources, health, socio-economic and statistical services, and community education.
The South Pacific Regional Environment Programme (SPREP), which focuses on protection and management of environmental resources.
The Pacific Forum Line (PFL), which facilitates regional trade through improved shipping links.
The South Pacific Applied Geoscience Commission (SOPAC), which assists countries in the assessment, exploration and development of mineral and other non-living resources.
New Zealand has other links with the Pacific covering official development assistance, defence and disaster coordination.
The France, Australia, New Zealand (FRANZ) arrangement is an important element in the provision of rapid emergency assistance to the region in the event of natural disasters such as tropical cyclones.
The Pacific is also the area of New Zealand's primary aid focus. Nearly half of the New Zealand Agency for International Development's (NZAID) budget - about $110 million - goes towards development assistance in the Pacific. NZAID has extensive bilateral relationships with countries in the Pacific, and provides significant support for regional organisations such as the Secretariat of the Pacific Community and the University of the South Pacific. Pacific regional programmes are divided into broad themes of health, education, law and justice, and the environment.
Security issues in the Pacific are characterised by internal and external security challenges stemming from factors including ethnic differences, economic disparities, land disputes and transnational crime. New Zealand has been extensively involved in regional efforts to resolve these security challenges, especially in Bougainville and the Solomon Islands. On Bougainville, New Zealand committed personnel to the Peace Monitoring Group (PMG 1998-2003) and the Bougainville Transitional Team (BTT-2003). New Zealand also contributed police and military personnel to the Regional Assistance Mission to the Solomon Islands (RAMSI).
Regional cooperation in security matters has been centred on the Pacific Islands Forum and its regional security committee. A significant development was the Biketawa Declaration made by forum leaders in 2000 under which the forum secretary-general was assigned a specific role in monitoring possible sources of conflict and developing methods of dispute settlement and conflict avoidance to prevent their developing into open conflict.
Figure 4.01 shows where the Ministry of Foreign Affairs and Trade has diplomatic and consular representation. The legend below also shows accreditations.
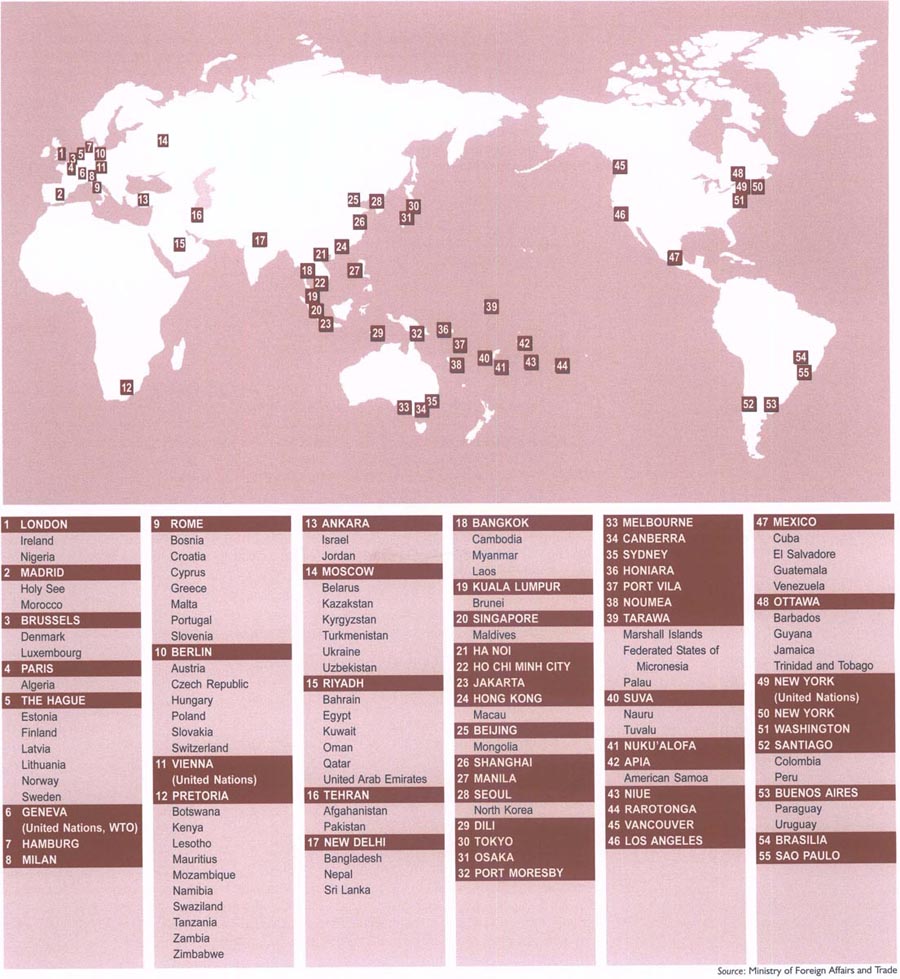
New Zealand enjoys no closer partnership than that shared with Australia. The relationship is central to New Zealand's trade and economic interests, its defence, security and foreign policy interests, and to the country's overall economic and social well-being.
The political framework for management of the relationship includes regular dedicated meetings between the Prime Ministers of New Zealand and Australia, between Ministers of Foreign Affairs and Trade, Ministers of Finance, Ministers for Trade Negotiations and Ministers of Defence. New Zealand is represented in Australia by a high commission in Canberra and consulates-general in Sydney and Melbourne.
The Trans-Tasman Travel Arrangement (TTTA) enables New Zealand citizens to travel, live and work in Australia, and Australian residents to receive similar access to New Zealand. A new social security agreement negotiated with Australia, covering superannuation and severe disability, came into effect on 1 July 2002. The new arrangement preserves the ability of New Zealanders to live and work in Australia (and vice versa) under the TTTA, while allowing both governments to determine their own policies regarding access to all other social welfare benefits.
There are more than 400,000 New Zealanders living in Australia and about 55,000 Australians in New Zealand. More than a million New Zealanders and Australians cross the Tasman on short-term visits each year.
Australia is New Zealand's most important trading partner and New Zealand is Australia's second largest market for manufactured goods. The Australia New Zealand Closer Economic Relations Trade Agreement (ANZCERTA or CER), signed in 1983, and its associated arrangements and agreements, is the main instrument governing trade and economic relations between the two countries. The economies of the two countries have become increasingly integrated since signing of the agreement. Complete free trade in goods was achieved five years ahead of schedule, on 1 July 1990. The 1988 CER Protocol on Services provides for free trade in nearly all services sectors.
The CER relationship also addresses a range of non-tariff measures, such as customs requirements, standards, business law regulations and occupational registration requirements. A Joint Food Standards Treaty was signed in 1995 and in December 2002 the Australia New Zealand Food Standards Code took effect. In 1998, CER was further expanded to include the Trans-Tasman Mutual Recognition Arrangement and, in 2000, an agreement on coordination of business law was signed. The 1996 Single Aviation Market Arrangement was expanded in 2000 to an ‘open skies’ agreement.
Australia is also New Zealand's closest and most important security partner. The alliance with Australia, founded in the Canberra Pact (1944), formalised in the ANZUS Treaty (1952) and finding current expression in the Closer Defence Relations concept, as confirmed in 2002, remains central to New Zealand's defence policies. Both governments are committed to achieving the highest possible level of interoperability with each other, while acknowledging the need for each to meet its own defence priorities. Australia and New Zealand have worked together closely and effectively in East Timor, Bougainville and the Solomon Islands.
New Zealand has a long association with Asia, dating back to its military involvement in the region during World War II and, later, the Korean War. New Zealand was a founding member of the Colombo Plan and contributed significant levels of development assistance to many Asian countries throughout the 1960s and 1970s. With the re-industrialisation of Japan and the rapid development of a number of Asian economies in the post-war period, the Asian region offered New Zealand new markets for its exports as Britain moved to join the European Economic Community in the early 1970s.
In the year ending June 2003, Asia took 34 percent of all New Zealand's exports and provided nearly 36 percent of imports. Trade in tourism and education services has been increasing rapidly, especially with the large economies of North Asia. In recent years, China has emerged as a significant economic player in its own right and is now New Zealand's fourth largest trading partner. There are also significant flows of direct investment between Asia and New Zealand.
With New Zealand's future prosperity inextricably linked with Asia, stability of the region remains integral to New Zealand's well-being. New Zealand invests considerable resources in developing closer political relations with neighbours in the Asian region and it is represented by a network of offices in Bangkok, Beijing, Hanoi, Ho Chi Minh City, Hong Kong, Jakarta, Kuala Lumpur, Manila, New Delhi, Seoul, Singapore, Shanghai and Tokyo.
Establishment of the Asia 2000 Foundation in 1991 has seen New Zealand's relations with Asia expand beyond the trade and economic prism. Support for sister city links, cultural exchanges and Asian language programmes in New Zealand schools has helped promote closer cultural ties with Asia. New Zealand's increasing Asian orientation has resulted in greater numbers of people from Asia coming to New Zealand to holiday, study, work or live. The Auckland region has become the focus of New Zealand's Asian community, with one in eight residents now of Asian descent.
At the political level, New Zealand is one of the original dialogue partners of the Association of South-East Asian Nations (ASEAN) and cooperates with members on a range of regional trade facilitation and economic development activities. A closer economic partnership agreement between AFTA (ASEAN Free Trade Area) and CER (New Zealand and Australia) was concluded in September 2002 and has adopted a work programme focussed on trade facilitation within the AFTA/CER region.
In the security arena, New Zealand takes part in the ASEAN Regional Forum, which provides ministers from throughout the Asia/Pacific region with an opportunity to focus collectively on regional security issues. New Zealand is also a member of the Five Power Defence Arrangement, which brings together Malaysia, Singapore, Britain, Australia and New Zealand.
Indian dancers take part in an Asia 2000 Festival of Lights in Auckland.
United States. New Zealand's relationship with the United States is one of its most important. Shared values underpin close government and private sector contacts across a broad range of bilateral, regional and multilateral activities. The United States is a key economic partner. It is one of New Zealand's three most important export markets and a major source of imports and investment. In the multilateral trade field, the two countries espouse similar open market philosophies. Cooperation is also long standing and close on issues such as international and regional security, human rights, environmental matters and Antarctic scientific research. Programmes for scientific, cultural and educational exchange maintain an awareness of New Zealand in the United States and promote an interchange of ideas and experiences.
Canada. New Zealand and Canada enjoy a positive and close relationship, based on shared Commonwealth, United Nations and Asia/Pacific interests. The two countries cooperate closely on a range of issues, including disarmament, international peacekeeping and security, Asia/Pacific policies and international economic matters. Canada is an important market for New Zealand's agricultural products, particularly beef. Bilateral trade and economic relations are conducted under the umbrella of the 1981 Trade and Economic Cooperation Agreement (TEC), which provides for, among other things, regular consultation on trade issues.
Latin America and the Caribbean. Trade and investment is the primary focus of New Zealand's relationship with Latin America and the Caribbean. Exports mainly comprise dairy products, agricultural machinery and manufactured goods. New Zealand companies are involved in a wide range of activities in the region in the agricultural, forestry, fisheries, construction, telecommunications and energy sectors. New Zealand provides a modest amount of economic and social development assistance to the region and shares interests with a number of Latin American and Caribbean countries in areas such as international trade, the environment, Antarctica, disarmament and Pacific regional cooperation. New Zealand has embassies and consulates in Mexico, Brazil, Chile and Argentina. The Ambassador in Mexico is also accredited to Venezuela, Guatemala, Cuba and El Salvador; the Ambassador in Santiago is also accredited to Peru and Colombia; and the Ambassador in Buenos Aires is also accredited to the Mercosur group of Argentina, Brazil, Uruguay and Paraguay. In addition to honorary consuls in Bogota, Lima, Caracas, San Salvador and Montevideo, a New Zealand Consulate-General was opened in Sao Paulo in 1999. The High Commissioner in Ottawa is also accredited to the Caribbean countries of Barbados, Guyana, Jamaica and Trinidad and Tobago.
Western Europe. The European Union (EU) is a major political and economic entity and a significant player in world affairs. It admitted 10 new members on 1 May 2004 to become a community of 25 states. The EU is New Zealand's second largest market after Australia, and contact with the European Commission in Brussels, and also with the European Parliament, is critical to maintaining New Zealand's trade access to Europe. The EU is the largest market for a broad range of primary produce, including sheepmeat, wool, butter, kiwifruit, apples and venison. It is also the most important market for New Zealand's wine exports. Successful negotiations during the General Agreement on Tariffs and Trade (GATT) Uruguay Round resulted in a significant improvement in both the volume and overall stability of New Zealand's access to this market. While trade issues remain important, the breadth of New Zealand's relationship with the EU has expanded in recent years, with conclusion of air services agreements and a number of young peoples' working holiday schemes with individual member states. Europe has traditionally been New Zealand's third largest source of tourists, behind Oceania and Asia, and is a major contributor of new investment. Twice-yearly political consultations are held at ministerial level with the revolving EU presidency and the European Commission. New Zealand has embassies or consulates in Berlin, Brussels, Geneva, Hamburg, Madrid, Milan, Paris, Rome and The Hague and a high commission in London. These posts are cross-accredited to all other EU member states, including those admitted in 2004. Regular contact is maintained by New Zealand's network of posts with individual EU member states, and with the European Commission in Brussels, on a range of economic and political issues.
Central and Eastern Europe and the Baltics. The former communist states of Central and Eastern Europe and the Baltics have evolved into multi-party democracies with free-market economies. Poland, Hungary, the Czech Republic, Slovenia, the Slovak Republic, Lithuania, Latvia and Estonia joined the European Union on 1 May 2004, while Bulgaria and Romania are candidates to join in 2007. In 2004, Bulgaria, Estonia, Latvia, Lithuania, Romania, Slovenia and Slovakia followed Poland, Hungary and the Czech Republic into the North Atlantic Trade Organisation (NATO). These political and economic changes have led to increased contacts between New Zealand and the countries concerned. Responsibility for New Zealand's government-to-government relations with the Czech Republic, Hungary, Poland and Slovakia lies with the New Zealand Embassy in Berlin, and for Bosnia, Croatia and Slovenia with the embassy in Rome. A New Zealand embassy was due to be opened in Warsaw in the second half of 2004. Commercial relations with Central and Eastern Europe are handled by the Trade New Zealand office in Milan, while the Baltic states of Estonia, Latvia and Lithuania are covered by the New Zealand Embassy in The Hague.
Russia and the Commonwealth of Independent States (CIS). Trade remains the central component of New Zealand's relations with the states that formerly made up the Soviet Union, the Russian Federation being the principal partner. Despite Russia's economic and financial problems, it remains an important, although diminished, market for New Zealand dairy products. The long-term potential for trade with some regions, notably the Russian far east, is strong. New Zealand cooperates with Russia on a range of international issues in regional bodies such as the Asia Pacific Economic Cooperation organisation and the Association of South-East Asian Nations Regional Forum, and is heavily involved in negotiations for the accession of Russia to the World Trade Organisation. New Zealand has an embassy in Moscow, which is accredited to Belarus, Kazakhstan, Kyrgyzstan, Turkmenistan, Ukraine and Uzbekistan. In 2001, a new honorary consulate was opened in Vladivostok to cover New Zealand's interests in the Russian far east.
The implications of events in the Middle East for international peace and security make developments there of ongoing concern to New Zealand. The two issues which have preoccupied the international community for many years are the Arab-Israeli dispute and the threat which Iraq has posed to its neighbours.
For more than 40 years, New Zealand has maintained a balanced and constructive approach to the Arab-Israeli dispute, consistently upholding the right of the Palestinian people to a viable state and, with equal consistency, Israel's right to exist within secure borders.
New Zealand has made a practical contribution to peace in the Middle East in the form of a contingent in the Sinai Multinational Force and Observers (MFO), based on the border between Egypt and Israel since 1982. New Zealand also contributes defence personnel to the United Nations Truce Supervision Organisation (UNTSO), headquartered in Jerusalem.
New Zealand deeply regretted that the multilateral approach to the Iraq crisis broke down and failed to avert conflict. The crucial issues now are the reconstruction of Iraq, the restoration of its sovereignty and the rebuilding of political and social structures to guarantee the Iraqi people a better life.
At the end of the 2003/04 financial year, New Zealand had contributed $9.8 million in humanitarian assistance for Iraq. In response to a United Nations Security Council request, in September 2003 New Zealand also deployed a defence force engineering group of 61 to undertake humanitarian and reconstruction work in southern Iraq.
New Zealand supports the Bonn Process under which Afghanistan is returning to constitutional democratic government. New Zealand has been involved continuously in security efforts in Afghanistan since late 2001, supporting both the International Security Assistance Force and Operation Enduring Freedom.
In September 2003, New Zealand took command of the Provincial Reconstruction Team (PRT) in Bamian (200km north west of Kabul), involving about 100 New Zealand Defence Force personnel drawn from the three services. PRTs are designed to assist the Afghanistan Transitional Authority extend its influence beyond Kabul. The focus is on enhancing the security environment and promoting the reconstruction effort. In addition, New Zealand had contributed $4.6 million of humanitarian assistance at the end of 2003.
New Zealand has significant economic interests in the Middle East. The region is a valuable market for New Zealand wool, dairy products, meat and, increasingly, manufactured goods and services. The Middle East is an important source for New Zealand's crude oil, polymers and fertilisers. In the year ending 30 June 2003, New Zealand exports to the region totalled $944 million, while imports for the same period were $1,400 million.
New Zealand has embassies in Saudi Arabia (Riyadh), Turkey (Ankara) and Iran (Tehran), and accreditations to Afghanistan, Bahrain, Egypt, Israel, Jordan, Kuwait, Oman, Qatar, and the United Arab Emirates. New Zealand embassies in Paris and Madrid are accredited to Algeria and Morocco respectively. The New Zealand Consulate-General in Dubai is also the regional office for New Zealand Trade and Enterprise.
New Zealand's official relations with Sub-Saharan Africa are in the main with the Commonwealth countries of southern and eastern Africa, with South Africa being the most substantial. There is a strong humanitarian focus to many of these relationships.
New Zealand has a long-standing involvement in development cooperation in Africa through its official development assistance programme. The focus of the programme is on primary and non-formal education, rural development and primary health care. There is also provision for short-term technical assistance and support for New Zealand non-government organisations (NGOs), including Volunteer Service Abroad. Expenditure on all facets of development assistance, including scholarships, during 2003 was $12.04 million.
New Zealand is also participating in the United Nations (UN) peacekeeping mission in Sierra Leone and in the UN demining programme in Mozambique.
Trade with Sub-Saharan Africa accounts for only a small proportion of New Zealand's global trade, with exports valued at around $250 million in the year ending 30 June 2003. Among major exports to the region were dairy, fish and other food products, casein and electrical equipment. Imports included petroleum products, iron and steel, vehicles and parts, tobacco, coffee and wine. In 2003, South Africa and Mauritius were New Zealand's most important markets in Sub-Saharan Africa. New Zealand has one mission in Africa, the office in Zimbabwe being closed in 2000. The New Zealand High Commission in Pretoria, South Africa, is accredited to 10 other southern and eastern African countries, Botswana, Kenya, Lesotho, Mauritius, Mozambique, Namibia, Swaziland, Tanzania, Zambia and Zimbabwe. The New Zealand High Commission in London is responsible for relations with Nigeria.
The New Zealand Agency for International Development (NZAID) is the New Zealand agency responsible for international assistance to developing countries. New Zealand aid helps to eliminate poverty through development partnerships, particularly in regions of the Pacific. NZAID also supports projects in Asia, Africa and Latin America. NZAID concentrates its development assistance on activities that help fulfil basic needs, that achieve sustainable livelihoods and development, and that ensure safe and inclusive societies.
As Table 4.01 shows, NZAID's programme for the 2002/03 financial year exceeded $230 million. Figure 4.02 compares New Zealand's net official development assistance as a percentage of GDP with other countries.
Table 4.01. Spending on New Zealand aid programmes
Year ending 30 June 2003
| Programme | Spending | Proportion of total |
|---|---|---|
| Source: NZAID | ||
| $(million) | Percent | |
| Pacific | 75.446 | 33 |
| Multilateral | 72.270 | 31 |
| Asia | 29.657 | 13 |
| Voluntary agencies | 19.513 | 9 |
| Scholarships | 16.061 | 7 |
| Other bilateral | 10.261 | 4 |
| Africa and the Americas | 6.974 | 3 |
| Total | 230.182 | 100 |
NZAID pursues its development objectives in the context of New Zealand's obligations to protect and promote the achievement of human rights as recognised by international instruments, standards and principles. NZAID's programme is divided for financial and administrative purposes into two broad schedules of activities: bilateral and multilateral.
New Zealand's bilateral aid schedule is dominated by direct assistance on a country-to-country basis in the form of development projects and activities. This schedule includes a number of regional programmes which serve groups of bilateral partner countries; scholarship programmes for overseas students funded independently of the bilateral country programmes; the work of Volunteer Service Abroad (VSA) and non-government organisations (NGOs) working at grassroots levels in developing countries; and contributions for emergency and disaster relief operations, both government-to-government and through international agencies.
Figure 4.02. Net official development assistance
As
proportion of gross national product Years ending 31
December1
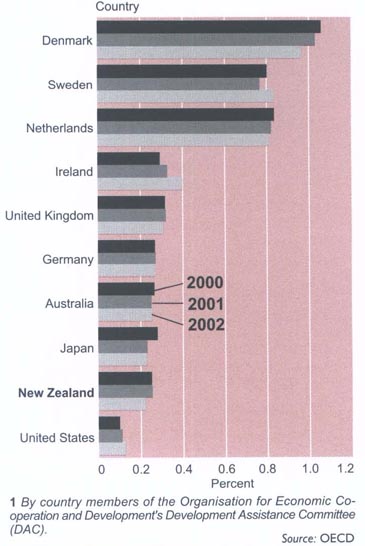
Bilateral country and regional programmes are developed on a three-year rolling basis, with each year's programmes containing a mixture of continuing activities and new proposals. Development assistance is provided in many sectors, including agriculture, communications, conservation and environment, education and training, energy, fisheries, forestry, health, industry, public sector reform, social infrastructure, tourism, transport, water resources and gender development. The South Pacific has been a focal area for New Zealand's aid programme, with a regional approach to development strongly supported. In addition to programmes that span the region, support continues to be provided to key regional organisations. In 2002/03 these included the Foreign Investment Advisory Service; the South Pacific Project Facility; the Pacific Financial Technical Centre; the Pacific Islands Forum Secretariat; the Secretariat of the Pacific Community; the Forum Fisheries Agency; the University of the South Pacific; the South Pacific Regional Environment Programme; the South Pacific Applied Geoscience Commission; and the South Pacific Board for Educational Assessment.
In addition to its bilateral country programmes, New Zealand provides regionally-focused assistance to the Pacific in education, health, environment, governance, law and justice and gender issues, agriculture, fisheries, and trade and economic projects.
Scholarships. NZAID funding for non-bilateral scholarship schemes totalled approximately $16 million in 2002/03. These schemes comprised the Postgraduate Scholarships Scheme, the Commonwealth Scholarships Scheme, the Aotearoa Scholarships Scheme, the Geothermal Diploma Course, and dependants' fees scholarships.
Emergency and disaster relief. NZAID support for emergency and disaster relief programmes in 2002/03 totalled $35.46 million. Of this, 9 per cent was directed towards meeting emergency and disaster needs in the Pacific. This support covered immediate emergency assistance, reconstruction activities and preventative programmes through international agencies, New Zealand non-government organisations and their overseas partners, international non-government organisations, and partner governments. Support fell into the following main categories:
Annual core funding of United Nations humanitarian agencies: $2.85 million.
Annual core and programme funding of the International Committee of the Red Cross, the International Federation of the Red Cross, and the New Zealand Red Cross: $732,000.
Support for preventative programmes in the Pacific: $300,000.
Funding through New Zealand non-government organisations and their partners overseas: $5.58 million.
Direct response to emergency and disaster situations: $12.51 million.
Non-government organisations. A strategic policy framework for NZAID and New Zealand non-government organisations (NGOs) sets out principles, undertakings and guidelines for funding, policy development and information exchange. Strengthening civil organisations in partner countries is a key feature of NZAID's work. Relationships include long-term engagement with NGOs in Papua-New Guinea, Fiji, Samoa, Tonga and Indonesia. Support is provided to NGOs and community groups through small-project funds for rural development and local capacity building. In 2003/04, New Zealand-based NGOs directed more than $10 million from the Voluntary Agency Support Scheme (VASS) to partners overseas for community development work. Nine organisations received VASS funding on a block grant basis. These agencies select projects within the scheme's criteria and report on an annual basis. A number of other agencies received grants on a project-by-project basis. A further $5.58 million in emergency and disaster relief was disbursed by VASS though New Zealand NGOs to partners overseas. These funds provided support for emergency relief for victims of natural disasters, as well as for people affected by armed conflict. Volunteer Service Abroad, the Council for International Development, the Development Resource Centre (commonly known as Dev-Zone) and Trade Aid also received core funding.
Volunteer Service Abroad sends New Zealand volunteers to share their skills in developing regions of the world.
The New Zealand Government is committed to multilateral approaches to global aid issues. In this context, the multilateral agencies and programmes of the United Nations, the Commonwealth, the World Bank and the Asian Development Bank, as well as a range of other international bodies, provide key vehicles for the distribution of aid.
Multilateral agencies and programmes provide a proven and effective means for New Zealand to address poverty, conflict, governance issues and humanitarian crises worldwide.
NZAID participated in two major global forums during 2002/03. These were the Financing for Development Conference (FfD) in Monterrey and the World Summit on Sustainable Development (WSSD) in Johannesburg. The ‘Monterrey Consensus’ which emerged from FfD included commitments to substantially increase aid levels, as well as working for better coherence between aid, international trade, private investment flows and initiatives to reduce the debt burden of development countries.
The first steps were taken in 2002 to use NZAID's Multilateral and Regional Agencies Assessment Framework to assess the impact of current engagements with multilateral agencies, the effectiveness of the agency, the fit with NZAID policies and priorities, and the value for money to the New Zealand taxpayer.
New Zealand was a founding member of the United Nations (UN) in 1945 and successive governments have strongly supported it as the major global instrument for maintaining peace and security, for developing friendly relations among countries, for encouraging international cooperation aimed at solving economic and social problems, for establishing and strengthening an international legal framework, and for promoting respect for human rights. The range and complexity of the functions of the UN and its specialised agencies have grown steadily during the years and New Zealand concentrates on areas where it can play a useful role in matters directly affecting its interests and where it can support efforts to secure lasting peace and security.
New Zealand is a strong advocate of international law and is actively engaged in the global debate on peace and security issues, disarmament, conflict prevention, sustainable development, the environment, and the promotion of human rights. New Zealand is a member of the International Law Commission, the Statistical Commission of the Economic and Social Council of the United Nations and the Committee of Experts on the Transport of Dangerous Goods.
Contributions to the United Nations. Contributions to the United Nation's budget are based on members' capacity to pay. New Zealand contributed annual dues to the United Nations of $8.03 million for the regular budget in 2003 and $10.53 million for the peacekeeping budget for 2002/03. New Zealand's level of assessment for 2003 was 0.241 percent of the UN budget. Contributions to budgets of specialised United Nations agencies vary, with assessments fixed according to scales agreed by members of each agency.
Human rights. As a party to international human rights instruments, New Zealand is required to report regularly to UN monitoring bodies on measures it has taken to give effect to international standards.
During 2003, New Zealand submitted its second periodic report under the UN Convention on the Rights of the Child; its third periodic report under the Convention Against Torture and Other Cruel, Inhuman or Degrading Treatment or Punishment; its second periodic report under the International Covenant on Economic, Social and Cultural Rights; and the 12th, 13th and 14th consolidated reports under the International Convention on the Elimination of All Forms of Racial Discrimination. The fifth periodic report for the Convention on the Elimination of All Forms of Discrimination Against Women is being prepared by the Ministry of Women's Affairs.
At the 2003 sessions of the UN Commission on Human Rights and the Third Committee of the UN General Assembly, which both dealt with civil, political, economic, social and cultural rights issues, New Zealand supported resolutions addressing a wide range of international human rights concerns, in particular women's and children's rights; the rights of people with disabilities; and human rights treaty issues. New Zealand has also been actively involved in international initiatives focusing on indigenous people.
Specialised agencies. There are many subsidiary, specialised or otherwise-related agencies of varying sizes within the UN system, some with independent secretariats, budgets and operations. New Zealand is a member of all the major specialised agencies and of a number of related bodies. Among the largest is the Food and Agricultural Organisation, which aims to raise levels of nutrition and global living standards, to promote agriculture and food security and to expand the world economy. The World Health Organisation seeks attainment by all people of the highest possible levels of health. The International Labour Organisation (ILO) seeks to improve working and living conditions, while the UN Educational, Scientific and Cultural Organisation seeks to increase international cooperation through education, science and culture.
In 2003, New Zealand served on the governing bodies of the UN Environment Programme, the ILO and the World Meteorological Organisation. For the first time, New Zealand was elected to the World Heritage Committee in 2003. The committee is responsible for implementing the World Heritage Convention to which New Zealand became a party in 1984. Parties to the convention - 176 countries - agree to protect their natural and cultural heritage.
From 2002 to 2004, New Zealand was a member of the board of governors of the International Atomic Energy Agency, which is not a specialised agency but an independent intergovernmental organisation under the aegis of the UN. Also in this category is the Organisation for the Prohibition of Chemical Weapons, on whose executive council New Zealand is serving from 2004 to 2006.
The World Trade Organisation (WTO) is the only international organisation dealing with rules of trade among nations. It acts as a single institutional framework over the General Agreement on Tariffs and Trade (GATT) and over the multilateral agreements that resulted from the Uruguay Round of trade negotiations between 1986 and 1994.
The GATT came into force in 1948. Its basic aim was to help trade flow as freely as possible by removing obstacles and increasing transparency, thereby contributing to international economic growth and development. By the time the WTO came into force on 1 January 1995, the GATT's contracting parties accounted for about 90 percent of world trade.
The WTO provides both a code of rules and a forum in which the 142 countries who belong to the organisation can discuss and address trade problems, and negotiate and enlarge world trading opportunities. It is based on the premises that the trading system should be:
Without discrimination - The ‘most favoured nation’ clause stipulates that each WTO member must grant all other members treatment as favourable as that which they grant any other country. This principle is particularly important for countries such as New Zealand, since it ensures that larger countries cannot adopt discriminatory trade policies, except for preferential free trade areas and customs unions. A second non-discrimination principle is ‘national treatment’, which requires that imported products are treated no less favourably than domestic products with respect to internal taxes, regulations and other requirements.
Freer - Barriers such as tariffs should progressively come down through negotiations.
Predictable - Businesses should be confident that trade barriers, including tariffs, non-tariff barriers and other measures, will not be raised arbitrarily. This is achieved by members making binding commitments not to raise trade barriers beyond current levels.
Transparent - Less transparent instruments, such as quotas and import licensing, are discouraged in favour of protection in the form of tariffs.
More competitive - Unfair practices, such as export subsidies and dumping products below cost to gain market share, are discouraged.
More beneficial to less developed countries - Developing countries are allowed more time to adjust, greater flexibility and special privileges to help them in their development objectives.
Eight rounds of multilateral trade negotiations were held under the auspices of the GATT, each with the aim of liberalising trade between contracting parties by reducing trade barriers and other measures impeding free trade. The most ambitious of these was the Uruguay Round (1986-94). In addition to establishing the WTO, the Uruguay Round:
Brought agriculture effectively within the multilateral trading system for the first time.
Secured eventual integration of the textiles and clothing sector into the WTO system.
Extended the multilateral trading system to trade in services.
Strengthened multilateral trade rules in areas such as subsidies, anti-dumping, technical barriers to trade, sanitary and phytosanitary measures, safeguards, trade-related investment measures and dispute settlement.
Established a multilateral framework for the protection and enforcement of intellectual property rights.
Further reduced tariffs on goods.
Former New Zealand Prime Minister Mike Moore was appointed Director-General of the WTO in 1999. He was succeeded in September 2002 by Dr Supachai Panitchpakdi, former deputy Prime Minister of Thailand.
The highest decision-making level in the WTO is the Ministerial Conference, which meets every two years to make decisions on matters under WTO agreements. The Ministerial Conference that took place in November 2001 in Doha, Qatar, launched a new round of negotiations with the aim of concluding them by 1 January 2005. The new round was termed the Doha Development Agenda, to acknowledge the importance of development issues to the achievement of further trade liberalisation.
Key provisions in the Doha ministerial declaration included agreement to negotiate to improve market access for agricultural and non-agricultural products and services, new mandates to negotiate to reduce fishing subsidies, and recognition of the relationship between WTO trade rules and multilateral environmental agreements. The declaration also contained a reference to the work of the International Labour Organisation and to avoidance of mandates that could weaken critical WTO disciplines, such as the Sanitary and Phytosanitary Agreement.
The subsequent Ministerial Conference was held in Cancun, Mexico, from 10 to 14 September 2003 to take stock of progress in the round and provide any necessary political guidance. The conference failed to reach agreement on key issues, however. It was agreed, therefore, that the WTO General Council in Geneva would meet at senior officials' level no later than 15 December 2003 to take the action necessary to enable negotiations to move towards a successful and timely conclusion. In the absence of a consensus at this meeting, chair Perez del Castillo outlined areas where agreement looked possible and suggested the way forward, based on his consultations with members in the previous three months. It was left to incoming negotiating groups, formed in February 2004, to take the issues further
The World Bank group consists of five closely-associated financial institutions: the International Bank of Reconstruction and Development (IBRD), the International Development Association (IDA), the International Finance Corporation (IFC), the Multilateral Investment Guarantee Agency (MIGA) and the International Centre for the Settlement of Investment Disputes (ICSID). New Zealand is a member of the IBRD, the IDA, the IFC and the ICSID.
The common objective of the institutions is to fight poverty and to improve living standards in developing countries by financing specific country-based and regional activities. These cover sectors such as health, education, social development, private sector development, gender, environment, and infrastructure development. Total new lending in the 2003 financial year was approximately US$18.5 billion.
The IDA provides highly concessional resources to low-income countries and US$7.3 billion was lent in 2003, compared with US$4.4 billion in 2000. New Zealand makes contributions to periodic replenishments of the IDA and in 2001 New Zealand made a commitment of NZ$36.5 million, payable over six years, amounting to a 0.12 percent share of total donor funding. New Zealand is currently participating in negotiations to contribute to the next replenishment.
New Zealand has also contributed approximately NZ$6 million to the IDA and International Monetary Fund (IMF) trust fund for Heavily Indebted Poor Countries (HIPC). These trusts give resources to heavily indebted poor countries to help relieve their debt servicing burdens to the IMF and the IDA. Twenty-six of the 38 countries eligible for debt relief currently receive assistance.
The Asian Development Bank (ADB) is a regional development bank established in 1965. It has 63 members, of which 45 are in Asia and the Pacific. The ADB's goal is to reduce poverty in the region through sustainable economic growth, social development and good governance. New Zealand holds 54,340 shares in the ADB, about 1.56 percent of the bank's voting share.
New Zealand also makes contributions to the periodic replenishment of the ADB's Asian Development Fund (ADF), the bank's concessional lending facility for its poorest developing member countries.
In November 2000, the New Zealand Government approved a contribution of NZ$39.6 million payable over seven years. The total replenishment level was US$2.79 billion, to be shared among 25 donors. The contribution represented an increase in New Zealand's share of the total replenishment from 0.65 percent to 0.7 percent and was partly based on an increasing level of responsiveness from the bank to meeting the development needs of Pacific developing member countries. New Zealand is currently participating in negotiations to contribute to the next replenishment.
The Commonwealth has 53 member countries representing approximately 1.7 billion people across the globe. New Zealand was a founding member of the Commonwealth in 1931 and has long been involved in a wide range of Commonwealth activities - the Empire or Commonwealth Games have been held in New Zealand three times.
Commonwealth policies and activities are decided at biennial meetings of Commonwealth Heads of Government (CHOGM). New Zealand was host to CHOGM in 1995.
Most activities are executed through the Commonwealth secretariat in London. Former New Zealand Minister of Foreign Affairs and Trade Don McKinnon was appointed Commonwealth Secretary-General in 1999 and re-elected for a second term in 2003.
New Zealand is the sixth largest contributor to the Commonwealth secretariat by volume and one of the eight largest contributors to combined Commonwealth funds. New Zealand actively promotes the Commonwealth's core beliefs and principles. Since 1992, New Zealanders have participated in numerous missions to observe elections in member countries, including South Africa in 1994, Zimbabwe in 2000 and 2002, Fiji in 2001 and Pakistan in 2002. The Commonwealth Ministerial Action Group (CMAG) functions as the Commonwealth's watchdog on democracy and was established in Millbrook, New Zealand, in 1995. New Zealand served on CMAG from 1995 to 1999. Countries currently on CMAG's agenda are Pakistan (suspended from the councils of the Commonwealth since 1999) and Fiji.
The Organisation for Economic Co-operation and Development (OECD) - which New Zealand joined in 1973 - is a forum for democratic and market-oriented economies to study and develop economic, social, environment and development policies with the ultimate aim of fostering prosperity and sustainable development.
The OECD works on almost all of the key economic, social and development issues on the international agenda. Its work programme includes projects on growth and innovation, agricultural policy reform, employment and social inclusion, sustainable development, ageing populations, education, information and communications technology, health care issues, and global trade liberalisation. Its staff are among the world's leading authorities in many of these areas.
Based in Paris, the OECD has 30 members: Australia, Austria, Belgium, Canada, Czech Republic, Denmark, Finland, France, Germany, Greece, Hungary, Iceland, Ireland, Italy, Japan, Korea, Luxembourg, Mexico, Netherlands, New Zealand, Norway, Poland, Portugal, Slovak Republic, Spain, Sweden, Switzerland, Turkey, United Kingdom and the United States.
The OECD has extensive cooperation programmes with key non-member countries, including China, Russia and Latin American countries. Also of central importance is its programme of contact with non-government organisations and the broader society to explain how the OECD's goals and activities are designed to promote the economic well-being of all citizens in both developed and developing countries.
In April 2003, New Zealand Prime Minister Helen Clark chaired the OECD's highest level annual meeting, the Ministerial Council.
New Zealand is a member of the International Energy Agency (IEA), an autonomous body within the OECD framework. The primary focus of the IEA is on oil security among members, but its programme embraces a wide range of energy issues. New Zealand is also a member of the Financial Action Task Force (FATF), an independent body housed in the OECD dedicated to combating money laundering and terrorist financing.
Tokelau consists of three small atolls in the South Pacific - Atafu, Fakaofo and Nukunonu - with a combined land area of 12 square kilometres and a population of about 1,500. The central atoll, Nukunonu, is 92 kilometres from Atafu and 64 kilometres from Fakaofo. Western Samoa is 480 kilometres to the south.
The British Government transferred administrative control of Tokelau (then known as the Union Islands) to New Zealand in 1925. Formal sovereignty was transferred to New Zealand in 1948 by an act of the New Zealand Parliament. New Zealand statute law, however, does not apply to Tokelau unless it is expressly extended. In practice, no New Zealand legislation is extended to Tokelau without its consent.
Tokelau is listed as a non self-governing territory for the purposes of the self-determination principles of the United Nations charter. This status was confirmed in 1962 when New Zealand added Tokelau to the schedule of territories under supervision of the United Nations Special Committee on Decolonisation.
The main objective of New Zealand's relationship with Tokelau is that of fostering a greater degree of self-government and economic self-sufficiency for the people in fulfilment of New Zealand's responsibilities under the United Nations charter and general assembly resolutions covering decolonisation and the transmission of information.
The Administrator of Tokelau is appointed by the Minister of Foreign Affairs and Trade and is responsible for administration of the executive government of Tokelau. Under a programme of constitutional change agreed in 1992, the role of Tokelau's political institutions have been better defined and expanded. This process was formalised in January 1994 by delegation of the administrator's powers to the General Fono (National Parliament), and the Council of Faipule (now the Council for Ongoing Government) when the General Fono is not in session.
In 1996, the formal step of devolving legislative power was taken. With passage of the Tokelau Amendment Act 1996 by the New Zealand parliament, the General Fono has been able, since 1 August 1996, to exercise rule-making power. This power has been used primarily to manage major economic activities in Tokelau and for financial management of Tokelau's accounts.
The Faipule are leaders of their respective villages (one on each atoll) and the ministerial portfolios they hold represent an extension of their formal responsibility. Traditionally, each village has been largely autonomous. This was confirmed by the Tokelau Village Incorporation Regulations 1986, giving legal recognition to each village and granting it independent law-making power.
As part of the recent Modern House of Tokelau Project, the administrator's powers were delegated from the General Fono to the three village councils (Taupulega) in June 2004. The aim of the delegation to village council was to put in place a governance system that was functional in the local setting, blending the modern with the traditional. The challenge was to devise a structure which properly establishes the village as the focus of social and economic activities, that delivers services within the village, and that integrates traditional decision-making processes with modern advice and support.
A review of Tokelau public services carried out in 2003 has seen agreement by the General Fono to shift responsibility for public services away from the national office in Apia back to the three atolls. Village councils and public service agencies will work closely to ensure a good standard of public service delivery is maintained on the atolls. The national office in Apia will be restructured to enhance its capability to deliver services on a national basis, and to provide a liaison point for international issues.
In October 2003, the General Fono instituted a number of constitutional and law changes, including the decision that the Council of Faipule would be renamed the Tokelau Council for Ongoing Government. The new council comprises six members, the three Faipule and the three Pulenuku (village mayors). The position of Ulu o Tokelau (Leader of Tokelau) will continue to rotate on a yearly basis among the three Faipule. The General Fono has also agreed to formally explore the option of Tokelau seeking self-determination in free association with New Zealand.
Tokelau's development prospects are restricted by its small land area and population, its geographic isolation and by the relatively high cost in these circumstances of providing education, health and other services to the three widely separated communities. For these reasons, Tokelau relies substantially on external financial support, primarily from New Zealand.
Nonetheless, the development of government structures at the national and village levels has promoted a clear wish for Tokelau to be self-reliant to the greatest extent possible and on 1 July 2003, control of Tokelau's budget was handed over to the General Fono.
The Ross Dependency consists of the land, permanent ice-shelf and islands of Antarctica below 60° South and between 160° East to 150° West. New Zealand's Antarctic territory, therefore, comprises the Ross Ice Shelf, the Balleny Islands, Scott Island, and the landmass and adjacent islands within these longitudes to the point of their convergence at the South Pole. The land is almost entirely covered by ice and is uninhabited except for people conducting or supporting scientific research programmes. New Zealand operates a permanent scientific research station, Scott Base, on Ross Island in the dependency. New Zealand has exercised jurisdiction over the dependency since 1923, when an Imperial Order-In-Council vested in the New Zealand Governor-General executive and legislative power in respect of the dependency.
New Zealand has committed to the international governance of Antarctica through the Antarctic Treaty System (ATS), which consists of the 1959 Antarctic Treaty and associated agreements. The treaty system's primary purpose is to ensure Antarctica is used only for peaceful purposes and that it does not become the scene or object of international discord. It designates Antarctica as ‘a natural reserve, devoted to peace and science,’ promotes international scientific cooperation and bans mining, the dumping of nuclear waste and the deployment of military personnel (except in support of peaceful purposes) in Antarctica. Membership of the ATS has grown from the 12 original signatories of the treaty (of which New Zealand was one) to 45 parties, 27 of which have consultative or decisionmaking status. The Antarctic Treaty parties meet regularly to consider issues within its framework, such as scientific and logistic cooperation and environmental protection measures. Anyone seeking to carry out activities in the Ross Dependency, or who depart for Antarctica from New Zealand (notwithstanding their nationality) are required to prepare Environmental Impact Assessments (EIAs) under the Antarctica (Environmental Protection) Act 1994. On the basis of the EIA, the Minister of Foreign Affairs and Trade decides whether the activity may proceed. Permits must also be obtained for certain types of Antarctic activities. Official expeditions of governments which are parties to the Antarctic Treaty are exempt from these requirements.
Fishing in the Ross Sea is conducted consistent with conservation measures adopted by the Commission for the Conservation of Antarctic Marine Living Resources, based in Hobart. New Zealand has conducted exploratory fishing for toothfish in the Ross Sea since 1997.

A No 40 Squadron Hercules delivers supplies to Antarctica.
The Governor-General of New Zealand, as Commander-in-Chief of New Zealand, is empowered to raise and maintain New Zealand Naval Forces, the New Zealand Army and the Royal New Zealand Air Force.
These forces, together with civilian employees, constitute the New Zealand Defence Force (NZDF).
The Minister of Defence has power of control of the New Zealand Defence Force, which is exercised through the Chief of Defence Force. The Chief of Defence Force is the principal military adviser to the minister and is responsible for carrying out the functions and duties of the NZDF, the general conduct of the NZDF, managing its activities and resources, and chairing the Chiefs of Staff Committee.
The Secretary of Defence is the principal civilian adviser on defence matters to the Minister of Defence and to the government.
The military and civilian advisory roles are complementary. There is considerable overlap on defence, security and New Zealand Defence Force capability issues and this requires close cooperation and consultation between the Ministry of Defence and the New Zealand Defence Force. This coordination takes place on a regular basis through the Office of Chief Executives, which brings the Secretary of Defence and the Chief of Defence Force together to discuss policy issues of mutual interest, and on the Executive Governance Boards, which oversee major New Zealand Defence Force capital equipment and infrastructure projects.
The New Zealand Government's defence policy objectives are set out in The Government's Defence Policy Framework released in June 2000. The five key objectives for New Zealand's defence policy are:
To defend New Zealand and to protect its people, land, territorial waters, exclusive economic zone, natural resources and critical infrastructure.
To meet New Zealand's alliance commitments to Australia by maintaining a close defence partnership in pursuit of common security interests.
To assist in the maintenance of security in the South Pacific and to provide assistance to New Zealand's Pacific neighbours.
To play an appropriate role in the maintenance of security in the Asia-Pacific region, including meeting New Zealand's obligations as a member of the Five Power Defence Arrangements.
To contribute to global security and peacekeeping through participation in the full range of United Nations and other appropriate multilateral peace support and humanitarian relief operations.
The framework foreshadowed the government's plan to build a modern, professional and well-equipped defence force with the military capabilities necessary across all three services to meet New Zealand's objectives. Figure 4.03 shows New Zealand's principal defence force locations.
The government's blueprint for the New Zealand Defence Force was outlined in The Government Defence Statement - A Modern, Sustainable Defence Force Matched to New Zealand s Needs (8 May 2001).
Key components of the blueprint are:
Joint approaches to structure and operational orientation.
A modernised army.
A practical navy fleet matched to New Zealand's wider security needs. A refocussed and updated air force.
A funding commitment.
The New Zealand Defence Force is being reconfigured so that it is sustainable and affordable over the long term. A key aim is to enhance the capabilities of the force across all three services to undertake a range of combat and peace support operations. The government has taken decisions on a number of projects including:
The P-3 Orion maritime patrol aircraft mission systems upgrade, and communications and navigation systems upgrades.
The C-130 Hercules transport aircraft life extension, and communications and navigation systems upgrades.
Acquiring Boeing 757 aircraft to replace Boeing 727 aircraft.
Direct fire support weapons (automatic grenade launchers).
Medium range anti-armour weapon (Javelin missiles).
New ships for the navy.
This will improve the ability of the New Zealand Defence Force both to defend New Zealand's interests and to contribute effectively to international and regional peace and security.
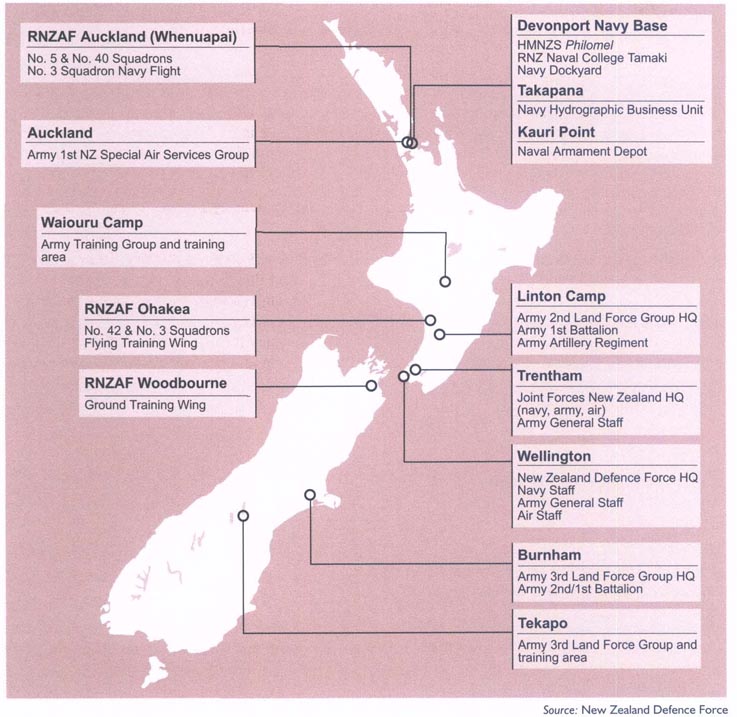
While New Zealand may not face a direct military threat from another country in the foreseeable future, its interests continue to face a wide range of security challenges. Not all of these challenges are of a military nature. This has been underlined by the terrorist attacks on 11 September 2001, the Bali bombings on 12 October 2002, and subsequent bombings, including those in Jakarta.
The deployment of New Zealand Defence Force personnel to various trouble spots around the world is the most tangible sign of New Zealand's commitment to international peace and security. During 2003, New Zealand Defence Force elements were deployed to Afghanistan, the Arabian Sea and the Gulf of Oman in the fight against terrorism. New Zealand Defence Force personnel were also deployed to Iraq to assist with post-war reconstruction and rehabilitation efforts and to the Solomon Islands as part of the Regional Assistance Mission to the Solomon Islands. This was in addition to longer-standing commitments in the Middle East, the Balkans and Africa.
Five Power Defence Arrangements. Concern about future security arrangements in the region led to the establishment in 1971 of the Five Power Defence Arrangements (FPDA) involving New Zealand, Australia, Singapore, Malaysia and the United Kingdom. Consultative in nature, the arrangements aim to contribute to the security of Malaysia and Singapore and to the long-term stability of the region. Members take part in a wide-ranging exercise programme that seeks to strengthen the ability of their armed forces to operate with each other. Defence ministers and defence chiefs meet regularly and there is a range of other exchanges. The exercises and contacts which New Zealand has with Malaysia and Singapore and the other partners is an important part of the New Zealand Defence Force's training programme, and one which has expanded significantly in recent years. On the occasion of the 30th anniversary of the FPDA in 2001, the five member countries reaffirmed their commitment to FPDA, recognising the important contribution it continues to make towards enhancing regional security.
Mutual Assistance Programme. Most South Pacific countries and some members of the Association of South-East Asian Nations (ASEAN) participate in the New Zealand Defence Force's Mutual Assistance Programme. The programme is a practical demonstration of New Zealand's commitment to regional security. Through training cooperation and advisory assistance, the programme contributes to the effectiveness of defence and disciplined forces in New Zealand's South Pacific neighbourhood. The programme also supports development projects in the South Pacific by using the engineering and trade skills of the armed forces. Training is provided in New Zealand, and training and technical teams are deployed overseas. Military instructors are attached to other armed forces for periods of up to two years in the Cook Islands, Tonga, Vanuatu and Malaysia.
Australia. There is no strategic partnership closer than that between Australia and New Zealand. The two countries are bound together by geography and history, by shared values, beliefs and interests, and by the close relationships between their people. The security relationship between Australia and New Zealand is embodied in the concept of Closer Defence Relations (CDR), adopted in 1991 and realised through a programme of cooperative activities designed to give the relationship enhanced practical effect.
ANZUS. The ANZUS security treaty between Australia, New Zealand and the United States came into force in 1952. However, the United States is not prepared to accept restrictions over access to New Zealand ports by nuclear powered or armed ships of the United States Navy and the ANZUS Council has not met since 1984.
Liaison with other countries. To facilitate exchanges on military matters, defence representatives are posted to many of New Zealand's diplomatic missions, with some of those representatives also accredited to other countries. A number of countries have service representatives attached to their diplomatic missions in Wellington or have service attaches accredited to, but not resident in, New Zealand.
United Nations Truce Supervision Organisation (UNTSO). New Zealand military observers have worked with UNTSO in Israel and neighbouring countries since 1954. They help monitor ceasefires, supervise armistice agreements, prevent isolated incidents from escalating and assist subsequent peacekeeping operations. New Zealand has seven military observers stationed in Israel and Syria with UNTSO.
Cambodian Mine Action Centre. The Cambodian Government set up this demining training centre with the assistance of outside agencies. New Zealand provides a military logistics technical adviser and a military training technical adviser to the programme.
Mozambique Accelerated Demining Programme (MADP). New Zealand's commitment to demining efforts in Mozambique began in 1994 and it currently provides two military demining experts, including the chief technical adviser.
Multinational Force and Observers (MFO), Sinai. This force was established in April 1982 to verify compliance with the terms of the 1979 peace treaty between Egypt and Israel. Nine countries contribute to the MFO, including New Zealand, whose 26-strong contingent comprises a training and advisory team, a heavy transport section, engineers and staff officers.
Former Yugoslavia. The New Zealand Defence Force contributes seven staff officers to fill a range of appointments in the British forces headquarters within the Stabilisation Force (SFOR) in Bosnia. A contingent of 20 more personnel serves with various British units assigned to SFOR on a tour of duty during April to September in Bosnia each year.
The New Zealand Defence Force also maintains two military liaison officers and observers in the former Yugoslavia. One military observer is deployed in Croatia with the United Nations Mission Of Observers in Prevlaka and a military liaison officer is deployed with the United Nations Interim Administration in Kosovo.
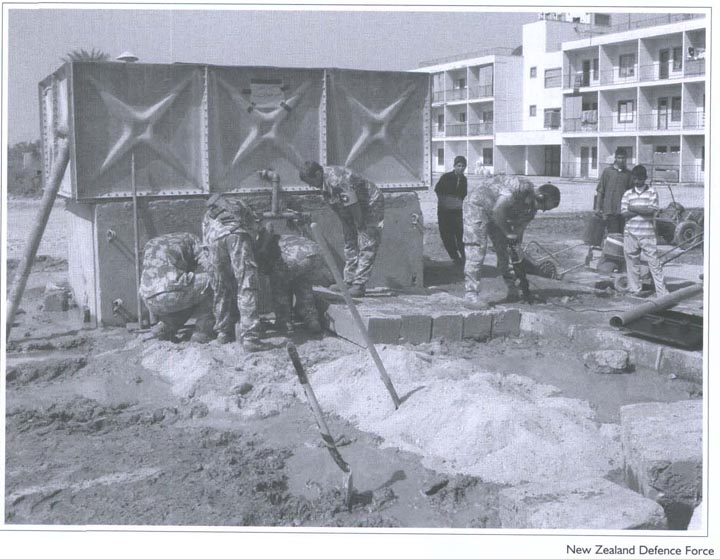
New Zealand Defence Force engineers restore water supplies in Al Mufayat, Iraq.
United Nations Mission in Sierra Leone (UNAMSIL). New Zealand has contributed two military observers to this mission since June 1998.
East Timor. In mid-1999, the Indonesian Government agreed to hold a plebiscite in East Timor to decide the fate of the region. The United Nations Assistance Mission in East Timor (UNAMET), to which New Zealand provided civilian police and military personnel, was established to oversee the election process.
Following the failure of UNAMET to stop violence in East Timor, the United Nations agreed to sanction a multinational force, INTERFET, to restore order until a United Nations-mandated force could be established.
New Zealand deployed ground troops, a helicopter detachment and naval units in support of INTERFET. The ground troops and the helicopter detachment were subsumed into the United Nations Interim Administration in East Timor (UNTAET) in January 2000.
In May 2002 UNMISET, the successor to UNTAET, stood up. This signalled reductions in the New Zealand troop contribution to Timor Leste. Currently, a small contingent of military observers -approximately 16 at any one time - continue to serve with UNMISET.
Regional Assistance Mission to the Solomon Islands (RAMSI). The RAMSI was deployed to the Solomon Islands following an invitation from Prime Minister Kanaleeza in July 2003.
The RAMSI is an Australian-led mission comprising Australian, Papua New Guinean, Fijian, New Zealand and Tongan foreign affairs and trade representatives, elements of the Australian Defence Force, the New Zealand Defence Force and police officers from Australia, New Zealand and the Pacific Islands.
Headquarters of the RAMSI is in Honiara and team sites are situated primarily on the islands of Guadalcanal and Malaita. The mission provides the framework for stabilising the security situation in the Solomon Islands. New Zealand initially contributed 230 personnel to the mission.
Casualties. There have been five fatalities among New Zealand Defence Force personnel serving in United Nations observer and peacekeeping missions.
Iraq. New Zealand Prime Minister Helen Clark announced on 1 August 2003 that New Zealand Defence Force engineers would be deployed to work alongside United Kingdom forces in southern Iraq. The deployment, for an initial period of 12 months, was to undertake humanitarian and reconstruction tasks consistent with United Nations Security Council resolutions and with New Zealand's policy position.
New Zealand Cadet Forces. Cadet forces comprise the Sea Cadet Corps, Air Training Corps and the New Zealand Cadet Corps. These are community-based youth groups who receive assistance from the New Zealand Defence Force and support from the Sea Cadet Association of New Zealand, the Air Training Corps Association of New Zealand, the Cadet Corps Association of New Zealand, community organisations and the Royal New Zealand Returned Services' Association.
There were 105 active cadet units at 30 June 2003 with a total strength of 3,300 cadets and 308 officers, compared with 103 units and a total strength of 3,225 cadets and 325 officers at 30 June 2002. The decline in officer strength is attributed to a change in the commissioning process where applicants now receive their commission on successful completion of the commissioning course.
Limited Service Volunteer Scheme. Limited service volunteer training courses have been run by the army at Burnham Camp since 1995, with additional staffing support provided by the navy and air force since 1998. The programme provides young unemployed volunteers with six weeks of residential motivational training, utilising the military culture and environment, outdoor activities and general life skills subjects.
Four hundred volunteers successfully completed training courses in the year ending 30 June 2003, compared with 500 in the previous year.
Disaster relief. The New Zealand Defence Force provides assistance in the wake of natural disasters in the South Pacific. Assistance can include post-disaster reconnaissance of damage levels; transportation of relief supplies, food and medical supplies; and engineering and communications services.
Fisheries protection. Royal New Zealand Air Force Orion aircraft patrol the New Zealand 200-mile Exclusive Economic Zone. Information from surveillance patrols is passed to the Ministry of Fisheries. Fisheries officers are sometimes aboard aircraft when patrols are conducted. The air force conducted numerous patrols in the New Zealand area and several patrols in the South Pacific during 2003 and 2004.
Search and Rescue. All three New Zealand Defence Force services maintain a search and rescue capability, with naval and air units on 24-hour standby. The navy and air force assist in extensive sea searches, while the army and the air force assist police in land searches and rescues. The air force also carries out emergency medical evacuations throughout New Zealand, the South Pacific and Antarctica.
Operation Antarctica. Eighty-nine New Zealand Defence Force personnel support Operation Antarctica in terminal and logistic support operations at Harewood in Christchurch, McMurdo Station Other assistance. Other assistance provided by the New Zealand Defence Force includes transportation of Department of Conservation personnel to New Zealand's outlying islands, ceremonial support for state occasions, helicopter and logistic support to the police, assistance with rural fire fighting, explosive ordnance disposal and support during national civil defence emergencies.

A navy Seasprite helicopter winches people off HMNZS Endeavour during a search and rescue exercise.
Defence funding is voted by parliament to two organisations, the New Zealand Defence Force under the Chief of Defence Force, and the Ministry of Defence under the Secretary of Defence.
Total expenditure by the two organisations is consolidated in Table 4.02. Table 4.03 compares New Zealand's defence expenditure internationally. Table 4.04 shows numbers of defence force personnel.
Table 4.02. Defence expenditure
Years ending 30
June
| Item | 2000 | 2001 | 2002 | 2003 |
|---|---|---|---|---|
- nil or zero Source: New Zealand Defence Force | ||||
| $(000) | ||||
| Personnel | 533,437 | 521,191 | 528,721 | 526,104 |
| Operating | 379,627 | 420,149 | 428,185 | 441,505 |
| Depreciation | 196,611 | 218,601 | 209,458 | 211,402 |
| Capital charge | 320,550 | 332,317 | 266,668 | 261,902 |
| Other expenses | 76,952 | 103,369 | - | 23,414 |
| Total output expenses | 1,507,177 | 1,595,627 | 1,433,032 | 1,464,327 |
| Less - | ||||
| Revenue | (30,432) | (31,834) | (24,059) | (21,166) |
| Surplus/(deficit) | (77,924) | (102,716) | 2,431 | (16,708) |
| Subtotal | (108,356) | (134,550) | (21,628) | (37,874) |
| Crown revenue provided | 1,398,821 | 1,461,077 | 1,411,404 | 1,426,453 |
Table 4.03. International comparison of defence expenditure
| Country | Proportion of GDP | |||||||
|---|---|---|---|---|---|---|---|---|
1Estimated. 2 Year ending 30 September. US budget definition differs from NATO definition. 3 Years ending 31 March. 4 Years ending 30 June. 5 Using NATO definition, excluding GST, capital charge and war pensions. Source: New Zealand Defence Force | ||||||||
| Percent | ||||||||
| United States2 | 3.9 | 3.4 | 3.2 | 3.0 | 2.9 | 3.2 | 3.1 | 3.4 |
| United Kingdom3 | 3.4 | 3.1 | 3.0 | 2.7 | 2.7 | 2.5 | 2.4 | 2.4 |
| Australia4 | 2.2 | 2.1 | 2.0 | 1.9 | 1.9 | 1.8 | 1.9 | 2.0 |
| Sweden4 | 2.6 | 2.5 | 2.3 | 2.3 | 2.1 | 2.2 | 2.9 | 1.8 |
| Canada3 | 1.6 | 1.5 | 1.3 | 1.2 | 1.3 | 1.2 | 1.1 | 1.2 |
| New Zealand4 | 1.4 | 1.3 | 1.4 | 1.4 | 1.15 | 1.15 | 1.15 | 1.25 |
Table 4.04. Defence personnel
At 30
June
| Year | Navy | Army | Air force | Total | Civilians (NZDF and MOD) |
|---|---|---|---|---|---|
| Source: New Zealand Defence
Force Ministry of Defence | |||||
| 1994 | 2,188 | 4,516 | 3,368 | 10,072 | 2,513 |
| 1995 | 2,152 | 4,510 | 3,296 | 9,958 | 2,024 |
| 1996 | 2,074 | 4,349 | 3,188 | 9,611 | 2,103 |
| 1997 | 2,080 | 4,391 | 2,991 | 9,462 | 2,243 |
| 1998 | 2,104 | 4,431 | 2,991 | 9,526 | 2,195 |
| 1999 | 2,080 | 4,417 | 2,885 | 9,382 | 1,912 |
| 2000 | 1,967 | 4,513 | 2,786 | 9,266 | 1,936 |
| 2001 | 1,893 | 4,580 | 2,624 | 9,097 | 1,877 |
| 2002 | 1,911 | 4,492 | 2,194 | 8,597 | 1,879 |
| 2003 | 1,969 | 4,388 | 2,245 | 8,602 | 1,923 |
Command and administration. The Chief of Navy exercises full command of the navy. However, the fleet is tasked by the Commander Joint Forces New Zealand through the Maritime Component Commander based at Headquarters Joint Forces New Zealand, at Trentham. The Deputy Chief of Navy, based at the Naval Staff, in Wellington, is responsible to the Chief of Navy for the navy's ‘raise, train and maintain’ functions.
Shore establishments. The naval base at Devonport, Auckland, collectively titled HMNZS Philomel, consists of the navy's main naval barracks, wharf facilities, weapon ranges and administrative units; the Royal New Zealand Naval College, which is the navy's training establishment; the naval hospital; and the naval supply and armament depots. The base also contains the naval dockyard, which is a comprehensive engineering and support facility managed under a commercial management agreement. HMNZS Wakefield is the administrative unit for naval personnel in the Wellington area. There are four Royal New Zealand Naval Volunteer Reserve units in the main centres - HMNZS Ngapona in Auckland, HMNZS Olphert in Wellington, HMNZS Pegasus in Christchurch and HMNZS Toroa in Dunedin. There is also a Port Headquarters in Tauranga. Table 4.05 lists the navy's ships and helicopters and Table 4.06 on page 70 shows navy personnel from 1997 to 2003.
Table 4.05. State of the navy
| Ship/helicopter type | Name | Force |
|---|---|---|
Note:In early 2002 the government allocated $500m for the purchase of a multi role vessel (MRV), two or three offshore patrol vessels (OPV), and a number of Inshore Patrol Vessels (IPV). The MRV will replace the frigate Canterbury, which is due to be decommissioned in 2005. Source: New Zealand Defence Force | ||
| ANZAC class frigates | Te Kaha | Naval combat |
| Te Mana | Naval combat | |
| Leander class frigate | Canterbury | Naval combat |
| Logistics (fleet replenishment) | Endeavour | Naval support |
| Survey ship | Resolution | Hydrographic support |
| Diving support ship | Manawanui | Diving support |
| Training tender | Kahu | Sea training |
| Inshore patrol craft | Hinau | Mine countermeasure |
| Kiwi | Mine countermeasure | |
| Wakakura | Mine countermeasure | |
| Moa | Mine countermeasure | |
| Kaman Seasprite SH-2G helicopters x 5 | Seaprite | Naval aviation |

HMNZS Te Kaha's two RHIBs (Ridged Hull Inflatable Boats) in a training exercise off the New Zealand coast.
Table 4.06. Strength of the navy
At 30
June
| Category | 1997 | 1998 | 1999 | 2000 | 2001 | 2002 | 2003 |
|---|---|---|---|---|---|---|---|
- nil or zero Source: New Zealand Defence Force | |||||||
| Regular force (all ranks) | 2,080 | 2,104 | 2,080 | 1,967 | 1,893 | 1,918 | 1,978 |
| Royal New Zealand Naval Volunteer Reserve (all ranks) | 395 | 397 | 401 | 385 | 385 | 357 | 354 |
| Total uniformed | 2,475 | 2,501 | 2,481 | 2,352 | 2,278 | 2,275 | 2,332 |
| Civilian employees | - | - | 524 | 453 | 434 | 444 | 441 |
| Total navy | 2,475 | 2,501 | 3,005 | 2,805 | 2,712 | 2,719 | 2,773 |
The New Zealand Army is organised, equipped and trained to provide a flexible range of units and sub-units up to a deployable battalion group. It can respond to lower level contingencies in the region, or serve as a New Zealand contribution to a collective force, including a United Nations force.
The Chief of Army (CA), under the Chief of Defence Force (CDF), retains full command of the army. The CA is assisted in fulfilling his statutory command requirements by the Army General Staff (Army GS). The Army GS has both a policy formulation and a policy implementation role.
The Land Component Commander (LCC), under the Commander Joint Forces New Zealand (COMJFNZ), commands operational elements of the army. The LCC, through the COMJFNZ, is assigned operational command of the 2nd Land Force Group, with headquarters at Linton, and the 3rd Land Force Group, with headquarters at Burnham, and commands all regular and territorial force units, with the exception of those elements assigned to the Army Training Group (ATG). The ATG, primarily based in Waiouru, reports directly to Army GS and is responsible for the majority of individual training conducted within the army.
Army specialist units, based at Auckland and Trentham, include a Special Air Services Group and a Military Police Company, and are commanded directly by the LCC.
Table 4.07. State of the army
| HQ/unit | Locations | Role |
|---|---|---|
Note: CSSCombat Service Support, CS Combat Support, TF Territorial Force. Source: New Zealand Defence Force | ||
| Army General Staff | Wellington | Command |
| HQ Joint Forces NZ | Trentham | Command |
| 1 NZ Special Air Services Group | Auckland | Special forces |
| Force Military Police Company | Trentham | CSS |
| HQ 2 Land Force Group | Linton | Command |
| 16 Field Regiment | Linton | CS |
| Queen Alexandra's Mounted Rifles (Armoured Personnel Carriers) | Waiouru | Combat |
| 1 Royal NZ Infantry Regiment | Linton | Combat |
| Auckland Northland Regiment | Auckland | TF |
| Wellington West Coast Taranaki Regiment | Wanganui | TF |
| Hauraki Regiment | Tauranga | TF |
| Wellington Hawke's Bay Regiment | Napier | TF |
| 2 Engineer Regiment | Linton | CS |
| 2 Signals Squadron | Linton | CS |
| Force Intelligence Group | Trentham | CS |
| 2 Logistics Battalion | Linton | CSS |
| 2 Health Services Battalion | Linton | CSS |
| HQ 3 Land Force Group | Burnham | Command |
| 2/1 Royal NZ Infantry Regiment | Burnham | Combat |
| Canterbury Nelson Marlborough West Coast Regiment | Burnham | TF |
| Otago Southland Regiment | Dunedin | TF |
| 3 Field Troop | Burnham | CS |
| 3 Signals Troop | Burnham | CS |
| 3 Logistics Battalion | Burnham | CSS |
| HQ Army Training Group | Waiouru | Command |
| Land Operations Training Centre | Waiouru | Training |
| Army Depot | Waiouru | Training |
| Officer Cadet School | Waiouru | Training |
| Trentham Regional Support Centre | Trentham | Static support |
Table 4.08. Strength of the army
At 30 June
| Category | 1977 | 1998 | 1999 | 2000 | 2001 | 2002 | 2003 |
|---|---|---|---|---|---|---|---|
| Source: New Zealand Defence Force | |||||||
| Regular force | |||||||
| Officers | 715 | 725 | 652 | 731 | 742 | 735 | 732 |
| Other ranks | 3,676 | 3,706 | 3,765 | 3,782 | 3,838 | 3,757 | 3,656 |
| Total | 4,391 | 4,431 | 4,417 | 4,513 | 4,580 | 4,492 | 4,388 |
| Territorial force (all ranks) | 3,680 | 3,394 | 3,085 | 2,474 | 2,159 | 2,158 | 2,031 |
| Total uniformed | 8,071 | 7,825 | 7,502 | 6,987 | 6,739 | 6,650 | 6,419 |
| Civilians | 801 | 768 | 734 | 723 | 643 | 779 | 687 |
| Total army | 8,872 | 8,593 | 8,236 | 7,710 | 7,382 | 7,429 | 7,106 |
Command and administration. The Royal New Zealand Air Force is structured to provide a maritime patrol force, a fixed wing transport force and a rotary wing transport force. The Chief of Air Force, supported by the Air Staff, commands the air force.
Organisation. The Air Component Commander within Headquarters Joint Force New Zealand commands the Royal New Zealand Air Force's deployable operational units. The broad range of activities carried out to raise, train and sustain the operational units of the air force is provided under the direction of the Air Staff. Operational flying units are based at RNZAF Base Auckland and RNZAF Base Ohakea. RNZAF Base Ohakea also hosts primary flying training, while most ground training is done at RNZAF Base Woodbourne.
Logistics. Royal New Zealand Air Force logistics services are coordinated by Air Staff with specific levels of aircraft maintenance and supply support performed by operational squadrons and base logistics units. Much of the deeper level repair and overhaul work is contracted to the private sector in New Zealand and overseas. Most RNZAF training aircraft are maintained and supported by private contractor.
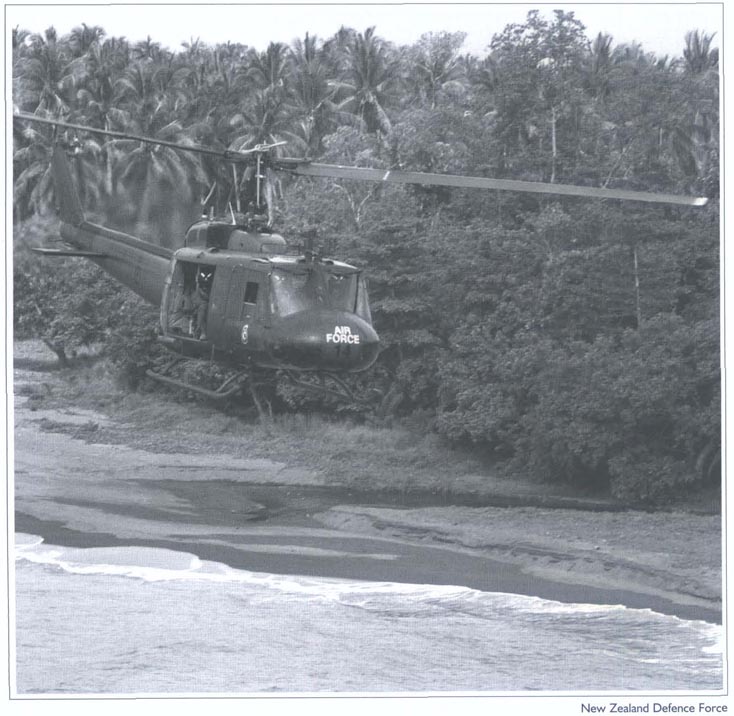
An RNZAF Iroquois helicopter on duty with the Regional Assistance Mission to the Solomon Islands (RAMSI).
Table 4.09 lists air force aircraft and Table 4.10 shows air force personnel from 1997 to 2003.
Table 4.09. State of the air force
| Aircraft | Location | |
|---|---|---|
| Source: New Zealand Defence Force | ||
| 6 Orions | RNZAF Base Auckland | Maritime Patrol Force |
| 2 Boeing 757s | RNZAF Base Auckland | Fixed Wing Transport Force |
| 5 Hercules | RNZAF Base Auckland | Fixed Wing Transport Force |
| 14 Iroquois | RNZAF Base Ohakea | Rotary Wing Transport Force |
| 5 Sioux | RNZAF Base Ohakea | Flying Training |
| 13 CT-4E Air Trainers | RNZAF Base Ohakea | Flying Training |
| 5 King Airs | RNZAF Base Ohakea | Flying Training |
Table 4.1. Strength of the air force
At 30
June
| Category | 1997 | 1998 | 1999 | 2000 | 2001 | 2002 | 2003 |
|---|---|---|---|---|---|---|---|
| Source: New Zealand Defence Force | |||||||
| Regular force | |||||||
| Officers | 640 | 642 | 619 | 596 | 571 | 509 | 508 |
| Other ranks | 2,351 | 2,349 | 2,266 | 2,190 | 2,053 | 1,714 | 1,718 |
| Total | 2,991 | 2,991 | 2,885 | 2,786 | 2,624 | 2,223 | 2,226 |
| Territorial force (all ranks) | 180 | 163 | 163 | 161 | 176 | 157 | 155 |
| Total uniformed | 3,171 | 3,154 | 3,048 | 2,947 | 2,800 | 2,380 | 2,381 |
| Civilians | 560 | 528 | 371 | 384 | 411 | 390 | 412 |
| Total air force | 3,731 | 3,682 | 3,419 | 3,331 | 3,211 | 2,770 | 2,793 |
New Zealand's role in the creation of the United Nations (UN), its opposition to nuclear testing, establishment of a nuclear-free New Zealand, and practical contributions to UN peacekeeping and demining operations, mean that New Zealand's voice on disarmament and arms control is listened to with respect.
New Zealand also exerts influence in cooperation with other like-minded countries, for example through its membership of the New Agenda Coalition (Brazil, Egypt, Ireland, Mexico, New Zealand, South Africa and Sweden), a strong advocate for multilateral progress towards nuclear disarmament.
The Ministry of Foreign Affairs and Trade's Disarmament Division includes five officers responsible for policy and treaty implementation. They prepare advice on disarmament and arms control issues for the Minister for Disarmament and Arms Control, represent New Zealand at international meetings and ensure that New Zealand's international legal obligations are implemented at the national level.
Officers of the ministry based overseas, including an Ambassador for Disarmament, are involved in negotiations and activities with disarmament organisations, mainly in Geneva, Vienna, New York and The Hague.
The government values the views of New Zealand's non-government peace and disarmament groups, whose representatives join official delegations to international meetings to contribute their advice and perspective on the pursuit of New Zealand's disarmament goals.
A statutory body, the Public Advisory Committee on Disarmament and Arms Control (PACDAC) was established under the New Zealand Nuclear Free Zone, Disarmament and Arms Control Act 1987 to:
Advise the Minister of Foreign Affairs and Trade on such aspects of disarmament and arms control matters as it thinks fit.
Advise the prime minister on implementation of the act.
Publish reports on disarmament and arms control matters, and on implementations of the act.
Make recommendations for grants from the Peace and Disarmament Education Trust, established from Rainbow Warrior compensation funds.
PACDAC comprises nine members, including the Minister for Disarmament and Arms Control, who is the chair. The other eight are appointed by the Minister of Foreign Affairs and Trade for three-year terms. PACDAC has recently been exploring ways of supporting conflict prevention/resolution initiatives in the South Pacific.
Inspector-General of Intelligence and Security. The Inspector-General of Intelligence and Security assists the prime minister in the oversight and review of the Security Intelligence Service and the Government Communications Security Bureau.
The inspector-general also ensures that each organisation's activities are lawful, and that any complaints about either of them are independently investigated.
The inspector-general is appointed by the governor-general on the recommendation of the prime minister following consultation with the leader of the opposition.
The New Zealand Security Intelligence Service (NZSIS) is a small government agency with approximately 140 staff, a head office in Wellington and regional offices in Auckland and Christchurch.
Principal functions of the NZSIS are to obtain, correlate and evaluate intelligence relevant to New Zealand's security and to advise ministers on security matters. These functions are outlined in the New Zealand Security Intelligence Service Act 1969 and amendments.
The legislation specifies that the act does not limit the right of people to engage in lawful protest, advocacy or dissent, and that it is not a function of the service to enforce measures of security.
The NZSIS reports directly to the Minister in Charge of the NZSIS, traditionally the prime minister, and the director is required by legislation to also consult regularly with the leader of the opposition, to keep him or her informed about matters relating to security.
The service is subject to oversight and review by the Inspector-General of Intelligence and Security, and by parliament's intelligence and security committee.
Responsible to the prime minister, the Government Communications Security Bureau (GCSB) provides information, advice and assistance to the New Zealand Government, government departments and organisations.
The GCSB is subject to oversight and review under the Intelligence and Security Committee Act 1996 and the Inspector-General of Intelligence and Security Act 1996.
Its functions are:
Communications security and computer security-protecting information that is processed, stored or communicated by electronic or similar means, including formulation of communications security and computer security policy; promulgation of standards and provision of material, advice and assistance to government departments and authorities, including the New Zealand armed forces, on matters related to the security and integrity of official information, the loss or compromise of which could adversely affect national security; provision of advice as required by government departments and authorities in relation to official information which, although unrelated to national security, requires protection from disclosure to protect the functions of government, and for privacy, safety and commercial reasons.
Critical infrastructure protection-provision of warnings, guidance and coordination of the national response to IT-based threats to New Zealand's critical infrastructures (ie power, telecommunications, emergency services, banking and finance, transport and government) through operation of a Centre for Critical Infrastructure Protection.
Technical security - providing defence against eavesdropping and other forms of technical attack against New Zealand Government premises worldwide.
Signals intelligence - providing foreign signals intelligence to meet the national intelligence requirements of the New Zealand Government.
The GCSB head office is in Wellington and it operates two communications stations - the Defence Communications Unit, Tangimoana, and the Defence Satellite Communications Unit, Blenheim at Waihopai.
Part of the Department of the Prime Minister and Cabinet, the External Assessments Bureau (EAB) produces intelligence assessments of events and trends overseas to support informed decision making by the government on events or trends likely to influence New Zealand's foreign relations and external interests.
The staff of about 30 identify, collate, evaluate and analyse information collected from a range of sources, and prepare assessments and reports on political, economic, biographic, strategic and scientific matters.
Table 4.11 lists annual expenditure on the three intelligence and security agencies since 1993.
Table 4.11. Expenditure on intelligence and security agencies
Years ending 30 June
| Year | EAB | NZSIS | GCSB |
|---|---|---|---|
| Sources: External Assessments Bureau New Zealand Security Intelligence Service Government Communications Security Bureau | |||
| $(000) | |||
| 1993 | 2,256 | 10,304 | 20,967 |
| 1994 | 2,289 | 9,987 | 19,279 |
| 1995 | 2,121 | 9,964 | 19,498 |
| 1996 | 2,216 | 9,964 | 19,496 |
| 1997 | 2,274 | 10,514 | 18,506 |
| 1998 | 2,287 | 10,583 | 19,083 |
| 1999 | 2,292 | 11,500 | 21,289 |
| 2000 | 2,462 | 10,956 | 19,327 |
| 2001 | 2,541 | 11,690 | 20,119 |
| 2002 | 2,709 | 13,518 | 23,223 |
| 2003 | 3,129 | 16,493 | 29,169 |
4.1 - 4.4 Ministry of Foreign Affairs and Trade.
4.5 New Zealand Defence Force.
4.6 Ministry of Foreign Affairs and Trade.
4.7 Department of the Prime Minister and Cabinet; New Zealand Security Intelligence Service; Government Communications Security Bureau; External Assessments Bureau.
www.asia2000.org.nz - Asia 2000 Foundation of New Zealand
www.vuw.ac.nz - Institute of Policy Studies
www.dpmc.govt.nz - Intelligence and Security
www.defence.govt.nz - Ministry of Defence
www.mfat.govt.nz - Ministry of Foreign Affairs and Trade
www.army.mil.nz - New Zealand Army
www.nzdf.mil.nz - New Zealand Defence Force
www.mfat.govt.nz/nzoda/nzoda.html - New Zealand Official Development Assistance (NZODA)
www.airforce.mil.nz - Royal New Zealand Air Force
www.navy.mil.nz - Royal New Zealand Navy
www.stats.govt.nz - Statistics New Zealand
www.vsa.org.nz - Volunteer Service Abroad
Table of Contents
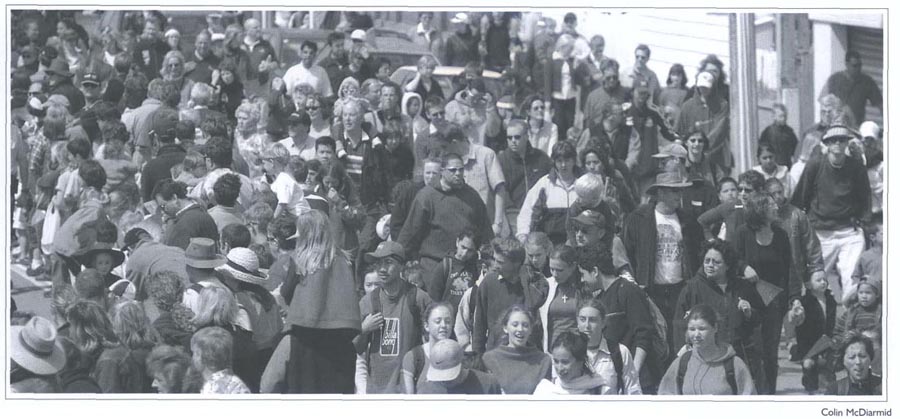
Current projections are for New Zealand's estimated resident population to peak at 4.81 million around 2046.
The population of New Zealand reached 500,000 in 1880, boosted by the introduction of government-assisted immigration. The first million was passed in 1908, following economic recovery from the depression of the 1880s and 1890s. In the aftermath of World War II, the growth rate climbed dramatically, compared with stagnation in the early 1930s, as the baby boom and increased immigration took effect. The second million of population was reached in 1952, 44 years after the first million, and the third was added only 21 years later, in 1973. Nearly 20 percent of the population growth during this period came from net immigration. According to the estimated resident population of New Zealand, the four million milestone was reached in April 2003. Nearly all the population growth from three to four million was due to natural increase, with migration not contributing significantly.
Figure 5.01 compares the historical and projected growth of New Zealand's population to 2051.
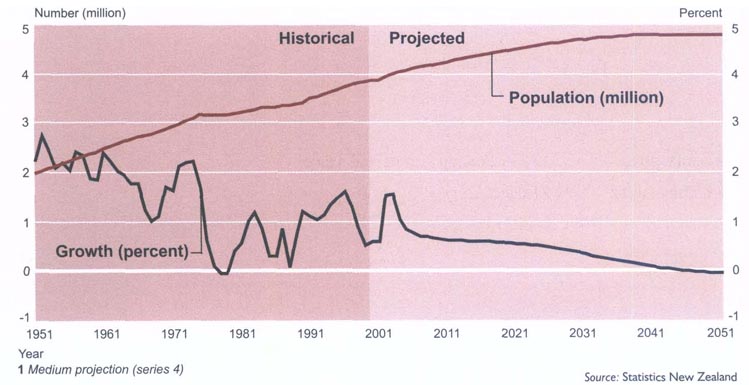
Population trends can be difficult to predict because demographic changes affect and, in turn, are influenced by social, economic, political and other circumstance
However, demographic projections are generally more reliable than other types of forecasts for several reasons. Firstly, despite the range of influences that can impact on it, population change is fundamentally driven by births, deaths and net migration (arrivals minus departures). Secondly, birth and death rates are generally consistent over several years, especially for larger geographical areas, barring major catastrophes, wars or epidemics. Thirdly, three-quarters of New Zealand's population in 20 years time is already living. With the uncertainty of the births component removed, only migration and death can change the live population.
Some broad future trends and structural changes can be identified. For example, population ageing and sub-replacement fertility in New Zealand have raised the prospect of a slow-growth or no-growth environment in coming decades. The entry of large baby boom cohorts into retirement ages after 2010 will result in a burgeoning 65+ population. New Zealand's workforce will take on an older profile. Latest projections also point to greater ethnic diversity in the future, with Maori, Pacific and Asian populations all expected to increase their share of the New Zealand population.
Within the national scene there will be contrasting population changes, with a further concentration of population in the northern North Island likely.
Table 5.01 shows the growth in New Zealand's population as measured by Censuses of Population and Dwellings.
Table 5.01. New Zealand population By census
| Census12 | Population | Intercensal increase | Average annual increase | |
|---|---|---|---|---|
1Omits censuses of 1851, 1864, 1867 and 1871 as censuses of Maori population were not taken in these years. 2Figures from 1981 onwards are census usually resident population counts, replacing census night population counts used previously. ... not applicable Note:All figures randomly rounded to base 3. Source: Statistics New Zealand | ||||
| Number | Number | Percent | Percent | |
| 1858, 24 December | 115,461 | .. | ... | ... |
| 1874, 1 March | 344,985 | ... | ... | ... |
| 1878, 3 March | 458,007 | 113,022 | 32,76 | 7.33 |
| 1881, 3 April | 534,030 | 76,023 | 16.60 | 5.10 |
| 1886, 28 March | 620,451 | 86,421 | 16.18 | 3.06 |
| 1891, 5 April | 668,652 | 48,201 | 7.77 | 1.50 |
| 1896, 12 April | 743.214 | 74,562 | 11.15 | 2.13 |
| 1901, 31 March | 815,862 | 72,648 | 9.77 | 1.90 |
| 1906, 29 April | 936,309 | 120,447 | 14.76 | 2.75 |
| 1911, 2 April | 1,058,313 | 122,004 | 13.03 | 2.52 |
| 1916, 15 October | 1,149,225 | 90,912 | 8.59 | 1.50 |
| 1921, 17 April | 1,271,667 | 122,442 | 10.65 | 2.27 |
| 1926, 20 April | 1,408,140 | 136,473 | 10.73 | 2.06 |
| 1936, 24 March | 1,573,812 | 165,672 | 11.77 | 1.13 |
| 1945, 25 September | 1,702,329 | 128,517 | 8.17 | 0.83 |
| 1951, 17 April | 1,939,473 | 237,144 | 13.93 | 2.37 |
| 1956, 17 April | 2,174,061 | 234,588 | 12.10 | 2.31 |
| 1961, 18 April | 2,414,985 | 240,924 | 11.08 | 2.12 |
| 1966, 22 March | 2,676,918 | 261,933 | 10.85 | 2.11 |
| 1971, 23 March | 2,862,630 | 185,712 | 6.94 | 1.35 |
| 1976, 23 March | 3,129,384 | 266,754 | 9.32 | 1.80 |
| 1981, 24 March | 3,143,307 | ... | ... | ... |
| 1986, 4 March | 3,263,283 | 119,976 | 3.82 | 0.76 |
| 1991, 5 March | 3,373,926 | 110,643 | 3.39 | 0.67 |
| 1996, 5 March | 3,618,303 | 244,377 | 7.24 | 1.41 |
| 2001, 6 March | 3,737,277 | 118,974 | 3.29 | 0.65 |
Projections given in this chapter draw on series 4 of the 2001-base national population projections. These projections assume that New Zealand women will average 1.85 births each (below the 2.1 children required for the population to replace itself without migration); life expectancy at birth will increase by about six years between 2001 and 2051 to reach 82.5 years for males and 86.5 years for females; and there will be a net migration gain of 5,000 people each year from 2007 onwards.
Given this scenario, the New Zealand estimated resident population is projected to pass the 4.5 million mark by 2021 and then peak at 4.81 million around 2046. The population is then projected to slowly decline, as deaths outnumber the combined effect of births and the net migration gain.
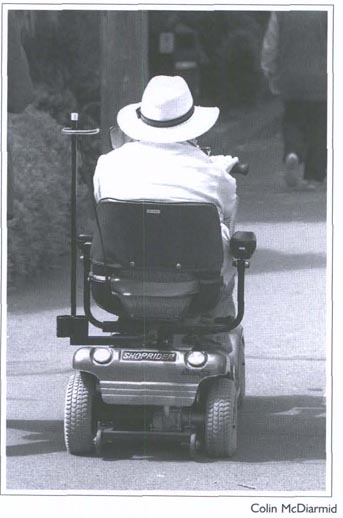
The number of people in New Zealand aged 65 and over is expected to more than double in the 50 years to 2051.
The pace of growth is not likely to be uniform. Growth is expected to average 1.2 percent a year between 2001 and 2006, 0.5 percent a year during the 2020s and just 0.1 percent a year during 2036-2041. The age structure of New Zealand's population will undergo significant changes as a result of past and likely future changes in fertility, improvement in longevity and a change in migration patterns. Overall, the population will take on an older profile. The median age (half the population is younger and half the population is older than this age) is projected to rise from 35 in 2001 to 38 by 2011 and to 45 in 2051 as the large number of people born in the 1950s to 1970s enter retirement ages (see Table 5.02).
Table 5.02. New Zealand population projections12
| Categories | 2001 | 2011 | 2021 | 2031 | 2041 | 2051 |
|---|---|---|---|---|---|---|
1Base: 30 June 2001. 2Medium projection (series 4). Note:Figures may not add to stated totals due to rounding. Source: Statistics New Zealand | ||||||
| Age group (at 30 June) | (000) | |||||
| All ages | 3,880 | 4,248 | 4,506 | 4,714 | 4,807 | 4,807 |
| 0-14 years | 877 | 822 | 791 | 809 | 777 | 752 |
| 15-39 years | 1,389 | 1,440 | 1,475 | 1,424 | 1,379 | 1,371 |
| 40-64 years | 1,154 | 1,410 | 1,447 | 1,433 | 1,458 | 1,466 |
| 65 years and over | 461 | 577 | 792 | 1,048 | 1,194 | 1,217 |
| Components of population change (years ending 30 June) | (000) | |||||
| Births | 56 | 51 | 54 | 52 | 50 | 50 |
| Deaths | 27 | 30 | 34 | 41 | 50 | 57 |
| Net migration | -9 | 5 | 5 | 5 | 5 | 5 |
| Annual population change | 20 | 27 | 25 | 16 | 4 | -3 |
| Median age (at 30 June) | In Years | |||||
| Age | 35 | 38 | 40 | 42 | 44 | 45 |
| Dependency ratio (at 30 June) | Per 100 people aged 15-64 | |||||
| 0-14 years | 34 | 29 | 27 | 28 | 27 | 27 |
| 65 years and over | 18 | 20 | 27 | 37 | 42 | 43 |
| 0-14 and 65 years and over | 53 | 49 | 54 | 65 | 69 | 69 |
Age groups. The number of children (0-14 years) is projected to drop by about one-seventh to around 750,000 by 2051. They will then make up 16 percent of the population, compared with 23 percent in 2001. By contrast, there will be unprecedented growth in the number of New Zealanders in older ages (65 and over). Their number will more than double, from 460,000 in 2001 to 1.22 million in 2051. By then, 25 percent of the population will be aged 65 and over, up from 12 percent in 2001. As figure 5.02 shows, the largest increases in the 65 and over age group will occur in the decades ending in 2021 (216,000) and 2031 (256,000) when the ‘baby boomers’ move into this age group. In 2001, there were about two children for every person aged 65 and over. By the early 2020s, there will be about equal numbers of children and older people, but by 2051 there are projected to be about three older people for every two children. The 65 and over age group itself will age. The number of New Zealanders aged 90 and over is projected to grow from 15,000 in 2001 to nearly 140,000 in 2051. They will then make up 11 percent of the 65 and over population, compared with 3 percent in 2001. The working-age population (15-64 years) is projected to increase by about 290,000 (12 percent) to 2.8 million by 2051. But its share of the total population will shrink from 66 percent to 59 percent by the late 2030s and then remain about this level. The workforce will take on an older profile in the future. In 2001, those aged 40-64 made up 45 percent of the working-age population, a figure projected to increase to 50 percent after 2011. The median age of the working-age group is projected to increase from 38 years in 2001 to 40 years in 2011 and then remain between 40 and 41 for the next four decades.
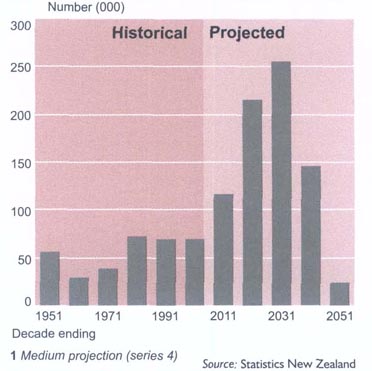
The 2001 Census recorded 25 percent of women aged 65-69, and about 20 percent of men, actively involved in voluntary work.
Educational ages. While numbers in the various educational age groups are projected to fluctuate in the future, there will be a general downward trend in all groups. The fluctuations mainly reflect changes in births in preceding years and are likely to have significant impacts on the demand for teachers and other educational resources. Note, however, that the projected numbers refer to the New Zealand resident population. Between 2001 and 2021, the primary school age population (5-12 years) will drop by 63,000 (13 percent) to 417,000. This compares with a peak of 503,000 in 1975. Further decreases will mean that by 2051 there will be 80,000 fewer primary school age children than in 2001. The trend in the secondary school age population (13-17 years) is similar to that for the primary school age population, except that the peaks and troughs of the secondary school population lag behind those of the primary school age population by about six years. The secondary school age population is projected to increase from 283,000 in 2001 to 318,000 in 2006. Then the number will drop by 50,000 to 268,000 in 2026. By 2051, the secondary school age population will number 264,000, about 59,000 fewer than the 1976 peak. Peaks and troughs in the tertiary age population (18-22 years) lag those of the secondary school age population by about five years. During the decade ending 2011, there will be an increase of 66,000 to a peak of 335,000, partly driven by inflows of students from overseas. This will be followed by drops of 27,000 and 23,000 in the next two decades, and smaller changes thereafter. Figure 5.03 shows the projected population in each of the three educational age groups to 2051.
Ethnic and cultural diversity. New Zealand has been ethnically and culturally connected to Polynesia for at least 1,000 years. Its population and cultural heritage 200 years ago was wholly that of Polynesia, but it is now dominated by cultural traditions that are mainly European, emanating especially from the British Isles.
About 79 percent of New Zealanders are of European ethnicity. The indigenous Maori ethnic group makes up the next largest group of the population, about 14.1 percent in 2001. The other main ethnic groups are Asian and Pacific peoples, who made up 6.6 and 6.5 percent respectively of the resident population count at the 2001 Census. The ethnic and cultural composition of New Zealand has been shaped and reshaped by three main demographic processes: international migration, natural increase and inter-marriage. The most important of these processes has been international migration.
Ethnic population information presented in this chapter is based on the concept of self-identification. Each ethnic group includes people who identify with that ethnic group either solely or in conjunction with other ethnic groups, but excludes people who have ancestry but do not identify with that ethnic group.
Some people identify with two or more ethnic groups and therefore the broad European, Maori, Pacific and Asian populations are not mutually exclusive. All four ethnic populations are projected to experience growth between 2001 and 2021. The Asian population is projected to have the largest percentage growth, up some 122 percent. The Pacific and Maori populations will experience increases of 58 and 28 percent, respectively, while the European population will increase until 2010 before slowly declining. The higher Asian growth rate mainly reflects assumed levels of net migration from 119,000 during the five years 2002-2006 to 30,000 during 2017-2021. By comparison, the higher Maori and Pacific growth relative to the New Zealand population overall is mainly driven by births. In 2001, 14 percent of the New Zealand population identified with the Maori ethnicity and this is projected to increase to 17 percent in 2021. The Pacific and Asian shares are projected to increase from 7 to 9 percent and 7 to 13 percent respectively. By contrast, the European share of the New Zealand population is projected to fall from 79 percent in 2001 to 69 percent in 2021. The decline in the European share is a reflection of the slower growth rate of the European population compared with the growth rate of the total New Zealand population. Diversity in fertility and migration patterns means the various ethnic groups will follow different paths to population ageing in future decades. With a median age of 37 years in 2001, the European population has a much older age structure than the Maori (22 years) and Pacific (21 years) populations. Despite ageing, the median age of the Maori (27 years) and Pacific populations (24 years) in 2021 will still be lower than the median age of the total New Zealand population. Table 5.03 shows the New Zealand population by ethnicity and age group. Table 5.04 shows the projected New Zealand population growth in the European, Māori, Pacific and Asian ethnic groups.
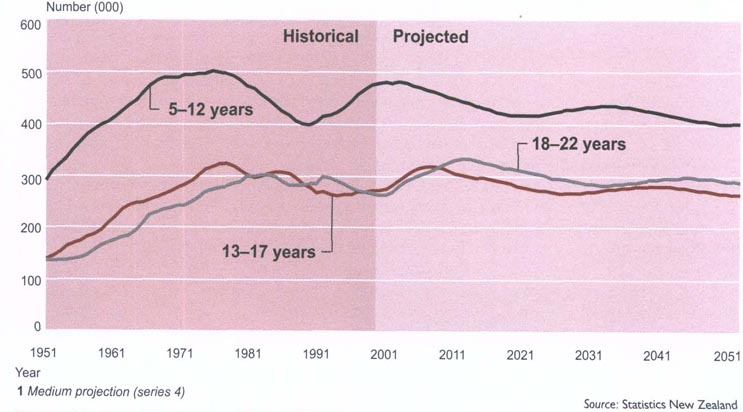
The ethnic and cultural composition of New Zealand has been shaped by international migration, natural increase and inter-marriage.
By 2021, the primary school age population (5-12 years) is expected to be 13 percent (63,000) lower than the 2001 figure of 480,000.
Table 5.04. Ethnic population projections12
| Year | Total New Zealand | European | Māori | Pacific | Asian |
|---|---|---|---|---|---|
1Base: Estimated resident population of each ethnic group at 30 June 2001. 2People who identify with more than one ethnicity are included in each ethnic population, so figures do not add to stated totals. 3Half the population is older and half younger than this age. Source: Statistics New Zealand | |||||
| (000) | |||||
| 2001 | 3,880 | 3,074 | 586 | 262 | 272 |
| 2011 | 4,248 | 3,124 | 665 | 332 | 489 |
| 2021 | 4,506 | 3,103 | 749 | 414 | 604 |
| Population change (percent) | |||||
| 2001-2021 | 16 | 1 | 28 | 58 | 122 |
| Median age3 (in years) | |||||
| 2001 | 35 | 37 | 22 | 21 | 29 |
| 2011 | 38 | 41 | 24 | 22 | 31 |
| 2021 | 40 | 44 | 27 | 24 | 36 |
Table 5.03. Ethnic population projections12 Byage
| Age group (in years) | Māori | Pacific | Asian | European |
|---|---|---|---|---|
1People who identify with more than one ethnicity are included in each ethnic population, so percentage figures add to more than 100. 2Ethnic projection series 6; New Zealand projections series 4. 3Base; Estimated resident population of each ethnicity at 30 June 2001. Source: Statistics New Zealand | ||||
| Percent | ||||
| 20013 | ||||
| Under 15 | 25 | 11 | 7 | 74 |
| 15-64 | 14 | 6 | 8 | 78 |
| 65 and over | 4 | 2 | 2 | 92 |
| All ages | 15 | 7 | 7 | 79 |
| 2021 | ||||
| Under 15 | 28 | 17 | 15 | 62 |
| 15-64 | 16 | 9 | 15 | 66 |
| 65 and over | 7 | 3 | 7 | 85 |
| All ages | 17 | 9 | 13 | 69 |
Territorial authority projections. About 90 percent of population growth in New Zealand in the 20-year period to 2021 will occur in the North Island. The four northernmost regions - Northland, Auckland, Waikato and Bay of Plenty - will account for nearly all North Island growth. The combined population of these four regions will increase by about 28 percent, from 1.98 million in 2001 to 2.53 million in 2021. The population of the rest of the North Island is expected to increase only 1 percent to 978,000 in 2021. The South Island's population is projected to increase by 7 percent to reach 1 million. Given these growth differentials, the northern North Island will be home to 56 percent of all New Zealanders by 2021, up from 51 percent in 2001. By contrast, the southern North Island's share will drop from 25 to 22 percent and the South Island's from 24 percent to 22 percent. Among cities and districts, there is considerable variation likely in population growth rates, largely because of differences in age structures, fertility levels and migration patterns. The Queenstown-Lakes District is projected to have the largest percentage growth during 2001-2021, up 64 percent, followed by Rodney District (up 50 percent), Tauranga City (up 46 percent) and Selwyn District (up 42 percent). By contrast, 39 of the 74 territorial authority areas are projected to decrease in population. The largest decreases are projected for the districts of Kawerau (down 25 percent), South Waikato (down 20 percent), Stratford (down 20 percent), Rangitikei (down 20 percent) and Waimate (down 20 percent). Figure 5.04 shows the projected percentage change in the population of regions between 2001 and 2021.
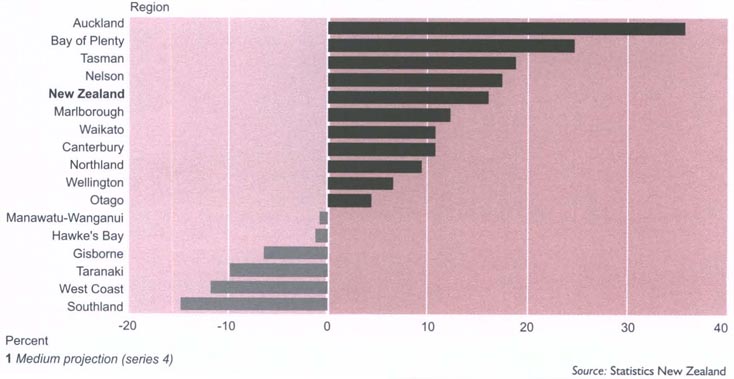
The number of families in New Zealand is projected to increase by 230,000, or 22 percent, from 1.05 million in 2001 to 1.28 million in 2021. During the same period, the number of households is projected to increase by 380,000, or 26 percent, to 1.82 million.
A family refers to a couple, with or without child(ren), or one parent with child(ren), usually living together in a household. A household consists of either one person usually living alone, or two or more people usually living together and sharing facilities, in a private dwelling.
Families comprising couples without children are expected to become the most common family type from 2006. surpassing two-parent families. The number of couple-without-children families is expected to increase by 51 percent, from 407,000 in 2001 to 614,000 in 2021, while the number of two-parent families is expected to decline, from 446,000 to 418,000. The number of one-parent families is projected to increase from 198,000 in 2001 to 251,000 in 2021. Couple-without-children families include couples whose children have left the parental home, as well as couples who may live with children in the future. The main driver of their increasing number is the increasingly older population age structure and, specifically, the ageing of the large birth cohorts of the 1950s to 1970s. In 2001, 63 percent of partners in couple-without-children families were aged 50 and over.
The projected growth in couple-without-children families also partly reflects recent trends of fewer couples having children and more single parenting because of increasing numbers of separations and divorces; increasing rates of childbearing outside of couple relationships; and more complex shared care arrangements, with parents living in different households.
Among households, one-person households are projected to increase by 45 percent, from 333,000 in 2001 to 482,000 in 2021, largely due to the ageing of the population. The number of family households is also projected to increase between 2001 and 2021, by 21 percent from 1.02 million to 1.23 million. Other multiperson households (households containing more than one person, but not containing a family) are expected to number 102,000 in 2021, compared with 88,000 in 2001.
The average size of households is projected to decrease from 2.6 people in 2001 to 2.4 people in 2021, following the steady decline of recent decades. In 1951, there were 3.7 people per household, but by 1981 this had fallen to 3.0 people. The expected decline is due to an increase in the number of one-person households and a decrease in the average size of family households.
Summary. Although fertility has been below replacement level for most of the past quarter of a century and is likely to remain so in the foreseeable future, New Zealand's population will continue to grow slowly for some time. This is because the current age structure has a built-in momentum for further growth. Slow growth aside, there will be profound shifts in population composition, including further ageing of the population, a burgeoning 65 years and over population, growing ethnic diversity and possible geographical redistribution of population, especially within territorial authorities.
Statistics New Zealand has adopted the ‘estimated resident population’ concept as a standard for producing official population estimates and projections.
This concept is viewed as a more accurate estimate of the population normally living in an area than the ‘census usually resident population count’. The estimated resident population of New Zealand includes all residents present in New Zealand and counted by the census (census usually resident population count), residents who are temporarily overseas (who are not included in the census), and an adjustment for residents missed or counted more than once by the census (net census undercount). Visitors from overseas are excluded.
Table 5.05 shows the estimated population of New Zealand from 1885 to 2003.
Table 5.05. Estimated population 1885-2003
| Year | Total population at 31 Dec | Mean population for year ending 31 Dec |
|---|---|---|
1Population estimates for 1991 onwards are based on the resident population concept replacing the de facto population concept used previously. Resident population estimates are not strictly comparable with census usually resident population counts as they include adjustments for census undercount and New Zealand residents temporarily overseas. PprovisionalRrevised Source; Statistics New Zealand | ||
| Estimated de facto population | ||
| 1885 | 619,300 | 613,900 |
| 1886 | 631,400 | 624,300 |
| 1887 | 645,300 | 638,300 |
| 1888 | 649,300 | 647,300 |
| 1889 | 658,000 | 653,700 |
| 1890 | 667,500 | 662,700 |
| 1891 | 676,100 | 671,800 |
| 1892 | 692,400 | 684,200 |
| 1893 | 714,300 | 703,300 |
| 1894 | 728,100 | 721,200 |
| 1895 | 740,700 | 734,400 |
| 1896 | 754,000 | 746,300 |
| 1897 | 768,900 | 761,500 |
| 1898 | 783,300 | 776,100 |
| 1899 | 796,400 | 789,800 |
| 1900 | 808,100 | 802,200 |
| 1901 | 830,800 | 821,100 |
| 1902 | 851,100 | 840,900 |
| 1903 | 875,600 | 863,400 |
| 1904 | 900,700 | 888,200 |
| 1905 | 925,600 | 913,100 |
| 1906 | 956,500 | 943,300 |
| 1907 | 977,200 | 966,800 |
| 1908 | 1,008,400 | 992,800 |
| 1909 | 1,030,700 | 1,019,500 |
| 1910 | 1,050,400 | 1,040,500 |
| 1911 | 1,075,300 | 1,063,900 |
| 1912 | 1,102,500 | 1,088,900 |
| 1913 | 1.134,500 | 1,118,500 |
| 1914 | 1,145,800 | 1,140,200 |
| 1915 | 1,152,600 | 1,149,200 |
| 1916 | 1,150,200 | 1,149,200 |
| 1917 | 1,147,400 | 1,148,900 |
| 1918 | 1,158,100 | 1,152,800 |
| 1919 | 1,227,200 | 1,192,700 |
| 1920 | 1,257,600 | 1,242,400 |
| 1921 | 1,292,700 | 1,276,700 |
| 1922 | 1,318,900 | 1,305,100 |
| 1923 | 1,343,000 | 1,328,200 |
| 1924 | 1,370,400 | 1,352,600 |
| Estimated de facto population | ||
| 1926 | 1,429,700 | 1,413,700 |
| 1927 | 1,450,400 | 1,439,000 |
| 1928 | 1,467,400 | 1,456,100 |
| 1929 | 1,486,100 | 1,473,400 |
| 1930 | 1,506,800 | 1,493,000 |
| 1931 | 1,522,800 | 1,514,200 |
| 1932 | 1,534,700 | 1,527,100 |
| 1933 | 1,547,100 | 1,539,600 |
| 1934 | 1,558,400 | 1,551,500 |
| 1935 | 1,569,700 | 1,562,200 |
| 1936 | 1,584,600 | 1,575,200 |
| 1937 | 1,601,800 | 1,590,000 |
| 1938 | 1,618,300 | 1,606,800 |
| 1939 | 1,641,600 | 1,628,500 |
| 1940 | 1,633,600 | 1,637,300 |
| 1941 | 1,631,200 | 1,630,900 |
| 1942 | 1,636,400 | 1,639,500 |
| 1943 | 1,642,000 | 1,635,600 |
| 1944 | 1,676,300 | 1,655,800 |
| 1945 | 1,727,800 | 1,694,700 |
| 1946 | 1,781,200 | 1,759,600 |
| 1947 | 1,817,500 | 1,798,300 |
| 1948 | 1,853,900 | 1,834,700 |
| 1949 | 1,892,100 | 1,871,700 |
| 1950 | 1,927,700 | 1,909,100 |
| 1951 | 1,970,500 | 1,947,600 |
| 1952 | 2,024,600 | 1,996,200 |
| 1953 | 2,074,700 | 2,048,800 |
| 1954 | 2,118,400 | 2,094,900 |
| 1955 | 2,164,800 | 2,139,000 |
| 1956 | 2,209,200 | 2,182,800 |
| 1957 | 2,262,800 | 2,232,500 |
| 1958 | 2,316,000 | 2,285,800 |
| 1959 | 2,359,700 | 2,334,600 |
| 1960 | 2,403,600 | 2,377,000 |
| 1961 | 2,461,300 | 2,426,700 |
| 1962 | 2,515,800 | 2,484,900 |
| 1963 | 2,566,900 | 2,536,900 |
| 1964 | 2,617,000 | 2,589,100 |
| 1965 | 2,663,800 | 2,635,300 |
| 1966 | 2,711,300 | 2,682,600 |
| Estimated de facto population | ||
| 1967 | 2,745,000 | 2,727,700 |
| 1968 | 2,773,000 | 2,753,500 |
| 1969 | 2,804,000 | 2,780,100 |
| 1970 | 2,852,100 | 2,819,600 |
| 1971 | 2,898,500 | 2,864,200 |
| 1972 | 2,959,700 | 2,915,600 |
| 1973 | 3,024,900 | 2,977,100 |
| 1974 | 3,091,900 | 3,041,800 |
| 1975 | 3,143,700 | 3,100,100 |
| 1976 | 3,163,400 | 3,131,800 |
| 1977 | 3,166,400 | 3,142,600 |
| 1978 | 3,165,200 | 3,143,500 |
| 1979 | 3,163,900 | 3,137,800 |
| 1980 | 3,176,400 | 3,144,000 |
| 1981 | 3,194,500 | 3,156,700 |
| 1982 | 3,226,800 | 3,180,800 |
| 1983 | 3,264,800 | 3,221,700 |
| 1984 | 3,293,000 | 3,252,800 |
| 1985 | 3,303,100 | 3,271,500 |
| 1986 | 3,313,500 | 3,277,000 |
| 1987 | 3,342,100 | 3,303,600 |
| 1988 | 3,345,200 | 3,317,000 |
| 1989 | 3,369,800 | 3,330,200 |
| 1990 | 3,410,400 | 3,362,500 |
| Estimated resident population1 | ||
| 1991 R | 3,516,000 | 3,495,800 |
| 1992 R | 3,552,200 | 3,533,000 |
| 1993 R | 3,597,900 | 3,573,600 |
| 1994 R | 3,648,200 | 3,621,600 |
| 1995 R | 3,706,700 | 3,675,800 |
| 1996 R | 3,762,300 | 3,733,900 |
| 1997 R | 3,802,600 | 3,782,600 |
| 1998 R | 3,829,200 | 3,815,800 |
| 1999 R | 3,851,200 | 3,837,300 |
| 2000 R | 3,873,000 | 3,860,100 |
| 2001 R | 3,912,100 | 3,886,000 |
| 2002 | 3,975,900 | 3,942,100 |
| 2003 P | 4,039,000 | 4,009,600 |
Table 5.06. North and South Island populations By census
| Census1 | North Island | South Island | Total population |
|---|---|---|---|
1Figures from 1981 onwards are census usually resident population counts, replacing census night population counts used previously. Note:The North Island includes the population of Kermadec Islands and people on oil rigs. The South Island includes the populations of the Chatham Islands and Campbell Island. All figures randomly rounded to base 3. Source: Statistics New Zealand | |||
| 1858 | 87,150 | 28,311 | 115,461 |
| 1874 | 155,472 | 189,513 | 344,985 |
| 1878 | 199,524 | 258,483 | 458,007 |
| 1881 | 234,648 | 299,382 | 534,030 |
| 1886 | 290,010 | 330,441 | 620,451 |
| 1891 | 321,246 | 347,403 | 668,652 |
| 1896 | 377,955 | 365,259 | 743,214 |
| 1901 | 431,472 | 384,390 | 815,862 |
| 1906 | 521,898 | 414,411 | 936,309 |
| 1911 | 610,599 | 447,714 | 1,058,313 |
| 1916 | 695,397 | 453,828 | 1,149,225 |
| 1921 | 791,919 | 479,751 | 1,271,667 |
| 1926 | 892,680 | 515,460 | 1,408,140 |
| 1936 | 1,018,038 | 555,774 | 1,573,812 |
| 1945 | 1,146,315 | 556,014 | 1,702,329 |
| 1951 | 1,313,869 | 625,602 | 1,939,473 |
| 1956 | 1,497,363 | 676,698 | 2,174,061 |
| 1961 | 1,684,785 | 730,200 | 2,414,985 |
| 1966 | 1,893,327 | 783,594 | 2,676,918 |
| 1971 | 2,051,364 | 811,269 | 2,862,630 |
| 1976 | 2,268,393 | 860,991 | 3,129,384 |
| 1981 | 2,303,985 | 837,429 | 3,143,307 |
| 1986 | 2,412,660 | 850,623 | 3,263,283 |
| 1991 | 2,520,348 | 853,578 | 3,373,926 |
| 1996 | 2,718,189 | 900,114 | 3,618,303 |
| 2001 | 2,829,801 | 907,476 | 3,737,277 |
Three major trends stand out in the geographic distribution and redistribution of New Zealand's population in the past 150 years. The first is an increasing proportion of people living in the north of the country. The second is a tendency for people to move northward within each island and, with the exception of the past 20 years, from the South Island to the North Island. The third is for an increasing degree of urbanisation and, in particular, a concentration of people in the main urban centres.
Following the end of the gold boom in the South Island in the 1870s, the proportion of the total census night population count living in the South Island began to steadily decrease. From the 1896 Census onward, the census night population of the North Island has exceeded that of the South. Since that time, the North Island's census night population has continued to grow at a greater rate, and its share of the total census night population has continued to increase.
In 1956, 69 percent of New Zealanders lived in the North Island. The percentage had risen to more than 72 by 1976 and in 2001 it was 76 percent.
Many influences have contributed to the population differential between the islands. The North Island has had a higher birth rate, a lower mortality rate and, as a result, a higher rate of natural increase. In addition, most overseas migrants choose to settle in the North Island.
Table 5.06 lists the populations of the North and South Islands on census night from 1858 to 2001.
The movement of people within and among regions is an important determinant of New Zealand's population distribution. Overall, New Zealanders are a mobile people and, while the majority of movement is within regions, there is significant movement among regions. In addition to affecting the size of the population, inter-regional migration also influences age structures, fertility levels and population growth rates within regions. Table 5.07 shows population movements between regions between the 1996 and 2001 censuses.
Table 5.07. Migration between regions 1996-2001
| Regions | Population1 | Migration in | Migration out | Net migration |
|---|---|---|---|---|
1Census usually resident population count of all people aged five and over, 2001. Note:All figures randomly rounded to base 3. Source: Statistics New Zealand | ||||
| Northland | 129,687 | 17,487 | 18,102 | -615 |
| Auckland | 1,070,565 | 65,601 | 67,956 | -2,355 |
| Waikato | 330,090 | 44,046 | 42,573 | 1,473 |
| Bay of Plenty | 221,130 | 34,827 | 26,250 | 8,577 |
| Gisborne | 40,122 | 4,839 | 7,503 | -2,664 |
| Hawke's Bay | 132,168 | 14,577 | 16,704 | -2,127 |
| Taranaki | 95,622 | 8,637 | 12,291 | -3,654 |
| Manawatu-Wanganui | 204,168 | 25,806 | 32,040 | -6,234 |
| Wellington | 393,078 | 39,234 | 37,077 | 2,157 |
| Tasman | 38,544 | 8,082 | 5,529 | 2,553 |
| Nelson | 38,982 | 8,412 | 8,310 | 102 |
| Marlborough | 37,080 | 6,738 | 6,162 | 576 |
| West Coast | 28,359 | 3,750 | 5,910 | -2,160 |
| Canterbury | 450,636 | 38,907 | 30.219 | 8,688 |
| Otago | 170,856 | 21,744 | 20,634 | 1,110 |
| Southland | 84,729 | 6,699 | 12,129 | -5,430 |
New Zealand is a highly urbanised country, with 86 percent of the census usually resident population count living in urban areas at the 2001 Census. Table 5.08 shows urban and rural populations at censuses from 1881 to 2001, while figure 5.05 shows changes in the proportions of urban and rural populations from 1881 to 2001.
Table 5.08. Urban and rural populations1 By census
| Census2 | Urban | Rural | ||
|---|---|---|---|---|
1From 1881-1921, ‘urban’ based on boroughs and cities, ‘rural’ based on counties (including town districts). From 1926-2001, ‘urban’ based on urban areas and towns with populations of more than 1,000, with ‘rural’the remainder. 2Figures from 1981 onwards are census usually resident population counts, replacing census night population counts used previously. 3Based on boundaries as at 6 March 2001. Note:All figures randomly rounded to base 3. Source: Statistics New Zealand | ||||
| Number | Percent | Number | Percent | |
| Non-Māori population | ||||
| 1881 | 194,982 | 40.1 | 291,237 | 59.9 |
| 1886 | 245,613 | 42.9 | 327,327 | 57.1 |
| 1891 | 270,342 | 43.4 | 352,098 | 56.6 |
| 1896 | 307,293 | 44.0 | 391,734 | 56.0 |
| 1901 | 350,202 | 45.6 | 417,597 | 54.4 |
| 1906 | 424,614 | 48.1 | 458,796 | 51.9 |
| 1911 | 505,599 | 50.4 | 496,779 | 49.6 |
| 1916 | 585,306 | 53.9 | 501,258 | 46.1 |
| 1921 | 681,987 | 56.2 | 530,853 | 43.8 |
| Total population | ||||
| 1926 | 953,172 | 68.0 | 448,500 | 32.0 |
| 1936 | 1,065,228 | 67.9 | 503,886 | 32.1 |
| 1945 | 1,227,069 | 72.2 | 472,077 | 27.8 |
| 1951 | 1,406,517 | 72.7 | 527,079 | 27.3 |
| 1956 | 1,600,809 | 73.8 | 568,806 | 26.2 |
| 1961 | 1,840,203 | 76.4 | 569,217 | 23.6 |
| 1966 | 2,119,086 | 79.3 | 553,023 | 20.7 |
| 1971 | 2,328,876 | 81.5 | 528,609 | 18.5 |
| 1976 | 2,614,119 | 83.6 | 511,005 | 16.4 |
| 19813 | 2,682,906 | 85.4 | 460,401 | 14.6 |
| 19863 | 2,780,151 | 85.2 | 481,467 | 14.8 |
| 19913 | 2,884,260 | 85.5 | 489,012 | 14.5 |
| 19963 | 3,091,104 | 85.5 | 525,633 | 14.5 |
| 20013 | 3,203,574 | 85.7 | 532,740 | 14.3 |
Seventy-one percent of the 2001 Census usually resident population count lived in main urban areas (places with 30,000 people or more). Between 1996 and 2001, most main urban areas experienced population growth, particularly those located in the north of both islands. However, most secondary urban areas (places with between 10,000 and 29,999 people) lost population during that period.
Table 5.09 shows the population of New Zealand's largest urban areas at selected censuses.
Table 5.09. Population of largest urban areas At selected censuses
| Urban area | 18861 | 19111 | 1936 | 1961 | 198623 | 199123 | 199623 | 200123 |
|---|---|---|---|---|---|---|---|---|
1Excludes Māori 2Boundaries as at 6 March 2001. 3Figures from 1986 onwards are census usually resident population counts, replacing census night population counts used previously. ... not applicable Note:All figures randomly rounded to base 3. Source: Statistics New Zealand | ||||||||
| Auckland | 33,162 | 102,675 | 226,365 | 448,365 | 816,927 | 878,223 | 991,833 | 1,074,513 |
| Wellington | 25,944 | 70,728 | 159,357 | 249,531 | 323,421 | 324,156 | 334,065 | 339,750 |
| Christchurch | 29,655 | 80,193 | 133,515 | 220,509 | 295,749 | 303,411 | 325,251 | 334,107 |
| Hamilton | 1,200 | 3,543 | 20,097 | 50,505 | 138,645 | 146,148 | 158,046 | 166,128 |
| Dunedin | 23,244 | 64,236 | 85,608 | 105,003 | 107,331 | 107,523 | 110,790 | 107,088 |
| Tauranga | 1,149 | 1,347 | 5,808 | 24,660 | 62,370 | 70,257 | 82,095 | 95,697 |
| Palmerston North | 2,607 | 10,992 | 24,372 | 43,185 | 66,951 | 70,236 | 73,860 | 72,681 |
| Hastings | 1,503 | 6,285 | 17,919 | 32,490 | 56,718 | 57,219 | 58.500 | 59,142 |
| Napier | 7,680 | 11,736 | 19,170 | 32,715 | 52,524 | 52,119 | 54,291 | 54,534 |
| Nelson | 7,314 | 8,235 | 13,494 | 25,320 | 43,725 | 45,879 | 50,688 | 53,688 |
| Rotorua | ... | 2,391 | 8,898 | 25,068 | 48,855 | 50,772 | 52,956 | 52,608 |
| New Plymouth | 3,093 | 5,238 | 18,597 | 32,388 | 47,370 | 47,652 | 48,879 | 47,763 |
| Invercargill | 8,250 | 15,858 | 25,911 | 41,088 | 52,818 | 51,540 | 49,404 | 46,305 |
| Whangarei | ... | 2,664 | 9,867 | 21,789 | 44,097 | 44,346 | 45,876 | 46,047 |
| Wanganui | 4,902 | 14,703 | 25,749 | 35,694 | 40,512 | 41,100 | 41,097 | 39,423 |
| Kapiti | ... | 1,068 | 5,367 | 12,306 | 23,040 | 27,342 | 30,291 | 33,669 |
| Gisborne | 2,193 | 8,196 | 15,879 | 25,065 | 32,019 | 31,401 | 32,607 | 31,722 |
| Timaru | 3,753 | 11,280 | 18,771 | 26,424 | 28,692 | 27,783 | 27,171 | 26,748 |
| Blenheim | 3,093 | 3,771 | 5,037 | 11,955 | 22,998 | 23,787 | 25,704 | 26,547 |
| Masterton | ... | 5,181 | 9,096 | 15,120 | 19,353 | 19,770 | 19,689 | 19,497 |
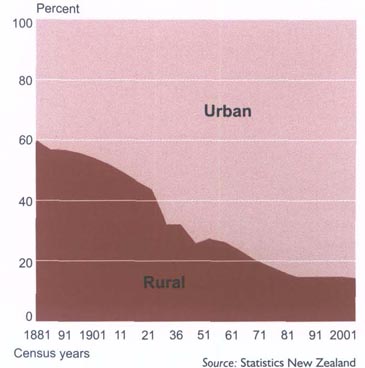
Tables 5.10 and 5.11 outline the estimated usually resident population count of New Zealand's 74 territorial authority areas and 16 regional council area.
Table 5.1. Estimated resident population At 30 June
| Territorial authority | Estimated resident population1 | Annual population change June 2002-2003 | |||
|---|---|---|---|---|---|
| 2001 | 2002 | 2003 | |||
1Resident population estimates are not strictly comparable with census usually resident population counts as they include adjustments for census undercount and New Zealand residents temporarily overseas. 2Includes the population of inlets, ships, oil rigs and Bays- Waiheke, Kermadec, Mayor, Motiti and White Islands, which are not included within territorial authorities. - nil or zero - figure too small to be expressed Note:Figures may not add to stated totals due to rounding. Source: Statistics New Zealand | |||||
| Number | Number | Percent | |||
| Far North District | 56,400 | 56,800 | 57,100 | 330 | 0.6 |
| Whangarei District | 70,000 | 70,700 | 71,400 | 760 | 1.1 |
| Kaipara District | 17,950 | 17,950 | 18,050 | 70 | 0.4 |
| Rodney District | 78,500 | 81,100 | 84,100 | 3,000 | 3.7 |
| North Shore City | 194,200 | 198,900 | 205,000 | 6,100 | 3.1 |
| Waitakere City | 176,200 | 180,700 | 185,600 | 4,880 | 2.7 |
| Auckland City | 388,800 | 401,500 | 415,200 | 13,680 | 3.4 |
| Manukau City | 298,200 | 307,300 | 317,500 | 10,210 | 3.3 |
| Papakura District | 42,300 | 42,700 | 43,100 | 430 | 1.0 |
| Franklin District | 53,300 | 54,300 | 55,500 | 1,130 | 2.1 |
| Thames-Coromandel District | 25,800 | 26,000 | 26,300 | 260 | 1.0 |
| Hauraki District | 17,250 | 17,100 | 17,000 | -100 | -0.6 |
| Waikato District | 41,300 | 41,700 | 42,100 | 400 | 0.9 |
| Matamata-Piako District | 30,300 | 30,300 | 30,300 | 40 | 0.1 |
| Hamilton City | 119,500 | 122,000 | 125,000 | 2,980 | 2.4 |
| Waipa District | 41,400 | 41,800 | 42,400 | 580 | 1.4 |
| Otorohanga District | 9,590 | 9,580 | 9,540 | -40 | -0.4 |
| South Waikato District | 24,200 | 23,800 | 23,600 | -300 | -1.2 |
| Waitomo District | 9,780 | 9,690 | 9,700 | 10 | 0.1 |
| Taupo District | 32,500 | 32,800 | 33,300 | 450 | 1.4 |
| Western Bay of Plenty District | 39,300 | 39,900 | 40,700 | 790 | 2.0 |
| Tauranga District | 93,300 | 95,600 | 98,500 | 2,860 | 3.0 |
| Rotorua District | 66,900 | 67,200 | 67,600 | 370 | 0.5 |
| Whakatane District | 34,000 | 34,000 | 34,000 | -30 | -0.1 |
| Kawerau District | 7,290 | 7,170 | 6,990 | -170 | -2.4 |
| Opotiki District | 9,540 | 9,550 | 9,580 | 30 | 0.3 |
| Gisborne District | 45,500 | 45,200 | 45,200 | -20 | -0.1 |
| Wairoa District | 9,260 | 9,090 | 8,880 | -210 | -2.3 |
| Hastings District | 69,600 | 70,200 | 70,500 | 400 | 0.6 |
| Napier City | 55,200 | 55,500 | 55,800 | 280 | 0.5 |
| Central Hawke's Bay District | 13,200 | 13,200 | 13,150 | -20 | -0.1 |
| New Plymouth District | 68,400 | 68,700 | 69,100 | 440 | 0.6 |
| Stratford District | 9,110 | 8,940 | 8,820 | -120 | -1.3 |
| South Taranaki District | 28,400 | 28,100 | 27,900 | -130 | -0.5 |
| Ruapehu District | 15,000 | 14,550 | 14,200 | -350 | -2.4 |
| Wanganui District | 44,400 | 44,200 | 43,900 | -260 | -0.6 |
| Rangitikei District | 15,500 | 15,300 | 15,100 | -180 | -1.2 |
| Manawatu District | 28,200 | 28,200 | 28,300 | 50 | 0.2 |
| Palmerston North City | 75,200 | 75,900 | 77,100 | 1,190 | 1.6 |
| Tararua District | 18,350 | 18,150 | 17,950 | -200 | -1.1 |
| Horowhenua District | 30,600 | 30,600 | 30,600 | -10 | — |
| Kapiti Coast District | 43,600 | 44,400 | 45,200 | 810 | 1.8 |
| Porirua City | 49,500 | 49,900 | 50,300 | 440 | 0.9 |
| Upper Hutt City | 37,700 | 37,700 | 37,800 | 50 | 0.1 |
| Lower Hutt City | 99,100 | 99,600 | 99,900 | 380 | 0.4 |
| Wellington City | 171,100 | 174,600 | 179,100 | 4,500 | 2.6 |
| Masterton District | 23,200 | 23,300 | 23,300 | 30 | 0.1 |
| Carterton District | 7,000 | 7,030 | 7,100 | 60 | 0.9 |
| South Wairarapa District | 8,940 | 8,930 | 8,860 | -70 | -0.7 |
| Tasman District | 42,400 | 43,500 | 44,700 | 1,180 | 2.7 |
| Nelson City | 42,900 | 43,500 | 44,400 | 920 | 2.1 |
| Marlborough District | 40,700 | 41,100 | 41,700 | 570 | 1.4 |
| Kaikoura District | 3,580 | 3,590 | 3,610 | 20 | 0.6 |
| Buller District | 9,860 | 9,760 | 9,720 | -40 | -0.4 |
| Grey District | 13,200 | 13,100 | 13,100 | -20 | -0.2 |
| Westland District | 7,990 | 7,940 | 7,930 | -20 | -0.2 |
| Hurunui District | 10,150 | 10,300 | 10,450 | 140 | 1.4 |
| Waimakariri District | 37,900 | 38,800 | 39,800 | 940 | 2.4 |
| Christchurch City | 327,200 | 332,000 | 338,800 | 6,760 | 2.0 |
| Banks Peninsula District | 8,040 | 8,140 | 8,200 | 60 | 0.7 |
| Selwyn District | 28,300 | 29,200 | 30,000 | 810 | 2.8 |
| Ashburton District | 26,000 | 26,100 | 26,500 | 350 | 1.3 |
| Timaru District | 42,800 | 42,900 | 42,900 | - | - |
| Mackenzie District | 3,790 | 3,750 | 3,760 | 10 | 0.2 |
| Waimate District | 7,220 | 7,150 | 7,120 | -30 | -0.5 |
| Waitaki District | 20,500 | 20,300 | 20,200 | -140 | -0.7 |
| Central Otago District | 14,750 | 14,800 | 14,950 | 120 | 0.8 |
| Queenstown-Lakes District | 17,850 | 19,250 | 20,700 | 1,420 | 7.3 |
| Dunedin City | 119,300 | 120,300 | 121,100 | 870 | 0.7 |
| Clutha District | 17,550 | 17,500 | 17,400 | -80 | -0.5 |
| Southland District | 29,400 | 29,400 | 29,400 | 70 | 0.3 |
| Gore District | 12,750 | 12,650 | 12,550 | -60 | -0.5 |
| Invercargill City | 51,100 | 51,400 | 51,800 | 400 | 0.8 |
| Chatham Islands Territory | 750 | 750 | 750 | - | 0.2 |
| Total New Zealand2 | 3,880,500 | 3,939,100 | 4,009,200 | 70,030 | 1.8 |
Table 5.11. Estimated resident population At 30 June
| Regional council | Estimated resident population1 | Annual population change June 2002-2003 | |||
|---|---|---|---|---|---|
| 2001 | 2002 | 2003 | |||
1Resident population estimates are not strictly comparable with census usually resident population counts as they include adjustments for census undercount and New Zealand residents temporarily overseas. 2Includes the Kermadec Islands and people on oil rigs. 3Includes the Chatham Islands and people on oil rigs. Note:Figures may not add to stated totals due to rounding. Source: Statistics New Zealand | |||||
| Number | Number | Percent | |||
| North Island | |||||
| Northland | 144,400 | 145,400 | 146,600 | 1,160 | 0.8 |
| Auckland | 1,216,900 | 1,251,600 | 1,290,800 | 39,190 | 3.1 |
| Waikato | 369,800 | 373,300 | 377,900 | 4,530 | 1.2 |
| Bay of Plenty | 246,900 | 250,100 | 254,000 | 3,830 | 1.5 |
| Gisborne | 45,500 | 45,200 | 45,200 | -20 | -0.1 |
| Hawke's Bay | 147,300 | 148,000 | 148,500 | 460 | 0.3 |
| Taranaki | 105,700 | 105,500 | 105,700 | 200 | 0.2 |
| Manawatu-Wanganui | 227,500 | 227,100 | 227,300 | 230 | 0.1 |
| Wellington | 440,200 | 445,400 | 451,600 | 6,220 | 1.4 |
| Total North Island2 | 2,944,300 | 2,991,800 | 3,047,600 | 55,790 | 1.9 |
| South Island | |||||
| Tasman | 42,400 | 43,500 | 44,700 | 1,180 | 2.7 |
| Nelson | 42,900 | 43,500 | 44,500 | 930 | 2.1 |
| Marlborough | 40,700 | 41,100 | 41,700 | 570 | 1.4 |
| West Coast | 31,100 | 30,800 | 30,700 | -80 | -0.3 |
| Canterbury | 496,700 | 503,600 | 512,600 | 9,000 | 1.8 |
| Otago | 188,300 | 190,600 | 192,900 | 2,240 | 1.2 |
| Southland | 93,300 | 93,400 | 93,800 | 410 | 0.4 |
| Total South Island3 | 936,100 | 947,300 | 961,500 | 14,240 | 1.5 |
| Total New Zealand | 3,880,500 | 3,939,100 | 4,009,200 | 70,030 | 1.8 |
Population change has two main components, natural increase (the excess of births over deaths) and net migration (the difference between arrivals and departures). The relative contribution of the two components has varied from one five-year census period to another, but net migration's share of population change has never exceeded 40 percent. Figure 5.06 shows contributions made by natural increase and net migration to New Zealand's total population change from 1861 to 2001.
Figure 5.06. Components of annual population changeNatural increase1 and net migration2 Years ending 31 March
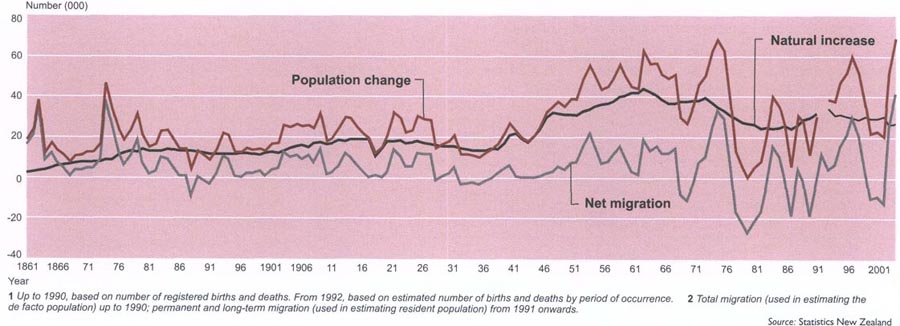
Changing levels of fertility over the years have played a major role in determining the size and structure of New Zealand's population.
Figure 5.07 shows the significant changes in the fertility rate (births per woman) in New Zealand from 1912 to 2003.
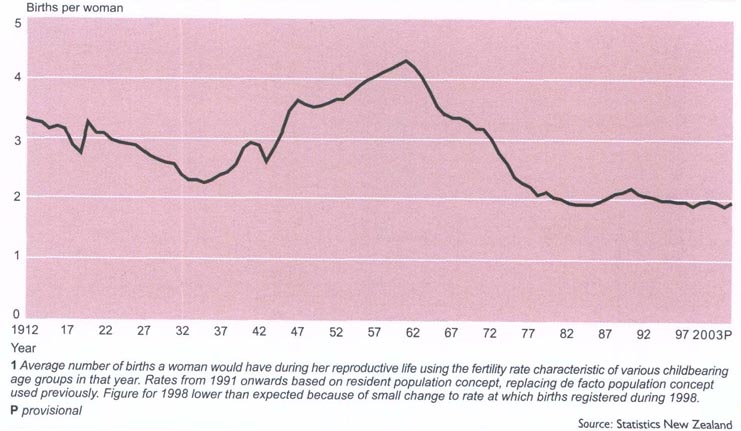
In 1935, the fertility rate in New Zealand fell to a low of 2.2 births per woman. This was attributed to fewer and later marriages, and family limitation within marriage. With demobilisation of forces after World War II and the resulting increase in marriages and births, the fertility rate reached 3.6 births per woman in 1947.
Other features of the years following World War II were New Zealanders marrying younger, and marriage becoming almost universal. By 1961, half of all women were married before the age of 22, compared with barely a quarter married by that age in the early 1940s. These trends were reinforced by early childbearing and the shortening of birth intervals.
The median age at first birth fell from 25.4 years in 1945 to 22.8 years in 1964. Fewer couples remained childless or had only one child. The net result was soaring birth numbers, up from just more than 27,000 in 1935 to about 42,000 in 1945, and to more than 65,000 in 1961. More than 1.1 million New Zealanders were born between 1946 and 1965 - the ‘baby boomers’. At its peak in 1961, the total fertility rate exceeded 4.3 births per woman and significantly exceeded figures for other developed nations.
The upward trend was reversed in the early 1960s just as suddenly as it had begun, which has prompted demographers to suggest that the ‘baby boom’ was merely a temporary diversion from a long-term downward trend. The turnaround coincided with introduction of the oral contraceptive pill in the early 1960s, but the ‘cause-and-effect’ relationship is not clear-cut. It is possible that increased acceptance and use of the pill helped sustain the downward trend.
By the mid-1970s, the post-depression rise in fertility had ended. The total fertility rate fell below the ‘replacement level’ in 1978 and then to an all-time low of 1.92 births per woman in 1983. This drop had a great impact on the annual number of births. Despite a substantial increase in the number of prospective mothers, caused by the ‘baby boomers’ entering prime reproductive ages, births dropped from around 64,000 in 1971 to below 50,000 in 1982.
After 1983, there was a minor resurgence in the fertility rate, to 2.18 births per woman in 1990, but the rate subsequently dropped to 1.96 in 1996 and has remained around this level since. This level of fertility is slightly below the level required for the population to replace itself without migration.
From 22.8 years in 1964, the median age at first birth rose steadily to 30.6 years in 2003. In 2002 and 2003, the age group 30-34 replaced 25-29 as the most common age group for childbearing among New Zealand women.
Figure 5.08 shows the median age of childbearing for New Zealand women from 1962 to 2003, based on nuptial and ex-nuptial live confinements.
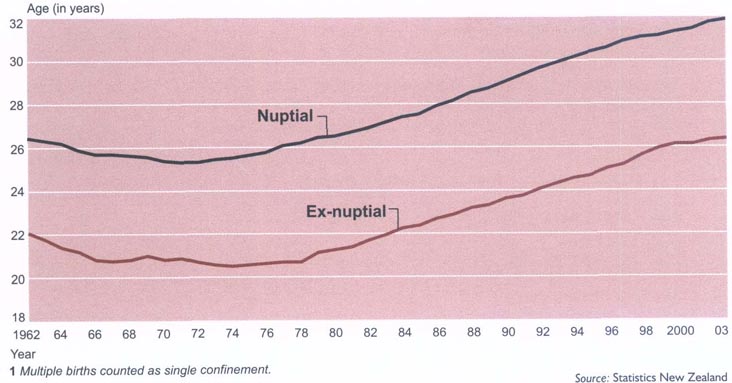
The dynamics of the fertility decline and of current low fertility levels are complex.
Increased use of contraceptives, increased participation of women in the labour force, rising divorce rates and general economic conditions have probably all, directly or indirectly, contributed to it.
Patterns of marriage and family formation have changed radically, with a shift away from early marriage and childbearing toward later marriage and delayed parenthood.
Between 1971 and 1986, the first marriage rate for women aged 20-24 dropped by about two-thirds, from 314 to 113 marriages per 1,000 never-married women.
By 2001, the first marriage rate for women aged 20-24 had dropped to 37 per 1,000. New Zealand women are marrying for the first time, on average, more than six years later than those who married for the first time in 1971.
The median age at first marriage in 2002 for women was 27.6 and 29.4 for men. This compared with 20.8 and 23.0 respectively in 1971.
A growing proportion of New Zealanders are remaining single through their 20s. The substantial postponement of marriage has been partly offset by the growth of de facto relationships (cohabitation outside marriage).
Such relationships may be either a prelude to, or a substitute for, formal marriages. The growth in de facto unions partly accounts for the rise in the number of ex-nuptial births (children born to women who are not legally married to the child's father), up from nearly 7,000 in 1966 to nearly 10,000 in 1976, and to more than 24,000 in 2001.
Figure 5.09 shows the ex-nuptial birth rate per 1,000 not-married women in New Zealand for selected years from 1896 to 2003.
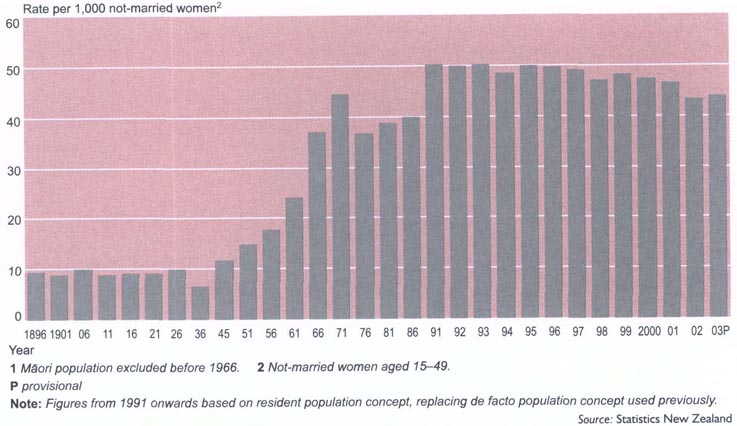
Ex-nuptial births comprised 12 percent of all births registered in New Zealand in 1966 and 44 percent in 2003. Changing social norms have contributed to this increase. There is also a high incidence of ex-nuptial births among Māori. In 2003, 75 percent of all Mωori births were classified as ex-nuptial and they accounted for nearly half of New Zealand's ex-nuptial births.
Latest demographic measures indicate that there is still a significant ethnic differential in fertility levels in New Zealand. In 2000-02, the fertility rate for Māori women was 2.6 births per woman and for Pacific women 2.9 births, compared with 1.7 and 1.8 births for Asian and European women respectively.
Table 5.12 illustrates fertility trends and patterns from 1881 to 2003.
Table 5.12. Fertility trends and patterns Years ending 31 December
| Year | Live births | Crude birth rate1 | Fertility rate2 | Gross reproduction rate34 | Net reproduction rate45 | Ex-nuptial birth rate46 |
|---|---|---|---|---|---|---|
1Live births per 1,000 estimated mean population. 2Average number of births a woman would have during her reproductive life using fertility rate characteristic of various childbearing age groups in that year. 3Average number of daughters a woman would have during her reproductive life, assuming age-of mother-specific birth rates experienced during that year continue to apply. 4Figures before 1966 exclude Maori population. 5Average number of daughters a woman would have during her reproductive life, assuming age-of-mother-specific birth rates and mortality rates experienced during that year continue to apply. 6Ex-nuptial births per 1,000 estimated mean number of not-married women aged 15-49. Before 1966, rates based on census counts of not-married women aged 15-44. 7Excludes Māori population. 8Births and fertility rates for 1998 lower than expected because of small change to rate at which births registered during 1998. PprovisionalRrevised figures not available Note:Birth and fertility rates for 1991 onwards based on resident population concept, replacing de facto population concept used previously. Source: Statistics New Zealand | ||||||
| 18817 | 18,732 | 38.00 | .. | .. | .. | .. |
| 18867 | 19,299 | 33.14 | .. | .. | .. | .. |
| 18917 | 18,273 | 29.01 | .. | .. | .. | 9.38 |
| 18967 | 18,612 | 26.35 | .. | .. | .. | 9.44 |
| 19017 | 20,491 | 26.34 | .. | .. | .. | 9.04 |
| 19067 | 24,252 | 27.08 | .. | .. | .. | 9.92 |
| 19117 | 26,354 | 25.99 | .. | .. | .. | 8.93 |
| 19167 | 28,509 | 25.94 | .. | .. | .. | 9.24 |
| 1921 | 29,623 | 23.24 | 3.08 | .. | .. | 9.21 |
| 1926 | 29,904 | 21.15 | 2.88 | .. | .. | 9.92 |
| 1931 | 28,867 | 19.06 | 2.56 | .. | .. | .. |
| 1936 | 28,395 | 18.03 | 2.30 | 1.04 | 0.97 | 6.71 |
| 1941 | 39,170 | 24.02 | 2.93 | 1.37 | 1.27 | .. |
| 1946 | 47,524 | 27.01 | 3.45 | 1.59 | 1.47 | 11.67 |
| 1951 | 49,806 | 25.57 | 3.60 | 1.64 | 1.58 | 14.85 |
| 1956 | 56,531 | 25.90 | 3.98 | 1.84 | 1.77 | 17.79 |
| 1961 | 65,390 | 26.95 | 4.31 | 2.03 | 1.96 | 24.14 |
| 1966 | 60,003 | 22.37 | 3.41 | 1.66 | 1.61 | 36.92 |
| 1971 | 64,460 | 22.51 | 3.18 | 1.55 | 1.51 | 44.39 |
| 1976 | 55,105 | 17.60 | 2.27 | 1.09 | 1.07 | 36.86 |
| 1981 | 50,794 | 16.09 | 2.01 | 0.98 | 0.96 | 38.81 |
| 1986 | 52,823 | 16.12 | 1.96 | 0.96 | 0.94 | 39.80 |
| 1987 | 55,254 | 16.73 | 2.03 | 0.98 | 0.96 | 42.44 |
| 1988 | 57,546 | 17.35 | 2.10 | 1.02 | 1.00 | 45.85 |
| 1989 | 58,091 | 17.44 | 2.12 | 1.04 | 1.01 | 48.83 |
| 1990 | 60,153 | 17.89 | 2.18 | 1.07 | 1.04 | 50.95 |
| 1991 | 59,911 | 17.14R | 2.09 R | 1.01 R | 1.00 | 50.17R |
| 1992 | 59,166 | 16.75 R | 2.06 R | 0.99 | 0.97 R | 49.90 R |
| 1993 | 58,782 | 16.45 R | 2.04 R | 0.99 | 0.97 | 50.16R |
| 1994 | 57,321 | 15.83 R | 1.98R | 0.96 R | 0.95 | 48.53 R |
| 1995 | 57,671 | 15.69R | 1.98 R | 0.96 | 0.94 | 50.07 R |
| 1996 | 57,280 | 15,34R | 1,96 | 0.95 | 0.93R | 49.60 R |
| 1997 | 57,604 | 15.23R | 1.96 R | 0.96 R | 0.94 R | 48.97 R |
| 19988 | 55,349 | 14.51 R | 1.89 R | 0.92 | 0.90 R | 47.02 R |
| 1999 | 57,053 | 14.87 R | 1.97 R | 0.96 | 0.95 R | 48.21 R |
| 2000 | 56,605 | 14.66 R | 1.98 R | 0.96 | 0.94 R | 47.50 R |
| 2001 | 55,799 | 14.36 R | 1,97 R | 0.97 | 0.95 R | 46.41 R |
| 2002 | 54,021 | 13.70 | 1.90 | 0.92 | 0.90 | 43.40 |
| 2003 | 56,134 | 14.00P | 1.96 P | 0.95 P | 0.94 P | 43.90 P |
Table 5.13 provides a summary of vital statistics for the New Zealand population from 1950 to 2003.
Table 5.13. Vital statistics Years ending 31 December
| Year | Live births | Deaths | Natural increase1 | Average age at death | |
|---|---|---|---|---|---|
| Male | Female | ||||
1Live births minus deaths. 2Births lower than expected because of small change to rate at which births registered during 1998. Note:Figures from 1991 onwards are based on the resident population concept, replacing the de facto population concept used previously. Source: Statistics New Zealand | |||||
| Number | Year | ||||
| 1950 | 49,331 | 18,084 | 31,247 | 60.0 | 61.8 |
| 1955 | 55,596 | 19,225 | 36,371 | 60.7 | 64.3 |
| 1960 | 62,779 | 20,892 | 41,887 | 62.2 | 65.9 |
| 1965 | 60,047 | 22,976 | 37,071 | 62.9 | 68.0 |
| 1970 | 62,050 | 24,840 | 37,210 | 63.2 | 68.8 |
| 1975 | 56,639 | 25,114 | 31,525 | 63,4 | 69.5 |
| 1980 | 50,542 | 26,676 | 23,866 | 65.7 | 71.0 |
| 1985 | 51,798 | 27,480 | 24,318 | 66.4 | 72.8 |
| 1990 | 60,153 | 26,531 | 33,622 | 66.5 | 73.3 |
| 1991 | 59,911 | 26,389 | 33,522 | 67.0 | 73.7 |
| 1992 | 59,166 | 27,115 | 32,051 | 67.8 | 74.3 |
| 1993 | 58,782 | 27,100 | 31,682 | 68.1 | 74.3 |
| 1994 | 57,321 | 26,953 | 30,368 | 68.7 | 74.7 |
| 1995 | 57,671 | 27,813 | 29,858 | 68.8 | 74.8 |
| 1996 | 57,280 | 28,255 | 29,025 | 68.9 | 75.1 |
| 1997 | 57,604 | 27,471 | 30,133 | 68.9 | 75.3 |
| 19982 | 55,349 | 26,206 | 29,143 | 69.1 | 75.5 |
| 1999 | 57,053 | 28,122 | 28,931 | 69.9 | 76.3 |
| 2000 | 56,605 | 26,660 | 29,945 | 69.9 | 76.0 |
| 2001 | 55,799 | 27,825 | 27,974 | 70.6 | 76.8 |
| 2002 | 54,021 | 28,065 | 25,956 | 70.9 | 76.9 |
| 2003 | 56,134 | 28,010 | 28,124 | 70.8 | 77.0 |
Table 5.14. Life expectancy at birth International comparisons
| Country | Year/period | Males | Females |
|---|---|---|---|
1Excludes Māori population. Source: Statistics New Zealand | |||
| New Zealand | 1901-19051 | 58.1 | 60.6 |
| Australia | 1901-1910 | 55.2 | 58.8 |
| Denmark | 1895-1900 | 50.2 | 53.2 |
| Japan | 1899-1903 | 37.8 | 38.2 |
| Norway | 1891-1900 | 50.4 | 54.1 |
| United Kingdom | 1906 | 48.0 | 51.6 |
| New Zealand | 1950-1952 | 67.2 | 71.3 |
| Australia | 1953-1955 | 67.1 | 72.8 |
| Denmark | 1951-1960 | 70.1 | 73.2 |
| Japan | 1950-1952 | 59.6 | 63.0 |
| Norway | 1951-1955 | 71.1 | 74.7 |
| United Kingdom | 1951 | 66.2 | 71.2 |
| New Zealand | 1970-1972 | 68.5 | 74.6 |
| Australia | 1975-1977 | 69.5 | 76.4 |
| Denmark | 1971-1975 | 70.9 | 76.5 |
| Japan | 1970 | 69.3 | 74.7 |
| Norway | 1971-1975 | 71.4 | 77.7 |
| United Kingdom | 1971 | 68.8 | 75.0 |
| New Zealand | 1980-1982 | 70.4 | 76.4 |
| Australia | 1981 | 71.4 | 78.4 |
| Denmark | 1981-1985 | 71.5 | 77.5 |
| Japan | 1980 | 73.3 | 78.8 |
| Norway | 1981-1982 | 72.6 | 79.4 |
| United Kingdom | 1981 | 70.8 | 76.8 |
| New Zealand | 1990-1992 | 72.9 | 78.7 |
| Australia | 1993 | 75.0 | 80.9 |
| Denmark | 1991-1992 | 72.4 | 77.8 |
| Japan | 1992 | 76.1 | 82.2 |
| Norway | 1992 | 74.2 | 80.3 |
| United Kingdom | 1990 | 73.0 | 78.5 |
| New Zealand | 2000-2002 | 76.3 | 81.1 |
| Australia | 2000-2002 | 77.4 | 82.6 |
| Denmark | 2001-2002 | 74.7 | 79.2 |
| Japan | 2002 | 78.3 | 85.2 |
| Norway | 2002 | 76.4 | 81.5 |
| United Kingdom 2000-2002 | 75.7 | 80.4 | |
A temperate climate, low population density, lack of heavy industry and good nutrition have given New Zealand a comparative advantage over other nations in terms of health. Ongoing advances in living standards, medical knowledge and technology, and health services continue to reduce mortality rates.
Nevertheless, New Zealand mortality rates mask the fact that Maori mortality rates are much higher than non-Māori, and that New Zealand life expectancy has been eclipsed by several other countries, as shown in Table 5.14.
A large part of longevity improvement in New Zealand occurred before 1930 and was due to the saving of life at younger ages. Allowing for higher Māori mortality, the infant mortality rate fell steadily from more than 100 deaths per 1,000 live births in the late 19th century to about 50 per 1,000 in the 1920s. As Table 5.15 shows, the infant mortality rate has continued to drop, from about 20 per 1,000 in the early 1960s, to 4.9 per 1,000 in 2003.
Table 5.15. Death rate By age and sex Years ending 31 December
| Year | Under I1 | 1-4 | 5-14 | 15-24 | 25-34 | 35-44 | 45-54 | 55-64 | 65-74 | 75 and over |
|---|---|---|---|---|---|---|---|---|---|---|
1Per 1,000 live births. 2Excludes Māori population. Pprovisional R revised Note:Live births for 1901-1961 include late registrations, while those from 1981 onwards exclude late registrations. Death rates for 1991 onwards are based on the resident population concept, replacing the de facto population concept used previously. Source: Statistics New Zealand | ||||||||||
| Males | Per 1,000 mean estimated population | |||||||||
| 19012 | 78.60 | 6.81 | 1.89 | 3.52 | 3.97 | 6.16 | 11.94 | 23.12 | 50.59 | 141.67 |
| 19212 | 53.10 | 4.78 | 1.85 | 2.44 | 3.56 | 5.55 | 9.61 | 19.96 | 46.17 | 128.60 |
| 1941 | 43.65 | 4.39 | 1.36 | 2.53 | 2.93 | 3.95 | 9.20 | 21.13 | 47.45 | 140.17 |
| 1961 | 25.86 | 1.35 | 0.49 | 1.28 | 1.47 | 2.67 | 7.37 | 19.70 | 47.40 | 125.90 |
| 1981 | 13.01 | 0.95 | 0.35 | 1.53 | 1.35 | 2.26 | 6.57 | 17.30 | 43.39 | 114.11 |
| 2001 R | 6.14 | 0.33 | 0.20 | 1.08 | 1.20 | 1.56 | 3.26 | 9.04 | 26.86 | 87.33 |
| 2002 | 5,62 | 0.39 | 0.20 | 0.90 | 1.13 | 1.60 | 3.40 | 8.86 | 24.95 | 86.58 |
| 2003 P | 5.69 | 0.34 | 0.19 | 0.92 | 1.15 | 1.60 | 3.39 | 8.41 | 23.77 | 83.70 |
| Females | ||||||||||
| 19012 | 63.87 | 5.50 | 1.64 | 3.58 | 4.72 | 6.70 | 10.62 | 19.44 | 43.32 | 127.98 |
| 19212 | 42.31 | 4.49 | 1.31 | 2.34 | 3.38 | 4.46 | 8.00 | 14.88 | 36.81 | 120.23 |
| 1941 | 35.75 | 3.84 | 1.20 | 1.94 | 2.44 | 3.50 | 6.90 | 15.04 | 38.61 | 118.74 |
| 1961 | 19.50 | 1.16 | 0.35 | 0.54 | 0.87 | 1.95 | 4.59 | 11.23 | 29.92 | 104.72 |
| 1981 | 10.22 | 0.64 | 0.23 | 0.67 | 0.64 | 1.51 | 3.94 | 9.19 | 23.73 | 84.67 |
| 2001R | 4.44 | 0.33 | 0.18 | 0.41 | 0.51 | 0.90 | 2.47 | 6.30 | 15.68 | 72.37 |
| 2002 | 5.48 | 0.32 | 0.13 | 0.39 | 0.56 | 0.96 | 2.29 | 6.04 | 15.69 | 72.30 |
| 2003 P | 4.14 | 0.36 | 0.12 | 0.46 | 0.50 | 0.98 | 2.43 | 5.71 | 15.38 | 70.36 |
| Both sexes | ||||||||||
| 19012 | 71.40 | 6.17 | 1.77 | 3.55 | 4.33 | 6.40 | 11.37 | 21.63 | 47.87 | 135.71 |
| 19212 | 47.82 | 4.64 | 1.58 | 2.39 | 3.47 | 5.10 | 8.85 | 17.59 | 41.90 | 124.84 |
| 1941 | 39.81 | 4.12 | 1.28 | 2.22 | 2.67 | 3.72 | 8.02 | 18.16 | 43.06 | 129.00 |
| 1961 | 22.76 | 1.26 | 0.42 | 0.92 | 1.18 | 2.31 | 5.99 | 15.43 | 37.71 | 113.84 |
| 1981 | 11.65 | 1.56 | 0.29 | 1.11 | 0.99 | 1.89 | 5.29 | 13.15 | 32.67 | 95.41 |
| 2001R | 5.30 | 0.33 | 0.19 | 0.75 | 0.84 | 1.22 | 2.86 | 7.65 | 21.07 | 78.11 |
| 2002 | 5.55 | 0.35 | 0.17 | 0.65 | 0.83 | 1.27 | 2.84 | 7.43 | 20.15 | 77.84 |
| 2003P | 4.93 | 0.35 | 0.16 | 0.70 | 0.81 | 1.28 | 2.90 | 7.05 | 19.42 | 75.62 |
Significant ethnic differentials exist in mortality rates.
According to 2000-2002 life tables, a newborn non-Māori girl could expect to live 81.9 years, and a newborn non-Māori boy could expect to live 77.2 years.
For Māori, life expectancy at birth was 73.2 years for females and 69.0 years for males. Lower non-Māori death rates at ages 45-79 years account for about three-quarters of these differences, and this partly reflects different rates of smoking and diabetes, as well as socio-economic differentials.
For example, the 1996 Census reported that 44 percent of Māori aged 15 and over were regular smokers, compared with 21 percent of non-Māori.
Women live longer than men and experience lower death rates at all ages, although men have closed the gap in recent decades.
A century ago, women could expect to outlive men by about 2.5 years. By 1950-1952, the female advantage had increased to 4.1 years, and by 1975-1977 it was 6.4 years. However, the male-female difference had narrowed to 4.8 years in 2000-2002.
Figure 5.10 shows movements in the median age at death for males and females since 1950.
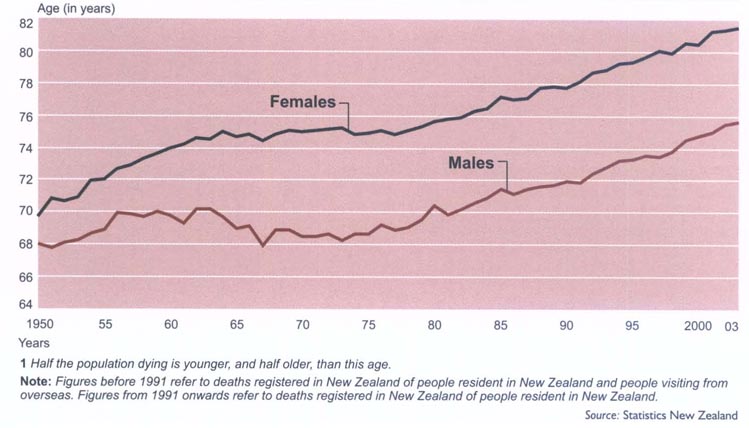
New Zealand has traditionally been a country of immigration, although the intake has been small compared with immigration flows to New World countries such as Australia, Canada and the United States.
The end of World War II saw economic stability and reintroduction, in 1947, of an assisted/free passage scheme to attract working-age industrial and agricultural labour from the United Kingdom. Agreements were also negotiated to accept young non-British European migrants, and refugee immigration was allowed on humanitarian grounds. These grounds were to lead to the settlement of nearly 4,000 Indo-Chinese refugees in New Zealand during 1978-82.
Historical and regional considerations also led to establishment of immigration quotas for small Pacific Island countries.
The government adopted a new immigration policy in 1974, which ended unrestricted immigration from the United Kingdom and Ireland and provided for the selection of immigrants from all sources on the same criteria.
The reciprocal Trans-Tasman Travel Agreement, which allows free movement of residents between Australia and New Zealand, was not changed.
Similarly, the right of free entry into New Zealand was maintained for the people of the Cook Islands, Niue and the Tokelau Islands, who are regarded as New Zealand citizens. As a result, immigrants in post-war years have come from a wider range of countries than before.
Between 1950 and 1967, New Zealand recorded a net gain of about 270,000 permanent and long-term migrants. In 16 of the 18 years, net migration was more than 10,000.
The economic recession of the late 1960s turned the tide again. A significant drop in immigration and a sharp upturn in emigration resulted in a net outflow of 7,387 during 1968-1970.
While annual net migration in the following nine-year period varied between a net inflow of 27,477 in 1974 and a net outflow of 40,200 in 1979, the result was a small outflow of 2,831 people.
The two most recent decades have seen major and unprecedented changes in external migration levels and patterns. The preponderance of immigrants from the United Kingdom and Ireland has decreased and migration to and from Australia has become the largest in terms of volume. The rate of migration has increased significantly and there have been dramatic shifts in the flow of migrants.
The 1980s brought radical changes in permanent and long-term migration (people whose stated intention is arriving to settle, or departing for 12 months or more).
Permanent and long-term departures had shown an almost unbroken upward trend since the 1950s, rising from 6,886 in 1950 to 81,008 in 1979.
In the year ending 31 March 1980, the number of permanent and long-term departures declined by 6 percent. By 1984, the number of emigrants had fallen to 34,147. A drop in departures to Australia accounted for about 60 percent of this decline.
For the first time since 1976, more people arrived in New Zealand than left in 1983 and 1984, giving small gains to the country of 3,180 and 6,558 respectively. The turnaround was short-lived, however.
During the remainder of the 1980s, the number of departures resumed an upward movement, reaching a peak in 1989, with 70,941 emigrants, giving a net outflow of 24,708 people for that year.
The 1990s saw a return to net population gains from migration, resulting from both increases in the number of permanent and long-term arrivals, and decreases in departures.
In the year ending 31 March 1991, there was a net gain of 11,616 people.
By 1995 this had almost doubled to 21,697 and by 1996 reached 29,832. This figure dropped to 20,948 in 1997 and further to 2,707 in 1998.
Between 1999 and 2001, there were net population losses from migration, with departures exceeding arrivals by 12,600 in 2001.
There was a net gain of 25,635 in 2002 and, during the year ending 31 March 2003, arrivals exceeded departures by 41,592 - the highest recorded March year net gain of permanent and long-term migrants.
Net migration from Asia increased significantly between 1988 and 1996, then declined over the next three years, before steadily increasing between 2000 and 2003, when a net gain of 32,655 was recorded.
Table 5.16 provides a summary of external migration from 1880 to 2003.
Table 5.16. External migration Years ending 31 March
| Year | Total | Permanent and long-term | Short-term | ||||||
|---|---|---|---|---|---|---|---|---|---|
| Arrivals | Departures | Net | Arrivals | Departures | Net | Arrivals | Departures | Net | |
Rrevised Note:Only total arrivals and departures recorded prior to 1930. Source: Statistics New Zealand | |||||||||
| Five-year totals | |||||||||
| 1880 | 98,877 | 30,376 | 68,501 | ||||||
| 1885 | 73,861 | 44,776 | 29,085 | ||||||
| 1890 | 75,063 | 79,747 | -4,684 | ||||||
| 1895 | 101,508 | 88,067 | 13,441 | ||||||
| 1900 | 93,037 | 84,398 | 8,639 | ||||||
| 1905 | 141,678 | 99,501 | 42,177 | ||||||
| 1910 | 190,772 | 146,783 | 43,989 | ||||||
| 1915 | 202,087 | 165,286 | 36,801 | ||||||
| 1920 | 98,473 | 90,532 | 7,941 | ||||||
| 1925 | 199,791 | 151,285 | 48,506 | ||||||
| 1930 | 192,606 | 167,346 | 25,260 | 53,988 | 16,081 | 37,907 | 138,618 | 151,265 | -12,647 |
| 1935 | 111,933 | 118,076 | -6,143 | 13,466 | 14,830 | -1,364 | 98,467 | 103,246 | -4,779 |
| 1940 | 171,424 | 159,514 | 11,910 | 22,871 | 19,267 | 3,604 | 148,553 | 140,247 | 8,306 |
| 1945 | 35,003 | 32,414 | 2,589 | 6,597 | 9,241 | -2,644 | 28,406 | 23,173 | 5,233 |
| 1950 | 158,637 | 135,439 | 23,198 | 51,487 | 30,020 | 21,467 | 107,150 | 105,419 | 1,731 |
| 1955 | 306,837 | 239,148 | 67,689 | 116,510 | 37,419 | 79,091 | 190,327 | 201,729 | -11,402 |
| 1960 | 395,218 | 347,021 | 48,197 | 115,308 | 51,169 | 64,139 | 279,910 | 295,852 | -15,942 |
| 1965 | 737,703 | 676,137 | 61,566 | 156,462 | 75,055 | 81,407 | 581,241 | 601,082 | -19,841 |
| 1970 | 1,278,867 | 1,273,409 | 5,458 | 155,008 | 127,814 | 27,194 | 1,123,859 | 1,145,595 | -21,736 |
| 1975 | 2,506,714 | 2,400,234 | 106,480 | 274,842 | 196,993 | 77,849 | 2,231,872 | 2,203,241 | 28,631 |
| 1980 | 3,793,483 | 3,874,575 | -81,092 | 204,867 | 319,964 | -115,097 | 3,588,616 | 3,554,611 | 34,005 |
| 1985 | 4,772,257 | 4,766,993 | 5,264 | 213,059 | 247,712 | -34,653 | 4,559,198 | 4,519,281 | 39,917 |
| 1990 | 7,359,340 | 7,394,389 | -35,049 | 226,420 | 306,653 | -80,233 | 7,132,920 | 7,087,736 | 45,184 |
| 1995 | 9,773,429 | 9,711,641 | 61,788 | 280,508 | 220,473 | 60,035 | 9,492,921 | 9,491,168 | 1,753 |
| 2000 | 13,519,016 | 13,462,491 | 56,525 | 337,781 | 303,480 | 34,301 | 13,181,235 | 13,159,011 | 22,224 |
| Annual totals | |||||||||
| 1987 | 1,321,729 | 1,317,372 | 4,357 | 44,360 | 58,629 | -14,269 | 1,277,369 | 1,258,743 | 18,626 |
| 1988 | 1,554,992 | 1,555,949 | -957 | 47,844 | 63,469 | -15,625 | 1,507,148 | 1,492,480 | 14,668 |
| 1989 | 1,669,637 | 1,687,935 | -18,298 | 46,233 | 70,941 | -24,708 | 1,623,404 | 1,616,994 | 6,410 |
| 1990 | 1,701,056 | 1,702,689 | -1,633 | 52,001 | 56,019 | -4,018 | 1,649,055 | 1,646,670 | 2,385 |
| 1991 | 1,772,524 | 1,757,948 | 14,576 | 57,088 | 45,472 | 11,616 | 1,715,436 | 1,712,476 | 2,960 |
| 1992 | 1,809,885 | 1,806,947 | 2,938 | 49,010 | 44,723 | 4,287 | 1,760,875 | 1,762,224 | -1,349 |
| 1993 | 1,898,769 | 1,890,689 | 8,080 | 49,562 | 42,714 | 6,848 | 1,849,207 | 1,847,975 | 1,232 |
| 1994 | 2,057,005 | 2,041,212 | 15,793 | 57,257 | 41,670 | 15,587 | 1,999,748 | 1,999,542 | 206 |
| 1995 | 2,235,246 | 2,214,845 | 20,401 | 67,591 | 45,894 | 21,697 | 2,167,655 | 2,168,951 | -1,296 |
| 1996 | 2,464,732 | 2,436,106 | 28,626 | 80,288 | 50,456 | 29,832 | 2,384,444 | 2,385,650 | -1,206 |
| 1997 | 2,726,897 | 2,689,118 | 37,779 | 76,896 | 55,948 | 20,948 | 2,650,001 | 2,633,170 | 16,831 |
| 1998 | 2,651,737R | 2,649,814R | 1,923R | 62,928 | 60,221 | 2,707 | 2,588,809R | 2,589,593R | -784R |
| 1999 | 2,755,895R | 2,769,847R | -13,952R | 56,580 | 66,779 | -10,199 | 2,699,315R | 2,703,068R | -3,753R |
| 2000 | 2,919,755 | 2,917,606 | 2,149 | 61,089 | 70,076 | -8,987 | 2,858,666 | 2,847,530 | 11,136 |
| 2001 | 3,218,995 | 3,214,037 | 4,958 | 66,465 | 79,065 | -12,600 | 3,152,530 | 3,134,972 | 17,558 |
| 2002 | 3,336,555 | 3,269,158 | 67,397 | 88,365 | 62,730 | 25,635 | 3,248,190 | 3,206,428 | 41,762 |
| 2003 | 3,481,498 | 3,417,540 | 63,958 | 98,671 | 57,079 | 41,592 | 3,382,827 | 3,360,461 | 22,366 |
The age and sex profile of a population represents the cumulative effect of past changes in the dynamics of population growth - fertility, mortality and migration.
There are slightly more females than males in the New Zealand population at present. This contrasts with early colonial days, when there was a large surplus of males, especially young males. Each census has seen the sex ratio draw closer to parity, with two exceptions when there was a temporary excess of females - during World War I and, again, during World War II. Females again outnumbered males in 1968 and the ratio has increased steadily since then, with the 2001 Census showing 1,823,007 males and 1,914,273 females usually resident in New Zealand, representing a sex ratio of 95 males to 100 females.
Figure 5.11 shows the age and sex distribution of the New Zealand population at 10-year intervals from 1971 to 2001.
Changes in the age structure of New Zealand's population have been profound during the past 100 years. The changes largely reflect ‘roller coaster’ movements in the birth rate, with small and large birth cohorts moving through the age structure. However, migration gains and losses (dominated by people of younger and middle working ages) have added significantly to these structural changes.
The ‘baby boom’ lifted the proportion of children in the population to 33 percent in 1961, with nearly half the population under the age of 25.
The subsequent sharp decline in fertility, increased longevity and movement of the ‘baby boomers’ into working ages caused a major realignment of the age structure. The median age of the population rose by 8.3 years between 1976 and 2001, from 26.5 years to 34.8 years.
At the 2001 Census, there were 847,743 children under the age of 15, down from 928,205 in 1976. They made up 23 percent of the population (down from 30 percent in 1976). The 15-64 age group has risen considerably since 1976 (by more than half a million) to number 2,439,111 at the 2001 Census. However, the proportion of the male population in working ages has declined slightly since 1991, whereas the proportion of the female population in the working ages has continued to increase.
The greatest change in the age structure of the population is at the older ages. Since 1976, the number of people aged 65 and over has increased by more than one and-a-half times and the number aged 80 and over has more than doubled.
There are population sub-groups within New Zealand with remarkably different age structures.
Ethnic groups such as Māori and Pacific peoples have more youthful populations, commonly characteristic of developing nations. At the 2001 Census, they contained nearly twice the proportion of children under 15 years as their European or Asian counterparts. Nearly two-thirds of their populations were under 30 and their median ages were about 15 years lower than their European counterparts.
At the other end of the age scale, only about 4 percent of the Māori, Asian and Pacific peoples populations were aged 65 or more, compared with 14 percent for the European ethnic group, reflecting both different life expectancy and recent migration history.
Figure 5.12 shows birth and death rates since 1855.
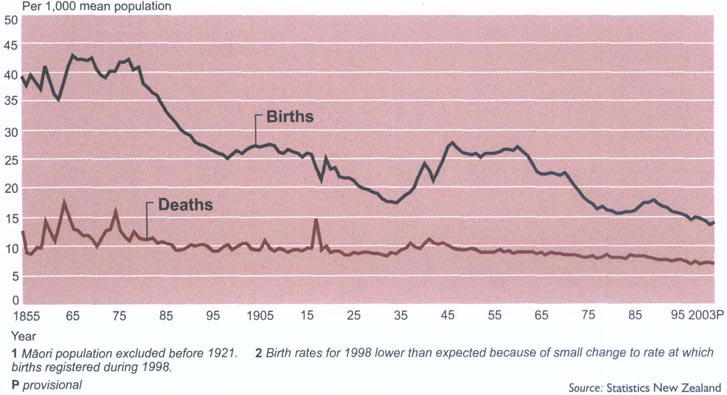
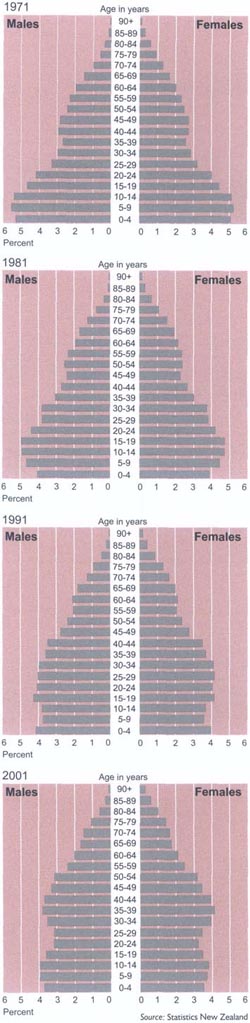
Table of Contents
‘A country where young people are vibrant and optimistic through being supported and encouraged to take up challenges.’ - Youth Development Strategy Aotearoa vision statement.
Ethnicity is a key variable in explaining differences in social characteristics, social well-being and social change. The population census has traditionally been the main source of national statistics on ethnicity in New Zealand, although prior to 1991 a biological or race-based measure was used. Since 1991, people have been asked to identify which ethnic group or groups they belong to, and multiple responses are counted.
The 2001 Census question differed from that used in the 1996 Census in two main ways: the wording of the question did not encourage multiple responses, and there were no tick-box categories for European ethnic groups, apart from New Zealand European.
As a result, data from the 1991 Census, which used a similar ethnicity question to 2001, is being used for comparison purposes.
Information presented in this chapter is based on the census usually resident population count. This is a count of all people who usually live in New Zealand and were present in New Zealand on the night of the census. It excludes visitors from overseas and New Zealand residents who were temporarily overseas on census night.
In 2001, nine out of 10 people living in New Zealand identified with one ethnic group only, but young people were far more likely to list multiple ethnicities. For example, one in five children under the age of five gave more than one ethnic response in 2001. This is a reflection of the increasing ethnic diversity of the New Zealand population.
As Table 6.01 on page 96 shows, 80 percent of people living in New Zealand in 2001 were European. However, compared with other major ethnic groups, there had been only a small increase in the European population since 1991.
The Māori population grew by 21 percent between 1991 and 2001, to comprise just under 15 percent of the population.
Other major ethnic groups made even more rapid gains, with the Asian population more than doubling in the same period to 6.6 percent of the total population.
For the first time in recent censuses, people of Asian ethnicity outnumbered Pacific peoples (6.5 percent of the population) in 2001.
Table 6.01. Ethnic groups of population (total responses)
| Ethnic group (total people) | 1991 Census | 2001 Census | Intercensal percentage change 1991-2001 | ||
|---|---|---|---|---|---|
| Number | Percentage of population12 | Number | Percentage of population12 | ||
1Includes response unidentifiable, response outside scope and not stated. 2Calculated in terms of specified cases only. – figure too small to be expressed Note:The number of responses is greater than the total population, as multiple responses are counted Source: Statistics New Zealand | |||||
| European | 2,783,025 | 83.2 | 2,868,009 | 80.0 | 3.1 |
| Māori | 434,847 | 13.0 | 526,281 | 14.7 | 21.0 |
| Pacific peoples | 167,070 | 5.0 | 231,798 | 6.5 | 38.7 |
| Asian | 99,756 | 3.0 | 237,459 | 6.6 | 138.0 |
| Other | 6,693 | 0.2 | 24,924 | 0.7 | 272.4 |
| Not elsewhere included | 28,113 | 150,546 | |||
| Total New Zealand resident population | 3,373,926 | 3,737,277 | 10.8 | ||
| Selected ethnic groups (total responses) | |||||
| New Zealand European | 2,618,445 | 78.3 | 2,689,308 | 75.0 | 2.7 |
| Māori | 434,847 | 13.0 | 526,281 | 14.7 | 21.0 |
| Samoan | 85,743 | 2.6 | 114,432 | 3.2 | 33.5 |
| Chinese | 44,136 | 1.3 | 100,203 | 2.8 | 127.0 |
| Indian | 29,820 | 0.9 | 59,823 | 1.7 | 100.6 |
| Cook Island Maori | 37,233 | 1.1 | 51,141 | 1.4 | 37.4 |
| Tongan | 23,175 | 0.7 | 40,713 | 1.1 | 75.7 |
| English | 53,325 | 1.6 | 34,074 | 1.0 | -36.1 |
| Dutch | 24,732 | 0.7 | 27,396 | 0.8 | 10.8 |
| Niuean | 14,427 | 0.4 | 20,148 | 0.6 | 39.7 |
| Korean | 930 | – | 19,026 | 0.5 | 1,945.8 |
| British | 16,659 | 0.5 | 16,524 | 0.5 | -0.8 |
| South African | 2,007 | 0.1 | 14,889 | 0.4 | 641.9 |
| Scottish | 14,094 | 0.4 | 12,792 | 0.4 | -9.2 |
| Irish | 7,392 | 0.2 | 11,199 | 0.3 | 51.5 |
| Filipino | 4,917 | 0.1 | 11,091 | 0.3 | 125.6 |
| Japanese | 2,970 | 0.1 | 10,002 | 0.3 | 236.8 |
| Fijian | 5,100 | 0.2 | 7,041 | 0.2 | 38.1 |
| Tokelauan | 4,146 | 0.1 | 6,204 | 0.2 | 49.6 |
| Sri Lanka | 2,406 | 0.1 | 6,042 | 0.2 | 151.1 |
| Arab | 177 | – | 2,856 | 0.1 | 1,513.6 |
| Croat/Croatian | 171 | – | 2,502 | 0.1 | 1,363.2 |
| Iraqi | 246 | – | 2,145 | 0.1 | 772.0 |
There were also large gains in the ‘other’ ethnic group, which includes African, Middle Eastern and South American ethnic groups. These increases largely reflect changes in migrant source countries and a move away from the more traditional source countries such as the United Kingdom. Ethnic groups such as Korean, Arab, Croatian, Iraqi and South African are examples of specific ethnic groups that made huge population gains in the past decade. Table 6.02 compares the age structure of the major ethnic groups in New Zealand.
Table 6.02. Comparison of age structure of major ethnic groups 2001 Census
| Age group (in years) | Proportion of population in age groups | ||||
|---|---|---|---|---|---|
| European | Māori | Pacific peoples | Asian | Other | |
Note:Figures may not add to stated totals due to rounding. Source: Statistics New Zealand | |||||
| Percent | |||||
| 0- 4 | 6.8 | 12.8 | 14.1 | 7.7 | 10.0 |
| 5-14 | 14.7 | 24.5 | 24.7 | 15.9 | 19.7 |
| 15-24 | 12.4 | 17.4 | 17.8 | 21.5 | 18.3 |
| 25-34 | 13.5 | 15.1 | 15.4 | 15.9 | 17.6 |
| 35-44 | 15.4 | 13.5 | 12.4 | 17.9 | 17.5 |
| 45-54 | 13.6 | 8.5 | 7.8 | 11.4 | 9.8 |
| 55-64 | 9.7 | 4.8 | 4.4 | 5.6 | 4.1 |
| 65-74 | 7.4 | 2.5 | 2.3 | 2.9 | 2.0 |
| 75-84 | 4.9 | 0.7 | 0.8 | 0.9 | 0.8 |
| 85 and over | 1.6 | 0.1 | 0.1 | 0.2 | 0.3 |
| Total | 100.0 | 100.0 | 100.0 | 100.0 | 100.0 |
The increasing diversity of New Zealand's population is reflected in changes in the country of birth of the population. In 2001, people who were born in New Zealand made up 80.5 percent of those people who usually live in New Zealand, down from 82.5 percent in 1996 (see Table 6.03).
Table 6.03. Country of birth of population
| Country of birth | 1996 Census | 2001 Census | Intercensal percentage change 1996-2001 | ||
|---|---|---|---|---|---|
| Number | Percentage of responses1 | Number | Percentage of responses1 | ||
1Calculated in terms of specified cases only. ... not applicable Note:All totals randomly rounded to base 3. Source: Statistics New Zealand | |||||
| New Zealand | 2,848,209 | 82.5 | 2,890,869 | 80.5 | 1.5 |
| Australia | 54,711 | 1.6 | 56,259 | 1.6 | 2.8 |
| Samoa | 42,174 | 1.2 | 47,118 | 1.3 | 11.7 |
| Fiji | 18,774 | 0.5 | 25,725 | 0.7 | 37.0 |
| Tonga | 14,040 | 0.4 | 18,051 | 0.5 | 28.6 |
| Cook Islands | 13,755 | 0.4 | 15,222 | 0.4 | 10.7 |
| Other Oceania and Antarctica | 10,533 | 0.3 | 11,877 | 0.3 | 12.8 |
| Total Oceania and Antarctica | 3,002,193 | 86.9 | 3,065,121 | 85.4 | 2.1 |
| United Kingdom and Ireland | 230,049 | 6.7 | 225,123 | 6.3 | -2.1 |
| Netherlands | 23,430 | 0.7 | 22,242 | 0.6 | -5.1 |
| Germany | 7,068 | 0.2 | 8,382 | 0.2 | 18.6 |
| Other Europe | 25,098 | 0.7 | 28,923 | 0.8 | 15.2 |
| Total Europe | 285,648 | 8.3 | 284,670 | 7.9 | -0.3 |
| North Africa and Middle East | 7,239 | 0.2 | 12,174 | 0.3 | 68.2 |
| Malaysia | 11,889 | 0.3 | 11,460 | 0.3 | -3.6 |
| Philippines | 7,002 | 0.2 | 10,137 | 0.3 | 44.8 |
| Other South-east Asia | 18,441 | 0.5 | 23,595 | 0.7 | 27.9 |
| China | 19,518 | 0.6 | 38,949 | 1.1 | 99.6 |
| Korea, Republic of | 12,183 | 0.4 | 17,934 | 0.5 | 47.2 |
| Taiwan | 10,932 | 0.3 | 12,486 | 0.3 | 14.2 |
| Hong Kong | 11,763 | 0.3 | 11,301 | 0.3 | -3.9 |
| Japan | 6,501 | 0.2 | 8,622 | 0.2 | 32.6 |
| India | 12,807 | 0.4 | 20,889 | 0.6 | 63.1 |
| Other North-east, Southern and Central Asia | 6,885 | 0.2 | 10,401 | 0.3 | 51.1 |
| Total Asia | 117,915 | 3.4 | 177,948 | 4.6 | 50.9 |
| Northern America | 19,065 | 0.6 | 21,114 | 0.6 | 10.7 |
| Central and Southern America | 3,561 | 0.1 | 4,395 | 0.1 | 23.4 |
| Total America | 22,626 | 0.7 | 25,509 | 0.7 | 12.7 |
| South Africa | 11,334 | 0.3 | 26,061 | 0.7 | 129.9 |
| Other sub-Saharan Africa | 6,114 | 0.2 | 10,152 | 0.3 | 66.0 |
| Total sub-Saharan Africa | 17,445 | 0.5 | 36,213 | 1.0 | 107.6 |
| Not specified/born at sea | 165,078 | ... | 147,816 | ... | -10.5 |
| Total | 3,618,303 | 3,737,277 | 3.3 | ||
Between 1996 and 2001, New Zealand's overseas-born population rose by approximately 93,600, an increase of 15.5 percent. Much of this increase occurred in Auckland, where people born overseas now account for one in every three.
While people born in the United Kingdom and Ireland continue to comprise the largest immigrant group, at around 6.3 percent of the total population, their number fell slightly, by 4,926, between 1996 and 2001. There were large increases in the number of people born in Asia, Africa and the Middle East. The proportion of the New Zealand population born in Asia increased from 3.4 percent to 4.6 percent during the period 1996 to 2001. Those born in China doubled, from 19,518 in 1996 to 38,949 in 2001. In the same period, the Indian-born population increased by 63.1 percent (to 20,889), those born in the Republic of Korea by 47.2 percent (to 17,934), and the Philippines-born population by 44.8 percent (to 10,137).
The number of people born in South Africa increased by 129.9 percent between 1996 and 2001, to 26,061. The number of people born in North Africa and the Middle East rose from 7,239 in 1996 to 12,174 in 2001, an increase of 68.2 percent. The rest of the sub-Saharan-born population increased by 66 percent, to 10,152.
Figure 6.01 shows birthplaces as a proportion of all New Zealanders born overseas.
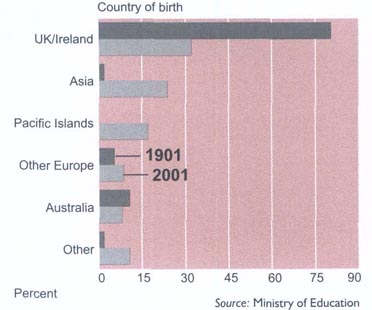
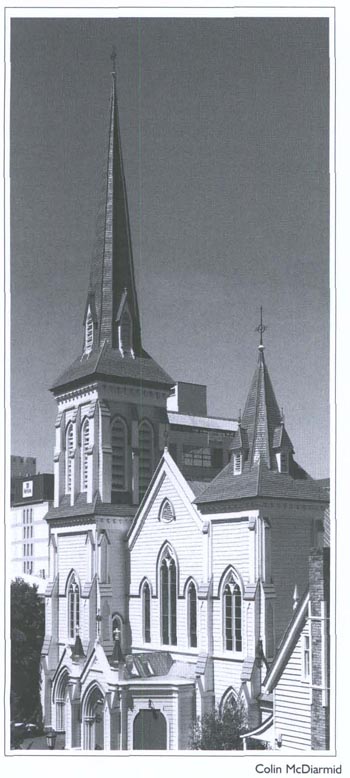
Christianity remains the dominant religion of New Zealanders, with 61 percent of 2001 Census respondents identifying with this group.
Changes to the 2001 Census question on religious affiliation mean direct intercensal comparisons cannot be made. Previous censuses collected only one response for religious affiliation, whereas up to four responses were collected in 2001.
Results from the 2001 Census showed that Christianity (including Māori Christian) remained the dominant religion, with 61 percent of people identifying an affiliation to this group. Around 30 percent of people stated they had no religion, and 7 percent objected to answering the religious affiliation question.
Within the Christian religion, the Anglican (28 percent), Catholic (23 percent), Presbyterian (20 percent) and Methodist (6 percent) denominations continued to have the majority of affiliates. Together their members made up more than 75 percent of all Christian denominations (including Māori Christian). Of those who identified with Māori Christian, the most popular denominations were Rātana (77 percent) and Ringatū (24 percent).
Although non-Christian religions are becoming more established in New Zealand, they each still make up only about 1 percent of the population. The three most common non-Christian religions in 2001 were Buddhist (1 percent), Hindu (1 percent) and Islam/Muslim (0.7 percent).
Table 6.04 summarises responses to the religious affiliation question in the 1991, 1996 and 2001 Censuses.
Table 6.04. Religious affiliation1
| Religious affiliation (total responses) | 1991 | 1996 | 2001 |
|---|---|---|---|
1Data for 2001 not directly comparable with previous data, as in the 1991 and 1996 censuses only one response to religious affiliation was collected. In the 2001 Census, up to four responses were collected. Where a person reported more than one religious affiliation, each was counted in its applicable group. The 1991 and 1996 data includes Ecumenical, which, in 2001, was included in Uniting/Union Church and Ecumenical. The 1996 data includes Fundamentalist and Born Again, which, in 2001, was included in Evangelical, Born Again and Fundamentalist. .. figures not available Note:All totals randomly rounded to base 3. Source: Statistics New Zealand | |||
| Buddhist | 12,762 | 28,131 | 41,634 |
| Anglican | 732,048 | 631,764 | 584,793 |
| Catholic | 498,612 | 473,112 | 486,012 |
| Presbyterian, Congregational and Reformed | 553,386 | 470,442 | 431,547 |
| Christian (not further defined) | 79,317 | 186,891 | 192,165 |
| Methodist | 139,494 | 121,650 | 120,705 |
| Pentecostal | 49,596 | 69,333 | 67,239 |
| Baptist | 70,155 | 53,613 | 51,426 |
| Latter-day Saints | 48,009 | 41,166 | 39,912 |
| Brethren | 21,915 | 21,933 | 20,406 |
| Jehovah's Witness | 19,182 | 19,527 | 17,826 |
| Adventist | 15,675 | 14,691 | 14,868 |
| Salvation Army | 19,992 | 14,625 | 12,618 |
| Evangelical, Born Again and Fundamentalist | 5,169 | 1,584 | 11,019 |
| Orthodox | 4,263 | 6,933 | 9,588 |
| Lutheran | 4,965 | 5,007 | 4,314 |
| Other Christian | 3,276 | 2,766 | 3,558 |
| Church of Christ and Associated Churches of Christ | 4,842 | 4,233 | 3,270 |
| Protestant (not further defined) | 1,785 | 2,778 | 2,784 |
| Uniting/Union Church and Ecumenical | 1,026 | 1,728 | 1,389 |
| Asian Christian | .. | 222 | 195 |
| Hindu | 18,036 | 25,551 | 39,798 |
| Islam | 6,096 | 13,545 | 23,631 |
| Judaism/Jewish | 3,126 | 4,809 | 6,636 |
| Māori Christian | 56,055 | 45,450 | 63,597 |
| Spiritualism and New Age | 5,196 | 9,786 | 16,062 |
| Other | 19,863 | 10,176 | 18,783 |
| No religion | 670,455 | 867,264 | 1,028,052 |
| Object to answering | 251,709 | 256,593 | 239,244 |
| Total people | 3,316,005 | 3,405,306 | 3,468,813 |
New Zealand's citizenship legislation is contained in the Citizenship Act 1977, the Citizenship (Western Samoa) Act 1982 and the Citizenship Regulations 1978. The principal legislation, the 1977 act, includes the territories of the Cook Islands, Niue, Tokelau and the Ross Dependency in the definition of New Zealand for purposes of New Zealand citizenship.
Under the act, a person may be a New Zealand citizen by birth in New Zealand or by descent from a New Zealand citizen parent. British citizens resident in New Zealand throughout 1948 may also apply for the grant of citizenship.
Citizenship by birth. Most people born in New Zealand after 1 January 1949 are New Zealand citizens by birth.
Citizenship by descent. Most people born outside New Zealand after 1 January 1949 to a New Zealand citizen parent are citizens by descent. There are some limitations on this.
In addition, those citizens by descent who were born on or after 1 January 1978 must register their citizenship by descent before their 24th birthday if they wish to remain a citizen.
This can be done in New Zealand through the Citizenship Office.
Those resident overseas may contact their local New Zealand Embassy or High Commission.
New Zealand's citizenship legislation also contains provisions for those adopted by New Zealand citizens.
The grant of citizenship. Migrants to New Zealand who wish to make New Zealand their home may apply for a grant of citizenship.
The general requirements are that applicants satisfy the Minister of Internal Affairs that they:
Have been ordinarily resident in New Zealand for the three years immediately preceding their application.
Are entitled to remain in New Zealand indefinitely (most applicants will be required to have permanent residence status).
Are of good character.
Have a sufficient knowledge of the English language and of the responsibilities and privileges attached to New Zealand citizenship.
Intend to continue to live in New Zealand, or to work overseas in Crown service or for a New Zealand resident or established organisation.
The Citizenship Act 1977 contains special provisions for those who are, or have been, married to a New Zealand citizen, for minors and for people with special circumstances.
The Citizenship (Western Samoa) Act 1982 provides for the grant of citizenship to Samoan citizens and to a small group of other people who have a special association with Samoa.
To be granted citizenship under this act, a person must either have been in New Zealand at any time before 15 September 1982, or have lawfully entered New Zealand after that date and have an entitlement to remain in New Zealand indefinitely (most applicants will be required to have permanent residence status).
Applicants aged 14 and over approved for citizenship are usually required to attend a citizenship ceremony to swear allegiance to Queen Elizabeth II, as Head of State of New Zealand.
After this has been done, the grant of citizenship is complete and a citizenship certificate is provided.
Figure 6.02 shows citizenship applications granted from 1960 to 2003.
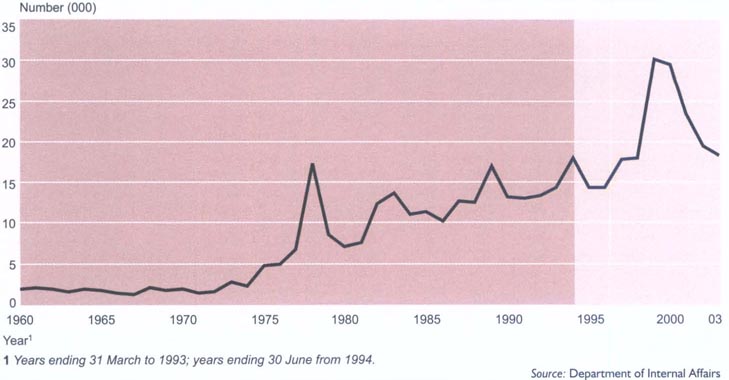
New Zealand citizens may be deprived of their citizenship if it was obtained by fraud, false representation, wilful concealment of relevant information, or by mistake.
New Zealand citizens may also choose to renounce their citizenship if they hold citizenship of another country.
Table 6.05 on page 100 shows the country of birth of approved citizenship applicants from 2000 to 2003.
Table 6.05. Citizenship approvals By country of birth Years ending 31 December
| Country of birth | 2000 | 2001 | 2002 | 2003 |
|---|---|---|---|---|
| Source: Department of Internal Affairs | ||||
| Aden | 0 | 3 | 0 | 0 |
| Afghanistan | 22 | 36 | 125 | 120 |
| Albania | 0 | 3 | 15 | 5 |
| Algeria | 16 | 26 | 11 | 15 |
| American Samoa | 17 | 15 | 21 | 7 |
| Angola | 1 | 0 | 3 | 2 |
| Argentina | 12 | 14 | 14 | 8 |
| Armenia | 2 | 3 | 0 | 3 |
| Australia | 81 | 68 | 92 | 111 |
| Austria | 25 | 15 | 8 | 5 |
| Azerbaijan | 2 | 2 | 2 | 5 |
| Bahamas | 0 | 0 | 0 | 0 |
| Bahrain | 7 | 12 | 6 | 12 |
| Bangladesh | 221 | 73 | 100 | 138 |
| Barbados | 0 | 0 | 0 | 1 |
| Bechuanaland | 0 | 0 | 0 | 0 |
| Belarus | 16 | 3 | 23 | 11 |
| Belgian Congo | 0 | 1 | 0 | 0 |
| Belgium | 9 | 4 | 5 | 6 |
| Belize | 0 | 0 | 0 | 1 |
| Benin | 1 | 0 | 0 | 0 |
| Bermuda | 2 | 2 | 0 | 0 |
| Bhutan | 1 | 0 | 0 | 0 |
| Bolivia | 1 | 5 | 1 | 7 |
| Born at sea | 1 | 0 | 0 | 0 |
| Bosnia | ||||
| -Herzegovina | 49 | 31 | 26 | 20 |
| Botswana | 10 | 8 | 5 | 6 |
| Brazil | 24 | 38 | 28 | 24 |
| British Guiana | 2 | 2 | 0 | 0 |
| British Virgin | ||||
| Islands | 0 | 0 | 0 | 3 |
| Brunei | 24 | 13 | 8 | 4 |
| Bulgaria | 42 | 56 | 50 | 38 |
| Burma | 50 | 32 | 15 | 14 |
| Burundi | 3 | 0 | 13 | 4 |
| Cambodia | 205 | 201 | 269 | 316 |
| Cameroon | 1 | 1 | 2 | 1 |
| Canada | 186 | 183 | 123 | 130 |
| Cayman Islands | 0 | 1 | 0 | 0 |
| Ceylon | 479 | 403 | 29 | 3 |
| Channel Islands | 14 | 15 | 5 | 3 |
| Chile | 15 | 30 | 11 | 25 |
| China | 3,752 | 2,579 | 1,896 | 2,032 |
| Colombia | 11 | 6 | 15 | 20 |
| Congo | 3 | 0 | 1 | 11 |
| Costa Rica | 1 | 2 | 3 | 4 |
| Croatia | 135 | 81 | 40 | 40 |
| Cuba | 0 | 2 | 1 | 1 |
| Cyprus | 11 | 3 | 4 | 6 |
| Czech Republic | 1 | 2 | 4 | 18 |
| Czechoslovakia | 21 | 14 | 7 | 1 |
| Democratic Republic of the Congo | 0 | 0 | 0 | 20 |
| Denmark | 6 | 4 | 7 | 3 |
| Dominican Republic | 1 | 1 | 0 | 0 |
| East Germany | 3 | 2 | 0 | 0 |
| Ecuador | 2 | 2 | 1 | 2 |
| Egypt | 237 | 164 | 75 | 105 |
| El Salvador | 9 | 1 | 2 | 0 |
| England | 3,064 | 2,527 | 1,823 | 1,893 |
| Eritrea | 2,5 | 15 | 19 | |
| Estonia | 1 | 2 | 1 | 0 |
| Ethiopia | 79 | 109 | 154 | 103 |
| Falkland Islands | 0 | 2 | 0 | 0 |
| Fiji | 1,253 | 1,273 | 1,139 | 1,047 |
| Finland | 2 | 4 | 1 | 15 |
| France | 45 | 38 | 46 | 39 |
| French Indo-China | 79 | 54 | 10 | 1 |
| French Polynesia | 8 | 0 | 4 | 3 |
| French Territory of the Afars and Issas | 0 | 1 | 0 | 0 |
| Georgia | 11 | 8 | 6 | 6 |
| Germany | 42 | 56 | 59 | 88 |
| Ghana | 26 | 26 | 21 | 11 |
| Gibraltar | 5 | 2 | 1 | 1 |
| Gilbert and Ellice Islands | 5 | 10 | 5 | 1 |
| Gilberts Islands | 0 | 1 | 0 | 0 |
| Gold Coast | 2 | 2 | 0 | 0 |
| Greece | 7 | 10 | 6 | 7 |
| Guam | 0 | 0 | 2 | 0 |
| Guatemala | 0 | 5 | 3 | 0 |
| Guyana | 1 | 1 | 0 | 0 |
| Haiti | 0 | 0 | 1 | 0 |
| Honduras | 1 | 0 | 0 | 0 |
| Hong Kong | 1,270 | 740 | 539 | 255 |
| Hungary | 21 | 15 | 18 | 16 |
| Iceland | 1 | 0 | 0 | 0 |
| India | 1,847 | 1,376 | 1,350 | 1,255 |
| Indonesia | 108 | 74 | 106 | 93 |
| Inner Mongolia | 0 | 0 | 0 | 0 |
| Iran | 180 | 204 | 240 | 228 |
| Iraq | 1,047 | 528 | 434 | 509 |
| Ireland | 0 | 5 | 32 | 26 |
| Isle of Man | 1 | 0 | 5 | 1 |
| Israel | 38 | 21 | 30 | 24 |
| Italy | 22 | 37 | 23 | 30 |
| Ivory Coast | 0 | 1 | 1 | 1 |
| Jamaica | 5 | 3 | 5 | 5 |
| Japan | 32 | 39 | 29 | 27 |
| Jordan | 53 | 50 | 23 | 27 |
| Kazakhstan | 18 | 20 | 21 | 12 |
| Kenya | 40 | 44 | 52 | 43 |
| Kiribati | 0 | 1 | 6 | 3 |
| Korea | 1,954 | 1,036 | 668 | 594 |
| Kuwait | 55 | 90 | 62 | 48 |
| Kyrgyzstan | 0 | 0 | 2 | 1 |
| Laos | 62 | 18 | 17 | 13 |
| Latvia | 4 | 11 | 0 | 9 |
| Lebanon | 27 | 6 | 14 | 19 |
| Lesotho | 0 | 0 | 2 | 1 |
| Liberia | 6 | 7 | 5 | 5 |
| Libya | 19 | 9 | 14 | 5 |
| Lithuania | 3 | 1 | 2 | 2 |
| Luxembourg | 0 | 0 | 0 | 1 |
| Macao | 21 | 21 | 14 | 5 |
| Macedonia | 328 | 89 | 58 | 19 |
| Madagascar | 2 | 0 | 1 | 3 |
| Malawi | 2 | 5 | 9 | 1 |
| Malaya | 146 | 125 | 8 | 1 |
| Malaysia | 183 | 202 | 234 | 289 |
| Maldives | 2 | 0 | 0 | 1 |
| Mali | 0 | 0 | 1 | 1 |
| Malta | 5 | 5 | 5 | 4 |
| Mauritius | 5 | 3 | 7 | 6 |
| Mexico | 12 | 24 | 9 | 16 |
| Micronesia | 0 | 0 | 0 | 0 |
| Moldova | 0 | 5 | 1 | 1 |
| Mongolia | 0 | 0 | 0 | 2 |
| Morocco | 8 | 11 | 6 | 10 |
| Mozambique | 2 | 5 | 0 | 2 |
| Myanmar | 0 | 6 | 22 | 23 |
| Namibia | 8 | 23 | 24 | 26 |
| Nauru | 2 | 1 | 0 | 4 |
| Nepal | 64 | 56 | 33 | 24 |
| Netherlands Antilles | 1 | 0 | 0 | 0 |
| Netherlands East Indies | 10 | 7 | 0 | 1 |
| Netherlands New Guinea | 0 | 0 | 2 | 0 |
| New Caledonia | 4 | 4 | 0 | 2 |
| New Hebrides | 1 | 0 | 1 | 0 |
| New Zealand | 4 | 2 | 0 | 0 |
| Nigeria | 26 | 33 | 23 | 27 |
| North Borneo | 4 | 6 | 1 | 0 |
| North Vietnam | 23 | 30 | 5 | 0 |
| Northern Ireland | 84 | 72 | 37 | 49 |
| Northern Mariana Islands | 1 | 1 | 0 | 0 |
| Northern Rhodesia | 34 | 23 | 8 | 3 |
| Norway | 2 | 3 | 3 | 5 |
| Nyasaland | 2 | 0 | 0 | 1 |
| Oman | 12 | 6 | 4 | 5 |
| Ottoman Empire | 1 | 0 | 0 | 0 |
| Pakistan | 473 | 172 | 168 | 134 |
| Palau | 0 | 0 | 0 | 0 |
| Palestine | 2 | 10 | 12 | 3 |
| Panama | 3 | 1 | 0 | 1 |
| Papua New Guinea | 6 | 5 | 13 | 9 |
| Paraguay | 0 | 1 | 0 | 2 |
| Peru | 30 | 26 | 19 | 13 |
| Philippines | 949 | 829 | 652 | 555 |
| Pitcairn Island | 1 | 2 | 1 | 0 |
| Poland | 60 | 64 | 43 | 34 |
| Portugal | 5 | 3 | 2 | 5 |
| Portuguese | ||||
| East Africa | 0 | 0 | 1 | 0 |
| Portuguese | ||||
| East Timor | 0 | 0 | 0 | 0 |
| Puerto Rico | 0 | 2 | 1 | 1 |
| Qatar | 4 | 8 | 2 | 6 |
| Republic of Ireland | 68 | 59 | 9 | 13 |
| Rhodesia | 0 | 3 | 24 | 15 |
| Romania | 35 | 34 | 43 | 66 |
| Russia | 315 | 149 | 231 | 247 |
| Rwanda | 2 | 5 | 15 | 2 |
| Rwanda-Burundi | 1 | 0 | 0 | 0 |
| Samoa | 19 | 49 | 588 | 820 |
| Sarawak | 3 | 12 | 0 | 0 |
| Saudi Arabia | 43 | 42 | 30 | 13 |
| Scotland | 391 | 292 | 241 | 241 |
| Senegal | 1 | 0 | 0 | 0 |
| Serbia and Montenegro | 0 | 0 | 0 | 4 |
| Seychelles | 1 | 0 | 0 | 0 |
| Sharjah | 1 | 0 | 0 | 0 |
| Sierra Leone | 2 | 4 | 7 | 6 |
| Singapore | 117 | 94 | 91 | 83 |
| Slovakia | 2 | 0 | 1 | 9 |
| Slovenia | 6 | 7 | 4 | 1 |
| Solomon Islands | 4 | 4 | 8 | 5 |
| Somalia | 256 | 313 | 401 | 260 |
| South Africa | 2,010 | 2,028 | 1,973 | 1,992 |
| South Korea | 28 | 17 | 17 | 48 |
| South Vietnam | 68 | 66 | 9 | 1 |
| South West Africa | 9 | 10 | 2 | 1 |
| Southern Rhodesia | 97 | 134 | 27 | 12 |
| Spain | 13 | 10 | 4 | 4 |
| Sri Lanka | 295 | 335 | 539 | 469 |
| St Kitts and Nevis | 0 | 0 | 1 | 2 |
| St Vincent | 1 | 0 | 0 | 0 |
| Sudan | 23 | 28 | 55 | 66 |
| Surinam | 1 | 0 | 1 | 3 |
| Swaziland | 2 | 5 | 3 | 0 |
| Sweden | 8 | 25 | 27 | 33 |
| Switzerland | 76 | 69 | 47 | 60 |
| Syria | 31 | 75 | 26 | 15 |
| Tahiti | 0 | 1 | 3 | 3 |
| Taiwan | 1,970 | 1,619 | 1,069 | 546 |
| Tajikistan | 1 | 0 | 0 | 0 |
| Tanganyika | 11 | 5 | 1 | 0 |
| Tanzania | 4 | 4 | 14 | 12 |
| Thailand | 269 | 217 | 248 | 232 |
| The Gambia | 0 | 0 | 1 | 1 |
| The Netherlands | 123 | 96 | 74 | 88 |
| Tibet | 0 | 1 | 1 | 0 |
| Togo | 2 | 1 | 0 | 1 |
| Tonga | 365 | 408 | 271 | 207 |
| Transjordan | 1 | 0 | 0 | 0 |
| Trinidad and Tobago | 3 | 2 | 1 | 3 |
| Tunisia | 3 | 8 | 6 | 6 |
| Turkey | 40 | 35 | 26 | 23 |
| Turkmenistan | 0 | 0 | 1 | 0 |
| Tuvalu | 4 | 14 | 6 | 10 |
| U.S.A | 363 | 281 | 225 | 348 |
| Uganda | 5 | 4 | 5 | 3 |
| Ukraine | 135 | 90 | 58 | 64 |
| United Arab Emirates | 49 | 90 | 55 | 36 |
| Uruguay | 1 | 2 | 1 | 2 |
| USSR | 179 | 202 | 40 | 32 |
| Uzbekistan | 8 | 12 | 4 | 4 |
| Vanuatu | 0 | 0 | 2 | 3 |
| Venezuela | 4 | 10 | 3 | 3 |
| Vietnam | 80 | 86 | 211 | 213 |
| Wales | 116 | 113 | 76 | 79 |
| West Germany | 64 | 35 | 3 | 1 |
| Western Samoa | 1,683 | 1,541 | 719 | 369 |
| Yemen | 11 | 11 | 2 | 9 |
| Yugoslavia | 427 | 196 | 187 | 292 |
| Zaire | 2 | 3 | 3 | 0 |
| Zambia | 24 | 25 | 25 | 26 |
| Zimbabwe | 21 | 29 | 102 | 98 |
| Total | 29,609 | 23,535 | 19,769 | 18,296 |
Immigration legislation and policy is administered by the New Zealand Immigration Service (NZIS), part of the Department of Labour.
The role of the NZIS is to manage immigration for national advantage on behalf of the government. The NZIS has branches throughout New Zealand and overseas. The Ministry of Foreign Affairs and Trade processes temporary applications on behalf of the NZIS in some countries where the NZIS is not represented.
Residence. People who want to migrate permanently to New Zealand can apply under one of the three residence streams of the New Zealand Immigration Programme: Skilled/business, family sponsored and international/humanitarian. Each stream has a number of categories. For the 2002/03 year, the immigration programme's residence approval target was 45,000 (plus or minus 5,000). This was the same as for the 2001/02 financial year and an increase of 7,000 on the 2000/01 goal.
Residence applications are considered on the basis of whether principal applicants meet the policy criteria set by the government. Principal applicants may include their partners and dependent children in their application. All applicants must meet health and character requirements, and all migrants over the age of 16 in the skilled migrant, investor and entrepreneur categories must meet a minimum standard of English.
The English standard can be met by either exceeding the specified score in the International English Language Testing System (IELTS), or by showing other evidence of English ability. Skilled migrants must have an average of 6.5 on the IELTS scale across the four skill areas (speaking, writing, listening and reading) and business migrants must have an average of 5. Non-principal applicants who do not meet the standard may still be granted residence, provided they purchase English language tuition to be taken up once they arrive in New Zealand.
Skilled/business. This stream consists of the Skilled Migrant Category and the Business Categories of Investor, Entrepreneur and Employees of Businesses Relocating to New Zealand. In 2002/03, there were 30,443 people approved for residence under the skilled/business stream. This represented 63 percent of all approvals. The General Skills Category (GSC) provided 26,650 of these approvals and a further 3,793 people were approved under the business categories.
Skilled Migrant Category (SMC) - The SMC replaced the GSC from 17 December 2003. This policy change shifted the focus of skilled immigration policy from the passive acceptance of residence applications to the active recruitment of applicants with the skills that New Zealand needs. Potential migrants submit expressions of interest, information from which is used to score points for a number of employability and capacity-building factors. Potential migrants must meet a pre-set number of points in order to enter a pool of potential residence applicants. Prospective migrants will be invited to apply for residence based on their ranking in the pool and subject to them meeting health, character and English language requirements and initial verification requirements. Principal applicants who are invited to apply must be aged between 18 and 55 inclusive. Applications for residence are assessed against government residence policy and the applicant's ability to settle and contribute to New Zealand. A person who can demonstrate their ability to settle in New Zealand successfully, through having skilled employment or an offer of skilled employment in New Zealand, or a New Zealand postgraduate qualification may qualify for residence. A person who has potential, but does not have these attributes, will be interviewed to gather more information. Either a residence or a work to residence visa/permit may be issued to these people.
Investor - Applicants are awarded points based on age, business experience and investment funds of at least $1 million. Applicants who reach the pass mark and meet English language, health and character requirements can be issued with residence visas or permits. Once invested, the funds must be retained in New Zealand for two years. Residence can be revoked if this condition is not met.
Entrepreneur - People who have successfully established a business that benefits New Zealand, and have been self-employed in New Zealand in that business for at least two years, can be granted residence under this category. Successful establishment means the applicant has established, purchased, or made a substantial investment in a profit-making business operating in New Zealand. A business is considered to benefit New Zealand if it creates employment, revitalises an existing business, enhances New Zealand's export markets or introduces new skills or technologies to New Zealand.
Employees of Businesses Relocating to New Zealand - This category is available on a case by case basis to essential employees of businesses relocating to New Zealand who do not qualify for residence under any other category.
Family sponsored. Thirty percent of approvals were allocated to the family sponsored stream for the 2002/03 financial year and 13,045 people were approved. The family sponsored stream allows migrants in a variety of close relationships with New Zealand citizens or residents to be sponsored for residence. Sponsors must have held New Zealand residence for at least three years immediately prior to sponsorship, and must sign a declaration that they will provide accommodation and financial support for the first two years of the migrant's residence in New Zealand. Financially dependent children under the age of 25 may also be sponsored. Parents (or grandparents or legal guardians if the parents are dead) qualify for sponsorship under certain conditions. Adult children and siblings who have no siblings or parents in their home country are eligible to be sponsored for residence, along with their dependants, providing they have a job offer in New Zealand. A family quota exists for a small number of sponsored parents, siblings, adult children and grandparents who do not meet other family policy criteria.
Partnership policy. New partnership rules were introduced in September 2003. To qualify for residence under this policy, all applicants have to prove that they have been living in a genuine and stable relationship with a New Zealander for 12 months or more at the time of application, whether or not they are in a marriage or de facto relationship (whether opposite or same sex).
Sources of migration. Of the 48,538 people approved for residence in New Zealand in 2002/03, both China and India accounted for 16 percent each, with a further 14 percent from Great Britain and five percent from South Africa.
In 2001/02, there were 52,856 people approved for residence. China was the source of 17 percent of these approvals, followed by India with 16 percent and Great Britain with 12 percent.
In 2002/03, the General Skills Category (GSC) accounted for 55 percent (26,650) of all approvals and a further 27 percent (13,045) were granted residence under the family sponsored stream.
In 2001/02, the GSC accounted for 59 percent (31,359) of the total number of residence approvals and the family sponsored stream for 22 percent (11,733) of all residence approvals.
The largest percentage of people approved under the GSC in 2002/03 came from India, with 23 percent of GSC approvals, followed by Great Britain and China, both with 15 percent of approvals.
All travellers arriving in New Zealand, including New Zealand citizens, must produce a valid passport or another form of recognised travel document.
With the exception of New Zealand citizens (which includes people born in the Cook Islands, Niue and Tokelau), Australian citizens and a small number of other people exempt under the Immigration Act 1987, everyone entering New Zealand is required to obtain a permit to remain in New Zealand. Categories for temporary permits include:
Visitors - People may enter New Zealand as visitors if they are tourists, visiting friends or relatives, studying for less than three months, playing sport or performing in cultural events without pay, or making short business trips. A visitor's permit is usually granted for an initial period of three months, and may be extended for up to a further six months. Citizens of more than 50 countries have been granted visa waivers and do not need to apply for a visitor's visa before they travel to New Zealand (they are granted a visitor's permit at the border). Visitors from countries without visa waivers need to apply for a visitor's visa prior to travelling to New Zealand. Visitors must have sponsorship or sufficient funds to support themselves while they are in New Zealand, and must have an outward ticket or some other travel arrangements.
Students - International students are required to apply for a visa before travelling to New Zealand to study, or, if they are from a visa waiver country, they may apply for a student permit in New Zealand if they intend studying for more than three months. Students must show that they have been offered a place at a recognised educational institution, evidence that course fees have been paid, a guarantee of accommodation, the ability to support themselves and a return ticket (or the funds to buy one). During their studies, student permit holders must attend classes and make satisfactory progress. Students undertaking some long-term courses may be granted permission to work for up to 15 hours each week. Students completing a full-time course of longer than 12 months may be allowed to work full time during the Christmas/New Year holiday period.
Guardian - In September 2003, a new visa and permit category was introduced allowing the parents of young international students to live with and care for their children while they study in New Zealand. The guardian visa applies to children aged 17 and under and who are enrolled for Year 1 to 13 at a New Zealand school. The currency of the guardian visa is linked to the child's student visa and can be renewed annually. Only one parent or guardian in each family is eligible for a guardian visa.
Work - The objective of New Zealand's work permit policy is to contribute to developing New Zealand's human capability base by facilitating the access of New Zealand employers to global skills and knowledge. Anyone who is not a New Zealand or Australian citizen or resident, and who wishes to work in New Zealand, must have a work permit. For immigration purposes ‘work’ is defined as an activity for which the person receives ‘gain or reward’, which can include not only money, but also accommodation and food. A work permit is still required if payment is made by an overseas employer. The NZIS continues to issue temporary work visas and permits to contribute to New Zealand's capacity base, to assist employers to meet short-term skill needs and to allow migrants who wish to set up businesses in New Zealand do so. To facilitate work visa and permit applications from employers, where skills appear to be in shortage, a regionally-based labour market skills shortage list was established in 2000. This is updated quarterly. In 2002, new work permit categories were introduced that provide a pathway for gaining residence in New Zealand. These categories allow people who are interested in applying for residence in New Zealand to work for up to two years prior to lodging their application for residence. These categories include the Priority Occupations List and the Talent Visa.
Priority Occupations List (POL) - Applicants are eligible under this category if they have an offer of employment for an occupation that is included on the POL and have the necessary qualifications, training or experience and (if required) registration to undertake the offer of employment. The offer of employment must be for at least 24 months, be full time, be compliant with all relevant New Zealand employment laws and have a salary of at least $45,000 a year.
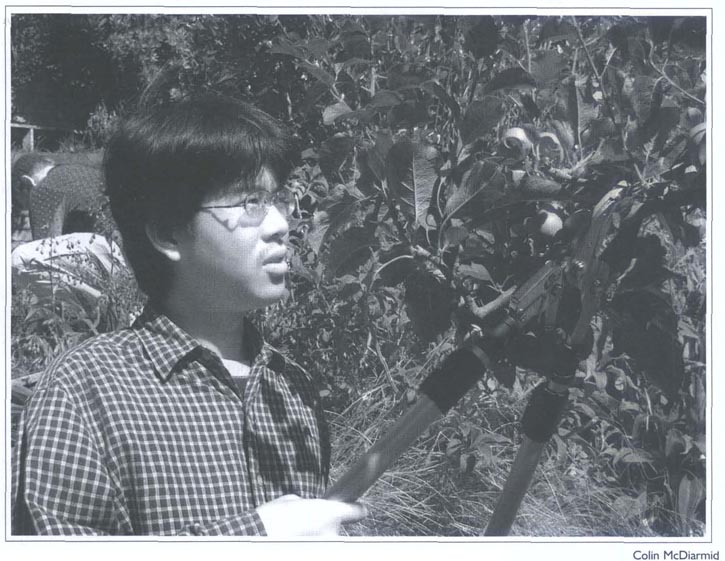
Up to 31,000 young people aged 18-30 can work for up to 12 months while on holiday in New Zealand.
Talent (Accredited Employer) - Businesses operating in New Zealand can apply to become accredited employers with the NZIS. Accredited employers are able to recruit workers directly from overseas to fill skill shortages, provided those workers meet immigration criteria. Talent visa holders are eligible for permanent residence after two years, provided they have met the conditions of their visa and have an offer of on-going employment. There are more than 230 accredited employers in New Zealand and more than 650 applications were approved in the two years following its introduction.
Talent (Arts, Culture and Sports) - Under this category, a person who has an international reputation, a record of excellence in their field, and who will enhance the quality of New Zealand's accomplishments and participation in that field, may be granted a work permit. An applicant must be sponsored by a New Zealand organisation of national repute. They may be eligible for permanent residence after a two-year temporary residence period, provided they have met the conditions of their visa and have an offer of on-going employment.
Working holiday schemes - Work permits may be issued each year to up to 31,000 young people (aged 18 to 30) participating in one of New Zealand's reciprocal working holiday schemes. The reciprocal nature of the schemes allow young New Zealanders to work in partner countries. Work permits are issued for up to 12 months, although under most of the schemes work is limited to three months with any one employer, as work is regarded as incidental to the main purpose of undertaking a holiday. Working holiday schemes have been established for people from Argentina, Canada, Chile, Denmark, France, Germany, Hong Kong, Ireland, Italy, Japan, Malaysia, Netherlands, South Korea, Sweden, the United Kingdom and Uruguay. New Zealand and Singapore have established a similar but more limited work exchange programme, with participants required to hold a tertiary qualification.
Long-term business visa - Work permits may be granted for up to three years to business people interested in either applying for residence under the Entrepreneur Category, or establishing a business in New Zealand without living permanently in New Zealand. A satisfactory business plan must be submitted, and applicants must have sufficient funds to finance their proposed business and to support themselves and their families. English language requirements were introduced for this category of applicants in November 2002.
This migration stream comprises the refugee quota, successful refugee status claimants, the Samoan quota, the Pacific access category, a category for Pitcairn Islanders and the domestic violence policy. Ten percent of residence approvals were allocated to this stream for the 2002/03 financial year and 3,286 people were approved.
Refugees. New Zealand is committed to working with the international community to help resolve refugee problems. The immigration service manages the Refugee Quota Programme, which allows up to 750 refugees to settle in New Zealand each year. In 2002/03, there were 684 people accepted for resettlement in New Zealand. (A planned selection mission was cancelled due to security concerns in the lead up to the war in Iraq, meaning fewer refugees could be resettled.) The Refugee Quota Programme consists of a number of categories including women at risk, medical/disabled, protection, emergency and other. The 2002/03 quota consisted of refugees from Iraq, Afghanistan, Sri Lanka, Myanmar, Palestine and other countries.
Women at risk - Seven women were accepted under this category in 2002/03. These were women who were mandated refugees and who were without the support of their traditional family protectors or community. They may have been in need of additional protection, for example, from abduction, sexual abuse and/or exploitation.
Medical/disabled - Six people were accepted under this category in 2002/03. These were mandated refugees with a medical condition that could not be treated in the country of refuge. Cases in this category can be rejected if resources and treatments are not available in New Zealand.
Protection - In 2002/03, 639 people were accepted under this category. These were people who required protection from being returned to their country of persecution, from expulsion from their country of refuge or from a physical threat to their security.
Emergency and other - Thirty-two refugees were accepted under these categories in 2002/03.
All refugees attend a six-week orientation programme run by the immigration service at its Mangere Refugee Resettlement Centre. The service locates and maintains sponsors who assist refugees to settle in the community following their initial induction. Refugees accepted under the quota are granted residence permits on arrival in New Zealand. This means they are entitled to live in New Zealand permanently and to enjoy the rights of New Zealand residents in matters such as education, health, employment and social welfare.
New Zealand also considers claims for refugee status from people who arrive in New Zealand and seek asylum. Claims are assessed under the 1951 United Nations Convention and 1967 Protocols Relating to the Status of Refugees. The refugee status branch of the immigration service assesses refugee status claims in the first instance. In 2002/03, around 20 percent of refugee status claimants were found to meet the definition of a refugee. The number of refugee status claims in New Zealand has reduced in recent years. Should a claim be declined, the claimant may appeal to the Refugee Status Appeals Authority.
Samoan quota. Up to 1,100 Samoan citizens may be granted residence in New Zealand each year under this quota. English language, health and character requirements must be met and the principal applicant must also have an offer of employment in New Zealand.
Pacific access. This category was introduced on 1 July 2002, and enables up to 250 people from Tonga, 250 people from Fiji, 75 people from Tuvalu and 75 people from Kiribati to be granted residence each year. Applicants must be citizens of their country, meet English language, health and character requirements, and have an offer of employment in New Zealand.
Pitcairn Islanders. A special residence category exists for Pitcairn Islanders because New Zealand recognises there are limited employment opportunities on the island. Pitcairn Islanders will be considered for residence if they have an offer of employment in New Zealand and meet health and character requirements.
Domestic violence policy. This policy enables ex-partners of New Zealand citizens or residents to apply for residence when their relationship has ended as a result of domestic violence and they are unable to return to their home country for cultural or social reasons.
The Immigration Act, as amended in 1999, emphasises that all visitors must have valid permits to be in New Zealand lawfully, and that those who do not may be removed. Any person may appeal on humanitarian grounds against removal to the Removal Review Authority within 42 days of becoming unlawfully in New Zealand. People removed from New Zealand are not eligible to return for five years after the date of their departure. The act provides for the deportation of people who threaten national security, suspected terrorists and criminal offenders who are residents of New Zealand. Such people may appeal on humanitarian grounds to the Deportation Review Tribunal, an independent tribunal administered by the Ministry of Justice. If the tribunal dismisses an appeal, the deportation order remains in place. A further appeal, only on a point of law, may be made to the High Court of New Zealand. Anyone in this category deported from New Zealand is not permitted to return without special permission from the Minister of Immigration.
Information. Further information about immigration policy, application forms, leaflets and fees can be obtained from New Zealand Immigration Service branches in New Zealand and overseas, or from New Zealand diplomatic and consular representatives overseas. The immigration service's website is www.immigration.govt.nz
Statistics on Māori ‘ethnicity’ in the 2001 Census of Population and Dwellings are collected on the basis of personal identification, individual perception and choice.
Ethnicity statistics in 2001 are generally comparable with 1991 Census statistics. Changes to the form of the ethnicity questions used in the 1996 and 2001 Censuses have resulted in some data that is not consistent between 1991 and 1996 nor between 1996 and 2001. This applies particularly to the ‘European’ ethnic groups, including the ‘New Zealand European’ ethnic group, but also to the ‘Māori’ ethnic group. Because data between 1991 and 2001 may not be affected, comparison should be made between 1991 and 2001 Census data when measuring the real effects of population change.
While statistics based on ethnicity are widely used for analysing Māori ethnic group growth and distribution, and are relevant to many of the present day requirements of users, it should be noted that the concept used to measure the Māori electoral ethnic group is based on Māori descent. People are counted as having Māori ethnicity if they have given this response as any one of their ethnicities.
Age distribution.Table 6.06 compares the Māori ethnic group population at the 1991 and 2001 Censuses by age group. When the intercensal change is analysed on a consistent age group basis (ie the 0-4 year group at the 1991 Census is compared with the 10-14 year group at the 2001 Census), the contribution made by net external migration and natural increase to growth of the Māori ethnic group can be seen. Another factor which affects this pattern is ethnic mobility (when a person changes ethnicity between censuses).
Table 6.06. Māori ethnic group By age group1
| Age group (in years) | 1991 Census | 2001 Census | Intercensal percentage change 1991-2001 | ||
|---|---|---|---|---|---|
| Number | Percentage | Number | Percentage | ||
1Māori ethnic group census usually resident population count. Note:Figures may not add to stated totals due to rounding. Source: Statistics New Zealand | |||||
| 0-4 | 62,001 | 14.3 | 67,560 | 12.8 | 9.0 |
| 5-9 | 51,075 | 11.7 | 66,114 | 12.6 | 29.4 |
| 10-14 | 49,968 | 11.5 | 62,805 | 11.9 | 25.7 |
| 15-17 | 30,021 | 6.9 | 31,071 | 5.9 | 3.5 |
| 18-19 | 19,890 | 4.6 | 18,456 | 3.5 | -7.2 |
| 20-24 | 42,855 | 9.9 | 42,096 | 8.0 | -1.8 |
| 25-29 | 39,564 | 9.1 | 40,164 | 7.6 | 1.5 |
| 30-34 | 33,996 | 7.8 | 39,252 | 7.5 | 15.5 |
| 35-39 | 26,010 | 6.0 | 38,325 | 7.3 | 47.3 |
| 40-44 | 20,745 | 4.8 | 32,859 | 6.2 | 58.4 |
| 45-49 | 15,438 | 3.6 | 25,095 | 4.8 | 62.6 |
| 50-54 | 13,836 | 3.2 | 19,473 | 3.7 | 40.7 |
| 55-59 | 10,653 | 2.4 | 13,827 | 2.6 | 29.8 |
| 60-64 | 7,836 | 1.8 | 11,553 | 2.2 | 47.4 |
| 65-69 | 5,064 | 1.2 | 7,941 | 1.5 | 56.8 |
| 70-74 | 2,931 | 0.7 | 5,070 | 1.0 | 73.0 |
| 75-79 | 1,725 | 0.4 | 2,685 | 0.5 | 55.7 |
| 80 and over | 1,239 | 0.3 | 1,941 | 0.4 | 56.7 |
| Total | 434,847 | 100.0 | 526,281 | 100.0 | 21.0 |
At the 2001 Census, the Māori ethnic group was significantly younger in age structure than the total population. This youthfulness is demonstrated by the fact that 37.3 percent of the Māori population were aged under 15, compared with 22.7 percent of the total New Zealand population.
By contrast, only 3.4 percent of the Māori population was aged 65 and over, compared with 12.1 percent of the total New Zealand population. These differences reflect both the higher historical fertility (in terms of birth numbers) and mortality levels of the Māori ethnic group relative to the New Zealand population.
The impact of the levels and directions of net external migration on the age structures of the two populations has been much less.
Male to female ratio. Females outnumbered males in the Māori ethnic group at the 2001 Census, repeating the pattern established at the 1991 Census.
In 2001, there were 268,797 Māori females and 257,481 Māori males, representing a sex ratio of 104.4 females to every 100 males.
Dynamics of population change. Māori have a substantially higher rate of natural increase than non-Māori, due largely to a higher birth rate, which, in turn, is due mainly to the more youthful age structure.
The Māori fertility rate fell rapidly during the 1960s and 1970s and as a consequence the gap between Māori and non-Māori average family size has narrowed, from a two child difference in 1962 to less than one child today.
Nevertheless, the Māori fertility rate of 2.55 births per woman in 2003 remains 40 percent higher than that for non-Māori women (1.82 births per woman).
Unlike non-Māori, who have sub-replacement fertility, Māori fertility remains about 20 percent above ‘replacement level’ (2.1 births per woman).
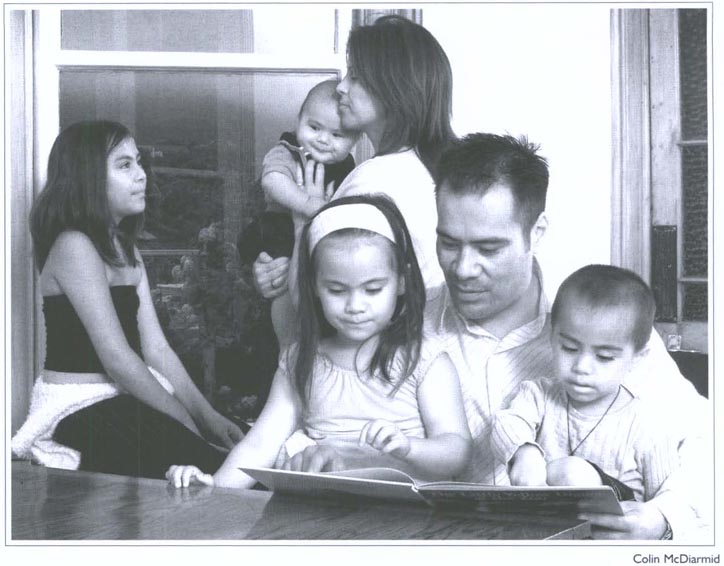
At the 2001 Census, 37.3 percent of the Māori population were under the age of 15, compared with 22.7 percent of the total New Zealand population.
In 2003, the median age at childbearing was 26.1 years for Māori women and 31.1 years for non-Māori women.
Figure 6.03 shows the Māori ethnic group population as a proportion of the total New Zealand population from 1901 to 2001.
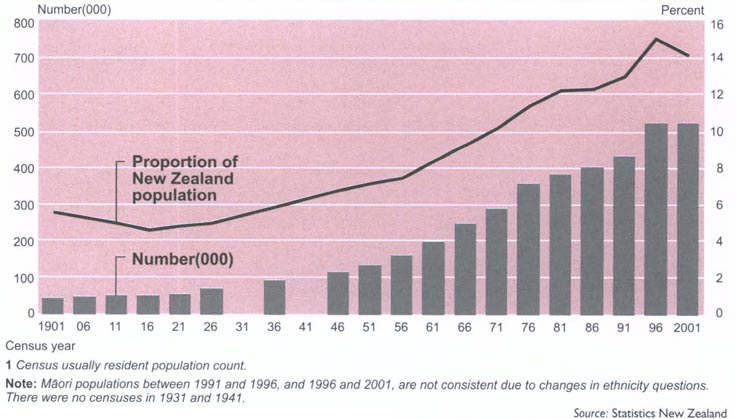
Geographical distribution. Changes in the regional distribution of the Māori ethnic group between the 1991 and 2001 Censuses are shown in Table 6.07.
People of Māori ethnicity continue to be concentrated in North Island regions (where 87.6 percent live) and more especially in the northern regions of Northland, Auckland, Waikato and Bay of Plenty.
The proportion of the Māori ethnic group in the North and South Islands increased 18.9 and 38.5 percent respectively during the 1991-2001 intercensal period.
The Tasman and Nelson regions showed the largest percentage increases between 1991 and 2001.
Redistribution of the Māori population between 1991 and 2001 was the result of variations in the relative levels of natural increase (births less deaths) in the regions, and the impact of both internal and external migration flows.
Table 6.07. Māori ethnic group1 By region
| Region | 1991 Census | 2001 Census | Intercensal percentage change 1991-2001 | ||
|---|---|---|---|---|---|
| Number | Percentage | Number | Percentage | ||
1Māori ethnic group census usually resident population count. 2Includes Chatham Islands. Note:Figures may not add to stated totals due to rounding. Source: Statistics New Zealand | |||||
| North Island | |||||
| Northland | 35,610 | 8.2 | 40,734 | 7.7 | 14.4 |
| Auckland | 103,587 | 23.8 | 127,626 | 24.3 | 23.2 |
| Waikato | 59,985 | 13.8 | 72,822 | 13.8 | 21.4 |
| Bay of Plenty | 53,175 | 12.2 | 63,654 | 12.1 | 19.7 |
| Gisborne | 17,820 | 4.1 | 19,365 | 3.7 | 8.7 |
| Hawke's Bay | 28,242 | 6.5 | 32,088 | 6.1 | 13.6 |
| Taranaki | 12,762 | 2.9 | 14,559 | 2.8 | 14.1 |
| Manawatu-Wanganui | 34,575 | 8.0 | 39,267 | 7.5 | 13.6 |
| Wellington | 42,078 | 9.7 | 51,123 | 9.7 | 21.5 |
| Total North Island | 387,834 | 89.2 | 461,238 | 87.6 | 18.9 |
| South Island | |||||
| Tasman | 1,629 | 0.4 | 2,778 | 0.5 | 70.5 |
| Nelson | 1,707 | 0.4 | 3,219 | 0.6 | 88.6 |
| Marlborough | 2,778 | 0.6 | 3,894 | 0.7 | 40.2 |
| West Coast | 2,025 | 0.5 | 2,547 | 0.5 | 25.8 |
| Canterbury | 22,005 | 5.1 | 31,632 | 6.0 | 43.7 |
| Otago | 7,410 | 1.7 | 10,542 | 2.0 | 42.3 |
| Southland | 9,129 | 2.1 | 10,038 | 1.9 | 10.0 |
| Total South Island | 46,680 | 10.7 | 64,653 | 12.3 | 38.5 |
| Area outside region2 | 330 | 0.1 | 390 | 0.1 | 18.2 |
| Total New Zealand | 434,847 | 100.0 | 526,281 | 100.0 | 21.0 |
Traditional location of major iwi 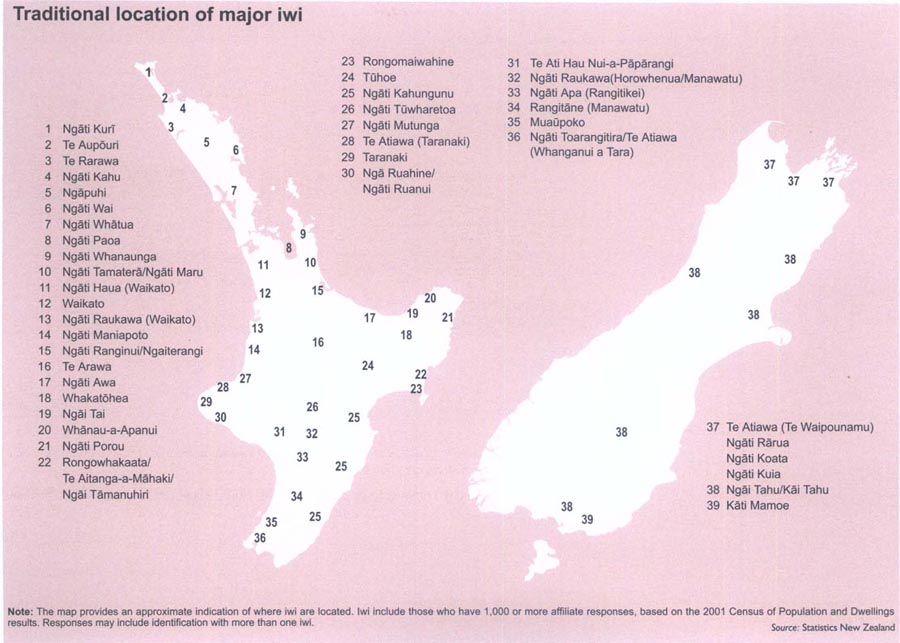 |
The Treaty of Waitangi was signed at Waitangi on 6 February 1840. While the treaty has always been recognised within Māori society as an affirmation of rights and highly valued as a taonga, a sacred pact, this has not always been the case for governments or the courts. A 1987 court ruling ensured, however, that the treaty moved from being ‘a simple nullity’, as it was described in 1877, to holding an important influence over much of the government's activities. The ruling confirmed the special relationship between Māori and the Crown as one of an ongoing partnership, requiring the partners to act reasonably and with the utmost good faith towards each other.
The Waitangi Tribunal, established under the Treaty of Waitangi Act 1975, has exclusive authority to determine the meaning and effect of the Treaty of Waitangi as embodied in the English and Māori texts, and to decide upon issues raised by the differences between them.
The main functions of the Waitangi Tribunal are to inquire into, and make findings and recommendations to the Crown on, claims related to the Treaty of Waitangi by Māori. It comprises up to 16 members appointed for their expertise in matters likely to come before the tribunal, plus a chairperson who is either a judge, or a retired judge, of the high court, or the Chief Judge of the Māori Land Court, and a deputy chairperson, who is a judge of the Māori Land Court. Membership of the tribunal reflects partnership in the Treaty of Waitangi through equal representation of Māori and Pākehā.
The tribunal may inquire only into claims by Māori concerning legislation, acts, omissions, policies and practices of the Crown, which are alleged to have caused prejudice against the claimants, and which are claimed to be inconsistent with the principles of the Treaty of Waitangi.
Claims fall into the three broad categories of historical claims (eg past government actions), contemporary claims (eg current government policies or practices) and conceptual claims (eg ownership of natural resources).
The tribunal does not settle claims; it makes recommendations to the government on how claims might be settled, and all claims are settled by negotiation with the government. Generally, the tribunal has the authority to make recommendations only. In most instances, its recommendations do not bind the Crown, claimants or third parties. However, in certain limited situations, the tribunal does have binding powers.
| Transfers | |||||
|---|---|---|---|---|---|
| Year | To general roll | To Māori roll transfers | Total | ||
| Total | Percent | Total | Percent | Total | |
| 2001 | 4,866 | 26.0 | 13,872 | 74.0 | 18,738 |
| 1997 | 7,040 | 32.7 | 14,471 | 67.3 | 21,511 |
| New Enrolments | |||||
|---|---|---|---|---|---|
| Year | To general roll | To Māori roll transfers | Total | ||
| Total | Percent | Total | Percent | Total | |
| Source: Electoral Enrolment Centre | |||||
| 2001 | 3,436 | 18.5 | 15,138 | 81.5 | 18,574 |
| 1997 | 2,664 | 20.2 | 10,517 | 79.8 | 13,181 |
The tribunal cannot make recommendations over the return of private land. It can register the claim of any Māori with a grievance against a policy, practice, act, or omission of the Crown, and it may refuse to inquire into claims that are frivolous or vexatious.
The tribunal's process is flexible. It is not necessarily required to follow the rules of evidence which must be followed in the courts, and it can adapt its procedures as it thinks fit.
For example, the tribunal can adopt the protocols of the marae.
At 30 June 2003, the tribunal had registered 1,042 claims since 1975.
Of these, 25 percent had been disposed of (having been reported on, directly negotiated, withdrawn etc), 17 percent had been inquired into and were in the process of being reported on, 32 percent were in research and/or hearing and 26 percent had yet to be dealt with.
The tribunal's website is www.waitangi-tribunal.govt.nz
The Office of Treaty Settlements Te Tari Whakatau Take e pa ana ki te Tiriti o Waitangi. The Office of Treaty Settlements was established on 1 January 1995 to give better focus to government objectives to resolve historical claims under the Treaty of Waitangi.
The office has these major functions:
To provide policy advice to the Minister in Charge of Treaty of Waitangi Negotiations on specific treaty claims and generic issues that impact on these claims.
To negotiate and implement the settlement of specific claims.
To acquire, manage and dispose of Crown-owned property for purposes related to treaty claims.
For administration and financial management purposes, the office is attached to, but funded separately from, the Ministry of Justice, having its own Vote: Treaty Negotiations.
At the beginning of 2004, the office was dealing with about 25 claimant groups at the pre-negotiation, negotiation or implementation stage.
The Office of Treaty Settlements website is www.ots.govt.nz
Māori Trustee. The Māori Trustee provides a sustainable framework for the development and utilisation of Māori resources to accelerate Māori development.
To achieve this, the Māori Trustee:
Manages clients' assets to best advantage through sound and prudent management practices.
Unlocks the potential of Māori assets by identifying new opportunities for land use and business development.
Enhances its financial services, including lending, by working with the public sector, including the Māori business facilitation service Poutama, the Ministry of Agriculture and Forestry and the private sector.
New Zealand Māori Council Te Kaunihera Māori. The New Zealand Māori Council is constituted under the Māori Community Development Act 1962 and is a founding member of the World Indigenous People's Council.
Some of the functions of the council are to:
Consider and discuss such matters as appear relevant to the social and economic advancement of Māori.
Consider and, as far as possible, act on any measures that will conserve and promote harmonious and friendly relations between Māori and other members of the community.
Promote, encourage and assist Māori to conserve, improve and advance their physical, economic, industrial, educational, social, moral, cultural and spiritual well-being through self-reliance, sound economic management and pride in themselves.
Collaborate with and assist government departments and other organisations and agencies in the development of employment, education, training, housing and health care for Māori people.
The council is responsible for advancing provisions of the Treaty of Waitangi and for effecting change in the status of Māori through acts of parliament. It challenged the Crown in the Privy Council in respect of fisheries settlement (especially the Māori Fisheries Act 1989), te reo Māori and Māori broadcasting, the State-owned Enterprises Act 1986 and the Crown Forest Assets Act 1989.
As a statutory body, the council is accountable to the government for its funding. The council is based on the 946 marae throughout New Zealand. It represents 17 district Māori councils, which nominate three delegates to attend full council meetings. The council also includes representatives from the Māori Women's Welfare League, and Māori Wardens. The executive committee consists of the chairman of each district council. The council is the only national Māori body with a statutory framework that recognises non-iwi based representation. Apart from the urban district Māori councils, each district council is tribally represented, and the council promotes the traditional social infrastructure of whānau and hapū.
Māori Congress Te Whakakotahitanga o ngā iwi o Aotearoa. The Māori Congress was officially launched in July 1990, after three national Māori leaders - the late Sir Hepi Te Heuheu, Dame Te Atairangikaahu and the late Mrs Te Reo Hura - sought to create a national body under which iwi could gather to share, consolidate and advance their positions. The objectives of the congress include:
The advancement of all Māori people.
The exercise, by each iwi, of tino rangatiratanga.
Provision of a national forum for iwi representatives to address economic, social, cultural and political issues within tikanga Māori.
Promotion of constitutional and legislative arrangements enabling Māori to control their own right to development and self-determination.
While acknowledging the strengths and autonomy of each iwi, the Māori Congress provides a forum at which matters of national importance affecting all iwi and, indeed, all Māori, can be debated within a Māori context. By standing apart from government, both in terms of direction and funding, it offers Māori people an opportunity to consider their own options and strategies for social, economic and cultural advancement. Furthermore, because it has a broad base and is widely representative, it is an obvious source of collective Māori opinion from which acceptable policies for Māori development might take shape.
The congress is led by two presidents and has three elected officers. Membership includes five delegates from 45 participating iwi. The congress is involved in a range of activities relating to iwi and Māori development. There has been extensive congress involvement in the development of modes for the equitable disposal of Crown assets, the representation of Māori on international bodies and the expansion of social projects, such as options for housing and economic expansion, and working with the government and its agencies to enhance the treaty relationship between iwi, Māori and the Crown.
Māori Women's Welfare League Te Roopu Wahine Māori Toko i Te Ora. The Māori Women's Welfare League is a national voluntary organisation with its philosophy being the well-being of Māori women and their families. The league has a nationwide network of 165 branches, with a membership of 3,000. It has been actively involved with Māori families and communities since 1951, improving health, housing, education, welfare, justice and economic development for Māori people.
Te reo Māori is the language of the indigenous people of New Zealand and an official language of the country. The Māori language renaissance, which began about 30 years ago, has fostered many Māori language initiatives to regenerate te reo Māori, including kωhanga reo (Māori language immersion preschool movement), kura kaupapa Māori and wharekura (Māori language immersion primary and secondary schools), and whare wānanga (Māori tertiary institutions). There are also 21 Māori radio stations, and a Māori television service which began operations in 2004. Legislation that led to the declaration of Māori as an official language of New Zealand and establishment of the Māori Language Commission Te Taura Whiri i te Reo Māori was passed in 1987.
Kωhanga reo. Te kωhanga reo is a whānau (family) base where Māori language, values and customs are naturally acquired by preschool children from their kaumātua (elders). The movement's aim is that through the example of the whānau, children learn aroha (love, compassion), manaakitanga (caring, hospitality) and whānaungatanga (family responsibilities) through the medium of Māori language. There were 546 kωhanga reo throughout New Zealand in 2004, where 10,495 children were taught in te reo Māori. Approximately 55,000 children have passed through te kωhanga reo since it was established in 1982. The kωhanga reo movement provides a variety of courses and training programmes which can be accessed by whānau through their own kωhanga reo. These courses are whānau based and have been designed to improve whānau skills and knowledge not only in te reo and tikanga Māori, but also in the administration and management of the kωhanga reo operation.
Māori Language Commission Te Taura Whiri i te Reo Māori. The Māori Language Commission was established by the Māori Language Act 1987 to promote the Māori language and its use as an official language of New Zealand, as a living language, and as an ordinary means of communication.
The 2001 Census provides the most recent and complete data on New Zealand's Pacific ethnic groups.
Pacific ethnic group population statistics are compiled on the basis of self-identification, and are based on the concept of ethnicity, allowing comparisons between 1991 and 2001 Census data.
Pacific ethnic groups include people of Samoan, Cook Island Maori, Niuean, Tokelauan and other Pacific (eg Hawaiian and Tahitian) ethnic groups.
People who specified themselves as belonging to one or several Pacific ethnicities are defined as belonging to those Pacific ethnic groups.
Table 6.08. Pacific ethnic groups1 By age group
| Age group (in years) | 1991 Census | 2001 Census | Intercensal percentage change 1991-2001 | ||
|---|---|---|---|---|---|
| Number | Percentage | Number | Percentage | ||
1Pacific ethnic groups census usually resident population count. Note:Figures may not add to stated totals due to rounding. Source: Statistics New Zealand | |||||
| 5-9 | 19,854 | 11.9 | 30,480 | 13.1 | 53.5 |
| 10-14 | 19,113 | 11.4 | 26,889 | 11.6 | 40.7 |
| 15-19 | 17,226 | 10.3 | 21,486 | 9.3 | 24.7 |
| 20-24 | 16,695 | 10.0 | 19,782 | 8.5 | 18.5 |
| 25-29 | 15,627 | 9.4 | 17,976 | 7.8 | 15.0 |
| 30-34 | 13,080 | 7.8 | 17,778 | 7.7 | 35.9 |
| 35-39 | 10,788 | 6.5 | 16,011 | 6.9 | 48.4 |
| 40-44 | 8,547 | 5.1 | 12,753 | 5.5 | 49.2 |
| 45-49 | 5,997 | 3.6 | 10,131 | 4.4 | 68.9 |
| 50-54 | 4,710 | 2.8 | 7,977 | 3.4 | 69.4 |
| 55-59 | 3,339 | 2.0 | 5,667 | 2.4 | 69.7 |
| 60-64 | 2,622 | 1.6 | 4,461 | 1.9 | 70.1 |
| 65-69 | 1,731 | 1.0 | 3,150 | 1.4 | 82.0 |
| 70-74 | 1,059 | 0.6 | 2,241 | 1.0 | 111.6 |
| 75-79 | 561 | 0.3 | 1,269 | 0.5 | 126.2 |
| 80 and over | 390 | 0.2 | 975 | 0.4 | 150.0 |
| Total | 167,073 | 100.0 | 231,798 | 100.0 | 38.7 |
Age distribution.Table 6.08 compares the Pacific population at the 1991 and 2001 Censuses on an age group basis. When intercensal population growth is analysed on a consistent age group basis (ie the 0-4 year group at the 1991 Census is compared with the 10-14 year group at the 2001 Census), the major contribution made by net immigration to the increase in Pacific peoples is evident. In addition, the big increase of 64,725 (38.7 percent) in the Pacific population during the 1991-2001 intercensal period was partly a result of significant natural increase (births less deaths). At the 2001 Census, the Pacific population was considerably younger in age structure than the total New Zealand population, with 38.9 percent of Pacific peoples under 15 years, compared with 22.7 percent of the total New Zealand population. By contrast, only 3.3 percent of Pacific peoples were aged 65 and over, compared with 12.1 percent of the total New Zealand population.
People of Pacific ethnicities in New Zealand have had a different age structure in the past from that of the Māori ethnic group. This was mainly the result of consistently high external net migration levels, especially for the younger working-age group (15-24 years) during the 1970s. However, with a large increase in intermarriage, the ageing of Pacific peoples and relatively high fertility rates, the age structure has, since 1996, been almost identical with the Māori ethnic group. Two other features affect the Pacific population: first, the number of Pacific peoples born in New Zealand has shown a significant increase only in the past two decades, the result of the growth in the population of reproductive age; and second, an increasingly large proportion of children and teenagers identify themselves as being of both Pacific and Māori ethnicities. More than 25 percent of all people under five belonging to Pacific ethnic groups also belong to the Māori ethnic group.
Geographical distribution. Distribution of Pacific peoples by New Zealand region is shown in Table 6.09 on page 112. All regions, except Southland, experienced significant growth in their Pacific populations between the 1991 and 2001 Censuses. The Auckland Region had the greatest numerical increase, 42,825 (66.2 percent) of the national increase of 64,725 during the 10-year period. In 2001 however, 66.7 percent of the Pacific population lived in the Auckland Region, 0.2 percentage points lower than the proportion in 1991.
Cook Islands. The Cook Islands gained independence in free association with New Zealand in 1965. Its people retained the right of free entry to New Zealand and significant emigration began from the 1950s, and increased during the 1960s and 70s.
The most common destinations were Auckland and Wellington. Smaller numbers of migrants went to provincial towns, where factory work was readily available. The 2001 Census recorded 51,486 Cook Island Maoris living in New Zealand.
Niue. Niue achieved self-government in free association with New Zealand in 1974 and Niueans were granted right of free entry, residence and New Zealand citizenship. Among New Zealand's attractions for Niueans is a more certain way of life. Niue is particularly vulnerable to natural disasters, such as drought and cyclones, and successive cyclones in 1959, 1960 and 2004 had a devastating effect. In 2001, there were 20,148 Niueans living in New Zealand, most of them in Auckland.
Table 6.09. Pacific ethnic groups1 By region
| Region | 1991 Census | 2001 Census | Intercensal percentage change 1991-2001 | ||
|---|---|---|---|---|---|
| Number | Percentage | Number | Percentage | ||
1Pacific ethnic groups census usually resident population count. 2Includes Chatham Islands. -nil or zero Note:Figures may not add to stated totals due to rounding. Source: Statistics New Zealand | |||||
| North Island | |||||
| Northland | 1,587 | 0.9 | 2,943 | 1.3 | 85.4 |
| Auckland | 111,855 | 66.9 | 154,680 | 66.7 | 38.3 |
| Waikato | 6,930 | 4.1 | 10,524 | 4.5 | 51.9 |
| Bay of Plenty | 3,246 | 1.9 | 5,463 | 2.4 | 68.3 |
| Gisborne | 504 | 0.3 | 1,137 | 0.5 | 125.6 |
| Hawke's Bay | 2,517 | 1.5 | 4,710 | 2.0 | 87.1 |
| Taranaki | 633 | 0.4 | 1,059 | 0.5 | 67.3 |
| Manawatu-Wanganui | 3,348 | 2.0 | 5,031 | 2.2 | 50.3 |
| Wellington | 26,133 | 15.6 | 32,283 | 13.9 | 23.5 |
| Total North Island | 156,753 | 93.8 | 217,833 | 94.0 | 39.0 |
| South Island | |||||
| Tasman | 126 | 0.1 | 222 | 0.1 | 76.2 |
| Nelson | 225 | 0.1 | 594 | 0.3 | 164.0 |
| Marlborough | 177 | 0.1 | 408 | 0.2 | 130.5 |
| West Coast | 144 | 0.1 | 186 | 0.1 | 29.2 |
| Canterbury | 5,838 | 3.5 | 8,619 | 3.7 | 47.6 |
| Otago | 2,238 | 1.3 | 2,646 | 1.1 | 18.2 |
| Southland | 1,566 | 0.9 | 1,278 | 0.6 | -18.4 |
| Total South Island | 10,311 | 6.2 | 13,953 | 6.0 | 35.3 |
| Area outside region2 | 9 | - | 12 | - | 33.3 |
| Total New Zealand | 167,073 | 100.0 | 231,798 | 100.0 | 38.7 |
Tonga. The Kingdom of Tonga is an independent nation, where population pressures have forced the nation to adopt emigration as an official policy. In 1970, a scheme was initiated under which Tongans were allowed to migrate to New Zealand temporarily to work in unskilled jobs within the processing industry. Many also went to Australia and to the United States. There were 40,716 Tongans living in New Zealand in 2001, most of them in Auckland.
Tokelau. The small island group of Tokelau was declared a British Protectorate in 1889. New Zealand took over administration on behalf of Britain in 1925 and it became part of New Zealand's territory in 1948, with full political independence gained in 1994. The 10 square kilometres of Tokelau's three atolls have few natural resources, apart from lagoons, coconut palms and the ocean. The atolls are also vulnerable to cyclones. After a devastating cyclone in 1966, the New Zealand Government set up a resettlement scheme which involved about 500 people, half the Tokelauan population. These people voluntarily left Tokelau and resettled in Porirua and forest-industry towns like Rotorua. In 2001, there were 6,204 Tokelauans living in New Zealand, compared with 1,502 in Tokelau.
Figure 6.04 shows the pattern of net Pacific migration to New Zealand from 1980 to 2003.
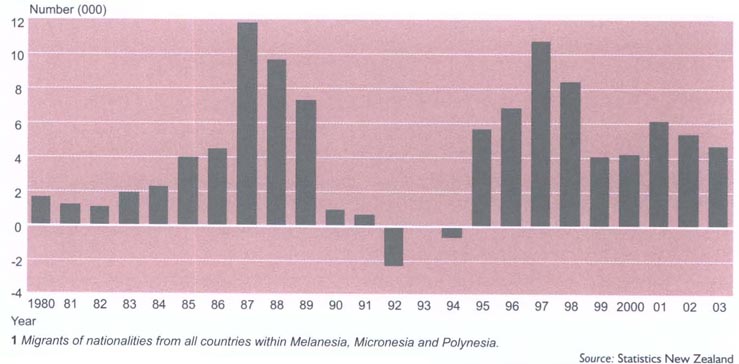
Samoa. Samoa's 13 islands are divided into Samoa and American Samoa. The six islands east of the 171 st meridian were annexed by the United States in 1899. New Zealand assumed control of Western Samoa at the start of World War I and retained it until 1962, when Western Samoa became independent. Western Samoa has recently been renamed Samoa. Emigration from Western Samoa picked up in the mid-1960s and escalated through to the early 1970s - largely through the process of chain migration. Rapid population growth, a decline in export prices for cocoa and copra, a banana crop disease and a major cyclone in 1966 were persuading factors for migrants. The Treaty of Friendship signed at Western Samoa's independence ensured emigrants would not have to register in New Zealand as aliens. Samoans constitute the largest group of Pacific peoples living in New Zealand - 115,017 in 2001. The majority of Samoans live in Auckland.
Fiji. There were 7,041 Fijians living in New Zealand in 2001, a 38 percent increase on the 1991 figure. New Zealand-born Fijians made up 47 percent of the Fijian population in New Zealand in 2001, while 32 percent of Fijians born overseas had been living in New Zealand for between 10 and 20 years. Fifty-seven percent of Fijians living in New Zealand lived in the Auckland urban area, with the next largest concentration, 11 percent, being in the Wellington urban area.
The Asian ethnic group in New Zealand increased markedly in the decade between 1991 and 2001. The 2001 Census of Population and Dwellings provides the latest statistical information on changes in the structure and size of the Asian ethnic group. Tables in this section are based on the concept of ethnicity and are established on the basis of self identification. This allows comparisons between 1991 and 2001 Census data. Figure 6.05 shows Asian migration to New Zealand from 1980 to 2003.
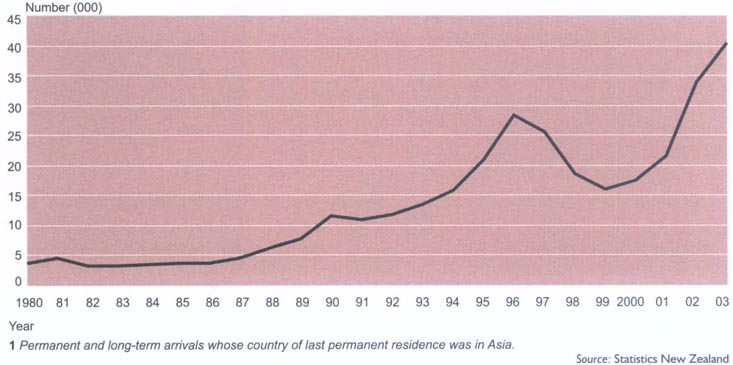
Asian ethnicities. Even though most people of Asian ethnicities more than doubled in the decade between 1991 and 2001, their shares of the total Asian ethnic group changed only marginally.
In 2001, with a share of 44.1 percent, people of Chinese ethnicities were the largest within the Asian ethnic group and experienced the biggest numerical increase in their population, from 44,793 in 1991 to 105,057 in 2001.
People of Indian ethnicities represented 26.1 percent of the Asian ethnic group in 2001, and during 1991-2001 the Indian ethnic group in New Zealand rose from 30,609 to 62,187.
The Korean ethnic group experienced the highest percentage increase during the 10-year period, rising from 930 to 19,026.
People of South-east Asian ethnicities were the third largest group within the Asian ethnic group.
In 2001, 30,648 (12.9 percent) of the Asian ethnic group were of South-east Asian ethnicities, and more than 33 percent of these were of Filipino ethnicity.
Age distribution.Table 6.10 on page 114 compares the Asian population in New Zealand at the 1991 and 2001 Censuses by age group.
When intercensal population growth is analysed on a consistent age group basis (ie the 0-4 year group at the 1991 Census is compared with the 10-14 year group at the 2001 Census), it is evident that the major contribution to the increase in the Asian ethnic group is from net immigration. The increase of 138,420 (138.8 percent) in the Asian population during the 1991-2001 intercensal period was the result of large net migration gains.
Table 6.1. Asian ethnic groups1 By age group
| Age group (in years) | 1991 Census | 2001 Census | Intercensal percentage change 1991-2001 | ||
|---|---|---|---|---|---|
| Number | Percentage | Number | Percentage | ||
1Asian ethnic groups census usually resident population count.. Note:Figures may not add to stated totals due to rounding. Source: Statistics New Zealand | |||||
| 5-9 | 9,093 | 9.1 | 18,381 | 7.7 | 102.1 |
| 10-14 | 9,021 | 9.0 | 19,521 | 8.2 | 116.4 |
| 15-19 | 9,006 | 9.0 | 27,102 | 11.4 | 200.9 |
| 20-24 | 9,339 | 9.4 | 24,018 | 10.1 | 157.2 |
| 25-29 | 11,847 | 11.9 | 17,979 | 7.5 | 51.8 |
| 30-34 | 11,589 | 11.6 | 19,947 | 8.4 | 72.1 |
| 35-39 | 9,420 | 9.4 | 22,722 | 9.5 | 141.2 |
| 40-44 | 7,131 | 7.1 | 19,806 | 8.3 | 177.7 |
| 45-49 | 4,311 | 4.3 | 15,690 | 6.6 | 264.0 |
| 50-54 | 2,991 | 3.0 | 11,520 | 4.8 | 285.2 |
| 55-59 | 2,163 | 2.2 | 7,161 | 3.0 | 231.1 |
| 60-64 | 1,608 | 1.6 | 6,192 | 2.6 | 285.1 |
| 65-69 | 1,059 | 1.1 | 4,434 | 1.9 | 318.7 |
| 70-74 | 657 | 0.7 | 2,589 | 1.1 | 294.1 |
| 75-79 | 447 | 0.4 | 1,485 | 0.6 | 232.2 |
| 80 and over | 471 | 0.5 | 1,254 | 0.5 | 166.2 |
| Total | 99,756 | 100.0 | 238,176 | 100.0 | 138.8 |
Between the 1991 and 2001 Censuses, the Asian ethnic group grew by an average rate of 9.1 percent a year, compared with 1.0 percent for the total New Zealand population. This also had a significant impact on the overall age structure of the Asian group. At the 2001 Census, 72.3 percent of the Asian ethnic group were of working age (15-64 years), compared with 65.3 percent for the total New Zealand population. By contrast, only 4.1 percent of Asian were aged 65 and over, compared with 12.1 percent of the total New Zealand population.
Geographical distribution. Distribution of the Asian ethnic population by region at the 1991 and 2001 Censuses is shown in Table 6.11. The Asian ethnic group continues to be concentrated in the main regions of Auckland, Wellington and Canterbury. The Auckland Region experienced the largest growth in Asians, both in numerical and relative terms, between the 1991 and 2001 Censuses. The Auckland Region's Asian population increased by nearly 100,000 to reach 151,602 in 2001 and represented 71.5 percent of the national increase of 138,420 between 1991 and 2001.
Table 6.11. Asian ethnic groups1 By region
| Region | 1991 Census | 2001 Census | Intercensal percentage change 1991-2001 | ||
|---|---|---|---|---|---|
| Number | Percentage | Number | Percentage | ||
1Asian ethnic groups census usually resident population count. 2Includes Chatham Islands territory. - nil or zero Note:Figures may not add to stated totals due to rounding. Source: Statistics New Zealand | |||||
| North Island | |||||
| Northland | 1,020 | 1.0 | 1,998 | 0.8 | 95.9 |
| Auckland | 52,584 | 52.7 | 151,602 | 63.7 | 188.3 |
| Waikato | 5,448 | 5.5 | 12,021 | 5.0 | 120.6 |
| Bay of Plenty | 2,121 | 2.1 | 5,202 | 2.2 | 145.3 |
| Gisborne | 429 | 0.4 | 621 | 0.3 | 44.8 |
| Hawke's Bay | 1,770 | 1.8 | 2,937 | 1.2 | 65.9 |
| Taranaki | 1,002 | 1.0 | 1,500 | 0.6 | 49.7 |
| Manawatu-Wanganui | 4,344 | 4.4 | 6,564 | 2.8 | 51.1 |
| Wellington | 19,533 | 19.6 | 27,819 | 11.7 | 42.4 |
| Total North Island | 88,257 | 88.5 | 210,264 | 88.3 | 138.2 |
| South Island | |||||
| Tasman | 132 | 0.1 | 366 | 0.2 | 177.3 |
| Nelson | 378 | 0.4 | 861 | 0.4 | 127.8 |
| Marlborough | 183 | 0.2 | 387 | 0.2 | 111.5 |
| West Coast | 177 | 0.2 | 246 | 0.1 | 39.0 |
| Canterbury | 6,996 | 7.0 | 19,431 | 8.2 | 177.7 |
| Otago | 3,075 | 3.1 | 5,766 | 2.4 | 87.5 |
| Southland | 561 | 0.6 | 849 | 0.4 | 51.3 |
| Total South Island | 11,499 | 11.5 | 27,906 | 11.7 | 142.7 |
| Area outside region2 | 3 | - | 3 | - | - |
| Total New Zealand | 99,756 | 100.0 | 238,176 | 100.0 | 138.8 |
The Human Rights Commission is an independent Crown entity charged with administration of the Human Rights Act 1993.
In December 2001, parliament made significant changes to the act, affecting both the Human Rights Commission and the Office of the Race Relations Conciliator.
As a result of the Human Rights Amendment Act 2001:
The commission and the race relations office have become one new organisation.
The government is no longer exempt from fully complying with human rights standards.
Complaint-handling procedures have been streamlined to allow for more flexibility and accessibility in dispute resolution.
The role of the Proceedings Commissioner has been disestablished and a separate Office for Human Rights Proceedings has been created.
Two primary functions have been set out for the commission:
to advocate and promote respect for, and an understanding and appreciation of, human rights in New Zealand society, and
to encourage the maintenance and development of harmonious relations between individuals and among the diverse groups in New Zealand society.
The commission also has the power to mediate disputes relating to unlawful discrimination on the grounds of sex and sexual harassment; marital status; religious belief; ethical belief; colour; race and racial harassment; ethnic or national origins; disability; age; political opinion; employment status; and sexual orientation in the areas of employment, education, access to public places, the provision of goods and services, housing and accommodation, partnerships, qualifying bodies, organisations of employees and employers, vocational training, and trade and professional associations.
Other functions of the commission include promoting human rights in New Zealand by education, research and publicity, issuing public statements on human rights matters, making submissions on human rights aspects of legislation before parliament, and issuing guidelines to assist compliance with the act.
The commission has published guidelines on advertising, pre-employment, health insurance, the rights of pregnant workers, and dealing with sexual harassment.
The commission also has an educational function, with a focus on providing public and private sector educators with human rights training.
The commission seeks to supply effective and culturally appropriate services to Maori.
Human Rights Commissioners, of whom there are eight, are appointed by the governor-general on the recommendation of the Minister of Justice for terms of up to five years.
Under the act, commissioners are appointed not only for their personal attributes, but also for their knowledge and/or experience of matters likely to come before the commission.
The commission has offices in Auckland, Wellington and Christchurch and its website is www.hrc.co.nz
Enquiries. There were 19,118 enquiries received in the year ending 30 June 2003, compared with 23,893 in the June 2002 year and 21,384 in the June 2001 year. The largest single proportion of enquiries in the June 2003 year concerned workplace disputes (9.6 percent), while the single largest ground of discrimination cited in enquiries was disability (18 percent), followed by ethnic or national origins (16 percent).
Complaints. In the year ending 30 June 2003, 1,101 complaints were received, compared with 786 in the previous June year and 514 in the year ending 30 June 2001. Approximately 49 percent of the alleged breaches of the Human Rights Act arose in the context of goods and services, while just under 27 percent concerned employment. The prohibited ground of discrimination most cited in complaints was disability, where there were 273 alleged breaches of the act. The second most frequently cited prohibited ground of discrimination was race, where 169 breaches were alleged.
The Equal Employment Opportunities (EEO) Trust was established in 1991 by the government and the private sector to promote EEO principles and best practice in the workplace. Trustees are representative of both public and private sectors. The trust encourages employers to recognise the business benefits of employing on the basis of merit and helps them to get full potential from a diverse workforce. Annual EEO Trust Work and Life Awards recognise organisations and individuals that champion work/life balance.
The EEO Trust's website is www.eeotrust.org.nz
Rotorua's Te Utuhina Manākitanga Trust was a winner in the Equal Employment Opportunities Trust's annual work and life awards.
The 110th anniversary in 2003 of New Zealand women winning the right to vote provided an opportunity to celebrate the achievements of women and reflect on the remaining inequalities. Pay equity, increasing women's representation on decision-making bodies, ensuring women's economic independence, work-life balance, and reducing domestic violence are some of the areas in which further work is required.
The Ministry of Women's Affairs is working with other government departments to implement the Action Plan for New Zealand Women following its launch early in 2004. The government-wide plan, aimed at improving the circumstances of women in New Zealand, has three themes:
Economic sustainability - women having enough money to care for themselves and those who depend on them.
Work-life balance - balancing work, family, whānau and community roles.
Well-being - preserving women's general well-being, including their safety, security, housing, physical and mental health.
The Ministry of Women's Affairs website is www.mwa.govt.nz
The Ministry of Youth Development works with the government and communities to promote the development of young New Zealanders and to uphold the principles of the Treaty of Waitangi through being experts in promoting positive youth policies and programmes, leaders in involving young people in decision making and providers of quality youth development programmes.
The ministry is funded by the government to:
Provide policy advice on policies, services and legislation affecting young people and their future. This includes researching and reporting on young people's issues and contributing to other matters that affect young people.
Administer and fund the youth development programmes New Zealand Conservation Corps, Youth Service Corps and Specialist Youth Service Corps. The 20-week programmes are a mix of challenging recreation, practical work, and life skills education. Members of the programmes contribute to their communities through conservation activities or community work.
The ministry consults young people and those who work with them to provide the government with a sound understanding of the issues in young people's lives. The ministry provides information to young people and those who work with them on what others are doing in similar areas and about changes in policies and practices.
Youth Parliament. Parliament opens its doors every three years for a Youth Parliament, which gives young people a chance the find out how parliament works and what it is like to be a Member of Parliament. Youth MPs get involved in things that real MPs do, like debating in the house, asking ministers questions in parliament, taking part in select committees and having their own Speaker of the House. A Youth Parliamentary Press Gallery is also established. The next Youth Parliament is in 2007.
Youth suicide prevention. Suicide among young people is a growing problem in modern societies and New Zealand's suicide rate is one of the highest in the world.
In 2000, there were 96 youth deaths from suicide - 23 fewer than in 1999 and the lowest number of deaths since 1986. Males accounted for 84 percent of youth suicide deaths in 2000.
Suicide is a complex problem for which there is no one cause or cure. Instead, there are a range of biological, cultural, economic, social and psychological influencing factors. Most suicides, however, can be prevented and it is possible to reduce the level of youth suicide.
The government has produced a national strategy to deal with the challenge of preventing young people from considering suicidal behaviour. However, the government cannot reduce youth suicide on its own. It needs the support and involvement of individuals, families, communities, services and businesses.
The New Zealand Youth Suicide Prevention Strategy was developed by the former Ministry of Youth Affairs, the Ministry of Māori Development Te Puni Kokiri and the Ministry of Health.
The strategy was launched in March 1998 and has two components: In Our Hands, which is the general population strategy, and Kia Piki Te Ora o te Taitamariki, which specifically targets Māori needs and approaches. The strategy helps government, communities, families/whānau and individuals to act together to reduce youth suicide and suicidal behaviour. It takes a broad-based and coordinated approach to youth suicide prevention, covering things such as health promotion, treatment and post-intervention support.
Property (Relationships) Act 1976. The Matrimonial Property Act 1976 was amended in 2001 to provide for the division of property when a married or de facto couple separates, or when one of the partners in a married or de facto relationship dies.
Domestic Violence Act 1995. The Domestic Violence Act 1995, which replaced the Domestic Protection Act 1982, aims to provide greater protection for victims of domestic violence. It combines non-molestation and non-violence orders into one protection order that can last indefinitely and which is available to a wider range of people in closer relationships than under previous legislation. The act also places particular emphasis on the provision of programmes for victims and their children and for the perpetrators of domestic violence.
Guardianship Act 1968. The Guardianship Act 1968 defines the authority of parents as guardians of their children, and the powers of the court in relation to guardianship and custody of, and access to, children.
Child Support Act 1992. The Child Support Act 1992 provides for the child support division of the Inland Revenue Department to assess the amount of child support to be paid by non-custodial parents according to a specific formula. The division collects and pays child support to the Crown when custodial parents are social welfare beneficiaries, and direct to custodial parents not receiving social welfare benefits. Child support is also paid to the Crown where a child is in the care of the Department of Child, Youth and Family Services. In addition, the Inland Revenue Department collects and pays court-ordered spousal maintenance and, if requested, maintenance for spouses and/or children agreed on voluntarily.
6.1 Statistics New Zealand; Department of Internal Affairs; New Zealand Immigration Service.
6.2 Statistics New Zealand; Ministry of Justice; Ministry of Māori Development (Te Puni Kokiri); New Zealand Māori Council; Māori Congress; Māori Women's Welfare League; Te Kohanga Reo National Trust; Māori Language Commission.
6.3 Statistics New Zealand; Ministry of Pacific Island Affairs.
6.4 Statistics New Zealand.
6.5 Human Rights Commission; Equal Employment Opportunities Trust; Ministry of Women's Affairs; Ministry of Youth Affairs.
www.dia.govt.nz - Department of Internal Affairs
www.dol.govt.nz - Department of Labour
www.eeotrust.org.nz - Equal Employment Opportunities Trust
www.hrc.co.nz - Human Rights Commission
www.justice.govt.nz - Ministry of Justice
www.tetaurawhiri.govt.nz - Māori Language Commission
www.poutokomanawa.co.nz/otautahi/default.asp - Māori Women's Welfare League
www.tpk.govt.nz - Ministry of Māori Development Te Puni Kωkiri
www.minpac.govt.nz - Ministry of Pacific Island Affairs
www.mwa.govt.nz - Ministry of Women's Affairs
www.youthaffairs.govt.nz - Ministry of Youth Development
www.nzfec.org.nz - New Zealand Federation of Ethnic Councils
www.immigration.govt.nz - New Zealand Immigration Service
www.rms.org.nz - Refugee and Migrant Service
www.ssc.govt.nz - State Services Commission
www.stats.govt.nz - Statistics New Zealand
www.kohanga.ac.nz - Te Kohanga Reo
Table of Contents

The Citizens Advice Bureau says no problem or question is too big or too small for its 2,750 volunteer workers and 112 paid staff.
The Ministry of Social Development was established on 1 October 2001, bringing together the income support and employment services of Work and Income New Zealand, and the policy advice and research functions of the Ministry of Social Policy. The merger marked a shift in New Zealand's social services, from social welfare to social development.
Social development is a planned, co-ordinated process of improving people's lives.
The Ministry of Social Development works closely with other social sector agencies, such as health, education and housing, to improve all areas of people's lives.
The ministry's framework covers children and young people, working-age people, older people, families and communities.
The ministry undertakes social research and evaluation, gives cross-sectoral policy advice to the government, delivers income support and employment services through Work and Income, and delivers services to students through Study Link.
The ministry also administers the Office for Disability Issues, the Office for the Community and Voluntary Sector and the Office for Senior Citizens. On 1 October 2003, the ministry took over administration of the Ministry of Youth Development.
The ministry's strategic social policy group monitors and reports on the social well-being of New Zealanders and delivers policy advice to the government on cross-sectoral policy issues.
The sector policy group delivers policy advice on the care and protection of children and young people; on social assistance and employment; on positive ageing and retirement; on disability issues; and on family and community development.
The Centre for Social Research and Evaluation researches key social policy issues, provides evidence to support policy development, and evaluates the effectiveness of government policies and programmes.
In the year ending 30 June 2003, the ministry provided more than 1,000 reports to ministers. It also produced its annual Social Report and the reports New Zealand Living Standards 2000 and Living Standards of Older Māori.
The Ministry of Social Development provides benefits and pensions through 170 Work and Income centres throughout New Zealand, Employing approximately 5,500 people, Work and Income had more than a million clients in the 2002/03 financial year.
An average 1,600 applications for benefits or pensions were processed each day, while 66,000 transactions were handled daily by mail, telephone and personal contact.
Work and Income pays a wide range of benefits, supplementary benefits, pensions, loans and subsidies.
Weekly rates of income support at 1 April 2003 are listed in Table 7.01.
The Ministry of Social Development provides financial assistance and employment services through its Work and Income centres.
Table 7.01. Income support weekly rates At 1 April 2003
| Type of income support | Net weekly payment |
|---|---|
| Source: Ministry of Social Development | |
| $ | |
| Unemployment benefit/sickness benefit granted on or after 1 July 1998 | |
| Without children: | |
| Single 18-19 years old, at home | 107.76 |
| Single 18-19 years old, away from home | 134.70 |
| Single 20-24 years old | 134.70 |
| Single 25 and over | 161.65 |
| Married couple (each partner) | 134.70 |
| With children: | |
| Single (1 child) | 231.53 |
| Single (2 children or more) | 252.60 |
| Married couple (each partner) | 143.14 |
| Sickness benefit (granted before 1 July 1998) | |
| Without children: | |
| Single 18-24 years old | 147.34 |
| Single 25 and over | 161.65 |
| Married couple (each partner) | 139.54 |
| With children: | |
| Single (1 child) | 231.53 |
| Single (2 children or more) | 252.60 |
| Married couple (each partner) | 143.14 |
| Invalid's and transitional retirement benefit | |
| Without children: | |
| Single 16-17 years old | 163.51 |
| Single 18 and over | 202.05 |
| Married couple (each partner) | 168.38 |
| With children: | |
| Single (1 child) | 265.43 |
| Single (2 children or more) | 285.03 |
| Married couple (each partner) | 168.38 |
| Widow's and domestic purposes benefit | |
| Women alone/single adult | 168.38 |
| Sole parent (1 child) | 231.53 |
| Sole parent (2 children or more) | 252.60 |
| Domiciliary care domestic purposes benefit for caregivers | |
| Single 16-17 years old | 163.51 |
| Single 18 and over | 202.05 |
| Sole parent (1 child) | 265.43 |
| Sole parent (2 children or more) | 285.03 |
| Orphan's and unsupported child benefit | |
| Under 5 years | 78.55 |
| 5-9 years old | 95.40 |
| 10-13 years old | 103.82 |
| 14 and over | 112.23 |
| Independent youth benefit | |
| Single 16-17 years old | 134.70 |
| New Zealand superannuation and veteran's pension | |
| Single living alone | 245.30 |
| Single sharing | 226.43 |
| Married person | 188.69 |
| Married couple (both qualify) | 377.38 |
| Married couple with non-qualifying spouse (each partner) | 179.91 |
Benefits paid in the year ending 30 June 2003 included:
Caring benefits - the domestic purposes benefit-sole parent; the domestic purposes benefit-caring for the sick and infirm; and the domestic purposes benefit-woman alone.
Incapacity benefits - the sickness benefit; and the invalid's benefit.
Work-related benefits - the independent youth benefit; and the unemployment benefit.
Miscellaneous benefits - the emergency benefit; the transitional retirement benefit; the unsupported child benefit; the orphan's benefit; and the widow's benefit.
Military service pensions - the veteran's pension; the war disability pension; and the dependant's pensions. Concessions to assist with interest payments on land and buildings, medical treatment and other expenses are also available.
New Zealand superannuation.
Supplementary benefits and lump sum assistance payments - the accommodation supplement; the childcare subsidy; the out-of-school care and recreation (OSCAR) subsidy; the disability allowance; funeral grants; the special benefit; the special needs grant; the training incentive allowance; advance payments of income support; and recoverable assistance available to people who are not receiving benefits or pensions.
Income adjustment. People receiving the invalid's benefit, the widow's benefit, any domestic purposes benefit, the sickness benefit, an unemployment benefit, or a transitional retirement benefit are income-tested and some are subject to stand down periods. The levels at which all benefits are paid are adjusted annually in line with movement in the consumers price index (CPI). In addition, the CPI-adjusted rate for New Zealand superannuation and the veteran's pension is compared with average wage levels to ensure the after-tax payment rate for couples is between 65 and 72.5 percent of the after-tax average ordinary time weekly wage.
Income exemptions. For people receiving an unemployment benefit, a sickness benefit, an independent youth benefit or a transitional retirement benefit, and for non-qualified spouses of people receiving New Zealand superannuation, each dollar of weekly income above $80 reduces the weekly rate of income support by 70 cents. For people receiving an invalid's benefit, a widow's benefit or any domestic purposes benefit, the level of income support reduces by 30 cents for every dollar earned between $80 and $180 a week. Every additional dollar of income above $180 a week reduces the benefit by 70 cents.
Unemployment benefit. This benefit is available to people who are unemployed, capable and willing to undertake full-time work, and taking reasonable steps to obtain employment. The benefit is also available to people who are not full-time students but are engaged in full-time employment-related training programmes. At 30 June 2003, 111,906 people were receiving an unemployment benefit, 14,036 fewer than at 30 June 2002. At the same date, 4,291 people in training were receiving an unemployment benefit, 301 more than at 30 June 2002.
Domestic purposes benefit. The domestic purposes benefit is available to parents caring for children without the support of partners, to people caring at home for someone who would otherwise be hospitalised and, in some circumstances, to older women living alone. At 31 December 2003, 111,065 people were receiving a domestic purposes benefit, 1,175 more than at 31 December 2002.
Widow's benefit. The widow's benefit is available to women whose husbands or de facto partners have died. At 30 June 2003, 8,659 people were receiving the widow's benefit, 115 fewer than at 30 June 2002.
Invalid's benefit. The invalid's benefit is available to people aged 16 and over who are either totally blind or permanently and severely restricted in their capacity for work due to a disability. At 30 June 2003, 68,507 people were receiving the invalid's benefit, 3,978 more than at 30 June 2002.
Sickness benefit. The sickness benefit is available to people aged 18 and over who lose earnings as a result of being temporarily incapacitated for work. At 30 June 2003, 39,902 people were receiving a sickness benefit, 3,522 more than at 30 June 2002.
Family support. Family support is provided to people with dependent children who meet income eligibility requirements. It is paid to income earners through taxation, but is delivered to people receiving benefits through payments by Work and Income.
Childcare subsidy. A childcare subsidy provides financial assistance to low-income families with dependent children under five years to obtain access to preschool childcare services. In the year ending 30 June 2003, there were 39,979 approved applications for childcare subsidies, 2,287 fewer than in the year ending 30 June 2002.
OSCAR subsidy. An OSCAR (Out of School Care and Recreation) subsidy provides financial assistance to low-income families with dependent children aged five to 13 to help with costs of care before and after school and in holiday programmes. In the year ending 30 June 2003,9,666 applications for an OSCAR subsidy were approved, 615 fewer than in the year ending 30 June 2002.
Orphan's benefit and unsupported child benefit. The orphan's benefit and the unsupported child benefit are paid to people caring for an orphan or an unsupported child. At 30 June 2003, 6,789 people were receiving one of these benefits, 457 more than at 30 June 2002.
Child disability allowance. The child disability allowance is a non-taxable allowance paid to the parent or guardian of a seriously physically or mentally disabled child who requires constant care and attention. There were 27,342 children covered by the child disability allowance at 30 June 2003, 3,594 more than at 30 June 2002. There were 7,822 new applications for the allowance granted in the year ending 30 June 2003, an increase of 1,481 on new applications granted in the previous year.
Disability allowance. The disability allowance is an income-tested allowance paid to people with special costs arising from a disability or a personal health need. At 30 June 2003, 219,040 people were receiving a disability allowance, 13,867 more than at 30 June 2002. Clients receiving a disability allowance may have been receiving the allowance for themselves or for one or more dependants.
Community Services Card. The Community Services Card is an entitlement card which people on low to middle incomes can use to reduce the cost of doctors' fees and prescription charges. At 30 June 2003, there were 1,088,960 cardholders, 9,513 fewer than at 30 June 2002.
Special needs grant. A special needs grant is a one-off payment made in an emergency situation where the need cannot be met in any other way and where the person has insufficient financial resources to meet the need. For the year ending 30 June 2003, 396,447 grants were made, an increase of 8,983 on the previous year. Table 7.02 provides more details.
Special benefit. The special benefit provides financial assistance for people who have ongoing expenses that exceed their income and who are in individual circumstances of hardship which warrant the receipt of a special benefit. At 30 June 2003, 35,380 people were receiving a special benefit, 19,154 more than at 30 June 2002.
Advance payment of benefit. Advance payment of a benefit is available to all people receiving benefits to assist them to meet essential needs they would otherwise be unable to meet. In the year ending 30 June 2003, 313,279 advance payments of benefits were granted, 14,264 more than in the previous year.
StudyLink. In the year ending 30 June 2003, more than 57,000 student allowances and 156,000 student loans were paid.
Table 7.03 shows spending on income support and pensions since 1940, while Table 7.04 shows the number of income support services and pensions in force.
Training incentive allowance. A training incentive allowance helps meet costs associated with attending recognised occupational or work-related courses which provide specific work skills. The allowance is available to people receiving the widow's benefit, the invalid's benefit, or any domestic purposes benefit.
Payment while in hospital. Income support clients with no dependent children receive income support at the going rate for the first 13 weeks of hospitalisation. Following 13 weeks of hospitalisation, they receive a reduced rate. The benefit rate is not reduced for clients with dependent children.
Continuation of benefit after death. Certain benefits and pensions may be paid for four weeks following a client's death.
Child support. Responsibility for the collection of child support payments from non-custodial parents rests with the Inland Revenue Department. The collection aims to ensure that parents contribute to the support of their children according to their ability to provide.
As at 1 April 2003, the New Zealand superannuation scheme provided $245.30 a week for a single person living alone and $377.38 a week for a married couple (or $359.82 if one spouse did not qualify). Payments are subject to normal taxation.
At 30 June 2003, there were 457,278 people receiving New Zealand superannuation, 6,843 more than at 30 June 2002. The qualifying age for New Zealand superannuation has been 65 since 1 April 2001.
Transitional retirement benefit. The transitional retirement benefit helps those adversely affected by the increase from 60 to 65 years in the qualifying age for New Zealand superannuation. It was introduced on 1 April 1994. At 30 June 2003, there were 2,110 people receiving the benefit, 3,008 fewer than at 30 June 2002. The decrease reflects contraction of the period during which clients are eligible to receive the benefit but not to receive superannuation.
More than 1 million New Zealanders use a Community Services Card to reduce the cost of doctor's fees and prescription medicines.
Vote: Veterans' Affairs - Social Development provides for payment of pensions and concessions for those who served in World War 1 and 11, Korea, Operation Grapple, Malaya, Vietnam, Mururoa, the Gulf, Angola, Bosnia, Sierra Leone, East Timor, Afghanistan, the Solomon Islands and Iraq.
Also included is routine service in New Zealand before 1 April 1974. Since then, service personnel have been covered under accident compensation provisions.
The War Pensions Act 1954 is administered by the Secretary for War Pensions, who is also Director of Veterans' Affairs New Zealand.
Processing and payment of war pensions is carried out by Work and Income on behalf of the secretary.
Decisions on eligibility for war pensions are made by war pension claims panels, acting under delegation from the secretary. Each claims panel consists of a nominee from the Royal New Zealand Returned Services Association and an employee of Veterans' Affairs New Zealand.
Table 7.05 shows the number of war pensions in force at 30 June 2003.
Veteran's pension. The veteran's pension is available to ex-service personnel with a significant disability. The pension is paid at the same rate as New Zealand superannuation and, like superannuation, is taxable. At 30 June 2003, 7,812 people were receiving the veteran's pension, 285 more than at 30 June 2002.
War disability pension. War disability pensions provide tax-free compensation for people who served in the armed forces and who suffer from a disability or disabilities related to that service. At 30 June 2003, 17,578 war disability pensions were in force.
Other war pension provisions. In addition to war disability pensions, the war pensions programme also provides pensions for surviving spouses, and additional allowances and concessions for clients receiving war disability pensions. The additional allowances and concessions available include concessions on interest payments connected to lands and buildings and assistance with medical expenses.
War pensions are increasingly related to the ageing of the population and have remained constant in recent years.
At 30 June 2003, 22,271 war pensions were in force, including war disability pensions. This was 488 fewer than at 30 June 2002.
New Zealand has overseas social security agreements with Australia, Canada, Denmark, Greece, Ireland, Jersey and Guernsey, the Netherlands and the United Kingdom.
The main purposes of the agreements are to encourage the free movement of labour and to ensure that, when a person has lived or worked in more than one country, each of those countries takes a fair share of responsibility for meeting the costs of that person's social security coverage.
The agreements are becoming part of the basic infrastructure of the global village, enabling people to move about the world, for short or long periods, either to work or to be with family, without jeopardising their social security coverage.
By entering into such agreements, New Zealand is better able to attract skills, specialist knowledge and technical know-how from overseas.
A widening network of agreements also provides more options for New Zealanders who wish to live overseas in their retirement.
General portability. Under the general portability provision, people eligible to receive New Zealand superannuation or a veteran's pension in their own right may receive 50 percent of the payment while living outside New Zealand, provided they are not living in a country which has a social security agreement with New Zealand. Applications under this provision must be made while the applicant is living in New Zealand.
Special portability arrangement. People leaving New Zealand to live in a Pacific country can receive a rate of New Zealand superannuation or veteran's pension based on their New Zealand residence since the age of 20.
People with 10 years New Zealand residence since the age of 20 receive 50 percent of New Zealand superannuation or the veteran's pension.
People with between 10 and 20 years New Zealand residence since the age of 20 are entitled to an additional 5 percent of superannuation or veteran's pension for each year of residence over 10 years. At the date of application, they must be both living and present in New Zealand, and intending to live in the Pacific country for 52 weeks or more.
Pacific countries covered by the arrangement are: American Samoa, the Cook Islands, the Federated States of Micronesia, Fiji, French Polynesia, Guam, Kiribati, Marshall Islands, Nauru, New Caledonia, Niue, Northern Mariana Islands, Palau, Papua New Guinea, Pitcairn Island, Samoa, Solomon Islands, Tokelau, Tonga, Tuvalu, Vanuatu, and Wallis and Fortuna.
The Department of Child, Youth and Family Services was established on 1 October 1999 following integration of two Department of Social Welfare business units, the Children, Young Persons and Their Families Service and the New Zealand Community Funding Agency. The department has statutory responsibility for children and young people whose family circumstances put them at risk of abuse and neglect, offending behaviour or poor life outcomes. The department provides direct services for children and young people in need of care and protection, for those who have committed offences and for those involved in adoption processes.
Table 7.06 shows the number of care and protection notifications received and the number assessed as requiring further investigation and action by a social worker. All cases accepted for investigation are assigned a criticality rating, or response category, at time of intake.
Table 7.06. Care and protection notifications Years ending 30 June
| Action | 1998 | 1999 | 2000 | 2001 | 2002 | 2003 |
|---|---|---|---|---|---|---|
| Source: Department of Child, Youth and Family Services | ||||||
| Care and protection notifications received | 23,652 | 27,218 | 26,588 | 26,707 | 27,507 | 31,781 |
| Notifications for further investigation | 18,252 | 21,930 | 21,983 | 22,868 | 23,805 | 27,394 |
| Critical - immediate response (same day) | 2,659 | 3,481 | 3,311 | 2,880 | 2,589 | 3,045 |
| Very urgent (same day + one calendar day) | 1,976 | 2,593 | 2,601 | 2,191 | 1,738 | 1,656 |
| Urgent (same day + six calendar days) | 7,221 | 9,291 | 9,840 | 11,180 | 13,067 | 14,963 |
| Low urgency (same day + 27 calendar days) | 6,610 | 6,702 | 6,212 | 6,556 | 6,402 | 7,730 |
In the year ending 30 June 2003, 31,781 notifications involving children and young people under the age of 17 were received, of which 27,394 required further action. In the previous year, there were 27,507 notifications, with 23,805 requiring further investigation. After investigation, findings are classified and recorded under the categories of physical abuse, sexual abuse, emotional abuse, neglect, self-harm behaviour, problem behaviour/relationship difficulty, or abuse not found. Table 7.07 lists investigation findings for these categories.
Table 7.07. Abuse and neglect investigation findings Years ending 30 June
| Year | Sexual abuse | Physical abuse | Emotional abuse | Neglect | Behavioural/relationship problems | Selfharm suicidal | Abuse not found | Total |
|---|---|---|---|---|---|---|---|---|
1Some investigations might still have been waiting findings at the time the data was extracted. Source: Department of Child, Youth and Family Services | ||||||||
| 1998 | 1,502 | 1,671 | 1,080 | 2,356 | 3,856 | 119 | 6,937 | 17,521 |
| 1999 | 1,375 | 1,660 | 1,414 | 2,260 | 4,088 | 115 | 9,543 | 20,455 |
| 2000 | 1,223 | 2,208 | 2,303 | 2,939 | 3,685 | 145 | 9,787 | 22,290 |
| 2001 | 827 | 1,567 | 1,576 | 2,189 | 2,626 | 89 | 11,433 | 20,307 |
| 2002 | 1,250 | 2,066 | 2,153 | 3,053 | 3,473 | 83 | 15,007 | 27,085 |
| 20031 | 1,288 | 2,002 | 2,282 | 2,939 | 3,328 | 128 | 14,238 | 26,205 |
When, on investigation, it is decided that the Department of Child, Youth and Family Services needs to remain involved with a child or family, direct services may be provided through family/whanau agreements, care agreements, family group conference plans or court plans.
Case management. The Children, Young Persons and Their Families Act 1989 provides for a range of plans, agreements and orders relating to the care, custody and guardianship of children and young people. Family/whanau agreements are negotiated by a social worker when a family agrees there is a problem to address and agrees voluntarily to intervention. Such an agreement may be in force for up to three months, must be formally reviewed, and may be renewed for one further three-month period. Table 7.08 shows the number of agreements signed from 1998 to 2003.
Table 7.08. Family/whanau agreements Years ending 30 June
| 1998 | 1999 | 2000 | 2001 | 2002 | 2003 | |
|---|---|---|---|---|---|---|
| Source: Department of Child; Youth and Family Services | ||||||
| Agreements signed | 2,051 | 2,762 | 2,555 | 2,305 | 2,395 | 2,346 |
When a family/whanau agreement is not considered to be appropriate, intervention may occur through the statutorily defined process of a family group conference. The Department of Child, Youth and Family Services manages family group conference plans and court orders to provide care for the children while working towards their return to parents, family or whanau. Examples of these include custody orders, plans resulting from family group conferences, counselling orders and support orders. Table 7.09 lists plans completed and in force from 2001 to 2003.
Table 7.09. Care and protection plans and orders Years ending 30 June
| Plans and orders | Completed during year | In force during year | ||||
|---|---|---|---|---|---|---|
| 2001 | 2002 | 2003 | 2001 | 2002 | 2003 | |
- nil or zero Source: Department of Child, Youth and Family Services | ||||||
| Family group conference plans | 2,427 | 2,540 | 2,985 | 1,775 | 1,274 | 1,090 |
| Counselling order | 3 | 3 | 12 | 22 | 45 | 40 |
| Custody pending determination | 726 | 1,128 | 926 | 1,022 | 2,059 | 3,211 |
| Service order | 137 | 182 | 183 | 550 | 1,444 | 2,131 |
| Restraining order | 48 | 74 | 79 | 222 | 657 | 1,016 |
| Interim restraining order | 35 | 65 | 60 | 69 | 149 | 243 |
| Support order | 253 | 890 | 1,238 | 648 | 1,029 | 1,142 |
| Interim support order | 25 | 36 | 54 | 23 | 24 | 64 |
| Custody order | 640 | 1,120 | 1,632 | 3,307 | 10,126 | 15,045 |
| Interim custody order | 81 | 72 | 107 | 123 | 323 | 431 |
| Guardianship order - sole | 98 | 65 | 112 | 270 | 704 | 906 |
| Guardianship order - additional | 268 | 541 | 639 | 1,730 | 5,561 | 8,274 |
| Temporary care agreement | 25 | 1,918 | 1,678 | 940 | 300 | 229 |
| Extended care agreement | 123 | 168 | 273 | 90 | 243 | 196 |
| Extended care agreement disabled | 8 | - | 1 | 9 | 8 | 8 |
| Care for moderate disability | - | - | - | 1 | - | - |
| Total | 4,897 | 8,802 | 9,979 | 10,801 | 23,946 | 34,026 |
Emergency actions. The Children, Young Persons and Their Families Act 1989 provides measures for securing the safety of a child through warrant action by social workers or the police, or through temporary care agreements with parents, to provide immediate care for a child while longer-term solutions are explored.
Youth justice services provided by the Department of Child, Youth and Family Services under the Children, Young Persons and Their Families Act 1989 and the Criminal Justice Act 1985 include:
Working with police to find options and to ensure that cases are brought into the formal system only when public interest and/or safety is an issue.
Providing programmes and services targeted at youth at risk of offending, re-offending, or those with poor life outcomes. These include young people with conduct disorders, serious and repeat youth offenders, young sex abusers, young people with difficult-to-manage behaviour and those at risk of self harm.
Providing appropriate placements for young people who have been arrested.
Providing custodial services.
Management of youth justice plans.Table 7.10 shows that family group conference (FGC) plans predominate over court plans as a means of managing young people who come to the notice of the Department of Child, Youth and Family Services through the youth justice provisions of the Children, Young Persons and Their Families Act 1989. FGCs encourage participation in the resolution of care and protection issues and often avoid the need for court involvement. Plans formulated by a FGC must be reviewed by reconvening the conference or by a less formal process.
Table 7.10. Youth justice family group conference plans and court orders Years ending 30 June
| Plans and orders | Completed during year | |||
|---|---|---|---|---|
| 2000 | 2001 | 2002 | 2003 | |
| Source: Department of Child, Youth and Family Services | ||||
| Family group conference plans | 3,645 | 3,970 | 4,104 | 4,283 |
| Supervision orders | 495 | 442 | 391 | 380 |
| Community work orders | 119 | 118 | 64 | 57 |
| Supervision with activity orders | 151 | 123 | 84 | 83 |
| Supervision with residence orders | 125 | 122 | 119 | 132 |
| Total | 4,535 | 4,775 | 4,762 | 4,935 |
Youth justice family group conferences. Family group conferences (FGCs) are convened to address the offending behaviour of children and young people. They bring together, in a statutory-defined forum, members of the offender's family or whanau, law enforcement officers and victims to agree how the young offender will be held accountable, and to agree on appropriate intervention plans.
Care services. Two main placement options are used in New Zealand for children and young people requiring alternative care. These are either based in a home (extended family, caregivers, family home, special purpose family home, specialist or group homes) or in a residential care centre (short or extended-term local or national residences).
Table 7.11 shows admissions to national residences in recent years.
Table 7.11. Admission to national residences Years ending 30 June
| 1995 | 1996 | 1997 | 1998 | 1999 | 2000 | 2001 | 2002 | 2003 | |
|---|---|---|---|---|---|---|---|---|---|
| Source: Department of Child, Youth and Family Services | |||||||||
| Admissions | 1,510 | 1,337 | 1,050 | 989 | 810 | 1,058 | 814 | 746 | 751 |
International research indicates that family-based placements are more effective than other forms of placement.
Children and young people are more likely to return to their usual caregivers, and are less likely to be re-abused, if they are placed in family-based care rather than in non kin-based care.
The Children, Young Persons and Their Families Act 1989 shifted the emphasis away from longer-term, extended-care placements towards restoring usual care giving arrangements.
When alternative placements are necessary, emphasis is put on making a placement, whenever possible, within the child's extended family or community.
Home-based care - There were 3,085 children in non-family/whanau care and 1,395 in family/ whanau care at 30 June 2002. By 30 June 2003, there were 3,117 in non-family/whanau care and 1,565 in family/whanau care.
Residential care - The current Residential Services Strategy (RSS) building programme dates from a review of the RSS in 1996 and cabinet agreement to build or upgrade nine residential facilities. The strategy allowed for the establishment of specialist units for young sex abusers, for conduct disorder children and young people, and for the separation of youth justice and care and protection residential facilities. This approach continues to form the basis of the RSS building programme.
The adoption information and services unit of the Department of Child, Youth and Family Services is responsible for statutory adoption services.
The department's local and inter-country adoption services include education, preparation and assessment of prospective adoptive applicants, counselling of birth parents, approval of placements, supervision and reporting to the New Zealand Family Court.
Post-adoption services for birth and adoptive families are provided when requested, or referrals made.
Table 7.12 shows access to adoption information from 1994 to 2003.
Table 7.12. Access to adoption information
| Action | 1994 | 1995 | 1996 | 1997 | 1998 | 1999 | 2000 | 2001 | 2002 | 2003 |
|---|---|---|---|---|---|---|---|---|---|---|
- nil or zero Sources: Department of Child, Youth and Family Services Department of Internal Affairs | ||||||||||
| Original birth certificates issued to adopted people | 1,849 | 1,597 | 1,580 | 1,925 | 1,446 | 1,356 | 1,230 | 1,030 | 943 | 902 |
| Original vetoes from adopted people | 26 | 36 | 17 | 30 | 22 | 8 | 1 | 4 | - | 6 |
| Renewal vetoes from adopted people | - | - | 51 | 13 | 4 | 5 | 6 | 8 | - | 9 |
| Cancelled vetoes from adopted people | 14 | 8 | 17 | - | 2 | 3 | 5 | 1 | 2 | 2 |
| Birth parent applications for identifying information | 717 | 610 | 650 | 534 | 450 | 392 | 325 | 303 | 285 | 269 |
| Original vetoes from birth parents | 34 | 69 | 126 | 60 | 22 | 15 | 4 | 2 | 1 | 5 |
| Renewal vetoes from birth parents | - | - | 351 | 77 | 19 | 11 | 13 | 13 | 10 | 11 |
| Cancelled vetoes from birth parents | 15 | 14 | 10 | 2 | 6 | 1 | 1 | 1 | 5 | - |
Table 7.13 shows adoptions by New Zealand citizens in recent years.
Table 7.13. Adoptions by New Zealand citizens Years ending 30 June
| Adoption type | 1997 | 1998 | 1999 | 2000 | 2001 | 2002 | 2003 |
|---|---|---|---|---|---|---|---|
1A registration may occur in a different fiscal year from the adoption report, hence total adoptions may not always equal the sum of the adoption reports written by the department for the same period. Any disparity is included under ‘adoption type not recorded’. Source: Department of Child, Youth and Family Services | |||||||
| Adoption of New Zealand children | |||||||
| Adoption reports in respect to Non-relatives | 131 | 125 | 122 | 87 | 78 | 104 | 81 |
| One parent and spouse | 179 | 174 | 122 | 120 | 119 | 89 | 71 |
| Relatives | 163 | 116 | 111 | 117 | 104 | 96 | 71 |
| Foster parents | 28 | 13 | 15 | 8 | 9 | 9 | 2 |
| Adoption type not recorded1 | 90 | 115 | 41 | 32 | 9 | 27 | 98 |
| Total | 591 | 543 | 411 | 364 | 319 | 325 | 323 |
| Adoption of foreign children | |||||||
| In New Zealand court to non-relatives | 10 | 13 | 6 | 16 | 14 | 7 | 13 |
| In New Zealand court to relatives | 60 | 89 | 47 | 90 | 50 | 48 | 38 |
| In overseas court | 436 | 358 | 350 | 274 | 344 | 256 | 265 |
| Total | 506 | 460 | 403 | 380 | 408 | 311 | 316 |
| Total adoptions granted or recognised by New Zealand | 1,097 | 1,003 | 814 | 744 | 727 | 636 | 639 |
Approval and contracting with not-for-profit providers. Community providers are funded each year by the Department of Child, Youth and Family Services to provide a variety of social services from non-departmental output classes. The department is responsible for the allocation and management of funding and support to iwi and community-based social and welfare services in accordance with government policies and criteria. Table 7.14 shows budget allocations for contracted social services in 2002 and 2003.
Table 7.14. Non-departmental budget allocations Years ending 30 June
| Allocation | 2002 | 2003 |
|---|---|---|
| Source: Department of Child, Youth and Family Services | ||
| $(000) | ||
| Information and advice | 1,426 | 1,426 |
| Education and prevention services | 9,640 | 9,547 |
| Family well-being services | 46,967 | 49,291 |
| Counselling and rehabilitation services | 13,617 | 13,435 |
| Emergency and special purpose housing and associated services | 995 | 995 |
| Strengthening providers and communities | 8,967 | 9,391 |
| Total | 81,612 | 84,085 |
| Other expenses to be incurred by the department | ||
| Contingency and innovations fund | 365 | 365 |
| Stronger communities action fund | 1,490 | 1,916 |
7.1 Ministry of Social Development; Office of the Retirement Commissioner.
7.2 Ministry of Social Development; Veteran's Affairs New Zealand; Department of Child, Youth and Family; Registrar General's Office, Department of Internal Affairs; New Zealand Association of Citizens Advice Bureaux.
www.cyf.govt.nz - Adoption Information and Services Unit
www.cab.org.nz - Citizens Advice Bureau
www.cyf.govt.nz - Department of Child, Youth and Family Services
www.dia.govt.nz - Department of Internal Affairs
www.msd.govt.nz - Ministry of Social Development
www.retirement.org.nz - Office of the Retirement Commissioner
www.sorted.org.nz - Office of the Retirement Commissioner (money management)
www.nzrsa.org.nz - Royal New Zealand Returned Services Association
www.winz.govt.nz - Work and Income
Table of Contents
Scientists at Wellington's Malaghan Institute carry out research into cancer, asthma, multiple sclerosis and infectious diseases.
The New Zealand health system is made up of public, private and voluntary sectors, which interact to provide and fund health care. Seventy-eight percent of health care is publicly funded, with out-of-pocket payments and private insurance being the other main contributors.
The Ministry of Health is the government's primary advisor on health policy and disability support services and is responsible, among other things, for monitoring the performance of district health boards (DHBs) and other health sector Crown entities; implementing, administering and enforcing relevant legislation and regulations; providing health information and processing payments; providing nationwide planning and maintenance of service frameworks; and planning and funding public health, disability support services and other service areas that are retained centrally.
The Ministry of Health consists of eight directorates; each led by a deputy director-general.
The Corporate and Information Directorate provides management of national data collections and the dissemination of health information through the New Zealand Health Information Service. It processes claims, payments and agreements on behalf of DHBs for the health and disability sector and provides legal advice on policy development, legislation and regulations, litigation, prosecutions, medico-legal issues, contracts and contracting, legal compliance, health regulatory frameworks and statutory decision making.
The Clinical Services Directorate provides an interface between the ministry, health providers, health professionals and communities, and manages the strategic development of publicly-funded clinical services and inter sectoral programmes. It evaluates new services, systems and innovative projects, and administers safety and facility-licensing legislation.
The DHB Funding and Performance Directorate is responsible for funding and monitoring the performance of DHBs and other health sector Crown entities. It supports DHB strategic planning, annual planning and Crown Funding Agreement processes, and provides nationwide planning and maintenance of service frameworks.
The Disability Services Directorate plans and develops support services for disabled people and their families and whānau; funds disability support service providers; and contributes to implementation of the New Zealand Disability Strategy.
The Māori Health Directorate provides policy advice on the strategic direction of the health and disability sector with respect to Māori health and disability.
The Mental Health Directorate is responsible for implementing the Mental Health Strategy and for the administration of regulations related to mental health.
The Public Health Directorate is responsible for the direction of population health services and for the regulation for public health and safety. The directorate contains the National Screening Unit, the National Radiation Laboratory and Medsafe.
The Sector Policy Directorate provides strategic policy advice to the government across all aspects of the health and disability sector, with a particular focus on long-term funding requirements. The directorate also administers health professional statutes and assesses the implications of emerging health sector issues.
Ministry of Health business units employ 41 percent of the ministry's staff. The business units and their responsibilities:
The New Zealand Health Information Service is responsible for the stewardship, management and coordination of national data collections and the dissemination of health information.
Health PAC is responsible for processing claims, payments and agreements on behalf of DHBs for the health and disability sector, including the audit of claims and agreements to ensure they comply with contract requirements.
The National Screening Unit is responsible for ensuring the effective delivery of the national breast and cervical cancer screening programmes.
Medsafe is responsible for the regulation of therapeutic products in New Zealand.
The National Radiation Laboratory is responsible for expert advice, service provision and research capability on matters concerning public, occupational and medical exposure to radiation, the performance of radiation equipment, and the measurement of radiation and radioactivity.
The Clinical Training Agency is responsible for funding post-entry clinical training programmes.
New Zealand's 21 district health boards are Crown entities and have both funding (planning and funding health services for their populations) and provider (delivery of hospital and related services) roles.
Established under the New Zealand Public Health and Disability Act 2000, the statutory objectives of district health boards are to improve, promote and protect the health of communities, to promote integration of health services, especially primary and secondary care services, and to promote effective care or support of those in need of personal health services or disability support. Boards also have the responsibility of promoting the independence, inclusion and participation in society of people with disabilities and of reducing health outcome disparities among various population groups.
Boards are expected to show a sense of social responsibility, to foster community participation in health improvement, and to uphold the ethical and quality standards commonly expected of providers of services and public sector organisations.
The boards work with all health care provider organisations to ensure the provision of specified health services and balance each community's needs for health and disability services.
Crown-owned public hospitals are the main providers of secondary health care services. Primary and community-based care comes from private/non-government owned providers such as general practitioners, Māori providers and disability support providers.
Boards have a majority of elected members, with some members appointed by the Minister of Health. Each board has three statutory advisory committees: a community and public health advisory committee, a disability support advisory committee and a hospital advisory committee. Each board has a separate operating charter and a set of accountabilities and reporting requirements.
The 21 district health boards and their constituencies are:
Northland - Far North, Whangarei, Kaipara.
Waitemata - Rodney, North Shore, Waitakere.
Auckland - Auckland north-west and gulf, Auckland north-east, Auckland south.
Counties Manukau - Manukau, Mangere, Manurewa, Franklin, Papakura.
Waikato - Thames-Coromandel, Waikato, Hamilton, South Waikato.
Bay of Plenty - Western Bay of Plenty, Tauranga, Whakatane.
Lakes - Rotorua north, Rotorua south, Taupo.
Tairawhiti - Gisborne, Tairawhiti.
Hawke's Bay - Wairoa, Hastings, Napier-Chatham Islands, Central Hawke's Bay.
Taranaki - New Plymouth, Taranaki north, Taranaki south.
Whanganui - Wanganui, Waimarino, Rangitikei.
Midcentral - Manawatu, Palmerston North, Tararua, Horowhenua.
Wairarapa - Masterton, Carterton, South Wairarapa.
Hutt - Lower Hutt central, Lower Hutt harbour, Wainuiomata.
Capital and Coast - Kapiti Coast, Porirua, Wellington north-west, Lambton, Wellington southeast.
Nelson-Marlborough - Tasman, Richmond, Nelson, Marlborough, Blenheim.
West Coast - Buller, Grey, Westland.
Canterbury - North Canterbury, Christchurch, Mid-Canterbury.
South Canterbury - Timaru, Temuka-Pleasant Point, Mackenzie-Geraldine, Waimate.
Otago - Waitaki, Central Otago, Clutha, Dunedin north, Dunedin south.
Southland - Queenstown-Lakes, Southland, Gore, Invercargill.
The Residual Health Management Unit (RHMU) is the Crown financing agency for district health boards. This is essentially a banking role whereby the unit provides boards with term debt through a similar range of facilities as private sector banks.
Other functions undertaken by the RHMU are management of the historical debt of former area health boards, management of the boards' residual assets, such as long-term property leases, management of contingent legal liabilities of the former boards, and assisting district health boards dispose of surplus property, including land.
The RHMU operates under the provisions of the New Zealand Public Health and Disability Act 2000.
National Advisory Committee on Health and Disability. The National Advisory Committee on Health and Disability (National Health Committee) advises the government on the quality and mix of public health, personal health and disability support services that should be publicly funded. It also provides independent public health policy advice to the minister, a role strengthened in the New Zealand Public Health and Disability Act 2000 by the requirement for the National Health Committee to establish a public health advisory committee. The National Health Committee seeks to ensure that maximum benefit is obtained from public funds for health care and public health services. The National Health Committee website is www.nhc.govt.nz
National Advisory Committee on Health and Disability Support Services Ethics. The committee's statutory functions are to advise the Minister of Health on ethical issues of national significance in respect of any health and disability matter, including research, to determine nationally-consistent ethical standards across the health sector, and to provide scrutiny for national health research and health services. The committee is required to consult with those involved in the funding or provision of services, and with other people the committee considers appropriate, before providing advice on an issue. The committee is required to deliver to the minister at least once a year a report setting out its activities and summarising its advice on matters referred to it.
Health Workforce Advisory Committee. A key task of the committee is to provide independent assessment and recommendations to the Minister of Health on health workforce capacity and on the requirements needed to meet the objectives of health and disability strategies. The committee is also required to facilitate cooperation among organisations involved in health workforce education and training.
Ministerial Advisory Committee on Complementary and Alternative Health. This committee is responsible for providing information and advice to the Minister of Health on complementary and alternative health care. Among its tasks is to provide advice on whether, or how, specified complementary and alternative health practitioners should be integrated into the mainstream health system.
The Child and Youth Mortality Committee is responsible for reviewing the deaths of children and young people aged between 28 days and 25 years with a view to reducing the number of preventable deaths. The committee's key task is to gather secure information from a range of agencies that will support the reviewing of deaths.
National Ethics Committee on Assisted Human Reproduction. The National Ethics Committee on Assisted Human Reproduction is responsible for reviewing assisted human reproduction proposals (including health research and innovative treatment proposals), for providing guidelines for fertility clinics, and for providing advice to the Minister of Health on matters relating to assisted human reproduction.
The National Health Epidemiology and Quality Assurance Committee is responsible for providing the Minister of Health with advice on any matter of health epidemiology and quality assurance, but must specifically examine perinatal, child and adolescence morbidity and mortality.
The New Zealand Blood Service (NZBS) ensures the supply of safe blood and blood products. It is also responsible for all aspects of the integrated national blood transfusion service, from the collection of blood from volunteer donors to the transfusion of blood products within the hospital environment - ‘vein to vein’ transfusion.
The New Zealand Blood Service is responsible for all aspects of the integrated national blood transfusion service, including ‘vein-to-vein’ transfusions.
Health Research Council of New Zealand. The Health Research Council of New Zealand (HRC) was established under the Health Research Council Act 1990 and is the major government agency purchasing and coordinating health research in New Zealand. The act requires the council to set guidelines for health research ethics and to accredit regional ethics committees. The HRC is also responsible for advising the Ministry of Health on the scientific merit of gene therapy proposals and clinical trials. The council's mission is to improve human health by promoting and purchasing health research. The council purchases a broad spectrum of research, including biomedical, public health, Māori and Pacific people's health, and clinical research. HRC funding is largely allocated through Vote: Research, Science and Technology, with funding for ethics policy advice coming from Vote: Health. Total government funding for the council's work in 2003/04 was $49.48 million. The council's website is www.hrc.govt.nz
The Malaghan Institute of Medical Research was established in 1979 as an independent medical research institute. Formerly known as the Wellington Cancer and Medical Research Foundation, it was renamed in 1986 to recognise the contribution of Len and Ann Malaghan. The institute is a charitable trust, with more than 40 full-time scientists dedicated to the relief of human suffering through scientific research into the causes, nature and treatment of disease.
Malaghan Institute scientists carry out research into cancer, asthma, multiple sclerosis and infectious diseases, including tuberculosis and RSV (a respiratory infection most serious in children under 12 months).
The institute has a commitment to educating, fostering and developing scientists, which it regards as essential to the continuing success of scientific research in New Zealand. To that end, the institute sponsors programmes for doctoral candidates, summer internships for university students and a science investigator award for secondary students.
The Malaghan Institute is funded by contestable research grants, contributions from corporate sponsors, and bequests and donations. Formerly housed at the Wellington School of Medicine, the institute recently moved to a larger, state-of-the-art facility at Victoria University which provides greater scope for the institute's research capabilities.
The Malaghan Institute website is www.malaghan.org.nz
Health expenditure (public) in New Zealand amounted to an estimated $8 billion for the financial year ending 30 June 2002, as shown in Table 8.01. This represented 20 percent of the government's total budgeted expenditure for the financial year.
Table 8.01. Health expenditure1 Years ending 30 June
| Sector | 1994 | 1995 | 1996 | 1997 | 1998 | 1999 | 2000 | 2001 | 2002 |
|---|---|---|---|---|---|---|---|---|---|
1CPI-deflated, non-health items excluded. 2Expressed in 1998/99 dollars. Note:Figures may not add to stated totals due to rounding. Source: Ministry of Health | |||||||||
| $(million)2 | |||||||||
| Public | 5,350 | 5,489 | 5,534 | 5,843 | 6,208 | 6,490 | 6,984 | 7,602 | 8,319 |
| Private | 1,551 | 1,624 | 1,683 | 1,717 | 1,851 | 1,886 | 1,968 | 2,300 | 2,361 |
| Total | 6,902 | 7,112 | 7,218 | 7,560 | 8,059 | 8,376 | 8,952 | 9,902 | 10,680 |
The health service workforce is made up of a large number of professions and occupations. Some require lengthy tertiary education and enrolled entry to their professions, while others need no formal training. The Health Practitioners Competence Assurance Act 2003 seeks to protect the health and safety of members of the public by providing mechanisms to ensure that health practitioners are competent and fit to practise their professions.
Doctors. The Medical Council of New Zealand is a statutory body operating under the Medical Practitioners Act 1995. The primary purpose of the council is to protect public health and safety through the registration of appropriately-trained doctors and the maintenance of medical competence. Registration is evidence that a doctor has met a certain standard. In addition to registration, the council has responsibilities in the areas of doctor education, standards, conduct and health.
The main functions of the council are:
Registration - The council registers all doctors working in New Zealand. Doctors who complete medical training outside New Zealand or Australia must show they meet certain standards by examination and/or assessment before registration is granted. Doctors with recognised higher postgraduate training are vocationally registered in recognised branches of medicine (sometimes called specialists).
Medical education - This involves accreditation of New Zealand medical schools, courses and curricula and, in association with the Australian Medical Council, accreditation of Australasian medical schools. The council approves hospitals as suitable for the education, training and experience of interns in their seventh year, the mandatory period before general registration. In addition, it promotes vocational and continuing medical education in New Zealand and accredits societies and colleges responsible for postgraduate or higher training.
Health - The council manages the rehabilitation and continued monitoring of doctors who, because of some mental or physical health problem, may not be fit to practise for a period of time.
Professional standards - Legislation provides for the council to review competency of doctors and to implement remediation as appropriate, including, if necessary, imposing conditions on annual practising certificates or registration. The council also ensures doctors maintain their competency to practise through continuing medical education, peer reviews and individual audits to overcome any knowledge or skill gaps.
Complaints and discipline - The act establishes a Medical Practitioners Disciplinary Tribunal, an autonomous body separate from the medical council. The council does, however, receive complaints if the matter occurred before July 1996 and must liaise with the Health and Disability Commissioner and, as appropriate, appoint complaints assessment committees to establish what action is to be taken on such complaints.
The number of practising doctors at 31 March 2003 was 10,355.
The council's website is www.mcnz.org.nz
Dentists. The New Zealand Dental Council is governed by the Dental Act 1988. It registers dentists, promotes high standards of professional education and conduct among dentists, and provides administration services for the Dentists' Disciplinary Tribunal. The number of dentists on the register at 30 June 2003 was 1,946, a decrease of 372 on the June 2001 figure. The Dental Act 1988 provides for a disciplinary structure, with an independent complaints assessment committee (CAC) and the tribunal comprising both dentists and lay members. From inception of disciplinary procedures in 1988 to 31 March 2003, the council referred 173 written complaints against registered dentists to the CAC. Of these, 96 complaints were closed after CAC investigation, five complaints were under investigation, 54 complaints were heard by the tribunal, 10 complaints were withdrawn by the complainant during CAC investigation, six complaints were withdrawn by the complainant at the tribunal hearing, one dentist was not fit to plead before the tribunal, and one file sent to the tribunal was withdrawn and closed by the CAC. The Health and Disability Commissioner is now the primary vehicle for dealing with complaints about dentists. All complaints against a dentist regarding events which occurred after 1 July 1996 are referred to the commissioner, who is concerned with breaches of the Code of Consumers' Rights. Any matters that do not breach the code, but nevertheless may require professional disciplinary action, are still referred to the CAC for investigation. Professional dental studies are provided at the School of Dentistry, University of Otago.
Nurses and midwives. The Nursing Council of New Zealand Te Kaunihera Tapuhi o Aotearoa is constituted under the Nurses Act 1977. Its primary function is the registration of nurses and midwives and enrolment of enrolled nurses. The council sets minimum standards for registration and enrolment; sets standards for, and monitors, programmes leading to registration and enrolment; conducts examinations; approves programmes of nursing and midwifery; issues annual practising certificates; and exercises disciplinary powers. It also maintains a register of comprehensive, general, general and obstetric, psychiatric, and psychopaedic nurses, a register of midwives and a roll for enrolled nurses. As at 31 March 2004, annual practising certificates were held by 51,602 nurses and midwives, 2,981 more than at 31 March 2001 and an 11 percent increase on the numbers registered five years earlier on 31 March 1999. All registered nurses and midwives are educated through three-year degree courses leading to registration as a comprehensive nurse or midwife. Post-basic education ranges from regular in-service and short clinical courses to diploma and transition to degree courses at polytechnics, and certificates, diplomas and degrees to doctorate level at universities. The nursing council is extending its professional role in response to the wishes of the nursing and midwifery professions. It has distributed a code of conduct and has developed requirements for competence-based practising certificates. Complaints about nurses and midwives are referred to the Health and Disability Commissioner. The council heard 20 disciplinary matters in 2003.
Psychologists. The Psychologists' Board is constituted under the Psychologists' Act 1981. The board is concerned with registration and education of psychologists and the discipline of registered psychologists. At 31 March 2003, there were 2,141 registered psychologists (an increase of 305 on the March 2001 figure), with 1,308 (an increase of 147 since March 2001) holding annual practising certificates. Current legislation requires registration only for those psychologists practising in the state services or in institutions licensed under the Mental Health (Compulsory Assessment and Treatment) Act 1992.
The New Zealand Dental Council registers dentists and promotes high standards of professional education and conduct among dentists.
Physiotherapists. The Physiotherapy Board, constituted under the Physiotherapy Act 1949, registers physiotherapists who are safe and competent to practise in New Zealand, disciplines registered physiotherapists and issues ultrasonic therapy licences. Four-year, full-time courses in physiotherapy are offered at the University of Otago and the Auckland University of Technology. Successful completion of these qualifications is required for registration. At 31 January 2003, there were 6,169 registered physiotherapists (an increase of 610 on the 2001 figure), with 2,774 (an increase of 271) holding annual practising certificates.
Occupational therapists. The Occupational Therapy Board is constituted under the Occupational Therapy Act 1949. The board is concerned with the education, registration and conduct of occupational therapists. Three-year, full-time training courses are conducted at the Auckland University of Technology and at Otago Polytechnic. Successful completion of a course is required for registration. At 31 March 2003, there were 2,981 registered occupational therapists (an increase of 194 on the March 2002 figure), with 1,609 (an increase of 63) holding annual practising certificates.
Dietitians. The Dietitians' Board is constituted under the Dietitians' Act 1950. A15-month postgraduate training course for dietitians is conducted at the University of Otago. The prerequisite qualification for entry into the programme is a three-year Bachelor of Consumer and Applied Science, or a Bachelor of Science degree from the University of Otago. At 31 March 2003, there were 1,083 registered dietitians (an increase of 26 on the March 2002 figure), with 385 (an increase of six) holding annual practising certificates.
Optometrists are trained at the University of Auckland in a five-year, full-time degree course.
Optometrists and dispensing opticians. The Opticians' Board, constituted under the Optometrists and Dispensing Opticians' Act 1976, is concerned with the registration and conduct of optometrists and dispensing opticians. Optometrists are trained at the University of Auckland in a five-year, full-time degree course. Dispensing opticians are trained through a two and-a-half-year correspondence course. At 31 March 2003, there were 1,053 registered optometrists, 531 of whom held annual practising certificates, and 178 registered dispensing opticians, with 99 holding annual practising certificates. There were 36 more optometrists and dispensing opticians holding practising certificates at 31 March 2003 than there had been a year earlier.
Podiatrists. The Medical Auxiliaries Act 1966 provides for the constitution of a Podiatrists' Board. The board registers qualified podiatrists and sets standards of education and conduct. The Auckland University of Technology offers a three-year Bachelor of Health Science (Podiatry) degree, the qualification recognised for registration. At 6 November 2003, there were 514 registered podiatrists, 39 more than at 30 June 2001. Of these, 254 held annual licenses, compared with 231 in 2001
Chiropractors. The Chiropractic Board is constituted under the Chiropractors' Act 1982 and is concerned with the registration, education and professional conduct of practising chiropractors. Graduates from board-approved chiropractic colleges are eligible to take the board's competency examination and successful candidates are considered for registration by the board. The New Zealand College of Chiropractic offers a five-year course leading to a Bachelor of Chiropractic degree. On 30 June 2003, there were 271 registered chiropractors in New Zealand, compared with 418 at 30 June 2001.
Pharmacists. Until 18 September 2004, the Pharmacy Act 1970 provided for the registration of pharmacists, all of whom had to be members of the Pharmaceutical Society of New Zealand. The society provided the combined function of a registration board, including discipline, and the functions of a professional body, including education, establishing standards and caring for public interests. The society also acted as the registering authority for pharmacies under the provisions of the Pharmacy Registration Regulations 1975. On 18 September 2004, the Health Practitioners Competence Assurance Act 2003 repealed the Pharmacy Act and dissolved the Pharmaceutical Society of New Zealand. A Pharmacy Council became responsible for the registration, competence to practice and discipline of pharmacists. Licensing of pharmacies became the responsibility of the Ministry of Health under the Medicines Act 1981. Entry to the pharmacy profession is via a four-year degree course at either the University of Auckland or the University of Otago, followed by a formal one-year pre-registration programme of practical training in order to achieve competence and gain registration as a pharmacist. Reciprocal recognition of qualifications exists between New Zealand and the states of Australia, with other applicants individually assessed. On 1 January 2004, there were 3,893 pharmacists on the register, 34 more than the year before. At the same time, there were 909 registered community pharmacies, compared with 930 in January 2003, 943 in January 2002 and 1,057 in January 1994.
Assurance Act 2003 repealed the Pharmacy Act and dissolved the Pharmaceutical Society of New Zealand. A Pharmacy Council became responsible for the registration, competence to practice and discipline of pharmacists. Licensing of pharmacies became the responsibility of the Ministry of Health under the Medicines Act 1981. Entry to the pharmacy profession is via a four-year degree course at either the University of Auckland or the University of Otago, followed by a formal one-year pre-registration programme of practical training in order to achieve competence and gain registration as a pharmacist. Reciprocal recognition of qualifications exists between New Zealand and the states of Australia, with other applicants individually assessed. On 1 January 2004, there were 3,893 pharmacists on the register, 34 more than the year before. At the same time, there were 909 registered community pharmacies, compared with 930 in January 2003, 943 in January 2002 and 1,057 in January 1994.
Medical radiation technologists. The Medical Radiation Technologists' Board is constituted under the Medical Auxiliaries Act 1966. The board is concerned with the registration, education and conduct of those practising medical radiation technology. There are five classes of medical radiation technology: diagnostic imaging, nuclear medicine, radiation therapy, ultrasound imaging and magnetic resonance imaging. At 31 March 2003, there were 3,123 registered practitioners (an increase of 148 on the June 2001 figure), 1,648 of whom held annual licences (an increase of 127). Students study diagnostic-imaging at UNITEC, UCOL and Christchurch Polytechnic Institute of Technology. Those who wish to study radiation therapy undertake a three-year course at the University of Otago's Wellington School of Medicine and Health Sciences.
Medical laboratory technologists. The Medical Laboratory Technologists Board is constituted under the Medical Auxiliaries Act 1966 and is concerned with the training, registration and conduct of those engaged in the practice of medical laboratory science/technology. The University of Otago, Massey University and Auckland University of Technology offer a Bachelor of Medical Laboratory Science degree, and the board also approves a diploma route to registration. From September 2004, the board became the Medical Laboratory Science Board under the Health Practitioners Competence Assurance Act 2003. At 31 March 2003, there were 2,877 registered medical laboratory technologists, an increase of 139 since 30 June 2001. Of these, 1,428 were licensed to practise, compared with 1,318 in 2001.
Clinical dental technicians and dental technicians. The Dental Technicians' Board controls the registration of clinical dental technicians and dental technicians, liaises with educational establishments on training and examination requirements and advises the Minister of Health on any matter relating to the work of clinical dental technicians and dental technicians. The board is constituted under the Dental Act 1988, which is being phased out by the Health Practitioners Competence Assurance Act 2003. As at 31 March 2003, 160 clinical dental technicians (an increase of 26 on the 20 November 2001 figure) and 178 dental technicians (a decrease of 12) were registered and held annual practising certificates. Dental technicians train at the School of Dentistry, University of Otago, where, after completing a three-year training programme, they graduate as a Bachelor in Dental Technology. After obtaining their degree and working for at least two years as a dental technician, they are eligible to complete the Postgraduate Diploma in Clinical Dental Technology from the School of Dentistry.
General practitioner subsidies. People on low incomes who are not enrolled in a Primary Health Organisation access the government subsidy for general practitioner visits through a community services card, issued to an individual and dependent family members. People with high health needs access the government subsidy through a high use health card. The subsidy for children under the age of six is $35, and for those six years and over it is $20 for cardholders and $15 for non-cardholders. Adult cardholders receive a subsidy of $15 per consultation. A higher subsidy is paid to general practitioners in certain rural areas, and an immunisation benefit covers the cost of vaccinations for children under the age of 16.
Hospital treatment. Inpatient, outpatient and day treatment in New Zealand public hospitals is free for all people eligible to access publicly-funded health services. Services related to public hospital treatment, such as pharmaceuticals and x-rays, are also free. Inpatient, outpatient and day treatment in public psychiatric hospitals is free. Mental health services, including pharmaceuticals, are free to day patients or outpatients, including those who are patients of community mental health teams and are on community treatment orders.
Pharmaceutical benefits. All people eligible for publicly-funded health services are entitled, at a small cost to themselves, to a wide range of medicines, approved appliances and materials included in the pharmaceutical schedule and prescribed by health professionals with prescribing rights. The pharmaceutical schedule is a list of drugs and services subsidised by the government. Special mechanisms are in place to ensure people get access to non-schedule drugs in exceptional circumstances. The government sets a standard maximum pharmaceutical charge of $15 an item. Medication costing less than $15 is charged accordingly. Higher government subsidies on pharmaceuticals are available for low income people, people with high health needs and children under the age of six. In addition, there is a subsidy on contraceptives. Children under six are exempt from charges on pharmaceuticals, with the exception of one or two specific items. Individuals or families pay the pharmaceutical charge of $15 for the first 20 pharmaceutical items from 1 February each year. The government then additionally subsidises pharmaceutical needs, and non-cardholder families and high use health cardholders pay a residual charge of $2 an item until the following 1 February. Community services cardholders do not pay a prescription charge until the following 1 February.
Dental services. Routine dental care is free for preschoolers, primary school children and adolescents. Dental therapists provide dental care for preschoolers and primary school children. Dentists under contract to district health boards provide dental care for adolescents. Some public hospitals have dental departments which provide services to patients. The government also funds emergency dental treatment for low income earners.
Maternity services. Eligible women in New Zealand receive free pregnancy, childbirth and postnatal care from general practitioners or midwives through benefits paid by the Ministry of Health. Some women choose to receive primary maternity care from a specialist obstetrician and may then be charged above the rate provided by the benefit. If there are clinical reasons requiring the involvement of a specialist obstetrician, the service is available free from public hospitals. Approximately 96 percent of births take place in hospitals, but midwives may provide care to women who choose to have their babies at home. All maternity hospitals are licensed under the Hospitals Act 1957 and the Ministry of Health is responsible for ensuring that regulations regarding buildings, equipment and staff are observed.
Home nursing and home help. Home nursing and home help in New Zealand is free when provided by a registered nurse or midwife employed by a district health board or an approved organisation. Subsidies are available to organisations that provide domestic help in appropriate cases to older people or families with young children. District health boards also provide home aid as part of a range of services to reduce the need for hospital or residential home care, and as a temporary follow up to hospital care.
Artificial aids. Specific benefits from the Ministry of Health are available in various circumstances for a range of artificial aids. These include breast prostheses, hearing aids, wheelchairs, artificial eyes and wigs. Specific eligibility conditions as to the suitability of the aid and the necessity for it apply in each case. Benefits generally contribute to the initial cost and to replacements.
PHARMAC. The Pharmaceutical Management Agency (PHARMAC) is a Crown entity reporting to the Minister of Health whose main role is to manage New Zealand's pharmaceutical schedule - the list of nearly 2,400 subsidised prescription drugs and related products. The schedule, updated monthly, records the price of each drug, the subsidy it receives from public funds and the guidelines or conditions under which it is subsidised. In 2002/03, 63 new products were added to the schedule, compared with 78 new products in 2001/02. District health boards spent $512 million on pharmaceuticals (drug cost ex manufacturer) in the year ending 30 June 2003, up $9 million (1.8 percent) on the previous year. This controlled increase reflects PHARMAC's ability to negotiate lower prices, which offsets volume growth and spending on new pharmaceuticals. PHARMAC also promotes the optimal use of prescription medicines and manages the purchasing of some pharmaceuticals used in hospitals.
HealthPAC. The role of HealthPAC (formerly Health Benefits) is to make government subsidy payments to health professionals on behalf of the Ministry of Health and to monitor payments to ensure that taxpayer money is being appropriately spent. This applies to all primary care-based transactions subsidised by the government, such as visits to the doctor, pharmaceutical prescriptions and maternity or immunisation services. HealthPAC handles approximately $1.2 billion in payments a year, involving more than 34 million items in pharmacy payments alone. HealthPAC also provides information to the Ministry of Health, health providers and other appropriate agencies about patterns of spending on health prescription costs and medicine usage, health trends and claiming patterns.
Public health services are generally those provided to populations rather than to individuals or those provided to individuals who require population-wide planning, such as population-based screening and development of an immunisation register. Public health supports a population health approach which takes into account all factors which determine health, and systematically plans how these will be tackled and how inequalities can be reduced. Public health services account for 1.9 percent of health services funded through Vote: Health.
The Public Health Directorate of the Ministry of Health is responsible for providing policy and strategic advice on public health issues and services, for monitoring the state of the health of the population, for developing and enforcing public health legislation, for developing public health strategies and for planning and funding public health services.
Twelve public health units based in district health boards (DHB) provide health promotion, health protection and disease prevention services to all 21 DHB districts.
Public health activities are also carried out by local authorities who have a role in the improvement, promotion and protection of public health and are charged with developing long-term plans with a focus on community public health. Around 200 non-government providers also provide complementary public health services at national, regional and local level.
Work continued during 2003 and 2004 on a major review of the Health Act 1956 and a proposed Public Health Bill. The new bill will provide the primary legislative framework for the identification, assessment and management of risks to public health. While the focus will be on environmental health and communicable disease control, the bill is being developed to allow action in relation to a wide range of current and emerging public health risks.
Safe drinking water is an essential prerequisite for public health. If a community's drinking water supply becomes contaminated by pathogenic organisms, a large number of people can be infected quickly and this can lead to the spread of infectious diseases in pandemic proportions. Chemical contamination of drinking water also has to be guarded against. Although direct health risks are lower than for contamination by pathogens, public concern about chemical contamination is often high.
The Ministry of Health tells the public about the safety of both public and privately-owned community drinking water supplies by way of a grading system. Grades given for water source and water treatment range from A1 (completely satisfactory) to E (completely unsatisfactory). Gradings are determined by the extent to which the supply complies with drinking water standards and whether adequate barriers to contamination are in place to minimise risk to the quality of the water. The water supply distribution system (pipes, reservoirs, etc) is graded similarly.
The Register of Community Drinking Water Supplies in New Zealand lists all community drinking water supplies known to the Ministry of Health (defined as supplies which service 25 or more people for 60 or more days a year), together with their public health grading, and whether any chemical contaminants are present at concentrations that could potentially be of public health significance. The 2002 register covers 1,964 community drinking water supplies. The grades awarded vary greatly, with Auckland's drinking water given an A grade, Wellington's between A and C, Christchurch's B and Dunedin's between B and E.
Potential harm from radioactive materials and equipment that generates radiation is controlled by the Christchurch-based National Radiation Laboratory (NRL), a specialist business unit of the Ministry of Health.
The Radiation Protection Act 1965 and the Radiation Protection Regulations 1982 provide controls to protect users of radiation, patients undergoing medical examinations or treatment using radiation, and members of the public, by licensing users and controlling the buying, selling and disposal of radioactive materials and radiation equipment. The legislation is currently under review as it has been overtaken by technology changes, modern radiation protection practices and security requirements (particularly in relation to the control of radioactive material).
The NRL grants licences to use radioactive materials, issues consents for the sale of radioactive materials, records notifications of the sale of irradiating apparatus, develops codes of safe practice, and audits individuals and facilities for compliance with the regulatory framework. The NRL also provides support to front line emergency services, with a 24-hour emergency response capability.
The NRL provides a variety of radiation safety services, including personal dosimetry, calibration of radiation measurement equipment, and specialist advice in both ionising and non-ionising radiation. The NRL operates a number of radionuclide monitoring stations that measure radioactivity in the atmosphere and in rainwater. Some of this work is carried out as part of New Zealand's responsibilities under the Comprehensive Nuclear Test Ban Treaty. The National Radiation Laboratory website is www.nrl.moh.govt.nz
The Medicines Act 1981 and the Medicines Regulations Act 1984 provide controls over therapeutic substances in New Zealand. New medicines and related products require the approval of the Minister of Health before they can be marketed. Consent is given only when satisfactory evidence of the safety, effectiveness and quality of the product has been provided.
A medicine is defined as any substance or article, other than a medical device, which is intended wholly or principally for administration to humans for a therapeutic purpose or as a pregnancy test. Any food, cosmetic or dentifrice (toothpowder or paste) claimed to be effective for a therapeutic purpose is considered a related product. Any material change in a medicine or a related product has to be notified to the director-general of health and the changed product must not be distributed until 90 days have elapsed from notification or until the director-general signifies consent.
Medicines are classified as either ‘prescription medicines’, ‘pharmacist medicines’ (for sale by a pharmacist personally), ‘pharmacy-only medicines’, or considered safe for general sale. The legislation controls the advertising and labelling of medicines, related products and methods of treatment; the standards of manufacture, package and storage of medicines, related products and cosmetics; and the prescribing and dispensing of medicines.
Licences are required for manufacturers and others dealing with medicines. Any refusal of a licence can be appealed to the Medicines Review Committee. The committee may also inquire into an objection to a recommendation that the Minister of Health refuse to consent to the distribution of a new medicine.
The New Zealand and Australian governments are considering establishing a trans-Tasman agency to regulate therapeutic substances. This agency will operate under a treaty between the two countries and new therapeutic products legislation in both countries. The treaty if approved, was expected to commence operating in 2005.
A wide range of drugs capable of being misused, including illegal and prescription drugs, are controlled by the Misuse of Drugs Act 1975 and the Misuse of Drugs Regulations 1977. It is an offence to obtain, manufacture, possess, consume, supply, or offer to supply controlled drugs unless authorised under the act.
Controlled drugs are divided into three classes. Heavier penalties are provided for offences involving Class A drugs, such as heroin and methamphetamine. Classes B and C contain many drugs legitimately used for medical and scientific purposes, such as morphine and pethidine. Cannabis plants, fruit and seeds are included in Class C. Substances manufactured from a cannabis plant are Class B. Illegal dealing in any class of controlled drug is subject to penalties varying from imprisonment to fines.
The rapid emergence of potentially dangerous ‘designer’ drugs necessitated a quicker way to control these drugs. In 2000, parliament amended the Misuse of Drugs Act 1975 to create a more rapid and evidence-based process of classifying drugs. The amendment clarified the basis of drug classification to relate to risk of harm to individuals and society arising from the drug. The risks range from Class A (very high) and Class B (high) to Class C (moderate risk). An expert advisory committee has been established to assess the relative risk of various drugs and to make classification recommendations to the Minister of Health.
In response to a rapid increase in the use of methamphetamine, the government reclassified it as a Class A drug. The reclassification focuses on controlling the supply of methamphetamine by giving police more effective tools to deal with suppliers, manufacturers and importers of methamphetamine. The government also announced a methamphetamine action plan designed to build resilience in at-risk communities, improve treatment options and develop community action programmes to deal with methamphetamine-related issues.
The National Drug Policy (NDP) is a comprehensive strategy to minimise all legal and illegal drug-related harm. The NDP is a cohesive policy framework, coordinating initiatives of relevant government agencies under a three-pronged approach, including:
Supply control (limiting the availability of drugs through, for instance, law enforcement).
Demand reduction (reducing the desire to use drugs through, for example, education programmes).
Problem limitation (mitigating the harm already occurring from drugs through treatment services).
The NDP, led by the Ministry of Health, provides a basis for priority setting, inter sectoral decision making and strategic alignment. The NDP is currently under review and a new National Drug Policy was planned to be completed in late 2004. To further assist in deterring drug abuse, the Ministry of Health, the New Zealand Customs Service and the New Zealand Police have maintained the National Drug Intelligence Bureau since 1972. The National Drug Policy website is www.ndp.govt.nz
Alcohol is a feature of New Zealand life. For many it is a symbol of hospitality, and is used on occasions to celebrate important events in people's lives. When alcohol is misused, however, the resulting harm can be considerable. Alcohol abuse can lead to physical and mental health problems, injury and death on the roads, drownings, violence, fetal abnormalities, absenteeism and impaired work performance.
Figure 8.01 shows alcohol consumed in New Zealand.
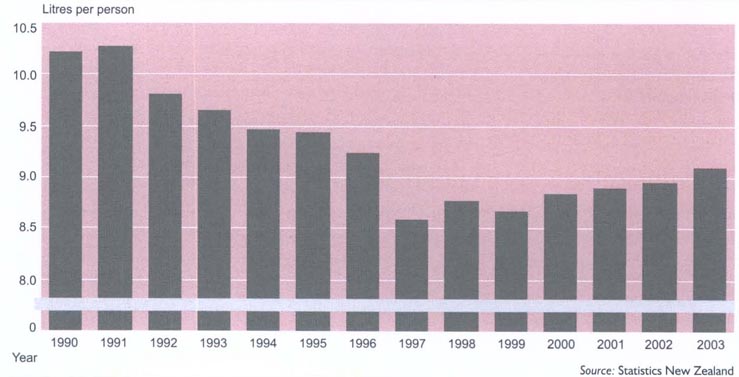
Land Transport Safety Authority figures indicate that in 2002 alcohol was a contributing factor in about 26 percent of fatal road accidents and 13 percent of injury accidents. In annual terms, the social costs of alcohol misuse in New Zealand have been estimated at between $1.5 billion and $2.4 billion.
The Alcohol Advisory Council of New Zealand (ALAC) promotes moderation in the use of alcohol and develops and promotes strategies aimed at reducing alcohol-related problems.
Alcohol and other drug issues are one of the priority areas for action identified in the New Zealand Health Strategy. Following on from this, the National Alcohol Strategy released in 2001 contains a comprehensive range of initiatives that span demand reduction, supply control and problem limitation measures.
Smoking is the greatest single preventable cause of premature death in New Zealand. Each year about 4,700 New Zealanders die from cancers, cardiovascular disease, chronic obstructive pulmonary disease and other diseases caused by their smoking. There is also increasing evidence of harm to adults and children from exposure to second-hand smoke in homes, workplaces and enclosed public places. Smokers who die from tobacco-related causes lose, on average, 14 years of life compared with non-smokers.
From 1999 to 2002, tobacco smoking decreased slightly, from 25.5 percent to 24.5 percent of the population aged 15 and over. This was lower than the 1990 smoking level of 28 percent and maintained a trend of decreasing smoking since 1983. Increases in the prevalence of smoking by secondary school students in the 1990s have been reversed, with a downward trend apparent between 1999 and 2002 for both males and females.
There is a continuing high prevalence of smoking among adult Māori, with 49 percent of the adult population in 2002 smokers. Forty-two percent of female Māori fourth form students reported being at least weekly smokers. Figure 8.02 shows tobacco consumption per person in New Zealand.
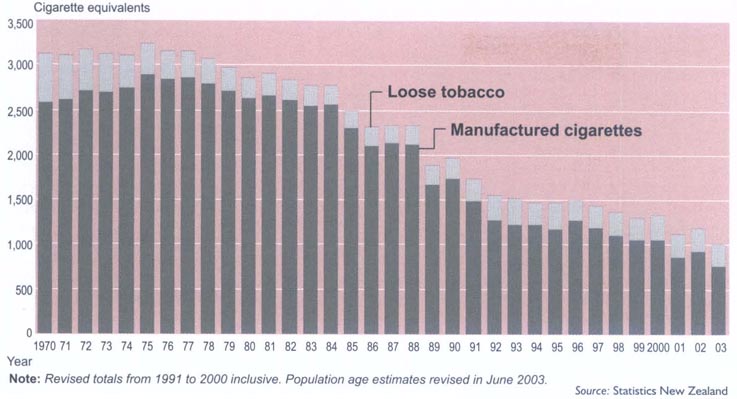
The successes of New Zealand's tobacco programme have been achieved through a mix of tobacco legislation, taxation, health promotion and cessation support.
Legislation introduced in 2004 strengthening the Smoke-free Environments Act 1990 is expected to create new momentum for a reduction in smoking. The amendments reduced exposure to environmental tobacco smoke by creating smoke-free workplaces, including bars, restaurants and cafes. They also restricted further access by minors to tobacco products and placed restrictions on the display of tobacco products at point of sale.
Medical practitioners are required under the Health Act 1956 to notify their medical officer of health of cases of notifiable diseases they suspect or diagnose. Notification data is recorded on a computerised database in each public health service and is used to guide local control measures. The data is, in turn, collated and analysed at national level by the Institute of Environmental Science and Research (ESR) on behalf of the Ministry of Health. The Ministry of Health monitors the prevalence of communicable diseases, manages the national coordination of responses to disease outbreaks, and is responsible for the national immunisation schedule and the control of communicable diseases through designated officers. The ministry is also responsible for policy development, promulgation of regulations and the fulfilment of international disease reporting requirements.
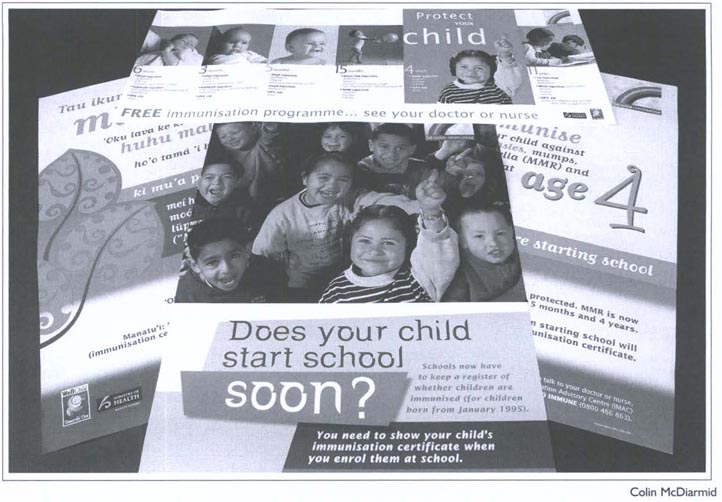
Outreach immunisation services began in 2003 to improve immunisation rates among groups with high rates of vaccine-preventable diseases.
Immunisation. A National Immunisation Register (NIR), health promotion resource development and ongoing education for providers of vaccination services were key features of the National Immunisation Programme in 2003. The NIR is a computerised information system to help health care providers keep a record of a child's immunisation status. It will enable authorised health professionals to quickly and easily determine immunisation status and will help to ensure children receive immunisations at the right time. The NIR will enable information sharing between health care providers to assist with follow-up of those individuals whose immunisations are significantly overdue.
The NIR is a key tool in implementation of the meningococcal vaccination programme, rolled out during 2004.
Outreach immunisation services were developed in 16 district health boards during 2003. These are designed to improve immunisation rates among Māori, Pacific peoples and other groups with high rates of vaccine-preventable diseases and low rates of immunisation. In addition to ongoing support from local immunisation coordinators or facilitators, a short-term mentoring and support role has also been established.
The New Zealand Food Safety Authority (NZFSA), established on 1 July 2002, is the New Zealand controlling authority for imports and exports of food and food-related products.
It also administers legislation covering food for sale on the domestic market; the primary processing of animal products and official assurances related to their export; the export of plant products; and controls surrounding registration and use of agricultural compounds and veterinary medicines.
Under the Food Act 1981, the NZFSA is responsible for development of food safety standards and for implementing food standards and regulations. The Food Act and amendments require food for sale not to be labelled or advertised in a misleading manner. It provides for composition and labelling, and for safe food processing and handling.
Enforcement of food legislation and investigation of food complaints and food-borne illnesses are undertaken by health protection officers, Food Act officers and medical officers of health.
The New Zealand food industry is working towards managing food safety risks by the Hazard Analysis Critical Control Point (HACCP) system.
From 1 July 1997, food businesses have been able to apply to either the NZFSA or the relevant territorial local authority for an exemption from food hygiene regulations. For an exemption to be granted, the business must have an effective, independently-audited, HACCP-based food safety programme that fulfils specific requirements set out in the act. The food industry and the NZFSA have been working closely together in this transition process, which is underpinned by the development of guidance documents in the form of codes of practice.
The Food Hygiene Regulations 1974 apply to a food business until an exemption is granted to that business. The regulations contain minimum requirements for construction, and provisions for the maintenance of food premises and the conduct of workers. Environmental health officers of local territorial authorities carry out inspections to check compliance. Public health unit health protection officers and medical officers of health provide specialist advice to local authorities on these matters.
The joint Australia New Zealand Food Standards Code covers labelling (including ingredient listing, date marking, nutritional panels, warning statements and claims about nutrition) and the composition of food (including ingredients, food additives, vitamins and minerals or other substances that may be used, in food, contaminants and microbiological standards). The code took full legal effect on 20 December 2002. Its provisions are available in full on the website www.foodstandards.govt.nz
Dietary supplements are regulated as foods under the Dietary Supplements Regulations 1985. The regulations define dietary supplements, state maximum daily doses for some nutrients, list food additive permissions and labelling requirements. As with other foods, it is the manufacturers/importer's responsibility to ensure their products are safe and comply with legal requirements. Dietary supplements may not be sold for therapeutic purposes. While most dietary supplements are sold as capsules, pills or in powder form, some are sold in food form. The Dietary Supplements Regulations 1985 are likely to be replaced by future joint Australia New Zealand healthcare and therapeutic products legislation.
The New Zealand Food Safety Authority's website is www.nzfsa.govt.nz
Cancer is a major health issue for New Zealanders. About 16,000 people develop cancer each year, excluding skin cancer, and about 7,500 die from the disease. One in three New Zealanders will have some experience of cancer, either personally or through a relative or friend.
Reducing the incidence and impact of cancer is one of 13 population health objectives in the New Zealand Health Strategy, launched in December 2000.
Cancer control is an organised approach to reducing the community burden of cancer through prevention, screening and early detection, treatment, support and rehabilitation, and palliative care.
The strategy encompasses the following goals:
Reduce the incidence of cancer through primary prevention.
Ensure effective screening and early detection to reduce incidence and mortality.
Ensure effective diagnosis and treatment to reduce morbidity and mortality.
Improve the quality of life for those with cancer, their family and whānau through support, rehabilitation and palliative care.
Improve the delivery of services across the continuum of cancer control through effective planning, coordination and integration of resources and activity, monitoring and evaluation.
Improve the effectiveness of cancer control in New Zealand through research and surveillance.
A cancer control task force has been established to develop the implementation plan for the strategy. The plan will identify the priorities, including what can be done in the short term and what needs to be phased in over a longer period. An implementation workshop providing input into the plan was held in late 2003.
Reports relating to the strategy's development are available on the website www.moh.govt.nz/ cancer control.
The New Zealand Cancer Control Trust's website is www.cancercontrol.org.nz
The majority of older people are fit and well and live independent lives. However, with advancing age, older people become increasingly high users of health and disability support services such as home support, residential care and provision of equipment.
In the 2002/03 financial year, Vote: Health expenditure was $7,744 million (inc GST) and about 39 percent of that was spent on the 11.9 percent of the population aged 65 and over. Expenditure increases exponentially with age. It was estimated that in the 2002/03 financial year, health expenditure was $1,014 for each person aged 15-64, $3,925 for each person aged 65-74, $7,430 for those aged 74-85 and $14,657 for those aged 85 and over.
The Health of Older People Strategy released in 2002 provides a framework for future service development for older people. Key directions in the strategy are an integrated approach to service planning and provision, and a greater emphasis on community-based services to support older people to ‘age in place’ (remain at home with a good quality of life).
An estimated 31,000 people (7 percent) aged 65 and over were in residential care in 2004. People are now entering residential care later and with a higher level of dependency than in the past. Proposed legislative changes to the income and asset-testing regime governing an individual's contribution to the cost of long-term residential care were under consideration by the government in 2004.
Initiatives developed to enable people to remain at home are being evaluated in Hamilton, Hutt Valley and Christchurch. Results of the evaluation will provide district health boards (DHBs) with information about key components of successful community programmes for older people.
In October 2003, funding for disability support services for older people was devolved from the Ministry of Health to DHBs. This has enabled DHBs to plan, fund and deliver a wide range of health and disability support services for older people.
Voluntary welfare organisations make valuable contributions to aspects of public health. Vote: Health, through a variety of contracts and other agreements, funds a wide range of independent service providers and related organisations, including, among others, the Royal New Zealand Plunket Society, the New Zealand Family Planning Association and the New Zealand AIDS Foundation.
The Ministry of Health has responsibility for leading implementation of the National Mental Health Strategy and the Mental Health Commission's Blueprint for Mental Health Services in New Zealand (1998). The national strategy is set in statute (the Mental Health Commission Act 1998) and since its development has resulted in a nominal increase of 174 per cent in public sector funding for mental health services.
The national strategy is based on the development of community-based services and the provision of specialist services for the 3 percent of the population most severely affected by mental illness. Mental Health Commission funding is targeted at this group.
Growth in funding has been accompanied by a significant growth in services, 69 percent of which are community based and 31 percent inpatient. Non-government organisations receive 28 percent of the funding for community-based services.
New Zealand's 21 district health boards have responsibility for the provision of mental health services, as both flinders and providers.
Te Puāwaitanga (2002) is the Māori mental health national strategic framework developed to assist the mental health sector and district health boards to recognise the importance of cultural identity as an essential component of mental health care, and to develop and provide services that meet the needs of Māori.
Building on Strengths (2002) outlines a national approach to the provision of education and guidance on mental health promotion, along with planned priority actions for promotional activities. The Like Minds, Like Mine initiative focuses on destigmatising mental illness and on improving the social environment for people with serious mental illness.
In 2004, the National Mental Health Strategy was under revision, with a draft plan to follow Moving Forward (1997) being developed. The new plan proposed to update and modernise the strategic framework, taking into account major policy, structural and best practice developments. The new plan was expected to be available for public consultation late in 2004 and was expected to cover the spectrum of interventions from promotion and prevention to primary care and specialist services.
Suicidal behaviour is a significant and preventable public health issue in New Zealand. It is a major cause of death and injury, and a significant contributor to social and health costs. In 2000, there were 458 deaths by suicide and in the 2000/01 financial year there were 6,117 hospitalisations for suicide attempts.
In the 1990s, New Zealand youth suicide rates were among the highest of member nations of the Organisation for Economic Co-operation and Development, and the New Zealand Youth Suicide Prevention Strategy was launched in 1998 to address the problem. Led by the Ministry of Youth Development, the strategy consists of two components - Kia Piki te Ora o te Taitamariki, which specifically addresses Māori youth suicide, and In Our Hands, which outlines steps to reduce suicidal behaviour among all youth. Together, they take a broad-based approach to suicide prevention, from community development and mental health promotion to early identification of risk factors and treatment, support after a suicide, restricting access to means of suicide, encouraging safe media reporting, and information and research.
In recognition of the need to provide a comprehensive framework for preventing suicide across all age groups, not just youth, work has begun on developing an All-age Suicide Prevention Strategy. The work is being led by the Ministry of Health and the Ministry of Youth Development, and will build upon gains made and lessons learnt from the New Zealand Youth Suicide Prevention Strategy.
The Ministry of Health is responsible for disability support services policies and planning, and directly funds disability support services for people with long-term disabilities (mostly people under 65 years). District health boards provide health and support services for older people with disabilities.
To access disability support services, a person must be assessed as having either a physical, intellectual, sensory, psychiatric or age-related disability, or a combination of these, where the disability is likely to continue for a minimum of six months and result in a reduction of independent function to the extent that ongoing support is required.
Disability support services aim to promote and maximise the independence of people with disabilities, provide rehabilitation, and support opportunities for people to participate as fully as possible in their families, communities and societies.
Disability support services include:
Home-based support services - eg personal care, home help.
Carer support services - eg respite care, caregiver and family support programmes.
Environmental support services - eg equipment, communication/hearing aids, grants for vehicle purchase and modifications, housing modifications, subsidised items such as breast prostheses.
Day and vocational services.
Residential care for people with long-term disabilities (mostly people under 65 years).
Habilitation and rehabilitation - eg deafness/blindness services.
Support services are provided through a variety of voluntary organisations, private businesses such as rest homes, and district health boards, with most services community based.
While the ministry is a significant government funder of disability support services, other funding agencies include district health boards, the Ministry of Education, the Accident Compensation Corporation and Work and Income. Although support services are funded largely from tax revenue, consumers may be required to pay part charges for some services.
Disability support services expenditure was approximately $1.416 million in 2002/03, compared with $1.315 million in the 2001/02 financial year. During 2002/03, approximately 56 percent of expenditure on disability support services was spent on residential care for older people and for people with intellectual, physical or sensory disabilities. The other key areas of expenditure were assessment, treatment and rehabilitation (12 percent); home-based support (11 percent); environmental support services (5.4 percent); carer support (4 percent); and respite care (1 percent).
The health of families in New Zealand is promoted cooperatively by the Ministry of Health, district health boards, government departments, voluntary agencies, hospital and health services and health professionals.
Like other countries, New Zealand seeks to maintain sexual and reproductive health and to minimise harm and unwanted pregnancies by delivering health promotion and protection programmes. Programmes vary from communicable disease prevention to working with the education sector to encourage healthy choices by youth. Unwanted pregnancies and unacceptably high rates of sexually transmitted infections among young people remain a constant concern. In 2004, the Ministry of Health launched a national public health campaign aimed at reducing the rates of HIV/AIDS and other sexually-transmitted infections.
Several national health indicators have improved for Māori in recent years, including increases in life expectancy and significant decreases in rates of sudden infant death syndrome, cervical cancer and rheumatic fever.
However, Māori still face poor health outcomes and on average die eight to nine years earlier than non-Māori.
While access to health services plays a role, the health of individuals is generally determined by socio-economic statuses such as employment, housing and education. Behavioural and biological risks are also believed to play a part, and these risks are inequitably distributed across socio-economic and ethnic groups.
The task of improving Māori health means not only addressing issues of access to effective health services, but also tackling underlying social and economic conditions that impact on health.
The government and the Ministry of Health have encouraged Māori to participate in providing their own health services, and there are now about 220 providers helping to make services more accessible and culturally appropriate for Māori.
Eight priority areas have been identified for Māori health - immunisation, hearing, smoking cessation, diabetes, asthma, oral health, mental health and injury prevention. Cardiovascular disease and sexual health are also priorities.
The Māori Health Strategy He Korowai Oranga introduced during 2002 has four pathways to improving Māori health:
Whanau, hapū, iwi and Māori community development.
Māori participation throughout the health and disability sector.
Effective health and disability services delivered to Māori.
Intersectoral action to reduce inequalities and tackle the wider determinants of health.
The Ministry of Health provides policy advice on a range of issues of particular relevance to women. These include contraception, sexual and reproductive health, infertility, pregnancy and childbirth services, abortions, breast cancer and cervical screening.
Women's health services are provided by district health boards, health professionals and a large number of community and consumer groups.
Cervical cancer screening. International evidence suggests that morbidity and mortality from invasive cervical cancer can be reduced with an organised screening programme aimed at detecting and treating pre-cancerous changes to the cervix. New Zealand's National Cervical Screening Programme was established in 1990 and is targeted at women aged 20-69.
Breast cancer screening. Established in 1998, the Breast Screen Aotearoa (BSA) programme provides two-yearly mammographic screening to asymptomatic women aged 45-70, along with assessment and treatment services. Breast cancer is the leading cause of cancer deaths in New Zealand women. As at December 2002, the programme had detected cancer in 2,338 women.
The Ministry of Health-developed Child Health Strategy provides direction to the health and disability sector on overall improvement in child health and disability outcomes. The strategy recognises that improving child health and disability outcomes requires a comprehensive approach involving:
Greater focus on health promotion.
Disease prevention and early intervention.
Better coordination of resources.
Development of a national Child Health Information Strategy.
Child health workforce development.
Improved child health research and evaluation.
Leadership in child health.
The strategy emphasises the need to reduce inequalities in health and disability outcomes by focusing on Māori children, Pacific children, children whose families experience multiple social and economic disadvantages, and children with high health and disability support needs. District health boards and the Ministry of Health purchase a comprehensive range of health services, including high quality secondary and tertiary paediatric services, primary care and well-child services that focus on disease prevention and health promotion.
Services set out in the Well Child Tamariki Ora national schedule include newborn screening; developmental, vision and hearing screening for children aged 0-4; and immunisation. Well-child services for this age group are provided by a range of providers including hospitals, Plunket and Māori and Pacific providers. The schedule recommends examination by family doctors at about six weeks of age and whenever there is anxiety over acute or chronic illness or development.
Infant mortality was 6.3 deaths per 1,000 live births in 2000, continuing the reduction that began in the early 1990s following release of the New Zealand Cot Death Study. Figure 8.03 shows the downward trend in infant mortality rates.
A Youth Health Action Plan was published in 2002, following extensive consultation with health, social service and educational professions, and with young people. The plan identifies the need to improve young people's mental and physical health, with special reference to Māori and Pacific youth and those with disabilities and chronic illness. Participation by young people in the development of policy, programmes and the running of health services was emphasised.
Immunisation. Two important milestones in the provision of immunisation services in New Zealand occurred in 2002 and in 2004. These were the development and implementation of the National Immunisation Register (NIR) and the meningococcal vaccine programme. The NIR began its roll out in South Auckland following three years of development. Based on a New Zealand-developed well-child information system, NIR provides accurate coverage, support and recall data, and provides access to a child's information by authorised health immunisation professionals. The NIR was rolled out ahead of the meningococcal vaccine programme, which began in South Auckland in June 2004. The programme follows many years of planning and the development of a specific vaccine for the strain of meningococcal infection epidemic in New Zealand for more than 10 years. The burden of this epidemic has been disproportionately borne by Māori and Pacific peoples infants. Table 8.02 shows the recommended immunisation schedule by age, and the diseases immunised against.
New Zealand's dental health services combine a school dental service for children, dental benefits for adolescents and private practice services for adults. Major hospitals also provide dental services for in-patient and other special groups.
School dental service. The school dental service works to maintain a high standard of dental health for preschool and school children, starting at the age of two and-a-half and continuing to the highest class at primary or intermediate school. Dental therapists, after completing either a two or three-year training course, provide children with routine dental care. Care involves examination, disease prevention measures, fillings in deciduous (first) and permanent teeth, extraction of teeth and dental health education. Some children are referred to dentists for care beyond the scope of dental therapists. The cost of such care is usually met as a special dental benefit. Orthodontic treatment and some other specialist services can only be obtained privately. For children leaving the care of the school dental service at the end of their primary schooling in 2002, the average number of teeth with fillings was 1.6, and 44 percent of children had no fillings in their permanent teeth.
Dental services for teenagers. Young people receive dental benefits up to the age of 18.
Dental research. Dental research is undertaken by the School of Dentistry at the University of Otago. Health Research Council-funded dental research is undertaken by a number of investigators.
Fluoridation. Sixty-two percent of New Zealanders on reticulated water supplies in 2002 lived in areas with fluoridated water. As a result of the widespread availability of fluoride from sources other than fluoridated water (principally toothpaste), the difference in dental decay rates in communities with fluoridation and non-fluoridated water supplies has decreased. The benefit of fluoridation in preventing dental decay is greatest for those in low socio-economic groups, for Māori and for children.
About 190,000 people received publicly-funded surgery in the year ending 30 June 2001 and, on average, 19,700 people a day received full or partial age-related subsidies for rest homes or continuing care hospitals. The Ministry of Health also funded 4,080 beds in community homes for people with intellectual, physical, neurological or sensory disabilities.
Outpatients and accident and emergency (A&E) attendances have not been accurately and consistently recorded over time. However, available evidence suggests that these attendances have risen steadily in recent years. In 1999/2000, there were approximately 740,000 publicly-funded A&E events, representing a rate of 192 events per 1,000 people. People under the age of 25 are most likely to use A&E services, while those aged 45-64 have the lowest rate of use.
In 1999/2000, medical and surgical specialties saw more than 1 million outpatients each, representing rates of 262 and 273 per 1,000 people respectively. The elderly use medical and surgical outpatient services at a much higher rate than those aged under 65. People aged 65 and over, comprising about 12 percent of the New Zealand population, accounted for approximately 24.9 percent of the total number of medical/surgical outpatient treatments and 24.7 percent of the total cost for the corresponding services.
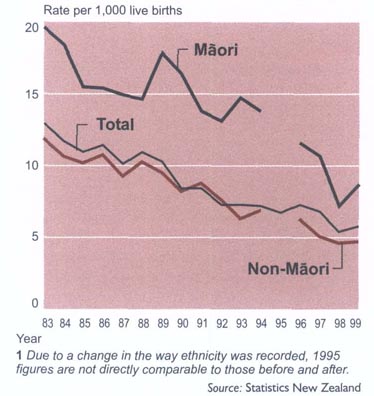
Table 8.02. Recommended immunisation schedule from 2002
| Age | Vaccine |
|---|---|
1Diphtheria, tetanus, whooping cough (acellular pertussis), and inactivated poliovirus vaccine. 2Haemophilus influenzae type b and hepatitis B vaccine. 3Diphtheria, tetanus, acellular pertussis and Haemophilus influenzae type b vaccine. 4Measles, mumps, rubella vaccine. 5Adult-type tetanus-diphtheria vaccine. In addition, hepatitis B vaccine and hepatitis B immunoglobulin is given at birth to babies of a mother who is a carrier of hepatitis B, and BCG is offered to babies who will be living in households where there are recent immigrants from high risk countries or persons with current or past history of tuberculosis. Rubella vaccine or MMR is available for susceptible women. Source: Ministry of Health | |
| 6 weeks | DTaP-IPV1, Hib-Hepatitis B2 |
| 3 months | DTaP-IPV, Hib-Hepatitis B, |
| 5 months | DTaP-IPV, Hepatitis B, |
| 15 months | DTaP/Hib3, MMR4 |
| 4 years | DTaP-IPV, MMR |
| 11 years | Td5 |
| 45 years | Td |
| 65 years | Td, annual influenza vaccine |
Table 8.03. Clients seen by mental health teams Year ending 31 December 2001
| Team type | Clients seen | Bed nights | Average bed nights |
|---|---|---|---|
| Source: Ministry of Health | |||
| Community | 47,800 | 6,738 | 0.1 |
| Alcohol and drug | 17,104 | 17,918 | 1.0 |
| Child, adolescent and family | 14,148 | 1,451 | 0.1 |
| Inpatient | 8,375 | 285,108 | 34.0 |
| Psychogeriatric | 3,988 | 25,257 | 6.3 |
| Kaupapa Māori | 3,639 | 1,638 | 0.5 |
| Forensic | 3,405 | 49,129 | 14.4 |
| Residential | 653 | 81,504 | 124.8 |
| Other | 11,963 | 19,202 | 1.6 |
| Total | 111,075 | 487,945 | 4.4 |
There were 445 hospitals in New Zealand in 2002. Eighty-five of these were publicly funded and 360 were privately owned. The number of hospital beds available in 2002 was 23,825, 12,484 in public hospitals and 11,341 in private hospitals providing high-level care. In 1998, hospital beds totalled 30,282, 14,298 in public hospitals and 15,984 in private hospitals. Most public hospitals provide acute and elective care for patients in their district. A few public hospitals provide tertiary services on a regional or national basis. The majority of privately-owned hospitals provide continuing care accommodation for older people. A number of these hospitals also provide separate rest home accommodation for older residents.
Length of stay in public hospitals. People are spending less time in hospital for medical and surgical treatment than previously. The average length of stay in hospitals fell by 50 percent in the decade to 2000/01, from 6.6 days 3.3 days. The reasons for the shorter stays are advances in medical technology, such as new medical treatments and more effective drugs, improved community and follow-up care, and more effective hospital administration.
Mental health consultation. Specialist teams provide mental health services in the community, backed up where necessary by inpatient care. Table 8.03 shows numbers seen by the various mental health teams, while Table 8.04 shows the number of people seen by district health board mental health services.
Table 8.04. Clients seen by district health board mental health (including alcohol and drug) services By age group Year ending 30 June 2002
| Age group | 0-9 | 10-19 | 20-29 | 30-39 | 40-49 | 50-59 | 60-69 | 70-79 | 80 and over | Total |
|---|---|---|---|---|---|---|---|---|---|---|
Note:Excludes data from non-government organisations. Source: Ministry of Health | ||||||||||
| Male | 2,994 | 8,477 | 8,244 | 9,926 | 7,375 | 3,558 | 1,720 | 1,216 | 902 | 44,412 |
| Female | 1,265 | 6,712 | 7,245 | 9,866 | 7,336 | 4,130 | 2,183 | 1,797 | 1,891 | 42,425 |
| Total | 4,259 | 15,189 | 15,489 | 19,792 | 14,711 | 7,688 | 3,903 | 3,013 | 2,793 | 86,837 |
| Totals in 2001... | 3,125 | 12,525 | 13,175 | 16,966 | 12,598 | 6,783 | 3,396 | 2,656 | 2,275 | 73,499 |
Malignant neoplasms (cancer), ischaemic heart disease and cerebrovascular disease were the leading causes of death in New Zealand in 1999 collectively accounting for 60.9 percent of all deaths (cancer 28.5 percent, ischaemic heart disease 22.4 percent and cerebrovascular disease 10 percent). Table 8.05 lists the major causes of death in New Zealand from 1997 to 1999.
Table 8.05. Major causes of death 1997-99
| Cause of death | Number of deaths | Crude rate per million of mean population | ||||
|---|---|---|---|---|---|---|
| 1997 | 1998 | 1999 | 1997 | 1998 | 1999 | |
| Source: New Zealand Health Information Service | ||||||
| Malignant neoplasms | 7,282 | 7,582 | 7,674 | 2,013 | 2,095 | 2,013 |
| Diabetes mellitus | 633 | 730 | 740 | 175 | 202 | 194 |
| Chronic rheumatic heart disease | 135 | 138 | 148 | 37 | 38 | 39 |
| Hypertensive disease | 262 | 283 | 232 | 72 | 78 | 61 |
| Ischaemic heart disease | 6,369 | 6,203 | 6,571 | 1,760 | 1,714 | 1,723 |
| Other forms of heart disease | 1,283 | 1,141 | 1,256 | 355 | 315 | 329 |
| Cerebrovascular disease | 2,566 | 2,492 | 2,835 | 709 | 689 | 744 |
| Diseases of arteries, arterioles and capillaries | 652 | 535 | 600 | 180 | 148 | 157 |
| Pneumonia | 972 | 415 | 623 | 269 | 115 | 163 |
| Bronchitis, emphysema and asthma | 415 | 507 | 670 | 115 | 140 | 176 |
| Other diseases of respiratory system | 1,522 | 1,226 | 1,437 | 421 | 339 | 377 |
| Peptic ulcer | 126 | 108 | 96 | 35 | 30 | 25 |
| Cirrhosis of liver | 126 | 111 | 143 | 35 | 31 | 38 |
| Congenital anomalies | 191 | 189 | 176 | 53 | 52 | 46 |
| Conditions of perinatal mortality | 134 | 109 | 120 | 37 | 30 | 31 |
| Motor vehicle accidents | 550 | 529 | 533 | 152 | 146 | 140 |
| Other injury and poisoning | 672 | 566 | 649 | 186 | 156 | 170 |
| Suicide and self-inflicted injury | 561 | 577 | 513 | 155 | 159 | 135 |
| All other diseases | 3,161 | 3,016 | 3,208 | 874 | 834 | 841 |
| Total | 27,612 | 26,457 | 28,224 | 7,631 | 7,312 | 7,402 |
Cancer. Cancer was the cause of 28.7 percent of all deaths in New Zealand in 2000. The lungs were the major site of male cancer deaths, accounting for 20.9 percent of deaths. Other common sites for males were the large bowel and prostate. The main cause of female cancer deaths was breast cancer, which caused 17.8 percent of female cancer mortality, followed by cancer of the large bowel. In 2000, 95.1 percent of cancer deaths occurred at age 45 and over, with 70.9 percent of deaths occurring at 65 years and over, as shown in Table 8.06.
Table 8.06. Deaths from malignant cancer 2000
| Age group | Males | Females | ||||
|---|---|---|---|---|---|---|
| Number | Rate per 100,000 of population at ages given | Percentage of total deaths at ages given | Number | Rate per 100,000 of population at ages given | Percentage of total deaths at ages given | |
| Source: New Zealand Health Information Service | ||||||
| Under 5 | 9 | 6.1 | 0.2 | 3 | 2.2 | 0.1 |
| 5-14 | 13 | 4.3 | 0.3 | 11 | 3.8 | 0.3 |
| 15-24 | 17 | 6.3 | 0.4 | 15 | 5.8 | 0.4 |
| 25-44 | 115 | 20.6 | 2.8 | 187 | 31.7 | 5.3 |
| 45-64 | 933 | 226.5 | 22.6 | 913 | 219.2 | 26.1 |
| 65 and over | 3,033 | 1,537.9 | 73.6 | 2,371 | 934.1 | 67.7 |
| Total | 4,120 | 218.2 | 100.0 | 3,500 | 180.0 | 100.0 |
| Totals in 1999 | 4,063 | 216.3 | 100.0 | 3,611 | 186.6 | 100.0 |
Perinatal deaths. The term perinatal deaths covers fetal deaths of 20 or more weeks gestation or 400 grams birthweight, and infant deaths within 168 hours of birth (early neonatal deaths).
Late neonatal death. A late neonatal death occurs when a liveborn infant dies after seven days and before 28 completed days after birth.
Post neonatal death. A post neonatal death is when a liveborn infant dies after 28 completed days and before the first year of life is completed.
Infant death. An infant death is the death of a live-born infant before the first year of life is completed.
Table 8.07 shows fetal and infant mortality rates in New Zealand in 2000 by ethnicity. Table 8.08 compares infant mortality rates in selected Organisation for Economic Co-operation and Development countries in 1988, 1998 and 1999.
Table 8.07. Fetal and infant mortality rates1 By ethnicity Year ending 31 December 2000
| Category of death | Māori | Pacific peoples | Other | Total | ||||
|---|---|---|---|---|---|---|---|---|
| Number | Rate | Number | Rate | Number | Rate | Number | Rate | |
1Rate per 1,000 live or total births. Source: New Zealand Health Information Service | ||||||||
| Total fetal | 92 | 5.8 | 41 | 6.6 | 236 | 6.7 | 369 | 6.4 |
| Early neonatal | 48 | 3.0 | 32 | 5.2 | 95 | 2.7 | 175 | 3.1 |
| Late neonatal | 12 | 0.8 | 9 | 1.5 | 20 | 0.6 | 41 | 0.7 |
| Post neonatal | 75 | 4.7 | 22 | 3.6 | 46 | 1.3 | 143 | 2.5 |
| Total infant | 135 | 8.5 | 63 | 10.2 | 161 | 4.6 | 359 | 6.3 |
Abortion. Abortion is permitted by New Zealand law in certain circumstances. The main conditions required are that continuation of the pregnancy would result in serious danger (not being danger normally associated with childbirth) to the life, or to the physical or mental health of the woman or girl; or that there is a substantial risk that the child, if born, would be so physically or mentally abnormal as to be seriously handicapped. There is no upper limit to when an abortion can be carried out in New Zealand, but the grounds are stricter when the gestation of the pregnancy is more than 20 weeks. Then, an abortion can be done only to save the life of the mother, or to prevent serious, permanent injury to her physical or mental health. The Crimes Act 1961 (as amended) sets out when an abortion would be unlawful. The Contraception, Sterilisation and Abortion Act 1977 sets out the referral procedure where a woman seeks an abortion. It also sets out the requirements when a case is determined. If, after consideration of a case, two specially-appointed consultants both believe the provisions of the law can be met, an authorising certificate is issued. New Zealand's abortion law is kept under review by the three-member Abortion Supervisory Committee, which also licenses institutions for the performance of abortions, appoints certifying consultants to consider cases, and liaises with all those providing facilities, both public and private. Counselling advisers also monitor counselling services for women seeking advice about their pregnancy and keep the committee informed on related issues.
Table 8.08. Infant mortality rates for selected OECD countries1
| Country | 1988 | 1998 | 1999 |
|---|---|---|---|
1Rate per 1,000 live births. Sources: Organisation for Economic Co-operation and Development New Zealand Health Information Service | |||
| Greece | 11.0 | 6.7 | 6.2 |
| New Zealand | 10.9 | 5.4 | 5.8 |
| United Kingdom | 9.0 | 5.7 | 5.8 |
| Australia | 8.7 | 5.0 | 5.7 |
| Portugal | 13.0 | 6.0 | 5.6 |
| Switzerland | 6.8 | 4.8 | 4.6 |
| Germany | 7.5 | 4.7 | 4.5 |
| Austria | 8.1 | 4.9 | 4.4 |
| Japan | 4.8 | 3.6 | 3.4 |
| Iceland | 6.2 | 2.6 | 2.4 |
Table 8.09 shows the number of abortions performed in New Zealand each year from 1997 to 2003, by age group. Table 8.10 compares New Zealand's abortion rate with those of a number of low fertility countries.
Table 8.09. Abortions1 By age group Years ending 31 December
| Age group (in years) | 1997 | 1998 | 1999 | 2000 | 2001 | 2002 | 2003 |
|---|---|---|---|---|---|---|---|
1New Zealand-registered induced abortions. Source: Abortion Supervisory Committee | |||||||
| 11-14 | 56 | 65 | 56 | 74 | 66 | 78 | 89 |
| 15-19 | 2,906 | 2,832 | 2,846 | 3,107 | 3,240 | 3,602 | 3,757 |
| 20-24 | 4,484 | 4,355 | 4,477 | 4,548 | 4,728 | 5,124 | 5,670 |
| 25-29 | 3,378 | 3,381 | 3,447 | 3,399 | 3,450 | 3,450 | 3,619 |
| 30-34 | 2,369 | 2,368 | 2,435 | 2,496 | 2,555 | 2,676 | 2,800 |
| 35-39 | 1,502 | 1,559 | 1,642 | 1,823 | 1,730 | 1,715 | 1,846 |
| 40-44 | 492 | 444 | 560 | 613 | 593 | 686 | 692 |
| 45 and over | 21 | 25 | 38 | 43 | 48 | 49 | 38 |
| Total | 15,208 | 15,029 | 15,501 | 16,103 | 16,410 | 17,380 | 18,511 |
| Expanded age groups (in years) | |||||||
| Under 16 | 215 | 238 | 232 | 262 | 283 | 388 | 368 |
| 16-19 | 2,747 | 2,659 | 2,670 | 2,919 | 3,023 | 3,392 | 3,478 |
Table 8.1. Abortion rates New Zealand and other low fertility countries Latest available year ending 31 December
| Country | Crude Year | General abortion rate1 | abortion rate2 |
|---|---|---|---|
1Per 1,000 estimated mean population. 2Per 1,000 estimated mean number of women aged 15-44. 3Includes abortions performed in hospitals but not counted by Medicare. 4Residents only. 5Includes most clinic abortions and abortions in the United States for Canadian residents. 6Abortion reporting incomplete and rates at least 20 percent higher than those stated. 7Includes abortions for foreign women living in the Netherlands PprovisionalRrevised .. figures not available Source: Abortion Supervisory Committee Statistics New Zealand | |||
| New Zealand | 1990 | 3.3 | 14.0 |
| 1995 | 3.7 | 16.2 | |
| 2000 | 4.2 | 19.0 | |
| 2001 | 4.2R | 19.1 | |
| 2002 | 4.4 | 20.0 | |
| 2003 | 4.6 | 21.0 | |
| Australia3 | 1996 | .. | 22.2 |
| United States | 2000 | .. | 21.3 |
| New Zealand | 2003 | 4.6 | 21.0 |
| Sweden | 2002 | 3.7 | 19.6 |
| England and Wales4 | 2002 | 3.3 | 16.1 |
| Canada5 | 2001 | 3.4 | .. |
| Norway | 2002 | 3.0 | 14.8 |
| Denmark | 2000 | 2.9 | 14.6 |
| Japan6 | 2001 | 2.7 | 13.8 |
| France6 | 1997 | .. | 13.1 |
| Scotland4 | 2002P | 2.3 | 10.9 |
| Finland | 2002 | 2.1 | 10.9 |
| Netherlands7 | 2002 | 1.8 | 8.7 |
| Germany | 2002 | .. | 7.7 |
Road crashes. Motor vehicle crashes involving death or personal injury are required by law to be reported to the Land Transport Safety Authority or to the police. During the year ending 31 December 2002, there were 9,798 reported crashes, resulting in 404 fatalities and injuries to 13,918 individuals. Table 8.11 classifies these crashes by cause.
Table 8.11. Classification of motor vehicle crashes Years ending 31 December
| Classification of crashes | 2001 | 2002 | ||||||
|---|---|---|---|---|---|---|---|---|
| Injuries | Injuries | |||||||
| Fatal | Serious | Minor | Total | Fatal | Serious | Minor | Total | |
| Source: Land Transport Safety Authority | ||||||||
| Overtaking or lane change | 24 | 89 | 351 | 464 | 22 | 100 | 415 | 537 |
| Head on (not overtaking) | 136 | 461 | 954 | 1,551 | 117 | 497 | 1,108 | 1,722 |
| Lost control or ran off road on straight | 42 | 277 | 1,057 | 1,376 | 49 | 270 | 1,069 | 1,388 |
| Lost control or ran off road while cornering | 128 | 565 | 2,104 | 2,797 | 99 | 656 | 2,268 | 3,023 |
| Collision with obstruction | 9 | 83 | 340 | 432 | 8 | 61 | 357 | 426 |
| Rear end | 1 | 80 | 928 | 1,009 | 9 | 86 | 1,220 | 1,315 |
| At intersections or driveways | ||||||||
| Turning versus same direction | 11 | 65 | 512 | 588 | 8 | 88 | 614 | 710 |
| Crossing no turn | 19 | 161 | 817 | 997 | 12 | 125 | 987 | 1,124 |
| Crossing vehicle turning | 8 | 106 | 671 | 785 | 14 | 155 | 827 | 996 |
| Vehicles merging | 1 | 24 | 176 | 201 | 1 | 27 | 183 | 211 |
| Right turn against | 10 | 158 | 784 | 952 | 5 | 133 | 933 | 1,071 |
| Vehicles manoeuvring | 8 | 78 | 439 | 525 | 6 | 78 | 509 | 593 |
| Pedestrian crossing road | 38 | 222 | 621 | 881 | 31 | 241 | 646 | 918 |
| Pedestrian - other | 11 | 38 | 91 | 140 | 10 | 43 | 104 | 157 |
| Miscellaneous | 9 | 28 | 88 | 125 | 13 | 40 | 78 | 131 |
| Total | 455 | 2,435 | 9,933 | 12,823 | 404 | 2,600 | 11,318 | 14,322 |
Figure 8.04 shows the contributing factors, by proportion, for injury accidents on New Zealand roads.
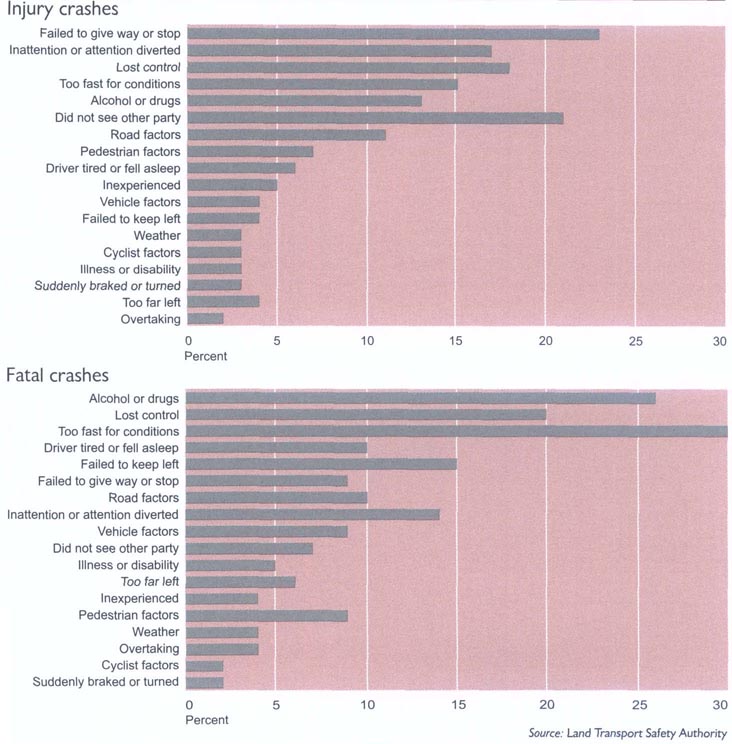
Special road safety initiatives, such as the ‘anywhere - anytime’ speed camera campaign, are designed to help keep the road toll down.
Road safety in New Zealand is administered by the Land Transport Safety Authority, with road laws enforced by the New Zealand Police. Publicity directed towards road safety is carried out through press, radio, television, posters and other forms of advertising. Special road safety campaigns and traffic improvement courses are held from time to time.
Integrating traffic education into school programmes is a major component of the road safety programme. Traffic education units are cooperatively planned and implemented, with police officers, teachers and others in the community working together to plan and implement traffic education interventions based on the special social and traffic needs of the community. The LTSA also funds the Road Sense programme, which provides professional development to 100 schools throughout New Zealand. Road Sense facilitators show teachers how to use road safety as a context to teach the curriculum. A network of 45 people coordinates community organisations working in road safety at the local authority level.
The New Zealand Automobile Association runs a defensive driving course for licensed drivers.
Advice on road safety policy is given to the government by the Transport and Environment Select Committee, by the National Road Safety Committee, and by a number of other bodies, including local road safety committees.
Table 8.12 shows the age groups of people killed or injured in motor crashes in New Zealand for five consecutive years. Table 8.13 shows road crash casualties and rates from 1991 to 2002.
Table 8.12. People killed or injured in motor crashes By age group Years ending 31 December
| Age group (in years) | Killed1 | Injured | ||||||||
|---|---|---|---|---|---|---|---|---|---|---|
| 1998 | 1999 | 2000 | 2001 | 2002 | 1998 | 1999 | 2000 | 2001 | 2002 | |
1Killed immediately or died within 30 days of accident. Source: Land Transport Safety Authority | ||||||||||
| Under 5 | 19 | 9 | 14 | 10 | 8 | 224 | 217 | 221 | 207 | 204 |
| 5-9 | 16 | 8 | 11 | 8 | 8 | 407 | 363 | 387 | 359 | 386 |
| 10-14 | 11 | 15 | 16 | 15 | 15 | 623 | 632 | 573 | 550 | 639 |
| 15-19 | 75 | 72 | 62 | 66 | 54 | 2,290 | 2,113 | 1,860 | 2,218 | 2,506 |
| 20-24 | 66 | 57 | 50 | 52 | 47 | 1,759 | 1,579 | 1,473 | 1,692 | 1,867 |
| 25-29 | 57 | 56 | 44 | 37 | 38 | 1,290 | 1,235 | 1,125 | 1,167 | 1,265 |
| 30-34 | 34 | 35 | 43 | 33 | 37 | 1,099 | 1,041 | 894 | 1,107 | 1,152 |
| 35-39 | 34 | 31 | 32 | 27 | 27 | 892 | 891 | 847 | 890 | 1,082 |
| 40-44 | 34 | 31 | 34 | 31 | 22 | 732 | 720 | 737 | 846 | 947 |
| 45-49 | 21 | 31 | 25 | 21 | 19 | 570 | 583 | 531 | 616 | 719 |
| 50-54 | 15 | 19 | 21 | 35 | 29 | 467 | 517 | 462 | 553 | 619 |
| 55-59 | 17 | 14 | 21 | 16 | 18 | 368 | 347 | 342 | 345 | 471 |
| 60-64 | 18 | 18 | 12 | 16 | 15 | 266 | 300 | 281 | 337 | 396 |
| 65-69 | 15 | 31 | 19 | 14 | 13 | 235 | 235 | 231 | 251 | 306 |
| 70-74 | 17 | 18 | 24 | 18 | 15 | 212 | 242 | 227 | 255 | 261 |
| 75-79 | 19 | 21 | 18 | 15 | 15 | 200 | 215 | 169 | 218 | 226 |
| 80 and over | 19 | 26 | 15 | 23 | 18 | 212 | 216 | 182 | 238 | 253 |
| Age unknown | 14 | 16 | 1 | 18 | 6 | 566 | 553 | 420 | 519 | 619 |
| Total | 501 | 508 | 462 | 455 | 404 | 12,412 | 11,999 | 10,962 | 12,368 | 13,918 |
Table 8.13. Road crash casualties and rates
| Year | Persons killed | Persons killed per 100,000 population | Persons injured | Persons injured per 100,000 population | Total casualties per 100,000 population |
|---|---|---|---|---|---|
| Source: Land Transport Safety Authority | |||||
| 1991 | 650 | 18.8 | 16,767 | 486.0 | 504.8 |
| 1992 | 646 | 18.5 | 16,121 | 462.5 | 481.0 |
| 1993 | 600 | 17.0 | 15,108 | 428.6 | 445.6 |
| 1994 | 580 | 16.2 | 16,600 | 464.1 | 480.3 |
| 1995 | 582 | 16.0 | 16,870 | 463.1 | 479.1 |
| 1996 | 514 | 13.8 | 14,796 | 398.0 | 411.8 |
| 1997 | 539 | 14.4 | 13,375 | 355.6 | 370.0 |
| 1998 | 501 | 13.2 | 12,412 | 327.5 | 340.7 |
| 1999 | 508 | 13.3 | 11,999 | 315.5 | 328.8 |
| 2000 | 462 | 12.1 | 10,962 | 286.2 | 298.3 |
| 2001 | 455 | 11.8 | 12,368 | 321.2 | 333.0 |
| 2002 | 404 | 10.3 | 13,918 | 353.3 | 363.6 |
Table 8.14 gives an international comparison of death rates in motor crashes in 2000 and 2001 for a number of countries including New Zealand.
Table 8.14. International comparison of motor crash death rates1 Years ending 31 December
| 2000 | 2001 | |||||
|---|---|---|---|---|---|---|
| Persons killed | Persons killed per 100,000 population | Persons killed per 10,000 vehicles | Persons killed | Persons killed per 100,000 population | Persons killed per 10,000 vehicles | |
1Data is for countries that contribute data to the International Road Traffic and Accident Database and is the most recent available. .. figures not available Source: Land Transport Safety Authority | ||||||
| United States | 41,821 | 15.2 | 1.9 | 42,116 | 14.8 | 1.9 |
| France | 8,079 | 13.6 | 2.4 | 8,161 | 13.8 | 2.3 |
| New Zealand | 462 | 12.1 | 1.8 | 455 | 11.8 | 1.7 |
| Australia | 1,824 | 9.5 | 1.5 | 1,737 | 9.0 | 1.4 |
| Canada2 | 2,927 | 9.5 | 1.6 | .. | .. | .. |
| Germany | 7,503 | 9.1 | 1.5 | 6,977 | 8.5 | 1.3 |
| Japan | 10,403 | 8.2 | 1.3 | 10,060 | 7.9 | 1.3 |
| Sweden | 591 | 6.7 | 1.2 | 554 | 6.2 | 1.1 |
| Norway3 | .. | .. | .. | 275 | 6.1 | 1.0 |
| United Kingdom | 3,580 | 6.0 | 1.2 | 3,598 | 6.1 | 1.2 |
Figure 8.05 shows that the trend in the past 15 years has been for a reduction in the road toll.
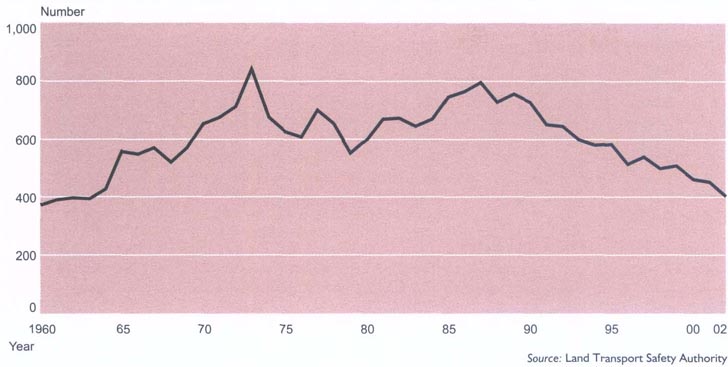
Water accidents. Water Safety New Zealand is responsible for water safety education in New Zealand, ensuring the safe participation of New Zealanders in all types of water activity. Formed in 1949, Water Safety New Zealand represents the interests of 31 aquatic sports and recreational organisations. It is funded by the New Zealand Lottery Grants Board and through sponsorship of specific programmes by organisations such as the Accident Compensation Corporation.
Water Safety New Zealand ensures the water safety needs of the community are met through public education, information and statistics, research, and advice and consultancy. Water Safety New Zealand runs its own programmes and promotions, as well as supporting and funding water safety educational activities by member organisations such as Swimming New Zealand, Surf Life Saving New Zealand, the Coastguard Boating Education Service, the New Zealand Outdoor Instructors' Association and the New Zealand Underwater Association.
Water Safety New Zealand produces teaching manuals, booklets, stickers, posters and certificates. It has a comprehensive video library, including titles on boating safety, safety at the beach, river safety and learning to swim. These free resources are complemented by a water safety video written and performed by school children for school children which is available for purchase.
Water Safety New Zealand's website is www.watersafety.org.nz
Table 8.15 on page 152 shows the number of drownings in New Zealand from 1991 to 2002, categorised by activity.
Table 8.15. Drownings Years ending 31 December
| Activity | 19911 | 19921 | 19931 | 1994 | 1995 | 1996P | 1997P | 1998P | 1999P | 2000P | 2001P | 2002P |
|---|---|---|---|---|---|---|---|---|---|---|---|---|
1Figures for 1991-93 have been confirmed against coroners' reports. Pprovisional - nil or zero Source: Water Safety New Zealand | ||||||||||||
| Recreational | ||||||||||||
| Boating | 15 | 22 | 35 | 14 | 23 | 22 | 18 | 17 | 13 | 24 | 21 | 25 |
| Surf sports | 1 | - | 1 | 1 | 1 | - | - | 4 | 3 | 4 | 5 | 1 |
| Whitewater sports | 1 | 4 | - | 5 | 2 | 1 | - | - | 2 | - | 3 | - |
| Recreational fishing | 11 | 8 | 12 | 11 | 8 | 1 | 13 | 5 | 9 | 6 | 11 | 15 |
| Underwater sports | 9 | 7 | 7 | 11 | 12 | 7 | 10 | 8 | 4 | 11 | 4 | 8 |
| Swimming | 18 | 7 | 12 | 17 | 22 | 19 | 18 | 26 | 19 | 11 | 8 | 15 |
| Other recreational | 2 | 4 | 4 | 8 | 9 | 7 | 6 | 4 | 4 | 3 | 1 | 3 |
| Total recreational | 57 | 52 | 71 | 67 | 77 | 57 | 65 | 64 | 54 | 59 | 53 | 67 |
| Non-recreational | ||||||||||||
| Immersion accidents | 30 | 30 | 25 | 32 | 23 | 35 | 33 | 39 | 32 | 32 | 30 | 37 |
| Road vehicles | 22 | 15 | 18 | 16 | 25 | 15 | 12 | 13 | 12 | 11 | 15 | 10 |
| Other transport | 1 | - | 1 | 2 | - | - | - | 4 | 2 | - | - | - |
| Commercial fishing | 6 | 7 | 10 | 1 | 4 | 18 | - | 12 | 4 | 4 | 3 | 1 |
| Other commercial | 2 | - | 2 | - | 5 | 1 | 1 | 2 | 1 | 4 | - | - |
| Rescuing others | 4 | 5 | 2 | - | 1 | 1 | 2 | 3 | 2 | 4 | 2 | 5 |
| Suicides and homicides | 24 | 20 | 24 | 13 | 20 | 13 | 25 | 14 | 18 | 19 | 17 | 14 |
| Miscellaneous | 1 | 1 | 1 | 1 | 4 | - | - | 1 | - | 2 | - | 1 |
| Total non-recreational | 90 | 78 | 83 | 65 | 82 | 83 | 73 | 88 | 71 | 76 | 67 | 68 |
| Total drownings | 147 | 130 | 154 | 132 | 159 | 140 | 138 | 152 | 125 | 135 | 120 | 135 |
General accident statistics. Accidents, poisoning and violence caused 5.6 percent of deaths from all causes in 1999 (the latest New Zealand Health Information Statistics available), compared with 6.3 percent in 1998. The largest single external cause of death was motor vehicle crashes (533 deaths compared with 529 in 1998), followed by suicide (516 deaths and 577 in 1998). Accidental falls accounted for 269 deaths, compared with 199 in 1998.
Table 8.16 shows the cause, number and rate per million population of deaths from external causes in New Zealand from 1997 to 1999. Table 8.17 classifies 1999 deaths from leading external causes by age and sex, while Table 8.18 lists the place of occurrence of fatal non-transport accidents from 1996 to 1999.
Table 8.16. Deaths from external causes Years ending 31 December
| Cause | 1997 | 1998 | 1999 | |||
|---|---|---|---|---|---|---|
| Number | Crude rate per million population | Number | Crude rate per million population | Number | Crude rate per million population | |
1Includes falls aboard ships and from horseback. 2Includes drowning from water transport. - nil or zero Source: New Zealand Health Information Service | ||||||
| Motor vehicle crashes | 550 | 146.2 | 529 | 139.5 | 533 | 139.8 |
| Other transport accidents1 | 67 | 17.8 | 60 | 15.8 | 65 | 17.0 |
| Suicide and self-inflicted injury | 561 | 149.1 | 577 | 152.1 | 516 | 135.3 |
| Accidental falls | 242 | 64.3 | 199 | 52.5 | 269 | 70.6 |
| Accidental drowning and suffocation2 | 118 | 31.4 | 102 | 26.9 | 107 | 28.1 |
| Homicide | 69 | 18.3 | 57 | 15 | 51 | 13.4 |
| Accidents caused by fire and flames | 33 | 8.8 | 20 | 5.3 | 22 | 5.8 |
| Accidents caused by machinery | 17 | 4.5 | 13 | 3.4 | 12 | 3.1 |
| Accidental poisoning | 27 | 7.2 | 11 | 2.9 | 9 | 2.4 |
| Accidents caused by firearms | - | - | 6 | 1.6 | 1 | 0.3 |
| All other external causes | 99 | 26.3 | 98 | 25.8 | 110 | 28.9 |
| Total deaths from external causes | 1,783 | 473.9 | 1,672 | 440.8 | 1,695 | 444.6 |
Table 8.17. Deaths from external causes By sex and age Year ending 31 December 1999
| Age group (in years) | Motor vehicle accidents | Accidental drowning | Accidental poisoning | Accidental falls | Suicide and self-inflected injury | Homocide | All other injury and poisoning | Total | ||||||||
|---|---|---|---|---|---|---|---|---|---|---|---|---|---|---|---|---|
| M | F | M | F | M | F | M | F | M | F | M | F | M | F | M | F | |
- nil or zero Source: New Zealand Health Information Service | ||||||||||||||||
| 0-14 | 17 | 15 | 12 | 5 | 1 | - | - | 2 | 3 | 3 | 7 | 4 | 24 | 17 | 64 | 46 |
| 15-24 | 92 | 46 | 10 | 3 | 1 | 1 | 8 | - | 83 | 37 | 4 | 2 | 13 | 7 | 211 | 96 |
| 25-34 | 82 | 17 | 12 | - | 2 | - | 8 | - | 106 | 20 | 10 | 4 | 19 | 12 | 239 | 53 |
| 35-44 | 46 | 24 | 9 | 1 | - | - | 6 | 3 | 74 | 35 | 9 | 1 | 33 | 4 | 177 | 68 |
| 45-54 | 38 | 13 | 9 | - | 2 | - | 13 | 1 | 51 | 15 | 3 | - | 20 | 8 | 136 | 37 |
| 55-64 | 19 | 17 | 6 | 1 | 1 | - | 4 | 5 | 32 | 6 | 4 | - | 19 | 8 | 85 | 37 |
| 65-74 | 27 | 26 | 2 | 1 | 1 | - | 16 | 13 | 18 | 9 | 2 | - | 13 | 10 | 79 | 59 |
| 75+ | 28 | 26 | 1 | - | - | - | 56 | 134 | 18 | 6 | - | 1 | 19 | 19 | 122 | 186 |
| Total | 349 | 184 | 61 | 11 | 8 | 1 | 111 | 158 | 385 | 131 | 39 | 12 | 160 | 85 | 1,113 | 582 |
| Totals in 1998 | 358 | 171 | 66 | 8 | 8 | 3 | 100 | 99 | 445 | 132 | 32 | 25 | 172 | 53 | 1,181 | 491 |
Table 8.18. Fatal non-transport accidents1 Years ending 31 December 1996-99
| Place of occurrence | Number of accidents | Crude rate per million of population | ||||||
|---|---|---|---|---|---|---|---|---|
| 1996 | 1997 | 1998 | 1999 | 1996 | 1997 | 1998 | 1999 | |
1Excludes surgical and medical misadventure and later complications, and late effects of injuries. - nil or zero Source: New Zealand Health Information Service | ||||||||
| Home | 598 | 624 | 623 | 575 | 165 | 166 | 164 | 151 |
| Farm | 23 | 16 | 20 | 14 | 6 | 4 | 5 | 4 |
| Mine and quarry | 2 | 1 | 2 | 1 | 1 | - | 1 | - |
| Industrial premises | 16 | 22 | 10 | 16 | 4 | 6 | 3 | 4 |
| Recreation/sport | 18 | 26 | 14 | 19 | 5 | 7 | 4 | 5 |
| Street/highway | 47 | 38 | 44 | 45 | 13 | 10 | 12 | 12 |
| Public building | 25 | 34 | 29 | 27 | 7 | 9 | 8 | 7 |
| Residential institution | 112 | 120 | 89 | 154 | 31 | 32 | 24 | 40 |
| Other specified place | 165 | 183 | 175 | 160 | 46 | 49 | 44 | 42 |
| Place not specified | 101 | 72 | 42 | 90 | 28 | 19 | 11 | 24 |
| Total | 1,107 | 1,136 | 1,048 | 1101 | 306 | 302 | 276 | 289 |
Male deaths by external causes. Males accounted for 65.6 percent of deaths from external causes in 1999 (the latest New Zealand Health Information Service statistics available). Males aged 25-34, followed closely by those aged 15-24, had the highest number of deaths for any particular age group, with suicide being the most common cause of death, followed by motor vehicle accidents.
Accident and injury rates for preschool children. The mortality rate for children aged from 1 to 4 from accidents and injury in 2000 was 14.9 per 100,00 population. In 1999, it was 15.6 per 100,000 population, in 1998 14.2 per 100,000 and in 1997 22.1 per 100,000. In 2000, the system of coding deaths in New Zealand was changed, so comparison with earlier years should be treated with caution.
The Ministry of Health and a number of other agencies fund injury prevention activities throughout the country.
A key activity undertaken in 2003 was completion of the New Zealand Injury Prevention Strategy and its first implementation plan. The strategy and action plans set out a number of priority action areas for the first five years. These are:
Motor vehicle crashes.
Suicide and deliberate self-harm.
Falls.
Workplace injuries.
Assault.
Drowning and near drowning.
The Ministry of Health and the Ministry of Youth Affairs are the lead agencies for suicide and deliberate self-harm.
Activities connected with the strategy involve national coordination contracts, resource development and information sharing through regional support networks, and working with local communities and local government agencies to ensure injury prevention issues achieve the right emphasis in public health promotion.
New Zealand was the first country more than 30 years ago to introduce comprehensive 24-hour, no-fault personal accident insurance cover for people injured in accidents.
Legislation creating the accident compensation scheme took effect on 1 April 1974, replacing a statutory workers' compensation scheme, compulsory third-party motor vehicle accident insurance and a criminal injuries compensation scheme. The new scheme also removed the common law right to sue for damages, in return for support for injured people no matter who was at fault.
Between 1974 and 1998, the scheme was amended from time to time, mainly to keep its entitlements in line with social changes. Essentially, it covers all New Zealand residents, New Zealand residents temporarily overseas and overseas visitors in New Zealand.
The scheme is managed by a statutory corporation, the Accident Compensation Corporation (commonly known as ACC), formerly the Accident Compensation Commission.
The Accident Insurance Act 1998 dramatically altered the scheme's structure by introducing competition to the market for work-related accident insurance. However, the Accident Insurance Amendment Act 2000 and the Accident Insurance (Transitional Provisions) Act 2000 returned ACC as the compulsory state provider of workplace accident insurance.
From 1 July 2000, ACC was again able to provide accident insurance for all work and non-work injuries for all New Zealanders. Private insurers continue to manage any ongoing claims that occurred between 1 July 1999 and 30 June 2000.
The Injury Prevention, Rehabilitation and Compensation Act, passed in September 2001, came into effect from 1 April 2002. This act reintroduced lump sum payments for injuries resulting in permanent impairment, required ACC to develop a code of claimant rights, and made a number of changes to entitlements for injured people.
The Accident Compensation Corporation (ACC) is a Crown entity with a board of directors appointed by the Minister for the Accident Compensation Corporation. A service agreement between the board and the minister specifies ACC's desired outcomes and objectives, and acts as an accountability mechanism.
In the year ending 30 June 2003, ACC accepted 1.52 million claims, a 3.7 percent increase on those accepted in the previous year. About 15,000 of the 2003 claims involved moderate or serious injury, with the rest involving basic medical attention only. In addition to new claims, ACC continued to provide support to people for the ongoing effects of injuries received in previous years.
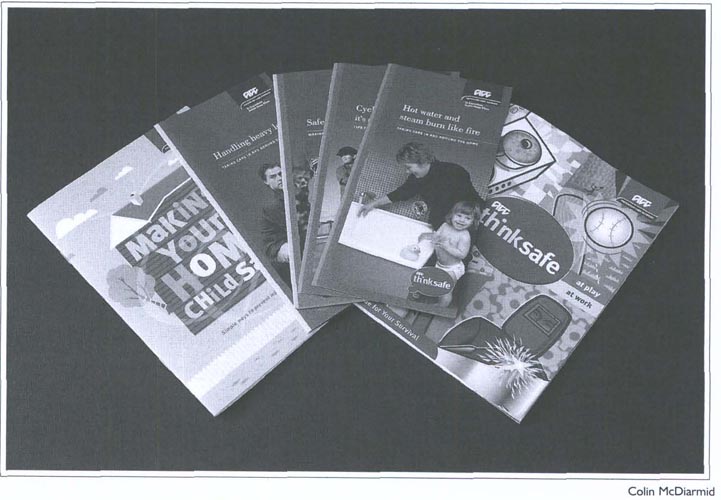
The Accident Compensation Corporation is a major funder of injury prevention programmes.
Services. The main services ACC provides to injured people are:
Cost of retrieval from accident scene, when ambulance or air transport is necessary.
Cost of physical rehabilitation, including cost of some public hospital and private hospital treatment; contribution to cost of ‘primary health care provider’, such as general practitioner, for consultation and treatment relating to minor injury; and some contribution to cost of travel for treatment.
Compensation for loss of earnings. Weekly payments of up to 80 percent of a claimant's pre-injury income for the period during which the claimant is unable to work as a result of the accident. Abated compensation is available if the claimant is able to resume work on reduced earnings.
Vocational support. Providing retraining to enable claimants to return to their previous employment, or to alternative employment.
Personal support designed to make living with the results of an accident more comfortable. This can include payment of an independence allowance, modification of homes and vehicles for those with lasting incapacity, and a range of care services for those unable to manage the normal routine of daily life.
Lump sum compensation. A one-off payment to compensate for permanent impairment resulting from injury. The lump sum is paid in addition to any other entitlements or assistance a claimant may receive from ACC. The amount of the payment depends on the level of permanent impairment.
Funding. ACC is funded by all New Zealanders, with the funding reserves policy moving in 1998 from a ‘pay-as-you-go’ basis to a ‘fully funded’ basis. This change required ACC to set premiums today to cover the full future cost of each claim, and to establish reserves to meet the full future entitlement of people injured in the past. This brought ACC into line with usual insurance practice and means that each generation pays the cost of its own accidents, rather than passing the cost on to future generations.
ACC receives income from: Earners, who pay premiums based on their total earnings, collected with PAYE tax; motor vehicle owners, who pay part of their annual motor vehicle registration fee and a two-cents-a-litre petrol tax; the government, on behalf of non-income earners; all employers and self-employed people; investment of funds held to cover claims costs.
Costs. Injury costs are assigned to one of seven separate accounts:
The employers' account meets the cost of all work-related injuries. The account is funded from employer premiums based on injury risk.
The self-employed work account meets the cost of injuries to self-employed people.
The residual claims account meets the cost of work injuries occurring before July 1999 and non-work injuries to earners occurring before 1 July 1992. Work injuries occurring before 1 July 1999 and non-work injuries of workers sustained before 1 July 1992 are paid from this account. The account is funded by employers and self-employed people.
The earners' account meets the cost of injuries occurring to earners outside their workplace after 1 July 1992 (often injuries resulting from accidents in the home or in sport or recreation). Injuries involving motor vehicles on public roads are not included. The account is funded from earners' premiums paid through PAYE.
The non-earners' account meets the cost of all injuries (except those involving motor vehicles on public roads) to people who are not in the workforce. This account is funded by a direct payment from the government.
The motor vehicle account meets the costs of all personal injuries involving motor vehicles on public roads. It is funded from motor vehicle registration premiums and petrol tax.
The medical misadventure account meets the cost of injuries that result from error by medical practitioners, or from rare and severe outcomes of medical or surgical procedures. The account is funded from the earners' and non-earners' accounts.
In the year ending 30 June 2003, ACC's net levy income totalled $2,574.3 million and total expenditure was $1,978.4 million. Table 8.19 shows claims registered from 1997 to 2003.
Table 8.19. ACC claims registered By account Years ending 30 June
| Account | 1997 | 1998 | 1999 | 2000 | 2001 | 2002 | 2003 |
|---|---|---|---|---|---|---|---|
... not applicable Source: Accident Compensation Corporation | |||||||
| Non-earners | 728,799 | 741,619 | 799,183 | 711,919 | 732,946 | 723,126 | 725,494 |
| Earners | 413,673 | 417,014 | 413,716 | 400,971 | 449,837 | 458,832 | 497,780 |
| Employers | ... | ... | ... | 323 | 155,264 | 198,811 | 210,954 |
| Self-employed work | ... | ... | ... | 35,131 | 50,679 | 49,141 | 48,302 |
| Motor vehicle | 43,571 | 46,019 | 43,787 | 33,764 | 32,500 | 34,909 | 36,711 |
| Medical misadventure | 757 | 510 | 513 | 654 | 432 | 662 | 672 |
| Residual claims | 281,177 | 258,923 | 242,471 | 9,028 | 1,314 | 856 | 600 |
| Total | 1,467,977 | 1,464,085 | 1,499,670 | 1,191,790 | 1,422,972 | 1,466,337 | 1,520,513 |
Ministry of Civil Defence and Emergency Management Te Rākau Whakamarumaru. The Ministry of Civil Defence and Emergency Management leads the way in making New Zealand and its communities resilient to hazards and disasters.
The overarching strategy for achieving this is through a risk management approach to the four ‘Rs’-reduction, readiness, response and recovery. This approach starts with recognising hazards and the vulnerability of communities and infrastructure to those hazards. By addressing the possible effects of these hazards, the focus can move to measures for reducing risks and managing potential impacts.
The ministry aims to put the right tools, knowledge and skills in the hands of those responsible for designing and implementing solutions at the local level. It does this by working closely with local government, utilities and emergency services involved in civil defence emergency management.
The ministry's website is www.civildefence.govt.nz
Fire protection involves fire safety and operational firefighting. These services are managed nationally by the New Zealand Fire Service, on behalf of the New Zealand Fire Service Commission. The primary emphasis on fire safety is determined by legislation in the Fire Service Act 1975.
New Zealand Fire Service Commission. The New Zealand Fire Service Commission is responsible for ensuring statutory requirements set down in the Fire Service Act 1975 are met. The commission comprises five members appointed by the government and is the national purchasing and policy-setting agency. The commission, established under the Forest and Rural Fires Act 1977 as the National Rural Fire Authority, is responsible for coordinating 112 rural fire authorities operating in areas outside designated fire districts, where operational firefighting is provided by the New Zealand Fire Service. The net cost of funding the commission, after allowing for miscellaneous income, is met by a levy on insured property collected by the insurance industry. For the year ending 30 June 2003, the levy produced $215.89 million, compared with $204.43 million for the year ending 30 June 2002. Miscellaneous revenue amounted to $10.06 million, compared with $9.91 million for the 2002 year.
New Zealand Fire Service. Fire safety and fire prevention are the key aims of the New Zealand Fire Service. The service has an operating structure designed to deliver decision-making response and resources to frontline operations. Senior managers are specifically responsible for fire safety and enhancement of fire safety technology.
Eight fire regions are responsible for fire safety programmes, fire fighting resources and the training and operational efficiency of brigades within their fire districts. Thirty of 348 fire districts are served mainly by career firefighters, with some stations augmented by volunteers, while the remaining 318 districts are staffed by volunteers. Nationally in 2003, there were 1,569 career firefighters, compared with 1,580 in 2002 and 1,690 in 2001. There were more than 8,000 volunteers and 3,000 volunteer rural firefighters in 2003, numbers similar to the previous year. Support staff (including those at communications centres in Auckland, Wellington and Christchurch) totalled 478 in 2003, which was six more than in 2002.
The New Zealand Fire Service has the responsibility to fight fires in all urban fire districts and, to the extent that its ability to fight fires is not compromised, to respond to other emergencies at which its fire fighting resources can be utilised.
Table 8.20 shows the number and nature of incidents attended by fire brigades in recent years
Table 8.2. Incidents attended by fire brigades Years ending 30 June
| 1998 | 1999 | 2000 | 2/01 | 2002 | 2003 | |
|---|---|---|---|---|---|---|
1Relating to cars, trucks, vans, motorbikes and ships. 2Volunteer brigade attending an incident in another brigade's territory. 3Figures for 2002, 2003 not differentiated. - nil or zero Source: New Zealand Fire Service | ||||||
| Fires | ||||||
| Fires relating to structures | 7,112 | 6,544 | 6,677 | 5,499 | 6,546 | 6,839 |
| Mobile property fires1 | 3,540 | 3,580 | 3,296 | 2,622 | 3,198 | 3,206 |
| Vegetation fires | 5,091 | 4,211 | 3,731 | 4,325 | 3,572 | 4,728 |
| Chemicals, flammable liquids and gases fires | 141 | 120 | 124 | 79 | 73 | 78 |
| Miscellaneous fires | 8,407 | 7,082 | 6,157 | 6,698 | 7,013 | 7,845 |
| Total | 24,291 | 21,537 | 19,985 | 19,223 | 20,402 | 22,696 |
| Fatalities (all fires) | 46 | 41 | 30 | 44 | 37 | 34 |
| Hazardous emergencies | ||||||
| Flammable liquid, gas incidents | 609 | 659 | 642 | 591 | 820 | 760 |
| Chemical, biohazard, radioactive incidents | 153 | 154 | 126 | 93 | 185 | 161 |
| Mobile properties hazardous incidents1 | 4,545 | 5,556 | 5,867 | 4,195 | 4,414 | 4,486 |
| Other | 794 | 796 | 799 | 944 | 1,144 | 1,171 |
| Total | 6,101 | 7,165 | 7,434 | 5,823 | 6,563 | 6,578 |
| Special service calls | ||||||
| Animal rescue | 408 | 416 | 384 | 329 | 323 | 348 |
| Repair roof | 223 | 326 | 136 | 224 | 297 | 274 |
| Other, including assisting ambulance or police | 4,224 | 4,560 | 4,434 | 5,193 | 6,174 | 5,918 |
| Total | 4,855 | 5,302 | 4,954 | 5,746 | 6,794 | 6,540 |
| Natural disasters | ||||||
| Earthquakes | - | 8 | 3 | - | 2 | - |
| Volcanic eruptions | 4 | 2 | 3 | 2 | 2 | 5 |
| Tsunami, tidal waves | 2 | 7 | - | 5 | - | - |
| Floods | 551 | 1,386 | 701 | 621 | 1,049 | 519 |
| Wind storms, tornadoes, cyclones etc | 303 | 657 | 152 | 502 | 93 | 46 |
| Natural disasters - not classified above | 3 | 16 | 10 | 6 | 2 | 1 |
| Total | 863 | 2,076 | 869 | 1,136 | 1,148 | 571 |
| False alarms | ||||||
| Good intent | 6,580 | 7,131 | 6,522 | 6,874 | 6,647 | 6,604 |
| Malicious | 1,757 | 1,947 | 2,126 | 1,796 | 1,720 | 1,761 |
| Defective apparatus/installation | 6,977 | 7,895 | 7,511 | 6,679 | 7,023 | 6,754 |
| Accidental operation | 4,936 | 4,995 | 5,748 | 5,968 | 6,627 | 6,170 |
| Other | 2,237 | 2,703 | 2,541 | 3,391 | 3,971 | 4,679 |
| Total | 22,487 | 24,671 | 24,448 | 24,708 | 25,988 | 25,968 |
| Other emergencies | ||||||
| Over pressure, rupture, explosives, over heating | 437 | 414 | 432 | 349 | 375 | 443 |
| Rescue, emergency, medical call | 2,650 | 2,890 | 1,253 | 1,478 | 1,849 | 1,882 |
| Mutual aid, cover moves2 | 46 | 66 | 2 | 21 | - | -3 |
| Total | 3,133 | 3,370 | 1,687 | 1,848 | 2,224 | 2,325 |
| All incident types | 61,730 | 64,121 | 59,377 | 58,484 | 63,119 | 64,678 |
Primary responsibility for the provision of occupational safety and health policy advice and services is held by the Department of Labour's Occupational Safety and Health Service (OSH). The Maritime Safety Authority and Civil Aviation Authority have responsibility for the administration and enforcement of legislation in their respective sectors. The Accident Compensation Corporation (ACC) also plays a major role in workplace injury prevention. The principal legislation is the Health and Safety in Employment Act 1992, the object of which is to promote the prevention of harm in the workplace. To achieve this, the legislation:
Defines hazards and places of work.
Promotes excellence in health and safety management.
Imposes enforceable duties on those who are responsible for work, and those who do the work.
Provides for the making of regulations and codes of practice dealing with particular hazards or types of work.
Encourages employee participation and a cooperative approach between employers and employees to workplace health and safety.
The act sets out the responsibilities of employers, employees, principals to contracts, and others who exercise control of places of work. It provides for detailed guidance material to be created by either mandatory regulations, or by codes of practice approved by the Minister of Labour, after consultation with industry. Approved codes are not mandatory, but are recognised statements of good practice. Other good practice guidelines are also developed by OSH, in conjunction with industry. Following a comprehensive review by the government, the Health and Safety in Employment Act was amended in 2002, with changes coming into force on 5 May 2003. The amending legislation made changes to the law in the following areas:
Extended coverage to include mobile workers, volunteers and trainees, as well as the maritime and aviation sectors.
Employee participation required in the improvement of workplace health and safety.
Compliance encouraged through increased fines and a new system of infringement notices.
Stress and fatigue among workers classified as types of harm and hazards covered by the act.
Health and safety in employment legislation provides for the compulsory wearing of safety helmets for all-terrain vehicle (ATV) users.
OSH focuses on supporting safe and healthy workplace practices and reducing work-related illness, injury and deaths through:
Working with other government agencies in promoting and supporting health and safety in the workplace.
Providing information and advice to help workplaces self-manage health and safety.
Identifying changes and risks in workplaces through environmental scoping.
Promoting research and influencing society's attitudes towards workplace health and safety.
Investigating workplace accidents and complaints and enforcing health and safety legislation.
The service investigates all workplace fatalities and works closely with emergency services, local authorities and defence forces in the area of explosives and dangerous goods, and hazardous substances affecting public safety. OSH also surveys agents certifying the safety of hazardous equipment, and audits workplaces for compliance with the law. OSH has 14 regional offices and a Wellington head office. Of 286 staff employed at October 2003, 178 were field staff, including health and safety inspectors or occupational medicine specialists. During 2002/03, OSH field staff carried out 20,617 proactive visits to workplaces, with 11,206 to provide information or advice, and 9,411 to assess compliance with the legislation. In addition, 10,599 investigations were carried out in response to notifications or complaints. In the 2002/03 financial year, OSH investigations led to the commencement of 136 prosecutions. During the year, of the 141 cases determined, 119 resulted in convictions. Funding is through a levy on employers, collected with ACC levies. At 1 January 2004, the levy was 5c per $100 of wages paid. OSH's budgeted Crown funding for the 2002/03 year was $29,005 million to provide policy advice ($1.603m), promote excellence in self-managing occupational safety and health hazards in the workplace ($25.682m) and for regulatory functions outside the Health and Safety in Employment Act 1992 ($1.720m). The OSH website is www.osh.dol.govt.nz
Table 8.21 lists the number of fatal accidents, by industry, investigated by OSH for the years 1995 to 2003.
Table 8.21. Fatal accidents investigated by the Occupational Safety and Health Service By industry Years ending 30 June
| Industry | 1995 | 2000 | 20011 | 20021 | 20031 |
|---|---|---|---|---|---|
1Includes bystanders killed as a result of workplace accidents - none in 2001, five in 2002 and 16 in 2003. 2Includes fatalities in extractive industries, eg mining - two in 2001, five in 2002 and one in 2003. Source: Department of Labour | |||||
| Agriculture and hunting | 4 | 18 | 17 | 25 | 22 |
| Forestry and logging | 11 | 4 | 7 | 2 | 7 |
| Construction | 16 | 17 | 9 | 12 | 14 |
| Other | 14 | 18 | 72 | 342 | 302 |
| Total | 45 | 57 | 40 | 73 | 73 |
Occupational disease. OSH maintains a Notifiable Occupational Disease System (NODS), with voluntary reporting of suspected cases by health professionals. OSH medical staff investigate all notifications of suspected occupational disease or illness. As Table 8.22 shows, this involved 1,088 cases in 2001/02 and 1,344 cases in 2002/03.
Table 8.22. Occupational disease notifications Years ending 30 June
| Disease category | 1995 | 2000 | 2001 | 2002 | 2003 |
|---|---|---|---|---|---|
1Notifiable Occupational Disease System classifications were reorganised for notifications received after 1 July 1998, meaning some categories of data are not directly comparable with others from this date. 2The significant increase in notifications of occupational cancers is due to the OSH-Massey University Cancer Research Project gaining ethical committee approval to contact New Zealand Cancer Registry registrants with bladder cancer, non-Hodgkin's lymphoma and leukaemia. - nil or zero Source: Occupational Safety and Health Service Department of Labour | |||||
| Asbestos-related disease | 132 | ||||
| Occupational asthma | 97 | 1081 | 1051 | 1021 | 961 |
| Other occupational respiratory disease | 34 | ||||
| Occupational disease due to chemical exposure | 115 | 80 | 78 | 58 | 64 |
| Chronic solvent-induced neurotoxicity | 63 | ||||
| Occupational cancer | 3 | 13 | 29 | 1992 | 122 |
| Occupational illness due to infection | 49 | 56 | 43 | 73 | 67 |
| Occupational noise-induced hearing loss | 575 | 330 | 459 | 536 | 891 |
| Occupational overuse | 760 | 135 | 94 | 61 | 68 |
| Occupational skin disease | 91 | 44 | 28 | 27 | 23 |
| Other1 | - | 46 | 15 | 32 | 13 |
| Total | 1,919 | 812 | 851 | 1,088 | 1,344 |
8.1 Ministry of Health; Health Research Council of New Zealand; Malaghan Institute of Medical Research; Medical Council of New Zealand; Dental Council of New Zealand; Nursing Council of New Zealand; Registration Boards Secretariat Ltd; Physiotherapy Board; Pharmaceutical Society of New Zealand; Dental Technicians' Board.
8.2 Ministry of Health; PHARMAC.
8.3 Ministry of Health.
8.4 Ministry of Health.
8.5 Ministry of Health; OECD; Abortion Supervisory Committee.
8.6 Land Transport Safety Authority; Water Safety New Zealand; Ministry of Health.
8.7 Accident Compensation Corporation.
8.8 Ministry of Civil Defence and Emergency Management; Statistics New Zealand; New Zealand Fire Service Commission.
8.9 Occupational Safety and Health Service.
www.acc.co.nz - Accident Compensation Corporation
www.alcohol.org.nz - Alcohol Advisory Council of New Zealand
www.healthcamps.org.nz - Children's Health Camps
www.dentalcouncil.org.nz - Dental Council of New Zealand
www.dentaltec.org.nz - Dental Technicians' Board
www.dol.govt.nz - Department of Labour
www.fpanz.org.nz - Family Planning Association
www.hdc.org.nz - Health and Disability Commissioner
www.hrc.govt.nz - Health Research Council
www.healthsponsorship.co.nz - Health Sponsorship Council
www.Itsa.govt.nz - Land Transport Safety Authority
www.malaghan.org.nz - Malaghan Institute of Medical Research
www.mcnz.org.nz - Medical Council of New Zealand
www.mentalhealth.org.nz - Mental Health Foundation
www.civildefence.govt.nz - Ministry of Civil Defence and Emergency
www.moh.govt.nz - Ministry of Health
www.transport.govt.nz - Ministry of Transport
www.ndp.govt.nz - National Drug Policy
www.otago.ac.nz/prevmed/npc.html - National Poisons and Hazardous Chemicals Information Centre
www.nrl.moh.govt.nz - National Radiation Laboratory
www.nzaf.org.nz - New Zealand Aids Foundation
www.fire.org.nz - New Zealand Fire Service Commission
www.healthcamps.org.nz - New Zealand Foundation for Child and Family Health
www.nzhis.govt.nz - New Zealand Health Information Service
www.nursingcouncil.org.nz - Nursing Council of New Zealand
www.osh.dol.govt.nz - Occupational Safety and Health
www.pharmac.govt.nz - Pharmaceutical Management Agency Ltd (PHARMAC)
www.psnz.org.nz - Pharmaceutical Society of New Zealand
www.huttvalleydhb.org.nz - Public Health Service
www.regboards.co.nz - Registration Boards Secretariat Ltd
www.stats.govt.nz - Statistics New Zealand
www.spinz.org.nz - Suicide Prevention
www.watersafety.org.nz - Water Safety New Zealand Inc
www.wnmeds.ac.nz - Wellington School of Medicine
Table of Contents
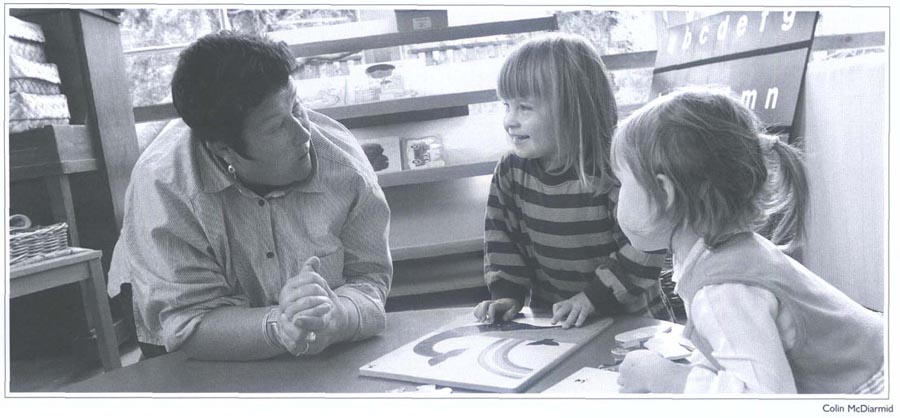
Kindergartens are the predominant provider of early childhood education in New Zealand.
The New Zealand Curriculum Framework sets out the policy direction for learning and teaching in New Zealand state and state-integrated schools. It describes a range of principles which underpin and give direction to the curriculum.
The principles state that the curriculum will be broad, balanced and common; be inclusive of all students; foster success and achievement for all students; enable students to become independent and life-long learners; ensure that learning progresses coherently throughout schooling; recognise New Zealand's bicultural identity; reflect the multicultural nature of New Zealand society; be cooperatively designed; and relate to the wider world.
The framework specifies seven essential learning areas which describe in broad terms the knowledge and understandings which all students will learn. These are:
Language and languages.
Mathematics.
Science.
Technology.
Social sciences.
The arts.
Health and physical well-being.
The framework also sets out essential skills to be developed by all students through a range of learning experiences across the whole curriculum. These skills are communication; numeracy; information; problem solving; self management and competitive; social and cooperative; physical; and work and study. The framework also outlines the commonly-held attitudes and values which should be developed and reinforced in the curriculum.
The framework is supported by more detailed national curriculum statements. Teaching and learning programmes based on these statements for each of the seven essential learning areas are mandatory for state and state-integrated schools to the end of Year 10.
A stock take of the national curriculum completed in 2003 found the structure to be sound, but recommended changes so that the curriculum better articulated expectations of teaching and learning.
A major recommendation of the stock take was that all Year 7 to 10 students have the opportunity of learning a second language. The recommendations of the stock take are being implemented through the New Zealand Curriculum Project.
The curriculum provides flexibility to enable teachers to develop classroom programmes to meet diverse needs. Classroom planning is supported through assessment tools, which provide information on the achievement and progress of students.
While literacy and numeracy continue to be priorities, the curriculum supports learning that encourages creative thinking, problem solving, a love of learning and healthy attitudes to oneself and others.
The National Qualifications Framework (NQF) brings together senior secondary education, industry training and tertiary education under one system.
Coordinated and administered by the New Zealand Qualifications Authority (NZQA), the framework is based on nationally agreed ‘unit standards’ and ‘achievement standards’. Each standard belongs to one of 10 framework levels.
Certificates awarded at Levels 1-3 include the senior secondary education qualification the National Certificate of Educational Achievement (NCEA). New Zealand Scholarship is at Level 4 and diplomas are awarded at Levels 5 and 6; bachelor degrees, graduate diplomas and certificates at Level 7; postgraduate diplomas and certificates, and bachelor degrees with honours, at Level 8; masters degrees at Level 9; and doctorates at Level 10.
Each student receives a Record of Learning - a personalised list of credits the student has achieved.
The framework means students can continue their studies wherever they wish - at school, university, polytechnic, a private or government training establishment, wananga, or even in the workplace. NZQA updates the student's Record of Learning when it receives results from the training organisations.
In the year ending 30 June 2002, 87,016 NQF qualifications were awarded, a 15 percent increase on the previous year.
NCEA qualifications are designed to:
Acknowledge achievement across a range of learning fields, particularly those identified in the New Zealand Curriculum Framework.
Act as learning goals.
Attest to the ability to participate in, and benefit from, further study, thereby promoting lifelong learning.
The NCEA includes a range of subjects and skills not previously examinable under the School Certificate, University Entrance, Bursary and Scholarship examinations it replaced. It allows for recognition of a broader range of student achievements, such as performance ability, research measurement and laboratory skills.
Success in NCEA external examinations is measured against nationally-agreed standards of achievement. These standards have been developed in line with both English and Maori language curriculums to ensure equity of access to the new qualification.
The NCEA shows differences between ‘achieving the standard’, ‘achieving the standard with merit’ and ‘achieving the standard with excellence’.
The NCEA is similar to a university degree. Students gain performance grades in each part of each subject and are able to cross-credit between qualifications. Candidates, while working towards the NCEA, are also able to work towards other national certificates and qualifications.
NCEA Level 1. Holders of an NCEA Level 1 have typically shown themselves able to work at directed activities, with limited responsibility for decisions about the organisation of their work. The qualification is available mainly to Year 11 school students and is awarded to those credited with a minimum of 80 credits at Level 1 or above who have met literacy and numeracy requirements. A minimum of eight credits is required from specified literacy subfields and/or listed standards, and a minimum of eight credits from specified numeracy subfields and/or domains.
NCEA Level 2. NCEA Level 2 is designed to enable access to the foundation skills required for employment. People certificated at Level 2 have typically shown themselves able to integrate knowledge and skills to solve familiar problems; access and use available sources of information; and work in directed activity. The qualification also provides a foundation for further study and knowledge. This qualification is mainly available to Year 12 school students and is awarded to those credited with a minimum of 80 credits, of which a minimum of 60 credits is at Level 2 or above, from achievement standards and/or unit standards anywhere on the National Qualifications Framework.

The new National Certificate of Educational Achievement includes a range of subjects and skills not previously examinable.
NCEA Level 3. NCEA Level 3 is designed to enable access to the skills required for employment. People certificated at Level 3 have typically shown themselves able to integrate knowledge and skills to solve unfamiliar problems; access, analyse and use available sources of information; and work independently in undirected activity. The qualification also provides a more advanced foundation for further study and knowledge. NCEA Level 3 is available mainly to Year 13 school students and is awarded to those credited with a minimum of 80 credits at Level 2 or above, of which a minimum of 60 credits is at Level 3 or above, from achievement standards and/or unit standards anywhere on the National Qualifications Framework.
NCEA Level 4 (New Zealand Scholarship). New Zealand Scholarship extends the best secondary school students and enables top scholars to be identified and acknowledged. New Zealand Scholarship candidates are expected to have completed a full year of study of courses assessed by NCEA Level 3 achievement standards. New Zealand Scholarship holders will have demonstrated outstanding achievement across at least three scholarship subjects; high-level critical thinking, abstraction and generalisation; and the ability to integrate, synthesise and apply knowledge, skills, understanding and ideas to complex situations. Depending on the learning area, effective communication; original or sophisticated solutions, performances or approaches; critical evaluation; and flexible thinking in unfamiliar/unexpected contexts; will also have been displayed.
Sixth Form Certificate (transitional). When NCEA Level 2 was introduced in 2003, secondary schools could opt to enter students for the new qualification or for Sixth Form Certificate (transitional). Grades from the transitional award generate NCEA Level 2 credits. The certificate is awarded on a single subject basis to Year 12 students who have satisfactorily completed a course of one year in one or more subjects. Most students take five or six subjects. All candidates must study a course of English, although they do not have to sit it as a Sixth Form Certificate (transitional) examination subject. Grades are awarded on a 1 to 9 scale, Grade 1 being the highest. Candidates are assessed internally, but grade allocations are moderated externally.
The mission of the Ministry of Education is to raise achievement and reduce disparity in learning outcomes for all New Zealanders by working closely with the education sector and the community.
The ministry provides policy advice to the Minister of Education on all aspects of education, from early childhood to post-compulsory, including employment-related education and training; oversees the implementation of approved policies; and ensures the optimum use of education resources. Through implementation of the New Zealand Disability Strategy, the ministry aims to involve disabled people increasingly in its policy and practice.
The ministry provides funding to early childhood centres, schools, universities, polytechnics, colleges of education and wananga, ensuring distribution matches government policy. It approves charters in all of these institutions and also negotiates funding bids by tertiary institutions.
Since February 2002, the ministry has provided special education services previously provided by Specialist Education Services.
The ministry administers legislation and manages all education property owned by the Crown. It is responsible for developing national guidelines on all aspects of education, including national curriculum objectives. It also conducts research and collects education statistics.
The ministry ensures the delivery of education advisory services, curriculum and early childhood development through contractual arrangements with other agencies.
The ministry's website is www.minedu.govt.nz
Special education. The aim of the government's special education policy is to improve learning opportunities for all children and young people with special education needs at their place of learning. Children and young people with special education needs include students with disabilities, learning difficulties, communication or behaviour difficulties, and sensory or physical impairments. Resources provided include funding, therapy, staffing, specialised programmes, equipment and other materials, transport, advice and support. The policy encourages schools and early childhood centres to work closely with students, their families, whanau, communities and specialists to identify needs and together make the best decisions to meet these needs. The Ministry of Education provides specialist advice and support directly to children and young people and their teachers, schools and families. This is likely to involve a combination of specialised services, tailored educational programmes, in-classroom teacher support and equipment.
Future needs. A key planning role for the Ministry of Education is assessing the need for new schools and classrooms. The primary school age population (5-12 year olds) peaked at 480,000 in 2003 and is now in decline. The secondary school age population (13-18 year olds) is experiencing significant growth, which is expected to continue to 2006 or 2007, after which it will also decline. While these are national projections, there are significant local variations, with some areas already in heavy decline and others sustaining long-term growth. Based on the current profile, more than 170 new classrooms were planned in the 2003/04 financial year, as well as the purchase of six new school sites, plus the building of nine new schools and several kura kaupapa Maori.
Early Childhood Development (ECD) Nga Kaitaunaki Kωhungahunga was established as a Crown entity in 1989. Its role was to promote and encourage the development and provision of quality, accessible and appropriate early childhood education services. Most functions of ECD were integrated into the Ministry of Education on 1 October 2003 and the entity was expected to be disestablished during 2004 by passage of the Education (Disestablishment of Early Childhood Development Board) Amendment Act. The ECD function of assessing and disbursing grants to new and existing licence-exempt groups is now carried out by the ministry.
The New Zealand Qualifications Authority (NZQA) Mana Tohu Matauranga o Aotearoa is a Crown agency reporting directly to the Minister of Education. Its aim is to promote improvement in the quality of education and training in New Zealand.
Its main functions are to develop and maintain a comprehensive, flexible and accessible National Qualifications Framework; oversee the setting of standards for qualifications; ensure New Zealand qualifications are recognised overseas and overseas qualifications are recognised in New Zealand; and administer national examinations, both secondary and tertiary.
The authority's website is www.nzqa.govt.nz
The Education Review Office (ERO) Te Tari Arotake Matauranga is a government department which reports publicly on the quality of education and the care of students in schools and early childhood services. ERO's findings help decisions and choices made by parents, educators, managers and others.
The chief executive of ERO is the Chief Review Officer, who formally accredits review officers to carry out reviews in schools and early childhood services. There are approximately 120 designated review officers in nine local offices, a national Maori evaluation unit, and a Pacific evaluation unit. ERO carries out education reviews, cluster reviews of educational institutions and services, and national evaluations of education issues. It also provides contract evaluation services.
In an education review, ERO investigates and reports to boards of trustees, early childhood service managers and the government on the quality of education provided for students in individual services and schools. Reviews of individual schools and early childhood services are scheduled, on average, once every three years. The review schedule is based on prior performance and current risk analysis.
Reviews are more frequent in particular cases, such as low quality performance or where there are major risks to students and their safety. ERO reports on individual schools and services are available to the public. They can be obtained from the individual school or service, from any ERO office or from the ERO website, www.ero.govt.nz
ERO also publishes national reports which evaluate specific educational issues, using information from its reviews. National reports cover areas such as curriculum, assessment, barriers to learning, principals and teachers, early childhood education, management, school types, cluster reports, senior school students and advice to parents.
The New Zealand Teachers' Council Te Pouherenga Kaiako o Aotearoa is a Crown entity established under the Education Standards Act 2001. It maintains an on-line register of teachers who fit the requirements of the act, are of good character, are fit to be teachers, are satisfactorily trained to teach, are satisfactory teachers in practice and who hold a current practising certificate.
Teacher registration is compulsory for teachers employed in kindergartens and in private and state schools.
Teachers are issued with a practising certificate valid for three years. There were 67,000 teachers with current practising certificates at 30 June 2003. Renewal of the practising certificate is dependent on teachers demonstrating they are still satisfactory teachers.
Teachers who do not meet registration requirements can be temporarily employed with a limited authority to teach. Such employment must be renewed annually. Names of teachers who have their registration cancelled are placed on the council's publicly-accessible web register.
The council operates reciprocal registration with Australia under the Trans Tasman Recognition Agreement.
The council is a member of the National Association of State Directors of Teacher Education and Certification (NASDTEC) in North America, the world's largest teacher licensing authority.
This gives New Zealand access to NASDTEC's clearing-house for checking the licensing of all North American teachers. Links are also maintained with the Department for Education and Employment in England and with the General Teaching Council for Scotland.
The council is funded from practising certificate fees paid by teachers. Its website is www.teacherscouncil.govt.nz
Learning Media Te Pou Taki Korero is a commercial Crown-owned company whose services and products contribute significantly to education in New Zealand and overseas.
Export sales of educational resources and professional development services make up about 30 percent of Learning Media's annual revenue of more than $28 million.
Learning Media exports to the United States, the United Kingdom, Canada, Australia and parts of Asia, Africa, Scandinavia and the Pacific.
In New Zealand, Learning Media produces many of the educational resources the Ministry of Education provides to teachers and students, as well as running key professional-development programmes. It is the world's largest publisher of te reo Maori resources and publishes in six Pasifika languages. Learning Media produces educational resources in a variety of media for other New Zealand government, local government, commercial, and not-for-profit organisations.
Learning Media's website is www.learningmedia.co.nz
Boards of trustees. All state and state-integrated primary, intermediate and secondary schools are governed by boards of trustees. Boards include three to seven parent representatives, the principal of the school and a staff representative. Parent representatives are elected by parents of students enrolled at the school. Where there are students enrolled full time in Year 9 or above, a student representative must be elected to the board. Boards may co-opt additional members to ensure, for instance, that there is a gender balance and that the board reflects the ethnic and socio-economic diversity of the student body of the school. The proprietors of integrated state schools have the right to appoint up to four representatives to boards of trustees.
A board of trustees works in partnership with its community, principal, teachers and the government to ensure the best possible educational outcomes for its students. In consultation, each board develops a school charter, which communicates the vision and direction for the school, its goals for the long and short term and its approach to meeting its legal responsibilities. Boards of trustees are accountable for meeting the objectives in their charter and for managing the funds they receive from the government to run the school. They are required to present an annual report to their community and the Ministry of Education in April/May of each year.
Tertiary councils. Under the Education Act 1989, polytechnics are controlled by councils, members of which represent business, industry, local authorities, universities, women's and ethnic groups, as well as other educational and community interests. Colleges of education councils include representatives from universities and teacher organisations, while wananga have their own councils, made up of representatives from their communities. All universities are established under their own acts of parliament and the council of each university is the governing body.
Table 9.01 shows that government expenditure on education from 1992/93 to 2002/03 increased steadily, both in dollar terms and as a proportion of government expenses.
Table 9.01. Government expenditure on education
| Year | Education expenses | Gross domestic product1 | Education expenses as a percentage of GDP | Total government expenses | Education expenses as a percentage of government expenses |
|---|---|---|---|---|---|
1This is the expenditure measure of GDP and may differ slightly from figures published previously which were based on the production measure of GDP. 2Education and total government expenses from 1997/98 exclude GST on Crown spending. Eestimate .. not available Source: Ministry of Education Statistics New Zealand The Treasury | |||||
| $(million) | Percent | $(million) | Percent | ||
| 1992/93 | 4,539 | 75,246 | 6.0 | 31,429 | 14.4 |
| 1993/94 | 4,627 | 81,387 | 5.7 | 29,639 | 15.6 |
| 1994/95 | 4,803 | 87,052 | 5.5 | 30,400 | 15.8 |
| 1995/96 | 4,949 | 92,679 | 5.3 | 31,743 | 15.6 |
| 1996/97 | 5,335 | 96,911 | 5.5 | 32,953 | 16.2 |
| 1997/982 | 5,162 | 97,107 | 5.3 | 32,852 | 15.7 |
| 1998/99 | 5,337 | 98,277 | 5.4 | 34,367 | 15.5 |
| 1999/2000 | 5,712 | 103,798 | 5.5 | 34,536 | 16.5 |
| 2000/01 | 6,136 | 106,183 | 5.8 | 36,699 | 16.7 |
| 2001/02 | 6,473 | 110,097 | 5.9 | 37,970 | 17.0 |
| 2002/03E | 7,152 | .. | .. | 41,234 | 17.3 |
Early childhood education funding is payable to licensed and chartered early childhood service providers.
Funding provided by the government is not intended to cover the full cost of providing early childhood services. Rather, it is intended to subsidise the cost of these services, with the expectation that parents will also contribute funding, usually by way of fees.
In addition to funding from the government and parents, some services also have other sources of revenue, such as donations and fund-raising activities.
To receive government funding, a service must be open continuously for at least two and-a-half hours. Each service can claim funding for a maximum of six hours a child place a day, up to 30 hours a child place a week.
The funding formula varies according to the type of service, the quality standard met and the ages of children enrolled. The base rate of funding (Rate 1) is higher for children under two years of age ($5.57) than that payable for children over two years of age ($2.79) in recognition of the higher staff:child ratios required for children under two. A higher rate of funding (Rate 2) is paid to services that maintain levels of qualified staff or staff:child ratios above the minimum licensing requirements. Again, a higher rate is paid for children under two ($6.36) than for those over two ($3.18). Kindergartens are funded at a higher rate than other services (Rate 3, $3.97).
A new system of early childhood funding is proposed for implementation by 2005.
Compulsory schooling in New Zealand is funded for state and state-integrated schools at levels adequate to ensure delivery of the curriculum to all students entitled to attend school.
State and state-integrated schools receive funding from the Ministry of Education for operational funding, staffing entitlement, school property and school transport assistance.
Expenditure is controlled by each school's board of trustees, with the board's financial management audited by the Audit Office.
Private schools receive a government subsidy and charge student fees.
For all schools, education provision and school management and governance are reviewed by the Education Review Office.
Operational funding. Levels vary according to school type, student numbers and year levels, and the school's property profile. State and state-integrated schools receive operational funding delivered on an entitlement and a targeted basis. Many boards of trustees choose to supplement this resourcing with funds raised by the local community to provide for extra activities and staffing. Schools may also receive the following targeted funding entitlements:
Maori language resourcing - the level of funding depends on the level of Maori immersion contained in the programme.
Targeted funding for educational achievement - funds to address barriers to learning associated with socio-economic factors, based on the school's roll and the location of students' homes.
Targeted funding for isolation - to recognise the additional costs of accessing the goods and services needed to operate an isolated school and to deliver the curriculum.
Careers information grant - to provide school-based careers information for secondary students.
Secondary Tertiary Alignment Resource (STAR) - for senior programmes in area and secondary schools.
Special education grant and learning support funding - to assist with support for students with moderate special education needs.
Supplementary funding is also available on application to support students with verified high and very high special education needs and for students needing programmes of English for speakers of other languages.
Staffing entitlement. Schools receive a formula-driven entitlement to employ teachers. This provides schools with a measure of security and stability, enabling them to make long-term decisions about students' curriculum and pastoral care needs. Above entitlement, additional staffing is provided in response to specific identified needs. Teachers' salary funding is managed centrally and accessed through the Ministry of Education's education service payroll.
School property. New Zealand's state school property portfolio consists of about 2,300 schools and 2,500 houses. There are also more than 300 state-integrated schools which, although part of the state network, are not owned by the Ministry of Education, but by individual proprietors, mainly representing the Catholic church. These proprietors may charge attendance dues to finance capital work, whereas this is the responsibility of the Ministry of Education for full state schools. Of the full state school portfolio, 65 percent are located in urban areas, while 35 percent are in rural areas. There are more than 21,000 individual buildings, of which nearly 90 percent were constructed after 1950. Replacement value of the portfolio is $10 billion, excluding state-integrated schools. Managing state school property is a shared responsibility between the ministry and each school's board of trustees. The ministry represents the owner, provides advice to both schools and the government on property management policies, and allocates capital funding to schools for property-related works. The ministry also maintains a database of all land and buildings, arranges insurance, town-planning designations, building warrants of fitness, the sale of surplus property, and administers housing for some teachers and caretakers. Boards of trustees for both state and integrated schools manage schools on a daily basis, ensuring all building, health and safety laws are met, as well as planning and implementing property-related works to maintain and improve the teaching and learning environment of schools.
School transport. School children in New Zealand who have to travel long distances to school in areas where there is no public transport may be entitled to use a government-subsidised school bus, or get financial help for transport. Special education students also receive transport assistance, usually in the form of taxis. Around 100,000 children use school buses each year. Bus operators are contracted to the Ministry of Education and to schools. About another 9,000 students receive transport allowances because they cannot use a school bus or need to travel long distances to do so. Approximately 2,300 school bus services carry students to and from school each day.
School boarding bursaries. Boarding assistance is available to school pupils who need to live away from home in order to receive their education. The annual value of a school boarding bursary is $2,340, paid to the school in equal amounts at the end of each term.
Demand-driven rather than capped funding was introduced for the tertiary sector in 1999. In 2002, 220,340 equivalent full-time students (EFTS) were funded with $1,617 billion. Two years earlier, in 2000, 177,847 EFTS were funded with $1,274 billion.
The EFTS system funds tertiary institutions in bulk according to the number of equivalent full-time students and the courses those students are taking. These funded places are provided by the government in advance of the funding year. The system has abolished central government decision making about tertiary institutions' levels of staffing, operating grants and capital works projects. These responsibilities now lie with the management of each institution.
A new tertiary funding framework was planned to be in place from 2004. Built from a mix of funding modes, it has three broad elements - funding for teaching and learning, funding for research, and targeted funding. Funding will continue to be delivered to tertiary providers and industry training organisations as bulk grants.
Private training establishments (PTEs). In 2002, the government provided $164 million to 234 private providers to subsidise tertiary tuition costs for more than 26,500 equivalent full-time students (EFTS). The government reduced the tuition subsidy by 9.5 percent in 2003 and also capped EFTS-based funding for PTEs at $146 million.
StudyLink. A service of the Ministry of Social Development, StudyLink provides the following financial support for students aged 18 and over attending a secondary school or tertiary institution, (students aged 16 and 17 may also be eligible in some circumstances):
Student allowance is a weekly payment to help students with living costs while they are in full-time study. For single students, the level of payment depends on the student's age, parental income if the student is under 25 and whether or not the student lives at home. There are also separate rates for students with a dependent spouse and/or dependent children, for those with an earning spouse, and for those married to another student. Single students living away from the parental home, some married students and those receiving a ‘with dependent’ rate of student allowance may also qualify for an accommodation benefit. Rates of allowances are reviewed annually. Table 9.02 shows student numbers and amounts paid in student allowances, accommodation benefits and bursary payments in recent years.
Table 9.02. Student allowance, accommodation benefit, bursary By student numbers and amounts paid Years ending 31 December
2000 2001 2002 2003 1A student is a person who received at least one payment in the calendar year specified.
Source: Ministry of Social Development
Number of students1 Student allowance 68,084 70,231 68,869 64,036 Accommodation benefit 53,255 54,366 53,508 50,429 Bursary 14,773 14,603 14,199 14,060 Amounts paid $ Student allowance 397,235,377 367,453,027 366,745,446 350,563,532 Accommodation benefit 41,723,972 42,655,284 42,378,868 42,035,984 Bursary 2,338,200 2,310,800 2,245,200 2,210,900 Average $ Student allowance 5,834 5,232 5,325 5,474 Accommodation 783 785 792 834 Bursary 158 158 158 157 The Kelburn campus of Victoria University of Wellington, one of New Zealand's eight universities.
The student loan scheme was established in 1992 to assist students participate in tertiary education. The Ministry of Education is responsible for managing strategic policy of the scheme. StudyLink is responsible for delivery and administration of payment. This includes assessment of loan applications, administration of the payment of compulsory fees to providers and payment of living costs and course-related costs to students. Students can get a loan to cover compulsory fees payable at enrolment (private training establishment students can borrow only up to $6,500 for fees per loan account); a maximum of $1,000 a year to assist with course-related costs such as equipment, textbooks and field trips; and living costs for full-time students of $150 a week for the length of the course (less any entitlement to a student allowance). Each time a new loan is taken out, an administration fee of $50 is charged. Full-time students can access fees, course-related costs and living costs; part-time (32 weeks or more) students can access fees and course-related costs, while part-time (less than 32 weeks and studying at least 0.3 equivalent full-time study values) students can access fees only. Loans incur interest and are repayable through the Inland Revenue Department. The level of repayment is based on taxable income.
The unemployment benefit student hardship is paid to students unable to obtain employment and in hardship during the break between periods of study. Eligibility is dependent on age, residency status, income, study status, job search status and hardship.
Supplementary assistance. StudyLink also administers a range of supplementary assistance for students, such as help with childcare or disability costs. Eligibility is dependent on individual circumstances.
Step up scholarships. StudyLink now administers step up scholarships for students studying certain human and animal health science degree courses. These were introduced in September 2003 for study in 2004.
Table 9.03 shows loan money drawn by students, repayments or refunds, and administration fees for recent years.
Table 9.03. Student loans, repayments, administration fees Years ending 31 December
| 2000 | 2001 | 2002 | 2003 | |
|---|---|---|---|---|
1A student is a person who received a least one payment in the calendar year specified. 2Standard administration fee is $50. Averages are higher because of a small number of students who have more than one loan in a year. Source: Ministry of Social Development | ||||
| Number of students1 | ||||
| Fees | 122,833 | 138,334 | 139.323 | 144.678 |
| Course-related costs | 72.591 | 94.319 | 96.563 | 101.664 |
| Living costs | 70.982 | 77.405 | 77.699 | 79.373 |
| Repayments or refunds | 41.087 | 35.586 | 37.474 | 38.278 |
| Administration charges | 128.104 | 143.703 | 144.952 | 150.754 |
| Amount paid | $ | |||
| Fees | 468.864.957 | 551.265.300 | 560.550.975 | 593.922.339 |
| Course-related costs | 65.008.000 | 88.177.896 | 90.810.508 | 95.143.228 |
| Living costs | 241.736.567 | 268.628.200 | 281.638.016 | 297.737.889 |
| Repayments or refunds | -35.943.724 | -39.310.502 | -43.808.978 | -51.210.852 |
| Administration charges | 6.498.450 | 7.334.350 | 7.418.150 | 7.717.100 |
| Average | $ | |||
| Fees | 3.817 | 3.985 | 4.023 | 4.105 |
| Course-related costs | 896 | 935 | 940 | 936 |
| Living costs | 3.406 | 3.470 | 3.625 | 3.751 |
| Repayments or refunds | -875 | -1.105 | -1.169 | -1.338 |
| Administration charges2 | 51 | 51 | 51 | 51 |
The Rural Education Activities Programme is a community-managed package of educational resources operating in rural communities in the Far North, Eastern Bay of Plenty, Tairawhiti (East Coast), Central Plateau, Central King Country, Ruapehu, Tararua (Southern Hawke's Bay), Wairarapa, Marlborough, Buller, Westland, Central Otago and Southland.
Each programme provides educational support and assistance across all education sectors.
The adult and community sector has a range of activities and programmes including access to information about adult learning opportunities and assistance with meeting adult education needs identified by the community, along with information and advice on community development, piloting new learning methods, and managing projects and programmes.
The programmes were funded by the Ministry of Education till 1 July 2004, when the Tertiary Education Commission took over funding the adult and community education sector.
The ministry continues to fund the early childhood, primary and secondary education sectors.
Ensuring Maori participate and achieve in the education system involves:
Building strong early learning foundations for Maori through participation in quality early childhood education services.
Supporting the provision of strong Maori language education options such as kωhanga reo, kura kaupapa Maori and bilingual education.
Raising the success of Maori in mainstream education.
Building Maori involvement and authority in education through partnerships with Maori organisations and iwi.
Recognising the important role that parents and whanau play in supporting their children's education.
The majority of Maori students are in mainstream education, although there has been a steady increase in the number of Maori participating in kaupapa Maori education. Kωhanga reo, kura kaupapa Maori, wharekura and wananga have all grown from Maori initiatives and their success and growth is in part due to the fact that they are designed and delivered to meet Maori needs.
The number of Maori enrolled in kura kaupapa Maori increased steadily between 1999 and 2002, as did the number of kura.
Maori participation in tertiary education has also increased significantly in recent years, the greatest growth being at Te Wananga o Aotearoa.
Maori achievement has also increased across the New Zealand education system in recent years. There remain concerns, however, that there is a widening gap between low and high achievers.
Working with teachers, whanau, education providers and Maori/iwi communities to support the educational achievement of Maori is a priority, to ensure that many more Maori succeed in education and enjoy long-term independence and well-being.
The purpose of the Maori Education Trust Te Tari O Te Kaitiaki Mo Nga Take Matauranga Maori is to promote and encourage the better education of Maori and to provide financial assistance for that purpose.
These aims were reconfirmed in October 1993 when the Maori Education Foundation formally became the Maori Education Trust. The trust was set up to assist all Maori, regardless of age, gender, tribal affiliations or geographic location and this is still its kaupapa.
Trust income comes from two dairy farms, from investment interest and from contracts for services (scholarship administration) through the Tertiary Education Commission and the Ministry of Education. The trust administers and co-sponsors 30 scholarships, bursaries and grants for Maori attending secondary, tertiary and postgraduate courses, both in New Zealand and overseas.
The trust is the major sponsor of the Nga Manu Korero national Maori speech competitions held annually for secondary school students. These competitions allow Maori students to participate in either te reo Maori or English. Taonga awarded give both successful students and their schools considerable mana.
The trust distributes approximately $6.3 million for Maori education annually and had assets of $13 million at 31 December 2002.
The Maori Education Trust website is www.maorieducation.org.nz
Early childhood education refers to the non-compulsory provision of education and care for infants, toddlers and young children before they begin school.
Early childhood education is available in New Zealand to children under six years through a wide range of services, many of which are administered by voluntary agencies with government assistance.
Many early childhood services have evolved from individual and community initiatives, resulting in a diverse system of education, with a high degree of autonomy. Early childhood education programmes are based on a wide range of philosophies framed by the early childhood education curriculum document Te Whariki.
All early childhood services wishing to receive government funding must be licensed and chartered. Licensing ensures that minimum standards of quality are maintained. A charter contains both mandatory and optional objectives and practices related to the provision of learning opportunities. Chartered groups receive funding direct from the government in the form of a bulk grant.
The main licensed providers of early childhood education are education and care services, kindergartens, te kωhanga reo and playcentres. Licensed centres and home-based care networks (excluding kωhanga reo and playcentres) are required to have a coordinator or a person responsible with a Diploma of Teaching (ECE).
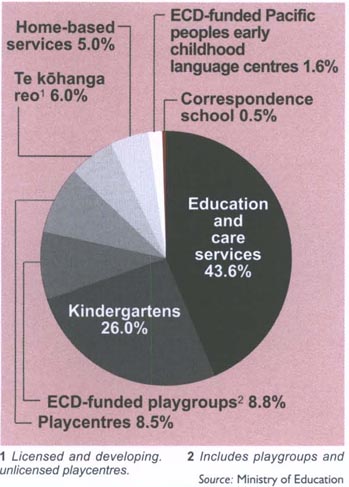
The main licence-exempt, Early Childhood Development-funded providers are playgroups and Pacific peoples early childhood groups.
Figure 9.01 shows the percentage of children enrolled in each early childhood education provider.
Kindergartens. Kindergartens are the predominant provider of early childhood education for children between the ages of three and five. At 1 July 2002, 45,169 children were enrolled in kindergartens, 61 percent of them aged four. In general, younger children at kindergarten attend afternoon sessions for three afternoons a week, while the older group attends five mornings a week. Mobile kindergarten services are available in some rural areas. All teachers in kindergartens are trained to diploma level and parent participation is encouraged. Each kindergarten has its own parent committee, but management responsibility lies with regional kindergarten associations. These may be linked to one of two national bodies, the New Zealand Free Kindergarten Association (Inc), or the New Zealand Kindergarten Federation.
Playcentres. Playcentres are parent cooperatives where parents take responsibility for the management and supervision of sessions. Children attending playcentre range in age from birth to school age. At 1 July 2002, 14,879 children were enrolled in licensed playcentres, with more two-year-olds enrolled than any other age group. A trained supervisor, or a group of parent supervisors, takes overall responsibility for the playcentre programme. Playcentres are administered through parent management committees at local and regional levels and these are linked to the New Zealand Playcentre Federation at a national level. Training and parent education programmes are developed by the national playcentre body and implemented through centre-based programmes.
Kωhanga reo. Kωhanga reo (language nests) are sessional or all-day Maori language immersion early childhood institutions. Their prime aim is the maintenance of the Maori language. The wider focus of kωhanga reo is whanau development. Kωhanga reo are community based and are administered by local management groups affiliated to Te Kωhanga Reo National Trust. The trust receives government funding and allocates it to individual kωhanga reo. The trust has delegated responsibility for developing and approving charters for kωhanga reo, based on government guidelines. All kωhanga reo use the early childhood Maori language immersion curriculum document Te Korowai in their planning and delivery of programmes. At 1 July 2002, there were 10,389 children enrolled in licensed kωhanga reo, with three-year-olds the biggest age group.
Parents as First Teachers (PAFT). Based on programmes developed in the United States by the Missouri State Department of Education, PAFT programmes provide a series of regular home visits by early childhood educators to parents with children from birth to three years. The programmes were developed in the belief that parents are their children's first and most important teachers, and that by empowering them in their parenting role, parents will become more confident, and participate more effectively, in the development and education of their children. Core elements of the programme provide individualised support through a structured learning series on child development and the fostering of early learning. Programmes are funded directly by the government and cover most regions of the country, involving around 8,000 families. Maori and Pacific peoples organisations are included in those contracted to provide PAFT programmes.
Pacific Early Childhood Education Services. Pacific Early Childhood Education Services offer programmes based on the values and languages of Pacific cultures. The services cover Samoan, Cook Islands Maori, Niuean, Tongan, Tokelauan, Tuvaluan and Fijian nationalities. Services range from licence-exempt groups, meeting once or twice a week, to licensed and chartered centres. Programmes have high parental involvement and emphasise language development, both in Pacific languages and English, and increased parental knowledge in early childhood care and education. At 1 July 2002, there were 2,914 children enrolled in Pacific peoples early childhood groups.
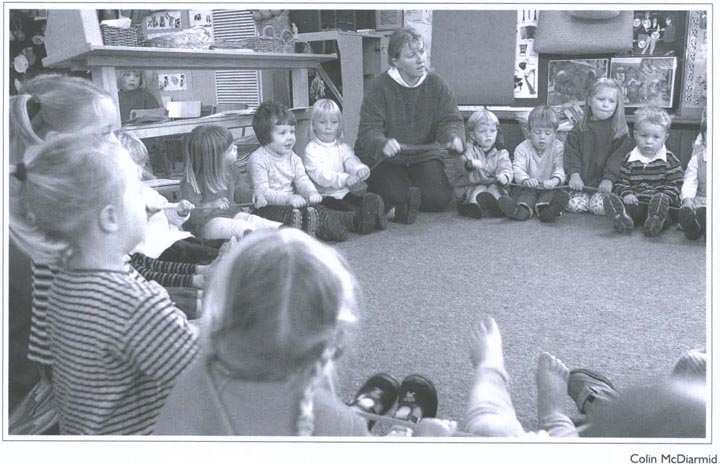
All teachers in kindergartens have to be trained to diploma level.
Anau Ako Pasifika. The ministry is the grant holder on behalf of the Bernard Van Leer Foundation for the Anau Ako Pasifika project, a home-based programme in early childhood care and education for Pacific communities based in Auckland, Tokoroa and Wellington.
Education and care centres. Education and care centres provide sessional, all day or flexible hours early childhood education services. Each centre is autonomous and many are privately owned. Some are administered by individuals, others by a committee, trust, firm or organisation. They may describe themselves as private kindergartens, creches, infant centres, playcentres, preschools, or by a name which indicates their particular philosophy or purpose. Some education and care centres have all trained staff, while others have a mixture of trained and untrained personnel. A number of education and care centres are community based, with a high degree of parent involvement, or are based on a parent cooperative model. At 1 July 2002, 76,246 children were enrolled at licensed education and care services, with three-year-olds the largest group (22,705) represented.
Home-based services. Home-based care (family day care) is an organised system whereby parents of young children or babies are linked to caregivers, who are often themselves parents of young children. Trained coordinators supervise provision of early childhood education and care, and provide regular playgroups or workshop meetings for parents and caregivers. Enrolments with licensed home-based services at 1 July 2002 totalled 8,591, with half of the children aged one and two.
Playgroups. Playgroups are licence-exempt, community-based, non-profit groups of parents who meet to provide early childhood education for their children. Funded community playgroups are exempt from licensing, but must meet criteria set down by the Ministry of Education. Active participation of parents is required at all sessions. Many licence-exempt groups work with Early Childhood Development in the Ministry of Education. There were 15,002 children enrolled in playgroups at 1 July 2002.
Compulsory education in New Zealand is divided into primary, intermediate and secondary schooling.
Primary schools are the first level. They cater for children from the age of five (Year 0) to the end of Year 6.
Children in Years 7 and 8 may either go to a separate intermediate school, or to part of a primary, secondary or composite/area school.
Secondary schools usually provide for students from Year 9 until the end of Year 13. Adult students who return to school enter in the year of the majority of their subjects. Table 9.04 shows years in attendance of 2002 secondary school leavers.
Composite/area schools, usually based in rural areas, combine primary, intermediate and secondary schooling at one location.
A child aged between five and six, starting primary school for the first time between July (when the school roll is counted) and the end of that school year, is classed as Year 0.
Children who begin school for the first time between 1 January and before the July roll count, are classed as Year 1.
If children start school for the first time after the age of six, they are placed in the same year as other children of the same age.
Primary schools are required to be open for at least 394 half days each year and secondary schools for at least 380 half days. The New Zealand school year is divided into four terms of approximately even length.
Table 9.04. Secondary school leavers during 2002 By year of schooling, gender and ethnicity
| Years in attendance | NZ European/European/Pakeha | Maori | Pacific peoples | Asian | Other | Total by gender | Grand total | ||||||
|---|---|---|---|---|---|---|---|---|---|---|---|---|---|
| Male | Female | Male | Female | Male | Female | Male | Female | Male | Female | Male | Female | ||
- nil or zero Source: Ministry of Education | |||||||||||||
| Year 9 | 18 | 10 | 22 | 14 | 3 | 1 | - | - | 3 | - | 46 | 28 | 74 |
| Year 10 | 341 | 175 | 216 | 142 | 26 | 19 | 9 | 6 | 10 | 5 | 602 | 347 | 949 |
| Year 11 | 2,515 | 1,543 | 1,101 | 974 | 249 | 163 | 68 | 69 | 40 | 20 | 3,973 | 2,769 | 6,742 |
| Year 12 | 4,956 | 4,167 | 1,486 | 1,557 | 509 | 393 | 336 | 274 | 99 | 95 | 7,386 | 6,486 | 13,872 |
| Year 13 | 9,453 | 10,676 | 1,608 | 2,027 | 961 | 1,078 | 1,597 | 1,511 | 293 | 263 | 13,912 | 15,555 | 29,467 |
| Year 14 | 293 | 361 | 133 | 131 | 111 | 120 | 76 | 38 | 6 | 10 | 619 | 660 | 1,279 |
| Year 15 | 43 | 46 | 16 | 17 | 15 | 7 | 9 | 3 | - | 1 | 83 | 74 | 157 |
| Total | 17,619 | 16,978 | 4,582 | 4,862 | 1,874 | 1,781 | 2,095 | 1,904 | 451 | 394 | 26,621 | 25,919 | 52,540 |
Table 9.05. Secondary school leavers in 2002 By level of highest attainment, gender and ethnic identification
| Highest attainment | NZ European/European/Pakeha | Maori | Pacific peoples | Asian | Other | Total by gender | Grand total | ||||||
|---|---|---|---|---|---|---|---|---|---|---|---|---|---|
| Male | Female | Male | Female | Male | Female | Male | Female | Male | Female | Male | Female | ||
1National Certificate of Educational Achievement (NC) is a New Zealand Qualifications Framework level. 2Minimum of three Cs in University Bursary examinations. 3One or more subjects irrespective of grade awarded. - nil or zero Source: Ministry of Education | |||||||||||||
| National Certificate of Educational Achievement (NC)1 L4 | 3 | 1 | 1 | 1 | 4 | 5 | |||||||
| A or B Bursary or NC L3 | 3,274 | 4,389 | 141 | 224 | 71 | 82 | 849 | 803 | 101 | 77 | 4,436 | 5,575 | 10,011 |
| Entrance qualification2 or 42 or more credits at NC L3 or above, or ACE or overseas award at Y13 level | 1,387 | 1,729 | 140 | 217 | 66 | 93 | 206 | 228 | 33 | 43 | 1,832 | 2,310 | 4,142 |
| Higher School Certificate or 14-41 credits at NC L3 or above | 1,949 | 2,097 | 327 | 498 | 239 | 358 | 297 | 253 | 52 | 74 | 2,864 | 3,280 | 6,144 |
| NC L2 or 1-13 credits at L3 or above | 600 | 558 | 160 | 180 | 71 | 125 | 29 | 35 | 11 | 16 | 871 | 914 | 1,785 |
| Forty-two or more credits at NC L2 or above, or ACE or overseas award at Y12 level | 55 | 67 | 21 | 25 | 10 | 26 | 12 | 4 | 2 | 2 | 100 | 124 | 224 |
| Sixth form certificate3 | 3,928 | 3,625 | 820 | 918 | 431 | 384 | 346 | 315 | 85 | 76 | 5,610 | 5,318 | 10,928 |
| NC L1 or 1-13 credits at L2 or above | 712 | 506 | 239 | 233 | 129 | 73 | 33 | 23 | 11 | 6 | 1,124 | 841 | 1,965 |
| Forty-two or more credits at NC LI or above, or ACE or overseas award at Y11 level | 409 | 313 | 126 | 112 | 46 | 25 | 14 | 17 | 7 | 1 | 602 | 468 | 1,070 |
| School Certificate or 14-41 credits at NC L1 or above | 2,434 | 1,780 | 854 | 906 | 248 | 215 | 100 | 68 | 33 | 28 | 3,669 | 2,997 | 6,666 |
| One to 13 credits at NC LI or no formal attainment | 2,871 | 1,911 | 1,753 | 1,548 | 563 | 400 | 209 | 158 | 116 | 71 | 5,512 | 4,088 | 9,600 |
| Total | 17,619 | 16,978 | 4,582 | 4,862 | 1,874 | 1,781 | 2,095 | 1,904 | 451 | 394 | 26,621 | 25,919 | 52,540 |
Table 9.05 shows the level of highest achievement by secondary school leavers in 2002.
While most students in New Zealand attend state-funded schools, parents or caregivers and students have the choice of a number of schooling options.
State schools. State schools are co-educational (mixed sexes) at primary and intermediate level, but some offer single-sex education at secondary level. Lessons are based on the New Zealand curriculum. Some state schools offer special programmes for adult students or run community education classes.
Integrated schools. Integrated schools are those that used to be private and have now become part of the state system. They teach the New Zealand curriculum, but keep their own special character (usually a philosophical or religious belief) as part of their school programme. Integrated schools receive the same government funding for each student as state schools, but as their buildings and land are privately owned, they charge attendance dues to meet property costs.
Kura kaupapa Maori. Kura kaupapa Maori are state schools where teaching is in the Maori language (te reo Maori) and is based on Maori culture and values. The curriculum is the same as at other state schools. Kura kaupapa cater for students from Years 1-8 or Years 1-13. The schools build on köhanga reo (Maori language early childhood education centres). A key goal of kura kaupapa is to produce students who are equally skilled in both Maori and English.
Independent schools. Independent (or private) schools are governed by their own independent boards, but must meet certain standards in order to be registered. Independent schools may be either coeducational or single-sex. They charge fees, but also receive government funding.
Boarding schools. Boarding schools may either be independent or part of a state-funded school. All charge boarding fees.
The Correspondence School Te Kura a Tuhi. The Correspondence School is a national state school funded by the Ministry of Education and administered by a board of trustees, which includes ministerial appointments and parent, staff and student representatives. The school provides courses for early childhood, primary, secondary and adult students. Full-time students are enrolled for a variety of reasons, including distance from other schools, special needs, medical and psychological problems, itinerancy and suspension from other schools. In some circumstances, the school provides courses for students in other New Zealand primary and secondary schools. It also offers ‘second chance’ education to adult students wanting to improve their qualifications. In addition, the school provides some services on a fee-paying basis. The Correspondence School educates the children of New Zealand citizens overseas, where suitable schooling is not available. This allows these students to continue to work towards New Zealand school level qualifications. The school offers a full range of courses, including practical subjects such as art, computing and science. The school roll of20,177 at December 2003 was made up of 1,006 early childhood pupils, 1,939 students attending other primary schools, 7,636 students attending other secondary schools, 873 full-time primary, 2,280 full-time secondary, 553 fee-paying and 5,890 adult students. The 630 staff employed by the school consist of 29 early childhood teachers, 101 primary teachers, 282 secondary teachers and 218 people who provide operational and strategic support. The Correspondence School's website is www.correspondence.school.nz
Home-based schooling. Home-based schooling is an alternative available for parents and caregivers who want to educate their children at home. Parents and caregivers need approval from the Ministry of Education and must educate their children at least as regularly and as well as at a registered school. Home-based schooling parents and caregivers are given an annual grant to help with the cost of learning materials and can choose to purchase teaching services from The Correspondence School. Though numbers of home-schooled children in New Zealand have grown considerably in recent years, they account for only 1 percent of total school enrolments.
Designated character schools. Designated character schools are state schools that teach the New Zealand curriculum, but have been allowed to develop their own set of aims, purposes and objectives to reflect their own particular values.
Special schools. Special schools are state schools that provide education for students with special education needs. The curriculum is the same as at other state schools. There are eight residential special schools.
Assessment information gathered about students' progress and achievement is used to improve the quality of teaching programmes.
Students' strengths and weaknesses identified as a result of assessment are shared with students and parents.
Most assessment information comes from ongoing classroom assessment. Schools provide parents with written reports about their children's achievements and parents are also entitled to ask for meetings with teachers to talk about their child's progress.
Student achievement for primary students across New Zealand is monitored on a four-year rolling cycle by assessing around three percent of eight and 12-year-olds. The National Education Monitoring Project covers the whole New Zealand curriculum. At secondary school level, results from the National Certificate of Educational Achievement (NCEA) are used to provide national information about student achievement. A sample of New Zealand students also participate in international assessment studies to measure their achievement levels against those of other Organisation for Economic Co-operation and Development countries.
Table 9.06 shows grades earned by students, by subject, in the year ending 31 December 2003.
Table 9.06. University Entrance, Bursary, Scholarship grades By subject Year ending 31 December 2003
| Subject | Total results | Grade A | Grade B | Grade C | Grade D | Grade E |
|---|---|---|---|---|---|---|
| Percent | ||||||
| Accounting | 3,515 | 18 | 27 | 34 | 17 | 4 |
| Agriculture and horticulture | 729 | 6 | 16 | 39 | 30 | 9 |
| Biology | 8,192 | 15 | 23 | 35 | 21 | 5 |
| Chemistry | 6,732 | 21 | 28 | 34 | 14 | 3 |
| Chinese (second language) | 406 | 10 | 37 | 42 | 7 | 4 |
| Classical studies | 4,964 | 14 | 24 | 36 | 21 | 5 |
| Design | 2,136 | 12 | 18 | 40 | 27 | 4 |
| Economics | 6,838 | 14 | 24 | 34 | 23 | 6 |
| English | 13,861 | 12 | 28 | 34 | 22 | 4 |
| French (second language) | 708 | 27 | 33 | 27 | 11 | 2 |
| Geography | 7,385 | 11 | 21 | 37 | 25 | 7 |
| German (second language) | 330 | 34 | 23 | 29 | 12 | 2 |
| Graphics | 1,788 | 8 | 23 | 36 | 27 | 6 |
| History (including English) | 3,108 | 15 | 24 | 37 | 19 | 5 |
| History (including New Zealand) | 1,990 | 12 | 28 | 31 | 22 | 7 |
| History of art | 2,399 | 15 | 23 | 37 | 20 | 5 |
| Indonesian | 12 | 33 | 33 | 25 | 8 | 0 |
| Japanese (second language) | 844 | 25 | 26 | 31 | 14 | 5 |
| Latin | 45 | 38 | 31 | 27 | 4 | 0 |
| Mathematics with calculus | 9,925 | 19 | 24 | 35 | 17 | 5 |
| Mathematics with statistics | 13,056 | 15 | 26 | 35 | 19 | 6 |
| Music | 817 | 16 | 21 | 36 | 21 | 5 |
| Painting | 2,230 | 10 | 22 | 33 | 30 | 5 |
| Photography | 2,046 | 9 | 23 | 41 | 23 | 5 |
| Physical education | 3,967 | 8 | 17 | 39 | 29 | 7 |
| Physics | 7,581 | 19 | 25 | 38 | 12 | 6 |
| Printmaking | 271 | 15 | 27 | 30 | 25 | 4 |
| Science | 1,496 | 11 | 20 | 37 | 26 | 6 |
| Sculpture | 301 | 15 | 16 | 39 | 27 | 4 |
| Spanish (second language) | 247 | 25 | 28 | 28 | 15 | 4 |
| Te Reo Rangatira | 583 | 14 | 25 | 35 | 21 | 5 |
Note:Percentages may not total 100 because of rounding. Source: New Zealand Qualifications Authority | ||||||
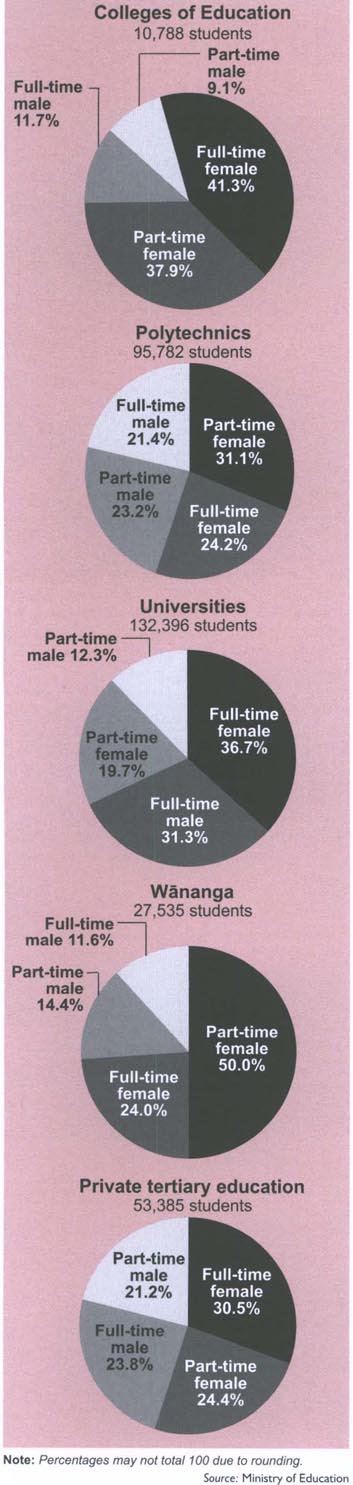
After finishing compulsory schooling, many New Zealanders continue their education at tertiary level.
Ministry of Education figures for 2002 showed around 400,000 New Zealanders participating in tertiary education, an increase of 30 percent since 1999. The tertiary sector now encompasses adult and community education, industry training, foundation education (basic skills usually acquired at school), study at tertiary institutions such as universities, colleges of education, polytechnics and wananga and at private training establishments. Figure 9.02 shows attendance at tertiary institutions in 2002.
Qualifications gained are part of the 10-level National Qualifications Framework, whose building-block approach to learning enables students to continue to build their skills over a lifetime using a range of delivery options. Tertiary education has a crucial role in providing high quality teaching, research and learning opportunities to meet economic and social development needs. In April 2000, a Tertiary Education Advisory Commission (TEAC) was established to develop a new strategic direction to focus the tertiary education system more effectively on meeting these needs.
In May 2002, the commission finalised Tertiary Education Strategy 2002-2007, which sets a new direction in tertiary education, explicitly linking learning and research with New Zealand's economic and social development goals and priorities.
A Tertiary Education Commission (TEC) was established in July 2002 under the provisions of the Education (Tertiary Reform) Amendment Act 2002. It is responsible for funding all post-compulsory education and training offered by universities, polytechnics, colleges of education, wananga, private training establishments, foundation education agencies, industry training organisations and adult and community education providers.
The commission's key role is to oversee implementation of the six strategies outlined in the tertiary education strategy:
Strengthen system capability and quality.
Contribute to the achievement of Maori development aspirations.
Raise foundation skills so that all people can participate in the knowledge society.
Develop the skills New Zealanders need for the knowledge society.
Educate for Pacific peoples' development and success.
Strengthen research, knowledge creation and uptake for the knowledge society.
New initiatives to improve student access to tertiary education include a fee stabilisation package for tertiary providers to prevent increases in course fees, a full interest write-off on student loans for full-time, full-year students and low income students, and additional funding to assist public tertiary education providers to adapt to the changing tertiary environment ahead of implementation of new funding and regulatory systems. Improvements in collaboration and coordination of public tertiary education institutions to offer more effective and diverse education services include mergers between tertiary education institutions, and accords and working alliances between education institutions and industry bodies.
The Tertiary Education Commission's website is www.tec.govt.nz
There are eight universities in New Zealand: the University of Auckland, Auckland University of Technology, the University of Waikato, Massey University, Victoria University of Wellington, the University of Canterbury, Lincoln University and the University of Otago.
Universities are controlled by their own councils, established under legislation drafted to maximise their autonomy, consistent with the normal requirements of accountability for public funding.
Each university sets its own programmes and each university council sets dates for terms or semesters. All matters relating to management are the responsibility of the council of the institution, which represents the interests of staff, students and the community. The council is also responsible for approving course regulations and for maintaining the equivalences of courses for degrees and other qualifications. Figure 9.03 illustrates the number of bachelors degrees by field of study completed in 2002.
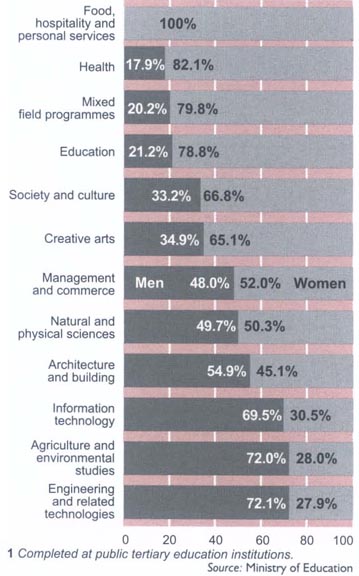
Polytechnics provide a diverse range of academic, vocational and professional programmes and cover an increasing number of subjects at various levels of specialisation.
There are 20 polytechnics in New Zealand. They are Northland Polytechnic, UNITEC-lnstitute of Technology, Manukau Institute of Technology, Waikato Polytechnic, Bay of Plenty Polytechnic, Waiariki Institute of Technology, Tairawhiti Polytechnic, Eastern Institute of Technology, Western Institute of Technology, Universal College of Learning (UCOL), Whitireia Polytechnic, The Open Polytechnic of New Zealand, Wellington Institute of Technology, Nelson Marlborough Institute of Technology, Tai Poutini Polytechnic, Christchurch Polytechnic Institute of Technology, Aoraki Polytechnic, Otago Polytechnic, Telford Polytechnic and Southland Institute of Technology.
Wananga (Maori tertiary institutions) provide tertiary education and training while assisting the application of knowledge regarding ahuatanga Maori (Maori tradition) in accordance with tikanga Maori (Maori custom). Te Wananga o Aotearoa in Te Awamutu, Te Wananga o Raukawa in Otaki and Te Wananga o Awanuiarangi in Whakatane are governed in the same way as other tertiary institutions.
The Open Polytechnic of New Zealand is the only broad-based national polytechnic and the specialist tertiary institution in open and distance learning. In 2003, it had 526 on-campus staff, a total staff of 843 and 36,963 enrolled students. Nearly all students are part-time learners.
The Open Polytechnic is a major educator of people in the workforce. A large percentage of its students are adult learners in paid employment who study in their own time to enhance their career opportunities.
The Schools of Accounting, Finance and Law; Information Science and Humanities; Management; and Workplace Learning and Development are integrated within a single faculty at its Lower Hutt campus. There are business centres in Auckland, Wellington and Christchurch.
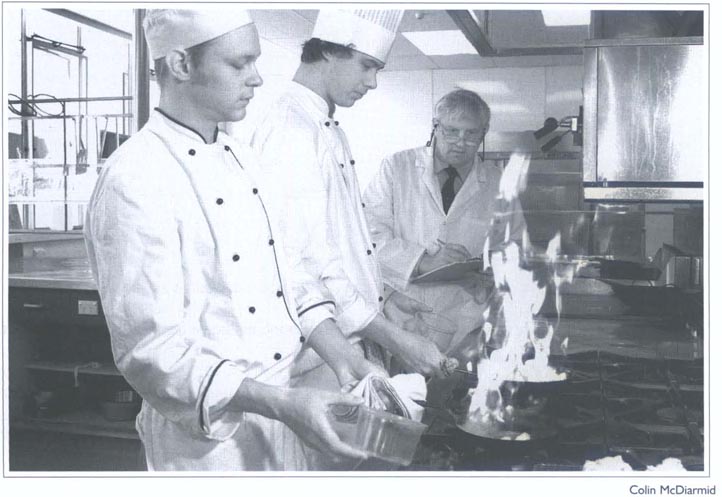
New Zealand's 20 polytechnics provide a diverse range of vocational programmes.
The Open Polytechnic offers more than 1,300 courses and 150 programmes, ranging from national certificate to diploma and degree level. It consults closely with industry and other stakeholders to ensure qualifications are directly related to the requirements of the workplace, now and in the future. All degrees and their majors are approved by the New Zealand Qualifications Authority.
As well as supporting individual learners, the Open Polytechnic offers a range of flexible learning design services for public and private sector organisations and industry. It also works in a variety of partnership arrangements with other tertiary providers. The Open Polytechnic's website is www.openpolytechnic.ac.nz
There are large numbers of private training establishments (PTEs) in New Zealand, of which about 900 are registered with the New Zealand Qualifications Authority (NZQA).
PTEs which enrol foreign students are required by law to have course approval and accreditation from NZQA and to have course approvals for courses of more than three months duration. Legislation provides protection for foreign students who pay tuition fees in advance.
PTEs offer a wide range of courses, often in niche markets. Despite their limited number of funded equivalent full-time student places, PTEs operating in provincial towns offer improved access to tertiary education, rather than actual competition for the state tertiary institutions. PTE courses that receive state funding are subject to similar standards of accountability as state-funded courses at universities, polytechnics and colleges of education.
Tables 9.07, 9.08 and 9.09 show the number of enrolments at tertiary institutions and the qualifications obtained by students in 2002.
Table 9.07. Enrolments at tertiary institutionsBy field of study At 31 July 2002
| Field of study | Enrolment level | Total by gender | Grand total | ||||||||
|---|---|---|---|---|---|---|---|---|---|---|---|
| Post-graduate | Degree | Diploma | Certificate | ||||||||
| Female | Male | Female | Male | Female | Male | Female | Male | Female | Male | ||
| Source: Ministry of Education | |||||||||||
| Natural and physical sciences | 1,366 | 1,456 | 6,152 | 7,256 | 181 | 161 | 914 | 546 | 8,613 | 9,419 | 18,032 |
| Information technology | 182 | 306 | 1,074 | 3,133 | 1,038 | 2,706 | 10,074 | 6,507 | 12,368 | 12,652 | 25,020 |
| Engineering and related technologies | 129 | 489 | 1,456 | 4,774 | 322 | 3,276 | 1,168 | 10,307 | 3,075 | 18,846 | 21,921 |
| Architecture and building | 29 | 56 | 1,354 | 1,458 | 359 | 1,172 | 897 | 2,426 | 2,639 | 5,112 | 7,751 |
| Agriculture and environmental studies | 315 | 289 | 565 | 811 | 477 | 596 | 1,788 | 4,054 | 3,145 | 5,750 | 8,895 |
| Health | 2,121 | 721 | 9,563 | 2,416 | 2,729 | 457 | 2,436 | 623 | 16,849 | 4,217 | 21,066 |
| Education | 1,546 | 445 | 9,649 | 2,341 | 5,080 | 822 | 2,850 | 889 | 19,125 | 4,497 | 23,622 |
| Management and commerce | 3,027 | 2,927 | 15,615 | 13,893 | 8.806 | 5,245 | 14,498 | 7465 | 41,946 | 29,530 | 71,476 |
| Society and culture | 3,902 | 1,979 | 20,928 | 11,204 | 11,053 | 5,848 | 10,855 | 6,347 | 46,738 | 25,378 | 72,116 |
| Creative Arts | 413 | 283 | 4,172 | 2,346 | 2,440 | 1,395 | 1,917 | 1,740 | 8,942 | 5,764 | 14,706 |
| Food, hospitality and personal services | - | - | 80 | 38 | 656 | 243 | 4,535 | 1,779 | 5,271 | 2,060 | 7,331 |
| Mixed field programmes | 1,873 | 1,962 | 2,457 | 1,561 | 270 | 233 | 21,293 | 12,828 | 25,893 | 16,584 | 42,477 |
| Total enrolments | 14,903 | 10,913 | 73,065 | 51,231 | 33,411 | 22,154 | 73,225 | 55,511 | 194,604 | 139,809 | 334,413 |
| Adjustment for multiple enrolments | 243 | 179 | 2,242 | 1,533 | 1347 | 933 | 4,865 | 3,185 | 8,697 | 5,830 | 14,527 |
| Total students | 14,660 | 10,734 | 70,823 | 49,698 | 32,064 | 21,221 | 68,360 | 52,326 | 185,907 | 133,979 | 319,886 |
Table 9.08. Qualification completions in 2002By award level, sector and gender
| Award level | Polytechnics | Colleges of Education | Universities | Wananga | Total gender | Grand total | |||||
|---|---|---|---|---|---|---|---|---|---|---|---|
| Female | Male | Female | Male | Female | Male | Female | Male | Female | Male | ||
- nil or zero Source: Ministry of Education | |||||||||||
| Doctorate | - | - | - | - | 247 | 274 | - | - | 247 | 274 | 521 |
| Masters/honours | 85 | 36 | 28 | 3 | 2,661 | 2,018 | 2 | 5 | 2,776 | 2,062 | 4,838 |
| Post-graduate diploma/certificate | 83 | 31 | 34 | 9 | 2,383 | 1,645 | 3 | 3 | 2,503 | 1,688 | 4,191 |
| Bachelors/advanced diploma | 2,468 | 1,011 | 2,168 | 609 | 10,877 | 7,815 | 91 | 33 | 15,604 | 9,468 | 25,072 |
| Diploma | 3,106 | 1,841 | 647 | 150 | 1,304 | 852 | 2,901 | 1,260 | 7,958 | 4,103 | 12,061 |
| Certificate | 14,259 | 10,001 | 305 | 53 | 3,524 | 2,453 | 3,996 | 1,102 | 22,084 | 13,609 | 35,693 |
| Total qualifications completed | 20,001 | 12,920 | 3,182 | 824 | 20,996 | 15,057 | 6,993 | 2,403 | 51,172 | 31,204 | 82,376 |
| Adjustment for multiple completions | 662 | 590 | 106 | 41 | 1,210 | 832 | 333 | 155 | 2,311 | 1,618 | 3,929 |
| Total students | 19,339 | 12,330 | 3,076 | 783 | 19,786 | 14,225 | 6,660 | 2,248 | 48,861 | 29,586 | 78,447 |
Table 9.09. Qualification completions in 2002By field of study, award level and gender
| Field of study | Award level | Total gender | Grand total | ||||||||||||
|---|---|---|---|---|---|---|---|---|---|---|---|---|---|---|---|
| Doctorate | Masters/Honours | Post graduate diploma/Certificate | Bachelors/Advanced diploma | Diploma | Certificate | ||||||||||
| Female | Male | Female | Male | Female | Male | Female | Male | Female | Male | Female | Male | Female | Male | ||
- nil or zero Source: Ministry of Education | |||||||||||||||
| Natural and physical sciences | - | 3 | 480 | 416 | 151 | 233 | 1,321 | 1,305 | 44 | 45 | 152 | 83 | 2,148 | 2,085 | 4,233 |
| Information technology | - | - | 11 | 21 | 30 | 59 | 199 | 454 | 188 | 401 | 1,349 | 1,138 | 1,777 | 2,073 | 3,850 |
| Engineering and related technologies | - | 1 | 64 | 167 | 13 | 26 | 324 | 836 | 54 | 302 | 396 | 1,913 | 851 | 3,245 | 4,096 |
| Architecture and building | - | - | 14 | 19 | - | 1 | 237 | 288 | 45 | 85 | 76 | 956 | 372 | 1,349 | 1,721 |
| Agriculture and environmental studies | - | - | 59 | 42 | 69 | 70 | 69 | 177 | 97 | 170 | 348 | 771 | 642 | 1,230 | 1,872 |
| Health | 2 | 6 | 239 | 68 | 812 | 304 | 2,347 | 511 | 395 | 59 | 5,596 | 1,722 | 9,391 | 2,670 | 12,061 |
| Education | 5 | 3 | 187 | 37 | 388 | 130 | 3,512 | 944 | 1,366 | 329 | 564 | 94 | 6,022 | 1,537 | 7,559 |
| Management and commerce | - | - | 499 | 589 | 605 | 589 | 2,743 | 2,533 | 1,400 | 625 | 2,739 | 930 | 7,986 | 5,266 | 13,252 |
| Society and culture | - | 1 | 1,085 | 610 | 218 | 125 | 3,849 | 1,917 | 3,394 | 1,547 | 2,926 | 1,809 | 11,472 | 6,009 | 17,481 |
| Creative arts | 1 | - | 134 | 89 | 49 | 31 | 884 | 474 | 650 | 378 | 779 | 568 | 2,497 | 1,540 | 4,037 |
| Food, hospitality and personal services | - | - | - | - | - | - | 8 | - | 163 | 59 | 1,839 | 1,010 | 2,010 | 1,069 | 3,079 |
| Mixed field programmes | 239 | 260 | 4 | 4 | 168 | 120 | 111 | 29 | 162 | 103 | 5,320 | 2,615 | 6,004 | 3,131 | 9,135 |
| Total qualifications completed | 247 | 274 | 2,776 | 2,062 | 2,503 | 1,688 | 15,604 | 9,468 | 7,958 | 4,103 | 22,084 | 13,609 | 51,172 | 31,204 | 82,376 |
| Adjustment for multiple completions | 6 | 1 | 153 | 91 | 141 | 83 | 678 | 466 | 350 | 241 | 983 | 736 | 2,311 | 1,618 | 3,929 |
| Total students | 241 | 273 | 2,623 | 1,971 | 2,362 | 1,605 | 14,926 | 9,002 | 7,608 | 3,862 | 21,101 | 12,873 | 48,861 | 29,586 | 78,447 |
New Zealand Certificates in Engineering (NZCE). NZCEs are in the process of being phased out and have been replaced by National Diplomas. No new enrolments are being accepted for NZCE, but existing candidates can complete their qualification at some accredited tertiary education providers on a full or part-time basis. Distance learning courses may also be available. New Zealand Certificates require students to complete three years suitable work experience. The New Zealand Qualifications Authority is responsible for prescriptions for NZCE subjects, for maintenance of the national database of results and for certification of the qualification.
New Zealand Certificates. A number of other New Zealand Certificates have now been replaced by National Diplomas. Courses for these qualifications are no longer available, but subjects may be completed through processes such as recognition of prior learning. A diploma may still be awarded when a student completes the requirements for the qualification - usually the work experience requirement. However, there is a final date when each of these diplomas can be awarded.
New Zealand Diploma in Business (NZDipBus). NZDipBus is a generic business qualification, endorsed by a number of industries such as accounting, marketing, tourism, banking, and management. Courses for the qualification are available at a number of accredited tertiary education providers. Most papers are of one semester (half year) duration and may be completed through full or part-time study. The New Zealand Qualifications Authority is the owner of NZDipBus and is responsible for establishing and maintaining regulations for the qualification; maintaining a national database of results and issuing results notices; maintaining national records; development and maintenance of prescriptions; management of the national external moderation system; and certification of the qualification. Accredited training providers may award the New Zealand Diploma in Business in conjunction with the New Zealand Qualifications Authority.
National Certificates and National Diplomas. National Certificates and National Diplomas are standard-based qualifications registered on the National Qualifications Framework (NQF). Generally, National Certificates are registered at Levels 1-4 of the NQF and National Diplomas are registered at Levels 5 or 6. National Certificates and National Diplomas are developed by Industry Training Organisations or other approved national industry bodies. Training for these qualifications occurs on-job, off-job or in a mixture of these depending on the qualification. National Certificates (and in a few cases National Diplomas) have replaced Trade Certificates and Advanced Trade Certificates in nearly every industry.
Other qualifications. A wide range of other vocational qualifications are available, including qualifications developed and administered by polytechnics and other tertiary training providers, national bodies such as the New Zealand Institute of Management and the Royal New Zealand Air Force, and private training providers. Responsibility for all aspects of these qualifications lies with the appropriate body.
Overseas students who want to study in New Zealand can get information about courses of study, academic entry requirements and fees by visiting www.mynzed.com, a New Zealand Government office in the student's home country, or by writing directly to the education institution they wish to attend. A student visa is required for any course of study longer than three months. International students wishing to enrol with a tertiary institution (including a private training establishment) should check that the course they intend to enrol in is an approved course and that the institution has accreditation to deliver that course. This information is available from the New Zealand Qualifications Authority at www.nzqa.govt.nz. Any New Zealand education institution enrolling international students must be a signatory to the Code of Practice for the Pastoral Care of International Students. The code requires education institutions to have measures in place to promote the welfare and safety of international students. For example, the code sets minimum standards in areas such as recruitment and enrolment, medical and travel insurance, support services, accommodation and grievance procedures. Further information on the code is available from the Ministry of Education at www.minedu.govt.nz/goto/international. Individual institutions set their own academic entrance requirements and fees. Some allow payment of annual fees by instalment. Student visas and permits are issued for the period for which fees have been paid. International students are not entitled to student loans or student allowances. As Table 9.10 shows, the number of students coming to study in New Zealand increased 36.6 percent in the year ending 31 March 2003.
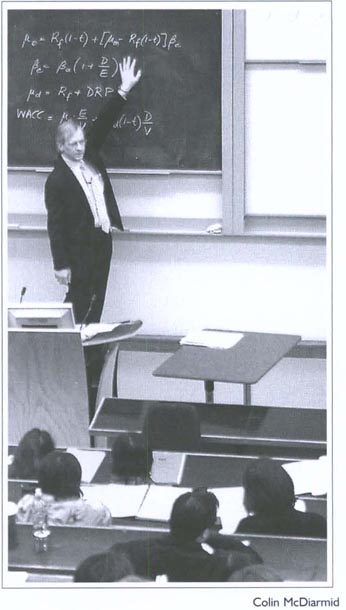
A mathematics lecture for university students.
Table 9.1. International students studying in New Zealand1,2
| Category | 1999 | 2000 | 2001 | 2002 | 2003 |
|---|---|---|---|---|---|
1All figures independently rounded. 2Regardless of length of stay. 3Ministry of Education, as at 1 July. 4Ministry of Education, as at 31 July. 5Survey of English Language Providers, Statistics New Zealand; year ending 30 June for 1999 and 2000, year ending 31 March from 2001. Note:Figures may not add to stated totals due to rounding. Sources: Ministry of Education Statistics New Zealand | |||||
| Primary and secondary students3 | 5,700 | 8,800 | 7,900 | 11,100 | 8,500 |
| Tertiary students4 | 7,900 | 10,500 | 10,400 | 16,400 | 18,700 |
| Students at English language providers5 and on study tours | 21,000 | 23,400 | 31,500 | 47,000 | 74,800 |
| Total | 34,600 | 42,700 | 49,800 | 74,600 | 101,900 |
Table 9.11. Full-time equivalent teaching staff at educational institutions At 1 July
| Institution | 1998 | 1999 | 2000 | 2001 | 2002 |
|---|---|---|---|---|---|
- not available Source: Ministry of Education | |||||
| Licensed early childhood services | |||||
| Kindergartens | 1,607 | 1,625 | 1,617 | 1,643 | 1,644 |
| Playcentres (includes unpaid adults on duty) | 1,336 | 1,314 | 1,251 | 1,182 | 1,174 |
| Education and care services - regular and casual | 6,841 | 7,344 | 7,854 | 8,212 | 8,734 |
| Home-based services - coordinators | 236 | 242 | 271 | 258 | 265 |
| Correspondence School | 24 | 24 | 20 | 25 | 29 |
| Te kohanga reo | .. | .. | .. | .. | .. |
| Primary schools | |||||
| State | 22,681 | 22,740 | 22,957 | 23,362 | 23,358 |
| Private | 438 | 397 | 401 | 452 | 465 |
| Composite schools | |||||
| State | 1,158 | 1,311 | 1,406 | 1,485 | 1,572 |
| Private | 920 | 981 | 937 | 959 | 1,016 |
| Secondary schools | |||||
| State | 14,663 | 14,842 | 15,083 | 1,5374 | 15,596 |
| Private | 565 | 482 | 512 | 596 | 615 |
| Special schools | |||||
| State | 491 | 556 | 663 | 743 | 764 |
| Private | 11 | .. | .. | .. | .. |
| Correspondence School | |||||
| Primary and secondary | 413 | 357 | 299 | 318 | 290 |
| Tertiary education providers - academic staff | |||||
| Public tertiary education institutions | |||||
| Polytechnics | 4,849 | 4,932 | 4,035 | 3,999 | 4,323 |
| Colleges of education | 481 | 497 | 505 | 475 | 485 |
| Universities | 4,973 | 5,008 | 5,936 | 6,103 | 6,365 |
| Wananga | 107 | 109 | 156 | 237 | 526 |
| Private tertiary education providers | 2,816 | 2,836 | 3,290 | 3,753 | 4,119 |
Table 9.12. Formal education institutions and students enrolled At 1 July
| Institutions | 1998 | 1999 | 2000 | 2001 | 2002 | |||||
|---|---|---|---|---|---|---|---|---|---|---|
| Number | Students | Number | Students | Number | Students | Number | Students | Number | Student | |
1Early Childhood Development. 2Included in playgroups before 2001. 3Student numbers estimated for 1998 and 1999. 4Figures may not add to stated totals due to rounding. 5In 2000, Wellington Polytechnic became part of Massey University and Auckland Institute of Technology changed from polytechnic to university status. 6Institution numbers count only those institutions that have formal students enrolled. not applicable Source: Ministry of Education | ||||||||||
| Licensed early childhood services | ||||||||||
| Kindergartens | 596 | 46,307 | 598 | 45,993 | 600 | 45,869 | 603 | 45,439 | 606 | 45,169 |
| Playcentres | 537 | 16,787 | 523 | 16,261 | 517 | 15,808 | 503 | 14,786 | 492 | 14,879 |
| Education and care services | 1,332 | 65,205 | 1,403 | 68,132 | 1,476 | 71,231 | 1,558 | 73,192 | 1,612 | 76,246 |
| Casual education and care (no regular roll) | 44 | .. | 44 | .. | 45 | .. | 39 | .. | 38 | .. |
| Homebased services | 150 | 8,300 | 171 | 8,498 | 180 | 8,937 | 184 | 8,546 | 194 | 8,591 |
| Te kohanga reo | 613 | 11,689 | 600 | 11,859 | 583 | 11,138 | 562 | 9,594 | 545 | 10,389 |
| Correspondence School | 1 | 1,044 | 1 | 1,097 | 1 | 984 | 1 | 947 | 1 | 913 |
| 3,273 | 149,332 | 3,340 | 151,840 | 3,402 | 153,967 | 3,450 | 152,504 | 3,488 | 156,187 | |
| License-exempt early childhood education services | ||||||||||
| ECD1 funded playgroups | 557 | 17,630 | 596 | 16,629 | 592 | 16,949 | 561 | 15,457 | 541 | 15,002 |
| ECD1 funded nga puna kohungahunga2 | 20 | 209 | 24 | 351 | ||||||
| ECD1 funded Pacific peoples language groups | 170 | 3,599 | 138 | 2,948 | 127 | 2,576 | 127 | 2,545 | 133 | 2,914 |
| ECD1 funded playcentres | 26 | 433 | 24 | 388 | 25 | 372 | 31 | 404 | 28 | 371 |
| Te kohanga reo | 33 | 361 | 50 | 524 | 29 | 381 | 24 | 214 | 14 | 138 |
| 786 | 22,023 | 808 | 20,489 | 773 | 20,278 | 763 | 18,829 | 740 | 18,776 | |
| EARLY CHILDHOOD TOTAL | 4,059 | 171,355 | 4,148 | 172,329 | 4,175 | 174,245 | 4,213 | 171,333 | 4,228 | 174,963 |
| Primary schools | ||||||||||
| State full primary | 1,211 | 166,481 | 1,205 | 168,397 | 1,189 | 170,070 | 1,186 | 169,654 | 1,177 | 171,121 |
| State contributing | 879 | 219,138 | 864 | 216,723 | 854 | 215,509 | 843 | 213,213 | 833 | 212,291 |
| State intermediate | 136 | 56,180 | 133 | 57,086 | 133 | 58,852 | 132 | 60,382 | 130 | 63,507 |
| Private primary and intermediate | 56 | 6,286 | 51 | 5,634 | 44 | 5,773 | 48 | 6,242 | 48 | 6,327 |
| 2,282 | 448,085 | 2,253 | 447,840 | 2,220 | 450,204 | 2,209 | 449,491 | 2,188 | 453,246 | |
| Composite schools | ||||||||||
| State composite | 63 | 17,623 | 69 | 19,594 | 78 | 21,084 | 82 | 21,861 | 85 | 22,534 |
| State correspondence | 1 | 10,914 | 1 | 9,556 | 1 | 8,119 | 1 | 8,839 | 1 | 9,135 |
| Private composite | 37 | 11,812 | 43 | 12,547 | 41 | 11,734 | 43 | 12,004 | 46 | 12,767 |
| 101 | 40,349 | 113 | 41,697 | 120 | 40,937 | 126 | 42,704 | 132 | 44,436 | |
| Secondary schools | ||||||||||
| State Year 9-15 | 237 | 189,930 | 233 | 190,160 | 232 | 189,979 | 232 | 191,983 | 229 | 198,725 |
| State Year 7-15 | 83 | 37,548 | 87 | 39,423 | 88 | 39,871 | 87 | 39,997 | 86 | 40,770 |
| Private Year 7-15 and Year 9-15 | 23 | 6,696 | 15 | 6,280 | 16 | 6,585 | 17 | 7,501 | 17 | 8,498 |
| 343 | 234,174 | 335 | 235,863 | 336 | 236,435 | 336 | 239,481 | 332 | 247,993 | |
| Special schools | ||||||||||
| State | 43 | 1,759 | 43 | 1.855 | 45 | 2,010 | 46 | 2,215 | 46 | 2,379 |
| Private | 1 | 42 | 0 | 0 | 0 | 0 | 0 | 0 | 0 | 0 |
| Other Vote: Education | 4 | 170 | 3 | 141 | 3 | 103 | 1 | 33 | 1 | 30 |
| 48 | 1,971 | 46 | 1,996 | 48 | 2,113 | 47 | 2,248 | 47 | 2,409 | |
| SCHOOL TOTAL | 2,774 | 724,579 | 2,747 | 727,396 | 2,724 | 729,689 | 2,718 | 733,924 | 2,699 | 748,084 |
| HOME SCHOOLING | .. | 5,274 | .. | 5,451 | .. | 5,877 | .. | 5,976 | .. | 6,173 |
| Tertiary education providers3 | ||||||||||
| Public tertiary education institutions4 | ||||||||||
| Polytechnics5 | 25 | 101,400 | 25 | 100,000 | 23 | 87,436 | 22 | 87,965 | 20 | 95,782 |
| Universities5 | 7 | 108,000 | 7 | 106,000 | 8 | 122,727 | 8 | 125,668 | 8 | 132,396 |
| Colleges of education | 4 | 11,800 | 4 | 12,800 | 4 | 12,045 | 4 | 10,884 | 4 | 10,788 |
| Wananga | 3 | 1,200 | 3 | 1,900 | 3 | 2,972 | 3 | 11,278 | 3 | 27,535 |
| 39 | 222,300 | 39 | 220,700 | 38 | 225,180 | 37 | 235,795 | 35 | 266,501 | |
| Private tertiary education providers6 | 457 | 28,700 | 441 | 33,100 | 452 | 39,173 | 455 | 51,666 | 506 | 53,385 |
| TERTIARY TOTAL | 496 | 251,000 | 480 | 253,800 | 490 | 264,353 | 492 | 287,461 | 541 | 319,886 |
Table 9.13. Education 1875-2002
| Year1 | Early childhood education | Primary | Secondary | University students | Polytechnic students7 | College of education students | Wananga students | Private training establishment students | |||
|---|---|---|---|---|---|---|---|---|---|---|---|
| Providers2 | Students | Schools3,4 | Students | Schools5,6 | Students | ||||||
1Year ending 31 December until 1925. thereafter as at 1 July. Figures from 1994 on have been revised and are not comparable with previous years. 2Early childhood figures include only playcentres and kindergartens until 1990, after which they also include childcare, kohanga reo and Pacific peoples language groups. 3Primary includes Year 1-8 students at all schools. 4Includes full primary, contributing, intermediate and special schools. 5Secondary includes Year 9-15 students at all schools. 6Includes secondary and composite schools. 7Prior to 1990. polytechnic figures included all students attending polytechnic. From 1990, they include only those attending on 31 July. .. not available ... not applicable Source: Ministry of Education | |||||||||||
| (000) | (000) | (000) | |||||||||
| 1875 | .. | .. | 830 | 54.2 | 4 | .. | ... | ... | ... | ... | ... |
| 1880 | .. | .. | 1,171 | 95.2 | 14 | 1.6 | 211 | ... | ... | ... | ... |
| 1885 | .. | .. | 1,363 | 116.5 | 24 | 2.6 | 442 | ... | ... | ... | ... |
| 1890 | .. | .. | 1,566 | 134.1 | 22 | 2.1 | 596 | ... | ... | ... | ... |
| 1895 | .. | .. | 1,831 | 145.8 | 24 | 2.5 | 742 | ... | ... | ... | ... |
| 1900 | .. | .. | 2,157 | 149.4 | 86 | 6.9 | 805 | ... | ... | ... | ... |
| 1905 | .. | .. | 2,192 | 158.1 | 86 | 6.9 | 1,153 | ... | 211 | ... | ... |
| 1910 | .. | .. | 2,508 | 179.6 | 94 | 9.1 | 1,862 | ... | 380 | ... | ... |
| 1915 | .. | .. | 2,765 | 210.8 | 129 | 11.5 | 2,039 | ... | 390 | ... | ... |
| 1920 | .. | .. | 2,777 | 225.3 | 131 | 15.4 | 3,822 | ... | 680 | ... | ... |
| 1925 | .. | .. | 2,995 | 247.3 | 181 | 23.2 | 4,442 | ... | 1,271 | ... | ... |
| 1930 | .. | .. | 3,045 | 252.6 | 209 | 31.0 | 4,801 | ... | 1,155 | ... | ... |
| 1935 | .. | .. | 2,950 | 232.3 | 216 | 31.9 | 5,101 | ... | 429 | ... | ... |
| 1940 | .. | .. | 2,656 | 243.3 | 234 | 36.1 | 5,528 | ... | 1,457 | ... | ... |
| 1945 | .. | .. | 2,874 | 252.5 | 248 | 46.9 | 8,425 | ... | 1,431 | ... | ... |
| 1950 | .. | .. | 2,377 | 304.6 | 269 | 53.7 | 11,515 | ... | 2,684 | ... | ... |
| 1955 | .. | .. | 2,423 | 365.4 | 313 | 80.8 | 10,851 | ... | 2,847 | ... | ... |
| 1960 | .. | .. | 2,517 | 425.0 | 354 | 111.4 | 15,809 | 7,663 | 3,828 | ... | ... |
| 1965 | .. | 27.8 | 2,594 | 472.9 | 376 | 157.9 | 22,145 | 29,074 | 4,790 | ... | ... |
| 1970 | .. | 41.1 | 2,595 | 516.7 | 386 | 186.8 | 31,908 | 43,204 | 7,587 | ... | ... |
| 1975 | 1,098 | 54.8 | 2,542 | 525.3 | 408 | 219.7 | 35,499 | 56,098 | 8,004 | ... | ... |
| 1980 | 1,208 | 56.9 | 2,595 | 507.9 | 394 | 226.3 | 43,933 | 73,067 | 5,919 | ... | ... |
| 1985 | 1,389 | 60.7 | 2,641 | 452.4 | 403 | 230.9 | 59,123 | 76,054 | 2,703 | ... | ... |
| 1990 | 2,890 | 118.4 | 2,460 | 420.4 | 400 | 230.2 | 78,919 | 56,771 | 5,766 | ... | ... |
| 1995 | 3,824 | 159.4 | 2,368 | 448.2 | 430 | 236.6 | 104,389 | 95,664 | 10,156 | 726 | ... |
| 2000 | 4,175 | 174.2 | 2,268 | 484.2 | 456 | 245.5 | 122,727 | 87,436 | 12,045 | 2,972 | 39,173 |
| 2001 | 4,213 | 171.3 | 2,256 | 451.7 | 462 | 282.2 | 125,668 | 87,965 | 10,884 | 11,278 | 51,666 |
| 2002 | 4,228 | 175.0 | 2,235 | 455.7 | 464 | 292.4 | 132,396 | 95,782 | 10,788 | 27,535 | 53,385 |
9.1 Ministry of Education.
9.2 Ministry of Education; New Zealand Qualifications Authority.
9.3 Ministry of Education; New Zealand Qualifications Authority; Education Review Office; Learning Media Ltd; New Zealand Teachers' Council.
9.4 Ministry of Education; Ministry of Social Development; Statistics New Zealand; Tertiary Education Commission.
9.5 Ministry of Education; Maori Education Trust.
9.6 Ministry of Education.
9.7 Ministry of Education; Correspondence School; New Zealand Qualifications Authority.
9.8 Ministry of Education; The Open Polytechnic; New Zealand Qualifications Authority; Tertiary Education Commission.
9.9 Ministry of Education.
9.10 Ministry of Education.
www.careers.govt.nz - Career Services
www.correspondence.school.nz
- The Correspondence School
www.ero.govt.nz
- Education Review Office
www.learningmedia.co.nz - Learning Media Ltd
www.maorieducation.org.nz - Maori Education Trust
www.minedu.govt.nz - Ministry of Education www.msd.govt.nz
- Ministry of Social Development www.nrc.org.nz
- National Resource Centre for Adult
Education and Community Learning
www.nzcer.org.nz
- New Zealand Council for Educational Research
www.nzqa.govt.nz
- New Zealand Qualifications Authority
www.teacherscouncil.govt.nz
- New Zealand Teachers' Council
www.studylink.govt.nz - StudyLink
www.tec.govt.nz
- Tertiary Education Commission
www.winz.govt.nz - Work and Income
Table of Contents
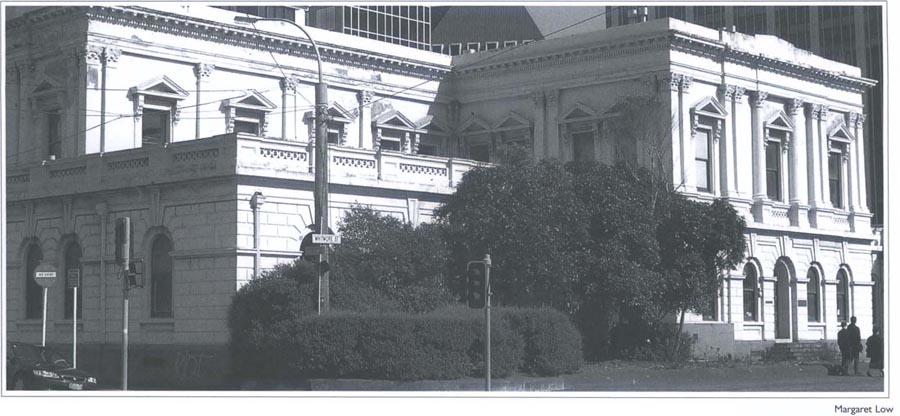
The new Supreme Court of New Zealand will eventually be located in the remodelled former Wellington High Court building.
The fundamental tenet of the New Zealand system of government - based on the Westminster model - is that the judiciary, the executive and the legislature must be kept separate from each other to provide checks and balances within the system and to ensure that accountability and impartiality are maintained.
Judges, appointed by the governor-general, make decisions by interpreting laws passed by parliament. Parliament passes laws which reflect the intention or interests of citizens collectively and these are enforced by the judiciary as the formal expression of society's standards.
Should a series of judicial decisions manifest an interpretation of legislation which the executive (cabinet ministers and government departments) considers does not reflect the intention of parliament, the executive may initiate changes to the legislation, but may not direct or request the judiciary to revise or reconsider a decision.
Similarly, the judiciary is not expected to comment publicly on whether a policy is good or bad, or to have a view on what policies should be amended or written into legislation.
High court judges, which include court of appeal and supreme court judges, can be removed from office only by the Sovereign or the governor-general acting upon an address of the House of Representatives on the grounds of misbehaviour or incapacity.
District court judges may be removed from office by the governor-general on the grounds of inability or misbehaviour. No person may be appointed a judge unless he or she has held a practising certificate as a barrister or solicitor for at least seven years. In practice, those appointed to the judiciary have practised law for longer than seven years. The retirement age is 68, although former judges may be reappointed as acting or temporary judges for up to four years, or one year if the judge is 72 or over when reappointed. In the supreme court, an acting judge can be appointed for a term of up to two years as long as that judge has not reached the age of 75.
Ministry of Justice Te Manatu Ture. The Ministry of Justice is unique in the New Zealand public sector in that as part of the executive it provides services to the independent arm of government, the judiciary. As well as providing advice on appointments to the judiciary, the ministry provides leadership across the whole of the justice sector; research, evaluation and advice on justice-related matters for ministers and other departments; and negotiates and advises on settlement of Treaty of Waitangi claims. Through the Chief Electoral Office, the ministry is responsible for the conduct of parliamentary elections and referenda. The ministry provides advice to the attorney-general on consistency between proposed legislation and the New Zealand Bill of Rights Act 1990. The ministry also monitors and provides advice (including advice on appointments) to the Minister of Justice on Crown entities and other bodies funded through Vote: Justice. The ministry's website is www.justice.govt.nz
The Supreme Court of New Zealand, established from 1 January 2004, heads the hierarchy of New Zealand courts. Below the supreme court is the New Zealand Court of Appeal, the New Zealand High Court and district courts, being the main courts that exercise general criminal and civil jurisdiction. There are also a number of courts and tribunals that have jurisdiction over specific areas of law, with rights of appeal to one or more of the four main courts.
The Judicial Committee of the Privy Council. The right to appeal from New Zealand-based courts to the United Kingdom-based Judicial Committee of the Privy Council was abolished on 1 January 2004 with establishment of the Supreme Court of New Zealand. However, under the Supreme Court Act 2003, certain appeals can continue to be determined by the privy council. These are:
Appeals made to the privy council before 1 January 2004.
Appeals arising out of successful applications made before 1 January 2004 to New Zealand courts for leave to appeal to the privy council.
Appeals arising out of successful applications made before 1 January 2004 to the privy council for special leave to appeal to it.
Appeals arising out of successful applications to the privy council for special leave to appeal to it made after a New Zealand court has, before 1 January 2004, refused leave to appeal.
In these cases, parties to an appeal can waive their appeal to the privy council if the privy council has not begun hearing the appeal and the parties agree in writing that an application should be made to the Supreme Court of New Zealand for leave to appeal to the supreme court against the decision concerned.
The New Zealand Court of Appeal. As New Zealand's principal intermediate appellate court, the New Zealand Court of Appeal has existed as an independent court since 1862 and is constituted by the Judicature Act 1908. Until 1957, it was composed of judges of the supreme court (as the high court was known then) sitting periodically in panels. In 1957, the court was reconstituted as a permanent, separate court.
The primary function of the court is to determine civil and criminal appeals from the high court and from indictable criminal proceedings in district courts, and appeals on questions of law from the employment court. As well, matters appealed to the high court from a district court can be taken to the court of appeal with leave if they are considered to be of sufficient significance to warrant a second appeal. The court also has some original jurisdiction.
The full-time working membership of the court consists of a judge of the high court appointed by the governor-general as its president; and six other judges of the high court appointed by the governor-general as judges of the court of appeal. Additional judges of the high court may be nominated by the chief justice to sit on the court of appeal.
The judges of the court of appeal are also judges of the high court. They have seniority over all other high court judges, except the chief justice, or the judges of the Supreme Court of New Zealand. The court of appeal may remit any proceedings pending before it to the high court and all its judgments, decrees and orders may be enforced by the high court.
New Zealand High Court. The New Zealand High Court was first established (as the New Zealand Supreme Court) in 1841. It has all the jurisdiction which may be necessary for a court to administer the laws of New Zealand. The high court's jurisdiction includes the most serious types of crimes, admiralty proceedings, important civil claims, appeals from lower courts and tribunals, and reviews of administrative actions. The high court also has inherent power to punish for contempt of court.
It consists of the chief justice and 43 other judges (including the judges of the supreme court and court of appeal), as prescribed by the Judicature Act 1908: An additional judge or judges may be appointed by the governor-general when it is deemed necessary due to the illness, absence or anticipated absence of any judge.
Judges of the high court are stationed in Auckland, Wellington and Christchurch, but also travel on circuit to Whangarei, Hamilton, Rotorua, Gisborne, Napier, New Plymouth, Wanganui, Palmerston North, Blenheim, Nelson, Greymouth, Timaru, Dunedin and Invercargill. There are high court offices at Masterton and Tauranga, but the court does not sit in those areas.
Table 10.01 lists judges of the supreme court and court of appeal, and judges and masters of the high court at 31 March 2004.
Commercial list - Instead of being included in the normal order of cases to be heard in the high court, a separate list of commercial cases is kept to ensure they are resolved quickly. The Judicature Amendment Act 1986 made provision for establishment of this list at the office of the New Zealand High Court at Auckland for an initial period of four years. The governor-general, by notice in the New Zealand Gazette dated 26 February 1991, ordered that the commercial list at Auckland continue indefinitely.
Table 10.01. Judges of the supreme court and court of appeal, and judges and masters of the high court1
1At 31 March 2004. Source: Ministry of Justice | |
|---|---|
| Judges of the Supreme Court | Rt Hon Dame Sian Elias. Chief Justice of New Zealand Rt Hon Justice Gault Rt Hon Sir Kenneth Keith Rt Hon Justice Blanchard Rt Hon Justice Tipping |
| Judges of the Court of Appeal | Hon Justice Anderson (President) Hon Justice McGrath Hon Justice Glazebrook Hon Justice Hammond Hon Justice William Young Hon Justice Chambers Hon Justice O'Regan |
| Judges of the High Court | Wellington Rt Hon Dame Sian Elias, Chief Justice of New Zealand Hon Justice Robertson (Law Commission) Hon Justice Goddard Hon Justice Gendall Hon Justice Wild Hon Justice Durie Hon Justice Ronald Young (Executive judge) Hon Justice France Hon Justice MacKenzie Hon Justice Miller Hon Justice Doogue (Acting judge) Hon Justice Neazor (Acting judge) Hon Justice McGechan (Acting judge) |
| Masters of the High Court | Master D I Gendall Master J C A Thomson (Temporary master) |
| Judges of the High Court | Auckland Hon Justice Williams Hon Justice Baragwanath Hon Justice Salmon Hon Justice Paterson Hon Justice Potter Hon Justice Laurenson Hon Justice Randerson (Executive judge) Hon Justice Nicholson Hon Justice Rodney Hansen, Hon Justice Priestley (Liaison judge, Waikato) Hon Justice Harrison Hon Justice Heath Hon Justice Venning Hon Justice Frater Hon Justice Keane Hon Justice Cooper |
| Masters of the High Court | Master J A Faire Master G L Lang Master H Sargisson |
| Judges of the High Court | Christchurch Hon Justice John Hansen Hon Justice Panckhurst (Executive judge) Hon Justice Chisholm Hon Justice Fogarty |
| Master of the High Court | Master A P Christiansen |
Masters - There may be up to six masters of the high court with the qualifications and experience necessary for judicial appointment. Masters may exercise certain powers of the high court concurrently with high court judges. Masters deal with, among other things, applications for summary judgments, specified land transfer matters, assessment of damages where liability has been determined, and trials where only the amount of the debt or damages is in dispute. There were five permanent masters and one temporary master at 31 March 2004.
District courts. Unlike the New Zealand High Court, which is one court for New Zealand, district courts are established as separate entities in various localities. District courts are constituted under the District Courts Act 1947, which limits the number of district court judges to 123. District court judges are appointed by the governor-general, who also appoints a Chief District Court Judge. The Chief District Court Judge is responsible for ensuring the orderly and expeditious discharge of the business of district courts throughout New Zealand and also sits in court. District courts have extensive civil and criminal jurisdiction. A number of district court judges are specially warranted to preside over jury trials of criminal cases. Community Magistrates and Justices of the Peace can also sit to hear a limited number of minor criminal and traffic charges, and can conduct preliminary hearings.
New Zealand has a number of courts with specialist functions.
Employment court. The Employment court is constituted under the Employment Relations Act 2000. It consists of the Chief Judge of the Employment Court and three other judges appointed from time to time by the governor-general. Qualifications for appointment, tenure and retirement age are the same as those applying to high court judges. Employment courts are located in Auckland, Wellington and Christchurch, although they can travel to other locations.
Broadly speaking, the court has jurisdiction to deal with matters in the employment relations field. These include hearing and determining challenges to determinations of the Employment Relations Authority, hearing and determining any questions of law referred to it by the authority, hearing and determining penalties in relation to strikes and lockouts, and issuing compliance orders on specified matters.
Family courts. Family courts have been established in New Zealand since 1980 as divisions of district courts. The governor-general appoints family court judges - who are district court judges -and a Principal Family Court Judge. Family courts have jurisdiction to deal with dissolution of marriages, adoption, guardianship applications, domestic violence matters, relationship property, child support, care and protection applications in respect of children and young persons, mental health compulsory treatment applications, protection of personal property rights applications and similar matters. They may state a case on a point of law to the high court or transfer complex proceedings to that court.
Youth courts. Youth courts are divisions of district courts and are established under the Children, Young Persons and Their Families Act 1989. Every district court has a youth court. Jurisdiction of youth courts is exercised by youth court judges, who are specially-designated district court judges. The governor-general appoints a Principal Youth Court Judge. Youth courts deal with all offending committed by young people (aged 14-16), except murder, manslaughter and minor traffic offences. Youth courts do not hear matters relating to the care or protection of children and young people, which are dealt with in family courts.
Maori Land Court and Maori Appellate Court. These courts are constituted under the Te Ture Whenua Maori Act 1993 and have jurisdiction to hear matters relating to Maori land. The governor-general may from time to time appoint a chief judge and other judges of the court as required. Judges of the Maori Land Court are also judges of the Maori Appellate Court. Three or more of the judges have power to act as the Maori Appellate Court. The Maori Land Court or the Maori Appellate Court may state a case for the opinion of the high court on any point of law arising in proceedings before it. The decision of the high court is subject to an appeal to the court of appeal. The decision of the high court or court of appeal on any case stated is binding on the Maori Land Court and the Maori Appellate Court.
Environment court. The Environment court is constituted under the Resource Management Act 1991. It consists of not more than eight environment judges at any one time. Environment commissioners are appointed by the governor-general on the recommendation of the Minister of Justice, after consultation with the Minister for the Environment and the Minister of Maori Affairs.
As currently constituted, the court has seven judges, four alternate judges, 13 commissioners and three deputy commissioners. One judge holds office as the Principal Environment Judge. The environment court is a court of record and is required to act in a judicial way. It is also accepted as an expert tribunal, which is reflected in the multi-disciplinary expertise of its members. The environment court is a people's court, with people presenting their own cases or represented as they choose. Cases can be conducted without formality as long as they are conducted fairly and efficiently. The court recognises tikanga Maori when appropriate and holds sittings as close to the location of the subject matter as convenient. The use of mediation and negotiation to settle disputes is encouraged and many cases are resolved promptly and inexpensively by these methods. The act provides for environment commissioners to conduct mediation, conciliation or other procedures designed to facilitate the resolution of any matter before the court.
The environment court, among other things, determines appeals against grants of resource consents or the conditions set for their operation, hears submissions on local and regional government authority resource management plans, makes recommendations on water conservation order applications, and makes declarations about the application and interpretation of resource management law.
Coroner's court. Coroners are judicial officers appointed under the Coroners' Act 1988. Their role is to establish, so far as is possible, the cause and circumstances of death in cases of sudden or unexplained deaths and deaths in other special circumstances. Coroners may authorise post-mortem examinations and hold inquests into deaths. The Ministry of Justice is responsible for the provision of coroner-directed post-mortem services, including payment of pathologists and contracting with service providers (hospital mortuaries).
More than 100 tribunals, authorities, boards, committees or related bodies exist in New Zealand to deal with disputes, largely between individuals, on matters such as environmental planning; economic issues; scientific and technical matters; censorship; welfare and benefits; taxation; occupational licensing and discipline; activity licensing, eg shop trading hours; and company registration.
Disputes tribunals. Disputes tribunals, previously known as small claims tribunals, are divisions of district courts with jurisdiction to determine disputes up to $7,500 based on contract, quasi-contract, or tort (in respect of the destruction or loss of any property, damage or injury to any property, or recovery of property). Claims may also be determined by the tribunal up to the value of $12,000 if the plaintiff and the defendant agree. Every district court, apart from the five courts with police registrars, has a disputes tribunal and 58 part-time referees service the 66 tribunals.
Human Rights Review Tribunal. The role of the Human Rights Review Tribunal is to deal with complaints of discrimination, breaches of privacy and breaches of patient codes of rights which have not been settled by either the human rights commissioner, the privacy commissioner, or the health and disability commissioner. The tribunal has powers similar to a district court. It hears the complaint, makes a decision and can award damages or order other remedies. Each sitting of the tribunal is chaired by a barrister or solicitor with two other appointees with experience in the area.
Tenancy Tribunal. The Tenancy Tribunal was set up under the Residential Tenancies Act 1986 to determine disputes between landlords and tenants to which the act applies. The tribunal is set up on similar lines to disputes tribunals. Hearings take place in district court premises under the authority of part-time adjudicators.
Waitangi Tribunal. The Waitangi Tribunal was established under the Treaty of Waitangi Act 1975 to consider claims by Maori under the Treaty of Waitangi. It was originally set up to consider only claims from 1975 onwards, but its jurisdiction was extended in 1985 to claims dating back to 1840.
The Law Commission Te Aka Matua o te Ture, established by the Law Commission Act 1985, is an independent, government-funded organisation, which reviews areas of the law that need updating, reforming or developing. The commission helps ensure that laws provide effectively for the current and future needs of New Zealand's changing society. Its goal is to achieve law that is just, principled, accessible and reflects the heritage and aspirations of the people of New Zealand. The commission is funded through Vote: Justice. There are six commissioners, and it employs legal researchers and support staff. It has a substantial, fully-staffed law library. The commission's recent publications, and information on its current work programme, are available on its website, www.lawcom.govt.nz
The Legal Services Agency is a Crown entity established by the Legal Services Act 2000. The agency replaced the Legal Services Board and its task is to promote access to justice for those who have the greatest need and least capacity to pay for legal services. It does this by administering, funding or sponsoring a range of legal services including:
Legal advice and representation, through legal aid, duty solicitor and police detention legal assistance schemes.
Community legal services, such as those provided by community law centres.
Production of information and education resources, prioritising those with unmet legal needs.
Research into the unmet legal needs of communities and how those needs may be met.
The agency is assisted by a public advisory committee, which advises on community concerns about legal aid, legal aid access, unmet legal needs, community law centre funding, legal information and law-related education needs and areas in need of research. Decisions on legal aid made by the agency may be referred back to the agency for reconsideration, or to an independent legal aid review panel.
Criminal legal aid. People charged with criminal offences may apply for legal aid. Not all criminal matters qualify for legal aid, as some are not considered serious enough (such as some driving offences) because they do not have serious or long-lasting consequences for defendants. People may be asked to contribute towards their legal aid, depending on their financial circumstances.
Duty solicitors. The duty solicitor scheme ensures solicitors are available at every district court to help people charged with an offence who do not have a solicitor. The service is free. The duty solicitor ensures the person charged understands basic court procedures. They also make sure the case is dealt with satisfactorily. They give advice on pleas, bail and sentencing options available to the court. They also advise on how to arrange private legal representation or legal aid.
Police Detention Legal Assistance. This scheme enables any person being questioned or detained by the police to obtain advice or assistance by telephone or in person from a lawyer. The service is free. The scheme ensures the New Zealand Bill of Rights Act 1990 is given practical effect, so those who are detained for questioning are able to obtain legal advice without delay.
Civil legal aid. Civil legal aid applies to all family matters, and to civil matters encompassing the Waitangi Tribunal and other civil proceedings, including immigration and employment. People may be asked to contribute to the cost of their legal aid, depending on their financial circumstances.
Finance. In the 2002/03 financial year, 60,815 legal aid grants were made and legal aid payments totalled $82 million (excluding GST). Payments made can relate to grants approved in previous years. Of these payments, $27 million went on family law cases, $35 million on criminal cases, $7 million on civil actions and $7 million on Waitangi Tribunal matters. A further $5 million was spent on the duty solicitor scheme and $1 million on the Police Detention Legal Assistance Scheme. Legal aid recovered from imposed contributions in the year was $7 million. Legal aid is demand driven.
Once an entitlement to assistance is established, aid must be provided. No direct control can be exercised over the number of applications submitted.
Community law centres. Community law centres (CLCs) provide legal services to those in communities with unmet legal needs, particularly those who cannot afford to pay for legal services. The number of centres in 2003 was 24, plus a pilot service in the Hutt Valley, Wellington. The centres provide free legal advice and sometimes representation, law-related education and legal information, and may work on law reform.
CLCs are funded mostly from a special fund (administered by the New Zealand Law Society) which earns revenue derived from interest income from nominated lawyers' trust accounts, plus some government funding.
Public Advisory Committee. The Legal Services Agency's Public Advisory Committee represents a range of groups, including women, Maori, Pacific peoples, young people, older people, people with disabilities, consumers, community law centres and the legal profession.
The committee provides advice to the agency on a number of matters including feedback and concerns about legal aid schemes and other services funded or delivered by the agency, unmet legal needs, funding of community law centres, research and law-related education.
Every person registered on the electoral roll is eligible for jury service, subject to some exceptions. Members of parliament, members of the judiciary, those involved in certain justice-related occupations and people who have been sentenced to certain prison sentences are not eligible to serve on a jury. A person may be excused from jury service if attendance would cause serious inconvenience or hardship.
The Crown Law Office is a government department which provides legal advice and representation services to the Crown in matters affecting the executive government, particularly in the areas of criminal, public and administrative law.
The office has two primary purposes in providing these services:
To ensure that the operations and responsibilities of the executive government are conducted lawfully.
To ensure that the government is not prevented, through legal process, from lawfully implementing its policies and discharging its governmental responsibilities.
The solicitor-general is chief executive of the Crown Law Office and is the chief legal adviser to the government, subject to any views expressed by the attorney-general. In this capacity, the solicitor-general is the government's chief advocate in the courts. In addition, the solicitor-general is responsible for conducting the prosecution of indictable crime, and also has a number of specific statutory duties and functions to perform.
The Crown Law Office is organised into three practice groups, which bring together specialist teams enabling clients to address key issues in the areas of:
Constitutional advice and litigation, including Treaty of Waitangi work, advice on international human rights obligations, bill of rights, and constitutional conventions.
The conduct of Crown prosecutions and criminal appeals.
Public law, arising, for example, out of the exercise and control of governmental power and public sector governance.
Each practice group is led by a deputy solicitor-general responsible for professional leadership and management of the client service teams within the group. A Crown counsel, in the role of team leader, has responsibility for the development and management of staff in each team and is also the principal contact point for clients. Each team is staffed with further Crown counsel, associate Crown counsel, assistant Crown counsel, and litigation and secretarial support staff.
The practice groups and their teams are:
Public Law Group - the Governmental Business Team, the Tax and Public Revenue Team and the Land and Resource Management Team.
Constitutional Law Group - the Law Officer Team, the Treaty Issues and International Law Team, the Human Rights Team and the Employment Team.
Criminal Process Group - the Criminal Process Team.
The Criminal Process Group also has responsibility for supervision and conduct of the nationwide network of Crown solicitors. Crown solicitors, private legal practitioners in the main centres of New Zealand, conduct prosecutions for indictable crime on behalf of the Crown in all high court districts.
Crown solicitors are appointed by the governor-general, on the recommendation of the attorney-general, and the Crown Solicitors Regulations 1994 provide the basis for their remuneration.
The Crown Law Office website is www.crownlaw.govt.nz
The more serious crimes in New Zealand are defined by the Crimes Act 1961. The Summary Offences Act 1981 provides for a wide variety of less serious offences. These include offences against public order, such as disorderly behaviour and fighting in a public place, and offences against persons or property, such as common assault and wilful damage.
A conviction is the most frequent outcome of a prosecution. In the five years to 2002, two-thirds of all prosecutions resulted in a conviction. The proportion has slowly declined from 73 percent in 1993. Figure 10.01 shows the proportion of convictions accounted for by each offence type from 1997 to 2002.
| Offences11878-20032 | |||
|---|---|---|---|
| Calendar year | Recorded | Resolved | Percent resolved |
1Figures before 1995 may not be comparable because they represent all offences, including traffic. 2Figures from 2000 are for years ending 30 June. .. figures not available Source: New Zealand Police | |||
| 1878 | 14,157 | .. | .. |
| 1880 | 17,837 | 16,723 | 93.8 |
| 1885 | 18,955 | 17,723 | 93.5 |
| 1890 | 13,115 | 12,177 | 92.8 |
| 1895 | 14,010 | 12,435 | 88.8 |
| 1900 | 18,358 | 17,131 | 93.3 |
| 1905 | 20,249 | 19,251 | 95.1 |
| 1910 | 25,106 | 23,949 | 95.4 |
| 1915 | 28,412 | 27,096 | 95.4 |
| 1920 | 26,106 | 24,718 | 94.7 |
| 1925 | 30,470 | 28,668 | 94.1 |
| 1930 | 37.214 | 33,690 | 90.5 |
| 1935 | 33,168 | 30,601 | 92.3 |
| 1940 | 45,009 | 41,619 | 92.5 |
| 1945 | 34,000 | 27,965 | 82.3 |
| 1950 | 35,383 | .. | .. |
| 1955 | 63,550 | .. | .. |
| 1960 | 102,792 | 66,857 | 65.0 |
| 1965 | 132,311 | 73,294 | 55.4 |
| 1970 | 165,859 | 94,785 | 57.1 |
| 1975 | 233,644 | 115,671 | 49.5 |
| 1980 | 349,193 | 166,535 | 47.7 |
| 1985 | 435,640 | 182,849 | 42.0 |
| 1990 | 488,886 | 201,942 | 41.3 |
| 1995 | 506,359 | 211,956 | 41.9 |
| 20002 | 432,354 | 174,611 | 40.4 |
| 2001 | 424,286 | 182,137 | 42.9 |
| 2002 | 436,315 | 182,468 | 41.8 |
| 2003 | 447,146 | 195,502 | 43.7 |
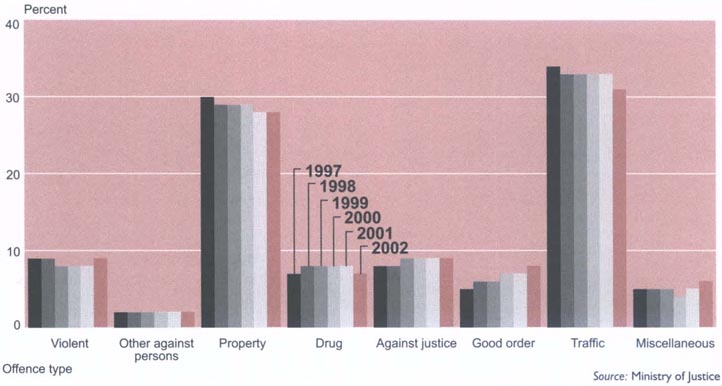
Total convictions. The annual number of convictions has been lower since 1997, partly due to the offence of failing to register a dog becoming an infringement offence. In 1996, there were 6,269 convictions for this offence, but in 2002 there were only 93. Table 10.02 shows annual convictions by type of offence from 1993 to 2002.
Table 10.02. Convictions By type of offence
| Offence type | 1993 | 1994 | 1995 | 1996 | 1997 | 1998 | 1999 | 2000 | 2001 | 2002 |
|---|---|---|---|---|---|---|---|---|---|---|
Source: Ministry of Justice | ||||||||||
| Violent | 13,095 | 15,845 | 16,714 | 16,497 | 15,683 | 16,131 | 15,287 | 14,577 | 14,693 | 14,537 |
| Other against persons | 3,185 | 3,411 | 3,708 | 3,785 | 3,496 | 3,706 | 3,686 | 3,682 | 3,702 | 3,783 |
| Property | 57,282 | 57,438 | 56,972 | 56,702 | 53,674 | 53,295 | 51,178 | 49,635 | 48,715 | 47,690 |
| Drug | 13,239 | 14,197 | 11,792 | 11,594 | 12,997 | 14,168 | 14.021 | 13,649 | 12,555 | 12,295 |
| Against justice | 12,263 | 13,022 | 13,521 | 13,902 | 14,819 | 15,685 | 15,306 | 15,465 | 15,017 | 14,997 |
| Against good order | 7,443 | 8,358 | 9,284 | 9,732 | 9,927 | 10,552 | 11,062 | 11,586 | 12,400 | 12,860 |
| Traffic | 62,178 | 59,508 | 64,024 | 63,183 | 60,502 | 62,201 | 58,785 | 57,018 | 56,573 | 54,603 |
| Miscellaneous | 19,460 | 18,767 | 16,393 | 17,001 | 9,706 | 10,101 | 9,437 | 7,663 | 9,296 | 10,234 |
| Total | 188,145 | 190,546 | 192,408 | 192,396 | 180,804 | 185,839 | 178,762 | 173,275 | 172,951 | 170,999 |
Robbery. The number of convictions for robbery showed an increasing trend between 1993 and 1998, but has dropped significantly in more recent years, almost back to the level seen at the start of the decade. The number of convictions for aggravated robbery decreased in the five years to 2002 after showing an increasing trend between 1993 and 1997. The 2002 figure of 359 was the lowest recorded in the decade.
Non-sexual assaults. The number of convictions for non-sexual assaults increased significantly between 1993 and 1995, but has generally shown a slowly decreasing trend since then. A large part of the increase in the early to mid-1990s occurred for the offence of‘male assaults female’ under section 194(b) of the Crimes Act 1961, most of which were domestic-related assaults. Statistics New Zealand suggested in a 1996 report that the increase might be due largely to changes in police practice in relation to domestic violence. Whereas police formerly attempted to mediate and reconcile the parties in domestic incidents, they now treated such incidents as family violence complaints and, barring exceptional circumstances, arrested (and prosecuted) the offender. The number of ‘male assaults female’ convictions decreased from 4,157 in 1994 to 2,630 in 2002.
Violent offences. The number of convictions for violent offences has shown a slowly decreasing trend since 1995, after a rapid increase between 1993 and 1995. In the nine years to 2002, violent offences accounted for between 8 and 9 percent of all convictions.
Violent sex offences. The total number of convictions for violent sex offences (rape, unlawful sexual connection, attempted sexual violation and indecent assault) peaked at 2,084 in 1996, but has averaged approximately 1,500 annually since then. In 2002, there were 1,562 convictions for violent sex offences. There were 185 convictions for rape in 2002, more than in the previous year. The number of convictions for indecent assault has decreased in the latter part of the decade, although there were 972 convictions for indecent assault in 2002, more than in the previous year. Table 10.03 shows the number of convictions for violent offences, including violent sex offences, from 1993 to 2002.
Table 10.03. Convictions for violent offences
| Offence type | 1993 | 1994 | 1995 | 1996 | 1997 | 1998 | 1999 | 2000 | 2001 | 2002 |
|---|---|---|---|---|---|---|---|---|---|---|
1Includes convictions for manslaughter involving the use of a motor vehicle. 2Includes both robbery and assault with intent to rob. 3Mostly assault with a weapon, wounding with intent, and injuring with intent, but also includes aggravated wounding or injury, disabling, doing dangerous act with intent, acid throwing, and poisoning with intent to cause grievous bodily harm. These offences have maximum penalties of at least five years imprisonment. 4Mostly common assault under the Crimes Act 1961, but also includes assault with intent to injure, injuring by unlawful act, and aggravated assault. 5Offences under section 194(b) of the Crimes Act 1961. 6Assault on a child under the age of 14 under section 194(a) of the Crimes Act 1961. 7Offences under section 195 of the Crimes Act 1961. Source: Ministry of Justice | ||||||||||
| Murder | 25 | 25 | 34 | 27 | 39 | 24 | 25 | 31 | 19 | 33 |
| Manslaughter1 | 38 | 23 | 38 | 36 | 28 | 45 | 28 | 23 | 32 | 31 |
| Attempted murder | 5 | 13 | 6 | 13 | 19 | 5 | 6 | 9 | 11 | 17 |
| Kidnapping/abduction | 72 | 81 | 112 | 142 | 112 | 149 | 81 | 107 | 114 | 126 |
| Rape | 238 | 247 | 327 | 302 | 210 | 253 | 207 | 131 | 169 | 185 |
| Unlawful sexual connection | 411 | 370 | 380 | 410 | 279 | 349 | 361 | 310 | 384 | 365 |
| Attempted sexual violation | 85 | 74 | 73 | 82 | 58 | 56 | 58 | 42 | 59 | 40 |
| Indecent assault | 1,099 | 1,150 | 1,112 | 1,290 | 947 | 1,054 | 968 | 794 | 818 | 972 |
| Aggravated burglary | 50 | 75 | 96 | 74 | 102 | 83 | 77 | 71 | 76 | 69 |
| Aggravated robbery | 411 | 422 | 479 | 456 | 582 | 555 | 523 | 423 | 363 | 359 |
| Robbery2 | 159 | 162 | 204 | 213 | 258 | 278 | 233 | 171 | 155 | 174 |
| Grievous assault3 | 748 | 988 | 1,157 | 1,222 | 1,209 | 1.335 | 1,258 | 1,320 | 1,303 | 1,302 |
| Serious assault4 | 2,024 | 2,586 | 2,993 | 2,964 | 3,031 | 3,239 | 3,090 | 3,247 | 3,364 | 3,345 |
| Male assaults female5 | 2,943 | 4,157 | 4,091 | 3,753 | 3,335 | 3,145 | 3,043 | 2,916 | 2,916 | 2,630 |
| Assault on a child6 | 212 | 299 | 302 | 326 | 298 | 294 | 304 | 280 | 294 | 292 |
| Minor assault | 4,036 | 4,542 | 4,688 | 4,462 | 4,432 | 4,516 | 4,245 | 3,959 | 3,848 | 3,767 |
| Threaten to kill/do grievous bodily harm | 413 | 518 | 511 | 585 | 602 | 633 | 641 | 628 | 626 | 699 |
| Cruelty to a child7 | 39 | 22 | 24 | 17 | 17 | 17 | 40 | 21 | 23 | 19 |
| Other violence | 87 | 91 | 87 | 123 | 125 | 101 | 99 | 94 | 119 | 112 |
| Total | 13,095 | 15,845 | 16,714 | 16,497 | 15,683 | 16,131 | 15,287 | 14,577 | 14,693 | 14,537 |
Assaults on children. Convictions for assaults on children aged less than 14 years (under section 194(a) of the Crimes Act 1961) have been stable since 1994, at approximately 300 convictions annually.
Assault. The number of convictions in the most serious category of assault - grievous - increased markedly between 1993 and 1998, but levelled off after that. Serious assaults generally showed an increasing trend during the decade, although the 2002 figure was slightly lower than the previous year's figure. Convictions for minor assault peaked in 1995 and have generally decreased since then.
Other convictions. Convictions for threatening to kill or do grievous bodily harm showed a strong upward trend between 1993 and 2002. The number of convictions in 2002 (699) was 69 percent higher than the number in 1993. Convictions for other offences against the person have been relatively stable since 1995, at around 3,500-3,700 convictions annually (see Table 10.04).
Table 10.04. Convictions for other offences against the person
| Offence type | 1993 | 1994 | 1995 | 1996 | 1997 | 1998 | 1999 | 2000 | 2001 | 2002 |
|---|---|---|---|---|---|---|---|---|---|---|
1Mainly unlawful sexual intercourse or doing an indecent act with or upon another person. Sex offences reported in the violent offences category are not included in the figures for this category. 2Obstructing or resisting a police officer, traffic officer, or other official. 3Excludes threatening to kill or do grievous bodily harm which is classified as a violent offence. Source: Ministry of Justice | ||||||||||
| Incest | 47 | 44 | 46 | 14 | 12 | 10 | 3 | 1 | 2 | 6 |
| Other sex1 | 402 | 427 | 363 | 416 | 332 | 294 | 244 | 293 | 413 | 447 |
| Obstruct/resist2 | 2,095 | 2,229 | 2,412 | 2,471 | 2,269 | 2,493 | 2,405 | 2,379 | 2,289 | 2.382 |
| Threats/intimidation3 | 277 | 343 | 440 | 412 | 466 | 477 | 549 | 561 | 618 | 654 |
| Other | 146 | 170 | 242 | 264 | 182 | 244 | 258 | 252 | 380 | 294 |
| Total | 2,967 | 3,213 | 3,503 | 3,577 | 3,261 | 3,518 | 3,459 | 3,492 | 3,702 | 3,783 |
Property. Property offences comprise the second largest group of offences resulting in conviction. In 2002, 28 percent of all convictions were for offences against property. The number of convictions for property offences remained reasonably stable between 1993 and 1996, at around 57,000 convictions annually (see Table 10.05), but decreased significantly in the last six years of the decade. The 2002 figure of 47,690 was the lowest recorded in the decade. Most of the decrease in property offences was due to a decrease in the number of convictions for fraud. Between 1994 and 1996, there were between 21,000 and 22,000 convictions for fraud each year, but by 2002 the number had dropped to 12,846. This was the lowest number of convictions for fraud recorded in the decade. The decrease needs to be treated with caution, however. Many offenders convicted of fraud face a large number of charges, so the total number of fraud charges could change significantly without the number of people being convicted of fraud necessarily changing much. In fact, the number of cases where the most serious offence was fraud was only about 420 fewer in 2002 than in 1996.
Table 10.05. Convictions for property offences
| Offence type | 1993 | 1994 | 1995 | 1996 | 1997 | 1998 | 1999 | 2000 | 2001 | 2002 |
|---|---|---|---|---|---|---|---|---|---|---|
1Includes fraud, false pretences, and forgery. 2Mostly unlawfully interfering with or getting into/onto a motor vehicle or motorcycle, unlawfully taking a bicycle, entering with intent, possessing instruments for burglary or conversion, providing misleading information to obtain a benefit, or misleading a social welfare officer. Source: Ministry of Justice | ||||||||||
| Burglary | 7,358 | 6,893 | 6,712 | 6,684 | 6,719 | 6,374 | 5,938 | 6,339 | 5,502 | 5,733 |
| Theft | 15,415 | 13,611 | 12,780 | 13,332 | 13,208 | 13,793 | 13,720 | 13,246 | 14,145 | 13,946 |
| Receiving stolen goods | 4,109 | 3,479 | 3.118 | 3,148 | 3.084 | 3.374 | 3,000 | 3,010 | 2,827 | 2,442 |
| Motor vehicle conversion | 2,553 | 2,659 | 2,810 | 2,831 | 2,793 | 2,538 | 2,431 | 2,173 | 2,053 | 2,096 |
| Fraud1 | 19,480 | 21,708 | 21,960 | 21,336 | 18,661 | 17,124 | 15,078 | 14,394 | 14,220 | 12,846 |
| Arson | 188 | 191 | 191 | 165 | 198 | 313 | 209 | 170 | 198 | 213 |
| Wilful damage | 4,104 | 4,881 | 5,177 | 4,838 | 4,800 | 5,087 | 5,156 | 5,232 | 5,065 | 5,109 |
| Other2 | 4,075 | 4,016 | 4,224 | 4,368 | 4,211 | 4,692 | 5,646 | 5,071 | 4,705 | 5,305 |
| Total | 57,282 | 57,438 | 56,972 | 56,702 | 53,674 | 53,295 | 51,178 | 49,635 | 48,715 | 47,690 |
Motor vehicle conversion. The number of convictions for motor vehicle conversion averaged about 2,730 between 1993 and 1997, before dropping in the next five years to 2,053 in 2001. The 2002 figure (2,096) was marginally higher.
Drug offences. Eighty-four percent of drug convictions in 2002 involved cannabis. As Table 10.06 shows, annual convictions for drug offences fluctuate between about 11,000 and 14,000, with 2002 having the lowest number of convictions since 1996. Seven percent of all convictions in 2002 were for drug offences.
Table 10.06. Convictions for drug offences
| Offence type | 1993 | 1994 | 1995 | 1996 | 1997 | 1998 | 1999 | 2000 | 2001 | 2002 |
|---|---|---|---|---|---|---|---|---|---|---|
1Mostly offences relating to the possession of pipes, needles, syringes or other drug-related utensils. The category also includes offences where the offender permitted his or her premises or motor vehicle to be used for a drug offence, or where the offender made a false statement in relation to the Misuse of Drugs Act. Source: Ministry of Justice | ||||||||||
| Use cannabis | 7,417 | 7,388 | 5,926 | 5,652 | 6,459 | 6,970 | 6,761 | 6,131 | 5,541 | 4,990 |
| Deal in cannabis | 3,489 | 4,219 | 3,437 | 3,459 | 3,708 | 3,977 | 3,916 | 3,884 | 3,589 | 3,307 |
| Other cannabis1 | 1,478 | 1,730 | 1,469 | 1,477 | 1,730 | 2,172 | 2,255 | 2,186 | 2,183 | 2,076 |
| Use other drug | 336 | 334 | 389 | 350 | 444 | 412 | 493 | 676 | 544 | 668 |
| Deal in other drug | 355 | 379 | 380 | 497 | 496 | 415 | 405 | 459 | 403 | 784 |
| Other drug1 | 164 | 147 | 191 | 159 | 160 | 222 | 191 | 313 | 295 | 470 |
| Total | 13,239 | 14,197 | 11,792 | 11,594 | 12,997 | 14,168 | 14,021 | 13,649 | 12,555 | 12,295 |
Driving convictions. Convictions for driving offences resulting in the death or injury of another person decreased since 1998 to the lowest level recorded in the decade to 2002. Convictions for driving with excess alcohol averaged 24,500 each year between 1993 and 1998, but have generally shown a decreasing trend since then, to a decade low of 20,827 in 2002. Convictions for driving while disqualified decreased considerably from 10,451 in 1999 to 6,870 in 2002. Prior to 1999, there had been an average of nearly 11,000 convictions for this offence each year. It is likely the roadside impoundment of vehicles driven by disqualified drivers from May 1999 had an impact on the number of convictions for driving while disqualified. Convictions for reckless or dangerous driving showed a generally increasing trend across the decade, from 2,109 in 1993 to 3,019 in 2002. There was a general downward trend during the decade in the number of careless driving convictions, with the 2002 figure being 27 percent lower than the 1993 figure.
Traffic offences. From 1993 to 1998, traffic offence convictions averaged about 62,000 a year, but dropped to just under 55,000 in 2002, the lowest number of traffic convictions recorded in the decade (see Table 10.07). Despite the decrease in convictions, traffic offences still comprise the largest group of offences resulting in conviction (32 percent of all convictions in 2002).
Table 10.07. Convictions for traffic offences
| Offence type | 1993 | 1994 | 1995 | 1996 | 1997 | 1998 | 1999 | 2000 | 2001 | 2002 |
|---|---|---|---|---|---|---|---|---|---|---|
1Charges involving driving with excess alcohol, reckless/dangerous driving, or careless driving where death or injury occurred. It is no longer possible to distinguish in the data between charges resulting in injury and charges resulting in death. A small number of people who kill a person while driving a motor vehicle are charged with manslaughter rather than driving causing death. 2Mostly charges where the person was driving with excess alcohol, but also includes charges where the offender refused to supply a blood specimen, or was convicted for driving under the influence of drink or drugs. Charges where a person was driving with excess alcohol and caused death or injury are included in the first category in this table. Source: Ministry of Justice | ||||||||||
| Driving causing death or injury1 | 1,561 | 1,620 | 1,739 | 1,654 | 1,556 | 1,679 | 1,575 | 1,446 | 1,422 | 1,406 |
| Driving with excess alcohol2 | 24,079 | 22,652 | 25,456 | 25,427 | 24,672 | 24,819 | 23,101 | 21,601 | 22.363 | 20,827 |
| Driving while disqualified | 11,056 | 10,695 | 10,451 | 10,948 | 10,746 | 11,605 | 10,451 | 7,862 | 7,399 | 6,870 |
| Reckless/dangerous driving | 2,109 | 2,136 | 2,443 | 2,521 | 2,611 | 2,881 | 2,939 | 2,691 | 2,773 | 3,019 |
| Careless driving | 11,324 | 11,319 | 12,345 | 11,139 | 9,639 | 10,248 | 9,177 | 8,417 | 7,961 | 8,262 |
| Other traffic | 12,049 | 11,086 | 11,590 | 11,494 | 11,278 | 10,969 | 11,542 | 15,001 | 1 4,655 | 14,219 |
| Total | 62,178 | 59,508 | 64,024 | 63,183 | 60,502 | 62,201 | 58,785 | 57,018 | 56,573 | 54,603 |
Offences against the administration of justice. As shown in Table 10.08, the number of convictions for offences against the administration of justice increased considerably between 1993 and 1998. Figures levelled off between 1999 and 2001, with a slight decrease in 2002. Offences against the administration of justice accounted for 9 percent of all convictions in 2002, compared with 7 percent in 1993.
Table 10.08. Convictions for offences against the administration of justice
| Offence type | 1993 | 1994 | 1995 | 1996 | 1997 | 1998 | 1999 | 2000 | 2001 | 2002 |
|---|---|---|---|---|---|---|---|---|---|---|
1A dash (-) indicates that the offence was not legislated for in that particular time period. 2Community work is a new sentence introduced on 30 June 2002 by the Sentencing Act 2002. 3The sentence of periodic detention was abolished by the Sentencing Act 2002 on 30 June 2002. 4Failure, without reasonable excuse, to comply with any condition of release from prison. 5The sentence of community service was abolished by the Sentencing Act 2002 on 30 June 2002. 6Failure by a person on bail to appear in court at a specified time and place. 7Non-molestation orders were replaced by protection orders under the Domestic Violence Act 1995. 8Mostly escaping from custody in a penal institution, or escaping from police custody. Also includes a small number of charges of escaping from another type of institution such as a psychiatric hospital. Source: Ministry of Justice | ||||||||||
| Breach community work1,2 | - | - | - | - | - | - | - | - | 528 | |
| Breach periodic detention3 | 6,643 | 7,101 | 7,302 | 7,552 | 7,318 | 7,532 | 7,011 | 6,623 | 6,257 | 5,553 |
| Breach supervision | 595 | 714 | 678 | 558 | 634 | 601 | 553 | 502 | 577 | 500 |
| Breach parole4 | 469 | 321 | 194 | 208 | 180 | 202 | 199 | 235 | 267 | 310 |
| Breach community service5 | 454 | 418 | 403 | 335 | 326 | 282 | 220 | 246 | 219 | 277 |
| Failure to answer bail6 | 2,668 | 2,898 | 3,380 | 3,622 | 3,959 | 4,013 | 4,124 | 4,285 | 4,307 | 4,395 |
| Breach non-molestation/protection order7 | 379 | 437 | 421 | 496 | 1,223 | 1,881 | 2,117 | 2,257 | 2,360 | 2,038 |
| Escape custody8 | 319 | 351 | 424 | 387 | 380 | 424 | 406 | 372 | 292 | 285 |
| Obstruct/pervert course of justice | 93 | 117 | 88 | 122 | 155 | 152 | 132 | 143 | 115 | 128 |
| Other | 643 | 665 | 631 | 622 | 644 | 598 | 544 | 802 | 623 | 983 |
| Total | 12,263 | 13,022 | 13,521 | 13,902 | 14,819 | 15,685 | 15,306 | 15,465 | 15,017 | 14,997 |
Protection orders. The number of breaches of protection orders increased dramatically between 1996 and 2001, although the rate of increase has slowed in recent years. The 2002 figure (2,038) was slightly less than the 2001 figure (2,360). The 2,038 convictions for breaches of protection orders in 2002 was more than five times the 379 breaches of non-molestation orders in 1993.
Offences against good order. Offences against good order have increased since 1993 (see Table 10.09), with the number of convictions in 2002 the highest recorded in the decade. Convictions for disorderly behaviour more than doubled during the decade, from 3,099 in 1993 to 7,160 in 2002. Convictions for trespassing offences also showed an increasing trend during the decade. Police indicate that increases in drug and anti-social offences reflect an increase by police in enforcement and street policing.
Table 10.09. Convictions for offences against good order
| Offence type | 1993 | 1994 | 1995 | 1996 | 1997 | 1998 | 1999 | 2000 | 2001 | 2002 |
|---|---|---|---|---|---|---|---|---|---|---|
1Mostly behaving in a disorderly or offensive manner (s.4 Summary Offences Act 1981), disorderly or threatening behaviour (s.3 Summary Offences Act 1981), and fighting in a public place (s. 7 Summary Offences Act 1981). Source: Ministry of Justice | ||||||||||
| Riot | 3 | 0 | 7 | 8 | 7 | 2 | 5 | 23 | 15 | 6 |
| Unlawful assembly | 30 | 44 | 64 | 33 | 69 | 40 | 21 | 23 | 17 | 30 |
| Possessing offensive weapon | 1,177 | 1,245 | 1,197 | 1,257 | 1,259 | 1,417 | 1,417 | 1,310 | 1,444 | 1,540 |
| Offensive language | 641 | 693 | 675 | 663 | 598 | 650 | 699 | 681 | 645 | 583 |
| Disorderly behaviour1 | 3,099 | 3,672 | 4,284 | 4,612 | 4,661 | 5,130 | 5,645 | 6,149 | 6,933 | 7,160 |
| Trespassing | 2,202 | 2,397 | 2,737 | 2,859 | 2,997 | 3,028 | 3,006 | 3,135 | 3,092 | 3,292 |
| Other | 291 | 307 | 320 | 300 | 336 | 285 | 269 | 265 | 254 | 249 |
| Total | 7,443 | 8,358 | 9,284 | 9,732 | 9,927 | 10,552 | 11,062 | 11,586 | 12,400 | 12,860 |
Miscellaneous convictions. The wide variety of offences included in this category makes it difficult to explain total annual fluctuations in the number of convictions for these offences. Legislative amendments to the Dog Control Act 1996 and the Sale of Liquor Act 1989 led to large decreases in the number of convictions under these acts, as shown in Table 10.10.
Table 10.1. Convictions for miscellaneous offences
| Offence type | 1993 | 1994 | 1995 | 1996 | 1997 | 1998 | 1999 | 2000 | 2001 | 2002 |
|---|---|---|---|---|---|---|---|---|---|---|
1Excludes a small number of offences prosecuted under this act which were categorised as violent offences against the person. 2The Dog Control Act 1996 replaced the Dog Control and Hydatids Act 1982. 3Offences under the Income Tax Act 1976, the Income Tax Act 1994, the Goods and Services Tax Act 1985, or the Tax Administration Act 1994. 4Includes convictions under the Sale of Liquor Act 1962 and the Sale of Liquor Act 1989 (from 1 April 1990). 5This category comprises convictions under the Fisheries Act 1983 and related regulations, eg commercial fishing regulations and freshwater fisheries regulations. 6Includes a wide variety of offences such as breaches under the Health and Safety in Employment Act 1992; the Insolvency Act 1967; the Resource Management Act 1991; the Films, Videos, and Publications Classification Act 1993; the Building Act 1991, the Telecommunications Act 1987; the Medicines Act 1981; and the Conservation Act 1987. Source: Ministry of Justice | ||||||||||
| Arms Act1 | 1,029 | 934 | 826 | 866 | 880 | 952 | 921 | 857 | 705 | 739 |
| Dog Control Act2 | 6,714 | 7,723 | 6,828 | 7,440 | 1,641 | 885 | 592 | 432 | 491 | 346 |
| Tax acts3 | 6,814 | 5,096 | 4,389 | 3,710 | 2,471 | 2,464 | 2,105 | 2,269 | 3,773 | 4,196 |
| Liquor-related4 | 975 | 1,163 | 940 | 928 | 957 | 1,200 | 1,181 | 223 | 190 | 251 |
| Fisheries Act5 | 983 | 1,247 | 453 | 310 | 319 | 714 | 455 | 750 | 762 | 721 |
| Other6 | 2,945 | 2,604 | 2,957 | 3,747 | 3,438 | 3,886 | 4,183 | 3,132 | 3,375 | 3,981 |
| Total | 19,460 | 18,767 | 16,393 | 17,001 | 9,706 | 10,101 | 9,437 | 7,663 | 9,296 | 10,234 |
Characteristics of convicted offenders. Male offenders accounted for 83 percent of all cases that resulted in conviction in 2002 for which the gender of the offender was known. Forty-eight percent of all convicted cases in 2002 for which the ethnicity of the offender was known involved Europeans, 41 percent involved Maori, 8 percent involved Pacific peoples and 3 percent involved offenders of some other ethnicity. Twenty percent of all cases that resulted in conviction in 2002 and for which the age of the offender was known, involved teenage offenders, 38 percent involved offenders in their 20s, 24 percent involved offenders in their 30s and 19 percent involved offenders aged 40 and over.
Throughout the decade ending 2002, 7 to 9 percent of people convicted each year received a custodial sentence, with the proportion being marginally higher since 1997 than in the earlier years of the decade. In 2002, 7,996 cases resulted in a custodial sentence.
The number of imprisonment sentences imposed of more than one year increased through the decade, while the number of imprisonment sentences imposed of one year or less decreased. As a result, the average custodial sentence length imposed (including preventive detention) increased during the decade, from 11.2 months in 1993 to 15.4 months in 2002.
Only 8 percent of cases resulting in custodial sentences in 2002 involved female offenders.
In cases where the ethnicity of offenders was available, Maori accounted for just over half (51 percent) of the cases resulting in imprisonment in 2002, while 40 percent involved Europeans and 7 percent involved Pacific peoples.
Cases involving offenders in their 20s accounted for 40 percent of custodial sentences in 2002, with 12 percent of cases involving teenagers (almost all being aged 17 to 19). Only 18 percent of offenders given a custodial sentence in 2002 were aged 40 or more.
Between 29 percent and 36 percent of all convictions in each year of the decade resulted in the imposition of community-based sentences. This percentage has shown a decreasing trend since 1999, with the 2002 figure (29 percent) being the lowest of the decade.
The use of monetary penalties (in particular, fines) as the most serious sentence fluctuated between 48 percent and 53 percent of all cases during the decade. Part of the fluctuation was due to legislative changes affecting the number of non-imprisonable offences resulting in conviction and a fine.
Figure 10.02 shows sentence types imposed for all offences, while Table 10.11 lists the number of sentences imposed for each sentence type from 1993 to 2002.
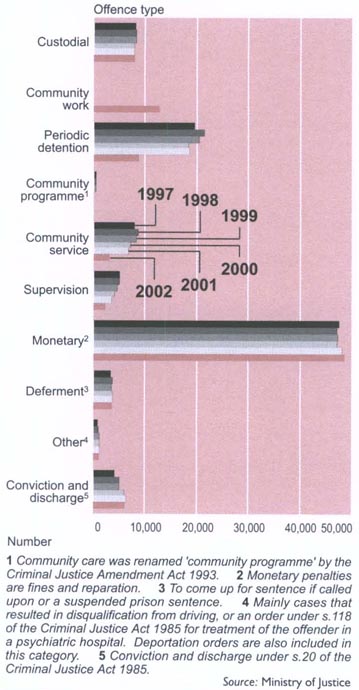
Table 10.11. Sentencing for all offences1
| Sentence type | 1993 | 1994 | 1995 | 1996 | 1997 | 1998 | 1999 | 2000 | 2001 | 2002 |
|---|---|---|---|---|---|---|---|---|---|---|
1Only the most serious sentence imposed is shown for cases where more than one sentence was imposed. 2A dash (-) indicates that the sentence type was not legislated for in that particular time period. 3Community work was introduced from 30 June 2002 by the Sentencing Act 2002. 4Sentence abolished from 30 June 2002 by the Sentencing Act 2002. 5Community care was renamed ‘community programme’ by the Criminal Justice Amendment Act 1993. 6Supervision was modified to include the ‘care’ aspect of community programme from 30 June 2002 by the Sentencing Act 2002. 7Monetary penalties are fines and reparation. 8To come up for sentence if called upon or a suspended prison sentence. Suspended prison sentences were abolished from 30 June 2002 by the Sentencing Act 2002. 9Mainly cases that resulted in disqualification from driving, or an order under s.118 of the Criminal Justice Act 1985 for treatment of the offender in a psychiatric hospital. Deportation orders are also included in this category. 10Conviction and discharge under section 20 of the Criminal Justice Act 1985, or section 108 of the Sentencing Act 2002. Source: Ministry of Justice | ||||||||||
| Custodial | 7,989 | 7,361 | 7,246 | 7,787 | 8,102 | 8,255 | 8,177 | 7,886 | 7,805 | 7,996 |
| Community work2,3 | - | - | - | - | - | - | - | - | - | 12,743 |
| Periodic detention4 | 22,065 | 20,777 | 19,437 | 19,116 | 19,510 | 21,340 | 20,481 | 18,395 | 18,461 | 8,777 |
| Community programme4,5 | 1,058 | 899 | 880 | 703 | 430 | 379 | 287 | 203 | 206 | 53 |
| Community service4 | 9,731 | 9,406 | 8,625 | 8,030 | 7,812 | 8,525 | 8,226 | 7,124 | 6,764 | 3,075 |
| Supervision6 | 3,939 | 4,977 | 5,166 | 5,166 | 5,037 | 5,004 | 4,550 | 4,024 | 3,367 | 2,321 |
| Monetary7 | 49,738 | 52,176 | 54,715 | 54,931 | 47,515 | 47,165 | 47,326 | 47,215 | 48,028 | 48,643 |
| Deferment8 | 3,779 | 3,530 | 3,146 | 3,499 | 3,233 | 3,560 | 3,502 | 3,590 | 3,606 | 3,633 |
| Other9 | 869 | 785 | 805 | 789 | 808 | 983 | 1,116 | 1,125 | 1,136 | 1,226 |
| Conviction and discharge10 | 4,195 | 4,784 | 4,902 | 4,656 | 4,068 | 4,994 | 4,982 | 5,945 | 6,234 | 6,133 |
| Total | 103,363 | 104,695 | 104,922 | 104,677 | 96,515 | 100,205 | 98,647 | 95,507 | 95,607 | 94,600 |
Victim Support is a community, not-for-profit organisation providing a 24-hour, seven-day-a-week support service for victims of crime, accident and emergency.
Of those receiving support, 90 percent are victims of crime. Other victims include families and survivors where there has been a serious transport accident, sudden death, a suicide attempt or completion, or a natural disaster.
A range of support services based on the victim's needs are provided by trained volunteer workers. These include crisis intervention at the time of an incident, where practical and emotional support is offered; advice on other services and agencies available to the victim; provision of information about police investigations and judicial processes; and ongoing support as needed, particularly throughout the criminal justice process. This latter support includes assisting the victim to prepare a victim impact statement, attending court with the victim, and supporting victims who have agreed to participate in a restorative justice conference.
Other services available to victims and managed by Victim Support include free counselling for families and close friends of victims of a homicide; financial assistance for victims who wish to travel to a high court trial or to present a submission to a parole hearing; and advice on and assistance with improving home security for low-income people who have been victims of repeat burglaries.
Funding for Victim Support comes from four main sources:
Government contracts for services.
Grants from the Community Organisation Grants Scheme, the lottery board and philanthropic trusts.
Local fund raising.
Donations.
A significant recent change for Victim Support has been the transfer of contract for services from the Community Funding Agency to the Ministry of Justice.
Victim Support works closely with the police, who provide office accommodation and facilities. A memorandum of understanding formalises the relationship between the two organisations.
Victim Support groups are affiliated to the New Zealand Council of Victim Support Groups Incorporated. A key role of the council is to advocate for victims' rights. Recent government initiatives have resulted in Victim Support providing comment on the Victims' Rights Bill, the Injury Prevention and Rehabilitation Bill, court-ordered restorative justice conference pilots and a review of youth justice.
Table 10.12. Victim Support Operations and funding Years ending 30 June
| Category | 2001 | 2002 | 2003 |
|---|---|---|---|
Source: New Zealand Council of Victim Support Groups | |||
| Victim Support groups | 66 | 67 | 67 |
| Staff employed (full-time equivalent) | 53 | 53 | 53 |
| Contacts made with victims | 212,443 | 140,659 | 187,211 |
| Volunteer workers | 1,326 | 1,311 | 1,304 |
| Hours of service given by volunteers | 134,700 | 73,284 | 80,137 |
| Ministry of Justice funding (including GST) | $1.2 million | $1.7 million | $1.9 million |
| Funding for victim assistance schemes (including GST) | $583,000 | $653,000 | $653,000 |
Table 10.12 provides details of Victim Support activities for the years ending 30 June 2001-2003.
Rape Crisis and related groups offer a variety of services, which may include support for survivors of rape and/or sexual abuse (women and children), 24-hour rape/sexual abuse hot lines, and training and educational presentations to schools, community and parent groups, the law enforcement community and businesses.
Some groups are affiliated to a national collective which lobbies for legal reform, and liaises with government departments, the media, other non-government organisations and the funding community.
Rape Awareness Week is an annual initiative during which pamphlets, posters and tip cards are distributed, and various educational and informational programmes are held.
The core responsibility of the Department of Corrections is management of the New Zealand corrections system. The purpose of the corrections system is to contribute to the maintenance of a safe and just society.
As part of this responsibility, the department ensures that custodial sentences (imprisonment) and non-custodial sentences and orders (home detention, supervision, community work, release on conditions, and parole) imposed by the courts and the New Zealand Parole Board are administered in a safe, secure, humane and effective way.
The department aims to contribute to the maintenance of a safe and just society by reducing the level of re-offending through the delivery of targeted and appropriate rehabilitative and re-integrative interventions.
The department also provides information on offenders to the courts and the New Zealand Parole Board to assist them in their decision making.
The department operates 17 public prisons, 12 Community Probation Service area offices (with staff at 143 locations nationwide), eight Psychological Service offices, 11 prison-based special treatment units (three drug and alcohol units, two sex offender units, five Maori focus units and one violence prevention unit) and the department's head office in Wellington.
The Department of Corrections is made up of six groups and services headed by a chief executive, who has overall responsibility for the department.
The chief executive is responsible to the Minister of Corrections for the broad direction of the department's work, for goal and objective setting, policy advice formulation, effective implementation of major policy decisions, determining the department's priorities, and effective administration of the organisation.
The six groups and services that make up the Department of Corrections are: finance, strategic services, corporate management, policy development, Public Prisons Service, and Probation and Offender Services.
Auckland Central Remand Prison. The Department of Corrections signed a $102 million, five-year contract with Australasian Correctional Management Pty Ltd (ACM) in July 1999 to run New Zealand's first contract-managed prison. Management of the prison reverted to the department in 2004.
The Auckland Central Remand Prison began operating on 13 July 2000 and received its first inmates on 20 July 2000. The agreed operating capacity for the prison is 272, which includes up to 22 special needs inmates (inmates who have been identified as at risk of self-harm). Included in the 272 are 32 sentenced inmates who work in internal services such as the kitchen and laundry.
Prisoner escort and courtroom custodial services. The Department of Corrections signed a contract with Chubb New Zealand Ltd in October 1998 to supply prisoner escort and courtroom custodial services in the Northland and Auckland regions. This included escorting prisoners between penal institutions, courts and forensic psychiatric units, and court custody of prisoners appearing for judicial purposes, work previously undertaken by police and Public Prisons Service officers.
The government agreed in 2001 to the development of a Crime Reduction Strategy (CRS) to replace the 1994 New Zealand Crime Prevention Strategy. The purpose of the CRS is to establish priorities for preventing and reducing crime. The CRS targets the following areas:
Family violence, including child abuse.
Other violence, including sexual abuse.
Burglary.
Theft of and from cars.
Organised criminal activity.
Serious traffic offending.
Youth offending and re-offending.
The CRS emphasises a partnership approach between government agencies, local government and communities. Target groups include victims, particularly repeat victims, Maori, Pacific peoples, at-risk families and those affected by drugs, alcohol or gambling. An action plan to reduce community and sexual violence was launched in June 2004 by the Ministry of Justice's Crime Prevention Unit (CPU). The CPU has also implemented changes to the funding of local government community crime prevention activities. From 1 July 2004, funding is being provided to local authorities on criteria determined by their crime prevention needs, including the size of population and crime rates. Metropolitan and provincial authorities are being funded directly on the basis of a crime prevention plan designed to meet local needs. Smaller and rural authorities are being funded on the basis of approved crime prevention projects. The CPU has crime prevention partnership agreements in place with four iwi and also funds crime prevention projects and programmes directly through individual contracts. The biggest contracted programmes are community-managed restorative justice programmes, community youth programmes run in conjunction with the New Zealand Police and neighbourhood-based safety programmes. The appropriation for community crime reduction and prevention initiatives in the 2004/05 financial year was $7,822 million, compared with $5,912 million in the previous financial year.
Probation and Offender Services comprises the service delivery arms of the Department of Correction responsible for the Community Probation Service, Psychological Service and Intervention Services. The latter is a new service operational from July 2004. The Community Probation Service (CPS) undertakes non-custodial sentences and orders. These include supervision, community work, parole orders, home detention, and release from prison on conditions. The service manages approximately 38,000 community-based sentences and orders each year, and provides information and reports to judges to assist them in making sentences and release decisions. As part of managing these sentences, CPS provides responsive and rehabilitative programmes to help address the needs that contribute to offending. Table 10.13 shows the number and type of community-based sentences from 1997 to 2003.
The Psychological Service provides specialist clinical assessment and treatment to offenders. The service also develops and delivers rehabilitative programmes for three special treatment units: two for male sex offenders who have offended against children, and one for violent offenders. In addition the service undertakes psychological research that helps to improve risk assessment, targeting and treatment effectiveness for both the service and the department.
Table 10.13. Community-based sentences1
| Sentence | 1997 | 1998 | 1999 | 2000 | 2001 | 2002 | 2003 |
|---|---|---|---|---|---|---|---|
1Numbers commencing sentences in years ending 30 June. 2Introduced by the Sentencing Act 2002, with effect from 1 July 2002. 3Introduced by amendments to the Criminal Justice Act 1985, with effect from 1 October 1999. 4Introduced by the Parole Act 2002, with effect from 1 July 2002. 5Abolished by the Sentencing Act 2002, with effect from 1 July 2002. ... not applicable Source: Department of Corrections | |||||||
| Community work2 | ... | ... | ... | ... | ... | ... | 27,936 |
| Supervision | 10,078 | 9,924 | 9,945 | 8,903 | 8,318 | 6,796 | 5,059 |
| Parole | 2,092 | 2,245 | 2,368 | 2,311 | 2,438 | 2,393 | 1,923 |
| Home detention3 | ... | ... | ... | 302 | 772 | 861 | 1,575 |
| Post release conditions4 | ... | ... | ... | ... | ... | ... | 1,461 |
| Periodic detention5 | 22,609 | 23,934 | 24,861 | 20,012 | 20,433 | 20,404 | ... |
| Community service5 | 11,613 | 10,670 | 10,934 | 8,750 | 8,387 | 7,557 | ... |
| Community programme5 | 584 | 418 | 365 | 240 | 230 | 180 | ... |
Community work. Community work is a community-based sentence that requires offenders to do unpaid work in the community. The aim of community work is for offenders to pay something back to the community for the offence they have committed. It also gives offenders an opportunity to take responsibility for their offending and learn new skills and work habits.
People sentenced to community work report to a probation officer at a Community Probation Service centre. In order to establish how the offender will complete a sentence, the probation officer takes into account the offence the person has committed, personal circumstances and needs and skills. Community work can be either in a group supervised by the Community Probation Service, or on an individual and/or group basis with an agency. The act specifies who can be an agency for community work. Community work projects include those sponsored by local councils, government agencies, voluntary organisations, marae organisations, sports groups and other community groups. If the work is supervised by an agency, probation officers check that the offender has completed the right number of hours and completed the work to the required standard.
Offenders can be required to do between 40 and 400 hours of community work. If offenders are sentenced to more than 200 hours of work, the hours need to be completed within two years. Sentences of 200 hours or less need to be completed within one year. Offenders can, in most cases, continue with their regular jobs while serving community work sentences. Some offenders may be given a sentence of supervision as well as community work. In these cases, as well as doing work in the community, offenders may also have to report regularly to a probation officer and attend programmes aimed at addressing their offending. If offenders on community work do not meet the conditions of their sentence, they may be returned to court. If an offender is convicted of breaching or not meeting requirements, the court may impose up to three months imprisonment or a $1,000 fine.
Supervision. Supervision is a rehabilitative community-based sentence, which requires offenders to address the causes of their offending. Offenders can be sentenced to supervision for at least six months and for a maximum of two years. When an offender has been convicted of an offence and is waiting to be sentenced, probation officers assess the person's offending and the most suitable form of sentence and programme. If the offender is sentenced to supervision, the information gained from the assessment may be included in the conditions of the supervision sentence. An offender will have standard conditions as part of the sentence and the judge may also impose special conditions to address the offender's needs.
Standard conditions include reporting to the Community Probation Service and restrictions on living and working arrangements and associating with people. Special conditions include participation in treatment, personal development or rehabilitative programmes and addressing any other issues which reduce the person's risk of re-offending. Probation officers work with offenders to address the causes of their offending. As part of rehabilitation, offenders may have to attend rehabilitative programmes. Probation officers may also work with family, friends and colleagues of the offender. In addition to a sentence of supervision, the court may also order the offender to pay a fine, pay reparation to victims, or do unpaid work in the form of community work. Probation officers ensure that offenders on supervision complete all the conditions of their sentence. If offenders do not meet the requirements of their sentences, they are returned to court. If an offender is convicted of breaching or not meeting the requirements of the sentence, the court may impose up to three months imprisonment or a $1,000 fine.
Parole. People on parole have been released from prison under strict conditions laid down by law. Often they will move on to a community-based programme designed to deal with their offending-related problems. They must report regularly to a probation officer, who monitors their progress and adherence to conditions imposed as part of parole. In the year ending 30 June 2003, the Community Probation Service supervised 3,453 offenders on parole.
Home detention. Home detention is a community-based option granted by the New Zealand Parole Board that allows offenders to serve part of their prison sentences at home or at an approved place of residence. Offenders live at home under electronic surveillance and receive intensive supervision by a probation officer.
Home detention allows offenders to maintain family relationships, keep working or actively look for work, and attend rehabilitative programmes designed to address causes of their offending. Offenders who are subject to short-term prison sentences of two years or less can, if the sentencing judge allows, apply to the New Zealand Parole Board to serve their sentences on home detention. Offenders sentenced to long-term prison sentences can also apply to be released on home detention three months prior to their parole eligibility date.
Home detention is available in most parts of New Zealand. Once an application for home detention is made, the Community Probation Service prepares a report for the parole board on the offender's suitability and how he or she will be managed while on home detention. This report examines the offender's risk to the public, motivation to change behaviour, risk of re-offending, suitability of the proposed residence and any comments from victims. The probation officer discusses home detention with the family or other residents who live at the address. The probation officer will inform the residents of the offender's past and present convictions and seek their consent before an offender is released to home detention. The probation officer will also investigate what employment and rehabilitative programmes are available for the offender. Approved offenders sentenced to less than two years are released from home detention automatically after half of their sentence. If the offender fails to meet the conditions of home detention, the probation officer may make a recall application to the parole board to have the offender sent to prison. Offenders on home detention wear an anklet that continuously emits a signal to a monitor while they are at home. If the offender tries to remove the anklet or leaves the property without permission, an alarm is triggered and a security guard is dispatched to the house.
While on home detention, offenders are subject to intensive supervision by a probation officer, which includes a minimum of three visits a week for the first half of the home detention order. Offenders may have set conditions as part of their release on home detention. These may cover where the offenders can work, with whom they can associate and may also cover the rehabilitative activities or programmes offenders have to attend. Offenders can work while on home detention, but only as authorised by the probation officer. Offenders who are not working can apply for the appropriate benefit and may be expected to actively seek employment.
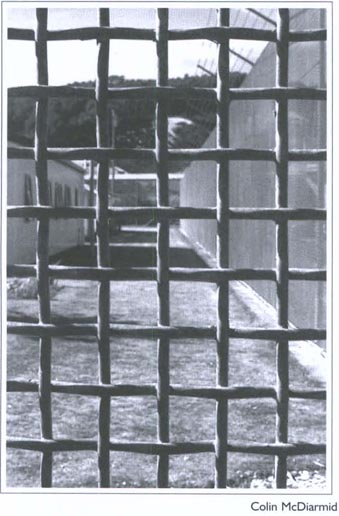
There were an average 5,882 prison inmates in New Zealand in the six months ending 30 June 2003, compared with an average 5,738 a year earlier.
The Public Prisons Service is responsible for running all of New Zealand's 18 prisons. It is responsible for providing prison services that are safe, secure, humane and which contribute to reducing re offending. The service is also responsible for managing the sentence needs of each offender, including rehabilitation and reintegration.
The service manages inmates' security, with two key priorities. The first focuses on community safety, ensuring inmates are securely contained in prison for the duration of their sentence. The second concentrates on encouraging inmates to address the things that drive their criminal lifestyle and take steps to change their offending behaviour.
Figure 10.03 shows the number of inmates in prison in New Zealand per 10,000 population.
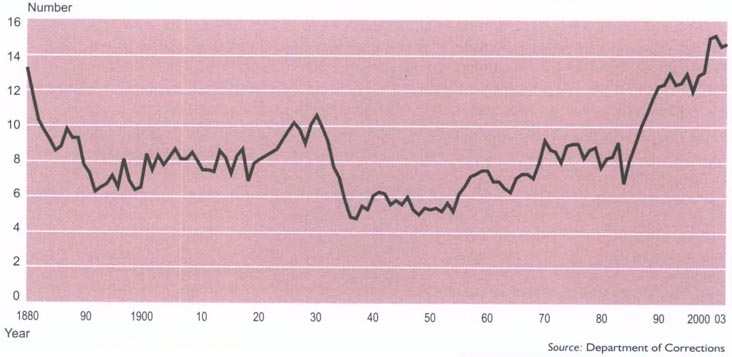
Table 10.14. Penal institutions At 31 July 2003
| Institution | Capacity |
|---|---|
Source: Department of Corrections | |
| Male prisons | |
| Waikeria | 877 |
| Christchurch | 704 |
| Rimutaka | 666 |
| Auckland | 645 |
| Hawke's Bay Regional | 568 |
| Tongariro/Rangipo | 442 |
| Mt Eden | 421 |
| Wanganui | 370 |
| Rolleston | 320 |
| Manawatu | 278 |
| Auckland Central Remand Prison | 272 |
| Invercargill | 172 |
| Wellington | 120 |
| New Plymouth | 109 |
| Ohura | 98 |
| Dunedin | 59 |
| Female prisons | |
| Arohata | 128 |
| Christchurch Women's | 98 |
| Mt Eden (women's division) | 54 |
The 18 Public Prisons Service prisons are operated within five regions, with a national office in Wellington. The national office is responsible for supporting the regions and for providing advice on policy development.
The service's prisons are listed in Table 10.14.
Inmates with different security classifications are held at each institution. Fourteen prisons receive remand inmates as well as sentenced inmates.
In the year ending 30 June 2003, the average cost of keeping a person in prison was $57,017, compared with $51,036 five years earlier.
Apart from his role in company liquidations and bankruptcies, the Official Assignee has certain statutory responsibilities under the Proceeds of Crime Act 1991.
The high court may order that assets be placed in the custody and control of the Official Assignee. This is to ensure that assets are not depleted or destroyed while a criminal trial is pending, or a further application under the act is to be heard.
If the court orders forfeiture of a criminal's property, or that restrained property be sold to satisfy a pecuniary penalty, the Official Assignee takes the necessary steps to realise those assets and transfer proceeds to the Crown.
In the year ending 30 June 2003, the Official Assignee, in relation to proceeds of crime matters, returned $3,666,267 to the Crown, compared with $505,250 in the 2002 year and $325,000 in 2001.
Two new pieces of legislation, the Sentencing Act 2002 and the Parole Act 2002, came into effect on 30 June 2002 and largely replaced the Criminal Justice Act 1985. The result of a government commitment to review sentencing and parole regimes, the new acts seek to provide greater clarity, consistency and transparency in sentencing and improve the parole decision-making structure.
The Public Prisons Service administers and manages custodial sentences imposed on offenders sentenced to penal institutions. The service also manages remand offenders pending court appearances or sentencing.
At the time of sentencing, a judge may impose release conditions (both standard and special) on offenders sentenced to terms of imprisonment of 12 months or less, and must impose standard conditions on those sentenced to more than 12 months, but not more than 24 months. The courts may also impose special conditions on these offenders.
Under the new legislation, courts may defer the start of a person's prison sentence for up to two months, instead of one month as had previously been the case. Courts can also impose a minimum non-parole period of imprisonment on any offender sentenced to more than 24 months, if they are satisfied that the circumstances of the offence are sufficiently serious. This period can be up to two-thirds of the sentence, or 10 years, whichever is the lesser. If sentenced to 24 months or less, offenders are released after serving half their sentence.
Offenders sentenced to more than 24 months imprisonment can be released before their sentence end date only by the parole board. Offenders are eligible to be seen by the parole board after serving one-third of their sentence, unless the judge imposes a minimum non-parole period greater than one-third. Offenders not released by the parole board on parole are released on their statutory release date, which is the last possible date they can be held. The board must impose standard conditions on offenders at their statutory release date to take effect for six months beyond that date. The board may also impose special conditions to apply for the same length of time.
Murder. A sentence of life imprisonment is no longer automatically imposed for murder. The law now states that the court must impose life imprisonment unless it is satisfied that this would be ‘manifestly unjust’. If the court chooses not to impose life imprisonment, it must give it reasons in writing. Ten years is the minimum non-parole period for anyone sentenced to life imprisonment for murder. The court must impose a minimum non-parole period of at least 17 years (unless it would be ‘manifestly unjust’) when the murder involves certain circumstances, including ‘if the deceased was a member of the police or a prison officer acting in the course of his or her duty’ or ‘if the deceased was particularly vulnerable because of his or her age, health, or because of any other factor’.
Preventive detention. Under the Sentencing Act 2002, the age limit for eligibility for preventive detention was lowered to 18. The range of offences to which preventive detention applies was also increased. A minimum non-parole period must be ordered by the court in each instance, but cannot be less than five years.
Victims. Victims of certain offences can apply under the Victims' Rights Act 2002 to receive specified information about offenders serving a sentence of imprisonment, either in prison or by way of home detention, or who have been released on parole. The New Zealand Police verifies all applications and sends them to the government agency responsible for notification. The Department of Corrections notifies registered victims of information such as the escape or death in custody of offenders, release to work, temporary releases and impending release dates. The New Zealand Parole Board (NZPB) is responsible under the Parole Act 2002 for notifying registered victims of impending parole hearings and the victim's right to make submissions to the board. Victims are also entitled to information about an inmate's sentence (including any programmes they have undertaken and completed and their security classification) to help them prepare their submission. The NZPB also notifies registered victims of the outcome of board hearings and, if the offender is released, any conditions on release that specifically relate to the registered victim or to submissions they have made to the board.
Determinate sentences. An inmate serving a finite term of imprisonment of 24 months or less is not eligible for parole, but is automatically released after serving one-half of his or her sentence. An inmate serving a finite term of imprisonment of more than 24 months is eligible for parole after serving one-third of his or her sentence, unless the court has imposed a minimum non-parole period of longer than this. A non-parole period can be for 10 years or two-thirds of the total sentence, whichever is the lesser. When the offender is eligible for parole, his or her suitability for parole will be considered once a year, although further hearings can be postponed for up to two years. The inmate must be released on his or her statutory release date, if not granted parole before then.
Indeterminate sentences. An inmate sentenced to preventive detention is subject to a minimum period of imprisonment specified by the court, which must be for a term of at least five years. When the offender is eligible for parole, his or her suitability for parole will be considered once a year, although further parole hearings can be postponed for up to three years. An inmate serving a life sentence for murder is normally eligible for parole after serving 10 years of his or her sentence, unless the court has imposed a minimum period of imprisonment of longer than this. However, where there are unusual mitigating factors, the court may decide to impose a determinate sentence. Where there are one or more specified aggravating factors, the court must, unless it would be ‘manifestly unjust’, impose a minimum period of imprisonment of at least 17 years. When the offender is eligible for parole, his or her suitability for parole will be considered once a year, although further parole hearings can be postponed for up to three years.
New Zealand Parole Board. The New Zealand Parole Board, an independent statutory authority, hears all applications for parole. The board is made up of full-time and part-time members appointed from the community and the judiciary. The board operates in panels of three, with a district court judge convening each panel. The board's chairperson, who has oversight of all decisions, is a high court or former high court judge.
When making decisions relating to the release of an offender, the paramount consideration for the board is the safety of the community. Part of the focus of legislation is to give full consideration to the rights of victims, particularly their rights to provide input into parole hearings and home detention hearings.
Inmate numbers. The number of inmates in New Zealand prisons has remained relatively stable since 2000. In the year ending 30 June 2003, there was an average daily muster of 5,826 inmates (5,552 males and 274 females). This was made up of a daily average of 4,846 sentenced inmates and 980 inmates remanded in custody. For the year ending 30 June 2001, there was a daily average of 5,855 inmates (4,957 sentenced and 898 on remand).
Census of prison inmates. There were 4,918 sentenced inmates in New Zealand when a census of inmates was carried out on 15 November 2001. This was 47 fewer than the 18 November 1999 census figure. In 2001, 4,716 of the sentenced inmates were males (4,759 in 1999), while 202 (206 in 1997) were females.
In addition, there were 862 remand inmates within prisons in 2001 (657 in 1999), of whom 830 were males (633) and 32 females (24).
In 2001, 174 offenders (130 males and 44 women) were held on home detention, making a grand total of 5,954 sentenced inmates (5,647 in 1999).
Unless specified, the following figures refer to sentenced inmates on the day of the 2001 census:
Age and ethnicity - Just under half of inmates were under 30 years of age (see Table 10.15). The highest proportion of both male (19.8 percent) and female (22.7 percent) inmates were in the 20-24 year bracket. Twenty-four percent of males and 19 percent of females were at least 40 years old.
For male sentenced inmates using a single ethnicity grouping, 53 percent identified themselves as Maori, 29 percent identified themselves as European and 11 percent identified as Pacific peoples. Corresponding figures for females were 55 percent Maori, 29 percent European and 11 percent Pacific peoples.
Table 10.15. Age distribution of inmates1At 15 November 2001 Census
| Age | Female | Male | Total1 | |||
|---|---|---|---|---|---|---|
| Number | Percent | Number | Percent | Number | Percent | |
1Excludes 26 female and 311 male inmates where age was not available. ... not applicable Source: Department of Corrections | ||||||
| 14-16 | ... | ... | 12 | 0.3 | 12 | 0.3 |
| 17-19 | 9 | 5.1 | 271 | 6.2 | 280 | 6.1 |
| 20-24 | 40 | 22.7 | 871 | 19.8 | 911 | 19.9 |
| 25-29 | 28 | 15.9 | 825 | 18.7 | 853 | 18.6 |
| 30-34 | 33 | 18.8 | 793 | 18.0 | 826 | 18.0 |
| 35-39 | 33 | 18.8 | 587 | 13.3 | 620 | 13.5 |
| 40-49 | 26 | 14.8 | 665 | 15.1 | 691 | 15.1 |
| 50-59 | 6 | 3.4 | 269 | 6.1 | 275 | 6.0 |
| 60+ | 1 | 0.5 | 112 | 2.5 | 113 | 2.5 |
| Total | 176 | 100.0 | 4,405 | 100.0 | 4,581 | 100.0 |
Major offence - As Table 10.16 shows, 62 percent of male inmates were imprisoned for violence (including sexual violence) offences. The next largest group of male inmates were those imprisoned for property offences (22 percent), followed by drug offenders (8 percent) and traffic offenders (6 percent). Female inmates were most likely to be imprisoned for violence offences (46 percent) or property offences (27 percent). Thirteen percent of female inmates were drug offenders and 9 percent traffic offenders. Of those imprisoned for violence, more than 34 percent, irrespective of gender, were in prison for robbery. The proportion of females in prison for homicide (38 percent) was considerably higher than for males (22 percent).
Sentence length - Males tended to have longer sentences than females (see Table 10.17). Twenty-eight percent of males were serving determinate sentences of more than five years, compared with 12 percent of females. However, 8 percent of female inmates were serving life sentences, compared with 6 percent of males.
Table 10.16. Major offence of sentenced inmates At 15 November 2001 Census
| Major offence | Female | Male | Total1 | |||
|---|---|---|---|---|---|---|
| Number | Percent | Number | Percent | Number | Percent | |
1Excludes eight female and 120 male inmates where major offence was not available. Source: Department of Corrections | ||||||
| Violence | 84 | 43.3 | 1,810 | 39.4 | 1,894 | 39.6 |
| Sexual violence | 6 | 3.1 | 1,072 | 23.3 | 1,078 | 22.5 |
| Against property | 53 | 27.3 | 991 | 21.6 | 1,044 | 21.8 |
| Involving drugs | 25 | 12.9 | 360 | 7.8 | 385 | 8.0 |
| Traffic | 18 | 9.3 | 264 | 5.7 | 282 | 5.9 |
| Miscellaneous | 8 | 4.1 | 99 | 2.2 | 107 | 2.2 |
| Total | 194 | 100.0 | 4,596 | 100.0 | 4,790 | 100.0 |
Table 10.17. Sentence length imposed At 15 November 2001 Census
| Sentence length | Female | Male | Total1 | |||
|---|---|---|---|---|---|---|
| Number | Percent | Number | Percent | Number | Percent | |
1Excludes eight female and 120 male inmates where sentence length was not available. - nil or zero Source: Department of Corrections | ||||||
| Under 3 months | 7 | 3.6 | 80 | 1.7 | 87 | 1.8 |
| 3 months and under 6 months | 13 | 6.7 | 195 | 4.2 | 208 | 4.3 |
| 6 months and under 1 year | 23 | 11.8 | 451 | 9.8 | 474 | 9.9 |
| 1 and under 2 years | 51 | 26.3 | 810 | 17.6 | 861 | 18.0 |
| 2 and under 3 years | 23 | 11.9 | 662 | 14.4 | 685 | 14.3 |
| 3 and under 5 years | 37 | 19.1 | 799 | 17.4 | 836 | 17.5 |
| 5 and under 7 years | 15 | 7.7 | 455 | 9.9 | 470 | 9.8 |
| 7 and under 10 years | 5 | 2.6 | 495 | 10.8 | 500 | 10.4 |
| 10 years and over | 4 | 2.1 | 225 | 4.9 | 229 | 4.8 |
| Life | 16 | 8.2 | 296 | 6.5 | 312 | 6.5 |
| Preventive detention | - | - | 128 | 2.8 | 128 | 2.7 |
| Total | 194 | 100.0 | 4,596 | 100.0 | 4,790 | 100.0 |
Offending history - As shown in Table 10.18, female inmates on average had fewer previous convictions than their male counterparts. Of female sentenced inmates, 35 percent had no previous record, 39 percent had at least six previous convictions and 8 percent had more than 20. Of male sentenced inmates, 21 percent had no previous convictions, 42 percent had at least six and 9 percent had more than 20.
Table 10.18. Time in prison on previous occasions At 15 November 2001 Census
| Time in prison | Female | Male | ||
|---|---|---|---|---|
| Number | Percent | Number | Percent | |
Source: Department of Corrections | ||||
| No previous incarcerations | 122 | 60.3 | 1,888 | 40.0 |
| Under 6 months | 14 | 6.9 | 447 | 9.5 |
| 6 months and under 1 year | 14 | 6.9 | 294 | 6.2 |
| 1 and under 2 years | 23 | 11.4 | 450 | 9.5 |
| 2 and under 3 years | 10 | 5.0 | 352 | 7.5 |
| 3 and under 5 years | 9 | 4.5 | 415 | 8.8 |
| 5 and under 7 years | 3 | 1.5 | 311 | 6.6 |
| 7 and under 10 years | 3 | 1.5 | 249 | 5.3 |
| 10 years and over | 4 | 2.0 | 310 | 6.6 |
| Total | 202 | 100.0 | 4,716 | 100.0 |
Classification status - Males tended to have a higher security status than females. For male sentenced inmates, 44 percent were minimum security, 49 percent were medium security and 4 percent were maximum security. For female sentenced inmates, 54 percent were minimum security, 40 percent were medium security and 0.5 percent were maximum security. The rest were unclassified.
Earnings. Modest earnings are paid to inmates who work or are involved in reintegrative programmes. Amounts vary depending on the nature of the work or activity and the standard of performance. The money is banked in a personal trust account and inmates can spend it on personal items through a weekly shopping system. Any person who has been in custody for more than 31 days is eligible on release for the Steps to Freedom grant administered by the Ministry of Social Development. The grant is for up to $350, but the amount of any money in an inmate's trust account upon final release is deducted from the grant.
Punishment. An inmate charged with an offence against discipline appears before a prison superintendent, an authorised staff member or a visiting justice. If the inmate is found guilty, a penalty may be imposed. Serious criminal offences by inmates are referred to the police for investigation.
Release to work. A small number of selected inmates may be released during the day for outside employment. They are required to contribute to the cost of their board, and part of their earnings may also be withheld to fund debts, including fines and reparation, and family expenses.
National administrative and operational control of the New Zealand Police is vested in the Police Commissioner, who is responsible to the government through the Minister of Police. New Zealand is divided into 12 police districts, each managed by a district commander. The Office of the Commissioner in Wellington provides policy advice and support to the government, the commissioner and districts. A number of service centres throughout New Zealand provide administrative support to districts.
Police have responsibility for enforcement of the criminal law, principally through the Crimes Act and the Summary Offences Act, but also through various other statutes such as the Arms Act, the Sale of Liquor Act, the Gambling Act, the Misuse of Drugs Act, Children, Young Persons and Their Families Act, the Police Act and the Transport Act.
Trained police prosecutors undertake summary prosecution in district courts of criminal offences investigated by the police. In some country districts, police hold additional appointments, such as registrars and bailiffs at district courts, and honorary fisheries officers.
The effective strength of the police at 30 June 2003 was 7,576 sworn personnel (248 more than at 30 June 2001), giving a full-time equivalent (FTE) of 7,257 sworn officers (an increase of 211). Approximately 16 percent of sworn officers in 2003 were women. Figure 10.04 shows the New Zealand population per sworn officer from 1878 to 2003. There were also 2,176 non-sworn full-time equivalent personnel (up 373 on the 2001 figure).
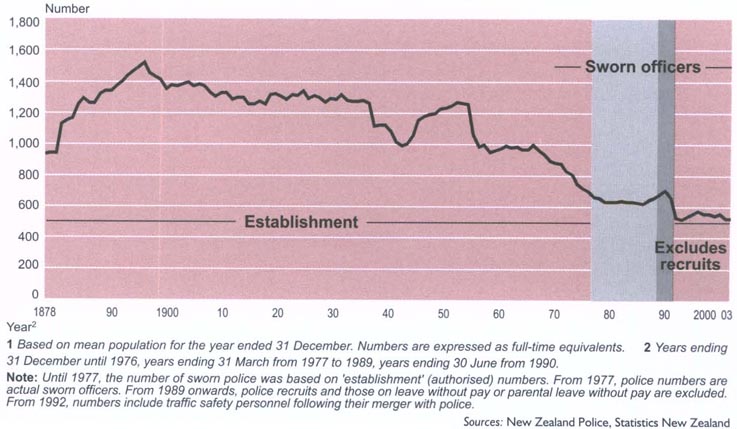
Armed offenders squads. Police maintain 17 squads of specially trained and equipped officers throughout New Zealand. During the year ending 30 June 2003, armed offenders squads were deployed 534 times (562 in 2002). The squads work with police negotiators and other specialist police support staff.
Special Tactics Group. The Special Tactics Group consists of selected members of armed offenders squads from Auckland, Wellington and Christchurch and is provided with specialised training to enable it to deal with incidents beyond the capability of armed offenders squads.
Search and rescue. There were 1,080 police-controlled search and rescue operations during the year ending 30 June 2003 which searched for and/or rescued 1,483 people. The comparable activity in 2001/02 was 1,120 searches and 1,453 people.
National Drug Intelligence Bureau. As shown in Table 10.19, crime figures for the year ending 30 June 2003 show 23,714 cannabis and non-cannabis drug offences, representing 5.3 percent of total recorded crime. This figure compares with 23,839 offences in the previous financial year. While there was a small decrease in cannabis offences detected, there was a 14 percent increase in non-cannabis offences. Drug seizure figures are recorded on a calendar year basis. The number of cannabis plants seized declined from 90,857 in 2001 to 74,324 in 2002. Likewise, there was a drop in cannabis plant material seized, from 1,847 kilograms in 2001 to 593 kilograms in 2002. On the other hand, there were increased seizures of synthetic drugs and party drugs, including MDMA (ecstasy) and amphetamines. The first seizures of GHB (fantasy) were recorded. Police now record the number of clandestine drug laboratories located. These rose from nine in 2000, to 41 in 2001 and to 147 in 2002. Related to the emergence of clandestine drug laboratories in New Zealand have been seizures of precursor chemicals used in the manufacture of synthetic drugs, particularly methamphetamine. The increase in seizures of pseudoephedrine and ephedrine are shown in Table 10.20. Powers of search without warrant were used 4,911 times in 2002, compared with 3,940 in 2001.
| Reported assaults on policeYears ending 30 June | ||
|---|---|---|
| Year | Total | Involving weapons (firearms) |
Source: New Zealand Police | ||
| 1993 | 1,501 | 66 (29) |
| 1994 | 1,924 | 100 (26) |
| 1995 | 2,101 | 82 (34) |
| 1996 | 2,067 | 86 (23) |
| 1997 | 1,911 | 97 (36) |
| 1998 | 1,924 | 71 (23) |
| 1999 | 1,878 | 57 (13) |
| 2000 | 1,965 | 59 (19) |
| 2001 | 1,997 | 66 (18) |
| 2002 | 2,150 | 92 (30) |
| 2003 | 2,068 | 84 (27) |
Table 10.19. Drug offences Year ending 30 June
| Offence class | Recorded 2000/01 | Recorded 2001/02 | Recorded 2002/03 | Variance over two years |
|---|---|---|---|---|
Source: New Zealand Police | ||||
| Percent | ||||
| Drugs (not cannabis) | 2,024 | 2,708 | 3,088 | +53 |
| Drugs (cannabis) | 22,395 | 21,131 | 20,626 | -8 |
| Total | 24,419 | 23,839 | 23,714 | |
Table 10.2. Drug seizures By substance Years ending 31 December
| Substance | 2000 | 2001 | 2002 |
|---|---|---|---|
1Seizures of MDMA powder have been converted to tablet equivalent. - nil or zero ... not applicable Source: New Zealand Police | |||
| Amphetamine (grams) | 12,189 | 1,539 | 1,037 |
| Amphetamine (tablets) | - | - | 480 |
| Cannabis leaf (kgs) | 2,467 | 1,847 | 593 |
| Cannabis oil (grams) | 9,500 | 3,147 | 1,342 |
| Cannabis plants (number) | 105,131 | 90,857 | 74,324 |
| Cannabis resin (grams) | - | 435 | 482 |
| Cocaine (grams) | 895 | 8 | 267 |
| Cocaine (coca leaf, grams) | - | 4,253 | 13 |
| Ecstasy (cases) | 112 | 123 | 143 |
| Ecstasy (tablets)1 | 9,352 | 83,449 | 256,350 |
| Fantasy (millilitres) | ... | ... | 5,170 |
| Heroin (grams) | 0.55 | 5,536 | 809 |
| Ketamine (millilitres) | - | - | 0.25 |
| LSD (trips) | 19,331 | 1,057 | 431 |
| LSD (grams) | - | - | 13 |
| Methamphetamine (grams) | 1,370 | 2,632 | 6,402 |
| Morphine (grams) | - | 954 | 887 |
| Morphine (millilitres) | 497 | - | - |
| Morphine (tablets) | 418 | 1,285 | 370 |
| Psilocybine (grams) | - | 483 | 1,192 |
| Psilocybine (mushrooms) | - | 1,295 | 87 |
| Pseudoephedrine and ephedrine (tablets) | 10,308 | 32,653 | 254,987 |
Police Infringement Bureau. The Police Infringement Bureau administers the speed camera programme, the community road watch programme, and is the national processing centre for police-issued infringement offence notices. The bureau also carries out an adjudication function in connection with infringement notices. Police began speed camera operations in 1993 and from 1994 onward have delivered 74,000 hours of speed camera activity a year. Camera sites are selected by road safety and community groups who, together with police, identify areas with a history of speed-related accidents. ‘Anywhere/anytime’ cameras were introduced as part of the government's Road Safety to 2010 package introduced in December 2003. From April 2004, signage indicating speed camera zones were removed to encourage drivers to remain within the speed limits over the whole journey.
Criminal Investigation Branch. The Criminal Investigation Branch (CIB) is dedicated to investigating and solving serious crime, and targeting organised crime and recidivist criminals. The job of the branch is to investigate serious crimes such as homicides, aggravated violence, sexual offending, drug offences, crimes against society and fraud. Law enforcement teams in each police district target crime ‘hot spots’. Modern policing tools assist most complex crime enquiries. A criminal investigation database is used to record and organise information gathered during serious crime investigations. Intelligence-led policing and analytical computer tools are increasingly used to help police detect and suppress crime. Crime mapping is a tool that presents police with information on where certain crimes are being committed, while link charting enables detectives to plot the relationship between criminals and their activities.
More than 7,500 offenders were identified by their fingerprints in the year ending 30 June 2003.
Police dogs. A comprehensive network of police dogs and handlers is maintained throughout New Zealand. During the year ending 30 June 2003, police dogs were deployed to 44,751 incidents. As at 30 June 2003, there were 113 general-purpose dog teams.
The service operated 10 narcotic detector dog teams, three explosive detector dog teams and two firearm detector dog teams. Operations involving police dogs led to the apprehension of 6,835 suspects, clearance of 10,110 offences and the recovery of $606,709 in property, excluding motor vehicles, in the June 2003 year.
Youth Education Service. The Youth Education Service (YES) is the New Zealand Police's national strategy to deliver crime prevention programmes to schools and school communities. The mission of YES is to promote individual safety with school students and school communities and to reduce the level at which these groups become either the perpetrators or the victims of road crashes, crime and anti-social behaviour.
YES promotes a curriculum for schools that has four themes:
Crime prevention and social responsibility.
Drug Abuse Resistance Education (DARE).
School road safety education, eg the Road Sense strategy and school patrols.
Violence prevention, eg Keeping Ourselves Safe (personal safety) and Kia Kaha (bullying).
A team of 125 police education officers delivered 61,671 classroom sessions in schools during the year ending 30 June 2003.
Community constables. Nearly 200 community constables provide a more personal style of policing service in their areas, based on consulting and remaining in touch with their community so they know what their policing needs are.
Specific duties include identifying and assisting in solving local crime and disorder problems; providing crime prevention advice; maintaining a high profile and being approachable to the community and community representatives, including schools and children; and assisting and providing information to community groups and organisations such as Neighbourhood Support, Victim Support and community patrols. Community constables are fully trained uniformed officers who also perform general and road policing duties.
Youth aid section. Under the Children, Young Persons and Their Families Act 1989, the New Zealand Police must follow the principle that unless the public interest requires otherwise, criminal proceedings are not instituted against children or young persons if there is an alternative means of dealing with the matter. There were about 170 youth-aid staff throughout New Zealand at 30 June 2003.
Youth Development Programme workers from the Rahui Pokeka Matua Whangai Trust clear a Waikato River track near Huntly.
Community support groups. The involvement of communities in setting policing priorities is fundamental to the consultative community policing style of the New Zealand Police. Police work closely in a partnership relationship providing and receiving information from independent groups interested in crime prevention such as Neighbourhood Support New Zealand and Community Patrols of New Zealand. Police also work closely with Victim Support, Women's Refuge and other violence intervention, road safety, youth development and health groups interested in reducing crime and victimisation and making communities safer.
10.1 Ministry of Justice; Department of Labour; Law Commission; Legal Services Agency; Crown Law Office.
10.2 Ministry of Justice; New Zealand Council of Victim Support Groups.
10.3 Ministry of Justice.
10.4 New Zealand Police.
www.justice.govt.nz - Crime Prevention Unit
www.crownlaw.govt.nz - Crown Law Office
www.courts.govt.nz - Department for Courts
www.corrections.govt.nz - Department of Corrections
www.dol.govt.nz - Department of Labour
www.dpmc.govt.nz - Department of Prime Minister and Cabinet
www.lawcom.govt.nz - Law Commission
www.lsa.govt.nz - Legal Services Agency
www.justice.govt.nz - Ministry of Justice
www.police.govt.nz - New Zealand Police
www.pco.parliament.govt.nz - Parliamentary Counsel Office
www.jpfed.org.nz - Royal Federation of New Zealand Justices' Association
www.stats.govt.nz - Statistics New Zealand
Table of Contents
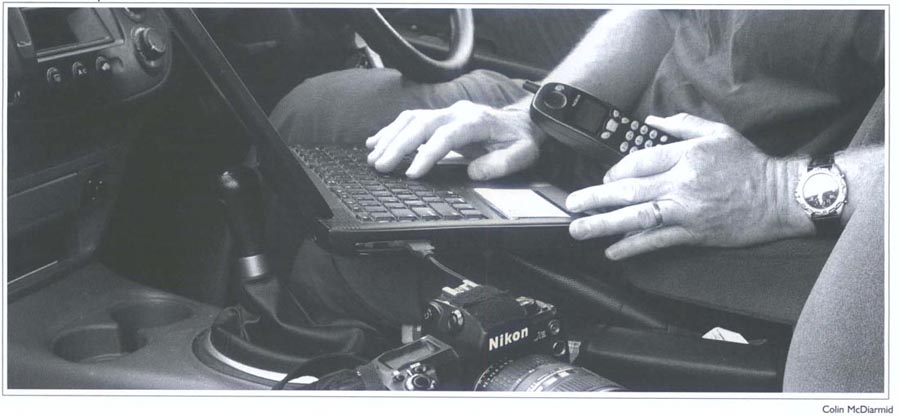
A newspaper photographer uses digital camera, laptop computer and cellphone to download photographic images to his newsroom.
Rapid expansion in the use of computers, the internet, and mobile and digital technology has blurred the traditional distinction between communications - telephone, television, radio, broadcasting, facsimile and film - and information processing and storage.
Consequently, information and communications technologies (ICTs) have transcended their infrastructural role and have emerged as facilitators and enablers for complementary innovations. As such, they function primarily as ‘general purpose technologies’ and have a key role in both enhancing the lives of individuals and communities and accelerating economic growth.
The rapid expansion of the internet has probably caused more social and economic change than any other aspect of ICT. The internet gives individuals, communities, businesses and governments the ability to communicate with millions of others almost instantaneously and at low cost. However, as full participation by local, national and international communities becomes increasingly predicated upon both access to ICTs and the skills to use them, the need to ensure ‘digital inclusion’ is a constant challenge. New technologies also bring new problems, and concerns about cultural colonialism through globalisation, copyright, privacy, security, the spread of pornography and spam need to be addressed.
New Zealand's small size, geographic isolation and technologically-aware population have all contributed to the widespread and rapid uptake of ICTs. Electronic activities such as eftpos transactions, automatic teller machines and internet banking, digital photography, mobile phone texting and email are now well established in the economic and social lives of most New Zealanders.
New Zealand's relatively cheap dial up internet access facilitated the rapid adoption and diffusion of internet use. However, it may also have been responsible for a slower uptake of broadband services, since the expense of the latter is still comparatively high and the telecommunications companies provide few opportunities for uncapped data options. Nationwide availability of broadband throughout New Zealand was expected to be achieved by the end of 2004 as a result of a joint government and private sector initiative, Project PROBE.
New Zealand's light-handed regulatory approach means there are no specific licensing requirements to commence business as a telecommunications carrier, and no foreign ownership restrictions. This has allowed telecommunications companies to offer the whole range of ICT services, including television, telephony and internet access.
Competition has flourished and at the beginning of 2004, 16 companies were offering telecommunication services and there were 168 Internet Service Providers. In addition, internet cafes were common throughout the country, providing an hour's internet access for as little as $4.00.
Internet use. Although the government was indirectly involved in establishing the internet through its funding of universities and other research institutions, commercial internet services have been developed entirely by the private sector. Responsibility for domain name registrations in the .nz domain (for example, stats.govt.nz) lies with Internet NZ (formerly the Internet Society of New Zealand). The Maori Internet Society, established with help from the Maori Language Commission among others, promotes a strong Maori presence on the internet and has successfully established the .maori.nz internet domain name. In general, there are minimal restrictions on New Zealand organisations registering a domain name in the .nz domain. At 30 December 2003, there were 142,468 registrations in the .nz domain, 310 in the .maori.nz domain and 59 in the .iwi.nz domain. In a 2003 e-government survey, more than 75 percent of New Zealanders had used the internet in the previous month, a higher proportion than in any other country. In the 10 years to 2004, the number of homes with a computer more than doubled, with 52 percent having at least one. While it is true that there is a strong relationship between internet usage and income, New Zealanders have a high level of accessing the internet on computers other than their own.
Figure 11.01 shows the growth in internet access since 1996, while figure 11.02 shows the most popular internet activities in the quarter ending 31 December 2003.
Figure 11.01. Growth in internet access
Proportion of New Zealanders with internet
access at any location Years ending 30 September
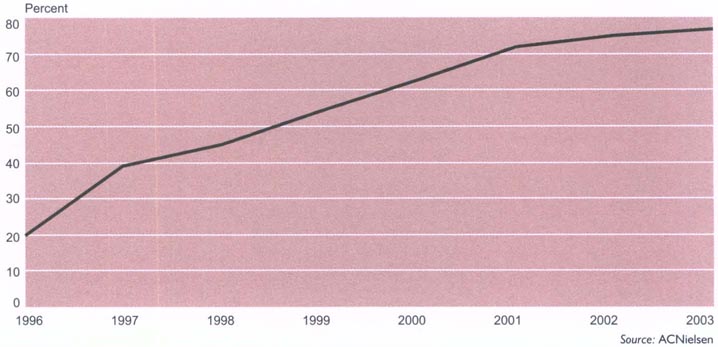
E-government. The government has been quick to take advantage of the opportunities offered by information and communication technologies to drive its e-government vision of New Zealanders being able to access ‘government information and services, and participate in our democracy, using the internet, telephones and other technologies as they emerge’.
A four-phase strategy for the integration of information, service delivery and government processes from a single point by 2010 is being implemented.
Already, access to most government agencies is available online, through the ‘all of government’ web portal.
Indications are that e-government is welcomed by New Zealanders, with ACNielsen research showing that New Zealand government websites as a whole group (.govt.nz) are in the top five accessed by New Zealanders.
E-commerce. Information and communications technologies (ICTs) have created new opportunities for basic business activities to be web-enabled and/or conducted electronically, and indications are that New Zealand companies have responded well to the digital economy.
Business surveys show that 88 percent of New Zealand businesses use computers for an increasing variety of e-business activity, including electronic financial transactions, recruitment, purchasing, delivery coordination and training.
The government's original Electronic Commerce Strategy was focussed on establishing a regulatory, business and social environment supportive of e-commerce. An electronic commerce action team worked between 2001 and 2003 to help drive the uptake of e-commerce by New Zealand businesses, the success of which was reflected in rapid expansion of e-business capability.
As part of the government's Growth and Innovation Framework (GIF) 2002, ICT was targeted as one of three significant high-growth, high-value areas.
An ICT taskforce was set up charged with setting a vision for ICT development and cross-sector enablement. A number of initiatives followed the taskforce's report, aimed at increasing expertise in the ICT area, raising awareness of ICT and improving business capability in the ICT sector.
HiGrowth, a joint industry/government initiative, is strongly focussed on increasing the capability of the ICT sector.
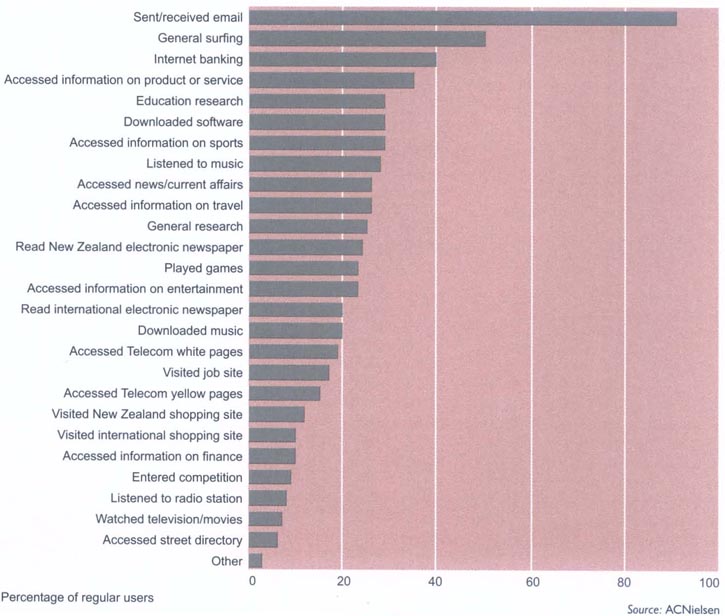
Seventy-nine percent of New Zealand businesses have internet access, which is higher than averages found in comparable Organisation for Economic Co-operation and Development countries such as Australia and Canada.
Eighty-seven percent of large businesses operate a website, though this figure drops to 44 percent for the smallest companies, which comprise the bulk of New Zealand businesses.
Employment in IT industries (excluding telecommunications services) reached 36,440 in 2002, more than double the 1988 figure.
New Zealand has a highly competitive IT market, with a range of equipment and software companies supplying both the domestic market and niche export markets overseas.
The total value of the New Zealand IT industry, excluding communications services, in the 2002 financial year was estimated at $7,055 million, up 1 percent on the previous year. This figure includes an unidentified amount of double counting of retail and wholesale sales.
Table 11.01 shows the growth in end-user IT sales between 1997 and 2002.
TUANZ. The Telecommunications Users' Association of New Zealand (TUANZ) recognises the value of effective and efficient use of information technology in business and is committed to leading the innovative use of e-commerce in New Zealand. The purpose of TUANZ is to lead informed and sophisticated usage of technology-based communications by New Zealand businesses. TUANZ has an interactive group involved in raising awareness of, and developing, interactive multimedia, an education group working with the teaching fraternity and a contact centre group, which works to raise the standard and develop the potential of the contact centre industry in New Zealand.
Table 11.01. Percentage changes in end-user IT sales
| 1997 | 1998 | 1999 | 2000 | 2001 | 2002 | |
|---|---|---|---|---|---|---|
1The 2002 figure was an estimate so no percentage change is shown. Source: Ministry of Economic Development | ||||||
| Single user computer systems | -12.4 | 3.5 | 5.4 | -11.2 | 11.3 | 22.8 |
| Multi-user computer systems | -5.8 | -0.2 | -2.5 | -10.9 | -2.0 | 16.0 |
| Peripheral computer equipment | -5.7 | 11.6 | 14.3 | -9.3 | 3.2 | 17.5 |
| Communications hardware and cables | 15.9 | -7.8 | -19.8 | 39.1 | 26.3 | -12.1 |
| Software sales | -13.9 | 27.7 | 24.3 | -15.9 | 27.0 | 3.0 |
| Computer services | 4.5 | 13.7 | 17.2 | 15.9 | 2.7 | -3.4 |
| Training and education in IT1 | 2.4 | -1.3 | 41.1 | 53.5 | 11.3 | - |
| Total New Zealand end-user IT sales | 6.2 | 7.9 | 9.1 | 6.2 | 8.6 | 0.7 |
In 1988, the government embarked upon a series of legislative, regulatory and institutional changes intended to improve economic efficiency in the broadcasting sector.
The Broadcasting Corporation of New Zealand (BCNZ) was restructured as two separate state-owned enterprises - Television New Zealand (TVNZ) and Radio New Zealand (RNZ) - which were required to return a profit. Transmission assets were passed to Broadcast Communications Ltd (BCL), incorporated in 1989. Deregulatory measures to promote competition across the sector and reduce restrictions on foreign ownership were also adopted. A regime to maintain broadcasting standards was established and a set of local content objectives adopted and supported by contestable funding distributed via NZ On Air and, since 1993, Te Mangai Paho.
In 1995, the Radio New Zealand Act changed the status of RNZ from a state-owned enterprise to a Crown company with its own charter.
After a decade in which the direction and development of broadcasting has largely been driven by the commercial priorities introduced by the restructuring of the late 1980s, the current government has re-claimed a significant role in broadcasting. It has given a renewed priority to the role of broadcasting in contributing to the nation's culture and identity, and in the promotion of a well-informed participatory democracy, including encouragement of a diversity of sources of information. A number of significant changes have occurred, rebalancing within the mixed broadcasting economy the place of public broadcasting principles, objectives and institutions.
In July 2000, the government formulated a set of objectives to ensure that desired kinds of broadcast content were available to the New Zealand public. The objectives guided subsequent decisions, such as reorientation of the direction of TVNZ, and the allocation of non-commercial spectrum. These objectives are:
Ensuring that all New Zealanders have reasonable and regular access to broadcasting representing the uniqueness and diversity of New Zealand life, recognising that the histories and stories of whanau, hapu and iwi are integral to any description of that life.
Meeting the information and entertainment needs of as many interests as reasonably possible, including those that cannot be met by commercial broadcasting.
Contributing to public awareness of, and participation in, the political and social debates of the day.
Providing for minority interests and increased choice.
Encouraging innovation and creativity in broadcasting, while aiming to continually increase audience satisfaction with the quality of content.
One of the most significant changes resulting from these objectives was the Television New Zealand Act 2003, which transformed TVNZ from a state-owned enterprise into a Crown company. Its charter set out in broad terms the kind of programming it was to provide. The act requires TVNZ to keep a balance between giving effect to the public broadcasting objectives embodied in the charter and maintaining its commercial performance. In 2003/04, the government granted direct funding to TVNZ for charter purposes of $15 million.
Broadcasting Commission (NZ On Air). The Broadcasting Commission's role is to promote in broadcasting cultural and social objectives and such other activities seen as unlikely to receive sufficient commercial provision. Members of the Broadcasting Commission, which operates as NZ On Air, are appointed by the governor-general on the recommendation of the Minister of Broadcasting.
The statutory objectives of NZ On Air are to:
Reflect and develop New Zealand identity and culture by promoting programmes about New Zealand interests and by promoting Maori language and culture.
Maintain and, where considered appropriate, extend television and radio coverage to New Zealand communities that otherwise would not receive a commercially-viable signal.
Ensure programmes are available to provide for the interests of women, youth, children, people with disabilities and minorities in the community, including ethnic minorities, and encourage broadcasts that reflect the diverse religious and ethical beliefs of New Zealanders.
Encourage the archiving of programmes likely to be of historical interest to New Zealand.
NZ On Air fulfils these objectives by providing funds for the broadcasting, production and archiving of programmes. When allocating funds for programme production, NZ On Air is required to take into account such factors as availability of other sources of funding, likely audience size and the likelihood of a programme being broadcast. Funding of NZ On Air's activities is a charge against Vote: Culture and Heritage. In the 2002/03 financial year, NZ On Air spent $58.9 million on the production of television programmes and $22.2 million on National Radio and Concert FM. It also spent $1.1 million on remote television and radio coverage, $3.7 million on New Zealand music projects, $1.1 million on broadcasting archives and $632,000 on a variety of programmes for commercial radio.
The NZ On Air website is www.nzonair.govt.nz
NZ On Air spent $58.9 million on the production of television programmes in its 2002/03 financial year.
Broadcasting standards. The Broadcasting Standards Authority is a Crown entity set up by the Broadcasting Act 1989, reporting to parliament through the Minister of Broadcasting. The authority's mission is to encourage broadcasters to develop and maintain programme standards which respect human dignity, reflect current social values and acknowledge research findings, while providing a process for the consideration of complaints from the public about broadcasting standards. The authority does not deal with complaints about advertisements except for party-political and parliamentary candidate advertising on radio and television during the lead-up to an election. The authority consists of four members, one of whom is appointed after consultation with broadcasters and another after consultation with public interest groups. Of the 182 complaints determined by the authority in the year ending 30 June 2003, 32 were upheld in total or in part, 139 were not upheld and 11 were interlocutory decisions. Of the complaints upheld, 44 percent related to matters of good taste and decency (including language) and 37 percent related to balance, fairness and accuracy. Nine complaints were upheld against Television New Zealand broadcasts, three against TV3 Network Services, none against Sky Network Television and one against Radio New Zealand. Nineteen complaints (59 percent) were upheld against other radio and television broadcasters.
The authority's website is www.bsa.govt.nz
Election broadcasting. Under the Broadcasting Amendment Act 1996, the Electoral Commission is responsible for the allocation to political parties of free broadcasting time and funding for party political advertising broadcast before an election.
Maori broadcasting. Under the Radio Communications Act 1989, frequencies suitable for radio and television were reserved throughout New Zealand for the promotion of Maori language and culture, and there were 21 iwi-based radio stations at the beginning of 2004. Since 1989, NZ On Air has provided public funding for the operating and capital costs of Maori radio stations and for the production of Maori programmes broadcast on network television. The Broadcasting Amendment Act 1993 established a new Maori broadcasting funding agency, Te Reo Whakapuaki Irirangi (now known as Te Mangai Paho). On 1 January 1995, Te Mangai Pho assumed primary responsibility for allocation of public funding for Maori broadcasting. This includes purchase of Maori language programming broadcast on national television and iwi radio, and some Maori radio programming produced by national providers and available to iwi stations through a radio programme distribution service. In 2001, the government confirmed the establishment of a Maori television channel, which began transmissions on 28 March, 2004. The principal function of the service is to promote te reo Maori me nga tikanga Maori through the provision of a high-quality, cost-effective Maori television service, in both Maori and English, which informs, educates and entertains, and in doing so, enriches New Zealand's society, culture and heritage.
The telecommunications market in New Zealand was fully opened to competition on 1 April 1989. Telecom New Zealand Ltd was established as a state-owned enterprise on 1 April 1987 following the breakup of the New Zealand Post Office and is the provider of the most extensive range of telecommunication services throughout the country. Other companies offering telecommunication services at January 2004 included TelstraClear, Vodafone, WorldxChange, TeamTalk, Compass, Call Plus and Ihug. The main competitive telecommunication services are international, national and cellular telephone calls.
There is competition in the supply of local telephone and data services to businesses in central business districts. The number of areas where there is residential telephone service competition is increasing, with TelstraClear initially offering fixed line telephone services in Wellington and Christchurch. Woosh Wireless and Counties Power are deploying wireless solutions for fixed line access to offer competitive telephone and data access services.
A particular feature of New Zealand's residential toll service market are calls up to a set duration that have a capped charge applied, such as $3 capped national calls, $4 capped calls to Australia and $8 capped calls to the United States and Canada and the United Kingdom and Ireland. A $5 capped call option for national peak calls is also available to residential users.
A Telecommunications Commissioner within the Commerce Commission administers regulated telecommunication services that include network interconnection, telephone number portability and wholesale telecommunication services. The commissioner's key functions are to resolve disputes over regulated services, to report to the Minister of Communications on the desirability of regulating additional services, and to calculate and allocate the net cost of telecommunication service obligations. Telephone density is high in New Zealand, with more than 96 percent of households having access to a telephone. The number of mobile phones has increased in recent years and at the beginning of 2004, more than 67 percent of the population had a mobile phone. Fifty-eight percent of all homes had mobile phones. Telecom and Vodafone provide cellular mobile phone services, with their networks giving extensive coverage of New Zealand.
Telecom Corporation of New Zealand Ltd (Telecom). Telecom is New Zealand's leading supplier of telecommunication services. Telecom provides a full range of telecommunication and online services to residential and business customers in New Zealand, and in Australia through its voice and data business, AAPT. Telecom has New Zealand's most extensive telecommunications network, which stretches from Kaitaia to Bluff. Telecom invested $3.3 billion in maintaining and upgrading its network in the five years to 2004. Telecom has 1.792 million fixed line residential and business customers in New Zealand. Of these, 1.2 million have access to fast internet. Telecom has been privately owned since September 1990 when it was purchased from the government for $4.25 billion. The purchaser was a consortium of two leading United States telecommunications suppliers, Bell Atlantic and Ameritech, and two New Zealand companies, Fay Richwhite and Freightways. Today, about 20 percent of Telecom's shareholding is held locally. In May 1996, Telecom launched XTRA - an internet access, navigation and content service, which today has approximately 432,000 active customers. Through Telecom's ongoing investments, its customers are able to access the latest ways of keeping in touch, doing business and being entertained. The Telecom website is www.telecom.co.nz and the XTRA website is www.xtra.co.nz
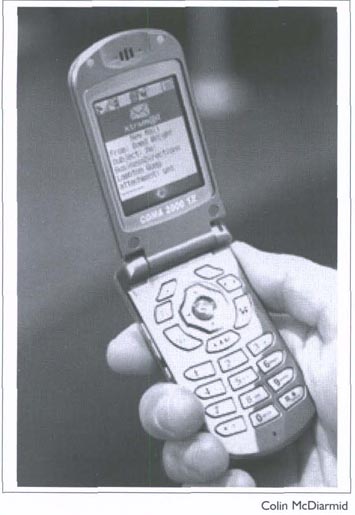
At the beginning of 2004, there were mobile phones in 58 percent of New Zealand homes.
Broadband. Broadband (high speed internet) data services share the characteristics of high speed and being ‘always on’ (ie it is unnecessary for users to establish specific connections to a service provider). Definitions of ‘high speed’ vary, but a generally-accepted definition is a minimum of 256,000 bits of data per second (256 Kbps), both upstream (from the user) and downstream (to the user). Almost nationwide coverage is available through mobile and satellite technologies and digital subscriber line (DSL) offers 85 percent coverage. Low levels of residential uptake are mainly responsible for New Zealand's slow broadband uptake, primarily because the price of dial-up has been kept low. Business penetration of broadband technology is comparatively high, however, with 8 percent of New Zealand's significant businesses using it, compared with 3.5 percent in the United Kingdom and 3 percent in Australia. By far the most common broadband access is via the telephone copper network using asymmetric data subscriber line (ADSL). At the beginning of 2004, there were more than 50,000 subscribers to Telecom's Jetstream service, although that figure included a large number of Jetstart subscribers who use 128 Kbps rather than 256 Kbps. There were also 4,500 subscribers to TelstraClear's cable service, limited to the Wellington, Hutt Valley and Kapiti Coast areas. In addition, a small but rapidly-growing number of users subscribe to wireless services offered by provides such as Woosh Wireless (Auckland, Wellington, Christchurch, Southland) and Counties Power (South Auckland and North Waikato). Broadcast Communications Limited (BCL) also offers commercial services on a national basis through extend wireless broadband (EWB).
A number of relatively small, localised, wireless operators have entered the telecommunications market offering broadband wireless services using general user radio licence spectrum (2.4 and 5 GHz bands), including Cafenet in Wellington, Hawke's Bay Internet, The Pacific.Net (Tasman and Buller districts) and South Waikato Networks Limited. In addition, there are many private or semi-private networks using general user licence spectrum. Since operators are not required to obtain permits or to register services, the number of such networks is not known.
Identification of the potential exclusion of the rural community because of the commercial non-viability of providing high speed internet access resulted in a joint government and private sector initiative in 2002, Project PROBE, to roll out high speed internet access to all schools and provincial communities by the end of 2004. The project was expected to provide broadband coverage for about 95-97 percent of New Zealand by that date. A secondary objective is to encourage competition in the telecommunications market outside of the larger metropolitan centres. The government's initiative has already brought about substantial change in the telecommunications scene in New Zealand. In the 12 months to December 2003, broadband coverage increased from 68 percent to 91 percent of all schools, including 53 percent of schools identified in PROBE tendering documents as requiring access.
Telecommunications relay service. The government is establishing a telecommunications relay service (TRS) to help ensure that the telephone communication needs of deaf, hearing-impaired and speech-impaired New Zealanders are met. Provision of the TRS was tendered late in 2003 and it was expected that the service would commence in 2004.
TelstraClear Limited. TelstraClear Limited is New Zealand's second largest full service communications company, providing innovative, market-leading products and services to the business, government, wholesale and residential sectors. TelstraClear provides a choice in the New Zealand communications market and seamless services to trans-Tasman customers. TelstraClear serves more than 300,000 business and residential customers in every central business district and in more than 30 regional centres. This represents more than 13 percent of the New Zealand market through a full voice, data, internet protocol and cable television product range. TelstraClear Limited is wholly owned by Telstra Corporation Limited, Australia's largest telecommunications company. The TelstraClear website is www.telstraclear.co.nz
Television New Zealand Ltd (TVNZ). TVNZ operates two national television channels, TV ONE and TV2, and has several subsidiary companies. TVNZ's local and international activities include programme production, an internet portal, outside broadcasting services, multi-media development, merchandising, teletext, signal distribution and programming supply.
Government redesignation of TVNZ from a state-owned enterprise (SOE) to a Crown-owned company (CROC) has meant separation of television and transmission services. The transmission business became an SOE from 1 January 2004.
As a CROC, the primary purpose of the television business is to meet its charter objectives, which are to inform, educate and entertain all New Zealanders, reflecting and fostering New Zealand's identity and culture. Both TV ONE and TV2 broadcast 24 hours a day, seven days a week. In 2003, 88 of the 100 most-watched programmes in New Zealand were broadcast by either TV ONE or TV2. TV ONE presents New Zealand and overseas drama, news, sport and information programming. TV2's mix of comedy, drama, children's, movie and entertainment programming is aimed at a younger audience. Imported programming for both channels is sourced mainly from the United Kingdom, the United States and Australia. TVNZ group revenue for the financial year ending 30 June 2003 was $492.lm, compared with $477.3 million in the previous financial year. Net surplus after taxation was $29.1 million, compared with $19.3 million in the 2002 financial year
The TVNZ website is www.tvnz.co.nz
TV3 Network Services Ltd. TV3, New Zealand's only privately-owned, free-to-air national television network, has been on air since November 1989. Headquarters are in Auckland, with offices and studio facilities in Wellington, Hamilton, Christchurch and Dunedin. TV3 is 100 percent owned by CanWest Global Communications Corporation, a Canadian communications company, and reaches 98 percent of New Zealand's population. The network, a broad-based entertainment channel, primarily targets viewers aged 18-49, with a strong emphasis on news, current affairs, sport and local programming. TV3's documentary series, Inside New Zealand, has won national and international awards. Internationally-sourced programmes come primarily from the United States. TV3 has exclusive agreements with FOX and Universal, as well as the ability to source drama and comedy from many other international distributors. In June 1997, TV3 launched a second free-to-air channel on VHF frequency, TV4. TV4 was relaunched as the free-to-air music channel C4 in October 2003. Targeting young, urban Kiwis aged 15-29, C4 runs daily from 4pm to midnight and to lam on Fridays and Saturdays. Twenty-five percent of videos played on C4 are local. C4 operates from TV3 studios in Auckland.
Table 11.02 shows local content programming by the free-to-air television networks from 1990 to 2002.
Table 11.02. Hours of local content on network television
| Year | TV One | TV2 | TV3 | Total |
|---|---|---|---|---|
1The decrease in hours in 1993 was mainly because coverage of the Olympic Games significantly increased the hours of local content broadcast in 1992. Source: NZ On Air | ||||
| 1990 | 2,474 | 772 | 1,003 | 4,249 |
| 1991 | 1,811 | 1,016 | 1,212 | 4,039 |
| 1992 | 2,526 | 1,227 | 1,962 | 5,715 |
| 19931 | 2,005 | 1,042 | 1,741 | 4,788 |
| 1994 | 2,210 | 1,041 | 1,718 | 4,969 |
| 1995 | 2,532 | 1,113 | 1,373 | 5,018 |
| 1996 | 2,407 | 1,255 | 1,404 | 5,066 |
| 1997 | 2,638 | 1,324 | 1,639 | 5,601 |
| 1998 | 3,503 | 1,307 | 1,487 | 6,297 |
| 1999 | 3,516 | 1,334 | 1,292 | 6,142 |
| 2000 | 3,544 | 1,158 | 1,484 | 6,186 |
| 2001 | 3,587 | 1,298 | 1,305 | 6,190 |
| 2002 | 4,003 | 1,758 | 1,439 | 7,200 |
Prime Television. In 1997, Prime Television acquired 34 UHF licences covering all major cities and towns in New Zealand and commenced broadcasting in August 1998. Prime Television is a free-to-air terrestrial broadcaster with its main office in Albany, Auckland, and regional sales offices in Hamilton, Tauranga, Wellington, Christchurch and Dunedin. An initial potential reach of 65 percent of the population had been expanded to 71 percent (2.1 million) by the end of 2001 and to more than 90 percent by November 2003. In March 2002, Prime Television began broadcasting an entertainment-based programme schedule following a joint venture agreement with the Nine Network of Australia, departing from its initial British programming line-up.
SKY Network Television Ltd. SKY Network Television Ltd is a pay television company which began broadcasting in May 1990 using scrambled UHF channels. At 31 December 2003, SKY had 548,041 residential and 7,898 commercial subscribers. SKY's UHF signal reaches more than 80 per cent of New Zealand households. In December 1998, SKY launched its digital direct broadcast satellite service, which reaches all of New Zealand's estimated 1.4 million television households. SKY broadcasts more than 70 entertainment channels on its digital satellite platform and five on its UHF terrestrial platform. SKY owns and operates seven of its channels, including SKY Sports channels, SKY 1, the Rugby Channel and SKY Movie channels.
Regional and local television services. A number of small regional television services operate throughout New Zealand, providing programmes ranging from music television services to mixed local and international news and entertainment services. Other services provide information about local events and attractions, targeted primarily at tourists. Local television services operating at 31 December 2003 included: Family Television Network (Warkworth), Triangle Television (Auckland), Big TV (Hamilton), Geyser Television (Rotorua), Eastland Television (Gisborne), Channel 61 (Taupo), Channel 51 (Hawke's Bay), Taranaki Community Television Trust (Taranaki), Mainland Television (Nelson), CTV (Christchurch), Channel 9 (Dunedin) and Mercury Television (Invercargill).
Trackside. Trackside broadcasts live racing, race results and programmes about racing on a nationwide basis, using UHF and satellite frequencies. It is owned by the New Zealand Racing Board.
Non-commercial television. The government has reserved UHF frequencies nationwide for the provision of non-commercial (community access) television services.
Since 1998, the Ministry of Economic Development, latterly on the recommendation of the Ministry for Culture and Heritage, has offered licences for non-commercial use to broadcasters in the Far North, Auckland, Waikato, Bay of Plenty, Taranaki, Wellington, Nelson/Marlborough, Christchurch and Oamaru regions. Triangle Television has been broadcasting in Auckland since July 1998 and Taranaki Community Television Trust Inc started broadcasting in December 1999. Channel 7 broadcast in Wellington from June 1999 until October 2003 when its licence was revoked.
The radio broadcasting sector consists of the public radio service, RNZ; two major private owners of radio networks; other private stations; a publicly-funded pilot Pacific radio service, Niu FM; a series of non-profit community stations; student radio stations; and a network of 21 iwi radio stations throughout the country.
In November 2001, the government gave priority to reserving frequencies for:
National Radio to be broadcast on FM. National Radio now simulcasts on reserved FM frequencies.
Concert FM to migrate to a designated group of frequencies in the upper FM band. Following a decision that Concert FM will not now make use of these frequencies, they remain in reserve pending future decisions on the nature of youth radio services.
Maori radio to enable establishment of a national service for the promotion of Maori language and culture. Further decisions on the use of these frequencies are pending.
Pacific Island radio to enable establishment of a national service for Pacific peoples in New Zealand. The National Pacific Radio Trust has been established and government funding provided for a pilot Pacific radio network, Niu FM.
Radiocommunications. The radio spectrum is an important resource managed by the Crown, through the Ministry of Economic Development, on behalf of the people of New Zealand. The efficient use of this resource to provide telecommunications and broadcasting services is essential to the functioning of a modern economy.
The main legislative vehicle for managing the radio spectrum in New Zealand is the Radiocommunications Act 1989, which provides for a market-based system of spectrum management, with up to 20-year tradeable spectrum access rights. The Radiocommunications Amendment Act 2000 allows greater flexibility in the Crown's management of the radio spectrum.
Allocation by tender/auction. The Radiocommunications Act 1989 heralded a new era for radio spectrum management, enabling the use of market-driven allocation mechanisms for the distribution of spectrum rights.
Radio spectrum was initially sold in 1989 and 1990 using a second-price tender system, then later by first-price tenders. In 1996 an internet-based computer system was developed for the sale of spectrum by auction.
There were six rounds of tenders and six auctions between 1989 and 2003. Frequencies auctioned included bands suitable for UHF television, AM and FM radio broadcasting, mobile telephony (including 3G), and fixed wireless telecommunications. Once spectrum rights have been sold by the Crown, the purchaser has the right to resell and transfer these rights to other parties.
Other allocation methods. The administrative licensing regime that existed prior to 1989 still exists in many bands. These bands are planned for various services, and licences are available on application by persons wishing to utilise these frequencies in accordance with these plans. Examples include land mobile and various public safety and civil aviation agencies.
While bands allocated to broadcasting are no longer managed under the administrative licensing regime, not all of the corresponding licences are allocated through a market process. Most broadcasters who were operating in 1989 received licences for a fee determined by a legislated formula. Some frequencies have also been reserved for public broadcasting, non-commercial broadcasting, and for the promotion of Maori language and culture.
From 2010, spectrum rights will begin to expire, and in 2003 the government agreed on a policy regarding the renewal of commercial rights. The policy creates a presumption that current rightholders will receive an offer for the renewal of their rights for a further 20 years at a price to be determined by a price-setting formula being developed by the Ministry of Economic Development.
Finally, not all use of the spectrum is on an individually-licensed basis. There are also spectrum ‘public parks’, which anyone may use in accordance with the terms of the corresponding general user licence. These are often used for consumer devices such as garage door openers.
Public radio. Radio New Zealand was incorporated as a Crown-owned company under the Radio New Zealand Act 1995. This act established the Radio New Zealand Charter, which set out the company's broadcasting functions.
In 2000, parliament's commerce select committee undertook the first five-yearly review of the charter. Following the committee's recommendations, the government introduced the RNZ Amendment Bill, which proposed minor changes to enhance charter requirements on reporting and public consultation, and recognition of the importance of Radio New Zealand International as a component of RNZ.
In 2000, National Radio and Concert FM also began to be carried by Sky Network Television's digital satellite.
RNZ receives annual funding of about $28 million (including GST) from NZ On Air to maintain and enhance its services and to fund the migration of National Radio to FM.
Funding for Radio New Zealand International, which broadcasts to the Pacific region, has been transferred from the Ministry of Foreign Affairs and Trade to the Ministry for Culture and Heritage.
Radio New Zealand. Radio New Zealand Ltd is a Crown entity established by the Radio New Zealand Act 1995. The company is New Zealand's public radio broadcaster consisting of three noncommercial radio networks: National Radio, Concert FM and the AM Network; a shortwave service: Radio New Zealand International; a news service: Radio New Zealand News and Current Affairs; and Sound Archives/Nga Taonga Korero.
National Radio and Concert FM are funded through New Zealand On Air.
National Radio focuses primarily on news and information, with a mix of features, drama and entertainment programmes. News bulletins are on the hour, every hour and Morning Report is regarded as the country's most authoritative news programme. Broadcasting 24 hours a day, the network reaches most New Zealanders on the AM band and FM in all main metropolitan centres and several provincial areas.
Concert FM is Radio New Zealand's fine music network, broadcasting a programme of mainly classical music and spoken features about music, 24 hours a day on the FM band. Both Concert FM and National Radio are also available through the SKY Television network. The AM Network broadcasts all sittings of parliament from transmitters in Auckland, Napier, Wellington, Christchurch and Dunedin. When not used for parliament, the network is leased out.
Radio New Zealand International is the country's international shortwave service, providing news and information programmes to listeners in the Pacific 24 hours a day. Radio New Zealand International's 100 kilowatt signal is beamed to the South Pacific, but can be heard by listeners as far away as Japan, North America, the Middle East and Europe.
Radio New Zealand News provides comprehensive news coverage, current affairs and specialist reporting for National Radio and Concert FM. International news services, correspondents overseas and reporters throughout New Zealand deliver news to listeners throughout the day.
Sound Archives Nga Taonga Korero is a subsidiary of Radio New Zealand which gained archive status under section 90 of the Copyright Act in 1998/99, allowing material broadcast by any New Zealand network or station to be archived without breaching copyright. This enabled Sound Archives Nga Taonga Korero to become a truly national collection, representing all broadcast radio providers in New Zealand, as well as preserving existing collections largely created during the era of state-owned radio.
The Radio Network of New Zealand Ltd. The Radio Network became a private radio broadcaster on 1 August 1996 when a consortium comprising Australian Provincial Newspapers Holdings Ltd (a radio, newspaper and outdoor advertising group) and Clear Channel Communications Incorporated (the United States' largest radio, television and outdoor advertising operator) purchased the assets of Radio New Zealand Commercial from the New Zealand Government.
The Radio Network operates 94 wholly-owned radio stations throughout New Zealand with the following programme brands: Newstalk ZB (22 stations), Classic Hits (25 stations), Radio Sport (18 stations), ZM (12 stations), Radio Hauraki (10 stations), Easy 1 (4 stations) and three single format stations - Cool Blue, The Coast and The Planet.
According to Research International RADIOS National Database 2003, the Radio Network reaches a listening audience of approximately 1.3 million New Zealanders aged 10 and over on a weekly basis, 54 percent of whom are aged 25-54 and 48 percent of whom are the main household shopper.
Non-commercial radio broadcasting. The Crown has reserved AM and FM radio frequencies throughout New Zealand for use by non-commercial broadcasters. AM frequencies have been reserved in all communities with populations of 10,000 or more. Broadcasters may have access to reserved spectrum for non-profit, community purposes. Licences are allocated to appropriate community organisations, who are responsible for ensuring that all interested groups have access to airtime on the frequencies.
Access radio stations operating on reserved frequencies provide airtime on a non-profit basis to a range of minority groups in the community. In 2002/03, there were 11 access radio stations in New Zealand. All were assisted by NZ On Air, whose funding for access radio in 2002/03 was $1.6 million. Applications for frequencies are received by the Ministry of Economic Development and allocated on the advice of the Ministry for Culture and Heritage.
New Zealand has a high number of daily newspapers in relation to its population. There are 24 daily newspapers, of which 16 are afternoon papers published in provincial towns and cities.
The Auckland-based New Zealand Herald had the largest 2003 audited net circulation of 210,910 copies daily. The biggest provincial paper in 2003 was Hamilton's Waikato Times, with an audited net circulation of 40,970. Other daily newspapers have circulations ranging from about 2,000 to more than 100,000.
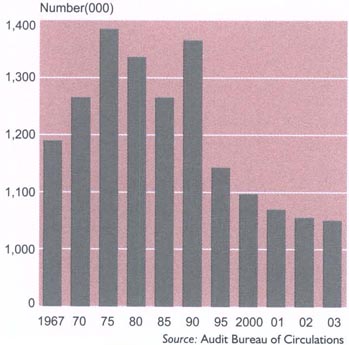
Table 11.03 shows newspaper circulation figures for 2001-03. Figure 11.03 shows the impact internet usage had on newspaper circulations in the decade to 2003.
Table 11.03. Newspaper circulation At 31 March
| Paper (date founded) | 2001 | 2002 | 2003 |
|---|---|---|---|
1Formed from integration of The Evening Post (1865) and The Dominion (1907). 2Formed from integration of Hawke's Bay Herald Tribune - Hastings (1857) and Daily Telegraph - Napier (1871). 3Latest audit. Source: Audit Bureau of Circulations | |||
| The New Zealand Herald - Auckland (1863) | 209,898 | 210,841 | 210,910 |
| The Dominion Post1 - Wellington (2002) | - | 99,089 | 101,511 |
| The Press - Christchurch (1869) | 91,003 | 92,713 | 91,111 |
| Otago Daily Times - Dunedin (1861) | 43,350 | 44,352 | 44,546 |
| Waikato Times - Hamilton (1872) | 40,427 | 41,121 | 40,970 |
| Hawke's Bay Today2 - Hastings (1998) | 31,787 | 31,665 | 30,079 |
| The Southland Times - Invercargill (1862) | 30,922 | 30,840 | 29,928 |
| The Daily News - New Plymouth (1857) | 26,579 | 26,784 | 26,687 |
| Bay of Plenty Times - Tauranga (1872) | 22,450 | 22,726 | 23,285 |
| The Manawatu Evening Standard - Palmerston North (1880) | 20,861 | 20,840 | 20,357 |
| The Nelson Mail (1866) | 18,102 | 18,274 | 18,312 |
| The Northern Advocate - Whangarei (1877) | 15,042 | 15,319 | 15,112 |
| The Timaru Herald (1864) | 14,004 | 14,308 | 14,360 |
| Wanganui Chronicle (1856) | 13,772 | 14,059 | 14,075 |
| The Daily Post - Rotorua (1885) | 11,866 | 11,955 | 11,979 |
| The Marlborough Express - Blenheim (1866) | 10,326 | 10,113 | 10,173 |
| The Gisborne Herald (1874) | 8,669 | 8,623 | 8,573 |
| Wairarapa Times-Age - Masterton (1878) | 8,061 | 7,713 | 7,585 |
| Ashburton Guardian (1879) | 5,610 | 5,497 | 5,554 |
| The Greymouth Evening Star (1866) | 4,606 | 4,266 | 4,219 |
| Horowhenua-Kapiti Chronicle - Levin (1893) | 3,663 | 3,7895 | 3,789 |
| The Oamaru Mail (1876) | 3,728 | 3,644 | 3,464 |
| Evening News - Dannevirke (1909) | 2,273 | 2,221 | 2,174 |
| The Westport News (1872) | 2,167 | 2,0103 | 2,010 |
The majority of daily papers are owned by two major publishing groups, Fairfax New Zealand Ltd and APN New Zealand Ltd. Between them, these groups account for just over 90 percent of New Zealand's aggregate daily newspaper circulation of about 740,000. The previously dominant pattern of single family, or partnership, newspaper ownership survives only in some centres.
Daily newspapers are widely read. On a typical day, more than 1.7 million New Zealanders aged 15 and over read a newspaper, and New Zealanders spend approximately $2.5 million a week on daily and Sunday newspapers.
At 30 June 2004, there were two Sunday newspapers, Sunday Star-Times and Sunday News, both published by Fairfax New Zealand Ltd and distributed nationwide. The Sunday Star-Times circulates around 204,000 copies every Sunday.
There are also approximately 120 community newspapers in New Zealand, the great majority of which are tabloid in format. Many of these are owned by the two big newspaper publishing groups, or by publishers of other newspapers outside the groups. Some are owned by individuals or small companies.
There are more than 6,000 magazines available in New Zealand on a regular basis, 650 of which are published in New Zealand. Table 11.04 shows the most popular magazines for the years 2001-2003.
Through international agreements with Reuters, Australian Associated Press and other news organisations, the cooperatively-owned New Zealand Press Association (NZPA) provides an international and domestic news service to all daily and Sunday newspapers.
The New Zealand Press Council. The press council is a self-regulatory body founded in 1972 with the primary function of investigating and adjudicating on complaints against newspapers and other publications.
Its constituent members are the Newspaper Publishers Association (NPA) and the New Zealand Engineering, Printing and Manufacturing Union (EPMU). The council consists of an independent chairman, five members representing the public and five representing the industry. Two of the five industry representatives are nominated by the NPA, two are nominated by the EPMU and one by magazine publishers. A panel including the Chief Ombudsman appoints public members.
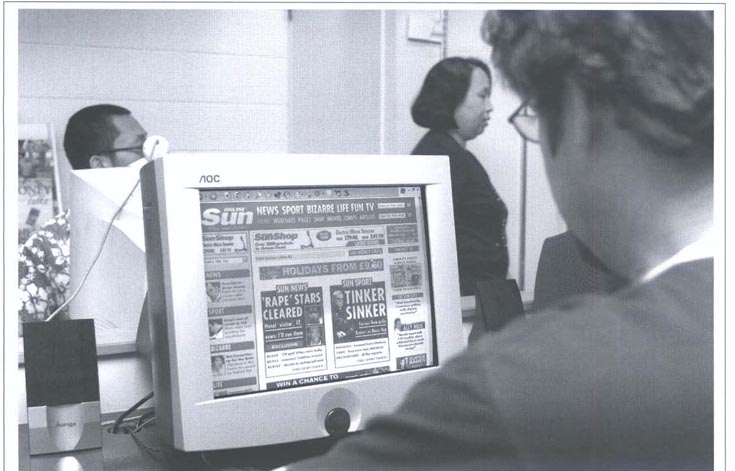
A public library user browses an overseas newspaper online.
Table 11.04. Magazine circulation1
| Publication | Circulation | ||
|---|---|---|---|
| 2001 | 2002 | 2003 | |
1Audit period: January - June Source: Audit Bureau of Circulations | |||
| AA Directions (quarterly) | 566,750 | 542,219 | 540,395 |
| Sky Watch (monthly) | 342,064 | 358,589 | 390,571 |
| TV Guide (weekly) | 229,126 | 225,648 | 222,931 |
| New Zealand Woman's Day (weekly) | 147,124 | 141,781 | 146,237 |
| New Zealand Woman's Weekly (weekly) | 95,918 | 97,013 | 101,397 |
| Australian Woman's Weekly NZ (monthly) | 82,764 | 92,627 | 98,888 |
| Reader's Digest NZ (monthly) | 105,000 | 101,756 | 92,258 |
| Rural News (fortnightly) | 83,222 | 84,607 | 86,134 |
| Agtrader (monthly) | 78,790 | 77,723 | 85,241 |
| Straight Furrow (monthly) | 79,895 | 80,006 | 85,231 |
| NZ House & Garden (monthly) | 75,556 | 80,669 | 79,299 |
| Cuisine (alternative months) | 60,061 | 79,760 | 76,977 |
| New Zealand Listener (weekly) | 81,761 | 76,844 | 76,171 |
| Next (monthly) | 61,267 | 63,070 | 67,471 |
| New Idea (weekly) | 55,283 | 54,427 | 57,408 |
| Your Home & Garden (monthly) | 41,988 | 50,382 | 50,073 |
| That's Life (weekly) | 41,636 | 44,366 | 45,640 |
| New Zealand Gardener (monthly) | 54,756 | 50,619 | 45,094 |
| Little Treasures (alternative months) | 49,700 | 46,184 | 43,974 |
| Family Times (quarterly) | 40,148 | 41,558 | 41,996 |
The principal objects of the press council are to:
Consider complaints against the editorial content of newspapers and other publications. (A separate body deals with complaints against advertising). The council may also consider complaints about the conduct of people and organisations towards the press.
Promote freedom of speech and freedom of the press in New Zealand.
Maintain the New Zealand press in accordance with the highest professional standards.
The council does not set standards for newspapers, but from time to time it issues recommendations to editors in general terms.
The council's Statement of Principles sets out a guide for complainants and the publishing industry.
To make a complaint to the council, complainants are first required to complain in writing to the editor of the publication concerned. This allows the editor the opportunity of righting a possible wrong.
If complainants are still not satisfied, they can then approach the council. There is no charge for the council's service.
In circumstances where legally actionable issues may be involved, complainants are required to provide a waiver that, having referred the matter to the press council, no legal proceedings will be taken against the newspaper or journalist concerned. The council is funded entirely by the industry. The Press Council website is www.presscouncil.org.nz
Table 11.05 shows a breakdown of Press Council complaints for 2001-03.
Table 11.05. New Zealand Press Council statistics Years ending 31 December
| 2001 | 2002 | 2003 | ||||
|---|---|---|---|---|---|---|
Source: New Zealand Press Council | ||||||
| Adjudications issued | 45 | 47 | 48 | |||
| Upheld | 9 | 1 | 8 | |||
| Part upheld | 9 | 3 | 2 | |||
| Not upheld with dissent | - | - | 1 | |||
| Not Upheld | 27 | 43 | 36 | |||
| Declined | - | - | 1 | |||
| Not adjudicated | 31 | 59 | 39 | |||
| Mediated/resolved | - | 1 | 3 | |||
| Withdrawn | - | 3 | 1 | |||
| Withdrawn at late stage | 8 | 2 | 1 | |||
| Not followed through | 13 | 18 | 16 | |||
| Out of time | 1 | 5 | 2 | |||
| Not accepted | 1 | 4 | 3 | |||
| Outside jurisdiction | 1 | 9 | 3 | |||
| In action at end of year | 7 | 17 | 10 | |||
| Total complaints | 76 | 106 | 87 | |||
Press freedom. Freedom of the press in New Zealand is of the highest degree. Newspapers participate from an editorial perspective in the Commonwealth Press Union (CPU) based in London. This Commonwealth-wide organisation of journalists and publishers is actively involved in promoting and defending press freedom throughout the Commonwealth through training, communications and advocacy.
Advertising industry. Approximately 1,000 people are employed in New Zealand advertising agencies and 2.500 in advertising-related services. Advertising revenue also contributes to the employment of another 10,000 people in the publishing, radio and television industries. At the beginning of 2003, there were approximately 180 advertising agencies, most of them New Zealand-owned, but with 25 (mostly larger agencies) affiliated to multinationals by total or partial ownership. Mainstream media advertising for the year ending 31 December 2002 was approximately $1,565 billion. Substantial additional money was spent on advertising using direct mail, telemarketing and display material, brochures and the like. Although accurate figures are not available, expenditure in these categories is estimated to exceed $500 million. Approximately 45 percent of expenditure on media advertising was made through advertising agencies, with agencies placing around 80 percent of advertising on television, 80 percent in magazines, 30 percent on radio, 30 percent in newspapers and 20 percent of advertising through other media. Table 11.06 shows the value of advertising spending in various media, while Table 11.07 shows advertising expenditure by consumer sector.
Table 11.06. Advertising expenditure in media1
Years ending 31 December
| Medium | 1999 | 2000 | 2001 | 2002 | ||||
|---|---|---|---|---|---|---|---|---|
| Expenditure | Share | Expenditure | Share | Expenditure | Share | Expenditure | Share | |
1All cash advertising revenue, plus agency commission where applicable. 2Includes daily and community newspapers. 3Separated from outdoor medium 2001. Source: Advertising Standards Authority | ||||||||
| $(million) | Percent | $(million) | Percent | $(million) | Percent | $(million) | Percent | |
| Newspapers2 | 566 | 39.8 | 596 | 40.1 | 606 | 40.7 | 628 | 40.1 |
| Television | 487 | 34.3 | 501 | 33.7 | 479 | 32.2 | 516 | 33.0 |
| Radio | 178 | 12.6 | 190 | 12.8 | 196 | 13.2 | 203 | 13.0 |
| Magazines | 159 | 11.2 | 157 | 10.6 | 166 | 11.1 | 173 | 11.0 |
| Outdoor and cinema | 30 | 2.1 | 41 | 2.8 | 32 | 2.2 | 37 | 2.4 |
| Cinema3 | 9 | 0.6 | 8 | 0.5 | ||||
| Total | 1,420 | 100.0 | 1,485 | 100.0 | 1,488 | 100.0 | 1,565 | 100.0 |
Table 11.07. Advertising expenditure By consumer sector Year ending 31 December 2003
| Section | Total media |
|---|---|
Source: ACNielsen | |
| $000 | |
| Foodstuffs | 288,444 |
| Leisure, entertainment | 275,718 |
| Retail | 212,680 |
| Automotive | 164,032 |
| Toiletries/cosmetics | 141,507 |
| Government departments, services and community | 133,085 |
| Beverages | 130,384 |
| Investment, finance, banking | 124,629 |
| Home improvements | 91,609 |
| Telecommunication | 90,322 |
| Travel | 88,417 |
| Pharmaceuticals, health | 80,210 |
| Household electrical products | 69,001 |
| Household furnishings | 64,534 |
| Computers | 57,088 |
| Clothing | 39,582 |
| Insurance | 27,973 |
| Agricultural | 26,592 |
| Household cleaning products | 22,814 |
| Business services | 21,813 |
| Total | 2,150,434 |
Industry organisations and self-regulation. The Communication Agencies Association of New Zealand (CAANZ) is an incorporated body representing the interests of members on issues affecting the advertising industry and agencies. There are 86 member agencies, who collectively represent between 85 and 90 percent of agency billings in New Zealand, with combined turnover of about $900 million. The Association of New Zealand Advertisers (ANZA) represents the interests of advertisers and has 90 members. ANZA administers two pre-placement vetting systems - one for liquor advertising and one for therapeutic advertising. The advertising industry has a self-regulatory system managed by the Advertising Standards Authority (ASA) and the Advertising Standards Complaints Board. The authority's function is to promulgate codes of practice and develop policies on advertising standards. The board's function is to adjudicate on complaints and advise the ASA on codes and public issues. In the year ending 31 December 2003, the board received 382 complaints, upholding 101 of them and not withholding 117. Of the remainder, 142 were not accepted for adjudication.
The ASA website is www.asa.co.nz
The Postal Services Act 1998 permitted full competition in all areas of the postal services market. All mail must carry a mark to identify the postal operator that carried it.
Postal operators have the right to open mail in certain circumstances (for example, so it can be returned to the sender when an address is illegible). They also have the right to erect letterboxes.
To carry out a business involving carriage of letters, a person or company must be registered as a postal operator with the Ministry of Economic Development. At 1 January 2004, 31 operators were registered.
Under a deed of understanding with the government, New Zealand Post Ltd is required to meet certain social obligations, including maintaining a minimum number of delivery points and postal outlets, maintaining five or six-day-a week delivery to 99.88 percent of delivery points, not reintroducing the rural delivery fee abolished in 1995, and providing competitors with access to its network on terms and conditions no less favourable than terms and conditions offered to equivalent customers.
New Zealand Post Ltd is currently the sole operator designated as New Zealand's ‘postal administration’ to the Universal Postal Union (UPU) and therefore has the exclusive right to issue ‘official’ UPU-stamps. The government has the power to designate additional operators to fulfil New Zealand's international postal obligations.
New Zealand Post Ltd is a state-owned enterprise which has been operating in a completely deregulated postal environment since 1998. The Postal Services Act of that year removed New Zealand Post's monopoly on the standard letter, allowing full competition in postal services. The price of standard letter postage was reduced from 45 cents to 40 cents on 2 October 1995 and was maintained at that level till 5 April 2004, when it returned to 45 cents. By comparison, Australia's basic postage price is the equivalent of 57 cents, Canada's 55 cents, the United Kingdom's 76 cents, Ireland's 90 cents, Germany's $1, Japan's $1.15 and Norway's $1.30. New Zealand Post says that in the developed world, only Hong Kong and the Czech Republic offer cheaper standard postal rates than New Zealand. New Zealand Post's FastPost service also increased in price from 5 April 2004, from 80 cents to 90 cents.
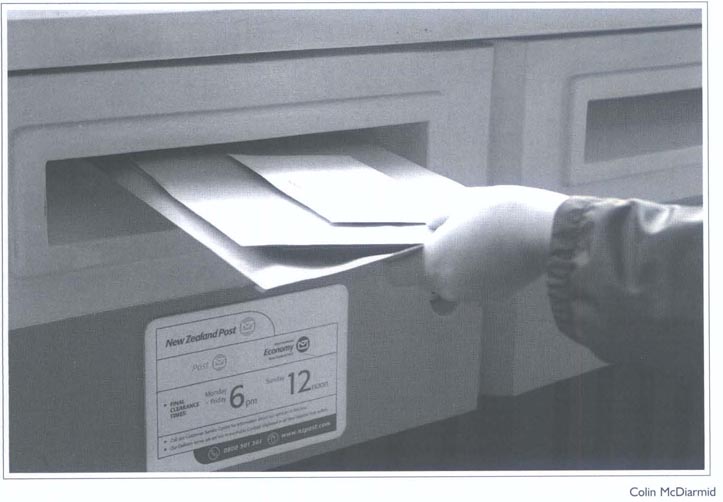
New Zealand Post handled nearly 1.7 million articles of mail in the year ending 30 June 2003.
New Zealand Post's service delivery - the independent measure of mail delivered on time - was 95.6 percent for the year to 30 June 2003, putting its service standards among the best in the world.
While it continues the tradition of carrying and delivering letters and parcels, New Zealand Post has responded to customers' growing communications needs by providing electronic solutions to residential, business and international markets.
Its business activities include letters, courier services, financial transactions, mail and stamp production, as well as data processing and electronic billing, commerce and messaging.
New Zealand Post's website is www.nzpost.com
Inland postal services. FastPost or standard post can be used to send letters up to 20mm thick and up to 1 kg in weight. FastPost targets next working day delivery between major towns and cities, with standard post targeting next working day delivery across town, and two to three working days across New Zealand.
For parcels, PacketPost is used to send parcels up to 1.5kg and can be sent either FastPost or standard post, and ParcelPost is used for parcels up to 25kg, targeting next working day for delivery across town and two to three working days delivery nationwide.
Other services include BoxLink, Volume Post, Registered Post and Postage Included Envelopes.
CourierPost offers urgent, overnight and economy delivery services.
CourierPost's track and trace service gives customers the ability to check on their item at any time from pick-up to delivery.
New Zealand Post also provides discounts for bulk mail and handles unaddressed mail (circulars) and direct mail.
Table 11.08 shows the number of articles posted from 1997 to 2003.
Table 11.08. Articles posted
| Address | Years ending | ||||||
|---|---|---|---|---|---|---|---|
| 31 March 1997-2000 | 30 June 2001-2003 | ||||||
| 1997 | 1998 | 1999 | 2000 | 2001 | 2002 | 2003 | |
Source: New Zealand Post | |||||||
| Number | |||||||
| Residential | 1,105,824 | 1,155,153 | 1,181,141 | 1,240,263 | 1,283,261 | 1,253,693 | 1,243,613 |
| Business | 53,484 | 53,465 | 51,590 | 54,750 | 56,045 | 57,314 | 59,508 |
| Private box and bag | 169,484 | 174,219 | 174,074 | 204,942 | 188,044 | 181,999 | 189,244 |
| Rural delivery | 146,266 | 150,655 | 162,347 | 168,096 | 175,127 | 177,727 | 180,495 |
| Other | 25,262 | 22,387 | 13,915 | 10,825 | 22,392 | 23,837 | 25,096 |
| Total | 1,500,320 | 1,555,879 | 1,583,067 | 1,678,876 | 1,724,869 | 1,694,570 | 1,697,956 |
Overseas mail services. New Zealand Post International operates several overseas mail services. International Express is a track and trace courier service to more than 220 countries, with next-morning delivery to Australian centres and targeting delivery within days to the rest of the world, including built-in insurance cover and additional cover options.
International Air offers delivery in approximately one to two weeks, with built-in insurance cover and the option of additional cover and/or track and trace facilities to selected countries. International Economy offers cost-effective delivery to anywhere in the world within approximately three to five weeks.
Table 11.09 shows changes in the cost of sending one page of material from New Zealand to London.
Table 11.09. Cost of sending one page of material from New Zealand to London1938, 2000 and 2003 Real (inflation adjusted) costs
| Cost (1999 dollars) for 300 words | 1938 | 2000 | 2003 |
|---|---|---|---|
1Telegraph service no longer available in 2000. 2Standard envelope. 28 grams, by sea or economy airmail. 3Cost of a five-minute call in peak hours inclusive of GST. 4Based on one minute of transmission time in peak hours. 5Marginal costing only. Does not include cost of a personal computer and assumes fiat rate charges from domestic site. figures not available not applicable Source: New Zealand Post Telecom | |||
| $ | $ | $ | |
| Telegraph1 | 1,315.00 | .. | .. |
| Letter post2 | 0.88 | 1.80 | 2.00 |
| Telephone3 | 438.00 | 2.95 | 3.25 |
| Fascimile4 | ... | 0.59 | 0.65 |
| Email (internet)5 | ... | <0.01 | <0.02 |
Stamp issues. New Zealand Post's stamp unit produces around 12 commemorative stamp issues each year and one to three definitive stamp issues.
Table 11.10 lists stamps issued from 1 January 2001 to 5 November 2003.
A variety of products, including commemorative coins on behalf of the Reserve Bank of New Zealand, are sold by mail order through the Philatelic Bureau at Wanganui, at stamp sales centres, through PostShops and from the stamps website www.stamps.co.nz
Table 11.1. 2001-2003 Stamp issues
| Date of issue | Issue name | Denominations |
|---|---|---|
Source: New Zealand Post | ||
| 2001 | ||
| 1 January | 100 Years of Moving the Mail | 40c x 10 |
| 1 February | Marine Reptiles - Year of the Snake | 40c, 80c, 90c, $1.30, $1.50, $2.00 |
| 7 March | Garden Flowers | 40c, 80c, 90c, $1.30, $1.50, $2.00 |
| 4 April | Art from Nature | 40c, 80c, 90c, $1.30, $1.50, $2.00 |
| 2 May | Aircraft | 40c, 80c, 90c, $1.30, $1.50, $2.00 |
| 6 June | Greetings | 40c x 5, 90c x 5 |
| 4 July | Scenic 100 Years of Tourism | 40c, 80c, 90c, $1.30, $1.50, $2.00 |
| 1 August | Children's Health - Cycling | 40c x 2, 90c |
| 5 September | Christmas 2001 | 40c, 80c, 90c, $1.30, $1.50, $2.00 |
| 3 October | Queen Elizabeth II | 40c, 80c, 90c, $1.30, $1.50, $2.00 |
| 7 November | Ross Dependency - Penguins | 40c, 80c, 90c, $1.30, $1.50, $2.00 |
| 7 November | Penguins | 40c, 80c, 90c, $1.30, $1.50, $2.00 |
| 4 December | The Lord of the Rings: The Fellowship of the Ring | 40c, 80c, 90c, $1.30, $1.50, $2.00 |
| 2002 | ||
| 7 February | Group One Winners - Year of the Horse | 40c, 80c, 90c, $1.30, $1.50, $2.00 |
| 6 March | Native Fungi | 40c, 80c, 90c, $1.30, $1.50, $2.00 |
| 3 April | Architectural Heritage | 40c, 80c, 90c, $1.30, $1.50, $2.00 |
| 2 May | Art Meets Craft | 40c, 80c, 90c, $1.30, $1.50, $2.00 |
| 5 June | New Zealand Post Children's Book Festival | 40c x 10 |
| 5 June | Bronze Round Kiwi | $1.50 |
| 5 June | HM Queen Elizabeth The Queen Mother | $2.00 |
| 3 July | Scenic Coastlines | 40c, 80c, 90c, $1.30, $1.50, $2.00 |
| 7 August | Children's Health - Healthy Living | 40c x 2, 90c |
| 4 September | Christmas 2002 | 40c, 80c, 90c, $1.30, $1.50, $2.00 |
| 2 October | Leading the Waves | 40c, 80c, 90c, $1.30, $1.50, $2.00 |
| 2 October | America's Cup | $1.30, $1.50, $2.00 |
| 6 November | Holiday Hideaways | 40c x 6 |
| 21 November | Vatican City Joint Issue | $1.50 |
| 4 December | The Lord of the Rings: The Two Towers | 40c, 80c, 90c, $1.30, $1.50, $2.00 |
| 2003 | ||
| 8 January | Team NZ - The Defence | 40c, 80c, 90c |
| 5 February | Year of the Sheep | 40c, 90c, $1.30, $1.50, $2.00 |
| 5 March | Royal New Zealand Ballet 50th Anniversary | 40c, 90c, $1.30, $1.50, $2.00 |
| 2 April | Military Uniforms | 40c x 20 |
| 2 May | Scenic Definitives | 50c, $1.00, $1.50, $2.00, $5.00 |
| 29 May | Conquest of Everest | 40c x 2 |
| 4 June | Queen Elizabeth 11 - 50th Anniversary of the Coronation | 40c, 90c, $1.30, $1.50, $2.00 |
| 2 July | 100 Years of New Zealand Test Rugby | 40c, 90c, $1.30, $1.50 × 2, $2.00 |
| 6 August | Children's Health - Playgrounds | 40c x 2, 90c |
| 6 August | Scenic Waterways | 40c, 90c, $1.30, $1.50, $2.00 |
| 3 September | Veteran Vehicles | 40c, 90c, $1.30, $1.50, $2.00 |
| 1 October | Ross Dependency - Marine Life | 40c, 90c, $1.30, $1.50, $2.00 |
| 1 October | Christmas 2003 | 40c, 90c, $1.30, $1.50, $2.00 |
| 5 November | The Lord of the Rings: The Return of the King | 40c, 80c, 90c, $1.30, $1.50, $2.00 |
Recent performances. New Zealand Post reported a profit of $27.1 million after tax for the 2002/03 financial year, compared with $21.9 in 2001/02 and $21.0m in 2000/01.
Retail network. At 30 June, 2003, New Zealand Post's retail network consisted of 143 company-owned PostShops, 137 franchised PostShops and 35 Books & More stores, with postal services available at a further 697 Post Centres.
Stamps were available at a further 2,735 retailers.
Financial transaction services, including motor registration, ticketing for certain events and bill payment services are available at all PostShops and Books & More stores through the PostLink computer system.
Table 11.11 shows New Zealand Post outlets for the years 1998-2003.
Table 11.11. Postal outlets Years ending 30 June1
| Year | 1998 | 1999 | 2000 | 2001 | 2002 | 2003 |
|---|---|---|---|---|---|---|
1 1998-2000 figures for years ending 31 March. Source: New Zealand Post | ||||||
| Post Shops (including franchises) | 308 | 314 | 315 | 314 | 313 | 315 |
| Post Centres | 717 | 719 | 714 | 705 | 699 | 697 |
| Stamp resellers | 2,945 | 3,141 | 2,994 | 2,940 | 2,877 | 2,735 |
| Total | 3,970 | 4,174 | 4,023 | 3,959 | 3,889 | 3,747 |
11.1 Ministry of Economic Development; Telecommunications Users Association of New Zealand Inc.
11.2 NZ On Air; Broadcasting Standards Authority; Electoral Commission; Te Mangai Paho; Ministry for Culture and Heritage
11.3 Ministry of Economic Development; Telecom Corporation of New Zealand Limited.
11.4 TelstraClear.
11.5 Television New Zealand; TV3 Network Services Limited; Sky Network Television Ltd; Prime Television; Ministry for Culture and Heritage.
11.6 Ministry for Culture and Heritage; Radio New Zealand Limited; The Radio Network; NZ On Air; Ministry of Economic Development.
11.7 New Zealand Audit Bureau of Circulations; Freedom House; New Zealand Press Council, Newspaper Publishers Association.
11.8 Communications Agencies Association of New Zealand (CAANZ); ACNielsen.
11.9 Ministry of Economic Development, New Zealand Post Limited.
www.acnielsen.co.nz - ACNielsen
www.asa.co.nz - Advertising Standards Authority
www.abc.org.nz - Audit Bureau of Circulations
www.bsa.govt.nz - Broadcasting Standards Authority
www.caanz.co.nz - Communication Agencies Association NZ (CAANZ)
www.elections.org.nz - Electoral Commission
www.ecommerce.govt.nz - Electronic Commerce
www.knowledge.gen.nz - Knowledge Economy
www.maoritelevision.com - Maori Television
www.mch.govt.nz - Ministry for Culture and Heritage
www.med.govt.nz - Ministry of Economic Development
www.med.govt.nz/consumer/elcon/ecommerce - Ministry of Economic Development IT Policy Group
www.presscouncil.org.nz - New Zealand Press Council
www.npa.co.nz - Newspaper Publishers Association
www.nzonair.govt.nz - New Zealand on Air
www.presscouncil.org.nz - New Zealand Press Council
www.nzpost.co.nz - New Zealand Post Ltd
www.primetv.co.nz - Prime Television
www.rnzi.com - Radion New Zealand International
www.radio.nz.co.nz - Radio New Zealand Ltd
www.skytv.co.nz - Sky Television
www.soundarchives.co.nz - Sound Archives
www.telecom.co.nz - Telecom Corporation of New Zealand
www.tvnz.co.nz - Television New Zealand Ltd
www.telstraclear.co.nz - TelstraClear Ltd
www.tmp.govt.nz - Te Mangai Paho
www.tuanz.org.nz - Telecommunications Users Association of New Zealand (TUANZ)
www.tv3.co.nz - TV3 Network Ltd
Table of Contents
The ballroom scene from the Royal New Zealand Ballet's production of Romeo and Juliet.
There has been an increasing recognition by governments in recent years of the strategic and intrinsic importance of arts, culture and heritage activities. This has been reflected in the increased resources the government has invested in these activities, notably the Cultural Recovery Package of May 2000.
The findings of the joint Ministry for Culture and Heritage and Statistics New Zealand report A Measure of Culture: Cultural experiences and cultural spending in New Zealand confirm that New Zealanders have a high level of engagement with arts, culture and heritage, and that activity in these areas forms a significant part of the New Zealand economy, accounting for 4 percent of domestic spending.
There are three commonly-cited purposes for government involvement in arts, culture and heritage:
Arts, culture and heritage should be valued for their intrinsic benefits; for what they have to contribute to our individual well-being and to our understanding of who we are as New Zealanders in a world context.
Given New Zealand's large pool of talented people, the creative sector has the potential to make an even larger contribution to the economy. Worldwide, the creative, cultural and heritage sectors are among the key growth industries for the 21 st century.
Arts and culture help define New Zealand as a unique, dynamic and creative nation. As the globalising trends of current times continue, it is all the more important that we vigorously assert the value of our own culture and heritage, and support their development and protection.
Taonga tuku iho describes the maintenance and communication of those aspects of New Zealand culture that are uniquely Maori. It is taonga tuku iho that makes New Zealand culture unique, and because of this governments have tended to make special provision for its support.
The government provides support for taonga tuku iho through a range of measures. It created and funds the Museum of New Zealand Te Papa Tongarewa, which has a statutory responsibility to express the significance of Maori cultural heritage through its collections and programmes; the New Zealand Historic Places Trust, whose responsibility for Maori sites and structures is primarily executed through its Maori Heritage Council; Creative New Zealand, which delivers support for specifically Maori art across the range of genres through Te Waka Toi, the Maori Arts Board; the Maori Arts and Crafts Institute, which works to maintain traditional skills in areas such as carving and weaving; the Maori Language Commission Te Taura Whiri i te Reo Maori, which promotes the use of the Maori language; and Te Mangai Paho and the Maori Television Service, which support Maori language and culture through Maori broadcasting.
A welcome to the marae at Whakarewarewa, Rotorua.
The government also provides direct support to the Aotearoa Traditional Maori Performing Arts Society, which has an emphasis on maintaining traditional Maori performing arts expertise. From time to time it provides capital funding to regional museums which have nationally significant collections, including collections of Maori taonga.
Other government interventions supporting taonga tuku iho are the New Zealand Lottery Grants Board, which allocates profits to a wide range of community enterprises, including restoration of marae; and the Antiquities Act 1975, which regulates the export of antiquities, including taonga, and which provides for the protection of newly-discovered artifacts.
The Museum of New Zealand Te Papa Tongarewa is New Zealand's national museum. Since opening on the Wellington waterfront in February 1998, it has established a national and international reputation as New Zealand's ‘must-see’ visitor attraction.
Te Papa's founding concept was developed through an extensive national consultative process and was adopted by the government in 1990. It introduced the concepts of unified collections, the narratives of culture and place, the idea of forum, the bicultural partnership between tangata whenua and tangata tiriti, and a multidisciplinary approach to delivering a national museum for diverse audiences. Its mission, to be a forum for the nation to explore and preserve its unique cultural and natural heritage, is underpinned by the principles of the bicultural partnership; being a waharoa or entryway to exploring and reflecting on cultural identity, acknowledging and recognising the role of communities in the care, management and understanding of taonga and collections; speaking with authority; being committed to providing excellent services; and being commercially positive.
The museum contains 21 major constructed exhibitions and features a programme of innovative and exciting exhibitions that both draw on the richness of its collections and bring to New Zealand the best of the rest of the world.
Permanent exhibitions include Bush City, an outdoor space that re-creates distinctive aspects of the New Zealand landform and its associated plant life, and The Time Warp, a dynamic interactive zone that uses motion-simulator technology and cinema effects to project visitors into New Zealand's distant past and near future. Te Papa is the only museum in the world with its own living, functioning marae.
Central to Te Papa's existence are its collections. The museum has particularly rich holdings of New Zealand plants and animals, taonga Maori and Pacific collections. Te Papa continues to develop its collection of art.
In its capacity as the national museum, Te Papa operates a number of services for customers outside its premises and a substantial national services programme that aims to work with other museums, iwi and related organisations on projects to build capacity and enhance the sustainability of the services they provide in their local communities. The focus of national services is on training and skill development; standards implementation; kaupapa Maori iwi development; and strategic regional and community development initiatives. Other services include Te Papa Press, touring exhibitions, a collections loans service, a programme of iwi partnership projects, and the Te Papa website, www.tepapa.govt.nz
Te Papa achieved overwhelming success in its first five years of operation, with more than seven million people visiting the museum and many more benefiting from its extension and national services programmes.
There is increasing evidence that the existence of Te Papa has changed national and international tourism patterns. More than 40 percent of domestic visitors to Te Papa in the 2002/03 financial year came from outside the Wellington region and more than 40 percent were from overseas.
Te Papa's audience closely approximates the New Zealand population at large. For example, the proportion of Maori visitors equates roughly with the percentage of people identifying themselves as Maori in the 2001 Census. A similar pattern has emerged for Pacific peoples and other ethnicities.
There are about 600 public museums and art galleries in New Zealand. These range from small, local museums housing collections of local importance, to larger institutions housing collections of national and regional significance. The larger museums, of which there are many, carry out research, print catalogues and research papers, and provide educational programmes.
Many museums and art galleries are funded by local government. Funding for capital works may be provided by the lottery grants board, community trusts, electricity trusts or other funding bodies.
The New Zealand Historic Places Trust, a statutory, non Crown-owned entity, is responsible nationally for the identification, protection, preservation and conservation of the land-based historic and cultural heritage of New Zealand. This includes buildings and archaeological sites, historic areas and wahi tapu (sites of special significance to Maori). The trust's Maori name, Pouhere Taonga, means ‘pillar that binds all treasures.’
One of the trust's key tasks is to assess registration proposals for the national register of heritage places established by the Historic Places Act 1993. Another important aspect is liaising with territorial authorities to ensure registered historic places and sites are listed and receive the protection available through district plan provisions.
Staff and trust branches also liaise with, and provide heritage advice to, private owners of registered historic places.
Historic places are registered as either Category I (places of special or outstanding historical or cultural heritage, significance or value) or Category II (places of historical or cultural significance or value). Historic areas and wahi tapu are included on the register, but are not differentiated as Category I or Category II, though individual sites within historic areas may sometimes have individual registration categories.
The trust is responsible for aspects of the regulation of all archaeological sites, whether they are registered or not, including the authorisation of modification, damage or destruction of sites by development processes, or by scientific excavation. Other aspects of archaeological site protection are the responsibility of territorial authorities under the Resource Management Act 1991.
The trust owns or manages 58 properties throughout New Zealand, including 32 Crown properties, mostly reserves, which have either been vested in it or which it has been appointed to control and manage. Properties the trust manages range from the Kerikeri Mission House (Kemp House), in the Bay of Islands, New Zealand's oldest surviving industrial building, to the Southland Provincial Council building in Invercargill.
A number of properties are open to the public, including Pompallier, which is a working museum complete with printery, tannery and bookbindery. The trust-owned Totara Estate, south of Oamaru, the birthplace of the New Zealand meat industry, underwent a major redevelopment during 2001-2003 and was reopened to the public in 2003.
Staff of the trust, including heritage property staff, are supported by about 24,000 members and 23 branch committees throughout New Zealand. In 1999/2000, the trust established a new regional structure, establishing new staff teams in Kerikeri, Auckland, Tauranga, Wellington, Christchurch and Dunedin.
Protection of antiquities and archaeological and traditional sites. New Zealand has a number of legal provisions to protect items and sites of historical and cultural significance. The Antiquities Act 1975, administered by the Ministry for Culture and Heritage, includes provisions controlling the sale of Maori artefacts in New Zealand. Artefacts found after 1976 are deemed to be Crown property. There are export controls on a range of items of cultural significance: Maori artefacts; chattels relating to European discovery, settlement or development of New Zealand; written and printed matter; works of art, reproductions, prints, films and sound recordings; specimens of animals, plants and minerals; meteorites; remains of extinct fauna; and shipwreck items. It is necessary to obtain an authority from the New Zealand Historic Places Trust before damaging, destroying, or modifying any archaeological site, or undertaking an archaeological investigation of any site.
Antrim House, Wellington, head office of the New Zealand Historic Places Trust.
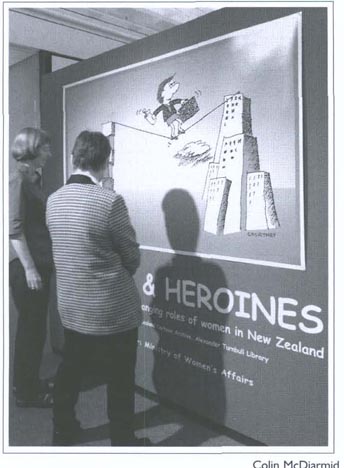
An exhibition at the New Zealand Cartoon Archive, Wellington.
Archives New Zealand has two roles: to preserve and provide access to the records of government, and to ensure government records are created and maintained. The department achieves the first of these by taking in government records which are no longer required for administration, arranging and describing them, and making them available through reading rooms in Dunedin, Christchurch, Wellington and Auckland. It achieves the second by providing advice about good record-keeping practices to government agencies.
Archives are the raw material for the history of New Zealand. A reliable record of government actions enables citizens to hold the government to account. In addition, a verifiable record provides the government with the protection that comes from its citizens trusting it to be truthful and accountable in its dealings. Records available at Archives New Zealand include those of government departments such as education, railways, health, justice, works, police, post office, lands and survey, internal affairs, Maori affairs, parliament, the armed forces, the courts and commissions of inquiry.
The Constitution Room at Archives New Zealand's Wellington headquarters displays some of New Zealand's most significant documents, providing a walk-through history of New Zealand. Signed sheets of the original Treaty of Waitangi and the Women's Suffrage Petition are the central focus of this exhibition room. Both documents are noted in the United Nations Educational, Scientific and Cultural Organisation's World Heritage Register as being of international significance.
Archives New Zealand has a statutory role to protect specified classes of local authority archives, and advises and assists these bodies in the care, preservation and disposal of their records.
Newspaper and magazine cartoons are important historical records because they capture the values and attitudes of the day, providing an extra dimension to our understanding of past events. The New Zealand Cartoon Archive, founded by Ian F Grant as a result of researching his cartoon history of New Zealand, The Unauthorized Version, was launched on April Fool's Day 1992. The archive's purpose is to collect historical and contemporary New Zealand editorial cartoons and to promote the collection to the New Zealand public.
The New Zealand Cartoon Archive has become New Zealand's principal cartoon collection and research institution. More than 25,000 cartoons - originals and copies - have been bequeathed to the archive by cartoonists and their relatives, collectors, politicians and organisations. Since 1992, the archive has received, by arrangement, copies and some originals of cartoons that appear in New Zealand newspapers and periodical press.
The collection includes the work of more than 60 New Zealand and expatriate New Zealand cartoonists. To date, nearly 10,000 cartoons have been indexed and are available on the National Library's TAPUHI internet system and more than 1,100 cartoons and caricatures can be viewed on the library's Timeframes website. The archive has curated 12 cartoon exhibitions, several touring to a number of New Zealand centres, and has published three books.
The archive is a self-supporting organisation relying on income raised by the New Zealand Cartoon Archive Trust through sponsorship, donations, membership and other events. It is established within the Alexander Turnbull Library, National Library of New Zealand, Wellington.
The National Library of New Zealand was established in 1965 by an act of parliament, which also incorporated the Alexander Turnbull Library into the National Library. The National Library of New Zealand (Te Puna Matauranga o Aotearoa) Act 2003 replaced the earlier act, and confirmed the Crown's undertaking to preserve, protect, develop and make accessible the collections of the Alexander Turnbull Library forever. The 2003 act also created an independent advisory body to the government, the Library and Information Advisory Commission.
The National Library is a key adviser to the government on library and information issues. The National Library holds in its general collections 890,347 books; 5,324 periodical titles; 10 main microfilm collections; 7,878 audiobook titles; and 518,746 items in the schools collections. Family history, music and children's literature are strengths within the collections. In addition, the Alexander Turnbull Library holds 354,000 volumes, including 44,000 rare books, chiefly in English literature; special collections including New Zealand and Oceania, Milton, Katherine Mansfield, and oral history; 8,000 linear metres of manuscripts; 78,000 drawings, paintings and prints; 2.6 million photographic prints, negatives and albums; 54,000 maps; 40,379 sound recordings; 2,678 videos; 579 computer files; and 140,000 items of ephemera, including 17,000 posters.
The National Library provides access to its general collections on site and by lending to other libraries through the interloans system. The collections of the Alexander Turnbull Library are not available for borrowing, but material can be selected from them and used in special areas of the library. Copies of some items, such as microform copies of serials, newspapers, books, manuscripts, some oral history interviews and other unpublished sound recordings, may be available through inter-library lending. Access to the records of most collections is available through the internet. The National Library gallery, through a programme of exhibitions and public events, provides access to, and interpretation of, the heritage collections held by the Alexander Turnbull Library. The National Library's website is www.natlib.govt.nz
Services available from the National Library include:
Collection and Reference Services - Under the National Library Act 2003, publishers are required to deposit copies of every publication produced in New Zealand, including electronic published material. The library lists these publications on the New Zealand National Bibliography, which is published monthly and often used by buyers to order new titles. The general collection includes the family history area, where people trace their family tree using books, CD-ROMs and microfiche information from New Zealand and overseas.
Te Puna - This is the web-based gateway to the library's on-line collections, catalogues and directories.
School Services - Located in 13 centres around the country, this service is available to all New Zealand schools. School Services provides advisory support on school library management and development, through a programme of courses, seminars and consultancy services. Curriculum Information Service provides reference services and loans of curriculum-related resources to teachers and home-schoolers from the schools collection and a developing range of online information resources.
Services to Maori - A Services to Maori unit helps Maori gain optimum use of the library's resources and services.
National Preservation Office - The National Library and National Archives established New Zealand's National Preservation Office Te Tari Tohu Taonga in 1997. This provides a national advisory service, including training in preservation management and conservation assessments.
Print Disabilities Service - This service provides audio books (cassettes and CDs) to people with print disabilities who cannot independently obtain access to information in a print form.
The Alexander Turnbull Library. Part of the National Library of New Zealand, the Turnball holds collections of books, photos, manuscripts and archives, letters, drawings and prints, music, newspapers, maps and sound recordings that document the history of New Zealand and the Pacific. Other significant holdings are the major research collection on John Milton and his times, a selection of illuminated manuscripts, and New Zealand's largest collection of early printed books and fine printing. The library was started by Alexander Horsburgh Turnbull, a wealthy Wellington merchant who died in 1918 and bequeathed to the nation 55,000 volumes, as well as manuscripts, photographs, paintings and sketches collected during his lifetime.
Oral History Centre. The many different voices of New Zealanders are recorded by the Turnbull Library's Oral History Centre. Interviewers use structured life history interviews to document people's experiences and to record those whose lives are relatively undocumented. The recordings provide valuable information about language, accent, inflection, emphasis and tone. The centre preserves and provides access to the oral history collection, as well as recording interviews for the library's oral history projects and carrying out commissioned projects for other organisations. As part of one of its contemporary oral history projects, the centre conducts weekly or monthly interviews with people such as leading politicians or the long-term unemployed. With more than 12,000 hours of spoken recording on discs, reels and cassette tape, the Alexander Turnbull Library has the most extensive collection of oral history recordings in the country. The primary source of funding for oral history projects is the annual Awards in Oral History from the Australian Sesquicentennial Gift Trust, administered by the Department of Internal Affairs. Most interviews in the collection have been recorded since 1980 and include the life histories of 23 centenarians recorded in 1985, interviews with more than 80 veterans of World War I, the experiences of immigrant groups and ethnic minorities and interviews with winners of the Golden Shears shearing competition.
The Parliamentary Library provides information, research and reference services for parliament as required by the Parliamentary Service Act 2000. The library provides Members of Parliament with desktop access to electronic resources such as legislative, statistical, legal and news databases.
The library's print collection of more than 500,000 volumes is strongest in economics, politics, public administration, law, social sciences and New Zealand serials and newspapers. International documents include government and parliamentary publications from a wide range of countries, with Australia, Canada, the United Kingdom and the United States particularly well covered. Publications from many inter-government agencies such as the United Nations, the Organisation for Economic Cooperation and Development and the World Bank are also available. The international documents collection is available for public use, as is the Parliamentary Information Service, which responds to enquires on all aspects of the New Zealand Parliament.
The Parliamentary Library building, which marked its centenary in 1999, is a striking example of 19th century Gothic architecture. Extensive refurbishment and earthquake strengthening took place from 1992 to 1996.
Founded in 1910 through a gift from Dr T M Hocken, Dunedin physician, bibliographer and collector, the Hocken Library contains major research collections of New Zealand, Pacific and early Australia. Administered in trust by the University of Otago, the library includes more than 197,000 books, newspapers and periodicals; 11,400 sound recordings; 1,800 pieces of sheet music; 300 videos; 15,900 microforms; 10,000 maps; 1,010,700 photographs; 16,700 posters; 12,700 paintings, including modern works of art; and manuscripts, particularly of early missionaries and literary figures. The library's archives and manuscripts total 7,300 linear metres and are rich in Otago sources - business, local government, education, health, sport, community organisations, the churches and the University of Otago.
The library needs of the majority of New Zealanders are met through public libraries provided by local authorities. Since local authority amalgamation, most cities and districts provide a coordinated library service to the whole district population. There is usually one central district or city library and a number of other service points. At the end of 2003, there were more than 400 libraries in New Zealand covering public, specialist, government and educational needs with a stock of more than 12 million volumes.
There are more than 50 libraries in tertiary education institutions, including specialist department libraries within universities, all of which have major collections. There is provision for a library or library room in every school. New Zealand universities finance their libraries largely from government funding. They have developed research collections and some share an on-line public access catalogue system.
Developments in information technology, including easy access to the internet, have enabled much more intensive use of remote electronic databases and sourcing of material from external databases and collections.
More than 200 specialist libraries and information centres serve government departments, businesses and other organisations. A cooperative inter-library lending system allows resource sharing among the libraries.
The New Zealand Society of Authors (PEN NZ Inc) is the principal advocate for the professional interests of writers. It has more than 900 members from all genres and from beginning writers to senior literary icons. Society membership is open to anyone interested in writers and writing.
As well as providing a range of professional development and communications services to members, the society advocates for writers with industry partners in publishing, bookselling and audience development, and with Creative New Zealand and government departments.
New Zealand was one of the first English-speaking countries to set up a public lending right to compensate writers for lost royalties on books held in public libraries, and the society continues to be involved with issues surrounding this fund.
The society's mentor and manuscript assessment programmes provide beginning writers with feedback on their writing and have been successful in bringing new authors closer to publication.
The society maintains a connection with International PEN, which works on behalf of writers whose lives and freedoms are endangered.
The society is represented on the New Zealand Book Council, the Robert Burns Fellowship selection committee and Copyright Licensing Ltd, which distributes fees to authors and publishers for institutional photocopying of their work.
Administered by Creative New Zealand, the New Zealand Authors' Fund compensates authors for loss of earnings when their books are borrowed from public libraries. In 2003, $1.5 million was distributed among 1,409 New Zealand writers.
Book marketing in the form of national promotions is undertaken by Booksellers New Zealand, an organisation representing booksellers and publishers. Booksellers New Zealand organises The Montana New Zealand Book Awards, Montana Poetry Day, and The New Zealand Post Book Awards and Festival. Detailed information on these activities is available on the Booksellers New Zealand website, www.booksellers.co.nz The Book Publishers' Association of New Zealand's annual book design awards (sponsored by Spectrum Print) recognise excellence in book design and aim to increase public awareness of the quality of New Zealand books. Publishers have mounted collective stands at two major international book fairs since 2001. Attendance at the Frankfurt Book Fair is facilitated by the New Zealand Publishers' Export Joint Action Group and attendance at the London Book Fair is facilitated by Booksellers New Zealand.

Former All Black Christian Cullen promotes his book.
Research commissioned by the Ministry for Culture and Heritage indicates there were at least 600 book publishers in New Zealand in 2002. Most publishing firms were New Zealand owned and employed one or two people. The same study estimated there were more than 3,600 titles published in New Zealand in 2002. Total turnover was estimated at $204 million, with $117 million generated by exports. However, 5 percent of publishers produced nearly 90 percent of the total turnover, while 74 percent of publishers produced only 2 percent of turnover. Educational books made up 56 percent of all titles published and 66 percent of exported titles. Total book spending in New Zealand schools and spending per student remained about the same in 2002 as in 2000. In primary schools, $32.12 was spent per student; in secondary schools $49.29. Buying books was the most popular activity surveyed in the 2002 Cultural Experiences Survey conducted by Statistics New Zealand and the Ministry for Culture and Heritage, with 1.2 million people, or 44 percent of New Zealand adults, buying at least one book during the four-week reference period. In the 2000/01 financial year, the survey estimated that household spending on books totalled nearly $4.7 million a week.
The New Zealand Music Industry Commission was established in June 2000 as a government-funded charitable trust to facilitate growth in the New Zealand music industry through specific projects, such as New Zealand Music Month. One of its main functions is to help the information flow among different facets of the industry, which it does through its website (www.nzmusic.org.nz), where music companies can register, gain information about projects, and get advice on matters such as tours, media and taxation.
The New Zealand Symphony Orchestra (NZSO) entered its 58th year in 2004. Numbering 95 players and supported by an administrative staff of 25, the NZSO is an orchestra of international standing that attracts prominent international artists and conductors. James Judd, director of the Florida Philharmonic, was appointed the orchestra's first Music Director in 1999 and is based in New Zealand for 12 weeks every year. Vesa-Matti Leppanen was appointed Concertmaster of the NZSO in October 2003, the sixth concertmaster in the orchestra's history. The NZSO is based in Wellington and performs regularly throughout New Zealand, travelling more than 50,000km each year, making it one of the world's most travelled orchestras.
Both the NZSO and the NZSO Chamber Orchestra (founded in 1987) perform works from the major symphonic and chamber repertoire, playing around 100 concerts a year. The chamber orchestra includes leading members of the NZSO. It generally performs without a conductor and is directed from the first violin chair by Music Director Donald Armstrong. The NZSO's initiation of an education programme in 2000, establishment of audience development programmes, highly successful concerts at non-subscription centres and a fresher, more ‘funky’ image have broadened its market appeal. As well as presenting a subscription series, the NZSO performs light music, family concerts, educational programmes, operas and ballets. The NZSO is also committed to commissioning, performing and recording works by New Zealand composers, and runs a composition competition for the Douglas Lilburn Prize in partnership with radio's Concert FM. In 2003, the NZSO commissioned New Zealand composer David Farquhar, in recognition of his 70th birthday.
The NZSO has made six overseas visits, to Australia in 1974, to Hong Kong in 1980 and, in 1992, to Expo92 in Seville, where it won international praise for its New Zealand Day concert with Dame Kiri Te Kanawa and then Chief Conductor Franz-Paul Decker.
In May 1997, the orchestra travelled to Australia and performed three concerts as part of the Brisbane Biennial International Music Festival.
In September 2000, it performed at the Sydney Opera House, in a collaboration with performers from the Tainui iwi, as part of the Sydney Olympic Arts Festival.
In 2003, the orchestra travelled to Osaka, Japan, for one concert as part of the Asian Orchestra Week.
The NZSO Foundation Charitable Trust was established in 1996 to aid the long-term funding needs of the orchestra. The foundation's endowment fund grows through contributions by individuals, corporations and associations interested in supporting the NZSO.
The orchestra's website is www.nzso.co.nz
The NZSO National Youth Orchestra brings together about 100 young instrumental musicians each year for an intensive week of rehearsal, culminating in a public concert. In 2001, due to increased sponsorship, the youth orchestra was able to perform for the first time in Wellington and Auckland and in 2004 also travelled to Christchurch. Selected from nationwide auditions, the young players (aged 13-25) receive coaching from NZSO principals, while gaining experience of professional symphony orchestra conditions. Many become NZSO and regional orchestra players. The youth orchestra is administered and funded by the NZSO.
Chamber Music New Zealand is the major presenter of chamber music concerts in New Zealand. International and New Zealand artists perform in celebrity season concerts in nine centres, with additional concerts in 26 smaller cities and towns.
There were more than 140 concerts and events in 2003. With more than 50 years experience, Chamber Music New Zealand has strong ties with artist management and concert presenters worldwide. This offers the opportunity of touring the best of both established and emerging international ensembles.
Chamber Music New Zealand also has a strong commitment to the development of New Zealand musicians and composers.
Chamber Music New Zealand established the New Zealand String Quartet in 1987, a professional, full-time quartet which has developed an international reputation.
Chamber Music New Zealand has organised contests for secondary school students in both instrumental performance and composition categories for nearly 40 years. Many contestants have become New Zealand's finest musicians and enjoyed distinguished international careers. The 2003 contest attracted 494 group entries, representing 1,800 young musicians from throughout New Zealand.
Ticket sales are the major source of Chamber Music New Zealand's funding, with the rest coming from grants from Creative New Zealand and sponsorship.
The Chamber Music New Zealand website is www.chambermusic.co.nz
The New Zealand Choral Federation Te Kotahitanga Manu Reo o Aotearoa (NZCF) is an incorporated society representing the interests of its 390 member choirs. It is served by a national executive of 16 members and maintains a full-time staffed national office in Auckland.
The NZCF, whose Maori name means ‘the assembly of the chorus of birds of New Zealand’, promotes choral music in all its forms and aims to ensure that the experience of singing in a group is available to all New Zealanders. Its long-term goal is to develop a unique New Zealand ‘voice’, a distinctive choral sound which amalgamates the singing traditions of Maori, Polynesian and western music.
Formed in 1985, NZCF provides advisory and information services on all group singing matters, and is the link to the International Federation for Choral Music. The NZCF's income is derived from membership fees, event management, sponsorship and Creative New Zealand.
The NZCF has developed a family of national events to promote group singing and to raise its profile. These showcase events encourage participation and promote excellence in group singing from an early age with The Kids Sing - NZCF Young Voices Group Singing Awards and The Big Sing - NZCF Secondary Schools Choral Festivals. In 2003, a record 202 choirs from 127 schools entered this festival, which culminated in 19 schools being selected to attend The Big Sing National Finale in Wellington.
In 2002 The Classic Sing - NZCF Community Group Singing Awards was introduced with four regional festivals staged. From these events, 11 choirs were selected to compete at the inaugural The Classic Sing Grand Prix in Rotorua in 2003.
The NZCF holds the Sing Aotearoa Festival every three years, a multi-cultural, multi-art festival first held in 1990 to commemorate the 150th anniversary of the signing of the Treaty of Waitangi. Sing Aotearoa brings together singers, writers, composers and dancers from all over New Zealand for an intensive weekend of workshops, performances, forums and cultural exchange.
The Royal New Zealand Ballet is one of New Zealand's largest performing arts organisations, comprising 32 dancers and 25 staff in artistic support, production, marketing and management. Established in 1953, it is the oldest professional ballet company in Australasia. With a strong classical base, and a healthy attitude towards innovation, the company regularly presents an eclectic repertoire of choreographic styles - from 19th century classics to 21st century contemporary works. The dancers of the Royal New Zealand Ballet possess a unique physical strength and versatility, and a well-developed sense of individuality. New international and New Zealand choreography expresses these qualities and features prominently in the company's repertoire. The Royal New Zealand Ballet tours New Zealand more extensively and more frequently than any other major performing arts organisation. In 2003, more than 100,000 people attended performances in 50 centres across the country. The company receives 40 percent of its income directly from Ministry for Culture and Heritage funds and 60 percent from box office sales and sponsorship. International tours have taken the ballet to the United States, Europe, Asia and Australia. The Royal New Zealand Ballet website is www.nzballet.org.nz
The New Zealand School of Dance trains about 60 students a year, offering a two-year National Certificate and a three-year National Diploma in Dance Performance. Students come mostly from New Zealand, but also from overseas. The school, founded in 1967, has a close relationship with the Royal New Zealand Ballet, and students are often seconded to the company for performances. The school offers its students the opportunity to work each year with a number of artists in residence. The school also offers a junior associate programme for aspiring young dancers. The New Zealand School of Dance is principally funded by the Ministry of Education, tuition fees, sponsorships and grants. Fees for dance courses in 2004 were $3,750 (inc GST). The School of Dance website is www.tewhaea.org.nz
More than 350 actors, entertainment technology production specialists and directors have graduated from Te Kura Toi Whakaari O Aotearoa New Zealand Drama School since its establishment in 1970. The school offers a three-year Bachelor of Performing Arts (Acting), a two-year diploma in entertainment technology, a one-year advanced diploma in entertainment technology, a two-year Master of Theatre Arts (Directing) offered jointly with Victoria University and a four-year Bachelor of Performance Design offered jointly with Massey University. The school is principally funded by the Ministry of Education, tuition fees, sponsorship and grants. In 2004, annual fees for the diploma courses and the Bachelor of Performing Arts (Acting) were $4,500 (inc GST) and for the Bachelor of Performance Design approximately $3,500 (inc GST). Papers for the applied Master of Theatre Arts (Directing) started at $43 per point of the paper's worth. The drama school website is www.tewhaea.org.nz
The NBR New Zealand Opera Company was formed in 2000 by the combination of the National Opera of Wellington and Auckland's Opera New Zealand. The aim of the fusion was to widen the reach and to raise the standard of opera production in New Zealand. In its first four years, the company grew its audience by more than 30 percent and won critical acclaim for its world-class productions. In 2004 the company staged The Elixir of Love, Rigoletto, Cosi Fan Tutte and Carmen.
The company does not confine itself to staging productions, however. Through the PricewaterhouseCoopers Dame Malvina Major Emerging Artists Programme, talented young singers receive practical assistance and experience. Development training is focused on voice and performance, with regular tuition by Dame Malvina Major. Opera Outreach is an initiative designed to make opera and the performing arts accessible to young people. This is achieved by hosting creative workshops that give school students the chance to create and perform in their own opera or musical drama; by having school children attend final dress rehearsals of operas; and by providing educational tours.
The New Zealand Film Commission (NZFC) finances distinctly New Zealand films with the aims of reaching significant New Zealand audiences and producing high returns on investment, both in cultural and financial terms.
More than 175 feature films have been made in New Zealand since the film commission was established in 1978. Eighty of these features have had NZFC finance and three have also had finance from the New Zealand Film Fund. A further 28 features from offshore were shot on New Zealand locations.
The functions, powers and duties of the NZFC are defined in the New Zealand Film Commission Act 1978. The commission receives funding from central government and the Lottery Grants Board.
The NZFC budget for the 2003/04 financial year was $13.8 million, of which 70 percent came from the Lottery Grants Board, 17 percent from the government, and the remainder from film investments and sales. The budget varies from year to year according to public funding and returns on film investments.
In the 2002/03 year, the commission committed $6.8 million for the production or post-production of 11 feature films, and $1.6 million for feature film scripts and project development. It also committed $770,000 on the production of nine short films and $1.1 million on the promotion and marketing of features and shorts.
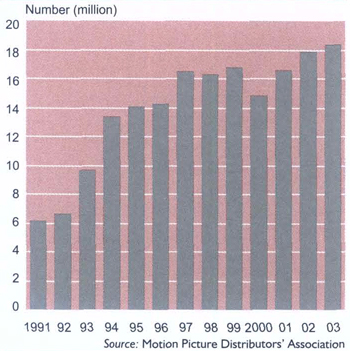
Film-going peaked at 40.6 million admissions in 1960-61, but declined dramatically after the introduction in 1961 of television and, later, home videos. However, as figure 12.01 shows, cinema admissions have shown a steady growth trend in recent years, from 6.1 million in 1991 to more than 18.3 million in 2003. According to Motion Picture Distributors' Association figures, box office takings in 2003 were $156.1 million, compared with $142.7 million in 2002 and $124.6 million in 2001.
The New Zealand Film Archive Nga Kaitiaki O Nga Taonga Whitiahua has three principal functions - to collect, protect and project New Zealand's moving image heritage.
Established in 1981, the archive's collections reflect the breadth of New Zealand's moving image history, from the earliest days of cinema to contemporary film, video and digital productions.
The film and video collection includes features and short films, newsreels, documentaries, home movies, music videos, broadcast programmes, commercials and video art.
The archive also maintains the national television collection on behalf of NZ on Air. This collection represents a diverse range of broadcasters and programming, including television news, dramas, documentaries, games shows, music videos, infomercials, youth programming and sport.
The documentation collection includes promotional, critical and historical materials from 1896 to the present. The collection includes stills, posters, scripts, clippings, programmes, publicity material, production records and files, personal records, storyboards, props and costumes, animation cels, taped interviews and equipment.
Based in central Wellington, the archive has a national focus. In addition to screenings and exhibitions in Wellington, the archive has an Auckland branch and video access sites in art galleries and museums in Dunedin, Christchurch, Palmerston North, New Plymouth and Whangarei. The archive website is www.filmarchive.org.nz
The Films, Videos and Publications Classification Act 1993, which covers a range of mediums, defines a ‘publication’ as:
Any film, book, sound recording, picture, newspaper, photograph, photographic negative, photographic plate or photographic slide.
Any print or writing
Any print or other thing
(i) that has printed on it, or otherwise shown upon it, any word, statement, sign or representation
(ii) on which is recorded or stored any information that, by the use of computer or other electronic device, is capable of being reproduced or shown as any word, statement, sign or representation.
Film is further defined as including cinematographic film, video recordings and any other material record of visual moving images.
Administration. The Films, Videos and Publications Classification Act 1993 established the following bodies:
Office of Film and Literature Classification - A stand-alone Crown entity made up of a chief censor, a deputy chief censor, classification officers, an information unit and support staff. The office classifies publications likely to be restricted or objectionable. The chief censor and deputy chief censor are appointed by the governor-general on the recommendation of the Minister of Internal Affairs, with the concurrence of the Ministers of Justice and Women's Affairs.
The Film and Video Labelling Body - An industry-based body responsible for rating unrestricted films and videos and issuing labels. It bases many of its ratings for New Zealand consumers on the ratings and classifications assigned by Australian or British authorities. Ratings are consumer guides only and do not carry legal sanctions. If a film is likely to be restricted or objectionable, or if the body is having difficulty assigning a rating, the film must be referred to the Office of Film and Literature Classification. The body is responsible for the labelling of films, and submits publications to the Office of Film and Literature Classification for classification on behalf of distributors.
Film and Literature Board of Review - The board comprises members of the public appointed by the governor-general on the recommendation of the Minister of Internal Affairs, with the concurrence of the Ministers of Justice and Women's Affairs. The act provides for the original applicant, the owner, maker, publisher or authorised distributor, or any other person given leave by the Secretary for Internal Affairs, to submit a publication to the board for a review of its classification. The board conducts the review by way of re-examination without regard to the decision of the Office of Film and Literature Classification. The president of the board also has the power to make a decision on any application for an interim restriction order in respect of any publication referred or submitted to the board. An interim restriction order prevents a publication being made available to the public prior to the board issuing its decision. The board is an independent statutory body and is serviced by the Department of Internal Affairs.
Classification. The Films, Videos and Publications Classification Act 1993 established a legal test which looks at whether the availability of a publication would be injurious to the public good. This test is applied to publications in order to ascertain whether restriction is required, and what level of restriction might be appropriate.
Apart from the Film and Video Labelling Body, publications can also be submitted to the Office of Film and Literature Classification by the Secretary for Internal Affairs, the Chief Executive Officer of the New Zealand Customs Service, or by any other person with leave of the chief censor. The chief censor can also ‘call in’ publications where deemed necessary.
The Office of Film and Literature Classification can classify a publication as unrestricted, restricted or objectionable. In general, publications classified by the office deal with matters such as sex, horror, crime, cruelty or violence and are restricted to people aged 16 and over, or 18 and over.
Following classification, films are issued labels by the Film and Video Labelling Body. Films rated G (suitable for general audiences) are issued with green labels. Yellow labels (PG and M) are issued for unrestricted films recommended for a certain age or group. A PG rating means that younger persons may require parental guidance. An M rating means that a film is recommended for mature audiences. Red labels signify a restricted film.
Computer games fall under the definition of films, and the act requires that films intended for supply to the public must be labelled. However, section 8(1)(q) of the act exempts games from labelling unless they are likely to be restricted. Restricted computer games must also carry a red label.
Publications other than films are not required to be labelled before being supplied to the public. However, distributors or publishers can request leave from the chief censor to submit publications such as magazines and books for classification. If the chief censor grants leave the Office of Film and Literature Classification will classify such material as unrestricted, restricted, or objectionable. In addition, display conditions may be imposed and the publication may be required to be labelled.
Classifications assigned are legally enforceable. Under the act, it is illegal to make an objectionable publication, or to supply such a publication to any other person. The act also makes possession of objectionable publications illegal. This applies whether or not the publication has been classified.
The Office of Film and Literature Classification website is www.censorship.govt.nz
Enforcement. The Censorship Compliance Unit of the Department of Internal Affairs enforces the Films, Videos and Publications Classification Act 1993. The department's objective is to increase compliance with New Zealand's censorship laws. The department's main intervention in support of this outcome is ensuring that the film and video industry, magazine distributors and shops adhere to the decisions of the Office of Film and Literature Classification. This is done via an inspection programme that checks compliance with the legislation, ensuring that restricted material is correctly labelled and displayed and that objectionable material is not made available to the public. The department also inspects New Zealand websites to ensure they comply with the legislation. The department is also the primary agency responsible for monitoring, investigating and prosecuting offences involving objectionable material across all publication formats. The department has a particular focus on investigating the making and distribution of child pornography via the Internet. The department has strong links with overseas law enforcement agencies and regularly exchanges intelligence on offenders with those agencies. The censorship compliance unit's website is www.censorship.dia.govt.nz
The New Zealand Customs Service is responsible for ensuring that material imported into New Zealand complies with the law. The service can prosecute offenders who import objectionable publications across the border, either by physical or electronic means. Material seized by customs may be referred to the Office of Film and Literature Classification by Customs or, if prosecution action is taken, through the court. The New Zealand Customs Service's website is www.customs.govt.nz
Copyright in New Zealand is based on the Copyright Act 1994, administered by the regulatory and competition policy branch of the Ministry of Economic Development. Copyright law is complex and only the essential aspects are discussed here. Copyright protection in New Zealand comes into existence automatically on the creation of any original literary, dramatic, musical and artistic work (including photographs), sound recording, film, broadcast, cable programme and published edition. Computer programs gain copyright protection under the definition ‘literary work’. No registration is necessary (or even possible), nor is any other formality required for securing copyright protection.
Duration of copyright. For literary, dramatic, musical and artistic works (including photographs), copyright continues for the lifetime of the author, plus 50 years after the end of the calendar year in which the author dies. For sound recordings and films, copyright generally continues for 50 years from the end of the calendar year in which they were made or made available (whichever is later). For broadcasts and cable programmes, copyright continues for 50 years from the end of the calendar year in which they were made (broadcasts), or included in a cable programme service (cable programmes). Copyright in published editions is for 25 years from the end of the calendar year in which they were first published. Shorter periods of protection apply to works that are industrially applied.
Ownership of copyright. The first owner of copyright is usually the author or maker. However, if this person was employed and made the work in the course of employment, then the employer is the first owner. If the author or maker of some kinds of work (such as sound recordings, films, photographs and computer programs) was commissioned to make that work, the first owner is the person who commissioned the work. For works commissioned or made by an employee, the parties can agree to vary the usual first ownership rule. Ownership of copyright can be assigned in writing to another person.
Moral rights. The author of literary, dramatic, musical or artistic work, or the director of a film, has the right to be identified as the author or director, provided this is asserted in accordance with the Copyright Act 1994. Authors and directors also have the right to object to certain treatments of their work which are derogatory (prejudicial to their honour or reputation), and the right not to have a work falsely attributed to them as an author or director. These rights cannot be assigned.
Exclusive rights of copyright owners. The owner of the copyright for a work has the exclusive right to do, and authorise others to do, a number of ‘restricted acts’ in relation to the work or an adaptation of that work in New Zealand. These include rights to make copies; issue copies to the public, including the rental of films, computer programs and sound recordings; perform, play or show the work in public; broadcast the work or include the work in a cable programme service; and make an adaptation of the work. Copyright infringement occurs when a person undertakes a restricted act without the permission of, or a licence from, the copyright owner.
Permitted acts and exceptions - There are a number of exceptions to these exclusive rights that allow copyright works to be used without the permission of the copyright owner. These ‘permitted acts’ include fair dealing for criticism review and news reporting, fair dealing for research and private study, time shifting of broadcasts or cable programmes (that is, copying them to listen to or watch them at a more convenient time), taking photographs of certain artistic works displayed in public places and backing up computer programs. There are also specific exceptions for libraries, archives and educational institutions.
Performers' rights. Performers have rights to control the recording, reproduction or live broadcast, or inclusion live in a cable programme, of certain performances.
Enforcement of copyright. Action for copyright infringement in New Zealand is generally by way of civil action by the copyright owner. Remedies from civil action include damages, injunctions, or an order for delivery up. Criminal offences apply to certain commercial activities concerning infringing copies and can result in fines up to $150,000, or three months imprisonment.
Copyright Tribunal. The role of the Copyright Tribunal is to resolve disputes regarding licences or proposed licences for the copying, performing or broadcasting of copyright works.
Protection overseas. Copyright protection given in New Zealand generally also extends to works originating from countries party to the Berne Convention for the Protection of Literary and Artistic Works, the Universal Copyright Convention, and the World Trade Organisation (WTO) Agreement. New Zealand is party to all three agreements. Conversely, countries party to either convention or the WTO agreement must give works originating from New Zealand the same protection they give works produced by their nationals.
The Ministry for Culture and Heritage assists the government in the provision and management of cultural resources for the benefit of all New Zealanders, and provides advice and undertakes activities that support and promote the history and heritage of New Zealand. The ministry is responsible to the Minister for Arts, Culture and Heritage and also provides advice and services to the Minister of Broadcasting and the Minister for Sport and Recreation.
The work of the ministry in the 2003/04 financial year was budgeted to cost $8.196 million (excluding GST). Of this, $7.598 million was made available through Vote: Arts, Culture and Heritage. Vote: Sport and Recreation provided $98,000, and $500,000 was contributed by third parties (eg from the writing of commissioned histories).
The ministry administers government funding to these statutory bodies in the cultural sector and manages the Crown's relationship with them: Creative New Zealand, New Zealand Film Commission, New Zealand Historic Places Trust, New Zealand Symphony Orchestra and the Museum of New Zealand Te Papa Tongarewa, which are responsible to the Minister for Arts, Culture and Heritage; the Broadcasting Standards Authority, NZ On Air, Radio New Zealand International and the National Pacific Radio Trust, which are responsible to the Minister of Broadcasting; and Sport and Recreation New Zealand and the New Zealand Sports Drug Agency, which are responsible to the Minister for Sport and Recreation.
The ministry also manages the Crown's relationship with the following cultural agencies, which receive ongoing government funding in return for the provision of services, but which have not been established by statute and are not owned by the Crown: Antarctic Heritage Trust, Aotearoa Traditional Maori Performing Arts Society, the New Zealand Film Archive, the New Zealand Sports Hall of Fame and the Royal New Zealand Ballet.
The ministry maintains a monitoring role with regard to the New Zealand Music Industry Commission which received one-off funding in 2000 to develop the popular music industry; and the Sir Edmund Hillary Trust, which received one-off funding in 2001/02.
The ministry manages, or assists in the management of, the Crown's relationship with other organisations, including the National War Memorial Advisory Council, which advises the Minister for Arts, Culture and Heritage on all matters pertaining to the memorial; the Te Maori Manaaki Taonga Trust, which supports the training of Maori in the care and display of taonga Maori, using funds ensuing from the Te Maori exhibition of the 1980s; the Pukaki Trust, established by the government in 2001 to ensure the care of its taonga; the Advertising Standards Authority and the Waitangi National Trust.
The ministry's other responsibilities include:
Provision of services and policy advice on arts, culture, heritage and broadcasting issues.
Researching, writing and publishing New Zealand history and major reference works, and the provision of advice about New Zealand history.
Management of national monuments, war graves and historic graves, and administration of legislation relating to the symbols and emblems of New Zealand.
The ministry's statement of intent for the five years from 2004 includes implementation of a programme that supports improved governance of major cultural agencies, and building stronger connections to ensure access to good intelligence on issues and developments in culture and heritage. The ministry also plans to construct a Tomb of the Unknown Warrior at the site of the National War Memorial in Wellington to commemorate all New Zealanders who lost their lives serving overseas.
Table 12.01 shows government and Lottery Grants Board funding to the arts and cultural sector for the 2003/04 financial year.
Table 12.01. Funding to the arts and cultural heritage sector Year ending 30 June 2004
| Group | Government funding1 | Lottery grant |
|---|---|---|
1 Vote: Arts, Culture and Heritage; Archives New Zealand; and National Library; Includes GST. Source: Ministry for Culture and Heritage National Library of New Zealand Archives New Zealand Lottery Grants Board | ||
| $(000) | ||
| Te Papa | 20,506 | n/a |
| Te Papa capital contribution | 9,000 | n/a |
| Creative New Zealand | 15,326 | 18,553 |
| New Zealand Film Commission | 2,232 | 8,634 |
| New Zealand Film Archive | 324 | 594 |
| New Zealand Historic Places Trust | 6,547 | n/a |
| Lottery community facilities (II: Cultural facilities) | n/a | 587 |
| Lottery environment and heritage (III: Cultural heritage) | n/a | 3,079 |
| New Zealand Symphony Orchestra | 11,390 | n/a |
| Ministry for Culture and Heritage | 9,111 | n/a |
| National Library | 51,916 | n/a |
| Archives New Zealand | 21,773 | n/a |
| Aotearoa Traditional Maori Performing Arts Society | 1,103 | n/a |
| Royal New Zealand Ballet | 3,695 | n/a |
| New Zealand On Air | 101,855 | n/a |
Creative New Zealand is the main arts development organisation in New Zealand, established as a crown entity under the Arts Council of New Zealand Toi Aotearoa Act 1994. Its work is diverse, ranging from grassroots projects through to support for professional artists and arts organisations.
Creative New Zealand achieves its goals and objectives through its work in arts advocacy, special initiatives and a range of funding programmes. It works in partnership with the arts sector, central and local government, the business sector and communities to enhance its resources and to achieve its vision of the arts at the centre of a creative society.
Its governing body is the Arts Council and its decision-making bodies are the Arts Board, Te Waka Toi and the Pacific Arts Committee. Members are appointed by the Minister for Arts, Culture and Heritage. Staff in Wellington, Christchurch and Auckland offer specialist artform and funding advice, arts advocacy, evaluation and corporate services.
Creative New Zealand's funding comes from the government through Vote: Arts, Culture and Heritage and from the New Zealand Lottery Grants Board. For 2003/04, it received $15.3 million from the government and $18.5 million from the lottery grants board. Creative New Zealand's website is www.creativenz.govt.nz
Advocacy. Advocating for New Zealand arts and artists underpins all of Creative New Zealand's work. In promoting the role and value of the arts to society, it works in partnership with many other organisations. Much of its advocacy work in 2003 focussed on cultural tourism, cultural diplomacy and arts employment.
Creative New Zealand supports several awards to acknowledge the contribution of other sectors to the arts. For instance, the annual Creative Places Award recognises local government innovation and investment in the arts. The 2003 Creative Places Award was won by the New Plymouth District Council for Puke Ariki, the region's new museum, library and visitor information centre. The organisation sponsored a new award in the 2003 Montana World of Wearable Arts Awards, the Creative New Zealand Artistic Excellence Award, to support innovation in the arts and provide an opportunity for senior artists to showcase their work on a high-profile platform. The inaugural award was won by Nelson designer Letty MacPhedran.
Creative New Zealand produces a number of regular and one-off publications. Along with its magazine, On Arts, in 2003 it published posters and postcards aimed at profiling Pacific arts to the international market; the calendar Te Maramataka a Te Waka Toi; and a publication showcasing the work of 11 artists who are licensed users of toi iho, a registered trademark denoting the authenticity and quality of Maori arts. Among its other publications in 2003 were two practical guides for the arts sector, Smart Arts/Toi huatau, a guide to marketing arts events in New Zealand, and The Touring Manual, a guide to touring the performing arts in New Zealand.
Arts development. Creative New Zealand achieves its arts development goals through its funding programmes and special initiatives. It receives more than 1,600 applications for grants each year and is able to support approximately 600 of these through its three funding bodies, the Arts Board, Te Waka Toi and the Pacific Arts Committee.
Professional development, the creation of new work and the presentation of work are supported by funding, as are artist-in-residence programmes, scholarships and bursaries, and international opportunities such as the New Zealand exhibition at the Prague Quadrennial in June 2003; participation of Qwik n Ezy in the world breakdancing championships in Germany; and the Pasifika divas' performance at a festival in Berlin. Through its project funding rounds in 2003, Creative New Zealand also supported the Asia Society in New York with grants totalling $190,000 to mount Paradise Now?, the first major presentation of contemporary art from both New Zealand and other Pacific nations in a United States museum. The exhibition opened in February 2004.
Creative New Zealand also funds 38 professional arts organisations on an annual or three-year basis. These organisations include the New Zealand String Quartet; Toi Maori Aotearoa; several national advocacy and service organisations such as Dance Aotearoa New Zealand and the New Zealand Book Council; regional theatre companies and orchestras; galleries and opera companies. These organisations received a total of $11.5 million in the 2003 calendar year.
Special initiatives. Creative New Zealand identifies opportunities and areas of concern in the arts sector and responds by developing appropriate initiatives. These include awards to artists (eg the Arts Pasifika Awards), fellowships (eg the inaugural 2003 Creative New Zealand Choreographic Fellowship) and initiatives supporting its international strategy (eg the New Zealand exhibition at the 50th Venice Biennale of Art). New Zealand participated in the Venice biennale with the work of artist Michael Stevenson. His multi-layered installation, This is the Trekka, featured in the 18th century church La Maddalena and had been seen by more than 58,000 people by the time the exhibition closed. Time magazine's Michael Fitzgerald said the exhibition “cleverly concocts a time capsule of New Zealand before globalisation”. Creative New Zealand presented the exhibition in partnership with the City Gallery, Wellington.
The registered trademark toi iho, denoting authenticity and quality of Maori arts, was launched in February 2002, and there are now more than 100 Maori artists and 14 stockists licensed to use toi iho. This initiative was developed by Creative New Zealand through Te Waka Toi, and the organisation's ongoing marketing continues to build on the demand for toi iho.
In May 2002, the government announced an additional $1 million (including GST) a year to the literary sector. Representatives from the literary sector, Creative New Zealand and the Ministry for Culture and Heritage consulted on the best use of the additional funding and, as a result, the annual Prime Minister's Awards for Literary Achievement were announced. Recipients of the $60,000 awards in 2003 were Janet Frame (fiction), Hone Tuwhare (poetry) and Michael King (non-fiction). Also announced was the annual $100,000 Creative New Zealand Writers' Fellowship, awarded in 2003 to Owen Marshall.
International residencies announced in 2003 included the Kunstlerhaus Bethanien in Berlin, awarded to Ronnie van Haut; the International Studio and Curatorial Program in New York, awarded to Chris Braddock; the Creative New Zealand Berlin Writer's Residency, awarded to Philip Temple; and the Cook Islands Artist's Residency, awarded to Sylvia Marsters.
Research. Creative New Zealand carries out research to inform its strategic planning and policy development, to support its advocacy work and to provide information of value to the wider arts sector. In late 2003, Creative New Zealand published a research report entitled Portrait of the artist/Te hakaahua o te tangata pukenga. This was based on findings from a survey of 1,010 professional practising artists across a range of artforms, exploring the working life and career path of being an artist in New Zealand.
Regional and local arts development. Creative New Zealand's support for regional and local arts development throughout New Zealand is delivered through a range of programmes and initiatives.
Twelve regions throughout New Zealand have benefited from Creative New Zealand's Regional Strengths strategy, aimed at developing major arts initiatives reflecting each region's unique cultural development. The initiatives range from art guides and websites through to databases, economic impact studies, and new organisations to strengthen regional arts infrastructure. The strategy was developed and implemented as a result of additional government funding to Creative New Zealand in May 2000. During the three-year life of the strategy, Creative New Zealand invested $960,000, which was enhanced by significant funding from other sources.
Creative New Zealand supports local arts activities through the Creative Communities Scheme. Established in 1995, the scheme involves all 74 local authorities as administrative partners, with Creative New Zealand as the funding partner. In 2002/03, this funding support amounted to $2.65 million, disbursed by assessment committees made up of representatives from iwi and the local arts sector, including community arts councils, and local government. More than 2,600 community arts projects are supported each year through the Creative Communities Scheme.
Introduction Ministry for Culture and Heritage
12.1 Statistics New Zealand; Ministry for Culture and Heritage.
12.2 Museum of New Zealand Te Papa Tongarewa; Statistics New Zealand; New Zealand Historic Places Trust; Archives New Zealand; New Zealand Cartoon Archive; Ministry for Culture and Heritage.
12.3 National Library of New Zealand; Parliamentary Library; Hocken Library; New Zealand Library and Information Association of New Zealand (LIANZA); Alexander Turnbull Library.
12.4 New Zealand Society of Authors; Creative New Zealand; Booksellers New Zealand, Book Publishers' Association of New Zealand.
12.5 New Zealand Symphony Orchestra; Royal New Zealand Ballet; Chamber Music New Zealand; New Zealand School of Dance/School of Drama; New Zealand Choral Federation.
12.6 New Zealand Film Archive; New Zealand Film Commission, Motion Picture Distributors Association; Office of Film and Literature Classification.
12.7 Office of Film and Literature Classification.
12.8 Ministry of Economic Development.
12.9 Ministry for Culture and Heritage; Creative New Zealand.
www.apra.com.au - Australasian Performing Right Association
www.archives.govt.nz - Archives New Zealand
www.bpanz.org.nz - Book Publishers Association of New Zealand
www.chambermusic.co.nz - Chamber Music New Zealand
www.copyright.org.nz - Copyright Council of New Zealand
www.creativenz.govt.nz - Creative New Zealand
www.dia.govt.nz - Department of Internal Affairs
www.otago.ac.nz - Hocken Library
www.dia.govt.nz - Lottery Grants Board
www.itanz.org.nz - Information Technology Association of New Zealand
www.mch.govt.nz - Ministry for Culture and Heritage
www.med.govt.nz - Ministry of Economic Development
www.tepapa.govt.nz - Museum of New Zealand Te Papa Tongarewa
www.natlib.govt.nz - National Library of New Zealand
www.nzfa.org.nz - New Zealand Film Archive
www.nzfilm.co.nz - New Zealand Film Commission
www.historic.org.nz - New Zealand Historic Places Trust
www.nzipp.org.nz - New Zealand Institute of Professional Photographers
www.nzopera.com - New Zealand Opera Company
www.tewhaea.org.nz - New Zealand School of Dance
www.arachna.co.nz/nzsa - New Zealand Society of Authors
www.nztvarchive.co.nz - New Zealand Television Archive
www.nzso.co.nz - New Zealand Symphony Orchestra
www.censorship.govt.nz - Office of Film and Literature Classification
www.nzballet.org.nz - Royal New Zealand Ballet
www.rianz.org.nz - Recording Industry Association of New Zealand
www.screen.org - Screenrights
www.spada.co.nz - Screen Producers & Directors Association
www.stats.govt.nz - Statistics New Zealand
www.vuw.ac.nz - Victoria University of Wellington
Table of Contents
New Zealand athletes model clothing manufactured by the supplier of uniforms for the 2004 Olympic Games in Athens.
As well as investing in sports programmes and physical recreation, SPARC has a public policy and research role. It gives effect to government policy aimed at promoting a healthier and more active nation.
With a staff of around 60, SPARC works to ensure that all New Zealanders recognise the value of, and have access to, an active lifestyle that will lead to a healthier and more socially cohesive nation.
The National Sport and Physical Activity Survey conducted by SPARC has been running in its current form since 1997.
The surveys have now interviewed 16,500 New Zealanders - 12,500 adults (people aged 18 and over) and 4,000 young people (5-17 year olds) - about their participation in physical activity and sport.
Some of the findings:
Sixty-eight percent of 5-17 year olds and adults are active, which means they do at least 2.5 hours or more of sport and active leisure a week.
Thirty-two percent of young people and 32 percent of adults are inactive, which means they either do no physical activity, or fewer than 2.5 hours a week.
More girls (36 percent) are inactive than boys (27 percent), and more women (34 percent) are inactive than men (31 percent).
More adults were active in 2000/01 than they were in 1997/98, which meant around 150,000 more adults became active.
Indications are that activity levels for young people may have declined, from 69 percent in 1997/98 to 66 percent in 2000/01, especially for boys, Maori, young Pacific peoples and young people aged 5-8 and 13-15.
More young people are sedentary (doing no activity), up from 8 percent in 1997/98 to 13 percent in 2000/01.
Ninety-eight percent of all New Zealand adults enjoy some sport and active leisure during the year. Participation rates over a year in sport and active leisure are equally high for all New Zealanders, including Maori, European, Pacific peoples and people from other ethnic groups.
Around 2.27 million adults (83 percent) took part in a sporting activity, excluding walking and gardening, during the survey year. Men, Maori and adults aged 49 and under (in particular those aged 18-24) are more likely to participate in a sport than women, adults from other ethnic groups and older adults (those aged 50 and over).
The popularity of sports and activities varies for men and women, and for people of different ages and cultures. Popular sports include golf, tennis and touch rugby for both men and women. Women also enjoy netball and horse riding, whereas men participate more in cricket and rugby union.
Golf is the main sport for New Zealand adults. For Maori, touch rugby is the favourite. Volleyball is the sport most Pacific adults participate in, and for adults from other ethnic groups it is badminton. Netball and basketball are also popular with both Maori and Pacific adults, as are rugby union and rugby league.
Walking and gardening are the two main physical activities men and women do in their leisure time. Other popular physical activities include swimming, fishing, and exercising at home or at the gym.
Thirty-six percent of New Zealand adults surveyed who had participated in a sport or physical activity in the previous four weeks were active members of a club or gym. Men were more likely to have been club members than women (41 percent and 31 percent respectively).
The New Zealand Academy of Sport is SPARC's high performance network, providing a comprehensive network of world-class expertise, services and facilities for New Zealand's best athletes, its promising young athletes and their coaches.
Nationally, the academy provides technical support and targeted financial resources for sporting organisations' high performance programmes. It also provides a range of support services in sports science, sports medicine and athlete and career education to carded national sports organisations, athletes and coaches.
With its head office in Wellington, the academy services high performance athletes, national organisations and coaches through regional operations in Auckland, Wellington and Dunedin.
Sports science services include nutritional advice, fitness testing, mental skills training, biomechanical analysis, physiological monitoring, strength and conditioning, and body composition assessment. Sports medicine services include medical and physical screening, sports vision, podiatry, physiotherapy, injury prevention programmes and diagnosis.
Trained career and educational advisors coordinate career, education and professional development advice to assist athletes to better manage their personal, study and sporting commitments, and to prepare them for life after sport. Athletes and coaches are able to access career training, professional development and education scholarships through this programme.
Specific services provided by the academy are determined by agreements between national sporting organisations and the academy. These agreements are sport-specific and are integrated into the individual sport's high performance plan. To access services, athletes are recognised at one of four levels - world, international, development and junior. Athletes receive a card, which recognises them as being an athlete at one of these levels and which entitles them to access services from the academy in accordance with their sport's service agreement. In 2002, there were approximately 1,000 carded athletes in New Zealand, representing 21 sports.
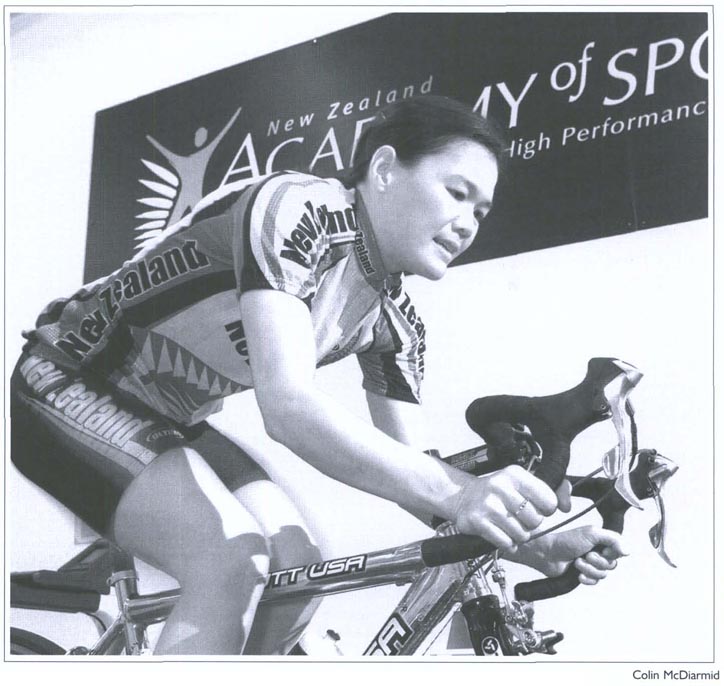
A young athlete in training at the New Zealand Academy of Sport, Wellington.
The academy programme is funded through a trust set up by the government in 2000 for the development of high performance sport over four years.
A separate Prime Minister's Scholarship fund provides athletes with scholarships for tuition fees and living expenses. The fund provided $1 million in 2001, which increased to $3 million in 2002 and $5 million in 2003. The Prime Minister's Scholarship fund also provided more than $1 million for professional development for coaches in 2002.
Young people are a major priority for SPARC. Sport improves the health and fitness of young people and makes them more confident and better prepared for life.
Sport teaches leadership, teamwork, discipline and how to respect others - skills that can be used in all aspects of life.
Schools, clubs and community groups need to work together to provide opportunities that meet the needs of all young people.
It needs parents, coaches, managers and officials to organise and present sport in the right way. And all this needs to be coordinated, if young people are to get the best out of sport.
Moving Through Sport is a national policy that provides a framework and guidelines for delivering sport for young New Zealanders. The policy was developed by the former Hillary Commission after consultation with national sporting organisations and various sport and education agencies. It is currently being reviewed by SPARC.
KiwiSport is SPARC's programme for primary and intermediate schools and sports clubs. Launched in 1988, KiwiSport was initially about adapting adult sports to make them suitable for children. While modified sports remain an important part of today's programme, KiwiSport now is also about providing quality sport and physical activity for young people. It helps schools, clubs and all those involved in junior sport. It also promotes positive competition and fair play. More than 90 percent of New Zealand's primary and intermediate schools deliver KiwiSport to their students.
Sportfit creates sport and fitness opportunities for young people in secondary schools. SPARC funds and works with schools to help provide high-quality sporting experiences and sports education for students. The Sportfit Strategy 2000-2005 aims to support secondary school sport and help schools reach important national goals for young people.
SportSCID2003 is a personal computer database that teachers can download free to assist their schools with day-to-day running of sports programmes.
Sports Choice is an interactive computer package that enables young people to match their physical attributes and preferences with potential sporting suitability. It also provides an indicator of fitness and skill and a method of identifying sport suitability. Sports Choice provides descriptions, information and contact details for sports in New Zealand, including sporting organisations for people with disabilities. The programme includes information about more than 100 sports and how to pursue different sporting options in the community. It can also create a personalised fitness and skill profile to match a user with the sports best suited to them physically.
Sport Shed sets out activities based on sports study, physical activity and outdoor education that can be incorporated into health and physical education teaching and learning programmes. Sport Shed also provides a planning resource that teachers can use on-line, or cut and paste into their own teaching materials.
Active Living is a SPARC programme which includes the Push Play, Green Prescriptions and He Oranga Poutama initiatives to encourage New Zealanders to enjoy physical activity as part of their everyday lives.
Figure 13.01 shows proportions of 5-14 year olds participating in active leisure activities.
Green Prescriptions. A Green Prescription is a health professional's written advice to a patient to be physically active as part of the patient's health management. Ten area managers located within Regional Sports Trusts promote the scheme, whose key players are general practitioners, practice nurses, patients and activity providers. The Green Prescriptions programme is funded by Pharmac. Nearly 6,000 patients were given Green Prescriptions during 2003.
He Oranga Poutama. He Oranga Poutama aims to encourage healthier active lifestyles for Maori by enhancing their enthusiasm for sport, physical recreation and active leisure. A national network facilitates physical activity initiatives in the regions. The network includes regional sports trusts and iwi organisations that provide services encouraging Maori to be active in sport, physical recreation and active leisure.
Sport development. SPARC works across the sport and recreation sector to increase the number of people involved in organised sport, encouraging them to move from active sports people to coaches or administrators.
Coaching. Coaching is vital to the development of any athlete and SPARC is committed to supporting and developing New Zealand's coaches at a national, regional and local level. Through its high performance network, the New Zealand Academy of Sport, SPARC administers the annual Prime Minister's Coach Scholarships, which recognise future national coaches and give them an incentive and the financial support to move to the next level. The aim is to increase the depth of knowledge of coaches and the standard of high performance coaching.
No Exceptions. No Exceptions is SPARC's strategic plan for New Zealanders with disabilities. Implemented in partnership with the Halberg Trust, it enables people with disabilities to access quality sports experiences and provides common goals. It is based on the belief that sport and physical activity, when properly presented and adapted, can make a significant contribution to the lives of both the individual and New Zealand society. No Exceptions refers to people who have traditionally faced barriers that made it difficult for them to take part in the sport or active leisure of their choice. This includes - but is not restricted to - people with physical, intellectual and sensory disabilities and any condition that disadvantages individuals among their able bodied peers.
Other central government bodies. Various government departments, ministries and Crown entities are involved in sport and physical recreation. SPARC has close relationships with the Ministry of Health and the Ministry of Education who share the objectives of helping New Zealand to be a healthy, physically-active nation.
Local government. Provision of sport and leisure facilities such as community centres, parks and playing fields has long been accepted as part of the responsibilities of local and regional authorities. SPARC's Active Communities initiative is making $10 million available to territorial authorities over three years to increase New Zealanders' physical activity levels. Three pilot initiatives covering six territorial authorities are underway in Gore, Southland, Invercargill, Hutt City, Upper Hutt and Christchurch. SPARC is also committed to investing in strategic planning with territorial authorities and other stakeholders via involvement in regional and community sport and physical activity plans.
For many New Zealanders, the successful sportsman or woman represents the archetype of the battler succeeding against the odds. International sporting events in which New Zealand features have the power to arouse intense nationalistic fervour.
New Zealanders have fared exceptionally well in the international arena despite the country's distance from the world's major venues and, until the early 1970s, a comparative lack of state or corporate funding.
Various reasons have been advanced for New Zealand's success. A small population may have helped produce an affinity between the national hero and the weekend athlete, and, while a generally temperate climate has made it possible for athletes to train year round, there is sufficient variety of terrain and climate to foster a wide range of summer and winter pursuits.
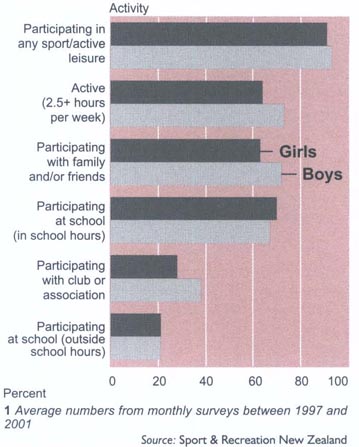
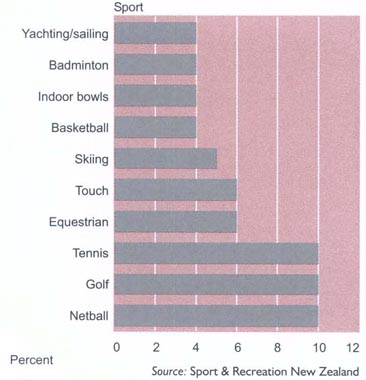
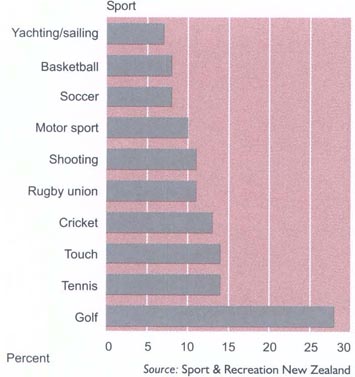
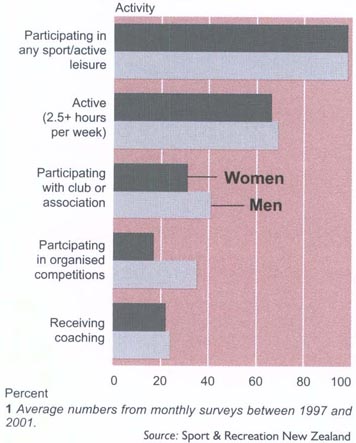
Traditionally, New Zealanders have excelled in rugby union, which has been regarded as the national sport, and, from time to time, in track and field athletics and equestrian events.
However, Sir Edmund Hillary, who with Sherpa Tensing Norgay in 1953 was the first to climb Mt Everest, probably remains New Zealand's best internationally known sportsman.
In more recent years, New Zealanders have had international success in rowing, rugby league, netball (including winning the world championship in 2003), squash, softball (retaining the world championship in 2004), cricket, yachting, cycling and other disciplines.
Figures 13.02 and 13.03 show the 10 most popular sports, by participation rate, for New Zealand women and men, averaged from a number of monthly surveys between 1997 and 2001.
Participation rate is the percentage of those surveyed who recorded any participation in the sport in the previous 12 months.
Physical activity reduces the risk of developing, or dying from, many serious diseases.
Physical inactivity contributes to 2,600 deaths a year in New Zealand, and is second only to smoking as a negative health behaviour.
A Ministry of Health study on the cost-effectiveness of physical activity conservatively estimated that a 5 percent increase in physical activity could result in savings of $25 million a year in direct health costs.
Figure 13.04 shows adult rates of participation in active leisure activities.
Push Play. The Push Play programme aims to get more people, more active, more often by teaching New Zealanders how to build exercise into their daily lives. The Push Play brand is widely used by sports trusts, community groups and local authorities, and a review of New Zealanders' self-reported levels of physical activity in 2002 found that 39 percent of adults said they were active for 30 minutes a day on five or more days a week.
Fishing. A wide variety of fish abound in bays and harbours around New Zealand's coast. Rainbow and brown trout are found in lakes and rivers of the North Island and in South Island lakes. The South Island also has sea-run brown trout in western coast rivers, sea-run quinnat salmon in eastern coast rivers and land-locked salmon. Average sizes of trout vary from district to district depending on environment, climate, food and the number of anglers. With the exception of the Lake Taupo fishery, which is managed by the Department of Conservation, trout and salmon fisheries are managed by Fish and Game New Zealand. This organisation was established in 1990 to manage sportsfish and gamebirds, replacing acclimatisation societies. The Fish and Game New Zealand website is www.fishandgame.org.nz
Big-game fishing. The warm waters off the east coast of the North Island provide some of the best surf, line and spear fishing in the world. The main bases for line fishing from charter boats are at Whangaroa, Bay of Islands (Russell, Otehei Bay and Waitangi), Tutukaka, Mercury Bay (Whitianga) and Tauranga (Mayor Island). The most-prized catches are broadbill, black marlin, striped marlin and blue marlin, while other types of big-game fish found in New Zealand waters are tiger shark, hammerhead shark, mako shark, thresher shark, kingfish (yellow tail) and tuna. Best catches are usually made in February, but fishing is good from December to April.
Shooting and hunting. New Zealand's principal game birds are duck, swan, pheasant, quail, geese and chukor. The sport is limited, the season usually extending for about six to eight weeks depending on the region. By tradition, the season starts on the first weekend of May. A licence is required to hunt game birds and numbers taken are limited. There are few restrictions on big-game hunting. Generally speaking, there is no limit on the number of big-game animals that can be taken, there are no licence requirements and the season is open for most species all year round. Deer of several species, chamois, thar, wild pigs, goats and wallaby are numerous in several areas. For tourists and inexperienced hunters, the service of an experienced guide is recommended.
Skiing and snowboarding. The season in New Zealand extends from June to late October at ski areas in the North and South Islands. Many areas have snow-making equipment to ensure reliable snow depth and quality. New Zealand has 13 commercial ski areas, 11 club ski fields and one commercial cross-country ski area. In the North Island, the main snow sports centre is Mt Ruapehu, in the Tongariro National Park. There are two commercial ski areas, Whakapapa and Turoa, and one club field, Tukino. The Maunganui Ski Club operates on Mt Taranaki or Egmont. In the South Island, the commercial ski areas are Coronet Peak, The Remarkables, Cardrona, Treble Cone, The Snow Park (Queenstown/Wanaka); Ohau, Mt Dobson and Round Hill (Aorangi); Porter Heights, Mt Hutt and Mt Lyford (Canterbury). There are nine club fields in the South Island. The Snow Farm on the Pisa Range near Queenstown/Wanaka offers 50 kilometres of cross-country skiing. Glacier skiing on the Tasman and Fox Glaciers, with access via ski-planes/helicopters, is also available, while guided heli-skiing and ski touring gives access to the Ben Ohau Ranges, the Harris Mountains, the Two Thumbs Range, the Aoraki/Mt Cook//Tasman Glacier area, Mt Hutt and Queenstown in the South Island. The International Ski Federation (FIS) has sanctioned the holding of annual international snow sports competitions at Mt Hutt, Whakapapa, Coronet Peak, Cardrona and Turoa.
Mountaineering and tramping. The closeness of mountains and forests to the main centres of population in New Zealand gives the opportunity for adventures away from civilisation. In the Waitakere and Hunua Ranges, near Auckland, in the many national and forest parks and reserves of the North Island, and through the extensive parks and protected natural areas of the South Island, there are many tracks through beautiful scenery. Tramping tracks range from half-day, family-oriented walks to challenging tramps in back-country and alpine isolation. Climbing (both rock and ice) is becoming increasingly popular, with many opportunities throughout New Zealand. Information on mountaineering and tramping is available through commercial guiding companies or the Department of Conservation.
Walking. New Zealand's walkways system offers walking opportunities over primarily private land and is a complementary system to the network of back-country tramping tracks. Walkways vary from half-hour walks to four or five days for the St James Walkway in North Canterbury. In addition to walkways, government agencies and local authorities develop and maintain public walking tracks throughout New Zealand. The Great Walks are New Zealand's most famous tracks, popular with both New Zealanders and overseas visitors. They include Lake Waikaremoana, Urewera National Park; Tongariro northern circuit, Tongariro National Park; Abel Tasman Coastal Track, Abel Tasman National Park; Heaphy Track, Kahurangi National Park; Routeburn Track, Mt Aspiring and Fiordland National Parks; and Milford Track, Kepler Track and Rakiura Track, Fiordland National Park. Most of these tracks take two to four days to complete and are well marked. Huts and campsites are provided for overnight accommodation. The Abel Tasman Coastal Track is the most popular, with about 30,000 overnight visitors a year.
Cycling. A new cycling organisation, Bike NZ Inc, was formed on 1 July 2003, representing and incorporating the interests of Cycling New Zealand, Mountain Bike NZ, BMX New Zealand, Cycling Advocates Network, the Masters Cycling Association and the Schools Cycling Association. Bike NZ Inc is affiliated to the international cycling body (UCI) and has an affiliated membership of approximately 5,000 athletes and officials. This figure does not include those competing in school competitions.
Table 13.01 shows expenditure on gaming, including racing, lotteries commission products, gaming machines and casinos, from 1980 to 2003.
Racing. There are 70 thoroughbred, 50 harness and 12 greyhound racing clubs in New Zealand. The number of meetings held by each club and the stakes they offer vary widely, particularly between large city clubs and small provincial clubs.
New Zealand also has a strong horse breeding sector. Export of thoroughbred horses is worth about $100 million a year, with Australia and Asian countries the main markets. New Zealand-bred horses compete very well overseas and regularly win top races, although in total they constitute a small percentage of runners.
The New Zealand Racing Board is developing a long-term strategy to grow the racing industry, and is implementing initiatives to combat declining race attendance and increased competition for the leisure time of New Zealanders.
The export of thoroughbred horses is worth about $100 million a year to New Zealand.
New Zealand Racing Board. Betting in New Zealand on racing, on and off course, and on sports is conducted by the New Zealand Racing Board through its Totalisator Agency Board (TAB) outlets and agencies, telephone services and the internet.
Established in 1950, the TAB was the first in the world to facilitate off-course betting on a comprehensive national scale through a statutory body.
Under the Racing Act 2003, the TAB amalgamated with the Racing Industry Board to become the New Zealand Racing Board (NZRB) on 1 August 2003. The new organisation continues to run its services under the TAB brand.
The NZRB has three fundamental objectives:
To provide a safe and corruption-free mechanism for betting on horse racing (gallops and harness), greyhound racing and sport.
To support the racing industry by returning the profit it makes to racing clubs and the industry.
To be the leading provider of responsible gambling services, training its staff in problem gambling awareness, monitoring customers where necessary, and contributing significantly to the treatment of problem gambling.
There are more than 600 TAB outlets throughout New Zealand and in the 2002/03 racing year, turnover for off-course racing totalled $1,011.7 million, with a further $77.6 million bet on-course. Sports betting totalled $117.6 million.
The internet enables the NZRB to compete for a share of the international racing and sports betting market. The TAB website www.tab.co.nz has a customer base of bettors from more than 70 countries.
Lotteries and gaming. The Gaming and Lotteries Act 1977 was replaced by the Gambling Act on 19 September 2003. The new act includes the following key provisions:
The Department of Internal Affairs is responsible for tighter licensing, auditing, reporting and other controls on gaming machines in pubs and clubs to ensure that profits go to community groups.
Territorial authorities (ie city and district councils) have the power to reduce or cap the number of gaming machines in their area and to decide the location of venues.
Problem gambling is recognised as a public health issue and the sector is required to pay a levy for prevention and treatment programmes. The Ministry of Health is responsible for coordinating problem gambling services.
Gaming machine venues that had a licence on 17 October 2001 are allowed up to 18 machines, or the actual number they were lawfully operating on 22 September 2003, whichever is lower.
Gaming machine venues that did not have a licence on 17 October 2001 are allowed up to nine machines, or the actual number they were lawfully operating on 22 September 2003, whichever is lower.
Gaming machines can be licensed as a form of fund-raising for community groups only and cannot be used for commercial benefit.
All gaming machines must be connected to an electronic monitoring system to be set up the Department of Internal Affairs within three and-a-half years.
The new act disestablished the Casino Control Authority, with some of its functions going to the Department of Internal Affairs and others to a new Gambling Commission. The act prohibits any new casino licences being issued and prevents existing casinos from expanding their gambling operations.
The New Zealand Lotteries Commission (NZLC) is responsible under the Gambling Act 2003 for promoting and conducting New Zealand lotteries, including Lotto, Lotto Strike, Lotto Powerball, Keno and Instant Kiwi.
Net profits from NZLC games are distributed to arts, sports, charitable and community causes by the New Zealand Lottery Grants Board, In the 2002/03 financial year, NZLC transferred $107.8 million to the Lottery Grants Board, the equivalent of $2 million a week. In the 2000/01 financial year, $130 million was transferred.
For every dollar spent on lotteries, 55 cents is paid in prizes, 21 cents is transferred to the Lottery Grants Board, 10 cents is paid in taxes, 7 cents is paid in retail commission and 7 cents covers operating costs (expenses).
In the financial year ending 30 June 2003, sales were $539.9 million. Of this, $286.6 million became payable in prizes, $107.8 million was transferred to the Lottery Grants Board, tax paid was $56.1 million, and $37.8 million was paid in retail commission. After allowing for transfers to the Prize Reserve Fund, less other incidentals of $12.0 million, the operating expenses for the year totalled $40.0 million.
Betting on horse racing, greyhound racing and sports events is controlled under the Racing Act 1990.
The New Zealand Lottery Grants Board Te Puna Tahua is a Crown entity set up by parliament to distribute profits from state lotteries. The board is chaired by the Minister of Internal Affairs. It distributes lottery profits to the arts, to sports, for film, for health research, to individuals with disabilities and to community groups (environment and heritage, welfare, youth, seniors, marae heritage and facilities, and general). Funds are distributed by the board through Sport & Recreation New Zealand, Creative New Zealand, the New Zealand Film Commission and lottery distribution committees. The minister also has a discretionary fund for purposes not covered by the distribution committees. Table 13.02 shows the allocation of lottery profits from 1997 to 2003.
Table 13.2. Allocation of lottery profits
Years
ending 30 June
| Recipient | 1997 | 1998 | 1999 | 2000 | 2001 | 2002 | 2003 |
|---|---|---|---|---|---|---|---|
- nil or zero ... not applicable Source: New Zealand Lottery Grants Board | |||||||
| $(million) | |||||||
| Distribution committees | |||||||
| Lottery Community Facilities | 12.10 | 12.00 | 11.40 | 10.62 | 10.25 | 9.44 | 4.49 |
| Lottery Environment and Heritage | 10.71 | 10.42 | 9.93 | 9.38 | 9.09 | 6.63 | 5.49 |
| Lottery General | 19.63 | 15.26 | 13.30 | 11.98 | 11.75 | 10.77 | 6.12 |
| Lottery Health Research | 4.00 | 3.50 | 3.45 | 3.22 | 3.11 | 2.31 | 1.91 |
| Lottery Marae Heritage and Facilities | - | 6.00 | 6.00 | 6.00 | 5.79 | 4.99 | 4.14 |
| Lottery Seniors (Aged) | 3.70 | 3.40 | 3.60 | 3.12 | 3.12 | 3.12 | 2.96 |
| Lottery Science Research | 2.00 | 1.00 | - | - | - | - | - |
| Lottery Welfare | 14.40 | 12.00 | 11.90 | 11.08 | 11.08 | 11.08 | 10.51 |
| Lottery Welfare- | |||||||
| Individuals with Disabilities | 3.20 | 3.20 | 3.20 | 3.20 | 3.20 | 3.20 | 3.03 |
| Lottery Youth | 6.80 | 5.00 | 5.60 | 5.22 | 5.22 | 5.22 | 4.95 |
| Minister of Internal Affairs | 0.28 | 0.28 | 0.28 | 0.28 | 0.35 | 0.10 | 0.08 |
| Statutory bodies | |||||||
| Creative New Zealand | 20.25 | 20.25 | 20.25 | 20.31 | 20.31 | 20.31 | 18.55 |
| Arts Foundation of New Zealand | - | - | 1.00 | 1.00 | 0.10 | 1.00 | 0.92 |
| Film Commission | 8.77 | 8.77 | 8.77 | 8.80 | 8.80 | 8.80 | 8.04 |
| Film Archive | - | - | - | - | - | 0.65 | 0.59 |
| Sport & Recreation New Zealand | 27.00 | 27.00 | 27.00 | 27.08 | 27.08 | 27.08 | 24.74 |
| Sports 2000/High Performance Sports Fund | 3.66 | 3.72 | 3.78 | 3.81 | 3.81 | 3.81 | 3.48 |
| Other | |||||||
| Alcohol and drug | 1.20 | 1.00 | 0.70 | 0.40 | - | - | - |
| Cultural Olympiad | 0.50 | ... | ... | ... | ... | ... | |
| Millennium | 2.00 | 2.00 | 2.00 | 4.00 | ... | ... | ... |
| Total | 140.20 | 134.80 | 132.16 | 129.50 | 123.06 | 118.51 | 100.00 |
Casino Control Authority. Established under the Casino Control Act 1990, the main functions of the Casino Control Authority were to consider applications and grant casino licences, act as an appeal authority for licence holders, and advise the Minister of Internal Affairs on the act and on casino policies generally. The authority issued six casino licences for casinos in Christchurch, Auckland, Dunedin, Queenstown (two) and Hamilton. The Gambling Act 2003 does not provide for the issue of any new casino licences and prohibits existing casinos from expanding their gambling operations. The act also disestablished the Casino Control Authority in 2004, with some of its functions going to the Department of Internal Affairs and others to a new Gambling Commission.
Problem gambling. Gambling-related harm has emerged worldwide as a social and health issue. In New Zealand, the last decade has been characterised by a growth in gambling opportunities and spending. This growth has been paralleled by an increased awareness of the risk of gambling-related harm to various population groups, such as Maori, Pacific peoples, Asians, women and older people. From 1 July 2004, the Ministry of Health took over the role of funding and coordinating services and activities relating to gambling-related harm. The ministry is in the process of designing a strategic plan to prevent and minimise gambling harm, and a range of primary and secondary prevention activities will be developed and funded to address the problem. These will include a number of existing problem gambling services.