
Te Pukapuka Houanga Whaimana o Aotearoa
Statistics New Zealand
Statistics New Zealand operates an information service. In answer to a letter, email, visit, or telephone call, information analysts can provide statistical information, or tell you more about the department's other services, including access to statistics on the INFOS computer database and the SNZ website.
Website: www.stats.govt.nz
Email:
info@stats.govt.nz
70 Symonds Street, AUCKLAND
Private Bag 92003, Telephone +64-9-357 2100, Facsimile +64-9-379
0859
Aorangi House, 85 Molesworth Street, WELLINGTON
PO Box 2922, Telephone +64-4-495 4600, Facsimile
+64-4-495 4610
Dollan House, 401 Madras Street, CHRISTCHURCH
Private Bag 4741, Telephone +64-3-374 8700,
Facsimile +64-3-374 8864
The New Zealand flag
The New Zealand flag is the symbol of the realm, government and people of New Zealand. The flag features, on a royal blue background, a Union Jack in the first quarter and four five-pointed red stars of the Southern Cross on the fly. The stars have white borders. Its royal blue background is reminiscent of New Zealand's blue sea and clear sky, while the stars of the Southern Cross emphasise New Zealand's location in the South Pacific Ocean. The Union Flag gives recognition to New Zealand's historical foundations and the fact that the country was once a British colony and dominion.
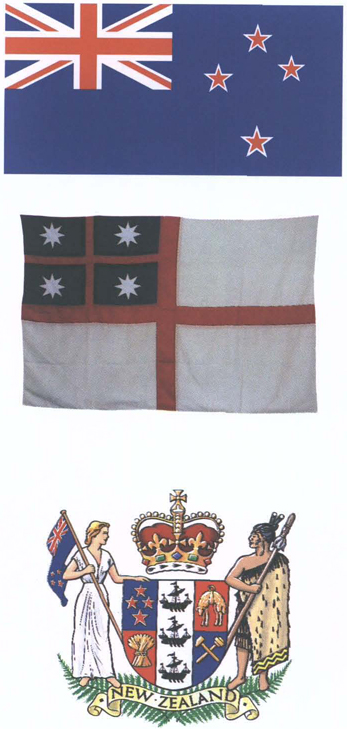
Te Hakituatahi o
Aotearoa
The first flag of New Zealand 1835
For a detailed history of Te Hakituatahi o Aotearoa, see Chapter 3: Government. Heraldic description: on a white field, a red St George's Cross; in the upper canton, next to the staff on a blue field, a smaller St George's Cross in red, severed from the blue by a fimbriation of black, half the width of the red and in the centre of each blue quarter a white eight-point star.
The New Zealand coat of arms
New Zealand has had its own coat of arms since 1911. Prior to that the United Kingdom coat of arms (featuring a lion and a unicorn on either side of a shield and crown) was used. This design still adorns the top of the pediment on the Old Government Buildings in Lambton Quay, Wellington, which were built in 1875 to house the colony's public service, but which now house Victoria University's law school. One of the few specific changes to flow on from the granting of dominion status in 1907, was the right for New Zealand to have its own coat of arms. The design was approved by royal warrant on 26 August 1911. The coat of arms was revised in 1956 following further constitutional changes when the country became the ‘Realm of New Zealand’ instead of ‘Dominion’. Accordingly, the British lion holding aloft the Union Jack was replaced by St Edward's Crown, which had been worn by Queen Elizabeth II at her coronation. At that same time, the dress of the figures at the side of the shield was revamped, some Victorian-looking scroll work at the base of the design was replaced by two ferns, and the motto ‘onward’ was replaced by ‘New Zealand’.
New Zealand Official Yearbook 2002
ISSN 0078 0170
ISBN
1-86953-517-0
This book is copyright. Except for the purpose of fair review, no part may be stored or transmitted in any form or by any means, electronic or mechanical, including recording or storage in any information retrieval systems, without permission in writing from the publishers. No reproduction may be made, whether by photocopying or by any other means, unless a licence has been obtained from the publisher or its agent.
Copyright © Statistics New Zealand 2002.
Published in 2002 by David Bateman Ltd, 30 Tarndale Grove, Albany, Auckland, New Zealand.
Printed by PrintLink, Wellington, New Zealand.
Table of Contents
List of Figures
- 1.1. Weather
- 11.1. Internet activities 2001
- 12.1. Cinema admissions
- 14.5. Employment
- 16.1. Land use
- 16.6. Parks of New Zealand
- 16.7. Whale sanctuaries
- 17.6. Imports and exports
- 18.9. Major crops
Area sown
- 18.1. Pipfruit, total exports
- 19.5. Wood panel production
- 19.6. Forestry exports, 2001P
- 20.1. Coal fields, 2001
- 20.3. Non-metallic minerals
- 23.1. Marine accidents
- 25.4. Forest product exports1
- 25.7. Machinery exports
- 25.9. Machinery imports
- 25.1. Mineral fuels imports
- 25.11. Vehicle imports
- 25.13. Major trading partners, 2001
- 25.16. Trade with Australia
- 25.17. Exports to Australia (fob)
- 25.18. Imports from Australia (cif)
- 25.19. Trade with United States
- 25.21. Trade with EU countries
- 25.22. Trade with Asia
- 26.1. Transportation prices
Comparison of petrol prices with movements in transportation prices in the CPI
- 28.2. Operating balance
List of Tables
- 1.4. Principal mountains
- 1.5. Principal rivers(1)
- 1.6. Principal lakes(1)
- 3.18. Territorial authorities
- 3.19. Regional councils
- 4.2. Defence expenditure
- 4.5. State of the navy
- 4.6. Strength of the navy
- 4.7. State of the army
- 4.8. Strength of the army
- 5.14. Vital statistics summary
- 5.15. Death rates: summary
- 6.13. Dwelling type
- 6.15. Tenure of household1
- 6.2. Household amenities
- 6.22. Marriage rates
- 6.28. Divorce rates
- 8.1. Health expenditure1
- 8.17. Drownings
- 9.4. Secondary school leavers in 2000 by level of highest attainment, gender
and ethnic identification
- 9.12. Education 1875–2000
- 10.11. Sentencing for all offences1
- 10.13. Community-based sentences1
- 10.14. Penal institutions1
- 10.15. Age distribution of inmates1
- 11.2. Magazine circulation
- 11.3. Media advertising1
- 11.5. Postal outlets
- 11.8. 2000/01 Stamp issues
- 13.1. Gaming statistics
- 14.1. Movable public holidays
- 14.21. Median income by region
- 14.24. Percentage of taxable income received and tax paid by deciles of
individuals, 1998/99 tax year
- 14.25. Labour cost index weights
- 16.1. Land use today1
- 17.4. National capital account
- 17.5. External account
- 17.12. Capital stock
- 17.16. Trade in services1
- 18.9. Sheep categories
- 18.1. Cattle categories
- 18.11. Average net schedule prices
- 18.12. Meat production1
- 18.15. Export meat production
- 18.16. London wholesale lamb prices
- 18.18. Wool production1
- 18.19. Wool sold at auction
- 18.21. Wool sector export earnings1
- 18.22. Dairy factory production
- 18.25. Pigs
- 18.26. Chicken production
- 18.29. Grain and peas 19991
- 18.3. Areas planted in fruit
- 18.31. Apple and pear sales1
- 18.32. Kiwifruit production
- 18.33. Wine industry statistics
- 19.7. Volume of timber exports
- 19.8. Volume of timber imports
- 19.13. Principal fish exports
- 19.15. Seafood exports
- 20.13. Mining
- 22.1. Residential prices
- 22.2. House price
index1,2
- 22.5. Household claims
- 22.11. Work put in place
- 23.6. Formed roads and streets
- 23.11. Licensed motor vehicles
- 24.2. Company registrations
- 24.3. Personal bankruptcies
- 24.4. Company insolvencies
- 24.11. Value of credit card sales1
- 25.17. Mineral fuel imports1,
2, 3
- 25.24. Trade with Australia1,
2, 3
- 25.3. Trade with Japan1,
2, 3
- 26.11. Capital goods price index1
- 27.7. Foreign exchange rates1
- 28.1. Expenses
- 28.5. Breakdown of tax revenue
- 28.7. Direct taxation
- 28.8. Indirect taxation
- 28.1. Statement of borrowings
- 28.11. Type of Crown debt
Table of Contents
This 103rd edition of the New Zealand Official Yearbook continues the tradition of providing a comprehensive picture of life in New Zealand based on the most recent and accurate information available. This edition is the second Yearbook to be published formally on a two-year cycle. This longer publishing cycle allows for new kinds of analysis, and for this 2002 release has provided the opportunity for a specialist review of each chapter.
The theme for the 103rd edition is the information society, reflecting the tremendous growth and convergence of information and communications technologies in recent years. Sidebar stories and photographs illustrate the interface of technologies and people in New Zealand, highlighting changes in business, government, education, the home, culture, natural environment, sports and leisure, healthcare and other facets of daily life. Many of the historical time series graphs and tables remain, offering comparisons with the recent past as well as with previous centuries. Historian David Green's new article brings a 21st century perspective to the history of New Zealand. Preparation of this Yearbook has itself embraced information technology, with extensive use being made, for the first time, of electronic transfer of information to gather and prepare material for publication.
Information from Censuses of Population and Dwellings is always an important aspect of the Yearbook, and in this edition we are pleased to present some of the initial information produced from Census 2001. Availability of this material so soon after census day reflects the uptake and use by Statistics New Zealand of new technologies such as the electronic scanning and processing of census forms.
I would like to offer special thanks to the Yearbook team for the high standards they have achieved, and for working at a rapid pace during early 2002 to ensure Census 2001 information could be included. Our thanks also to publisher David Bateman for providing a high-quality finished product.
On behalf of Statistics New Zealand, I would also like to thank the more than 400 businesses, government departments, non-government organisations, academic institutions and individuals for their time, effort and goodwill in providing and updating contributions to the Yearbook. Finally, I again thank all New Zealanders and visitors to New Zealand who participated in Census 2001. The very high level of cooperation in not only the census but in all our other surveys ensures the continuing high quality of our official statistics.

Brian Pink
Government Statistician
The 2002 Yearbook was produced by the Information and Publishing Services Division of Statistics New Zealand, with the assistance of the many individuals and organisations listed in the ‘Contributors’ section at the end of each chapter, or below the sidebars. The department wishes to record its thanks to them and to the following:
Divisional managers: Helen Stott, Kevin Eddy
Publishing services managers: Chris Daish, Margaret O'Sullivan (acting), Geoffrey Mead, Mark McGann (acting), Angela Perkins
Yearbook Editor: Paul Cavanagh
Editor and production coordinator: Nicky McCreanor
Editorial support: Sandra Wasley, Antje Heymanns, Angela Papprill, Marie Smith
Design: Maureen Metcalfe, Merran Plunket
Typesetters: Merran Plunket, Teresa Ross, Janet Gudmun, Sandra McKenzie
Maps and diagrams: Maureen Metcalfe, Merran Plunket
Illustrations researcher: Margaret Low
Technical support: Kevin Tompson
Database design: Megan Hutchison
Database development: Irina Simeonov, Nestor Velasco
Bibliographic research: Beryl Anderson
As a new reader of the New Zealand Official Yearbook you may be surprised at the range of information within its pages. The following notes are to help familiarise you with the book.
The New Zealand Official Yearbook is published as a compendium of facts and figures on New Zealand and to describe major changes in New Zealand's administrative framework in the two years preceding publication.
The Yearbook contains the latest available statistics on particular topics. It also tells its readers where further information can be found.
There are two likely ways you will look for information.
If your question is general, for example ‘How is New Zealand governed?’, then you will probably refer firstly to the Contents (overleaf), which lists chapter headings and major sections within chapters. In approaching the book this way it is worth bearing in mind that the 28 chapters follow a ‘logical’ progression. The first few chapters describe the physical setting as well as New Zealand's history, system of government and international relations. A description of its people comes next, followed by social framework and institutions. The second section of the Yearbook begins with an overview of New Zealand's workforce and moves to a discussion of the nation in broad economic terms. Then follow descriptions of each of the constituent sectors, ending with a chapter on public sector finances.
If, on the other hand, your question is more specific, for example ‘How many people died in air accidents in 2000/01?’, then the book is thoroughly indexed. A brief note on the system used can be found at the beginning of the index.
Because the Yearbook covers such a broad range of subjects, few of its statistics are being published for the first time. Many statistics from government departments and other organisations have been published in the year preceding Yearbook publication.
The source of a particular table is noted at the foot of the table. The following symbols may be used in the tables:
Figures are often rounded-off to the nearest thousand or some convenient unit. Sometimes this rounding results in tables with totals that disagree slightly with the total of the individual items shown. See sidebar on page 95 for more detail on rounding.
Statistics from Censuses of Population and Dwellings have been subject to a process of random rounding, whereby all cell values, including row and column totals, have been randomly rounded to base 3. Individual figures will therefore not necessarily add up to the stated totals.
A glossary of statistical terms used is given at the back of the book.
Statistics New Zealand has made every effort to obtain, analyse and edit the information and statistics used in the Yearbook. However, Statistics New Zealand gives no warranty that the information or data supplied contains no errors, and shall not be liable for any loss or damage caused by the use, directly or indirectly, of material contained in the Yearbook.
New Zealand's scenery, creativity and technical capability was showcased to the world in December 2001 with the release of the first of director Peter Jackson's The Lord of the Rings movie trilogy. To celebrate the release of The Lord of the Rings: The Fellowship of the Ring, New Zealand Post produced a range of stamps, postcards and presentation packs featuring scenes from the movie. The six ‘Maximum Cards’ shown here feature designs derived from scenes in the film, related stamps and the date stamp commemorating the first day of issue.
Aragorn (Viggo Mortensen) with Arwen (Liv Tyler).
Balin's Tomb – the Fellowship prepares for an attack.
Gandalf the Grey
(Sir Ian
Mckellan) in Rivendell.
The patrons of the bar at the Inn
of the Prancing Pony.
Frodo Baggins (Elijah Wood) in Rivendell.
Galadriel (Cate Blanchett) before the Mirror at Lothlorien.
Ecstasy suitcase
Security equipment used by the New Zealand Customs Service exposes the contents of this suitcase to customs officers – the case is full of the class B controlled drug commonly known as Ecstasy. Customs checks all passengers and crew entering New Zealand by sea or air, as well as associated craft and vessels.
Tuatara x-ray
Advances in medical technology developed for the benefit of human patients can often, with a little adaptation, benefit animal patients too. One of the more unusual clients of Wakefield Radiology in Wellington was this tuatara from Wellington Zoo, which needed an x-ray to confirm she was carrying fertile eggs. Wakefield Radiology provides the zoo with free x-ray and ultrasound services.
Fossil images
Images produced using the latest electron microscope technology clearly reveal the surface features and shape of these 0.4 to 1 million-year-old fossils. These planktic foraminifers are from a deep-sea drill-hole on the north-east slope of Chatham Rise, 1,000 kilometres east of New Zealand.
Victoria University of Wellington design students use 3D digital design software as an aid to conceptualising, generating, defining and refining complex form and space in their design solutions. Experimental model-making techniques using computer-generated data are used alongside established design studio methods to allow greater experimentation, control and manipulation of form and space to create organic, fluid designs such as those shown here.
Design issues of scale, proportion, detail, colour, reflection, refraction, opacity and tactility are addressed using advanced modeling software. Computer simulation of materials, texture and light allow the student to experiment with the visual and aesthetic qualities of the object.
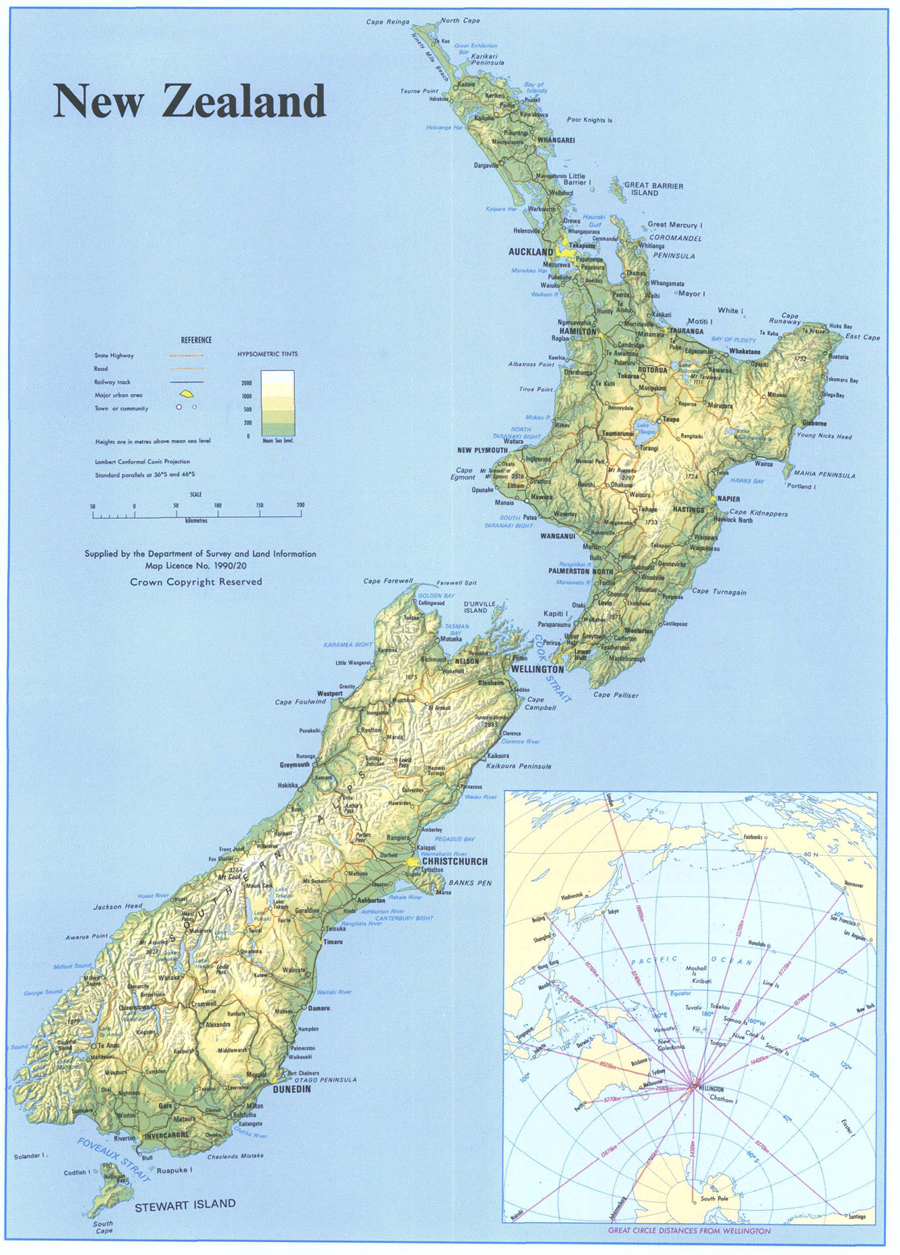
Table of Contents
The mountains of New Zealand strongly influence weather systems.
New Zealand is a long, narrow, mountainous country, surrounded by a large expanse of ocean. The nearest major land mass is Australia, about 1,600km to the west. The climate of New Zealand is largely influenced by:
Its location in a latitude zone where the prevailing wind flow is westerly.
Its surrounding oceanic environment.
Its mountains, especially the main mountain chain, which modifies weather systems as they pass eastwards, and which also provide a sheltering effect on the leeward side. Local mountain formations are the cause of a number of different ‘microclimates’ in a given region.
Day-to-day weather is mostly determined by a series of anticyclones and troughs of low pressure in the westerlies. Consequently, New Zealand's weather is changeable, typically with short periods of settled or unsettled weather. At times, the westerly regime breaks down and there are cold, southerly outbreaks, with snow in winter and sometimes spring, or northerly intrusions of warm, moist air when tropical depressions move southwards into New Zealand latitudes in the summer.
The main mountain chain which extends over much of the length of the country is a major barrier to weather systems approaching from the west. Consequently, there is a marked contrast between climates of regions west and east of the mountains. This contrast is much greater than north-south climatic differences.
Surrounding oceans have a moderating effect on temperatures in most northern and western regions. However, inland and eastern areas may experience large temperature variations. High temperatures usually occur in the east in warm, north-westerly wind conditions due to the so-called föhn effect. These high temperatures are often followed by sudden falls in temperature as cold fronts move up the east coast of both islands.
Many parts of New Zealand are subject to extremes of wind and rain, occasionally giving rise to wind damage to buildings and forests, and flooding as depressions with their fronts pass close to or over the country. The rugged terrain is an important factor in enhancement of wind strength and/or rainfall. Figure 1.1 summaries weather details from 1971 to 2000. Climate extremes up to 31 May 2001 are presented in table 1.1.
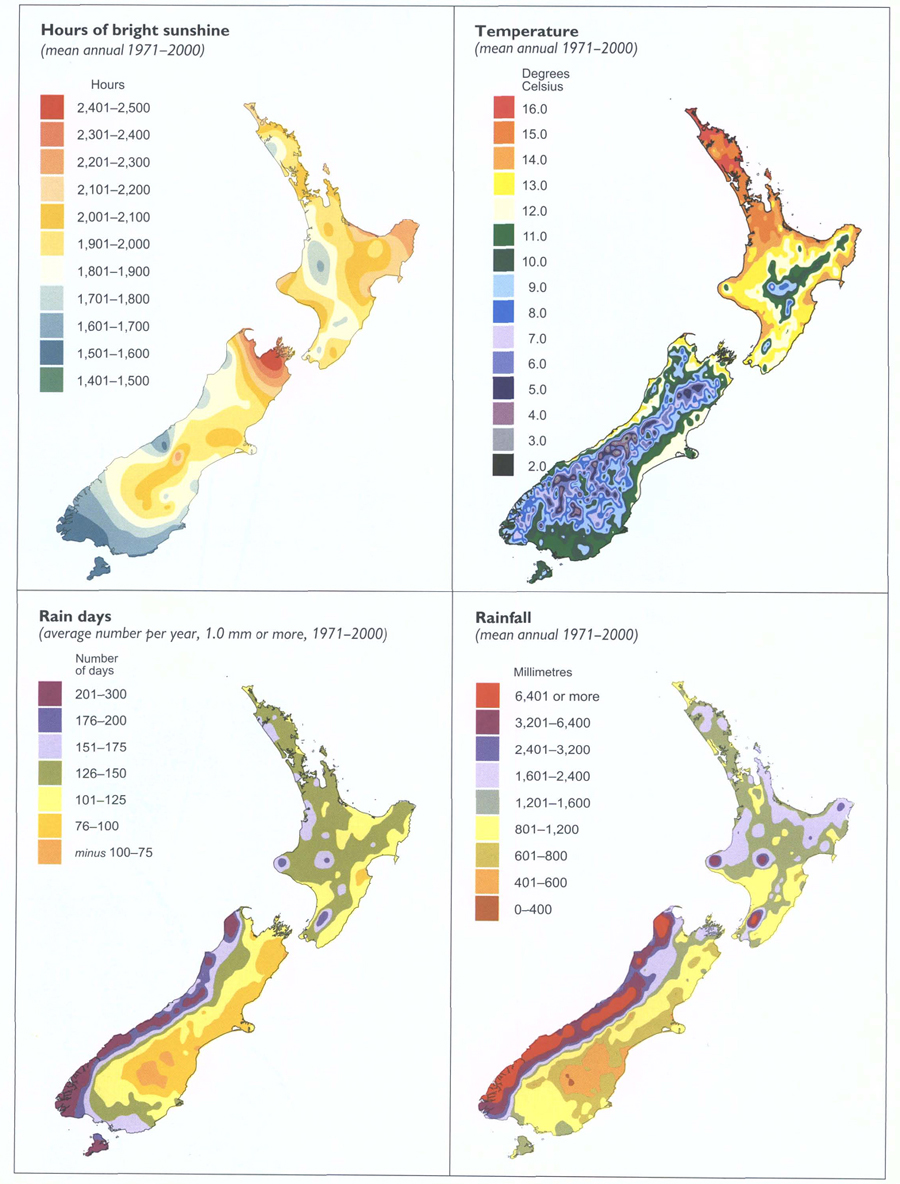
Table 1.1. Summary of New Zealand climate extremes to 31 May 2001
| Source: NIWA | |||
|---|---|---|---|
| Rainfall | |||
| Period | Amount mm | Location | Date |
| Highest: | |||
| 10 minutes | 34 | Tauranga | 17 April 1948 |
| 1 hour | 109 | Leigh | 30 May 2001 |
| 12 hours | 473 | Colliers Creek (Hokitika Catchment) | 22 January 1994 |
| 24 hours | 682 | Colliers Creek (Hokitika Catchment) | 21–22 January 1994 |
| 48 hours | 1,049 | Waterfall, Cropp River (Hokitika Catchment) | 12–13 December 1995 |
| 1 calendar month | 2,927 | Waterfall, Cropp River (Hokitika Catchment) | December 1995 |
| 1 calendar year | 16,617 | Waterfall, Cropp River (Hokitika Catchment) | January 1998–December 1988 |
| 365 days | 18,442 | Waterfall, Cropp River (Hokitika Catchment) | 29 October 1997–29 October 1998 |
| Lowest: | |||
| 3 months | 9 | Cape Campbell | January-March 2001 |
| 6 months | 52 | Cape Campbell | November 2000–April 2001 |
| 12 months | 167 | Alexandra | November 1963–October 1964 |
| Temperature extremes | |||
| Location | Temperature (°C) | Date | |
| Highest: | |||
| North Island | 39.2 | Ruatoria | 7 February 1973 |
| South Island | 42.4 | Rangiora and Jordan, Marlborough | 7 February 1973 |
| Lowest: | |||
| North Island | -13.6 | Chateau Tongariro | 7 July 1937 |
| South Island | -21.6 | Ophir | 3 July 1995 |
| Sunshine | |||
| Location | Total (hours) | Year | |
| Highest: | |||
| North Island | 2,588 | Napier | 1994 |
| South Island | 2,711 | Nelson | 1931 |
| Wind gusts | |||
| Location | Speed (km/h) | Date | |
| North Island | 248 | Hawkins Hill, Wellington | 6 November 1959 and 4 July 1962 |
| South Island | 250 | Mt John, Canterbury | 18 April 1970 |
International climate change research reached a major milestone in January 2001 when the Intergovernmental Panel on Climate Change (IPCC) concluded there was now comprehensive evidence of climate change during the 20th century. Key points raised in the IPCC report were:
An increasing body of observations gave a collective picture of a warming world and other changes during the 20th century. The global average surface temperature increased by about 0.6°C. On islands east of about 160E and south of the equator, surface air temperatures increased by 0.3 to 0.8°C. Sea levels in the tropical Pacific rose by about 2mm/year.
Emissions of greenhouse gases and aerosols due to human activities continued to alter the atmosphere in ways that were expected to affect the climate, and would continue to change atmospheric composition throughout the 21st century.
There was new and stronger evidence that most of the warming observed during the past 50 years was attributable to human activities (emissions of greenhouse gases and aerosols), and that anthropogenic (human-induced) climate change would persist for many centuries.
Confidence in the ability of models to project future climate has increased.
Global average temperature and sea levels were projected to rise under all IPCC greenhouse gas emission scenarios. Projected increases in global mean temperatures from 1990 to 2100 for a range of plausible emission scenarios lie between 1.4 and 5.8°C. Global mean sea level changes lie between 9 and 88cm.
Changes were expected in some extreme weather and climate events, including higher maximum temperatures and more hot days, more heavy rainfall events, and, in some areas, an increase in peak wind intensities and rainfall intensities in tropical cyclones. Projections showed little change, or a small increase, in amplitude for El Nino events during the next 100 years. However, even with little or no change in El Nino amplitude, global warming was likely to lead to greater extremes of drying, heavy rainfall and to increased risks of droughts and floods that occur with El Nino events in many different regions.
What the warming climate will mean in detail for the South Pacific is still the subject of investigation by scientific researchers, with key emerging issues being changes in rainfall patterns and associated shifts in water resources and agricultural growing conditions. Impact scenario studies will provide an important link between global climate dynamics and the ability of New Zealand and South Pacific communities to adapt to local changes that will affect everyday lives.
A hoarfrost in Alexandra, Central Otago, during the winter of 2001.
Following is a summary of knowledge gained in the past decade about the effect of climate change on New Zealand.
Projected climate changes. Temperatures in New Zealand are likely to increase faster in the North Island than in the South Island, but generally less than global average temperatures. Rainfall is projected to increase in the west of the country and to decrease in many eastern regions. In the long term, rising seas are expected to increase erosion of vulnerable beaches and breach coastal protection structures more often.
Agriculture. The agricultural sector could benefit under climate change, but also faces risks. The key benefit to agriculture is likely to be from increased carbon dioxide concentrations, which could lead to greatly increased growth rates and water-use efficiency. In addition, warmer conditions and lengthened growing seasons could allow the long-term southward shift of climate-limited activities, and new crops and related industries could be introduced. The most significant risks include more droughts and floods in some areas, particularly in the east of New Zealand. Warmer temperatures could also make the growing of some current fruit crops in some northern areas uneconomical.
Native ecosystems. Climate change may add to pressure on ecosystems already under threat. Fragmented native forests of drier lowland environments in Northland, Waikato and Manawatu, and in the east from East Cape to Southland, are probably the most vulnerable to climate change.
Urban environment, transport and energy. The main threat to the urban environment comes from possible increases in heavy rainfall, which would put pressure on drainage and stormwater systems and increase the risk of flooding in some areas. Warmer conditions will substantially reduce home heating costs, leading to reduced electricity demand during the peak winter season, but possibly increased demand for air conditioning during summer.
Health. Higher temperatures are expected to reduce winter illnesses, but could lead to higher death rates during summer. A warmer climate could also allow the spread of mosquitoes capable of transmitting diseases such as Ross River virus and dengue fever. Recent research has also found that climate change could lead to a delay in the recovery of the ozone layer. This would increase the period during which New Zealanders are exposed to high levels of ultraviolet radiation, which is known to lead to skin cancers. However, the possible effects of greenhouse gases on the ozone layer are still highly uncertain.
Pacific neighbours. New Zealand has close links with many Pacific Island countries. Many of these countries are highly vulnerable to rising sea levels caused by climate change. As a result, New Zealand may face increased demand for development aid and disaster relief.
Table 1.2 gives predicted changes to temperature and rainfall.
Table 1.2. Predicted changes in annual mean temperature (°C) and precipitation (%) between 1970–1999 and 2070–2099, based on averages from four global climate models
| Region | Temperature | Precipitation |
|---|---|---|
| Source: MORST | ||
| Northland, Auckland | +1.0° to +2.8°C | -10% to 0% |
| Western North Island from Waikato to Wellington | +0.8° to +2.7°C | 0% to +20% |
| Eastern North Island from Bay of Plenty to Wairarapa | +0.9° to +2.7°C | -20% to 0% |
| Nelson, Marlborough, to coastal Canterbury and Otago | +0.8° to +2.5°C | -20% to +5% |
| West Coast and Canterbury foothills | +0.6° to +2.5°C | +5% to +25% |
| Southland and inland Otago | +0.6° to +2.2°C | 0% to +30% |
2001. New Zealand climate records continued to tumble in 2001, both for average and extreme temperatures. The year was one of the driest on record in many eastern South Island areas, as well as parts of Wellington, in spite of a wet October-December period.
The North Island bore the brunt of 11 rainfall/flooding extremes, while tornadoes also featured in 2001, with at least eight reported, along with an unusual number of high wind events, many of which caused property damage.
The year featured many new climate records and extremes, with five unusually warm months, and two much colder than average. There were six cold snaps in winter, four with snow and two with extreme frosts. There were at least two widespread and damaging hailstorms, with hailstones ‘the size of golf balls’.
Higher than average pressures occurred from the south Tasman Sea across the lower South Island and east past the Chatham Islands. Pressures were below average in the north Tasman Sea and to the north. This pattern resulted in more frequent easterlies and north-easterlies over the north of the North Island and more settled conditions elsewhere.
Analyses of month-by-month records for 2001 compared with recorded statistics for previous years show:
The year's national average temperature was 12.8°C (0.3°C above the 1961–1990 normal).
The highest annual mean temperature recorded for the year was 16.9°C at Cape Reinga.
The highest recorded extreme temperature for the year was 35.3°C at Timaru airport on 4 February and the lowest was −12.2°C at Hanmer forest on the morning of 5 July.
May, August, September, October and December were unusually warm months, January was rather cool and July was the coldest for more than 30 years.
December was unusually wet, with record low sunshine over the North Island.
The driest recorded centre was Alexandra, with only 299mm of rain for the year.
North Egmont was the wettest location with 7,546mm. Traditionally wet Milford Sound managed only 5,134mm.
Christchurch was the driest main centre with 405mm and Auckland the wettest with 1,256mm. Wellington received 1,053mm and Dunedin 515mm.
The capital was again the sunniest of the three largest centres, with 2,094 sunshine hours, followed by Christchurch (2,072 hours), and Auckland (1,981 hours). Nelson was the sunniest centre in 2001 with 2,550 hours, followed by Blenheim with 2,484 hours and Motueka with 2,430 hours.
2000. The year 2000 produced a wide variety of climate extremes and the second warmest winter since records began in the mid 1850s. Unusually high sunshine hours occurred in Taranaki. A drought in summer and early autumn contrasted with 15 high rainfall events producing floods in most other months. Two notable heatwaves occurred, and six cold snaps, five with snow. Three tornadoes were reported, and 11 high wind events all caused property damage. Severe hailstorms occurred on three separate occasions. More anticyclones than normal occurred east of New Zealand, resulting in more easterlies over the north of the North Island, and north-westerlies over the far south.
National average temperature for the year 2000 was 12.7°C (0.2°C above the 1961–1990 normal).
The highest recorded annual mean temperature for the year was 16°C at Whangarei.
The highest extreme temperature for the year was 35°C at both Darfield and Culverden on 4 March, and the lowest −12.4°C at Tekapo on the morning of 24 August.
The winter was the second warmest on record since reliable measurements were established in the 1850s. The national average winter temperature of 9.1°C was up 0.9°C on the 1961–1990 normal.
The driest recorded centre was Alexandra, with only 475mm of rain for the year.
The wettest recorded location was Milford Sound, with an annual total of 7,019mm.
Christchurch was the driest main centre with 706mm and Auckland the wettest with 1,130mm. Wellington received 994mm and Dunedin 926mm.
The capital was the sunniest of the three largest centres with 2,172 sunshine hours, followed by Christchurch (2,141 hours), and Auckland (1,962 hours).
Nelson was the sunniest centre in 2000 with 2,534 hours, followed by Blenheim with 2,435 hours and Tauranga with 2,347 hours.
New Plymouth's 2,334 hours of sunshine was the highest in the area since 1943.
Climate extremes. NIWA's annual climate summaries (available on its website www.niwa.cri.nz) contain detailed descriptions of extreme weather events for the year. These include extremes of temperatures and sunshine hours, and notable occurrences of snowfalls and frosts, droughts, floods and high rainfall, tornadoes, gales and high winds, and severe hailstorms.
New Zealand lies in the south-west Pacific Ocean and comprises two main and a number of smaller islands. Their combined area of 270,500 square kilometres is similar in size to Japan or the British Isles. See table 1.3 for more details.
Table 1.3. Land area of New Zealand(1)
| Land area | Size (sq km) |
|---|---|
1Includes all internal waterways (lakes and rivers). 2Includes all offshore islands 20 sq km or larger, except those listed separately. Source: Land Information New Zealand | |
| North Island | 113,729 |
| South Island | 150,437 |
| Offshore islands(2) | 1,065 |
| Stewart Island/Rakiura | 1,680 |
| Chatham Islands | 963 |
| Raoul Island | 34 |
| Campbell Island/Motu Ihupuku | 113 |
The main North and South Islands are separated by Cook Strait, which, at its narrowest point, is 20km wide. The North and South Islands lie on an axis running from north-east to south-west, except for the low-lying Northland peninsula.
The administrative boundaries of New Zealand extend from 33° to 53° south latitude, and from 160° east to 173° west longitude.
In addition to the main and nearby islands, New Zealand also includes the small inhabited outlying islands of the Chathams, 850km east of Christchurch; Raoul Island, in the Kermadec Group 930km north-east of the Bay of Islands; and Campbell Island, 590km south of Stewart Island. New Zealand also has jurisdiction over the territories of Tokelau and the Ross Dependency (see Chapter 4).
New Zealand is more than 1,600km long and 450km wide at its widest part, and has a long coastline for its area. The coast is very indented in places, providing many natural harbours.
The country is also very mountainous (see table 1.4), with less than a quarter of the land less than 200m above sea level. In the North Island, the main ranges run generally north-east to south-west, parallel to the coast, from East Cape to Cook Strait, with further ranges and four volcanic peaks to the north-west. The South Island is much more mountainous than the North Island. A massive mountain chain, the Southern Alps, runs almost the length of the island. There are many outlying ranges to the Southern Alps in the north and the south-west of the South Island. There are at least 223 named peaks higher than 2,300m.
Table 1.4. Principal mountains
| Mountain or peak | Elevation |
|---|---|
1Taranaki or Egmont is the correct format for the dual name as prescribed in the 1986 Gazette 2The height of Aoraki/Mt Cook was confirmed by Dr John Beavan, from the Institute of Geological and Nuclear Sciences, as 3,754m – this was determined photogrametrically after the 1991 slip from the peak. Source: Land Information New Zealand | |
| metres | |
| North Island: | |
| Ruapehu | 2,797 |
| Taranaki or Egmont(1) | 2,518 |
| Ngauruhoe | 2,287 |
| Tongariro | 1,967 |
| South Island: | |
| Aoraki/Mt Cook(2) | 3,754 |
| Tasman | 3,497 |
| Dampier | 3,440 |
| Silberhorn | 3,300 |
| Hicks (St David's Dome) | 3,198 |
| Lendenfeldt | 3,194 |
| Torres | 3,163 |
| Teichelmann | 3,160 |
| Sefton | 3,157 |
| Malte Brun | 3,155 |
| Haast | 3,138 |
| Elie de Beaumont | 3,117 |
| Douglas | 3,085 |
| La Perouse | 3,079 |
| Heidinger | 3,066 |
| Minarets | 3,055 |
| Aspiring/Tititea | 3,033 |
| Glacier Peak | 3,007 |
There are also 360 glaciers in the Southern Alps. The largest are, on the east, the Tasman (29km in length), Murchison (13km), Mueller (13km), Godley (13km) and the Hooker (11km), and, on the west, the Fox (15km) and the Franz Josef (13km).
New Zealand's rivers (see table 1.5) are mainly swift and difficult to navigate. They are important as sources of hydroelectric power and artificial lakes have been created as part of major hydroelectric schemes. Table 1.6 describes the largest lakes.
Table 1.5. Principal rivers(1)
| River | Length |
|---|---|
1More than 150km in length from the mouth to the farthest point in the river system irrespective of name, including estimated courses through lakes. Source: Land Information New Zealand | |
| km | |
| North Island: | |
| Flowing into the Pacific Ocean – | |
| Rangitaiki | 193 |
| Waihou | 175 |
| Mohaka | 172 |
| Ngaruroro | 154 |
| Flowing into the Tasman Sea – | |
| Waikato | 425 |
| Whanganui | 290 |
| Rangitikei | 241 |
| Manawatu | 182 |
| Whangaehu | 161 |
| Mokau | 158 |
| South Island: | |
| Flowing into Cook Strait – | |
| Wairau | 169 |
| Flowing into the Pacific Ocean – | |
| Clutha/Matau | 322 |
| Taieri | 288 |
| Clarence | 209 |
| Waitaki | 209 |
| Waiau | 169 |
| Waimakariri | 161 |
| Flowing into Foveaux Strait – | |
| Mataura | 240 |
| Waiau | 217 |
| Oreti | 203 |
| Flowing into the Tasman Sea – | |
| Buller | 177 |
Table 1.6. Principal lakes(1)
| Lake | Maximum depth | Area |
|---|---|---|
1More than 20 square kilometres in area. Source: Land Information New Zealand and NIWA | ||
| m | sq km | |
| North Island: | ||
| Taupo | 163 | 606 |
| Rotorua | 45 | 80 |
| Wairarapa | 3 | 80 |
| Waikaremoana | 248 | 541 |
| Tarawera | 87 | 36 |
| Rotoiti | 94 | 34 |
| South Island: | ||
| Te Anau | 417 | 352 |
| Wakatipu | 380 | 293 |
| Wanaka | 311 | 193 |
| Ellesmere | 2 | 181 |
| Pukaki | 99 | 169 |
| Manapouri | 444 | 142 |
| Hawea | 384 | 141 |
| Tekapo | 120 | 88 |
| Benmore (artificial) | 120 | 75 |
| Hauroko | 462 | 7 |
| Ohau | 129 | 61 |
| Poteriteri | uncharted | 47 |
| Brunner | 109 | 39 |
| Coleridge | 200 | 36 |
| Monowai | 161 | 31 |
| Aviemore (artificial) | 62 | 29 |
| Dunstan (artificial) | 70 | 27 |
| Rotoroa | 152 | 23 |
| Mahinerangi (artificial) | 31 | 21 |
New Zealand is in an area of the world characterised by active volcanoes and frequent earthquakes. The ‘ring of fire’, as this area is known, forms a belt that surrounds the Pacific Ocean and is the surface expression of a series of boundaries between the plates that make up the earth's crust. The boundary between the Indo-Australian plate and the Pacific plate runs through New Zealand, and the processes from their collisions have had a profound effect on New Zealand's size, shape and geology.
The oldest rocks in New Zealand are found in Nelson, Westland and Fiordland. They have been dated back to the Paleozoic era about 570 million years ago. Nearly three-quarters of New Zealand is covered by sedimentary rocks, created by the interplay of earth movement and erosion. The most common forms of sedimentary rocks in New Zealand are sandstone, mudstone, greywacke, conglomerate and limestone. As well as sedimentary rocks of various ages, New Zealand incorporates in its complex structure metamorphic rocks (schist, gneiss and marble) and intrusive igneous rocks (granite, gabbro, diorite and serpentine). Volcanic rocks (basalt, andesite, rhyolite and ignimbrite) are products of the many volcanic eruptions that have characterised New Zealand's geological history.
Soil is a product of its environment. Its composition depends on the parent ingredient, the climate, the length of time it has weathered, topography and the vegetation under which it has formed. The complex soil pattern of New Zealand (see table 1.7) is a result of many different kinds of rock and the various conditions under which the soils have formed. Climate varies from such extremes as sub-tropical North Auckland to the cold uplands of the alpine regions and the semi-arid basins of Central Otago. The country's topography is equally varied, with 50 percent of the land classifiable as steep, 20 percent as moderately hilly and only 30 percent as rolling or flat. Natural vegetation ranges from kauri forest to sub-alpine scrub, and from tussock grassland to broadleaf forest. Occasionally, occurrences such as river floods on alluvial plains, sand drifts, or volcanic ash eruptions interrupt and alter the pattern of soil development.
Evidence of episodes of intense mountain building between one million and six million years ago are apparent in the New Zealand landscape of today. Mountain chains were pushed up during this period and there was movement and displacement of the earth's crust along faults. Due to this activity, well-preserved tilted fault blocks bounded by fault scarps (steep faces hundreds or even thousands of metres high) are visible in the landscape of some regions. Fault movements continue to the present day and have accompanied several major earthquakes of the past century.
A caver descends into Harwood Hole near Takaka in the Golden Bay district.
Erosion has transformed the landscape during this time, carving detailed patterns of peaks, ridges, valleys and gorges. The deposition of debris has built up alluvial plains, shingle fans and other construction forms. At the coast, waves have eaten back headlands and built beaches, spits and bars. Glaciers carved the fiords of Fiordland and valleys occupied by most of the South Island lakes. Sea level changes accompanied formation, and later melting, of global glacial ice. These changes affected the erosion and deposition of rivers and were responsible for the formation of many prominent river terraces.
Volcanic activity during the past few million years played an important part in shaping the landscape. The largest volcanic outpourings of late geological times were in the region between Tongariro National Park and the Bay of Plenty coast. The most recognisable volancoes in New Zealand now occur in the North Island, where a number are still active. They include Ruapehu, Tongariro, Ngauruhoe, White Island and Mt Tarawera. Others such as Mt Taranaki or Egmont and Rangitoto may be considered dormant at present, although they are still regarded as significant hazards.
Living in New Zealand means living with earthquakes. There is an almost continuous belt of earthquake activity around the edge of the Pacific Ocean that affects the geological stability of many countries on the Pacific Rim, particularly New Zealand, west coast United States, Chile, Peru, Japan and the Philippines. New Zealand's level of activity is similar to that of California, but slightly lower than that of Japan. A magnitude 8 earthquake occurs in New Zealand about once a century, a magnitude 7 quake averages out at once a decade and there is an average rate of one magnitude 6 quake a year.
Sheep graze in the gentle rolling country of Southland.
Table 1.7. Classification of New Zealand soils
| Region | Soils | Vegetation and land use |
|---|---|---|
| Source: Institute of Geological and Nuclear Sciences | ||
| North Auckland Peninsula and Auckland region | Large areas of infertile gumland soils formerly covered with kauri; granular, oxide and ultic soils from volcanic rocks and weathered sandstone. | Patchy land use. Exotic forests on lowland country and remnant kauri forest on uplands. Intensive dairying on rolling lands around Kaipara Harbour, Whangarei, Kaikohe and Dargaville. Sheep and beef on hill country. |
| Bay of Plenty-Waikato-Thames-Hauraki Plains | Volcanic ash covers much of the area, giving rise to deep, granular soils with good physical properties. Peaty and gley soils with high ground water on Hauraki Plains and parts of Waikato Basin. | Predominantly pastoral farming (mostly dairying), exotic forestry and several large tracts of indigenous forest. Kiwifruit along coastal Bay of Plenty. Scattered maize cropping. |
| Volcanic Plateau | Pumice soils, lacking in some essential trace elements, but mostly deep, friable and highly suited to tree growth. | Important watershed with large areas protected as native forest. Extensive exotic forests. Topdressing of former scrub areas with trace elements has allowed widespread farming. |
| East Coast-Wairarapa | Brown soils. Significant areas of recent alluvial soils on Gisborne and Heretaunga Plains. Pallic soils on rolling land south of Hawke's Bay. | Semi-extensive sheep farming (wool and store sheep) on dry hill country. Intensive lamb production on flat to rolling plains. Market gardens and orchards near Gisborne, Napier, and Hastings. Important pip-fruit production. Vineyards. Pockets of dairying close to main ranges from Norsewood south. |
| Taranaki | Volcanic ring plain consists of allophanic soils, usually from deep volcanic ash, but stony in west. Soft-rock uplands in east Taranaki. | Distinct contrast between intensive dairying on ring plain, and severely eroded inland hill country, with many steep ridges covered in second-growth forest or dense gorse. |
| Manawatu-Horowhenua | Sand dunes and swampy hollows common along coast. Loess-covered terraces and river flats inland. Pallic soils on drier terraces with sand soils near coast and organic and recent alluvial soils on lower plains. | Intensive sheep production and cropping on the terrace country; semi-intensive sheep and beef in hill country of Rangitikei. Exotic forestry on coastal sand country. |
| Marlborough Sounds-Nelson | Pockets of fertile, recent alluvial soils on Waimea and Motueka Plains. Large areas of steepland soils and stony soils on Moutere Gravels. | Intensive orcharding and market gardens. Exotic forests in Marlborough Sounds and Moutere Gravels. |
| Marlborough-Kaikoura Coast | Pallic soils and brown soils with pockets of recent alluvial soils. | Intensive sheep farming and cropping on river terraces, semi-intensive sheep and beef on hill country. Vineyards in lower Wairau Valley. |
| West Coast | Extensive gleyed podzols and organic soils, with recent soils on alluvial flats. | Indigenous forestry declining; national parks and reserves; exotic forestry on hill country of north Westland. Dairying on river flats. |
| Canterbury | Very thick layer of gravel covered by variable thicknesses of fine material. Pallic soils and associated stony soils. | Intensive cropping for cereals and fodder crops. Intensive sheep production, with widespread irrigation of pasture. |
| Otago | High-country brown soils on ranges, pallic soils at intermediate altitudes and semi-arid soils (often stony), in basins. | Extensive sheep and beef farming in uplands. Intensive orcharding in Central Otago basins, especially for stonefruit; irrigation necessary. Market gardening in lower Taieri. |
| Southland | Southland Plain mainly deposits of gravel and silt. Brown soils and recent alluvial soils. Pallic soils inland in drier areas. | Semi-intensive sheep and beef farming in rolling areas inland, and intensive fattening on plains. Dairying on plains near Invercargill. |
New Zealand has many earthquakes because it straddles the boundary between two of the earth's great tectonic plates – the Pacific Plate in the east and the Australian Plate in the west. These two plates are converging obliquely at about 30mm/year in Fiordland, increasing to about 50mm/year at East Cape. The plates converge in different ways. In the North Island and the northern South Island, the Pacific Plate sinks below the Australian Plate. Earthquakes originating within the subducting Pacific Plate are less than 30km deep along the eastern coast, and become deeper westward. In Fiordland and the region to the south, the Australian Plate subducts beneath the Pacific Plate, so the earthquake sources are shallow in the west and deeper in the east under Fiordland.
Between these two subduction zones, the crust of both plates is too buoyant to subduct, so the convergence is accommodated by uplift, which created the Southern Alps, and horizontal movement along the Alpine Fault. This results in parts of Nelson and western Otago, adjacent five million years ago, now being 450km apart. The forces driving this sideways and upward movement create shallow earthquakes.
About two-thirds of New Zealand's earthquakes are deep, while shallow earthquakes originate within the earth's crust, which has an average thickness of 35km in New Zealand. Crustal quakes are responsible for almost all damage to property, and are widely scattered throughout New Zealand. In the Taupo volcanic zone, from White Island to Ruapehu, swarms of small earthquakes of similar magnitude are associated with the area's active volcanism. Although the number of shocks is alarming, they rarely cause damage.
Earthquake risk. The worst disaster that can reasonably be expected within a generation is a 7.5 magnitude earthquake on the segment of the Wellington fault within the city. It has a 12 percent probability of occurring within the next 30 years, and would affect 200,000 residential properties from Palmerston North to Nelson, as well as roads, bridges and dams, and services such as electricity, water and sewerage.
The Institute of Geological and Nuclear Sciences (GNS) in Lower Hutt runs the National Seismograph Network. A major upgrade to the equipment that monitors earthquakes and volcanoes in New Zealand was started in 2001. The Earthquake Commission is providing $5 million a year over 10 years to install upgraded equipment at new sites and replace existing equipment to more rapidly and reliably determine the location and magnitude of all significant earthquakes within the New Zealand region (see sidebar). Such information is rapidly broadcast to civil defence and emergency management authorities and international earthquake centres in the United Kingdom and the United States. New Zealand scientists also undertake a large body of research aimed at improving understanding of, and ways to mitigate, seismic hazard in New Zealand. Mitigation measures include improved engineering design of buildings and infrastructure, better prepared communities and better regional planning.
Principal earthquakes in New Zealand in 2001. New Zealand was hit by at least six potentially damaging earthquakes in 2001, but they were either too distant from population centres or too deep to cause harm.
In what GNS seismologists described as an average year in terms of size, number and distribution of earthquakes, the largest jolt was a magnitude 7.0 earthquake on August 21 centred offshore in the Kermadec Trench, 420km north-east of Gisborne. Although distant, its large size and relatively shallow depth meant it was felt throughout much of the North Island and as far south as Christchurch. It caused minor damage and a brief electricity blackout at Tolaga Bay, 56km north-east of Gisborne.
Also of note was a magnitude 6.2 earthquake centred 20km north of Taumarunui on May 24. It was felt throughout the eastern North Island, but its impact was not severe because of its depth of 260km.
A magnitude 6.1 earthquake on the morning of December 8 located 30km south-west of Haast, and shallower than 12km, was felt throughout the southern South Island, but was away from major population centres.
All of these larger earthquakes were followed by dozens of smaller aftershocks. In the case of the quake south-west of Haast, aftershocks occurred at the rate of up to 20 an hour during the first two days after the main shock. Accurate recordings of aftershocks give seismologists valuable information about the nature of the main shock and its relation to the geology of the area. In particular, aftershocks can indicate how the main shock may have increased or decreased the stress on neighbouring faults.
Only about 1 percent of the 16,000 earthquakes recorded in New Zealand each year are big enough or shallow enough to be felt by humans. As a general guide, shallow earthquakes above magnitude 5.0 are capable of causing damage and casualties in built-up areas.
During late September and early October 2001, a number of moderate-sized shallow earthquakes occurred in southern Hawke's Bay, off the coast at Porangahau. The largest of these, a magnitude 5.6 quake on September 24, was felt widely throughout the central and southern North Island.
Among other moderate-sized shallow earthquakes recorded in 2001 was a magnitude 5.0 event on April 4, 30km south-east of Blenheim. The largest of a cluster of eight earthquakes that occurred in that area on that day, it was felt throughout Marlborough, the Wellington region and as far north as Wanganui. On May 18, a magnitude 5.1 earthquake 50km west of Methven in Canterbury was felt on the West Coast and in inland Canterbury.
A number of moderate-sized deep earthquakes also occurred during 2001. On October 15, a magnitude 5.8 quake with an epicentre close to Hastings was felt widely. A magnitude 5.0 quake on October 24, 30km north-west of Taupo, was felt along the east coast of the North Island. On November 9, a magnitude 5.3 earthquake 30km south of Nelson was felt in the northern South Island and in the Wellington region. Finally, a magnitude 5.0 event on December 8, located 30km south-west of Gisborne, was felt in the East Cape and Hawke's Bay regions. There were also three earthquakes above magnitude 5.0 in the Bay of Plenty during the first half of the year, but all these events were too deep to cause damage.
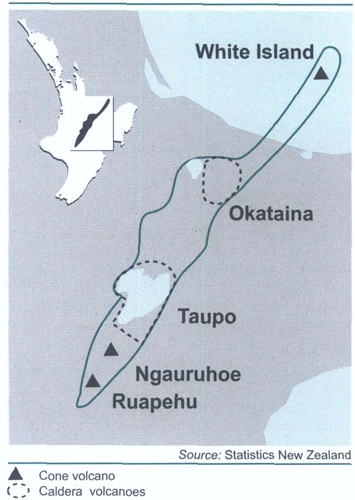
The New Zealand region is characterised by both a high density of active volcanoes and a high frequency of eruptions. Volcanic activity in New Zealand occurs within the North Island and offshore to the north-east in the Kermadec Islands. In the past 150 years, volcanoes have killed more people than earthquakes, yet the scale and style of historically recorded volcanic activity is dwarfed by events known to have occurred in the past 2,000 to 5,000 years.
Volcanism. New Zealand volcanism is confined to five areas in the North Island – the Bay of Islands, Whangarei, Auckland, White Island to Ruapehu, and Taranaki or Egmont. The area from White Island to Ruapehu is known as the Taupo volcanic zone and is by far the most frequently active. There are three major types of volcano in New Zealand:
Volcanic fields such as Auckland, where each eruption builds a single small volcano (eg Mt Eden), which does not erupt again. The next eruption in the field occurs at a different place, the site of which cannot be predicted until the eruption is imminent.
Cone volcanoes such as Taranaki or Egmont and Ruapehu, where a succession of small eruptions occurs from roughly the same point on the earth's surface. The products of successive eruptions accumulate close to the vent to form a large cone, which is the volcano itself. The site of future eruptions can generally be predicted.
Caldera volcanoes, such as Taupo and Okataina (Tarawera). Eruptions at these volcanoes are occasionally so large that the ground surface collapses into the ‘hole’ left behind. For example, Lake Taupo infills a caldera formed in two episodes about 1,800 and 26,000 years ago.
The Taupo volcanic zone (see Figure 1.3) contains three frequently active cone volcanoes (Ruapehu, Ngauruhoe and White Island) and the two most productive caldera volcanoes (Taupo and Okataina) in the world.
Casualties. Deaths due directly or indirectly to volcanism (and associated hydrothermal explosions) represent the biggest single source of fatalities from natural disasters in New Zealand since 1846 (see table 1.8). Economic loss due to volcanism, however, has been low compared with that from earthquakes or flooding. The cost of the 1995 and 1996 eruptions of Ruapehu has been estimated at $130 million. However, an assessment of the size and style of volcanic eruptions in the geologically recent past, coupled with consideration of the economic development of New Zealand, especially in the central North Island, shows that the record since 1846 represents only a fraction of the type and size of hazard posed by New Zealand volcanism.
Table 1.8. Deaths in volcanic areas since 1846
| Year | Location (eruption) | Cause – hazard | Fatalities |
|---|---|---|---|
| Source: Institute of Geological and Nuclear Sciences | |||
| 1846 | Waihi (Lake Taupo) | Debris avalanche/mudflow from thermal area | c 60 |
| 1886 | Tarawera Rift | Large volcanic eruption | 108 |
| 1903 | Waimangu (Tarawera) | Hydrothermal explosion | 4 |
| 1910 | Waihi (Lake Taupo) | Debris avalanche/mudflow from thermal area | 1 |
| 1914 | White Island | Debris avalanche from crater wall | 11 |
| 1917 | Waimangu (Tarawera) | Hydrothermal explosion | 2 |
| 1953 | Tangiwai (Ruapehu) | Lahar and flood from crater lake | 151 |
| >337 | |||
Crises. The term volcanic crisis is used to describe the entire time period associated with a major volcanic eruption. It includes precursors, the eruption and its aftermath. During all this time, people and property are at risk.
The onset of a volcanic crisis is often predictable, but the exact course of an eruption is not. Large volcanic eruptions are predictable because precursors like earthquakes, ground deformation and increased outputs of volcanic gas can be used to infer that an eruption is imminent, so enabling some site-specific planning or mitigation. Large volcanic eruptions are preceded by a period of days to years of high levels of seismicity, ground movements and changes to hot springs and gas vents. However, once an eruption has started, significant hazards can be present for much longer periods than with any other natural event. The eruption may be followed by months to decades of flooding, erosion and land instability.
A feature of volcanic crises compared with other kinds of natural hazards is that each eruption has a far wider range of possible outcomes, each, in turn, with a characteristic range of threats to life and property.
Major types of volcanic hazard are ash and pumice fall, ash and pumice currents, lavas, lahars/flooding and gases/acid rain. Volcanism on a relatively minor scale (eg Ruapehu 1945, 1995, 1996) causes disruption and damage on a regional scale, while some larger events (eg Taupo 1,800 years ago) adversely affect the entire national economy.
Mt Ruapehu eruptions in 1995 and 1996 resulted in extensive ash falls throughout the North Island.
For each volcano, a hazard map of different potential eruptions can be drawn. Each map has a number of zones specific to a particular hazard (eg lahar, ash fall). The risk varies considerably depending on factors such as topography, wind direction at the time of the eruption, and the position of communities and infrastructure with respect to the erupting volcano. At all of New Zealand's volcanoes, with the possible exception of Ngauruhoe, the historic record is inadequate to assess the full range of activity. Therefore, to help assess the return intervals of any specific kind of eruption, studies are made of deposits left by prehistoric eruptions and interpretations are made of the size and style of each event, together with an estimation of the age. Such information is available to various extents for all of New Zealand's volcanoes. The probability of a future eruption from a wholly new site, or of a type of activity not represented in the past history of the volcano, is remote.
Surveillance. Volcanologists use three primary techniques to establish the ‘health’ of an active volcano:
Monitoring of volcanic earthquakes. This is done using closely-spaced networks of seismometers. These networks are designed to detect movement of magma (molten rock) below the surface and allow assessment of the possible onset and timing of eruptive activity. There are five volcano-seismic networks in New Zealand (Auckland, Bay of Plenty-Rotorua, Taranaki, Tongariro and Taupo).
Monitoring of ground deformation. This is done using precise geodetic surveys. The concept is that if magma is moving upwards before an eruption, it will cause the volcano to swell (ie the ground surface to rise), and this swelling can be detected. A novel version of this technique uses lakes at Taupo and Okataina as giant spirit levels.
Monitoring of volcanic gases. Magma at depth in the earth contains gases (carbon dioxide, together with various compounds of sulphur, chlorine and fluorine) dissolved in it. As the magma rises to shallow levels before an eruption, these gases are released and come to the surface via fumaroles. The temperatures and the abundance of the gases and their relative proportions give information on the state of the magma and how close to the surface it is.
In a volcanic crisis, practical steps can be taken to mitigate risk and lessen the threat to life, but this requires accurate perception of the onset of a crisis. This perception in turn depends on a knowledge of the ‘background’ or ‘normal’ levels of seismicity, ground movement and gas flux at the volcano, coupled with ‘real-time’ determination of any significant changes from this background. New Zealand has an active volcano surveillance programme to define these background levels.
Mitigation. Experiences at recent large volcanic eruptions like Rabaul (Papua New Guinea) and Pinatubo (Philippines) show it is possible to minimise loss of life during volcanic crises. On the other hand, Nevado del Ruiz and El Chichon showed that poor planning results in major loss of life. A major feature of mitigation is public education. An informed, knowledgeable population makes intelligent decisions, and ‘self-evacuation’ was a key feature at Rabaul and Pinatubo.
The principal tool to accomplish this in New Zealand is the Yellow Book series of the Ministry of Civil Defence and Emergency Management. Communities exposed to frequent volcanic hazards evolve simple measures to limit risk. One example is Whakapapa village, Mt Ruapehu, where posters and brochures give detailed precautions against lahar hazards on ski-fields.
The islands of New Zealand separated from their nearest neighbours more than 80 million years ago. Some of the original inhabitants endured times of turbulent change and violent upheaval, evolving and adapting to become part of a unique natural biota (or region). Other species died out (either nationally or regionally), unable to compete or survive environmental disturbances such as ice ages. For example, coconut palms were once found in New Zealand, and kauri, now confined to the north of the North Island, used to grow as far south as Canterbury. Over the years, the earliest inhabitants were joined by other plants and animals carried across the oceans by wind and current.
The pre-human community was notable for the absence of snakes, land mammals (apart from three species of bat) and many of the flowering plant families.
Whole orders and families were found only in New Zealand, including tuatara, moa and kiwi, all of the native lizards, and nearly 200 species of native earthworms. Many remarkable plants, insects and birds evolved to fill ecological niches normally occupied by mammals. Others diversified to fill new territories created by sea-level fluctuations and land uplift. With no mammalian predators on the ground, but avian predators everywhere, flightlessness was not a handicap, nor was size. Moa (11 species, some up to 3m tall) became extinct in pre-European times, but many other large flightless birds still remain, including kiwi, the nocturnal kākāpō (the only flightless parrot in the world) and weka (of the rail family).
Flightless insects are numerous, including many large beetles and 70 or so species of the cricketlike weta, found only in New Zealand.
New Zealand, with 84 species, has the most diverse seabird fauna of any country. Nearly half of all native bird species depend on the ocean for food, the feeding zones of some extending as far south as the Antarctic continent. New Zealand's extensive coastline and many islands offer a huge range of habitat, from estuary and mud-flat, to rocky cliffs and boulder bank.
The ocean itself is marvellously rich. There are about 400 different marine fish in the waters around New Zealand, as well as various species of seals, dolphins and porpoises. Twenty-nine species of whale have been recorded, and three of the largest (sperm, humpback and right) regularly migrate to New Zealand waters in spring and autumn.
The most widespread and complex type of forest in New Zealand is a podocarp (conifer) broadleaf association. It is generally found at lower altitudes and is characterised by a variety of species, a stratified canopy and an abundance of vines and epiphytic plants. Beech and kauri forests, by contrast, are much simpler in structure. New Zealand's beech species have close relatives in Australia and South America and the five different types of species in New Zealand have exploited habitats from valley floor to mountain tops. Kauri, true forest giants, dominate only in the warmer climes to the north.
Some of the most specialised plants are those occupying the alpine zone. A remarkable 25 percent of all New Zealand's plants can be found above the treeline. Ninety-three percent of all alpine plants are found only in New Zealand, compared with 80 percent for the rest of the higher plant species. Snow tussock herbfields are one of the most distinctive elements in this cold, windswept environment. Remarkably long-lived, some larger specimens may be several centuries old. Like beech trees, they seed infrequently, but in profusion.
A definitive feature of New Zealand's land-based plants and animals is their degree of specialisation and narrow habitat requirements (eg takahē/tussock grasslands; blue duck/fast flowing rivers and streams) and their evolution in the absence of mammalian predators (birds) or browsers (plants). This specialisation, and the adaptations which make New Zealand's wildlife so unique, render them extremely vulnerable to introduced predators, such as rats and cats; competitors, such as deer and possums; and loss of habitat.
The arrival of people in New Zealand heralded times of rapid change. Introduction (intentionally or accidentally) of exotic plants and animals, and the modification of habitat, radically affected native species populations. In the pre-1800 period, following the arrival and expansion of Māori, forest cover was reduced and 34 species became extinct, including moa, the adzebill and the flightless goose. In the much shorter post-1800 period of European settlement, the forest area was further reduced to around 25 percent of the land, nine more birds became extinct and many more were threatened. Since 1840, more than 80 new species of mammals, birds and fish, and more than 1,800 plant species have been introduced, in many places totally changing the landscape and ecology.
One uniform time is kept throughout mainland New Zealand. This time is 12 hours ahead of Coordinated Universal Time (UTC) and is called New Zealand Standard Time (NZST). It is an atomic standard maintained by the Measurement Standards Laboratory, part of Industrial Research Ltd, Lower Hutt. One hour of daylight saving, called New Zealand Daylight Time (NZDT), which is 13 hours ahead of UTC, is observed from 2am (NZST) on the first Sunday in October, until 2am (NZST) on the third Sunday in March. Time kept in the Chatham Islands is 45 minutes ahead of that kept in New Zealand.
1.1 Dr Jim Salinger (NIWA); Ministry for the Environment; Ministry of Science, Research and Technology.
1.2 Land Information New Zealand; National Institute of Water and Atmospheric Research Ltd (NIWA); New Zealand Speleological Society.
1.3 Institute of Geological and Nuclear Sciences Ltd.
1.4 Department of Conservation.
1.5 Industrial Research Ltd.
Statistics New Zealand divisional manager responsible: Zane Colville.
Trotter M, and McCulloch B (1996). Digging up the Past: New Zealand's archaeological history, rev edition, Penguin, Auckland.
Climate Change Impacts on New Zealand (2001). Ministry for the Environment, Wellington.
Sturman A, and Tapper N (1996). The Weather and Climate of Australia and New Zealand, Oxford University Press, Auckland.
The National Institute of Water and Atmospheric Research Ltd (NIWA) operates an extensive climatological database and publishes the Monthly Climate Digest, as well as regional climatologies, maps and other publications.
McKinnon M (ed) (1997). Bateman New Zealand Historical Atlas: Ko Papatūānuku e takoto nei, Bateman, in association with historical branch, Department of Internal Affairs, Auckland.
Wards I (1976). New Zealand Atlas, Government Printer, Wellington.
Terralink International Ltd publishes topographical maps of New Zealand.
Aitken JJ, and Lowry MA (1995). More Earthquakes Explained, Institute of Geological and Nuclear Sciences, Wellington.
Aitken JJ (1996). Plate Tectonics for Curious Kiwis, Institute of Geological and Nuclear Sciences, Wellington.
Brazier R, Keyes I, and Stevens G (1990). The Great New Zealand Fossil Book: Pictures of ancient life in an evolving land, Institute of Geological and Nuclear Sciences, Wellington.
Forsyth PJ, and Aitken JJ (1995). New Zealand Minerals and Rocks for Beginners, Institute of Geological and Nuclear Sciences, Wellington.
Gregory J (1988). Ruamoko's Heritage: Volcanoes of New Zealand (video and kit), Institute of Geological and Nuclear Sciences, Wellington.
Hayward, BW (1996). Precious Land: Protecting New Zealand's landforms and geological features, Geological Society of New Zealand, Lower Hutt.
Hicks G, and Campbell H (eds) (1998). Awesome Forces: The natural hazards that threaten New Zealand, Te Papa Press in association with the Earthquake Commission and the Institute of Geological and Nuclear Sciences, Wellington.
Thompson B, Brathwaite B, and Christie T (1995). Mineral Wealth of New Zealand, Institute of Geological and Nuclear Sciences, Wellington.
The Institute of Geological and Nuclear Sciences publishes geological and geophysical maps covering all New Zealand, plus bulletins, reports, guidebooks and handbooks.
Bishop N, and Gaskin C (1992). Natural History of New Zealand, Hodder and Stoughton, Auckland.
Dawson J (1988). Forest Vines to Snow Tussocks: The story of New Zealand plants, Victoria University Press, Wellington.
Heather BD, and Robertson HA (1996). The Field Guide to the Birds of New Zealand, Viking, Auckland.
King CM (1984). Immigrant Killers: Introduced predators and the conservation of birds in New Zealand, Oxford University Press, Auckland.
Meads M (1990). Forgotten Fauna, Department of Scientific and Industrial Research, Wellington.
Molloy L, and Cubitt G (1994). Wild New Zealand, New Holland, London.
Salmon JT (1998). The Native Trees of New Zealand, 2 vol, Reed, Auckland.
Salmon JT (1992). A Field Guide to the Alpine Plants of New Zealand, 3rd edition, Godwit,
www.doc.govt.nz – Department of Conservation
www.gns.cri.nz – Institute of Geological and Nuclear Sciences Ltd
www.linz.govt.nz – Land Information New Zealand
www.weather.co.nz – Metservice
www.niwa.cri.nz – National Institute of Water and Atmospheric Research Ltd
www.terralinkinternational.com – Terralink International Ltd
Table of Contents
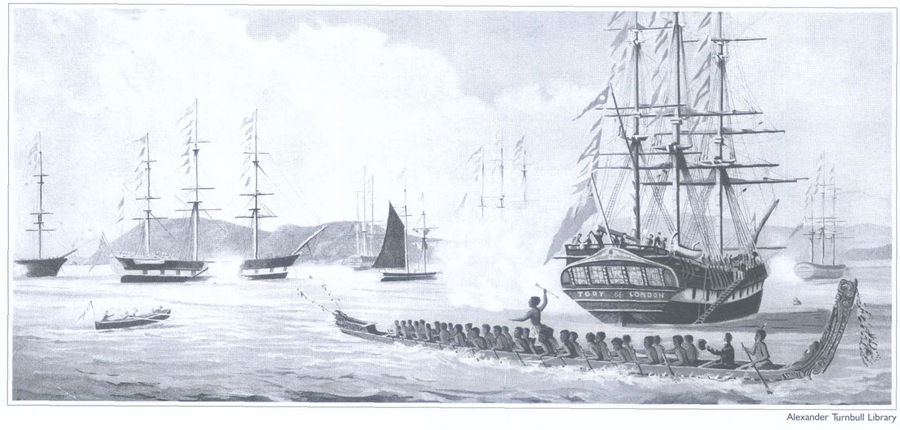
An artist's impression of the arrival of settlers at Port Nicholson, 1840.
The Polynesian ancestors of the Māori (meaning ‘ordinary’) people settled the main New Zealand islands (Aotearoa) about 1,000 years ago. They arrived – whether initially by accident or design is unclear – in waka (canoes) blown across the subtropics by prevailing north-east winds.
The settlers soon lost contact with their home islands and were forced to adapt to Aotearoa's more challenging physical environment. Annual cultivation of kumara (sweet potatoes) – a perennial crop in the tropics – was possible in the north through the underground winter storage of tubers. Birds, fish and small animals were caught and the resources of forest and ocean gathered. The large moa (flightless birds similar to emu), which were numerous in Te Wai Pounamu (the South Island), were eventually hunted to extinction. Fires lit to flush them out removed much of the forest east of the Southern Alps and climatic changes made horticulture more difficult. Southern Māori increasingly lived in small hunter/gatherer groups and migrated seasonally to harvest resources.
Māori lived in groups of varying size that traced their descent from a common ancestor. Whānau (extended families of 10 to 30 people) were linked in hapū (subtribes), several of which made up an iwi. These distinctions were fluid: large whānau became hapū, and large hapū came to be seen as iwi, while other groups declined in status. Iwi said to have arrived on the same migratory canoe were linked in loose confederations.
All aspects of Māori life were interrelated, with economic and social activities carried out on behalf of the whole community. While land belonged to large groups, smaller groups had rights to use specific areas and resources. Families were headed by kaumātua (elders) and communities by rangatira (chiefs), whose persons and possessions were tapu (spiritually protected). Tapu also safeguarded cultivations and urupā (burial grounds) and helped maintain social order. Tapu was regulated by tohunga (experts), who mediated spiritual forces, retained tribal history and knowledge, and had expertise in carving, tattooing and canoe-building.
Tribal groups interacted through both trade and warfare. Regional products such as pounamu (jade) and tītī (shearwaters or petrels, known as ‘muttonbirds’) were often transported long distances for bartering. Information was also exchanged among tribes. Travel was by waka, or on foot along beaches, riverbeds and ridges. There were footpaths in more densely populated areas and tracks through forests.
One consequence of the slowness of travel was that even large iwi were unable to permanently conquer extensive areas. Instead, low-level warfare became endemic. Competition for mana (status) was complemented by competition for increasingly scarce land and resources. The concept of utu (reciprocity) generally ensured that at least one party to a dispute felt justified in maintaining it. Fighting usually occurred seasonally to fit in with cycles of subsistence. Most taua (raiding parties) made small-scale attacks, which caused few casualties. Sometimes, however, iwi were displaced into less desirable areas by military defeat or economic pressures. But many regions were occupied by the same descent group for long periods.
By the late 18th century, the Māori population was about 100,000. Most now lived in the north of Te Ika a Māui (the North Island), where pressure for land and other resources had become intense. Here communities became larger, with many pā (fortified settlements) sited on hilltops and protected by ditches and palisades. Hunting and trapping had declined as population density increased; fish and shellfish now complemented crops. Some iwi now numbered many thousands. Te Wai Pounamu remained sparsely populated.
Māori were generally relatively tall and sturdy, free from infectious diseases, adequately fed, and unlikely to die violently. Because of the dangers of childbirth, infant mortality and dietrelated dental problems, Māori life expectancy was about 30 years. This was similar to that of Europeans in the 17th century.
The first Europeans to reach Aotearoa were probably Abel Tasman's Dutch East India Company expedition in 1642. After four men were killed by local Māori when a landing was attempted in Golden Bay, Tasman sailed up the west coast of Te Ika a Māui without finding the ‘treasures or matters of great profit’ he sought. While this experience discouraged other Europeans from following in his wake, the name of a Dutch province (Zeeland) was given to a jagged line on maps of the Pacific.
In 1769, two European expeditions visited Aotearoa. That of Frenchman Jean de Surville ill-treated Māori, provoking retaliation against later visitors. The arrival two months earlier of the English explorer James Cook, on a voyage with both scientific and economic goals, had enduring consequences. Cook's mostly peaceful interactions with ‘noble savages’ excited imaginations in Europe, and his discovery of Aotearoa's natural resources ensured it would not again be forgotten there.
Cook led two further expeditions which visited Aotearoa in the course of systematic exploration of the South Pacific. Following establishment of a penal colony at Sydney in 1788, New Zealand became an economic offshoot of New South Wales. Whaling and shore-based sealing began in the 1790s. Flax, timber, potatoes and pigs were being traded with visiting ships by the 1800s and Māori soon found they could barter this produce for firearms.
Muskets revolutionised Māori warfare. Fired in sufficient numbers, they generated enough terror to enable enemies who lacked them to be routed by traditional means. Unprecedently large and wide ranging Ngā Puhi taua settled old scores and generated new grievances across Te Ika a Māui during the 1820s. Other iwi exploited temporary leads in local arms races, in some cases using sailing ships to launch surprise attacks. Thousands were killed or enslaved, and tens of thousands displaced, provoking enduring disputes about land rights. By 1840, the ‘Musket Wars’ had subsided into an uneasy balance of terror.
Regular contact with Europeans had other negative consequences. Desired products could be purchased only through debilitating labour, often in unhealthy environments. Māori were vulnerable to infectious diseases, from which many died from the 1790s. The Māori population was halved during the 19th century.
Māori social structures were also disrupted. Mana became linked to the acquisition of European goods and the Pākehā (Europeans) who provided access to them. In the early 19th century, these were mostly whalers in the South Island – where communities soon included ‘half-caste’ children – and missionaries in the North Island. Māori initially resisted Christianity, but embraced the skills through which it was communicated – reading and writing. Literate slaves acquired status, while the mana of illiterate chiefs fell. Knowledge, previously held in common or tied to specific roles, could now be possessed and communicated by anyone.
Contact with the outside world also benefited Māori. Introduced animals and crops enabled improved diets. Knowledge gained through social interaction and literacy was supplemented by Māori who travelled the world as ships’ crew. Māori gradually developed some resistance to European diseases, and Pākehā settlers remained relatively few – 1,000 to 2,000 by 1839.
From 1840, however, when the British sovereignty first proclaimed by Cook was reasserted, Māori control over Aotearoa was threatened. Humanitarian concerns in Britain were assuaged by the signing of an agreement with some 500 chiefs. The differing and contested meanings in Māori and English of this Treaty of Waitangi clouded subsequent inter-racial relations. Māori ceded kāwanatanga (a word derived from ‘governorship’, but rendered as ‘sovereignty’ in the English text) to the British Crown, in exchange for rights as British subjects. They retained their taonga (‘treasured possessions’, including land, forests and fisheries) and could sell land only to the Crown. Māori accepted that the Crown's local representatives would have jurisdiction over immigrants who were arriving in increasing numbers, but the extent of their authority over Māori remained unclear.
Three main waves of settlers arrived in the next half-century. In the first, five separate ‘colonies’ were planted around the coast by 1850 under the auspices of the privately-owned New Zealand Company. A sixth was the most important: Auckland became the seat of government in 1841. These ‘mere encampments on the fringes of Polynesia’ existed on Māori terms. Several were saved from starvation in their first years by food grown by Māori. Communication between them was by ship and irregular – most had more frequent contact with Sydney than with each other.
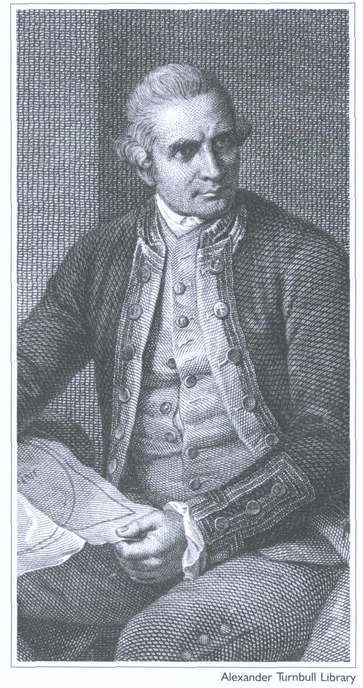
Captain James Cook.
Racial tolerance was soon strained. The New Zealand Company had purchased land hastily and with scant regard for actual ownership. Māori increasingly resisted further sales –- especially at the low prices offered – of land which immigrants arrived expecting to occupy. Rumoured and actual wars in the 1840s were followed by a largely effective boycott of land sales from 1854. Māori remained a majority for whom the decisions of the new elected General Assembly were largely irrelevant.
Governor George Grey had bought land and created institutions to assimilate Māori into British ways during his first term (1845–53). On his return in 1861, he employed more direct methods of establishing control. A war over land in Taranaki in 1860 had ended in stalemate. Grey decided to challenge the Kīngitanga (Māori sovereignty) movement in its Waikato heartland. An 18,000-strong army fought its way up the Waikato River in 1863–64 against strong resistance. War spread to Tauranga and both coasts of the North Island as messianic Pai Marire and Ringatū movements, which promised to expel the Pākehā, flourished. The strongest threat was posed by Titokowaru, who won several battles in southern Taranaki in 1868 before internal dissension lost him his army. With the flight of guerrilla leader Te Kooti to the ‘King's country’ in 1872, armed Māori resistance to British authority ended. The land of ‘rebels’ was confiscated, and much land belonging to ‘loyal’ Māori was also soon lost under a Native Land Court system which imposed individualised titles.
The second wave of immigration had begun in 1861 after the discovery of gold in Central Otago. Thousands of miners poured into Otago and Westland, swamping the ‘old identities’ of the carefully-planned Otago and Canterbury settlements. From 1865, Chinese miners – the colony's first significant non-European immigrants – were brought in to rework the tailings.
The third influx of migrants, in the 1870s, was instigated by New Zealand's first ‘Think Big’ government, which provided assisted passages. Land opened for settlement by the wars required deforestation and conversion to farmland. The process was aided by railways, which linked the main South Island towns in the 1870s, and those of the southern North Island by the early 1880s. Improved communications encouraged the abolition of separate provincial governments in 1876.
The end of Māori autonomy was symbolised by the advance of a railway through the King Country in the 1880s. Because of difficult terrain, the Auckland–Wellington line was not completed until 1908. Dunedin and Auckland were now two days travel apart, compared with two weeks 40 years earlier. As use of telephones also increased – there were 33,000 by 1910 – New Zealand became more meaningfully a single country. From 1876, information that took up to 10 weeks to convey by letter could be transmitted to Britain instantaneously by undersea telegraph cable.
From the 1890s, refrigeration transformed New Zealand farming. Much of Waikato and Taranaki was soon covered by small family-run dairy farms producing milk, and butter and cheese for export to Britain. Large runs in drier eastern areas had been growing wool for export since the 1850s; sheepmeat now also became a major export commodity. Coal steadily supplanted gold as the most important extracted mineral.
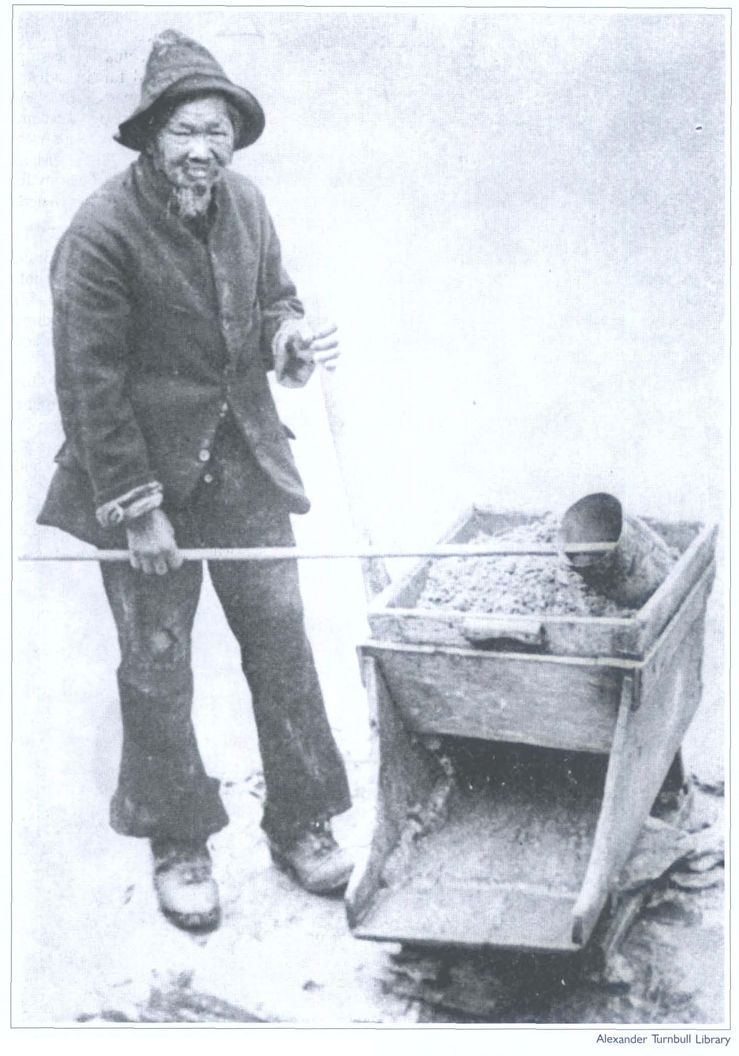
Chinese gold miner with cradle, Central Otago.
Politics, too, was transformed in the 1890s, when the ‘Continuous Ministry’ of runholders and businessmen was replaced by a Liberal government supported by small farmers and the skilled workers of the growing and increasingly industrialised towns. New Zealand became the first country to grant women the vote in 1893. By 1900, when the Māori population had fallen to 46,000, the 750,000 Pākehā were evenly divided between the North and South islands.
The Liberals placed ‘ordinary working men’ and their families on farms – which promised them physical and mental health, and prosperity – by buying and subdividing large estates, and by acquiring much of the remaining Māori-owned land. Concern for the welfare of ageing ‘pioneers’ encouraged the introduction of old-age pensions for the ‘deserving poor’ in 1898; they were to be joined in the next 40 years by other worthy but narrowly defined groups, including war veterans and widows. Job security of urban workers was improved by provisions for the compulsory arbitration of employment disputes and regulation of wages.
Around 1900, Pākehā New Zealanders underlined their new sense of identity by rejecting an offer to join the new Australian federation, and accepting a change of status from ‘colony’ to ‘dominion’. They also seized a chance to prove themselves ‘better Britons’ by fighting Boers in South Africa. Living far from centres of culture and knowledge, ‘Maorilanders’ were proud of their adaptability and resourcefulness. Most of their innovations, such as mechanising the separation of cream from milk, were motivated by pragmatism. The imagination of the South Canterbury farmer Richard Pearse, who probably flew before the Wright brothers, was exceptional.
The Liberal coalition began to unravel in the 1900s as the interests of small farmers and urban workers diverged. Farmers joined forces with urban employers in a Reform Party, while militant workers withdrew from the arbitration system and the ‘Liberal–Labour’ alliance. Social tensions came to a head in 1912–13, when Reform replaced the Liberals in power and crushed strikes led by a ‘red’ Federation of Labour. As in other settler societies, class war seemed imminent. But the threat had subsided by the time World War I broke out in mid-1914.
One hundred thousand New Zealanders served in the Great War alongside British forces. One in six were killed, many more came home as invalids, and another 8,000 to 9,000 New Zealanders died at the end of the war in the ‘Spanish flu’ pandemic. As their soldiers fought with distinction on Gallipoli, in Palestine and on the Western Front, New Zealanders’ sense of identity within the Empire grew.
Still tied to Britain economically, New Zealand was buffeted by volatile commodity prices in the 1920s. Working-class aspirations now found political expression in the Labour Party, while Reform continued the tradition of activist government by creating producer boards to coordinate exports, and building a countrywide hydroelectric system. A conservative coalition failed to cope effectively with the Great Depression, and Labour won office in 1935.
Labour introduced a minimum wage, a 40-hour working week, compulsory unionism, a substantial state housing programme, and a comprehensive system of social security, which provided a safety net ‘from the cradle to the grave’. Labour also articulated an independent foreign policy. But this had limits: a balance of payments crisis in 1938 necessitated import and financial controls which had the advantage of stimulating local industries.
New Zealand casualties in World War II were similar to those in World War I. While New Zealanders fought in North Africa and Europe, the country was garrisoned by United States forces training for the Pacific war. They made a substantial impression, not least on women. Aided by radio, the cinema and, later, television, the American invasion broadened New Zealanders’ cultural horizons.
During World War II, Labour ‘manpowered’ both sexes and took control of the country's resources. Māori supported the war with unparalleled unanimity. A Māori Battalion was raised on tribal lines and a Māori War Effort Organisation coordinated civilian contributions. For the first time, Māori migrated to the cities in significant numbers, a trend which was to continue until the 1980s, when manufacturing employment plummeted and rural life seemed more attractive. Successive governments worked to assimilate Māori into mainstream New Zealand life.
Young people were a higher proportion of the population in the ‘baby-boom’ years after 1945. Growing up with British and American music, fashions and television programmes, they chafed at the modest expectations of their parents. There were jobs, homes, education and health care for all, although some consumer goods remained scarce. Family life in the suburbs, which transformed areas such as West Auckland and Wellington's Hutt Valley, was both satisfying and stultifying. Wider choices did become available: the contraceptive pill and recreational drugs brought new freedoms, experiences and dangers in the 1960s. The need to enlarge the paid workforce widened opportunities for women, and low-cost tertiary education expanded those of many working-class teenagers.
National held power for most of the second half of the century. Until 1975, the terms of trade for New Zealand's primary exports (wool, meat, dairy products, timber) were high, and so was the standard of living. Local manufacturing industries protected from foreign competition expanded further. After the energy crises of the 1970s, the terms of trade turned against most primary products and full employment disappeared. From the late 1970s, National attempted to increase New Zealand's energy self-sufficiency while subsidising farming incomes. Both policies largely failed, expensively.
The 1984–90 Labour government, and its National successor, challenged much that New Zealanders took for granted. Many government activities were corporatised and then privatised. Some fared poorly in private ownership – in 2001, the national airline and part of the railway system reverted to state control. Public education and health care, the social welfare system, and employees’ rights were all constrained. The removal of most restrictions on economic activity encouraged both entrepreneurship and cultural diversity; the physical environment was more strongly protected; and New Zealand remained nuclear-free and robustly independent in foreign policy. Urban culture thrived as society was deregulated, and an influx of Pacific Islands and East Asian immigrants increased New Zealand's ethnic diversity.
A Labour-led coalition government took office in 1999, promising to maintain these benefits while reasserting the role of the state. Its greatest challenge lay in Māori-Pākehā relations. Having suffered disproportionately when full employment ended, Māori continued to fall behind in education, health and other social indicators. Māori confronted the dominant culture directly from 1975, when a march reiterating land grievances generated much support. A statutory tribunal was established in the same year to investigate breaches of the Treaty of Waitangi. Others saw cultural renaissance as the key to empowerment: schools in which only Māori was spoken, and Māori-language radio stations, sprang up from 1981.
In the 1990s, the government negotiated settlements of up to $170 million with individual iwi, and Māori entrepreneurship flourished. But many Māori want a bigger share of national wealth. Occupations of land whose ownership is disputed have continued, as have actions such as disrupting the sale of artefacts. Māori increasingly assert rights to intellectual property under international law. Many argue that the Treaty of Waitangi requires the equal sharing of power between Māori and Pākehā; some, that Māori sovereignty over Aotearoa has never been extinguished. Most New Zealanders, however, assume that all citizens have equal political rights, an attitude reinforced by the introduction of an electoral system based on proportional representation. This debate seems likely to continue.
David Green, History Group, Ministry for Culture and Heritage
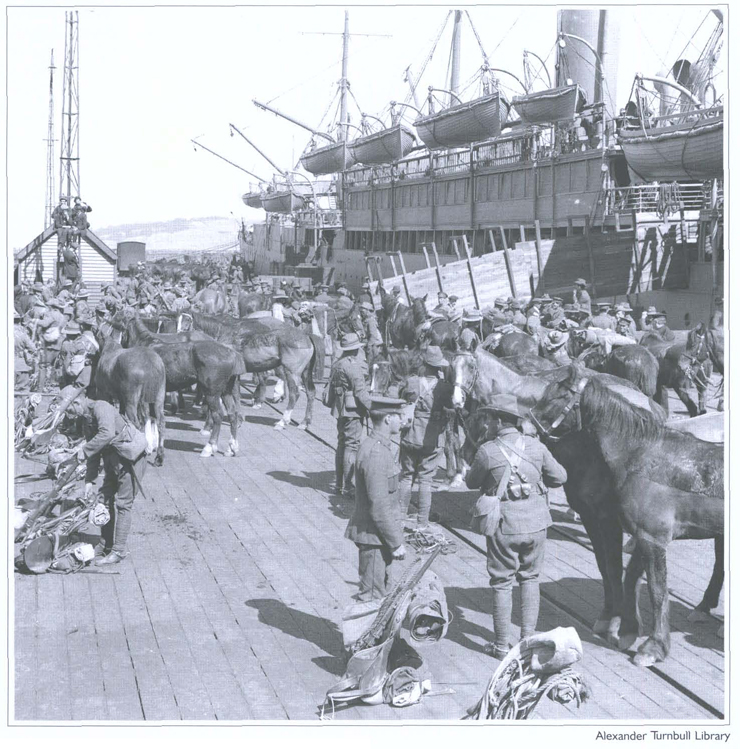
World War I troops leaving from Lyttelton.
| c1300 | Archaeological evidence indicates Polynesian settlement established by this date. |
| 1642 | Dutch explorer Abel Janszoon Tasman discovers a land he calls Staten Landt, later named Nieuw Zeeland. |
| 1769 | British explorer James Cook makes first of three visits to New Zealand, taking possession of the country in the name of King George III. |
| 1790s | Sealing, deep-sea whaling, flax and timber trading begins, with some small temporary settlements. First severe introduced epidemic among Māori population. |
| 1791 | First visit by a whaling vessel, the William and Ann, to Doubtless Bay. |
| 1806 | First Pākehā women arrive in New Zealand. |
| 1814 | British missionary Samuel Marsden makes first visit to New Zealand. Anglican mission station established. Sheep, cattle, horses and poultry introduced. |
| 1815 | First Pākehā child, Thomas Holloway King, born in New Zealand. |
| 1819 | Raids on Taranaki and Te Whanganui-a-Tara regions by Ngāpuhi and Ngāti Toa people led by chiefs Patuone, Nene, Moetara, Tuwhare and Te Rauparaha. |
| 1820 | Hongi Hika, Ngā Puhi chief, visits England, meets King George IV and secures supply of muskets. |
| 1821 | Musket wars begin with raids by Hongi Hika and Te Morenga on southern iwi and continue throughout the decade. |
| 1822 | Ngāti Toa migration south to Cook Strait region, led by Te Rauparaha, begins. |
| 1823 | Wesleyan Missionary Society mission established. First Church of England marriage between Pākehā and Māori: Phillip Tapsell and Maria Ringa. |
| 1824 | Te Heke Niho-Puta migration of Taranaki iwi to the Kapiti Coast. Rawiri Taiwhanga in Bay of Islands sells dairy produce and other food supplies to visiting ships. |
| 1827 | Te Rauparaha's invasion of the South Island from Kapiti begins. |
| 1830 | First acorn planted at Waimate North where agricultural mission and school established. |
| 1831 | Whaling stations established at Tory Channel and Preservation Inlet. |
| 1833 | James Busby, appointed British Resident in New Zealand, arrives at the Bay of Islands. |
| 1834 | United Tribes’ flag adopted by some 25 northern chiefs at Busby's suggestion. |
| 1835 | Declaration of Independence by the ‘United Tribes of New Zealand’ signed by 34 northern chiefs. |
| 1837 | New Zealand Association formed in London, becoming the New Zealand Colonisation Society in 1838 and the New Zealand Company in 1839, under the inspiration of Edward Gibbon Wakefield. William Colenso completes printing the New Testament in Māori, the first book printed in New Zealand. |
| 1838 | Bishop Pompallier founds Roman Catholic Mission at Hokianga. |
| 1839 | William Hobson instructed to establish British rule in New Zealand, as a dependency of New South Wales. Colonel William Wakefield of the New Zealand Company arrives on the Tory to purchase land for a settlement. |
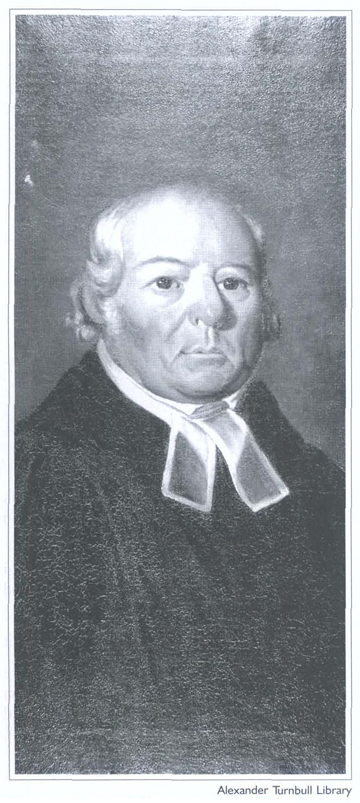 Reverend Samuel Marsden, died 1838. | |
| 1840 | Treaty of Waitangi signed at Bay of Islands and later over most of the country. British sovereignty proclaimed. Hobson becomes first governor and sets up executive and legislative councils. New Zealand Company settlers arrive at Port Nicholson, Wellington. French settlers land at Akaroa. |
| 1841 | European settlements established at New Plymouth and Wanganui. Capital shifted from Russell to Auckland. |
| 1842 | Main body of settlers arrive at Nelson. |
| 1843 | Twenty-two European settlers and four Māori killed at a confrontation at Tua Marina, near Wairau, in Marlborough. Robert FitzRoy becomes governor. |
| 1844 | Hone Heke begins the ‘War in the North’. New Zealand Company suspends colonising operations due to financial difficulties. |
| 1845 | George Grey becomes governor. |
| 1846 | War in the north ends with capture of Ruapekapeka. First New Zealand Constitution Act passed. Heaphy, Fox and Brunner begin exploring the West Coast. First steam vessel, HMS Driver, arrives in New Zealand waters. |
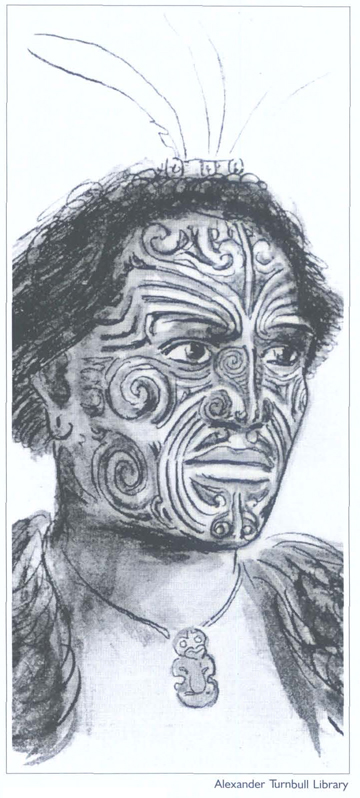 Hongi Hika, 1823. | |
| 1848 | Settlement founded by Scottish Otago Association. Provinces of New Ulster and New Munster established. Coal discovered at Brunner on the West Coast. Earthquake centred in Marlborough damages most Wellington buildings. |
| 1850 | Canterbury settlement founded. |
| 1852 | Second New Zealand Constitution Act passed creating general assembly and six provinces with representative government. |
| 1853 | Idea of a Māori King canvassed by Tamihana Te Rauparaha and Matene Te Whiwhi. |
| 1854 | First session of general assembly opens in Auckland. |
| 1855 | Governor Thomas Gore Browne, appointed in 1854, arrives. Severe earthquake on both sides of Cook Strait. |
| 1856 | Henry Sewell forms first ministry under responsible government and becomes first premier. Edward Stafford forms first stable ministry. |
| 1858 | New Provinces Act passed. Te Whero-whero installed as first Māori King, taking name Potatau I. |
| 1859 | First session of new Hawke's Bay and Marlborough provincial councils. Gold discovered in Buller River. New Zealand Insurance Company established. |
| 1860 | Waitara dispute develops into general warfare in Taranaki. |
| 1861 | Grey begins second governorship. Gold discovered at Gabriel's Gully; Otago goldrushes begin. First session of Southland provincial council. Bank of New Zealand incorporated at Auckland. |
| 1862 | First electric telegraph line opens – from Christchurch to Lyttelton. First gold shipment from Dunedin to London. |
| 1863 | War resumes in Taranaki and begins in Waikato when General Cameron crosses the Mangatawhiri stream. New Zealand Settlements Act passed to effect land confiscation. First steam railway in New Zealand opened. |
| 1864 | War in the Waikato ends after battle of Orakau. Land in Waikato, Taranaki, Bay of Plenty and Hawke's Bay confiscated. Gold discovered in Marlborough and Westland. Arthur, George and Edward Dobson are the first Pākehā to cross what becomes known as Arthur's Pass. |
| 1865 | Seat of government transferred from Auckland to Wellington. Native Land Court established. Māori resistance continues. Auckland streets lit by gas for first time. |
| 1866 | Cook Strait submarine telegraph cable laid. Christchurch to Hokitika road opens. Cobb and Co coaches run from Canterbury to the West Coast. |
| 1867 | Thames goldfield opens. Four Māori seats established in parliament. Lyttelton railway tunnel completed. Armed constabulary established. |
| 1868 | Māori resistance continues through campaigns of Te Kooti Arikirangi and Titokowaru. New Zealand's first sheep breed, the Corriedale, developed. |
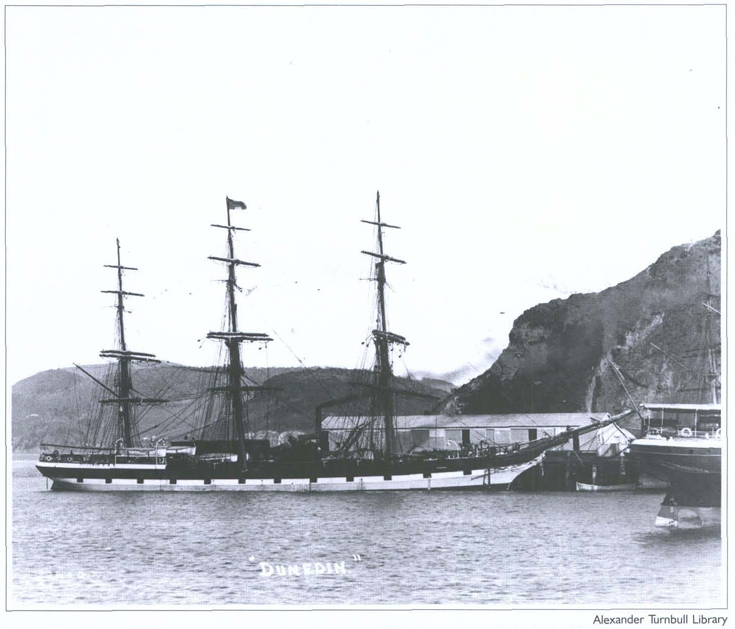 The Dunedin carried New Zealand's first exports of frozen meat to Britain in 1882.. | |
| 1869 | New Zealand's first university, the University of Otago, established. |
| 1870 | The last imperial forces leave New Zealand. Vogel's public works and immigration policy begins. New Zealand University Act passed, establishing a federal system which lasts until 1961. Vogel announces national railway construction programme; more than 1,000 miles constructed by 1879. First rugby match. Auckland to San Francisco mail service begins. |
| 1871 | Deer released in Otago. |
| 1872 | Te Kooti retreats to the King Country and Māori armed resistance ceases. Telegraph communication links Auckland, Wellington and southern provinces. |
| 1873 | New Zealand Shipping Company established. |
| 1874 | First New Zealand steam engine built at Invercargill. |
| 1876 | Abolition of the provinces and establishment of local government by counties and boroughs. New Zealand–Australia telegraph cable established. |
| 1877 | Education Act passed, establishing national system of primary education. |
| 1878 | Completion of Christchurch–Invercargill railway. |
| 1879 | Triennial Parliaments Act passed. Vote is given to every male aged 21 and over. Kaitangata mine explosion; 34 people die. Annual property tax introduced. |
| 1881 | Parihaka community forcibly broken up by troops. Te Whiti, Tohu Kakahi and followers arrested and imprisoned. Wreck of SS Tararua; 131 people die. Auckland and Christchurch telephone exchanges open. |
| 1882 | First shipment of frozen meat leaves Port Chalmers for England on the Dunedin. |
| 1883 | Te Kooti pardoned, Te Whiti and other prisoners released. Direct steamer link established between New Zealand and Britain. |
| 1884 | King Tawhiao visits England with petition to the Queen and is refused access. First overseas tour by a New Zealand rugby team, to New South Wales. Construction of King Country section of North Island main trunk railway begins. |
| 1886 | Mt Tarawera erupts and Pink and White Terraces destroyed; 153 people die. Oil discovered in Taranaki. |
| 1887 | New Zealand's first national park, Tongariro, is presented to the nation by Te Heuheu Tukino IV. Reefton becomes first town to have electricity. First inland parcel post service. |
| 1888 | Birth of writer Katherine Mansfield. |
| 1889 | Abolition of non-residential or property qualification to vote. First New Zealand-built locomotive completed at Addington. |
| 1890 | Maritime strike involves 8,000 unionists. ‘Sweating’ Commission reports on employment conditions. First election on a one-man one-vote basis. |
| 1891 | John McKenzie introduces the first of a series of measures to promote closer land settlement. John Ballance becomes premier of first Liberal government. |
| 1892 | First Kotahitanga Māori parliament meets. |
| 1893 | Franchise extended to women. John Ballance dies and is succeeded by Richard John Seddon. Liquor licensing poll introduced. Elizabeth Yates becomes first woman mayor, of Onehunga. Banknotes become legal tender. |
| 1894 | Compulsory arbitration of industrial disputes and reform of employment laws. Advances to Settlers Act. Clark, Fyfe and Graham become the first people to climb Mt Cook. |
| 1896 | National Council of Women founded. Brunner mine explosion; 67 people killed. Census measures national population as 743,214. |
| 1897 | First of series of colonial and later imperial conferences in London. |
| 1898 | Old Age Pensions Act. First cars imported to New Zealand. |
| 1899 | New Zealand army contingent sent to South African war. First celebration of Labour Day. |
| 1900 | Māori Councils Act passed. Public Health Act passed setting up Department of Public Health in 1901. |
| 1901 | Cook and other Pacific Islands annexed. Penny postage first used. |
| 1902 | Pacific cable begins operating between New Zealand, Australia and Fiji. |
| 1903 | Richard Pearse achieves semicontrolled flight near Timaru. |
| 1905 | New Zealand rugby team tours Britain and becomes known as the All Blacks. |
| 1906 | Seddon dies and is succeeded by Joseph Ward as premier. |
| 1907 | New Zealand constituted as a dominion. Fire destroys parliament buildings. |
| 1908 | Auckland to Wellington main trunk railway line opens. Ernest Rutherford awarded Nobel Prize in Chemistry. New Zealand's population reaches 1 million. |
| 1909 | ‘Red’ Federation of Labour formed. SS Penguin wrecked in Cook Strait; 75 people die. Compulsory military training introduced. Stamp-vending machine invented and manufactured in New Zealand. |
| 1912 | William Massey wins vote in the house and becomes first Reform Party prime minister. Waihi miners strike. |
| 1913 | Waterfront strikes in Auckland and Wellington. |
| 1914 | World War I begins and German Samoa occupied. New Zealand Expeditionary Forces despatched to Egypt. Huntly coal mine disaster; 43 people die. |
| 1915 | New Zealand forces take part in Gallipoli campaign. Reform and Liberal parties form National War Cabinet. Britain announces its intention to purchase all New Zealand meat exports during war. |
| 1916 | New Zealand troops transfer to Western Front. Conscription introduced. Labour Party formed. Lake Coleridge electricity supply scheme opened. |
| 1917 | Battle of Passchendaele – about 1,000 New Zealanders die. Six o’clock public house closing introduced. |
| 1918 | New Zealand division on Western Front. End of World War I. Influenza epidemic in which an estimated 8,500 die. Creation of power boards for electricity distribution. Prohibition petition with 242,001 signatures presented to parliament. |
| 1919 | Women eligible for election to parliament. Massey signs Treaty of Versailles. First official airmail flight from Auckland to Dargaville. |
| 1920 | Anzac Day established. New Zealand gets League of Nations mandate to govern Western Samoa. First aeroplane flight across Cook Strait. |
| 1921 | New Zealand division of Royal Navy established. |
| 1922 | Meat producers’ board placed in control of meat exports. |
| 1923 | Otira tunnel opens. Ross Dependency proclaimed. Death of Katherine Mansfield. |
| 1926 | National public broadcasting begins under auspices of Radio Broadcasting Co Ltd. |
| 1928 | General election won by new United Party. Kingsford-Smith completes first trans-Tasman flight. |
| 1929 | Depression deepens. Severe earthquake in Murchison–Karamea district; 17 people die. First health stamps issued. |
| 1930 | Unemployment Board set up to provide relief work. |
| 1931 | Newly formed Coalition government under George Forbes wins general election. Hawke's Bay earthquake; 256 die. Substantial percentage reductions in public service wages and salaries. Airmail postage stamps introduced. |
| 1932 | Compulsory arbitration of industrial disputes abolished. Unemployed riot in Auckland, Dunedin and Christchurch. Reductions in old age and other pensions. |
| 1933 | Elizabeth McCombs becomes first woman MP. Distinctive New Zealand coins first issued. |
| 1934 | Reserve Bank and Mortgage Corporation established. First trans-Tasman airmail. |
| 1935 | First Labour government elected under Michael Joseph Savage. Air services begin across Cook Strait. |
| 1936 | Reserve Bank taken over by state. State housing programme launched. Guaranteed prices for dairy products introduced. National Party formed from former Coalition MPs. Inter-island trunk air services introduced. Jack Lovelock wins Olympic gold medal. Jean Batten's record flight from England. Standard working week reduced from 44 to 40 hours for many workers. |
| 1937 | Federation of Labour unifies trade union movement. RNZAF set up as separate branch of armed forces. |
| 1938 | Social Security Act establishes revised pensions structure and the basis of a national health service. Import and exchange controls introduced. |
| 1939 | World War II begins. Second New Zealand Expeditionary Force formed. Bulk purchases of farm products by Great Britain. HMS Achilles takes part in Battle of the River Plate. |
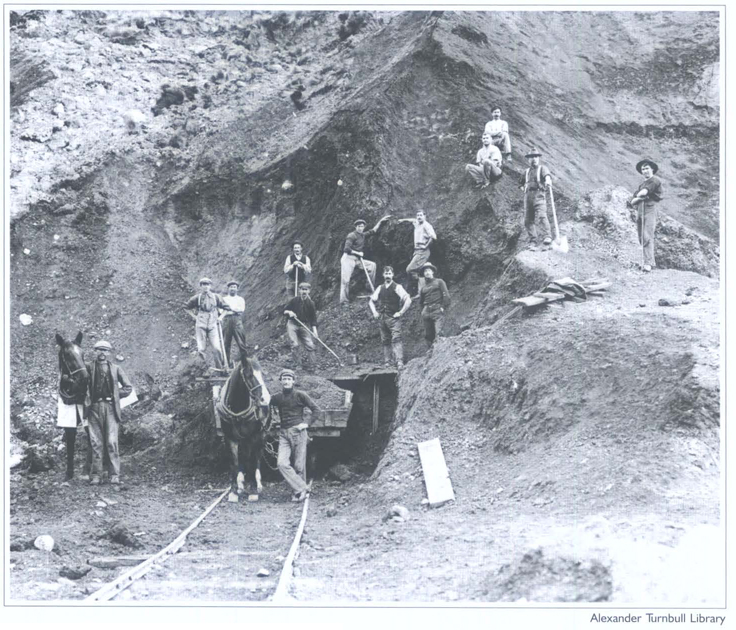 Early railway construction, by pick and shovel. | |
| 1940 | Michael Joseph Savage dies and is succeeded by Peter Fraser. Sidney Holland becomes leader of opposition. Conscription for military service. German mines laid across Hauraki Gulf. |
| 1941 | Japan enters the war. Māori War Effort Organisation set up. Pharmaceutical and general practitioner medical benefits introduced. |
| 1942 | Economic stabilisation. New Zealand troops in Battle of El Alamein. Food rationing introduced. Mobilisation of women for essential work. |
| 1943 | New Zealand troops take part in invasion of Italy. |
| 1944 | Australia–New Zealand Agreement provides for cooperation in the South Pacific. |
| 1945 | War in Europe ends on 8 May and in the Pacific on 15 August. New Zealand signs United Nations charter. Māori Social and Economic Advancement Act passed. National Airways Corporation founded. |
| 1946 | Family benefit of £1 a week becomes universal. Bank of New Zealand nationalised. |
| 1947 | Statute of Westminster adopted by New Zealand parliament. First public performance by National Orchestra. Mabel Howard becomes first woman cabinet minister. Fire in Ballantyne's department store, Christchurch; 41 people die. |
| 1948 | Protest campaign against exclusion of Māori players from 1949 rugby tour of South Africa. Polio epidemic closes schools. Ruapehu and Ngauruhoe erupt. Meat rationing ends. |
| 1949 | Referendum agrees to compulsory military training. National government elected. New Zealand gets first four navy frigates. |
| 1950 | Naval and ground forces sent to Korean War. Legislative Council abolished. Wool boom. Empire Games held in Auckland. |
| 1951 | Prolonged waterfront dispute – state of emergency proclaimed. ANZUS Treaty signed between United States, Australia and New Zealand. Māori Women's Welfare League established. |
| 1952 | Population passes 2 million. |
| 1953 | First tour by a reigning monarch. Edmund Hillary and Sherpa Tensing Norgay first to climb Mt Everest. Railway disaster at Tangiwai; 151 people die. World sheep-shearing record set by Godfrey Bowen. |
| 1954 | New Zealand signs South East Asia Collective Defence Treaty. New Zealand gains seat on United Nations Security Council. Social Credit gets 10 percent of vote in general election, but no seat in parliament. |
| 1955 | Pulp and paper mill opens at Kawerau. Rimutaka rail tunnel opens. |
| 1956 | New Zealand troops deployed in Malaya. Roxburgh and Whakamaru power stations in operation. |
| 1957 | National loses election; Walter Nash leads second Labour government. Last hanging. Scott Base established in Ross Dependency. Court of Appeal constituted. Dairy products gain 10 years of unrestricted access to Britain. |
| 1958 | PAYE tax introduced. Arnold Nord-meyer's ‘Black Budget’. First geothermal electricity generated at Wairakei. First heart-lung machine used at Greenlane Hospital, Auckland. |
 Jack Lovelock, Olympic gold medallist 1936. | |
| 1959 | Antarctic Treaty signed with other countries involved in scientific exploration in Antarctica. Auckland harbour bridge opened. |
| 1960 | Regular television programmes begin in Auckland. National government elected. Government Service Equal Pay Act passed. |
| 1961 | New Zealand joins the International Monetary Fund. Capital punishment abolished. |
| 1962 | Western Samoa becomes independent. Sir Guy Powles becomes first ombudsman. New Zealand Māori Council established. Cook Strait rail ferry service begins. Taranaki gas well opens. Peter Snell establishes mile and half-mile world athletic records. |
| 1964 | Marsden Point oil refinery opens near Whangarei. Cook Strait power cables laid. Auckland's population reaches half a million. |
| 1965 | Free trade (NAFTA) agreement negotiated with Australia. Government support for United States in Vietnam. New Zealand combat forces sent to Vietnam amid public protests. Cook Islands becomes self-governing. |
| 1966 | International airport officially opens at Auckland. New Zealand labour force reaches 1 million. Te Ata-i-rangi-kaahu becomes first Māori Queen. |
| 1967 | Referendum extends hotel closing hours to 10pm. Decimal currency introduced. Lord Arthur Porritt becomes first New Zealand-born governor-general. Breath and blood tests introduced for suspected drinking drivers. |
| 1968 | Inter-island ferry Wahine sinks in storm in Wellington Harbour; 51 people die. Three die in Inangahua earthquake. |
| 1969 | Vote extended to 20-year-olds. National government wins fourth election in a row. First output from Glenbrook Steel Mill. |
| 1970 | Natural gas from Kapuni supplied to Auckland. |
| 1971 | New Zealand secures continued access of butter and cheese to the United Kingdom. Ngā Tamatoa protest at Waitangi celebrations. Tiwai Point aluminium smelter begins operating. Warkworth satellite communications station begins operation. |
| 1972 | Labour government led by Norman Kirk elected. Equal Pay Act passed. |
| 1973 | Great Britain becomes a member of the EEC. Naval frigate despatched in protest against French nuclear testing in the Pacific. New Zealand's population reaches 3 million. Rugby tour by South Africa cancelled. Oil price hike means worst terms of trade in 30 years. Colour television introduced. |
| 1974 | Prime minister Norman Kirk dies. Commonwealth Games held in Christ-church. |
| 1975 | Robert Muldoon becomes prime minister after National election victory. Māori land march protests against land loss. The Waitangi Tribunal is established. Second television channel starts broadcasting. |
| 1976 | Matrimonial Property Act passed. Pacific Islands overstayers deported. EEC import quotas for New Zealand butter set until 1980. Introduction of metric system of weights and measures. Subscriber toll dialling introduced. |
| 1977 | National superannuation scheme begins. New Zealand's 200-mile exclusive economic zone established. Bastion Point occupied by Māori land protesters. |
| 1978 | Registered unemployed reaches 25,000. National government re-elected. |
| 1979 | Air New Zealand plane crashes on Mt Erebus, Antarctica; 257 people die. Carless days introduced to reduce petrol consumption. |
| 1980 | Social Credit wins East Coast Bays by-election. Saturday trading partially legalised. Eighty-day strike at Kinleith pulp and paper mill. |
| 1981 | South African rugby team's tour brings widespread disruption. |
| 1982 | Closer Economic Relations (CER) agreement signed with Australia. First kohanga reo established. Year-long wage, price and rent freeze imposed – lasts until 1984. |
| 1983 | Visit by nuclear-powered United States Navy frigate Texas sparks protests. Official Information Act replaces Official Secrecy Act. New Zealand Party founded. |
| 1984 | Labour Party wins snap general election. Finance Minister Roger Douglas begins deregulating economy. New Zealand ratifies the United Nations Convention on the Elimination of All Forms of Discrimination Against Women. Te Hikoi ki Waitangi march and disruption of Waitangi Day celebrations. Auckland's population exceeds that of the South Island. Government devalues New Zealand dollar by 20 percent. |
| 1985 | Anti-nuclear policy leads to refusal of visit by American warship USS Buchanan. Greenpeace vessel Rainbow Warrior bombed and sunk by French agents in Auckland harbour. New Zealand dollar floated. Author Keri Hulme wins Booker Prize for The Bone People. First case of locally-contracted AIDS reported. Waitangi Tribunal given power to hear Māori land grievances arising since 1840. |
| 1986 | Homosexual Law Reform Bill passed. Royal Commission reports in favour of MMP electoral system. Jim Bolger becomes National Party leader. Soviet cruise ship, the Mikhail Lermontov, sinks in Marlborough Sounds. Goods and Services Tax introduced. First visit to New Zealand by the Pope. |
| 1987 | Share prices plummet by 59 percent in four months. Labour wins general election. Māori Language Act passed making Māori an official language. Anti-nuclear legislation enacted. First Lotto draw. New Zealand's first heart transplant performed. New Zealand wins first Rugby World Cup. |
| 1988 | Number of unemployed exceeds 100,000. Bastion Point land returned to Māori ownership. Cyclone Bola strikes northern North Island. Electrification of North Island's main trunk line completed. New Zealand Post closes 432 post offices. Fisheries quota package announced for Māori iwi. |
| 1989 | Prime minister David Lange suggests formal withdrawal from ANZUS. Jim Anderton founds New Labour Party. Lange resigns and Geoffrey Palmer becomes prime minister. First annual balance of payments surplus since 1973. Reserve Bank Act sets bank's role as one of maintaining price stability. First school board elections under Tomorrow's Schools reforms. First elections under revised local government structure. Sunday trading begins. Third television channel begins. Māori Fisheries Act passed. |
 Edmund Hillary, mountaineer. | |
| 1990 | New Zealand celebrates its sesqui-centennial. Māori leaders inaugurate National Congress of Tribes. Dame Catherine Tizard becomes first woman governor-general. Geoffrey Palmer resigns as prime minister and is replaced by Mike Moore. National Party has landslide victory. Jim Bolger becomes prime minister. One and two cent coins withdrawn from circulation. Commonwealth Games held in Auckland. Telecom sold for $4.25 billion. Welfare payments cut. |
| 1991 | Welfare payments further reduced. Alliance Party formed. Employment Contracts Act passed. Consumers price index has lowest quarterly increase for 25 years. Number of unemployed exceeds 200,000 for first time. New Zealand troops join multi-national force in the Gulf War. An avalanche reduces the height of Mt Cook by 10.5m. |
| 1992 | Government and Māori interests negotiate Sealords fisheries deal. Public health system reforms. State housing commercialised. Watties Foods is bought by American company Heinz. New Zealand gets seat on United Nations Security Council. |
| 1993 | Centennial of women's suffrage celebrated. New Zealand First Party launched. National wins election without majority – Opposition MP Peter Tapsell becomes Speaker of the House, thus giving the government a majority. Referendum favours MMP electoral system. |
| 1994 | Government commits 250 soldiers to peacekeeping duty in Bosnia. Government proposes $1 billion cap in plan for final settlement of Treaty of Waitangi claims. Sharemarket reaches highest level since 1987 crash. New Zealand's first casino opens in Christchurch. First fast-ferry passenger service begins operation across Cook Strait. |
| 1995 | Team New Zealand wins America's Cup. Occupation of Moutua Gardens, Wanganui. Waikato Raupatu Claims Settlement Act passed. Conservative, Christian Heritage and United New Zealand political parties launched. Renewal of French nuclear tests results in New Zealand protest flotilla and navy ship Tui sailing for Mururoa Atoll. Common-wealth Heads of Government meeting in Auckland. New Zealand contingent returns from Bosnia. |
| 1996 | Thirteenth National Park, Kahurangi, opens in north-west Nelson. Waitangi Tribunal recommends settlement of Taranaki land claims. First legal sports betting at TAB. A $170 million Ngāi Tahu settlement proposed. Government makes an offer to settle the Whakatāhea claim; debate continues. First MMP election brings National/New Zealand First coalition government. |
| 1997 | The Winebox Inquiry concludes with a recommendation of tighter tax laws and the finding that all allegations of fraud raised in the inquiry were unable to be substantiated. The $170 million Ngāi Tahu settlement signed. Jim Bolger resigns as prime minister after a National Party coup while he is overseas. Bolger replaced by New Zealand's first woman prime minister, Jenny Shipley. Taranaki farmers drive tractors to parliament to protest passage of the Māori Reserved Land Amendment Act. |
| 1998 | Auckland city businesses hit by power cut which continues for more than a month. New Zealand women's rugby team, the Black Ferns, becomes world champions. Coalition government dissolved, leaving Shipley's National Party as a minority government. Several cases of tuberculosis discovered in South Auckland in the worst outbreak for a decade. The Hikoi of Hope marches to parliament calling for more support for the poor. |
| 1999 | Dame Sian Elias becomes New Zealand's first female chief justice. New Zealand sends peacekeeping troops to East Timor. Auckland hosts the APEC world leaders’ conference, attended by United States President Bill Clinton. Former prime minister Mike Moore becomes head of the World Trade Organisation. The minority National government loses the November election and Labour leader Helen Clark becomes first elected woman prime minister, in coalition with the Alliance party and with the support of the Green party. The Greens enter parliament for the first time with seven seats. Legal drinking age lowered from 20 to 18 years. |
| 2000 | Air New Zealand gains ownership of Ansett Australia. Team New Zealand beats Italy's Prada 5–0 in the final series to retain the America's Cup. Labour government abolishes knighthoods from future honours lists. Auckland's One Tree Hill loses its pine after vandalism attack. Dr Alan G MacDiarmid wins Nobel Prize for Chemistry for his part in the discovery and development of conductive polymers. |
| 2001 | New Zealand-born Russell Crowe wins best actor Academy Award for his performance in Gladiator. Dame Silvia Cartwright sworn in as governor-general. For the first time, the governor-general, prime minister, attorney-general, leader of the opposition and chief justice are all women. New Zealand's largest company, Fonterra, is formed from merger of the New Zealand Dairy Group and Kiwi Dairies. Qantas New Zealand and Ansett collapse. Government injects $550 million to keep Air New Zealand flying after the company announces a $1.4 billion loss – the largest in New Zealand's corporate history. Government disbands RNZAF combat wing. Shipley resigns and Bill English becomes Leader of the National Party. New Zealand-filmed and produced The Lord of the Rings: The Fellowship of the Ring opens to world-wide acclamation. |
2.1 David Green, History Group, Ministry for Culture and Heritage.
2.2 Statistics New Zealand.
Statistics New Zealand divisional manager responsible: Kevin Eddy.
Bassett J, Sinclair K, and Stenson M (1985). The Story of New Zealand, Reed Methuen, Auckland.
Belich J (1996). Making Peoples: A history of the New Zealanders from Polynesian settlement to the end of the nineteenth century, Allen Lane/The Penguin Press, Auckland.
Belich J (2001). Paradise Reforged: A history of the New Zealanders from the 1880s to the year 2000, Allen Lane/The Penguin Press, Auckland.
Bohan E (1997). New Zealand: The Story So Far: A short history, HarperCollins, Auckland.
Brooking TWH, and Enright P (1988). Milestones: Turning points in New Zealand history, Mills Publications, Lower Hutt.
Cumberland K (1981). Landmarks, (video recordings), Television New Zealand, Wellington.
Dalley B (2000). Living in the 20th Century: New Zealand history in photographs, 1900–1980, Bridget Williams Books/Craig Potton Publishing, Wellington/Nelson.
Keith H (1984). New Zealand Yesterdays: A look at our recent past, Reader's Digest Services, Sydney.
McKinnon M (ed) (1997). New Zealand Historical Atlas, David Bateman in association with Historical Branch, Department of Internal Affairs, Auckland.
Rice G (ed) (1992). The Oxford History of New Zealand, 2nd edition, Oxford University Press, Auckland.
Richardson L (ed) (2000). Bateman New Zealand Encyclopedia, updated and expanded 5th (millennium) edition, David Bateman, Auckland.
Sinclair K (1998). A History of New Zealand, revised edition, Penguin, Auckland.
Sinclair K (ed) (1990). The Oxford Illustrated History of New Zealand, Oxford University Press, Auckland.
Smith P, and Callan L (1999). Our People, Our Century, 1900–2000, Hodder Moa Beckett, Auckland.
Watson J (1996). Links: A history of transport and New Zealand society, GP Publications, Wellington.
Wilson AC (1994). Wire and Wireless: A history of telecommunications in New Zealand, 1860–1987, Dunmore Press, Palmerston North.
Table of Contents
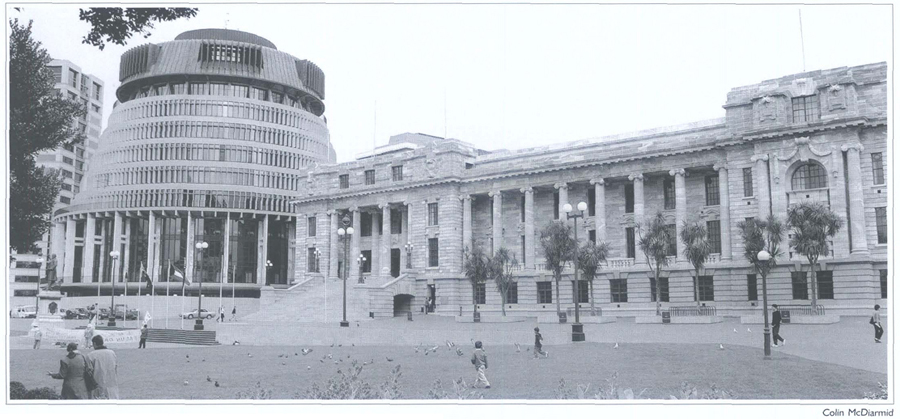
Parliament buildings and the Beehive in Molesworth Street, Wellington.
New Zealand's constitutional history can be traced back to 1840 when, by the Treaty of Waitangi, the Māori people exchanged their sovereignty for the guarantees of the treaty and New Zealand became a British colony. Five years earlier, on 28 October 1835, an assembly of the Confederation of Chiefs of the United Tribes of New Zealand had proclaimed the country independent and signed a Declaration of Independence.
New Zealand is an independent state: a monarchy with a parliamentary government. Queen Elizabeth II has the title Queen of New Zealand.
A constitution is concerned with the establishment and composition of the legislative, executive and judicial organs of government, their powers and duties, and the relationship between these organs. New Zealand's Constitution Act 1986 brings together in one act the most important statutory constitutional provisions and clarifies rules relating to the governmental handover of power. The act deals with the principal components of New Zealand's statutory constitutional provisions: the sovereign, the executive, the legislature and the judiciary.
A number of United Kingdom acts (referred to as Imperial acts) remain in force as part of the law of New Zealand. Some are historic constitutional acts, such as the Magna Carta. These acts are listed and defined in the Imperial Laws Application Act 1988.
Table 3.1 lists Sovereigns of New Zealand since signing of the Treaty of Waitangi.
Table 3.1. Sovereigns of New Zealand
| Monarch | Accession | Died | Age | Reigned(years) |
|---|---|---|---|---|
1Abdicated; reigned 325 days. Source: Statistics New Zealand | ||||
| House of Hanover | ||||
| Victoria | 1837 | 1901 | 81 | 63 |
| House of Saxe-Coburg | ||||
| Edward VII | 1901 | 1910 | 68 | 9 |
| House of Windsor | ||||
| George V | 1910 | 1936 | 70 | 25 |
| Edward VIII1 | 1936 | 1972 | .. | .. |
| George VI | 1936 | 1952 | 56 | 15 |
| Elizabeth II | 1952 | |||
New Zealand gallantry and bravery awards A new series of New Zealand gallantry and bravery awards was instituted in 1999, replacing the former British awards. There are four levels to each of the gallantry and bravery categories. The awards are usually announced in Special Lists as required. The gallantry awards, which recognise acts of gallantry by New Zealand Defence Force and certain other personnel during war and war-like operations, including peacekeeping operations, are:
The bravery awards, which recognise civilians who save or attempt to save the life of another person and in doing so place their own lives at risk, are:
Source: Executive Council Chambers  New Zealand's bravery awards recognise those who have risked their lives to save others. |
The Governor-General of New Zealand is the representative of the Sovereign in New Zealand and exercises the royal powers derived from statute and the general law (prerogative powers). The powers of the governor-general are set out in the Letters Patent 1983 and it is for the courts to decide on the limits of these powers.
The governor-general's main constitutional function is to arrange for the leader of the majority party in parliament to form a government. The Crown is part of parliament and the governor-general's assent is required before bills can become law. The governor-general is required, however, by constitutional convention and the Letters Patent, to follow the advice of ministers. In extraordinary circumstances, the governor-general can reject advice if he or she believes a government is intending to act unconstitutionally. This is known as the reserve power.
The Sovereign appoints the governor-general on the prime minister's recommendation, normally for a term of five years.
Table 3.2 lists Lieutenant-Governors, Governors and Governors-General of New Zealand since signing of the Treaty of Waitangi.
A feature of New Zealand's constitution is that although it is a monarchy in form, it operates democratically because of a long political tradition of parliamentary government and a network of constitutional principles. The government cannot act effectively without parliament, because it cannot raise or spend money without parliamentary approval. For most categories of expenditure, this approval takes the form of an annual vote of funds to the government. Parliament has to be assembled regularly, therefore, and thus has the opportunity to hold the government to account.
The general election in 1996 was the first held in New Zealand under the Mixed Member Proportional (MMP) system, where voters have a party vote and an electorate vote. Voters choose what party they want in parliament with their party vote and which person they want to represent their electorate with their electorate vote.
Table 3.2. Vice-regal representatives
| Vice-regal representative1 | Assumed office | Retired |
|---|---|---|
1Honours are specified only if held on retirement from office. Source: Office of the Governor-General | ||
| Dependency | ||
| Lieutenant-Governor | ||
| Captain William Hobson, RN | 30 Jan 1840 | 3 May 1841 |
| Crown colony | ||
| Governor | ||
| Captain William Hobson, RN | 3 May 1841 | 10 Sep 1842 |
| Captain Robert FitzRoy, RN | 26 Dec 1843 | 17 Nov 1845 |
| Captain George Grey | 18 Nov 1845 | 31 Dec 1847 |
| Governor-in-Chief Sir George Grey, KCB | 1 Jan 1848 | 7 Mar 1853 |
| Self-governing colony | ||
| Governors of New Zealand | ||
| Sir George Grey, KCB | 7 Mar 1853 | 31 Dec 1853 |
| Colonel Thomas Gore Browne, CB | 6 Sep 1855 | 2 Oct 1861 |
| Sir George Grey, KCB | 4 Dec 1861 | 5 Feb 1868 |
| Sir George Ferguson Bowen, GCMG | 5 Feb 1868 | 19 Mar 1873 |
| Rt Hon Sir James Fergusson, Bt | 14 Jun 1873 | 3 Dec 1874 |
| Marquess of Normanby, GCB, GCMG, PC | 9 Jan 1875 | 21 Feb 1879 |
| Sir Hercules George Robert Robinson, GCMG | 17 Apr 1879 | 8 Sep 1880 |
| Hon Sir Arthur Hamilton Gordon, GCMG | 29 Nov 1880 | 23 Jun 1882 |
| Lieutenant-General Sir William Francis Drummond Jervois, GCMG, CB | 20 Jan 1883 | 22 Mar 1889 |
| Earl of Onslow, GCMG | 2 May 1889 | 24 Feb 1892 |
| Earl of Glasgow, GCMG | 7 Jun 1892 | 6 Feb 1897 |
| Earl of Ranfurly, GCMG | 10 Aug 1897 | 19 Jun 1904 |
| Lord Plunket, GCMG, KCVO | 20 Jun 1904 | 7 Jun 1910 |
| Dominion | ||
| Lord Islington, KCMG, DSO, PC | 22 Jun 1910 | 2 Dec 1912 |
| Earl of Liverpool, GCMG, MVO, PC | 19 Dec 1912 | 27 Jun 1917 |
| Governors-General of New Zealand | ||
| Earl of Liverpool, GCB, GCMG, GBE, MVO, PC | 28 Jun 1917 | 7 Jul 1920 |
| Admiral of the Fleet Viscount Jellicoe, GCB, OM, GCVO | 27 Sep 1920 | 26 Nov 1924 |
| General Sir Charles Fergusson, BT, GCMG, KCB, DSO, MVO | 13 Dec 1924 | 8 Feb 1930 |
| Viscount Bledisloe, GCMG, KBE, PC | 19 Mar 1930 | 15 Mar 1935 |
| Viscount Galway, GCMG, DSO, OBE, PC | 12 Apr 1935 | 3 Feb 1941 |
| Marshal of the Royal Air Force Sir Cyril Louis Norton Newall, GCB, OM, GCMG, CBE, AM | 22 Feb 1941 | 19 Apr 1946 |
| Realm | ||
| Lieutenant-General the Lord Freyberg, VC, GCMG, KCB, KBE, DSO | 17 Jun 1946 | 15 Aug 1952 |
| Lieutenant-General the Lord Norrie, GCMG, GCVO, CB, DSO, MC | 2 Dec 1952 | 25 Jul 1957 |
| Viscount Cobham, GCMG, TD | 5 Sep 1957 | 13 Sep 1962 |
| Brigadier Sir Bernard Fergusson, GCMG, GCVO, DSO, OBE | 9 Nov 1962 | 20 Oct 1967 |
| Sir Arthur Espie Porritt, BT, GCMG, GCVO, CBE | 1 Dec 1967 | 7 Sep 1972 |
| Sir (Edward) Denis Blundell, GCMG, GCVO, KBE, QSO | 27 Sep 1972 | 5 Oct 1977 |
| Rt Hon Sir Keith Jacka Holyoake, KG, GCMG, CM, QSO | 26 Oct 1977 | 27 Oct 1980 |
| Hon Sir David Stuart Beattie, GCMG, GCVO, QSO, QC | 6 Nov 1980 | 10 Nov 1985 |
| Most Reverend Sir Paul Alfred Reeves, GCMG, GCVO, QSO | 20 Nov 1985 | 29 Nov 1990 |
| Dame Catherine Tizard, GCMG, GCVO, DBE, QSO | 13 Dec 1990 | 3 Mar 1996 |
| Rt Hon Sir Michael Hardie Boys, GNZM, GCMG, QSO | 21 Mar 1996 | 21 Mar 2001 |
| Dame Silvia Cartwright, PCNZM, DBE | 4 April 2001 | |

Governor-General of New Zealand Dame Silvia Cartwright.
Prime Minister Helen Clark greets Green MP Nandor Tanczos during the opening session of the 46th parliament in December 1999.
For the 2002 election, New Zealand was divided geographically into 62 general electorates and seven Māori ones. There were also 51 seats for list Members of Parliament. The number of general electorates changes as the population changes. Electors vote in the electorate in which they live.
People of Māori descent can choose whether to be on the Māori or general electoral rolls. The number of Māori seats changes as the number of voters on the Māori roll changes.
The Electoral Act 1993, which sets out the way the New Zealand electoral system works, is the only statute in New Zealand with entrenched provisions. Being entrenched means that if certain changes to the act are made, for example the length of the parliamentary term, they must be passed by either 75 percent of MPs, or a majority vote in a referendum of all voters on the electoral rolls. Usually, a simple majority (51 percent) of MPs is all that is required to make changes to an act.
The power to make laws lies at the heart of New Zealand's parliamentary system. This power is vested in the Parliament of New Zealand by the Constitution Act 1986. Parliament consists of the Sovereign (normally represented by the governor-general) and an elected House of Representatives.
The principal functions of parliament are to enact laws, to supervise the government's administration, to vote supply, to provide a government and to redress grievances by way of petition. The act forbids the house allocating public funds for any purpose unless first recommended by the Crown. At the same time, the law forbids the Crown taxing citizens without express parliamentary approval. Private members are now able, under standing orders, to initiate proposals involving expenditure or taxation. However, the government has an absolute right to veto such proposals if in its view they would have more than a minor impact on the government's fiscal aggregates.
Perhaps the most important privilege of the house is that of freedom of speech, guaranteed by the Bill of Rights 1688 and claimed by the Speaker upon confirmation in office by the governor-general.
The house meets in answer to a summons from the governor-general. Sessions of parliament are marked by a formal opening, when the government's legislative programme is described in the Speech from the Throne, read by the governor-general in the absence of the Sovereign. The session is either terminated by prorogation or, as is now usually the case, directly by dissolution of parliament. Unless there is a new session, the prime minister's statement at the start of business in the second and third years of the parliamentary term reviews public affairs and outlines the government's legislative and other policy intentions for the year ahead.
The Speaker, elected by the house, is the principal presiding officer, maintaining order in proceedings and ensuring standing orders are complied with. The Speaker is assisted by the Clerk of the House of Representatives, who notes all proceedings of the house and of any committee of the house, and provides advice on parliamentary law and custom.
Standing orders. The current standing orders, or rules of procedure, of the New Zealand House of Representatives came into force on 20 February 1996 in anticipation of a house elected under the Mixed Member Proportional (MMP) system at the general election of 1996. The background to the changes is set out in the Report of the Standing Orders Committee on the Review of Standing Orders (Parl paper I.18A, 1995). Amendments were made in August 1996 (Parl paper I.18B, 1996) and in September 1999 (Parl paper I.18B, 1999).
Role of parties. Traditionally in New Zealand it has been the role of the opposition party with the highest number of seats to present itself to the people as an alternative government, attacking government policy and attempting to demonstrate inefficiency of government or departmental mismanagement.
Under an electoral system providing majority governments, it is unlikely that the opposition could bring down a government by a no-confidence vote – there has been no instance of a successful no-confidence vote in the New Zealand Parliament since 1928. The New Zealand House of Representatives has been characterised in the past by two large, dominant parties, with the majority party forming the government and the minority party forming the opposition.
In recent years, however, members of other parties have been elected to parliament and, from time to time, members have left one of the parties and continued to sit as independent members, or have formed new parties.
It is less likely under the Mixed Member Proportional (MMP) voting system that any single party will command an absolute majority in the house and be able to form a government on its own account.
Current standing orders provide expressly for parties to be recognised in the house. This is reflected in various procedures, for instance in relation to voting. The principle of proportionality to party membership in the house is accorded weight, such as for participation in debate and the asking of oral questions.
Because of the importance that parties have assumed within the political framework, the party caucus (a meeting of each party's Members of Parliament in closed session at regular intervals, once a week when parliament is in session) has become a primary means of developing policies and tactics.
Table 3.3 shows seats held by political parties after general elections since 1890.
Figure 3.1 illustrates the growth in the number of women in parliament from 1933 to 1999.
Table 3.3. Seats held by political parties after general elections
| Election | Total | Liberal | Conservative | Labor | ACT | NZ First | Alliance | Green | Others | Independent | |
|---|---|---|---|---|---|---|---|---|---|---|---|
1Country Party. 2Rātana. 3Social Credit/Democrats. 4New Labour. 5Includes Speaker of the House. 6United. Source: Office of the Clerk of the House of Representatives | |||||||||||
| 1890 | 74 | 38 | 25 | 7 | |||||||
| 1893 | 74 | 51 | 13 | 6 | |||||||
| 1896 | 74 | 39 | 25 | 6 | |||||||
| 1899 | 74 | 49 | 19 | 2 | |||||||
| 1902 | 80 | 47 | 19 | 10 | |||||||
| 1905 | 80 | 58 | 16 | 6 | |||||||
| Reform | |||||||||||
| 1908 | 80 | 50 | 26 | 1 | 3 | ||||||
| 1911 | 80 | 33 | 37 | 4 | 6 | ||||||
| 1914 | 80 | 33 | 41 | 6 | 0 | ||||||
| 1919 | 80 | 21 | 47 | 8 | 4 | ||||||
| 1922 | 80 | 22 | 37 | 17 | 4 | ||||||
| 1925 | 80 | 11 | 55 | 12 | 2 | ||||||
| 1928 | 80 | 27 | 27 | 19 | 11 | 6 | |||||
| Coalition | |||||||||||
| 1931 | 80 | 51 | 24 | 11 | 4 | ||||||
| National | |||||||||||
| 1935 | 80 | 19 | 53+22 | 21 | 4 | ||||||
| 1938 | 80 | 25 | 53 | 2 | |||||||
| 1943 | 80 | 34 | 45 | 1 | |||||||
| 1946 | 80 | 38 | 42 | ||||||||
| 1949 | 80 | 46 | 34 | ||||||||
| 1951 | 80 | 50 | 30 | ||||||||
| 1954 | 80 | 45 | 35 | ||||||||
| 1957 | 80 | 39 | 41 | ||||||||
| 1960 | 80 | 46 | 34 | ||||||||
| 1963 | 80 | 35 | 35 | ||||||||
| 1966 | 80 | 44 | 35 | 13 | |||||||
| 1969 | 84 | 45 | 39 | ||||||||
| 1972 | 87 | 32 | 55 | ||||||||
| 1975 | 87 | 55 | 32 | ||||||||
| 1978 | 92 | 51 | 40 | 13 | |||||||
| 1981 | 92 | 47 | 43 | 23 | |||||||
| 1984 | 95 | 37 | 56 | 23 | |||||||
| 1987 | 97 | 40 | 57 | ||||||||
| 1990 | 97 | 67 | 29 | 14 | |||||||
| 1993 | 99 | 50 | 455 | 2 | 2 | ||||||
| 1996 | 120 | 445 | 37 | 8 | 17 | 13 | 16 | ||||
| 1999 | 120 | 39 | 49 | 9 | 5 | 10 | 7 | 16 | |||
Party representation. The general election on 12 October 1996, the first under Mixed Member Proportional (MMP) representation, did not produce an outright majority of seats for either of the two main political parties, National (previously in coalition with the United New Zealand Party) or Labour. A coalition agreement was concluded between National and New Zealand First on 11 December 1996 and the new ministry was sworn in on 16 December 1996. Following termination of the coalition agreement, a National-led ministry was reconstituted on 31 August 1998. The first House of Representatives to be elected under MMP consisted of: National 44 (30 electorate, 14 party list); Labour 37 (26 electorate, 11 party list); New Zealand First 17 (6 electorate, 11 party list); Alliance 13 (1 electorate, 12 party list); Act New Zealand 8 (1 electorate, 7 party list); and United New Zealand (1 electorate). When parliament dissolved on 18 October 1999, the state of the parties recognised for parliamentary purposes was: National 44; Labour 36; Alliance 9; New Zealand First 9; ACT New Zealand 8; Mauri Pacific 5; Green Party 2; Christian Heritage 1; Mana Wahine Te Ira Tangata 1; Te Tawharau 1; United New Zealand 1; Independents 2; vacant (formerly Labour) 1.
The general election on 27 November 1999 resulted in the formation of a minority coalition government consisting of Labour and the Alliance. The new ministry was sworn in on 10 December 1999. The second House of Representatives elected under MMP consisted of: Labour 49 (41 electorate, 8 party list); National 39 (22 electorate, 17 party list); Alliance 10 (1 electorate, 9 party list); ACT New Zealand 9 party list; Green 7 (1 electorate, 6 party list); New Zealand First 5 (1 electorate, 4 party list); United New Zealand 1 electorate.
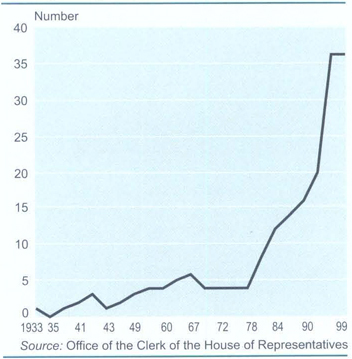
Legislative procedure. The legislative procedure starts in New Zealand when proposed laws are presented to the House of Representatives in the form of draft laws known as ‘bills’. Classes of bills are:
Government bills, which deal with matters of public policy and which are introduced by a minister.
Members’ bills, which deal with matters of public policy and which are introduced by a Member of Parliament who is not a minister.
Local bills, which are promoted by local authorities to give them special powers or validate unlawful actions they may have taken and which affect particular localities.
Private bills, promoted by individuals or bodies (such as companies or trusts) for their particular interest or benefit.
All types of bills follow a similar procedure in the house, with every bill being required by standing orders of the house to be ‘read’ three times. A local bill or a private bill must also comply with prescribed preliminary procedures, which entail advertising the bill before its introduction into the house. The number of members’ bills that may be introduced and proceed at any one time to first reading is limited to four, chosen by ballot.
Under standing orders, a government bill is introduced by the Leader of the House informing the Clerk of the House on any working day, or by 1pm on a sitting day, of the government's intention to introduce the bill. A member's bill or a local bill is introduced after notice of intention to introduce it is given and the bill's introduction has been announced to the house. A private bill is introduced by presentation of a petition for the bill to the house. The bill is then set down for first reading on the third sitting day following. Debate on the first reading is limited to 12 speeches in the case of a government bill, or six speeches of 10 minutes each for other bills, with the member in charge getting a five-minute right of reply.
After its first reading, a bill is referred to a select committee of the house for consideration, unless it is an appropriation bill, an imprest supply bill, or a bill that has been accorded urgency for its passing. Private, local and members’ bills, in certain circumstances, may be introduced while the house is adjourned, deemed read a first time and referred directly to a select committee for consideration.
Select committee consideration of bills provides an opportunity for the public and interested bodies to make submissions in the expectation that better law will result. Committees also carry out scrutiny functions in relation to such matters as estimates, financial reviews and petitions. A committee must finally report to the house on a bill within six months of the bill being referred to it, unless the house extends that time. In its report recommending amendments to a bill, the committee must distinguish between those adopted unanimously by the committee and those adopted by a majority.
Following presentation of a select committee report on a bill, the report is set down for second reading on the third sitting day following. At the conclusion of debate on the report, the house decides whether to agree to the amendments recommended by the select committee by majority. The house then decides whether the bill should be read a second time. The second reading of a bill is directed to the principles and objects of the bill.
A bill to which the house gives a second reading is set down for consideration in a committee of the whole house next sitting day, unless the business committee decides that the bill does not require consideration in committee. In committee, the bill is considered clause by clause or, if so instructed, part by part.
Once a bill has been fully considered by the committee, it is reported to the house with any amendments that have been agreed to. The house having adopted the report, the bill is then set down for third reading next sitting day. Debate on the third reading is limited to 12 speeches of 10 minutes each. After a third reading has been given, a bill that has been passed by the house is forwarded to the governor-general for the Royal Assent. The bill then becomes an Act of Parliament and part of the law of New Zealand.
Sessions of parliament. The first session of the 46th New Zealand Parliament was called following the general election of 27 November 1999 and began sitting on 20 December 1999. It concluded on 18 June 2002.
Parliamentary Service provides administrative support services to Members of Parliament and the House of Representatives and is responsible to the Speaker as Vote Minister and Chairman of the Parliamentary Service Commission.
Under the Parliamentary Service Act 2000, the commission is a policy advisory and consultative body to the Speaker. The act provides that all parties having representation in parliament will be represented on the commission. Formal voting on the commission is proportional to the number of members each party has in the House of Representatives. Representation on the commission is restricted to Members of Parliament. The Leader of the House and the Leader of the Opposition (or their representatives) are specified members of the commission and there are eight other members, including the Speaker as chairman.
Services provided by Parliamentary Service are:
Personal staff to assist Members of Parliament in the parliamentary complex and in their out-of-parliament offices.
Parliamentary information services, library services and computing facilities to Members of Parliament and their staff.
Catering services (Bellamys) for members, staff and guests.
Buildings operations, security, messenger, reception and visitor services within the parliamentary complex.
Personnel, finance and administrative services to Members of Parliament and other agencies operating within the parliamentary complex, including the Office of the Clerk of the House of Representatives and the Parliamentary Counsel Office.
Administering determinations of the Higher Salaries Commission as they relate to salaries and allowances payable to Members of Parliament.
Policy advice to the Speaker and to the Parliamentary Service Commission.
Table 3.4 lists recent parliamentary sessions of the New Zealand House of Representatives.
Table 3.4. Parliamentary sessions
| Parliament | Period of session |
|---|---|
| Source: Office of the Clerk of the House of Representatives | |
| Forty-first | {15 August 1984–12 December 1985 |
| 26 February 1986–21 July 1987 | |
| Forty-second | {16 September 1987–12 December 1989 |
| 14 February 1990–6 September 1990 | |
| Forty-third | {29 November 1990–18 January 1991 |
| 22 January 1991–30 September 1993 | |
| Forty-fourth | 21 December 1993–6 September 1996 |
| Forty-fifth | 12 December 1996–18 October 1999 |
| Forty-sixth | 20 December 1999–18 June 2002 |
Table 3.5 shows a summary of parliamentary proceedings by session.
Table 3.5. Summary of parliamentary proceedings
| Session | |||||
|---|---|---|---|---|---|
| 19901 | 19912 | 1991–933 | 1993–964 | 1996–995 | |
1Second session. 42nd parliament. 2First session, 43rd parliament. 3Second session, 43rd parliament. 444th parliament. 545th parliament. Source: Office of the Clerk of the House of Representatives | |||||
| Sitting days | 56 | 10 | 224 | 203 | 99 |
| Government bills – | |||||
| Introduced | 43 | 12 | 150 | 139 | 191 |
| Referred to select committees | 33 | 9 | 124 | 117 | 152 |
| Enacted | 129 | 9 | 442 | 418 | 371 |
| Members’ bills – | |||||
| Introduced | 3 | – | 31 | 35 | 61 |
| Referred to select committees | 4 | – | 32 | 29 | 26 |
| Enacted | – | – | 6 | 5 | 4 |
| Local bills – | |||||
| Introduced | 5 | – | 25 | 18 | 9 |
| Referred to select committees | 5 | – | 25 | 18 | 9 |
| Enacted | 7 | – | 21 | 18 | 8 |
| Private bills – | |||||
| Introduced | 3 | – | 11 | 11 | 7 |
| Referred to select committees | 3 | – | 11 | 11 | 7 |
| Enacted | 3 | – | 8 | 11 | 9 |
Salaries and allowances of parliamentarians. Salaries and allowances of parliamentarians are set by the Higher Salaries Commission and are shown in table 3.6.
A constituency allowance is paid at a rate dependent on whether the member's electorate is urban, rural, or semi-rural and ranges from $8,000 to $20,000. Every member is paid an allowance of $7,000 a year.
A day allowance of $56 is paid for each day on which a member attends a sitting of parliament or a committee, and a night allowance of up to $160 for each night a member requires overnight accommodation away from home by reason of such attendance. Instead of receiving night allowances for each night spent in Wellington on parliamentary business, a member may elect to receive a Wellington accommodation allowance to cover costs incurred in retaining or maintaining accommodation. The maximum amount that can be claimed in a period of six months is $9,100.
Travel allowances are set out in Parliamentary Salaries and Allowances Determination 2000, published in the statutory regulations series.
Prime Minister of New Zealand Helen Clark.  Helen Clark (1950–) New Zealand's first elected woman prime minister, Helen Clark, was born in Hamilton in 1950. She grew up on a Waikato farm and was educated at Epsom Girls’ Grammar School (Auckland) and the University of Auckland. It was there, in 1971, that she joined the Labour Party. She graduated MA (Hons) in 1974. From 1973 to 1975, Clark was a junior lecturer in political studies at Auckland University, becoming a lecturer in 1977. After unsuccessfully contesting the Piako seat in 1975, she was elected Labour Member of Parliament for Mt Albert in 1981. Clark convened the Government Caucus Committee on External Affairs and Security from 1984 to 1987 and was Minister of Conservation and Minister of Housing from 1987 to 1989. She became Minister of Health in January 1989 and Minister of Labour and deputy prime minister in August that year. As a minister, she chaired the Cabinet Social Equity Committee and served on seven other cabinet committees. Clark has also chaired two select committees, foreign affairs and defence, and disarmament and arms control. Following the Labour government's defeat in October 1990, Clark became deputy leader of the opposition. Three years later, on 1 December 1993, she succeeded Mike Moore as Labour's parliamentary leader and leader of the opposition. When Labour was able to form a government after the second MMP election on 27 November 1999, Clark became Prime Minister of New Zealand. She is also Minister for Arts, Culture and Heritage, and for the Security Intelligence Service. She has wide-ranging interests. As well as serving for many years on the Labour Party's New Zealand executive, Clark has been president of the Labour Youth Council, an executive member of the party's Auckland regional council, secretary of the Labour Women's Council and a member of the policy council. She has also represented the party at Socialist International congresses and conferences overseas. In 1986, Clark was awarded the annual peace prize of the Danish Peace Foundation for her work in promoting international peace and disarmament. She is married to Peter Davis and her leisure activities include reading, music and theatre. Sources: Prime Minister's Office and Virginia Myers’ Head and Shoulders. |
Table 3.6. Parliamentary and ministerial salaries and allowances
| Annual salary or allowance payable from 1 July 2000 to 30 June 200111 | from 1 July 2001 | |
|---|---|---|
1Parliamentary Salaries and Allowances Determination (S.R. 2000/246). Source: Office of the Clerk of the House of Representatives | ||
| Salaries – | $ | |
| Members of the Executive – | ||
| Prime Minister | 222,400 | 231,400 |
| Deputy Prime Minister | 165,200 | 172,300 |
| Minister of the Crown in Cabinet | 149,200 | 154,900 |
| Minister of the Crown with portfolio outside | ||
| Cabinet | 132,600 | 137,000 |
| Ministers without portfolio | 110,000 | 110,000 |
| Parliamentary Under-Secretary | 107,000 | 107,000 |
| Officers of the House of Representatives – | ||
| Speaker | 149,200 | 154,900 |
| Deputy Speaker | 109,000 | 111,000 |
| Assistant Speaker | 92,200 | 94,000 |
| Chairpersons of Select Committees | 91,500 | 94,000 |
| Deputy Chairpersons of Select Committees | 86,000 | 88,000 |
| Leader of the Opposition and other party leaders – | ||
| Leader of the Opposition | 149,200 | 154,900 |
| Leader of other parties (depending on number of MPs) | 92,300+ | 95,400+ |
| Deputy leader of party with 35 MPs or more | 102,000 | 105,000 |
| Whips – | ||
| Senior Government Whip | 97,700+ | 100,000+ |
| Other Whips (depending on number of MPs) | 91,500 | +94,000 |
| Other Members of Parliament – | ||
| Member of Parliament | 85,000 | 87,000 |
| Allowances – | ||
| Prime Minister | 29,500 | 29,500 |
| Deputy Prime Minister | 13,000 | 13,000 |
| Minister of the Crown | 12,000 | 12,000 |
| Parliamentary Under-Secretary | 9,500 | 9,500 |
| Minister of Foreign Affairs and Trade (additional) | 6,000 | 6,000 |
| Speaker – basic expenses allowance | 12,000 | 12,000 |
| –additional allowance | 8,500 | 8,500 |
| Deputy Speaker – basic expenses allowance | 9,500 | 9,500 |
| –additional allowance | 7,500 | 7,500 |
| Assistant Speaker – basic expenses allowance | 7,000 | 7,000 |
| –additional allowance | 1,000 | 1,000 |
| Leader of the Opposition – basic expenses allowance | 12,000 | 12,000 |
| Leaders of other parties (depending on number of MPs) | 7,000–10,000 | |
| Deputy Leader – basic expenses allowance | 7,000 | 7,000 |
| additional allowance | 2,000 | 2,000 |
| Constituency Members – basic expenses allowance | 7,000 | 7,000 |
| constituency allowance (depending on classification of electoral district) | 8,000–20,000 | |
| List Members | 7,000 | 7,000 |
Table 3.7 lists Members of the House of Representatives during the 46th parliament.
Table 3.7. House of Representatives, 46th parliament
Prime Minister – Rt Hon Helen Clark Leader of the Opposition – Rt Hon Jenny Shipley; – Hon Bill English (from 9 October 2001) Speaker – Rt Hon Jonathan Hunt Deputy Speaker – Geoffrey Braybrooke Clerk of the House – D G McGee | ||||
|---|---|---|---|---|
| Member1 | Year of birth | Previous occupation | Electorate/list | Party |
1Names are given by which individual members prefer to be addressed. 2Declared elected 14 March 2000, replacing Rt Hon Don McKinnon. 3Resigned with effect from 6 March 2000. 4Declared elected 12 January 2001. replacing Rt Hon Simon Upton. 5Resigned with effect from 11 January 2001. Source: Office of the Clerk of the House of Representatives | ||||
| Anderton, Hon Jim | 1938 | Company director | Wigram | Alliance |
| Anae, Arthur2 | 1945 | Managing director | list | National |
| Ardern, Shane | 1960 | Farmer | Taranaki/King Country | National |
| Awatere Huata, Donna | 1949 | Māori development consultant | list | ACT |
| Barker, Rick | 1951 | Trade unionist | Tukituki | Labour |
| Barnett, Tim | 1958 | Vol. sector manager | Christchurch Central | Labour |
| Benson-Pope, David | 1950 | Teacher | Dunedin South | Labour |
| Beyer, Georgina | 1957 | Mayor | Wairarapa | Labour |
| Bradford, Hon Max | 1942 | Administrator, consultant | list | National |
| Bradford, Sue | 1952 | Community development worker | list | Green |
| Braybrooke, Geoff | 1935 | Sales manager | Napier | Labour |
| Brown, Peter | 1939 | Company director | list | NZF |
| Brownlee, Gerry | 1956 | Teacher | Ilam | National |
| Bunkle, Phillida | 1944 | University lecturer | list | Alliance |
| Burton, Hon Mark | 1956 | Community education organiser | Taupo | Labour |
| Campbell, Kevin | 1949 | Barrister and solicitor | list | Alliance |
| Carter, Chris | 1952 | Electorate secretary | Te Atatu | Labour |
| Carter, Hon David | 1952 | Businessman, farmer | list | National |
| Carter, John | 1950 | Local government officer | Northland | National |
| Chadwick, Steve | 1949 | Nurse/midwife | Rotorua | Labour |
| Clark, Rt Hon Helen | 1950 | University lecturer | Mt Albert | Labour |
| Cosgrove, Clayton | 1970 | Public relations executive | Waimakariri | Labour |
| Creech, Rt Hon Wyatt | 1946 | Accountant | list | National |
| Cullen, Hon Dr Michael | 1945 | University lecturer | list | Labour |
| Cunliffe, David | 1963 | Management consultant | Titirangi | Labour |
| Dalziel, Hon Lianne | 1960 | Trade unionist | Christchurch East | Labour |
| Donald, Rod | 1957 | Vol. sector administrator | list | Alliance |
| Donnelly, Hon Brian | 1949 | School principal | list | NZF |
| Duncan, Helen | 1941 | Teacher, trade unionist | list | Labour |
| Dunne, Hon Peter | 1954 | Deputy chief executive officer | Ohariu/Belmont | United |
| Duynhoven, Harry | 1955 | Teacher | New Plymouth | Labour |
| Dyson, Hon Ruth | 1957 | Employment consultant | Banks Peninsula | Labour |
| Eckhoff, Gerrard | 1947 | Farmer | list | ACT |
| English, Hon Bill | 1961 | Farmer | Clutha/Southland | National |
| Ewen-Street, Ian | 1950 | Organic farmer | list | Green |
| Field, Taito Phillip | 1952 | Trade unionist | Mangere | Labour |
| Fitzsimons, Jeanette | 1945 | Organic farmer, environmental consultant | Coromandel | Green |
| Franks, Stephen | 1951 | Barrister and solicitor | list | ACT |
| Gallagher, Martin | 1952 | Company director, teacher | Hamilton West | Labour |
| Gillon, Grant | 1954 | Engineer | list | Alliance |
| Goff, Hon Phil | 1953 | University lecturer | Mt Roskill | Labour |
| Gordon, Liz | 1955 | University lecturer | list | Alliance |
| Gosche, Hon Mark | 1955 | Trade unionist | list | Labour |
| Harré, Hon Laila | 1966 | Barrister and solicitor | list | Alliance |
| Hartley, Ann | 1942 | Real estate agent | Northcote | Labour |
| Hasler, Hon Marie | 1948 | Businesswoman | list | National |
| Hawke, Joe | 1940 | Marae worker, housing consultant | list | Labour |
| Hawkins, Hon George | 1946 | Teacher | Manurewa | Labour |
| Heatley, Philip | 1967 | Engineer | Whangarei | National |
| Herlihy, Gavan | 1947 | Farmer | Otago | National |
| Hide, Rodney | 1956 | Economic consultant | list | ACT |
| Hobbs, Hon Marian | 1947 | Teacher | Wellington Central | Labour |
| Hodgson, Hon Pete | 1950 | Veterinarian | Dunedin North | Labour |
| Horomia, Hon Parekura | 1950 | Public servant, farmer | Ikaroa-Rawhiti | Labour |
| Hunt, Rt Hon Jonathan | 1938 | Teacher | list | Labour |
| Hutchison, Dr Paul | 1947 | Gynecologist | Port Waikato | National |
| Jackson, Willie | 1961 | Trade unionist | list | Alliance |
| Jennings, Owen | 1945 | Farmer | list | ACT |
| Keall, Judy | 1942 | Consultant | Otaki | Labour |
| Kedgley, Sue | 1948 | Author, local authority member | list | Green |
| Kelly, Graham | 1941 | Trade unionist | Mana | Labour |
| Kidd, Hon Doug | 1941 | Barrister and solicitor | list | National |
| King, Hon Annette | 1945 | Chief executive officer | Rongotai | Labour |
| Kyd, Warren | 1939 | Barrister and solicitor | Hunua | National |
| Laban, Luamanuvao Winnie | 1955 | Family therapist | list | Labour |
| Lee, Hon Sandra | 1952 | Local authority member | list | Alliance |
| Locke, Keith | 1945 | Retail manager | list | Green |
| Luxton, Hon John | 1946 | Farmer | Karapiro | National |
| Mackey, Janet | 1953 | Real estate agent | Mahia | Labour |
| McCully, Hon Murray | 1953 | Public relations consultant | Albany | National |
| McKinnon, Rt Hon Don3 | 1939 | Real estate agent | list | National |
| Maharey, Hon Steve | 1953 | University lecturer | Palmerston North | Labour |
| Mahuta, Nanaia | 1970 | Archivist librarian | Te Tai Hauauru | Labour |
| Mallard, Hon Trevor | 1954 | Executive assistant | Hutt South | Labour |
| Mapp, Dr Wayne | 1952 | Law lecturer | North Shore | National |
| Mark, Ron | 1954 | Businessman, ex army officer | list | NZF |
| Neeson, Brian | 1945 | Real estate agent | Waitakere | National |
| Neill, Alec4 | 1950 | Barrister and solicitor | list | National |
| Newman, Dr Muriel | 1950 | Tertiary and secondary teacher, business | list | ACT |
| O’Connor, Damien | 1958 | Tourism operator | West Coast/Tasman | Labour |
| Okeroa, Mahara | 1946 | Regional director | Te Tai Tonga | Labour |
| Peck, Mark | 1953 | Trade unionist | Invercargill | Labour |
| Peters, Rt Hon Winston | 1945 | Barrister and solicitor | Tauranga | NZF |
| Pettis, Jill | 1952 | Education administrator | Wanganui | Labour |
| Power, Simon | 1970 | Barrister and solicitor | Rangitikei | National |
| Prebble, Hon Richard | 1948 | Barrister and solicitor | list | ACT |
| Rich, Katherine | 1968 | Businesswoman | list | National |
| Ririnui, Mita | 1951 | Minister of religion | Waiariki | Labour |
| Robertson, H V Ross | 1949 | Industrial engineer | Manukau East | Labour |
| Robson, Hon Matt | 1950 | Barrister and solicitor | list | Alliance |
| Roy, Eric | 1948 | Farmer/company director | list | National |
| Ryall, Hon Tony | 1964 | Accountant | Bay of Plenty | National |
| Samuels, Hon Dover | 1939 | Company director | list | Labour |
| Scott, Lynda | 1956 | Geriatrician | Kaikoura | National |
| Shipley, Rt Hon Jenny | 1952 | Farmer | Rakaia | National |
| Shirley, Hon Ken | 1950 | Executive director | list | ACT |
| Simcock, Bob | 1946 | Deer farmer | list | National |
| Simich, Hon Clem | 1939 | General manager | Tamaki | National |
| Smith, Hon Dr Lockwood | 1948 | Managing director | Rodney | National |
| Smith, Hon Nick | 1964 | Engineer | Nelson | National |
| Sowry, Hon Roger | 1958 | Retail manager | list | National |
| Steel, Tony | 1941 | Teacher | Hamilton East | National |
| Sutton, Hon Jim | 1941 | Farmer | Aoraki | Labour |
| Swain, Hon Paul | 1951 | Trade unionist | Rimutaka | Labour |
| Tamihere, John | 1960 | Chief executive, barrister and solicitor | Hauraki | Labour |
| Tanczos, Nandor | 1966 | Business owner/director | list | Green |
| te Heuheu, Hon Georgina | 1943 | Consultant, advocate Treaty issues | list | National |
| Tich, Lindsay | 1947 | Management consultant | Karapiro | National |
| Tizard, Hon Judith | 1956 | Electorate secretary | Auckland Central | Labour |
| Tolley, Anne | 1953 | Businesswoman | list | National |
| Turia, Hon Tariana | 1944 | Iwi development worker | list | Labour |
| Upton, Rt Hon Simon5 | 1958 | Student, teacher | list | National |
| Vernon, Belinda | 1958 | Financial controller | Maungakiekie | National |
| Webster, Penny | 1947 | Farmer, teacher | list | ACT |
| Williamson, Hon Maurice | 1951 | Planning analyst | Pakuranga | National |
| Wilson, Hon Margaret | 1947 | University lecturer | list | Labour |
| Wong, Pansy | 1955 | Accountant | list | National |
| Woolerton, R Doug | 1944 | Farmer | list | NZF |
| Worth, Richard | 1948 | Barrister and solicitor | Epsom | National |
| Wright, John | 1945 | Motor mechanic | list | Alliance |
| Yates, Dianne | 1943 | Education officer | list | Labour |
| Young, Annabel | 1956 | Business advisor | list | National |
Table 3.8 lists New Zealand's premiers and prime ministers.
Table 3.8. Premiers and prime ministers
| Premier/Prime minister1 | Term(s) of office | |
|---|---|---|
1Honours are specified only if held on retirement from office. Source: Office of the Clerk of the House of Representatives | ||
| Premiers | ||
| Henry Sewell | 7 May 1856–20 May 1856 | |
| William Fox | 20 May 1856–2 Jun 1856 | |
| 12 Jul 1861–6 Aug 1862 | ||
| 28 Jun 1869–10 Sep 1872 | ||
| 3 Mar 1873–8 Apr 1873 | ||
| Edward William Stafford | 2 Jun 1856–12 Jul 1861 | |
| 16 Oct 1865–28 Jun 1869 | ||
| 10 Sep 1872–11 Oct 1872 | ||
| Alfred Domett | 6 Aug 1862–30 Oct 1863 | |
| Frederick Whitaker, MIX | 30 Oct 1863–24 Nov 1864 | |
| 21 Apr 1882–25 Sep 1883 | ||
| Frederick Aloysius Weld | 24 Nov 1864–16 Oct 1865 | |
| George Marsden Waterhouse, MLC | 11 Oct 1872–3 Mar 1873 | |
| Sir Julius Vogel, KCMG | 8 Apr 1873–6 Jul 1875 | |
| 15 Feb 1876–1 Sep 1876 | ||
| Daniel Pollen, MLC | 6 Jul 1875–15 Feb 1876 | |
| 1 Sep 1876–13 Sep 1876 | ||
| Sir Harry Albert Atkinson, KCMG | 13 Sep 1876–13 Oct 1877 (ministry reconstructed) | |
| 25 Sep 1883–16 Aug 1884 | ||
| 28 Aug 1884–3 Sep 1884 | ||
| 8 Oct 1887–24 Jan 1891 | ||
| Sir George Grey, KCB | 13 Oct 1877–8 Oct 1879 | |
| John Hall | 8 Oct 1879–21 Apr 1882 | |
| Sir Robert Stout, KCMG | 16 Aug 1884–28 Aug 1884 | |
| 3 Sep 1884–8 Oct 1887 | ||
| John Ballance | Liberal | 24 Jan 1891–d 27 Apr 1893 |
| Rt Hon Richard John Seddon | Liberal | 1 May 1893–d 10 Jun 1906 |
| Prime ministers | ||
| William Hall-Jones | Liberal | 21 Jun 1906–6 Aug 1906 |
| Rt Hon Sir Joseph George Ward, Bt, KCMG | Liberal | 6 Aug 1906–28 Mar 1912 |
| United | 10 Dec 1928–28 May 1930 | |
| Thomas MacKenzie | Liberal | 28 Mar 1912–10 Jul 1912 |
| Rt Hon William Ferguson Massey | Reform | 10 Jul 1912–12 Aug 1915 |
| National | 12 Aug 1919–d 10 May 1925 | |
| Sir Francis Henry Dillon Bell, GCMG, KC, MLC | Reform | 14 May 1925–30 May 1925 |
| Rt Hon Joseph Gordon Coates, MC | Reform | 30 May 1925–10 Dec 1928 |
| Rt Hon George William Forbes | United | 28 May 1930–22 Sep 1931 |
| Coalition | 22 Sep 1931–6 Dec 1935 | |
| Rt Hon Michael Joseph Savage | Labour | 6 Dec 1935–d 27 Mar 1940 |
| Rt Hon Peter Fraser, CH | Labour | 1 Apr 1940–13 Dec 1949 |
| Rt Hon Sidney George Holland, CH | National | 13 Dec 1949–20 Sep 1957 |
| Rt Hon Sir Keith Jacka Holyoake, GCMG, CH | National | 20 Sep 1957–12 Dec 1957 |
| 12 Dec 1960–7 Feb 1972 | ||
| Rt Hon Walter Nash, CH | Labour | 12 Dec 1957–12 Dec 1960 |
| Rt Hon John Ross Marshall (later Sir) | National | 7 Feb 1972–8 Dec 1972 |
| Rt Hon Norman Eric Kirk | Labour | 8 Dec 1973–d 31 Aug 1974 |
| Rt Hon Wallace Edward Rowling (later Sir) | Labour | 6 Sep 1974–12 Dec 1975 |
| Rt Hon Sir Robert David Muldoon, GCMG, CH | National | 12 Dec 1975–26 Jul 1984 |
| Rt Hon David Russell Lange | Labour | 26 Jul 1984–8 Aug 1989 |
| Rt Hon Geoffrey Winston Russell Palmer (later Sir) | Labour | 8 Aug 1989–4 Sep 1990 |
| Rt Hon Michael Kenneth Moore | Labour | 4 Sep 1990–2 Nov 1990 |
| Rt Hon James Brendan Bolger | National | 2 Nov 1990–12 Oct 1996 |
| Coalition | 12 Oct 1996–8 Dec 1997 | |
| Rt Hon Jennifer Mary Shipley | Coalition | 8 Dec 1997–10 Dec 1999 |
| Rt Hon Helen Clark | Labour | 10 Dec 1999– |
The executive government of New Zealand is carried out on behalf of the Sovereign (represented by the governor-general) by Ministers of the Crown who make up membership of the cabinet and the Executive Council. Ministers are responsible to parliament for their official actions by constitutional convention, and are required to be Members of Parliament by the Constitution Act 1986.
After a general election, the governor-general invites the leader of the party, or parties, with the confidence of the House of Representatives to accept office as prime minister and form a government. On the new prime minister's advice, the governor-general appoints a number of Members of Parliament ministers, generally with responsibilities for various areas of government administration (portfolios). The governor-general may also appoint parliamentary under-secretaries, who are not ministers and not members of the Executive Council, to assist ministers.
Cabinet and the Executive Council. The cabinet and the Executive Council have separate functions. All ministers are members of the Executive Council, but not all ministers are in cabinet. The Executive Council is a formal body with formal functions, whereas cabinet is an informal body with deliberative functions. The Executive Council tenders advice to the governor-general on the basis of policy formulated in cabinet. The council is established under Clause VII of the Letters Patent and is the main vehicle for law-making by the executive. Authority to make statutory regulations, for example, is delegated by parliament to the governor-general in council.
The cabinet is, in effect, the highest policy making body of government. It is the main vehicle by which the executive decides on major policy issues and legislative proposals, and it coordinates the work of ministers. The cabinet has a system of committees, which can examine subjects in detail and recommend specific policy measures to cabinet. Proceedings of cabinet are informal and confidential, and decisions are usually made by consensus. By convention, cabinet accepts collective responsibility for its decisions, which ensures that, unless the matter is agreed to be one of party differentiation, once a decision is made, it will be publicly supported by all members of the government.
The Cabinet Office provides support services for the cabinet and its committees. The current Secretary of the Cabinet is also Clerk of the Executive Council.
The makeup of the New Zealand Government at 15 October 2001 is shown in table 3.9.
Table 3.9. New Zealand Government, at 15 October 2001
| Source: Cabinet Office |
|---|
| Governor-General: |
| Her Excellency The Honourable Dame Silvia Cartwright, PCNZM, DBE (assumed office 4 April 2001). Official Secretary: Hugo Judd. CVO |
| Executive Council: |
| Membership of the Executive Council comprises all ministers with the governor-general presiding. The Clerk of the Executive Council is Marie Shroff, CVO. |
| The Cabinet: |
| 1 Rt Hon Helen Clark, Prime Minister, Minister for Arts, Culture and Heritage, Minister Responsible for Ministerial Services, Minister in Charge of the NZ Security Intelligence Service. |
| 2 Hon Jim Anderton, Deputy Prime Minister, Minister for Economic Development, Minister for Industry and Regional Development, Minister in Charge of the Public Trust Office. |
| 3 Hon Dr Michael Cullen, Treasurer, Minister of Finance [includes responsibility for the Government Superannuation Fund], Minister of Revenue, Leader of the House. |
| 4 Hon Steve Maharey, Minister of Social Services and Employment, Associate Minister of Education (Tertiary Education), Minister for the Community and Voluntary Sector. |
| 5 Hon Phil Goff, Minister of Foreign Affairs and Trade, Minister of Justice. |
| 6 Hon Annette King, Minister of Health, Minister for Racing. |
| 7 Hon Sandra Lee, Minister of Conservation, Minister of Local Government, Associate Minister of Māori Affairs. |
| 8 Hon Jim Sutton, Minister of Agriculture, Minister for Biosecurity, Minister for Trade Negotiations, Minister for Rural Affairs. |
| 9 Hon Trevor Mallard, Minister of Education, Minister of State Services, Minister for Sport, Fitness and Leisure, Minister for the America's Cup, Associate Minister of Finance, Minister Responsible for the Education Review Office, Minister for Adult and Community Education. |
| 10 Hon Pete Hodgson, Minister of Energy, Minister of Fisheries, Minister of Forestry, Minister of Research, Science and Technology, Minister for Crown Research Institutes, Minister for Small Business, Associate Minister for Economic Development, Associate Minister for Industry and Regional Development, Associate Minister of Foreign Affairs and Trade, Minister Responsible for Timberlands West Coast Ltd. |
| 11 Hon Margaret Wilson, Attorney-General [includes responsibility for Serious Fraud Office], Minister of Labour, Minister in Charge of Treaty of Waitangi Negotiations, Minister Responsible for the Law Commission, Associate Minister of Justice, Associate Minister of State Services. |
| 12 Hon Parekura Horomia, Minister of Māori Affairs, Associate Minister of Social Services and Employment (Employment), Associate Minister of Education, Associate Minister of Fisheries, Associate Minister of Tourism. |
| 13 Hon Matt Robson, Minister of Corrections, Minister for Courts, Minister for Disarmament and Arms Control, Minister for Land Information, Associate Minister of Foreign Affairs and Trade (Official Development Assistance). |
| 14 Hon Lianne Dalziel, Minister for Accident Insurance, Minister of Immigration, Minister for Senior Citizens, Associate Minister of Education. |
| 15 Hon George Hawkins, Minister of Police, Minister of Internal Affairs, Minister of Civil Defence, Minister for Ethnic Affairs. |
| 16 Hon Mark Burton, Minister of Defence, Minister for SOEs [responsible for all SOEs except TVNZ Ltd and Timberlands West Coast Ltd], Minister of Tourism, Minister of Veterans’ Affairs, Deputy Leader of the House. |
| 17 Hon Paul Swain, Minister of Commerce, Minister of Communications, Minister for Information Technology, Associate Minister of Finance, Associate Minister of Revenue, Associate Minister of Energy, Associate Minister of Justice, Associate Minister for Land Information. |
| 18 Hon Marian Hobbs, Minister for the Environment, Minister of Broadcasting [includes responsibility for Television New Zealand Ltd, Radio New Zealand Ltd, and NZ on Air], Minister Responsible for Archives New Zealand, Associate Minister for Biosecurity, Associate Minister of Education, Minister Responsible for the National Library. |
| 19 Hon Mark Gosche, Minister of Transport, Minister of Housing [includes responsibility for Housing New Zealand Corporation], Minister of Pacific Island Affairs, Minister Responsible for Civil Aviation. |
| 20 Hon Laila Harré, Minister of Women's Affairs, Minister of Youth Affairs, Minister of Statistics, Associate Minister of Commerce, Associate Minister of Labour. |
| Ministers outside Cabinet: |
| 21 Hon Judith Tizard, Minister of State, Associate Minister for Arts, Culture and Heritage, Associate Minister of Transport, Minister Assisting the Prime Minister on Auckland Issues. |
| 22 Hon Ruth Dyson, Minister of State, Minister for Disability Issues, Associate Minister for Accident Insurance, Associate Minister of Health, Associate Minister of Social Services and Employment. |
| 23 Hon Tariana Turia, Minister of State, Associate Minister of Māori Affairs (Social Development), Associate Minister of Corrections, Associate Minister of Health, Associate Minister of Housing, Associate Minister of Social Services and Employment (Social Services). |
| Parliamentary Under-Secretaries: |
| Hon Dover Samuels, MP, Parliamentary Under-Secretary to the: Minister for Economic Development, Minister for Industry and Regional Development. |
| Mr John Wright, MP, Parliamentary Under-Secretary to the: Minister for Economic Development, Minister for Industry and Regional Development, Minister of Revenue, Minister for Racing. |
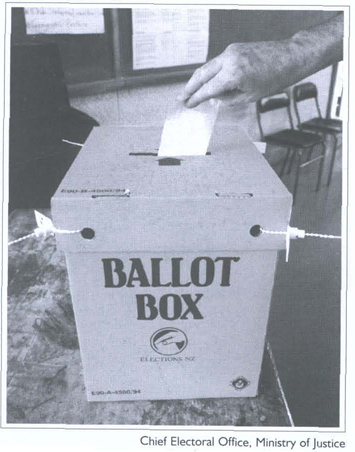
An elector casts a vote in the general election.
People 18 years and over have the right to vote in New Zealand's parliamentary elections. Enrolment as an elector is compulsory, but voting is not. To qualify for enrolment people must:
Be at least 18 years old.
Be New Zealand citizens or permanent residents.
Have lived continuously in New Zealand for at least a year at some time.
Have last lived continuously for one month in the electorate they are to be enrolled in.
Māori and people of Māori descent may choose to enrol for either a Māori or a general electorate, but may make the choice only at certain times. Māori may make the choice the first time they enrol or at the time of the five-yearly Māori option exercise, which occurs normally during the time of a census. There was a Māori option exercise in 2001. At that time, all registered and identified Māori electors were sent a form for the purpose of exercising their choice.
Electoral rolls are maintained by the electoral enrolment centre, a division of New Zealand Post.
Voting patterns in recent general elections are shown in table 3.10.
Table 3.1. Voting patterns: 1981–1999
| Year | Electors on master roll | Valid votes | Informal votes | Special votes disallowed | Percentage of votes cast to electors on master roll |
|---|---|---|---|---|---|
1Party votes rather than electorate votes. 2There were 2,047,473 valid electorate votes cast in 1999, and 37,908 informal electorate votes. Source: Ministry of Justice | |||||
| 1981 | 2,034,747 | 1,801,303 | 8,998 | 50,263 | 91.44 |
| 1984 | 2,111,651 | 1,929,201 | 7,565 | 42,032 | 93.71 |
| 1987 | 2,114,656 | 1,831,777 | 11,184 | 40,433 | 89.06 |
| 1990 | 2,202,157 | 1,824,092 | 10,180 | 42,843 | 85.24 |
| 1993 | 2,321,664 | 1,922,796 | 11,364 | 43,932 | 85.20 |
| 1996 | 2,418,587 | 2,072,3591 | 8,1831 | 54,633 | 88.28 |
| 1999 | 2,509,365 | 2,065,4941,2 | 19,8871,2 | 41,884 | 84.77 |
Voting. The conduct of polls is the responsibility of the Chief Electoral Office of the Ministry of Justice and is controlled by a returning officer in each electorate who arranges voting facilities and staff, conducts the election, supervises counting of votes and declares the result. Only people whose names are validly enrolled before an election are qualified to vote. Most electors cast their votes at polling booths in their electorates on polling day, but they may vote as special voters at booths outside their electorate. Special votes may also be cast before polling day at issuing offices or at home because of sickness, travel or similar reasons. Provision is also made for voting overseas. Voting is by secret ballot. A preliminary count of ordinary votes is available for each electorate on election night and final results are normally available a fortnight later, once special and overseas votes have been received and counted.
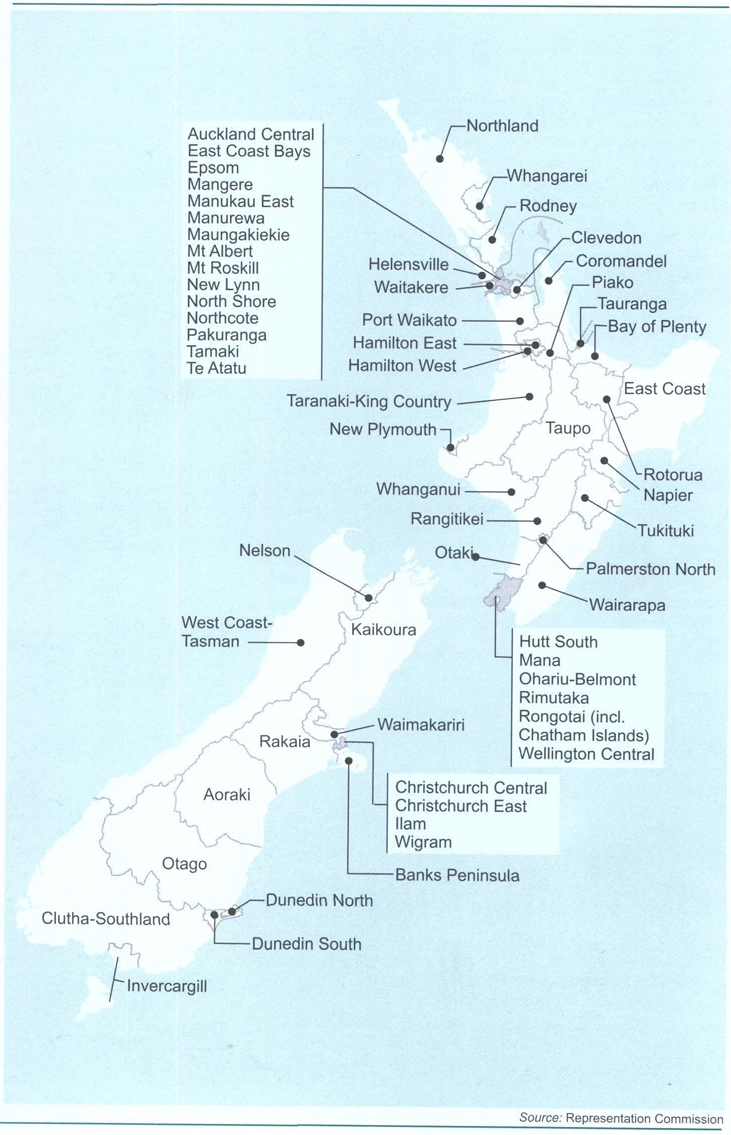
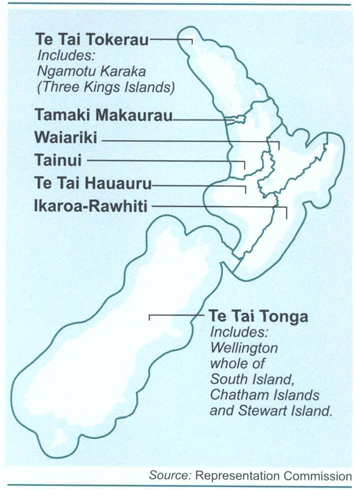
Electoral boundaries. The boundaries of electorates are revised every five years after the Census of Population and Dwellings, and the new boundaries come into effect at the expiry of the parliamentary term during which the revision is finalised. The revision is based on figures for the electoral population provided by Statistics New Zealand. Electoral boundaries are defined by the Representation Commission, which has seven members: a chairperson; four officials (the Surveyor-General, the Government Statistician, the Chief Electoral Officer, and the Chairman of the Local Government Commission); and two members nominated by parliament to represent the government and the opposition. Figures 3.2 and 3.3 show the 2002 electoral boundaries for the general and Māori electoral districts. The internet can be used to identify the appropriate electorate for a given street address (see sidebar below the map of Māori electorates).
Table 3.11 shows votes and percentages obtained by the various political parties in recent general elections.
Table 3.11. General elections – votes for political parties
| Political party | Valid votes | Percentage of total valid votes | ||||||||
|---|---|---|---|---|---|---|---|---|---|---|
| 1987 | 1990 | 1993 | 19961 | 1999 | 1987 | 1990 | 1993 | 1996 | 1999 | |
1Party votes. 2Christian Coalition 1996. Source: Ministry of Justice | ||||||||||
| ACT | – | – | – | 126,442 | 145,493 | – | – | – | 6.10 | 7.04 |
| Alliance | – | – | 350,064 | 209,347 | 159,859 | – | – | 18.21 | 10.10 | 7.74 |
| Christian Heritage2 | – | – | 38,749 | 89,716 | 49,154 | – | – | 2.02 | 4.33 | 2.38 |
| Democrats | 105,091 | 30,455 | – | – | – | 5.74 | 1.67 | – | – | – |
| Green | – | 124,915 | – | – | 106,560 | – | 6.85 | – | –5.16 | |
| Labour | 878,448 | 640,915 | 666,759 | 584,159 | 800,199 | 47.96 | 35.14 | 34.68 | 28.19 | 38.74 |
| Mana Motuhake | 9,789 | 10,869 | – | – | – | 0.53 | 0.60 | – | – | – |
| National | 806,305 | 872,358 | 673,892 | 701,315 | 629,932 | 44.02 | 47.82 | 35.05 | 33.84 | 30.50 |
| New Labour | – | 94,171 | – | – | – | – | 5.16 | – | – | – |
| New Zealand First | – | – | 161,481 | 276,603 | 87,926 | – | – | 8.40 | 13.35 | 4.26 |
| United New Zealand | – | – | – | 18,245 | 11,065 | – | – | – | 0.88 | 0.54 |
| Other | 32,144 | 50,409 | 31,851 | 66,532 | 75,306 | 1.75 | 2.76 | 1.66 | 3.21 | 3.64 |
| Total valid votes | 1,831777 | 1,824,092 | 1,922,796 | 2,072,359 | 2,065,494 | 100.00 | 100.00 | 100.00 | 100.00 | 100.00 |
| Informal votes | 11,184 | 10,180 | 11,364 | 8,183 | 19,887 | ... | ... | ... | ... | ... |
| Total | 1,842,961 | 1,834,272 | 1,934,160 | 2,080,542 | 2,085,381 | ... | ... | ... | ... | ... |
When determining boundaries of the Māori electoral districts, the commission is joined by the Chief Executive Officer of Te Puni Kōkiri and two Māori who are not public servants directly concerned with the administration of the Electoral Act or Members of the House of Representatives and who are selected by the parties. These two are nominated by parliament to represent the government and the opposition. After proposed boundaries are drawn up and published, objections and counter-objections are considered by the commission, which makes a final decision.
Under the Electoral Act 1993, the South Island is allocated 16 general electorates. The numbers of North Island general and of Māori electorates are then calculated so that their electoral populations are approximately the same as those for South Island general electorates. The commission is also required to give consideration to community of interest, facilities of communications, topographical features and any projected variation in the general electoral population of the electorates.
Based on the South Island general electoral population of 868,923, the South Island general electorate quota for the 2002 general election was 54,308, resulting in 46 North Island general electorates (quota 54,296) and 7 Māori electorates (quota 53,099). All electorates have an allowance of 5 percent above or below their electoral population quota.
General election voting. There were 2,509,365 electors on the master roll for the 1999 general election. A total of 2,085,381 votes were cast, representing a turnout of 83.10 percent of electors on the master roll. Figure 3.4 shows the percentage of enrolled voters voting in general elections from 1879 to 1999.
General licensing poll. The national triennial liquor licensing poll was abolished in 1990. Three local restoration poll votes were held at the same time as the 1999 general election, in Eden, Roskill and Tawa. Local restoration received a majority in all three no-licence districts.
Party affiliations of Members of Parliament elected in recent general elections are shown in table 3.12.
Figure 3.4. Voter turnout
Percentage of enrolled
electors1 voting at general elections
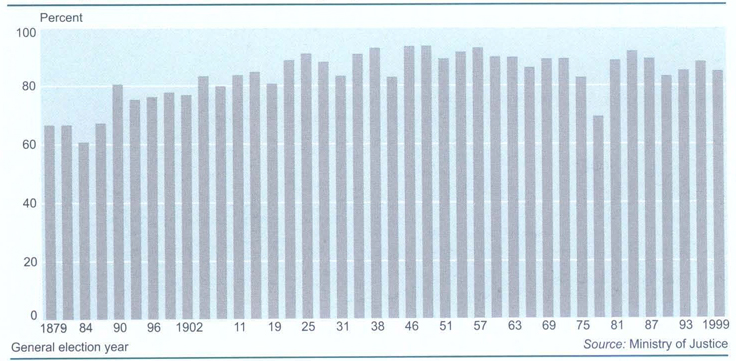
1Excludes Māori population before 1951.
Table 3.12. General election results1
| Political party | Number of MPs | |||||
|---|---|---|---|---|---|---|
| 1984 | 19872 | 1990 | 1993 | 1996 | 1999 | |
1The election dates were: 14 July 1984, 15 August 1987, 27 October 1990, 6 November 1993, 12 October 1996, 27 November 1999. 2Includes result of electoral petition which was upheld and saw the Wairarapa seat pass from Labour to National in July 1988. Source: Ministry of Justice | ||||||
| ACT | – | – | – | – | 8 | 9 |
| Alliance | – | – | – | 2 | 13 | 10 |
| Democrats | 2 | – | – | – | – | – |
| Green Party | – | – | – | – | – | 7 |
| Labour | 56 | 57 | 29 | 45 | 37 | 49 |
| National | 37 | 40 | 67 | 50 | 44 | 39 |
| New Labour | – | – | 1 | – | – | – |
| New Zealand First | – | – | – | 2 | 17 | 5 |
| United New Zealand | – | – | – | – | 1 | 1 |
The state sector comprises all organisations included in the annual financial statements of the Crown. These include:
The New Zealand Public Service – departments and ministries listed in the first schedule to the State Sector Act 1988. At 31 July 2001, there were 38 departments/ministries in the public service.
Departments outside the public service – departments in terms of the Public Finance Act 1989, but not listed in the first schedule to the State Sector Act 1988 and, consequently, not part of the public service. At 31 July 2001, there were seven departments outside the public service: New Zealand Defence Force; New Zealand Police; Office of the Clerk; Parliamentary Counsel Office; Parliamentary Service; New Zealand Security Intelligence Service; and the Government Communications Security Bureau.
State-owned enterprises (SOEs) – companies listed in the first schedule to the State-Owned Enterprises Act 1986. At 31 July 2001, there were 17 SOEs.
Crown entities – organisations listed in the fourth schedule to the Public Finance Act 1989. Crown entities make up a significant part of the state sector and include a wide variety of statutory corporations, statutory boards, statutory offices, Crown companies and trusts. At 31 July 2001, Crown entities included 66 separate legal entities, as well as 21 district health boards, 33 reserves boards, 14 fish and game councils, 37 tertiary education institutions, 2,624 schools, 14 Crown-owned companies that included nine Crown Research Institutes, and six trusts.
Offices of Parliament – The Office of the Ombudsmen, the Audit Office and the Parliamentary Commissioner for the Environment are not part of the executive branch of the government, as their primary function is to provide a check on the executive's use of power and resources, but they report to parliament under the Public Finance Act
The Reserve Bank of New Zealand – a stand-alone organisation included in the annual financial statements of the Crown.
At 30 June 2001, the number of staff employed in public service departments (excluding Crown entities and SOEs) was 30,355 (calculated on a full time equivalent basis). When reform of the state sector began in the 1980s, about 70,000 people were permanent employees in government departments. Many jobs in government departments have shifted to Crown entities, SOEs or the private sector. The public service today is characterised by relatively small departments, which have quite sharply defined roles in policy advice, service delivery, regulatory, or sectoral funding functions. Some bigger departments perform a combination of roles.
The State Sector Act 1988 provides for a State Services Commissioner appointed by the governor-general in council on the recommendation of the prime minister. The commissioner is required by the act to:
Review the machinery of government, including allocation of functions among departments, the need for new departments, the amalgamation or abolition of departments and coordination among departments.
Appoint chief executives of departments and negotiate their conditions of employment.
Review the performance of departments and their chief executives.
Provide and maintain, in association with chief executives, a senior executive service for the public service.
Negotiate conditions of employment for public service employees.
Promote and develop personnel policies and standards of personnel administration for the public service.
Promote, develop and monitor equal employment opportunities policies and programmes for the public service.
Advise on training and career development of public servants.
Provide advice on management systems, structures and organisations.
At the direction of the prime minister, exercise other functions in relation to the administration and management of the public service.
In a number of cases, the commissioner delegates authority to others to fulfil a particular responsibility. For example, negotiating conditions of employment for public service staff is delegated to public service chief executives, and negotiating conditions of employment for education sector staff is delegated to the Secretary for Education.
The State Services Commission exists to assist the State Services Commissioner fulfil the commissioner's statutory functions. The commission:
Assists the State Services Commissioner in appointing public service chief executives and operates the chief executive performance management system.
Provides advice and business analysis to the Minister of State Services and other ministers with ownership responsibilities in respect of public service departments.
Advises the government about collective state sector ownership issues, including public management systems, the machinery of government and human resource requirements.
Promotes appropriate values and standards of behaviour for the public service.
Table 3.13 lists the chief executives of government departments, as at 30 June 2001.
Table 3.13. Chief executives of government departments
| Department | Title | Name |
|---|---|---|
1As at 30 June 2001. Source: State Services Commission | ||
| Ministry of Agriculture and Forestry | Acting Chief Executive | Larry Fergusson |
| Archives New Zealand | Chief Archivist and Chief Executive | Dianne Macaskill |
| Audit Department | Controller and Auditor-General | David MacDonald |
| Department of Child, Youth & Family Services | Chief Executive | Jackie Brown |
| Department of Conservation | Director-General and Chief Executive | Hugh Logan |
| Department of Corrections | Chief Executive | Mark Byers |
| Department for Courts | Chief Executive | Wilson Bailey |
| Crown Law Office | Solicitor-General and Chief Executive | Terrance Arnold QC |
| Ministry for Culture & Heritage | Chief Executive | Martin Matthews |
| Ministry of Defence | Secretary of Defence and Chief Executive | Graham Fortune |
| Ministry of Economic Development | Chief Executive | Geoff Dangerfield |
| Ministry of Education | Secretary of Education and Chief Executive | Howard Fancy |
| Education Review Office | Acting Chief Review Officer and Acting Chief Executive | Karen Sewell |
| Ministry for the Environment | Secretary for the Environment and Chief Executive | Denise Church |
| Ministry of Fisheries | Chief Executive | Warwick Tuck |
| Ministry of Foreign Affairs & Trade | Secretary of Foreign Affairs & Trade and Chief Executive | Neil Walter |
| Ministry of Health | Director-General and Chief Executive | Dr Karen Poutasi |
| Ministry of Housing | Chief Executive | David Smyth |
| Inland Revenue Department | Commissioner of Inland Revenue and Chief Executive | David Butler |
| Department of Internal Affairs | Secretary for Internal Affairs and Chief Executive | Peter Hughes |
| Ministry of Justice | Secretary of Justice and Chief Executive | Belinda Clark |
| Department of Labour | Secretary of Labour and Chief Executive | John Chetwin |
| Land Information NZ | Chief Executive | Dr Russ Ballard |
| Ministry of Māori Development | Chief Executive | Leith Comer |
| National Library | Chief Executive | Chris Blake |
| NZ Customs Service | Comptroller and Chief Executive | Robin Dare |
| Ministry of Pacific Island Affairs | Chief Executive | Fuimaono Les McCarthy |
| Department of Prime Minister & Cabinet | Chief Executive | Dr Mark Prebble |
| Public Trust Office | Public Trustee and Chief Executive | David Hutton |
| Ministry of Research, Science & Technology | Chief Executive | Dr James Buwalda |
| Serious Fraud Office | Director and Chief Executive | David Bradshaw |
| Department of Social Welfare | Chief Executive | Dame Margaret Bazley |
| State Services Commission | State Services Commissioner | Michael Wintringham |
| Department of Statistics | Government Statistician and Chief Executive | Brian Pink |
| Ministry of Transport | Secretary of Transport and Chief Executive | Alastair Bisley |
| The Treasury | Secretary to the Treasury and Chief Executive | Dr Alan Bollard |
| Ministry of Women's Affairs | Chief Executive | Judy Lawrence |
| Department of Work and Income | Chief Executive | Christine Rankin |
| Ministry of Youth Affairs | Chief Executive | Anne Carter |
Functions of central government are under a continual process of review. The following departmental descriptions were correct at March 2002.
Agriculture and Forestry, Ministry of: Te Manatū Ahuwhenua, Ngaherehere. The Ministry of Agriculture and Forestry (MAF) was established on 1 March 1998 following merger of the Ministries of Agriculture and Forestry. Core MAF consists of nine business groups: Policy, operations, forest management, corporate services, human resources, corporate finance, information management, MAF Food Assurance Authority and MAF Biosecurity Authority. MAF exists to create opportunities for, and manage risk to, New Zealand's food, fibre, forestry and associated industries. MAF's roles are to provide policy advice on the trading environment, on sustainable resource use and on regulation of product safety, biosecurity and related matters, to administer regulation of product safety, biosecurity and related matters, and to provide other services where necessary. MAF's programmes aim to protect New Zealand's competitive advantage as an export nation by monitoring and protecting its animals, plants, forests and seafood against introduction of exotic pests and diseases. See Chapter 18: Agriculture and Chapter 19: Forestry and Fishing. The ministry's website is www.maf.govt.nz
Archives New Zealand. Archives New Zealand (formerly National Archives in the Department of Internal Affairs) is responsible for preserving government records of long-term value and making them available to the general public. It also provides advice on management of records created by government agencies. Established in 2000 as a government department in its own right, Archives New Zealand represents the memory of government because it provides evidence of its functions, policies, transactions, decisions and areas of responsibility. The original Treaty of Waitangi is preserved by Archives New Zealand, as is the Women's Suffrage Petition of 1893. Both documents have been placed on Unesco's World Heritage List as being of international significance.
Audit New Zealand: Te Mana Arotake. See Controller and Auditor-General section further on in this chapter.
Child, Youth and Family Services, Department of: Te Tari Āwhina I te Tamaiti, tae atu ki te Whānau. The Department of Child, Youth and Family Services was established on 1 October 1999 following integration of two Department of Social Welfare business units, the Children, Young Persons and Their Families Service and the New Zealand Community Funding Agency. The department has statutory responsibility for children and young people whose family circumstances put them at risk of abuse and neglect, who have offending behaviours, or poor life outcomes. The department's statutory role is defined by the Children, Young Persons and Their Families Act 1989, the Adoption Act 1955, the Adult Adoption Information Act 1985, the Adoption (Inter-country) Act 1997 and the Guardianship Act 1968. The department provides direct services for children and young people in need of care and protection, who have committed offences, or who are involved in adoption processes. The department also approves and contracts with community organisations for social services for children, young people and their families. The department's website is www.cyf.govt.nz
Civil Defence and Emergency Management, Ministry of: Te Rākau Whakamarumaru. The ministry's role is to lead the way in making New Zealand and its communities resilient to hazards and disasters through a risk management approach to reduction, readiness, response and recovery. The ministry aims to put the right tools, knowledge and skills in the hands of those responsible for designing and implementing solutions at the local level. It does this by working closely with local government, utilities and emergency services involved in civil defence and emergency management. The ministry is a semi-autonomous body within the Department of Internal Affairs (DIA). The Chief Executive of the DIA is the Secretary for Civil Defence and is the employer of the Director of Civil Defence and Emergency Management, who heads the ministry. The DIA is responsible for administration of the Civil Defence Act 1983. The role of the ministry is to:
Provide strategic policy advice on New Zealand's capability to manage and be resilient to the social and economic costs of disasters.
Ensure establishment of structures to provide the capability to manage and respond to disasters in New Zealand.
Provide support to sector stakeholders in their delivery of civil defence emergency management.
Ensure a coordinated approach, at both national and community level, to planning for reduction, readiness, response and recovery.
Manage central government response and recovery functions for large scale events beyond the capacity of local authorities.
The ministry's website is www.civildefence.govt.nz
Commerce, Ministry of: Te Manatū Tauhokohoko. See Ministry of Economic Development.
Conservation, Department of: Te Papa Atawhai. The Department of Conservation (DOC) administers most of the Crown land in New Zealand protected for scenic, scientific, historic or cultural reasons, or set aside for recreation. This is almost a third of New Zealand's land area, including national, forest and maritime parks, marine reserves, nearly 4,000 other reserves, river margins, some coastline and many offshore islands. Its aim is to conserve New Zealand's natural and historic heritage for the public to enjoy. DOC's work with natural heritage includes saving threatened native species, managing threats like possums and weeds, ecosystem restoration, caring for marine life and protecting natural heritage with help from landowners. It also looks after historic heritage on public conservation land. Providing for recreation is a major part of DOC's core work and covers family picnic sites to rugged backcountry tracks. In all areas, DOC works with local communities, other organisations and iwi where it can. The department's website is www.doc.govt.nz
Consumer Affairs, Ministry of: Manatū Kaihokohoko. The vision of the Ministry of Consumer Affairs is well-informed consumers, fair trading practices and safe products used safely. The outcomes the ministry seeks are:
Consumer interests well represented in public and private sector policies and decisions.
Appropriate, accurate and accessible information, education and advice available for consumers and businesses.
Information available to help consumers make comparisons between goods, services, prices and production processes.
Goods and services sold using fair rules and ethical practices.
Appropriate redress, remedies and penalties available for consumers when things go wrong.
Accurate, informed and effective measures in trade transactions.
Safe products used safely.
Safe production, distribution, installation and use of electricity and gas.
The ministry is divided into four sections:
The policy unit provides policy advice to the government on laws, practices and policies affecting consumers. It also works with consumer, industry and government agencies to promote compliance with self-regulatory policies and codes.
The consumer information service provides consumer information and education, including activities aimed at Māori, Pacific peoples and low-income consumers.
The trading standards service seeks to ensure that trade in goods is conducted on the basis of fair and accurate measurement, and that goods and services are safe and used safely.
The energy safety service seeks to ensure the safe production, distribution, installation and use of electricity and gas. It also oversees the supply, quality and measurement of gas, and the quality of petroleum fuels.
The ministry's website is www.mca.govt.nz
Corrections, Department of. The Department of Corrections manages all custodial and community-based sentences and orders imposed by the courts. This includes prison sentences, periodic detention, home detention, community service and supervision. The department has more than 4,500 full and part-time staff responsible for managing offenders. The department's operations include providing work programmes and activities to help reduce re-offending; giving specialist psychological advice and assistance with offenders’ needs; providing information to judges to assist them in sentencing offenders; administering the parole board and district prisons boards; and providing advice to the government about the most effective policies for corrections services. There are eight services and groups in the department working to reduce re-offending: The public prisons service; the community probation service; the psychological service; the service purchase and monitoring group; the policy development group; the strategic development group; the finance group, including Corrland Inmate Employment (which manages farms and forests owned by the department); and the internal audit group. See Chapter 10: Justice and Law. The department's website is www.corrections.govt.nz
Courts, Department for: Te Tari Kooti. The Department for Courts was established on 1 July 1995. Its predecessor was the courts and tribunals group of the Department of Justice. The department has three operational units, the courts’ business unit (responsible for the administration of courts and for providing support to the judiciary), collections (responsible for enforcement of financial court orders) and special jurisdictions, which covers tribunals, the Māori Land Court (responsible for the administrative support of the Māori Land Court and the Māori Appellate Court and for administration of Māori land records of ownership and title) and the Waitangi Tribunal (responsible for administrative support to the Waitangi Tribunal). See Chapter 10: Justice and Law. The department's website is www.courts.govt.nz
Crown Law Office. The Crown Law Office is a government department which provides legal advice and representation to the Crown on matters affecting executive government, particularly in areas of criminal, public and administrative law. Services provided include judicial review of government actions, constitutional questions, including Treaty of Waitangi issues, enforcement of criminal law and protection of the revenue. The office administers the prosecution process in the criminal justice system, in particular trials on indictment before juries. The office has two primary purposes in providing its services: to ensure the operations and responsibilities of executive government are conducted lawfully, and to ensure that the government is not prevented, through legal process, from lawfully implementing its policies and discharging its responsibilities. The work of the Crown Law Office contributes to the government's strategic goals of protecting the legal interests and supporting the responsibilities of the executive government and its agencies, maintaining law and order and serving the interests of justice in the community. See Chapter 10: Justice and Law. The office's website is www.crownlaw.govt.nz
Culture and Heritage, Ministry for: Te Manatū Taonga. The Ministry for Culture and Heritage provides advice to the government on culture and heritage matters and assists the government in provision and management of cultural resources for the benefit of all New Zealanders. The ministry is also responsible for advising and providing services to the Minister of Broadcasting in relation to non-commercial broadcasting issues, as well as providing services to the Minister for Sport, Fitness and Leisure. See Chapter 12: Arts and Cultural Heritage. The ministry's website is www.mch.govt.nz
Customs Service, New Zealand: Te Mana Arai O Aotearoa. The New Zealand Customs Service is responsible for the policy, administration and enforcement of the Customs and Excise Act 1996 and for administering border-related policies prescribed by other legislation relating to the legitimate movement of goods, craft and people. See Chapter 25: Overseas Trade, Chapter 13: Leisure and Tourism and Chapter 28: Public Sector Finance. The service's website is www.customs.govt.nz
Defence, Ministry of: Manatū Kaupapa Waonga. The Ministry of Defence is the government's principal source of advice on defence policy. It also carries out audits and assessments on the performance of defence organisations and manages procurement projects which entail a significant change to New Zealand's defence capability. The ministry works jointly with the New Zealand Defence Force in many matters. See Chapter 4: International Relations and Defence. The ministry's website is www.defence.govt.nz

An RNZAF troop forms a guard of honour at Government House, Wellington.
Defence Force, New Zealand: Te Ope Kaatua O Aotearoa. The primary purpose of the New Zealand Defence Force is to protect the sovereignty and advance the well-being of New Zealand by maintaining a level of armed forces sufficient to deal with small contingencies affecting New Zealand and its region. The force must also be capable of contributing to collective efforts where New Zealand's wider interests are involved. See Chapter 4: International Relations and Defence. Defence force websites are www.airforce.mil.nz www.army.mil.nz www.navy.mil.nz
Economic Development, Ministry of: The Ministry of Economic Development, established on 29 February 2000, is the principal successor department to the Ministry of Commerce and leads implementation of the government's economic development policies. The ministry managed establishment in October 2000 of Industry New Zealand, a Crown entity and the primary delivery vehicle for the government's industry and regional development programmes. The ministry's policy and operational functions include offering regulatory advice on the telecommunications and energy sectors, a major reform programme on business law, consumer policy issues, plus operation of the Companies Office, the Intellectual Property Office, the Insolvency and Trustee Service, Crown Minerals and Radio Spectrum Management. The ministry reports to 11 portfolio ministers on the discharge of its responsibilities for Votes: Economic Development; Industry and Regional Development; Commerce; Communications; Energy; Sport, Fitness and Leisure; Tourism; and Consumer Affairs. The ministry's website is www.med.govt.nz
Education, Ministry of: Te Tāhuhu o te Mātauranga. The Ministry of Education is responsible for providing policy advice to the government on early childhood, compulsory and post-compulsory education, including employment-related education and training; ensuring the effective, efficient and equitable implementation of the government's policies; advising on the optimal use of resources allocated to education; and providing an education policy perspective to a range of economic and social policy issues. See Chapter 9: Education. The ministry's website is www.mined.govt.nz
Education Review Office: Te Tari Arotake Mātauranga. The Education Review Office (ERO) reports publicly on the quality of education in all New Zealand schools and early childhood centres, including private schools, kura kaupapa Māori (Māori language immersion schools) and ngā kōhanga reo (Māori language early childhood groups). The ERO actively supports and promotes high quality decision making on the education provided for New Zealand's young people. See Chapter 9: Education. The office's website is www.ero.govt.nz
Table 3.14 shows how the representation of Equal Employment Opportunity (EEO) groups in the public service and in the employed labour force have generally increased since 1996.
Table 3.14. Representation of EEO groups in the public service and labour force
| EEO groups | 1996 | 1997 | 1998 | 1999 | 2000 | 2001 | ||
|---|---|---|---|---|---|---|---|---|
1Public service ethnicity data double counts people with more than one ethnicity, so that a person who is Māori and Samoan will be counted in both Māori and Pacific peoples. The labour force figures shown, which are sourced from the Household Labour Force Survey, use a priority system that has the effect of slightly reducing the figure for Pacific peoples. 2Representation is calculated as a proportion of known ethnicities, which is consistent with Statistics New Zealand practice. Ethnicity is known for 86.5 percent of public service staff. 3In 1998 a new definition of disability was introduced, based on internationally accepted standards. Data collected under the previous definition are not comparable to the data currently collected. Source: State Services Commission | ||||||||
| Percent | ||||||||
| Ethnicity1,2 | Māori | Public service | 14.5 | 14.7 | 15.5 | 16.1 | 16.9 | 17.0 |
| Employed labour force | 7.9 | 7.9 | 8.1 | 7.6 | 8.9 | 8.8 | ||
| Pacific peoples | Public service | 5.5 | 5.6 | 5.9 | 6.2 | 6.6 | 6.3 | |
| Employed labour force | 3.2 | 3.7 | 3.6 | 4.0 | 4.0 | 4.0 | ||
| Disability3 | People with disabilities | 10.6 | 10.1 | 9.7 | 8.1 | |||
| Gender | Women | Public service | 54.7 | 54.8 | 54.5 | 56.3 | 56.2 | 56.5 |
| Employed labour force | 44.9 | 44.9 | 44.9 | 45.4 | 45.1 | 45.7 | ||
Environment, Ministry for the: Te Manatū mō te Taiao. The Ministry for the Environment works with others to identify and act on New Zealand's environmental problems. It advises the government on New Zealand's environmental laws, policies, standards and guidelines, monitors how they work in practice, and takes any action needed to improve them. Through reporting on the New Zealand environment, it helps raise community awareness and provides information needed by decision makers. The ministry also plays a part in international action on global environmental issues. The ministry is responsible for government policies covering resource management; air and water quality and contaminated sites; protection of the ozone layer; and climate change. Local bodies, particularly regional councils, manage most day-to-day environmental matters. Besides the Environment Act 1986 under which it was set up, the ministry is responsible for the Soil Conservation and Rivers Control Act 1941, the Resource Management Act 1991, the Hazardous Substances and New Organisms Act 1996 and the Ozone Layer Protection Act 1996. On behalf of the Minister for the Environment, who has duties under various laws, the ministry reports on local government performance on environmental matters and on the work of the Environmental Risk Management Authority and the Energy Efficiency and Conservation Authority. The ministry's website is www.mfe.govt.nz
Fisheries, Ministry of: Te Tautiaki i ngā tini a Tangaroa. The Ministry of Fisheries is responsible for the sustainable use of fisheries. This involves managing the resource so that it provides for the social, economic and cultural well-being of New Zealanders. The ministry advises the government on development of fisheries policies, develops laws to manage fisheries, administers the quota system that regulates commercial fishing activity, and gives effect to the principles of the Treaty of Waitangi as they relate to fisheries. See Chapter 19: Forestry and Fishing. The ministry's website is www.fish.govt.nz
Foreign Affairs and Trade, Ministry of: Manatū Aorere. The Ministry of Foreign Affairs and Trade conducts the government's business with other countries and their governments, and with international organisations. It advises the government on where New Zealand's advantage lies in relation to other countries. On behalf of the government, it influences other governments in New Zealand's favour. It draws together various aspects of New Zealand's national interests, including relevant domestic interests, to achieve most benefit for New Zealand in relation to the government's security, political, trade and economic objectives. The ministry operates 47 posts overseas. Their primary task is to develop the official relationship between the New Zealand Government and the country or international organisation concerned through discussion and contacts with local political leaders, officials, business executives and media representatives. See Chapter 4: International Relations and Defence. The ministry's website is www.mft.govt.nz
Housing, Ministry of: Te Whare Āhuru. The Ministry of Housing helps the government protect the rights of residential landlords and tenants through the Residential Tenancies Act 1986. See Chapter 22: Housing and Construction. The ministry's website is www.minhousing.govt.nz
Inland Revenue, Department of: Te Tari Taake. The main function of the Inland Revenue Department is to assess and collect taxes and duties. It collects more than 80 percent of New Zealand Government revenue. Along with taxes such as income tax, goods and services tax, fringe benefit tax and resident withholding tax, Inland Revenue also administers family assistance, child support and student loan repayment programmes. See Chapter 28: Public Sector Finance. The department's website is www.ird.govt.nz
Internal Affairs, Department of: Te Tari Taiwhenua. The Department of Internal Affairs issues passports; registers births, deaths and marriages; administers citizenship applications; ensures gambling is fair, legal and honest; contributes to community development by administering lottery grants, community grants schemes and trusts; and provides support services and policy advice for ministers of the Crown. The department also oversees the Office of Ethnic Affairs, the Ministry of Civil Defence and Emergency Management, and local government commissioners. The department's website is www.dia.govt.nz
Justice, Ministry of: Te Manatū Ture. The Ministry of Justice provides leadership across the justice sector; research, evaluation and advice on justice-related matters for ministers and other departments; purchases advice during the government's annual budget round; and negotiates and advises on settlement of Treaty of Waitangi claims. Through the Chief Electoral Office, the ministry is responsible for the conduct of parliamentary elections and referenda. The ministry provides advice for the attorney-general on consistency between proposed legislation and the New Zealand Bill of Rights Act 1990. It also provides advice on appointments to the judiciary. The ministry monitors and provides advice (including advice on appointments) to the Minister of Justice on the Crown entities and other bodies funded through Vote: Justice. The ministry is responsible for the administration of 140 acts and numerous regulations. See Chapter 10: Justice and Law. The ministry's website is www.justice.govt.nz
Labour, Department of: Te Tari Mahi. The Department of Labour delivers services across a range of labour market related areas, including employment relations, workplace health and safety and immigration and community employment. It provides input into broader policy advice to the government on issues with labour market impacts, such as accident insurance and rehabilitation, disability, education and economic development policies. The department's purpose is to link social and economic issues to enable people to develop and use their potential for the advantage of themselves and New Zealand. It is the government's main labour market agency and principal advisor on the labour market. The Department of Labour consists of five services: The Employment Relations Service; the Community Employment Group; Workplace Safety and Health; the New Zealand Immigration Service and the Labour Market Policy Group; plus an Office of the Chief Executive with responsibilities across the department, including accountability and monitoring.
Department of Labour activities cover:
Accident insurance – providing purchase, policy and monitoring advice to the government on accident prevention, compensation and rehabilitation issues. Maintaining an accident insurance database and monitoring accident insurance claims made against contracts entered into in 1999/2000.
Employment – providing policy, purchase and monitoring advice to the government on employment and related issues. Helping to build the capacity of communities and to assist them to identify and achieve new opportunities for sustainable economic and employment outcomes.
Employment relations – providing information to employers, employees and unions about employment relations matters and assistance to employers and employees in resolving problems in workplaces. Supporting operation of employment legislation policy, monitoring the regulatory framework of employment relations and providing policy advice to the government.
Immigration – managing the flow of people, including migrants and visitors, across New Zealand's borders; issuing visas and permits for people entering the country; taking responsibility for New Zealand's refugee programme and providing immigration policy advice to the government.
International labour issues – managing the government's relationship with the International Labour Organisation (ILO) and other international institutions with an interest in the labour market.
Labour market analysis, research and policy advice – providing analysis on labour market trends and the economic outlook, evaluating the effectiveness of policies and programmes, and undertaking research on labour market dynamics to inform policy advice. Providing policy advice to the government on labour market impact of a wide range of policy initiatives.
Workplace health and safety – working to lower work-related death and injury rates; providing information to workplaces on occupational safety and health issues; enforcing health and safety legislation and providing policy advice to the government.
Among legislation administered by the department are the Accident Insurance Act 1998, the Accident Insurance Amendment Act 2000, the Employment Relations Act 2000, the Equal Pay Act 1972, the Health and Safety in Employment Act 1992, the Holidays Act 1981, the Immigration Act 1987 and the Minimum Wage Act 1983. The department's website is www.dol.govt.nz
Land Information New Zealand: Toitū te whenua. Land Information New Zealand is responsible for land-related policy and regulatory and core government service delivery functions. Land Information New Zealand advises the government, administers the Crown's interests in land and makes government-held information available to the public. Its areas of responsibility are land titles (land registration and search facilities), survey systems (administration of the survey infrastructure), Crown property (administration of Crown land and disposal of surplus Crown land), topography/hydrography (provision of digital databases, core topographic mapping and hydrographic charts) and rating valuations (standard setting for rating valuations). See Chapter 16: Land and Environment. The Land Information New Zealand website is www.linz.govt.nz
Māori Development, Ministry of: Te Puni Kōkiri. The Ministry of Māori Development was established as a policy ministry on 1 January 1992, replacing the Ministry of Māori Affairs (Manatū Māori) and the Iwi Transition Agency (Te Tira Ahu Iwi). The ministry is responsible under the Ministry of Māori Development Act 1991 for promoting increases in the levels of achievement attained by Māori with respect to education, training and employment, health, and economic resource development. It also monitors and liaises with departments and agencies providing services for Māori to ensure the adequacy of those services. The ministry's functions are to provide high quality policy advice on the Crown's relationship with iwi, hapū and Māori and on the government's objectives, interests and obligations relating to Māori. In particular, it advises on strategic leadership, sectoral issues, and intervention and risk management of Crown/Māori issues. The ministry's website is www.tpk.govt.nz
National Library of New Zealand: Te Puna Mātauranga o Aotearoa. The role of the National Library is to collect and maintain literature and information resources that relate to New Zealand and the Pacific, to make this information readily available, and to preserve the documentary heritage of New Zealand for future generations. The National Library creates better access to information for New Zealanders by supporting the activities of other New Zealand libraries, including public, university and school libraries, and by collecting and preserving material which is the ‘memory’ of New Zealand. The library also gives policy advice to the government on access to information in New Zealand. See Chapter 12: Arts and Cultural Heritage. The library's website is www.natlib.govt.nz
National Provident Fund. The National Provident Fund provides superannuation schemes for employer/employee groups and for individual members. The National Provident Fund has been closed to new members since 1991. The fund comprises 14 separate superannuation schemes. The fund's website is www.npf.co.nz
The Office of Treaty Settlements: Te Tari Whakatau Take e pa ana ki te Tiriti o Waitangi. The Office of Treaty Settlements provides policy advice to the government on historical claims under the Treaty of Waitangi, negotiates settlements of specific historical treaty claims and implements those settlements. It also acquires, manages, transfers and disposes of Crown-owned land for use in treaty settlements and related purposes. The office's website is www.ots.govt.nz
Pacific Island Affairs, Ministry of. The Ministry of Pacific Island Affairs exists to promote development of Pacific peoples in New Zealand in a way that recognises and reflects Pacific cultural values and aspirations, so that Pacific peoples can participate in, and contribute fully to, New Zealand's social, cultural and economic life. The ministry provides policy advice to the government and other agencies on key policies and issues impacting on Pacific peoples and is responsible for communicating information and government policy advice to and from Pacific communities and other agencies. See Chapter 6: Social Framework. The ministry's website is www.minpac.govt.nz
Police, New Zealand: Ngā Pirihimana o Aotearoa. New Zealand Police is a state agency serving all New Zealand. The two strategic goals of New Zealand Police are community safety and crime reduction. The vision of New Zealand Police is to build ‘safer communities together’, which gives direction to the principal operational strategy of community-oriented policing. The police mission is to serve the community by reducing the incidence and effects of crime, detecting and apprehending offenders, maintaining law and order and enhancing public safety. The police website is www.police.govt.nz
Prime Minister and Cabinet, The Department of the. The Department of the Prime Minister and Cabinet provides advice to the prime minister on policy, constitutional and administrative issues and provides secretariat support to the executive council and cabinet. It provides support services to the governor-general and manages the governor-general's residences. Through the External Assessments Bureau, it provides intelligence assessments to the government on developments overseas. The department contributes to the effective coordination of government across departmental lines, tests the quality of advice coming from departments and acts as an ‘honest broker’ where there are conflicts about policy advice being offered by different parts of the public sector. The department from time to time undertakes special operational functions. Examples have included the Crime Prevention Unit and the Prime Ministerial Taskforce on the Year 2000. The department's website is www.dpmc.govt.nz
Public Trust Office. The Public Trust Office is a self-funding government department providing a wide range of financial services and services as trustee, executor, manager and attorney. It is also required to provide a number of statutory services. The office's website is www.publictrust.co.nz
Quotable Value New Zealand Ltd. Valuation New Zealand was replaced in July 1998 by the Crown entity Quotable Value New Zealand Ltd and the Office of the Valuer General. The Office of the Valuer General is a statutory office of the Crown created under the Rating Valuations Act 1998. It is located within the structure of Land Information New Zealand. See Chapter 16: Land and Environment. Quotable Value's website is www.quotable.co.nz
Research, Science and Technology, Ministry of: Te Manatū Pūtaiao. The mission of the Ministry of Research, Science and Technology is to ‘inspire and assist New Zealanders to create a better future through research and innovation.’ Its main roles are providing advice to the government on research and innovation policies, including investment priorities, science matters and international science issues; applying innovation policies to grow New Zealand's economy; managing contracts on behalf of the Minister of Research, Science and Technology with agencies that directly invest in research and innovation; raising the profile of research and innovation with New Zealanders making career choices and with the social, environmental and business sectors. See Chapter 15: Science and Technology. The ministry's website is www.morst.govt.nz
Serious Fraud Office, The: Te Tari Hara Tāware. The Serious Fraud Office, established as an operational department in 1990, has the primary role of detecting and investigating cases of serious or complex fraud and expeditiously prosecuting offenders. Based in Auckland, the office is the only government department to have its head office outside Wellington. See Chapter 24: Commerce and Services. The office's website is www.sfo.govt.nz
Social Development, Ministry of: Te Manatū Whakahiato ora. The Ministry of Social Development was established on 1 October 2001 to provide strategic social policy advice to the New Zealand Government and to deliver income support and employment services to more than a quarter of all New Zealanders. The ministry's income support and employment services are delivered by 170 service centres trading under the name Work and Income and offer a single point of contact for New Zealanders needing work-search support, income support and in-work support. Work and Income employs about 5,000 people and had more than 1 million clients in the 2000/01 financial year. An average 1,600 applications for income support or pensions are processed each day, while nationally Work and Income handles approximately 66,000 transactions a day by mail, telephone and personal contact. See Chapter 7: Social Welfare. The ministry's website is www.msd.govt.nz
State Services Commission: Te Komihana O ngā Tari Kāwanatanga. The State Services Commission exists to assist the State Services Commissioner carry out his/her statutory functions. The commission's website is www.ssc.govt.nz
Statistics New Zealand: Te Tari Tatau. The main function of Statistics New Zealand is to provide and distribute statistical information about the economic, demographic, social and environmental circumstances of New Zealand. It also provides advice to the Minister of Statistics on statistical policy matters and on the relevance of official statistics. On behalf of the minister, the department ensures that the official statistical system is efficiently integrated and coordinated to cover all government-produced statistics. Output from the organisation's databases is formatted into a range of products and services appropriate to the requirements of government, as well as to the general public and commercial users. Cooperation with other national statistical offices and international agencies fosters availability of high-quality, internationally-comparable statistical information. Statistics New Zealand operates under the Statistics Act 1975, which defines collection authorities, as well as setting out confidentiality safeguards. Statistics New Zealand's website is www.stats.govt.nz
Transport, Ministry of: Te Manatū Waka. The ministry's core functions are largely policy oriented – ensuring that the government receives high quality advice and information relating to the promotion of safe, sustainable transport at reasonable cost. As the Minister of Transport's agent, the ministry plays an important role in negotiating and monitoring contracts with the stand alone Civil Aviation, Maritime Safety and Land Transport Safety Authorities, the Aviation Security Service, Transit New Zealand, Transfund New Zealand and the Transport Accident Investigation Commission. It also monitors the government's contract for weather services with MetService New Zealand Ltd and manages the Motor Vehicle Registry and Revenue Management business. Development of any legislation for the transport sector is the ministry's responsibility. Its other significant function is to formulate and implement policy relating to the development of New Zealand's international air transport links. It also advises the government in relation to the Crown's interests in joint venture airports operated in partnership with local authorities. See Chapter 23: Transport.
Treasury, The: Kaitohutohu Kaupapa Rawa. The Treasury manages the Crown's finances and is the government's lead advisor on economic and financial policy. At an operational level, it manages the Crown's liabilities, monitors significant assets, manages and publishes Budget documents and Crown financial statements, and manages New Zealand's relationships with international financial institutions, including the International Monetary Fund and the World Bank. The Treasury also provides wide-ranging policy advice, reports on most expenditure proposals being considered by the government, and monitors and analyses developments in New Zealand and international economies. See Chapter 28: Public Sector Finance. The Treasury's website is www.treasury.govt.nz
Women's Affairs, Ministry of: Te Minitatanga mō ngā Wāhine. The Ministry of Women's Affairs is the government's primary provider of gender-specific advice. The ministry advises the government on all aspects of policy development and implementation with regard to women in areas of strategic policy, economic autonomy, safety, justice and well-being. The ministry manages the government's international obligations in relation to the status of women. A priority for 2001/02 was preparation of New Zealand's fifth report on the United Nations Convention on the Elimination of All Forms of Discrimination Against Women. The ministry recommends suitably qualified women for positions on government-appointed boards and committees, with the aim of increasing the number of women, including Māori and Pacific women, in decision making roles. The ministry's website is www.mwa.govt.nz
Youth Affairs, Ministry of: Te Tari Taiohi. The role of the Ministry of Youth Affairs is to advise the government on involvement with people aged 12 to 25 years. It combines policy advice and operational roles in support of this task. The ministry works to promote the direct participation of people aged between 12 and 25 in the social, educational, economic and cultural development of New Zealand, both locally and nationally. The ministry's website is www.youthaffairs.govt.nz
Crown entities. Crown entities are organisations or offices listed in the Fourth Schedule of the Public Finance Act 1989. The fourth schedule can be amended to add, remove or change the name of a Crown entity by order-in-council. The act establishes financial management and accountability provisions for bodies set up by the government or by legislation that depend wholly or partly on public funds. There are nearly 3,000 Crown entities, including school and reserve boards. Crown entities generally have regulatory, purchasing and service provision functions. Most are run by boards, which appoint chief executives who have responsibility for settling terms and conditions for employees. Some Crown entities are companies and are subject to the Companies Act 1993 and to monitoring on the government's behalf by the Crown Company Monitoring Advisory Unit (CCMAU).
State-owned enterprises. State-owned enterprises (SOEs) are government-owned organisations operating on commercial lines and are companies under the Companies Act 1993. They are required under statute to operate as successful businesses and to be as profitable and efficient as comparable businesses in the private sector. The government's interest in SOEs is substantially in their ownership. The government may purchase services from SOEs, but generally will do so on the same basis as other purchasers. The State Owned Enterprises Act 1986 specifies principles governing the operation of SOEs, authorises formation of companies and establishes accountability requirements. The government's shareholding interests are supported by the Crown Company Monitoring Advisory Unit (CCMAU), which is part of Treasury. SOEs are named in the first schedule to the act. Since 1986 there have been numerous changes to the first schedule as new SOEs have been added and as others have been sold. In addition to state service organisations, there is a multitude of advisory bodies, statutory corporations, companies, councils, commissions, committees, tribunals and other organisations loosely connected to the government.
Crown Company Monitoring Advisory Unit. The increasing number and diversity of limited liability companies owned by the Crown led it to establish the Crown Company Monitoring Advisory Unit (CCMAU) in 1993 as a centre of expertise in the monitoring of these entities. CCMAU advises and supports primarily the Minister for State-owned Enterprises and the Minister for Crown Research Institutes. The shareholding ministers of other Crown companies (such as Radio New Zealand, Housing New Zealand, Animal Control Products and airport companies) receive advice from the unit in their role as monitors of the Crown's ownership interest, as does the Minister of Finance, who, as a shareholding minister, receives unit advice via the responsible minister and in joint reports from the unit and the Treasury.
CCMAU's mission is to be the government's pre-eminent ownership monitoring, advisory and governance agency. One of the unit's chief functions is the provision of advice to shareholding ministers relating to the performance of Crown companies against their objectives and associated statement of corporate intent/statement of intent targets (including market, financial, investment and enterprise-specific objectives) and the appropriateness of those objectives and targets. Other functions include the provision of administrative support, including facilitation of information flows between shareholding ministers and Crown company boards, and coordination of the Crown company monitoring regime, including operating processes and facilitating advice from other advisors.
The unit, while independent for advice purposes, is attached to the Treasury for administrative purposes. Its executive director is accountable to the Treasurer, through the Secretary of the Treasury, for management of the unit and appointment, remuneration and performance of staff. Some of the principal issues facing the unit are:
The need for advice from a commercial perspective to assist ministerial decision making in relation to Crown companies.
Issues of shareholder and director accountability.
Changes in information management and monitoring methodologies.
The long-term creation of shareholder value.
Pressures from Crown companies to expand or change their activities and, as a consequence, changing the Crown's ownership risk profile.
The Controller and Auditor-General is an officer of parliament appointed by the governor-general under the Public Audit Act 2001. The position is independent of the executive government and only the governor-general, upon an address from the House of Representatives, can end tenure. The Controller and Auditor-General and the people acting under his or her delegation comprise the Audit Office. The constitutionally important controller function of the Audit Office, as set out in the Public Finance Acts 1977 and 1989, is to act as a monitor on behalf of parliament and to control issues of money from the Crown bank account. The Audit Office has to be satisfied that all issues from the account for the government's expenditure requirements are within appropriations and other authorities granted by parliament. This role is crucial to the ability of parliament to control the supply of funds to the Crown, and, in certain circumstances, the Audit Office may prevent the issue of money.
The Audit Office audits the financial statements of government departments, local authorities and most government-controlled corporations, boards and companies. The office plays a key part in ensuring adequate accountability by these organisations. It also conducts periodic performance audits to ascertain whether public entities are carrying out their activities effectively and efficiently, are complying with their statutory obligations and are acting with due regard for probity and financial prudence. Considerable emphasis is placed on reporting the results of this work. The most visible results are the audit reports on public entity financial statements tabled in parliament each year. If shortcomings are discovered during an audit, the principal recourse of the Audit Office is to report to the management of the organisation, to a minister, or to parliament and its select committees. Other reports are also tabled on the results of performance audits and inquiries conducted by the Controller and Auditor-General.
The Controller and Auditor-General uses a mix of his own staff and private sector auditors to carry out individual audits in accordance with requirements laid down by him.
The Official Information Act 1982 is based on the principle that information shall be made available unless there is good reason for withholding it. The purposes of the act are to:
Increase availability of official information to the people of New Zealand.
Provide for proper access by bodies corporate to official information relating to themselves (access by individuals to information relating to them is now governed by the Privacy Act 1993).
Protect official information consistent with the public interest and preservation of individual privacy.
With the exception of the Parliamentary Counsel Service, the Official Information Act covers all government departments, state-owned enterprises and a range of statutory bodies. It does not include courts, tribunals (in relation to their judicial function) or some judicial bodies. All local authorities and statutory boards are covered under either the Official Information Act 1982 or the Local Government Official Information and Meetings Act 1987. These acts provide special rights of access by bodies corporate to personal information about themselves.
Requests for access to official information can be made by a corporation sole and by a body of people whether corporate or unincorporate. Protection of the privacy of natural persons may be overturned if it is in the public interest to make information available.
Among criteria to be considered when judging whether information should be withheld are whether, if the information were released, it would prejudice the security, defence or economic international relations of New Zealand; the maintenance of law and order; the effective conduct of public affairs; trade secrets and commercial sensitivity; personal privacy and the safety of any person.
Ombudsmen can review a decision to refuse information. This investigation is private and free. The formal recommendation of an ombudsman is binding unless overridden by the governor-general by order-in-council.
An information guide concerning access to personal and official information is available from the Ministry of Justice. The Directory of Official Information is a comprehensive guide to organisations covered by the act, including their structure, functions, policies, documents held, contact officers and other listings which facilitate access of information.
The principal function of ombudsmen is to enquire into complaints relating to administrative decisions of government departments and related organisations, hospitals and health authorities. Under the Ombudsmen Act 1975, there is provision for the appointment of a Chief Ombudsman and one or more ombudsmen in temporary or permanent positions.
All investigations undertaken by ombudsmen are conducted in private. When an ombudsman believes a complaint can be sustained, his opinion is reported to the government department or organisation concerned, along with any recommendation for action. A copy of this report is made available to the responsible minister. At the local government level, the ombudsman reports his finding to the organisation and provides a copy to the mayor or chairperson.
Ombudsmen also investigate recommendations made to ministers by government departments, organisations or employees. Similarly, they look into recommendations made to local body councils or boards by any committee, subcommittee, officer, employee or member.
It is also the responsibility of ombudsmen to investigate complaints on decisions for the request of official information.
Under the Protected Disclosures Act 2000, ombudsmen can provide guidance and information to employees who have made, or who are considering making, a protected disclosure pursuant to the act, and they fulfil the ‘appropriate authority’ requirements of the act.
Ombudsmen have no authority to investigate complaints against private companies and individuals, decisions of judges, complaints directed at ministerial decisions, or at the full council of local government. They can also decide that certain complaints, although within their sphere, are better suited to other avenues of administrative redress.
Table 3.15 details complaints made to the ombudsmen for the year to June 2001.
Table 3.15. Complaints to the ombudsmen, 20011
| Action on complaint | Ombudsmen Act 1975 | Official Information Act 1982 | Local Government Official Information and Meetings Act 1987 |
|---|---|---|---|
1Year ended 30 June. Source: Office of the Ombudsmen | |||
| Declined, no jurisdiction | 93 | 19 | – |
| Declined or discontinued (section 17) | 504 | 105 | 25 |
| Resolved in course of investigation | 230 | 285 | 59 |
| Sustained, recommendation made | 4 | 4 | – |
| Sustained, no recommendation made | 25 | 16 | – |
| Not sustained | 138 | 131 | 22 |
| Formal investigation not undertaken, but explanation, advice or assistance given | 2,601 | 447 | 83 |
| Complaints transferred to: | |||
| Privacy Commissioner | 2 | 28 | 5 |
| Health & Disability Commissioner | 7 | – | – |
| Police Complaints Authority | 10 | 2 | – |
| Still under investigation as at 30 June | 459 | 326 | 45 |
| Total | 4,073 | 1,363 | 239 |
| Total 2000 | 4,004 | 1,309 | 206 |
The functions of the Office of the Privacy Commissioner: Te Mana Matapono Matatapu are set out in the Privacy Act 1993. The office is independent of the executive and of parliament. One of the main purposes of the act is the promotion and protection of individual privacy. The act establishes 12 information privacy principles and four public register privacy principles. Both sets of principles are subject to any other law and apply to both public and private sectors. Information privacy principles deal with the collection, security, use and disclosure of personal information, access to and correction of personal information, and the assignment and use of unique identifiers. Public register privacy principles place some controls on the availability of public register information and its subsequent use.
The privacy commissioner has the power to issue codes of practice which may modify information privacy principles by prescribing different standards. Codes of practice can also prescribe how information privacy principles are to be applied or complied with. Codes replace the principles in particular contexts. The most important code issued by the commissioner is the Health Information Privacy Code 1994, which provides stringent controls on the collection, use and disclosure of medical and health information by health sector agencies.
The Privacy Act also lays down rules controlling statutory information matching programmes in the public sector. Information matching involves one government department comparing personal information collected for specific purposes with databases of personal information in other government departments held for different purposes. The act requires notice to be given to an affected individual before adverse action is taken on the basis of a match.
The commissioner investigates complaints alleging breaches of privacy principles, codes of practice and information matching rules. The investigation process emphasises conciliation. If a complaint cannot be settled, the privacy commissioner may refer it to the proceedings commissioner, who may issue proceedings before the Complaints Review Tribunal. If either of the commissioners do not do so, the aggrieved person may issue proceedings before the tribunal. The tribunal has the power to award a number of remedies (including a declaration that an action has caused interference with privacy), orders, damages and costs. In 1999/2000, the privacy commissioner referred four complaints to the proceedings commissioner, and 27 complainants commenced proceedings on their own initiative.
The privacy commissioner performs a general ‘watchdog’ role over privacy. In 1999/2000, he made a number of reports to the Minister of Justice, and public statements on a range of issues affecting individual privacy. The commissioner peruses new legislation and prepares reports on privacy issues. He also appears before parliamentary select committees considering bills. The Official Information Act 1982 and the Local Government Official Information and Meetings Act 1987 require ombudsmen to consult with the commissioner on official information access requests where privacy is a possible ground for withholding information. During the 1999/2000 year, 52 formal consultations under the two acts were completed. The commissioner's website is www.privacy.org.nz
Table 3.16 details complaints made to the privacy commissioner for the years to June 1999 and 2000.
Table 3.16. Complaints to the privacy commissioner
| Year ended June | ||
|---|---|---|
| 1999 | 2000 | |
| Source: Office of the Privacy Commissioner | ||
| New complaints received | 1,003 | 798 |
| Complaints current at start of year | 1,068 | 1,126 |
| Number of complaints under process | 2,071 | 1,924 |
| Number of complaints closed during year | 895 | 956 |
| No jurisdiction | 56 | 45 |
| Complaints resolved without final opinion | 708 | 775 |
| Final opinion (substance 44 – no substance 102) | 131 | 146 |
The Human Rights Act 1993 amalgamated the Race Relations Act 1971 and the Human Rights Commission Act 1977 and added five new prohibited grounds of discrimination. There are 13 prohibited grounds of discrimination: sex, marital status, religious belief, ethical belief, colour, race, ethnic or national origins, disability, age, political opinion, employment status, family status and sexual orientation. Areas in which it is unlawful to discriminate are employment; access to places, vehicles and facilities; provision of goods and services; provision of land, housing and other accommodation; and access to educational establishments. The act also contains provisions relating to racial disharmony, sexual harassment and racial harassment.
An amendment to the act in 2001 made most public sector activity subject only to the New Zealand Bill of Rights Act 1990 anti-discrimination standard. This standard is incorporated into the Human Rights Act for this purpose (part IA). However, government employment policies and practices and the related areas of racial and sexual harassment and victimisation continue to be regulated by the standard in part II of the Human Rights Act.
The 2001 amendment also combined the Human Rights Commission and the Office of the Race Relations Conciliator into a new Human Rights Commission. This organisation is strategically focussed on general human rights education and advocacy, while retaining some discrimination complaints roles. The Human Rights Commission's role in complaints is as the publicly-funded entry point for all complaints of discrimination whether relating to government or non-government activity. The commission attempts to assist the parties to resolve complaints using mediation or other low-level dispute resolution mechanisms. If low-level resolution fails or is inappropriate, the complainant may approach the independent Director of Human Rights Proceedings for possible litigation assistance. Complainants may also take their own litigation or engage their own legal counsel.
The Human Rights Review Tribunal is the specialist tribunal to determine discrimination proceedings. Where a complaint is upheld, including complaints about government policies and practices, a wide range of remedies are available, for example damages and orders of specific performance. When a complaint concerns legislation or validly-made regulations, and the complaint is upheld, the sole remedy available is a declaration of inconsistency. This does not invalidate the legislation, but the responsible minister is required to bring the declaration to the attention of the House of Representatives, along with the executive's response to that declaration.
There are appeal rights from the tribunal to the high court and proceedings may also be removed to the high court if appropriate.
The Parliamentary Commissioner for the Environment was established by the Environment Act 1986 following reform of environmental administration in New Zealand. The commissioner is an independent officer of parliament whose role is to review and provide advice on environmental issues and on the agencies and processes established by the government to manage the environment. The primary objective of the commissioner's office is to maintain and improve the quality of the environment by providing advice to parliament, local councils, business, tangata whenua, communities and other public agencies. The commissioner may investigate any matter where the environment may be, or has been, adversely affected; assess the capability, performance and effectiveness of the New Zealand system of environmental management; and provide advice and information that will assist people to maintain and improve the quality of the environment.
During 2000/01, the commissioner initiated investigations into the urban environment; into biosecurity; into the interaction between land use, biodiversity and sustainability goals; into the environmental management capacity of small local authorities; into urban water systems management; and into native plants on private land. Two environmental management audits were completed. The first reviewed the management of biosecurity risks to the environment, and the second was a progress report on hazardous waste management. The commissioner produced a background paper and a submission to the Royal Commission on Genetic Modification and was involved in a number of workshops, strategy planning sessions and responses to policy statements. The commissioner responded to 328 communications from citizens, non-government organisations, select committees, public authorities and international correspondents requesting information or assistance on environmental issues. The commissioner's website is www.pce.govt.nz
Table 3.17 lists the number of reports and papers produced by the commissioner during four comparable years.
Public Trust, the first organisation of its kind in the world, was launched in 1873 by an act of parliament to provide New Zealanders with the opportunity of writing a will, thereby decreasing the number of intestacies, and to provide executor and trustee services. Before its inception, problems had arisen with unscrupulous individuals cheating beneficiaries out of their inheritances.
Public Trust has been a self-funding government department operating, most recently, under the Public Trust Office Act 1957. However, the Public Trust Bill proposes changes to the office's status and structure. The bill proposes that:
The operations and undertakings of the Public Trust Office will be vested in a new statutory corporation to be known as Public Trust.
The existing corporation sole (the Public Trustee), the Public Trust Office and the Public Trust Investment Board will be dissolved, and the new corporation will be their successor.
Public Trust will no longer be a government department, but will become a Crown entity subject to accountability and reporting arrangements under the Public Finance Act 1989.
Public Trust will have a board responsible to the minister for the management and operation of the organisation, including appointment of its chief executive.
Public Trust will continue to be responsible for carrying out existing public and social functions and to provide free wills and other non-commercial services when so requested and funded by the Crown.
Crown ownership of Public Trust is confirmed.
Provision is made for payment of dividends to the Crown and also for a one-off payment of surplus capital immediately prior to establishment of the new corporation.
The independence of Public Trust in client matters is preserved and enhanced by a specific direction that it must, when managing and administering estates and in fulfilling any other fiduciary obligations, act in an independent manner free from any instruction or direction from the Crown.
With 36 outlets throughout New Zealand, Public Trust administers about 50,000 estates, trusts, funds and agencies. On behalf of individuals, it has a trustee role in relation to approximately $2 billion of assets, of which $1 billion is managed funds. In the corporate trustee area, Public Trust has a supervisory or trustee responsibility in relation to approximately $10 billion of assets. Public Trust's Common Fund stands at about $425 million, its Group Investment Funds at around $300 million and the retail Public Trust Investment Funds at about $250 million. Public Trust also holds the statutorily-required deposits of insurance companies.
Most Public Trust activities are commercial in nature, but it is also required to provide a number of statutory services which may not be income earning. These are of a regulatory, quasi-judicial, trustee of last resort, trustee-guardian and representative (ie in the case of legal incapacity) nature.
New Zealand has a system of local government largely independent of the central executive government. The system has, however, a subordinate role in the constitution, as the powers of local authorities are only those conferred by parliament. Local authorities fall into three categories, regional, territorial and special purpose authorities. Many territorial authorities contain one or more communities administered by community boards, but these are not separate local authorities.
Six special purpose authorities are constituted under their own acts and one, Infrastructure Auckland, is constituted under the Local Government Act 1974, which is the statute constituting regional councils and territorial authorities. Boundaries are usually defined by the Local Government Commission, or the Minister of Local Government. Local authorities have their own sources of income, independent of central government, with the basic source (apart from the income of trading activities under the control of territorial authorities) local taxes on landed property (rates). Rates are set by local authorities themselves, subject to the Rating Powers Act 1988.
Several important statutes apply not only to local authorities as defined in the Local Government Act, but to a wider range of public bodies. These include the Local Government Official Information and Meetings Act 1987, the Local Authorities (Members’ Interests) Act 1968 and the Local Elections and Polls Act 1976. Local authorities derive their functions and powers not only from local government legislation, but from numerous other acts, such as the Resource Management Act 1991, the Transit New Zealand Act 1989, and the Building Act 1991.
Under Parliamentary Standing Orders, local authorities can promote legislation about matters affecting areas within their jurisdiction which they are not empowered to deal with already. When permanent or major additional powers are sought, a local bill must be prepared for the consideration of parliament. If this is enacted, it becomes a local act, and applies only to the body or bodies which promoted it.
Local authorities are answerable to their electorates through triennial local body elections.
Legislation includes numerous provisions for local authorities to give public notice and receive public submissions before making certain important decisions. The Local Government Official Information and Meetings Act 1987 promotes open conduct of local authority meetings and sets out rights of access to official information. Local authorities may also come under the scrutiny of the ombudsmen, the Controller and Auditor-General and the Parliamentary Commissioner for the Environment.
The Minister of Local Government may appoint a review authority when it is considered there has been serious mismanagement by a local authority, and may require the local authority to implement the review authority's recommendations. Any decision by a local authority may be reviewed by appeal to the high court, and decisions under the Resource Management Act 1991 may be appealed to the environment court.
New Zealand has 12 regional councils, 74 territorial authorities, 147 community boards and seven special authorities. The Local Government Act 1974 as amended in 1989 holds as central recognition of the existence of different communities in New Zealand, their separate identities and values, and the effective participation of local people in local government. Local authorities are required by statute to conduct their affairs in an open and proper manner, to separate their regulatory and non-regulatory activities and to adequately inform local communities of their activities. Emphasis is placed on setting objectives and measuring performance. Local authorities are permitted to corporatise or privatise their trading activities and may put out the delivery of services to competitive tender as an alternative to using in-house business units. Table 3.18 lists territorial authorities and council members.
Regional councils. Regional councils are directly elected, set their own rates and have a chairperson elected by their members. Their main functions are matters under the Resource Management Act 1991 and the Soil Conservation and Rivers Control Act, the control of pests and noxious plants, harbour regulations and marine pollution control, regional aspects of civil defence, an overview of transport planning, and control of passenger transport operators. Some regional councils also have other functions, such as those formerly undertaken by land drainage boards.
Table 3.18. Territorial authorities
| Cities/districts | Council members1 |
|---|---|
1Based on October 1998 elections. Figures include mayors. 2Unitary authority. Source: Local Government New Zealand | |
| North Island | |
| Cities | |
| North Shore | 16 |
| Waitakere | 15 |
| Auckland | 20 |
| Manukau | 21 |
| Hamilton | 14 |
| Napier | 13 |
| Palmerston North | 16 |
| Porirua | 14 |
| Upper Hutt | 11 |
| Hutt | 13 |
| Wellington | 19 |
| Districts | |
| Far North | 11 |
| Whangarei | 14 |
| Kaipara | 11 |
| Rodney | 13 |
| Papakura | 13 |
| Franklin | 15 |
| Waikato | 15 |
| Waipa | 13 |
| Otorohanga | 8 |
| Waitomo | 11 |
| Thames-Coromandel | 10 |
| Hauraki | 13 |
| Matamata-Piako | 12 |
| South Waikato | 11 |
| Taupo | 13 |
| Tauranga | 14 |
| Western Bay of Plenty | 13 |
| Rotorua | 13 |
| Whakatane | 16 |
| Kawerau | 9 |
| Opotiki | 11 |
| Gisborne2 | 15 |
| Wairoa | 10 |
| Hastings | 15 |
| Central Hawke's Bay | 11 |
| New Plymouth | 17 |
| Stratford | 11 |
| South Taranaki | 13 |
| Ruapehu | 14 |
| Wanganui | 13 |
| Rangitikei | 12 |
| Manawatu | 14 |
| Horowhenua | 11 |
| Tararua | 9 |
| Kapiti Coast | 14 |
| Masterton | 11 |
| Carterton | 9 |
| South Wairarapa | 10 |
| South Island | |
| Cities | |
| Nelson2 | 12 |
| Christchurch | 25 |
| Dunedin | 15 |
| Invercargill | 13 |
| Districts | |
| Tasman2 | 14 |
| Marlborough2 | 13 |
| Kaikoura | 8 |
| Buller | 12 |
| Grey | 9 |
| Westland | 13 |
| Hurunui | 10 |
| Waimakariri | 15 |
| Selwyn | 14 |
| Banks Peninsula | 10 |
| Ashburton | 13 |
| Timaru | 13 |
| Mackenzie | 11 |
| Waimate | 12 |
| Waitaki | 16 |
| Queenstown-Lakes | 12 |
| Central Otago | 14 |
| Clutha | 15 |
| Southland | 13 |
| Gore | 12 |
| Chatham Islands Council | 9 |
Table 3.19 shows regional councils and council members based on the October 1998 elections.
Table 3.19. Regional councils
| Region | Council members1 |
|---|---|
1Based on October 1998 elections. Source: Local Government New Zealand | |
| North Island | |
| Northland | 8 |
| Auckland | 13 |
| Waikato | 14 |
| Bay of Plenty | 11 |
| Hawke's Bay | 9 |
| Taranaki | 10 |
| Manawatu-Wanganui | 11 |
| Wellington | 14 |
| South Island | |
| West Coast | 6 |
| Canterbury | 14 |
| Otago | 12 |
| Southland | 11 |
Territorial authorities. New Zealand's 74 territorial authorities consist of 15 city councils, 58 district councils and the Chatham Islands Council. Territorial authorities are directly elected, set their own rates and have a mayor elected by the people. They have a wide range of functions, including land use consents under the Resource Management Act 1991, noise and litter control, roading, water supply, sewage reticulation and disposal, rubbish collection and disposal, parks and reserves, libraries, land subdivision, pensioner housing, health inspection, liquor licensing, building consents, parking controls and civil defence. New cities can now be constituted only by a reorganisation scheme where a new district is formed and that district has a population of at least 50,000, is predominantly urban, is a distinct entity and a major centre of activity within the region.
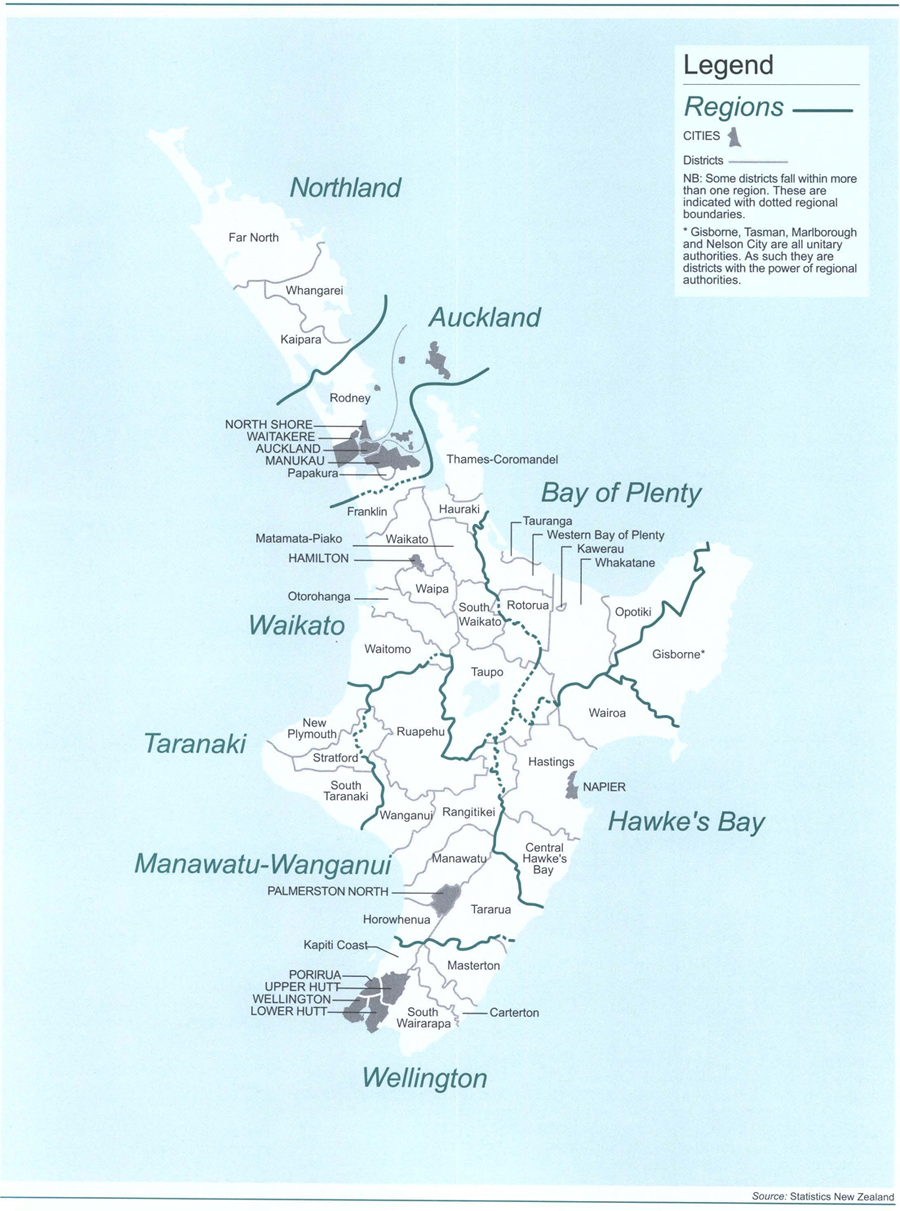
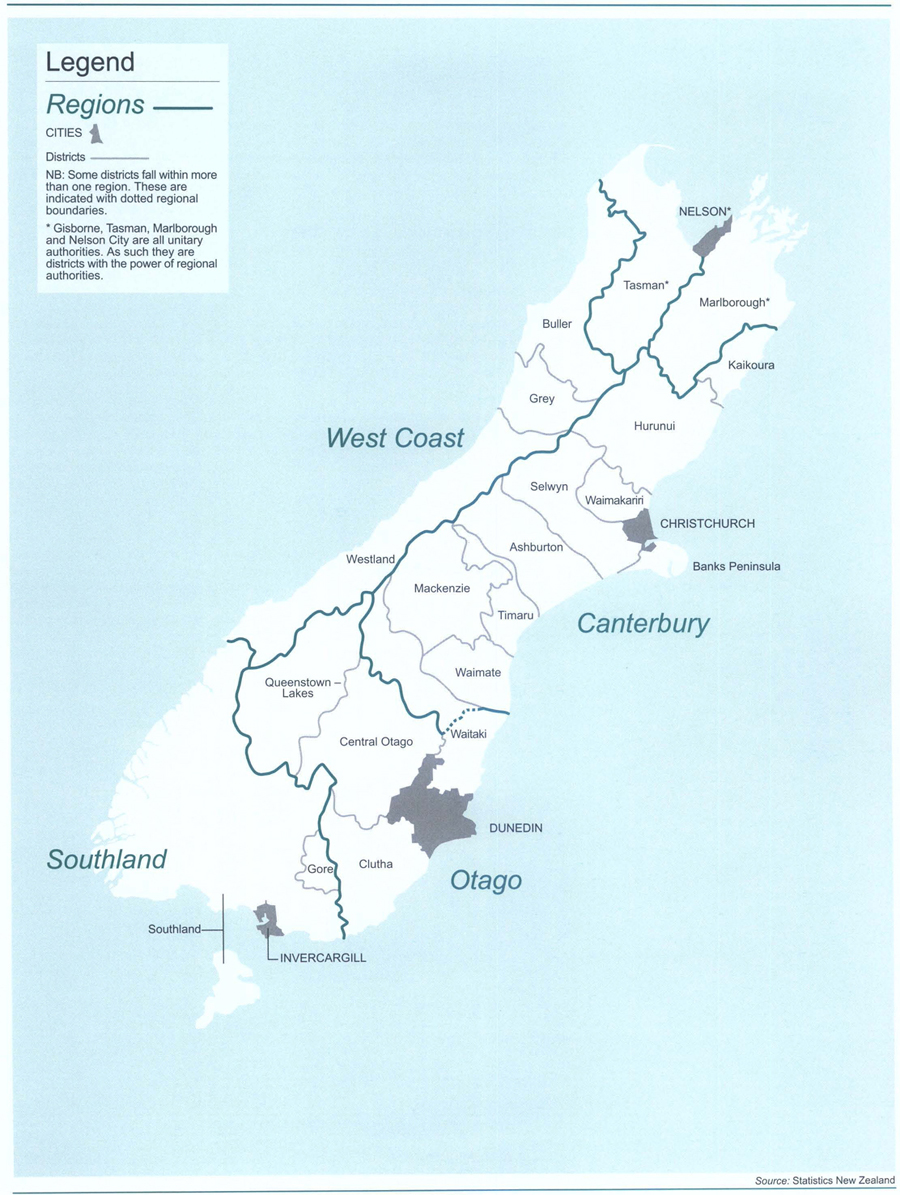
Unitary authorities. Unitary authorities are territorial authorities which also have regional powers. Legislation in 1989 prevented any unitary authorities being established, other than in Gisborne. However, an amendment in 1992 not only created three more unitary authorities (Marlborough District, Tasman District and Nelson City), but made it possible for others to be created by submitting proposals to the Local Government Commission.
Community boards. A community board is primarily an advocate for its community and a means whereby the territorial authority can consult with the community. Any power the community board has is delegated by the territorial authority, but cannot include such powers as levying rates, appointing staff or owning property. Community boards are partly elected by the community and partly appointed by the territorial authority from among its own members, or are entirely elected. Community boards can be established anywhere in New Zealand to serve any number of inhabitants. They may be established upon the initiative either of a given number of electors of the territorial authority, or as provided in a reorganisation scheme. Community boundaries often coincide with those of wards (divisions of the district for electoral purposes). Boards have between four and 12 members.
The number of special purpose local authorities was greatly reduced following local body reform in 1989. Catchment boards, harbour boards, pest destruction boards and land drainage boards, among others, disappeared, with their functions reallocated either to regional councils or, to a lesser extent, to territorial authorities. Categories remaining include scenic and recreation boards. There are also some one-off authorities such as the Aotea Centre Board of Management, the Canterbury Museum Trust Board, the Council of the Auckland Institute and Museum, the Otago Museum Trust Board, the Masterton Lands Trust, the Greytown Lands Trust and Infrastructure Auckland.
Infrastructure Auckland. Infrastructure Auckland was created in 1998 to help address the Auckland region's land and passenger transport and stormwater problems. As successor to the Auckland Regional Services Trust, Infrastructure Auckland inherited the assets of the trust, except those of Watercare Services Ltd, which were transferred to Auckland local authorities. Infrastructure Auckland's assets are estimated to be worth around $1 billion and include 80 percent of the shares in Ports of Auckland Ltd and 100 percent of America's Cup Village Ltd and Northern Disposal Systems Ltd. The mandate for this wealth as defined by legislation is to benefit the community as a whole by making grants to land and passenger transport and stormwater projects. When Infrastructure Auckland was initially set up, it was controlled by nine members, six former members of the Auckland Regional Services Trust and three appointed by an electoral college. From 1 July 1999, that number was reduced to seven members and from 1 January 2000, the electoral college has had sole power to appoint all members and the chairperson. The electoral college comprises eight members, made up of one member from each of the seven territorial authorities in the Auckland region and one from the Auckland Regional Council. Members representing Manukau and Auckland City Councils have three votes, members representing Waitakere and North Shore City have two votes, with the other four council representatives each having one vote. Apart from appointing and discharging members and the chairperson of Infrastructure Auckland, they also, among other things, monitor Infrastructure Auckland's performance.
A sketch perspective of the proposed Britomart underground railway station in Auckland.
Local government elections are held on the second Saturday in October every third year. The next elections will be in 2004. All regional council, territorial authority, special purpose local authority and community board elections are conducted at the same time. In the year before an election, regional and territorial authorities are required to review the number of members and the number and size of their electorates. Electorates are known as wards in the case of territorial authorities and constituencies in the case of regions. Territorial authorities have the option of deciding whether members will be elected by the electors of the district as a whole. Regions must be divided into constituencies. The purpose of the review is to give effective representation to communities of interest and fair representation to electors. The review process provides for objections and appeals by the public. When necessary, final decisions are made by the Local Government Commission.
Voting procedures. Although postal voting is now universal, any territorial authority may decide whether an election is to be conducted by attendance at a polling booth, or by post. The method of casting a vote is similar to parliamentary elections. The surnames of candidates are printed on the ballot paper and electors place a tick after the name of the candidate they wish to vote for. The voting system currently used is ‘first past the post’. From 2004, however, elections for district health boards will use the single transferable vote (STV) system, while other local authorities will have the option of using STV.
Local authority franchise. Every parliamentary elector is automatically qualified as a residential elector of a local authority if the address at which the person is registered on the electoral roll is within the district of the local authority. Ratepayers who are not residents are entitled to enrol and vote in any region, district or community in which they pay rates. Rolls are compiled by territorial authorities, who usually compile rolls and conduct elections for other authorities as well. Information for the residential electoral roll is obtained from the parliamentary electoral database, and the ratepayer roll is compiled from enrolment forms received from ratepayers.
Membership of local authorities. Subject to meeting certain residency and citizenship requirements, any person who is a parliamentary elector may be elected to a regional council or territorial authority or community board. In 1992, a prohibition was introduced on a person being a candidate for both a regional council and a territorial authority or community board within that region. Vacancies may be filled either by an election or by appointment, depending upon the type of council, the circumstances of the vacancy and the wishes of electors.
Remuneration. Most boards and councils pay their chairperson or mayor an annual salary, while other members are paid a combination of a daily meeting allowance and an annual salary. Maximum and minimum salary and allowance levels are set by the Higher Salaries Commission, giving the council or board the discretion to decide the actual rate within the prescribed limits.
The Local Government Commission comprises three members, one of whom is the chairperson, appointed by the Minister of Local Government. The commission has two major functions. Firstly, as a quasi-judicial appeal authority, to hear and determine appeals against decisions of local authorities on proposed boundary alterations; appeals and counter-objections relating to ward and membership proposals of a local authority following its triennial review of representation and membership; proposals for the constitution of communities; and proposals for the reorganisation, or abolition, of communities where there is disagreement between a community board and its parent authority. Secondly, the commission has responsibilities relating to the consideration and processing of reorganisation proposals for the union or constitution of districts or regions. The commission may also carry out investigations of particular matters affecting local government and report on them to the Minister of Local Government.
The New Zealand coat of arms is protected under the Flags, Emblems, and Names Protection Act 1981 and its lawful use is confined to official purposes.
Under the Flags, Emblems, and Names Protection Act 1981, the flag previously known as the New Zealand ensign was declared the national flag of New Zealand. It is the symbol of the realm, government and people of New Zealand. The basis of the New Zealand Flag is the Union Flag (Jack) in the upper left quarter, and, on a blue ground to the right, the Southern Cross represented by four five-pointed stars with white borders.
New Zealand has two national anthems: God Defend New Zealand and God Save the Queen. God Defend New Zealand is a poem written by Thomas Bracken set to music composed by John J Woods. It was first performed in public on Christmas Day 1876 and formally adopted as the national hymn in 1940. In 1977, with the permission of Queen Elizabeth II, the government adopted both God Defend New Zealand and God Save the Queen as national anthems of equal status to be used in the order appropriate to the occasion.
Māori and English texts of the New Zealand national anthem
| Aotearoa | God Defend New Zealand |
|---|---|
| Source: Ministry for Culture and Heritage | |
1. E Ihowā Atua, O ngā iwi mātou rā Āta whakarongona; Me aroha noa Kia hua ko te pai; Kia tau tō atawhai; Manaakitia mai Aotearoa | 1. God of Nations at Thy feet, In the bonds of love we meet, Hear our voices, we entreat, God defend our free land. Guard Pacific's triple star From the shafts of strife and war, Make her praises heard afar, God defend New Zealand. |
2. ōna mano tāngata Kiri whero, kiri mā, Iwi Māori Pākehā, Rūpeke katoa, Nei ka tono ko ngā hē Māu e whakaahu kē, Kia ora mārire Aotearoa | 2. Men of every creed and race, Gather here before Thy face, Asking Thee to bless this place, God defend our free land. From dissension, envy, hate, And corruption guard our State, Make our country good and great, God defend New Zealand. |
3. Tōna mana kia tū! Tōna kaha kia ū; Tōna rongo hei pakū Ki te ao katoa Aua rawa ngā whawhai Ngā tutū a tata mai; Kia tupu nui ai Aotearoa | 3. Peace, not war, shall be our boast, But, should foes assail our coast, Make us then a mighty host, God defend our free land. Lord of battles in Thy might, Put our enemies to flight, Let our cause be just and right, God defend New Zealand. |
4. Waiho tona takiwā Ko te ao mārama; Kia whiti tōna rā Taiāwhio noa. Ko te hae me te ngangau Meinga kia kore kau; Waiho i te rongo mau Aotearoa | 4. Let our love for Thee increase, May Thy blessings never cease. Give us plenty, give us peace, God defend our free land. From dishonour and from shame, Guard our country's spotless name, Crown her with immortal fame, God defend New Zealand. |
5. Tōna pai me toitū Tika rawa, pono pū; Tōna noho, tana tū; Iwi nō Ihowā. Kaua mōna whakamā; Kia hau te ingoa; Kia tū hei tauira; Aotearoa | 5. May our mountains ever be Freedoms ramparts on the sea, Make us faithful unto Thee, God defend our free land. Guide her in the nations’ van, Preaching love and truth to man, Working out Thy glorious plan, God defend New Zealand. |
3.1 Ministry of Justice; Statistics New Zealand; Office of the Governor-General.
3.2 Office of the Clerk of the House of Representatives; Parliamentary Service; Cabinet Office; Chief Electoral Office; Ministry of Justice.
3.3 State Services Commission; government departments as listed; Office of the Controller and Auditor-General; Crown Company Monitoring Advisory Unit; Office of the Ombudsmen; Office of the Privacy Commissioner; Ministry of Justice; Office of the Parliamentary Commissioner for the Environment; Public Trust.
3.4 Local Government Commission; Department of Internal Affairs; Local Government New Zealand.
3.5 Ministry for Culture and Heritage.
Statistics New Zealand divisional manager responsible: Ian McLeod.
Burrows JF (1999). Statute Law in New Zealand, Butterworths, Wellington.
Chen M, and Palmer G (1993). Public Law in New Zealand: Cases, materials, commentary and questions, Oxford University Press, Auckland.
Harris P, and Levine S (1994). The New Zealand Politics Source Book 3rd ed, Dunmore Press, Palmerston North.
James C (ed) (2000). Building the Constitution. Institute of Policy Studies, Victoria University of Wellington.
Joseph PA (2000). Constitutional and Administrative Law in New Zealand 2nd ed, Brookers, Wellington.
Joseph PA (ed) (2001). Essays on the Constitution, 2nd ed, Brookers, Wellington.
Miller R (ed) (2001). New Zealand Government and Politics, Oxford University Press, Auckland.
Mulholland RD (1995). Introduction to the New Zealand Legal System, 8th ed, Butterworths, Wellington.
Palmer G, and Palmer M (1997). Bridled Power: New Zealand Government under MMP, Oxford University Press, Auckland.
Vowles J, and others (2002). Proportional Representation on Trial: The 1999 New Zealand general election and the fate of MMP, Auckland University Press, Auckland.
Boston J et al (ed) (1999). Electoral and Constitutional Change in New Zealand: An MMP source book, Dunmore Press, Palmerston North.
Cabinet Manual (2001). Cabinet Office, Department of the Prime Minister and Cabinet, Wellington.
General Election (Parl paper E.9).
New Zealand Electoral Compendium (2001). 2nd ed, Electoral Commission, Wellington.
Parliamentary Bulletin. Office of the Clerk of the House of Representatives, Wellington.
Public Service Principles, Conventions and Practice (series). States Services Commission, Wellington.
Report of the Department of Internal Affairs (Parl paper G.7).
Report of the Department of the Prime Minister and Cabinet (Parl paper G.48).
Report of the Office of the Clerk of the House of Representatives (Parl paper A.8).
Report of the Parliamentary Service Commission (Parl paper A.2).
Standing Orders of the House of Representatives (1996, amended 1999). New Zealand Parliament, Wellington.
Step by Step Guide: Cabinet and cabinet committee processes (2001). Cabinet Office, Department of Prime Minister and Cabinet, Wellington.
Tables of New Zealand Acts and Ordinances and Statutory Regulations in Force (annual). Parliamentary Counsel Office, Wellington.
Anderson A (1990). The Quest for Efficiency: The origins of the State Services Commission, State Services Commission, Wellington.
Bassett M (1997). The Mother of All Departments, Auckland University Press and Historical Branch, Department of Internal Affairs, Wellington.
Boston J et al (1996). Public Management: The New Zealand model, Oxford University Press, Auckland.
Boston J (ed) (1995). The State Under Contract, Bridget Williams Books, Wellington.
James C (1997). Under New Sail: MMP and public servants, Institute of Policy Studies, Wellington.
Reports of the Controller and Auditor-General (Parl papers B.28 and B.29).
Report of the Parliamentary Commissioner for the Environment (Parl paper C.12).
Report of the Ombudsmen: Nga Kaitiaki Mana Tangata (Parl paper A.3).
Report of the State Services Commission (Parl paper G.3).
The New Zealand Government Directory (2000). Ministry of Justice, Wellington.
www.elections.govt.nz – Electoral Commission
www.vuw.ac.nz/inst-policy-studies – Institute of Policy Studies
www.lawcom.govt.nz – Law Commission
www.localgovtnz.co.nz – Local Government New Zealand
www.parliament.govt.nz – Office of the Clerk of the House of Representatives
www.ombudsmen.govt.nz – Office of the Ombudsmen
www.pce.govt.nz – Parliamentary Commissioner for the Environment
www.pco.parliament.govt.nz – Parliamentary Counsel Office
www.parliament.govt.nz – Parliamentary Service
www.ssc.govt.nz – State Services Commission
Table of Contents

An RNZAF Hercules arrives with supplies at Suai airport, East Timor.
The New Zealand Government established the then Department of External Affairs and began to station diplomatic representatives overseas in 1943. Today, New Zealand has 56 diplomatic and consular posts in 42 countries and territories and more than 50 honorary consuls. Multiple accreditation allows New Zealand representatives to cover 76 other countries and states from their bases (see Figure 4.1).
On behalf of the government, the Ministry of Foreign Affairs and Trade (MFAT), Te Manatū Aorere is responsible for all major policy functions related to New Zealand's external relations. The main thrust of the ministry's work is directed at management of New Zealand's bilateral relations with other countries and interests in international institutions. Other functions include management of development assistance, provision of consular services to New Zealanders abroad, and provision of operational and administrative support services to other New Zealand government agencies overseas.
The ministry is the official channel of communication between the New Zealand Government and other governments. It also administers Tokelau and undertakes external affairs and defence functions for the Cook Islands and Niue, after consultations with their heads of government.
The ministry consults closely with other government departments and agencies on domestic and international developments and their interrelationships. The New Zealand Trade Development Board is a particularly important partner in developing and implementing programmes to promote foreign exchange earnings.
The ministry also operates and administers the diplomatic and consular posts that represent and pursue New Zealand's interests overseas. The posts perform services on behalf of all government departments, offer assistance to New Zealanders overseas whether travelling in official or private capacities, and issue passports and visas overseas. The ministry's website is www.mft.govt.nz
The Pacific is a key area in New Zealand's international relations. New Zealand enjoys a close association with Pacific Island nations, with 11 diplomatic missions and consulates in the region and accreditation to a further eight. A special relationship exists between New Zealand and the Cook Islands, Niue and Tokelau. The Cook Islands became a self-governing state in free association with New Zealand in 1965, and Niue followed in 1974. Tokelau is a non self-governing territory of New Zealand under the purview of the United Nations Committee on Decolonisation. Cook Islanders, Niueans and Tokelauans are New Zealand citizens.
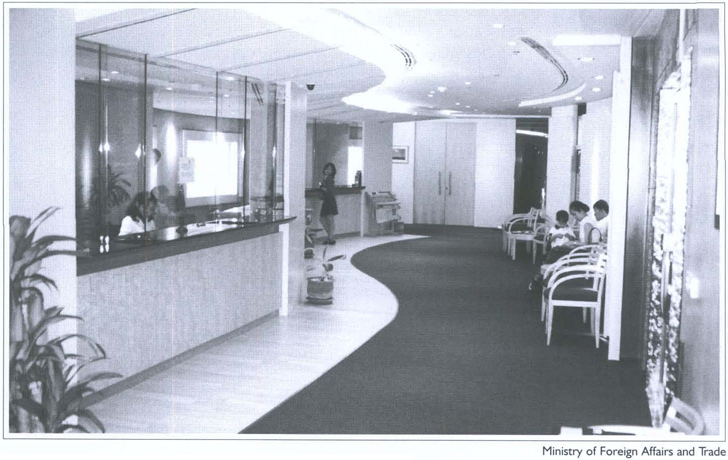
Inside the New Zealand Embassy in Bangkok, Thailand.
Security issues in New Zealand's regional neighbourhood are characterised by internal security challenges stemming from factors including ethnic differences, economic disparities, land disputes and transnational crime. New Zealand's involvement with these challenges, in particular in Bougainville, the Solomon Islands and Fiji, has been to encourage negotiated settlements and to join in regional efforts to support them, once achieved, by contributing to peace monitoring and reconstruction efforts. Regional cooperation in security matters has been centred on the Pacific Islands Forum and its regional security committee. A significant development was the ‘Biketawa Declaration’ made by forum leaders in 2000, under which the forum secretary-general was assigned a specific role in monitoring possible sources of conflict and developing methods of dispute settlement and conflict avoidance to prevent their developing into open conflict.
Trade with the Pacific region, though small compared with other regions, is important to New Zealand. Exports to the region totalled $490 million for the year ending June 2001, and imports for the same period amounted to $134 million. Imports from Pacific countries have duty-free access on a non-reciprocal basis to New Zealand and Australian markets under the South Pacific Regional Trade and Economic Cooperation Agreement (SPARTECA).
In 2001, the Pacific Agreement on Closer Economic Relations (PACER), a framework agreement covering all forum countries including Australia and New Zealand, and the Pacific Island Countries Free Trade Agreement (PICTA) among Pacific Island countries of the forum, were concluded. The PACER represents an important step in New Zealand's relations with Pacific Island countries, providing a framework for the development, over time, of modern arrangements to achieve closer trade and economic integration in the Pacific region.
New Zealand has developed extensive links with Pacific regional organisations. It was a founding member of the South Pacific Forum, formed in 1971 to promote regional cooperation, particularly in trade and economic development. Renamed in 1999, the Pacific Islands Forum now comprises 16 Pacific countries and provides an opportunity to discuss other regional and international issues of interest to the region, such as regional security, environmental issues, fisheries and economic development. Pacific Islands Forum countries meet annually at heads of government level, with meetings throughout the year at ministerial and officials level to consider a variety of specific issues. An important aspect of the forum's work is the annual Forum Economic Ministers’ Meeting (FEMM). Since the first meeting in 1995, ministers have agreed on an action plan covering accountability principles, public sector reform initiatives, tariff reform and investment reform. The 2001 FEMM endorsed a plan for a stocktake of regional economic reform.
Other regional organisations of which New Zealand is a member include the Forum Fisheries Agency (FFA), which assists members with management and conservation of the region's marine resources; the Pacific Community (formerly the South Pacific Commission), which helps promote economic and social development in the region through work in agriculture, marine resources, health, socio-economic and statistical services and community education; the South Pacific Regional Environment Programme (SPREP), which focuses on protection and management of environmental resources; the Pacific Forum Line (PFL), which facilitates regional trade through improved shipping links; and the South Pacific Applied Geoscience Commission (SOPAC), which assists countries in the assessment, exploration and development of mineral and other non-living resources.
The importance of fisheries as an economic resource in the Pacific led to the negotiation, completed in September 2000, of a convention covering conservation and management of highly migratory fish stocks (mostly tuna) in the western and central Pacific. This convention, the first regional fisheries management arrangement to base itself on the 1995 United Nations Fish Stocks Agreement, envisages establishment of a broad-based fisheries management organisation in the Pacific region, including both coastal states and distant water fishing nations. The first preparatory conference for establishment of the new fisheries management organisation was held in Christchurch in April 2001 and a further conference was held in Papua New Guinea in February 2002.
New Zealand has other links with the Pacific covering official development assistance, defence, and disaster coordination. The France, Australia, New Zealand (FRANZ) arrangement is an important element in the provision of rapid emergency assistance to the region in the event of natural disasters such as tropical cyclones.
New Zealand enjoys no closer partnership than that shared with Australia. The relationship is central to New Zealand's trade and economic interests, its defence, security and foreign policy interests, and to the country's overall economic and social well-being.
The political framework for management of the relationship includes regular dedicated meetings of prime ministers and Ministers of Foreign Affairs and Trade, and Defence. New Zealand is represented in Australia by a high commission in Canberra and a consulate general in Sydney.
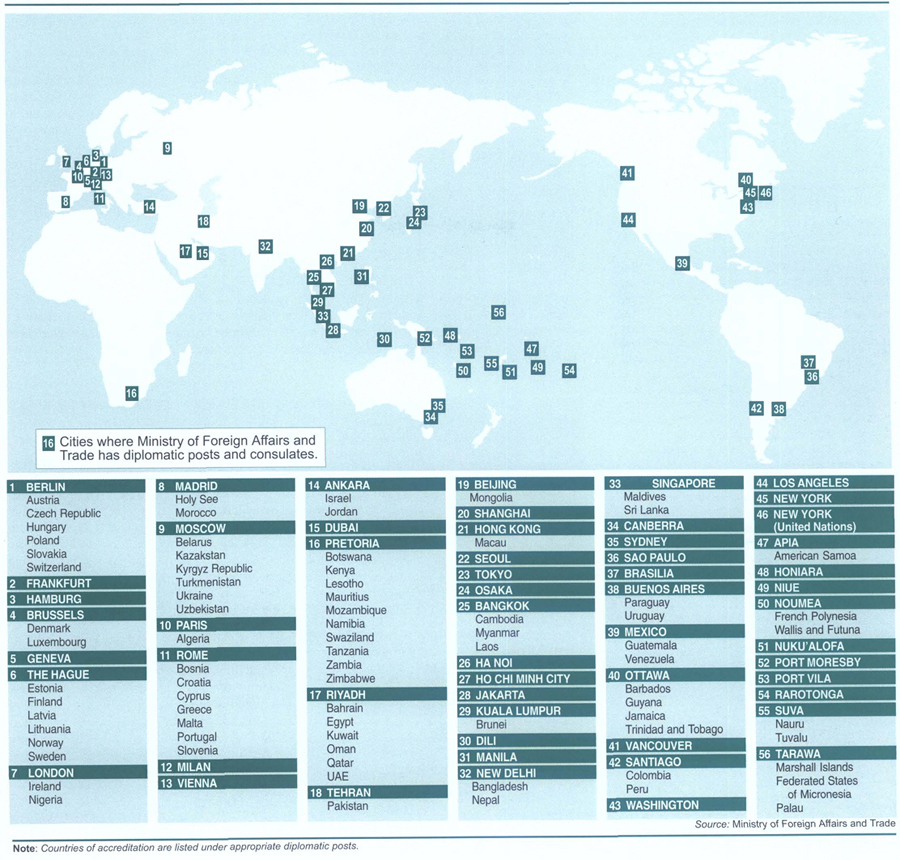
The Trans-Tasman Travel Arrangement (TTTA) enables New Zealand citizens to travel, live and work in Australia, and Australian residents to receive similar access to New Zealand. A new social security agreement negotiated with Australia, covering superannuation and severe disability, came into effect on 1 July 2002. The new arrangement preserves the ability of New Zealanders to live and work in Australia (and vice versa) under the TTTA, while allowing both governments to determine their own policies regarding access to all other social welfare benefits. There are more than 400,000 New Zealanders living in Australia and about 55,000 Australians in New Zealand. More than a million New Zealanders and Australians cross the Tasman on short-term visits each year.
Australia is New Zealand's most important trading partner and New Zealand is Australia's second largest market for manufactured goods. The Australia New Zealand Closer Economic Relations Trade Agreement (ANZCERTA or CER), signed in 1983, is the main instrument governing trade and economic relations between the two countries. The economies of the two countries have become increasingly integrated since signing of the agreement. Complete free trade in goods was achieved five years ahead of schedule, on 1 July 1990. The 1988 CER Protocol on Services provides for free trade in nearly all services sectors.
The CER relationship also addresses a range of non-tariff measures, such as customs requirements, standards, business law regulations and occupational registration requirements. A Joint Food Standards Treaty was signed in 1995. The following year CER was further expanded to include the Trans-Tasman Mutual Recognition Arrangement and the Arrangement on Food Inspection Measures, and, in 2000, an agreement on coordination of business law was signed. The 1996 Single Aviation Market Arrangement was expanded in 2000 to an ‘open skies’ agreement, which is currently in interim effect.
Australia is also New Zealand's closest and most important security partner. The alliance with Australia, founded in the Canberra Pact (1944), formalised in the ANZUS Treaty (1952), and finding current expression in the Closer Defence Relations (1991) concept, remains central to New Zealand's defence policies. Both governments are committed to achieving the highest possible level of interoperability with each other, while acknowledging the need for each to meet its own defence priorities. Australia and New Zealand are currently working together closely and effectively in East Timor, Bougainville and the Solomon Islands.
New Zealand has a long association with Asia, dating back to its military involvement in the region during World War II and, later, the Korean War. New Zealand was a founding member of the Colombo Plan and contributed significant levels of development assistance to many Asian countries throughout the 1960s and 1970s. Assistance continues today.
With the reindustrialisation of Japan and the rapid development of a number of Asian economies in the post-war period, the Asian region offered New Zealand emerging markets for its exports as Britain moved to join the European Community in the early 1970s. Burgeoning trade formed a base for developing a relationship with Japan that has become one of New Zealand's closest and most mature. By virtue of shared size and strategic interests, New Zealand has developed a similarly high degree of cooperation with Singapore. In the year ending June 2001, Asia took 37 percent of all New Zealand's exports and provided 31 percent of imports. Trade in tourism and education services has been increasing rapidly, especially with the large economies of North Asia. There are also significant flows of direct investment between Asia and New Zealand.
Shanxi drummers from China perform at the 2001 Festival of Asia in Auckland.
The strong growth in New Zealand's economic links with Asia was dinted by the region's economic crisis in 1998. Most of the key markets affected by the crisis have since recovered, but some faced fresh uncertainties as a result of the slowdown in the United States economy in 2001. With New Zealand's economic future now inextricably linked with Asia, stability of the region remains integral to New Zealand's well-being. New Zealand invests considerable resources in developing closer political relations with neighbours in the Asian region. New Zealand is well represented in Asia by a network of 15 offices in Bangkok, Beijing, Hanoi, Ho Chi Minh City, Hong Kong, Jakarta, Kuala Lumpur, Manila, New Delhi, Osaka, Seoul, Singapore, Shanghai, Taipei and Tokyo.
Establishment of the Asia 2000 Foundation (see sidebar) in 1991 has seen New Zealand's relations with Asia expand beyond the trade and economic prism. Support for sister city links, cultural exchanges and Asian language programmes in New Zealand schools has helped promote closer cultural ties with Asia. New Zealand's increasing Asian orientation has resulted in greater numbers of people from Asia coming to New Zealand to holiday, study, work or live. Auckland has become the focus of New Zealand's Asian community, with one in eight people now of Asian descent.
At the political level, New Zealand is one of the original dialogue partners of the Association of South-east Asian Nations (ASEAN) and cooperates with members on a range of regional trade facilitation and economic development activities. A Closer Economic Partnership agreement between AFTA (ASEAN Free Trade Area) and CER (New Zealand and Australia) is being explored and has resulted in increased cooperation in a number of fields.
In the security arena, New Zealand takes part in the ASEAN Regional Forum, which provides ministers from throughout the Asia/Pacific region with an opportunity to focus collectively on regional security issues. New Zealand is also a member of the Five Power Defence Arrangements, which brings together Malaysia, Singapore, Britain, Australia and New Zealand.
In the economic field, New Zealand was a founding member of the Asia Pacific Economic Cooperation (APEC) and continues to participate actively towards achieving goals of free trade and increased investment in the region.
United States. New Zealand's relationship with the United States is one of its most important. Shared values underpin close government and private sector contacts across a broad range of bilateral, regional and multilateral activities. The United States is a key economic partner. It is one of New Zealand's three most important export markets and a major source of imports and investment. In the multilateral trade field, the two countries espouse similar open market philosophies. Cooperation is also close on international environmental matters and Antarctic scientific research. Programmes for scientific, cultural and educational exchange maintain an awareness of New Zealand in the United States and promote interchange of ideas and experiences.
Canada. New Zealand and Canada enjoy a positive and close relationship, based on shared bilateral Commonwealth, United Nations and Asia/Pacific interests. The two countries cooperate closely on a range of issues, including disarmament, international peacekeeping and security, Asia/Pacific policies and international economic matters. Canada is an important market for New Zealand's agricultural products, particularly beef. Bilateral trade and economic relations are conducted under the umbrella of the 1981 Trade and Economic Cooperation Agreement (TEC), which provides for, among other things, regular consultation on trade issues.
Latin America and the Caribbean. New Zealand has Latin American embassies and consulates in Mexico, Brazil, Chile and Argentina. The ambassador in Mexico is accredited to Venezuela and Guatemala, the ambassador in Santiago is accredited to Peru and Colombia and the ambassador in Buenos Aires is accredited to the Mercosur group of Argentina, Brazil, Uruguay and Paraguay. In addition to honorary consuls in Bogota, Lima, Caracas and Montevideo, a New Zealand Consulate General was opened in Sao Paulo in 1999. The high commissioner in Ottawa is accredited to the Caribbean countries of Barbados, Guyana, Jamaica and Trinidad and Tobago. Trade and investment is the primary focus of New Zealand's relationship with Latin America and the Caribbean. Exports mainly comprise dairy products, agricultural machinery and manufactured goods. New Zealand companies are involved in a wide range of activities in the region in the agriculture, forestry, fisheries, construction, telecommunications and energy sectors. New Zealand provides a modest amount of economic and social development assistance to the region. New Zealand shares interests with those of a number of Latin American and Caribbean countries in areas such as international trade, environment, Antarctica, disarmament and Pacific regional cooperation.
Western Europe. The European Union (EU) is a major political and economic entity which has become an increasingly significant player in world affairs. It is New Zealand's second largest market after Australia, and contact with the European Commission in Brussels, and also with the European Parliament, is critical to supporting New Zealand's trade access to Europe. The EU is the largest market for a broad range of primary produce, including sheepmeat, wool, butter, kiwifruit, apples and venison. It is also the most important market for New Zealand's growing wine exports. Successful negotiations during the GATT Uruguay Round resulted in a significant improvement in both the volume and overall stability of New Zealand's access to this market. While trade issues remain important, the breadth of New Zealand's relationship with the EU has expanded in recent years, with conclusion of air services agreements and a number of young peoples’ working holiday schemes with individual member states. The EU was the second largest source of tourists to New Zealand between 1996 and 2000 and, in the same period, was the largest contributor of new investment, totalling $18 billion. Twice-yearly political consultations are held at ministerial level with the revolving EU presidency and the European Commission. New Zealand has embassies or consulates in Berlin, Brussels, Frankfurt, Geneva, Hamburg, Madrid, Milan, Paris, Rome, The Hague and Vienna and a high commission in London. These posts are cross-accredited to all other EU member states and a number of EU applicant states, such as Poland, Hungary, the Czech Republic, Slovakia and the Baltic states. Regular contact is maintained by New Zealand's network of posts with individual EU member states, and with the European Commission in Brussels, on a range of economic and political issues.
Central and Eastern Europe and the Baltics. The former communist states of Central and Eastern Europe and the Baltics are evolving into multi-party democracies with free-market economies. Poland, Hungary and the Czech Republic have joined the North Atlantic Trade Organisation (NATO) and these countries, together with Slovenia, the Slovak Republic, Lithuania, Latvia and Estonia and, more recently, Bulgaria and Romania, are candidates for membership of the European Union. Several of the applicant states are expected to join the EU in the next few years and, as such, their economic importance for New Zealand is increasing. Central and East Europeans are taking a growing interest in the Pacific region, including New Zealand, and, in 2000/01, visitors have included the Slovak Speaker and ministers from Hungary, Poland, the Czech Republic, Bosnia-Herzegovina and Croatia. Responsibility for New Zealand's government-to-government relations with the Czech Republic, Hungary, Poland and Slovakia lies with the New Zealand Embassy in Berlin, and for Bosnia, Croatia and Slovenia with the embassy in Rome. Commercial relations with Central and Eastern Europe are handled by the Trade New Zealand office in Milan. The Baltic states of Estonia, Latvia and Lithuania are covered by the New Zealand Embassy in The Hague.
Russia and the Commonwealth of Independent States (CIS). Trade remains the central component of New Zealand's relations with the states that formerly made up the Soviet Union, the Russian Federation being the principle partner. Despite Russia's economic and financial problems, it remains an important, although diminished, market for New Zealand dairy products. The long-term potential for trade with some regions, notably the Russian far east, is strong. New Zealand cooperates with Russia on a range of international issues in regional bodies such as APEC and the ASEAN Regional Forum, and is heavily involved in negotiations for the accession of Russia to the World Trade Organisation. New Zealand has an embassy in Moscow, which is accredited to Belarus, Kazakhstan, Kyrgyzstan, Turkmenistan, Ukraine and Uzbekistan. In 2001, a new honorary consulate was opened in Vladivostok to cover New Zealand's interests in the Russian far east.
The implications of events in the Middle East for international peace and security make developments there of ongoing concern to New Zealand. The two issues which have preoccupied the international community for many years are the Arab-Israeli dispute and the threat which Iraq poses to its neighbours. For more than 40 years, New Zealand has maintained a balanced and constructive approach to the Arab-Israeli dispute, consistently upholding the right of the Palestinian people to a viable state and, with equal consistency, Israel's right to exist within secure borders. New Zealand supports moves to make the comprehensive economic sanctions imposed on Iraq by the United Nations Security Council more targeted in order to minimise the harm done to innocent civilians. It also supports better enforcement of the arms embargo to ensure that Iraq complies with disarmament obligations.
New Zealand has made a practical contribution to peace in the Middle East in the form of a contingent in the Sinai Multinational Force and Observers (MFO), based on the border between Egypt and Israel since 1982. The government also contributes defence personnel to the United Nations Truce Supervision Organisation (UNTSO), headquartered in Jerusalem.
New Zealand has significant economic interests in the Middle East. The region is a valuable market for New Zealand wool, dairy products, meat and, increasingly, manufactured goods and services. The Middle East is an important source for New Zealand's crude oil, polymers and fertilisers. In the year ended June 2001, New Zealand exports to the region totaled $1.116 billion, while imports for the same period were $2.086 billion.
New Zealand has embassies in Saudi Arabia (Riyadh), Turkey (Ankara) and Iran (Tehran), and accreditations to the United Arab Emirates, Egypt, Israel, Jordan, Bahrain, Kuwait, Oman and Qatar. New Zealand embassies in Paris and Madrid are accredited to Algeria and Morocco respectively. The New Zealand Trade Development Board has a regional office in Dubai.
New Zealand's official relations with Sub-Saharan Africa are in the main with the Commonwealth countries of southern and eastern Africa, with South Africa being the most substantial. There is a strong humanitarian focus to many of these relationships.
New Zealand has a longstanding involvement in development cooperation in Africa through its Official Development Assistance (NZODA) programme. The focus of the programme is on primary and non-formal education, rural development and primary health care. There is also provision for short-term technical assistance and support for New Zealand non-government organisations (NGOs), including Volunteer Service Abroad. Expenditure on all facets of NZODA, including scholarships, during 2000/2001 was $10.85 million.
New Zealand is also participating in the United Nations peacekeeping mission in Sierra Leone and its demining programme in Mozambique.
Trade with Sub-Saharan Africa accounts for only a small percentage of New Zealand's global trade, with exports valued at $165 million in the year ending June 2001. Among major exports to the region were dairy, fish and other food products, casein and electrical equipment. Imports, valued at $141 million in the year to June 2001, included petroleum products, iron and steel, vehicles and parts, tobacco, coffee and wine. In 2001, South Africa and Mauritius were New Zealand's most important markets in Sub-Saharan Africa.
New Zealand has one mission in Africa, the office in Zimbabwe being closed in November 2000. The New Zealand High Commission in Pretoria, South Africa, is accredited to 10 other southern and eastern African countries, Botswana, Kenya, Lesotho, Mauritius, Mozambique, Namibia, Swaziland, Tanzania, Zambia and Zimbabwe. The New Zealand High Commission in London is responsible for relations with Nigeria.
New Zealand's Official Development Assistance (NZODA) programme contributes to poverty reduction, helping to secure stability and harmony in the international community and, in particular, in the South Pacific region. Table 4.1 shows recent annual funding for NZODA programmes, while Figure 4.2 compares New Zealand's net official development assistance as a percentage of GNP with other countries.
Table 4.1. New Zealand Official Development Assistance (NZODA) programme
| Bilateral schedule | 1999/2000 | 2000/01 | 2001/02 |
|---|---|---|---|
| $(000) | $(000) | $(000) | |
| Pacific country programmes | |||
| Cook Islands | 6,200 | 6,200 | 6,200 |
| Fiji | 5,000 | 2,500 | 3,000 |
| French Polynesia | 175 | 175 | 175 |
| Kiribati | 3,100 | 3,100 | 3,100 |
| Micronesia | 825 | 850 | 850 |
| New Caledonia | 375 | 375 | 375 |
| Niue | 6,500 | 6,250 | 6,250 |
| Papua New Guinea | 11,000 | 10,500 | 10,000 |
| Samoa | 7,700 | 7,700 | 7,700 |
| Solomon Islands | 5,250 | 8,000 | 8,000 |
| Tokelau | 6,500 | 8,500 | 7,500 |
| Tonga | 5,600 | 5,600 | 5,600 |
| Tuvalu | 2,150 | 2,000 | 2,050 |
| Vanuatu | 5,200 | 5,250 | 5,250 |
| Wallis and Futuna | 75 | 75 | 75 |
| Pacific regional programmes | 12,120 | 11,355 | 11,105 |
| Pacific head of mission funds | 930 | 1,000 | 1,000 |
| Foreign investment and financial services | 0 | 750 | 750 |
| Total Pacific | 79,250 | 80,180 | 78,980 |
| Other bilateral programmes | |||
| Asia | 31,800 | 32,735 | 31,025 |
| Africa/Americas | 5,530 | 6,200 | 8,470 |
| Education and training | 25,450 | 25,450 | 24,650 |
| Voluntary agencies | 14,655 | 16,287 | 17,051 |
| Emergency and disaster relief | 4,500 | 5,230 | 4,075 |
| Good governance programme | 1,000 | 1,250 | 1,250 |
| Māori and Pacific partnerships for ODA | 0 | 75 | 50 |
| Bilateral total | 162,185 | 167,407 | 165,551 |
| Multilateral schedule | |||
| Commonwealth agencies | 2,956 | 3,942 | 3,982 |
| Pacific agencies | 11,315 | 12,140 | 12,540 |
| International financial institutions | 22,200 | 24,033 | 25,875 |
| United Nations agencies | 11,150 | 15,365 | 15,475 |
| Other multilateral | 2,916 | 3,640 | 3,104 |
| Multilateral total | 50,537 | 59,120 | 60,976 |
| NZODA total | 212,722 | 226,527 | 226,527 |
| Source: Ministry of Foreign Affairs and Trade | |||
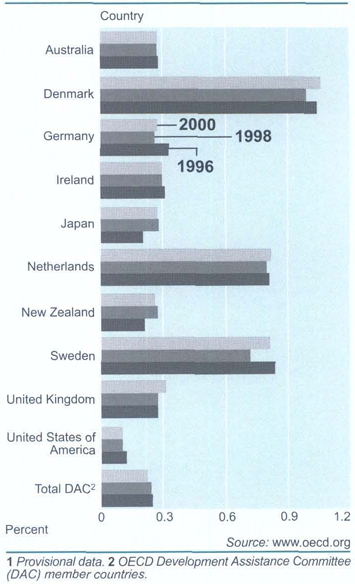
There is increasing international recognition that aid must be sharply focused on reducing poverty and promoting environmental sustainability. NZODA contributes directly to these goals (see sidebar). It recognises that partnership and participation are keys to cooperation between donor and partner countries. Respect for, and promotion of, internationally-recognised human rights and good and honest governance form the foundation of development.
NZODA programmes are designed to give developing countries greater choice and opportunity in a world in which globalisation is dramatically changing opportunities and options for weaker and more vulnerable nations. The programmes help to strengthen links between New Zealand and the peoples of developing nations, and to foster understanding and mutually beneficial relationships.
NZODA is managed by the Development Cooperation Division (DEV) of the Ministry of Foreign Affairs and Trade (MFAT), in conjunction with New Zealand's diplomatic posts in partner countries. Other government departments and agencies, and civil organisations, also contribute significantly to the overall New Zealand aid effort. The division's development expertise and experience are supplemented and complemented by those of a wide range of New Zealanders and partner country counterparts drawn from both public and private sectors. The division helps facilitate and coordinate the work of other New Zealand departments and agencies, including non-government organisations.
A child assists in building a new classroom in Uganda under a New Zealand Government-funded project to help traumatised children.
An independent review of the NZODA programme, commissioned by ministers, has produced recommendations for new directions for NZODA, which were under consideration as this publication went to press.
The NZODA programme is funded by two core payments set by parliament. For the 2001/02 financial year these were:
$226,527 million as Non-Departmental Payments (NDP). The NDP is the core of the ODA allocation and covers transfers of New Zealand goods, services and funding.
$16,454 million for ODA management, funded as one of the MFAT output classes.
Some other activities or transfers that meet the Organisation for Economic Cooperation and Development's definition of official development assistance are funded from other government sources. Total disbursement on NZODA amounts to around 0.24 percent of New Zealand's gross national product (GNP). New Zealand's ODA programme is divided for financial and administrative purposes into two broad schedules of activities: bilateral and multilateral.
Direct bilateral (country to country) assistance accounts for 47 percent of New Zealand's total official development assistance (ODA). New Zealand's ODA bilateral schedule includes development cooperation with 63 countries. The main focus is on extensive cooperation programmes with 19 major partner countries in the South Pacific, South-east Asia, China and South Africa. The bilateral schedule is dominated by direct assistance on a one-to-one, country-to-country basis in the form of development projects and activities. This schedule includes a number of regional programmes which serve groups of bilateral partner countries; scholarship programmes for overseas students funded independently of the bilateral country programmes; the work of Volunteer Service Abroad (VSA) and non-government organisations (NGOs) working at grassroots levels in developing countries; and substantial contributions for emergency and disaster relief operations, both government-to-government and through international agencies.
Bilateral country and regional programmes are developed on a three-year rolling basis, with each individual year's country or regional programme containing a mixture of continuing activities and new proposals. Development assistance has been provided in many sectors, including agriculture, communications, conservation and environment, education and training, energy, fisheries, forestry, health, industry, public sector reform, social infrastructure, tourism, transport, water resources and gender development.
New Zealand participates in partnership projects by contributing technical assistance, cash grants, material supplies and training. A key component is the transfer of appropriate New Zealand expertise, for example in areas such as ecotourism and business development. Recent emphasis on environmental management has led to NZODA-funded technology transfers in the fields of nature conservation, environment impact assessment capacity-building, assistance with climate change negotiations, waste management, pollution, land use planning, soil conservation and environmental education. Recent interest in many developing countries in issues of good governance, including law and justice and public sector capacity building, has opened new areas for cooperation.
New Zealand promotes development of the South Pacific region as a whole, with contributions to a number of regional and multilateral agencies. These include the Pacific Islands Forum Secretariat, the Forum Fisheries Agency, the Secretariat of the Pacific Community, the South Pacific Applied Geoscience Commission, the South Pacific Regional Environment Programme and the International Finance Corporation's South Pacific Project Facility.
Human resource development is the largest single investment area in New Zealand's development cooperation with Pacific Island countries. Much of this development has been delivered within New Zealand, in the form of study and training awards. NZODA also supports regional educational institutions in the South Pacific through core and project funding, as well as in-country training and staff development. Outer island and rural development are also features of several Pacific Island country programmes.
Education and training. New Zealand recognises that people are at the centre of development, and that human resource development is the key to social and economic progress in developing countries. Besides funding scholarships, training and programmes to strengthen education systems and institutions under bilateral country programmes, cross-regional scholarships are also made available. A major review of New Zealand's Official Development Assistance investment in the education sector is currently underway.
Emergency and disaster relief. Emergency and disaster relief is allocated as the need arises, with disasters in the South Pacific region having first call on New Zealand's limited funds. Where natural disasters befall near neighbours, New Zealand is often able to send supplies, medical teams or other skilled people to help recovery work. When disaster strikes in more distant countries, New Zealand usually responds by making cash grants to international relief appeals. Direct response may also be possible. New Zealand Red Cross staff sent to emergency situations as international delegates are also supported under the emergency and disaster relief programme. Disaster mitigation is supported by overseas development assistance grants to the South Pacific Applied Geoscience Commission (SOPAC), as coordinator of the South Pacific disaster reduction programme. An emergency disaster relief non-government organisation funding window provides a transparent and consistent means by which New Zealand non-government organisations can access overseas development assistance funding for emergency and disaster relief, rehabilitation and mitigation activities in developing countries.
Non-government organisations. The New Zealand Official Development Assistance (NZODA) programme supports the work of non-government organisations (NGOs) through a range of funding mechanisms. These include special development and emergency relief funding programmes for New Zealand NGOs, support for the activities of New Zealand NGOs through bilateral programmes and direct funding to NGOs on the ground in partner countries.
The two main programmes for NZODA support of NGOs are the Voluntary Agency Support Scheme (VASS) and an agreement with Volunteer Service Abroad (VSA) to support New Zealand volunteers in developing countries. In 2001/02, funding of $9 million was available through VASS for NGO-sponsored, small-scale development projects overseas. Projects are funded on a 2:1 general ratio (ie two dollars from NZODA for every dollar contributed by the NGO) and 4:1 for activities which have a specifically gender development or NGO capacity-building focus. NGO proposals for VASS funding are assessed by a project selection committee consisting of representatives elected by the NGO community, a ministerial appointee and the NZODA NGO programme manager.
There are six funding rounds a year and funding recommendations from the committee are submitted to the associate Minister for Foreign Affairs and Trade, or the Director of DEV, depending on the size of the grant involved. VASS incorporates a special Partnership for Development Fund which provides small grants to support development of new linkages between New Zealand community groups and overseas counterparts. Funding is also available through VASS to assist efforts aimed at strengthening the capacity of New Zealand NGOs.
New Zealand agencies with a consistent record of projects and programmes which have met VASS criteria are eligible to receive an accountable block grant rather than applying individually by project. Agencies receiving block grants are reviewed every three to five years to ensure VASS criteria and requirements are being adhered to. There is a strong focus within VASS on learning from experience. It is planned to institute a regular series of impact reviews of NGO activity overseas to draw lessons of relevance to the broader NGO community in New Zealand.
Through its contract with Volunteer Service Abroad, NZODA supports core costs for sending New Zealand volunteers to Africa, Asia and the Pacific. The core allocation for 2001/02 was $4.36 million. Volunteers operate in a range of sectors, including community development, education and training, economic development, agriculture, health and natural resource management. Support for VSA activities is also provided through the NZODA bilateral programmes for South Africa, Cambodia, East Timor, Lao PDR, Vietnam, Bougainville and Tokelau.
NZODA also supports the Council for International Development (CID), the umbrella group for New Zealand development NGOs. CID provides the primary interface between the NGO community and NZODA, and has worked with the ministry to develop a strategic policy framework for relations between NZODA and the NGO sector. Within the terms of a three-year agreement, $360,000 in core funding was provided to CID in 2001/ 02. This included provision for an NZODA/NGO travel fund to support NGO participation in significant international development conferences of wide interest to the NGO development community.
Funding by NZODA for development education activities was increased to $749,000 in 2001/02. From this is drawn core funding for the Development Resource Centre (DRC) under a three-year agreement with NZODA. The DRC provides information on development issues, training and educational resources for teachers, and training programmes for development consultants.
Support is also provided by NZODA for the alternative trading activities of Trade Aid, the aim of which is to support community development and promote local self-reliance in developing countries. In 2001/02, $562,000 was made available under a new three-year agreement to assist with the purchase of products from community cooperatives, improve partnerships with developing country counterparts and improve marketing and business practices.
Multilateral assistance makes up 26 percent of funds available to the New Zealand Official Development Assistance programme. Participation in institutions such as the International Development Association, the Asian Development Fund, the United Nations Development Programme and the Commonwealth Fund for Technical Cooperation gives New Zealand a role in international efforts to alleviate poverty through development at the global and regional level. These multilateral institutions are especially helpful in directing assistance to regions where New Zealand is not represented. They are respected for their neutrality and the expertise they bring to development issues.
New Zealand also co-finances individual projects with multilateral agencies. Special consultant trust funds totalling around $1 million have been established at the World Bank and the International Finance Corporation. These trust funds provide money for contracting New Zealand consultants for a range of developmental projects.
Negotiations on the eighth replenishment of the Asian Development Fund, the Asian Development Bank's soft loan facility, were concluded at the end of 2000 and New Zealand's contribution is $39.6 million over seven years. New Zealand is engaged in a similar replenishment of the World Bank's concessional lending fund, the International Development Association. New Zealand is also a member of the International Fund for Agricultural Development and contributed $2.16 million to the fifth replenishment of its resources.
New Zealand contributed $6.4 million in 2000 to trust funds of the International Monetary Fund and the World Bank, which contribute to debt relief under the Heavily Indebted Poor Countries initiative. This initiative is designed to provide substantial debt relief to heavily-indebted countries with a strong commitment to social and economic reform.
New Zealand was able to increase most of its contributions to United Nations and Commonwealth agencies during 2000, in recognition of their work to alleviate poverty. New Zealand will continue its contribution to the WTO's technical assistance activities in response to the need faced by developing countries for training in trade policy concepts and practices.
During 2000/01, New Zealand maintained support for multilateral sustainable development activities, including ongoing work with the Commission on Sustainable Development, replenishment of the Global Environment Facility, the Montreal Protocol for the Protection of the Ozone Layer, the Consultative Group on International Agricultural Research and development of an environmental vulnerability index by the South Pacific Applied Geoscience Commission.
New Zealand was a founding member of the United Nations in 1945 and successive governments have strongly supported it as the major global instrument for maintaining peace and security, for developing friendly relations among countries, for encouraging international cooperation aimed at solving economic and social problems, for establishing and strengthening an international legal framework, and for promoting respect for human rights. The range and complexity of United Nations functions and its specialised agencies have grown steadily over the years and New Zealand concentrates on areas where it can play a useful role in matters directly affecting its interests and where it can support efforts to secure lasting peace and security (see sidebar).
New Zealand is a strong advocate of international law and is actively engaged in global debates on peace and security issues, conflict prevention, sustainable development and promotion of human rights. New Zealand is a member of the Statistical Commission of the Economic and Social Council of the United Nations, as well as a member of the governing bodies of a number of programmes and specialised agencies, including the committee on economic, social and cultural rights of the Commission on Human Rights.
Minister of Foreign Affairs and Trade Phil Goff addresses the General Assembly of the United Nations.
Contributions to the United Nations. Contributions to the United Nation's budget are based on members’ capacity to pay. New Zealand contributed annual dues to the United Nations of NZ$5.08 million for the regular budget in 2000, and NZ$13.34 million for the peacekeeping budget and for support for international criminal tribunals in 2000/01. As a result of reform of the previous scales of assessment, New Zealand's level of assessment for contributions to both budgets rose from 0.221 percent of the total budget in 2000 to 0.242 percent in 2001. New Zealand's contributions to budgets of specialised United Nations agencies vary, with assessments fixed according to a scale agreed by members of each agency.
Human rights. As a party to international human rights instruments, New Zealand is required to report regularly to United Nations monitoring bodies on measures it has taken to give effect to international standards.
During 2001, New Zealand submitted its second periodic report under the United Nations Convention on the Rights of the Child; its third periodic report under the Convention Against Torture and Other Cruel, Inhuman or Degrading Treatment or Punishment; its second periodic report under the International Covenant on Economic, Social and Cultural Rights; and the 12th, 13th and 14th consolidated reports under the International Convention on the Elimination of All Forms of Racial Discrimination. The fifth periodic report for the Convention on the Elimination of All Forms of Discrimination Against Women is being prepared by the Ministry of Women's Affairs for submission.
At the 2001 sessions of the United Nations Commission on Human Rights and the Third Committee of the United Nations General Assembly, which both dealt with civil, political, economic, social and cultural rights issues, New Zealand supported resolutions addressing a wide range of international human rights concerns, in particular women's, indigenous and children's rights; the rights of people with disabilities; and human rights treaty body reform issues.
New Zealand continued to provide financial support during 2001 for the protection and promotion of human rights internationally. In particular, New Zealand provided practical human rights capacity-building assistance, with an emphasis on Asia-Pacific region countries.
Issues relating to the rights of children continue to be a priority for New Zealand. In November 2001, New Zealand ratified the United Nations Convention on the Rights of the Child (UNCROC) Optional Protocol on the Involvement of Children in Armed Conflict. It is expected that New Zealand will soon ratify the UNCROC Optional Protocol on the Sale of Children, Child Prostitution and Child Pornography. In addition, in June 2001, New Zealand ratified International Labour Organisation Convention 182 on the Elimination of the Worst Forms of Child Labour.
New Zealand has also been actively involved in international initiatives focusing on indigenous people, being the first state to make a financial contribution to establishment of the Permanent Forum on Indigenous Issues. New Zealand also provided technical support to the forum. New Zealand participated in the Working Group on Indigenous Populations, organising a seminar on Māori development during the meeting. New Zealand also took part early in 2002 in the seventh session of the Working Group considering a Draft Declaration on the Rights of Indigenous People.
Specialised agencies. The United Nations system encompasses 14 autonomous organisations known as specialised agencies (14 if the World Bank group is counted as one, 19 if the World Bank group is split). There are also a large number of additional bodies with their own secretariats, budgets and operations. New Zealand is a member of all major specialised agencies. Among the largest is the Food and Agricultural Organisation, which aims to raise levels of nutrition and global living standards, to promote agriculture and food security and to expand the world economy. Similarly, the World Health Organisation seeks attainment by all people of the highest possible levels of health. The International Labour Organisation (ILO) seeks to improve working and living conditions, and the United Nations Educational, Scientific and Cultural Organisation seeks to increase international cooperation through education, science and culture. New Zealand served on the governing body of the ILO from 1999 to 2002. Other specialised agencies of which New Zealand is a member are concerned with civil aviation, agricultural development, maritime safety, telecommunications, postal services, patents and trademarks, climate and weather, and industrial development. New Zealand participates in other United Nations bodies and programmes concerned with such diverse subjects as nuclear non-proliferation, refugees, development and environmental issues. New Zealand was elected to the executive board of the United Nations Development Programme for a three-year term which began on 1 January 2000, and to the governing council of the United Nations Environmental Programme for the period 2000 to 2002.
The World Trade Organisation (WTO) is the only international organisation dealing with rules of trade among nations. It acts as a single institutional framework over the General Agreement on Tariffs and Trade (GATT) and the multilateral agreements that resulted from the Uruguay Round.
Former New Zealand Prime Minister Mike Moore was appointed Director-General of the WTO in 1999 (see sidebar). Mr Moore was succeeded in September 2002 by Dr Supachai Panitchpakdi, former deputy Prime Minister of Thailand.
The GATT came into force in 1948. Its basic aim was to help trade flow as freely as possible by removing obstacles and increasing transparency, thereby contributing to international economic growth and development.
By the time the WTO came into force on 1 January 1995, the GATT's contracting parties accounted for about 90 percent of world trade. The WTO provides both a code of rules and a forum in which the 142 countries who belong to the organisation can discuss and address trade problems and negotiate and enlarge world trading opportunities. It is based on the premises that the trading system should be:
Without discrimination – The ‘most favoured nation’ clause stipulates that each WTO member must grant all other members treatment as favourable as that which they grant any other country. This principle is particularly important for countries such as New Zealand, since it ensures that larger countries cannot adopt discriminatory trade policies, except for preferential free trade areas and customs unions. A second non-discrimination principle is ‘national treatment', which requires that imported products be treated no less favourably than domestic products with respect to internal taxes, regulations and other requirements.
Freer – Barriers such as tariffs should progressively come down through negotiations.
Predictable – Businesses should be confident that trade barriers, including tariffs, non-tariff barriers and other measures, will not be raised arbitrarily. This is achieved by members making binding commitments not to raise trade barriers beyond current levels.
Transparent – Less transparent instruments, such as quotas and import licensing, are discouraged in favour of protection in the form of tariffs.
More competitive – Unfair practices, such as export subsidies and dumping products below cost to gain market share, are discouraged.
More beneficial to less developed countries – Developing countries are allowed more time to adjust, greater flexibility and special privileges to help them in their developmental objectives.
Eight rounds of multilateral trade negotiations were held under the auspices of the GATT, each with the aim of liberalising trade between contracting parties by reducing trade barriers and other measures impeding free trade.
The most ambitious of these was the Uruguay Round (1986–94). In addition to establishing the WTO, the Uruguay Round:
Brought agriculture effectively within the multilateral trading system for the first time.
Secured eventual integration of the textiles and clothing sector into the WTO system.
Extended the multilateral trading system to trade in services.
Strengthened multilateral trade rules in areas such as subsidies, anti-dumping, technical barriers to trade, sanitary and phytosanitary measures, safeguards, trade-related investment measures and dispute settlement.
Established a multilateral framework for protection and enforcement of intellectual property rights.
Further reduced tariffs on goods.
The highest decision making level in the WTO is the Ministerial Conference, which meets every two years to make decisions on matters under WTO agreements.
The most recent Ministerial Conference took place from 9–14 November 2001 in Doha, Qatar. Debate at the meeting focused on whether or not the WTO should launch a round of trade negotiations to build on the results of the Uruguay Round. The meeting ran one day late, but ultimately adopted, by a consensus decision of trade ministers from the 142 member countries, a declaration to launch multilateral trade negotiations. Ministers decided to begin negotiations by 31 January 2002 and to aim to conclude them by 1 January 2005. The trade negotiations are known as the ‘Doha Development Agenda,’ acknowledging the extent to which developing countries’ objectives were recognised in the ministerial declaration.
Key provisions in the Doha ministerial declaration included agreement to negotiate to improve market access for agricultural and non-agricultural products and services, new mandates to negotiate to reduce fishing subsidies, and recognition of the relationship between WTO trade rules and mulitilateral environmental agreements. The declaration also contained a reference to the work of the International Labour Organisation and to avoidance of mandates that could weaken critical WTO disciplines, such as the Sanitary and Phytosanitary Agreement.
The next Ministerial Conference will take stock of negotiations and make decisions on whether further negotiations on competition, investment, trade facilitation and government procurement will be initiated.
The World Bank group consists of five closely associated financial institutions: The International Bank of Reconstruction and Development (IBRD), the International Development Association (IDA). the International Finance Corporation (IFC), the Multilateral Investment Guarantee Agency (MIGA) and the International Centre for the Settlement of Investment Disputes (ICSID). New Zealand is a member of the IBRD, the IDA and the IFC. The common objective of the institutions is to help raise living standards in developing countries by financing specific country-based and regional activities to reduce poverty. These cover sectors such as health, education, social development, private sector development, gender, environment and infrastructure development. Total new lending in the 2001 financial year was US$17.3 billion, up from US$15.3 billion in the previous year.
The IDA provides highly concessional resources to low-income countries and US$6.8 billion was lent in 2001, an increase of US$2.4 billion on the previous year. New Zealand makes contributions to periodic replenishments of the IDA and in 1998 New Zealand made a commitment of NZ$32 million, amounting to a 0.12 percent share of total donor funding, plus a supplementary contribution of NZ$6.4 million. New Zealand also agreed to an accelerated payment schedule over six years. New Zealand is currently participating in negotiations to contribute to the next replenishment.
In March 2001, New Zealand contributed $3.2 million to the IDA trust fund for Heavily Indebted Poor Countries (HIPC). It also contributed another $3.2 million to the HIPC trust fund at the International Monetary Fund. These trusts give resources to heavily indebted poor countries to help relieve their debt servicing burdens to the IMF and the IDA. Twenty-three of the 38 countries eligible for debt relief currently receive assistance.
The Asian Development Bank (ADB) is a regional development bank established in 1965. It has 59 members, of which 42 are in Asia and the Pacific. The ADB's goal is to reduce poverty in the region through economic growth, social development and good governance. New Zealand holds 54,340 shares in the ADB, about 2.6 percent of the bank's voting share. The shares had a par value of US$676.886 million at 30 June 2001.
New Zealand also makes contributions to the periodic replenishment of the ADB's Asian Development Fund, the bank's concessional lending facility for its poorest developing member countries. In November 2000, the government approved a contribution of NZ$39.6 million payable over seven years. The total replenishment level was US$5.6 billion, of which US$2.91 billion was shared among 25 donors. The contribution represented an increase in New Zealand's share of the total replenishment from 0.65 percent to 0.7 percent and was partly based on an increasing level of responsiveness from the bank to meeting the development needs of Pacific developing member countries.
The Commonwealth has 54 member countries representing 1.7 billion people across the globe. New Zealand was a founding member of the Commonwealth in 1931 and has long been involved in a wide range of Commonwealth activity – the Commonwealth Games have been held in New Zealand three times.
Commonwealth policies and activities are decided at biennial meetings of Commonwealth Heads of Government (CHOGM). New Zealand was host to CHOGM in 1995. The 2001 CHOGM, scheduled for Queensland, Australia, was deferred to 2002 due to international security uncertainties following terrorist attacks in the United States.
Most activities are executed through the Commonwealth Secretariat in London, led by former New Zealand Minister of Foreign Affairs and Trade Don McKinnon, elected to the position of Secretary-General in 1999 (see sidebar). Fellow New Zealander Denis Marshall was appointed Secretary-General of the Commonwealth Parliamentary Association in 2001. The Commonwealth Association for Corporate Governance has as its chief executive Geoffrey Bowes, based in Havelock, Marlborough. New Zealand is the fourth largest contributor to the Commonwealth Secretariat by volume and the largest contributor on a gross national product/capita basis. New Zealand actively promotes the Commonwealth's core beliefs and principles. Since 1992, New Zealanders have participated in numerous missions to observe elections in member countries, including Zimbabwe in 2000 and 2002 and Fiji in 2001. Following coups in Fiji (May 2000) and Pakistan (October 1999), both countries were suspended from the Councils of the Commonwealth pending their return to democracy and listed for attention by the Commonwealth Ministerial Action Group (CMAG). The CMAG functions as the Commonwealth's watchdog on democracy and was established in Millbrook, New Zealand, in 1995. The general election in Fiji from 27 August to 1 September 2001 was part of its process of restoring democracy. The Solomon Islands has also been a focus of ongoing Commonwealth and CMAG interest in recent years.
Based in Paris, the Organisation for Economic Cooperation and Development (OECD) provides a vehicle for democratic and market-oriented economies to study and develop economic and social policies, with the aim of maximising economic growth.
The principal aims of the OECD are:
To help member countries promote sustainable economic growth, employment and rising standards of living.
To contribute to sound economic expansion in member countries, and in non-member countries to the process of economic development.
To contribute to the expansion of world trade on a multilateral, non-discriminatory basis.
The 30 member countries use the OECD to discuss and compare policy approaches on a wide range of issues. The OECD provides advice to members on best practices in social and economic policies, assists members coordinate policy, and sometimes helps member countries develop accords and agreements which must then be adopted by consensus.
Increasingly, a top priority for the OECD is to relate its work to the needs of developing countries in order to identify ways in which their prospects for achieving economic growth can be enhanced.
The OECD works at the cutting edge of key economic and social issues on the international economic agenda. It has projects underway on the challenges posed by population aging, sustainable development, education, electronic commerce, health care issues and food safety. Its expert staff are among the world's leading authorities in many of these areas. Of central importance is its programme of contact with non-government organisations and broader civil societies to explain how the OECD's goals and activities are designed to promote the economic well-being of all citizens in both developed and developing countries.
The OECD provides a valuable forum through which New Zealand can make its voice heard on key economic and social issues. Through the OECD, New Zealand can learn from the experience of others across the full range of economic and social policy challenges facing governments. The OECD is a valuable source of intellectual capital and analytical work on which New Zealand can draw to supplement and confirm its own policy development process.
The OECD's regular country reviews, which involve peer review by other OECD members, provide comparative performance insights across a broad range of government policy areas. An example is the OECD Development Assistance Committee's periodic reviews of New Zealand's Overseas Development Assistance (NZODA) programme.
New Zealand is a member of the International Energy Agency (IEA), an autonomous body of 23 member countries within the OECD framework. The primary focus of the IEA is on oil security among members. However, its programme embraces a wide range of energy issues, including energy-related environmental concerns, increased energy efficiency and use of renewable resources, the energy situation of member and non-member countries, and dialogue between energy, particularly petroleum, producers and consumers.
Tokelau consists of three small atolls in the South Pacific – Atafu, Fakaofo and Nukunonu – with a combined land area of 12 square kilometres and a population of about 1,500. The central atoll, Nukunonu, is 92km from Atafu and 64km from Fakaofo. Western Samoa is 480km to the south.
The British Government transferred administrative control of Tokelau (then known as the Union Islands) to New Zealand in 1925. Formal sovereignty was transferred to New Zealand in 1948 by an act of the New Zealand Parliament. New Zealand statute law, however, does not apply to Tokelau unless it is expressly extended. In practice, no New Zealand legislation is extended to Tokelau without its consent.
Tokelau is listed as a non self-governing territory for the purposes of the self-determination principles of the United Nations Charter. This status was confirmed in 1962 when New Zealand added Tokelau to the schedule of territories under supervision of the United Nations Special Committee on Decolonisation.
The main objective of New Zealand's relationship with Tokelau is that of fostering a greater degree of self-government and economic self-sufficiency for the people, in fulfilment of New Zealand's responsibilities under the United Nations charter and general assembly resolutions covering decolonisation and the transmission of information.
The Administrator of Tokelau is appointed by the Minister of Foreign Affairs and Trade and is responsible for administration of the executive government of Tokelau.
Under a programme of constitutional change agreed in 1992, the role of Tokelau's political institutions is being better defined and expanded. The process under way enables the base of the Tokelau Government to be located within Tokelau's national level institutions rather than as before, within a public service located largely in Western Samoa. This process was formalised by delegation in January 1994 of the administrator's powers to the General Fono, and the Council of Faipule when the General Fono is not in session. Consequently, the public service has been relocated to the atolls.
The General Fono, comprising 18 members, remains Tokelau's paramount political institution. while the key operational relationship is between the three Faipule acting as ministers within the Council of Faipule and the senior staff of the public service. The Council of Faipule's head is the Ulu o Tokelau (Leader of Tokelau), a post which rotates on a yearly basis.
In 1996, the formal step of devolving legislative power was taken. With passage of the Tokelau Amendment Act 1996 by the New Zealand Parliament, the General Fono has been able, since 1 August 1996, to exercise rule-making power. This power has been used primarily to manage the major economic activities in Tokelau and for financial management of Tokelau's accounts. The Faipule are leaders of their respective villages (one on each atoll) and the ministerial function represents an extension of their formal responsibility. Traditionally, each village has been largely autonomous. This was confirmed by the Tokelau Village Incorporation Regulations 1986, giving legal recognition to each village and granting it independent law-making power.
Each village holds elections on a three-yearly basis. Earlier practice was to elect the Faipule and Pulenuku (mayor equivalent). From 1999, the arrangement was expanded in order that each village could elect, for three-year terms, its six General Fono delegates. Previously, delegates were chosen through a process of selection.
Tokelau's development prospects are restricted by its small land area and population, its geographic isolation and by the relatively high cost in these circumstances of providing education, health and other services to the three widely separated communities. For these reasons, Tokelau relies substantially on external financial support, primarily from New Zealand. Nonetheless, the development of government structures at the national level has promoted a clear wish for Tokelau to be self-reliant to the greatest extent possible.
Through 2000/01, Tokelau's governance, or ‘modern house', project moved from the planning to the implementation stage. The agreed guiding principle is that the three villages are the traditional foundation, and for the good government of the people their village councils (Taupulega) should be the basis of future government. This project aims to put in place a governance system that is functional in the local setting, blending the modern with the traditional. The challenge is to devise a structure which properly establishes the village as the focus of social and economic activities, that delivers services within the village, and that integrates traditional decision-making processes with modern advice and support.
The Ross Dependency consists of the land, permanent ice-shelf and islands of Antarctica between 160° east to 150° west. The land is almost entirely covered by ice and is uninhabited except for people working on scientific research programmes. New Zealand has exercised jurisdiction over the territory since 1923.

An RNZAF Hercules in support of New Zealand's Antarctic research programme.
An Antarctic scientific research programme is maintained in the Ross Dependency, with New Zealand operating Scott Base, on Ross Island, as a permanent base. New Zealand is an original party to the Antarctic Treaty, which requires Antarctica to be used for peaceful purposes only and which promotes international cooperation, freedom of scientific investigation, and exchange of information and scientific personnel. The 43 parties to the treaty meet regularly to consider questions within its framework. Ministerial approval of, and permits for, all Antarctic activities are required under the Antarctica (Environmental Protection) Act 1994, administered by the Ministry of Foreign Affairs and Trade. Official expeditions of governments which are parties to the Antarctic Treaty are, however, exempt from this requirement.
Fishing in the Ross Sea is conducted consistent with conservation measures adopted by the Commission for the Conservation of Antarctic Marine Living Resources, based in Hobart. Since 1997/98, New Zealand has conducted exploratory fishing for toothfish in the Ross Sea area. New Zealand is opposed to any country taking whales from the area.
The Governor-General of New Zealand, as Commander-in-Chief of New Zealand, is empowered to raise and maintain New Zealand Naval Forces, the New Zealand Army and the Royal New Zealand Air Force. These forces, together with civilian employees, constitute the New Zealand Defence Force (NZDF).
The Minister of Defence has power of control of the New Zealand Defence Force, which is exercised through the Chief of Defence Force. The Chief of Defence Force is the principal military adviser to the minister and is responsible for carrying out the functions and duties of the NZDF, the general conduct of the NZDF, managing its activities and resources, and chairing the Chiefs of Staff Committee.
The Secretary of Defence is the chief executive of the Ministry of Defence and is the principal civilian adviser to the minister. The secretary is responsible for formulating advice, in consultation with the Chief of Defence Force, on defence policy, the procurement, replacement or repair of defence equipment which has major significance to military capability, and assessment and audit of the NZDF.
The Shape of New Zealand's Defence, a defence white paper released in November 1997, concluded that the policy laid out in a 1991 white paper remained the best framework for guiding New Zealand's defence effort in a security environment which is largely benign and stable, but contains a number of uncertainties.
The framework has three principal elements:
Defending New Zealand against low-level threats such as terrorism and incursions into its Exclusive Economic Zone.
Contributing to regional security, which includes maintaining key relationships with Australia and Five Power Defence Arrangements partners Malaysia and Singapore.
Contributing to the maintenance of international peace and security by taking part in global security efforts, particularly peacekeeping.
New Zealand's physical distance from other land masses provides a unique natural defence barrier. With little chance of a serious threat to its territory, New Zealand's plans for defence include the capability to deter and respond to threats such as the illegal use or poaching of resources, terrorism and infringements of its Exclusive Economic Zone.
The nature of New Zealand's geostrategic position means that beyond the immediate south-west Pacific region, defence planning is about security interests, rather than security needs. New Zealand's well-being is dependent on secure and stable trade markets, and secure trade routes in the Asia Pacific region and around the world, both for its exports and the import of vital commodities such as oil.
The Asian economic crisis has now largely abated and nations are moving down the path of recovery. While the economic crisis meant difficult years for the region, security implications were modest.
The regional security environment is relatively benign, but security concerns do remain, such as the situation on the Korean Peninsula, the relationship between China and Taiwan, and the proliferation of weapons of mass destruction. There have also been increased demands on the NZDF to contribute to collective endeavours in support of regional and global security interests, with the missions in East Timor, Bougainville and the Solomon Islands being prime examples.
Australia. New Zealand's defence relationship with Australia is its most important. Recognition in 1991 of the natural coincidence of the defence and strategic interests of the two countries led to adoption of the Closer Defence Relations policy. This acknowledged that a threat to one country would inevitably be a threat to the other, and that a more effective contribution to regional security could be made by working together.
The Five Power Defence Arrangements. The Five Power Defence Arrangements grew out of a statement in a communique following a meeting of ministers from New Zealand, Australia, Singapore, Malaysia and Great Britain in 1971. The focus of the arrangements is to provide support to Malaysia and Singapore should either country come under external threat. The number of exercises and contacts which New Zealand has with Malaysia and Singapore and other partners is an important part of the New Zealand Defence Force's training programme and one which has expanded significantly since the end of the Cold War.
Mutual Assistance Programme. Most Association of South-east Asian Nations (ASEAN) and South Pacific countries participate in the New Zealand Defence Force's Mutual Assistance Programme. The programme is a practical demonstration of New Zealand's commitment to regional security. Through training cooperation and advisory assistance, the programme contributes to the effectiveness of defence and disciplined forces in New Zealand's South Pacific neighbourhood. The programme also supports development projects in the South Pacific by using the engineering and trade skills of the armed forces. Commonly, training is provided in New Zealand and training and technical teams are deployed overseas. Military instructors are attached to other armed forces for periods of up to two years in exercises in the Cook Islands, Tonga, Papua New Guinea, Vanuatu and Malaysia.
ANZUS. The ANZUS security treaty between Australia, New Zealand and the United States came into force in 1952. Each party recognised that an armed attack in the Pacific on any of the parties would be dangerous to its own peace and safety, and declared that it would act to meet the common danger in accordance with its constitutional processes. However, because of the dispute between New Zealand and the United States over access to New Zealand ports by ships of the United States Navy arising out of New Zealand's nuclear-free policy, the ANZUS Council has not met since 1984.
Liaison with other countries. To facilitate exchanges on military matters, defence representatives are posted to many of New Zealand's diplomatic missions, with some of those representatives also accredited to other countries. A number of countries have service representatives attached to their diplomatic missions in Wellington or have service attaches accredited to, but not resident in, New Zealand.
Bougainville Peace Monitoring Group (PMG). This mission was first established as the Truce Monitoring Group in 1997 and the transition to the Peace Monitoring Group was made in 1998. New Zealand continued to support the Australian-led PMG through 2001. New Zealand provides 15 defence personnel directly to the PMG and financially supports six Vanuatu and five Fijian personnel.
United Nations Truce Supervision Organisation (UNTSO). New Zealand military observers have worked with UNTSO in Israel and neighbouring countries since 1954. They help to monitor ceasefires, supervise armistice agreements, prevent isolated incidents from escalating and assist subsequent peacekeeping operations. New Zealand has seven military observers stationed in Israel and Syria with UNTSO.
Cambodian Mine Action Centre. The Cambodian Government set up this demining training centre with the assistance of outside agencies. New Zealand provides a military logistics technical adviser and a military training technical adviser to the programme.
Mozambique Accelerated Demining Programme (MADP). New Zealand's commitment to demining efforts in Mozambique began in 1994. New Zealand currently provides two military demining experts to the MADP, including the chief technical adviser.
Multinational Force and Observers (MFO), Sinai. This force was established in April 1982 to verify compliance with the terms of the 1979 peace treaty between Egypt and Israel. Nine countries contribute to the MFO, including New Zealand whose 26-strong contingent comprises a training and advisory team, a heavy transport section, engineers and staff officers.
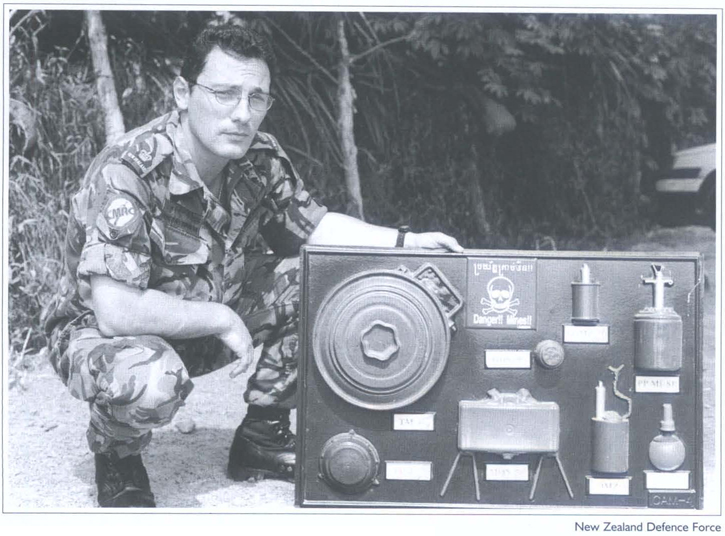
An army officer with demining training aids in Cambodia.
Former Yugoslavia. The New Zealand Defence Force contributes seven staff officers to fill a range of appointments in the British Forces headquarters within the Stabilisation Force (SFOR) in Bosnia.
A contingent of 20 further personnel serves with various British units assigned to SFOR on a tour of duty during April to September in Bosnia each year.
The New Zealand Defence Force also maintains two military liaison officers and observers in the former Yugoslavia. One military observer is deployed in Croatia with the United Nations Mission Of Observers in Prevlaka and a military liaison officer is deployed with the United Nations Interim Administration in Kosovo.
Unexploded Ordnance Programme Laos. New Zealand has provided a military logistics technical adviser and a military training technical adviser to this programme since 1997.
Figure 4.3 shows the location of New Zealand's peace support and humanitarian missions.
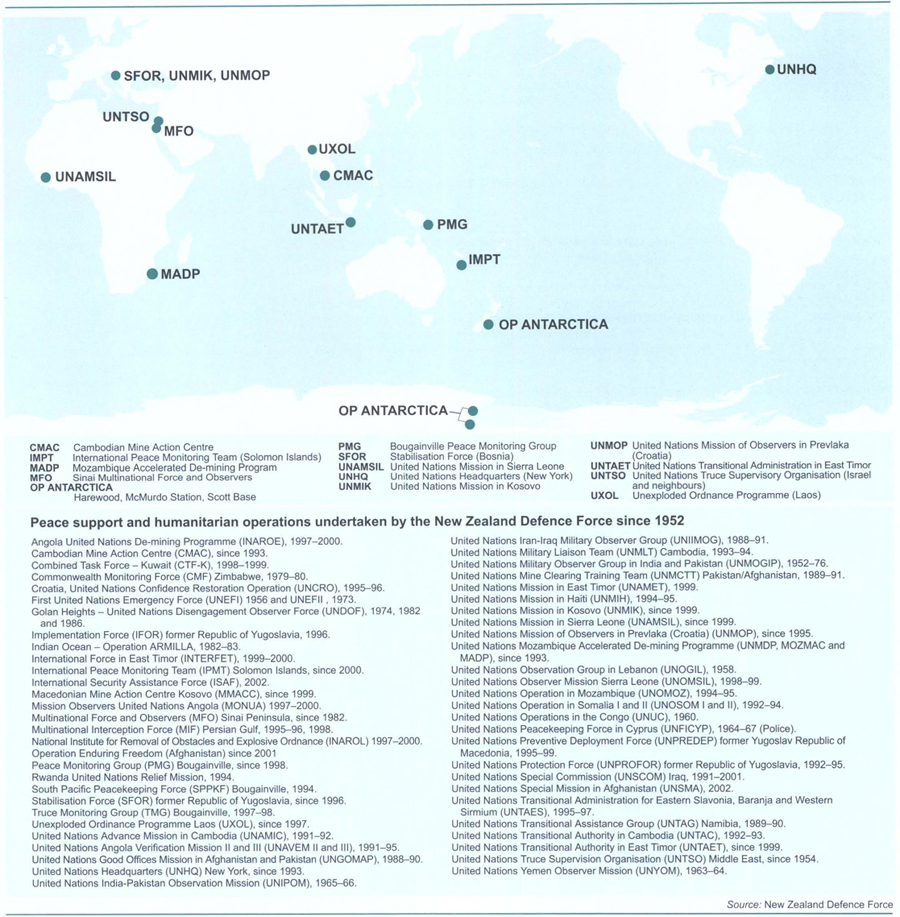
United Nations Mission in Sierra Leone (UNAMSIL). New Zealand has contributed two military observers to this mission since June 1998.
East Timor. In mid-1999, the Indonesian Government agreed to hold a plebiscite in East Timor to decide the fate of the region. The United Nations Assistance Mission in East Timor (UNAMET), to which New Zealand provided civilian police and military personnel, was established to oversee the election process.
Following the failure of UNAMET to stop violence in East Timor, the United Nations agreed to sanction a multinational force, 1NTERFET, to restore order until a United Nations-mandated force could be established. New Zealand deployed ground troops, a helicopter detachment and naval units in support of INTERFET.
The ground troops and the helicopter detachment were subsumed into the United Nations Interim Administration in East Timor (UNTAET) in January 2000. These units, and a small contingent of military observers, continue to serve with UNTAET. The New Zealand contingent approximates 670 personnel at any one time.
International Peace Monitoring Team (IPMT). The IPMT was deployed to the Solomon Islands following signing of the Townsville Peace Agreement between the warring Isatabu Freedom Fighters and the Malaitan Eagle Force factions. The IPMT is an Australian-led mission comprising Australian and New Zealand foreign affairs and trade representatives, elements of the Australian Defence Force, the New Zealand Defence Force and police officers from Australia, New Zealand and the Pacific Islands. Headquarters of the IPMT is in Honiara and team sites are situated on the islands of Guadalcanal and Malaita. The mission provides the framework for progressing peace and harmony in the Solomon Islands. New Zealand contributes seven personnel to the mission.
Casualties. There have been five fatalities to date among NZDF personnel serving in UN observer and peacekeeping missions.
The New Zealand Defence Force (NZDF) engages in a wide variety of exercises with other forces. Many of the priority international exercises are with the Australian Defence Force, reflecting the nature and intent of Closer Defence Relations (CDR).
Activities with nations of the Five Power Defence Arrangements (FPDA) include the maritime exercises STARDEX, conducted twice in every three years, and FLYINGFISH, every three years, and the annual land forces command post exercise SUMAN WARRIOR.
The NZDF's main joint and combined exercise in New Zealand is TASMANEX and involves both the Royal New Zealand Navy and the Royal New Zealand Air Force (RNZAF).
Key exercises in the South Pacific include TROPIC ASTRA (RNZAF deployment), TROPIC TWILIGHT (New Zealand Army and RNZAF deployment for civil aid tasks) and CROIX DU SUD, the major exercise of the French Armed Forces in New Caledonia.
Bilateral exercises with regional partners include exercises such as SILVER COBRA, KIWI TEMASEK, LION HEART, LION ZEAL, SING AFFIL, IRON SEA and SKYTRAIN with Singapore, TAIAHA TOMBAK and KRIS MERE with Malaysia, and CROSSED SWORDS and AZAM BERSAMA with Brunei.
Personnel exchanges. Members of the New Zealand Defence Force participate in annual exchanges with personnel from the defence forces of Australia. Canada, Singapore and the United Kingdom.
New Zealand Cadet Forces. Cadet forces comprise the Sea Cadet Corps, Air Training Corps and the New Zealand Cadet Corps. These are community-based youth groups which receive assistance from the New Zealand Defence Force, and support from the Sea Cadet Association of New Zealand, the Air Training Corps Association of New Zealand, the Cadet Corps Association of New Zealand, community organisations and the Royal New Zealand Returned Services’ Association. There were 103 active cadet units at 30 June 2001 with a total strength of 3,768, compared with 101 units and a total strength of 4,170 at 30 June 1999.
Limited Service Volunteer Scheme. Limited service volunteer training courses have been run by the army at Burnham Camp since 1995, with staffing support provided by the navy and air force since 1998. The programme provides young unemployed volunteers with six weeks of residential training in outdoor activities and general life skills. Five hundred volunteers successfully completed training courses in the year ended 30 June 2001, compared with 486 in 1999.
Disaster relief. The New Zealand Defence Force provides assistance in the wake of natural disasters in the South Pacific. Assistance can include post-disaster reconnaissance of damage levels; transportation of relief supplies, food and medical supplies; and engineering and communications services.
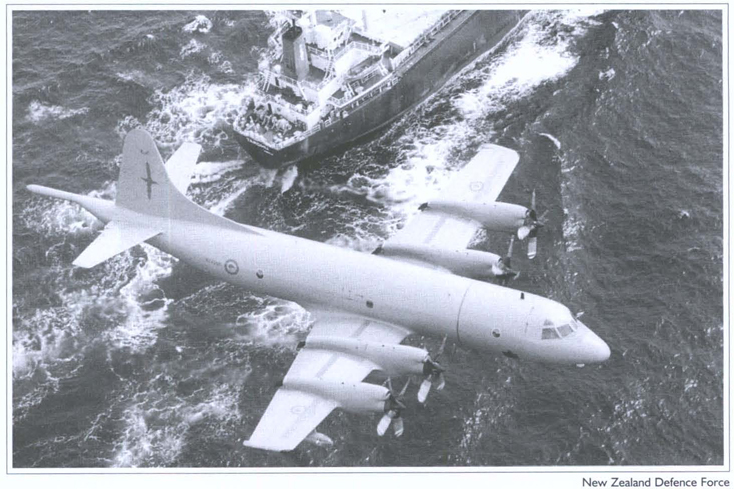
A No. 5 Squadron RNZAF Orion overflies a bulk carrier during a fisheries protection patrol.
Fisheries protection. Royal New Zealand Air Force Orion aircraft patrol the New Zealand 200-mile Exclusive Economic Zone. Information from surveillance patrols is passed to the Ministry of Fisheries. Fisheries officers are sometimes aboard aircraft when patrols are conducted. The air force conducted numerous patrols in the New Zealand area and 10 patrols in the South Pacific during 2001.
Search and rescue. All three defence services maintain a search and rescue capability, with naval and air units on 24-hour standby. The navy and air force assist in extensive sea searches, while the army and the air force assist police in land searches and rescues. The air force also carries out emergency medical evacuations throughout New Zealand, the South Pacific and Antarctica.
Operation Antarctica. Eighty-three New Zealand Defence Force personnel support Operation Antarctica in terminal and logistic support operations at Harewood, McMurdo Station and Scott Base for varying periods during the September to February Antarctic summer season. Twenty personnel are annually deployed in Antarctica from October to February. Royal New Zealand Air Force Hercules aircraft made 17 return flights to McMurdo in the 2001 season. An additional flight on 22 April 2001 airlifted three patients from McMurdo to New Zealand for medical treatment (see sidebar).
Other assistance. Other assistance provided by the New Zealand Defence Force includes transportation of Department of Conservation personnel to New Zealand's outlying islands, ceremonial support for state occasions, helicopter and logistic support to the police, assistance with rural fire fighting, explosive ordnance disposal and support during national civil defence emergencies.
Defence funding is voted by parliament to two organisations, the New Zealand Defence Force under the Chief of Defence Force, and the Ministry of Defence under the Secretary of Defence. Total expenditure by the two organisations is consolidated in Table 4.2. Table 4.3 compares New Zealand's defence expenditure internationally.
Table 4.2. Defence expenditure
| Item | Year ended 30 June | |
|---|---|---|
| 2000 | 2001 | |
| $(000) | $(000) | |
| Personnel | 533,437 | 521,191 |
| Operating | 379,627 | 420,149 |
| Depreciation | 196,611 | 218,601 |
| Capital charge | 320,550 | 332,317 |
| Other expenses | 76,952 | 103,369 |
| Total output expenses | 1,507,177 | 1,595,627 |
| Less – | ||
| Revenue | (30,432) | (31,834) |
| Surplus/(deficit) | (77,924) | (102,716) |
| Subtotal | (108,356) | (134,550) |
| Crown revenue provided | 1,398,821 | 1,461,077 |
| Source: New Zealand Defence Force; Ministry of Defence | ||
Table 4.3. International comparison of defence expenditure
| Percentage of GDP | |||||||
|---|---|---|---|---|---|---|---|
| 1995 | 1996 | 1997 | 1998 | 1999 | 2000 | 20011 | |
1Estimated. 2Year ended 30 June. 3Year ended 31 March. 4Year ended 30 September. 5Using NATO definition, excluding GST, capital charge and war pensions. Source: New Zealand Defence Force | |||||||
| Australia2 | 2.2 | 2.1 | 2.0 | 1.9 | 1.9 | 1.8 | 1.9 |
| Canada3 | 1.6 | 1.5 | 1.3 | 1.2 | 1.3 | 1.2 | 1.1 |
| New Zealand2 | 1.4 | 1.3 | 1.4 | 1.4 | 1.135 | 1.135 | 1.15 |
| Sweden2 | 2.6 | 2.5 | 2.3 | 2.3 | 2.1 | 2.2 | 2.9 |
| United Kingdom3 | 3.4 | 3.1 | 3.0 | 2.7 | 2.7 | 2.5 | 2.4 |
| United States of America4 | 3.9 | 3.4 | 3.2 | 3.0 | 2.9 | 3.2 | |
Table 4.4 gives recent annual totals of New Zealand defence personnel.
Table 4.4. Number of defence personnel
| As at June | Navy | Army | Air force | Total | Civilians (NZDF & MOD) |
|---|---|---|---|---|---|
| 1994 | 2,188 | 4,516 | 3,368 | 10,072 | 2,513 |
| 1995 | 2,152 | 4,510 | 3,296 | 9,958 | 2,024 |
| 1996 | 2,074 | 4,349 | 3,188 | 9,611 | 2,103 |
| 1997 | 2,080 | 4,391 | 2,991 | 9,462 | 2,243 |
| 1998 | 2,104 | 4,431 | 2,991 | 9,526 | 2,195 |
| 1999 | 2,080 | 4,417 | 2,885 | 9,382 | 1,912 |
| 2000 | 1,967 | 4,513 | 2,786 | 9,266 | 1,936 |
| 2001 | 1,893 | 4,580 | 2,624 | 9,097 | 1,877 |
| Sources: New Zealand Defence Force; Ministry of Defence | |||||
Command and administration. The Chief of Naval Staff exercises full command of the navy. However, the fleet is tasked by the Commander Joint Forces New Zealand through the Maritime Component Commander based at Headquarters Joint Forces New Zealand at Trentham. The Deputy Chief of Navy, based at the Naval Staff in Wellington, is responsible to the Chief of Naval Staff for the navy's ‘raise, train and sustain’ functions.
Shore establishments. The naval base at Devonport, Auckland, consists of HMNZS Philomel, the navy's main naval barracks and administrative unit; the Royal New Zealand Naval College, which is the navy's training establishment; the naval hospital; and the naval supply and armament depots. The base also contains the naval dockyard, which is a comprehensive engineering and support facility managed under a commercial management agreement by Babcocks New Zealand Ltd. The Royal New Zealand Navy Hydrographic Office is located nearby in Takapuna.
HMNZS Wakefield is the administrative unit for naval personnel in the Wellington area.
There are four Royal New Zealand Naval Volunteer Reserve units in the main centres – HMNZS Ngapona in Auckland, HMNZS Olphert in Wellington, HMNZS Pegasus in Christchurch and HMNZS Toroa in Dunedin. There is also a Port Headquarters in Tauranga. Table 4.5 lists the navy's ships and table 4.6 gives recent annual totals for navy personnel.
Table 4.5. State of the navy
| Ship type | Name | Force |
|---|---|---|
| ANZAC class frigates | Te Katha | Naval Combat Force |
| Te Mana | ||
| Leander class frigate | Canterbury | |
| Fleet tanker | Endeavour | Naval Support Force |
| Survey ship | Resolution | |
| Diving support ship | Manawanui | |
| Inshore patrol craft | Hinau | Maritime Mine Warfare Force |
| Wakakura | ||
| Kiwi | ||
| Moa | ||
| Training tender | Kahu | Sea training |
| Kaman Seasprite SH-2G helicopters x 5 (2 accepted into service at Dec 2001) | Naval aviation | |
Note: In early 2002 the government allocated $500m for the purchase of a multi role vessel (MRV) and two or three offshore patrol vessels (OPV). The MRV will replace the frigate Canterbury, which is due to he decommissioned by 2005. Source: New Zealand Defence Force | ||
Figure 4.4 shows the location of New Zealand's defence forces.
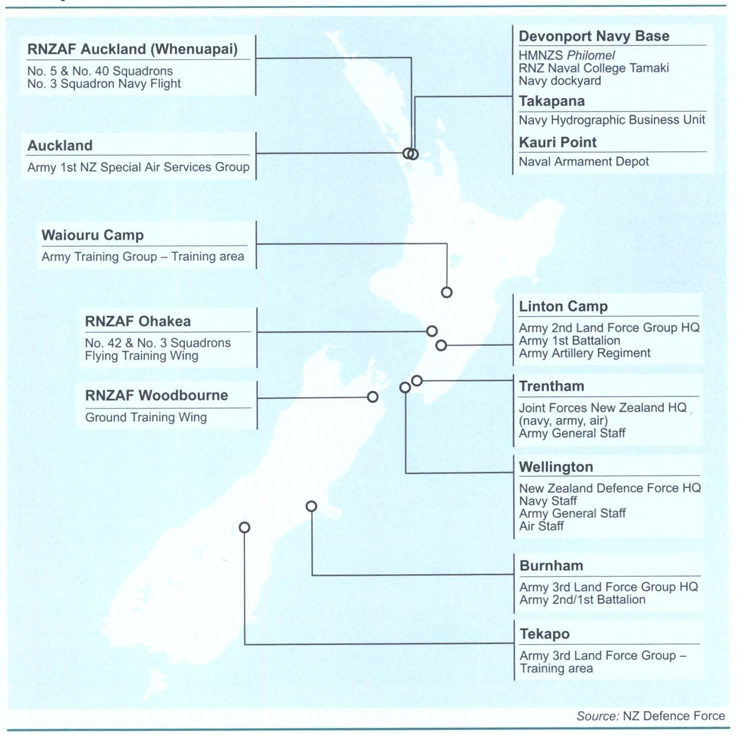
Table 4.6. Strength of the navy
| Category | At 30 June | ||||||
|---|---|---|---|---|---|---|---|
| 1995 | 1996 | 1997 | 1998 | 1999 | 2000 | 2001 | |
| Regular forces (all ranks) | 2,152 | 2,074 | 2,080 | 2,104 | 2,080 | 1,967 | 1,893 |
| Royal New Zealand Naval Volunteer Reserve (all ranks) | 370 | 367 | 395 | 397 | 401 | 385 | 385 |
| Total uniformed | 2,522 | 2,441 | 2,475 | 2,501 | 2,481 | 2,352 | 2,278 |
| Civilian employees | 524 | 453 | 434 | ||||
| Total Navy | 3,005 | 2805 | 2,712 | ||||
| Source: New Zealand Defence Force | |||||||
The New Zealand Army is organised, equipped and trained to provide a flexible range of units and sub-units up to a deployable battalion group. It can respond to lower level contingencies in the region or serve as a New Zealand contribution to a collective force, including a United Nations force.
Command and administration. The Chief of General Staff (CGS), under the Chief of Defence Force (CDF), retains full command of the army. The CGS is assisted in fulfilling his statutory command requirements by the Army General Staff (Army GS). Army GS has both a policy formulation and implementation role. Operational elements of the army are commanded by the Land Component Commander (LCC), under the Commander Joint Forces New Zealand (COMJFNZ).
The LCC, through the COMJFNZ, is assigned operational command of the 2nd Land Force Group, with headquarters at Linton, and the 3rd Land Force Group, with headquarters at Burnham, and commands all regular and territorial force units, with the exception of those elements assigned to the Army Training Group (ATG). The ATG, primarily based in Waiouru, reports directly to Army GS and is responsible for the majority of individual training conducted within the army. Army specialist units, based at Auckland and Trentham, include a Special Air Services Group and a Military Police Company, and are commanded directly by the LCC.
Table 4.7 lists army headquarters and units and table 4.8 gives recent annual totals of army personnel.
Table 4.7. State of the army
| HQs/units | Locations | Role |
|---|---|---|
| Army GS | Wellington | Command |
| HQ JFNZ | Trentham | Command |
| 1 NZSAS Gp | Auckland | Special Forces |
| Force MP Coy | Trentham | CSS |
| HQ 2 LFG | Linton | Command |
| 16 Fd Regt | Linton | CS |
| QAMR | Waiouru | Combat |
| 1 RNZIR | Linton | |
| Combat | ||
| Ak North Regt | Auckland | TF |
| WWCT Regt | Wanganui | TF |
| Hauraki Regt | Tauranga | TF |
| WnHB Regt | Napier | TF |
| 2 Engr Regt | Linton | CS |
| 2 Sigs Sqn | Linton | CS |
| FIG | Trentham | CS |
| 2 Log Bn | Linton | CSS |
| 2 HSB | Linton | CSS |
| HQ 3 LFG | Burnham | Command |
| 2/1 RNZIR | Burnham | Combat |
| Cant NMWC Regt | Burnham | TF |
| O South Regt | Dunedin | TF |
| 3 Fd Tp | Burnham | CS |
| 3 Sigs Tp | Burnham | CS |
| 3 Log Bn | Burnham | CSS |
| HQ ATG | Waiouru | Command |
| Land Ops Trg Centre | Waiouru | Training |
| The Army Depot | Waiouru | Training |
| Officer Cadet School | Waiouru | Training |
| TRSC | Trentham | Static Support |
CS = Combat Support, CSS = Combat Service Support, TRSC = Trentham Regional Support Centre. Source: New Zealand Defence Force |
Table 4.8. Strength of the army
| Category | At 30 June | ||||
|---|---|---|---|---|---|
| 1997 | 1998 | 1999 | 2000 | 2001 | |
| Regular forces – | |||||
| Officers | 715 | 725 | 652 | 731 | 742 |
| Other ranks | 3,676 | 3,706 | 3,765 | 3,782 | 3,838 |
| Total | 4,391 | 4,431 | 4,417 | 4,513 | 4,580 |
| Territorial Force (all ranks) | 3,680 | 3,394 | 3,085 | 2,474 | 2,159 |
| Total uniformed | 8,071 | 7,825 | 7,502 | 6,987 | 6,739 |
| Civilians | 801 | 768 | 734 | 723 | 643 |
| Total Army | 8,872 | 8,593 | 8,236 | 7,710 | 7,382 |
| Source: New Zealand Defence Force | |||||
Command and administration. The Royal New Zealand Air Force is structured to provide a maritime patrol force, a fixed wing transport force and a rotary wing transport force. The air combat force was disbanded in December 2001 (see sidebar). The Chief of Air Staff, supported by the Air Staff, commands the air force.
Organisation. The Air Component Commander within Headquarters Joint Force New Zealand commands the Royal New Zealand Air Force's deployable operational units. The broad range of activities carried out to raise, train and sustain the operational units of the air force is provided under the direction of the Air Staff. Operational flying units are based at RNZAF Base Auckland and RNZAF Base Ohakea. RNZAF Base Ohakea also hosts primary flying training, while most ground training is done at RNZAF Base Woodbourne. The RNZAF Museum is based at Wigram, with a wing of the museum at RNZAF Base Ohakea.
Engineering. Royal New Zealand Air Force aircraft technical services are coordinated by Air Staff with specific levels of aircraft maintenance assigned to bases and squadrons. The overhaul of specific aircraft and engines and some manufacturing of aeronautical equipment is carried out at RNZAF Base Woodbourne. Some repair and overhaul work is contracted to the private sector in New Zealand and overseas. Table 4.9 lists the air force's aircraft and table 4.10 gives recent annual totals of air force personnel.
Table 4.9. State of the air force
| Aircraft | Location | |
|---|---|---|
| 6 Orions | RNZAF Base Auckland | Maritime Patrol Force |
| 2 Boeing 727s | RNZAF Base Auckland | Fixed Wing Transport Force |
| 5 Hercules | RNZAF Base Auckland | Fixed Wing Transport Force |
| 14 Iroquois | RNZAF Base Ohakea | Rotary Wing Transport Force |
| 5 Sioux | RNZAF Base Ohakea | Flying Training |
| 13 Air Trainers | RNZAF Base Ohakea | Flying Training |
| 3 King Airs | RNZAF Base Ohakea | Flying Training |
Note: The Iroquois. Sioux and King Air aircraft moved from RNZAF Base Auckland to RNZAF Base Ohakea in January 2002. Source: New Zealand Defence Force | ||
Table 4.1. Strength of the air force
| Category | At 30 June | ||||||
|---|---|---|---|---|---|---|---|
| 1995 | 1996 | 1997 | 1998 | 1999 | 2000 | 2001 | |
| Regular forces | |||||||
| Officers | 619 | 620 | 640 | 642 | 619 | 596 | 571 |
| Other ranks | 2,676 | 2,568 | 2,351 | 2,349 | 2,266 | 2,190 | 2,053 |
| Total | 3,295 | 3,188 | 2,991 | 2,991 | 2,88 | 2,786 | 2,624 |
| Territorial Air Force (all ranks) | 101 | 170 | 180 | 163 | 163 | 161 | 176 |
| Total uniformed | 2,800 | ||||||
| Civilians | 405 | 465 | 560 | 528 | 371 | 384 | 411 |
| Total Air Force | 3,211 | ||||||
| Source: New Zealand Defence Force | |||||||
New Zealand is a small nation, geographically distant from the world's major conflicts. Its credibility in arms control and disarmament is the result of a long history of commitment to the peaceful and just resolution of international disputes.
New Zealand's role in the creation of the United Nations (UN), its opposition to nuclear testing, establishment of a nuclear-free New Zealand and South Pacific, and practical contributions to UN peacekeeping and demining operations, mean New Zealand's voice is listened to with respect.
The Ministry of Foreign Affairs and Trade's international security and arms control division includes five officers responsible for policy and treaty implementation. They prepare advice on disarmament and arms control issues for the Minister for Disarmament and Arms Control, represent New Zealand at international meetings, and ensure New Zealand's international legal obligations are fully implemented at the national level.
Officers of the ministry based overseas, including an Ambassador for Disarmament, are involved in negotiations and activities with disarmament organisations in Geneva, Vienna, New York and The Hague. The ministry's posts in Europe, North America, Latin America, Asia, the Pacific, and southern Africa also engage in bilateral discussions with host governments on key issues.
The government values the views of New Zealand's non-government peace and disarmament groups and interested members of the public. Non-government representatives are invited to join official delgegations to international meetings to contribute their advice and perspective on the pursuit of New Zealand's disarmament goals.
A statutory body, the Public Advisory Committee on Disarmament and Arms Control (PACDAC) was established under the New Zealand Nuclear Free Zone, Disarmament and Arms Control Act 1987 to:
Advise the Minister of Foreign Affairs on such aspects of disarmament and arms control matters as it thinks fit.
Advise the prime minister on implementation of the act.
Publish reports on disarmament and arms control matters and on implementations of the act.
Make recommendations for grants from the Peace and Disarmament Education Trust, established from Rainbow Warrior compensation funds.
The act specifies that PACDAC is to comprise nine members, including the Minister for Disarmament and Arms Control, who chairs the committee. The other eight members are appointed by the Minister of Foreign Affairs for three-year terms.
A recent initiative of PACDAC was commissioning independent research into the trade in small arms in South-east Asia and the South Pacific.
Inspector-General of Intelligence and Security. The Inspector-General of Intelligence and Security advises each minister responsible for an intelligence and security agency on the oversight and review of those agencies. In particular, the inspector-general is responsible for assisting the minister to ensure that the activities of New Zealand intelligence and security agencies comply with the law, and that complaints relating to those agencies are independently investigated. The office of the inspector-general's website is www.dpmc.govt.nz
The New Zealand Security Intelligence Service (NZSIS) is a small government agency with approximately 110 staff, a head office in Wellington and regional offices in Auckland and Christchurch.
Principal functions of the NZSIS are to obtain, correlate and evaluate intelligence relevant to New Zealand's security and to advise ministers on security matters. These functions are outlined in the New Zealand Security Intelligence Service Act 1969 and amendments. The legislation specifies that the act does not limit the right of people to engage in lawful protest, advocacy or dissent, and that it is not a function of the service to enforce measures of security.
The NZSIS reports directly to the Minister in Charge of the NZSIS, traditionally the prime minister, and the director is required by legislation to also consult regularly with the leader of the opposition, to keep him or her informed about matters relating to security.
The service is subject to oversight and review by the Inspector-General of Intelligence and Security, and a committee of parliamentarians, the intelligence and security committee.
Responsible to the prime minister, the Government Communications Security Bureau (GCSB) provides information, advice and assistance to the New Zealand Government, government departments and organisations. The GCSB is subject to oversight and review under the Intelligence and Security Committee Act 1996 and the Inspector-General of Intelligence and Security Act 1996. Its functions are:
Communications security and computer security – protecting information that is processed, stored or communicated by electronic or similar means and including:
The formulation of communications security and computer security policy; the promulgation of standards and the provision of material, advice and assistance to government departments and authorities, including the New Zealand armed forces, on matters related to the security and integrity of official information, the loss or compromise of which could adversely affect national security.
The provision of advice as required by government departments and authorities in relation to official information which, although unrelated to national security, requires protection from disclosure to protect the functions of government, and for privacy, safety and commercial reasons.
Critical infrastructure protection – provision of warnings, guidance and coordination of the national response to IT-based threats to New Zealand's critical infrastructures (ie power, telecommunications, emergency services, banking and finance, transport and government) through operation of a Centre for Critical Infrastructure Protection.
Technical security – providing defence against eavesdropping and other forms of technical attack against New Zealand Government premises worldwide.
Signals intelligence – providing foreign signals intelligence to meet the national intelligence requirements of the New Zealand Government.
The GCSB head office is in Wellington and it operates two communications stations – the Defence Communications Unit, Tangimoana, and the Defence Satellite Communications Unit, Blenheim at Waihopai.
Part of the Department of Prime Minister and Cabinet, the External Assessments Bureau (EAB), Te Ranga Tātari Take Tāwāhi produces intelligence assessments of events and trends overseas to support informed decision making by the government on events or trends likely to influence New Zealand's foreign relations and external interests.
The staff of about 30 identify, collate, evaluate and analyse information collected from a range of sources, and prepare assessments and reports on political, economic, biographic, strategic and scientific matters.
Table 4.11 lists recent annual expenditure on the three intelligence and security agencies.
Table 4.11. Expenditure on intelligence and security agencies
| Year ended 30 June | EAB | NZSIS | GCSB |
|---|---|---|---|
| $(000) | |||
| 1993 | 2,256 | 10,304 | 20,967 |
| 1994 | 2,289 | 9,987 | 19,279 |
| 1995 | 2,121 | 9,964 | 19,498 |
| 1996 | 2,216 | 9,968 | 18,496 |
| 1997 | 2,274 | 10,514 | 18,506 |
| 1998 | 2,287 | 10,583 | 19,083 |
| 1999 | 2,292 | 11,500 | 21,289 |
| 2000 | 2,462 | 10,956 | 19,327 |
| 2001 | 2,541 | 11,690 | 20,119 |
| Sources: External Assessments Bureau; New Zealand Security Intelligence Service; Government Communications Security Bureau | |||
4.1–4.4 Ministry of Foreign Affairs and Trade.
4.5 New Zealand Defence Force.
4.6 Ministry of Foreign Affairs and Trade.
4.7 Department of the Prime Minister and Cabinet; New Zealand Security Intelligence Service; Government Communications Security Bureau; External Assessments Bureau.
Statistics New Zealand divisional manager responsible: Kevin Eddy.
Air Force News (monthly). Royal New Zealand Air Force, Wellington.
Army News (fortnightly). New Zealand Army, Wellington.
Crawford J (1996). In the field for peace: New Zealand's contribution to international peace support operations: 1950–95, New Zealand Defence Force, Wellington.
Crawford JAB, and Harper G (2001). Operation East Timor (The New Zealand Defence Force in East Timor 1999–2001). Reed, Auckland.
Departmental Forecast Report (annual). G 4FR, Ministry of Defence, Wellington.
Departmental Forecast Report of the New Zealand Defence Force (annual). G 55FR, New Zealand Defence Force, Wellington.
Development Cooperation (biannual). Ministry of Foreign Affairs and Trade, Development Cooperation Division, Wellington.
Diplomatic and Consular List (twice-yearly). Ministry of Foreign Affairs and Trade, Wellington.
Information Bulletins (1994–2000). Nos. 44–62, Ministry of Foreign Affairs and Trade, Wellington.
Navy Today: RNZN News (monthly). Royal New Zealand Navy, Wellington.
New Zealand Defence Quarterly (quarterly). Ministry of Defence, Wellington.
New Zealand Foreign Affairs and Trade Record (monthly except January). Ministry of Foreign Affairs and Trade, Wellington.
New Zealand International Review (every two months). Institute of International Affairs, Wellington.
Overseas Posts. A List of New Zealand Representatives Abroad (twice-yearly). Ministry of Foreign Affairs and Trade, Wellington.
Report of the Asia 2000 Foundation of New Zealand (Parl Paper G.47).
Report of the Ministry of Defence (Parl Paper G.4).
Report of the Ministry of Foreign Affairs and Trade (Parl Paper A.1).
Report of the New Zealand Defence Force (Parl Paper G.55).
The Shape of New Zealand's Defence: A White Paper 1997. New Zealand Government, Wellington.
United Nations Handbook (annual). Ministry of Foreign Affairs and Trade, Wellington.
www.asia2000.org.nz – Asia 2000 Foundation of New Zealand
www.vuw.ac.nz – Institute of Policy Studies
www.dpmc.govt.nz – Intelligence and Security
www.defence.govt.nz – Ministry of Defence
www.mfat.govt.nz – Ministry of Foreign Affairs and Trade
www.army.mil.nz – New Zealand Army
www.mfat.govt.nz/nzoda/nzoda.html – New Zealand Official Development Assistance (NZODA)
www.airforce.mil.nz – Royal New Zealand Air Force
www.navy.mil.nz – Royal New Zealand Navy
www.stats.govt.nz – Statistics New Zealand
www.vsa.org.nz – Volunteer Service Abroad
Table of Contents
As New Zealand's population ages, there will be a higher proportion of retirees and a lower proportion of children.
The demography of New Zealand changed dramatically during the past century. The nation passed through a ‘demographic transition’ similar to those experienced by most western countries and, despite a continued reliance on agricultural exports, became highly urbanised.
Substantial reductions in mortality mean that New Zealanders born at the end of the 20th century can expect to live, on average, more than 20 years longer than those born 100 years earlier. During the second half of the 20th century, family formation patterns changed radically, the divorce rate soared and de facto unions became common. The average family size is now less than half of what it once was.
The population age structure has also undergone profound changes, largely as a result of peaks and troughs in the birth rate. The number of elderly New Zealanders has increased more than 20-fold since 1886, and the population is ageing – a process that is expected to hasten when the ‘baby boom’ generation reaches retirement age early this century. Continued low birth rates and the ‘greying’ of the population have raised the prospect of a future slow-growth or no-growth environment.
The following discussions on population issues focus on the years since World War II, more particularly the past 30 years, highlighting recent trends in New Zealand's demography.
Dramatic changes in the first 150 years of European settlement in New Zealand were frequently consistent with, and indicative of, international social and economic trends. In a nation of New Zealand's size and youth, however, the results of these trends often had profound effects. The almost cyclic nature of economic depression and recovery, along with gold rushes, world wars and assisted immigration schemes, caused regular fluctuations in New Zealand's population growth rates.
The population of New Zealand reached 500,000 in 1880, boosted by the introduction of government-assisted immigration. The first million was passed in 1908 following economic recovery from the depression of the 1880s and 1890s. In the aftermath of World War II, the growth rate climbed dramatically (compared with stagnation in the early 1930s) as the baby boom and increased immigration took effect. The second million of population was reached in 1952, 44 years after the first million, and the third was added only 21 years later in 1973. Nearly 20 percent of this population growth came from net immigration.
New Zealand's population grew by 118,974 between 1996 and 2001.
Since 1976, New Zealand's population has increased by more than half of a million to reach 3.74 million at the 2001 Census on 6 March (see table 5.1).
In absolute terms, New Zealand's population grew by a record 266,752 during 1971–76, 119,977 during 1981–86, 110,643 during 1986–91, 244,375 during 1991–96, and 118,974 between 1996 and 2001.
Table 5.1. Total New Zealand population, 1858–2001 censuses
| Census1,2 | Total population | Intercensal increase | ||
|---|---|---|---|---|
| Number | Percent | Average annual (percent) | ||
1Omits censuses of 1851, 1864, 1867 and 1871 as censuses of Māori population were not taken in these years. 2Figures from 1981 onwards are census usually resident population counts, replacing census night population counts used in the past. Note: All figures have been randomly rounded to base 3. Source: Statistics New Zealand | ||||
| 1858, 24 December | 115,461 | ... | ... | ... |
| 1874, 1 March | 344,985 | ... | ... | ... |
| 1878, 3 March | 458,007 | 113,022 | 32.76 | 7.33 |
| 1881, 3 April | 534,030 | 76,023 | 16.60 | 5.10 |
| 1886, 28 March | 620,451 | 86,421 | 16.18 | 3.06 |
| 1891, 5 April | 668,652 | 48,201 | 7.77 | 1.50 |
| 1896, 12 April | 743,214 | 74,562 | 11.15 | 2.13 |
| 1901, 31 March | 815,862 | 72,648 | 9.77 | 1.90 |
| 1906, 29 April | 936,309 | 120,447 | 14.76 | 2.75 |
| 1911, 2 April | 1,058,313 | 122,004 | 13.03 | 2.52 |
| 1916, 15 October | 1,149,225 | 90,912 | 8.59 | 1.50 |
| 1921, 17 April | 1,271,667 | 122,442 | 10.65 | 2.27 |
| 1926, 20 April | 1,408,140 | 136,473 | 10.73 | 2.06 |
| 1936, 24 March | 1,573,812 | 165,672 | 11.77 | 1.13 |
| 1945, 25 September | 1,702,329 | 128,517 | 8.17 | 0.83 |
| 1951, 17 April | 1,939,473 | 237,144 | 13.93 | 2.37 |
| 1956, 17 April | 2,174,061 | 234,588 | 12.10 | 2.31 |
| 1961, 18 April | 2,414,985 | 240,924 | 11.08 | 2.12 |
| 1966, 22 March | 2,676,918 | 261,933 | 10.85 | 2.11 |
| 1971, 23 March | 2,862,630 | 185,712 | 6.94 | 1.35 |
| 1976, 23 March | 3,129,384 | 266,754 | 9.32 | 1.80 |
| 1981, 24 March | 3,143,307 | ... | ... | ... |
| 1986, 4 March | 3,263,283 | 119,976 | 3.82 | 0.76 |
| 1991, 5 March | 3,373,926 | 110,643 | 3.39 | 0.67 |
| 1996, 5 March | 3,618,303 | 244,377 | 7.24 | 1.41 |
| 2001, 6 March | 3,737,277 | 118,974 | 3.29 | 0.65 |
Figure 5.1 shows the estimated annual population and percentage growth in the New Zealand population from 1900 to 2001.
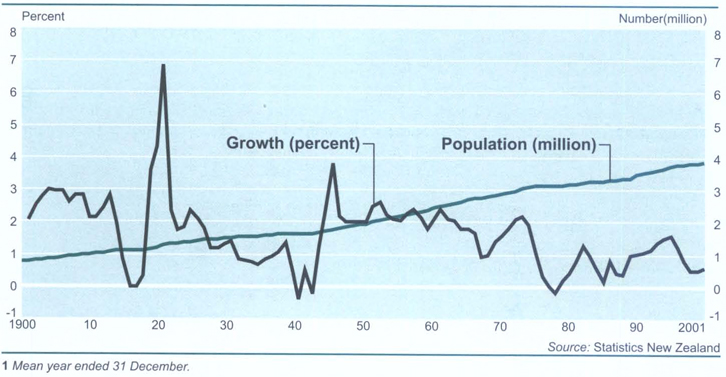
Population trends are difficult to predict because demographic changes affect and, in turn, are influenced by social, economic and other circumstances. Some broad trends and structural changes can be identified, however. For example, population ageing and sub-replacement fertility in New Zealand have raised the prospect of a slow-growth or no-growth environment in coming decades. The entry of large baby boom cohorts into retirement ages after 2010 will result in a burgeoning 65+ population. New Zealand's workforce will take on an older profile. Latest projections also point to greater ethnic diversity in the future, with Māori, Pacific and Asian populations all expected to increase their share of the New Zealand population. Within the national scene, the northward drift is likely to continue, with the northern North Island expected to grow most.
Projected resident population. Projections given here assume that New Zealand women will average just under two births each, that life expectancy at birth will increase by about seven years for males to 82 years and by about six years for females to 86.5 years in 2051, and that there will be a net migration gain of 5,000 people a year.
New Zealand's population is projected to pass the 4 million mark within the present decade and then peak at 4.6 million around 2044. This is an increase of 800,000 on the 1999 figure of 3.8 million. The pace of growth will not be uniform, however. The annual growth rate is projected to slow significantly from 0.8 percent in 2002 to 0.1 percent in 2039. This is due partly to the narrowing gap between births and deaths. Following the peak around 2044, the population is projected to decline slowly, as deaths offset the combined effect of births and the migration gain.
Figure 5.2 compares the historical and projected growth of New Zealand's population to 2051.
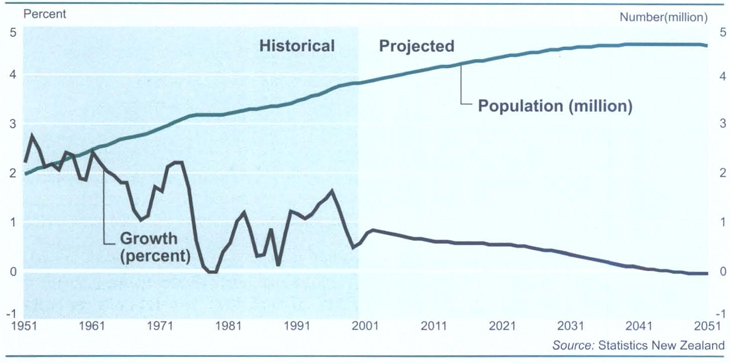
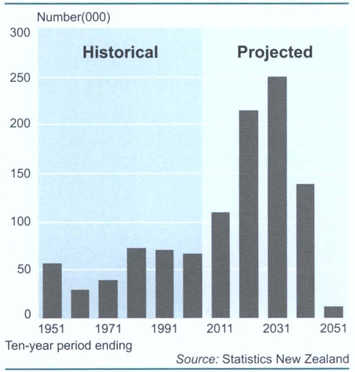
The age structure of New Zealand's population will undergo significant changes as a result of past and likely future changes in fertility, improvement in longevity and a change in migration patterns. Overall, the population will take on an older profile. The median age (half the population is younger and half the population is older than this age) is projected to rise from 34 years in 1999 to 38 years by 2011 and to 45 years in 2051 as the baby boomers enter retirement ages (see table 5.2).
Table 5.2. New Zealand population, medium projection (series 4)
| 1999 | 2011 | 2021 | 2031 | 2041 | 2051 | |
|---|---|---|---|---|---|---|
| Population (000) | ||||||
| All ages | 3,811 | 4,138 | 4,375 | 4,565 | 4,642 | 4,630 |
| 0–14 years | 875 | 812 | 775 | 795 | 763 | 737 |
| 15–64 years | 2,490 | 2,760 | 2,819 | 2,739 | 2,709 | 2,712 |
| 65+ years | 446 | 566 | 781 | 1,031 | 1,170 | 1,181 |
| Births (000) | 57 | 49 | 52 | 51 | 48 | 48 |
| Deaths (000) | 27 | 30 | 34 | 41 | 50 | 56 |
| Annual population change (000) | 18 | 25 | 23 | 14 | 3 | -3 |
| Median age (years) | 34 | 38 | 40 | 42 | 44 | 45 |
| Dependency ratio (per 100 people aged 15–64 years) | ||||||
| Child (0–14 years) | 35 | 29 | 27 | 29 | 28 | 27 |
| Elderly (65+ years) | 18 | 21 | 28 | 38 | 43 | 44 |
| Total (0–14, 65+ years) | 53 | 50 | 55 | 67 | 71 | 71 |
| Source: Statistics New Zealand | ||||||
Age groups. The number of children (0–14 years) is projected to drop by about one-sixth to around 740,000 by 2051. They will then make up 16 percent of the population, compared with 23 percent in 1999. By contrast, there will be unprecedented growth in the number of New Zealanders in retirement ages (65+ years). Their number will more than double, from 450,000 in 1999 to 1.2 million in 2051. By then, 26 percent of the population will be aged 65 and over, up from 12 percent in 1999. As Figure 5.3 shows, the largest increases in the 65+ age group will occur in the decades ending in 2021 (215,000) and 2031 (250,000) when the baby boom cohorts move into this age group. In 1999, there were about two children for every person aged 65 and over. By the early 2020s, there will be about equal numbers of children and older people, but by 2051 there are projected to be about three older people for every two children. The 65+ age group itself will age. The number of New Zealanders aged 85 and over is projected to grow from 45,000 in 1999 to 290,000 by 2051. They will then make up 25 percent of New Zealanders aged 65+, compared with 10 percent in 1999. Improvement in life expectancy and the baby boom impact could also mean more centenarians (100+ years) – 12,000 in 2051 as against just a few hundred at present. Females will continue to significantly outnumber males in the 85+ age group, with 1.6 females for every male in 2051, compared with 2.3 in 1999. The working-age population (15–64 years) is projected to increase by about 220,000 (9 percent) to 2.7 million by 2051. But its share of the total population will shrink from 65 percent to 59 percent during the 50-year period. The workforce will take on an older profile in the future. In 1999, those aged 40–64 made up 44 percent of the working-age population, a figure projected to increase to 51 percent by 2011. The median age of the working-age group is projected to increase from 37 in 1999 to 40 in 2009 and then remain between 40 and 41 for the next four decades.
Educational ages. While numbers in the various educational age groups are projected to fluctuate in the future, there will be a general downward trend in all groups. The fluctuations mainly reflect changes in births in preceding years and are likely to have significant impacts on the demand for teachers and other educational resources in the future.
Figure 5.4 shows the projected population in each of the three educational age groups to 2051.
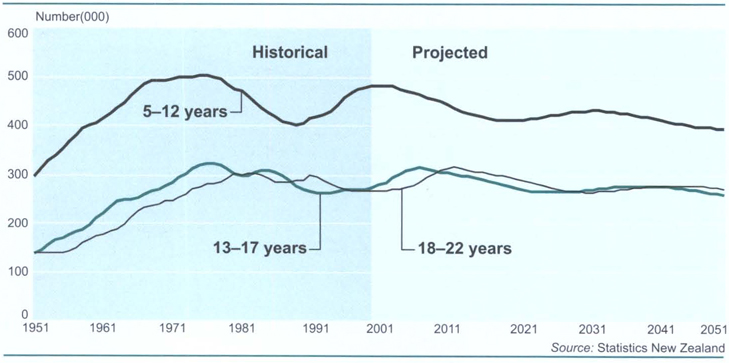

By 2051, the secondary school age population is projected to be 261,000, about 62,000 fewer than the 1976 peak.
During the next two decades, the primary school age population (5–12 years) will drop by 67,000 (14 percent) to 410,000 in 2021. This compares with a peak of 503,000 in 1975. Further decreases will mean that by 2051 there will be 84,000 fewer primary school age children than in 1999.
The trend in the secondary school age population (13–17 years) is similar to that for the primary school age population, except that the peaks and troughs of the secondary school age population lag behind those of the primary school age population by about six years. The secondary school age population is projected to increase from 272,000 in 1999 to 315,000 in 2007. Then the number will drop by 50,000 to 265,000 in 2027. By 2051, the secondary school age population will number 261,000, about 62,000 fewer than the 1976 peak.
Peaks and troughs in the tertiary age population (18–22 years) lag those of the secondary school age population by about five years. During the decade ending 2011, there will be an increase of 47,000, followed by drops of 23,000 and 26,000 in the next two decades, and smaller changes thereafter. By 2051, there will be 270,000 people aged 18–22, nearly back to the 1999 figure of 266,000.
Alternative growth scenarios. Given the uncertainty about future demographic events, Statistics New Zealand does not predict the future population, but compiles alternative demographic scenarios using different combinations of assumptions on future fertility, mortality and migration. These provide a range within which the future population size and structure may lie if the stated assumptions are met. They allow users to assess the changes that would occur under different scenarios. For example, how would the population change if the annual migration level was 10,000 a year instead of 5,000 a year, or if the long-term fertility rate was above replacement level instead of 1.90 births per woman (the medium variant)?
Alternative fertility scenarios are formulated using both the New Zealand post-war experience and recent international fertility levels as a guide. New Zealand's lowest fertility level last century was in the early 1980s, at 1.92 births per woman. Sub-replacement fertility is a common demographic feature among developed countries, including Australia (1.7), England and Wales (1.7), the Netherlands (1.7), Canada (1.6) and Sweden (1.5). Some European countries, notably Italy and Spain, have fertility rates below 1.3 births per woman.
The low fertility scenario, which assumes that New Zealand women would average 1.65 births each during the projection period, results in a smaller and much older population than the medium fertility variant. By contrast, the high fertility scenario, which assumes 2.15 births per woman, results in a larger and more youthful population.
The size and direction of New Zealand's external migration balance has fluctuated significantly in the past 100 years, averaging a net gain of about 5,000 people a year. Overall, larger migration gains in future would result in a larger population, but would be unlikely to significantly retard the ageing process.
Unlike fertility and net migration assumptions, alternative mortality variants have only a slight impact on the size and structure of the projected population.
Table 5.3 shows a variety of alternative population projections using different assumptions of fertility and migration.
Table 5.3. Alternative population projection series
| By fertility rate1 | Series 1 | Series 4 | Series 8 | Very high fertility series |
|---|---|---|---|---|
1These series assume medium mortality and long-term annual net migration of 5,000. 2Half the population is older and half younger than this age. 3Population aged 0–14 years per 100 population aged 15–64 years. 4Population aged 65+ years per 100 population aged 15–64 years. 5These series assume medium fertility (declining to 1.90 births per woman by 2011) and medium mortality. Source: Statistics New Zealand | ||||
| Total fertility rate (births per woman) | 1.65 | 1.90 | 2.15 | 2.50 |
| Population (million) | ||||
| 1999 | 3.8 | 3.8 | 3.8 | 3.8 |
| 2051 | 4.2 | 4.6 | 5.1 | 5.8 |
| Median age (years)2 | ||||
| 1999 | 34 | 34 | 34 | 34 |
| 2051 | 49 | 45 | 42 | 38 |
| Population aged 0–14 years (percent) | ||||
| 1999 | 23 | 23 | 23 | 23 |
| 2051 | 13 | 16 | 18 | 22 |
| Population aged 15–64 years (percent) | ||||
| 1999 | 65 | 65 | 65 | 65 |
| 2051 | 59 | 59 | 58 | 58 |
| Population aged 65+ years (percent) | ||||
| 1999 | 12 | 12 | 12 | 12 |
| 2051 | 28 | 26 | 23 | 20 |
| 0–14 dependency ratio3 | ||||
| 1999 | 35 | 35 | 35 | 35 |
| 2051 | 23 | 27 | 31 | 37 |
| 65+ dependency ratio4 | ||||
| 1999 | 18 | 18 | 18 | 18 |
| 2051 | 48 | 44 | 40 | 35 |
| By migration level5 | Series 3 | Series 4 | Series 5 | Series 6 |
| Annual net migration | 0 | 5,000 | 10,000 | 20,000 |
| Population (million) | ||||
| 1999 | 3.8 | 3.8 | 3.8 | 3.8 |
| 2051 | 4.3 | 4.6 | 5.0 | 5.7 |
| Median age (years)2 | ||||
| 1999 | 34 | 34 | 34 | 34 |
| 2051 | 46 | 45 | 45 | 44 |
| Population aged 0–14 years (percent) | ||||
| 1999 | 23 | 23 | 23 | 23 |
| 2051 | 16 | 16 | 16 | 17 |
| Population aged 15–64 years (percent) | ||||
| 1999 | 65 | 65 | 65 | 65 |
| 2051 | 58 | 59 | 59 | 60 |
| Population aged 65+ years (percent) | ||||
| 1999 | 12 | 12 | 12 | 12 |
| 2051 | 26 | 26 | 25 | 23 |
| 0–14 dependency ratio3 | ||||
| 1999 | 35 | 35 | 35 | 35 |
| 2051 | 27 | 27 | 27 | 28 |
| 65+ dependency ratio4 | ||||
| 1999 | 18 | 18 | 18 | 18 |
| 2051 | 46 | 44 | 42 | 39 |
Growing ethnic diversity. The ethnic mosaic of New Zealand's population is changing, with the Māori, Pacific and Asian ethnic groups making up a growing proportion of the population. This reflects past and existing differentials in fertility, as well as the impact of growing miscegenation and changes in immigration policy. It can also be attributed to the fact that the Māori, Pacific and Asian populations have more youthful age structures and thus a greater built-in momentum for growth than the European population.
The 1996-base ethnic population projections presented here are based on the concept of self-identification. Accordingly, each ethnic group excludes people who have ancestry but do not identify with that ethnic group, but includes people who identify with that ethnic group either solely or with other ethnic groups.
Some people are counted in two or more ethnic groups and therefore the Māori, Pacific and Asian populations discussed here are not mutually exclusive.
New Zealand's Asian population is projected to reach 370,000 in 2016 – double that of 1996.
Māori, Pacific and Asian populations are all projected to grow at a faster rate than the total New Zealand population. The number of Māori people is projected to roughly double by 2051, reaching nearly 1 million. During the same period, the Pacific population in New Zealand will nearly treble to reach about 600,000. The faster growth for the Pacific population reflects slightly higher fertility and a positive immigration contribution, whereas for the Māori population the projections assume a small net emigration. The Asian population is projected to double between 1996 and 2016 to reach 370,000. The shorter projection period for the Asian population reflects the volatility of Asian migration levels in recent years and the uncertainty of future immigration policies.
Table 5.4 shows the projected New Zealand population growth in the Māori, Pacific and Asian ethnic groups.
Table 5.4. Māori, Pacific and Asian population projections
| Total New Zealand | Māori | Pacific | Asian | |
|---|---|---|---|---|
1Half the population is older, and half younger, than this age. Source: Statistics New Zealand | ||||
| Population (000) | ||||
| 1996 | 3,714 | 548 | 213 | 186 |
| 2016 | 4,258 | 728 | 339 | 370 |
| 2051 | 4,630 | 993 | 599 | .. |
| Population change 1996–2051 (percent) | 21 | 81 | 181 | .. |
| Median age (years)1 | ||||
| 1996 | 33 | 22 | 21 | 27 |
| 2016 | 39 | 26 | 24 | 34 |
| 2051 | 45 | 32 | 29 | .. |
Diversity in fertility and migration patterns means the various ethnic groups will follow different paths to population ageing in future decades. With a median age of 35 in 1996, the European ethnic group has a much older age structure than the Māori (22 years) and Pacific (21 years) ethnic groups. Despite significant ageing, the median age of the Māori (32) and Pacific populations (29) in 2051 will still be lower than the median age of the total New Zealand population (33) in 1996.
Subnational projections. According to latest (1996-base) projections, about 90 percent of population growth in New Zealand in the 25-year period to 2021 will occur in the North Island. The four northernmost regions – Northland, Auckland, Waikato and Bay of Plenty – will account for nearly all North Island growth. The combined population of these four regions will increase by about one-third, from 1.8 million in 1996 to 2.4 million in 2021. The Auckland region will account for three-quarters of the North Island growth and two-thirds of the national growth. The population of the remainder of the North Island – Gisborne, Hawke's Bay, Taranaki, Manawatu-Wanganui and Wellington regions – is expected to increase only slightly to 962,000 by 2021. The South Island's population is projected to increase by 7 percent to reach 983,000.
Given these growth differentials, the northern North Island will be home to 56 percent of all New Zealanders by 2021, up from 49 percent in 1996. By contrast, the southern North Island's share will drop from 26 to 22 percent and the South Island's from 25 percent to 22 percent.
Figure 5.5 shows the projected percentage change in the population of regions between 1996 and 2021.
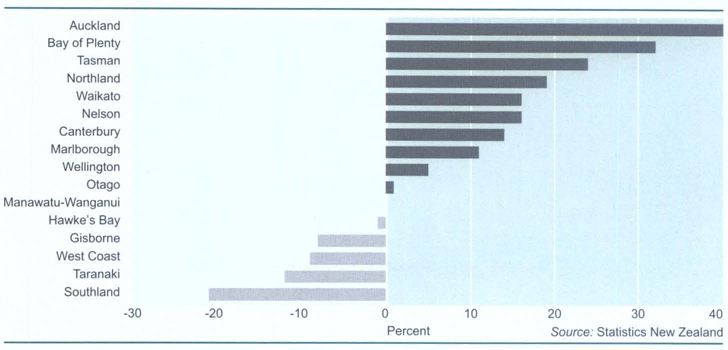
Among the 15 main urban areas (30,000+ population), Tauranga is projected to experience the fastest growth (up 61 percent) during the period 1996–2021, followed by Auckland (up 39 percent), Hamilton (up 27 percent) and Nelson (up 19 percent). The Auckland urban area is projected to have the greatest numerical increase, up from 1 million to 1.4 million – equivalent to adding the current Auckland city population to the area during the 25-year period. By 2021, the Auckland urban area will be home to 33 percent of all New Zealanders, up from 28 percent in 1996.
Among territorial authorities (cities and districts), growth rates are projected to vary. According to the 1996-base projections, leading growth areas will include Rodney, Selwyn, Tauranga, Western Bay of Plenty, Queenstown-Lakes, Franklin and Waimakariri districts, and Manukau and Waitakere cities, all with growth rates in excess of 40 percent during 1996–2021. By contrast, Kawerau, Gore, South Waikato, Rangitikei and Ruapehu districts and Invercargill city are all projected to experience population decreases of 20 percent or more.
Summary. Although fertility has been below replacement level for most of the past 20 years and is likely to remain so in the foreseeable future, New Zealand's population will continue to grow slowly for some time. This is because the current age structure has a built-in momentum for further growth. Slow growth aside, there will be profound shifts in population composition, including further ageing of the population, a burgeoning 65+ population, growing ethnic diversity and possible geographical redistribution of population, especially within territorial authorities. These demographic developments add new dimensions to policy choices in an era which is likely to witness extraordinary technological progress.
Statistics New Zealand has adopted the ‘resident population’ concept as a standard for producing official population estimates and projections. This concept is viewed as a more accurate estimate of the population normally living in an area than the ‘census usually resident population’ count. The estimated resident population of New Zealand includes all residents present in New Zealand and counted by the census and residents temporarily overseas (who are not counted by the census). An adjustment is made for residents missed or counted more than once by the census (net census undercount). The latest set of resident population estimates are based on the census held on 5 March 1996 and are adjusted for the estimated net undercount at the 1996 Census and the estimated number of New Zealand residents temporarily overseas on the day of the census. Results from the 2001 Census post-enumeration survey reveal that 85,000 New Zealand residents (2.2 percent of the population) were not enumerated by the 2001 Census and the number of residents temporarily overseas at the 2001 Census was estimated to be 55,000. Resident population estimates based on the 2001 Census results were not available in time for inclusion in this publication.
Table 5.5 shows the estimated resident population of New Zealand from 1885 to 2001.
Table 5.5. Estimated population, 1885–2001
| Year | Total population at 31 Dec | Mean population for year ended 31 Dec |
|---|---|---|
1Resident population estimates are not strictly comparable with enumerated census counts; they include adjustment for census undercount and residents temporarily overseas. Note: The population estimates for 1991 onwards are based on the resident population concept, replacing the de facto population concept used in the past. Source: Statistics New Zealand | ||
| De facto population | ||
| 1885 | 619,300 | 613,900 |
| 1886 | 631,400 | 624,300 |
| 1887 | 645,300 | 638,300 |
| 1888 | 649,300 | 647,300 |
| 1889 | 658,000 | 653,700 |
| 1890 | 667,500 | 662,700 |
| 1891 | 676,100 | 671,800 |
| 1892 | 692,400 | 684,200 |
| 1893 | 714,300 | 703,300 |
| 1894 | 728,100 | 721,200 |
| 1895 | 740,700 | 734,400 |
| 1896 | 754,000 | 746,300 |
| 1897 | 768,900 | 761,500 |
| 1898 | 783,300 | 776,100 |
| 1899 | 796,400 | 789,800 |
| 1900 | 808,100 | 802,200 |
| 1901 | 830,800 | 821,100 |
| 1902 | 851,100 | 840,900 |
| 1903 | 875,600 | 863,400 |
| 1904 | 900,700 | 888,200 |
| 1905 | 925,600 | 913,100 |
| 1906 | 956,500 | 943,300 |
| 1907 | 977,200 | 966,800 |
| 1908 | 1,008,400 | 992,800 |
| 1909 | 1,030,700 | 1,019,500 |
| 1910 | 1,050,400 | 1,040,500 |
| 1911 | 1,075,300 | 1,063,900 |
| 1912 | 1,102,500 | 1,088,900 |
| 1913 | 1,134,500 | 1,118,500 |
| 1914 | 1,145,800 | 1,140,200 |
| 1915 | 1,152,600 | 1,149,200 |
| 1916 | 1,150,200 | 1,149,200 |
| 1917 | 1,147,400 | 1,148,900 |
| 1918 | 1,158,100 | 1,152,800 |
| 1919 | 1,227,200 | 1,192,700 |
| 1920 | 1,257,600 | 1,242,400 |
| 1921 | 1,292,700 | 1,276,700 |
| 1922 | 1,318,900 | 1,305,100 |
| 1923 | 1,343,000 | 1,328,200 |
| 1924 | 1,370,400 | 1,352,600 |
| 1925 | 1,401,200 | 1,384,400 |
| 1926 | 1,429,700 | 1,413,700 |
| 1931 | 1,522,800 | 1,514,200 |
| 1936 | 1,584,600 | 1,575,200 |
| 1939 | 1,641,600 | 1,628,500 |
| 1940 | 1,633,600 | 1,637,300 |
| 1941 | 1,631,200 | 1,630,900 |
| 1942 | 1,636,400 | 1,639,500 |
| 1943 | 1,642,000 | 1,635,600 |
| 1944 | 1,676,300 | 1,655,800 |
| 1945 | 1,727,800 | 1,694,700 |
| 1946 | 1,781,200 | 1,759,600 |
| 1947 | 1,817,500 | 1,798,300 |
| 1948 | 1,853,900 | 1,834,700 |
| 1949 | 1,892,100 | 1,871,700 |
| 1950 | 1,927,700 | 1,909,100 |
| 1951 | 1,970,500 | 1,947,600 |
| 1952 | 2,024,600 | 1,996,200 |
| 1953 | 2,074,700 | 2,048,800 |
| 1954 | 2,118,400 | 2,094,900 |
| 1955 | 2,164,800 | 2,139,000 |
| 1956 | 2,209,200 | 2,182,800 |
| 1957 | 2,262,800 | 2,232,500 |
| 1958 | 2,316,000 | 2,285,800 |
| 1959 | 2,359,700 | 2,334,600 |
| 1960 | 2,403,600 | 2,377,000 |
| 1961 | 2,461,300 | 2,426,700 |
| 1962 | 2,515,800 | 2,484,900 |
| 1963 | 2,566,900 | 2,536,900 |
| 1964 | 2,617,000 | 2,589,100 |
| 1965 | 2,663,800 | 2,635,300 |
| 1966 | 2,711,300 | 2,682,600 |
| 1967 | 2,745,000 | 2,727,700 |
| 1968 | 2,773,000 | 2,753,500 |
| 1969 | 2,804,000 | 2,780,100 |
| 1970 | 2,852,100 | 2,819,600 |
| 1971 | 2,898,500 | 2,864,200 |
| 1972 | 2,959,700 | 2,915,600 |
| 1973 | 3,024,900 | 2,977,100 |
| 1974 | 3,091,900 | 3,041,800 |
| 1975 | 3,143,700 | 3,100,100 |
| 1976 | 3,163,400 | 3,131,800 |
| 1977 | 3,166,400 | 3,142,600 |
| 1978 | 3,165,200 | 3,143,500 |
| 1979 | 3,163,900 | 3,137,800 |
| 1980 | 3,176,400 | 3,144,000 |
| 1981 | 3,194,500 | 3,156,700 |
| 1982 | 3,226,800 | 3,180,800 |
| 1983 | 3,264,800 | 3,221,700 |
| 1984 | 3,293,000 | 3,252,800 |
| 1985 | 3,303,100 | 3,271,500 |
| 1987 | 3,342,100 | 3,303,600 |
| 1988 | 3,345,200 | 3,317,000 |
| 1989 | 3,369,800 | 3,330,200 |
| 1990 | 3,410,400 | 3,362,500 |
| Resident population1 | ||
| 1991 | 3,498,100 | 3,477,900 |
| 1992 | 3,534,400 | 3,515,000 |
| 1993 | 3,579,900 | 3,555,800 |
| 1994 | 3,630,400 | 3,603,700 |
| 1995 | 3,688,700 | 3,657,900 |
| 1996 | 3,743,400 | 3,715,700 |
| 1997 | 3,781,300 | 3,762,300 |
| 1998 | 3,805,600 | 3,793,200 |
| 1999 | 3,825,800 | 3,812,800 |
| 2000 | 3,843,200 | 3,832,900 |
| 2001P | 3,881,500 | 3,855,400 |
South African rugby team-mates complete 2001 Census forms in their Wellington hotel.
Three major trends stand out in the geographic distribution and redistribution of New Zealand's population in the past 150 years. The first is an increasing proportion of people living in the north of the country. The second is a tendency for people to move northward within each island and, with the exception of the past 20 years, from the South Island to the North Island. The third is for an increasing degree of urbanisation and, in particular, a concentration of people in the main urban centres.
Following the end of the gold boom in the South Island in the 1870s, the proportion of the total census night population count living in the South Island began to steadily decrease. From the 1896 Census onward, the census night population of the North Island has exceeded that of the South. Since that time, the North Island's census night population has continued to grow at a greater rate, and its share of the total census night population has continued to increase. In 1956, 69 percent of New Zealanders lived in the North Island. The percentage had risen to more than 72 by 1976 and in 2001 it was 76 percent. Many influences have contributed to the population differential between the islands. The North Island has had a higher birth rate, a lower mortality rate and, as a result, a higher rate of natural increase, and most overseas migrants choose to settle in the North Island.
Table 5.6 lists the population of the North and South Islands on census night from 1858 to 2001.
Table 5.6. Population of North and South Islands, 1858–2001 censuses
| Census1 | North Island | South Island | Total population |
|---|---|---|---|
1Figures from 1981 onwards are census usually resident population counts, replacing census night population counts used in the past. Note:The North Island includes the population of Kermadec Islands and people on oil rigs. The South Island includes the populations of the Chatham Islands territory and Campbell Island. Note:All figures have been randomly rounded to base 3. Source: Statistics New Zealand | |||
| 1858 | 87,150 | 28,311 | 115,461 |
| 1874 | 155,472 | 189,513 | 344,985 |
| 1878 | 199,524 | 258,483 | 458,007 |
| 1881 | 234,648 | 299,382 | 534,030 |
| 1886 | 290,010 | 330,441 | 620,451 |
| 1891 | 321,246 | 347,403 | 668,652 |
| 1896 | 377,955 | 365,259 | 743,214 |
| 1901 | 431,472 | 384,390 | 815,862 |
| 1906 | 521,898 | 414,411 | 936,309 |
| 1911 | 610,599 | 447,714 | 1,058,313 |
| 1916 | 695,397 | 453,828 | 1,149,225 |
| 1921 | 791,919 | 479,751 | 1,271,667 |
| 1926 | 892,680 | 515,460 | 1,408,140 |
| 1936 | 1,018,038 | 555,774 | 1,573,812 |
| 1945 | 1,146,315 | 556,014 | 1,702,329 |
| 1951 | 1,313,869 | 625,602 | 1,939,473 |
| 1956 | 1,497,363 | 676,698 | 2,174,061 |
| 1961 | 1,684,785 | 730,200 | 2,414,985 |
| 1966 | 1,893,327 | 783,594 | 2,676,918 |
| 1971 | 2,051,364 | 811,269 | 2,862,630 |
| 1976 | 2,268,393 | 860,991 | 3,129,384 |
| 1981 | 2,303,985 | 837,429 | 3,143,307 |
| 1986 | 2,412,660 | 850,623 | 3,263,283 |
| 1991 | 2,520,348 | 853,578 | 3,373,926 |
| 1996 | 2,718,189 | 900,114 | 3,618,303 |
| 2001 | 2,829,801 | 907,476 | 3,737,277 |
The movement of people within and among regions is an important determinant of New Zealand's population distribution. Overall, New Zealanders are a mobile people and, while the majority of movement is within regions, there is significant movement among regions. In addition to affecting the size of the population, inter-regional migration also influences age structures, fertility levels and population growth rates within regions. Within each of the North and South Islands, the trend has been for a northward drift of people. During 1996–2001, regions in the north of each island gained more people from internal migration than did other regions, with the highest growth areas being Waikato, Bay of Plenty and Wellington in the North Island and Tasman, Marlborough and Canterbury in the South Island. Table 5.7 shows the population movement between regions between the 1996 and 2001 censuses.
Table 5.7. Migration between regions, 1996–2001
| Regions | Census usually resident population count aged 5 years and over, 2001 | In-migration (2) | Out-migration (3) | Gross migration (2) + (3)=(4) | Net migration (2) - (3) = (5) | Migration effectiveness ratio (5)/(4) x 100 |
|---|---|---|---|---|---|---|
Note:All figures have been randomly rounded to base 3. Source: Statistics New Zealand | ||||||
| Northland | 129 687 | 17,487 | 18,102 | 35,589 | -615 | -1.73 |
| Auckland | 1,070,565 | 65,601 | 67,956 | 133,557 | -2,355 | -1.76 |
| Waikato | 330,090 | 44,046 | 42,573 | 86,619 | 1,473 | 1.70 |
| Bay of Plenty | 221,130 | 34,827 | 26,250 | 61,077 | 8,577 | 14.04 |
| Gisborne | 40,122 | 4,839 | 7,503 | 12,342 | -2,664 | -21.58 |
| Hawke's Bay | 132,168 | 14,577 | 16,704 | 31,281 | -2,127 | -6.80 |
| Taranaki | 95,622 | 8,637 | 12,291 | 20,928 | -3,654 | -17.46 |
| Manawatu-Wanganui | 204,168 | 25,806 | 32,040 | 57,846 | -6,234 | -10.78 |
| Wellington | 393,078 | 39,234 | 37,077 | 76,311 | 2,157 | 2.83 |
| Tasman | 38,544 | 8,082 | 5,529 | 13,611 | 2,553 | 18.76 |
| Nelson | 38,982 | 8,412 | 8,310 | 16,722 | 102 | 0.61 |
| Marlborough | 37,080 | 6,738 | 6,162 | 12,900 | 576 | 4.47 |
| West Coast | 28,359 | 3,750 | 5,910 | 9,660 | -2,160 | -22.36 |
| Canterbury | 450,636 | 38,907 | 30,219 | 69,126 | 8,688 | 12.57 |
| Otago | 170,856 | 21,744 | 20,634 | 42,378 | 1,110 | 2.62 |
| Southland | 84,729 | 6,699 | 12,129 | 18,828 | -5,430 | -28.84 |
New Zealand is a highly urbanised country, with 86 percent of the resident population count living in urban areas at the 2001 Census. Cities have increased their dominance over time. Just more than 50 percent of the population lived in urban areas in 1911 and just more than 75 percent by 1961. Since 1981, this proportion has stabilised at around 85 to 86 percent (see table 5.8).
Table 5.8. Urban-rural population1, 1881–2001 censuses
| Census2 | Urban | Rural | ||
|---|---|---|---|---|
| number | percent | number | percent | |
1Excludes inland water, inlet and oceanic areas. From 1881–1921, ‘urban’ based on boroughs and cities, ‘rural’ based on counties (including town districts). From 1926–2001, ‘urban’ based on urban areas and towns with over 1,000 population, and ‘rural’ is the remainder. 2Figures from 1981 onwards are census usually resident population counts, replacing census night population counts used in the past. 3Based on boundaries as at 6 March 2001. Note:All figures have been randomly rounded to base 3. Source: Statistics New Zealand | ||||
| Non-Māori population | ||||
| 1881 | 194,982 | 40.1 | 291,237 | 59.9 |
| 1886 | 245,613 | 42.9 | 327,327 | 57.1 |
| 1891 | 270,342 | 43.4 | 352,098 | 56.6 |
| 1896 | 307,293 | 44.0 | 391,734 | 56.0 |
| 1901 | 350,202 | 45.6 | 417,597 | 54.4 |
| 1906 | 424,614 | 48.1 | 458,796 | 51.9 |
| 1911 | 505,599 | 50.4 | 496,779 | 49.6 |
| 1916 | 585,306 | 53.9 | 501,258 | 46.1 |
| 1921 | 681,987 | 56.2 | 530,853 | 43.8 |
| Total population | ||||
| 1926 | 953,172 | 68.0 | 448,500 | 32.0 |
| 1936 | 1,065,228 | 67.9 | 503,886 | 32.1 |
| 1945 | 1,227,069 | 72.2 | 472,077 | 27.8 |
| 1951 | 1,406,517 | 72.7 | 527,079 | 27.3 |
| 1956 | 1,600,809 | 73.8 | 568,806 | 26.2 |
| 1961 | 1,840,203 | 76.4 | 569,217 | 23.6 |
| 1966 | 2,119,086 | 79.3 | 553,023 | 20.7 |
| 1971 | 2,328,876 | 81.5 | 528,609 | 18.5 |
| 1976 | 2,614,119 | 83.6 | 511,005 | 16.4 |
| 19813 | 2,682,906 | 85.4 | 460,401 | 14.6 |
| 19863 | 2,780,151 | 85.2 | 481,467 | 14.8 |
| 19913 | 2,884,260 | 85.5 | 489,012 | 14.5 |
| 19963 | 3,091,104 | 85.5 | 525,633 | 14.5 |
| 20013 | 3,203,574 | 85.7 | 532,740 | 143 |
Figure 5.6 shows the change in the proportion of urban and rural population for the census years from 1881 to 2001.
While 86 percent of the resident population count lived in urban areas at the time of the 2001 Census, 71 percent lived in ‘main urban areas’ (places with 30,000 people or more). A feature of urbanisation in New Zealand has been the growing concentration of people in Auckland. In 2001, 29 percent of New Zealand's population lived there, compared with only 14 percent in 1936.
Between 1996 and 2001, most main urban areas experienced population growth, particularly those located in the north of both islands. However, most of the secondary urban areas (places with between 10,000 and 29,999 people) lost population during that period.
While the New Zealand population increased by 3 percent between 1996 and 2001, the population of main urban areas grew by 4 percent and both secondary and minor urban areas decreased by 0.4 and 0.3 percent respectively. Table 5.9 shows the population of New Zealand's largest urban areas at selected censuses.
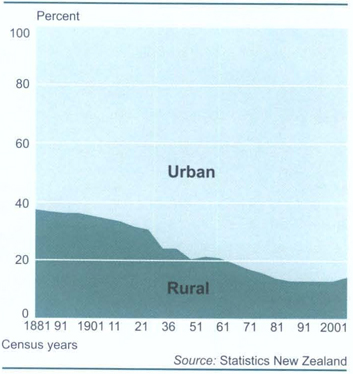
Table 5.9. Population of 20 largest urban areas at selected censuses
| Urban area | 18861 | 19111 | 1936 | 1961 | 19862,3 | 19912,3 | 19962,3 | 20012,3 |
|---|---|---|---|---|---|---|---|---|
1Excludes Māori. 2Boundaries as at 6 March 2001. 3Figures from 1986 onwards are census usually resident population counts, replacing census night population counts used in the post. Note:All figures have been randomly rounded to base 3. Source: Statistics New Zealand | ||||||||
| Auckland | 33,162 | 102,675 | 226,365 | 448,365 | 816,927 | 878,223 | 991,833 | 1,074,513 |
| Wellington | 25,944 | 70,728 | 159,357 | 249,531 | 323,421 | 324,156 | 334,065 | 339,750 |
| Christchurch | 29,655 | 80,193 | 133,515 | 220,509 | 295,749 | 303,411 | 325,251 | 334,107 |
| Hamilton | 1,200 | 3,543 | 20,097 | 50,505 | 138,645 | 146,148 | 158,046 | 166,128 |
| Dunedin | 23,244 | 64,236 | 85,608 | 105,003 | 107,331 | 107,523 | 110,790 | 107,088 |
| Tauranga | 1,149 | 1,347 | 5,808 | 24,660 | 62,370 | 70,257 | 82,095 | 95,697 |
| Palmerston North | 2,607 | 10,992 | 24,372 | 43,185 | 66,951 | 70,236 | 73,860 | 72,681 |
| Hastings | 1,503 | 6,285 | 17,919 | 32,490 | 56,718 | 57,219 | 58,500 | 59,142 |
| Napier | 7,680 | 11,736 | 19,170 | 32,715 | 52,524 | 52,119 | 54,291 | 54,534 |
| Nelson | 7,314 | 8,235 | 13,494 | 25,320 | 43,725 | 45,879 | 50,688 | 53,688 |
| Rotorua | ... | 2,391 | 8,898 | 25,068 | 48,855 | 50,772 | 52,956 | 52,608 |
| New Plymouth | 3,093 | 5,238 | 18,597 | 32,388 | 47,370 | 47,652 | 48,879 | 47,763 |
| Invercargill | 8,250 | 15,858 | 25,911 | 41,088 | 52,818 | 51,540 | 49,404 | 46,305 |
| Whangarei | ... | 2,664 | 9,867 | 21,789 | 44,097 | 44,346 | 45,876 | 46,047 |
| Wanganui | 4,902 | 14,703 | 25,749 | 35,694 | 40,512 | 41,100 | 41,097 | 39,423 |
| Kapiti | ... | 1,068 | 5,367 | 12,306 | 23,040 | 27,342 | 30,291 | 33,669 |
| Gisborne | 2,193 | 8,196 | 15,879 | 25,065 | 32,019 | 31,401 | 32,607 | 31,722 |
| Timaru | 3,753 | 11,280 | 18,771 | 26,424 | 28,692 | 27,783 | 27,171 | 26,748 |
| Blenheim | 3,093 | 3,771 | 5,037 | 11,955 | 22,998 | 23,787 | 25,704 | 26,547 |
| Masterton | ... | 5,181 | 9,096 | 15,120 | 19,353 | 19,770 | 19,689 | 19,497 |
Figure 5.7 shows the average annual intercensal growth rates from 1945–2001 for New Zealand's main urban areas.
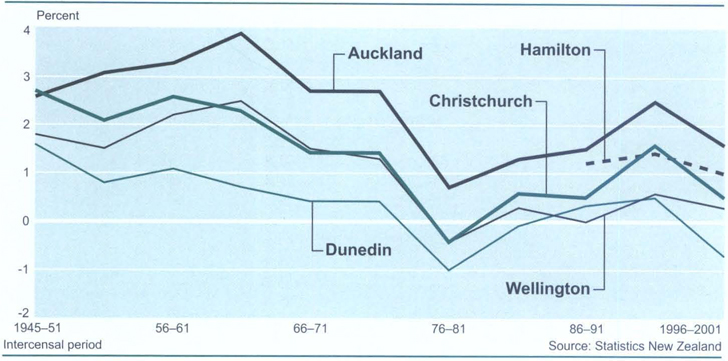
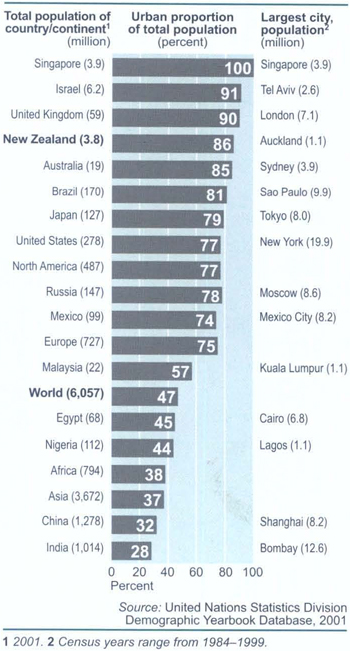
Figure 5.8 is an international comparison of the urban proportion of the total population of selected countries, including New Zealand.
In 2001, 71 percent of New Zealanders lived in cities of 30,000 or more.
Tables 5.10 and 5.11 outline the resident population of New Zealand's 74 territorial authority areas and 16 regions.
Table 5.1. Census usually resident population count for territorial authorities, 1991, 1996 and 20011
| Territorial authority | 1991 | 1996 | 2001 | Increase/decrease(-) 1991–1996 | Increase/decrease(-) 1996–2001 | ||
|---|---|---|---|---|---|---|---|
1Census usually resident population count. Note:All figures have been randomly rounded to base 3. Source: Statistics New Zealand | |||||||
| Number | Number | Percent | Number | Percent | |||
| Cities | |||||||
| North Shore | 152,646 | 172,164 | 184,821 | 19,518 | 12.8 | 12,657 | 7.4 |
| Waitakere | 136,998 | 155,565 | 168,750 | 18,567 | 13.6 | 13,185 | 8.5 |
| Auckland | 306,210 | 345,768 | 367,734 | 39,558 | 12.9 | 21,966 | 6.4 |
| Manukau | 226,002 | 254,277 | 283,200 | 28,275 | 12.5 | 28,923 | 11.4 |
| Hamilton | 99,414 | 108,426 | 114,921 | 9,012 | 9.1 | 6,495 | 6.0 |
| Napier | 51,285 | 53,463 | 53,661 | 2,178 | 4.2 | 198 | 0.4 |
| Palmerston North | 69,537 | 73,095 | 72,033 | 3,558 | 5.1 | -1,062 | -1.5 |
| Porirua | 46,545 | 46,626 | 47,370 | 81 | 0.2 | 744 | 1.6 |
| Upper Hutt | 36,882 | 36,714 | 36,369 | -168 | -0.5 | -345 | -0.9 |
| Lower Hutt | 94,881 | 95,871 | 95,478 | 990 | 1.0 | -393 | -0.4 |
| Wellington | 148,440 | 157,719 | 163,824 | 9,279 | 6.3 | 6,105 | 3.9 |
| Nelson | 36,456 | 40,239 | 41,568 | 3,783 | 10.4 | 1,329 | 3.3 |
| Christchurch | 289,071 | 309,027 | 316,227 | 19,956 | 6.9 | 7,200 | 2.3 |
| Dunedin | 114,504 | 118,143 | 114,342 | 3,639 | 3.2 | -3,801 | -3.2 |
| Invercargill | 55,707 | 53,208 | 49,830 | -2,499 | -4.5 | -3,378 | -6.3 |
| Total cities | 1,864,581 | 2,020,314 | 2,110,125 | 155,733 | 8.4 | 89,811 | 4.4 |
| Districts | |||||||
| Far North | 47.466 | 52,935 | 54,576 | 5,469 | 11.5 | 1,641 | 3.1 |
| Whangarei | 62,256 | 66,747 | 68,094 | 4,491 | 7.2 | 1,347 | 2.0 |
| Kaipara | 17,049 | 17,370 | 17,457 | 321 | 1.9 | 87 | 0.5 |
| Rodney | 54,816 | 66,483 | 76,182 | 11,667 | 21.3 | 9,699 | 14.6 |
| Papakura | 37,149 | 39,690 | 40,665 | 2,541 | 6.8 | 975 | 2.5 |
| Franklin | 41,769 | 47,826 | 51,669 | 6,057 | 14.5 | 3,843 | 8.0 |
| Thames-Coromandel | 21,750 | 24,822 | 25,176 | 3,072 | 14.1 | 354 | 1.4 |
| Hauraki | 17,043 | 17,319 | 16,764 | 276 | 1.6 | -555 | -3.2 |
| Waikato | 37,413 | 39,138 | 39,855 | 1,725 | 4.6 | 717 | 1.8 |
| Matamata-Piako | 29,847 | 29,664 | 29,472 | -183 | -0.6 | -192 | -0.6 |
| Waipa | 36,693 | 38,853 | 40,293 | 2,160 | 5.9 | 1,440 | 3.7 |
| Otorohanga | 9,096 | 9,660 | 9,282 | 564 | 6.2 | -378 | -3.9 |
| South Waikato | 26,409 | 25,008 | 23,472 | -1,401 | -5.3 | -1,536 | -6.1 |
| Waitomo | 10,092 | 9,732 | 9,456 | -360 | -3.6 | -276 | -2.8 |
| Taupo | 27,978 | 30,690 | 31,521 | 2,712 | 9.7 | 831 | 2.7 |
| Western Bay of Plenty | 29,871 | 34,968 | 38,232 | 5,097 | 17.1 | 3,264 | 9.3 |
| Tauranga | 66,738 | 77,778 | 90,906 | 11,040 | 16.5 | 13,128 | 16.9 |
| Rotorua | 61,560 | 64,509 | 64,473 | 2,949 | 4.8 | -36 | -0.1 |
| Whakatane | 32,091 | 33,126 | 32,814 | 1,035 | 3.2 | -312 | -0.9 |
| Kawerau | 8,337 | 7,830 | 6,975 | -507 | -6.1 | -855 | -10.9 |
| Opotiki | 8,667 | 9,375 | 9,201 | 708 | 8.2 | -174 | -1.9 |
| Gisborne | 44,265 | 45,780 | 43,971 | 1,515 | 3.4 | -1,809 | -4.0 |
| Wairoa | 10,128 | 9,900 | 8,913 | -228 | -2.3 | -987 | -10.0 |
| Hastings | 64,029 | 66,279 | 67,425 | 2,250 | 3.5 | 1,146 | 1.7 |
| Central Hawke's Bay | 12,828 | 13,038 | 12,828 | 210 | 1.6 | -210 | -1.6 |
| New Plymouth | 67,191 | 68,112 | 66,603 | 921 | 1.4 | -1,509 | -2.2 |
| Stratford | 9,882 | 9,543 | 8,883 | -339 | -3.4 | -660 | -6.9 |
| South Taranaki | 30,228 | 29,133 | 27,537 | -1,095 | -3.6 | -1,596 | -5.5 |
| Ruapehu | 16,863 | 16,743 | 14,292 | -120 | -0.7 | -2,451 | -14.6 |
| Wanganui | 44,703 | 45,042 | 43,266 | 339 | 0.8 | -1,776 | -3.9 |
| Rangitikei | 16,575 | 16,356 | 15,102 | -219 | -1.3 | -1,254 | -7.7 |
| Manawatu | 27,132 | 28,077 | 27,507 | 945 | 3.5 | -570 | -2.0 |
| Tararua | 19,851 | 19,068 | 17,859 | -783 | -3.9 | -1,209 | -6.3 |
| Horowhenua | 29,814 | 30,150 | 29,820 | 336 | 1.1 | -330 | -1.1 |
| Kapiti Coast | 34,941 | 38,586 | 42,447 | 3,645 | 10.4 | 3,861 | 10.0 |
| Masterton | 22,566 | 22,755 | 22,614 | 189 | 0.8 | -141 | -0.6 |
| Carterton | 6,867 | 6,813 | 6,849 | -54 | -0.8 | 36 | 0.5 |
| South Wairarapa | 9,156 | 8,937 | 8,742 | -219 | -2.4 | -195 | -2.2 |
| Tasman | 34,029 | 37,974 | 41,352 | 3,945 | 11.6 | 3,378 | 8.9 |
| Marlborough | 35,142 | 38,397 | 39,555 | 3,255 | 9.3 | 1,158 | 3.0 |
| Kaikoura | 3,273 | 3,516 | 3,483 | 243 | 7.4 | -33 | -0.9 |
| Buller | 10,479 | 10,512 | 9,624 | 33 | 0.3 | -888 | -8.4 |
| Grey | 13,074 | 13,701 | 12,894 | 627 | 4.8 | -807 | -5.9 |
| Westland | 8,007 | 8,280 | 7,776 | 273 | 3.4 | -504 | -6.1 |
| Hurunui | 8,919 | 9,405 | 9,885 | 486 | 5.4 | 480 | 5.1 |
| Waimakariri | 27,879 | 32,346 | 36,903 | 4,467 | 16.0 | 4,557 | 14.1 |
| Banks Peninsula | 6,984 | 7,581 | 7,833 | 597 | 8.5 | 252 | 3.3 |
| Selwyn | 21,324 | 24,783 | 27,312 | 3,459 | 16.2 | 2,529 | 10.2 |
| Ashburton | 24,702 | 25,179 | 25,443 | 477 | 1.9 | 264 | 1.0 |
| Timaru | 42,582 | 42,630 | 41,967 | 48 | 0.1 | -663 | -1.6 |
| Mackenzie | 3,666 | 4,077 | 3,717 | 411 | 11.2 | -360 | -8.8 |
| Waimate | 7,743 | 7,617 | 7,101 | -126 | -1.6 | -516 | -6.8 |
| Chatham Islands | 726 | 729 | 720 | 3 | 0.4 | -9 | -1.2 |
| Waitaki | 21,888 | 21,573 | 20,085 | -315 | -1.4 | -1,488 | -6.9 |
| Central Otago | 14,967 | 14,955 | 14,466 | -12 | -0.1 | -489 | -3.3 |
| Queenstown-Lakes | 9,984 | 14,283 | 17,040 | 4,299 | 43.1 | 2,757 | 19.3 |
| Clutha | 18,213 | 18,006 | 17,172 | -207 | -1.1 | -834 | -4.6 |
| Southland | 30,699 | 30,561 | 28,716 | -138 | -0.4 | -1,845 | -6.0 |
| Gore | 13,542 | 13,281 | 12,459 | -261 | -1.9 | -822 | -6.2 |
| Total districts | 1,508,928 | 1,597,221 | 1,626,699 | 88,293 | 5.9 | 29,478 | 1.8 |
| Area outside territorial authority | 417 | 765 | 453 | 348 | 83.5 | -312 | -40.8 |
| Total New Zealand | 3,373,926 | 3,618,303 | 3,737,277 | 244,377 | 7.2 | 118,974 | 3.3 |
Table 5.11. Census usually resident population count for regional councils, 1991, 1996 and 20011
| Regional council | 1991 | 1996 | 2001 | Increase/decrease(-) 1991–1996 | Increase/decrease(-) 1996–2001 | ||
|---|---|---|---|---|---|---|---|
1Census usually resident population count. Note:All figures have been randomly rounded to base 3. Source: Statistics New Zealand | |||||||
| Number | Number | Percent | Number | Percent | |||
| North Island | |||||||
| Northland | 126,786 | 137,052 | 140,133 | 10,266 | 8.1 | 3,081 | 2.2 |
| Auckland | 943,776 | 1,068,657 | 1,158,891 | 124,881 | 13.2 | 90,234 | 8.4 |
| Waikato | 331,026 | 350,112 | 357,726 | 19,086 | 5.8 | 7,614 | 2.2 |
| Bay of Plenty | 203,982 | 224,364 | 239,412 | 20,382 | 10.0 | 15,048 | 6.7 |
| Gisborne | 44,265 | 45,786 | 43,974 | 1,521 | 3.4 | -1,812 | -4.0 |
| Hawke's Bay | 138,342 | 142,788 | 142,947 | 4,446 | 3.2 | 159 | 0.1 |
| Taranaki | 107,127 | 106,590 | 102,858 | -537 | -0.5 | -3,732 | -3.5 |
| Manawatu-Wanganui | 224,760 | 228,771 | 220,089 | 4,011 | 1.8 | -8,682 | -3.8 |
| Wellington | 400,284 | 414,048 | 423,765 | 13,764 | 3.4 | 9,717 | 2.3 |
| Total North Island | 2,520,342 | 2,718,171 | 2,829,798 | 197,829 | 7.8 | 111,627 | 4.1 |
| South Island | |||||||
| Tasman | 34,026 | 37,971 | 41,352 | 3,945 | 11.6 | 3,381 | 8.9 |
| Nelson | 36,456 | 40,278 | 41,568 | 3,822 | 10.5 | 1,290 | 3.2 |
| Marlborough | 35,148 | 38,397 | 39,558 | 3,249 | 9.2 | 1,161 | 3.0 |
| West Coast | 31,563 | 32,514 | 30,303 | 951 | 3.0 | -2,211 | -6.8 |
| Canterbury | 438,171 | 468,039 | 481,431 | 29,868 | 6.8 | 13,392 | 2.9 |
| Otago | 177,525 | 185,082 | 181,542 | 7,557 | 4.3 | -3,540 | -1.9 |
| Southland | 99,954 | 97,098 | 91,005 | -2,856 | -2.9 | -6,093 | -6.3 |
| Total South Island | 852,846 | 899,385 | 906,753 | 46,539 | 5.5 | 7,368 | 0.8 |
| Area outside region | 738 | 747 | 726 | 9 | 1.2 | -21 | -2.8 |
| Total New Zealand | 3,373,926 | 3,618,303 | 3,737,277 | 244,377 | 7.2 | 118,974 | 3.3 |
Population change has two main components, natural increase (the excess of births over deaths) and net migration (the difference between arrivals and departures). To indicate the relative importance of these components, 77 percent of census night population growth between 1858 and 1989 came from natural increase, with net migration making up the remaining 23 percent.
The relative contribution of the two components has varied from one five-year census period to another, but net migration's share has never exceeded 40 percent. In three five-year periods (1941—45, 1966–70 and 1981–85), it contributed less than 10 percent of population growth, while in a further three periods (1931–35, 1976–80 and 1986–90), because of a net population outflow, the contribution was negative.
Figure 5.9 shows the annual natural increase, net migration and total population change in New Zealand from 1861 to 2001.
The rise in the rate of natural increase has been prodigious. In 1861–65, births exceeded deaths by only 16,610. By 1961–65, the margin had soared to 205,164. Until 1985, the gap between births and deaths diminished because of both a decrease in the number of births and a rise in the number of deaths. In 1981–85, births exceeded deaths by 125,109, a drop of nearly 40 percent on 20 years earlier. In the following two five-year periods the natural increase rose to 148,422 in 1986–90 and 157,481 in 1991–95. However, in 1996–2000, births exceeded deaths by 147,177, a decrease of nearly 7 percent on 1991–95, a result of a declining number of births.
The following text briefly looks at the population processes – fertility, mortality and migration.
Changing levels of fertility over the years have played a major role in determining the size and structure of New Zealand's population. Figure 5.10 shows the average number of births a woman would have during her reproductive life, from 1912 to 2001.
In 1935, the fertility rate in New Zealand fell to a low of 2.2 births per woman. This low rate was attributed to fewer and later marriages, and family limitation within marriage. Fertility started to recover once the worst years of the economic depression were over. With demobilisation of forces after World War II and the resulting increase in marriages and births, the fertility rate reached 3.6 births per woman in 1947. Other features of the post-war years were New Zealanders marrying younger, and marriage becoming almost universal. By 1961, half of all women were married before the age of 22, compared with barely a quarter married by that age in the early 1940s. These trends were reinforced by early childbearing and the shortening of birth intervals.
In the mid-1950s, age group 20–24 replaced 25–29 years as the most common age group for childbearing. The median age at first birth fell from 25.4 years in 1945 to 22.8 years in 1964. Fewer couples remained childless or had only one child. The net result was soaring birth numbers, up from just over 27,000 in 1935, to about 42,000 in 1945 and to more than 65,000 in 1961. More than 1.1 million New Zealanders were born between 1946 and 1965 – the ‘baby boomers'.
As was the case elsewhere, this burgeoning in the number of births was to reshape the population age structure and pose problems for policy makers and planners in both the public and private sectors. At its peak in 1961, the total fertility rate exceeded 4.3 births per woman and significantly exceeded figures for other developed nations.
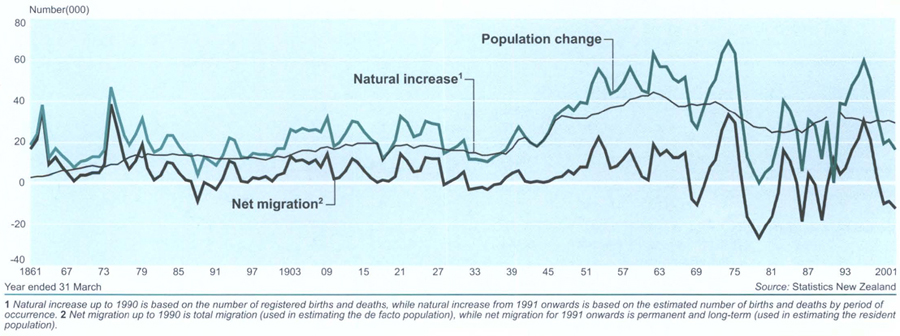
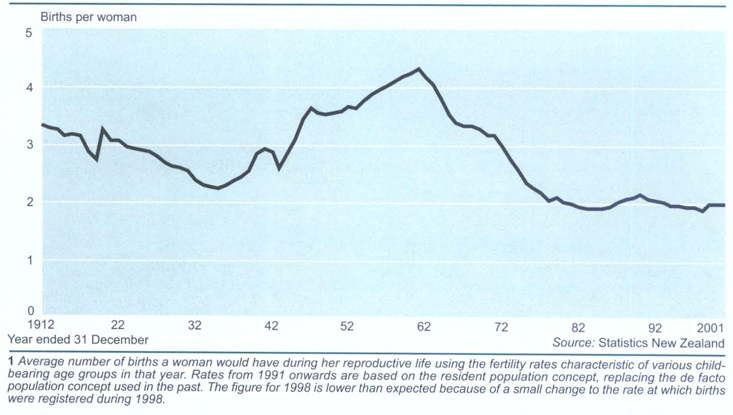
The upward trend was reversed in the early 1960s just as suddenly as it had begun, which has prompted demographers to suggest that the ‘baby boom’ was merely a temporary diversion from a long-term downward trend. The turnaround coincided with the introduction of the oral contraceptive pill in the early 1960s, but the ‘cause-and-effect’ relationship is not clear-cut. It is possible that increased acceptance and use of the pill helped sustain the downward trend.
By the mid-1970s, the post-depression rise in fertility had ended. The total fertility rate fell below the ‘replacement level’ in 1978 and then to an all-time low of 1.92 births per woman in 1983. This drop had a great impact on the annual number of births. Despite a substantial increase in the number of prospective mothers, caused by the large baby boom cohorts entering the prime reproductive ages, and thus the prospect of an ‘echo boom', births dropped from more than 64,000 in 1971 to below 50,000 in 1982.
After 1983, there was a minor resurgence in the fertility rate to 2.18 in 1990, but the rate subsequently dropped to 2.01 by 2000. This level of fertility is slightly below the level required for the population to replace itself without migration. The current low fertility level should therefore be viewed as an extension of the transition from relatively large families to relatively small families which was already on its way when the 20th century began. New Zealand couples now have fewer children, later in their lives and many forgo parenting altogether.
Figure 5.11 shows the median age of childbearing for New Zealand women from 1962 to 2001.
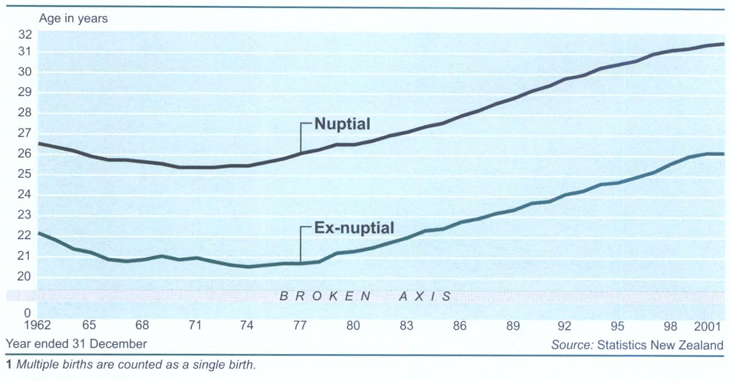
The dynamics of the fertility decline and of current low fertility levels are complex. Increased use of contraceptives, increased participation of women in the labour force, rising divorce rates and general economic conditions have probably all, directly or indirectly, contributed to it. Patterns of marriage and family formation have changed radically, with a shift away from early marriage and childbearing toward later marriage and delayed parenthood. (See Chapter 6: Marriage.) Between 1971 and 1986, the first marriage rate for women aged 20–24 years dropped by about two-thirds, from 314 to 113 marriages per 1,000 never-married women. By 1996, the first marriage rate for women aged 20–24 years had dropped to 48 per 1,000. New Zealand women are marrying for the first time, on average, more than six years later than those who married for the first time in 1971. The average age at first marriage in 2000 for women was 28.1 years and 30.2 years for men. This compared with 21.7 and 24.2 years respectively in 1971.
A growing proportion of New Zealanders are remaining single through their 20s. The substantial postponement of marriage has been partly offset by the growth of de facto relationships (cohabitation outside marriage). Such relationships may be either a prelude to, or a substitute for, formal marriages. The growth in de facto unions partly accounts for the rise in the number of ex-nuptial births (children born to women who are not legally married to the child's father), up from nearly 7,000 in 1966 to nearly 10,000 in 1976 and to more than 24,000 in 2000.
Figure 5.12 shows the birth rate per 1,000 not-married women in New Zealand for selected years from 1896 to 2001.
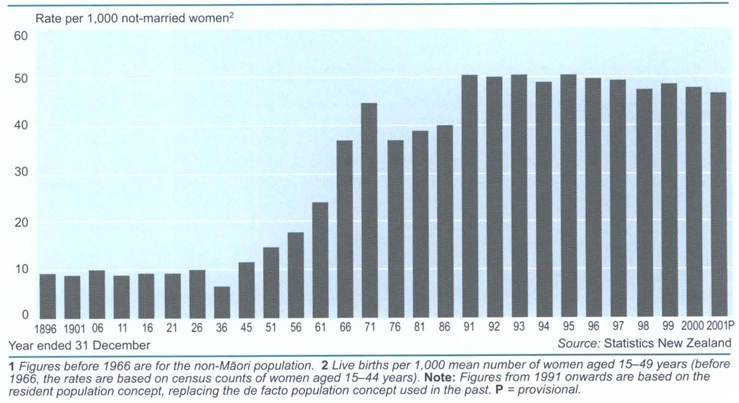
Ex-nuptial births comprised 12 percent of all births registered in New Zealand in 1966 and 43 percent in 2000. Changing social norms have contributed to this increase. There is also a high incidence of ex-nuptial births among Māori. In 2000, 73 percent of all Māori births were classified as ex-nuptial and they accounted for nearly half of New Zealand's ex-nuptial births.
The transition in Māori fertility from relatively large to small families is of more recent origin. Latest demographic measures indicate that there is still a significant ethnic differential in fertility levels in New Zealand. In 1996, the fertility rate for Māori women was 2.7 births per woman and for Pacific women 3.5 births, compared with 1.8 births for European women.
Table 5.12 illustrates fertility trends and patterns from 1881 to 2001.
Table 5.12. Fertility trends and patterns
| Year ended 31 December | Total live births | Crude birth rate2 | Total fertility rate3 | Gross reproduction rate4,5 | Net reproduction rate5,6 | Ex-nuptial birth rate5,7 |
|---|---|---|---|---|---|---|
1Non-Māori population only. 2Per 1,000 estimated mean population. 3Average number of births a woman would have during her reproductive life using the fertility rates characteristic of various childbearing age groups in that year. 4Average number of daughters a woman would have during her reproductive life, assuming that the age-of-mother-specific birth rates experienced during that year continue to apply. 5Figures before 1966 are for non-Māori population. 6Average number of daughters a woman would have during her reproductive life, assuming that the age-of-mother-specific birth rates and mortality rates experienced during that year continue to apply. 7Ex-nuptial births per 1,000 estimated mean number of not-married women aged 15–49 years. (Before 1966, rates are based on census counts of not-married women aged 15–44 years.) 8Births and fertility rates for 1998 are lower than expected because of a small change to the rate at which births were registered during 1998. Note:Births and fertility rates for 1991 onwards are based on the resident population concept, replacing the de facto population concept used in the past. P = provisional. Source: Statistics New Zealand | ||||||
| 18811 | 18,732 | 38.00 | .. | .. | .. | .. |
| 18861 | 19,299 | 33.14 | .. | .. | .. | .. |
| 18911 | 18,273 | 29.01 | .. | .. | .. | 9.38 |
| 18961 | 18,612 | 26.35 | .. | .. | .. | 9.44 |
| 19011 | 20,491 | 26.34 | .. | .. | .. | 9.04 |
| 19061 | 24,252 | 27.08 | .. | .. | .. | 9.92 |
| 19111 | 26,354 | 25.99 | .. | .. | .. | 8.93 |
| 19161 | 28,509 | 25.94 | .. | .. | .. | 9.24 |
| 1921 | 29,623 | 23.24 | 3.08 | .. | .. | 9.21 |
| 1926 | 29,904 | 21.15 | 2.88 | .. | .. | 9.92 |
| 1931 | 28,867 | 19.06 | 2.56 | .. | .. | .. |
| 1936 | 28,395 | 18.03 | 2.30 | 1.04 | 0.97 | 6.71 |
| 1941 | 39,170 | 24.02 | 2.93 | 1.37 | 1.27 | .. |
| 1946 | 47,524 | 27.01 | 3.45 | 1.59 | 1.47 | 11.67 |
| 1951 | 49,806 | 25.57 | 3.60 | 1.64 | 1.58 | 14.85 |
| 1956 | 56,531 | 25.90 | 3.98 | 1.84 | 1.77 | 17.79 |
| 1961 | 65,390 | 26.95 | 4.31 | 2.03 | 1.96 | 24.14 |
| 1966 | 60,003 | 22.37 | 3.41 | 1.66 | 1.61 | 36.92 |
| 1971 | 64,460 | 22.51 | 3.18 | 1.55 | 1.51 | 44.39 |
| 1976 | 55,105 | 17.60 | 2.27 | 1.09 | 1.07 | 36.86 |
| 1981 | 50,794 | 16.09 | 2.01 | 0.98 | 0.96 | 38.81 |
| 1986 | 52,823 | 16.12 | 1.96 | 0.96 | 0.94 | 39.80 |
| 1987 | 55,254 | 16.73 | 2.03 | 0.98 | 0.96 | 42.44 |
| 1988 | 57,546 | 17.35 | 2.10 | 1.02 | 1.00 | 45.85 |
| 1989 | 58,091 | 17.44 | 2.12 | 1.04 | 1.01 | 48.83 |
| 1990 | 60,153 | 17.89 | 2.18 | 1.07 | 1.04 | 50.95 |
| 1991 | 59,911 | 17.23 | 2.10 | 1.02 | 1.00 | 50.33 |
| 1992 | 59,166 | 16.83 | 2.07 | 0.99 | 0.98 | 50.06 |
| 1993 | 58,782 | 16.53 | 2.05 | 0.99 | 0.97 | 50.31 |
| 1994 | 57,321 | 15.91 | 1.99 | 0.97 | 0.95 | 48.68 |
| 1995 | 57,671 | 15.77 | 1.99 | 0.96 | 0.94 | 50.21 |
| 1996 | 57,280 | 15.42 | 1.96 | 0.95 | 0.94 | 49.72 |
| 1997 | 57,604 | 15.31 | 1.97 | 0.97 | 0.96 | 49.05 |
| 19988 | 55,349 | 14.59 | 1.91 | 0.92 | 0.91 | 47.11 |
| 1999 | 57,053 | 14.96 | 2.00 | 0.98 | 0.96 | 48.32 |
| 2000 | 56,605 | 14.77 | 2.01 | 0.97 | 0.96 | 47.66 |
| 2001P | 55,799 | 14.47 | 2.01 | 0.99 | 0.97 | 46.63 |
The life expectancy of New Zealanders increased significantly during the 20th century. A temperate climate, low population density, lack of heavy industry and good nutrition gave New Zealand an early advantage over other nations in terms of health conditions. From the middle of the 19th century until the 1930s, New Zealand had the lowest mortality rates in the world.
Figure 5.13 shows the birth and death rate in New Zealand from 1855 to 2001.
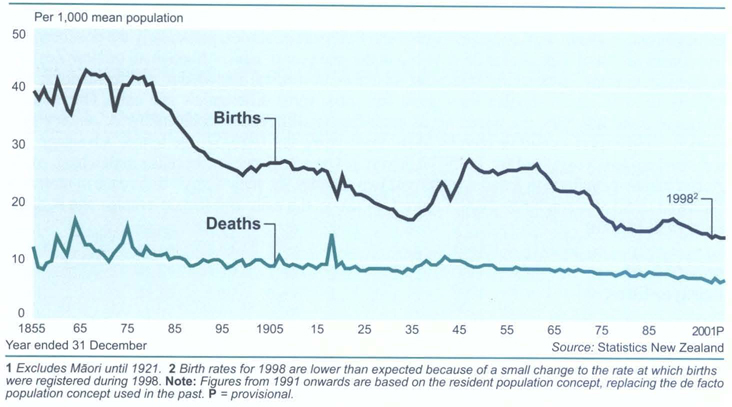
A large part of New Zealanders’ improvement in longevity occurred prior to the 1930s and was due to the saving of life at younger ages. The infant mortality rate fell steadily in association with a major reduction in infectious and respiratory diseases, which were previously the main causes of death in New Zealand.
The pace of improvement slowed in the 20 years prior to 1970 and there was even a slight deterioration in male longevity during the mid-1960s.
Since 1970–72, there has been a gain of 7.1 years in the life expectancy at birth of men and 6.2 years in women. Unlike earlier, a major part of this improvement has occurred in the retirement ages. This improvement, however, has not altered New Zealand's slightly disadvantaged position internationally. Currently, residents of at least seven other countries can expect to live longer than New Zealanders. Table 5.13 (see next page) compares historical life expectancy figures of six countries, including New Zealand.
Table 5.13. Historical life expectancies: international comparison Expectation of life at birth, in years
| Country | Year/period | Males | Females |
|---|---|---|---|
1Non-Māori population only. 2Abridged life tables. Source: Statistics New Zealand | |||
| New Zealand | 19011 | 58.1 | 60.6 |
| Australia | 1901–10 | 55.2 | 58.8 |
| Denmark | 1895–1900 | 50.2 | 53.2 |
| Japan | 1899–1903 | 37.8 | 38.2 |
| Norway | 1891–1900 | 50.4 | 54.1 |
| United Kingdom | 1906 | 48.0 | 51.6 |
| New Zealand | 1950–52 | 67.2 | 71.3 |
| Australia | 1953–55 | 67.1 | 72.8 |
| Denmark | 1951–60 | 70.1 | 73.2 |
| Japan | 1950–52 | 59.6 | 63.0 |
| Norway | 1951–55 | 71.1 | 74.7 |
| United Kingdom | 1951 | 66.2 | 71.2 |
| New Zealand | 1970–72 | 68.6 | 74.6 |
| Australia | 1975–77 | 69.5 | 76.4 |
| Denmark | 1971–75 | 70.9 | 76.5 |
| Japan | 1970 | 69.3 | 74.7 |
| Norway | 1971–75 | 71.4 | 77.7 |
| United Kingdom | 1971 | 68.8 | 75.0 |
| New Zealand | 1980–82 | 70.4 | 76.4 |
| Australia | 1981 | 71.4 | 78.4 |
| Denmark | 1981–85 | 71.5 | 77.5 |
| Japan | 1980 | 73.3 | 78.8 |
| Norway | 1981–82 | 72.6 | 79.4 |
| United Kingdom | 1981 | 70.8 | 76.8 |
| New Zealand | 1990–92 | 72.9 | 78.7 |
| Australia | 1993 | 75.0 | 80.9 |
| Denmark | 1991–92 | 72.4 | 77.8 |
| Japan | 1992 | 76.1 | 82.2 |
| Norway | 1992 | 74.2 | 80.3 |
| United Kingdom | 1990 | 73.0 | 78.5 |
| New Zealand2 | 1998–2000 | 75.7 | 80.8 |
| Australia | 1998 | 75.9 | 81.5 |
| Denmark | 1998–99 | 74.0 | 78.8 |
| Japan | 1998 | 77.2 | 84.0 |
| Norway | 2000 | 76.0 | 81.4 |
| United Kingdom | 1997–99 | 74.9 | 79.8 |
There is still considerable room for improvement, especially with regard to mortality in the first year of life and at retirement ages. Although the infant mortality rate has dropped in the past 50 years, from 41.7 per 1,000 live births in 1939 to 20.5 per 1,000 in 1962 and further to 6.1 per 1,000 in 2000, it is still high compared with some European countries, particularly the post neonatal component (death of a child over 28 days but under one year of age). Although all of New Zealand has benefited from better living standards, advances in medical knowledge and technology, and improvements in health services throughout the years, some differentials still exist. One notable historical trend has been the widening of male-female differences in mortality. A century ago, women could expect to outlive men by about three years. By 1950–52, the female advantage had increased to four years, and by 1975–77, it was 6.4 years. However, because males have made greater longevity gains than females in the past two decades, the male-female difference in mortality narrowed to 5.1 years in 1998–2000. Figure 5.14 shows the male and female average age at death from 1950 to 2001.
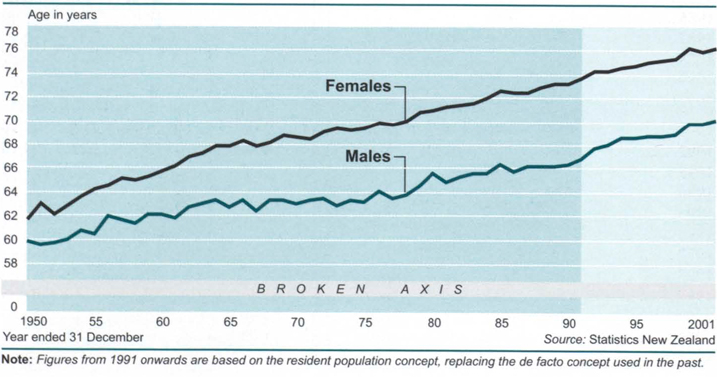
Table 5.14 provides a summary of vital statistics for the New Zealand population from 1885 to 2001.
Table 5.14. Vital statistics summary
| Year ended 31 December | Total live births (a) | Total deaths (b) | Natural increase (a)-(b) | Average age at death (years)2 | ||
|---|---|---|---|---|---|---|
| Male | Female | |||||
1Excludes Māori population. 2Figures before 1950 exclude Māori population. 3Births for 1998 are lower than expected because of a small change to the rate at which births were registered during 1998. Note:Figures from 1991 onwards are based on the resident population concept, replacing the de facto population concept used in the past. Source: Statistics New Zealand | ||||||
| 18851 | 19,693 | 6,081 | 13,612 | 57.2 | ||
| 18901 | 18,278 | 5,994 | 12,284 | 58.1 | ||
| 18951 | 18,546 | 6,863 | 11,683 | 60.0 | ||
| 19001 | 19,546 | 7,200 | 12,346 | 60.6 | ||
| 19051 | 23,682 | 8,061 | 15,621 | 61.8 | ||
| 19101 | 25,984 | 9,639 | 16,345 | 63.5 | ||
| 19151 | 27,850 | 9,965 | 17,885 | 64.2 | ||
| 19201 | 29,921 | 12,109 | 17,812 | 65.4 | ||
| 1925 | 29,869 | 11,844 | 18,025 | 66.3 | ||
| 1930 | 28,822 | 13,145 | 15,677 | 67.7 | ||
| 1935 | 27,150 | 13,664 | 13,486 | 68.5 | ||
| 1940 | 36,945 | 15,875 | 21,070 | 69.1 | ||
| 1945 | 41,534 | 17,686 | 23,848 | 70.6 | ||
| 1950 | 49,331 | 18,084 | 31,247 | 60.0 | 61.8 | |
| 1955 | 55,596 | 19,225 | 36,371 | 60.7 | 64.3 | |
| 1960 | 62,779 | 20,892 | 41,887 | 62.2 | 65.9 | |
| 1965 | 60,047 | 22,976 | 37,071 | 62.9 | 68.0 | |
| 1970 | 62,050 | 24,840 | 37,210 | 63.2 | 68.8 | |
| 1975 | 56,639 | 25,114 | 31,525 | 63.4 | 69.5 | |
| 1980 | 50,542 | 26,676 | 23,866 | 65.7 | 71.0 | |
| 1985 | 51,798 | 27,480 | 24,318 | 66.4 | 72.8 | |
| 1990 | 60,153 | 26,531 | 33,622 | 66.5 | 73.3 | |
| 1991 | 59,911 | 26,389 | 33,522 | 67.0 | 73.7 | |
| 1992 | 59,166 | 27,115 | 32,051 | 67.8 | 74.3 | |
| 1993 | 58,782 | 27,100 | 31,682 | 68.1 | 74.3 | |
| 1994 | 57,321 | 26,953 | 30,368 | 68.7 | 74.7 | |
| 1995 | 57,671 | 27,813 | 29,858 | 68.8 | 74.8 | |
| 1996 | 57,280 | 28,255 | 29,025 | 68.9 | 75.1 | |
| 1997 | 57,604 | 27,471 | 30,133 | 68.9 | 75.3 | |
| 19983 | 55,349 | 26,206 | 29,143 | 69.1 | 75.5 | |
| 1999 | 57,053 | 28,122 | 28,931 | 69.9 | 76.3 | |
| 2000 | 56,605 | 26,660 | 29,945 | 69.9 | 76.0 | |
| 2001 | 55,799 | 27,825 | 27,974 | 70.6 | 76.8 | |
Table 5.15 summarises death rates per 1,000 mean population, by age and sex.
Table 5.15. Death rates: summary
| Year ended 31 December | Under 11 | 1–4 | 5–14 | 15–24 | 25–34 | 35–44 | 45–54 | 55–64 | 65–74 | 75 and over |
|---|---|---|---|---|---|---|---|---|---|---|
Per 1,000 live births. 2Figures for non-Māori only, as age group figures for Māori not available for these years. Note:Death rates for 1991 onwards are based on the resident population concept, replacing the de facto population concept used in the past. P = provisional. Source: Statistics New Zealand | ||||||||||
| Rates per 1,000 mean population in each age group | ||||||||||
| Males | ||||||||||
| 19012 | 78.60 | 6.81 | 1.89 | 3.52 | 3.97 | 6.16 | 11.94 | 23.12 | 50.59 | 141.67 |
| 19212 | 53.10 | 4.78 | 1.85 | 2.44 | 3.56 | 5.55 | 9.61 | 19.96 | 46.17 | 128.60 |
| 1941 | 43.65 | 4.39 | 1.36 | 2.53 | 2.93 | 3.95 | 9.20 | 21.13 | 47.44 | 140.27 |
| 1961 | 25.86 | 1.34 | 0.49 | 1.28 | 1.47 | 2.68 | 7.39 | 19.65 | 47.33 | 126.31 |
| 1981 | 13.01 | 0.95 | 0.35 | 1.53 | 1.35 | 2.26 | 6.57 | 17.30 | 43.39 | 114.11 |
| 1985 | 12.09 | 0.54 | 0.36 | 1.54 | 1.38 | 1.94 | 5.86 | 16.75 | 42.20 | 120.09 |
| 1986 | 12.49 | 0.86 | 0.34 | 1.71 | 1.53 | 2.12 | 5.71 | 16.06 | 41.72 | 111.40 |
| 1987 | 10.56 | 0.59 | 0.39 | 1.75 | 1.54 | 1.90 | 5.63 | 15.49 | 40.73 | 110.43 |
| 1988 | 12.13 | 0.65 | 0.31 | 1.68 | 1.54 | 2.08 | 5.07 | 15.88 | 38.85 | 111.33 |
| 1989 | 11.73 | 0.66 | 0.34 | 1.85 | 1.53 | 2.01 | 5.07 | 14.45 | 37.57 | 106.64 |
| 1990 | 9.64 | 0.73 | 0.29 | 1.80 | 1.51 | 1.93 | 4.68 | 14.08 | 36.07 | 101.75 |
| 1991 | 9.57 | 0.49 | 0.32 | 1.48 | 1.34 | 2.06 | 4.51 | 13.16 | 33.95 | 97.76 |
| 1992 | 8.23 | 0.53 | 0.31 | 1.52 | 1.44 | 1.84 | 4.57 | 13.53 | 34.25 | 104.10 |
| 1993 | 7.69 | 0.45 | 0.19 | 1.57 | 1.26 | 2.01 | 4.31 | 12.45 | 32.43 | 101.28 |
| 1994 | 7.17 | 0.50 | 0.24 | 1.20 | 1.44 | 1.77 | 4.08 | 11.81 | 32.39 | 100.82 |
| 1995 | 6.83 | 0.37 | 0.25 | 1.45 | 1.44 | 1.62 | 4.25 | 11.89 | 32.06 | 101.42 |
| 1996 | 7.54 | 0.43 | 0.22 | 1.34 | 1.41 | 1.56 | 4.01 | 11.87 | 31.09 | 99.12 |
| 1997 | 7.30 | 0.50 | 0.22 | 1.27 | 1.38 | 1.75 | 3.92 | 10.83 | 30.11 | 94.82 |
| 1998 | 6.51 | 0.42 | 0.26 | 1.12 | 1.30 | 1.77 | 3.44 | 10.55 | 27.60 | 88.04 |
| 1999 | 6.54 | 0.35 | 0.21 | 1.05 | 1.29 | 1.62 | 3.68 | 10.75 | 27.65 | 93.72 |
| 2000 | 6.52 | 0.44 | 0.22 | 1.00 | 1.33 | 1.58 | 3.48 | 9.14 | 26.67 | 88.04 |
| 2001P | 6.14 | 0.33 | 0.20 | 1.06 | 1.22 | 1.58 | 3.26 | 9.14 | 27.09 | 87.22 |
| Females | ||||||||||
| 19012 | 63.87 | 5.50 | 1.64 | 3.58 | 4.72 | 6.70 | 10.62 | 19.44 | 43.32 | 127.98 |
| 19212 | 42.31 | 4.49 | 1.31 | 2.34 | 3.38 | 4.46 | 8.00 | 14.88 | 36.81 | 120.23 |
| 1941 | 37.75 | 3.84 | 1.20 | 1.94 | 2.44 | 3.50 | 6.90 | 15.04 | 38.60 | 118.92 |
| 1961 | 19.50 | 1.16 | 0.35 | 0.53 | 0.87 | 1.95 | 4.59 | 11.22 | 29.89 | 104.74 |
| 1981 | 10.22 | 0.64 | 0.23 | 0.67 | 0.64 | 1.51 | 3.94 | 9.19 | 23.73 | 84.67 |
| 1985 | 9.47 | 0.58 | 0.29 | 0.57 | 0.69 | 1.39 | 3.85 | 9.44 | 23.44 | 89.59 |
| 1986 | 9.87 | 0.48 | 0.26 | 0.55 | 0.69 | 1.27 | 3.42 | 9.38 | 22.39 | 84.02 |
| 1987 | 9.45 | 0.52 | 0.23 | 0.62 | 0.70 | 1.28 | 3.85 | 9.26 | 23.28 | 83.85 |
| 1988 | 9.35 | 0.49 | 0.25 | 0.61 | 0.70 | 1.28 | 3.44 | 8.30 | 21.85 | 83.42 |
| 1989 | 8.58 | 0.39 | 0.20 | 0.60 | 0.57 | 1.27 | 3.58 | 8.60 | 21.03 | 80.64 |
| 1990 | 6.93 | 0.37 | 0.17 | 0.59 | 0.65 | 1.24 | 3.66 | 8.84 | 21.07 | 75.60 |
| 1991 | 6.84 | 0.37 | 0.18 | 0.49 | 0.63 | 1.35 | 3.22 | 8.13 | 19.60 | 75.61 |
| 1992 | 6.12 | 0.34 | 0.23 | 0.51 | 0.52 | 1.15 | 3.10 | 7.52 | 19.12 | 75.46 |
| 1993 | 6.60 | 0.48 | 0.19 | 0.51 | 0.57 | 1.13 | 2.97 | 7.99 | 19.08 | 75.85 |
| 1994 | 6.81 | 0.33 | 0.14 | 0.51 | 0.56 | 1.08 | 2.83 | 7.63 | 18.43 | 74.46 |
| 1995 | 6.48 | 0.38 | 0.16 | 0.55 | 0.60 | 1.14 | 3.10 | 7.37 | 18.59 | 75.71 |
| 1996 | 6.65 | 0.37 | 0.21 | 0.56 | 0.60 | 0.95 | 2.97 | 7.40 | 18.77 | 77.36 |
| 1997 | 5.75 | 0.34 | 0.16 | 0.49 | 0.64 | 0.99 | 2.75 | 6.85 | 17.48 | 72.29 |
| 1998 | 4.45 | 0.31 | 0.17 | 0.47 | 0.55 | 1.06 | 2.46 | 6.79 | 16.37 | 67.97 |
| 1999 | 4.52 | 0.29 | 0.15 | 0.51 | 0.51 | 1.07 | 2.51 | 6.91 | 17.49 | 74.18 |
| 2000 | 5.68 | 0.31 | 0.15 | 0.34 | 0.52 | 0.96 | 2.51 | 6.44 | 15.89 | 67.08 |
| 200IP | 4.44 | 0.33 | 0.18 | 0.41 | 0.52 | 0.92 | 2.49 | 6.41 | 15.90 | 72.56 |
| Both sexes | ||||||||||
| 19012 | 71.40 | 6.17 | 1.77 | 3.55 | 4.33 | 6.40 | 11.37 | 21.63 | 47.87 | 135.71 |
| 19212 | 47.82 | 4.64 | 1.58 | 2.39 | 3.47 | 5.10 | 8.85 | 17.59 | 41.90 | 124.84 |
| 1941 | 39.81 | 4.12 | 1.28 | 2.22 | 2.67 | 3.72 | 8.02 | 18.16 | 43.04 | 129.15 |
| 1961 | 22.76 | 1.25 | 0.42 | 0.91 | 1.18 | 2.31 | 6.00 | 15.41 | 37.67 | 114.01 |
| 1981 | 11.65 | 0.80 | 0.29 | 1.11 | 0.99 | 1.89 | 5.29 | 13.15 | 32.67 | 95.41 |
| 1985 | 10.81 | 0.56 | 0.33 | 1.06 | 1.03 | 1.66 | 4.87 | 13.06 | 31.86 | 100.69 |
| 1986 | 11.21 | 0.68 | 0.30 | 1.14 | 1.11 | 1.69 | 4.58 | 12.71 | 31.09 | 94.15 |
| 1987 | 10.03 | 0.55 | 0.31 | 1.20 | 1.12 | 1.59 | 4.75 | 12.37 | 31.10 | 93.70 |
| 1988 | 10.77 | 0.57 | 0.28 | 1.15 | 1.12 | 1.68 | 4.26 | 12.09 | 29.47 | 93.72 |
| 1989 | 10.19 | 0.53 | 0.27 | 1.23 | 1.04 | 1.64 | 4.34 | 11.52 | 28.55 | 90.28 |
| 1990 | 8.31 | 0.56 | 0.23 | 1.20 | 1.07 | 1.59 | 4.17 | 11.46 | 27.93 | 85.26 |
| 1991 | 8.25 | 0.43 | 0.25 | 0.98 | 0.98 | 1.70 | 3.87 | 10.65 | 26.18 | 83.82 |
| 1992 | 7.22 | 0.44 | 0.27 | 1.01 | 0.97 | 1.49 | 3.83 | 10.52 | 26.12 | 86.19 |
| 1993 | 7.16 | 0.46 | 0.19 | 1.04 | 0.91 | 1.57 | 3.64 | 10.22 | 25.30 | 85.24 |
| 1994 | 7.00 | 0.41 | 0.19 | 0.85 | 0.99 | 1.42 | 3.46 | 9.71 | 24.98 | 84.45 |
| 1995 | 6.66 | 0.38 | 0.20 | 1.00 | 1.01 | 1.38 | 3.67 | 9.62 | 24.95 | 85.21 |
| 1996 | 7.11 | 0.40 | 0.21 | 0.95 | 0.99 | 1.25 | 3.49 | 9.62 | 24.62 | 85.44 |
| 1997 | 6.54 | 0.43 | 0.19 | 0.88 | 1.00 | 1.36 | 3.34 | 8.83 | 23.52 | 80.94 |
| 1998 | 5.51 | 0.37 | 0.21 | 0.80 | 0.92 | 1.41 | 2.95 | 8.66 | 21.75 | 75.50 |
| 1999 | 5.56 | 0.32 | 0.18 | 0.79 | 0.88 | 1.34 | 3.09 | 8.82 | 22.37 | 81.56 |
| 2000 | 6.11 | 0.38 | 0.19 | 0.68 | 0.91 | 1.26 | 3.00 | 7.78 | 21.10 | 75.07 |
| 2001P | 5.30 | 0.33 | 0.19 | 0.75 | 0.86 | 1.24 | 2.87 | 7.76 | 21.31 | 78.20 |
Life expectancy also varies according to ethnicity. Non-Māori generally have lower mortality rates than Māori. As a result, life expectancy at birth for non-Māori was greater than that for Māori by 8.1 years for males and 9 years for females, according to the 1995–97 life tables. It is not possible to compare these latest Māori and non-Māori life tables with earlier life tables because of a change to the ethnicity question on the death registration form introduced in 1995.
According to the 1995–97 life tables, a newborn Māori girl can expect to live 71.6 years, and a newborn Māori boy can expect to live 67.2 years. For non-Māori, life expectancy at birth was 80.6 years for females and 75.3 years for males.
New Zealand has traditionally been a country of immigration, although in the past 150 years the intake has been small compared with immigration flows to New World countries such as Australia, Canada and the United States.
Immigration has had a major impact on the size, growth rate, age-sex structure and ethnic composition of New Zealand's population throughout the years, and has been a subject of vigorous public debate, especially when large-scale immigration has tested the amenities and social services of the country.
The end of World War II saw economic stability and the reintroduction, in 1947, of an assisted/free passage scheme to attract working-age industrial and agricultural labour from the United Kingdom. The immigration policy was further liberalised in 1950. Agreements were also negotiated to accept young non-British European migrants. Refugee immigration was allowed on humanitarian grounds.
Subsequently, these grounds were to lead to the settlement of nearly 4,000 Indo-Chinese refugees in New Zealand during the March years 1978–82. Historical and regional considerations also led to establishment of immigration quotas for small Pacific Island countries.
The government adopted a new immigration policy in 1974, which ended unrestricted immigration from the United Kingdom and Ireland and provided for the selection of immigrants from all sources on the same criteria. The reciprocal Trans-Tasman Travel Agreement, which allows free movement of residents between Australia and New Zealand, was not changed. Similarly, the right of free entry into New Zealand was maintained for the people of the Cook Islands, Niue and the Tokelau Islands, who are regarded as New Zealand citizens. As a result, immigrants in post-war years have come from a wider range of countries than before.
Between 1950 and 1967, New Zealand recorded a net gain of about 270,000 permanent and long-term migrants. In 16 of the 18 years, net migration was more than 10,000. The economic recession of the late 1960s turned the tide again. A significant drop in immigration and a sharp upturn in emigration resulted in a net outflow of 7,387 during 1968–1970. While annual net migration in the following nine-year period varied between a net inflow of 27,477 in 1974 and a net outflow of 40,200 in 1979, the result was a small outflow of 2,831 people.
The two most recent decades have seen major and unprecedented changes in external migration levels and patterns. The preponderance of immigrants from the United Kingdom and Ireland has decreased and migration to and from Australia has become the largest in terms of volume. The rate of migration has increased significantly and there have been dramatic shifts in the flow of migrants.
The 1980s brought radical changes in permanent and long-term migration (people whose stated intention is arriving to settle, or departing for 12 months or more). Permanent and long-term departures had shown an almost unbroken upward trend since the 1950s, rising from 6,886 in 1950 to 81,008 in 1979. In the year ended March 1980, the number of permanent and long-term departures declined by 6 percent. By 1984, the number of emigrants had fallen to 34,147. A drop in departures to Australia accounted for about 60 percent of this decline. For the first time since 1976, more people arrived in New Zealand than left in 1983 and 1984, giving small gains to the country of 3,180 and 6,558 respectively. The turnaround was short-lived, however. During the remainder of the 1980s, the number of departures resumed an upward movement, reaching a peak in 1989, with 70,941 emigrants, giving a net outflow of 24,708 people for that year.
The 1990s saw a return to net population gains from migration, resulting from both increases in the number of permanent and long-term arrivals, and decreases in departures. In the year ended March 1991, there was a net gain of 11,616 people. By 1995 this had almost doubled to 21,697 and by 1996 reached 29,832 – the highest recorded (March year) gain of permanent and long-term migrants. This figure dropped to 20,948 in 1997 and further to 2,707 in 1998. During the year ended March 2001, permanent and long-term departures once again exceeded arrivals by 12,600. This is the largest outflow of migrants recorded since 1989. In 2001, there were net losses of population to Australia (31,577), the United Kingdom (1,287), and the United States and Canada (1,211).
Immigration from South Pacific countries, although small in amount, is continuing.
Net migration from Asia increased significantly between 1988 and 1996, but has since begun to fall. In 1988, net permanent and long-term migration from Asian countries was 3,998. It peaked in 1996 at 23,489, but fell to 10,028 in the year ended 31 March 1999. During the year ended 31 March 2001, the net permanent and long-term migration from Asia recorded a gain of 14,051.

Immigration has had a major impact on the composition of New Zealand's population.
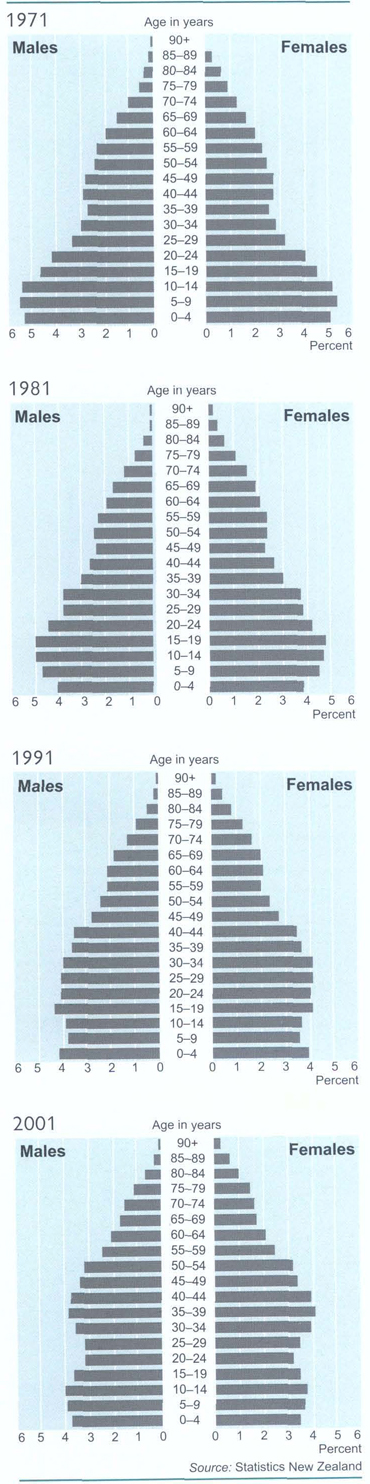
Table 5.16 provides a summary of external migration for New Zealand from 1880 to 2001.
Table 5.16. External migration: summary
| Period ended 31 March | Total | Permanent and long-term | Short-term | ||||||
|---|---|---|---|---|---|---|---|---|---|
| Arrivals | Departures | Net Arrivals | Arrivals | Departures | NetArrivals | Arrivals | Departures | Net Arrivals | |
Note:A minus sign denotes an excess of departures over arrivals. R = revised. Source: Statistics New Zealand | |||||||||
| Five-year totals | |||||||||
| 1880 | 98,877 | 30,376 | 68,501 | ||||||
| 1885 | 73,861 | 44,776 | 29,085 | ||||||
| 1890 | 75,063 | 79,747 | -4,684 | ||||||
| 1895 | 101,508 | 88,067 | 13,441 | ||||||
| 1900 | 93,037 | 84,398 | 8,639 | ||||||
| 1905 | 141,678 | 99,501 | 42,177 | ||||||
| 1910 | 190,772 | 146,783 | 43,989 | ||||||
| 1915 | 202,087 | 165,286 | 36,801 | ||||||
| 1920 | 98,473 | 90,532 | 7,941 | ||||||
| 1925 | 199,791 | 151,285 | 48,506 | ||||||
| 1930 | 192,606 | 167,346 | 25,260 | 53,988 | 16,081 | 37,907 | 138,618 | 151,265 | -12,647 |
| 1935 | 111,933 | 118,076 | -6,143 | 13,466 | 14,830 | -1,364 | 98,467 | 103,246 | -4,779 |
| 1940 | 171,424 | 159,514 | 11,910 | 22,871 | 19,267 | 3,604 | 148,553 | 140,247 | 8,306 |
| 1945 | 35,003 | 32,414 | 2,589 | 6,597 | 9,241 | -2,644 | 28,406 | 23,173 | 5,233 |
| 1950 | 158,637 | 135,439 | 23,198 | 51,487 | 30,020 | 21,467 | 107,150 | 105,419 | 1,731 |
| 1955 | 306,837 | 239,148 | 67,689 | 116,510 | 37,419 | 79,091 | 190,327 | 201,729 | -11,402 |
| 1960 | 395,218 | 347,021 | 48,197 | 115,308 | 51,169 | 64,139 | 279,910 | 295,852 | -15,942 |
| 1965 | 737,703 | 676,137 | 61,566 | 156,462 | 75,055 | 81,407 | 581,241 | 601,082 | -19,841 |
| 1970 | 1,278,867 | 1,273,409 | 5,458 | 155,008 | 127,814 | 27,194 | 1,123,859 | 1,145,595 | -21,736 |
| 1975 | 2,506,714 | 2,400,234 | 106,480 | 274,842 | 196,993 | 77,849 | 2,231,872 | 2,203,241 | 28,631 |
| 1980 | 3,793,483 | 3,874,575 | -81,092 | 204,867 | 319,964 | -115,097 | 3,588,616 | 3,554,611 | 34,005 |
| 1985 | 4,772,257 | 4,766,993 | 5,264 | 213,059 | 247,712 | -34,653 | 4,559,198 | 4,519,281 | 39,917 |
| 1990 | 7,359,340 | 7,394,389 | -35,049 | 226,420 | 306,653 | -80,233 | 7,132,920 | 7,087,736 | 45,184 |
| 1995 | 9,773,429 | 9,711,641 | 61,788 | 280,508 | 220,473 | 60,035 | 9,492,921 | 9,491,168 | 1,753 |
| Annual totals | |||||||||
| 1987 | 1,321,729 | 1,317,372 | 4,357 | 44,360 | 58,629 | -14,269 | 1,277,369 | 1,258,743 | 18,626 |
| 1988 | 1,554,992 | 1,555,949 | -957 | 47,844 | 63,469–15,625 | 1,507,148 | 1,492,480 | 14,668 | |
| 1989 | 1,669,637 | 1,687,935 | -18,298 | 46,233 | 70,941 | -24,708 | 1,623,404 | 1,616,994 | 6,410 |
| 1990 | 1,701,056 | 1,702,689 | -1,633 | 52,001 | 56,019 | -4,018 | 1,649,055 | 1,646,670 | 2,385 |
| 1991 | 1,772,524 | 1,757,948 | 14,576 | 57,088 | 45,472 | 11,616 | 1,715,436 | 1,712,476 | 2,960 |
| 1992 | 1,809,885 | 1,806,947 | 2,938 | 49,010 | 44,723 | 4,287 | 1,760,875 | 1,762,224 | -1,349 |
| 1993 | 1,898,769 | 1,890,689 | 8,080 | 49,562 | 42,714 | 6,848 | 1,849,207 | 1,847,975 | 1,232 |
| 1994 | 2,057,005 | 2,041,212 | 15,793 | 57,257 | 41,670 | 15,587 | 1,999,748 | 1,999,542 | 206 |
| 1995 | 2,235,246 | 2,214,845 | 20,401 | 67,591 | 45,894 | 21,697 | 2,167,655 | 2,168,951 | -1,296 |
| 1996 | 2,464,732 | 2,436,106 | 28,626 | 80,288 | 50,456 | 29,832 | 2,384,444 | 2,385,650 | -1,206 |
| 1997 | 2,726,897 | 2,689,118 | 37,779 | 76,896 | 55,948 | 20,948 | 2,650,001 | 2,633,170 | 16,831 |
| 1998 | 2,651,737R | 2,649,814R | 1,923R | 62,928 | 60,221 | 2,707 | 2,588,809R | 2,589,593R | -784R |
| 1999 | 2,755,895R | 2,769,847R | -13,952R | 56,580 | 66,779 | -10,199 | 2,699,315R | 2,703,068R | -3,753R |
| 2000 | 2,919,755 | 2,917,606 | 2,149 | 61,089 | 70,076 | -8,987 | 2,858,666 | 2,847,530 | 11,136 |
| 2001 | 3,218,995 | 3,214,037 | 4,958 | 66,465 | 79,065 | -12,600 | 3,152,530 | 3,134,972 | 17,558 |
The age and sex profile of a population represents the cumulative effect of past changes in the dynamics of population growth – fertility, mortality and migration.
There are slightly more females than males in the New Zealand population at present. This contrasts with early colonial days, when there was a large surplus of males, especially young males. Each census has seen the sex ratio draw closer to parity, with two exceptions when there was a temporary excess of females – during World War 1 and, again, during World War II (see table 5.17). Females again outnumbered males in 1968 and the ratio has increased steadily since then. The 2001 Census showed there were 1,823,007 males and 1,914,273 females usually resident in New Zealand, representing a sex ratio of 95 males to 100 females. The shift largely reflected the preponderance of females among the older population (65 years and over) at 78 males to 100 females in 2001. At ages below 65 years, the sex ratio is 98 males to 100 females.
Figure 5.15 shows the age and sex distribution of the New Zealand population at 10-year intervals from 1971 to 2001.
Changes in the age structure of New Zealand's population have been profound during the past 100 years (see Figure 5.16). The changes largely reflect the ‘roller coaster’ movements in the birth rate, with small and large birth cohorts moving through the age structure. However, migration gains and losses (dominated by people of younger and middle working ages) have added significantly to these structural changes.
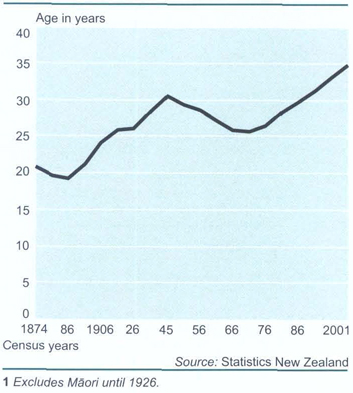
The baby boom broadened the base again and lifted the proportion of children in the population to 33 percent in 1961. With almost half of the population aged under 25 years at that time, the population looked youthful once again. The ageing of the smaller group of people born during the depression years meant a smaller proportion of workers (those aged 15–64 years) in the population – only 58 percent in 1961. The older population (aged 65 years and over) increased by 42 percent between 1945 and 1961, to make up just over 8 percent of the population. As the ‘youth’ and ‘aged’ components both increased, the dependency ratio (the number of persons aged 0–14 years and 65 years and over per 100 persons aged 15–64 years) lifted sharply to 0.72.
The subsequent sharp decline in fertility, increased longevity and movement of the baby boom ‘bulge’ into working ages has caused a major realignment of the age structure, as well as incipient ageing. The median age of the population rose by 8.3 years between 1976 and 2001, from 26.5 years to 34.8 years. The dependency ratio has fallen to 0.53, due largely to a sharp drop in the ‘youth’ component.
At the 2001 Census, there were 847,743 children under the age of 15 usually resident in New Zealand (down from 928,205 in 1976). They made up 23 percent of the population (down from 30 percent in 1976). The 15–64 age group has risen considerably since 1976 (by more than half a million) to number 2,439,111 at the 2001 Census. However, the proportion of the male population in the working ages has declined slightly since 1991, whereas the proportion of the female population in the working ages has continued to increase.
The greatest change in the age structure of the population is at the older ages. Since 1976, the number of people aged 65 years and more has increased by more than one-and-a-half times and the number aged 80 years and more has more than doubled.
There are population sub-groups within New Zealand with remarkably different age structures. Ethnic groups such as Māori and Pacific peoples have more youthful populations, commonly characteristic of developing nations. At the 2001 Census, they contained nearly twice the proportion of children under 15 years as their European or Asian counterparts. Nearly two-thirds of their populations are under 30 years and their median ages are about 15 years lower than their European counterparts. At the other end of the age scale, only about 4 percent of the Māori, Asian and Pacific peoples populations are aged 65 or more, compared with 14 percent for the European ethnic group, reflecting both different life expectancy and recent migration history.
Table 5.17. Sex of the population, 1858–2001 censuses
| Census1 | Males | Females | Total population | Sex ratio2 |
|---|---|---|---|---|
Figures from 1981 onwards are census usually resident population counts, replacing census night population counts used in the past. 2Number of males per 100 females. Note:All figures have been randomly rounded to base 3. Source: Statistics New Zealand | ||||
| 1858 | 65,388 | 50,076 | 115,461 | 130.6 |
| 1874 | 195,765 | 149,220 | 344,985 | 131.2 |
| 1878 | 254,937 | 203,070 | 458,007 | 125.5 |
| 1881 | 293,973 | 240,057 | 534,030 | 122.5 |
| 1886 | 335,061 | 285,390 | 620,451 | 117.4 |
| 1891 | 355,737 | 312,912 | 668,652 | 113.7 |
| 1896 | 393,033 | 350,181 | 743,214 | 112.2 |
| 1901 | 429,111 | 386,751 | 815,862 | 111.0 |
| 1906 | 496,545 | 439,764 | 936,309 | 112.9 |
| 1911 | 558,384 | 499,926 | 1,058,313 | 111.7 |
| 1916 | 577,716 | 571,509 | 1,149,225 | 101.1 |
| 1921 | 651,156 | 620,514 | 1,271,667 | 104.9 |
| 1926 | 719,643 | 688,497 | 1,408,140 | 104.5 |
| 1936 | 799,092 | 774,720 | 1,573,812 | 103.1 |
| 1945 | 832,908 | 869,421 | 1,702,329 | 95.8 |
| 1951 | 973,968 | 965,505 | 1,939,473 | 100.9 |
| 1956 | 1,093,212 | 1,080,852 | 2,174,061 | 101.1 |
| 1961 | 1,213,377 | 1,201,608 | 2,414,985 | 101.0 |
| 1966 | 1,343,742 | 1,333,176 | 2,676,918 | 100.8 |
| 1971 | 1,430,856 | 1,431,774 | 2,862,630 | 99.9 |
| 1976 | 1,562,043 | 1,567,341 | 3,129,384 | 99.7 |
| 1981 | 1,562,553 | 1,580,754 | 3,143,307 | 98.8 |
| 1986 | 1,616,667 | 1,646,616 | 3,263,283 | 98.2 |
| 1991 | 1,662,555 | 1,711,371 | 3,373,926 | 97.1 |
| 1996 | 1,777,464 | 1,840,839 | 3,618,303 | 96.6 |
| 2001 | 1,823,007 | 1,914,273 | 3,737,277 | 95.2 |
New Zealand has been ethnically and culturally connected to Polynesia for at least 1,000 years. Its population and cultural heritage 200 years ago was wholly that of Polynesia, but is now dominated by cultural traditions that are mainly European, emanating especially from the British Isles.
About 80 percent of New Zealanders are of European ethnicity. The indigenous Māori ethnic group makes up the next largest group of the population, about 14.1 percent in 2001. The other main ethnic groups are Asian and Pacific peoples, who made up 6.6 and 6.5 percent respectively of the resident population count at the 2001 Census.
The ethnic and cultural composition of New Zealand has been shaped and reshaped by three main demographic processes: international migration, natural increase and inter-marriage. The most important of these processes has been international migration.
Māori ethnic group. Estimates of the size of the Māori population at the time of European contact in 1769 range from 150,000 to 200,000. There is, however, agreement that whatever the original size of the population, a substantial decline occurred in the following 70 years. It is believed the population had dropped to no more than 100,000 by 1840. Tuberculosis, typhoid, venereal disease, measles, influenza and other diseases exacted a heavy toll. Introduction of firearms and subsequent warfare also resulted in depletion of population.
At the time of the first census to count Māori, in 1858, numbers were down to fewer than 60,000. This decline, combined with European immigration, made Māori a minority group in the population by the 1860s. Numbers continued to decline further, at a rate of more than 1 percent a year, until the 1870s. Population levels fluctuated for the remainder of the 19th century, with the lowest point of 42,000 reached in 1896.
By the mid-1940s, the Māori population had risen to a level comparable with that at the beginning of European settlement. The growth rate accelerated markedly after World War II and peaked at 4.4 percent a year during the early 1960s. This is believed to be close to the maximum possible increase for a human population ‘closed’ to inward migration. The rate of increase remained at high levels until the mid-1970s.
Between 1976 and 1986 the rate of increase dropped significantly, averaging 1.3 percent a year. More recently, between 1991 and 2001, the rate of increase has averaged 1.9 percent a year.
By the 2001 Census, people who belonged to the Māori ethnic group numbered 526,281 and made up 14.1 percent of the resident population count. Those of some Māori descent made up 16.2 percent of the count and numbered 604,110.
International migration emerged for the first time as a significant factor in Māori population change when large numbers of young Māori left New Zealand on a permanent or long-term basis in the 1980s. A population loss of 8,100 was recorded between 1981 and 1986. The main destinations of the migrants were Australia and the United Kingdom. Sizeable Māori communities now exist in Australia – particularly in Sydney. A result is that the Māori population is now susceptible to inward migration, both from return migration and inward migration of Māori born overseas.
Fertility transition – Māori fertility has historically been high. Up to the 1960s, the birth rate was around 45 per 1,000. However, a transition in fertility from high to low rates occurred in the 1960s and 1970s. Māori experienced one of the most rapid transitions chronicled anywhere in the world when the fertility rate dropped to a level 40 percent below the rate of that prior to 1962. The 10 years from 1962–71 saw the total fertility rate begin to decline, from six births per woman to five births per woman. The rate then began to fall even more sharply and by 1977 was three births per woman. This level had only been reached by non-Māori women in 1972. By 1990, the total fertility rate had dropped to 2.19 births per woman. The ethnic question on the birth registration form changed in September 1995. The new question and the resultant differences (biological versus self-identification) mean new birth data by ethnicity is not directly comparable with the old series. The total fertility rate for the Māori population was 2.6 births per woman in 1996 and had fallen to 2.5 births per woman in 2001.
Rural to urban migration – The change from being a largely rural to a predominantly urban population also happened extremely rapidly for Māori. By 1945, around 75 percent of Māori lived in rural areas. Within two decades, however, the majority of Māori were living in urban areas, largely as the result of Māori returning from war service settling in the cities rather than the areas they left from. By the mid-1970s, 75 percent lived in urban areas. Then a trend for migration from urban to rural ancestral marae became apparent. Initially such migrants were older urban Māori, but more recently a wider section of urban Māori have been involved. Nevertheless, by 1981, 80 percent of the Māori ethnic group was urban, and urbanisation among Māori has remained at that level. Urbanisation of Māori has been accompanied by a wider geographical distribution throughout New Zealand. In the 1920s, 95 percent of Māori lived in the North Island. Countering the trend of the total New Zealand population, Māori then began to shift south, to the southern North Island and to the South Island. In 2001, 12.4 percent of Māori lived in the South Island compared with 24.3 percent of all New Zealanders.
Age structure – Youthfulness is the central characteristic that has distinguished Māori from the non-Māori population structure. Throughout most of the last century the Māori population was concentrated in the younger age groups – a result of the consistently high fertility of Māori and lower life expectancy. Between 1926 and 1976, the proportion of children in the Māori population consistently exceeded 43 percent. A peak of 50 percent was achieved in 1966. In 1961, just more than 20 percent of the Māori population was aged under five. In the 15 years from 1971 to 1986. significant changes to the structure of the Māori population occurred. The transition in fertility experienced in the 1970s had much impact. The median age, the point at which half the population is older and half younger, steadily increased. In 1976 it was 15.7 years, by 1991 it had risen to 20.5 years and in 2001 it was 21.9 years, compared with 34.8 years for the total population. The number and proportion of children in the Māori ethnic group also changed during this period. Children made up 45 percent of the Māori population in 1976. By 1986 this had fallen to 39 percent and since 1991 it has stabilised at around 37 percent. Despite these changes, the Māori ethnic group is still relatively youthful compared with the rest of the New Zealand population. With the decline in the proportion of children in the population there has been an expansion in the population of the working-age group (15–64 years). In 1976 and 1991, 53 percent and 60 percent of the Māori ethnic group were in the working ages (15–64 years). By 2001, 59.3 percent of Māori were in the working ages – closer to the 65.3 percent of the total census usually resident population count. Within the working age group, however, a higher proportion of Māori were in the 15–29 age group (42.2 percent of Māori compared with 30.8 percent of the total census usually resident population count). Although the Māori ethnic group is moving towards a more elderly age structure, it is still younger than the non-Māori population. In 2001, the proportions in each age group under 35 were larger for Māori than non-Māori.
Females outnumbered males at the 2001 Census, with a sex ratio of 95 males to 100 females.
Pacific peoples ethnic group. The cultural and ethnic diversity of New Zealand has been enhanced since the 1960s by the inflow of people from the Pacific Islands. The Pacific peoples ethnic group has grown from a little more than 100,000 in 1981 to nearly 232,000 at the 2001 Census.
Immigration from the Pacific dropped sharply in the 1970s as a result of economic downturn, and natural increase became the major source of Pacific peoples population growth. The early 1980s saw a return to net migration gains from the Pacific. From 1980 to 1984, there were 8,354 more arrivals than departures, and the second half of the 1980s saw arrivals outnumbering departures by more than 37,000. The early 1990s saw a temporary reversal of this trend, but since 1995 arrivals have continued to exceed departures.
Refugees. Refugees from Europe arrived in New Zealand in the 1930s and again during and after World War II. This migration was intensified after the war, with about 6,000 refugees from Poland settling in New Zealand in the immediate post-war years. Following the 1956 Hungarian uprising, a limited intake of refugees from Hungary was received by New Zealand. As a result of conflict, about 7,000 South-east Asian refugees have resettled in New Zealand since 1975, making up more than 90 percent of New Zealand's refugee intake since that date. In addition to the South-east Asian refugees, small numbers of Chilean, Russian Jew, East European, Assyrian, Ethiopian, Bosnian and Somali refugees have also been received.
While the cultural diversity of New Zealand is – for the greater part – Eurocentric, the range of cultures from non-European sources, along with the existing Māori culture, suggest that New Zealand in the future will posses an increasingly wider range of ethnic and cultural values. For further information on ethnicity and country of birth of the population refer to Chapter 6.1: Social diversity.
5.1–5.4 Statistics New Zealand.
Statistics New Zealand divisional manager responsible: Mansoor Khawaja.
Demographic Trends (annual). Statistics New Zealand. Wellington.
Digital geographic boundary data from Geoframe, based on census meshblocks. Customised, Statistics New Zealand, Wellington
External Migration Statistics (monthly). Statistics New Zealand, Wellington.
Key Statistics (monthly). Statistics New Zealand, Wellington.
National (quarterly) and subnational (annual) population estimates. Statistics New Zealand, Wellington.
New Zealand Life Tables 1995–97 (1998). Statistics New Zealand, Wellington.
New Zealand Now (series, 1998). 2nd ed, Statistics New Zealand, Wellington.
New Zealand Population Projections (1999 base–2101) (2000). On-line, Statistics New Zealand, Wellington.
Subnational Population Projections (1996 base–2021) (2000). On-line, Statistics New Zealand, Wellington.
Births and Deaths (quarterly). Statistics New Zealand, Wellington.
Table of Contents
The 2001 Census showed that the Māori ethnic group was significantly younger in age structure than the total population.
Ethnicity is a key variable in explaining differences in social characteristics, social well-being and social change. The population census has traditionally been the main source of national statistics on ethnicity in New Zealand, although prior to 1991 a biological or race-based measure was used. Since 1991, people have been asked to identify which ethnic group(s) they belong to, and multiple responses are counted. The 2001 Census question differed from that used in the 1996 Census in two main ways: the wording of the question did not encourage multiple responses, and there were no tick-box categories for European ethnic groups, apart from New Zealand European. Data from the 1991 Census, which used a similar ethnicity question as in 2001, is being used for comparison purposes. Information presented in this chapter is based on the census usually resident population count.
In 2001, nine out of 10 people living in New Zealand identified with one ethnic group only, but young people were far more likely to list multiple ethnicities. For example, one in five children under the age of five gave more than one ethnic response in 2001. This is a reflection of the increasing ethnic diversity of the New Zealand population.
As table 6.1 shows, 80 percent of people living in New Zealand are European, but there has been only a small increase in the European population in the past decade compared with other major ethnic groups.
The Māori population has grown by 21 percent since 1991, making up just under 15 percent of the population in 2001. Other major ethnic groups have made even more rapid gains, with the Asian population more than doubling in the same period to 6.6 percent of the total population. For the first time in recent censuses, the total of people of Asian ethnicity is slightly higher than Pacific peoples (6.5 percent of the population).
There have also been large gains in the ‘other’ ethnic group, which includes African, Middle Eastern and South American ethnic groups. These increases largely reflect changes in migrant source countries and the move away from the more traditional source countries such as the United Kingdom. Ethnic groups such as Korean, Arab, Croatian, Iraqi and South African are examples of specific ethnic groups that have made huge population gains in the past decade. For example, the number of Koreans living in New Zealand has increased from just over 900 in 1991 to more than 19,000 in 2001.
The number of Chinese-born people living in New Zealand nearly doubled between 1996 and 2001.
Table 6.1. Ethnic groups of population (total responses)
| Ethnic group (total people) | 1991 Census | 2001 Census | Intercensal percentage change 1991–2001 | ||
|---|---|---|---|---|---|
| Number | Percentage of population1,2 | Number | Percentage of population1,2 | ||
1Includes response unidentifiable, response outside scope and not stated. 2Calculated in terms of specified cases only. Note:The number of responses is greater than the total population, as multiple responses are counted, – too small to be expressed. Source: Statistics New Zealand. | |||||
| European | 2,783,025 | 83.2 | 2,868,009 | 80.0 | 3.1 |
| Māori | 434,847 | 13.0 | 526,281 | 14.7 | 21.0 |
| Pacific peoples | 167,070 | 5.0 | 231,798 | 6.5 | 38.7 |
| Asian | 99,756 | 3.0 | 237,459 | 6.6 | 138.0 |
| Other | 6,693 | 0.2 | 24,924 | 0.7 | 272.4 |
| Not elsewhere included | 28,113 | 150,546 | |||
| Total NZ resident population | 3,373,926 | 3,737,277 | 10.8 | ||
| Selected ethnic groups (total responses) | |||||
| New Zealand European | 2,618,445 | 78.3 | 2,689,308 | 75,0 | 2.7 |
| Māori | 434,847 | 13.0 | 526,281 | 14.7 | 21.0 |
| Samoan | 85,743 | 2.6 | 114,432 | 3.2 | 33.5 |
| Chinese | 44,136 | 1.3 | 100,203 | 2.8 | 127.0 |
| Indian | 29,820 | 0.9 | 59,823 | 1.7 | 100.6 |
| Cook Island Māori | 37,233 | 1.1 | 51,141 | 1.4 | 37.4 |
| Tongan | 23,175 | 0.7 | 40,713 | 1.1 | 75.7 |
| English | 53,325 | 1.6 | 34,074 | 1.0 | -36.1 |
| Dutch | 24,732 | 0.7 | 27,396 | 0.8 | 10.8 |
| Niuean | 14,427 | 0.4 | 20,148 | 0.6 | 39.7 |
| Korean | 930 | – | 19,026 | 0.5 | 1,945.8 |
| British | 16,659 | 0.5 | 16,524 | 0.5 | -0.8 |
| South African | 2,007 | 0.1 | 14,889 | 0.4 | 641.9 |
| Scottish | 14,094 | 0.4 | 12,792 | 0.4 | -9.2 |
| Irish | 7,392 | 0.2 | 11,199 | 0.3 | 51.5 |
| Filipino | 4,917 | 0.1 | 11,091 | 0.3 | 125.6 |
| Japanese | 2,970 | 0.1 | 10,002 | 0.3 | 236.8 |
| Fijian | 5,100 | 0.2 | 7,041 | 0.2 | 38.1 |
| Tokelauan | 4,146 | 0.1 | 6,204 | 0.2 | 49.6 |
| Sri Lankan | 2,406 | 0.1 | 6,042 | 0.2 | 151.1 |
| Arab | 177 | – | 2,856 | 0.1 | 1,513.6 |
| Croat/Croatian | 171 | – | 2,502 | 0.1 | 1,363.2 |
| Iraqi | 246 | – | 2,145 | 0.1 | 772.0 |
Table 6.2 compares the age structure of the major ethnic groups in New Zealand, showing the percentage of ethnic populations in each age group.
Table 6.2. Comparison of age structure of major ethnic groups, 2001 Census
| Age group (years) | Percentage of population1in age groups | ||||
|---|---|---|---|---|---|
| European | Māori | Pacific peoples | Asian | Other | |
Census usually resident population count. Source: Statistics New Zealand | |||||
| 0–4 | 6.8 | 12.8 | 14.1 | 7.7 | 10.0 |
| 5–14 | 14.7 | 24.5 | 24.7 | 15.9 | 19.7 |
| 15–24 | 12.4 | 17.4 | 17.8 | 21.5 | 18.3 |
| 25–34 | 13.5 | 15.1 | 15.4 | 15.9 | 17.6 |
| 35–44 | 15.4 | 13.5 | 12.4 | 17.9 | 17.5 |
| 45–54 | 13.6 | 8.5 | 7.8 | 11.4 | 9.8 |
| 55–64 | 9.7 | 4.8 | 4.4 | 5.6 | 4.1 |
| 65–74 | 7.4 | 2.5 | 2.3 | 2.9 | 2.0 |
| 75–84 | 4.9 | 0.7 | 0.8 | 0.9 | 0.8 |
| 85 and over | 1.6 | 0.1 | 0.1 | 0.2 | 0.3 |
| Total | 100.0 | 100.0 | 100.0 | 100.0 | 100.0 |
The increasing diversity of the New Zealand population is reflected in changes in the country of birth of the population. In 2001, people who were born in New Zealand made up 80.5 percent of those people who usually live in New Zealand, down from 82.5 percent in 1996 (see table 6.3).
Between 1996 and 2001, New Zealand's overseas-born population rose by approximately 93,600 people, an increase of 15.5 percent. Much of this increase occurred in Auckland, where people born overseas now account for one in every three people.
Table 6.3. Country of birth of population
| Country of birth | 1996 Census | 2001 Census | Intercensal percentage change 1996–2001 | ||
|---|---|---|---|---|---|
| Number | Percentage of responses1 | Number | Percentage of responses1 | ||
1Calculated in terms of specified cases only. Source: Statistics New Zealand | |||||
| New Zealand | 2,848,209 | 82.5 | 2,890,869 | 80.5 | 1.5 |
| Australia | 54,711 | 1.6 | 56,259 | 1.6 | 2.8 |
| Samoa | 42,174 | 1.2 | 47,118 | 1.3 | 11.7 |
| Fiji | 18,774 | 0.5 | 25,725 | 0.7 | 37.0 |
| Tonga | 14,040 | 0.4 | 18,051 | 0.5 | 28.6 |
| Cook Islands | 13,755 | 0.4 | 15,222 | 0.4 | 10.7 |
| Other Oceania and Antarctica | 10,533 | 0.3 | 11,877 | 0.3 | 12.8 |
| Total Oceania and Antarctica | 3,002,193 | 86.9 | 3,065,121 | 85.4 | 2.1 |
| United Kingdom and Ireland | 230,049 | 6.7 | 225,123 | 6.3 | -2.1 |
| Netherlands | 23,430 | 0.7 | 22,242 | 0.6 | -5.1 |
| Germany | 7,068 | 0.2 | 8,382 | 0.2 | 18.6 |
| Other Europe | 25,098 | 0.7 | 28,923 | 0.8 | 15.2 |
| Total Europe | 285,648 | 8.3 | 284,670 | 7.9 | -0.3 |
| North Africa and Middle East | 7,239 | 0.2 | 12,174 | 0.3 | 68.2 |
| Malaysia | 11,889 | 0.3 | 11,460 | 0.3 | -3.6 |
| Philippines | 7,002 | 0.2 | 10,137 | 0.3 | 44.8 |
| Other South-east Asia | 18,441 | 0.5 | 23,595 | 0.7 | 27.9 |
| China | 19,518 | 0.6 | 38,949 | 1.1 | 99.6 |
| Korea, Republic of | 12,183 | 0.4 | 17,934 | 0.5 | 47.2 |
| Taiwan | 10,932 | 0.3 | 12,486 | 0.3 | 14.2 |
| Hong Kong | 11,763 | 0.3 | 11,301 | 0.3 | -3.9 |
| Japan | 6,501 | 0.2 | 8,622 | 0.2 | 32.6 |
| India | 12,807 | 0.4 | 20,889 | 0.6 | 63.1 |
| Other North-east, Southern and Central Asia | 6,885 | 0.2 | 10,401 | 0.3 | 51.1 |
| Total Asia | 117,915 | 3.4 | 177,948 | 4.6 | 50.9 |
| Northern America | 19,065 | 0.6 | 21,114 | 0.6 | 10.7 |
| Central and Southern America | 3,561 | 0.1 | 4,395 | 0.1 | 23.4 |
| Total America | 22,626 | 0.7 | 25,509 | 0.7 | 12.7 |
| South Africa | 11,334 | 0.3 | 26,061 | 0.7 | 129.9 |
| Other sub-Saharan Africa | 6,114 | 0.2 | 10,152 | 0.3 | 66.0 |
| Total sub-Saharan Africa | 17,445 | 0.5 | 36,213 | 1.0 | 107.6 |
| Not specified / Born at sea | 165,078 | ... | 147,816 | ... | -10.5 |
| Total | 3,618,303 | 3,737,277 | 3.3 | ||
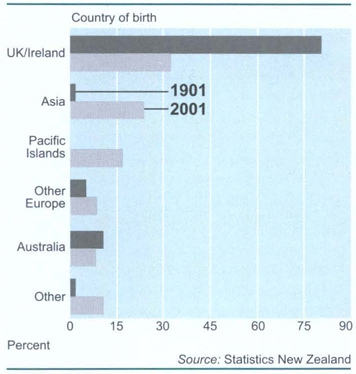
While those people born in the United Kingdom and Ireland continue to comprise the largest immigrant group, at around 6.3 percent of the total population, their number fell slightly, by 4,926, between 1996 and 2001. There were large increases in the number of people born in Asia, Africa and the Middle East.
The proportion of the total New Zealand resident population born in Asia increased from 3.4 percent to 4.6 percent during the period 1996 to 2001. Those born in China doubled, from 19,518 in 1996 to 38,949 in 2001. In the same period, the Indian-born population increased by 63.1 percent (to 20,889), those born in the Republic of Korea by 47.2 percent (to 17,934), and the Philippines-born population by 44.8 percent (to 10,137).
The number of people born in South Africa increased by 129.9 percent between 1996 and 2001, to 26,061. The number of people born in North Africa and the Middle East rose from 7,239 in 1996 to 12,174 in 2001, an increase of 68.2 percent. The rest of the sub-Saharan-born population increased by 66 percent, to 10,152. Figure 6.1 shows birthplaces as a percentage of all New Zealanders born overseas.
Changes to the 2001 Census of Population and Dwellings question on religious affiliation mean direct intercensal comparisons cannot be made. Previous censuses collected only one response for religious affiliation, whereas up to four responses were collected in 2001.
Results from the 2001 Census showed that Christianity (including Māori Christian) remained the dominant religion, with 61 percent of people identifying an affiliation to this group. Around 30 percent of people stated they had no religion, and 7 percent objected to answering the religious affiliation question. These results varied only slightly for Māori, 62 percent of whom identified with Christianity (including Māori Christian), 31 percent stated no religion and 8 percent objected to answering the census question.
Within the Christian religion, the Anglican (28 percent), Catholic (23 percent), Presbyterian (20 percent) and Methodist (6 percent) denominations continued to have the majority of affiliates. Together their members made up more than 75 percent of all the Christian denominations (including Māori Christian). This compared with just under 60 percent of Māori who affiliated to these four Christian denominations. Of those who identified with Māori Christian, the most popular denominations were Rātana (77 percent) and Ringatū (24 percent).
Although non-Christian religions are becoming more established in New Zealand, they each still make up only about 1 percent of the population. The three most common non-Christian religions were Buddhist (1 percent), Hindu (1 percent) and Islam/Muslim (0.7 percent).
Table 6.4 summarises responses to the religious affiliation question in the 1991, 1996 and 2001 Censuses.
Table 6.4. Religious affiliation1
| Religious affiliation (total responses) | Census year | ||
|---|---|---|---|
| 1991 | 1996 | 2001 | |
2001 data is not directly comparable with previous data, as in the 1991 and 1996 censuses only one response to religious affiliation was collected. In the 2001 census up to four responses were collected. Where a person reported more than one religious affiliation, they have been counted in each applicable group. 2The 1991 and 1996 data includes Ecumenical which is now included in Uniting/Union Church and Ecumenical. The 1996 data includes Fundamentalists which is now included in Evangelical, Born Again and Fundamentalist. 3The 1996 data includes Born Again which is now included in Evangelical. Born Again and Fundamentalist. nfd: not further defined. Source: Statistics New Zealand | |||
| Buddhist | 12,762 | 28,131 | 41,634 |
| Anglican | 732,048 | 631,764 | 584,793 |
| Catholic | 498,612 | 473,112 | 486,012 |
| Presbyterian, Congregational and Reformed | 553,386 | 470,442 | 431,547 |
| Christian nfd2 | 79,317 | 186,891 | 192,165 |
| Methodist | 139,494 | 121,650 | 120,705 |
| Pentecostal3 | 49,596 | 69,333 | 67,239 |
| Baptist | 70,155 | 53,613 | 51,426 |
| Latter-day Saints | 48,009 | 41,166 | 39,912 |
| Brethren | 21,915 | 21,933 | 20,406 |
| Jehovah's Witness | 19,182 | 19,527 | 17,826 |
| Adventist | 15,675 | 14,691 | 14,868 |
| Salvation Army | 19,992 | 14,625 | 12,618 |
| Evangelical, Born Again and Fundamentalist | 5,169 | 1,584 | 11,019 |
| Orthodox | 4,263 | 6,933 | 9,588 |
| Lutheran | 4,965 | 5,007 | 4,314 |
| Other Christian | 3,276 | 2,766 | 3,558 |
| Church of Christ and Associated Churches of Christ | 4,842 | 4,233 | 3,270 |
| Protestant nfd | 1,785 | 2,778 | 2,784 |
| Uniting/Union Church and Ecumenical | 1,026 | 1,728 | 1,389 |
| Asian Christian | .. | 222 | 195 |
| Hindu | 18,036 | 25,551 | 39,798 |
| Islam/Muslim | 6,096 | 13,545 | 23,631 |
| Judaism/Jewish | 3,126 | 4,809 | 6,636 |
| Māori Christian | 56,055 | 45,450 | 63,597 |
| Spiritualism and New Age Religions | 5,196 | 9,786 | 16,062 |
| Other religions | 19,863 | 10,176 | 18,783 |
| No religion | 670,455 | 867,264 | 1,028,052 |
| Object to answering | 251,709 | 256,593 | 239,244 |
| Total people | 3,316,005 | 3,405,306 | 3,468,813 |
New Zealand is becoming more diverse with a greater variety of ethnic groups now present in the country. This diversity is reflected in the variety of languages spoken. Both the 1996 and the 2001 Censuses asked people to list the languages in which they could have a conversation about a lot of every day things.
Despite the diversity of languages spoken, in 2001 most people (98.2 percent of those who can speak a language) spoke English. The second most common language was Māori, spoken by 160,527 or 4.6 percent. The other top 10 languages were Samoan, French, Yue (including Cantonese), German, New Zealand sign languages, Northern Chinese, Dutch and Tongan.
In 2001, 16.1 percent of people who usually live in New Zealand said they spoke more than one language, a small increase on the 13.9 percent in 1996. In 2001, multiple languages were most prevalent among people aged 15–24 years, with 22.7 percent of this age group speaking more than one language. Close to half of those aged 15–24 who spoke multiple languages were born overseas.
Speaking more than one language varied across regions. In the Auckland region, 23.7 percent were bi-lingual or multi-lingual compared with only 5.3 percent in the West Coast region. Other regions with relatively high rates of multi-lingualism were Gisborne (19.4 percent) and Wellington (17.9 percent).
The language people speak is closely related to their ethnicity, and increases in the numbers speaking particular languages between the 1996 and 2001 Censuses were generally associated with increases in immigrant groups. For example, there were increases of more than 100 percent in the number speaking Afrikaans, Somali, Tegulu and Tuvalan languages, which corresponded to large country of birth increases for South Africa, Somalia, India and Tuvalu.
Figure 6.2 shows the number of people of Māori ethnicity who spoke Māori, by age group. While more young people are now speaking the language, speaking Māori is still more prevalent among older Māori. Overall, 26 percent of Māori spoke the Māori language.
Figure 6.2. Māori language speakersProportion of Māori ethnic group who speak Māori language, 2001 Census
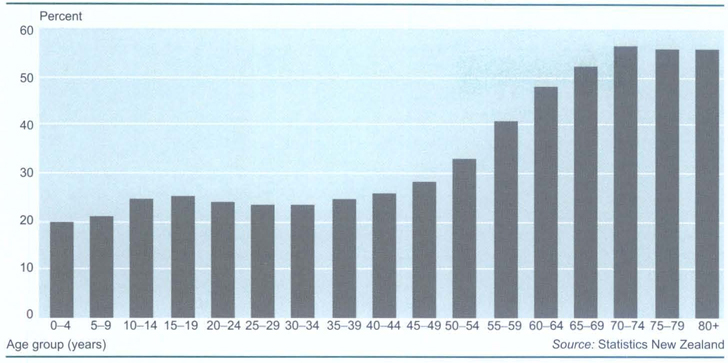
New Zealand's citizenship legislation is contained in the Citizenship Act 1977, the Citizenship (Western Samoa) Act 1982 and the Citizenship Regulations 1978. The 1977 act, the principal legislation, includes the territories of the Cook Islands, Niue, Tokelau and the Ross Dependency in the definition of New Zealand for purposes of New Zealand citizenship. Under the 1977 act, a person may be a New Zealand citizen by birth in New Zealand or by descent from a New Zealand citizen parent. British citizens resident in New Zealand throughout 1948 may also apply for the grant of citizenship.
Citizenship by birth. Most people born in New Zealand after 1 January 1949 are New Zealand citizens by birth.
Citizenship by descent. Most people born outside of New Zealand after 1 January 1949 to a New Zealand citizen parent are citizens by descent. There are some limitations on this. In addition, those citizens by descent who were born on or after 1 January 1978 must register their citizenship by descent before their 24th birthday if they wish to remain a citizen. This can be done in New Zealand through the Citizenship Office. Those resident overseas may contact their local New Zealand Embassy or High Commission. New Zealand's citizenship legislation also contains some provision for those adopted by New Zealand citizens.

Migrants may apply for citizenship after they have lived in New Zealand for three years.
The grant of citizenship. Migrants to New Zealand who wish to make New Zealand their home may apply for a grant of citizenship. The general requirements are that applicants satisfy the Minister of Internal Affairs that they:
Have been ordinarily resident in New Zealand for the three years immediately preceding their application.
Are entitled to remain in New Zealand indefinitely (most applicants will be required to have permanent residence status).
Are of good character.
Have a sufficient knowledge of the English language and of the responsibilities and privileges attached to New Zealand citizenship.
Intend to continue to reside in New Zealand, or to work overseas in Crown service, or for a New Zealand resident or established organisation.
The Citizenship Act 1977 contains special provisions for those who are or have been married to a New Zealand citizen, for minors and for people with special circumstances.
The Citizenship (Western Samoa) Act 1982 provides for the grant of citizenship to Samoan citizens and to a small group of other people who have a special association with Samoa. To be granted citizenship under this act, a person must either have been in New Zealand at any time on 14 September 1982 or have lawfully entered New Zealand after that date and have an entitlement to remain in New Zealand indefinitely (most applicants will be required to have permanent residence status).
Applicants aged 14 and over who are approved the grant of citizenship are usually required to attend a citizenship ceremony to swear allegiance to Queen Elizabeth II, as Head of State of New Zealand. After this has been done, the grant of citizenship is complete and a citizenship certificate is provided.
Figure 6.3 shows the number of citizenship applications granted from 1960 to 2001.
Figure 6.3. CitizenshipNumber of applications granted
The 2001 Census revealed that there were more than 40,000 Tongans living in New Zealand.
The Ministry of Pacific Island Affairs promotes the development of Pacific peoples in New Zealand in a way that recognises and reflects Pacific cultural values and aspirations, so that Pacific peoples can participate in, and contribute fully to, New Zealand's social, cultural and economic life.
The ministry has two main roles:
Policy advice – whereby the ministry provides policy advice to the government and other government agencies on key policies and issues impacting on Pacific peoples. The ministry achieves this by informing government agencies of, and encouraging them to take responsibility for, the needs and aspirations of Pacific peoples; by working in partnership with government agencies to meet these needs and aspirations; by influencing and monitoring the development and implementation of government policies that affect Pacific peoples; and by fostering Pacific leadership by providing Pacific nominations to public sector bodies whose decisions have a significant impact on Pacific peoples.
Communications – whereby the ministry communicates information and government policy advice to and from Pacific communities and other government agencies. The ministry does this by advising government agencies on how to communicate effectively with Pacific peoples; by facilitating public meetings and community fono to disseminate information to Pacific peoples; by facilitating community consultations to enable Pacific peoples’ input into policy issues; by establishing and maintaining community networks; by maintaining a Pacific database for nomination requests; and by fostering communicating through the print and electronic media.
Migration to New Zealand. The Cook Islands gained independence in free association with New Zealand in 1965. Its people retained the right of free entry to New Zealand and significant emigration began from the 1950s and increased during the 1960s and 70s. The most common destinations were Auckland and Wellington. Smaller numbers of migrants went to provincial towns where factory work was readily available. The 2001 Census recorded 51,486 Cook Island Maoris living in New Zealand.
Niue achieved self-government in free association with New Zealand in 1974. Niueans were granted right of free entry, residence and New Zealand citizenship. Migration picked up from the 1950s, but reached a peak in the 1970s. Among New Zealand's attractions was a more certain way of life. Niue is particularly vulnerable to natural disasters such as drought and cyclones and successive cyclones in 1959 and 1960 had a devastating effect. In 2001 there were 20,148 Niueans living in New Zealand, most of them in Auckland.
The Kingdom of Tonga was the only Pacific country to retain independence. Population pressures forced the nation to adopt emigration as an official policy and in 1970 a scheme was initiated under which Tongans were allowed to migrate to New Zealand temporarily to work in unskilled jobs within the processing industry. Many also went to Australia and to the United States. There were 40,716 Tongans living in New Zealand in 2001, most of them in Auckland.
The small island group of Tokelau was declared a British Protectorate in 1889. New Zealand took over administration on behalf of Britain in 1925 and it became part of New Zealand's territory in 1948, with full political independence gained in 1994. The 10 square kilometres of Tokelau's three atolls have few natural resources apart from lagoons, coconut palms and the ocean. The atolls are also vulnerable to cyclones. After a devastating cyclone in 1966, the New Zealand Government set up a resettlement scheme which involved about 500 people, half the Tokelauan population. These people voluntarily left Tokelau and resettled in Porirua and forest-industry towns like Rotorua. In 2001, there were 6,204 Tokelauans living in New Zealand, compared with 1,502 in Tokelau.
Figure 6.6 shows the pattern of Pacific migration to New Zealand from 1980 to 2001.
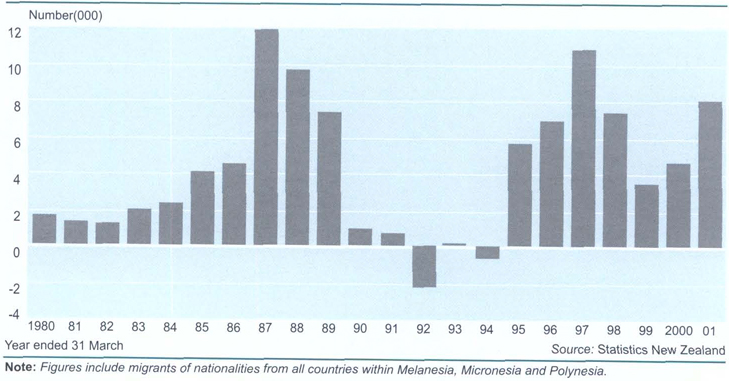
Samoa's 13 islands are divided into two parts, Samoa and American Samoa. The six islands east of the 171st meridian were annexed by the United States in 1899. New Zealand assumed control of Western Samoa at the start of World War I and retained it until 1962, when Western Samoa became independent. Western Samoa has recently been renamed Samoa. Emigration from Western Samoa picked up in the mid-1960s and escalated through to the early 1970s – largely through the process of chain migration. Rapid population growth, a decline in export prices for cocoa and copra, a banana crop disease and a major cyclone in 1966 were persuading factors for migrants. The Treaty of Friendship signed at Western Samoa's independence ensured emigrants would not have to register in New Zealand as aliens. Samoans constitute the largest group of Pacific peoples living in New Zealand – 115,017 in 2001. The majority of Samoans live in Auckland.
There were 7,041 Fijians living in New Zealand in 2001.
The Asian ethnic group in New Zealand increased markedly in the decade between 1991 and 2001. The 2001 Census provides the latest statistical information on changes in the structure and size of the Asian ethnic group. Tables in this section are based on the concept of ethnicity and are established on the basis of self identification. This allows comparisons between 1991 and 2001 Census data. People who specified themselves as belonging to one or several Asian ethnicities are counted as belonging to the Asian ethnic group.
Age distribution. Table 6.10 compares the Asian population in New Zealand at the 1991 and 2001 Censuses by age group. When intercensal population growth is analysed on a consistent age group basis (ie the 0–4 year group at the 1991 Census is compared with the 10–14 year group at the 2001 Census), it is evident that the major contribution to the increase in the Asian ethnic group is from net immigration. The increase of 138,420 (138.8 percent) in the Asian population during the 1991–2001 intercensal period was the result of large net migration gains. Between the 1991 and 2001 Censuses, the Asian ethnic group grew by an average rate of 9.1 percent a year, compared with 1.0 percent for the total New Zealand population. This also had a significant impact on the overall age structure of the Asian group. At the 2001 Census, 72.3 percent of the Asian ethnic group was in the working ages (15–64 years), compared with 65.3 percent for the total New Zealand population. By contrast, only 4.1 percent of Asians were 65 years or more, compared with 12.1 percent of the total New Zealand population.
Asian ethnicities. Even though most people of Asian ethnicities more than doubled in the decade between 1991 and 2001, their shares of the total Asian ethnic group changed only marginally. In 2001, with a share of 44.1 percent, people of Chinese ethnicities were the largest within the Asian ethnic group and experienced the biggest numerical increase in their population, from 44,793 in 1991 to 105,057 in 2001. People of Indian ethnicities represented 26.1 percent of the Asian ethnic group in 2001, and during 1991–2001 the Indian ethnic group in New Zealand rose from 30,609 to 62,187. The Korean ethnic group experienced the highest percentage increase during the 10-year period, rising from 930 to 19,026. People of South-east Asian ethnicities were the third largest group within the Asian ethnic group. In 2001, 30,648 (12.9 percent) of the Asian ethnic group were of South-east Asian ethnicities, and more than 33 percent of these were of Filipino ethnicity.
Table 6.1. Asian ethnic groups by age group1,2
| Age group (years) | 1991 Census | 2001 Census | Intercensal percentage change 1991–2001 | ||
|---|---|---|---|---|---|
| Number | Percentage | Number | Percentage | ||
Asian ethnic groups census usually resident population count. 2Based on total responses. Source: Statistics New Zealand | |||||
| 0–4 | 9,600 | 9.6 | 18,378 | 7.7 | 91.4 |
| 5–9 | 9,093 | 9.1 | 18,381 | 7.7 | 102.1 |
| 10–14 | 9,021 | 9.0 | 19,521 | 8.2 | 116.4 |
| 15–19 | 9,006 | 9.0 | 27,102 | 11.4 | 200.9 |
| 20–24 | 9,339 | 9.4 | 24,018 | 10.1 | 157.2 |
| 25–29 | 11,847 | 11.9 | 17,979 | 7.5 | 51.8 |
| 30–34 | 11,589 | 11.6 | 19,947 | 8.4 | 72.1 |
| 35–39 | 9,420 | 9.4 | 22,722 | 9.5 | 141.2 |
| 40–44 | 7,131 | 7.1 | 19,806 | 8.3 | 177.7 |
| 45–49 | 4,311 | 4.3 | 15,690 | 6.6 | 264.0 |
| 50–54 | 2,991 | 3.0 | 11,520 | 4.8 | 285.2 |
| 55–59 | 2,163 | 2.2 | 7,161 | 3.0 | 231.1 |
| 60–64 | 1,608 | 1.6 | 6,192 | 2.6 | 285.1 |
| 65–69 | 1,059 | 1.1 | 4,434 | 1.9 | 318.7 |
| 70–74 | 657 | 0.7 | 2,589 | 1.1 | 294.1 |
| 75–79 | 447 | 0.4 | 1,485 | 0.6 | 232.2 |
| 80 and over | 471 | 0.5 | 1,254 | 0.5 | 166.2 |
| Total | 99,756 | 100.0 | 238,176 | 100.0 | 130.8 |
Figure 6.7 shows how Asian migration to New Zealand has increased since 1980.
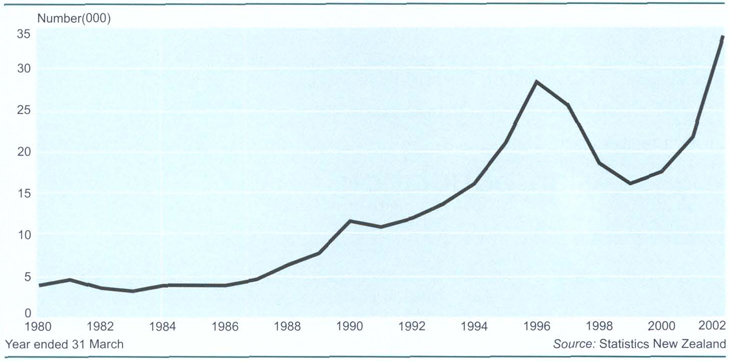
Geographical distribution. Distribution of the Asian ethnic population by region at the 1991 and 2001 Censuses is shown in table 6.11. The Asian ethnic group continues to be concentrated in the main centres of Auckland, Wellington and Canterbury. The Auckland region experienced the largest growth both in numerical and relative terms between the 1991 and 2001 Censuses. The Auckland region's Asian population increased by nearly 100,000 to reach 151,602 in 2001 and represented 71.5 percent of the national increase of 138,420 between 1991 and 2001.
Table 6.11. Asian ethnic groups by region1,2
| Region | 1991 Census | 2001 Census | Intercensal percentage change 1991–2001 | ||
|---|---|---|---|---|---|
| Number | Percentage | Number | Percentage | ||
Asian ethnic groups census usually resident population count. 2Based an total responses. 3Includes Chatham Islands territory. Source: Statistics New Zealand | |||||
| North Island – | |||||
| Northland | 1,020 | 1.0 | 1,998 | 0.8 | 95.9 |
| Auckland | 52,584 | 52.7 | 151,602 | 63.7 | 188.3 |
| Waikato | 5,448 | 5.5 | 12,021 | 5.0 | 120.6 |
| Bay of Plenty | 2,121 | 2.1 | 5,202 | 2.2 | 145.3 |
| Gisborne | 429 | 0.4 | 621 | 0.3 | 44.8 |
| Hawke's Bay | 1,770 | 1.8 | 2,937 | 1.2 | 65.9 |
| Taranaki | 1,002 | 1.0 | 1,500 | 0.6 | 49.7 |
| Manawatu–Wanganui | 4,344 | 4.4 | 6,564 | 2.8 | 51.1 |
| Wellington | 19,533 | 19.6 | 27,819 | 11.7 | 42.4 |
| North Island total | 88,257 | 88.5 | 210,264 | 883 | 138.2 |
| South Island – | |||||
| Tasman | 132 | 0.1 | 366 | 0.2 | 177.3 |
| Nelson | 378 | 0.4 | 861 | 0.4 | 127.8 |
| Marlborough | 183 | 0.2 | 387 | 0.2 | 111.5 |
| West Coast | 177 | 0.2 | 246 | 0.1 | 39.0 |
| Canterbury | 6,996 | 7.0 | 19,431 | 8.2 | 177.7 |
| Otago | 3,075 | 3.1 | 5,766 | 2.4 | 87.5 |
| Southland | 561 | 0.6 | 849 | 0.4 | 51.3 |
| South Island total | 11,499 | 11.5 | 27,906 | 11.7 | 142.7 |
| Area outside region3 | 3 | – | 3 | – | – |
| New Zealand total | 99,756 | 100.0 | 238,176 | 100.0 | 138.8 |
Support for Asians in New Zealand. A number of organisations provide support and services for Asians living in New Zealand. The Asian Migrant Service, based in Auckland, provides information, advice, assistance and referrals to migrants from Asia. Also in Auckland, Asian Community Services offers social and community support to Chinese and other Asian families. Asian Social Services of New Zealand supplies support, information, consultancy and advocacy services to the Auckland Asian community. Asian women have their own representation through the Shakti Asian Women's Centre in Auckland and Mamta in Wellington. These groups offer women information and advocacy on education, legal and health issues, and counselling and support services. Specific Asian communities also have their own associations for mutual support and social interaction. Among these are the New Zealand Chinese Association, the Japanese Society, the Vietnamese Association and the Korean Association. A number of church, business and preschool groups also exist at community level. The New Zealand Immigration Service provides an ethnic communities directory on its website www.immigration.govt.nz
The Human Rights Commission is an independent statutory body given a wide range of functions and powers under the Human Rights Act 1993. The commission's primary function is to protect human rights in New Zealand in accordance with United Nations human rights covenants and conventions. An important function of the commission is the investigation and conciliation of complaints of unlawful discrimination in public life. This includes areas of employment, access to public places, vehicles and facilities, provision of goods and services, accommodation and education.
Grounds of unlawful discrimination covered by the act are sex, marital status, religious belief, ethical belief, colour, race, ethnic or national origins, disability, age, political opinion, employment status, family status and sexual orientation. The act also covers sexual harassment, racial harassment and racial disharmony. If complaints are not resolved within the commission's mediation and conciliation process, they can be taken to the Complaints Review Tribunal, an independent tribunal administered by the Department for Courts.
Other functions of the commission include promoting human rights in New Zealand by education, research and publicity, issuing public statements on human rights matters, making submissions on human rights aspects of any legislation before parliament, and issuing guidelines to assist compliance with the act. The commission has published guidelines on advertising, pre-employment practices, superannuation and insurance.
The commission also has an educational function with a focus on providing public and private sector educators with human rights training. The commission seeks to supply effective and culturally appropriate services to Māori. It provides translation services and iwi education.
The commission has offices in Auckland, Wellington and Christchurch. Its head office is in Auckland, where the majority of complaints of unlawful discrimination arise.
Human Rights Commissioners, of whom there are six, are appointed by the governor-general on the recommendation of the Minister of Justice for terms of up to five years. Under the act, commissioners are appointed not only for their personal attributes, but also for their knowledge and/or experience of matters likely to come before the commission. The Race Relations Conciliator and the Privacy Commissioner also serve as Human Rights Commissioners. The Proceedings Commissioner has special functions and responsibilities for the institution and conduct of legal proceedings under the act.
The government announced in 2001 that changes were to be made to New Zealand's human rights institutional framework and introduced the Human Rights Amendment Bill into the house in August 2001. Among other things, the bill establishes a Human Rights Commission that includes the functions previously carried out by the Race Relations Conciliator. It also replaces the existing Proceedings Commissioner with an independent Office of Human Rights Proceedings led by a Director of Human Rights Proceedings. The commission's website is www.hrc.co.nz
Enquiries. There were 21,384 enquiries received in the year ended 30 June 2001, compared with 10,092 in 1999/2000. The largest single proportion concerned workplace disputes (45 percent), while the single largest area of complaint was disability (22 percent), followed by sexual harassment (17 percent).
Complaints. In the year to 30 June 2001, 514 complaints alleging 754 breaches of the act were received, compared with 337 complaints in the previous June year. Approximately 46 percent of the alleged breaches of the act arose in the context of employment, while just under 25 percent concerned the provision of goods and services. The prohibited ground of discrimination most cited in complaints was disability. There were 148 alleged breaches of the act on this ground. The second most frequently cited prohibited ground of discrimination was sexual harassment, where 120 breaches were alleged.
The Human Rights Amendment Act 2001 made the Office of the Race Relations Conciliator part of the Human Rights Commission. Under the act, the conciliator became a full-time human rights commissioner and, as Race Relations Commissioner, chairs meetings on substantive matters relating to race relations. The Human Rights Act 1993 makes it unlawful to discriminate in certain areas of public life on 13 grounds, four of which relate specifically to race. Those grounds are race, colour and ethnic or national origin, which are further defined as including nationality and citizenship. The commissioner investigates and conciliates complaints of racial discrimination, racial harassment and exciting racial disharmony. In addition, the commissioner has a number of more general functions designed to promote positive race relations. These include education, the right to make public statements, to receive representations from the public on matters relating to race relations, to conduct general enquiries, to draft guidelines and to comment on legislation.
Enquiries. In the year to 30 June 2001, 876 enquiries were responded to. Staff members attended 199 community activities and eight submissions were made to select committees on race relations issues. The office responded to two official information requests, four parliamentary questions, two ministerial questions and two questions from members of parliament.
Complaints. The conciliator received 1,167 complaints in the year to 30 June 2001, compared with 1,031 in the previous year. Eighty percent of complaints were dealt with within six weeks. Most complaints (21 percent) involved the provision of goods and services, while 19 percent alleged excitement of racial disharmony and 18 percent alleged racial harassment. Complaints involving employment made up 11 percent of the total. Complaints against government departments rose from 15 to 18 percent during the year and against the media from 10 to 13 percent. Complaints made by Pākehā fell from 45 percent to 33 percent in the latest reporting period, while complaints made by Māori fell from 22 to 19 percent. There was a corresponding increase, however, in complaints by other ethnic groups.
The Equal Employment Opportunities (EEO) Trust was established in 1991 by the government and the private sector to promote EEO principles and best practice in the workplace. Trustees are representative of both public and private sectors. The trust encourages employers to recognise the business benefits of employing on the basis of merit and helps them to get full potential from a diverse workforce.
The trust launched an EEO employers group in June 1997 for organisations which want to demonstrate and strengthen their commitment to equal employment opportunities. Members of the group commit to its charter, can use the group logo and have access to a wide range of trust resources. The group has around 300 members.
The EEO Trust commissions, monitors and promotes a wide range of equal employment opportunities projects. The annual EEO Trust Work and Life Awards recognise organisations and individuals who champion work/life balance. Trust-commissioned research monitors diversity progress in New Zealand annually. All organisations with more than 50 employees and all organisations associated with the trust are invited to participate in the research. Employers use the resulting diversity index to benchmark EEO progress.
The EEO Trust's website is www.eeotrust.org.nz
Women make up 51 percent of New Zealand's population, but while women and men have equal status under law, women have yet to achieve full equality in economic and social status, freedom from discrimination and access to decision-making processes and opportunities. The Ministry of Women's Affairs provides policy advice to the government on issues where there is significant disparity between women and men that disadvantages women, and where significant disparity exists between Māori women and non-Māori women that disadvantages whānau, hapū and iwi. The ministry contributes to policy advice by promoting the use of gender analysis and by providing sex-disaggregated data on the differences between women's and men's lives. In 2001/02, the ministry's priorities included work on:
Advancing gender analysis across government by developing and making available information and resources to assist this work.
Developing with wide input from women a strategy on the priority work yet to be done to address issues of inequality.
Further developing a women's health strategy within the overall women's strategy.
Developing options for policy on pay equity.
Paid parental leave.
Employment relations issues.
Work and family balance, including childcare and its links to welfare, employment, training and tertiary education.
Māori women's economic development.
Information technology.
Family law reform.
Safety and family violence.
Engaging with Māori women and, in partnership with them, building on their diverse experiences and insights to develop policies and programmes which affirm, celebrate and enhance their success, and advance their progress.
Increasing the number of women, including Māori and Pacific women, in decision making roles.
The Ministry of Youth Affairs works with the government and communities to promote the development of young New Zealanders and uphold the principles of the Treaty of Waitangi through being experts in promoting positive youth policies and programmes, leaders in involving young people in decision making and providers of quality youth development programmes.
The ministry is funded by the government to do work in three main areas:
Policy advice – whereby the ministry provides advice on policies, services and legislation affecting young people and their future. This includes researching and reporting on young people's issues and contributing to other matters that affect young people.
Youth corps programmes – whereby the ministry administers and manages funding and contracts for youth development programmes Conservation Corps and Youth Service Corps, which help young people contribute to their communities. The programmes include personal development, skill acquisition and recreational and educational activities. The Conservation Corps involves young people in conservation activities and the Youth Service Corps in community service.
Communication and facilitation – whereby the ministry empowers young people through youth participation. Youth Affairs consults young people and those who work with them to provide the government with a sound understanding of the issues in young people's lives. Youth Affairs provides information to young people and those who work with them on what others are doing in similar areas and about changes in policies and practices.
Youth Development Strategy Aotearoa. Youth development is the process of young people growing up and developing skills and attitudes they need to take part positively in society now and in the future. Youth development strategy involves thinking about how young people can succeed, and focuses on positive strategies for improvement, rather than simply trying to fix things after the event. The Ministry of Youth Affairs has developed Youth Development Strategy Aotearoa, which provides a blueprint for how the government plans to work to develop young people. The strategy is about:
Changing attitudes about the contribution of young people – from passive observers to active participants.
Encouraging the active participation of young people in all aspects of society.
Helping young people develop a strong and positive identity which reflects New Zealand/Aotearoa.
Supporting young people to develop valuable skills and positive, flexible attitudes.
Student representatives. The Ministry of Youth Affairs actively encourages student representation and involvement in schools and in policy making. The Student Representative Scheme started in schools in 1993 and more than 4,000 students have taken part. The representatives are important to the ministry in finding out what young people think about issues affecting them.
Youth Parliament. Parliament opens its doors every three years for a Youth Parliament, which gives young people a chance the find out how parliament works and what it is like to be a Member of Parliament. Youth MPs get involved in things that real MPs do, like debating in the house, asking ministers questions in parliament and taking part in select committees. They also gain experience of the Youth Parliamentary Press Gallery and act as Speaker of the House. The next Youth Parliament is in 2003.
Conservation Corps and Youth Service Corps. The Conservation Corps and Youth Service Corps are youth development programmes enabling young men and women to get involved in conservation or local community projects. Participants learn new skills through education and challenging recreation. Youth Service Corps involves projects such as restoring historic buildings or working with community groups. Conservation Corps involves planting native trees, upgrading walking tracks and other activities helping the environment. Since 1988, 15,590 young New Zealanders have taken part in more than 900 Conservation Corps projects. The Youth Service Corps has had 1,700 people take part in more than 120 projects since 1995. Each year corps members contribute more than 1 million hours to conservation projects throughout New Zealand and a further 100,000 hours to community projects. In 2001, an average 68 percent of those who took part in the programmes moved into work or other education and training within six months of leaving a project.
Youth suicide prevention. Suicide among young people is a growing problem in modern societies. But by international standards, New Zealand's suicide rate is one of the highest in the world.
In 1999, there were 119 youth deaths from suicide and this was the lowest number of deaths since 1987.
For every completed suicide, there are a far greater number of attempted suicides. Males accounted for more than two-thirds of youth suicide deaths in 1999.
Suicide is not a disease that can be cured. Rather, it is a complex problem for which there is no one cause or cure. Instead, there are a range of biological, cultural, economic, social and psychological influencing factors. Most suicides, however, can be prevented and it is possible to reduce the level of youth suicide.
The New Zealand Government has responded by producing a national strategy to deal with the challenge of preventing young people from considering suicidal behaviours.
However, the government cannot reduce youth suicide on its own. It needs the support and involvement of individuals, families, communities, services and businesses.
The New Zealand Youth Suicide Prevention Strategy was developed by the Ministry of Youth Affairs, the Ministry of Māori Development: Te Puni Kokiri and the Ministry of Health.
The strategy was launched in March 1998 and has two components: In Our Hands, which is the general population strategy, and Kia Piki Te Ora o te Taitamariki, which is the strategy specifically targeting Māori needs and approaches.
In March 2001, the Ministry of Youth Affairs took over from the Ministry of Health responsibility for leading and coordinating the youth suicide prevention strategy.
The strategy helps government, communities, families/whānau and individuals act together to reduce youth suicide and suicidal behaviour.
The strategy takes a broad-based and coordinated approach to youth suicide prevention, covering things such as health promotion, treatment and post-intervention support.
Youth Affairs has published a number of resources to provide information to people who may know a young person who needs help. These are: SPIN (a resource to help young people deal with feeling down); Helping Troubled Young People (a resource for parents/caregivers); and Te Awhina i Nga Rangatahi e Raru Nei (a resource for Māori parents, caregivers and whānau).
For more statistical information about suicide, see the New Zealand Health Information Service website www.nzhis.govt.nz
There were 1,344,267 households living in private dwellings in New Zealand at the 2001 Census. This was an increase of 76,173 (6.0 percent) on the 1,268,094 recorded at the 1996 Census.
Table 6.12 describes the composition of households in private occupied dwellings at the 1996 and 2001 Censuses.
One-family households remain predominant, although the percentage of households in this category fell from 63.0 in 1996 to 60.7 in 2001.
One-person households are easily the next most common type, comprising 22.9 percent of all households in 2001, compared with 20.1 percent in 1996.
Table 6.12. Household composition in private occupied dwellings
| Type | 1996 Census | 2001 Census | Intercensal percentage change 1996–2001 | ||
|---|---|---|---|---|---|
| Number | Percentage of total | Number | Percentage of total | ||
Note: All cells in this table have been randomly rounded to base 3. Source: Statistics New Zealand | |||||
| One family only | 803,994 | 63.0 | 815,823 | 60.7 | 1.5 |
| One family plus other people | 78,909 | 6.2 | 93,261 | 6.9 | 18.2 |
| One family, not further defined 21 | ... | ... | ... | ... | |
| Two or more families (with or without other people) | 32,193 | 2.5 | 28,440 | 2.1 | -11.7 |
| Other multi-person household | 66,360 | 5.2 | 70,434 | 5.2 | 6.1 |
| One-person household | 256,572 | 20.1 | 307,632 | 22.9 | 19.9 |
| Household composition unidentifiable | 30,045 | 3.0 | 28,677 | 2.1 | -4.5 |
| Total | 1,268,094 | 100.0 | 1,344,267 | 100.0 | 6.0 |
The number of dwellings occupied on census night increased 84,213 from 1,283,991 in 1996 to 1,368,204 in 2001, a rise of 6.6 percent (see table 6.13). The percentage increase was not significantly different from that of the resident population count, leading to no significant change in the average number of household members per occupied dwelling. The average number was 2.7 in 2001 and 2.8 in 1996.
There was a 1.9 percent decline in the number of separate houses, a 15.9 percent decline in the number of dwellings where three or more flats were joined together, and a 28.3 percent decline in the number of temporary private dwellings.
Table 6.13. Dwelling type
| Type | Number of dwellings | Intercensal percentage change 1996–2001 | |
|---|---|---|---|
| 1996 | 2001 | ||
Note:All cells in this table have been randomly rounded to base 3. Source: Statistics New Zealand | |||
| Occupied dwellings – | |||
| Permanent private dwellings – | |||
| Separate house | 1,050,144 | 1,030,077 | -1.9 |
| Two houses or flats joined together | 115,812 | 132,114 | 14.1 |
| Three or more flats or houses joined together | 93,351 | 78,513 | -15.9 |
| Flat or house joined to a business or shop | 7,122 | 16,791 | 135.8 |
| Bach, crib or other holiday home | 2,565 | 8,811 | 243.5 |
| Permanent private dwellings not further defined | ... | 21,585 | ... |
| Total permanent private dwellings | 1,268,994 | 1,287,888 | 1.5 |
| Temporary private dwellings | 7,341 | 5,265 | -28.3 |
| Private dwellings not further defined | ... | 66,690 | ... |
| Total private dwellings | 1,276,332 | 1,359,843 | 6.5 |
| Non-private dwellings | 7,662 | 8,364 | 9.2 |
| Total occupied dwellings | 1,283,991 | 1,368,204 | 6.6 |
| Unoccupied dwellings – | |||
| Total unoccupied dwellings | 123,837 | 147,435 | 19.1 |
| Dwellings under construction | 10,449 | 9,024 | -13.6 |
Table 6.14 shows the number of usual residents in households on census nights in 1996 and 2001.
Changes in the distribution of dwellings by number of household members are a result of demographic, social and economic trends.
Intercensal increases in both the number and percentage of dwellings with one occupant reflect demographic shifts in the population towards increasing numbers of people at the ages where living alone is most common. However, not all of the increase can be explained by demographic shifts. Changes in attitudes and choices of New Zealanders can also be reflected.
Table 6.14. Number of usual residents in households1,2
| Number of usual residents in households | 1996 Census | 2001 Census | Intercensal percentage change 1996–2001 | ||
|---|---|---|---|---|---|
| Households | Percentage | Households | Percentage | ||
Excludes visitor-only households. 2For households in private occupied dwellings. Note: All cells in this table have been randomly rounded to base 3. Source: Statistics New Zealand | |||||
| One | 276,507 | 21.8 | 307,935 | 22.9 | 11.4 |
| Two | 414,426 | 32.7 | 452,580 | 33.7 | 9.2 |
| Three | 217,911 | 17.2 | 221,883 | 16.5 | 1.8 |
| Four | 196,779 | 15.5 | 200,994 | 15.0 | 2.1 |
| Five | 98,694 | 7.8 | 99,402 | 7.4 | 0.7 |
| Six | 38,601 | 3.0 | 37,359 | 2.8 | -3.2 |
| Seven | 14,037 | 1.1 | 13,029 | 1.0 | -7.2 |
| Eight or more | 11,136 | 0.9 | 11.079 | 0.8 | -0.5 |
| Total | 1,268,094 | 100.0 | 1,344,267 | 100.0 | 6.0 |
Figure 6.8 shows the average number of people per dwelling at each census year from 1956 to 2001.
Tenure of dwellings. Changes in the tenure of private dwellings between the 1996 and 2001 Censuses are shown in table 6.15. Occupied private dwellings owned with a mortgage decreased by 1.1 percent to 443,277. This category decreased its share of total private dwellings from 36.8 percent to 34.6 percent.
There was an increase of 4.9 percent in the number of occupied dwellings owned without a mortgage, although the percentage of total dwellings in this category remained very similar.
The 2001 Census recorded a 23.7 percent increase in the number of private dwellings rented or leased and a 15 percent decrease in the number of private dwellings provided rent free.
Figure 6.8. Household size Average number of people per household
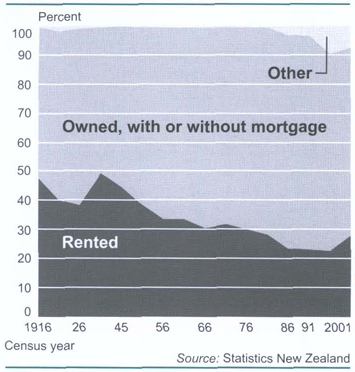
Table 6.15. Tenure of household1
| Tenure | 1996 Census | 2001 Census | Intercensal percentage change 1996–2001 | ||
|---|---|---|---|---|---|
| Dwellings | Percentage2 | Dwellings | Percentage2 | ||
For households in private occupied dwellings. Excludes visitor-only households. 2Calculated in terms of specified cases only. 3Includes response unidentifiable and not slated. Note: All cells in this table have been randomly rounded to base 3. Source: Statistics New Zealand | |||||
| Owned with mortgage | 448,374 | 36.8 | 443,277 | 34.6 | -1.1 |
| Owned without mortgage | 394,074 | 32.4 | 413,550 | 32.3 | 4.9 |
| Owned, mortgage arrangements not further defined | 18,312 | 1.5 | 11,832 | 0.9 | -34.8 |
| Rented | 290,124 | 23.8 | 358,890 | 28.0 | 23.7 |
| Provided rent free | 45,405 | 3.7 | 38,607 | 3.0 | -15.0 |
| Not owned, rental status not further defined | 21,534 | 1.8 | 14,700 | 1.1 | -31.7 |
| Not elsewhere included3 | 51,015 | ... | 63,414 | ... | 24.3 |
| Total | 1,268,094 | 100.0 | 1,344,267 | 100.0 | 6.0 |
Figure 6.9 shows the tenure of private dwellings in New Zealand for the census years from 1916 to 2001 and Figure 6.10 shows home ownership by ethnic composition. Table 6.16 shows a continuing decline in involvement in the rental housing market by government departments, including Housing New Zealand, and local authorities. The share of rented dwellings provided by Housing New Zealand declined from 1996 to 2001. By contrast, dwellings rented or leased from individuals and trusts increased during the intercensal period. This remains the most common category.
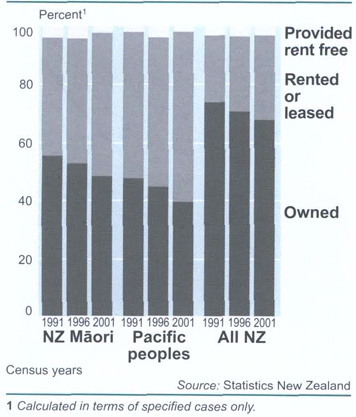
Table 6.16. Sector of landlord for households in rented private occupied dwellings
| Category of landlord | 1996 Census | 2001 Census | Intercensal percentage change 1996–2001 | ||
|---|---|---|---|---|---|
| Dwellings | Percentage | Dwellings | Percentage | ||
Note: All cells in this table have been randomly rounded to base 3. Source: Statistics New Zealand | |||||
| Rented from – | |||||
| Private person | ... | ... | 231,408 | 64.5 | ... |
| Private trust | ... | ... | 19,512 | 5.4 | ... |
| Total private | 183,153 | 63.1 | 250,920 | 69.9 | 37.0 |
| Local authority or city council | 14,781 | 5.1 | 14,115 | 3.9 | -4.5 |
| Housing New Zealand | 52,671 | 18.2 | 52,503 | 14.6 | -0.3 |
| Other state-owned corporations | 8,370 | 2.9 | 6,432 | 1.8 | -23.2 |
| Business or other organisation | 13,038 | 4.5 | 13,581 | 3.8 | 4.2 |
| Sector of landlord not elsewhere specified | 18,114 | 6.2 | 21,339 | 5.9 | 17.8 |
| Total rented | 290,124 | 100.0 | 358,890 | 100.0 | 23.7 |
The number of households which had the use of one or more motor vehicles for private transport increased by 8.5 percent between the 1996 and 2001 Censuses. At the 2001 Census, 1,158,462 households (89.9 percent of total households) had the use of one or more motor vehicles, 90,294 more than at the 1996 Census. There was a related decline in the percentage of households without a vehicle. Table 6.17 shows the number of motor vehicles per household at the 1996 and 2001 Censuses and the percentage changes.
Table 6.17. Number of motor vehicles1
| Number of motor vehicles2 | 1996 Census | 2001 Census | Intercensal percentage change 1996–2001 | ||
|---|---|---|---|---|---|
| Households | Percentage of total3 | Households | Percentage of total3 | ||
For households in private occupied dwellings. Excludes visitors-only households. 2Includes cars, station-wagons, vans, trucks, and other vehicles used on public roads (excludes motorcycles and scooters). Business vehicles if available for private use are also included. 3Calculated in terms of stated cases only. NoteAll cells in this table have been randomly rounded to base 3. Source: Statistics New Zealand | |||||
| None | 144,972 | 12.0 | 129,891 | 10.1 | -10.4 |
| One | 518,454 | 42.7 | 526,230 | 40.8 | 1.5 |
| Two | 406,884 | 33.5 | 463,116 | 35.9 | 13.8 |
| Three or more | 142,830 | 11.8 | 169,116 | 13.1 | 18.4 |
| Not specified | 54,954 | ... | 55,914 | ... | 1.7 |
| Total | 1,268,094 | 100.0 | 1,344,267 | 100.0 | 6.0 |
The New Zealand Household Economic Survey is conducted every three years by Statistics New Zealand, with results applying to the year 1 July to 30 June. The survey provides information on spending patterns and income levels of private households. Social and demographic characteristics are also collected to enable households to be analysed in more detail.
Itemised expenditure statistics from the survey are used as the weighting base of the consumers price index when it is revised every three years (see Chapter 26: Prices).
In the following tables, the aggregate estimate of income or expenditure has been averaged over all households in the survey, rather than over only those households which reported income or expenditure on particular items. This has the effect of reducing some statistics to a level below that which would normally be expected (eg expenditure on rent).
Table 6.18 shows the number of households in New Zealand in each of the listed income brackets and the average weekly household income for each category.
Table 6.18. Income distribution of households 2000/011
| Annual income | Number of households | Average weekly household income |
|---|---|---|
Income is before tax, from regular and recurring sources only (income is not collected from children under 15 years). 2Including loss from self-employment and nil. Source: Statistics New Zealand | ||
| (000) | $ | |
| Under 14,9002 | 136.5 | 180.80 |
| 14,900 to 20,699 | 138.1 | 334.60 |
| 20,700 to 25,899 | 137.0 | 446.20 |
| 25,900 to 32,399 | 138.2 | 554.60 |
| 32,400 to 40,599 | 136.8 | 700.30 |
| 40,600 to 51,099 | 136.4 | 873.60 |
| 51,100 to 62,299 | 136.3 | 1,085.70 |
| 62,300 to 76,699 | 138.8 | 1,317.40 |
| 76,700 to 101,099 | 135.3 | 1,682.50 |
| 101,100 or more | 137.6 | 3,032.50 |
| All income groups | 1,371.0 | 1,020.70 |
| Total for 1997/98 | 1,162.5 | 944.10 |
Table 6.19 shows the average weekly household expenditure on various expenditure groups, classified by household composition.
Table 6.19. Average weekly expenditure1 by household composition, 2000/01
| Expenditure group | Year ended 30 June | |||
|---|---|---|---|---|
| One-family household, couple only | One-family household, one parent with child(ren) only | One-family household, couple with child(ren) only | Other one-family households2 | |
All expenditure is net of refunds, sales and trade-ins and includes GST. 2This category contains all one-family households where ‘other people’ are present (other people can be related or unrelated to the family nucleus). 3This category is an aggregation of the following categories: two-family households, three-or-more-family households and other multi-person households. Source: Household Economic Survey, Statistics New Zealand | ||||
| $ | ||||
| Food group | 121.70 | 178.10 | 93.20 | 160.70 |
| Housing group | 174.70 | 235.80 | 165.10 | 235.20 |
| Household operations | 102.30 | 123.80 | 80.40 | 111.70 |
| Apparel group | 22.80 | 36.20 | 14.30 | 35.10 |
| Transportation group | 142.30 | 148.50 | 73.50 | 203.10 |
| Other goods group | 86.30 | 113.00 | 57.70 | 123.90 |
| Other services group | 123.60 | 169.00 | 68.40 | 160.80 |
| Total net expenditure | 773.70 | 1,004.30 | 552.60 | 1,030.50 |
| Expenditure group | One-person household | All other household3 | All household |
|---|---|---|---|
| $ | |||
| Food group | 57.20 | 145.00 | 124.90 |
| Housing group | 102.30 | 211.70 | 181.00 |
| Household operations | 59.10 | 96.10 | 97.00 |
| Apparel group | 10.70 | 30.70 | 24.50 |
| Transportation group | 54.40 | 148.40 | 120.70 |
| Other goods group | 39.90 | 118.60 | 85.00 |
| Other services group | 72.70 | 165.30 | 125.30 |
| Total net expenditure | 396.30 | 915.80 | 758.30 |
Table 6.20 compares the percentage of households with various amenities in their homes in the years ended 30 June 1998 and 2001.
Table 6.2. Household amenities
| Amenity in dwelling | Percent of all households | |
|---|---|---|
| 1997/98 | 2000/01 | |
| Source: Household Economic Surveys. Statistics New Zealand | ||
| Electric range or wall oven | 94 | 94 |
| Gas, coal or oil-fired range | 11 | 13 |
| Microwave oven | 79 | 82 |
| Telephone | 96 | 94 |
| Cellular phone | 22 | 58 |
| Clothes-washing machine | 98 | 97 |
| Clothes dryer | 65 | 64 |
| Combination refrigerator/freezer | 81 | 82 |
| Separate refrigerator | 29 | 29 |
| Separate deep-freeze unit | 53 | 50 |
| Dish-washing machine | 32 | 39 |
| Colour television (owned) | 96 | 98 |
| Television (hired or rented) | 1 | – |
| No television owned or hired or rented | 3 | 2 |
| Subscriber TV decoder | 20 | 31 |
| Subscription to subscriber TV | 18 | 29 |
| Video recorder (hired or rented) | – | – |
| Video recorder (owned) | 79 | 83 |
| Home computer (mains operated with keyboard) | 32 | 47 |
| Waterbeds | 9 | 5 |
| Spa pools and heated swimming pools | 5 | 5 |
| Portable electric heater | 74 | 71 |
| Electric night-store heater fixed in place | 10 | 9 |
| Other electric heater fixed in place | 30 | 27 |
| Portable gas heater | 31 | 33 |
| Gas heater fixed in place | 13 | 12 |
| Portable kerosene heater | 1 | 1 |
| Wet-back fire of any kind | 18 | 15 |
| Open fire | 20 | 17 |
| Slow-combustion fire | 32 | 32 |
| Central heating of any kind | 4 | 5 |
| Water heaters | 83 | 98 |
| Gas mains connection | 15 | 15 |
Table 6.21 compares various aspects of New Zealand's living standards with selected other OECD countries.
Table 6.21. Indicators of living standards
| Item | Unit | Year | New Zealand | Australia | Japan | Sweden | United Kingdom | United States |
|---|---|---|---|---|---|---|---|---|
From OECD website www.oecd.org. 21998. 31996. 41997. 5November. 6Sanitary and similar services included under industry. 7Includes government enterprises. Source: OECD in Figures, 2000 | ||||||||
| Area | sq km (000) | 269 | 7,687 | 378 | 450 | 245 | 9,372 | |
| Population1 | million persons | 1999 | 3.8 | 18.9 | 126.7 | 8.9 | 59.22 | 272.9 |
| Density1 | persons per sq km | 1999 | 14 | 2 | 335 | 20 | 2422 | 29 |
| Vital statistics | ||||||||
| Infant mortality rate | per 1,000 live births | 1997 | 6.9 | 5.3 | 3.7 | 4.03 | 5.9 | 7.83 |
| Life expectancy at birth | male | 1997 | 74.9 | 75.6 | 77.2 | 76.7 | 74.33 | 73.6 |
| female | 1997 | 80.2 | 81.3 | 83.8 | 81.8 | 79.53 | 79.4 | |
| Gross Domestic Product | US$ billion at current prices and exchange rates | 1999 | 54.2 | 393.3 | 4,380.10 | 239.2 | 1,422.90 | 9,190.40 |
| Average annual volume change | percentage | 1998–99 | 2.7 | 3.9 | 1.4 | 3.9 | 1.7 | 4.1 |
| GDP per capita | US$ per person at current prices and exchange rates | 1999 | 14,100 | 20,700 | 34,500 | 27,000 | 23,900 | 33,900 |
| Contribution by sector | ||||||||
| Agriculture | percentage of GDP | 1998 | 7.43 | 3.3 | 1.74 | 2.23 | 1.3 | 1.74 |
| Industry | percentage of GDP | 1998 | 26.03 | 26.4 | 37.24 | 29.93 | 28.8 | 26.14,6 |
| Services | percentage of GDP | 1998 | 66.63 | 70.4 | 61.14 | 67.93 | 69.9 | 72.24,7 |
| Employment by sector | ||||||||
| Agriculture, forestry and fishing | percentage of civilian employment | 1998 | 8.5 | 4.8 | 5.3 | 2.6 | 1.7 | 2.7 |
| Industry | percentage of civilian employment | 1998 | 23.9 | 21.9 | 32.2 | 25.7 | 26.5 | 23.6 |
| Services | percentage of civilian employment | 1998 | 67.0 | 73.3 | 62.5 | 71.7 | 71.8 | 73.7 |
| Energy | ||||||||
| Total final energy consumption | tonnes of oil equivalent (million) | 1998 | 12.3 | 69.1 | 336.5 | 35.3 | 159.0 | 1,429.70 |
| Total production | tonnes of oil equivalent (million) | 1998 | 13.8 | 212.0 | 109.9 | 34.2 | 274.2 | 1,695.4 |
| External commodities trade | ||||||||
| Imports (cif) | US$ billion at current prices and exchange rates | 1998 | 12.5 | 60.8 | 280.6 | 64.2 | 320.3 | 944.4 |
| Exports (fob) | US$ billion at current prices and exchange rates | 1998 | 11.9 | 55.8 | 388.1 | 82.5 | 273.4 | 680.4 |
| Social and natural environment | ||||||||
| Doctors | per 1,000 of mean population | 1997 | 2.2 | 2.5 | 1.83 | 3.13 | 1.73 | 2.7 |
| Expenditure on health (total) | percentage of GDP | 1997 | 7.6 | 8.4 | 7.2 | 8.6 | 6.9 | 13.9 |
| Expenditure on public education | percentage of GDP | 1997 | 5.33 | 5.6 | 4.8 | 6.9 | 4.63 | .9 |
| Expenditure on pollution control | percentage of GDP | Latest available | .. | 0.8 | 1.6 | 1.2 | 1 | 1.6 |
| Road accident fatalities | per 100,000 of population | 1998 | 13 | 9 | 9 | 6 | 6 | 164 |
| Consumer prices | percentage change | Dec 1998–99 | 0.55 | 1.85 | -1.1 | 1.3 | 1.8 | 2.7 |
| Long-term interest rate | percent | Dec 1999 | 7.17 | 6.96 | 1.77 | 5.59 | 5.38 | 6.63 |
| Comparative price level | US$ to buy same basket of goods and services costing $100 in US | 1999 | 148 | 131 | 161 | 970 | 66.4 | 100 |
Marriages in New Zealand may be solemnised either by a celebrant or before a registrar of marriages. A licence must be obtained from a registrar before a marriage by a celebrant can be solemnised.
Approved marriage celebrants are listed annually in the New Zealand Gazette. To be appointed. marriage celebrants must be of good character, be of high standing in the community and be able to demonstrate a community need for their appointment. Justices of the Peace are not necessarily marriage celebrants.
The minimum age for marriage is 16 years. No marriage, however, is deemed to be void by reason only of an infringement of the minimum age. People under 20 years of age, not being widowed, require the consent of parents or guardians to marry. In case of their refusal, consent of a district court judge may be sought.
Table 6.22 shows the number of marriages and marriage rates in New Zealand from 1988 to 2000.
Table 6.22. Marriage rates
| December year1 | Number of marriages | Marriage rate | |
|---|---|---|---|
| Crude2 | General3 | ||
Figures for 1991 onwards are based an the resident population concept, replacing the de facto population concept used in the past. Figures for 1999 onwards are based on ‘date of registration', whereas earlier years are based on ‘date of marriage'. 2Per 1,000 mean population. 3Per 1,000 mean not-married population aged 16 years and over. Source: Statistics New Zealand | |||
| 1988 | 23,485 | 7.08 | 23.36 |
| 1989 | 22,733 | 6.83 | 22.18 |
| 1990 | 23,341 | 6.94 | 22.19 |
| 1991 | 21,841 | 6.28 | 19.76 |
| 1992 | 20,804 | 5.92 | 18.44 |
| 1993 | 20,802 | 5.85 | 18.04 |
| 1994 | 20,587 | 5.71 | 17.48 |
| 1995 | 20,452 | 5.59 | 16.96 |
| 1996 | 20,453 | 5.50 | 16.54 |
| 1997 | 19,953 | 5.30 | 15.78 |
| 1998 | 20,135 | 5.31 | 15.66 |
| 1999 | 21,085 | 5.53 | 16.18 |
| 2000 | 20,655 | 5.39 | 15.61 |
Table 6.23 shows the census usually resident population counts for males and females by marital status and age group at the 2001 Census of Population and Dwellings. The numbers ‘never married’ and ‘married’ in each age group reflect long-term changes that have taken place in the average age at marriage, the marriage rate and the age-sex distribution of the population.
Age-specific marriage rates have, in turn, been affected by the increasing number of people in each age group who are partnered, not legally married. General improvements in life expectancy and earlier increases in divorce rates have had a continuing impact on numbers in the ‘widowed’ and ‘divorced’ categories at all ages.
Table 6.23. Legal marital status by age group, 2001 census1
| Age group (years) | Never married | Married (Not separated) | Separated2 | Divorced | Widowed | Not elsewhere included3 | Total |
|---|---|---|---|---|---|---|---|
Census usually resident population count aged 15 years and over. 2Includes people who are still married but permanently separated. 3Includes response unidentifiable. Source: Statistics New Zealand | |||||||
| Males | |||||||
| 15–19 | 119,298 | 354 | 48 | 72 | 171 | 15,009 | 134,952 |
| 20–24 | 101,514 | 5,352 | 414 | 201 | 108 | 11,205 | 118,794 |
| 25–34 | 134,526 | 83,631 | 6,672 | 5,556 | 276 | 19,548 | 250,206 |
| 35–14 | 62,457 | 164,067 | 15,288 | 20,802 | 924 | 17,640 | 281,181 |
| 45–54 | 22,650 | 160,683 | 14,385 | 26,565 | 2,367 | 13,830 | 240,480 |
| 55–64 | 9,510 | 118,479 | 7,173 | 16,377 | 4,719 | 9,759 | 166,023 |
| 65–74 | 6,321 | 84,774 | 3,081 | 7,785 | 9,528 | 7,134 | 118,626 |
| 75+ | 3,843 | 47,565 | 1,062 | 2,604 | 17,454 | 5,535 | 78,060 |
| Total | 460,119 | 664,908 | 48,126 | 79,962 | 35,544 | 99,657 | 1,388,316 |
| Females | |||||||
| 15–19 | 116,595 | 732 | 81 | 48 | 102 | 12,777 | 130,332 |
| 20–24 | 98,751 | 10,998 | 1,122 | 324 | 102 | 9,696 | 120,993 |
| 25–34 | 121,674 | 113,256 | 12,126 | 9,966 | 780 | 18,174 | 275,973 |
| 35–44 | 51,498 | 179,607 | 21,225 | 29,865 | 2,985 | 16,722 | 301,902 |
| 45–54 | 16,845 | 159,930 | 15,141 | 34,263 | 7,998 | 13,296 | 247,473 |
| 55–64 | 6,807 | 110,142 | 6,354 | 19,701 | 17,877 | 9,930 | 170,808 |
| 65–74 | 5,016 | 67,809 | 2,298 | 8,694 | 36,090 | 7,638 | 127,545 |
| 75+ | 6,366 | 31,197 | 789 | 3,723 | 74,862 | 9,255 | 126,192 |
| Total | 423,552 | 673,665 | 59,130 | 106,581 | 140,799 | 97,488 | 1,501,218 |
| Total | 883,671 | 1,338,573 | 107,256 | 186,546 | 176,340 | 197,148 | 2,889,537 |
Figure 6.11 shows marriage and divorce rates in New Zealand from 1961 to 2000.
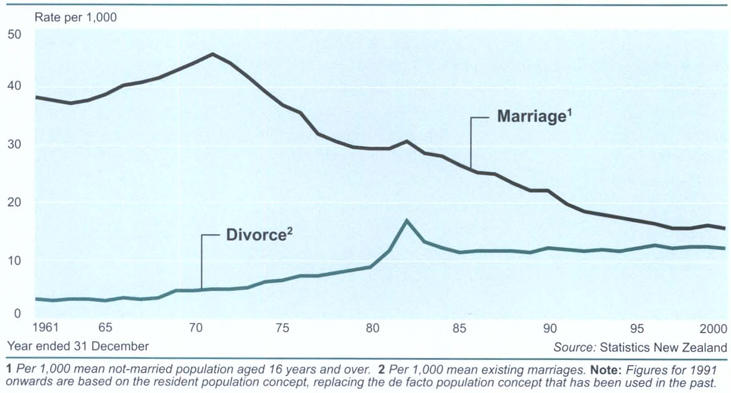
Table 6.24 shows the numbers of males and females in each marital status category and the percentage distribution of the population by marital status at the 1996 and 2001 Censuses. There was a considerable increase in the percentages of both males and females separated or divorced between the 1996 and 2001 Censuses. Also evident is a small decrease in the number of people recorded as married, while there is an increase in those never married.
Table 6.24. Distribution of people aged 15 years and over by legal marital status1
| Marital status | 1996 Census | 2001 Census | Intercensal increase or decrease | |||
|---|---|---|---|---|---|---|
| Number | Percentage | Number | Percentage | Number | Percentage | |
Census usually resident population count aged 15 years and over. 2Includes people who are still married but permanently separated. 3Includes response unidentifiable. Source: Statistics New Zealand | ||||||
| Males | ||||||
| Never married | 446,442 | 33.1 | 460,119 | 33.1 | 13,677 | 3.1 |
| Married | 669,171 | 49.5 | 664,908 | 47.9 | -4,263 | -0.6 |
| Separated2 | 41,337 | 3.1 | 48,126 | 3.5 | 6,789 | 16.4 |
| Divorced | 66,132 | 4.9 | 79,962 | 5.8 | 13,830 | 20.9 |
| Widowed | 32,022 | 2.4 | 35,544 | 2.6 | 3,522 | 11.0 |
| Not elsewhere included3 | 94,860 | 7.0 | 99,657 | 7.2 | 4,797 | 5.1 |
| Total | 1,349,964 | 100.0 | 1,388,316 | 100.0 | 38,352 | 2.8 |
| Females | ||||||
| Never married | 397,746 | 27.7 | 423,552 | 28.2 | 25,806 | 6.5 |
| Married | 676,407 | 47.1 | 673,665 | 44.9 | -2.742 | -0.4 |
| Separated2 | 51,711 | 3.6 | 59.130 | 3.9 | 7,419 | 14.3 |
| Divorced | 86,478 | 6.0 | 106,581 | 7.1 | 20,103 | 23.2 |
| Widowed | 132,951 | 9.3 | 140,799 | 9.4 | 7,848 | 5.9 |
| Not elsewhere included3 | 90,963 | 6.3 | 97,488 | 6.5 | 6,525 | 7.2 |
| Total | 1,436,256 | 100.0 | 1,501,218 | 100.0 | 64,962 | 4.5 |
Marriages in 2000 totalled 20,655, continuing the declining trend in the number of marriages from the peak of 27,199 in 1971.
Table 6.25 shows the age of people married in 2000. The average age of those marrying in 2000 rose to 34.4 years for men and 31.7 years for women. This continued the upward trend in average age at marriage evident since the early 1970s (see table 6.27). The increase in the average age at marriage is largely a reflection of a trend towards delayed marriage, increasing numbers of people remaining single, cohabitation before marriage and the growing number of people living in de facto unions.
The rise in the average age at marriage for both men and women has been mainly driven by the rise in age at first marriage. The average age for people marrying for the first time in 2000 was 30.2 years for men and 28.1 years for women – the highest since the mid-1920s for men and since figures have been collected for women.
In general, women are still marrying men older than themselves, but the gap between their average age at first marriage has narrowed from about three years in the mid-1960s to two years in 2000.
Table 6.25. Ages of people married in 2000
| Age of men, in years | Age of women, in years | Total men | ||||||
|---|---|---|---|---|---|---|---|---|
| Under 20 | 20–24 | 25–29 | 30–34 | 35–39 | 40–44 | 45 and over | ||
| Source: Statistics New Zealand | ||||||||
| Under 20 | 98 | 70 | 11 | 4 | – | – | – | 183 |
| 20–24 | 300 | 1,736 | 468 | 97 | 26 | 6 | 2 | 2,635 |
| 25–29 | 136 | 1,694 | 2,969 | 767 | 167 | 40 | 20 | 5,793 |
| 30–34 | 28 | 535 | 1,926 | 1,575 | 422 | 104 | 39 | 4,629 |
| 35–39 | 14 | 144 | 632 | 954 | 666 | 234 | 75 | 2,719 |
| 40–44 | 3 | 39 | 194 | 357 | 492 | 342 | 191 | 1,618 |
| 45 and over | 1 | 26 | 116 | 226 | 423 | 593 | 1,693 | 3,078 |
| Total women | 580 | 4,244 | 6,316 | 3,980 | 2,196 | 1,319 | 2,020 | 20,655 |
Table 6.26 shows census usually resident population counts for males and females living in partnered, not legally married relationships, by age group, irrespective of marital status. At the 2001 Census, 300,846 people were living in partnered, not legally married relationships, an increase of 64,446, or 27.3 percent, since 1996. Of the people in this category, 73.7 percent of males and 76.2 percent of females were between the ages of 20 and 44 years. The age group with the highest number of partnered, not legally married relationships is clearly the 25 to 34-year-old group.
Table 6.26. Partnered, not legally married relationships1,2
| 1996 Census1,2 | 2001 Census1,2 | Intercensal increase or decrease | ||||
|---|---|---|---|---|---|---|
| Number | Percentage | Number | Percentage | Number | Percentage | |
Census usually resident population count aged 15 years and aver. 2Includes same sex couples and excludes partnered not further defined. Source: Statistics New Zealand | ||||||
| Males | ||||||
| 15–19 | 3,033 | 2.6 | 4,008 | 2.7 | 975 | 32.1 |
| 20–24 | 19,890 | 16.9 | 19,350 | 13.0 | -540 | -2.7 |
| 25–34 | 46,926 | 40.0 | 53,736 | 36.1 | 6,810 | 14.5 |
| 35–44 | 25,563 | 21.8 | 36,651 | 24.6 | 11,088 | 43.4 |
| 45–54 | 14,247 | 12.1 | 21,552 | 14.5 | 7,305 | 51.3 |
| 55–64 | 5,304 | 4.5 | 9,279 | 6.2 | 3,975 | 74.9 |
| 65–74 | 1,941 | 1.7 | 3,177 | 2.1 | 1,236 | 63.7 |
| 75+ | 495 | 0.4 | 1,167 | 0.8 | 672 | 135.8 |
| Total | 117,396 | 100.0 | 148,917 | 100.0 | 31,521 | 26.9 |
| Females | ||||||
| 15–19 | 6,939 | 5.8 | 7,917 | 5.2 | 978 | 14.1 |
| 20–24 | 26,871 | 22.6 | 25,920 | 17.1 | -951 | -3.5 |
| 25–34 | 45,168 | 38.0 | 55,266 | 36.4 | 10,098 | 22.4 |
| 35–44 | 23,295 | 19.6 | 34,476 | 22.7 | 11,181 | 48.0 |
| 45–54 | 12,114 | 10.2 | 19,272 | 12.7 | 7,158 | 59.1 |
| 55–64 | 3,207 | 2.7 | 6,432 | 4.2 | 3,225 | 100.6 |
| 65–74 | 1,047 | 0.9 | 1,833 | 1.2 | 786 | 75.1 |
| 75+ | 357 | 0.3 | 816 | 0.5 | 459 | 128.6 |
| Total | 119,004 | 100.0 | 151,929 | 100.0 | 32,925 | 27.7 |
Figure 6.12 shows the median age at first marriage for men and women.
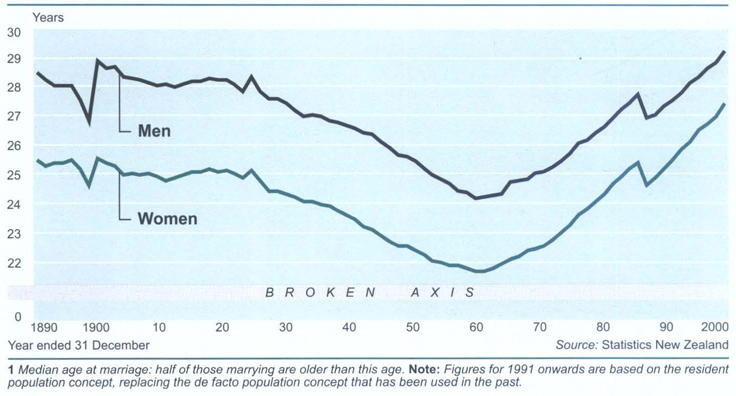
Table 6.27 shows changes in the average age of people marrying from 1976 to 2000.
Table 6.27. Average age of people marrying
| December year1 | Men | Women | ||||||
|---|---|---|---|---|---|---|---|---|
| Bachelors | Divorced | Widowers | Total | Spinsters | Divorced | Widows | Total | |
Figures for 1991 onwards are based on the resilient population concept, replacing the de facto concept used in the past. Source: Statistics New Zealand | ||||||||
| 1976 | 24.8 | 39.1 | 57.9 | 28.0 | 22.2 | 35.4 | 51.4 | 25.0 |
| 1981 | 25.4 | 39.7 | 58.2 | 29.2 | 23.0 | 35.9 | 51.9 | 26.3 |
| 1986 | 26.6 | 40.7 | 59.3 | 30.8 | 24.3 | 37.0 | 52.4 | 27.9 |
| 1991 | 27.8 | 41.8 | 59.9 | 31.9 | 25.6 | 38.0 | 52.7 | 29.1 |
| 1992 | 27.9 | 42.3 | 60.5 | 32.2 | 25.8 | 38.3 | 53.2 | 29.5 |
| 1993 | 28.2 | 42.4 | 59.2 | 32.5 | 26.1 | 39.0 | 53.3 | 29.7 |
| 1994 | 28.5 | 43.0 | 59.9 | 32.7 | 26.4 | 39.0 | 53.7 | 30.0 |
| 1995 | 28.8 | 43.2 | 59.9 | 33.2 | 26.8 | 39.4 | 53.8 | 30.4 |
| 1996 | 29.1 | 43.5 | 60.0 | 33.4 | 27.0 | 39.5 | 53.5 | 30.7 |
| 1997 | 29.3 | 43.9 | 60.0 | 33.7 | 27.4 | 40.2 | 54.0 | 31.1 |
| 1998 | 29.5 | 43.7 | 61.0 | 33.8 | 27.5 | 39.9 | 53.5 | 31.2 |
| 1999 | 29.8 | 44.0 | 60.4 | 33.9 | 27.8 | 40.4 | 54.2 | 31.3 |
| 2000 | 30.2 | 44.5 | 60.2 | 34.4 | 28.1 | 40.7 | 54.0 | 31.7 |
There is only one ground on which an order dissolving a marriage can be made in New Zealand – that the marriage has broken down irreconcilably. The Family Proceedings Act 1980, which provides the legal framework for the dissolution of marriage, also makes provision for orders declaring a marriage void and for declarations of presumption of death. To establish that a marriage has broken down irreconcilably, the parties must have been living apart for the previous two years. Since 1981, applications for dissolution of marriage have been made to family courts, which are less formal and have simpler procedures than other courts. Table 6.28 shows the divorce rate and number of divorces in New Zealand each year from 1991 to 2000. Table 6.29 shows the duration of marriages ending in dissolution and the age of each partner when married.
Table 6.28. Divorce rates
| December year | Number of divorces | Divorce rate1 |
|---|---|---|
Per 1,000 estimated existing marriages. Source: Statistics New Zealand | ||
| 1991 | 9,152 | 12.0 |
| 1992 | 9,114 | 11.9 |
| 1993 | 9,193 | 12.0 |
| 1994 | 9,213 | 11.9 |
| 1995 | 9,574 | 12.3 |
| 1996 | 10,009 | 12.7 |
| 1997 | 9,754 | 12.3 |
| 1998 | 10,067 R | 12.7 |
| 1999 | 9,931 | 12.6 |
| 2000 | 9,699 | 12.3 |
Table 6.29. Duration of marriages ending in dissolution by ages of husbands and wives at marriage, 2000
| Duration of marriage (in years)1 | Age (in years) at marriage | Total | ||||||
|---|---|---|---|---|---|---|---|---|
| Under 20 | 20–24 | 25–29 | 30–34 | 35–39 | 40–44 | 45 and over | ||
1Duration of marriage calculated from bath month and year of dissolution. Source: Statistics New Zealand | ||||||||
| Husbands (all petitions and applications) | ||||||||
| Under 5 | 29 | 272 | 389 | 225 | 123 | 90 | 128 | 1,256 |
| 5–9 | 36 | 652 | 843 | 434 | 180 | 146 | 154 | 2,445 |
| 10–14 | 34 | 579 | 632 | 250 | 146 | 86 | 96 | 1,823 |
| 15–19 | 55 | 637 | 417 | 182 | 80 | 41 | 42 | 1,454 |
| 20 and over | 254 | 1,585 | 613 | 161 | 71 | 21 | 16 | 2,721 |
| Total | 408 | 3,725 | 2,894 | 1,252 | 600 | 384 | 436 | 9,699 |
| Wives (all petitions and applications) | ||||||||
| Under 5 | 112 | 383 | 361 | 168 | 97 | 73 | 62 | 1,256 |
| 5–9 | 152 | 985 | 670 | 306 | 150 | 92 | 90 | 2,445 |
| 10–14 | 190 | 808 | 452 | 194 | 80 | 61 | 38 | 1,823 |
| 15–19 | 247 | 731 | 275 | 97 | 63 | 19 | 22 | 1,454 |
| 20 and over | 882 | 1,413 | 293 | 90 | 23 | 15 | 5 | 2,721 |
| Total | 1,583 | 4,320 | 2,051 | 855 | 413 | 260 | 217 | 9,699 |
Property (Relationships) Act 1976. The Matrimonial Property Act 1976 was amended in 2001. The renamed and amended act, Property (Relationships) Act 1976, provides for the division of property when a married or de facto couple separate or one of the partners dies.
Domestic Violence Act 1995. The Domestic Violence Act 1995 came into force in 1996 and replaced the Domestic Protection Act 1982. It aims to provide greater protection for victims of domestic violence. It combines non-molestation and non-violence orders into one protection order that can last indefinitely and which is available to a wider range of people in closer relationships than the previous legislation. The act also places particular emphasis on the provision of programmes for victims and their children and for the perpetrators of domestic violence.
Guardianship Act 1968. The Guardianship Act 1968 defines the authority of parents as guardians of their children, and the powers of the court in relation to guardianship and custody of, and access to, children.
Child Support Act 1992. The Child Support Act 1992 provides for the child support division of the Inland Revenue Department to assess the amount of child support to be paid by non-custodial parents according to a specific formula. The division collects and pays child support to the Crown when custodial parents are social welfare beneficiaries, and direct to custodial parents not receiving social welfare benefits. Child support is also paid to the Crown where a child is in the care of the Department of Child, Youth and Family Services. In addition, the Inland Revenue Department collects and pays court-ordered spousal maintenance and, if requested, maintenance for spouses and/or children agreed on voluntarily.
6.1 Statistics New Zealand; Department of Internal Affairs; New Zealand Immigration Service.
6.2 Statistics New Zealand; Waitangi Tribunal; Office of Treaty Settlements; Ministry of Māori Development (Te Puni Kokiri); New Zealand Māori Council; Māori Congress; Māori Women's Welfare League; Te Kohanga Reo National Trust; Māori Language Commission.
6.3 Statistics New Zealand; Ministry of Pacific Island Affairs.
6.4 Statistics New Zealand.
6.5 Human Rights Commission; Office of the Race Relations Conciliator; Equal Employment Opportunities Trust; Ministry of Women's Affairs; Ministry of Youth Affairs.
6.6 Statistics New Zealand.
6.7 Statistics New Zealand; Department for Courts.
Statistics New Zealand divisional manager responsible: Denise Brown.
2001 Census Snapshots (series). Statistics New Zealand, Wellington.
Annual Report of the EEO Trust (Parl paper G. 57).
EEO policy to 2010: Future directions of EEO in the New Zealand Public Service (1997). State Services Commission, Wellington.
Report of the Commissioner for Children (Parl paper E.65).
Report of the Department of Internal Affairs (Parl paper G.7).
Report of the Department of Labour (Parl paper G.1).
Report of the Human Rights Commission (Parl paper E.6).
2001 Census Snapshots (series). Statistics New Zealand, Wellington.
Report of the Māori Language Commission (Parl paper E.34).
Report of Te Puni Kōkiri – the Ministry of Māori Development (Parl paper E.47).
2001 Census Snapshots (series). Statistics New Zealand, Wellington.
Report of the Ministry of Pacific Island Affairs (Parl paper G.54).
www.dia.govt.nz – Department of Internal Affairs
www.dol.govt.nz – Department of Labour
www.hrc.co.nz – Human Rights Commission
www.tetaurawhiri.govt.nz – Māori Language Commission
www.tpk.govt.nz – Ministry of Māori Development
www.minpac.govt.nz – Ministry of Pacific Island Affairs
www.immigration.govt.nz – New Zealand Immigration Service
www.ssc.govt.nz – State Services Commission
www.stats.govt.nz – Statistics New Zealand
Table of Contents
Wellington City Mission staff sort foodbank donations for distribution.
There has been an evolution in recent years in the formulation and delivery of social services in New Zealand.
The Department of Social Welfare (DSW) was restructured in the late 1990s from a large, multi-functional, multi-divisional organisation into three new organisations with separate responsibilities for policy; income support and employment services delivery; and services for children and young people.
Restructuring grew from the decision to separate the provision of social policy advice from delivery of income support and employment services, and to provide services for children and young people from a separate organisation. This initial restructuring evolved further, with the policy and services provision functions being reunited in the Ministry of Social Development, established on 1 October 2001.
Major milestones on the evolutionary path:
The Department of Work and Income was established in 1998 to provide income support and employment assistance. It combined the Department of Social Welfare's income support unit, the New Zealand Employment Service and the community employment group.
The Department of Child, Youth and Family Services was established on 1 October 1999. It integrated two Department of Social Welfare business units, the Children, Young Persons and Their Families Service and the New Zealand Community Funding Agency.
The Ministry of Social Policy was established on 1 October 1999. It joined the Department of Social Welfare's social policy agency and its corporate office, completing the dissolution of the department.
The policy and service delivery functions of the Ministry of Social Policy and the Department of Work and Income were brought together on October 1 2001 as the new Ministry of Social Development. The ministry now provides cross-sector policy advice to the government and delivers income support and employment services through its Work and Income service centres, and services to students through its StudyLink centres.
The Ministry of Social Development was established on 1 October 2001 to provide strategic social policy advice to the New Zealand Government and to deliver income support and employment services to more than one million New Zealanders.
Policy services. The ministry's policy advice areas include strategic cross-sector policy; social assistance policy; child, youth and family policy; superannuation and positive ageing policies; community development policy; and disability policy. Current priorities include:
Reviewing income support policies to achieve a system that better meets people's needs.
Developing policies to better support people moving off benefits into work.
Developing strategies to provide opportunities and incentives for sole parent beneficiaries to develop their skills and undertake meaningful work.
Developing and implementing policies to provide children with the security and opportunities they need to maximise their potential.
Providing strategic cross-sector social policy advice, including monitoring the social health of New Zealand and social policy frameworks, and identifying social policy priorities.
Progressing the Registration of Social Workers Bill and establishing associated systems.
Preparing a blueprint for the care and protection sector following a report on care and protection services for children and young people.
Developing strategies to ensure central and local government work in partnership with communities and voluntary sector agencies to develop social well-being.
Overseeing a positive ageing strategy to ensure that older New Zealanders enjoy security and independence and are able to continue to participate in their communities.
Developing a coordinated approach to knowledge management with social sector agencies.
Developing information and knowledge to support policy and purchase advice.
Publishing information and reports to enhance public understanding of social issues and trends.
Service delivery. The Ministry of Social Development's income support and employment services are delivered by Work and Income, and services to students are delivered by StudyLink.
The Ministry of Social Development provides income support services through 170 Work and Income centres throughout New Zealand. Employing approximately 5,000 people, Work and Income had more than a million clients (more than a quarter of all New Zealanders) in the 2000/01 financial year. An average 1,600 applications for income support or pensions were processed each day, while 66,000 transactions were handled daily by mail, telephone and personal contact.
Figure 7.1 shows the growth in total income support services from 1938 to 2001. The number of income support services reflects the implementation of new income support services as well as demographic trends and changing social and economic conditions. Income support services introduced since 1938 which have a significant effect on the number of income services include domestic purposes benefit (introduced in 1973) and national superannuation (now New Zealand Superannuation), introduced in 1976.
Figure 7.2 shows percentages of people receiving the main benefit types in 2000/01.
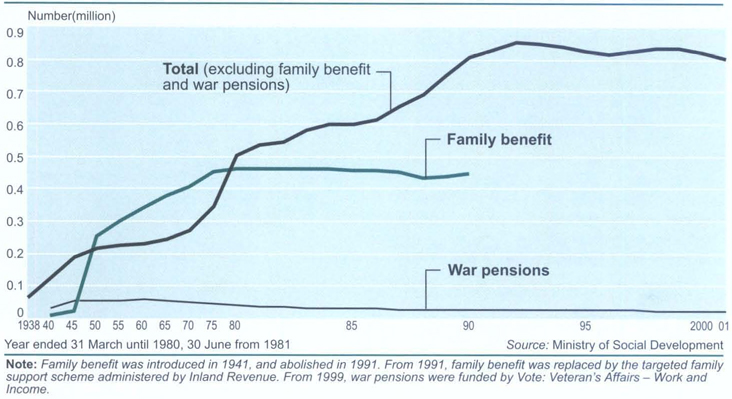
Work and Income pays a wide range of income support, supplementary income support, pensions, loans and subsidies. In the year ending 30 June 2001, these included:
Caring benefits: Domestic purposes benefit, orphan's benefit, widow's benefit and unsupported child benefit.
Incapacity benefits: Sickness benefit (formerly community wage (sickness)) and invalid's benefit.
Work-related benefits: The independent youth benefit and the unemployment benefit (formerly community wage (job seeker)).
War pensions: Veteran's pension, war disablement pension, dependant's pension, interest concessions on land and buildings, and medical treatment and other concessions.
Other benefits, grants and payments: New Zealand Superannuation, transitional retirement benefit, accommodation supplement, childcare subsidy, disability allowance, funeral grant, special benefit, special needs grant, training incentive allowance and advance payments of income support.
Weekly rates of income support at 1 April 2001 are listed in table 7.1, and a brief description of each type of income support is set out in the following text. More information is available from Work and Income service centres.
Income adjustment. People receiving invalid's, widow's, domestic purposes, sickness, unemployment and transitional retirement benefits are income-tested and some are subject to stand down periods. The levels at which all income support is paid are adjusted annually in line with movement in the consumers price index (CPI). In addition, the CPI-adjusted rate for New Zealand Superannuation and the veteran's pension is compared with average wage levels to ensure the after-tax payment rate for couples is not more than 72.5 percent or less than 60 percent of average after-tax wages.
Figure 7.2. Income support
Percentages of people receiving support by type of benefit, 2001
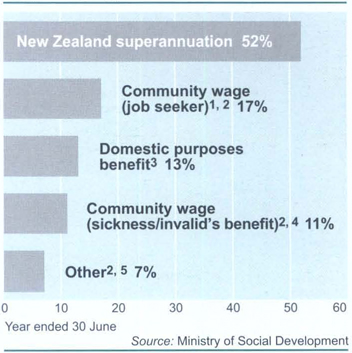
1includes community wage – job seeker, community wage – emergency job seeker and community wage – emergency job seeker student. 2On 7 July 2001 unemployment benefit replaced community wage – job seeker and community wage – training, and sickness benefit replaced community wage – sickness. 3Includes domestic purposes benefit – sole parent, domestic purposes benefit – caring for sick or infirm, domestic purposes benefit – woman alone, emergency maintenance allowance. 4Includes community wage – sickness, community wage – emergency sickness and invalid's benefit. 5Includes transitional retirement benefit, community wage – training, community wage – emergency training, orphan's benefit and unsupported child benefit, widow's benefit, war pensions.
Basic income exemptions. For people receiving the invalid's benefit, the widow's benefit or the emergency maintenance allowance, and for people who are part-time work tested and receiving the domestic purposes benefit, the level of income support is reduced by 30 cents for every dollar earned between $80 and $180 a week. Every additional dollar of income above $180 a week reduces the benefit by 70 cents. For people receiving the unemployment benefit, the sickness benefit, the independent youth benefit or the transitional retirement benefit, and for non-qualified spouses of people receiving New Zealand Superannuation, each dollar of weekly income above $80 reduces the weekly rate of income support by 70 cents.
Unemployment benefit. The unemployment benefit replaced the community wage (job seeker) on 1 July 2001 and at the same time the unemployment benefit (in training) replaced the community wage (training). The community wage (job seeker) was paid to people who were unemployed, who were capable and willing to undertake full-time work and who had taken reasonable steps to obtain suitable employment. At 30 June 2001, 141,083 people were receiving the community wage (job seeker), 14,322 fewer than at 30 June 2000. People who were not full-time students but were engaged in full-time employment-related training programmes were eligible for the community wage (training). At 30 June 2001, 3,766 people were receiving the community wage (training), 11 more than at 30 June 2000.
Table 7.1. Income support weekly rates at 1 April 2001
| Type of income support | Net weekly payment |
|---|---|
1On 1 July 2001 unemployment benefit replaced community wage (job seeker) and community wage (training); and sickness benefit replaced community wage (sickness). Source: Ministry of Social Development | |
| $ | |
| Unemployment benefit/sickness benefit1(granted on or after 1 July 1998) | |
| Without children: | |
| Single 18–19 years old, at home | 103.03 |
| Single 18–19 years old, away from home | 128.79 |
| Single 20–24 years old | 128.79 |
| Single 25 and over | 154.56 |
| Married couple (each partner) | 128.79 |
| With children: | |
| Single (1 child) | 221.37 |
| Single (2 children or more) | 241.51 |
| Married couple with child(ren) (each partner) | 136.86 |
| Sickness benefit1(granted before 1 July 1998) | |
| Without children: | |
| Single 18–24 years old | 147.34 |
| Single 25 and over | 154.56 |
| Married couple (each partner) | 139.54 |
| With children: | |
| Single (1 child) | 221.37 |
| Single (2 children or more) | 241.51 |
| Married couple (each partner) | 139.54 |
| Invalid's and transitional retirement benefit | |
| Without children: | |
| Single 16–17 years old | 156.33 |
| Single 18 and over | 193.18 |
| Married couple (each partner) | 160.99 |
| With children: | |
| Single (1 child) | 253.78 |
| Single (2 children or more) | 272.52 |
| Married couple with child(ren) (total) | 321.98 |
| Married couple (each partner) | 160.99 |
| Widow's and domestic purposes benefit | |
| Women alone/single adult | 160.99 |
| Sole parent (1 child) | 221.37 |
| Sole parent (2 children or more) | 241.51 |
| Domiciliary care domestic purposes benefit for caregivers | |
| Single 16–17 years old | 156.33 |
| Single 18 and over | 193.18 |
| Sole parent (1 child) | 253.78 |
| Sole parent (2 children or more) | 272.52 |
| Half married rate | 160.99 |
| Orphan's and unsupported child benefit | |
| Under 5 years | 75.10 |
| 5–9 years old | 91.21 |
| 10–13 years old | 99.26 |
| 14 and over | 107.31 |
| Independent youth benefit | |
| Single 16–17 years old | 128.79 |
| New Zealand Superannuation and veteran's pension | |
| Single living alone | 234.53 |
| Single sharing | 216.49 |
| Married person | 180.41 |
| Married couple: both qualify (total) | 360.82 |
| Married couple: non-qualifying spouse (each partner) | 172.01 |

A Work and Income staff member helps a job seeker use on-line services.
Figure 7.3 compares quarterly numbers of unemployed people from the Household Labour Force Survey with quarterly averages of numbers of people receiving the community wage.
Figure 7.3. Average number in quarter receiving community wage compared with quarterly averages of HLFS unemployed, 1995–2001
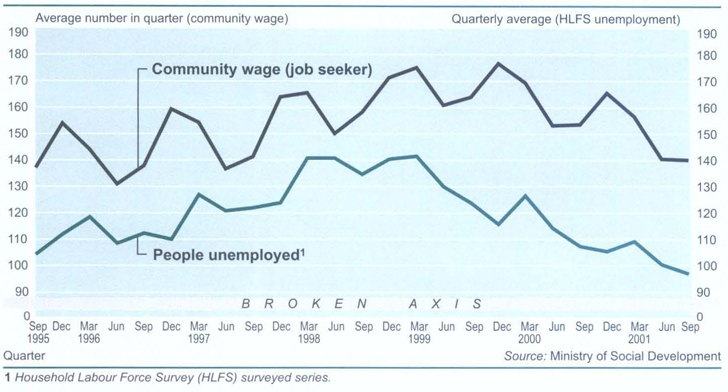
Domestic purposes benefit. The domestic purposes benefit is paid to parents caring for children without the support of partners, to people caring at home for someone who would otherwise be hospitalised and, in some circumstances, to older women living alone. At 30 June 2001, 109,121 people were receiving the benefit, 573 fewer than at 30 June 2000.
Widow's benefit. The widow's benefit is paid to women whose husbands or de facto partners have died. At 30 June 2001, 8,944 people were receiving the benefit, 204 fewer than at 30 June 2000.
Invalid's benefit. The invalid's benefit is paid to people 16 years and over who are either totally blind or are permanently and severely restricted in their capacity for work due to a disability. At 30 June 2001, 59,908 people were receiving the benefit, 4,480 more than at 30 June 2000.
Sickness benefit. The sickness benefit is paid to people over the age of 18 who suffer loss of earnings as a result of being temporarily incapacitated for work. The sickness benefit replaced the community wage (sickness) on 1 July 2001. At 30 June 2001, 33,620 people were receiving the community wage (sickness), 1,326 more than at 30 June 2000.
Table 7.2 shows recent annual expenditure on income support and pensions, and table 7.3 lists numbers of income support benefits and pensions from 1940 to 2001.
Family support. Family support is provided to people with dependent children who meet income eligibility requirements. It is paid to income earners through taxation (see Chapter 28: Public Sector Finance), but is delivered to people receiving income support through payments by Work and Income.
Childcare subsidy. The childcare subsidy provides financial assistance to low-income families with dependent children under five years to obtain access to preschool childcare services. In the year to 30 June 2001, there were 43,708 approved applications for subsidies, 2,257 fewer than in the year to 30 June 2000.
OSCAR subsidy. The OSCAR (Out of School Care and Recreation) subsidy provides financial assistance to low-income families with dependent children aged 5 to 13 to help with costs of care before and after school. In the year ended 30 June 2000, 7,810 subsidies were granted.
Orphan's and unsupported child benefits. The orphan's benefit and the unsupported child benefit are paid to people caring for an orphan or an unsupported child. As at 30 June 2001, 6,109 people were receiving one of the benefits, 303 more than at 30 June 2000.
Child disability allowance. The child disability allowance is a non-taxable allowance paid to the parent or guardian of a seriously physically or mentally disabled child being cared for at home. There were 21,512 children receiving the allowance at 30 June 2001, 648 more than at 30 June 2000. There were 5,748 new applications for the allowance granted in the year ending 30 June 2001, an increase of 1,297 on new applications in the previous year.
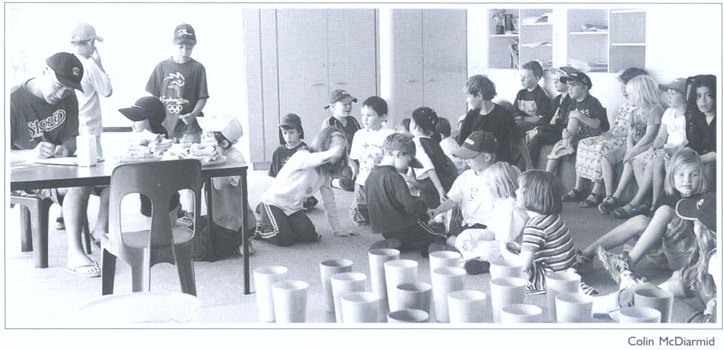
The Out of School Care And Recreation subsidy (OSCAR) provides working families with affordable childcare.
Disability’ allowance. The disability allowance is an income-tested allowance paid to people with special costs arising from a disability or personal health need. As at 30 June 2001, there were 195,743 allowances being paid, 11,575 more than at 30 June 2000.
Community services card. The community services card is an entitlement card that people on low to middle income can use to reduce the cost of doctors’ fees and prescription charges. As at 30 June 2001, there were 1,128,600 cardholders, 7,228 more than at 30 June 2000.
Special benefit. The special benefit is short-term assistance for people who have on-going expenses related to special or unusual circumstances or financial commitments. At 30 June 2001, 13,083 people were receiving the benefit, 2,330 more than at 30 June 2000.
Advance payment of benefits. Advance payment of income support is available to all income support clients to assist them to meet essential needs which they would otherwise be unable to meet. In the year ending 30 June 2001, 294,755 advance payments were granted. 26,588 fewer than in the previous year.
Training incentive allowance. The training incentive allowance helps meet costs associated with attending recognised occupational or work-related courses which provide specific work skills. It is available to people receiving the widow's, invalid's or domestic purposes benefits.
Payment while in hospital. Income support clients with no dependent children receive income support at the current rate for the first 13 weeks of hospitalisation. Thereafter they receive a reduced rate. The benefit rate is not reduced for clients with dependent children.
Continuation of benefit after death. Certain benefits and pensions may be paid for four weeks following a client's death.
Special needs grant. A special needs grant is a one-off payment made in an emergency situation where the need cannot be met in any other way and where the person has insufficient financial resources to meet the need. For the year ending 30 June 2001, 383,704 grants were made, an increase of 22,338 on the previous year. See table 7.4 for more details.
Child support. Responsibility for the collection of child support payments from non-custodial parents rests with the Inland Revenue Department, which aims to ensure that parents contribute to the support of their children according to their capacity to provide (see Chapter 28: Public Sector Finance).
At 31 March 2002, the New Zealand Superannuation scheme provided $234.53 a week for a single person living alone and $360.82 a week for a married couple (or $344.02 if one spouse did not qualify). Payments are subject to normal taxation. At 30 June 2001, there were 426,319 people receiving New Zealand Superannuation. The qualifying age for New Zealand Superannuation has been raised incrementally since 1994, and reached 65 years on 1 April 2001. People who wish to supplement the New Zealand Superannuation they will receive when they retire may contribute to private superannuation or insurance schemes. Private superannuation and insurance is described in more detail in Chapter 24: Commerce and Services.
Transitional retirement benefit. The transitional retirement benefit helps those adversely affected by the increase (from 60 to 65 years) in the qualifying age for New Zealand Superannuation. It was introduced on 1 April 1994. At 30 June 2001, there were 9.072 people receiving a benefit, 205 more than at 30 June 2000.
Vote: Veterans’ Affairs – Work and Income provides for payment of pensions and concessions for those who served in World War I and II, Korea, Malaya, Vietnam, the Gulf, Angola, Bosnia, Sierra Leone and East Timor. It also includes routine military service in New Zealand prior to 1 April 1974. Since then, service personnel have been covered under accident compensation provisions. The War Pensions Act 1954 is administered by the Secretary for War Pensions, who is also Director of Veterans’ Affairs New Zealand. Processing and payment of war pensions is carried out by Work and Income on behalf of the secretary. Decisions on eligibility for war pensions are made by war pensions claims panels, acting under delegation from the secretary. Each claims panel consists of a nominee from the Royal New Zealand Returned Services Association (RNZRSA) and an employee of Veterans’ Affairs New Zealand. Table 7.5 shows the number and value of war pensions in force in 2000.
Table 7.5. War pensions at 30 June 2000
| Type of pension | Number in force | Annual value1 |
|---|---|---|
1The annual values have been calculated from the amount being paid in the fortnight ended 30 June, multiplied by 26. Pension payments are relatively constant throughout the year: 2Disablement and dependant's pensions for police are recorded under police pensions. 3Includes five special annuities and two Section 55 pensions. Source: Ministry of Social Development | ||
| $(000) | ||
| Disablement pension2 | 19,609 | 64,043 |
| Dependant's pension2 | 4,287 | 24,272 |
| Police | 29 | 101 |
| Other (special annuities)3 | 7 | 52 |
Veteran's pension. The veteran's pension is paid at the same rate as New Zealand Superannuation and, like superannuation, is taxable. At 30 June 2001, 7,195 people were receiving the pension, 122 more than at 30 June 2000.
War disablement pension. The war disablement pension provides tax-free compensation for people who served in the armed forces and who suffer from a disability or disabilities related to that service. At 30 June 2000, 19,609 pensions were in force. Approximately 85 percent of those receiving the pension served in World War II.
Other war pension provisions. The war pensions programme can also provide additional allowances and concessions, including an additional pension for severe disablement, clothing allowance, travelling allowance, attendance allowance and allowances for dependants. War pensions are increasingly related to the ageing sector of the population and have remained constant in recent years. At 30 June 2001, 23,599 war pensions were in force, 521 fewer than at 30 June 2000.
New Zealand has overseas social security agreements with Australia, Canada, Denmark, Greece, Ireland, Jersey and Guernsey, the Netherlands and the United Kingdom. Main purpose of the agreements is to encourage free movement of labour and to ensure that when a person has lived or worked in more than one country, each of those countries takes a fair share of responsibility for meeting the costs of that person's social security coverage. The agreements are becoming part of the basic infrastructure of the global village, enabling people to move about the world, for short or long periods, either to work or to be with family, without jeopardising their social security coverage. By entering into such agreements, New Zealand is better able to attract skills, specialist knowledge and technical know-how from overseas. A widening network of agreements also provides more options for New Zealanders who wish to live overseas in their retirement.
Australia. Under the 1994 Social Security Agreement between New Zealand and Australia, invalids. widows, sole parents and the aged who have lived in one country for 10 years or more are entitled to that country's pensions and income support services, subject to certain conditions. New Zealand and Australia reimburse each other for pensions and income support paid to former residents with less than 10 years’ residence in the country where the service is paid. Australian age pensions and New Zealand Superannuation are reimbursable for the lifetime of the pension. A revised agreement relating to New Zealand Superannuation and the invalid's benefit (severe disablement) was implemented on 1 July 2002 and means New Zealand pays those entitled in Australia directly (and Australia pays its entitlements in New Zealand).
Greece. New Zealand Superannuation, the veteran's pension, the funeral grant, the orphan's benefit, the widow's benefit, the invalid's benefit and domestic purposes benefits for women living alone are paid to former New Zealand residents living in Greece. Rates of payment vary according to the period of the person's residence in New Zealand. Analogous Greek pensions are paid to people living in New Zealand who have contributed to the Greek social security scheme.
The Netherlands. New Zealand Superannuation, the veteran's pension, the widow's benefit, the invalid's benefit and domestic purposes benefits for women living alone are paid to former New Zealand residents living in the Netherlands. Rates of payment vary according to the period of the person's residence in New Zealand. Analogous Netherlands pensions are paid to people living in New Zealand who have contributed to the Netherlands social security scheme. Since 1 July 2002, a special banking option has been available to pensioners from the Netherlands living in New Zealand. Under the option, pensioners agree to have their Netherlands pensions paid into bank accounts accessible only by Work and Income. In return, the pensioners receive the full rate of corresponding New Zealand pensions or benefits.
Republic of Ireland. New Zealand Superannuation, the veteran's pension, the orphan's benefit, the widow's benefit, the invalid's benefit and domestic purposes benefits for women living alone are paid to former New Zealand residents living in Ireland. Rates of payment vary according to the period of the person's residence in New Zealand. Analogous Irish pensions are paid to people living in New Zealand who have contributed to the Irish social security scheme. The social security agreement between New Zealand and Ireland is under review.
United Kingdom. New Zealand's Social Security (Reciprocity With United Kingdom) Order 1990 provides for reciprocity in a comprehensive range of benefits. Since 1 April 1996, pensions have been paid directly to United Kingdom pensioners. A special banking option for United Kingdom pensioners living in New Zealand was introduced on 1 April 1997. People who take up this option consent to have their United Kingdom pensions paid to a bank account accessible only by Work and Income. In return, pensioners receive the full rate of New Zealand benefits or pensions. About 33,000 British pensioners live in New Zealand and approximately 23,000 of them have taken up the special banking option.
Jersey and Guernsey. New Zealand Superannuation, the veteran's pension, the widow's benefit, the invalid's benefit and the domestic purposes benefit for women living alone are paid to former New Zealand residents living in Jersey or Guernsey. Rates of payment vary according to the period of the person's residence in New Zealand. Analogous Jersey and Guernsey pensions are paid to people living in New Zealand who have contributed to the Jersey and Guernsey social security schemes. The social security agreement between the countries is under review.
Canada. New Zealand Superannuation, the veteran's pension, the widow's benefit, the invalid's benefit and the domestic purposes benefit for women living alone are paid to former New Zealand residents living in Canada. Rates of payment vary according to the period of the person's residence in New Zealand. Analogous Canadian pensions are paid to people living in New Zealand who have contributed to the Canadian social security scheme.
Denmark. New Zealand Superannuation, the veteran's pension, the widow's benefit and the domestic purposes benefit for women living alone are paid to former New Zealand residents living in Denmark. Rates of payment vary according to the period of the person's residence in New Zealand. Analogous Danish pensions are paid to people living in New Zealand who have lived in Denmark, or who have contributed to the Danish social security scheme.
General portability. People receiving New Zealand Superannuation or the veteran's pension receive 50 percent of their income support while living overseas. They must be ordinarily resident in New Zealand on the date of application and not be intending to live for more than 26 weeks in a country that has a social security agreement with New Zealand.
Special portability arrangement. People eligible for New Zealand Superannuation or the veteran's pension may receive up to 100 percent of the core level of income support while living in certain Pacific countries. A condition of the arrangement is that those receiving income support were ordinarily resident in New Zealand on the date of application and were intending to live in one of those Pacific countries for more than 52 weeks. Rates of payment vary according to the period of the person's residence in New Zealand. Successful applicants who have lived in New Zealand for 20 years receive income support at 100 percent of the level paid in New Zealand. Countries in which the special portability arrangement applies are: American Samoa, Cook Islands, Federated States of Micronesia, Fiji, French Polynesia, Guam, Kiribati, Marshall Islands, Nauru, New Caledonia, Niue, Northern Mariana Islands, Palau, Papua New Guinea, Pitcairn Island, Samoa, Solomon Islands, Tokelau, Tonga, Tuvalu, Vanuatu, Wallis and Futuna.
The Department of Child, Youth and Family Services was established on 1 October 1999 following integration of two Department of Social Welfare business units, the Children, Young Persons and Their Families Service and the New Zealand Community Funding Agency. The department has statutory responsibility for children and young people whose family circumstances put them at risk of abuse and neglect, offending behaviour or poor life outcomes. The department's roles are defined in the Children, Young Persons and Their Families Act 1989, the Adoption Act 1955, the Adult Adoption Information Act 1985, the Adoption (Inter-country) Act 1997 and the Guardianship Act 1968. The department provides direct services for children and young people in need of care and protection, for those who have committed offences and for those involved in adoption processes. The department also approves, and contracts with community organisations, social services for children, young people and their families.
A woman enjoys quality time with her grandchild.
Table 7.6 shows the number of care and protection notifications received and the number assessed as requiring further investigation and action by a social worker. All cases accepted for investigation are assigned a criticality rating, or response category, at time of intake. In the 2000/01 financial year, 26,707 notifications involving children and young people under the age of 17 were received, of which 22,868 required further investigation. After investigation, findings are classified and recorded under the categories of physical abuse, sexual abuse, emotional abuse, neglect, self-harm behaviour, problem behaviour/relationship difficulty, or abuse not found.
Table 7.6. Breakdown of care and protection notifications for the years 1996–2001
| 1996/97 | 1997/98 | 1998/99 | 1999/00 | 2000/01 | |
|---|---|---|---|---|---|
| Source: Department of Child, Youth and Family Services | |||||
| Care and protection notifications received | 23,246 | 23.652 | 27,218 | 26,588 | 26,707 |
| C&P notifications for further investigation | 18,467 | 18,252 | 21,930 | 21,983 | 22,868 |
| Critical – immediate response time (same day) | 2,585 | 2,659 | 3,481 | 3,311 | 2,880 |
| Very urgent (same day + one calendar day) | 1,976 | 1,976 | 2,593 | 2,601 | 2,191 |
| Urgent (same day + six calendar days) | 7,645 | 7,221 | 9,291 | 9,840 | 11,180 |
| Low urgency (same day + 27 calendar days) | 6,184 | 6,610 | 6,702 | 6,212 | 6,556 |
Table 7.7 lists investigation findings for these categories from 1996/97 to 2000/01. There was a small decrease in notifications in 2000/01 and a slight increase in the number of ‘abuse not found’ cases. When, on investigation, it is decided that the Department of Child, Youth and Family Services needs to remain involved with a child or family, direct services may be provided through family/ whanau agreements, care agreements, family group conference plans or court plans.
Table 7.7. Abuse and neglect notifications – investigation findings ages 0–171
| Fiscal year | Sexual abuse | Physical abuse | Emotional abuse | Neglect | Behavioural/relation-ship problems | Self-harm/ suicidal | Abuse not found | Total |
|---|---|---|---|---|---|---|---|---|
1Some investigations where a notification was received for 2000/01 may still be awaiting a folding at the time this data was extracted. Source: Department of Child Youth and Family Services | ||||||||
| 1996/97 | 1,804 | 1,868 | 1,077 | 2,693 | 4,058 | 111 | 6,782 | 18,393 |
| 1997/98 | 1,502 | 1,671 | 1,080 | 2,356 | 3,856 | 119 | 6,937 | 17,521 |
| 1998/99 | 1,375 | 1,660 | 1,414 | 2,260 | 4,088 | 115 | 9,543 | 20,455 |
| 1999/00 | 1,223 | 2,208 | 2,303 | 2,939 | 3,685 | 145 | 9,787 | 22,290 |
| 2000/01 | 827 | 1,567 | 1,576 | 2,189 | 2,626 | 89 | 11,433 | 20,307 |
Family/whanau agreements. A family/whanau agreement provides social services to a child and its family to ensure the care and protection needs of the child are addressed. Table 7.8 shows numbers of agreements signed from 1995/96 to 2000/01. Family/whanau agreements are negotiated by a social worker when a family agrees there is a problem to address and agrees voluntarily to intervention. The emphasis of intervention is on working with the family/whanau. Such an agreement may be in force for up to three months, must be formally reviewed, and may be renewed for one further three-month period. When a family/whanau agreement is not considered to be appropriate, intervention may occur through a statutorily defined process of a family group conference.
Table 7.8. Family/whanau agreements (FWAs)
| 1995/96 | 1996/97 | 1997/98 | 1998/99 | 1999/00 | 2000/01 | |
|---|---|---|---|---|---|---|
| Source: Department of Child. Youth and Family Services | ||||||
| Number of FWAs signed | 3,204 | 2,137 | 2,051 | 2,762 | 2,555 | 2,305 |
Management of care and protection plans. The Children, Young Persons and Their Families Act 1989 provides for a range of plans, agreements and orders relating to the care, custody and guardianship of children and young people. The Department of Child, Youth and Family Services uses these plans to provide care for the children while working towards their return to parents, family or whanau. Examples of the plans and orders are custody orders, plans resulting from family group conferences, counselling orders and support orders. Table 7.9 lists plans completed and in force in 1999/2000 and 2000/01.
Table 7.9. Management of care and protection plans and court plans
| Plans and orders per section of the act | Completed during year | In force during year | ||
|---|---|---|---|---|
| 1999/2000 | 2000/2001 | 1999/2000 | 2000/2001 | |
| Source: Department of Child, Youth and Family Services | ||||
| FGC plans s29 | 2,336 | 2,427 | 1,488 | 1,775 |
| Counselling order s74 | 3 | 3 | 11 | 22 |
| Custody pending determination s78 | 712 | 726 | 339 | 1,022 |
| Service order s86 | 87 | 137 | 545 | 550 |
| Restraining order s87 | 28 | 48 | 196 | 222 |
| Interim restraining order s88 | 64 | 35 | 52 | 69 |
| Support order s91 | 131 | 253 | 431 | 648 |
| Interim support order s92 | 21 | 25 | 7 | 23 |
| Custody order s101 | 241 | 640 | 2,301 | 3,307 |
| Interim custody order s102 | 117 | 81 | 78 | 123 |
| Guardianship order – sole s110(2a) | 45 | 98 | 343 | 270 |
| Guardianship order – additional s110(2b) | 94 | 268 | 1,285 | 1,730 |
| Temporary care agreement s139 | 66 | 25 | 13 | 940 |
| Extended care agreement s140 | 217 | 123 | 3 | 90 |
| Extended care agreement disabled s141 | 34 | 8 | 2 | 9 |
| Care for moderate disability s142 | 1 | 0 | 0 | 1 |
| Total | 4,197 | 4,897 | 7,094 | 10,801 |
Emergency actions. The Children, Young Persons and Their Families Act 1989 provides measures for securing the safety of a child through warrant action by social workers or the police, or through temporary care agreements with parents, to provide immediate care for a child while longer-term solutions are explored.
Care services. Two main placement options are used in New Zealand for children and young people requiring alternative care. These are either based in a home (extended family, caregivers, family home, special purpose family home, specialist or group homes) or in a residential care centre (short or extended-term local or national residences).
International research indicates that family-based placements are more effective than other forms of placement. Children and young people are more likely to return to their usual caregivers, and are less likely to be re-abused, if they are placed in family-based care rather than non kin-based care.
The Children, Young Persons and Their Families Act 1989 shifted the emphasis away from longer-term, extended-care placements towards restoring usual caregiving arrangements. When alternative placements are necessary, emphasis is put on making a placement, whenever possible, within the child's extended family or community.
Home-based care. There were 2,458 children in out-of-family care and 1,194 in in-family care at 30 June 2000. By 30 June 2001, there were 2,662 in out-of-family care and 1,299 in in-family care.
Residential care. The Department of Child, Youth and Family Services provides residential care services in Auckland, Hamilton, Palmerston North, Lower Hutt, Christchurch and Dunedin. New facilities have been established at Palmerston North, Lower Hutt and Christchurch since 1999. Further facilities are required to replace out-of-date residences at Auckland and Christchurch. A key element of residential services strategy is separation of youth justice facilities from care and protection residential facilities and campuses. The department's medium-term strategy is to increase its residential care capacity from 100 to 166 beds, with completion scheduled for 2004. Table 7.10 shows annual admissions to national residences.
Youth justice services provided by the Department of Child, Youth and Family Services under the Children, Young Persons and Their Families Act 1989 and the Criminal Justice Act 1985 include:
Working with police to find options, and to ensure that cases are brought into the formal system only when public interest and/or safety is an issue.
Providing programmes and services targeted at youth at risk of offending, re-offending, or those with poor life outcomes. These include young people with conduct disorders, serious and repeat youth offenders, young sex abusers, young people with difficult-to-manage behaviour and those at risk of self harm.
Providing appropriate placements for young people who have been arrested.
Providing custodial services.
Youth justice family group conferences. Family group conferences (FGCs) are convened to address the offending behaviour of children and young people. They bring together, in a statutory-defined forum, members of the offender's family or whanau, law enforcement officers and victims to agree how the young offender will be held accountable, and to agree on appropriate intervention plans.
Management of youth justice plans. Table 7.11 shows that family group conference plans predominate over court plans as a means of managing young people who come to the notice of the Department of Child, Youth and Family Services through the youth justice provisions of the Children, Young Persons and Their Families Act 1989. FGCs encourage participation in the resolution of care and protection issues and often avoid the need for court involvement. Plans formulated by a family group conference must be reviewed by reconvening the conference or by a less formal process.
Table 7.11. Management of youth justice family group conference plans and court plans
| Plans and orders | Completed during year | |
|---|---|---|
| 1999/2000 | 2000/2001 | |
| Source: Department of Child, Youth and Family Services | ||
| Family group conference plans | 3.645 | 3,970 |
| Supervision order s283(k) | 495 | 442 |
| Community work order s298 | 119 | 118 |
| Supervision with activity order s307 | 151 | 123 |
| Supervision with residence order s311 | 125 | 122 |
| Total | 4,535 | 4,775 |
The adoption information and services unit of the Department of Child, Youth and Family Services is responsible for statutory adoption services. The department's local and inter-country adoption services include education, preparation and assessment of prospective adoptive applicants, counselling of birthparents, approval of placements, supervision and reporting to the New Zealand Family Court. Post-adoption services for birth and adoptive families are provided when requested, or referrals made.
Adult adoption information services include provision of information, pre and post-reunion counselling, including those receiving copies of their original birth certificate, and mediation to birthparents and adult adopted people. In the year to 30 June 2001, 195 adult adopted people applied for copies of personal information held on their adoption file. A further 741 requests were made for non-identifying information from adoption files under provisions of the Official Information Act.
Table 7.12 shows numbers of people accessing adoption information from 1993/94 to 2000/01, while table 7.13 shows adoptions by New Zealand citizens.
Table 7.12. Access to adoption information
| 1993/94 | 1994/95 | 1995/96 | 1996/97 | 1997/98 | 1998/99 | 1999/00 | 2000/01 | |
|---|---|---|---|---|---|---|---|---|
| Sources: Adoption Information and Services Unit, Department of Child. Youth and Family: Registrar General's Office, Department of Internal Affairs | ||||||||
| Original birth certificates issued to adopted people | 1,849 | 1,597 | 1,580 | 1,925 | 1,446 | 1,356 | 1,230 | 1,030 |
| Original vetoes from adopted people | 26 | 36 | 17 | 30 | 22 | 8 | 1 | 4 |
| Renewal vetoes from adopted people | 0 | 051 | 13 | 4 | 5 | 6 | 8 | |
| Cancelled vetoes from adopted people | 14 | 8 | 17 | 0 | 2 | 3 | 5 | 1 |
| Birthparent applications for identifying information (section 8) | 717 | 610 | 650 | 534 | 450 | 392 | 325 | 303 |
| Original vetoes from birthparents | 34 | 69 | 126 | 60 | 22 | 15 | 4 | 2 |
| Renewal vetoes from birthparents | 0 | 0 | 351 | 77 | 19 | 11 | 13 | 13 |
| Cancelled vetoes from birthparents | 15 | 14 | 10 | 2 | 6 | 1 | 1 | 1 |
Table 7.13. Adoptions by New Zealand citizens
| 1993/94 | 1994/95 | 1995/96 | 1996/97 | 1997/98 | 1998/99 | 1999/00 | 2000/01 | |
|---|---|---|---|---|---|---|---|---|
1This figure was previously reported as 518 in error. That figure represented the number of applications received by the cowl, not the number of final orders. From fiscal year 1999 this figure is based on the adoption registrations created in that period, by the Births. Deaths and Marriages section of the Department of internal Affairs. This information was previously collected by the Department of Justice. 2From fiscal year 1999 this figure is based on the adoption registrations created in that period by the Births. Deaths and Marriages section of the Department of internal Affairs. This information was previously collected by the Department of Justice. 3This category of adoption is no longer identified separately and is no longer reported – now included in the ‘strangers’ reporting figure. 4Detail not collected separately prior to 1996. 5Overseas adoptions that complied with Section 17 of the New Zealand Adoption Act 1955 or where the adoption was completed in an overseas court in accordance with the Hague Convention on Protection of Children and Cooperation in respect of Intercountry Adoption. Sources: Department of Child, Youth and Family: Citizens Office. Department of Internal Affairs | ||||||||
| Adoption of New Zealand children | 683 | 640 | 540 | 591 | 543 | 4111 | 3642 | 3192 |
| Non-relatives | 183 | 124 | 114 | 131 | 125 | 122 | 87 | 78 |
| One parent and spouse | 221 | 240 | 169 | 179 | 174 | 122 | 120 | 119 |
| Relatives | 151 | 146 | 177 | 163 | 116 | 111 | 117 | 104 |
| Close friends3 | 8 | 25 | 18 | ... | ... | ... | ... | ... |
| Foster parents | 24 | 12 | 6 | 28 | 13 | 15 | 8 | 9 |
| Adoption type not recorded | 96 | 93 | 56 | 90 | 115 | 41 | 32 | 9 |
| Adoption of foreign children | ... | 476 | 497 | 506 | 460 | 403 | 380 | 408 |
| In NZ Court to non-relatives4 | ... | ... | ... | 10 | 13 | 6 | 16 | 14 |
| In NZ Court to relatives4 | ... | ... | ... | 60 | 89 | 47 | 90 | 50 |
| In overseas Court by NZ citizen parents where the child has been registered as a NZ citizen5 | N/a | 476 | 497 | 436 | 358 | 350 | 274 | 344 |
| Total adoptions by New Zealand citizens | 683 | 1,116 | 1,037 | 1,097 | 1,003 | 814 | 744 | 727 |
Approval and contracting with not-for-profit providers. Up to 1,400 service providers are contracted each year by the Department of Child, Youth and Family Services to provide a variety of social services from non-department output classes such as child and youth support and rehabilitation; counselling and therapy; coordinated family services; family/whanau home-based support; family/ whanau life skill development; residential care; training in the Children, Young Persons and Their Families Act 1989; emergency accommodation; short-term supported accommodation; and general advice. The department is responsible for the allocation and management of funding and support to iwi and community-based social and welfare services in accordance with government policies and criteria. Table 7.14 shows Budget allocations for contracted social services in 2000/01.
Table 7.14. Non-departmental output class Budget allocation for 2000/01 year1
| 2000/01 | |
|---|---|
1The figures above are GST inclusive. Source: Department of Child, Youth and Family Services | |
| $000 | |
| Child and youth support and rehabilitation | 10,794 |
| Counselling/therapy | 15,071 |
| Coordinated family services | 8,970 |
| Family/whanau home-based support | 8,096 |
| Family/whanau life skills development | 10,788 |
| Residential care | 5,363 |
| Training in the Children, Young Persons and Their Families Act 1989 | 388 |
| Emergency accommodation and short-term support accommodation | 1,065 |
| General advice and information | 2,333 |
| Community housing | 94 |
| Refuge | 4,597 |
| Strengthening providers and communities | 3,686 |
| Industry training | |
| Support for the Industry Training Organisation | 686 |
| Total | 71,931 |
7.1 Ministry of Social Development.
7.2 Ministry of Social Development; Statistics New Zealand; Office of Veterans Affairs.
7.3 Department of Child, Youth and Family Services; Registrar General's Office, Department of Internal Affairs; Citizens Office.
Statistics New Zealand divisional manager responsible: Denise Brown.
Care Services Project: Summary, report and recommendations (1999). Department of Child, Youth and Family Services, Wellington.
Overview of benefit trends (1997). Department of Social Welfare, Wellington.
Report of the Department of Child, Youth and Family Services (Parl paper E. 70).
Report of the Office of the Retirement Commissioner (Parl paper E.62).
Statistics Report (annual). Ministry of Social Development, Wellington.
www.cyf.govt.nz – Adoption Information and Services Unit
www.cab.org.nz – Citizens Advice Bureaux
www.cyf.govt.nz – Department of Child, Youth and Family Services
www.dia.govt.nz – Department of Internal Affairs
www.msd.govt.nz – Ministry of Social Development
www.retirement.org.nz – Office of the Retirement Commissioner
www.sorted.org.nz – Office of the Retirement Commissioner (money management)
www.nzrsa.org.nz – Royal New Zealand Returned Services Association
www.winz.govt.nz – Work and Income
Table of Contents

A patient receives treatment in the accident and emergency unit of Wellington Hospital.
The New Zealand health system is made up of public, private and voluntary sectors which interact to provide and fund health care. More than 77 percent of health care is publicly funded.
The Ministry of Health is responsible for all aspects of health and disability policy advice; for monitoring standards and performance; for auditing and enforcing regulations; for reporting regularly on the status of health throughout New Zealand, including the achievement of health goals; and for funding the health and disability sector.
A new organisational design for the ministry was implemented on 1 January 2001 following the government's decision to integrate the functions of the Health Funding Authority (HFA) and the Ministry of Health. In implementing the new design, the government aimed to create a health and disability sector that would raise the health and independence of the population and reduce inequalities; meet the health and disability support needs of local communities; ensure more effective use of available resources; increase community involvement in decision making about health and disability support services; have a non-commercial, collaborative and accountable culture in the publicly-funded health sector; and ensure clear accountabilities.
The Ministry of Health consists of eight directorates, each led by a deputy director-general.
The sector policy directorate is responsible for providing strategic advice to the government across all aspects of the health and disability sector. Specific advice includes the long-term funding path, workforce strategy, regulatory and quality frameworks for health and disability, legislative priorities, structures for government funding/purchasing/ownership in the health sector, and health research strategies and policies.
The public health directorate is responsible for directing population health services and for regulating public health and safety. It also advises in other health policy areas which impact on population health.
The disability issues directorate provides advice to the Minister of Health on service issues specific to people with disabilities, on effective utilisation of the disability support budget and on implementation of the New Zealand Disability Strategy. Advice is also provided to the Minister Responsible for Disability Issues.
The mental health directorate is responsible for advice and issues management related to mental health. This includes advice on strategies, funding and sector development, and the monitoring of health sector performance in relation to mental health. The directorate is also responsible for implementation of the New Zealand Mental Health Strategy and for administration of mental health regulations.
The clinical services directorate is responsible for providing a focus within the ministry on clinical matters and is the key interface with health professionals and professional groups. The directorate is responsible for primary care development, strategic development of hospital services, development of disease management approaches that link primary and secondary services, the provision of policy advice on health services, and development of acute care and elective care initiatives.
The district health board funding and performance directorate is responsible for managing the Crown's funding and ownership interests in district health boards and Crown entities, and for managing transitional functions yet to be devolved to health boards. The directorate acts as the performance and accountability interface with boards, monitoring and advising board performance and working cooperatively with boards to encourage and facilitate improvements in service delivery. The directorate also provides advice on the strategic development of health boards in relation to capital investment, annual and strategic plans and national and regional collaborative projects.
The Māori health directorate provides policy advice on the government's strategy to reduce disparities in health status for Māori by increased responsiveness. The directorate works with other directorates to develop and strengthen services for Māori.
The corporate and information directorate provides support services to the Minister of Health and to the ministry. These services include communications, corporate and ministerial services. facilities management, financial management, human resources management, information technology and legal services. The directorate is also responsible for the collection, processing, maintenance, analysis and dissemination of health data, health statistics and health information.
Twenty-one district health boards were established throughout New Zealand when the functions of the Health Funding Authority were integrated with the functions of the Ministry of Health on 1 January 2001. The boards, established under the New Zealand Public Health and Disability Act 2000, have both a funding role (planning and funding health services for their populations) and a provider role (delivery of hospital and related services).
The statutory objectives of district health boards are to improve, promote and protect the health of communities, to promote integration of health services, especially primary and secondary care services, and to promote effective care or support of those in need of personal health services or disability support.
Boards also have the responsibility of promoting the independence, inclusion and participation in society of people with disabilities; of reducing health disparities by improving health outcomes for Māori and other population groups; and of reducing health outcome disparities between various population groups.
Boards are expected to show a sense of social responsibility, to foster community participation in health improvement, and to uphold the ethical and quality standards commonly expected of providers of services and public sector organisations.
The boards work with all health care provider organisations to ensure the provision of specified health services and balance each community's needs for health and disability services. Crown-owned public hospitals are the main providers of secondary health care services. Primary and community-based care comes from private/non-government owned providers such as general practitioners, Māori providers and disability support providers.
District health boards are Crown entities and have a majority of elected members, with some members appointed by the Minister of Health. Each board has three statutory advisory committees: a community and public health advisory committee, a disability support advisory committee and a hospital advisory committee. Each board has a separate operating charter and a set of accountabilities and reporting requirements.
The 21 district health boards (DHBs) are configured as follows:
| Name of DHB | Constituencies |
| Northland DHB | Far North, Whangarei, Kaipara |
| Waitemata DHB | Rodney, North Shore, Waitakere |
| Auckland DHB | Auckland North-west and Gulf, Auckland North-east, Auckland South |
| Counties Manukau DHB | Manukau, Mangere, Manurewa, Franklin, Papakura |
| Waikato DHB | Thames-Coromandel, Waikato, Hamilton, South Waikato |
| Bay of Plenty DHB | Western Bay of Plenty, Tauranga, Whakatane |
| Lakes DHB | Rotorua North, Rotorua South, Taupo |
| Tairawhiti DHB | Gisborne, Tairawhiti |
| Hawke's Bay DHB | Wairoa, Hastings, Napier-Chatham Islands, Central Hawke's Bay |
| Taranaki DHB | New Plymouth, Taranaki North, Taranaki South |
| Whanganui DHB | Wanganui, Waimarino, Rangitikei |
| Midcentral DHB | Manawatu, Palmerston North, Tararua, Horowhenua |
| Wairarapa DHB | Masterton, Carterton, South Wairarapa |
| Hutt DHB | Lower Hutt Central, Harbour, Wainuiomata |
| Capital and Coast DHB | Kapiti Coast, Porirua, and the north-western, Lambton, and south-eastern districts of Wellington City |
| Nelson-Marlborough DHB | Tasman, Richmond, Nelson, Marlborough, Blenheim |
| West Coast DHB | Buller, Grey, Westland |
| Canterbury DHB | North Canterbury, Christchurch, Mid-Canterbury |
| South Canterbury DHB | Timaru, Temuka-Pleasant Point, Mackenzie-Geraldine, Waimate |
| Otago DHB | Waitaki, Central Otago, Clutha, Dunedin North, Dunedin South |
| Southland DHB | Queenstown-Lakes, Southland, Gore, Invercargill |
Statutory and non-statutory functions undertaken by the Residual Health Management Unit are management of the historical debt of former area health boards, management of the boards’ residual assets such as long-term property leases, management of contingent legal liabilities of the former boards and assisting district health boards dispose of surplus property. In addition, the government has agreed that the unit should undertake the function of Crown financing agency for district health boards. This is essentially a banking role and will be the most significant of the unit's activities in the future. The unit will provide boards with term debt through a similar range of facilities as private sector banks.
National Advisory Committee on Health and Disability. The National Advisory Committee on Health and Disability (National Health Committee) advises the government on the quality and mix of public health, personal health and disability support services that should be publicly funded. It also provides independent public health policy advice to the minister, a role strengthened in the New Zealand Public Health and Disability Act 2000 by the requirement for the National Health Committee to establish a public health advisory committee. The National Health Committee seeks to ensure that maximum benefit is obtained from public funds for health care and public health services. The committee's website is www.nhc.govt.nz
National Advisory Committee on Health and Disability Support Services Ethics. The statutory functions of the National Advisory Committee on Health and Disability Support Services Ethics, established under the New Zealand Public Health and Disability Act 2000 and accountable to the Minister of Health, are to:
Provide advice to the Minister of Health on ethical issues of national significance in respect of any health and disability matter, including research and health services.
Determine nationally consistent ethical standards across the health sector and provide scrutiny for national health research and health services.
The committee is required to consult with the public, with people involved in the funding or provision of services and with other people the committee considers appropriate before providing advice on an issue, and, at least once a year, to deliver to the minister a report setting out its activities and summarising its advice on the matters referred to it.
Health Workforce Advisory Committee. The role of the Health Workforce Advisory Committee is to advise the Minister of Health on health workforce issues. The committee's key tasks are to:
Provide an independent assessment for the Minister of Health of current workforce capacity and foreseeable workforce needs to meet the objectives of the New Zealand Health and Disability Strategies.
Improving the health of New Zealanders  A low-impact swiss ball fitness class. The New Zealand Health Strategy, launched in December 2000, places particular emphasis on improving population health outcomes and reducing disparities between all New Zealanders, including Māori and Pacific peoples. The strategy, New Zealand's first, highlights 13 health objectives, chosen for the contribution they can make to improving the health status of New Zealanders and for reducing health inequalities. The short to medium-term objectives of the strategy are to:
Source: Ministry of Health |
Advise the minister on national goals for the health workforce and recommend strategies to develop appropriate workforce capacity.
Facilitate cooperation between organisations involved in health workforce education and training to ensure a strategic approach to health workforce supply, demand and development.
Report on the effectiveness of recommended strategies and identify required changes.
The Ministerial Advisory Committee on Complementary and Alternative Health. The role of the Ministerial Committee on Complementary and Alternative Health is to provide information and advice to the Minister of Health on complementary and alternative healthcare issues. The committee's key tasks are to:
Provide advice on how complementary and alternative healthcare can improve outcomes in priority areas signalled in the New Zealand Health Strategy.
Provide advice on the need to regulate complementary and alternative healthcare practitioners in order to protect consumers.
Provide advice on consumer information needs and, in particular, advice on the benefits, risks and costs of complementary and alternative therapies.
Review overseas evidence-based research and identify priorities for the development of New Zealand evidence-based research on the safety and efficacy of specific complementary and alternative therapies, and support the development of guidelines.
Provide advice on whether, and how, specified complementary and alternative health practitioners should be integrated into the mainstream health system.
The New Zealand Blood Service (NZBS) was created on 1 July 1998 to ensure the supply of safe blood and blood products, and with responsibility for the development of an integrated national blood transfusion service for New Zealand. NZBS is responsible for all aspects of the transfusion process, from the collection of blood from volunteer donors to the transfusion of blood products within the hospital environment – ‘vein to vein’ transfusion.
Health Research Council of New Zealand. The Health Research Council of New Zealand (HRC) was established under the Health Research Council Act 1990 and is the major government agency purchasing and coordinating health research in New Zealand. The act requires the council to set guidelines for health research ethics and to accredit regional ethics committees. The HRC is also responsible for advising the Ministry of Health on the scientific merit of gene therapy proposals and clinical trials. The council's mission is to improve human health by promoting and purchasing health research. The council purchases a broad spectrum of research, including biomedical, public health, Māori and Pacific peoples’ health, and clinical research. HRC funding is largely allocated through Vote: Research, Science and Technology, with funding for ethics policy advice coming from Vote: Health. Government funding for the council's work in 2001/2002 was $44.8 million. The HRC website is www.hrc.govt.nz
The Malaghan Institute of Medical Research. The Malaghan Institute of Medical Research was established in 1979 as an independent medical research institute (formerly known as the Wellington Cancer and Medical Research Foundation). It was renamed in 1986 to recognise the contribution of Len and Ann Malaghan. The institute is a charitable trust with the goals of improving the prevention and treatment of disease and disseminating and teaching that knowledge. It has 40 full-time staff and is based at the Wellington School of Medicine (see sidebar). Diseases studied at the Malaghan Institute include asthma, cancer, multiple sclerosis and human immunology and haematology. The institute collaborates with research groups, both nationally and internationally. A major focus of the institute is on the provision of quality postgraduate (PhD) degrees through the Wellington School of Medicine (University of Otago). It is funded by contestable research grants and by contributions from corporate sponsors, bequests and donations.
Health expenditure (public) in New Zealand amounted to an estimated $6.490 billion for the financial year ended 30 June 1999, the most recent estimates available (see table 8.1). This represented 6.5 percent of New Zealand's gross domestic income and was equivalent to $1,705 per head of population.
Table 8.1. Health expenditure1
| 90/91 | 91/92 | 92/93 | 93/94 | 94/95 | 95/96 | 96/97 | 97/98 | 98/99 | |
|---|---|---|---|---|---|---|---|---|---|
1CPI-deflated, non-health items excluded. June years. 2Expressed in 1998–99 dollars. Source: Health Expenditure Trends in New Zealand 1980–1999 | |||||||||
| $(million)2 | |||||||||
| Public | 5,055 | 5,039 | 4,996 | 5,350 | 5,489 | 5,534 | 5,843 | 6,208 | 6,490 |
| Private | 1,092 | 1,337 | 1,523 | 1,551 | 1,624 | 1,683 | 1,717 | 1,851 | 1,886 |
| Total | 6,146 | 6,376 | 6,520 | 6,902 | 7,112 | 7,218 | 7,560 | 8,059 | 8,376 |
The health service workforce is made up of a large number of professions and occupations. Some require lengthy tertiary education with enrolled entry to the profession, and others have no formal training requirements. Existing occupational regulatory statutes will be repealed and replaced by new legislation, but separate registering authorities will be retained for each professional group. There will be a process in the legislation for regulation of new professions where there is a risk of harm to the public, or it is otherwise in the public interest.
Doctors. The Medical Council of New Zealand is a statutory body operating under the Medical Practitioners Act 1995. The council works to protect the health and safety of the public by ensuring that doctors are competent to practise medicine. The council has 10 members and includes public participation. The main functions of the council are:
Registration – The council registers all doctors working in New Zealand. Doctors who complete medical training outside New Zealand or Australia must show they meet set standards by examination and/or assessment before registration is granted. Doctors with higher training are vocationally registered in recognised branches of medicine.
Medical education – This involves accreditation of medical school courses and curriculums and, in association with the Australian Medical Council, accreditation of Australasian medical schools. The council approves posts for the education, training and experience of interns in their seventh year, the mandatory period before general registration. In addition, it promotes vocational and continuing medical education in New Zealand.
Fitness to practise – The council manages doctors who, because of some mental or physical health problem, may not be fit to practise.
Professional standards – Legislation provides for the council to review competency of doctors and to implement remediation as appropriate, including, if necessary, imposing conditions on annual practising certificates or registration.
Discipline – The act establishes a Medical Practitioners’ Disciplinary Tribunal, an autonomous body separate from the medical council. The medical council does, however, receive complaints and must liaise with the Health and Disability Commissioner and, as appropriate, appoint complaints assessment committees.
The number of registered medical practitioners at 31 March 2001 was 12,505, (down 389 on the 31 March 1999 figure) of whom 8,738 (down 559) held annual practising certificates. A further 646 (466 in 1999) overseas-trained doctors were working on temporary registration.
Dentists. The Dental Council is governed by the Dental Act 1988. It registers dentists, promotes high standards of professional education and conduct among dentists, and provides administration services for the Dentists’ Disciplinary Tribunal. The number of dentists on the register at 30 June 2001 was 2,318, an increase of 148 on the June 1999 figure. The Dental Act 1988 provides for a disciplinary structure, with an independent complaints assessment committee (CAC) and the tribunal comprising both dentists and lay members. From inception of disciplinary procedures in 1988 to 31 March 2001, the Dental Council referred 156 written complaints against registered dentists to the CAC. Of these, 85 complaints were closed after CAC investigation, four complaints were under investigation, 48 complaints were heard by the tribunal, two complaints were awaiting hearing by the tribunal, nine complaints were withdrawn by the complainant during CAC investigation, six complaints were withdrawn by the complainant at the tribunal hearing, one dentist was not fit to plead before the tribunal, and one file sent to the tribunal was withdrawn and closed by the CAC. The Health and Disability Commissioner is now the primary vehicle for dealing with complaints about dentists. All complaints against a dentist regarding events which occurred after 1 July 1996 are referred to the commissioner, who is concerned with breaches of the Code of Consumers’ Rights. Any matters that do not breach the code but nevertheless may require professional disciplinary action are still referred to the CAC for investigation. Professional dental studies are provided at the School of Dentistry, University of Otago.
Nurses and midwives. The Nursing Council of New Zealand: Te Kaunihera Tapuhi o Aotearoa is constituted under the Nurses Act 1977. Its primary function is the registration of nurses and midwives and enrolment of enrolled nurses. The council sets minimum standards for registration and enrolment; sets standards for, and monitors, programmes leading to registration and enrolment; conducts examinations; approves programmes of nursing and midwifery; issues annual practising certificates; and exercises disciplinary powers. It also maintains a register of comprehensive, general, general and obstetric, psychiatric, psychopaedic nurses, midwives and a roll for enrolled nurses. As at 31 March, 2001, 48,621 nurses and midwives held annual practising certificates, an increase of 2,160 on the March 1999 figure. All nurses and midwives are educated through three-year degree courses leading to registration as a comprehensive nurse or midwife. Post-basic education ranges from regular in-service and short clinical courses to diploma and transition to degree courses at polytechnics, and certificates, diplomas and degrees to doctorate level at universities. The nursing council is extending its professional role in response to the wishes of the nursing and midwifery professions. It has distributed a code of conduct and has developed requirements for competence-based practising certificates. Complaints about nurses and midwives are referred to the Health and Disability Commissioner. The council heard 13 disciplinary matters in the year ended 31 March 2001.
Fighting disease through research 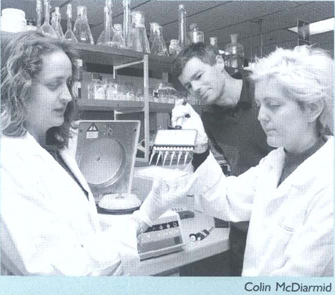 Researchers at the main laboratory of the Malaghan Institute of Medical Research. The Malaghan Institute of Medical Research is New Zealand's only independent medical research institute and is a registered charitable trust. Scientists at the institute are dedicated to the relief of human suffering through scientific research into the causes, nature and treatment of disease. Located at the Wellington School of Medicine, the institute employs approximately 30 full-time scientists who research cancer, asthma, multiple sclerosis, and human immunology and haematology. Recent research of interest includes a cancer serum test, which is the first of its kind to be tested against different cancers, including colon, lung and liver cancer. The test has recently being trialled in the clinic to determine its effectiveness in early detection and in the monitoring and treatment of cancer. Results from the trial are being evaluated. An asthma research team is involved in a project that focuses on the use of BCG (vaccine used for tuberculosis) in the treatment of asthma and, more specifically, on determining what components are key to inhibiting the disease. The cancer immunotherapy programme has recruited patients with non-Hodgkin's lymphoma for a clinical trial. The trial uses a procedure that teaches the body's immune system to seek out and kill cancer cells. A human immunology and haematology group has recently been established and plans to establish a human immunology laboratory to undertake research on the role of the T cell in various diseases. Source: Malaghan Institute of Medical Research |
Psychologists. The Psychologists’ Board is constituted under the Psychologists’ Act 1981. The board is concerned with registration of psychologists and the discipline of registered psychologists. At 30 June 2001, there were 1,836 registered psychologists (an increase of 113 on the June 1999 figure), with 1,161 (an increase of 100) holding annual practising certificates. Current legislation requires registration only for those psychologists practising in the state services or in institutions licensed under the Mental Health (Compulsory Assessment and Treatment) Act 1992.
Physiotherapists. The Physiotherapy Board is constituted under the Physiotherapy Act 1949. The board registers physiotherapists who are safe and competent to practise in New Zealand, disciplines registered physiotherapists and issues ultrasonic therapy licences. Four-year, full-time courses in physiotherapy are offered at the University of Otago and the Auckland University of Technology. Successful completion of these qualifications is required for registration. At 17 September 2001, there were 5,559 registered physiotherapists (an increase of 466 on the 1999 figure), with 2,503 (an increase of 64) holding annual practising certificates.
Occupational therapists. The Occupational Therapy Board is constituted under the Occupational Therapy Act 1949. The board is concerned with the education, registration and conduct of occupational therapists. Three-year, full-time training courses are conducted at the Auckland University of Technology and at Otago Polytechnic. Successful completion of a course is required for registration. At 31 March 2001, there were 2,577 registered occupational therapists (an increase of 405 on the June 1999 figure), with 1,393 (an increase of 122) holding annual practising certificates.
Dietitians. The Dietitians’ Board is constituted under the Dietitians’ Act 1950. The postgraduate training course for dietitians is conducted at the University of Otago. Students are usually already qualified in either home, consumer or applied science. At 31 March 2001, there were 1,015 registered dietitians (an increase of 48 on the June 1999 figure), with 368 (an increase of 34) holding annual practising certificates.
Optometrists and dispensing opticians. The Opticians’ Board, constituted under the Optometrists and Dispensing Opticians’ Act 1976, is concerned with the registration and conduct of optometrists and dispensing opticians. Optometrists are trained at the University of Auckland in a four-year, full-time degree course. Dispensing opticians are trained through a two-and-a-half-year correspondence course. At 30 June 2001, there were 979 registered optometrists (an increase of 162 on the June 1999 figure), 521 (an increase of 64) of whom held annual practising certificates, and 167 registered dispensing opticians (an increase of 29), with 102 (an increase of 15) holding annual practising certificates.
Podiatrists. The Medical Auxiliaries Act 1966 provides for the constitution of a Podiatrists’ Board. The board sets standards of education and conduct and runs special examinations. The Auckland University of Technology offers a three-year Bachelor of Health Science (Podiatry) degree, the qualification recognised for registration. At 30 June 2001, there were 475 registered podiatrists (an increase of 33 on the June 1999 figure), with 231 (an increase of eight) holding annual licenses.
Chiropractors. The Chiropractic Board is constituted under the Chiropractors’ Act 1982 and is concerned with the registration, education and conduct of practising chiropractors. Graduates from board-approved chiropractic colleges are eligible to take the board's competency examination and successful candidates are considered by the board for registration. The New Zealand Chiropractors’ Association established a school of chiropractic, the New Zealand Centre for Chiropractic Ltd, in Auckland in 1994, which offers a five-year degree course leading to the qualification of Bachelor of Chiropractic. At 30 June 2001, there were 418 registered chiropractors (a decrease of 75 on the June 1999 figure), of whom 236 (an increase of 46) held annual practising certificates.
Pharmacists. The Pharmacy Act 1970 provides for the registration of pharmacists, all of whom must be members of the Pharmaceutical Society of New Zealand. The society provides the combined function of a registration board, including discipline, and the functions of a professional body, including education, establishing standards and caring for public interests. The society also acts as the registering authority for pharmacies under the provisions of the Pharmacy Registration Regulations 1975. Entry to the profession is via a four-year degree course at either the University of Auckland or the University of Otago, plus a formal one-year postgraduate training programme that must be completed before registration is granted. Reciprocal recognition of qualifications exists between New Zealand, the states of Australia, the United Kingdom and Eire. In August 2001, there were 3,833 pharmacists on the register, 100 more than in August 1999. At the same time, there were 941 registered pharmacies, compared with 956 in August 2000, 983 in August 1999 and 1,014 in August 1998.
Medical radiation technologists. The Medical Radiation Technologists’ Board is constituted under the Medical Auxiliaries Act 1966. The board is concerned with the registration, education and conduct of those practising medical radiation technology. There are five classes of medical radiation technology: diagnostic radiography, radionuclide imaging (nuclear medicine), therapeutic radiography, ultrasound imaging and magnetic resonance imaging. At 30 June 2001, there were 2,975 registered practitioners (an increase of 255 on the June 1999 figure), 1,521 of whom held annual licences (an increase of 133). Diagnostic imaging courses are available at UNITEC, Manawatu Polytechnic (Universal College of Learning) and Christchurch Polytechnic Institute of Technology. Radiation therapists undertake a three-year full-time diploma course at the Wellington School of Medicine and Health Sciences.
A cancer patient undergoes radiation treatment.
Medical laboratory technologists. The Medical Laboratory Technologists’ Board is constituted under the Medical Auxiliaries Act 1966 and is concerned with the training, registration and conduct of those engaged in the practice of medical laboratory technology. The traditional apprenticeship-style training system has been replaced by courses based in the education sector. The University of Otago, Massey University and the Auckland University of Technology offer a Bachelor of Medical Laboratory Science. At 30 June 2001, there were 2,738 registered medical laboratory technologists (an increase of 140 on the June 1999 figure), with 1,318 (an increase of 67) licensed to practise.
Clinical dental technicians and dental technicians. As at 20 November 2001, 134 clinical dental technicians (an increase of 14 on the 30 November 1999 figure) and 190 dental technicians (a decrease of two) were registered and held annual practising certificates. The Dental Technicians’ Board is constituted under the Dental Act 1988 and in addition to the registration process, it liaises with educational establishments on training and examination requirements. Dental technicians receive training at the School of Dentistry, University of Otago, where, after completing a three-year training programme, they graduate as a Bachelor in Dental Technology. After obtaining their degree and working for a period as a dental technician, they must pass the Postgraduate Diploma in Clinical Dental Technology from the School of Dentistry. The board advises and makes recommendations to the minister in respect of any matter relating to work carried out by clinical dental technicians and dental technicians.
General practitioner subsidies. The government subsidises the cost of general practitioner (GP) visits for New Zealanders with low income or high health needs, although the GP may charge a co-payment. A subsidy of $32.50 is paid for visits to a GP by children under the age of six. This covers the full cost charged by most GPs for an office hours consultation with younger children. Children aged six years or older receive a partial subsidy on GP visits. Adults who are not eligible for low income or high health needs subsidies pay the full cost of a GP consultation. The salaries of practice nurses are subsidised by district health boards and all GP patients can access services provided by the practice nurse. Government subsidies may be paid either for each individual consultation, or as a bulk funding payment. People on low incomes access the government subsidy for GP visits via a community services card, issued to an individual and any dependent family members. People with high health needs access the government subsidy for GP visits via a high use health card. The subsidy for children aged six years or older is $20 for cardholders and $15 for non-cardholders. Adult cardholders receive a subsidy of $15 per consultation. A higher subsidy is paid to GPs in certain rural areas, and an immunisation benefit covers the cost of vaccinations for children under the age of 16.
Hospital treatment. Inpatient, outpatient and day treatment in New Zealand public hospitals is free of charge for all people eligible to access publicly-funded health services. Services related to public hospital inpatient, outpatient and day treatment, such as pharmaceuticals and x-rays, are also free. Inpatient, outpatient and day treatment in public psychiatric hospitals is free. Mental health services, including pharmaceuticals, are free to day patients or outpatients, including those who are patients of community mental health teams and are on community treatment orders.
Pharmaceutical benefits. All people eligible for publicly-funded health services are entitled, at a small cost to themselves, to a wide range of medicines, approved appliances and materials which are included in the pharmaceutical schedule and prescribed by medical practitioners, midwives or dentists. The pharmaceutical schedule is a list of the drugs and services subsidised by the government. The government pays a subsidy equivalent to the lowest priced drug with a specific effect in each drug group. Some drug companies charge more for their products and pass this charge on to the customer. Special mechanisms are in place to ensure people get access to non-schedule drugs in special circumstances. The government sets a standard maximum pharmaceutical charge of $15 an item. Medication costing less than $15 is charged accordingly. Higher government subsidies on pharmaceuticals are available for low income people, people with high health needs and children under the age of six. In addition, there is a subsidy on contraceptives. Children under six are exempt from charges on pharmaceuticals, with the exception of one or two specific items. Individuals or families pay the pharmaceutical charge of $15 for the first 20 pharmaceutical items from February 1 each year. The government then additionally subsidises pharmaceutical needs, and non-cardholder families and high use health cardholders pay a residual charge of $2 an item until the following 1 February. Community services cardholders do not pay a prescription charge until the following 1 February.
Dental services. Routine dental care is free for preschoolers, primary school children and adolescents. Dental therapists provide dental care for preschoolers and primary school children. Dentists under contract to district health boards provide dental care for adolescents. Some public hospitals have dental departments which provide services to patients. The government also funds emergency dental treatment for low income earners.
Maternity services. Women in New Zealand receive free pregnancy, childbirth and postnatal care from general practitioners or midwives through benefits paid by the Ministry of Health. Some women choose to receive primary maternity care from a specialist obstetrician and may then be charged above the rate provided by the benefit. If there are clinical reasons requiring the involvement of a specialist obstetrician, this service is available free from public hospitals. Approximately 96 percent of births take place in hospitals, but midwives and general practitioners may provide care to women who choose to have their babies at home. All maternity hospitals are licensed under the Hospitals Act 1957 and the Ministry of Health is responsible for ensuring that regulations regarding buildings, equipment and staff are observed.
Home nursing and home help. Home nursing and home help in New Zealand is free when provided by a registered nurse or midwife employed by a district health board or an approved organisation. Subsidies are available to associations that provide domestic help in appropriate cases to older people or families with young children. District health boards also provide home aid as part of a range of services to reduce the need for hospital or residential home care, and as a temporary follow up to hospital care.
Artificial aids. Specific benefits from the Ministry of Health are available in various circumstances for a range of artificial aids. These include breast prostheses, hearing aids, wheelchairs, artificial eyes and wigs. Specific eligibility conditions as to the suitability of the aid and the necessity for it apply in each case. Benefits generally contribute to the initial cost and to replacements.
PHARMAC. The Pharmaceutical Management Agency (PHARMAC) is a Crown entity set up in 1993. PHARMAC reports to the Minister of Health and its main role is to manage New Zealand's pharmaceutical schedule – the list of nearly 3,000 subsidised prescription drugs and related products available in New Zealand. The schedule, updated monthly and reprinted three times a year, records the price of each drug, the subsidy it receives from public funds and the guidelines or conditions under which it is subsidised. In 1999/2000, 78 new products were added to the schedule, compared with 128 products in 1998/99. The former Health Funding Authority and the Ministry of Health spent $745 million (including drug cost, pharmacy fee and GST) on pharmaceutical subsidies in the year to June 2001, up $12 million (about 2 percent) from the previous year. This increase reflects PHARMAC's continued ability to negotiate lower prices, which offsets the volume, spending and growth in new pharmaceuticals. Expenditure in many other developed countries grows by more than 10 percent a year. With a staff of 25, PHARMAC assesses the value granted from the products it subsidises or is requested to subsidise. It aims to improve the value for money of public funding of prescription drugs, using three strategies to balance patient needs and costs: price competition, improved targeting and financial risk sharing.
Health Benefits. The role of Health Benefits is to make government subsidy payments to health professionals on behalf of the Ministry of Health and to monitor payments to ensure that taxpayer money is being appropriately spent. This applies to all primary care-based transactions subsidised by the government, such as visits to the doctor, pharmaceutical prescriptions and maternity or immunisation services. Health Benefits handles approximately $1.2 billion in payments a year, involving more than 34 million items in pharmacy payments alone. Health Benefits has introduced new systems and approaches to match the changing relationship between the funder (the Ministry of Health) and its providers. Introduction of audit and investigation activities has had a profound effect on claiming patterns. Health Benefits also provides information to the Ministry of Health, health providers and other appropriate agencies about patterns of spending on health prescription costs and medicine usage, health trends and claiming patterns. Table 8.2 shows expenditure on health benefits for the years 1995 to 2000.
Table 8.2. Trends in expenditure on major health benefits
| Item | Year ended 30 June | |||||
|---|---|---|---|---|---|---|
| 1995 | 1996 | 1997 | 1998 | 1999 | 2000 | |
Note: Figures are GST inclusive. Totals may not add due to rounding. Sources: Health Benefits Ltd; Health Funding Authority | ||||||
| $(000) | ||||||
| Primary services | ||||||
| General medical services (GMS) including motor vehicle allowance | 170,275 | 173,382 | 192,174 | 190,369 | 194,485 | 140,072 |
| Practice nurse and health centre | 31,020 | 32,646 | 35,461 | 32,309 | 23,730 | 30,740 |
| Rural practice bonus | 3,247 | 3,238 | 2,998 | 3,543 | 2,314 | 790 |
| Immunisation | 2,980 | 2,964 | 8,007 | 6,343 | 6,727 | 13,044 |
| Maternity | 89,478 | 94,228 | 105,423 | 109,214 | 117,179 | 145,158 |
| Dental benefits | 16,042 | 15,780 | 16,538 | 17,102 | 16,053 | 43,938 |
| Capitation | 43,535 | 37,218 | 104,231 | |||
| Subtotal | 313,042 | 322,237 | 360,601 | 402,415 | 397,706 | 477,973 |
| Referral services | ||||||
| Specialists | 2,562 | 2,721 | 2,683 | 2,627 | 2,556 | 2,401 |
| Laboratory | 141,082 | 158,137 | 159,668 | 175,192 | 191,031 | 206,753 |
| Diagnostic imaging | 2,508 | 2,808 | 3,115 | 2,868 | 2,836 | 2,546 |
| Subtotal | 146,152 | 163,665 | 165,466 | 180,687 | 196,423 | 211,700 |
| Pharmaceuticals | 674,798 | 695,939 | 747,426 | 772,734 | 710,520 | 725,162 |
| Total | 1,133,992 | 1,181,841 | 1,273,493 | 1,355,836 | 1,304,649 | 1,414,836 |
The Health Act 1956 is New Zealand's core public health statute. It identifies the public health responsibilities of the Ministry of Health, territorial local authorities (city and district councils) and designated officers (particularly medical officers of health and health protection officers). The act provides mechanisms for the improvement, promotion and protection of public health in relation to infectious diseases and environmental hazards. It also provides a framework for subordinate regulations and related public health statutes.
A major function of local government is the improvement, promotion and protection of public health. Each local authority appoints environmental health officers to carry out regular inspections and take action on any nuisances or conditions injurious to health. Specific duties include control of sanitary conditions (including housing standards) and regulation of food premises, hairdressers, camping grounds and funeral directors. Local authorities are also responsible for control of offensive trades and environmental noise and are empowered to provide public water supplies, sewage disposal systems, refuse collection and disposal, storm water drainage, public conveniences, cemeteries, crematoriums, swimming pools and other facilities.
Health protection officers and medical officers of health are employed by district health boards. They provide specialist advice to local government to improve the effectiveness of environmental health activities.
The Ministry of Health also has responsibilities in public health regulation, including licensing of hospitals and old peoples’ homes; administration of legislation on communicable and non-communicable disease control; environmental health; food safety and quality; smokefree environments; and coordination of national regulatory activities. The ministry's public health directorate monitors the state of public health to identify public health needs, and advises the Minister of Health on matters related to public health.
Kiwis getting fatter The prevalence of obesity and overweight revealed in a national nutrition survey is a major public health issue for New Zealand. Results from the 1997 national nutrition survey released in August 1999 showed that the prevalence of obesity increased from 11 percent in a 1989 survey to 17 percent in the latest survey. Fifty-four percent of New Zealand adults 15 years and older were overweight and of those 17 percent were obese. Most New Zealanders (94 percent) reported eating a regular (omnivorous) diet that included animal and plant-based foods. About a third were trying to make changes to their diets, such as increasing fruit intake and reducing fat intake. Findings of the survey have been used as the basis for public health policy objectives in the New Zealand Health Strategy. Of the 13 health objectives in the strategy, three focus on improving nutrition, reducing obesity and increasing physical activity, while another four – reducing the impact of cancer, cardiovascular disease and diabetes, and improving oral health – are closely linked to food and nutrition. Ministry of Health food and nutrition guidelines recommend that adult New Zealanders should each day eat at least three servings of vegetables and two of fruit, six servings of breads and cereals, two servings of low fat dairy products and at least one serving of meat or a meat alternative. The survey also revealed that water was the most popular drink, with 80 percent of New Zealanders drinking it at least three times a week. Tea and coffee were both consumed by about 60 percent of New Zealanders at least three times a week. More than half of men drank beer at least once a week and about a quarter of women drank white wine at least once a week. Bread showed up in the survey as an important source of energy and nutrients, while milk and cheese provided nearly half the calcium intake of New Zealanders. Low fat dairy products were more popular with women than men. Source: Ministry of Health 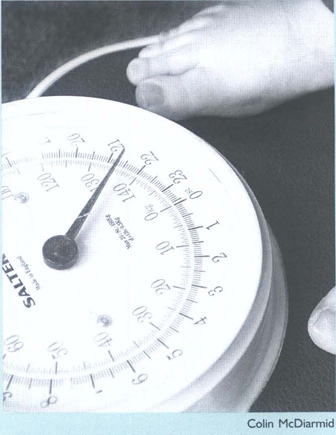 More than half New Zealand adults are overweight. |
Existing public health legislation is regarded as outdated, inflexible and complex. It is also potentially inconsistent with other more recent legislation in related sectors. Accordingly, the government has agreed to revise the legislation and to begin drafting a new public health bill. It is proposed that the new legislation, which will replace the Health Act 1956, the Tuberculosis Act 1948 and eventually some 30 sets of regulations, will include:
Clarity as to the purpose of public health legislation and the adoption of risk management principles.
Improved coordination with other legislation that impacts on public health.
Descriptive (or enabling) rather than prescriptive legislation.
An explicit methodology for assessing risks to public health and determining appropriate interventions, with regard to alternatives, costs and benefits.
Regular monitoring and reporting on the state of public health and the effectiveness of interventions.
Allowance for innovation in meeting mandatory objectives.
Provision for declared public health emergencies.
Recognition of New Zealand's international public health obligations.
Development and passage of the new legislation is contingent on government and parliamentary processes.
Safe drinking water is an essential prerequisite for public health. If a community's drinking water supply becomes contaminated by pathogenic organisms, a large number of people can be infected quickly and this can lead to the spread of infectious disease in pandemic proportions. Chemical contamination of drinking water also has to be guarded against. Although the direct health risks are lower than for contamination by pathogens, public concern about chemical contamination is often high.
The yardstick by which the safety of community drinking water supplies is assessed is the Drinking Water Standards for New Zealand 2000. The standards specify:
The maximum acceptable values (MAVs) for potential contaminants of public health significance.
Priorities for monitoring potential contaminants to maximise monitoring cost effectiveness.
Performance standards for the monitoring and analysis of drinking water quality.
The level of performance that is required for a drinking water supply to demonstrate compliance with the standards. Compliance is defined in terms of effectiveness in not exceeding MAVs and the frequency and quality of monitoring, analysis and record keeping.
Remedial action to be taken in the event of contamination of supply.
An important way for the Ministry of Health to inform the public about the safety of community drinking water supplies is the public health grading of such supplies. Both publicly and privately-owned drinking water supplies may be graded and the results published. Grades given for the water source and water treatment range from Al (completely satisfactory) to E (completely unsatisfactory). This is determined by the extent to which the supply complies with drinking water standards and whether adequate barriers to contamination are in place to minimise risk to the quality of the water. The water supply distribution system (pipes, reservoirs, etc) is graded similarly.
The Register of Community Drinking Water Supplies in New Zealand lists all community drinking water supplies known to the Ministry of Health (defined as supplies which service 25 or more people for 60 or more days a year), together with their public health grading and whether any chemical contaminants are present at concentrations that could potentially be of public health significance. The 2001 register covers 1,848 community drinking water supplies. The grades awarded vary greatly, with Auckland's drinking water given an A grade, Wellington's between A and C, Christchurch's B and Dunedin's between B and E.
The ministry also makes information available to the public through the Annual Report on the Microbiological Quality of Community Drinking Water Supplies in New Zealand.
Potential harm from radioactive materials and equipment that generates radiation is controlled in New Zealand by the National Radiation Laboratory (NRL), a specialist business unit of the Ministry of Health, based in Christchurch. The NRL is responsible for administering the Radiation Protection Act 1965 and Radiation Protection Regulations 1982. This legislation protects users of radiation, patients undergoing medical examinations or treatment using radiation, and members of the public, by licensing users and controlling the buying, selling and disposal of radioactive materials and radiation equipment. Functions of the NRL include auditing facilities that use radioactive materials and irradiating apparatus, and provision of a variety of radiation safety services, including personal dosimetry, calibration of radiation measurement equipment, and specialist advice in both ionising and non-ionising radiation. The NRL operates a number of radionuclide monitoring stations that measure radioactivity in the atmosphere and in rainwater. Some of this work is carried out as part of New Zealand's responsibilities under the Comprehensive Nuclear Test Ban Treaty. The NRL's website is www.nrl.moh.govt.nz
The Medicines Act 1981 and the Medicines Regulations Act 1984 provide controls over therapeutic substances in New Zealand. New medicines and related products require the approval of the Minister of Health before they can be marketed. Consent is given only when satisfactory evidence of the safety, effectiveness and quality of the product has been provided.
A medicine is defined as any substance or article, other than a medical device, which is intended wholly or principally for administration to humans for a therapeutic purpose or as a pregnancy test. Any food, cosmetic or dentifrice (toothpowder or paste) claimed to be effective for a therapeutic purpose is considered a related product. Any material change in a medicine or a related product has to be notified to the director-general of health and the changed product must not be distributed until 90 days have elapsed from notification or until the director-general signifies consent.
Medicines are classified as either ‘prescription medicines', ‘pharmacist medicines’ (for sale by a pharmacist personally), ‘pharmacy-only medicines', or considered safe for general sale. The legislation controls the advertising and labelling of medicines, related products and methods of treatment; the standards of manufacture, package and storage of medicines, related products and cosmetics; and the prescribing and dispensing of medicines.
Licences are required for manufacturers and others dealing with medicines. Any refusal of a licence can be appealed to the Medicines Review Committee. The committee may also inquire into an objection to a recommendation that the Minister of Health refuse to consent to the distribution of a new medicine.
The New Zealand and Australian governments are considering establishing a trans-Tasman agency to regulate therapeutic substances. This agency would operate under a treaty between the two countries and, if approved, would be expected to commence operating in 2004.
A wide range of drugs capable of being misused, including illegal and prescription drugs, are controlled by the Misuse of Drugs Act 1975 and the Misuse of Drugs Regulations 1977. It is an offence to obtain, manufacture, possess, consume, supply or offer to supply controlled drugs unless authorised under the act. Controlled drugs are divided into three classes. Heavier penalties are provided for offences involving class A drugs, such as heroin and LSD. Classes B and C contain many drugs which are legitimately used for medical and scientific purposes, such as morphine and pethidine. Cannabis plants, fruit and seeds are included in class C. Substances manufactured from a cannabis plant are class B. Illegal dealing in any class of controlled drug is subject to penalties varying from imprisonment to fines.
The rapid emergence of potentially dangerous new ‘designer’ drugs like Ecstasy necessitated a quicker way to control these drugs. In 2000, parliament amended the Misuse of Drugs Act 1975 to create a more rapid and evidence-based process of classifying drugs. The amendment clarified the basis of drug classification to relate to risk of harm to individuals and society arising from the drug. This ranges from class A (very high risk), class B (high risk) to class C (moderate risk). An expert advisory committee has been established to assess the relative risk of various drugs and to make classification recommendations to the Minister of Health.
The National Drug Policy (NDP) is a comprehensive strategy to minimise all legal and illegal drug-related harm. The NDP is a cohesive policy framework, coordinating initiatives of relevant government agencies under a three-pronged approach including:
Supply control (limiting the availability of drugs), eg through law enforcement.
Demand reduction (reducing the desire to use drugs), eg through education programmes.
Problem limitation (mitigating the harm already occurring from drugs), eg through treatment services.
The NDP, led by the Ministry of Health, provides a basis for priority setting, inter-sectoral decision making and strategic alignment.
To further assist in deterring drug abuse, the Ministry of Health, the New Zealand Customs Service and the New Zealand Police have maintained the National Drug Intelligence Bureau since 1972. The NDP website is www.ndp.govt.nz
Alcohol is a feature of New Zealand life. For many it is a symbol of hospitality, and is used on occasions to celebrate important events in people's lives.
When alcohol is misused, however, the resulting harms can be considerable. Alcohol abuse can lead to physical and mental health problems, injury and death on the roads, drownings, violence, fetal abnormalities, absenteeism and impaired work performance.
In 1998, an estimated 117 people died from alcoholic liver diseases and cirrhosis, alcoholic cardiomyopathy, alcohol dependent syndrome, alcoholic psychosis and alcohol abuse. The alcohol-related mortality rate for 1996/98 was 2.92 per 100,000 population, a decline of 45 percent from 1980/82. Figure 8.1 shows alcohol available for consumption in New Zealand.
Figure 8.1. Average number in quarter receiving community wage compared with quarterly averages of HLFS unemployed, 1995–2001
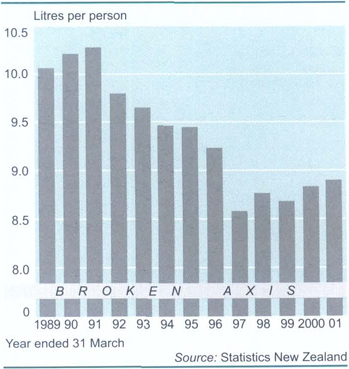
Note: The methodology for gathering this data has been revised and new data used from 1994. The population age estimates were revised in May 2000.
The impact of alcohol on road traffic accidents continues to be of concern. Land Transport Safety Authority figures indicate that in 1999 alcohol was a contributing factor in about 23 percent of fatal road accidents and 14 percent of injury accidents.
In annual terms, the social costs of alcohol misuse in New Zealand have been estimated at between $1.5 billion and $2.4 billion.
The Sale of Liquor Act 1989 increased the availability of alcohol and recent amendments to the act have further increased availability by lowering the minimum legal drinking age to 18 years, removing restrictions on the sale of alcohol on Sundays, and allowing wine and beer to be sold in supermarkets.
Much of the alcohol-related harm experienced in New Zealand is a consequence of heavier drinking. Fifty percent of the alcohol consumed in 2000 was consumed on heavier drinking occasions (eight or more drinks for men, six or more for women). Males aged 18 and 19 consume the highest typical occasion amounts, more than eight drinks per occasion in 2000.
Figures from a sample survey conducted in 2001 indicate that almost a third of 14 to 17-year-olds drink weekly.
A health survey commissioned by the Ministry of Health in 1996/97 found that one sixth of adults displayed drinking patterns that put them at risk of future negative physical or mental health effects. Young people aged between 15 and 24, especially men, were more likely to fall into this group. According to the survey, while more Māori and Pacific peoples reported never drinking alcohol, those who did drink consumed more on a typical drinking occasion than Europeans and illustrated hazardous patterns of drinking (more than six drinks an occasion).
A further concern is the risk to the fetus from drinking by women who are pregnant, as there is no proven safe level of alcohol intake during pregnancy.
The Alcohol Advisory Council of New Zealand (ALAC) promotes moderation in the use of alcohol and develops and promotes strategies aimed at reducing alcohol-related problems.
Alcohol and other drug issues are one of the priority areas for action identified in the New Zealand Health Strategy. Following on from this, the National Alcohol Strategy was released in 2001 to serve as the government's action plan to target alcohol-related harm. The strategy contains a comprehensive range of initiatives that span demand reduction, supply control and problem limitation measures.
It is estimated that 4,700 smokers and 400 non-smokers who have been exposed to second-hand tobacco smoke die in New Zealand each year. Half of all regular smokers die from a tobacco-related illness, losing, on average, 14 years of life compared with non-smokers.
The amount of tobacco products released for consumption per adult declined by 11 percent between 1996 and 2000, but one in five New Zealand deaths can still be attributed to tobacco smoking.
Figure 8.2 shows tobacco consumption per person in New Zealand, illustrating the overall decline in consumption.
Since 1998, a number of tobacco control initiatives have been put in place, including:
The national Quitline and the Quit multimedia campaign.
The Aukati Kai Paipa pilot smoking cessation programme targeted at Māori women.
Smoking cessation programmes for pregnant women, Māori and hospital patients.
Subsidisation of nicotine replacement therapy (patches and gum).
Figure 8.2. Tobacco consumption
Per person aged 15 years
and over
A healthy meal of fish, salad and vegetables.
The Food Hygiene Regulations 1974 apply to a food business until an exemption is granted to that business. The regulations contain minimum construction requirements, provisions dealing with maintenance of food premises and the conduct of workers. Environmental health officers carry out inspections to check compliance with these regulations. Public health unit health protection officers and medical officers of health provide specialist advice to local authorities on these matters.
Mental Health Foundation of New Zealand 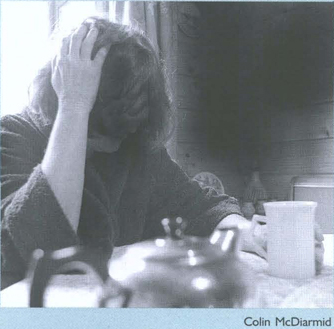 The Mental Health Foundation promotes awareness of mental health. The vision of the Mental Health Foundation of New Zealand is to promote positive mental health for all New Zealanders. The foundation is a non-profit charitable trust with a head office in Auckland and offices in Christchurch and Wellington. The foundation focuses on promoting awareness of mental health and well-being and prevention of mental illness. It works with a wide range of agencies across health and related sectors, particularly education, social welfare, policy, media, employers and local communities. Resource and information centre: In addition to library and internet services, the foundation has an information centre at its national headquarters in Auckland which offers pamphlets, fact sheets, videos, manuals, teaching units and other resources on mental health topics. MHINZ (Mental Health Information New Zealand) is a series of locally-written, plain-language mental health information packages. The series includes information on schizophrenia, depression, eating disorders, alcohol and drug abuse. Resources can be ordered by phone, fax, email or through the foundation's website. Resources, some of which are free, are available to the general public as well as to those working in the mental health field. Mental health promotion: The foundation facilitates training workshops, with a major focus on youth mental health, including resilience, depression awareness and suicide prevention. It works with schools and teachers to promote mentally healthy environments. Working with Age Concern, it also runs workshops looking at mental health issues for older people. It is developing projects and a publicity campaign on mental health at work. Stigma and discrimination: The foundation campaigns against stigma and discrimination experienced by those with mental illnesses. It is involved in the national Like Minds, Like Mine project. Advocacy and policy development: The foundation advocates on behalf of mental health consumers and lobbies for policy changes in mental health. It works with the Mental Health Advocacy Coalition, a group which represents a number of mental health and related sectors, to highlight issues of concern, provide policy advice to government and offer ways of improving service coordination and delivery. www.mentalhealth.org.nz is the foundation's website, while www.spinz.org.nz is a website containing information on suicide prevention. Source: Mental Health Foundation of New Zealand |
The Ministry of Health is working collaboratively with the Ministry of Agriculture and Forestry to harmonise their regulatory systems and to implement risk-based management programmes for food administration in New Zealand. The two agencies want to achieve consistency between domestic food safety programmes and the risk management approach under the Dairy Industry Act 1952 and the Animal Products Act 1999.
The labelling (including ingredient listing, nutrition content, warning statements and claims about nutrition) and composition of food (including its microbiological status, contaminants, residues, additives, vitamins and minerals or other substances that may be present in food) are regulated by a combination of regulations and food standards. Since 1984, these aspects of food have been subject to the New Zealand Food Regulations 1984.
Australian and New Zealand Ministers of Health agreed in November 2000 on a new joint food standards code, the Australia New Zealand Food Standards Code. The joint code took legal effect in New Zealand on 8 February 2001 and will coexist with the New Zealand Food Regulations and the Australian Food Standard Code until they are repealed. This was expected in late 2002. The joint code does not cover specification of maximum residue limits for agricultural and veterinary chemicals in food; the specification of food hygiene provisions, including requirements for food safety programmes or other means of demonstrating the safety and compliance of foods; or export requirements relating to third country trade.
The new code is available on the website www.anzfa.govt.nz
New Zealand food standards (outside the scope of the Australia New Zealand food standards-setting systems) are issued by the Minister of Health. They cover residue limits for agricultural and veterinary compounds, prescribed foods (for which assurances on safety must be provided prior to entry into New Zealand) and emergency food standards.
Dietary supplements are regulated as foods that are ‘sold singly or in mixtures in controlled dosage forms as cachets, capsules, liquids, lozenges, pastilles, powders, or tablets, which are intended to supplement the intake of those substances normally derived from food'. They are regulated under the Dietary Supplements Regulations 1985. While most dietary supplements are sold as capsules, pills or in powder form, some are sold in food form.
Further information on the regulation of food in New Zealand is available on the Ministry of Health website www.moh.govt.nz
A range of health and support services are provided in New Zealand for older people, including assessment of support needs, treatment, rehabilitation, home support services, environmental support (equipment and housing or car modifications) and residential care. Charges for services vary depending upon the type of service and the individual's financial circumstances.
Health and support services for older people have tended to develop in an ad hoc way in recent years, resulting in some fragmentation and inconsistencies. During late 2001, the government consulted on a draft strategic framework to integrate planning, funding and provision of health and disability support services for older people. The final strategy for the health of older people was to be released in 2002.
Focus of the strategy is on providing a range of health care and support services to meet the diverse needs of older people, their families, whānau or carers. There is an emphasis on services that help an older person to be an active, participating member of the community. There is also an emphasis on enabling older people and those close to them to make informed decisions about accommodation and support options available to them.
Voluntary welfare organisations make valuable contributions to aspects of public health. Vote: Health, through a variety of contracts and other agreements, funds a wide range of independent service providers and related organisations, including, among others, the Royal New Zealand Plunket Society, the New Zealand Family Planning Association and the New Zealand AIDS Foundation.
The National Mental Health Strategy is designed to improve the state of mental health services in New Zealand. The strategy is set in statute (the Mental Health Commission Act 1998) and has resulted in a 100 percent increase in mental health funding in less than a decade. The strategy is based on more and better services for the top 3 percent of people suffering from serious mental disorders, and funding has been targeted at this group.
Early intervention and prevention/promotion approaches have not yet been widely developed, but offer promise for less severe mental disorders.
The Māori component of the mental health policy will be addressed in the Māori Mental Health Strategy, which is under development.
District health boards are responsible for the provision of mental health services and rapid funding growth has required development of workforce and information resources to provide the infrastructure for service provision. The Ministry of Health is investing an additional $8 million a year from 2000 to 2005 to develop the mental health workforce, along with additional workforce development from the clinical training agency.
A national epidemiology study is expected to produce detailed data about the patterns of mental illness by 2003. Extra attention has been needed to meet quality expectations that have at times been strained by the rapid growth rate. Quality improvement initiatives have emphasised best practice, new mental health standards and a programme of audits.
Like Minds, Like Mine has been established as a national initiative to destigmatise mental illness and improve the social environment for people with serious mental illness. Intersectoral linkages are part of mental health policy and aim to improve access to good housing, education and employment to assist recovery from mental illness and full participation in society.
The Mental Health Commission (MHC) has the statutory role of monitoring implementation of the National Mental Health Strategy. The MHC's Blueprint forms the basis of service development expectations, while the Mental Health (Compulsory Assessment and Treatment) Act 1992 aims to balance human rights with public safety.
The New Zealand Youth Suicide Prevention Strategy was launched in 1998 to address New Zealand's high rates of youth suicide. The year before, New Zealand had the highest rate of youth (15–24 years) suicides of Organisation for Economic Cooperation and Development countries, including Finland, Australia, Canada, the United States, Norway, France, Denmark, Sweden, Germany, Japan, the United Kingdom and the Netherlands. Implementation of the prevention strategy is overseen by both a ministerial and an inter-agency committee and is coordinated by the Ministry of Youth Affairs. The strategy consists of two components: Kia Piki te Ora o te Taitamariki specifically supports Māori efforts to reduce the Māori youth suicide, and In Our Hands outlines steps to reduce suicidal behaviour among all youth. Together they take a broad-based approach to suicide prevention, from community development and mental health promotion to early identification of risk factors and treatment, support after a suicide, restricting access to means of suicide, encouraging safe media reporting, and information and research.
The Ministry of Health has responsibility for implementation of the New Zealand Disability Strategy (see sidebar) and for funding disability support services.
The ministry has a systemic approach to the provision and funding of disability services. Called the disability support services framework, it involves three processes:
Assessment to identify and prioritise needs. This process is intended to identify all of a person's care and support needs, irrespective of funding constraints and availability of services.
Service coordination. This identifies appropriate services and support options to meet assessed needs within available funding. It determines which services will be publicly funded.
Service provision.
Disability support services aim to promote and maximise the independence of people with disabilities, provide effective habilitation and rehabilitation, and support opportunities for people to participate as fully as possible in their families, community and society.
Most publicly-funded support services are funded through the ministry to people who are assessed as having a physical, psychiatric, intellectual, sensory or age-related disability. The disability must be likely to continue for a minimum of six months and result in a reduction of independent function to the extent that ongoing support is required.
Some support services are funded through the Accident Compensation Corporation and the Ministry of Social Development. Other services are privately resourced, either fully or partially.
Disability support consists of a range of services, from home support and residential services to information and advisory services. The services are provided through a variety of voluntary organisations, private businesses such as rest homes, and government-funded district health boards. Most services are community based.
Disability support services took approximately 25 percent of Vote: Health in the 2000/01 financial year. Support services funding was $1.759 billion, compared with $1.645 billion for the 1999/2000 financial year. (Funding for both years included a component of mental health funding).
During 2000/01, approximately 42 percent of expenditure on disability support services (excluding the mental health funding component) was spent on rest home and hospital-level care for older people. Home support and carer support made up 9 percent and 4 percent respectively. Community residential care (for younger people) was approximately 16 percent of the support services budget. The remaining 29 percent of expenditure was spent on needs assessment and service coordination, respite care, day programmes, community health, child development, specialist support, environmental support services and other services.
New Zealand Disability Strategy The New Zealand Disability Strategy, launched in April 2001, aims to remove barriers that prevent disabled people from participating in society. Underpinning the strategy is a vision of a fully-inclusive society that highly values disabled people's lives and continually enhances their full participation in society. The strategy, a requirement of the New Zealand Public Health and Disability Act 2000, was developed with extensive input from the disability sector. The strategy outlines 15 objectives and more than 100 action points in areas such as human rights, social attitudes, education and employment, recreation and lifestyle, information, public services and support systems. It is a framework designed to ensure that government departments and other government agencies consider disabled people before making decisions. Eleven key government agencies were required to develop implementation plans for the 2001/02 financial year and all other government agencies will be required to develop plans for the 2002/03 year. The strategy goes beyond government services, however, with local authorities and nongovernment public bodies expected to take steps to improve the position of disabled people. Source: Ministry of Health 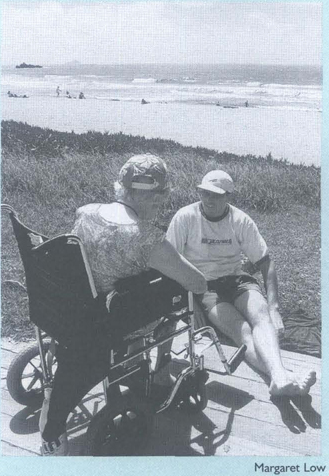 A boardwalk provides access for those with mobility problems. |
The government has announced that disability support services for people over 65 years of age are to be separated from services provided for younger people. Decisions were to be announced during 2002 on future arrangements for both sets of services.
The health of families in New Zealand is promoted cooperatively by the Ministry of Health, district health boards, government departments, voluntary agencies, hospital and health services and health professionals.
Family planning. Family planning advice is purchased from the Family Planning Association, general practitioners, group practices, student health clinics, sexual health clinics, marae-based health services and other providers, including those in the private sector. Some hospitals offer family planning services within their obstetrics and gynaecology departments to provide facilities for the public and training for doctors, medical students and nurses. Government funding provides for some free contraceptives and consultations and subsidised oral contraceptives, especially for those on low incomes. A Sexual and Reproductive Health Strategy was launched in October 2001 and the Ministry of Health is working with sector experts to develop a series of sexual and reproductive health action plans that fall within the strategy's framework.
The government's key goal for Māori health is to reduce health inequalities for Māori (along with other disadvantaged groups). Several national health indicators have improved for Māori in the past decade, including increases in life expectancy and significant decreases in rates of sudden infant death syndrome, cervical cancer and rheumatic fever. However, Māori still face poorer health outcomes than New Zealand Europeans, even when the impact of socio-economic status is taken into account.
Māori on average die eight to nine years earlier than non-Māori. While access to health services plays a role, the health of individuals is generally determined by socio-economic status, eg employment, housing and education. Behavioural and biological risks are believed to play a part, and these risks are also inequitably distributed across socio-economic and ethnic groups.
The task of improving Māori health means not only addressing issues of access to and effectiveness of health services, but also tackling underlying social and economic conditions that impact on people's health. To achieve the latter, a cabinet committee has been established to reduce inequalities by using intersectoral approaches both across government agencies and within communities.
The government and the Ministry of Health have encouraged Māori in the past 10 years to participate in providing their own health services, not only to improve access but also to recognise the principles of the Treaty of Waitangi. Since 1993, the number of Māori providers has grown from about 30 to more than 220. This has helped make services more accessible and culturally appropriate for Māori. In the 2000/01 financial year, $110 million was used to fund Māori health providers throughout New Zealand. Eight priority areas have been identified for Māori health: immunisation, hearing, smoking cessation, diabetes, asthma, oral health, mental health and injury prevention, with cardiovascular disease and sexual health also important.
Enhancements continue to be made to mainstream health services to make them more effective and appropriate for Māori. District health boards have a statutory objective of reducing Māori and other health disparities. They are required to engage iwi and Māori in their planning and decision making, and there must be at least two Māori members on each board, more if there are larger numbers of Māori in the board's district.
The Māori Health Strategy He Korowai Oranga, introduced during 2002, aims to build on gains already made for Māori and focuses on achieving whānau ora (healthy families). The strategy has four pathways to improving Māori health:
Whānau (family), hapū (extended family), iwi (tribal) and Māori community development.
Māori participation throughout the health and disability sector.
Effective health and disability services delivered to Māori.
Intersectoral action to reduce inequalities and tackle the wider determinants of health.
The Māori Health Strategy supports the New Zealand Health Strategy, which has 13 short to medium-term priorities related to improving population health, addressing inequalities in health status and improving delivery of key services.
The Ministry of Health provides policy advice to its minister on a range of issues of particular relevance to women. These include contraception, sexual and reproductive health, infertility, pregnancy and childbirth services, terminations, breast cancer and cervical screening. The ministry also establishes the overall framework that determines how people, including particular population or interest groups such as women, get access to publicly-funded services. This includes examining issues such as affordability of health care, appropriateness of services and acceptable waiting times. Women's health services are provided by district health boards, health professionals and a large number of community and consumer groups.
National cervical screening programme. Cervical cancer is largely treatable if detected early. The need for a national screening programme was identified in 1984 and the programme was established in 1990. The goal is to reduce mortality and disability from squamous cell cancer of the cervix by using a nationwide ongoing screening programme that can detect pre-cancerous changes. Screening is offered three-yearly for women aged 20 to 69. The Ministry of Health is responsible for national leadership and strategic direction of the programme, development of policy and quality standards, purchasing of services and monitoring of the programme. Screening is delivered to women by a range of providers including general practitioners, nurse and lay smeartakers, midwives, gynaecologists, health educators and laboratories. The programme has 14 regional offices located within district health boards, providing promotion, coordination and operation of the programme's register. Local registers are linked to a central database.
Cervical cancer incidence and mortality targets are:
Mortality. To reduce the age-standardised death rate from cervical cancer to below 2.5 per 100,000 by the year 2005.
Māori mortality. To reduce the age-standardised Māori death rate from cervical cancer to 6 per 100,000 or fewer by 2005.
Incidence. To reduce the age-standardised incidence rate of cervical cancer in women to below 8.6 per 100,000 by the year 2005.
Māori incidence. To reduce the age-standardised incidence rate of cervical cancer in Māori women to below 11 per 100,000 by the year 2005.
Early detection. No more than 30 percent of invasive cervical cancers detected should be beyond stage one at the time of detection. Provisional data for 1999 indicates 58 percent in 1996 and 52 percent in 1997 were stage one at diagnosis.
Enrolments. To increase the proportion of eligible women enrolled and screened in the previous three years to 85 percent by the year 2000. This target was reached. By November 1999, 90 percent of eligible women were enrolled and 84 percent had had a smear in the previous five years.
Reduction in both incidence and mortality rates for cervical cancer for all New Zealand women has accelerated since 1991 and is most likely due to improvements in cervical screening since the mid-1980s. Based on current trends, cervical cancer incidence and mortality rate targets for the total population are likely to be achieved by the year 2005.
Since targets for Māori women were set, the definition of ethnicity has changed from a ‘sole ethnic origin’ population to a ‘Māori ethnic group’ population. Until several years of mortality data are available for Māori women using the new definition, progress toward the mortality target cannot be accurately estimated.
National breast cancer screening programme. A national breast cancer screening programme began in 1998. Breast cancer is the leading cause of cancer deaths for New Zealand women, with 84 percent of all breast cancer deaths occurring in women over the age of 50. International evidence shows that an organised population-based breast screening programme can reduce deaths from breast cancer in women aged 50 to 64 by between 25 and 30 percent over a number of years, as long as at least 70 percent of eligible women are screened. Breast Screen Aotearoa New Zealand offers free mammography services at two-yearly intervals to women in the 55 to 69 age group who do not have symptoms of breast cancer. Assessments for women who need it are done by a team of radiographers, radiologists, breast specialist nurses, surgeons and pathologists.
The Ministry of Health provides policy advice to the Minister of Health relating to health services for children and their families.
In 1998, the ministry led development of the Child Health Strategy, which provides direction to the health and disability sector on the overall improvement within five to 10 years of child health and disability outcomes and the reduction of inequities. The strategy recognises that improving child health and disability outcomes requires a comprehensive approach, which is set out in six directions:
Greater focus on health promotion, disease prevention and early intervention.
Better coordination.
Development of a national child health information strategy.
Child health workforce development.
Improved child health research and evaluation.
Leadership in child health.
Implementation of the six directions has focused on the child health information strategy and workforce development.
The strategy emphasises the need to reduce inequities in health and disability outcomes by focusing on Māori children, Pacific children, children whose families experience multiple social and economic disadvantages, and children with high health and disability support needs.
A comprehensive range of child health services is purchased by district health boards and the Ministry of Health. This includes high quality secondary and tertiary paediatric services, primary care, and well-child services which focus on disease prevention and health promotion.
Services set out in the Well Child Tamariki Ora national schedule include newborn screening; developmental, vision and hearing screening for children aged 0–4; and immunisation. Well-child services for this age group are provided by a range of providers including hospitals, the Royal New Zealand Plunket Society and Māori and Pacific providers. The schedule recommends examination by family doctors at about six weeks of age and whenever there is anxiety over acute or chronic illness or development.
Infant mortality was 6.1 deaths per 1,000 live births in 2000. This continues the reduction in infant mortality that began in the early 1990s following release of the New Zealand Cot Death Study. Figure 8.3 illustrates this downward trend in infant mortality in New Zealand.

A toddler receives free immunisation.
Immunisation. A free series of immunisations is available to children in New Zealand to protect them from nine serious diseases. To be fully protected, children need to have all of the immunisations in the series. A national committee has been established by the Ministry of Health to certify the elimination of polio in New Zealand. This is being done as part of the global eradication of polio. The oral polio vaccine was replaced by an injectable vaccine in 2002. Table 8.3 shows the recommended immunisation schedule by age, and the diseases immunised against. Table 8.4 shows the percentage of national coverage for infant immunisation achieved in 2000, by vaccine type.
Table 8.3. Recommended immunisation schedule from 2002
| Age | Vaccine |
|---|---|
1Diphtheria, tetanus, whooping cough (acellular pertussis), and inactivated poliovirus vaccine. 2Haemophilus influenzae type b and hepatitis B vaccine. 3Diphtheria, tetanus, acellular pertussis and Haemophilus influenzae type b vaccine. 4Measles, mumps, rubella vaccine. 5Adult-type tetanus-diphtheria vaccine. In addition, hepatitis B vaccine and hepatitis B immunoglobulin is given at birth to babies of a mother who is a carrier of hepatitis B, and BCG is offered to babies who will be living in households where there are recent immigrants from high risk countries or persons with current or past history of tuberculosis. Rubella vaccine or MMR is available for susceptible women. Source: Ministry of Health | |
| 6 weeks | DTaP-IPV1, Hib-Hepatitis B2 |
| 3 months | DTaP-IPV, Hib-Hepatitis B, |
| 5 months | DTaP-IPV, Hepatitis B, |
| 15 months | DTaP/Hib3, MMR4 |
| 4 years | DTaP-IPV, MMR |
| 11 years | Td5 |
| 45 years | Td |
| 65 years | Td, annual influenza vaccine |
Table 8.4. Infant immunisation coverage by vaccine type, 20001
| Vaccine type2 | Recommended timing | National coverage levels (%) |
|---|---|---|
1Immunisation coverage surveillance using benefit claim data. January – December 2000. 2D = diphtheria, T = tetanus, P = pertussis, aP = acellular pertussis, Hib = Haemophilus influenzae type b, Hep B = hepatitis B. OPV = oral polio vaccine, MMR = measles, mumps and rubella. Source: Institute of Environmental Science and Research | ||
| DTPH/DTaP1 | 6 weeks | 89.0 |
| DTPH/DTaP2 | 3 months | 87.0 |
| DTPH/DTaP3 | 5 months | 90.0 |
| DTPH/DTaP/Hib | 15 months | 86.0 |
| HepB/Hib-HepB | 6 weeks | 89.0 |
| HepB/Hib-HepB | 3 months | 87.0 |
| HepB | 5 months | 90.0 |
| OPV1 | 6 weeks | 84.0 |
| OPV2 | 3 months | 81.0 |
| OPV3 | 5 months | 82.0 |
| MMR1 | 15 months | 85.0 |
Health promotion. Public health nurses provide a consultative service to schools with a specific emphasis on promotion of health and health education.
Family Start. Family Start is an intensive home-based visiting service set up by the Ministries of Health, Education and Social Development as part of the Strengthening Families intersectoral initiative. It is jointly funded through Votes: Health, Education and Child, Youth and Family Services, and the services are purchased by district health boards, the Department of Child, Youth and Family Services, and Early Childhood Development. The programme is targeted at families in difficult circumstances that put at risk good health, education and welfare outcomes for their children. Families experiencing multiple or severe difficulties around the time of the birth of a child may be referred by maternity carers, well-child providers or general practitioners. Participation in the programme is voluntary. Support is provided at three levels of intensity, depending on the assessed needs of the family. Family Start is not intended to replace or duplicate existing health, education or welfare support services, but to work with families in a supportive partnership and to link them to existing services and local networks as needed. If necessary, families can participate in the programme for the first five years of a child's life.
New Zealand's dental health service combines a school dental service for children, dental benefits for adolescents and private practice services for adults. Major hospitals also provide dental services for in-patients and other special groups.
Figure 8.3. Infant mortality1
Death of infants aged under 1 year
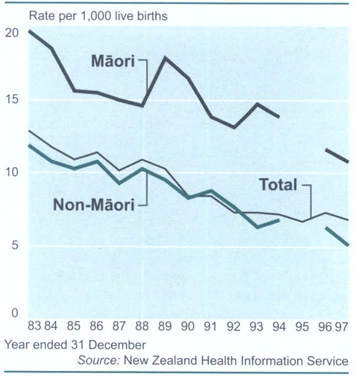
1Due to a change in the way ethnicity was recorded, 1995 figures are not directly comparable to those before and after.
School dental service. The school dental service works to maintain a high standard of dental health for preschool and school children, starting at the age of two-and-a-half and continuing to the highest class at primary or intermediate school. Dental therapists, after completing a two-year training course, provide children with routine dental care. Care involves examination, disease prevention measures, fillings in deciduous (first) and permanent teeth, extraction of teeth and dental health education. Some children are referred to dentists for care that is beyond the scope of the dental therapist. The cost of such care is usually met as a special dental benefit. Orthodontic treatment and therapist. The cost of such care is usually met as a special dental benefit. Orthodontic treatment and some other specialist services can only be obtained privately. For children leaving the care of the school dental service at the end of their primary schooling, the number of filled teeth was, on average, 1.6 per child in 1999, and 44 percent had no fillings at all in their permanent teeth.
Dental services for teenagers. Young people continue to receive dental benefits up to the age of 18.
Dental research. Dental research is undertaken by the School of Dentistry at the University of Otago. Health Research Council-funded dental research is undertaken by a number of investigators.
Fluoridation. Fifty-six percent of New Zealanders on reticulated water supplies in 2000 lived in areas with fluoridated water. As a result of the widespread availability of fluoride from sources other than fluoridated water (principally toothpaste), the difference in dental decay rates in communities with fluoridated and non-fluoridated water supplies has decreased. The benefit of fluoridation in preventing dental decay is greatest for those in low socio-economic groups, for Māori and for children.
Malignant neoplasms (cancer), ischaemic heart disease and cerebrovascular disease were the leading causes of death in New Zealand in 1998 (the most recent figures available), collectively accounting for 61.5 percent of all deaths (cancer 28.7 percent, ischaemic heart disease 23.4 percent and cerebrovascular disease 9.4 percent). Figure 8.4 shows the trend in the death rates for five selected causes of death in New Zealand.
Figure 8.4. Selected causes of death
Age-standardised
rate1
White water rafters wear lifejackets and hard hats for safety.
Water Safety New Zealand continues to support and fund water safety education programmes like Lotto SwimSafe, an introductory learn-to-swim programme; BeachEd, an experiential day at the beach for primary and intermediate school children; ACC RiverSafe, an activity-based river education programme; and various boating courses run by Coastguard Boating Education Service. Water Safety New Zealand also has a comprehensive video library which includes videos on boating safety, safety at the beach, river safety and learn to swim.
Water Safety New Zealand's website www.watersafety.org.nz includes topical information, press releases and drowning statistics, an on-line ordering system for resources and videos, and safety advice on a variety of water-related activities. Other websites have been developed for BoatSafe, PoolSafe and RiverSafe.
In January 2000, the Lotto Take The Plunge campaign taught 11,300 people to swim. It involved 1,000 volunteers in 215 pools throughout New Zealand. During the past six years, 75,000 people have taken part in Water Safety New Zealand's major event of the year.
Water Safety Across The Curriculum continues to be a popular teachers’ resource and is complemented with a water safety video written and performed by school children for school children. In addition, the activity-based RiverSafe programme has been developed for secondary school teachers and students.
Table 8.17 shows the number of drownings in New Zealand from 1991 to 2000, categorised by activity.
Table 8.17. Drownings
| Activity | Year ended 31 December | |||||||||
|---|---|---|---|---|---|---|---|---|---|---|
| 19911 | 19921 | 19931 | 1994 | 1995 | 1996P | 1997P | 1998P | 1999P | 2000P | |
1Figures for 1991–93 have been confirmed against coroners’ reports. P = provisional Source: Water Safety New Zealand | ||||||||||
| Recreational | ||||||||||
| Boating | 15 | 22 | 35 | 14 | 23 | 22 | 18 | 16 | 13 | 24 |
| Surf sports | 1 | – | 1 | 1 | 1 | – | – | 4 | 3 | 4 |
| Whitewater sports | 1 | 4 | – | 5 | 2 | 1 | – | – | 2 | – |
| Recreational fishing | 11 | 8 | 12 | 11 | 8 | 1 | 13 | 5 | 9 | 6 |
| Underwater sports | 9 | 7 | 7 | 11 | 12 | 7 | 10 | 8 | 4 | 11 |
| Swimming | 18 | 7 | 12 | 17 | 22 | 19 | 18 | 26 | 19 | 11 |
| Other recreational | 2 | 4 | 4 | 8 | 9 | 7 | 6 | 4 | 4 | 3 |
| Total recreational | 57 | 52 | 71 | 67 | 77 | 57 | 65 | 63 | 54 | 59 |
| Non-recreational | ||||||||||
| Immersion accidents | 30 | 30 | 25 | 32 | 23 | 35 | 33 | 39 | 31 | 30 |
| Road vehicles | 22 | 15 | 18 | 16 | 25 | 15 | 12 | 13 | 11 | 10 |
| Other transport | 1 | – | 1 | 2 | – | – | – | 4 | 2 | – |
| Commercial fishing | 6 | 7 | 10 | 1 | 4 | 18 | – | 12 | 3 | 4 |
| Other commercial | 2 | – | 2 | – | 5 | 1 | 1 | 1 | 1 | 6 |
| Rescuing others | 4 | 5 | 2 | – | 1 | 1 | 2 | 3 | 2 | 4 |
| Suicides and homicides | 24 | 20 | 24 | 13 | 20 | 13 | 25 | 14 | 17 | 19 |
| Miscellaneous | 1 | 1 | 1 | 1 | 4 | – | – | 1 | – | 2 |
| Total non-recreational | 90 | 78 | 83 | 65 | 82 | 83 | 73 | 87 | 67 | 75 |
| Total drownings | 147 | 130 | 154 | 132 | 159 | 140 | 138 | 150 | 121 | 134 |
General accident statistics. Accidents, poisoning and violence caused 6.3 percent of deaths from all causes in 1998, compared with 6.1 percent in 1996. The largest single external cause of death was suicide (577 deaths compared with 540 in 1996), followed by motor vehicle crashes (529 deaths and 537 in 1996). Accidental falls accounted for 199 deaths, compared with 267 in 1996.
Table 8.18 shows the cause, number and rate per million population of deaths from external causes in New Zealand from 1996 to 1998. Table 8.19 classifies 1998 deaths from leading external causes by age and sex, while table 8.20 lists the place of occurrence of fatal non-transport accidents from 1996 to 1998.
Male deaths by external causes. Males accounted for 70.6 percent of deaths from external causes in 1998. Males aged 15 to 24 years, followed closely by those aged 25 to 34, had the highest number of deaths for any particular age group, with suicide being the most common cause of death, followed by motor vehicle accidents.
Deaths of preschool children from accidents and violence. The mortality rate for children aged from 1 to 4 years from accidents and violence in 1998 was 14.2 per 100,000 population, compared with 22.1 per 100,000 in 1997.
Table 8.18. Deaths from external causes 1996–19981
| 1996 | 1997 | 1998 | ||||
|---|---|---|---|---|---|---|
| Number | Crude rate per million population | Number | Crude rate per million population | Number | Crude rate per million population | |
1Registered during calendar year: 2Includes falls aboard ship and falls horseback. 3Includes drowning from water transport. Source: New Zealand Health Information Service | ||||||
| Motor vehicle crashes | 537 | 148.4 | 550 | 146.2 | 529 | 139.5 |
| Other transport accidents2 | 68 | 18.8 | 67 | 17.8 | 60 | 15.8 |
| Accidental poisoning | 26 | 7.2 | 27 | 7.2 | 11 | 2.9 |
| Accidental falls | 267 | 73.8 | 242 | 64.3 | 199 | 52.5 |
| Accidents caused by machinery | 14 | 3.9 | 17 | 4.5 | 13 | 3.4 |
| Accidents caused by fire and flames | 35 | 9.7 | 33 | 8.8 | 20 | 5.3 |
| Accidents caused by firearms | 6 | 1.7 | 0 | 0.0 | 6 | 1.6 |
| Accidental drowning and suffocation3 | 91 | 25.1 | 118 | 31.4 | 102 | 26.9 |
| Suicide and self-inflicted injury | 540 | 149.2 | 561 | 149.1 | 577 | 152.1 |
| Homicide | 69 | 19.1 | 69 | 18.3 | 57 | 15.0 |
| All other external causes | 82 | 22.7 | 99 | 26.3 | 98 | 25.8 |
| Total deaths from external causes | 1,735 | 479.5 | 1,783 | 473.9 | 1,672 | 440.8 |
Table 8.19. Deaths from leading external causes by sex and age 19981
| Age group (in years) | Motor vehicle accidents | Accidental drowning | Accidental poisonings | Accidental falls | ||||
|---|---|---|---|---|---|---|---|---|
| M | F | M | F | M | F | M | F | |
1Registered during calendar year. Source: New Zealand Health Information Service | ||||||||
| 0–14 | 36 | 17 | 7 | 4 | 0 | 1 | 4 | 0 |
| 15–24 | 99 | 44 | 15 | 0 | 0 | 2 | 8 | 1 |
| 25–34 | 76 | 24 | 17 | 1 | 1 | 0 | 6 | 0 |
| 35–14 | 55 | 25 | 8 | 0 | 4 | 0 | 8 | 1 |
| 45–54 | 33 | 7 | 10 | 0 | 1 | 0 | 6 | 0 |
| 55–64 | 17 | 22 | 6 | 2 | 1 | 0 | 8 | 1 |
| 65–74 | 23 | 9 | 2 | 0 | 1 | 0 | 8 | 8 |
| 75+ | 19 | 23 | 1 | 1 | 0 | 0 | 52 | 88 |
| Total | 358 | 171 | 66 | 8 | 8 | 3 | 100 | 99 |
| Age group (in years) | Suicide and self-inflicted injury | Homicide | All other injury and poisoning | Total external causes | ||||
|---|---|---|---|---|---|---|---|---|
| M | F | M | F | M | F | M | F | |
| 0–14 | 8 | 4 | 7 | 3 | 22 | 9 | 84 | 38 |
| 15–24 | 105 | 35 | 3 | 5 | 29 | 5 | 259 | 92 |
| 25–34 | 111 | 25 | 8 | 9 | 37 | 10 | 256 | 69 |
| 35–44 | 83 | 29 | 4 | 6 | 20 | 6 | 182 | 67 |
| 45–54 | 47 | 16 | 4 | 1 | 18 | 2 | 119 | 26 |
| 55–64 | 43 | 7 | 3 | 1 | 23 | 1 | 101 | 34 |
| 65–74 | 28 | 10 | 2 | 0 | 9 | 5 | 73 | 32 |
| 75+ | 20 | 6 | 1 | 0 | 14 | 15 | 107 | 133 |
| Total | 445 | 132 | 32 | 25 | 172 | 53 | 1,181 | 491 |
Table 8.2. Sites of fatal non-transport accidents1, 1996–98
| Place of occurrence | Number of accidents | Crude rate per million of population | ||||
|---|---|---|---|---|---|---|
| 1996 | 1997 | 1998 | 1996 | 1997 | 1998 | |
1Excludes surgical and medical misadventure and later complications, and late effects of injuries. Source: New Zealand Health Information Service | ||||||
| Home | 598 | 624 | 623 | 165 | 166 | 164 |
| Farm | 23 | 16 | 20 | 6 | 4 | 5 |
| Mine and quarry | 2 | 1 | 2 | 1 | 0 | 1 |
| Industrial premises | 16 | 22 | 10 | 4 | 6 | 3 |
| Recreation/sport | 18 | 26 | 14 | 5 | 7 | 4 |
| Street/highway | 47 | 38 | 44 | 13 | 10 | 12 |
| Public building | 25 | 34 | 29 | 7 | 9 | 8 |
| Residential inst | 112 | 120 | 89 | 31 | 32 | 24 |
| Other specified place | 165 | 183 | 175 | 46 | 49 | 46 |
| Place not specified | 101 | 72 | 42 | 28 | 19 | 11 |
| Total | 1,107 | 1,136 | 1,048 | 306 | 302 | 276 |
New Zealand was the first country in the world to introduce comprehensive 24-hour, no-fault personal accident insurance cover for people injured in accidents. The accident compensation scheme was created by legislation and took effect in 1974. It replaced a statutory workers’ compensation scheme, compulsory third-party motor vehicle accident insurance and a criminal injuries compensation scheme. It also removed the common law right to sue for damages in return for support for injured people, no matter who was at fault.
All Black Andrew Merhtens receives on-field treatment.
Between 1974 and 1998, the scheme was amended from time to time, mainly to keep its entitlements in line with social changes. Essentially, it covered all New Zealand residents, New Zealand residents temporarily overseas and overseas visitors in New Zealand. The scheme is managed by a statutory corporation, the Accident Compensation Corporation (commonly known as ACC), formerly the Accident Compensation Commission.
The Accident Insurance Act 1998 dramatically altered the scheme's structure by introducing competition to the market for work-related accident insurance. The Accident Insurance Amendment Act 2000 and the Accident Insurance (Transitional Provisions) Act 2000 returned ACC as the compulsory state provider of workplace accident insurance. From 1 July 2000, ACC was again able to provide accident insurance for all work and non-work injuries for all New Zealanders. Private insurers continue to manage any ongoing claims that occurred between 1 July 1999 and 30 June 2000.
The Injury Prevention, Rehabilitation and Compensation Act, passed in September 2001, came into effect from 1 April 2002. This act reintroduces lump sum payments for injuries resulting in permanent impairment, requires ACC to develop a code of claimant rights, and makes a number of changes to entitlements for injured people.
ACC is a Crown entity with a board of directors appointed by the Minister for Accident Insurance. A service agreement between the board and the minister specifies the desired outcomes and objectives of ACC and acts as an accountability mechanism. In the financial year to 30 June 2001, ACC accepted 1.4 million claims (see table 8.21). Approximately 130,000 involved moderate or serious injury, while the remainder involved basic medical attention for claimants. In addition to new claims, ACC continues to provide support to people for the ongoing effects of injuries received in previous years.
Services. The main services or compensation that ACC provides to injured people are:
The costs of their retrieval from the accident scene, when ambulance or air transport is necessary.
The costs of physical rehabilitation, including the costs of some public hospital and private hospital treatment; a contribution to the costs of ‘primary health care providers', such as general practitioners, for consultations and treatment relating to minor injury; and some contribution to the costs of travel to treatment.
Compensation for loss of earnings. These are weekly payments, equivalent to 80 percent of the claimant's pre-injury income, for the period in which the claimant is unable to work because of the accident. When the injured person is able to continue some work with reduced earnings, abated compensation is available.
Vocational support providing injured people with retraining, which allows them to return, where possible, to their former capacity for work, or to alternative work.
A range of personal support, designed to make living with the results of an accident more comfortable. This support can include the payment of an independence allowance, the modification of homes and vehicles for those with lasting incapacity, and a range of care services for those unable to manage the normal routine of their daily life without help.
Funding. ACC is funded by all New Zealanders. Legislation in 1998 changed the way ACC calculates its premiums. The funding reserves policy moved from a ‘pay-as-you-go’ basis to a ‘fully funded’ basis. This change requires ACC to set premiums today to cover the full future costs of each claim, and to establish reserves to meet the full future entitlements of people injured in the past. This brings ACC into line with usual insurance practice. It also means each generation pays the costs of its own accidents, rather than passing costs on to future generations, as with pay-as-you-go premiums. ACC receives income from:
Earners, who pay a premium based on their total earnings, collected with PAYE tax.
Motor vehicle owners, who pay part of their annual registration fee for motor vehicles and a tax of two cents a litre on all petrol sales to ACC.
The government, which meets costs for people not earning an income.
All employers and self-employed people.
The investment of funds it holds to cover the cost of claims.
Costs. Injury costs are assigned to one of seven separate accounts:
The employers’ account meets the cost of all work-related injuries from 1 July 2000 and for those employees not covered by private insurers from 1 April 2000. The account is funded from employer premiums.
The self-employed work account meets the cost of injuries to those self-employed people who chose to remain covered by ACC from 1 July 1999 and all injuries to self-employed people from 1 July 2000.
The residual claims account meets the cost of work injuries occurring before July 1999 and non-work injuries to earners occurring before 1 July 1992. Work injuries occurring prior to 1 July 1999 and non-work injuries of workers sustained before 1 July 1992 are funded from this account. This is funded by employers and self-employed people.
The earners' account meets the cost of injuries occurring to earners outside their workplace post-1992 (often injuries resulting from accidents in the home or in sport or recreation). They do not include injuries involving motor vehicles on public roads. The account is funded from the earners’ premiums.
The non-earners' account meets the cost of all injuries (except those involving motor vehicles on public roads) to people who are not in the workforce. This account is funded by a direct payment from the government.
The motor vehicle account meets the costs of all injuries involving motor vehicles on public roads. It is funded from motor vehicle premiums and petrol tax.
The medical misadventure account meets the cost of injuries that result from error by medical practitioners, or from rare and severe outcomes of medical or surgical procedures. It is funded from the earners’ and non-earners’ accounts.
In the year to 30 June 2001, ACC's income totalled $2,198 million and total expenditure was $1,746 million.
Table 8.21. Total ACC claims registered by year and account to 30 June 2001
| 1994/95 | 1995/96 | 1996/97 | 1997/98 | 1998/99 | 1999/2000 | 2000/01 | |
|---|---|---|---|---|---|---|---|
| Source: Accident Compensation Corporation | |||||||
| Earners' | 376,341 | 394,982 | 413,673 | 417,014 | 413,716 | 400,971 | 449,837 |
| Employers' | ... | ... | ... | ... | ... | 323 | 155,264 |
| Medical misadventure | 994 | 869 | 757 | 510 | 513 | 654 | 432 |
| Motor vehicle | 46,282 | 45,084 | 43,571 | 46,019 | 43,787 | 33,764 | 32,500 |
| Non-earners' | 708,590 | 700,886 | 728,799 | 741,619 | 799,183 | 711,919 | 732,946 |
| Residual claims | 280,204 | 280,476 | 281,177 | 258,923 | 242,471 | 9,028 | 1,314 |
| Self-employed work | ... | ... | ... | ... | ... | 35,131 | 50,679 |
| Total | 1,412,411 | 1,422,297 | 1,467,977 | 1,464,085 | 1,499,670 | 1,191,790 | 1,422,972 |
Accident compensation statistics. ACC collects a number of statistics on compensated claims. Compensated claims largely exclude injuries causing fewer than eight days’ incapacity (for which ACC is not required to pay earnings-related compensation) and claims for medical treatment only (for which the doctor is normally reimbursed directly by ACC). ACC's website is www.acc.co.nz
Accident Insurance Regulator. The Accident Insurance Regulator (AIR) was established by the Accident Insurance Act 1998 to administer the act and to monitor the performance of the accident insurance market. Under the Accident Insurance (Transitional Provisions) Act 2000, the provision of accident insurance returned to a single public fund, administered by the ACC. The primary role of the regulator's office is to monitor the performance of registered insurers with respect to claims made against accident insurance contracts during 1999/2000; to manage the non-compliers fund, which funds claims made by claimants whose employer did not have an accident insurance contract in force at the time of injury; to collect data relating to personal injury claims; and to publish injury statistics relating to claims.
The emphasis of the Ministry of Civil Defence and Emergency Management Te Rākau Whakamarumaru is on seeking sustainable, long-term solutions to managing risks arising from emergency events, either natural, such as earthquakes, or technological, such as chemical spills, by ensuring that effective risk management is seen as an integral part of day-to-day business decision making. Part of this process is development of a new civil defence emergency management group (CDEMG) structure, which groups together local authorities for emergency management purposes. CDEMGs are seen as ideal mechanisms for supporting the move to a more focused approach to risk management.
A fire service safety officer installs a free smoke alarm.
Hazard information on-line. The Ministry for Civil Defence and Emergency Management has revamped its website to maximise opportunities offered by the internet. The site has three specific objectives:
To provide information for all New Zealanders on the hazards we face and how to be prepared to cope in an emergency.
To provide a mechanism for the sharing of information on civil defence emergency management for those working in the sector.
To provide real time information during an emergency.
The site is highly accessible and adheres closely to State Services Commission guidelines on e-government. It pitches its content to parallel audiences, considering both the general public and emergency management professionals.
For families and households there are links to local body sites for local information and simple, practical advice for a variety of situations. The Kidsworld feature tells children how to learn what to do in tough situations, such as how to cope in an earthquake and how to look after pets during an emergency.
For professionals, links and documents provide latest local and international research and professional opinion. The website is www.civildefence.govt.nz
Natural disaster insurance is the responsibility of the Earthquake Commission (see Chapter 24.3: Insurance and superannuation).
Fire protection involves fire safety and operational fire fighting. These services are managed nationally by the New Zealand Fire Service, on behalf of the New Zealand Fire Service Commission. The primary emphasis on fire safety is determined by legislation in the Fire Service Act 1975.
New Zealand Fire Service Commission. The New Zealand Fire Service Commission is responsible for ensuring statutory requirements set down in the Fire Service Act 1975 are met. The commission consists of five commissioners appointed by the government and is the national purchasing and policy-setting agency. Established under the Forest and Rural Fires Act 1977 as the National Rural Fire Authority, the commission is responsible for coordinating 112 rural fire authorities operating in areas outside designated fire districts, where operational fire fighting is provided by the New Zealand Fire Service. The net cost of funding the commission, after allowing for miscellaneous income, is met by a levy on insured property collected by the insurance industry. For the year ended 30 June 2001, the levy totalled $193.37 million, compared with $182.89 million for the year ended 30 June 2000. Miscellaneous revenue amounted to $11.53 million, compared with $8.24 million for the 2000 year.
New Zealand Fire Service. Fire safety and fire prevention are the key aims of the New Zealand Fire Service. The service has an operating structure designed to deliver decision making response and resources to frontline operations. Senior managers are specifically responsible for fire safety and enhancement of fire safety technology.
Eight fire regions are responsible for fire safety programmes, fire fighting resources and the training and operational efficiency of brigades within their fire districts. Nineteen of 359 fire districts are served mainly by career firefighters, with some stations augmented by volunteers, while the remaining 340 districts are staffed by volunteers. Nationally in 2001, there were 1,690 career (1,515 in 1999), 8,000 volunteer (8,000 in 1999) and 3,000 rural (3,000 in 1999) firefighters and 426 (428 in 1999) support staff (including communications centres in Auckland, Wellington and Christchurch).
The New Zealand Fire Service has the responsibility to fight fires in all urban fire districts and, to the extent that its ability to fight fires is not compromised, to respond to other emergencies at which its fire fighting resources can improve outcomes.
Fire safety. The Fire Service Act 1975 requires the Fire Service Commission, as a matter of prime consideration, to take an active and coordinating role in promotion of fire safety. This includes working with other agencies to improve community knowledge about fire through public education, encouraging use of sprinkler systems, support of fire engineering qualifications at tertiary level, enforcement of fire safety law, rural fire prevention and provision of fire danger indices for various vegetation types in rural areas during the fire season.
Table 8.22 shows the number and nature of incidents attended by fire brigades for four consecutive years.
Table 8.22. Incidents attended by fire brigades
| Year ended 30 June | 1997/98 | 1998/99 | 1999/00 | 2000/01 |
|---|---|---|---|---|
1Relating to cars, trucks, vans, motorbikes and ships. 2Volunteer brigade attending an incident in another brigade's territory. Source: New Zealand Fire Service | ||||
| Fires | ||||
| Fires relating to structures | 7,112 | 6,544 | 6,677 | 5,499 |
| Mobile property fires1 | 3,540 | 3,580 | 3,296 | 2,622 |
| Vegetation fires | 5,091 | 4,211 | 3,731 | 4,325 |
| Chemicals, flammable liquids and gases fires | 141 | 120 | 124 | 79 |
| Miscellaneous fires | 8,407 | 7,082 | 6,157 | 6,698 |
| Total, fires | 24,291 | 21,537 | 19,985 | 19,223 |
| Fatalities (all fires) | 46 | 41 | 30 | 44 |
| Hazardous emergencies | ||||
| Flammable liquid, gas incidents | 609 | 659 | 642 | 591 |
| Chemical, biohazard, radioactive incidents | 153 | 154 | 126 | 93 |
| Mobile properties hazardous incidents1 | 4,545 | 5,556 | 5,867 | 4,195 |
| Other | 794 | 796 | 799 | 944 |
| Total, hazardous emergencies | 6,101 | 7,165 | 7,434 | 5,823 |
| Special service calls | ||||
| Animal rescue | 408 | 416 | 384 | 329 |
| Repair roof | 223 | 326 | 136 | 224 |
| Other, including assisting ambulance or police | 4,224 | 4,560 | 4,434 | 5,193 |
| Total, special service calls | 4,855 | 5,302 | 4,954 | 5,746 |
| Natural disasters | ||||
| Earthquake | 0 | 8 | 3 | 0 |
| Volcanic eruption | 4 | 2 | 3 | 2 |
| Tsunami, tidal waves | 2 | 7 | 0 | 5 |
| Flood | 551 | 1,386 | 701 | 621 |
| Wind storm, tornado, cyclone etc | 303 | 657 | 152 | 502 |
| Natural disasters – not classified above | 3 | 16 | 10 | 6 |
| Total, natural disasters | 863 | 2,076 | 869 | 1,136 |
| False alarms | ||||
| Good intent | 6,580 | 7,131 | 6,522 | 6,874 |
| Malicious | 1,757 | 1,947 | 2,126 | 1,796 |
| Defective apparatus/installation | 6,977 | 7,895 | 7,511 | 6,679 |
| Accidental operation | 4,936 | 4,995 | 5,748 | 5,968 |
| Other | 2,237 | 2,703 | 2,541 | 3,391 |
| Total, false alarms | 22,487 | 24,671 | 24,448 | 24,708 |
| Other emergencies | ||||
| Over pressure, rupture, explosives, over heating | 437 | 414 | 432 | 349 |
| Rescue, emergency, medical call | 2,650 | 2,890 | 1,253 | 1,478 |
| Mutual aid, cover moves2 | 46 | 66 | 2 | 21 |
| Total, other emergencies | 3,133 | 3,370 | 1,687 | 1,848 |
| All incident types | 61,730 | 64,121 | 59,377 | 58,484 |
Primary responsibility for the provision of occupational safety and health policy advice and services is held by the Occupational Safety and Health Service (OSH) of the Department of Labour. The Accident Compensation Corporation (ACC) also plays a major role in workplace injury prevention.
The predominant piece of occupational safety and health legislation is the Health and Safety in Employment Act 1992. Its principal objective is the prevention of harm to employees at work, with three means of achieving this:
Promoting excellence in health and safety management.
Prescribing, and imposing on employers and others, duties to prevent harm to employees.
Providing for the making of regulations and approved codes of practice relating to hazards to employees.
The act sets out the responsibilities of employers, employees, principals to contracts and others who exercise control of places of work, in managing the risks they face in their day-to-day work. It provides for detailed guidance material to be created to assist those with responsibilities to meet the act's requirements and allows for regulations to be made for specific industries, processes or hazards, with which compliance is mandatory. The act also allows for approved codes of practice to be made, after consultation with industry, which are not mandatory, but are statements of preferred or best practice.
Under the act, employers have primary responsibility for ensuring the health and safety of their workers by:
Providing a safe and healthy working environment.
Implementing effective hazard identification and control methods.
Providing training and supervision of their employees.
Involving employees in the development of procedures for dealing with hazards and emergencies.
Recording and investigating accidents and incidents so that injury prevention activities can be undertaken.
Employees are also responsible for ensuring their work does not endanger the health and safety of themselves or others. People who control a place of work, the self-employed and principals to contracts also have responsibilities to protect the safety and health of employees and others at work.
The Health and Safety in Employment Act 1992 is currently under review by the government. The review has been based on the premise that the underlying approach of the act is sound, but that further incentives could be provided to encourage workplaces to develop a culture where more priority is given to health and safety. With this in mind, proposals for amending the legislation are being considered under three categories:
Improving its coverage.
Encouraging a greater sense of partnership between employers and employees.
Providing greater incentives for compliance through enforcement measures.
OSH's principal goal is to achieve a 30 percent improvement in workplace health and safety from 1999/2000 to 2005/06. To do this, it is targeting industry sectors with the highest rates of workplace illness and injury, based primarily on ACC claim rates. To achieve its goal, the service has adopted a number of business strategies, including:
Partnership – working together with clients to implement good health and safety management.
Collaboration – working with other organisations to improve outreach to workplaces, employers and employees.
Outcomes – checking and achieving results, especially in terms of customer service and continuing compliance.
Raising awareness of the social and economic costs of workplace injury and disease.
In delivering its strategies, OSH works in close cooperation with industry, Crown agencies and other community groups in order to increase its reach and penetration of the labour market.
The service operates under the legislative framework of the Health and Safety in Employment Act 1992, the Hazardous Substances and New Organisms Act 1996 and regulations made under the Machinery Act 1950. The service has 14 regional offices and a Wellington head office. Of 278 staff, 173 are field staff, including health and safety inspectors or occupational medicine specialists. During 2000/01, OSH field staff carried out 18,739 proactive visits to workplaces and completed an additional 9,087 investigations in response to notifications or complaints.
Funding is through a levy on employers, collected with ACC levies and currently set at five cents per $100 of wages paid. OSH's budgeted Crown funding for the 2001/02 year was $25,276 million to provide policy advice ($1,313m), promote excellence in self-managing occupational safety and health hazards in the workplace ($22,035m) and for regulatory functions outside the Health and Safety in Employment Act 1992 ($1,928m).
The service investigates all workplace fatalities and works closely with emergency services, local authorities and defence forces in the area of explosives and dangerous goods and hazardous substances affecting public safety. OSH also surveys agents certifying the safety of hazardous equipment, and audits workplaces for compliance with the law.
Table 8.23 lists the number of fatal accidents, by industry, investigated by OSH for the years 1995 to 2001.
In the 2000/01 financial year, OSH investigations led to the commencement of 136 prosecutions, resulting in 118 convictions. The OSH website is www.osh.dol.govt.nz
Table 8.23. Fatal accidents investigated by OSH, by industry
| Industry | Year ended 30 June | ||||||
|---|---|---|---|---|---|---|---|
| 1995 | 1996 | 1997 | 1998 | 1999 | 2000 | 2001 | |
| Source: Occupational Safety and Health Service, Department of Labour | |||||||
| Agriculture and hunting | 4 | 14 | 12 | 15 | 13 | 18 | 17 |
| Forestry and logging | 11 | 11 | 9 | 9 | 9 | 4 | 7 |
| Construction | 16 | 18 | 10 | 17 | 13 | 17 | 9 |
| Other | 14 | 10 | 10 | 15 | 9 | 18 | 7 |
| Total | 45 | 53 | 41 | 56 | 44 | 57 | 40 |
Occupational disease. OSH maintains a Notifiable Occupational Disease System (NODS), with voluntary reporting of suspected cases by health professionals. OSH medical staff investigate all notifications of suspected occupational disease or illness. This involved 939 cases 1998/99 and 812 cases in 1999/2000 (see table 8.24).
Table 8.24. Occupational disease notifications
| Disease category | Year ended 30 June | |||||
|---|---|---|---|---|---|---|
| 1995 | 1996 | 1997 | 1998 | 1999 | 2000 | |
1Notifiable Occupational Disease System classifications were reorganised for notifications received after 1 July 1998, meaning some categories of data are not directly comparable with others from this date. Source: Occupational Safety and Health Service, Department of Labour | ||||||
| Asbestos-related disease | 132 | 67 | 71 | 58 | } | } |
| Occupational asthma | 97 | 81 | 67 | 61 | }1111 | }1081 |
| Other occupational respiratory disease | 34 | 31 | 24 | 12 | } | } |
| Occupational disease due to chemical exposure | 115 | 94 | 91 | 82 | 65 | } }80 |
| Chronic solvent-induced neurotoxicity | 63 | 72 | 42 | 54 | 32 | |
| Occupational cancer | 3 | 2 | 4 | 5 | 8 | 13 |
| Occupational illness due to infection | 49 | 61 | 45 | 58 | 50 | 56 |
| Occupational noise-induced hearing loss | 575 | 612 | 597 | 353 | 383 | 330 |
| Occupational overuse syndrome/osteoarthritis | 760 | 828 | 826 | 426 | 202 | 135 |
| Occupational skin disease | 91 | 106 | 36 | 24 | 39 | 44 |
| Other | – | – | – | – | 491 | 461 |
| Total | 1,919 | 1,954 | 1,803 | 1,133 | 939 | 812 |
8.1 Ministry of Health; Health Research Council of New Zealand; Malaghan Institute of Medical Research; Medical Council of New Zealand; Dental Council of New Zealand; Nursing Council of New Zealand; Registration Boards Secretariat Ltd; Physiotherapy Board; Pharmaceutical Society of New Zealand; Dental Technicians’ Board.
8.2 Ministry of Health; PHARMAC.
8.3 Ministry of Health; Alcohol Advisory Council of New Zealand; Alcohol and Public Health Research Unit, Auckland University; Statistics New Zealand.
8.4 Ministry of Health; Abortion Supervisory Committee.
8.5–6 Ministry of Health.
8.7 Land Transport Safety Authority; Water Safety New Zealand; Ministry of Health.
8.8 Accident Compensation Corporation; Accident Insurance Regulator, Department of Labour.
8.9 Ministry of Civil Defence and Emergency Management; Statistics New Zealand; New Zealand Fire Service Commission.
8.10 Occupational Safety and Health Service, Department of Labour.
Statistics New Zealand divisional manager responsible: Denise Brown.
An Overview of the Health and Disability Sector (2001). Ministry of Health, Wellington
Immunisation Handbook (2001). Ministry of Health, Wellington.
Implementing the New Zealand Health Strategy (2001). Ministry of Health, Wellington.
Key Statistics (monthly). Statistics New Zealand, Wellington.
Report of the Abortion Supervisory Committee (Parl paper E.28).
Report of the Alcohol Advisory Council of New Zealand (Parl paper E.26).
Report of the Health Research Council (Parl paper E.11).
Report of the Health Sponsorship Council (Parl paper E.45).
Report of the Ministry of Health (Parl paper E.10).
Report of Pharmaceutical Management Agency Ltd (PHARMAC) (Parl paper E. 39).
Social Inequalities in Health. New Zealand 1999 (2000). Ministry of Health, Wellington.
The New Zealand Health Strategy (2000). Ministry of Health, Wellington.
Annual Report (annual). New Zealand Water Safety Council, Wellington.
Discussion paper on the review of the Health and Safety in Employment Act 1992 (2000). Office of the Minister of Labour, Wellington.
Report of the Accident Compensation Corporation (Parl paper E.19).
Report of the Department of Labour (Parl paper G.1) (includes Occupational Safety and Health).
Report of the Land Transport and Safety Authority (Parl paper F. 13).
Report of the New Zealand Fire Service Commission (Parl paper G.8).
www.acc.co.nz – Accident Rehabilitation and Compensation Insurance Corporation
www.alcohol.org.nz – Alcohol Advisory Council of New Zealand
www.healthcamps.org.nz – Children's Health Camps
www.dentalcouncil.org.nz – Dental Council of New Zealand
www.dentaltec.org.nz – Dental Technicians’ Board
www.dol.govt.nz – Department of Labour
www.fpanz.org.nz – Family Planning Association
www.hdc.org.nz – Health and Disability Commissioner
www.hrc.govt.nz – Health Research Council
www.healthsponsorship.co.nz – Health Sponsorship Council
www.ltsa.govt.nz – Land Transport Safety Authority
www.malaghan.org.nz – Malaghan Institute of Medical Research
www.mcnz.org.nz – Medical Council of New Zealand
www.mentalhealth.org.nz – Mental Health Foundation
www.civildefence.govt.nz – Ministry of Civil Defence and Emergency Management
www.moh.govt.nz – Ministry of Health
www.transport.govt.nz – Ministry of Transport
www.ndp.govt.nz – National Drug Policy
www.otago.ac.nz/prevmed/npc.html – National Poisons and Hazardous Chemicals Information Centre
www.nrl.moh.govt.nz – National Radiation Laboratory
www.nzaf.org.nz – New Zealand Aids Foundation
www.fire.org.nz – New Zealand Fire Service Commission
www.healthcamps.org.nz – New Zealand Foundation for Child and Family Health Development
www.nzhis.govt.nz – New Zealand Health Information Service
www.nursingcouncil.org.nz – Nursing Council of New Zealand
www.osh.dol.govt.nz – Occupational Safety and Health
www.pharmac.govt.nz – Pharmaceutical Management Agency Ltd (PHARMAC)
www.psnz.org.nz – Pharmaceutical Society of New Zealand
www.huttvalleydhb.org.nz – Public Health Service
www.regboards.co.nz – Registration Boards Secretariat Ltd
www.stats.govt.nz – Statistics New Zealand
www.spinz.org.nz – Suicide Prevention
www.watersafety.org.nz – Water Safety New Zealand Inc
www.wnmeds.ac.nz – Wellington School of Medicine
Table of Contents
Capping it off: Two 2001 Massey graduates celebrate their success.
In an internationally competitive knowledge economy, high quality education and lifelong learning are critical for the social and economic well-being of New Zealand. Teaching and learning need to reflect the reality that today's society needs innovative people with skills and knowledge built through diverse qualifications.
Good communication and interpersonal skills, as well as the skills required in developing new knowledge and applying new learning, are critical in a world where relationships and networking are of growing strategic importance.
New Zealand school leavers today need strong foundations in literacy and numeracy, as well as developed critical-thinking, problem-solving, information-management and creative skills. They also need a good knowledge base from which they can apply their skills and achieve a qualification. A sense of being a New Zealander, the social skills and attitudes required to be a good citizen, and strength and security in their own identity and culture are also necessary.
To meet these challenges, there have been significant shifts in emphasis throughout the education sector in recent years aimed at meeting the individual needs of students and providing a solid platform for their ongoing learning.
Options for tertiary learning have mushroomed and now include institution-based study, on-line learning, distance and extramural study, and on-the-job training. Compared with other Organisation for Economic Cooperation and Development (OECD) countries, the number of adults accessing tertiary education in New Zealand is high.
Academic and vocational education are no longer rigidly separated: universities and polytechnics offer a mixture of academic, professional and vocational studies; wānanga provide tertiary education in a Māori context, using the Māori language; and private training establishments offer courses in niche areas.
The information technology revolution has broadened the accessibility and scope of education. Children learn vital skills using computers, while physically isolated students can link to lessons delivered electronically through video conferencing and tele-teaching. Teachers and administrators can share ideas and resources across large distances and a plethora of tertiary courses can be undertaken electronically.
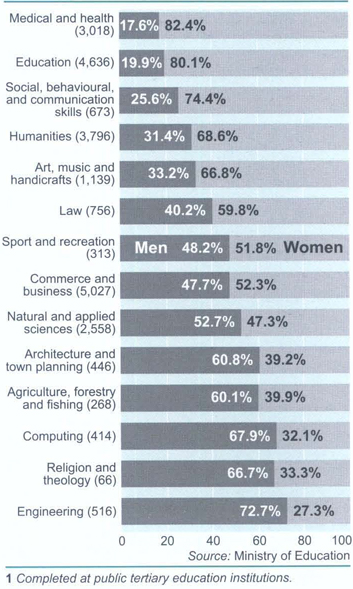
The school Information and Communication Technology (ICT) strategy, developed in 1998 and now under review, aims to incorporate ICT in student learning. The strategy includes the use of ICT to deliver the curriculum, to raise the skill and confidence of teachers, to make learning more accessible to communities and to increase the efficiency and effectiveness of education administration. By focusing on improving students’ knowledge, understanding, skills and attitudes through effective learning and teaching, and efficient management and administration, the strategy provides for further development of the ICT infrastructure throughout the education sector. (See sidebar below).
Educational success relies on input from parents, family, whānau and the community, as well as good access to early childhood services, schools and tertiary services responsive to the diverse needs of students. The Pasifika Education Plan aims to increase Pacific students’ participation and achievement in education. Working with Māori creates opportunities for traditional tribal and non-tribal Māori organisations to be directly involved in supporting and providing local education programmes. Iwi and Māori organisations have also been fundamental in driving increased wānanga enrolments and the development of kura kaupapa Māori.
The focus on lifelong learning has evolved alongside changes to the school curriculum and to qualifications. These see greater collaboration between early childhood education centres and schools and offer a more seamless progression from early childhood education through primary and secondary schools to tertiary and other higher education and training.
Responding quickly and effectively to rapid advances in ICT and to the vast potential of e-learning will be a vital part of 21st century education. So too will be responding quickly through education to economic, social and environmental issues.
The major challenges to achieving current education goals are improved teacher capability, equitable access to ICT, and higher success rates for Māori and Pacific students.
Education in New Zealand is continually evolving to meet the challenges and demands of a rapidly-changing learning environment. New ways of acquiring a more diverse range of skills have opened up alongside curriculum development and a new system of qualifications that encourages continued education by allowing a smoother progression through the education sectors and beyond.
The New Zealand school curriculum identifies learning outcomes across seven essential learning areas for year 1 to year 10 students and provides the basis for qualifications in years 11 to 13. The curriculum also includes a focus on essential skills, attitudes and values to ensure students have the interest, motivation and skills to undertake further learning. The curriculum provides flexibility to enable teachers to develop classroom programmes to meet diverse needs, and ensures the achievement and progress of all students is monitored using improved assessment tools. While literacy and numeracy continue to be priorities, the curriculum supports learning that encourages creative thinking, problem solving and healthy attitudes to oneself and others.
Use of the preschool curriculum document Te Whāriki is a prerequisite for chartering early childhood services and their eligibility for government funding.

Kindergarten children practise woodwork.
The school curriculum, underpinned by a set of principle statements, sets out the outcomes of learning in eight levels across seven essential learning areas, eight essential skills, and attitudes and values to be fostered in all schools. This may mean students learn about different subject areas at different levels in the same time period, for example working at level 4 English and level 6 mathematics in the same school year.
Integration of curriculum and qualifications is a central part of the lifelong learning philosophy behind development of the National Qualifications Framework (NQF). The NQF, a quality-assured and nationally-recognised framework, is designed to record achieved knowledge, understanding and skills.
The NQF has 10 levels. Certificates awarded at Levels 1–3 include the new secondary education qualification, the National Certificate of Educational Achievement (NCEA), whose first level was introduced in 2002, and at Level 4, New Zealand Scholarship. At Levels 5 and 6 are diplomas, at Level 7 bachelor degrees, graduate diplomas and certificates, at Level 8 postgraduate diplomas and certificates, and bachelors degrees with honours, at Level 9 masters degrees, and at Level 10 doctorates.
All qualifications are based on learning outcomes, with credits as the common currency. Credits are gained through assessment against unit and achievement standards. Administered by the New Zealand Qualifications Authority, the framework integrates senior secondary school, industry training and tertiary education into a comprehensive, flexible qualification system that provides recognition of learning at any stage of life from secondary school onwards.
Early childhood education. The Ministry of Education recognises that quality early childhood education helps build strong foundations for future learning. A strategic plan for early childhood education (ECE) was to be published in 2002 to provide a framework for ECE policy for the next 10 years. This framework is likely to result in significant changes for the early childhood education sector. The aim of the plan is to improve quality and to increase participation and cooperation in early childhood education. It links early childhood education and other government policy goals, particularly those in labour market, health and welfare policies.
Central to improving the quality of ECE is a move to significantly increase the number of qualified early childhood teachers. Licensed ECE centres and home-based care networks (excluding kōhanga reo and playcentres) are required to have a person responsible, or a coordinator, with a Diploma of Teaching (ECE) by 1 January 2005, or 1 January 2002 for people new to these positions.
To achieve a significant increase in the number of qualified early childhood education teachers, the government has put in place a number of schemes to assist people to undertake early childhood education teacher training. These include a recognition of prior learning scheme, incentive grants for ECE services to help them meet some of the costs associated with upgrading staff qualifications, and TeachNZ scholarships for Māori and Pacific peoples undertaking ECE teacher training.
Introduction of equity funding will assist eligible ECE services in providing quality education and care for children in their communities. The additional funding will be targeted at community-based ECE services in low socio-economic and isolated communities, those based on a language and culture other than English, and/or those that have significant numbers of children with special education needs. A campaign to increase Māori and Pacific participation in ECE is working with local communities to assess barriers to ECE participation and put solutions to those barriers in place.
Otago University, New Zealand's oldest.
The latest report of the longitudinal research study into competent children, Competent Children at 10, illustrates that quality early childhood education continues to have an impact on children's competencies five years later.
Primary and secondary schools. The school sector has increased its focus on raising the levels of knowledge and skills of its students, especially in the areas of literacy and numeracy, critical thinking, problem solving, and communication and information skills. Reform of the curriculum, a new qualifications system and increasing focus on ICT are central to these changes.
A major international report released in December 2001 ranked New Zealand 15-year-olds third in reading literacy, third in mathematical literacy and sixth in scientific literacy. The Organisation for Economic Cooperation and Development report presented results of a survey of more than a quarter of a million 15-year-olds in 32 countries.
Level 1 of the new National Certificate of Educational Achievement replaced School Certificate in 2002. This will be followed by Level 2 in 2003, replacing Sixth Form Certificate, and Level 3 in 2004, replacing University Entrance, bursaries and Higher School Certificate. In 2004 the New Zealand Scholarship at Level 4 will be introduced. The NCEA recognises a broader range of student achievement across a wider range of subjects, including practical, research, technological and creativity skills. By recognising a wider set of skills through a range of learning opportunities, the NCEA gives greater flexibility for separate achievement at different levels.
ICT is changing the way teachers and students operate. Through networking within and between schools, technology helps the sharing of knowledge and resources. While limited bandwidth remains a major issue for some schools, all New Zealand secondary schools and 98 percent of primary schools had some form of internet access in 2001. Fifty-one ICT professional development clusters, involving more than 500 schools, have been established to develop teacher skills and confidence in the effective use of ICT for administrative and classroom work. Principals in Northland rural schools use e-mail to share policies and collaborate on administrative requirements, freeing up meeting time to focus on teaching and learning. Some whare kura and Māori boarding school clusters use video conferencing to teach senior secondary subjects, making the most of their small core of specialist teachers. By creating a much larger virtual school, students can access top teachers in each subject.
The Kaupapa Ara Whakawhiti Matauranga (KAWM) ICT project won the top award and best education project at the 2001 Telecommunications Users’ Association of New Zealand innovation awards. KAWM, a national video-conferencing network where lessons are shared on-line in real time, builds on the experiences of Cantatech begun in 1994. Cantatech, a group of 10 South Island secondary and area schools, shares delivery of 18 senior secondary subjects.
A number of community and enterprise initiatives have helped schools implement ICT programmes or gain computers, software and technical assistance. Others, like the Computers in Homes pilot project, are addressing the issues of unequal access to ICT, known as the digital divide.
Tertiary. Tertiary education has a crucial role in providing high quality teaching, research and learning opportunities to meet economic and social development needs.
In April 2000, a Tertiary Education Advisory Commission (TEAC) was established to develop a new strategic direction to focus the tertiary education system more effectively on serving New Zealand's social, economic and human capability development. The commission advised the government on ways to achieve a more cooperative and collaborative tertiary education sector, with a greater sense of partnership between individuals, local communities and industry. The commission completed four reports between July 2000 and November 2001 on a comprehensive strategic direction for tertiary education in New Zealand – Shaping a Shared Vision (July 2000), Shaping the System (February 2001), Shaping the Strategy (July 2001) and Shaping the Funding Framework (November 2001). A draft Tertiary Education Strategy 2002–2007 resulting from these reports was circulated for comment. The strategy, finalised in May 2002, sets a new direction in tertiary education, explicitly linking learning and research with New Zealand's economic and social development goals and priorities.
A Tertiary Education Commission (TEC) was to be established in July 2002 to implement the tertiary education strategy, to allocate funding of approximately $1.6 billion annually to public and private providers of tertiary education and training, and to build the capability of providers of tertiary education and training. A system of enhanced charters and profiles will be introduced for all publicly-funded tertiary education providers and industry training organisations.
Other key strands of the strategic refocusing of tertiary education are:
Establishment of the Centres of Research Excellence Fund to support world-class research to contribute to New Zealand's economic and social development.
Completion of an industry training review, which positions industry training as a crucial part of the tertiary system to facilitate delivery of the skills demanded by the economy.
Additional funding to public tertiary providers to improve participation, retention and completion rates of Māori in tertiary education.
Expansion of Modern Apprenticeships, which provides work-based education and training for young people and others wishing to start a new career to more than 1,200 apprentices, of whom about 20 percent are Māori.
Launch of the Pasifika Education Plan for increasing participation and achievement of Pacific students in tertiary education, and additional funding to public tertiary education providers to help achieve these goals.
Development of the Gateway programme to build links between schools and businesses to provide industry training for students.
Launch of the New Zealand Adult Literacy Strategy to develop adult literacy programmes so that New Zealanders can enjoy a level of literacy which enables them to participate fully in all aspects of life, including work, family and the community.
A report on Adult and Community Education (ACE), which provides advice on ways to improve the integration and focus of ACE in contributing to tertiary education learning achievement.
Advice from the e-learning advisory group to the Ministry of Education on ways to develop e-learning capability in the tertiary education sector.
Release of a discussion paper, Building Futures: Te Aro Whakamua, inviting submissions on ways to lift the foundation skills of those who did not acquire those skills at school.
New initiatives to improve student access to tertiary education include a fee stabilisation package for tertiary providers to prevent increases in course fees, a full interest write-off on student loans for full-time, full-year students and low income students, and additional funding to assist public tertiary education providers to adapt to the changing tertiary environment ahead of implementation of new funding and regulatory systems.
Improvements in collaboration and coordination of public tertiary education institutions to offer more effective and diverse education services include mergers between tertiary education institutions, and accords and working alliances between education institutions and industry bodies.
More than 250,000 tertiary students now study each year for formal qualifications such as a certificate, diploma or degree, and a similar number participate in informal tertiary learning in universities, polytechnics, industry training, youth training programmes and in community education.
Ministry of Education: Te Tāhuhu o te Mātauranga. The ministry's mission is to raise achievement and reduce disparity in learning outcomes for all New Zealanders by working closely with the education sector and the community. The ministry provides policy advice to the Minister of Education on all aspects of education, from early childhood to post-compulsory, including employment-related education and training; oversees the implementation of approved policies; and ensures the optimum use of education resources. The ministry is a leader in the implementation of the New Zealand Disability Strategy, and aims to involve disabled people increasingly in its policy and practice. It provides funding to early childhood centres, schools, universities, polytechnics, colleges of education and wānanga and ensures its distribution matches government policy. It approves charters in all of these institutions and also negotiates funding bids for tertiary institutions. Since February 2002 the ministry has provided special education services previously provided by Specialist Education Services. The ministry administers legislation and manages all education property owned by the Crown. It is responsible for developing national guidelines on all aspects of education, including national curriculum objectives. It also conducts research and collects education statistics. The ministry ensures the delivery of education advisory services, curriculum and early childhood development through contractual arrangements with other agencies. The ministry's website is www.minedu.govt.nz
Early Childhood Development (ECD): Ngā Kaitaunaki Kōhungahunga. ECD was established under the Education Act in 1989 as a Crown entity. Its role is to promote and encourage the development and provision of quality, accessible and appropriate early childhood services. ECD provides the following programmes:
Parents As First Teachers (PAFT) – ECD-trained parent educators deliver the PAFT curriculum to parents of children up to the age of three through a programme of regular home visits. This is an individualised, structured learning programme that focuses on child development and on providing information on how learning occurs in the early years.
Family Start – ECD-trained whānau workers deliver the PAFT curriculum and other services to high needs families through regular home visits. ECD is responsible for the training of Family Start whānau workers and for contract management for six of the Family Start sites.
Awhina Mātua – A service that works with families isolated from or not participating in parenting programmes and early childhood education services. The Māori-specific dimension is Whānau Development and the Pacific peoples-specific dimension is Fanau Pasifika.
Licence-exempt playgroups – ECD staff support licence-exempt playgroups to provide children and their families with early childhood education in a community setting, often characterised by rural isolation, high unemployment and limited access to other services. The playgroup model is responsive to the aspirations of families/communities to deliver culture-specific services, to remain licence exempt, or to develop and attain licensing and chartered status. Playgroups include groups for community languages, new migrants, refugees, women's refuges, Pacific Islands Early Childhood Groups (playgroups for communities based on values and languages) and Ngā Puna Kōhungahunga (playgroups for Māori parents and families who are not involved in mainstream services or te kōhanga reo, based on Māori values and language).
Developing Centres Fund – ECD assesses eligibility and disburses grants to new and existing licence-exempt groups and monitors and reports on grant use.
Licensing and chartering information and advice – This is provided to centre staff and managers, and to parents and communities. The purpose is to help early childhood centres meet licensing and chartering requirements and improve the quality of their services.
Professional development – Provision of professional support services for staff and management in licensed and chartered centres, associations and home-based schemes. Programmes include He Kete Oriori (professional development for Māori centres), He Kete Pasifika (professional development for Pacific peoples centres) and He Kete Atea (professional development for mainstream centres, including those that have Māori children and whānau as part of their client base.
Atawhaingia Te Pa Harakeke (Nurture the Family) – This is a national training and professional support programme for Māori and iwi social service providers to deliver two strands of services using Māori customs, practices, and values: Hakuitanga/Hakorotanga – a parenting support programme that highlights the importance of care and nurturing for babies and children; and He Taonga Te Mokopuna – a support programme for young children who have been affected by domestic violence and neglect. ECD provides these programmes under contract to the Department of Child, Youth and Family Services and to the Department of Courts.
Participation project – ECD staff support the Pacific peoples’ increased educational participation project (see sidebar), which identifies non-attending children and barriers to their non-attendance. Solutions are developed and implemented. The programme is administered under contract to the Ministry of Education.
The website for ECD is www.ecd.govt.nz
Special education. The aim of the government's special education policy is to improve learning opportunities for all children and young people with special education needs at their place of learning. Children and young people with special education needs include learners with disabilities, learning difficulties, communication or behaviour difficulties, and sensory or physical impairments. Resources provided include funding, therapy, staffing, equipment and other materials, transport, advice and support.
The government's policy affirms the right of every student to learn in accordance with the principles and values of the Education Act 1989, the National Education Guidelines, which include the National Education Goals, the Foundation Curriculum Policy Statements, the National Curriculum Statements and the National Administration Guidelines, as well as the Special Education Policy Guidelines.
Historically, young children and school students with special education needs have not had equal access to funding or quality education services throughout New Zealand. To address this, the Special Education 2000 policy has been implemented to:
Improve educational opportunities and outcomes for children with special education needs in the early childhood and school sectors.
Ensure there is a clear, consistent and predictable resourcing framework.
Provide equitable resourcing for those with similar needs, irrespective of school setting or geographic location.
Assist schools to take ownership in meeting the full range of students’ needs.
The policy encourages schools and early childhood centres to work closely with students, their families, whānau, communities and specialists to identify needs and together make the best decisions to meet these needs. Funding and support is provided by the Ministry of Education to enable schools and early childhood centres to provide services on behalf of children and young people with special needs. This is likely to involve a combination of specialists, particular educational programmes, in-classroom teacher support and special equipment. Special education settings range from mainstream classrooms and early childhood centres, kōhanga reo, kura kaupapa, attached classrooms, residential and day special schools, hospital schools, home schooling and the Correspondence School.
Many of the special services, guidance and advice were provided by Specialist Education Services (SES), a Crown-owned entity. From February 2002, all services provided by SES were transferred to a new part of the Ministry of Education and SES was disestablished. The change is part of an ongoing process of reviewing and improving special education policy.
New Zealand Qualifications Authority (NZQA): Mana Tohu Mātauranga o Aotearoa. NZQA is a Crown agency reporting directly to the Minister of Education. Its aim is to promote improvement in the quality of education and training in New Zealand. Its main functions are to:
Develop and maintain a comprehensive, flexible and accessible National Qualifications Framework.
Oversee the setting of standards for qualifications.
Ensure New Zealand qualifications are recognised overseas, and overseas qualifications are recognised in New Zealand.
Administer national examinations, both secondary and tertiary.
The website for NZQA is www.nzqa.govt.nz
The Education Review Office (ERO): Te Tari Arotake Mātauranga. The ERO is a government department whose sole purpose is to report publicly on the education and care of students in schools and early childhood centres. The ERO's findings inform decisions and choices made by parents, educators, managers and others. The chief executive of the ERO is the Chief Review Officer, who formally accredits individual review officers to carry out reviews in schools and early childhood centres. The functions and powers of the Chief Review Officer are described in the Education Act 1989. This act gives the Chief Review Officer the power to initiate reviews and to investigate, report and publish findings on the provision of education to all young New Zealanders. There are approximately 120 designated review officers in nine district offices and a Māori Education Unit. The ERO carries out accountability reviews, cluster reviews of educational institutions and services and national evaluations of education issues. It also provides contract evaluation services.
In an accountability review, the ERO investigates and reports to boards of trustees, early childhood centre managers and the government on the quality of education provided for students in individual centres and schools. Reviews of schools and centres are scheduled on the basis of prior performance, current risk appraisal and general review frequency. Schools and early childhood centres are reviewed every three to four years. Reviews are more frequent in particular cases, such as low quality performance or where there are major risks to students and their safety. ERO reports on individual schools and centres are available to the public. They can be obtained from the individual school or centre, from any ERO office or from the ERO website www.ero.govt.nz
The ERO also publishes national reports which evaluate specific education issues using information from its reviews. National reports cover areas such as curriculum, assessment, barriers to learning, principals and teachers, early childhood education, management, school types, cluster reports, senior school students and advice to parents.
Learning Media Ltd: Te Pou Taki Kōrero. Learning Media is a publishing company producing print, audio, video and computer software educational resources for teachers and children. Learning Media's background in educational publishing goes back to 1907, when the first issue of the School Journal was published. Learning Media has been a commercial Crown-owned company since 1993. Most of its current work involves publishing under contract to the Ministry of Education. Learning Media also provides publishing services for public and private sector clients, including the Museum of New Zealand: Te Papa Tongarewa, the Reserve Bank of New Zealand, the Electoral Commission, Curriculum Corporation (Australia), Creative New Zealand and Telecom New Zealand.
Learning Media develops and publishes its own titles for distribution to schools in New Zealand and overseas. The Ministry of Education pays for materials to be issued either free or at a small charge to schools.
Teacher Registration Board: Te Poari Kairehita Kaiako. The board is a Crown entity established under the 1989 Education Act. It maintains a register of teachers who fit the requirements of the act, are of good character, are fit to be teachers, are satisfactorily trained to teach and are satisfactory teachers in practice. Teachers are issued with a practising certificate valid for three years. There are 50,000 teachers with current practising certificates. Renewal of the practising certificate is dependent on teachers demonstrating that they are still satisfactory teachers. Names of teachers who have their registration cancelled are circulated to teacher employers. The board is funded from practising certificate fees paid by teachers.
Teacher registration is compulsory for teachers employed in all kindergartens and in all private and state schools. Teachers who do not meet registration requirements can be temporarily employed with a limited authority to teach, which must be renewed annually.
Kanohi ki te kanohi -education to the people Responding to findings of consultation work undertaken in 1997, the cabinet in June 2000 confirmed a communication programme to enhance Māori participation and achievement in education. This became the Whakaaro Mātauranga – Think Learning project, which incorporates a number of Māori education strategies, including the public information campaign Te Mana, Ki te Taumata, and recruitment of 23 pouwhakataki throughout New Zealand. The Whakaaro Mātauranga strategy has two key outcomes:
These outcomes will benefit non-Māori as well as Māori, as some of the barriers to educational achievement and greater participation are driven by socio-economic circumstances that Māori share with other New Zealanders. Much of the information produced, therefore, has wide audience appeal. A vital part of the programme is the kanohi ki te kanohi (face to face) element provided by the pouwhakataki. The name comes from a combination of pou (post – to signify they are grounded in the community and work in a defined geographical area) and whakataki (to inform and establish direction and leadership). To properly ‘ground’ each ‘pou', local iwi were heavily involved in the selection of each person and in setting conditions of employment and job descriptions. While much of the role of each pouwhakataki depends on the priorities and needs of his/her particular community, the essence of the job is to act as a bridge between the education sector and the local community. Source: Ministry of Education  School publication designers at Learning Media Ltd. |
The Teacher Registration Board operates reciprocal registration with the Australian states of South Australia and Queensland. The board is a member of the National Association of State Directors of Teacher Education and Certification (NASDTEC) in North America, the world's largest teacher licensing authority. This gives New Zealand access to NASDTEC's clearing-house for checking the licensing of all North American teachers. Links are also maintained with the Department for Education and Employment in England and with the General Teaching Council for Scotland. The board was replaced in February 2002 by the New Zealand Teachers Council.

Board of trustees members inspect school grounds.
New Zealand Council for Educational Research (NZCER). See following sidebar.
Māori Education Trust: Te Kaupapa Mātauranga mō te Iwi Māori. The purpose of the Māori Education Trust, as outlined in the Māori Education Foundation Act 1961, is to promote and encourage the better education of Māori and to provide financial assistance for that purpose. These aims were reconfirmed in October 1993 when the Māori Education Foundation formally became the Māori Education Trust.
The trust was set up to assist all Māori, regardless of age, gender, tribal affiliations or geographic location and this is still its kaupapa.
The trust is supported financially by both the government and New Zealanders, Māori and non-Māori, who care about education.
The trust has developed pilot initiatives under a programme called Whakamana Whānau.
These initiatives are aimed at improving educational opportunities for Māori students in primary and secondary schools. Some of these programmes have included te reo Māori, maths, science, cooperative reading, learning to learn, a young Māori writers” course and a summer school for young Māori artists.
The trust administers and co-sponsors 29 scholarships, bursaries and grants for Māori attending secondary, tertiary and postgraduate courses, both in New Zealand and overseas. The sponsor parties include trusts set up by prominent Māori and other individual New Zealanders, as well as business and community organisations.
The trust is the major sponsor of Ngā Manu Korero national Māori speech competitions held annually for secondary school students. The trust co-sponsors these competitions with the New Zealand Post Primary Teachers Association. These competitions allow Māori students to participate in either te reo Māori or the English language. Taonga awarded give both successful students and their schools considerable mana. Non-Māori New Zealanders may participate in the Māori language section.
The trust distributed $2.4 million for Māori education in 2000 and as at 31 December 2000 it had assets of $11.5 million.
Boards of trustees. All state and state-integrated primary, intermediate and secondary schools in New Zealand are governed by boards of trustees. Members of a board are elected by parents of students enrolled at the school. Members include three to seven parent representatives, the principal of the school and a staff representative. Where there are students enrolled full time in Year 9 or above (Form 3), a student representative must be elected to the board.
Boards may co-opt additional members, to ensure, for instance, that there is a gender balance and that the board reflects the ethnic and socio-economic diversity of the student body of the school. The proprietors of integrated state schools have the right to appoint up to four representatives to the board of trustees, which limits the ability of integrated schools to co-opt.
Each board of trustees has a large measure of autonomy in its control of the management of its school. It has responsibility for payment of ancillary staff salaries, allocation of designated management units in schools and for the allocation of funds for the operational activities of the school. In consultation with its community, each board develops a school charter.
All school charters include the National Education Guidelines, which contain a statement of goals for education in New Zealand as well as curriculum and administrative requirements.
Boards of trustees are accountable for meeting the objectives in their charter and for managing the funds they receive from the government to run the school. They are required to present an annual report to their community and the Ministry of Education in April/May of each year.
Polytechnic councils. Polytechnics are controlled by councils. Members represent business, industry, local authorities, universities, women's and ethnic groups, as well as other education and community interests.
Colleges of Education councils. Councils of colleges of education include representatives from universities and teacher organisations.
Wānanga. Wānanga have their own council established under the Education Act 1984 with representatives from their communities.
University councils. Each university is established under its own act of parliament and is also subject to the provisions of the Education Act 1989 and amendments. All matters relating to management are the responsibility of the council of the institution, which represents the interests of staff, students and the community.
Education service centres. Education service centres offer services such as administration of school transport, payroll, property, and other administrative services to schools.
Table 9.1 shows that government expenditure on education from 1992/93 to 2001/02 has increased steadily, both in dollar terms and as a percentage of government expenses.
Table 9.1. Government expenditure on education
| Year | Education expenses | Gross domestic product1 | Education expenses as a percentage of GDP | Total government expenses | Education expenses as a percentage of government expenses |
|---|---|---|---|---|---|
1This is the expenditure measure of GPP and may differ slightly from figures published previously which were based on the production measure of GDP. E = estimate .. Not available Sources: Annual Budget Statements and Statistics New Zealand | |||||
| ($M) | ($M) | percent | ($M) | percent | |
| 1992/93 | 4,539 | 75,246 | 6.0 | 31,429 | 14.4 |
| 1993/94 | 4,627 | 81,387 | 5.7 | 29,639 | 15.6 |
| 1994/95 | 4,803 | 87,052 | 5.5 | 30,400 | 15.8 |
| 1995/96 | 4,949 | 92,679 | 5.3 | 31,743 | 15.6 |
| 1996/97 | 5,335 | 96,911 | 5.5 | 32,953 | 16.2 |
| 1997/98 | 5,714 | 100,076 | 5.7 | 34,211 | 16.7 |
| 1998/99 | 5,899 | 100,837 | 5.9 | 35,825 | 16.5 |
| 1999/2000 | 6,310 | 105,687 | 6.0 | 36,171 | 17.4 |
| 2000/2001 | 6,690 | 111,900 | 6.0 | 38,186 | 17.5 |
| 2001/2002 | 7,041E | .. | .. | 39,603 | 17.8 |
Early childhood education funding is payable to licensed and chartered early childhood service providers. Funding provided by the government is not intended to cover the full cost of providing early childhood services. Rather, it is intended to subsidise the cost of these services, with the expectation that parents will also contribute funding, usually by way of fees. In addition to funding from the government and parents, some services also have other sources of revenue, such as donations and fundraising activities. To receive government funding, a service must be open continuously for at least two-and-a-half hours. Each service can claim funding for a maximum of six hours per child place a day, up to 30 hours a child place per week. The funding formula varies according to the type of service, the quality standard met and the ages of children enrolled. The base rate of funding (Rate 1) is higher for children under two years of age ($5.33) than that payable for children over two years of age ($2.67), in recognition of the greater levels of attention and supervision required for infants. A higher rate of funding (Rate 2) is paid to services that maintain levels of qualified staff or staff:child ratios above the minimum licensing requirements. Again, a higher rate is paid for children under two ($5.92) than for those over two ($2.96). Kindergartens are funded at a higher rate than other services (Rate 3, $3.56).
Compulsory schooling in New Zealand is resourced for state and state-integrated schools at levels that are adequate to ensure the delivery of the curriculum to all students entitled to attend school. Private schools receive a government subsidy and charge student fees. Expenditure is controlled by each school's board of trustees, with the board's financial management audited by the Audit Office. Education provision and school management and governance are reviewed by the Education Review Office. State and integrated schools receive resources from the Ministry of Education for operational funding, staffing entitlement, school property and school transport assistance.
Operational funding. Levels vary according to school type, student numbers and year levels, and the school's property profile. State and state-integrated schools may receive operational funding delivered on an entitlement and a targeted basis. Many boards of trustees choose to supplement this resourcing with funds raised by the local community to provide for extra activities and staffing. Schools may also receive the following targeted funding entitlements:
Māori language resourcing – the level of funding depends on the level of Māori immersion contained in the programme.
Targeted funding for educational achievement – funds to address barriers to learning associated with socio-economic factors, based on the school's roll and the location of students’ homes.
Careers information grant – to provide school-based careers information for secondary students.
Special education grant and learning support funding – to assist with support for students with moderated special education needs.
Supplementary funding is also available on application to support particular student needs and programmes:
Students with verified high and very high special education needs (Ongoing and Reviewable Resourcing Scheme (ORRS)).
Students needing programmes of English for Speakers of Other Languages (ESOL).
Senior programmes in area and secondary schools (Secondary Tertiary Alignment Resource (STAR))
Staffing entitlement. Schools receive an entitlement to employ teachers within staffing formula. Entitlement staffing provides schools with a measure of security and stability, enabling them to make long-term decisions about students’ curriculum and pastoral care needs. Above entitlement, additional staffing is provided in response to specific identified needs. Teachers’ salary funding is managed centrally and accessed through the ministry's education service payroll.
School property. New Zealand's state school property portfolio comprises around 2,300 schools and 2,600 houses. The capital value of the portfolio is $5 billion, including $4 billion worth of improvements. Total replacement value is approximately $8 billion. The proprietors of state-integrated schools own their school property and may charge attendance dues to finance capital developments. Managing state school property is a shared responsibility between the Ministry of Education and each school's board of trustees. The ministry represents the Crown as owner of school property, providing advice to both schools and the government on property management policy, and allocating capital funding to schools for property-related works. In specific terms, the ministry maintains an accurate database of all land and buildings, arranges insurance, town planning designations, building warrants of fitness and the sale of surplus property, and administers housing for teachers and caretakers. A key planning role is assessing the need for new schools and classrooms. Primary school rolls were expected to peak in 2002 at 484,400, with a projected reduction of 1,500 in 2003 and a further 4,900 in 2004. While this is the national projection, there are significant local variations, with some areas already in decline and others sustaining long-term growth. Rolls in the secondary sector are projected to increase each year for the foreseeable future. Based on this profile, 356 new classrooms were planned to be provided in the 2001/02 financial year, compared with 605 in 1998/99, 364 in 1999/2000 and 308 in 2000/01. The ministry also provides policy leadership to schools to enable them to use their property assets to the best educational advantage. This means schools having sound governance and management practices in place that ensure all building, health and safety laws are met and a safe and productive learning environment is provided for students. Schools are also responsible for managing their own property-related projects, based on funding allocated by the ministry.
School transport. School children in New Zealand who have to travel long distances to school in areas where there is no public transport may be entitled to use a government-subsidised school bus or get financial help for transport. Special education students also receive transport assistance, usually in the form of taxis. Around 100,000 children use school buses each year. Bus operators are contracted to the Ministry of Education and to schools. About another 9,000 students receive transport allowances because they cannot use a school bus or need to travel long distances to do so. Approximately 2,300 school bus services carry students to and from school each day.
School boarding bursaries. Boarding assistance is available to school pupils who need to live away from home in order to receive their education. The annual value of a school boarding bursary is $1,990, paid to the school in four equal amounts at the end of each term. Information on boarding bursaries is available from the Ministry of Education website www.minedu.govt.nz/goto/GBB
Demand-driven rather than capped funding was introduced for the tertiary sector in 1999. In 2000, a total of 177,847 EFTSs were funded with $1.274 billion.
EFTS funding system. The Equivalent Full-Time Student (EFTS) system funds tertiary institutions in bulk according to the number of students and the courses that those students are taking. Polytechnics, colleges of education, universities and wānanga receive state subsidies for the number of equivalent full-time students in each of the course-cost categories at their institution. These funded places are provided by the government in advance of the funding year. The funding is inclusive of capital works. The EFTS funding system has abolished detailed central government decision making about levels of staffing, operating grants and capital works projects. These responsibilities now lie with the management of tertiary institutions themselves. Improved accountability is required from all tertiary institutions under the EFTS funding system. Each institution must meet the requirements of the Public Finance Act 1989 and the Education Act 1989.
Private training establishments. The EFTS funding system provides state funding to subsidise certain programmes in private training establishments. The same levels of accountability as state tertiary institutions are expected.
Early childhood education refers to the non-compulsory provision of education and care for infants, toddlers and young children before they begin school. Early childhood education is available to children under 6 years through a wide range of services, many of which are administered by voluntary agencies with government assistance. Many early childhood services in New Zealand have evolved from individual and community initiatives, resulting in a diverse system of early childhood education, with a high degree of autonomy. The main providers of early childhood education are kindergartens, playcentres, Pacific peoples early childhood groups, education and care centres, home-based care services and kōhanga reo. Figure 9.2 shows percentages enrolled in each provider. Early childhood education programmes are based on a wide range of philosophies framed by the early childhood education curriculum document, Te Whāriki. The number of children on regular rolls of early childhood services are given in table 9.2. All early childhood services wishing to receive government funding must be licensed and chartered. Licensing ensures that minimum standards of quality are maintained. A charter contains both mandatory and optional objectives and practices related to the provision of learning opportunities. Chartered groups receive funding direct from the government in the form of a bulk grant.
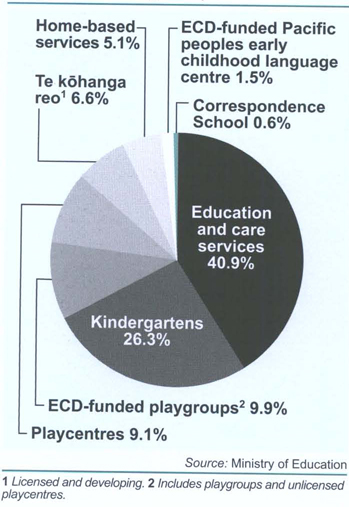

Kindergarten children try their hand at printing.
Kindergartens. Kindergartens predominantly provide early childhood education for children between the ages of 3 and 5. In general, younger children attend afternoon sessions for three afternoons a week, while the older group attends five mornings a week. Mobile kindergarten services are available in some rural areas. All teachers in kindergartens are trained to diploma level and parent participation is encouraged. Each kindergarten has its own parent committee, but management responsibility lies with regional kindergarten associations. These may be linked to one of two national associations, the New Zealand Free Kindergarten Association (Inc), or the New Zealand Kindergarten Federation.
Playcentres. Playcentres are parent cooperatives where parents take responsibility for the management and supervision of sessions. Children attending playcentre range in age from birth to school age. A trained supervisor, or a group of parent supervisors, takes overall responsibility for the playcentre programme. Parents are encouraged to be involved in sessions. Playcentres are administered through parent management committees at local and regional levels and these are, in turn, linked to the New Zealand Playcentre Federation at a national level. Training and parent education programmes are developed by the national playcentre body and implemented through centre-based programmes.
Te kōhanga reo. Kōhanga reo, which translates to ‘language nest', are sessional or all-day Māori language immersion early childhood institutions. Their prime aim is the maintenance of the Māori language. The wider focus of kōhanga reo is whānau development. Kōhanga reo are community based and are administered by local management groups affiliated to Te Kōhanga Reo National Trust. The trust receives government funding and allocates it to individual kōhanga reo. The trust has delegated responsibility for developing and approving charters for kōhanga reo, based on government guidelines. All kōhanga reo use the early childhood immersion curriculum document Te Korowai in their planning and delivery of programmes.
Parents as First Teachers (PAFT). Based on programmes developed in the United States by the Missouri State Department of Education, PAFT programmes provide a series of regular home visits by early childhood educators to parents with children from birth to 3 years of age. The programmes were developed in the belief that parents are their children's first and most important teachers, and that by empowering them in their parenting role, parents will become more confident, and participate more effectively, in the development and education of their children. Core elements of the programme provide individualised support through a structured learning series on child development and the fostering of early learning. Programmes are funded directly by the government and cover most regions of the country, involving around 8,000 families. Māori and Pacific peoples organisations are included in those contracted to provide PAFT programmes.
Anau Ako Pasifika. ECD is the grantholder on behalf of the Bernard Van Leer Foundation for the Anau Ako Pasifika project, a home-based programme in early childhood care and education for Pacific peoples’ communities based in Auckland, Tokoroa and Wellington.
Pacific Early Childhood Education Services. Pacific Early Childhood Education Services offer programmes based on the values and languages of Pacific cultures. The services cover Samoan, Cook Islands Māori, Niuean, Tongan, Tokelauan, Tuvaluan and Fijian nationalities. Services range from licence-exempt groups, meeting once or twice a week, to licensed and chartered centres. Programmes have high parental involvement and emphasise language development, both in Pacific languages and English, and increased parental knowledge in early childhood care and education.
Education and care centres. Education and care centres provide sessional, all-day or flexible-hours early childhood education services. Each centre is autonomous and many are privately owned. Some are administered by individuals, others by a committee, trust, firm or organisation. They may describe themselves as private kindergartens, creches, infant centres, playcentres, preschools, or by a name which indicates their particular philosophy or purpose. Some education and care centres have all trained staff, while others have a mixture of trained and untrained personnel. A number of education and care centres are community-based with a high degree of parent involvement, or are based on a parent cooperative model.
Home-based services. Home-based care (family daycare) is an organised system whereby parents of young children or babies are linked to caregivers, who are often themselves parents of young children. Trained coordinators supervise provision of early childhood education and care, and provide regular playgroups or workshop meetings for parents and caregivers.
Table 9.2 shows the number of children attending early childhood education services by the type of service.
Table 9.2. Children on regular rolls of early childhood education services at 1 July 2000
| Type of service | Number of services | Age (years) | Total | Included in total | ||||||||||||||
|---|---|---|---|---|---|---|---|---|---|---|---|---|---|---|---|---|---|---|
| Under 1 | 1 | 2 | 3 | 4 | 5 and over | Māori descent | Pacific peoples | |||||||||||
| Male | Female | Male | Female | Male | Female | Male | Female | Male | Female | Male | Female | Male | Female | Total | Total | Total | ||
1Early Childhood Development. ... Not applicable Source: Ministry of Education | ||||||||||||||||||
| Licensed early childhood education services | ||||||||||||||||||
| Kindergartens | 600 | 11 | 8 | 9 | 6 | 376 | 358 | 8,376 | 8,211 | 14,726 | 13,586 | 123 | 79 | 23,621 | 22,248 | 45,869 | 7,048 | 3,437 |
| Playcentres | 517 | 784 | 715 | 1,345 | 1,290 | 2,132 | 1,995 | 2,160 | 2,008 | 1,690 | 1,572 | 62 | 55 | 8,173 | 7,635 | 15,808 | 1,832 | 324 |
| Education and care services | 1,476 | 1,352 | 1,269 | 5,014 | 4,658 | 9,187 | 8,702 | 11,155 | 10,702 | 9,527 | 8,851 | 439 | 375 | 36,674 | 34,557 | 71,231 | 8,921 | 3,890 |
| Home-based services | 180 | 496 | 439 | 1,111 | 931 | 1,187 | 1,079 | 1,046 | 989 | 847 | 742 | 35 | 35 | 4,722 | 4,215 | 8,937 | 1,139 | 159 |
| Casual education and care | 45 | … | … | … | ||||||||||||||
| Correspondence School | 1 | 1 | 3 | 18 | 16 | 192 | 186 | 259 | 278 | 17 | 14 | 489 | 495 | 984 | 173 | 14 | ||
| Te kōhanga reo | 583 | 343 | 277 | 885 | 763 | 1,310 | 1,252 | 1,565 | 1,451 | 1,456 | 1,397 | 227 | 212 | 5,786 | 5,352 | 11,138 | 11,021 | 10 |
| Subtotal | 3,402 | 2,986 | 2,709 | 8,367 | 7,648 | 14,210 | 13,402 | 24,494 | 23,547 | 28,505 | 26,426 | 903 | 770 | 79,465 | 74,502 | 153,967 | 30,134 | 7,834 |
| Licence-exempt early childhood education services | ||||||||||||||||||
| ECD1-funded | ||||||||||||||||||
| -Playgroups | 592 | 1,205 | 1,186 | 2,010 | 1,954 | 2,621 | 2,376 | 1,876 | 1,713 | 965 | 919 | 51 | 73 | 8,728 | 8,221 | 16,949 | 1,587 | 366 |
| - Pacific Islands early childhood groups | 127 | 181 | 170 | 207 | 158 | 298 | 255 | 313 | 290 | 281 | 284 | 65 | 74 | 1,345 | 1,231 | 2,576 | 38 | 2,512 |
| - Playcentres | 25 | 18 | 16 | 32 | 27 | 53 | 43 | 57 | 49 | 39 | 34 | 1 | 3 | 200 | 172 | 372 | 120 | 27 |
| Licence-exempt | ||||||||||||||||||
| kōhanga reo | 29 | 15 | 7 | 37 | 29 | 43 | 53 | 41 | 47 | 48 | 45 | 8 | 8 | 192 | 189 | 381 | 376 | 2 |
| Subtotal | 773 | 1,419 | 1,379 | 2,286 | 2,168 | 3,015 | 2,727 | 2,287 | 2,099 | 1,333 | 1,282 | 125 | 158 | 10,465 | 9,813 | 20,278 | 2,121 | 2,907 |
| Total | 4,175 | 4,405 | 4,088 | 10,653 | 9,816 | 17,225 | 16,129 | 26,781 | 25,646 | 29,838 | 27,708 | 1,028 | 928 | 89,930 | 84,315 | 174,245 | 32,255 | 10,741 |
Playgroups. Playgroups are licence-exempt, community-based, non-profit groups of parents who meet to provide early childhood education for their children. Funded community playgroups are exempt from licensing, but must meet criteria set down by the Ministry of Education. Active participation of parents is required at all sessions. Many licence-exempt groups work with ECD.
Levels of schooling. Compulsory education in New Zealand is divided into primary, intermediate and secondary schooling. Primary schools are the first level. They cater for children from the age of 5 (Year 0) to the end of Year 6. Children in Years 7 and 8 may either go to a separate intermediate school, or to part of a primary, secondary or composite/area school. Secondary schools usually provide for students from Year 9 until the end of Year 13. Adult students who return to school enter in the year of the majority of their subjects. Composite/area schools, usually based in rural areas, combine primary, intermediate and secondary schooling at one location. A child aged between 5 and 6, starting primary school for the first time between July (when the school roll is counted) and the end of that school year, is classed as Year 0. Children who begin school for the first time between 1 January and before the July roll count are classed as Year 1. If children start school for the first time after the age of 6, they are placed in the same year as other children of the same age.
School terms. Primary schools are required to be open for at least 394 half days each year and secondary schools for at least 380 half days. The New Zealand school year is divided into four terms of approximately even length. Before 1996, the school year was divided into three terms, but it was changed after pilot studies showed students became less tired and were able to concentrate and work better when terms were shorter and holiday breaks more frequent.
Assessment of students. The main purpose of assessing students’ progress and achievement is to improve both learning and the quality of learning programmes. A student's strengths, and areas needing development, are identified for teachers developing and delivering programmes, as well as for the student and parents. The main information comes from ongoing school-based assessment. Schools are expected to report to parents on the progress of their students. Usually, schools provide written reports and parents can also meet teachers to talk about their children. Parents are entitled to ask for meetings with their child's teachers. Student achievement at the system level is monitored on a four-year rolling cycle by assessing around 3 percent of 8 and 12-year-olds. The four-year cycle of the National Education Monitoring Project covers aspects of all essential learning areas and essential skills in the New Zealand curriculum.
While most students in New Zealand attend state-funded schools, parents or caregivers and students have the choice of a number of schooling options.
State schools. State schools are co-educational (mixed sexes) at primary and intermediate level, but some offer single-sex education at secondary level. Lessons are based on the New Zealand curriculum. Some state schools offer special programmes for adult students or run community education classes.

A tutor from The Correspondence School talks by phone to a student.
Integrated schools. Integrated schools are those that used to be private and have now become part of the state system. They teach the New Zealand curriculum, but keep their own special character (usually a philosophical or religious belief) as part of their school programme. Integrated schools receive the same government funding for each student as state schools, but as their buildings and land are privately owned, they charge attendance dues to meet property costs.
Kura kaupapa Māori (Māori medium schools). Kura kaupapa Māori are state schools where teaching is in the Māori language (te reo Māori) and is based on Māori culture and values. The curriculum is the same as at other state schools. Kura kaupapa cater for students from Years 1–8 or Years 1–13. These schools provide ongoing education in te reo Māori, building on from kōhanga reo (Māori language early childhood education centres). A key goal of kura kaupapa is to produce students who are equally skilled in both Māori and English.
Independent (or private) schools. Independent (or private) schools are governed by their own independent boards, but must meet certain standards in order to be registered. Independent schools may be either co-educational or single-sex. They charge fees, but also receive government funding.
Boarding schools. Boarding schools may either be independent or part of a state-funded school. All charge boarding fees.
The Correspondence School. The Correspondence School (see sidebar) is a national school, funded by the Ministry of Education, and administered by a board of trustees, which includes ministerial appointments and parent, staff and student representatives. The Correspondence School provides courses for early childhood, primary, secondary and adult students. Full-time students are enrolled for a variety of reasons, including distance from other schools, special needs, medical and psychological problems, itinerancy and suspension from other schools. In some circumstances, the school provides courses for students in other New Zealand primary and secondary schools. It also offers ‘second chance’ education to adult students wanting to improve their qualifications. In addition, the school provides some services on a fee-paying basis. The Correspondence School educates the children of New Zealand citizens overseas, where suitable schooling is not available. This allows these students to continue to work towards New Zealand school level qualifications. A full range of courses, including practical subjects such as art, computing and science, is offered by the school. The school roll of 18,341 at October 2001 was made up of 893 early childhood pupils, 32 special needs pupils under 5 years, 1,553 students attending other primary schools, 7,133 students attending other secondary schools, 980 full-time primary, 2,000 full-time secondary, 512 fee paying and 5,238 adult students. The 630 staff employed by the school comprise 29 early childhood teachers, 101 primary teachers, 282 secondary teachers and 218 people who provide operational and strategic support. The Correspondence School's website is www.correspondence.school.nz.
Home-based schooling. Home-based schooling is an alternative available for parents and caregivers who want to educate their children at home. Parents and caregivers need approval from the Ministry of Education and must educate their children at least as regularly and as well as at a registered school. Homeschooling parents and caregivers are given an annual grant to help with the cost of learning materials and can choose to purchase teaching services from The Correspondence School. Though the number of homeschooled children in New Zealand has grown considerably in recent years, it accounts for only 1 percent of total school enrolments.
Designated character schools. Designated character schools are state schools that teach the New Zealand curriculum, but have been allowed to develop their own set of aims, purposes and objectives to reflect their own particular values.
Special schools. Special schools are state schools that provide education for students with special education needs. The curriculum is the same as at other state schools. There are eight residential special schools.
A programme of reform for the national curriculum begun in 1991 is now complete. The New Zealand Curriculum Framework and sets of national curriculum statements (in English and te reo Māori) provide the basis for teaching and learning programmes in schools.
New Zealand Curriculum Framework (1993). The New Zealand Curriculum Framework sets out the policy direction for learning and teaching in New Zealand state and state-integrated schools. It describes a range of principles which underpin and give direction to the curriculum. The principles state that the curriculum will:
Be broad, balanced and common.
Be inclusive of all students.
Foster success and achievement for all students.
Enable students to become independent and lifelong learners.
Ensure that learning progresses coherently throughout schooling.
Recognise New Zealand's bicultural identity.
Reflect the multicultural nature of New Zealand society.
Be cooperatively designed.
Relate to the wider world.
The framework specifies seven essential learning areas, which describe in broad terms the knowledge and understandings which all students will learn. These are:
Language and languages/te korero me ngā reo.
Mathematics/pāngarau.
Science/pūtaiao.
Technology/hangarau.
Social sciences/tikanga-a-iwi.
The arts/ngā toi.
Health and physical well-being/hauora.
The framework also sets out essential skills to be developed by all students through the context of essential learning areas. These skills are communication; numeracy; information; problem solving; self-management and competitive; social and cooperative; physical; and work and study. The framework outlines the commonly held attitudes and values which should be developed and reinforced in the curriculum.
National curriculum statements. The New Zealand Curriculum Framework is supported by more detailed national curriculum statements. Those for mathematics, science, English, technology and social studies for primary, intermediate and secondary schools are now mandatory in state and state-integrated schools to the end of Year 10 (Form 4). National curriculum statements for health and physical education and for the arts have been published and schools are working towards their implementation. The following national curriculum statements have been published in te reo Māori for Māori medium education: Te reo Māori (Māori language), pāngarau (mathematics), pūtaiao (science), hangarau (technology), tikanga-a-iwi (social studies), ngā toi (the arts) and hauora (health and physical education). Curriculum statements for optional language subjects Japanese, Chinese, Spanish, Samoan and Korean have been published. Curriculum statements for senior sciences, biology, chemistry and physics have also been published. Students may choose from an increasingly wide range of subjects from Year 11 (Form 5) to Year 13 (Form 7).
The National Qualifications Framework brings together senior secondary education, industry training and tertiary education under one system. It is coordinated and administered by the New Zealand Qualifications Authority (NZQA). The framework is based on nationally agreed ‘unit standards'. These standards are like ‘building blocks’ towards a qualification. Each standard belongs to one of 10 framework levels. Certificates awarded at Levels 1–3 include the new senior secondary education qualification, the National Certificate of Educational Achievement (NCEA) and at Level 4 New Zealand Scholarship. Diplomas are awarded at Levels 5 and 6; bachelor degrees, graduate diplomas and certificates at Level 7; post-graduate diplomas and certificates, and bachelors degrees with honours, at Level 8; masters degrees at Level 9; and doctorates at Level 10. Under NCEA, each learner receives a Record of Learning, a personalised list of credits the learner has achieved in the year. The framework means learners can continue their studies wherever they wish – at school, university, polytechnic, a private or government training establishment, wānanga, or even in the workplace. NZQA will update a learner's Record of Learning when it receives results from training organisations. As at 30 June 2001, 61,968 NQF qualifications had been awarded, with 21,749 gained in the year ended 30 June 2001, a 24 percent increase on the previous year.
The current system of national qualifications for middle and senior secondary school students is in a transitional phase as the National Certificate in Educational Achievement (NCEA) is introduced progressively. (see NCEA section for its introduction timetable). Tables 9.3 and 9.4 show numbers of school leavers in 2000 and their highest attainment levels. Figure 9.3 shows how attainment levels have changed since 1985.
School Certificate. This examination was offered for the last time in 2001. School Certificate was taken by most students at the end of three years of secondary education (5th Form or Year 11). Except for part-time students, each candidate's course of study had to include English, although the student was not required to sit the examination in that subject. A student could enter the examination in any number of subjects (up to six) and was credited with a grade in each subject. There were five grades: A, B, C, D, and E. School Certificate was replaced by NCEA Level 1 in 2002.
Sixth Form Certificate. This certificate is awarded on a single-subject basis to Year 12 (Form 6) students who have satisfactorily completed a course of one year in one or more subjects. Most students take five or six subjects. All candidates must study a course of English, although they do not have to sit it as a Sixth Form Certificate examination subject. Grades are awarded on a 1 to 9 scale, Grade 1 being the highest. Candidates are assessed internally, but grade allocations are moderated externally. Sixth Form Certificate will be replaced by NCEA Level 2 in 2003. Figure 9.4 shows subjects taken by Sixth Form Certificate students in 2000.
Figure 9.3. School qualifications
Selected highest
attainment of secondary school leavers
Massey Vice Chancellor Professor James McWha with graduates, 2001.

Vocational guidance advice being given to a student.
New Zealand Diploma in Business (NZDipBus). NZDipBus is a generic business qualification, endorsed by a number of industries such as accounting, marketing and management. Courses for the qualification are available at a number of accredited tertiary education providers and through distance learning. Most courses are of one semester (half year) duration and may be completed through full or part-time study. The New Zealand Qualifications Authority is responsible for the development and review of prescriptions for NZDipBus papers, for maintenance of the national database of results and for certification of the qualification. Accredited training providers may also certificate the New Zealand Diploma in Business. In 2001, 1,454 New Zealand Diplomas in Business were issued, 473 by the qualifications authority and 981 by accredited teaching institutions.
New Zealand Diplomas. New Zealand Diplomas are available in science and surface coatings technology. They are advanced qualifications for students who have completed a New Zealand Certificate in the same or a related area.
Table 9.7. Summary of 2000 tertiary graduates by fields of study
| Field of study | Award group | Total | Grand total | ||||||||||||
|---|---|---|---|---|---|---|---|---|---|---|---|---|---|---|---|
| Doctorate | Masters/ Honours | Postgraduate Dip./Cert | Bachelors/Advanced Diploma | Diploma | Certificate | ||||||||||
| Male | Female | Male | Female | Male | Female | Male | Female | Male | Female | Male | Female | Male | Female | ||
| Source: Ministry of Education | |||||||||||||||
| General programmes | 260 | 194 | – | – | 114 | 127 | – | – | – | – | 80 | 124 | 454 | 445 | 899 |
| Literacy | – | – | – | – | – | – | – | – | 18 | 60 | 727 | 977 | 745 | 1,037 | 1,782 |
| Education | 1 | – | 49 | 137 | 140 | 465 | 924 | 3,712 | 316 | 1,495 | 125 | 684 | 1,555 | 6,493 | 8,048 |
| Art, music and handicrafts | – | – | 53 | 73 | 23 | 29 | 378 | 761 | 240 | 246 | 335 | 451 | 1,029 | 1,560 | 2,589 |
| Humanities | – | – | 488 | 804 | 58 | 125 | 1,193 | 2,603 | 123 | 264 | 368 | 716 | 2,230 | 4,512 | 6,742 |
| Religion and theology | – | – | 2 | 4 | 1 | – | 44 | 22 | – | – | – | – | 47 | 26 | 73 |
| Social, behavioural and communication skills | – | – | 50 | 159 | 40 | 126 | 172 | 501 | 121 | 397 | 430 | 1,726 | 813 | 2,909 | 3,722 |
| Commercial and business | – | – | 620 | 454 | 569 | 499 | 2,399 | 2,628 | 618 | 1,007 | 1,136 | 2,615 | 5,342 | 7,203 | 12,545 |
| Law | 1 | – | 90 | 108 | 1 | 5 | 304 | 452 | – | – | 141 | 171 | 537 | 736 | 1,273 |
| Natural and applied sciences | 2 | – | 468 | 456 | 203 | 156 | 1,348 | 1,210 | 53 | 72 | 84 | 218 | 2,158 | 2,112 | 4,270 |
| Mathematics | – | – | 3 | 3 | 5 | 7 | 2 | 2 | – | – | – | – | 10 | 12 | 22 |
| Computing | – | – | 15 | 6 | 64 | 39 | 281 | 133 | 18 | 32 | 895 | 982 | 1,273 | 1,192 | 2,465 |
| Medical and health | 2 | 4 | 48 | 117 | 268 | 514 | 531 | 2,487 | 51 | 275 | 84 | 527 | 984 | 3,924 | 4,908 |
| Industrial trades and crafts | – | – | – | – | 2 | 2 | 26 | 62 | 38 | 77 | 2,251 | 379 | 2,317 | 520 | 2,837 |
| Engineering | – | – | 454 | 125 | 18 | 11 | 375 | 141 | 213 | 11 | 118 | 8 | 1,178 | 296 | 1,474 |
| Architectural and town planning | – | – | 61 | 63 | 10 | 8 | 271 | 175 | 50 | 19 | 41 | 25 | 433 | 290 | 723 |
| Agriculture, forestry and fishing | – | – | 38 | 24 | 54 | 53 | 161 | 107 | 183 | 98 | 572 | 479 | 1,008 | 761 | 1,769 |
| Transport and communication | – | – | – | – | – | – | 31 | 9 | 5 | 7 | 421 | 44 | 457 | 60 | 517 |
| Service trades | – | – | – | 3 | 14 | 12 | 36 | 48 | 143 | 343 | 1,080 | 2,243 | 1,273 | 2,649 | 3,922 |
| Mass communication | – | – | 28 | 67 | 6 | 21 | 81 | 194 | 70 | 128 | 103 | 111 | 288 | 521 | 809 |
| Para-professional occupations | – | – | – | – | – | – | – | – | – | – | 177 | 78 | 177 | 78 | 255 |
| Sport and recreation | – | – | 14 | 9 | 18 | 7 | 151 | 162 | 226 | 143 | 393 | 304 | 802 | 625 | 1,427 |
| General foundation programmes | – | – | – | – | – | – | – | – | – | – | 106 | 234 | 106 | 234 | 340 |
| Other programmes nec | – | – | – | – | – | – | – | – | – | – | 68 | 76 | 68 | 76 | 144 |
| Total: All fields of study | 266 | 198 | 2,481 | 2,612 | 1,608 | 2,206 | 8,708 | 15,409 | 2,486 | 4,674 | 9,735 | 13,172 | 25,284 | 38,271 | 63,555 |
| Adjustment for multiple awards | – | – | 6 | 5 | 25 | 33 | 417 | 664 | 67 | 154 | 618 | 853 | 1,133 | 1,709 | 2,842 |
| Number of students | 266 | 198 | 2,475 | 2,607 | 1,583 | 2,173 | 8,291 | 14,745 | 2,419 | 4,520 | 9,117 | 12,319 | 24,151 | 36,562 | 60,713 |
National Certificates and National Diplomas. National Certificates and National Diplomas are unit standard-based qualifications registered on the National Qualifications Framework (NQF). The NQF is an outcomes-based, credit-transfer system that integrates nationally-recognised National Certificates and National Diplomas gained from secondary school onwards. Generally, National Certificates are registered at levels 1–4 of the NQF and National Diplomas are registered at levels 5 or 6. (There are 10 levels on the NQF, with bachelor degrees being at level 7.) National Certificates and National Diplomas are developed by Industry Training Organisations or other approved national industry bodies, with the New Zealand Qualifications Authority having responsibility for the maintenance of the National Qualifications Framework. Training for these qualifications occurs on-job, off-job or in a mixture of these depending on the qualification. Up to 31 December 2001, 73,775 National Certificates and Diplomas had been awarded, with 24,413 being awarded in 2001, a 40 percent increase on the number awarded in the previous year. National Certificates (and in a few cases National Diplomas) have replaced Trade Certificates and Advanced Trade Certificates in nearly every industry.
Other qualifications. A wide range of other vocational qualifications have been developed. These include qualifications developed and administered by polytechnics and other tertiary training providers, national bodies such as the New Zealand Institute of Management and the Royal New Zealand Air Force, and private training providers. Responsibility for all aspects of these qualifications lies with the appropriate body.
New government funding introduced in 2001 to help students to access tertiary education included a fee stabilisation package for tertiary providers to prevent increases in course fees, a full interest write-off on student loans for full-time, full-year students and low-income students, and extra funding for tertiary providers to prepare for implementation of new funding and regulatory systems.
StudyLink services. StudyLink, a service of the Ministry of Social Development, provides a range of financial support for students aged 18 or over on 1 January of the year in which they attend a secondary school or tertiary institution. Students aged 16 and 17 may also be eligible depending on circumstances. Table 9.8 shows numbers of students receiving student allowances in 2001.
Student allowance: The student allowance is a weekly payment to help students with living costs while they are in full-time study. For single students, the rate of student allowance is dependent on the student's age, parental income if the student is under 25, and whether or not the student lives at home. There are also separate rates for students with a dependent spouse and/or dependent children, those with an earning spouse, and those married to another student. Single students living away from the parental home, some married students and those receiving a ‘with dependants’ rate of student allowance may also qualify for an accommodation benefit if they are receiving a targeted student allowance. Rates of allowances are changed annually and are subject to review. At 31 July 2001, 50,664 students were receiving student allowances, 437 more that at 31 July 2000. Of these, 10,227 were living at home, 4,981 had dependent children, and 4,846 were 16 to 24 year olds separated from, and independent of, their parents. At 31 July 2001, 39,547 students were receiving the accommodation benefit, 588 more than at 31 July 2000. (See table 9.8.)
Table 9.8. Students receiving student allowances by institution type at 30 June 2001
| Allowance type | Type of institution | Total by gender | Grand total | ||||||||||||
|---|---|---|---|---|---|---|---|---|---|---|---|---|---|---|---|
| School | Polytechnic | College of Education | University | Private Training Establishment | Wānanga | ||||||||||
| Female | Male | Female | Male | Female | Male | Female | Male | Female | Male | Female | Male | Female | Male | ||
| Source: Ministry of Social Development | |||||||||||||||
| 16–24 years – targeted away from home | 115 | 160 | 1,914 | 1,608 | 547 | 128 | 5,920 | 4,687 | 717 | 477 | 52 | 46 | 9,265 | 7,106 | 16,371 |
| 16–24 years – targeted at home | 318 | 405 | 868 | 1,076 | 215 | 49 | 2,693 | 2,487 | 414 | 322 | 29 | 36 | 4,537 | 4,375 | 8,912 |
| 25+ years – away from home | 35 | 27 | 1,578 | 1,881 | 394 | 238 | 2,563 | 2,839 | 724 | 937 | 104 | 191 | 5,398 | 6,113 | 11,511 |
| 25+ years – at home | 3 | 5 | 188 | 236 | 59 | 27 | 281 | 351 | 60 | 110 | 16 | 29 | 607 | 758 | 1,365 |
| Accommodation benefit | 356 | 297 | 5,230 | 5,298 | 1,348 | 594 | 11,315 | 10,208 | 2,100 | 2,189 | 258 | 354 | 20,607 | 18,940 | 39,547 |
| Couple allowance | 33 | 17 | 195 | 263 | 44 | 39 | 415 | 475 | 103 | 134 | 12 | 12 | 802 | 940 | 1,742 |
| Students with dependants | 129 | 50 | 856 | 1,032 | 171 | 140 | 715 | 1,037 | 259 | 439 | 73 | 80 | 2,203 | 2,778 | 4,981 |
| Independent circumstances | 44 | 43 | 664 | 506 | 184 | 48 | 1,675 | 1,154 | 289 | 200 | 16 | 23 | 2,872 | 1,974 | 4,846 |
| Earning spouse – away from home | 0 | 0 | 23 | 8 | 8 | 1 | 27 | 16 | 8 | 2 | 1 | 2 | 67 | 29 | 96 |
| Earning spouse – at home | 10 | 2 | 186 | 84 | 71 | 21 | 186 | 122 | 85 | 48 | 20 | 5 | 558 | 282 | 840 |
| Total allowances | 1,043 | 1,006 | 11,702 | 11,992 | 3,041 | 1,285 | 25,790 | 23,376 | 4,759 | 4,858 | 581 | 778 | 46,916 | 43,295 | 90,211 |
| Adjustment for more than one allowance | 356 | 297 | 5,230 | 5,298 | 1,348 | 594 | 11,315 | 10,208 | 2,100 | 2,189 | 258 | 354 | 20,607 | 18,940 | 39,547 |
| Number of students | 687 | 709 | 6,472 | 6,694 | 1,693 | 691 | 14,475 | 13,168 | 2,659 | 2,669 | 323 | 424 | 26,309 | 24,355 | 50,664 |
Student loans: The student loan scheme was established in 1992 to assist students to participate in tertiary education. The Ministry of Education is responsible for managing strategic policy for the scheme. StudyLink, a service of the Ministry of Social Development, is responsible for delivery and administration of the payment of student loans, including the receipt and assessment of applications from students, the administration of the payment of compulsory fees funded by loans to providers, and payment of living costs and course-related costs funded by loans to students. Loans incur interest and are repayable through the Inland Revenue Department. The level of repayment is based on taxable income. Eligible students may receive a loan from the government to cover compulsory fees payable at enrolment (private training establishment students can borrow up to only $6,500 for fees); a maximum of $1,000 a year for full-time courses to assist with course-related costs such as equipment, textbooks and field trips (part-time full-year and full-time part-year students can also borrow a proportion of this); and living costs for full-time students of $150 a week times the length of the course (less any entitlement to student allowances). Each time a new loan is taken out, an administration fee of $50 is charged. This is added to the student's loan balance when the student makes the first drawing from the loan account. During the 2000 academic year, 128,185 students accessed a student loan, borrowing $777 million. This $777 million consisted of $468.9 million in course fees, $65 million in course-related costs, and $243.1 million in living costs. Administration fees totalled $6.5 million. Total interest charged was $35.7m.
Unemployment benefit student hardship: This benefit is paid to students who are unable to obtain employment and are in hardship during the break between periods of study. Eligibility is dependent on age, residency, income, study status, job search status and hardship. At 31 December 2000, 19,089 students were receiving this assistance, 790 more than at 31 December 1999.
Teacher training courses in primary and secondary education are offered by a number of institutions, including colleges of education, schools of education at some universities, some polytechnics and some private training establishments. Teacher training in early childhood education, Māori language, business, music, physical education, trades and technology, and special education are also offered by other tertiary providers.
Early childhood workers and teachers. Three-year training programmes for early childhood workers and teachers are operated at each of the colleges of education. The Advanced Studies for Teachers Unit at Palmerston North College of Education and Massey University offers advanced courses for all early childhood education workers and teachers.
Primary teacher training. The usual course of training for primary teacher trainees is three years at a teacher-training provider, followed by two years of satisfactory teaching in a state primary school. Courses may be shortened to one or two years for trainees who are university graduates or are partway through degree courses, or for mature trainees with relevant work experience. Approximately 80 percent of primary teacher trainees undertake university degree study. Conjoint programmes are offered at all institutions.
Secondary teacher training. Two options are available to people who wish to train as secondary teachers. For graduates, and those with other approved advanced qualifications, there is a one-year course. People with University Entrance or acceptable Sixth Form Certificate results may be accepted into a four-year course of consecutive or concurrent study. Secondary teacher training can be undertaken at a variety of institutions.
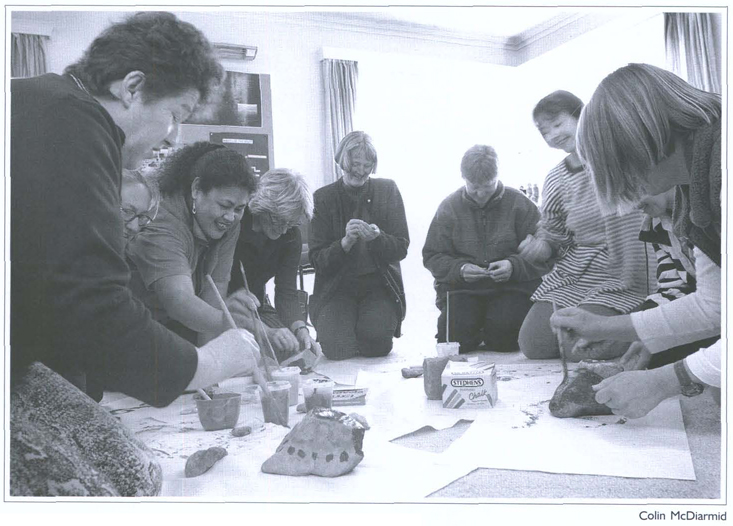
Teachers attending a refresher course.
Special education training. People who wish to become speech/language therapists enrol for a four-year Bachelor of Education (Speech-Language Therapy) degree at the University of Canterbury. Postgraduate courses for teachers who wish to be trained as teachers of children and young people with disabilities are available at Auckland, Palmerston North, Wellington and Christchurch. Specialist postgraduate training courses for teachers of the deaf and the visually impaired are available in Auckland and Christchurch. Training for resource teachers (learning and behaviour) is provided by a consortium from Auckland, Waikato and Victoria Universities.
Continuing education for teachers. A wide range of professional education papers is offered to teachers, most intended to provide credits towards diploma qualifications and service increments for certified teachers. Colleges of education offer a range of approved after-hours advanced study courses for teachers who wish to advance their professional qualifications. The Professional and Community Education (PACE) programme at Massey University College of Education provides distance education courses to about 5,000 teachers, teacher aides and other adults in teaching positions. It is a teaching department within the university, with a core of permanent professional tutorial and administrative staff. Other staff throughout New Zealand act as part-time tutors. The Teachers Refresher Course Committee: Komiti Whakahauora Kaiwhakaako, established in 1944, is contracted to the Ministry of Education to offer at least 4,250 professional development course days, organised in three to five-day residential courses during school vacations or over long weekends. Travel assistance is provided to teachers attending these courses. The Ministry of Education also manages a large contract programme of professional development available to all schools, in addition to professional development provided through school support services attached to colleges and schools of education.
There are large numbers of private training establishments (PTEs) in New Zealand, of which about 800 are registered with the New Zealand Qualifications Authority (NZQA). PTEs which enrol foreign students are required by law to have course approval and accreditation from NZQA and to have course approvals for courses of more than three months’ duration. The legislation provides protection for foreign students who pay tuition fees in advance. PTEs offer a wide range of courses, often in niche markets. Despite their limited number of funded equivalent full-time students places, the PTEs operating in provincial towns offer improved access to tertiary education, rather than actual competition for the state tertiary institutions. PTE courses that receive state funding are subject to similar standards of accountability under legislation as state-funded courses at universities, polytechnics and colleges of education.
This Crown entity was established in July 1990 and is directly responsible to the Associate Minister of Education (Tertiary Education), who appoints a board to oversee its work. Career Services contracts with the minister to deliver a range of services to agreed consumers through a purchase agreement signed between the minister and the Career Services Board.
Services contracted by the minister include the development and promotion of:
KiwiCareers. This is a national careers internet-based information system providing career information and advice.
CareerCentres. These are contracted to deliver career planning, information and advice services.
CareerPoint. This is a freephone service providing career information and advice by telephone.
Career Services is partly funded by the Crown and enters into contracts with other organisations, both public and private. Career Services website is www.careers.govt.nz
Skill New Zealand develops and implements a range of initiatives designed to build a highly skilled and adaptable workforce. They are targeted at school leavers starting their working lives, unemployed people wanting to re-enter paid work, and people currently in employment wanting to increase their skills.
Skill New Zealand purchases a range of fully subsidised training programmes targeted at people under-represented in the labour market, including recent school leavers and unemployed people with low qualifications. It was to become part of the new Tertiary Education Commission in July 2002. More than 2,500 training programmes are offered by more than 500 providers nationwide. These programmes provide eligible learners with the opportunity to gain nationally recognised qualifications and skills, as well as work experience, to enable them to progress into further training or employment. Many of its programmes are part of the National Qualifications Framework.
Community education. In the year ended 31 July 2000, there were 4,914 enrolments in community and general education at New Zealand universities, colleges of education and wānanga. Of these, 3,578 were female and 1,336 male. Victoria University had the highest number of enrolments (1,326), followed by the University of Waikato (1,264). There were 8,221 community and general education enrolments at polytechnics, 4,968 of whom were females and 3,253 males.
The Eastern Institute of Technology of Hawke's Bay had the highest number of enrolments (1,621), followed by Christchurch Polytechnic (1,278). At schools, the number of community enrolments during 2000 was 211,952, of whom 156,283 were females and 55,669 males. Art/music/craft courses attracted 43,558 enrolments at schools, computing 33,041, fitness/sport/recreation 29,256 and home management/maintenance 25,748. Art/music craft courses were most favoured by females, while computing courses attracted the most males.
National Resource Centre for Adult Education and Community Learning. In 1990 the resource centre was established to: promote and assist the adult education needs of the community; collect and distribute information resources; act as a network centre for people and groups involved in adult and community learning; and accommodate national community learning organisations.
Community Learning Aotearoa New Zealand (CLANZ). This committee gives recommendations on the dispersal of grants to community groups for non-formal adult learning projects.
University Continuing Education. All eight universities have centres for continuing education. A typical university education centre has a director-in-charge and a staff of lecturers in a range of academic disciplines. The courses are conducted by various methods – lecture courses, study conferences, seminars, schools of varying lengths (both residential and non-residential), and correspondence courses. Most universities continue to offer the general public substantial continuing education programmes in the liberal studies area. There has been, however, a significant increase in programmes designed for specialist groups, especially occupational. Some of these programmes are national in scope.
School community education programme. School community education programmes provide educational opportunities for adults within the school community. The programme is developed by a programme coordinator with a sub-committee of the school board of trustees to meet the community's defined needs. Schools receive an allocation of tutor hours and associated staffing allowances. Fifteen percent of the allocated hours must be available for use by local community groups and all courses are required to fall under one of the following headings: adult basic education; training for volunteer community workers; parent education; personal development; or specific community need. Courses that do not fall under these categories can be offered on a self-funded basis.
Polytechnics. Polytechnics also provide a range of community education courses and programmes for adults, both on-campus and through outposts established to give students in smaller centres the opportunity of participating in some form of tertiary education.
Distance education. Main agencies in the field of distance education are the Correspondence School (18,341 students enrolled at October 2001), Massey University (21,149 students enrolled with extramural as their primary mode of study as of September 2001) and the Open Polytechnic of New Zealand (29,915 students enrolled in 2000).
Organisations contributing to non-formal and continuing education. Many voluntary organisations make some provision for continuing education. For most of them, such as the New Zealand Playcentre Federation and the Country Women's Coordinating Committee, continuing education is only one aspect of their overall activities. However, several organisations, such as the New Zealand Workers’ Educational Association, Adult Reading and Learning Assistance, and Te Ataarangi have community education as their primary purpose.
Although most Māori students remain within the mainstream education system, increasing numbers are taking advantage of Māori medium education. There is now a strong demand for Māori language education throughout the New Zealand education system, stimulated by the revival of te reo Māori (the Māori language). Programmes developed to preserve their language have given Māori the opportunity to design the kind of education that meets the needs of both adults and children. The language revival began with the establishment of kōhanga reo (Māori language early childhood centres) and continued with kura kaupapa (Māori medium schools) and wānanga (tertiary level institutions). Growing numbers of Māori students are also enrolled in bilingual and Māori language immersion classes in mainstream schools. However, while Māori achievement has increased across the New Zealand education system in recent years, there remains concern that it has not kept pace with that of other groups.
The Māori Language Education Plan. The Māori Language Education Plan (MLEP) outlines the government's strategic framework for advancing Māori language education. There are five key areas in the MLEP designed to support Māori language education. These areas support both the provision of adequate and appropriate resourcing for both mainstream and Māori medium schools, as well as support for the community. Initiatives include:
Provision of skilled teachers and sufficient teaching and learning resources.
Creation of Māori medium-specific assessment tools.
Strengthening linkages between school programmes and Māori communities.
Māori teachers. An evaluation of Māori teacher supply initiatives was been carried out and review of Māori and Māori medium teacher supply initiatives is under way. TeachNZ scholarships, designed to attract more Māori and Māori medium teachers, were awarded to 165 recipients in 2001.
Tables 9.9 to 9.12 give information about all three educational sectors.
Table 9.9. Full-time equivalent teaching staff at all educational institutions
| 1998 | 1999 | 2000 | |
|---|---|---|---|
.. Not available Source: Ministry of Education | |||
| Licensed early childhood services | |||
| Kindergartens | 1,607 | 1,625 | 1,617 |
| Playcentres (includes unpaid adults on duty) | 1,336 | 1,314 | 1,251 |
| Education and care services – regular and casual | 6,841 | 7,344 | 7,854 |
| Home-based services – coordinators | 236 | 242 | 271 |
| Correspondence School | 24 | 24 | 20 |
| Te kōhanga reo | .. | .. | .. |
| Primary schools | |||
| State | 22,681 | 22,740 | 22,957 |
| Private | 438 | 397 | 401 |
| Composite schools | |||
| State | 1,158 | 1,311 | 1,406 |
| Private | 920 | 981 | 937 |
| Secondary schools | |||
| State | 14,663 | 14,842 | 15,083 |
| Private | 565 | 482 | 512 |
| Special schools | |||
| State | 491 | 556 | 663 |
| Private | 11 | ||
| Correspondence School | |||
| Primary and secondary | 413 | 357 | 299 |
| Tertiary education providers – academic staff | |||
| Public tertian’ education institutions | |||
| Polytechnics | 4,849 | 4,932 | 4,035 |
| Colleges of Education | 481 | 497 | 505 |
| Universities | 4,973 | 5,008 | 5,936 |
| Wānanga | 107 | 109 | 156 |
| Private tertiary education providers | 2,816 | 2,836 | 3,290 |
Table 9.1. Ratio of students to teaching staff at state schools by school sector, 1996–2000
| Year | 1996 | 1997 | 1998 | 1999 | 2000 |
|---|---|---|---|---|---|
Note:Primary and intermediate ratios are based on July rolls, while secondary and composite ratios are based on March rolls. 1Includes management, special education teachers and other additional teachers. Source: Ministry of Education | |||||
| Overall ratio1 | |||||
| Primary/intermediate | 19.9 | 19.5 | 19.5 | 19.1 | 19.4 |
| Secondary | 15.8 | 15.8 | 15.9 | 15.8 | 15.5 |
| Composite/area | 15.0 | 14.7 | 14.9 | 14.9 | 14.8 |
| Classroom ratio | |||||
| Primary/intermediate | 23.1 | 22.9 | 22.9 | 22.7 | 22.8 |
| Secondary | 18.0 | 18.1 | 18.2 | 18.2 | 18.0 |
| Composite/area | 17.7 | 17.3 | 17.4 | 17.3 | 17.2 |
Table 9.11. Numbers of institutions and students enrolled1in formal education
| 1998 | 1999 | 2000 | ||||
|---|---|---|---|---|---|---|
| institutions | students | institutions | students | institutions | students | |
1As at July. 2Early Childhood Development. 3Student numbers estimated for 1998 and 1999. 4Owing to rounding, individual figures for student numbers do not always sum to give stated totals. 5In 2000 Wellington Polytechnic became part of Massey University and Auckland Institute of Technology changed from polytechnic to university status. 6Institution numbers count only those institutions that have formal students enrolled. Source: Ministry of Education | ||||||
| Licensed early childhood services | ||||||
| Kindergartens | 596 | 46,307 | 598 | 45,993 | 600 | 45,869 |
| Playcentres | 537 | 16,787 | 523 | 16,261 | 517 | 15,808 |
| Education and care services | 1,332 | 65,205 | 1,403 | 68,132 | 1,476 | 71,231 |
| Casual education and care (no regular roll) | 44 | ... | 44 | ... | 45 | ... |
| Homebased services | 150 | 8,300 | 171 | 8,498 | 180 | 8,937 |
| Te kōhanga reo | 613 | 11,689 | 600 | 11,859 | 583 | 11,138 |
| Correspondence School | 1 | 1,044 | 1 | 1,097 | 1 | 984 |
| 3,273 | 149,332 | 3,340 | 151,840 | 3,402 | 153,967 | |
| License-exempt early childhood education services | ||||||
| ECD2 funded playgroups | 557 | 17,630 | 596 | 16,629 | 592 | 16,949 |
| ECD2 funded Pacific peoples language groups | 170 | 3,599 | 138 | 2,948 | 127 | 2,576 |
| ECD2 funded playcentres | 26 | 433 | 24 | 388 | 25 | 372 |
| License-exempt kōhanga reo | 33 | 361 | 50 | 524 | 29 | 381 |
| 786 | 22,023 | 808 | 20,489 | 773 | 20,278 | |
| Early childhood total | 4,059 | 171,355 | 4,148 | 172,329 | 4,175 | 174,245 |
| Primary schools | ||||||
| State full primary | 1,211 | 166,481 | 1,205 | 168,397 | 1,189 | 170,070 |
| State contributing | 879 | 219,138 | 864 | 216,723 | 854 | 215,509 |
| State intermediate | 136 | 56,180 | 133 | 57,086 | 133 | 58,852 |
| Private primary and intermediate | 56 | 6,286 | 51 | 5,634 | 44 | 5,773 |
| 2,282 | 448,085 | 2,253 | 447,840 | 2,220 | 450,204 | |
| Composite schools | ||||||
| State composite | 63 | 17,623 | 69 | 19,594 | 78 | 21,084 |
| State Correspondence | 1 | 10,914 | 1 | 9,556 | 1 | 8,119 |
| Private composite | 37 | 11,812 | 43 | 12,547 | 41 | 11,734 |
| 101 | 40,349 | 113 | 41,697 | 120 | 40,937 | |
| Secondary schools | ||||||
| State Year 9–15 | 237 | 189,930 | 233 | 190,160 | 232 | 189,979 |
| State Year 7–15 | 83 | 37,548 | 87 | 39,423 | 88 | 39,871 |
| Private Year 7–15 and Year 9–15 | 23 | 6,696 | 15 | 6,280 | 16 | 6,585 |
| 343 | 234,174 | 335 | 235,863 | 336 | 236,435 | |
| Special schools | ||||||
| State | 43 | 1,759 | 43 | 1,855 | 45 | 2,010 |
| Private | 1 | 42 | 0 | 0 | 0 | 0 |
| Other Vote: Education | 4 | 170 | 3 | 141 | 3 | 103 |
| 48 | 1,971 | 46 | 1,996 | 48 | 2,113 | |
| School total | 2,774 | 724,579 | 2,747 | 727,396 | 2,724 | 729,689 |
| Home schooling | ... | 5,274 | ... | 5,451 | ... | 5,877 |
| Tertiary education providers3 | ||||||
| Public tertiary education institutions4 | ||||||
| Polytechnics5 | 25 | 101,400 | 25 | 100,000 | 23 | 87,436 |
| Universities5 | 7 | 108,000 | 7 | 106,000 | 8 | 122,727 |
| Colleges of Education | 4 | 11,800 | 4 | 12,800 | 4 | 12,045 |
| Wānanga | 3 | 1,200 | 3 | 1,900 | 3 | 2,972 |
| Total | 39 | 222,300 | 39 | 220,700 | 38 | 225,180 |
| Private tertiary education providers6 | 457 | 28,700 | 441 | 33,100 | 452 | 39,173 |
| Tertiary total | 496 | 251,000 | 480 | 253,800 | 490 | 264,353 |
Table 9.12. Education 1875–2000
| Year1 | Early childhood education2 | Primary34 | Secondary56 | University students | Polytechnic students7 | College of education students | Wānanga students | Private training establishment students | |||
|---|---|---|---|---|---|---|---|---|---|---|---|
| services | students | schools | students | schools | students | ||||||
1Year ending 31 December until 1925; thereafter 1 July. Figures from 1994 on have been revised and are not comparable to previous years. 2Early childhood figures only include playcentres and kindergarten until 1990, when they also include childcare, kōhanga reo and Pacific peoples language groups. 3Primary includes year 1–8 students at all schools. 4Includes full primary, contributing, intermediate and special schools. 5Secondary includes year 9–15 students at all schools. 6Includes secondary and composite schools. 7Prior to 1990 polytechnic figures included all students attending polytechnic; from 1990 they include only those attending on 31 July. ... Not available Source: Ministry of Education | |||||||||||
| no. | (000) | no. | (000) | no. | (000) | number | |||||
| 1875 | .. | .. | 830 | 54.2 | 4 | ||||||
| 1880 | .. | .. | 1,171 | 95.2 | 14 | 1.6 | 211 | ||||
| 1885 | .. | .. | 1,363 | 116.5 | 24 | 2.6 | 442 | ||||
| 1890 | .. | .. | 1,566 | 134.1 | 22 | 2.1 | 596 | ||||
| 1895 | .. | .. | 1,831 | 145.8 | 24 | 2.5 | 742 | ||||
| 1900 | .. | .. | 2,157 | 149.4 | 86 | 6.9 | 805 | ||||
| 1905 | .. | .. | 2,192 | 158.1 | 86 | 6.9 | 1,153 | 211 | |||
| 1910 | .. | .. | 2,508 | 179.6 | 94 | 9.1 | 1,862 | 380 | |||
| 1915 | .. | .. | 2,765 | 210.8 | 129 | 11.5 | 2,039 | 390 | |||
| 1920 | .. | .. | 2,777 | 225.3 | 131 | 15.4 | 3,822 | 680 | |||
| 1925 | .. | .. | 2,995 | 247.3 | 181 | 23.2 | 4,442 | 1,271 | |||
| 1930 | .. | .. | 3,045 | 252.6 | 209 | 31 | 4,801 | 1,155 | |||
| 1935 | .. | .. | 2,950 | 232.3 | 216 | 31.9 | 5,101 | 429 | |||
| 1940 | .. | .. | 2,656 | 243.3 | 234 | 36.1 | 5,528 | 1,457 | |||
| 1945 | .. | .. | 2,874 | 252.5 | 248 | 46.9 | 8,425 | 1,431 | |||
| 1950 | .. | .. | 2,377 | 304.6 | 269 | 53.7 | 11,515 | 2,684 | |||
| 1955 | .. | .. | 2,423 | 365.4 | 313 | 80.8 | 10,851 | 2,847 | |||
| 1960 | .. | .. | 2,517 | 425 | 354 | 111.4 | 15,809 | 7,663 | 3,828 | ||
| 1965 | .. | 27.8 | 2,594 | 472.9 | 376 | 157.9 | 22,145 | 29,074 | 4,790 | ||
| 1970 | .. | 41.1 | 2,595 | 516.7 | 386 | 186.8 | 31,908 | 43,204 | 7,587 | ||
| 1975 | 1,098 | 54.8 | 2,542 | 525.3 | 408 | 219.7 | 35,499 | 56,098 | 8,004 | ||
| 1980 | 1,208 | 56.9 | 2,595 | 507.9 | 394 | 226.3 | 43,933 | 73,067 | 5,919 | ||
| 1985 | 1,389 | 60.7 | 2,641 | 452.4 | 403 | 230.9 | 59,123 | 76,054 | 2,703 | ||
| 1990 | 2,890 | 118.4 | 2,460 | 420.4 | 400 | 230.2 | 78,919 | 56,771 | 5,766 | ||
| 1995 | 3,824 | 159.4 | 2,368 | 448.2 | 430 | 236.6 | 104,389 | 95,664 | 10,156 | 726 | .. |
| 2000 | 4,175 | 174.2 | 2,268 | 484.2 | 456 | 245.5 | 122,727 | 87,436 | 12,045 | 2,972 | 39,173 |
9.1 Ministry of Education.
9.2 Ministry of Education; Early Childhood Development; New Zealand Qualifications Authority; Education Review Office; Learning Media Ltd; Teacher Registration Board; Māori Education Trust.
9.3 Ministry of Education; Statistics New Zealand.
9.4 Ministry of Education.
9.5 Ministry of Education; The Correspondence School; New Zealand Qualifications Authority.
9.6 Ministry of Education; Ministry of Social Policy; The Open Polytechnic of New Zealand; New Zealand Qualifications Authority; Career Services; Skill New Zealand; National Resource Centre for Adult Education and Community Learning.
9.7 Ministry of Education.
9.8 Ministry of Education.
Statistics New Zealand divisional manager responsible: Paul Brown.
Annual Report (annual). Te Kaupapa Matauranga Mo Te Iwi Māori (Māori Education Trust), Wellington.
Annual Report (annual). New Zealand Council for Educational Research (NZCER), Wellington.
Annual Report (annual). Teacher Registration Board, Wellington.
Boyd S (1998). Computers in classrooms. NZCER, Wellington.
Chalmers A (1998). Workload and Stress in New Zealand Universities in 1988: A follow-up to the 1994 study. NZCER and Association of University Staff of New Zealand, Wellington.
Education Statistics of New Zealand (annual). Ministry of Education, Wellington.
Garden RA (1996). Mathematics Performance of New Zealand Form 2 and Form 3 Students: National results from New Zealand's participation in the third international mathematics and science study, Ministry of Education, Wellington.
Garden RA (1997). Performance Assessment in the Third Mathematics and Science Study: New Zealand results, Ministry of Education, Wellington.
Garden RA (ed) (1996). Science Performance of New Zealand Form 2 and Form 3 Students: National results from New Zealand's participation in the third international mathematics and science study, Ministry of Education, Wellington.
Harris D, and Boyd S (1998). A Link to Learning: The use of computers by children with disabilities. NZCER, Wellington.
Keegan PJ (1998). Te Wāhanga Kaupapa Māori publications and documents 1972–1997, NZCER, Wellington.
Ko e Ako ‘a e Kakai Pasifika: Pacific Islands peoples’ education in Aotearoa, New Zealand towards the twenty-first century (1996). Ministry of Education, Wellington.
Mara DL (1998). Pacific Islands School-Parent–Community Liaison Project: An independent evaluation, NZCER, Wellington.
Mara DL (1998). Progress Towards Licensing and Chartering Pacific Islands Early Childhood Centres in New Zealand, NZCER, Wellington.
Meagher-Lundberg P, and Podmore VN (1998). Out-of-school care: A review of quality provision, NZCER, Wellington.
Ngā Haeata Mātauranga: Ten point plan for Māori education (1996). Ministry of Education, Wellington.
Podmore VN, and May H, with Mara D (1998). Evaluating Early Childhood Programmes Using the Strands and Goals of Te Whāriki, the National Early Childhood Curriculum. Final report on phases one and two to the Ministry of Education, NZCER/Ministry of Education, Wellington.
Report of the Ministry of Education (Parl paper E.1).
Report of Early Childhood Development Unit (Parl paper E.50).
Report of Education Review Office (Parl paper E.39).
Report of Education and Training Support Agency (Parl paper E.46).
Report of New Zealand Qualifications Authority (Parl paper E.44).
Report of the Pacific Islands Polynesian Education Foundation (Parl paper E.21).
Staffing of Form 1–7 and Form 3–7 State Secondary Schools (annual). Research and Statistics Division, Ministry of Education, Wellington.
Sisley R with Waiti D (1998). Te Pīkaunga-Mahi Me Te Kōhukihuki (Workload and Stress): A national survey of Māori ASTE Te Hau Takitini O Aotearoa members, NZCER, Wellington.
Tertiary Education Statistics (annual). Ministry of Education, Wellington.
Wylie C (1999). Can Vouchers Deliver Better Education? A review of the literature with special reference to New Zealand, NZCER, Wellington.
www.careers.govt.nz – Career Services
www.correspondence.school.nz – The Correspondence School
www.ecd.govt.nz – Early Childhood Development
www.ero.govt.nz – Education Review Office
www.learningmedia.co.nz – Learning Media Ltd
www.maorieducation.org.nz – Māori Education Trust
www.minedu.govt.nz – Ministry of Education
www.msd.govt.nz – Ministry of Social Development
www.nrc.org.nz – National Resource Centre for Adult Education and Community Learning
www.nzcer.org.nz – New Zealand Council for Educational Research
www.nzqa.govt.nz – New Zealand Qualifications Authority
www.skill.nz.govt – Skill New Zealand
www.trb.govt.nz – Teacher Registration Board
www.winz.govt.nz – Work and Income
Table of Contents
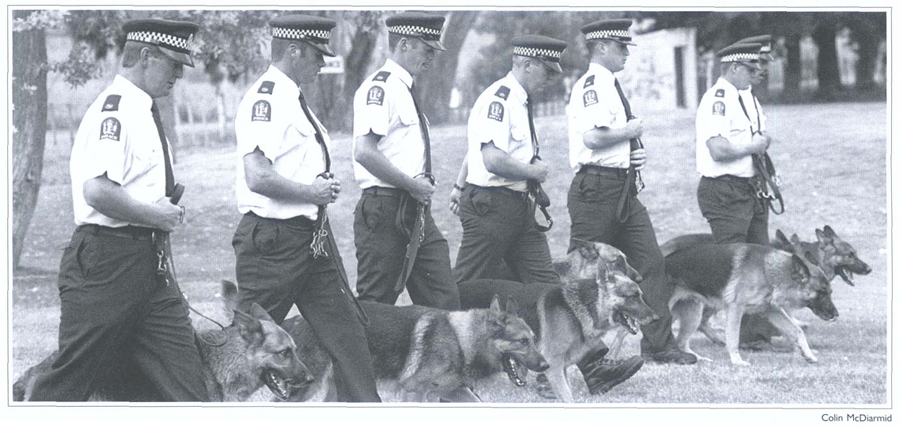
A comprehensive network of police dogs and handlers is maintained throughout New Zealand.
New Zealand has inherited a tradition of an independent judiciary, seen as a protection against unnecessary intrusion by the state in the lives of citizens. The Judicature Act 1908 and the Constitution Act 1986 contain a number of constitutionally significant provisions designed to ensure judicial independence. Judges (including those who sit in the court of appeal) are appointed by the governor-general.
Neither court of appeal nor high court judges may be removed from office except by the Sovereign or the governor-general acting upon an address of the House of Representatives on grounds of misbehaviour or incapacity. District court judges may be removed from office by the governor-general on the grounds of inability or misbehaviour. No person may be appointed a judge unless he or she has held a practising certificate as a barrister or solicitor for at least seven years. The retirement age is 68, although former judges may be reappointed as acting or temporary judges for up to four years, or one year if the judge is 72 years of age or over when reappointed.
The Judicial Committee of the Privy Council heads the hierarchy of New Zealand courts. Below the privy council is the court of appeal, followed by the high court and district courts. All courts exercise criminal, civil and family court jurisdictions.
In April 2002, Attorney-General Margaret Wilson announced moves to establish a stand-alone, five-judge Supreme Court of New Zealand to act as the final appeal court in place of the Judicial Committee of the Privy Council.
The Judicial Committee of the Privy Council. The Judicial Committee of the Privy Council is the final appeal tribunal for New Zealand. The judicial committee is not an English court, although its members are primarily eminent British judges. The judicial committee acts like a court, but it does not deliver a judgement. Instead, it submits its opinion on a case it has heard to the Sovereign, who is then required to make the necessary order. Appeals to the privy council may be brought by leave of the court appealed from, or by special leave of the privy council itself. Leave is granted as of right from any final judgement of the court of appeal when the matter in dispute is of $5,000 or more, or involves directly or indirectly some claim to property or some civil right exceeding that amount. The privy council has a discretionary power to grant special leave to appeal in criminal cases. Such leave is not commonly granted in criminal appeals from New Zealand. In May 1995, the solicitor-general reported to a cabinet committee on matters relating to the availability of appeals to the privy council. The government decided to retain the existing appellate structure. In April 2002, however, the attorney-general announced that legislation would be introduced to replace the privy council with a five-judge Supreme Court of New Zealand. It was expected the legislation would be enacted in 2003 and that the new court would commence sittings in 2004.
The court of appeal. The highest appeal court in New Zealand, the court of appeal has existed since 1846 and is constituted by the Judicature Act 1908. The primary function of the court is to determine ordinary appeals from the high court. Certain other proceedings in the lower courts may, by order of the high court, be removed to the court of appeal. The court also has some original jurisdiction. The court consists of the chief justice, who is a member by virtue of office as head of the judiciary; a judge of the high court appointed by the governor-general as its president; and six other judges of the high court appointed by the governor-general as judges of the court of appeal. Additional judges of the high court may be nominated by the chief justice to sit on the court of appeal. The judges of the court of appeal are also judges of the high court. They have seniority over all other judges of that court except the chief justice or the acting chief justice. The court of appeal may remit any proceedings pending before it to the high court and all its judgements, decrees and orders may be enforced by the high court. Decisions of the court of appeal are final except when an appeal is sent to the Judicial Committee of the Privy Council.
The High Court of New Zealand. The High Court of New Zealand was first established (as the Supreme Court of New Zealand) in 1841. It has all the jurisdiction which may be necessary for a court to administer the laws of New Zealand. The high court exercises jurisdiction in cases of major crimes, admiralty proceedings, important civil claims, appeals from lower courts and tribunals, and reviews of administrative actions. The high court also has inherent jurisdiction to punish for contempt of court. It consists of the chief justice and 36 other judges, as prescribed by the Judicature Act 1908. An additional judge or judges may be appointed by the governor-general when it is deemed necessary due to the illness, absence or anticipated absence of any judge. Judges of the high court are stationed in Wellington, Auckland, Hamilton and Christchurch. The high court travels on circuit to Whangarei, Rotorua, Gisborne, Napier, New Plymouth, Wanganui, Palmerston North. Blenheim, Nelson, Greymouth, Timaru, Dunedin and Invercargill. There are high court offices at Masterton and Tauranga, but the court does not sit in those areas. Table 10.1 lists judges of the high court and the court of appeal as at 31 May 2002.
Commercial list – Instead of being included in the normal order of cases to be heard in the high court, a separate list of commercial cases is kept to ensure they are resolved quickly. The Judicature Amendment Act 1986 made provision for establishment of this list at the office of the high court at Auckland for an initial period of four years. The governor-general, by notice in the New Zealand Gazette dated 26 February 1991, ordered that the commercial list at Auckland continue indefinitely.
Masters – There may be up to six masters of the high court with the qualifications and experience necessary for judicial appointment. Masters may exercise certain powers of the high court concurrently with high court judges. Masters deal with, among other things, applications for summary judgements, specified land transfer matters, assessment of damages where liability has been determined, and trials where only the amount of the debt or damages is in dispute. There were five masters at 31 May 2002.
Table 10.1. Judges of the court of appeal, and judges and masters of the high court1
1As at 31 May 2002. Source: High Court of New Zealand | |
|---|---|
| Judges of the court of appeal | Rt Hon Justice Gault (president), Rt Hon Sir Kenneth Keith, Rt Hon Justice Blanchard, Rt Hon Justice Tipping, Rt Hon Justice McGrath, Rt Hon Justice Anderson, Rt Hon Justice Glazebrook, Rt Hon Dame Sian Elias, Chief Justice of New Zealand (ex officio). |
| Judges of the high court | Wellington: Rt Hon Dame Sian Elias, Chief Justice of New Zealand, Hon Justice high court Ellis (executive judge), Hon Justice Doogue, Hon Justice Robertson (law commission), Hon Justice Hammond, Hon Justice Goddard, Hon Justice Gendall, Hon Justice Wild, Hon Justice Durie, Hon Justice Ronald Young, Hon Justice France, Hon Justice Neazor (acting judge). Master D I Gendall. |
| Auckland: Hon Justice Fisher (executive judge), Hon Justice Morris, Hon Justice Williams, Hon Justice Baragwanath, Hon Justice Salmon, Hon Justice Paterson, Hon Justice Potter, Hon Justice Laurenson, Hon Justice Randerson (liaison judge, Waikato), Hon Justice Nicholson, Hon Justice Chambers, Hon Justice Rodney Hansen, Hon Justice O'Regan, Hon Justice Priestley, Hon Justice Harrison, Hon Justice Heath, Hon Justice Tompkins (acting judge), Hon Justice Smellie CNZM (acting judge), Hon Justice Penlington (acting judge). Master Anne Gambrill, Master J A Faire, Master G L Lang. | |
| Christchurch: Hon Justice John Hansen (executive judge), Hon Justice Panckhurst, Hon Justice Chisolm, Hon Justice William Young, Hon Justice Fraser (acting judge). Master G J Venning. | |
District courts. Unlike the high court, which is one court for New Zealand, district courts are established as separate entities in various localities. District courts are constituted under the District Courts Act 1947, which limits the number of district court judges to 110. Judges are appointed by the governor-general, who also appoints a Chief District Court Judge. The chief judge oversees administration of the courts and also sits in court. District courts have extensive civil and criminal jurisdiction. A number of district court judges are specially warranted to preside over jury trials of criminal cases. Justices of the Peace can sit as district court judges to hear a limited number of minor criminal and traffic charges which do not carry a maximum fine in excess of $500. They also preside over deposition hearings.
New Zealand has a number of courts with specialist functions.
Employment Court. The Employment Court is constituted under the Employment Relations Act 2000. It consists of the Chief Judge of the Employment Court and four other judges appointed from time to time by the governor-general. Qualifications for appointment, tenure and retirement age are the same as those applying to high court judges. Employment Courts are located in Auckland, Wellington and Christchurch, although they can travel to other locations. Broadly speaking, the court has jurisdiction to deal with matters in the employment relations field. These include hearing and determining appeals or reviews of determinations of the Employment Relations Authority, hearing and determining any questions of law referred to it by the authority, hearing and determining penalties in relation to strikes and lockouts, union access and issuing compliance orders on specified matters.
Family courts. Family courts have been established since 1980 as divisions of district courts. The governor-general appoints family court judges – who are district court judges – and a Principal Family Court Judge. Family courts have jurisdiction to deal with dissolution of marriages, adoption, guardianship applications, domestic actions, matrimonial property, child support, care and protection applications in respect of children and young persons, mental health compulsory treatment applications, protection of personal property rights applications and similar matters. They may state a case on a point of law to the high court or transfer complex proceedings to that court.
Youth courts. Youth courts are constituted by the Children, Young Persons and Their Families Act 1989. Jurisdiction of the courts is exercised by specially-designated district court judges. Offences committed by children (under 14 years) and young persons (older than 14 but less than 17 years of age) come before the youth courts initially and most are dealt with there. The rest proceed to district courts or the high court. Youth courts do not hear matters relating to the care or protection of children and young people, which are dealt with in family courts.
Māori Land Court and Māori Appellate Court. These courts are constituted under the Te Ture Whenua Māori Act 1993 and have jurisdiction to hear matters relating to Māori land. The governor-general may from time to time appoint a chief judge and other judges of the court as required. Judges of the Māori Land Court are also judges of the Māori Appellate Court. Three or more of the judges have power to act as the Māori Appellate Court. The Māori Land Court or the Māori Appellate Court may state a case for the opinion of the high court on any point of law arising in proceedings before it. The decision of the high court is subject to an appeal to the court of appeal. The decision of the high court or court of appeal on any case stated is binding on the Māori Land Court and the Māori Appellate Court.
Environment Court. The Environment Court is constituted under the Resource Management Act 1991. It consists of not more than eight environment judges at any one time. Environment commissioners are appointed by the governor-general on the recommendation of the Minister of Justice, after consultation with the Minister for the Environment and the Minister of Māori Affairs. As currently constituted, the court has seven judges, four alternate judges, 13 commissioners and three deputy commissioners. One judge holds office as the Principal Environment Judge. The Environment Court is a court of record and is required to act in a judicial way. It is also accepted as an expert tribunal, which is reflected in the multi-disciplinary expertise of its members. The Environment Court is a people's court, with people presenting their own cases or represented as they choose. Cases can be conducted without formality as long as they are conducted fairly and efficiently. The court recognises tikanga Māori when appropriate and holds sittings as close to the location of the subject matter as convenient. The use of mediation and negotiation to settle disputes is encouraged and many cases are resolved promptly and inexpensively by these methods. The act provides for environment commissioners to conduct mediation, conciliation or other procedures designed to facilitate the resolution of any matter before the court. The Environment Court, among other things, determines appeals against grants of resource consents or the conditions set for their operation, hears submissions on local and regional government authority resource management plans, makes recommendations on water conservation order applications, and makes declarations about the application and interpretation of resource management law.
Coroner's court. Coroners are judicial officers appointed under the Coroners’ Act 1988. Their role is to establish, so far as is possible, the cause and circumstances of death in cases of sudden or unexplained deaths and deaths in other special circumstances. Coroners may authorise postmortem examinations and hold inquests into deaths. Responsibility for the provision of coroner-directed postmortem services passed from the Health Funding Authority to the Department for Courts on 1 July 1999. Responsibility includes payment of pathologists and contracting with postmortem service providers (hospital mortuaries).
More than 100 tribunals, authorities, boards, committees or related bodies exist in New Zealand to deal with disputes, largely between individuals, on matters such as environmental planning; economic issues; scientific and technical matters; censorship; welfare and benefits; taxation; occupational licensing and discipline; activity licensing, eg shop trading hours; and company registration. The main tribunals which deal with individual disputes are described below, together with the Waitangi Tribunal.
Employment Tribunal. The Employment Tribunal is constituted under the now repealed Employment Contracts Act 1991. Despite repeal of the act, a residual tribunal remains to deal with residual applications made to it under the act. The tribunal's jurisdiction includes providing mediation assistance in all matters properly brought before it, adjudicating unresolved employment relationship problems and issuing compliance orders on specified matters. The tribunal will be disbanded once all residual applications have been dealt with.
Disputes tribunals. Disputes tribunals, previously known as small claims tribunals, were established in 1976 as divisions of district courts. The tribunals have jurisdiction to determine disputes up to a value of $7,500 based on contract, quasi-contract, or tort (in respect of the destruction or loss of any property, damage or injury to any property, or recovery of property). Claims may also be determined by the tribunal up to the value of $12,000 if the plaintiff and the defendant agree to settle in this way. Every district court, apart from the five courts with police registrars, has a disputes tribunal. There are 58 part-time referees to service the 66 tribunals.
Human Rights Review Tribunal. Formerly the Complaints Review Tribunal, the Human Rights Review Tribunal was set up under the Human Rights Commission Act 1977 and is continued under the Human Rights Act 1993 and the Human Rights Amendment Act 2001. Its function is to deal with complaints of discrimination, breaches of privacy and breaches of patient codes of rights which have not been settled by either the human rights commissioner, the privacy commissioner, or the health and disability commissioner. The tribunal has powers similar to a district court. It hears the complaint, makes a decision and can award damages or order other remedies. Each sitting of the tribunal is chaired by a barrister or solicitor with two other appointees with experience in the area.
Tenancy tribunals. Tenancy tribunals were set up under the Residential Tenancies Act 1986 to determine disputes between landlords and tenants to which the act applies. Tribunals are set up on similar lines to disputes tribunals. Hearings take place in district court premises under the authority of part-time adjudicators.
Waitangi Tribunal. The Waitangi Tribunal was set up under the Treaty of Waitangi Act 1975 to consider claims by Māori under the Treaty of Waitangi. It was originally set up to consider only claims from 1975 onwards, but its jurisdiction was extended in 1985 to claims dating back to 1840.
The law of New Zealand consists of the common law, statute law enacted by the New Zealand Parliament, constitutional conventions, a number of United Kingdom statutes still in force in New Zealand, regulations, by-laws and other forms of subordinate legislation.
The common law. Sometimes referred to as case law or judge-made law, the common law is based on general rules developed by the courts in England over centuries which became part of the law of New Zealand in 1840. The common law continues to develop. When applying the common law, New Zealand courts take into account common law principles developed in New Zealand and other parts of the Commonwealth, notably the United Kingdom, Australia and Canada. The common law can be reversed or amended by statute law.
New Zealand statutes. Parliament has full power to make laws having effect in, or in respect of, any part of New Zealand, and laws having effect outside New Zealand. The extra-territorial lawmaking power is rarely exercised, except in relation to crimes committed aboard commonwealth ships or aircraft, or any ship or aircraft that arrives in New Zealand.
United Kingdom statutes. A number of United Kingdom statutes are still in force in New Zealand. They are those statutes passed before 1840, when New Zealand first became a British colony, which were applicable to the circumstances of the colony at that date, and others passed between 1840 and 1947 which extended to New Zealand expressly or by necessary implication. Many United Kingdom statutes have been repealed or replaced by enactments of the New Zealand Parliament. A few of particular constitutional significance remain – the Magna Carta of 1297 and the Act of Settlement 1700. These acts are listed and defined in the Imperial Laws Application Act 1988.
Subordinate legislation. Many statutes empower the Governor-General of New Zealand to make regulations by Order-in-Council. Local authorities and a number of other bodies may make bylaws in accordance with relevant statutes. The courts may examine regulations and by-laws and declare them invalid if they go beyond limits prescribed by statute.
The Law Commission Te Aka Matua o te Ture was established by the Law Commission Act 1985. The commission is an independent, government-funded organisation, which reviews areas of the law that need updating, reforming or developing. The commission helps ensure that laws provide effectively for the current and future needs of New Zealand's changing society. Its goal is to achieve law that is just, principled, accessible and reflects the heritage and aspirations of the people of New Zealand. The commission is funded through Vote: Justice. There are six commissioners, and it employs legal researchers and support staff. It has a substantial, fully-staffed law library.
The commission researches in detail areas of the law under review and then reaches tentative conclusions. After a period of consultation with outside interests and discussion within the commission, a preliminary paper is usually published setting out the commission's ideas. The commission then invites comment on the paper. After further consultation and internal discussion, it makes specific recommendations. These recommendations are published in its report series. Law Commission reports are presented to the Minister Responsible for the Law Commission, tabled in parliament and published.
Replacing old law by new is the task of parliament. Whether action is taken on a Law Commission report depends on decisions made by the minister responsible, by the government as a whole, and by parliament. Various ministries, the Parliamentary Counsel Office and parliamentary select committees all play a part in determining the enacted law's final shape.
As well as projects undertaken either at the request of the minister or on the commission's initiative, advisory work is done in response to requests from government departments and Crown entities on reviews of the law, and the commission can be called on to assist select committees. The commission also provides assistance to the legislation advisory committee, an independent committee appointed by the Minister of Justice to advise on general legislative issues and individual items of legislation.
In developing proposals, the commission recognises the importance of the Treaty of Waitangi and takes account of community and international experience. In making its recommendations, the commission is required to take into account te ao Māori and to give consideration to the multicultural character of New Zealand society.
Reports published during 2001 were Juries in Criminal Trials; Acquittal Following Perversion of the Course of Justice; Misuse of Enduring Powers of Attorney; Subsidising Litigation; Some Criminal Defences with Particular Reference to Battered Defendants; and Minority Buy-Outs. Study papers published were Simplification of Criminal Procedure Legislation: An Advisory Report to the Ministry of Justice; Determining Representation Rights under Te Ture Whenua Māori Act 1993: An Advisory Report for Te Puni Kōkiri; Māori Custom and Values in New Zealand Law; Mandatory Orders Against the Crown and Tidying Judicial Review; and Insolvency Law Reform: Promoting Trust and Confidence, An Advisory Report to the Ministry of Economic Development. Discussion papers published were The Future of the Joint Family Homes Act; Reforming the Rules of General Discovery; and Improving the Arbitration Act 1996.
As well as continuing work on discussion papers published in 2001, the commission's future work programme includes a review of the structure of the courts, a review of the Privacy Act 1993, a review of search warrant powers, deciding how facts are determined for sentencing, family court dispute resolution, and an after-settlement asset project.
The Legal Services Agency: Pokapū Ratonga Ture is a Crown entity set up by the Legal Services Act 2000. It came into existence on 1 February 2001, replacing the Legal Services Board.
The agency's purpose is to promote access to justice. To do this, it administers, funds or sponsors a range of legal services, including:
Legal advice and representation through legal aid, the duty solicitor programme and the police detention legal assistance scheme.
Services provided by community law centres, such as legal advice and assistance, law reform and advocacy work, legal information and law-related education.
The agency is assisted by a public advisory committee, which advises on community concerns about legal aid, legal aid access, unmet legal needs, community law centre funding, legal information and law-related education needs and areas in need of research. Decisions on legal aid made by the agency may be referred back to the agency for reconsideration, or to an independent legal aid review panel for review.
Criminal legal aid. A person charged with a criminal offence may apply for legal aid. Not all criminal matters qualify for legal aid, as some are not considered serious enough (such as some driving offences) because they do not have serious or long-lasting consequences for the defendant.
Duty solicitors. The duty solicitor scheme ensures solicitors are available at every district court to help people charged with an offence who do not have a solicitor. The service is free. The duty solicitor ensures the person charged understands basic court procedures. They also make sure the case is dealt with satisfactorily. They give advice on pleas, bail and sentencing options available to the court. They also advise on how to arrange private legal representation or legal aid.
Police Detention Legal Assistance. This scheme enables any person being questioned or detained by the police to obtain advice or assistance by telephone or in person from a lawyer. The service is free. The scheme ensures the New Zealand Bill of Rights Act 1990 is given practical effect, so those who are detained for questioning are able to obtain legal advice without delay.
Civil legal aid. This applies to all family matters and civil matters, including cases before the Waitangi Tribunal and some before the employment tribunal. People may be asked to contribute to the costs of their case, depending on their financial circumstances.
Finance. In the 2000/01 financial year, 66,714 grants of legal aid were made and legal aid payments totalling $79 million (GST exclusive) were made. Payments made can relate to grants approved in a previous year. Of these payments, $34 million went on family law cases, $30 million was spent on criminal cases, $6 million on civil actions and $4 million on Waitangi Tribunal matters. A further $4 million was spent on the duty solicitor scheme and $1 million on the Police Detention Legal Assistance Scheme. Legal aid recovered from imposed contributions in the year was $5 million. Legal aid is demand driven. Once an entitlement to assitance is established, aid must be provided. No direct control can be exercised over the number of applications submitted.
Community law centres. Community law centres (CLCs) provide legal services to those in communities who cannot afford a lawyer. The number of centres grew from nine in 1992 to 24 in 2001. They provide free legal advice and sometimes representation, law-related education and legal information, and may work on law reform. CLCs are funded from interest on nominated lawyers’ trust fund accounts.
Public Advisory Committee. The Public Advisory Committee was set up by the Legal Services Act 2000. The nine-member committee represents a range of groups, including women, Māori, Pacific peoples, young people, older people, people with disabilities, consumers, community law centres and the legal profession. The committee provides advice to the agency on a number of matters including:
Feedback and concerns of the community about legal aid schemes and community legal services, and information available on these services.
Unmet legal needs of communities.
Funding of community law centres.
Research into legal aid schemes and community legal services.
Legal education programmes for the public.
The High Court of New Zealand has original jurisdiction to hear and determine civil proceedings including:
Proceedings in contract and tort.
Equity.
Supervisory powers over lower courts and tribunals.
Wills and administration of the estates of the deceased.
Dissolution of partnerships and the taking of partnership accounts.
The sale and distribution of the proceeds of any property subject to a lien or charge.
Proceedings relating to mortgages, leases, sale, or partition of land, including specific performance of contract.
Execution of charitable or private trusts.
Rectification, setting aside or cancellation of deeds or contracts.
Proceedings relating to the insolvency of individuals and companies.
Family law (matrimonial property and proceedings under the Family Protection Act 1955).
Electoral petitions.
Admiralty.
Absconding debtors.
The high court also issues declaratory judgements and hears appeals from the district courts and from a number of administrative tribunals. Decisions on many civil proceedings in the high court may be appealed to the court of appeal.
District courts have jurisdiction to hear proceedings founded on contract or tort and other civil claims (including equitable claims) where the amount of debt, demand, or damage, or value of the chattels claimed, is no more than $200,000. In proceedings for recovery of land, the courts have jurisdiction if rent payable does not exceed $62,500 a year, or where the value of the land does not exceed $500,000.
District Court Rules 1992 were designed to bring procedures in the district court into line with those in the high court. The rules apply to all matters within the civil jurisdiction of the district court, except where other rules provide procedures for any class of litigation.
Every person over the age of 18 registered on the electoral roll is eligible for jury service, subject to some exceptions. Members of Parliament, those involved in justice-related occupations and people who have certain prison sentences are excused from serving on a jury. A person may be excused if jury service would cause serious inconvenience or hardship.
The Crown Law Office is a government department which provides legal advice and representation to the Crown in matters affecting the executive government, particularly in the areas of criminal, public and administrative law. Services provided include judicial review of government actions, constitutional questions including Treaty of Waitangi issues, the enforcement of criminal law and protection of the revenue. The office administers the prosecution process in the criminal justice system, in particular trials on indictment before juries.
The office has two primary purposes in providing these services:
To ensure that the operations and responsibilities of the executive government are conducted lawfully.
To ensure that the government is not prevented, through legal process, from lawfully implementing its policies and discharging its governmental responsibilities.
The Solicitor-General is the Chief Executive of the Crown Law Office and is the chief legal adviser to the government, subject to any views expressed by the Attorney-General. In this capacity, the Solicitor-General is the government's chief advocate in the courts. In addition, the Solicitor-General is responsible for the conduct of prosecution of indictable crime. The Solicitor-General also has a number of specific statutory duties and functions.
The Crown Law Office is organised into nine client service teams, bringing together specialist expertise to enable clients to address key issues facing them in the areas of public, administrative and constitutional law. Each team is led by a Crown Counsel, who is the principal contact point for clients and the team's professional leader and manager. Each team is staffed by other Crown Counsel, assistant Crown Counsel and support personnel.
The nine teams are: The Bill of Rights Act; public commercial; commercial regulatory; criminal and Crown solicitors; employment and education; land and resource management; law officer functions; taxation and public revenue; and treaty issues and international law.
Reporting to the office is a network of Crown Solicitors located in main centres around New Zealand. Crown Solicitors are private legal practitioners appointed on the recommendation of the Attorney-General and by warrant of the governor-general to conduct indictable trials on behalf of the Crown in all high court districts. The Crown Solicitors Regulations 1994 give the basis for their remuneration.
The following selection of cases is a sample of legal advice and representation the office has been involved in recently.
Bill of Rights – The court of appeal was asked to consider the correct approach to, and the calculation of, compensation for breaches of the New Zealand Bill of Rights Act 1990. The central issue in the cases was whether a breach of the Bill of Rights required extra compensation over and above the amount that might be recoverable at common law. The court decided against the need for extra compensation and that a specific declaration of a breach of rights would suffice. In another case on the same issue, the court confirmed that only if the nature of the right breached differed from the interests protected a\ common law would extra compensation become necessary.
Charitable trusts – Long-running proceedings about the future of the Centrepoint Community Growth Trust came to an end in the high court in Auckland. The court approved a variation of the trust to enable it to carry out its charitable purposes. At the same time, the court endorsed a settlement payment to Mr Bert Potter and his followers on the condition they left the community. The Public Trustee remains the trustee of the trust, now renamed the New Zealand Communities Growth Trust.
Commercial litigation – The privy council considered an appeal relating to a decision by the Minister of Transport in Ports of Auckland Ltd v The Minister of Transport & Others declining to approve an amendment to a port company plan. The privy council held that the minister's decision not to amend the port plan to include various marina assets was reasonable and valid.
Criminal law – The office continued its direct involvement in running the prosecution in R v Watson. The case was a lengthy one (nearly three months) and was followed by an unsuccessful appeal against conviction to the court of appeal. In R v Mako, a Solicitor-General appeal against sentence led to a review by the court of appeal of sentencing tariffs relating to aggravated robbery.
Employment law – The office gave advice and made representation to government departments and ministers on employment issues covering departmental restructurings, redundancy, discrimination, claims of workplace stress and general disciplinary issues. A number of these issues were litigated before the employment tribunal, the Employment Court and the court of appeal.
Inquiries – The office also assisted clients meet their obligations in respect of several inquiries, significantly parliament's Financial Expenditure Committee Inquiry into the Powers and Operations of the Inland Revenue, the Auditor-General's Inquiry into Events Surrounding the Charter of Aircraft by the Department of Work and Income and the Ministerial Review of the Department of Work and Income.
Public interest immunity – The scope of public interest immunity in the context of decisions relating to national security was considered by the court of appeal on two occasions. In the second of its decisions, the court recognised the different status of public interest immunity claims based on national security.
Treaty of Waitangi – Advice and litigation over issues arising from the Treaty of Waitangi and Māori customary rights continued, as did advice relating to negotiation of historical claims brought under the treaty. Litigation over ownership of foreshore and seabed was also progressed. Representation is provided before the Waitangi Tribunal on a range of historical regional claims, as well as broader claims to the ownership of natural resources. Advice is also being provided relating to treaty aspects of the contemporary Crown/Māori relationship.
Vexatious litigants – The Attorney-General successfully applied to the high court in AG v Collier for an order declaring a litigant to be vexatious. Such applications are rare, this being only the third occasion when such an order has been made.
Further information about the office may be found at www.crownlaw.govt.nz
The more serious crimes in New Zealand are defined by the Crimes Act 1961. The Summary Offences Act 1981 provides for a wide variety of less serious offences. These include offences against public order, such as disorderly behaviour and fighting in a public place, and offences against persons or property, such as common assault and wilful damage.
A conviction is the most frequent outcome of a prosecution. The proportion of all prosecutions resulting in a conviction has slowly declined in recent years, reaching the lowest level recorded in a decade in 2000 at 66 percent. At least part of the decrease is likely to be linked to the use of diversion by the police. Figure 10.1 shows convictions by offence type from 1997 to 2000.
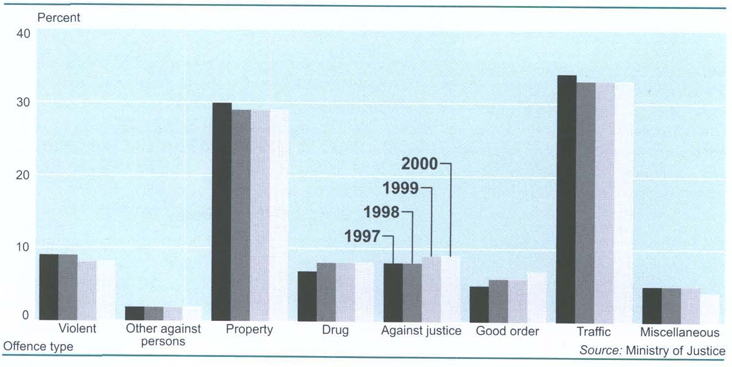
Total convictions. The annual number of convictions has been lower since 1997, partly due to the offence of failing to register a dog becoming an infringement offence. In 1996 there were 6,269 convictions for this offence, but in 2000 there were only 135.
Table 10.2 shows annual convictions by type of offence from 1991 to 2000.
Table 10.2. Convictions for all offences, by type of offence
| Offence type | 1991 | 1992 | 1993 | 1994 | 1995 | 1996 | 1997 | 1998 | 1999 | 2000 |
|---|---|---|---|---|---|---|---|---|---|---|
| Source: Ministry of Justice | ||||||||||
| Violent | 9,568 | 10,708 | 13,095 | 15,845 | 16,714 | 16,497 | 15,683 | 16,131 | 15,287 | 14,639 |
| Other against persons | 2,587 | 2,686 | 2,967 | 3,213 | 3,503 | 3,577 | 3,261 | 3,518 | 3,459 | 3,492 |
| Property | 54,727 | 57,403 | 57,282 | 57,438 | 56,972 | 56,702 | 53,674 | 53,295 | 51,178 | 50,039 |
| Drug | 11,555 | 11,434 | 13,239 | 14,197 | 11,792 | 11,594 | 12,997 | 14,168 | 14,021 | 13,663 |
| Against justice | 10,561 | 11,075 | 12,263 | 13,022 | 13,521 | 13,902 | 14,819 | 15,685 | 15,306 | 15,491 |
| Good order | 6,506 | 6,255 | 7,443 | 8,358 | 9,284 | 9,732 | 9,927 | 10,552 | 11,062 | 11,608 |
| Traffic | 79,563 | 68,828 | 62,178 | 59,508 | 64,024 | 63,183 | 60,502 | 62,201 | 58,785 | 57,112 |
| Miscellaneous | 11,394 | 13,869 | 19,678 | 18,965 | 16,598 | 17,209 | 9,941 | 10,289 | 9,664 | 7,900 |
| Total | 186,461 | 182,258 | 188,145 | 190,546 | 192,408 | 192,396 | 180,804 | 185,839 | 178,762 | 173,944 |
Violent offences. The number of convictions for violent offences has shown a slowly decreasing trend since 1995, after a rapid increase between 1991 and 1995. The 2000 figure of 14,639 was the lowest recorded since 1993, but was still 53 percent higher than the 1991 figure. In the seven years to 2000, violent offences accounted for between 8 and 9 percent of all convictions, compared with 5 percent in 1991.
Violent sex offences. The total number of convictions for violent sex offences (rape, unlawful sexual connection, attempted sexual violation and indecent assault) peaked at 2,084 in 1996, but decreased after that. In 2000, there were 1,297 convictions for violent sex offences. The number of convictions for rape (138) and attempted sexual violation (42) in 2000 were the lowest recorded in the previous decade. The number of convictions for unlawful sexual connection fluctuated from year to year during the decade, but there were fewer convictions in the last four years than in the period 1993 to 1996. The number of convictions for indecent assault increased from 731 to 1,290 between 1991 and 1996, but generally decreased after that. There were 798 convictions for indecent assault in 2000 – the lowest number since 1991.
Table 10.3 shows the number of convictions for violent offences, including violent sex offences, from 1991 to 2000.
Table 10.3. Convictions for violent offences
| Offence type | 1991 | 1992 | 1993 | 1994 | 1995 | 1996 | 1997 | 1998 | 1999 | 2000 |
|---|---|---|---|---|---|---|---|---|---|---|
1Includes convictions for manslaughter which involved the use of a motor vehicle. 2Includes both robbery and assault with intent to rob. 3Mostly assault with a weapon, wounding with intent, and injuring with intent, but also includes aggravated wounding or injury, disabling, doing dangerous act with intent, acid throwing, and poisoning with intent to cause grievous bodily harm. These offences have maximum penalties of at least five years’ imprisonment. 4Mostly common assault under the Crimes Act 1961, but also includes assault with intent to injure, injuring by unlawful act. and aggravated assault. 5Offences under section 194(h) of the Crimes Act 1961. 6Assault on a child under the age of 14 years under section 194(a) of the Crimes Act 1961. 7Offences under section 195 of the Crimes Act 1961. Source: Ministry of Justice | ||||||||||
| Murder | 26 | 43 | 25 | 25 | 34 | 27 | 39 | 24 | 25 | 31 |
| Manslaughter1 | 35 | 43 | 38 | 23 | 38 | 36 | 28 | 45 | 28 | 26 |
| Attempted murder | 14 | 12 | 5 | 13 | 6 | 13 | 19 | 5 | 6 | 9 |
| Kidnapping/abduction | 81 | 59 | 72 | 81 | 112 | 142 | 112 | 149 | 81 | 113 |
| Rape | 157 | 149 | 238 | 247 | 327 | 302 | 210 | 253 | 207 | 138 |
| Unlawful sexual connection | 266 | 341 | 411 | 370 | 380 | 410 | 279 | 349 | 361 | 319 |
| Attempted sexual violation | 57 | 55 | 85 | 74 | 73 | 82 | 58 | 56 | 58 | 42 |
| Indecent assault | 731 | 939 | 1,099 | 1,150 | 1,112 | 1,290 | 947 | 1,054 | 968 | 798 |
| Aggravated burglary | 59 | 67 | 50 | 75 | 96 | 74 | 102 | 83 | 77 | 71 |
| Aggravated robbery | 284 | 402 | 411 | 422 | 479 | 456 | 582 | 555 | 523 | 434 |
| Robbery2 | 173 | 143 | 159 | 162 | 204 | 213 | 258 | 278 | 233 | 171 |
| Grievous assault3 | 694 | 681 | 748 | 988 | 1,157 | 1,222 | 1,209 | 1,335 | 1,258 | 1,324 |
| Serious assault4 | 1,418 | 1,582 | 2,024 | 2,586 | 2,993 | 2,964 | 3,031 | 3,239 | 3,090 | 3,251 |
| Male assaults female5 | 1,623 | 1,902 | 2,943 | 4,157 | 4,091 | 3,753 | 3,335 | 3,145 | 3,043 | 2,922 |
| Assault on a child6 | 152 | 171 | 212 | 299 | 302 | 326 | 298 | 294 | 304 | 281 |
| Minor assault | 3,435 | 3,623 | 4,036 | 4,542 | 4,688 | 4,462 | 4,432 | 4,516 | 4,245 | 3,963 |
| Threaten to kill/do GBH | 268 | 369 | 413 | 518 | 511 | 585 | 602 | 633 | 641 | 629 |
| Cruelty to a child7 | 9 | 41 | 39 | 22 | 24 | 17 | 17 | 17 | 40 | 22 |
| Other violence | 86 | 86 | 87 | 91 | 87 | 123 | 125 | 101 | 99 | 95 |
| Total | 9,568 | 10,708 | 13,095 | 15,845 | 16,714 | 16,497 | 15,683 | 16,131 | 15,287 | 14,639 |
Robbery. The number of convictions for robbery showed an increasing trend between 1992 and 1998, but dropped significantly in both 1999 and 2000. The number of convictions for aggravated robbery decreased in the three years to 2000 after showing an increasing trend between 1991 and 1997. The 2000 figure of 434 was the lowest recorded since 1994.
Twenty-nine percent of all convictions in 2000 were for offences against property.
Non-sexual assaults. The number of convictions for non-sexual assaults increased significantly between 1991 and 1995, but has generally shown a slowly decreasing trend since then. A large part of the increase in the early to mid-1990s occurred for the offence of ‘male assaults female’ under section 194(b) of the Crimes Act 1961, the majority of which were domestic-related assaults. Statistics New Zealand suggested in a 1996 report that the ‘increase may be due largely to changes in police practice in relation to domestic violence. Whereas police formerly attempted to mediate and reconcile the parties in domestic incidents, they now treat such incidents as family violence complaints and, barring exceptional circumstances, arrest [and prosecute] the offender'. Although the number of ‘male assaults female’ convictions decreased in each of the six years to 2000, the 2000 figure was still 80 percent higher than the 1991 figure.
Assaults on children. Convictions for assaults on children aged less than 14 years (under section 194(a) of the Crimes Act 1961) increased significantly in the early 1990s. The number of convictions doubled between 1991 and 1994, from 152 to 299. Since 1994, the number of convictions for assault on a child has averaged 300 a year, with the 2000 figure (281) being a little lower than the average.
Assault. The number of convictions in the two most serious categories of assault – grievous and serious – increased markedly between 1991 and 1998, but levelled off after that. Convictions for minor assault peaked in 1995 and have generally decreased since then.
Other convictions. Convictions for threatening to kill or do grievous bodily harm showed a strong upward trend in the decade ending 2000. Convictions more than doubled from 268 in 1991 to 641 in 1999, before decreasing a little in 2000 to 629. Convictions for other offences against the person (see table 10.4) have been relatively stable since 1995 at around 3,500 convictions annually, after an increasing trend between 1991 and 1995. The number of convictions for threatening and intimidation offences (which do not involve a threat to kill or do grievous bodily harm) increased strongly during the decade, with the number in 2000 (561) more than triple the 1991 figure (183).
Table 10.4. Convictions for other offences against the person
| Offence type | 1991 | 1992 | 1993 | 1994 | 1995 | 1996 | 1997 | 1998 | 1999 | 2000 |
|---|---|---|---|---|---|---|---|---|---|---|
1Mainly unlawful sexual intercourse or doing an indecent act with or upon another person. Sex offences reported in the violent offences category are not included in the figures for this category. 2Obstructing or resisting a police officer, traffic officer or other official. 3Excludes threatening to kill or do grievous bodily harm which is classified here as a violent offence. Source: Ministry of Justice | ||||||||||
| Incest | 24 | 63 | 47 | 44 | 46 | 14 | 12 | 10 | 3 | 7 |
| Other sex1 | 277 | 397 | 402 | 427 | 363 | 416 | 332 | 294 | 244 | 293 |
| Obstruct/resist2 | 1,978 | 1,896 | 2,095 | 2,229 | 2,412 | 2,471 | 2,269 | 2,493 | 2,405 | 2,379 |
| Threats/intimidation3 | 183 | 217 | 277 | 343 | 440 | 412 | 466 | 477 | 549 | 561 |
| Other | 125 | 113 | 146 | 170 | 242 | 264 | 182 | 244 | 258 | 252 |
| Total | 2,587 | 2,686 | 2,967 | 3,213 | 3,503 | 3,577 | 3,261 | 3,518 | 3,459 | 3,492 |
Property. Property offences comprise the second largest group of offences resulting in conviction. In 2000, 29 percent of all convictions were for offences against property. The number of convictions for property offences remained reasonably stable between 1992 and 1996 at around 57,000 convictions annually (see table 10.5), but decreased significantly in the last four years of the decade. The 2000 figure of 50,039 was the lowest recorded in the decade.
Most of the decrease in property offences was due to a decrease in the number of convictions for fraud. Between 1994 and 1996, there were around 21,000–22,000 convictions for fraud each year, but by 2000 the number had dropped to fewer than 15,000. This was the lowest number of convictions for fraud recorded in the decade. The decrease needs to be treated with caution, however. Many offenders convicted of fraud face a large number of charges, so the total number of fraud charges could change significantly without the number of people being convicted of fraud necessarily changing much. In fact, the number of cases where the most serious offence was fraud was only about 250 fewer in 2000 than in 1996.
Table 10.5. Convictions for property offences
| Offence type | 1991 | 1992 | 1993 | 1994 | 1995 | 1996 | 1997 | 1998 | 1999 | 2000 |
|---|---|---|---|---|---|---|---|---|---|---|
1Includes fraud, false pretences, and forgery. 2Mostly unlawfully interfering with or getting into/onto a motor vehicle or motorcycle, unlawfully taking a bicycle, entering with intent, possessing instruments for burglary or conversion, providing misleading information to obtain a benefit, or misleading a social welfare officer. Source: Ministry of Justice | ||||||||||
| Burglary | 7,891 | 7,264 | 7,358 | 6,893 | 6,712 | 6,684 | 6,719 | 6,374 | 5,938 | 6,363 |
| Theft | 14,479 | 14,673 | 15,415 | 13,611 | 12,780 | 13,332 | 13,208 | 13,793 | 13,720 | 13,370 |
| Receiving stolen goods | 3,226 | 3,572 | 4,109 | 3,479 | 3,118 | 3,148 | 3,084 | 3,374 | 3,000 | 3,018 |
| Motor vehicle conversion | 3,364 | 2,867 | 2,553 | 2,659 | 2,810 | 2,831 | 2,793 | 2,538 | 2,431 | 2,188 |
| Fraud1 | 17,884 | 21,426 | 19,480 | 21,708 | 21,960 | 21,336 | 18,661 | 17,124 | 15,078 | 14,620 |
| Arson | 144 | 159 | 188 | 191 | 191 | 165 | 198 | 313 | 209 | 171 |
| Wilful damage | 3,701 | 3,611 | 4,104 | 4,881 | 5,177 | 4,838 | 4,800 | 5,087 | 5,156 | 5,237 |
| Other2 | 4,038 | 3,831 | 4,075 | 4,016 | 4,224 | 4,368 | 4,211 | 4,692 | 5,646 | 5,072 |
| Total | 54,727 | 57,403 | 57,282 | 57,438 | 56,972 | 56,702 | 53,674 | 53,295 | 51,178 | 50,039 |
Motor vehicle conversion. The number of convictions for motor vehicle conversion averaged about 2,750 between 1992 and 1997, but dropped in the last three years of the decade, reaching its lowest level of 2,188 in 2000.
Drug offences. Eighty-nine percent of drug convictions in 2000 involved cannabis.
As table 10.6 shows, annual convictions for drug offences fluctuate between about 11,000 and 14,000. Eight percent of all convictions in 2000 were for drug offences.
Table 10.6. Convictions for drug offences
| Offence type | 1991 | 1992 | 1993 | 1994 | 1995 | 1996 | 1997 | 1998 | 1999 | 2000 |
|---|---|---|---|---|---|---|---|---|---|---|
1Mostly offences relating to the possession of pipes, needles, syringes or oilier drug-related utensils. The category also includes offences where the offender permitted his or her premises or motor vehicle to be used for a drug offence, or where the offender made a false statement in relation to the Misuse of Drugs Act. Source: Ministry of Justice | ||||||||||
| Use cannabis | 6,484 | 6,101 | 7,417 | 7,388 | 5,926 | 5,652 | 6,459 | 6,970 | 6,761 | 6,133 |
| Deal in cannabis | 3,074 | 3,303 | 3,489 | 4,219 | 3,437 | 3,459 | 3,708 | 3,977 | 3,916 | 3,886 |
| Other cannabis1 | 1,091 | 1,137 | 1,478 | 1,730 | 1,469 | 1,477 | 1,730 | 2,172 | 2,255 | 2,188 |
| Use other drug | 393 | 325 | 336 | 334 | 389 | 350 | 444 | 412 | 493 | 678 |
| Deal in other drug | 348 | 375 | 355 | 379 | 380 | 497 | 496 | 415 | 405 | 464 |
| Other drug1 | 165 | 193 | 164 | 147 | 191 | 159 | 160 | 222 | 191 | 314 |
| Total | 11,555 | 11,434 | 13,239 | 14,197 | 11,792 | 11,594 | 12,997 | 14,168 | 14,021 | 13,663 |
Offences against the administration of justice. As shown in table 10.7, the number of convictions for offences against the administration of justice increased considerably between 1991 and 1998, but levelled off in 1999 and 2000.
The 2000 figure, however, was 47 percent higher than the 1991 figure.
Offences against the administration of justice accounted for 9 percent of all convictions in 2000, compared with 6 percent in 1991.
Table 10.7. Convictions for offences against the administration of justice
| Offence type | 1991 | 1992 | 1993 | 1994 | 1995 | 1996 | 1997 | 1998 | 1999 | 2000 |
|---|---|---|---|---|---|---|---|---|---|---|
1Failure, without reasonable excuse, to comply with any condition of release from prison. 2Failure by a person on bail to appear in court at a specified time and place. 3Non-molestation orders were replaced by protection orders under the Domestic Violence Act 1995. 4Mostly escaping/nun custody in a penal institution, or escaping from police custody. Also includes a small number of charges of escaping from another type of institution such as a psychiatric hospital. Source: Ministry of Justice | ||||||||||
| Breach periodic detention | 5,711 | 6,005 | 6,643 | 7,101 | 7,302 | 7,552 | 7,318 | 7,532 | 7,011 | 6,628 |
| Breach supervision | 464 | 542 | 595 | 714 | 678 | 558 | 634 | 601 | 553 | 503 |
| Breach parole1 | 251 | 339 | 469 | 321 | 194 | 208 | 180 | 202 | 199 | 236 |
| Breach community service | 258 | 350 | 454 | 418 | 403 | 335 | 326 | 282 | 220 | 246 |
| Failure to answer bail2 | 2,411 | 2,405 | 2,668 | 2,898 | 3,380 | 3,622 | 3,959 | 4,013 | 4,124 | 4,293 |
| Breach non-molestation/protection order3 | 242 | 321 | 379 | 437 | 421 | 496 | 1,223 | 1,881 | 2,117 | 2,265 |
| Escape custody4 | 345 | 380 | 319 | 351 | 424 | 387 | 380 | 424 | 406 | 373 |
| Obstruct/pervert course of justice | 100 | 106 | 93 | 117 | 88 | 122 | 155 | 152 | 132 | 143 |
| Other | 779 | 627 | 643 | 665 | 631 | 622 | 644 | 598 | 544 | 804 |
| Total | 10,561 | 11,075 | 12,263 | 13,022 | 13,521 | 13,902 | 14,819 | 15,685 | 15,306 | 15,491 |
Protection orders. The number of breaches of protection orders increased dramatically between 1996 and 2000.
There were 2,265 convictions for breaches of protection orders in 2000, more than nine times the 242 breaches of non-molestation orders in 1991.
Offences against good order. Offences against good order have shown a strongly increasing trend since 1992 (see table 10.8).
The number of convictions for against good order offences in 2000 was the highest recorded in the decade.
Convictions for disorderly behaviour nearly tripled during the decade, from 2,193 in 1991 to 6,160 in 2000.
Convictions for trespassing offences also showed an increasing trend during the decade.
Police have indicated that increases in ‘drug and anti-social’ offences reflect an increase by police in enforcement and street policing.
Table 10.8. Convictions for offences against good order
| Offence type | 1991 | 1992 | 1993 | 1994 | 1995 | 1996 | 1997 | 1998 | 1999 | 2000 |
|---|---|---|---|---|---|---|---|---|---|---|
1Mostly behaving in a disorderly or offensive manner (s.4 Summary Offences Act), disorderly or threatening behaviour (s.3 Summary Offences Act), and lighting in a public place (s.7 Summary Offences Act). Source: Ministry of Justice | ||||||||||
| Riot | 6 | 3 | 3 | 0 | 7 | 8 | 7 | 2 | 5 | 23 |
| Unlawful assembly | 32 | 42 | 30 | 44 | 64 | 33 | 69 | 40 | 21 | 23 |
| Possess offensive weapon | 1,179 | 1,035 | 1,177 | 1,245 | 1,197 | 1,257 | 1,259 | 1,417 | 1,417 | 1,312 |
| Offensive language | 630 | 552 | 641 | 693 | 675 | 663 | 598 | 650 | 699 | 685 |
| Disorderly behaviour1 | 2,193 | 2,304 | 3,099 | 3,672 | 4,284 | 4,612 | 4,661 | 5,130 | 5,645 | 6,160 |
| Trespassing | 2,051 | 1,977 | 2,202 | 2,397 | 2,737 | 2,859 | 2,997 | 3,028 | 3,006 | 3,138 |
| Other | 415 | 342 | 291 | 307 | 320 | 300 | 336 | 285 | 269 | 267 |
| Total | 6,506 | 6,255 | 7,443 | 8,358 | 9,284 | 9,732 | 9,927 | 10,552 | 11,062 | 11,608 |
Traffic offences. As table 10.9 shows, convictions for traffic offences decreased considerably between 1991 and 1993, from nearly 80,000 to just more than 62,000.
From 1993 to 1998, convictions averaged about 62,000 a year, but dropped to just more than 57,000 in 2000, the lowest number of traffic convictions recorded in the decade. Traffic offences accounted for 33 percent of all convictions in 2000, compared with 43 percent in 1991. Despite the decrease in convictions, traffic offences still comprise the largest group of offences resulting in conviction.
Table 10.9. Convictions for traffic offences
| Offence type | 1991 | 1992 | 1993 | 1994 | 1995 | 1996 | 1997 | 1998 | 1999 | 2000 |
|---|---|---|---|---|---|---|---|---|---|---|
1Charges involving driving with excess alcohol, reckless/dangerous driving, or careless driving where death or injury occurred. It is no longer possible to distinguish in the data between charges resulting in injury and charges resulting in death. A small number of people who kill a person while driving a motor vehicle will be charged with manslaughter rather than driving causing death. 2Mostly charges where the person was driving with excess alcohol. but also includes charges where the offender refused to supply a blood specimen, or was convicted for driving under the influence of drink or drugs. Charges where a person was driving with excess alcohol and caused death or injury are included in the first category in this table. Source: Ministry of Justice | ||||||||||
| Driving causing death or injury1 | 1,677 | 1,582 | 1,561 | 1,620 | 1,739 | 1,654 | 1,556 | 1,679 | 1,575 | 1,446 |
| Driving with excess alcohol1 | 30,995 | 25,192 | 24,079 | 22,652 | 25,456 | 25,427 | 24,672 | 24,819 | 23,101 | 21,615 |
| Driving while disqualified | 13,290 | 12,220 | 11,056 | 10,695 | 10,451 | 10,948 | 10,746 | 11,605 | 10,451 | 7,879 |
| Reckless/dangerous driving | 2,680 | 2,230 | 2,109 | 2,136 | 2,443 | 2,521 | 2,611 | 2,881 | 2,939 | 2,697 |
| Careless driving | 13,698 | 12,911 | 11,324 | 11,319 | 12,345 | 11,139 | 9,639 | 10,248 | 9,177 | 8,437 |
| Other traffic | 17,223 | 14,693 | 12,049 | 11,086 | 11,590 | 11,494 | 11,278 | 10,969 | 11,542 | 15,038 |
| Total | 79,563 | 68,828 | 62,178 | 59,508 | 64,024 | 63,183 | 60,502 | 62,201 | 58,785 | 57,112 |
Driving convictions. Convictions for driving offences resulting in the death or injury of another person were lower in 2000 than for any other year in the decade. Convictions for driving with excess alcohol decreased by 30 percent during the decade, to the low of 21,615 in 2000. Convictions for driving while disqualified dropped considerably in 2000 to 7,879, after averaging nearly 11,000 in the previous seven years. It is likely the roadside impoundment of large numbers of vehicles driven by disqualified drivers from May 1999 had an impact on the number of convictions for driving while disqualified. Convictions for reckless or dangerous driving increased between 1993 and 1999, from 2,109 to 2,939, but dropped to 2,697 in 2000. There was a general downward trend during the decade in the number of careless driving convictions, with the 2000 figure 38 percent lower than the 1991 figure.
Miscellaneous convictions. The wide variety of offences included in this category (see table 10.10) makes it difficult to explain annual fluctuations in the number of convictions for these offences.
Table 10.1. Convictions for miscellaneous offences
| Offence type | 1991 | 1992 | 1993 | 1994 | 1995 | 1996 | 1997 | 1998 | 1999 | 2000 |
|---|---|---|---|---|---|---|---|---|---|---|
1Excludes a small number of offences prosecuted under this act which were categorised as violent offences against the person. 2The Dog Control Act 1996, which came into force on 1 July 1996, replaced the Dog Control and Hydatids Act 1982. 3Offences under the Income Tax Act 1976, the Income Tax Act 1994, the Goods and Services Tax Act 1985, or the Tax Administration Act 1994. 4Includes convictions under the Sales of Liquor Act 1962 and the Sale of Liquor Act 1989 (from 1 April 1990). 5This category comprises convictions under the Fisheries Act 1983 and related regulations, eg commercial fishing regulations and freshwater fisheries regulations. 6Includes a wide variety of offences such as breaches under: the Health and Safety in Employment Act 1992; the Insolvency Act 1967; the Resource Management Act 1991; the Films, Videos, and Publications Classification Act 1993; the Building Act 1991, the Telecommunications Act 1987; the Medicines Act 1981; and the Conservation Act 1987. Source: Ministry of Justice | ||||||||||
| Arms Act1 | 981 | 991 | 1,029 | 934 | 826 | 866 | 880 | 952 | 921 | 858 |
| Dog Control Act2 | 4,559 | 5,366 | 6,714 | 7,723 | 6,828 | 7,440 | 1,641 | 885 | 592 | 442 |
| Tax acts3 | 1,344 | 2,850 | 6,814 | 5,096 | 4,389 | 3,710 | 2,471 | 2,464 | 2,105 | 2,282 |
| Liquor-related5 | 759 | 644 | 975 | 1,163 | 940 | 928 | 957 | 1,200 | 1,181 | 223 |
| Fisheries Act5 | 861 | 758 | 983 | 1,247 | 453 | 310 | 319 | 714 | 455 | 751 |
| Other6 | 2,890 | 3,260 | 3,163 | 2,802 | 3,162 | 3,955 | 3,673 | 4,074 | 4,410 | 3,344 |
| Total | 11,394 | 13,869 | 19,678 | 18,965 | 16,598 | 17,209 | 9,941 | 10,289 | 9,664 | 7,900 |
Characteristics of convicted offenders. Male offenders accounted for 83 percent of all cases that resulted in conviction in 2000 for which the gender of the offender was known. Forty-seven percent of all convicted cases in 2000 for which the ethnicity of the offender was known involved Europeans, 42 percent involved Māori, 9 percent involved Pacific peoples and 2 percent involved offenders of some other ethnicity. Nineteen percent of all cases that resulted in conviction in 2000 and for which the age of the offender was known, involved teenage offenders, 40 percent involved offenders in their 20s, 24 percent involved offenders in their 30s and 17 percent involved offenders aged 40 and over.
Throughout the decade ending 2000, 7 to 8 percent of people convicted each year received a custodial sentence, with the proportion being marginally higher in the last four years than in the earlier years of the decade. In 2000, 7,931 cases resulted in a custodial sentence, fewer than the number imposed in the three previous years. The average custodial sentence length (including preventive detention) increased during the decade from 10.2 months in 1991 to 14.2 months in 2000.
Only 8 percent of cases resulting in custodial sentences in 2000 involved female offenders.
In cases where the ethnicity of offenders was available, Māori offenders accounted for more than half (53 percent) of the cases resulting in imprisonment in 2000, while 39 percent involved Europeans and 8 percent involved Pacific peoples.
Cases involving offenders in their 20s accounted for 42 percent of custodial sentences in 2000, with 15 percent of cases involving teenagers. Only 62 of the 1,192 cases identified as involving a teenager, and which resulted in a custodial sentence, involved 14 to 16-year-olds. The rest of these cases involved 17 to 19-year-olds. Only 15 percent of offenders given a custodial sentence in 2000 were aged 40 or more.
Between 31 percent and 36 percent of all convictions in each year of the decade resulted in imposition of community-based sentences, with the 2000 figure (31 percent) being the lowest of the decade.
Periodic detention was the most commonly imposed community-based sentence, and in terms of principal sentences imposed, it was the second most commonly imposed behind fines. Nineteen percent of convicted cases in 2000 resulted in periodic detention. There were 18,436 periodic detention sentences imposed in 2000, the lowest of the decade.
The community programme sentence continues to be used less and less by the courts. In 2000, only 204 such sentences were imposed, which was 0.2 percent of all sentences imposed.
The use of monetary penalties (in particular, fines) as the most serious sentence fluctuated between 48 percent and 53 percent of all cases during the decade. Part of the fluctuation was due to legislative changes affecting the number of non-imprisonable offences resulting in conviction and a fine.
Figure 10.2 shows the number of various sentence types imposed for all offences.
Table 10.11 lists the number of sentences imposed for each sentence type from 1991 to 2000.
Table 10.11. Sentencing for all offences1
| Sentence type | 1991 | 1992 | 1993 | 1994 | 1995 | 1996 | 1997 | 1998 | 1999 | 2000 |
|---|---|---|---|---|---|---|---|---|---|---|
1Only the most serious sentence imposed is shown for cases where more than one sentence was imposed. 2Community care was renamed ‘community programme by the Criminal Justice Amendment Act 1993. 3Monetary penalties are fines and reparation. 4To came up for sentence if called upon or a suspended prison sentence. 5Mainly cases that resulted in disqualification from driving, or an order under s.118 of the Criminal Justice Act 1985 for treatment of the offender in a psychiatric hospital. Deportation orders are also included in this category. 6Conviction and discharge under section 20 of the Criminal Justice Act 1985. Source: Ministry of Justice | ||||||||||
| Custodial | 7,739 | 7,805 | 7,989 | 7,361 | 7,246 | 7,787 | 8,102 | 8,255 | 8,177 | 7,931 |
| Periodic detention | 22,548 | 21,702 | 22,065 | 20,777 | 19,437 | 19,116 | 19,510 | 21,340 | 20,481 | 18,436 |
| Community programme2 | 1,123 | 1,164 | 1,058 | 899 | 880 | 703 | 430 | 379 | 287 | 204 |
| Community service | 9,196 | 9,765 | 9,731 | 9,406 | 8,625 | 8,030 | 7,812 | 8,525 | 8,226 | 7,135 |
| Supervision | 3,010 | 3,103 | 3,939 | 4,977 | 5,166 | 5,166 | 5,037 | 5,004 | 4,550 | 4,032 |
| Monetary3 | 55,121 | 48,444 | 49,738 | 52,176 | 54,715 | 54,931 | 47,515 | 47,165 | 47,326 | 47,346 |
| Deferment4 | 3,141 | 3,710 | 3,779 | 3,530 | 3,146 | 3,499 | 3,233 | 3,560 | 3,502 | 3,598 |
| Other5 | 887 | 891 | 869 | 785 | 805 | 789 | 808 | 983 | 1,116 | 1,127 |
| Conviction & discharge6 | 3,377 | 4,000 | 4,195 | 4,784 | 4,902 | 4,656 | 4,068 | 4,994 | 4,982 | 5,925 |
| Total | 106,442 | 100,584 | 103,363 | 104,695 | 104,922 | 104,677 | 96,515 | 100,205 | 98,647 | 95,734 |
Victim Support is a community, not-for-profit organisation providing a 24-hour, seven-day-a-week support service for victims of crime, accident and emergency. Of those receiving support, 90 percent are victims of crime. Other victims include families and survivors where there has been a serious transport accident, sudden death, a suicide attempt or completion, or a natural disaster.
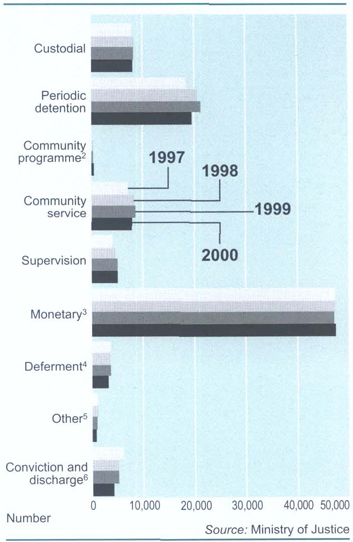
A range of support services based on the victim's needs are provided by trained volunteer workers. These include crisis intervention at the time of an incident, where practical and emotional support is offered; advice on other services and agencies available to the victim; provision of information about police investigations and judicial processes; and ongoing support as needed, particularly throughout the criminal justice process. This latter support includes assisting the victim to prepare a victim impact statement, attending court with the victim, and supporting victims who have agreed to participate in a restorative justice conference.
Further services available to victims and managed by Victim Support include free counselling for families and close friends of victims of a homicide; financial assistance for victims who wish to travel to a high court trial or to present a submission to a parole hearing; and advice on and assistance with improving home security for low-income people who have been victims of repeat burglaries.
Funding for Victim Support services comes from four main sources: Government contracts for services; grants from the Community Organisation Grants Scheme, the lottery board and philanthropic trusts; local fund raising; and donations. A significant recent change for Victim Support has been the transfer of contract for services from the Community Funding Agency to the Ministry of Justice.
Victim Support works closely with the police, who provide office accommodation and facilities. A memorandum of understanding formalises the relationship between the two organisations.
Victim Support groups are affiliated to the New Zealand Council of Victim Support Groups Incorporated. A key role of the council is to advocate for victims’ rights. Recent government initiatives have resulted in Victim Support providing comment on the Victims’ Rights Bill, the Injury Prevention and Rehabilitation Bill, court-ordered restorative justice conference pilots and a review of youth justice. Table 10.12 provides some details of Victim Support activities for the year ending June 2001.
Table 10.12. Victim Support operations and funding
| Year ending 30 June 2001 | |
|---|---|
| Source: New Zealand Council of Victim Support Groups | |
| Number of contacts made with victims | 212,443 |
| Number of Victim Support volunteer workers | 1,326 |
| Hours of service given by volunteer workers | 134,700 |
| Kilometres travelled in providing service | 363,136 |
| Number of Victim Support groups | 66 |
| Number of staff employed by Victim Support groups | 53 (full-time equivalent) |
| Ministry of Justice funding for provision of services | $1.2 million (incl GST) |
| Funding for victim assistance schemes | $583,000 (incl GST) |
New Zealand's corrections system is responsible for protecting the community from offenders through both deterrence and rehabilitation. The Department of Corrections manages all custodial and non-custodial sentences and orders imposed by the courts on offenders, including prison and community-based corrections.
Eight services and groups in the department work to reduce re-offending: The Public Prisons Service, the Community Probation Service, the Psychological Service, the Service Purchase and Monitoring Group, the Policy Development Group, the Strategic Development Group, the Finance Group (including Corrland Inmate Employment, which manages farms and forests owned by the department) and the Internal Audit Group.
Auckland Central Remand Prison. The Department of Corrections signed a $102 million, five-year contract with Australasian Correctional Management Pty Ltd (ACM) in July 1999 to run New Zealand's first contract-managed prison. The Auckland Central Remand Prison began operating on 13 July 2000 and received its first inmates on 20 July 2000. The agreed operating capacity for the prison is 272, which includes up to 22 special needs inmates (inmates who have been identified as at risk of self-harm). Included in the 272 are 32 sentenced inmates who work in internal services such as the kitchen and laundry. Although the prison's capacity is 360, it cannot exceed 299 without departmental approval. The department monitors performance of prison management through a monitor with statutory powers.
Prisoner escort and courtroom custodial services. The Department of Corrections signed a five-year contract with Chubb New Zealand Ltd in October 1998 to supply prisoner escort and courtroom custodial services in the Northland and Auckland regions. This includes escorting prisoners between penal institutions, courts and forensic psychiatric units, and court custody of prisoners appearing for judicial purposes, work previously undertaken by police and Public Prisons Service officers.
The Psychological Service is regionally based with offices in eight centres. The service runs two special units for the treatment of child sex offenders and one unit for the treatment of violent offenders. It has a staff of 60 psychologists and also employs on a fee-for-service basis psychologists in private practice, with about 30 being employed at any one time. Psychological services are provided to both the Public Prisons Service and the Community Probation Service, to community agencies dealing with offenders, and to courts, the district prisons boards and the New Zealand Parole Board.
The main work of the service is the psychological assessment and treatment of convicted offenders who are either serving a prison sentence or a community-based sentence administered by the Community Probation Service. It also provides psychological assessments for courts at the pre-sentence stage, and for the district prisons boards and the parole board to assist in parole decisions.
It also provides advice to the Department of Corrections and the Minister of Corrections on policy, practices and procedures, and to staff of the Public Prisons Service, Community Probation Service and community agencies on ways to assist offenders. For example, one programme that has been developed is the Psychological Service Bicultural Therapy Model (BTM), designed to reduce re-offending by Māori by increasing the number of Māori clients that receive treatment for their offending-related behaviour.
A Crime Prevention Unit (CPU) was established within the Department of the Prime Minister and Cabinet in July 1993 and on 1 November 2000 the unit was transferred to the Ministry of Justice.
The CPU coordinates government agencies’ crime prevention policies and programmes and partners communities in local crime prevention initiatives.
The core of the community crime prevention initiative is a network of Safer Community Councils (SCCs), which coordinates community crime prevention programmes and activities and encourages the development of new programmes. They are established and funded by the CPU under an agreement between the government (represented by the CPU) and a sponsoring body (such as a local authority or iwi).
An SCC usually consists of a committee, with members representing the community, local and central government agencies and other key individuals. Each committee generally oversees the work programme of a paid coordinator.
SCCs also promote, support and, in some cases, deliver crime prevention services. Examples of such services include mentoring projects; neighbourhood-based safety projects; early intervention with at-risk children; family skills development; and community-managed diversion projects aimed at dealing effectively with offenders outside the formal court system.
The CPU evaluates the projects and services it supports in order to build up knowledge of what interventions work effectively in preventing crime, including for whom and in what circumstances.
At 30 June 2001, there were 67 SCCs, 48 in the North Island and 19 in the South Island. Of these, eight were iwi sponsored (including two co-sponsored with the local authority) and three Pacific peoples community sponsored.
The appropriation for community crime prevention initiatives in the 2001/02 financial year was $5,087 million, compared with $5,425 million in the previous financial year. The appropriation for 1999/2000 was $4,660 million and for 1998/99 $4.317 million.
The Community Probation Service provides courts with information to assist judges with their sentencing decisions and manages people who are on community-based sentences and orders. Community-based sentences and orders include: supervision, community work, home detention and release on conditions, including parole. Offenders on community-based sentences have to meet the requirements of their sentences and may (in the case of supervision) have to attend rehabilitative programmes which address their offending.
The Community Probation Service is a service of the Department of Corrections and works under provisions of the Sentencing Act 2002 and the Parole Act 2002.
The Community Probation Service and the community have a common goal – safer communities achieved through working together, sharing knowledge, expertise and resources.
Table 10.13 shows the number and type of community-based sentences commenced from 1995 to 2001.
Table 10.13. Community-based sentences1
| Sentence | As at 30 June | ||||||
|---|---|---|---|---|---|---|---|
| 1995 | 19962 | 1997 | 1998 | 1999 | 2000 | 2001 | |
1Figures represent the numbers commencing a sentence in the 12 months ended 30 June. 2Due to departmental restructuring, 1995 figures cover from 1 October 1995 to 30 June 1996 only. Source: Department of Corrections | |||||||
| Periodic detention | 23,381 | 22,665 | 22,609 | 23,934 | 24,861 | 20,012 | 20,433 |
| Community service | 13,423 | 12,262 | 11,613 | 10,670 | 10,934 | 8,750 | 8,387 |
| Community programme | 1,022 | 836 | 584 | 418 | 365 | 240 | 230 |
| Supervision | 9,875 | 9,791 | 10,078 | 9,924 | 9,945 | 8,903 | 8,318 |
| Parole | 1,859 | 2,019 | 2,092 | 2,245 | 2,368 | 2,311 | 2,438 |
Sentences administered by the Community Probation Service are detailed below.
Community work. With the introduction of the Sentencing Act 2002, community work replaced the sentence of community service. Community work is a community-based sentence which requires offenders to do unpaid work in the community. The aim of community work is for offenders to pay something back to the community for the offence they have committed. It also gives offenders an opportunity to take responsibility for their offending and learn new skills and work habits.
People sentenced to community work report to a probation officer at a Community Probation Service centre. In order to establish how the offender will complete a sentence, the probation officer takes into account the offence the person has committed, personal circumstances and needs and skills.
Community work can be either in a group supervised by the Community Probation Service or on an individual basis with an agency. The act specifies who can be an agency for community work.
Community work projects include those sponsored by local councils, government agencies, voluntary organisations, marae organisations, sports groups and other community groups. If the work is supervised by an agency, probation officers check that the offender has completed the right number of hours and completed the work to the required standard.
Offenders can be required to do between 40 and 400 hours of community work. If offenders are sentenced to more than 200 hours of work, the hours need be completed within two years. Sentences of 200 hours or less need to be completed within one year. Offenders are encouraged to complete their hours as quickly as possible. Offenders can work up to 10 hours a day, or 40 hours in any week. Offenders can, in most cases, continue with their regular jobs while serving community work sentences.
Some offenders may be given a sentence of supervision as well as community work. In these cases, as well as doing work in the community, offenders may also have to report regularly to a probation officer and attend programmes which aim to address their offending.
Community work can be carried out on a marae, both as individual placements and in supervised groups. Community work on a marae presents an opportunity for Māori offenders to increase their cultural knowledge and, in some cases, re-establish contact with their iwi. Before the work can be approved, there is a requirement that it is not work that an offender would normally carry out as a member of the marae.
If offenders on community work do not meet the conditions of their sentence, they are returned to court. If an offender is convicted of breaching or not meeting requirements, the court may impose up to three months’ imprisonment or a $1,000 fine.
Supervision. With introduction of the Sentencing Act 2002, supervision replaced the sentences of community programme and periodic detention. Supervision is a rehabilitative community-based sentence which requires offenders to address the causes of their offending. Offenders can be sentenced to supervision for at least six months and for a maximum of two years.
When an offender has been convicted of an offence and is waiting to be sentenced, probation officers assess the person's offending and the most suitable form of sentence and programme. If the offender is sentenced to supervision, the information gained from the assessment may be included in the conditions of the supervision sentence. An offender will have standard conditions as part of the sentence and the judge may also impose special conditions to address the offender's needs.
Standard conditions include reporting to the Community Probation Service and restrictions on living and working arrangements and associating with people. Special conditions include participation in treatment, personal development or rehabilitative programmes and addressing any other issues which reduce the person's risk of re-offending.
Probation officers work with offenders to address the causes of their offending. As part of rehabilitation, offenders may have to attend rehabilitative programmes. Probation officers may also work with family, friends and colleagues of the offender.
In addition to a sentence of supervision, the court may also order the offender to pay a fine, pay reparation to victims, or do unpaid work in the form of community work.
Probation officers ensure that offenders on supervision complete all the conditions of their sentence. If offenders do not meet the requirements of their sentences, they are returned to court. If an offender is convicted of breaching or not meeting the requirements of the sentence, the court may impose up to three months’ imprisonment or a $1,000 fine.
Parole. People on parole have been released from prison under strict conditions laid down by law. Often they will move on to a community-based programme designed to deal with their offending-related problems. They must report regularly to a probation officer, who monitors their progress and adherence to conditions imposed as part of parole. In the year to 30 June 2001, the Community Probation Service supervised 2,438 offenders on parole.
Home detention. Home detention is a community-based order that allows offenders to serve part of their prison sentences at home or at an approved place of residence. Offenders live at home under electronic surveillance and receive intensive supervision by a probation officer. Home detention allows offenders to maintain family relationships, keep working or actively look for work, and attend rehabilitative programmes designed to address causes of their offending.
Offenders on home detention are subject to electronic monitoring.
Offenders who are subject to short-term prison sentences of two years or less can, if the sentencing judge allows, apply to the New Zealand Parole Board to serve their sentences on home detention. Offenders sentenced to long-term prison sentences can also apply to be released on home detention three months prior to their parole eligibility date. Home detention is available in most parts of New Zealand.
Once an application for home detention is made, the Community Probation Service prepares a report for the parole board on the offender's suitability and how he or she will be managed while on home detention. This report examines the offender's risk to the public, motivation to change behaviour, risk of re-offending, suitability of the proposed residence and any comments from victims. The probation officer discusses home detention with the family or other residents who live at the address. The probation officer will inform the residents of the offender's past and present convictions and seek their consent before an offender is released to home detention. The probation officer will also investigate what employment and rehabilitative programmes are available for the offender.
The parole board considers the report and makes the final decision on the offender's application. In the case of offenders sentenced to more than two years, the board will also decide the period of home detention (provided it is no longer than 12 months or, with the offender's consent, for a further period of up to 12 months). Approved offenders sentenced to less than two years are released from home detention automatically after half of their sentence.
If the offender fails to meet the conditions of home detention, the probation officer may make a recall application to the parole board to have the offender sent to prison.
Offenders on home detention are subject to electronic monitoring. Each offender wears an anklet that continuously emits a signal to a monitor while they are at home. If the offender tries to remove the anklet or leaves the property without permission, an alarm is triggered and a security guard is dispatched to the house. The offender receives security checks from the security guards responsible for electronic monitoring and is also subject to security checks when they are on approved absences from the home.
While on home detention, offenders are subject to intensive supervision by a probation officer, which includes a minimum of three visits a week for the first half of the home detention order.
Offenders may have set conditions as part of their release on home detention. These may cover where the offenders can work, with whom they can associate and may also cover the rehabilitative activities or programmes offenders have to attend. Probation officers work with offenders to address the causes of their offending behaviour. If offenders are not motivated to address these issues, probation officers will work with offenders to increase their level of motivation.
Offenders can work while on home detention, but only as authorised by the probation officer. Offenders who are not working can apply for the appropriate benefit and may be expected to actively seek employment.
The Public Prisons Service aims to provide world standard prison services that are safe, secure and humane, and contribute to a reduction in re-offending.
There are 17 prisons capable of housing about 6,090 sentenced inmates and inmates on remand – either those who are charged with offences but awaiting a court hearing, or those who have been convicted and are awaiting sentencing. There are four maximum security units (all located within Auckland Prison), 78 high-medium security units, 65 minimum security units and one corrective training unit. There are two separate women's prisons, and a women's division at Mt Eden Prison.
About 2,800 people work full time for the Public Prisons Service.
Figure 10.3 shows the number of inmates in prison in New Zealand per 10,000 population.
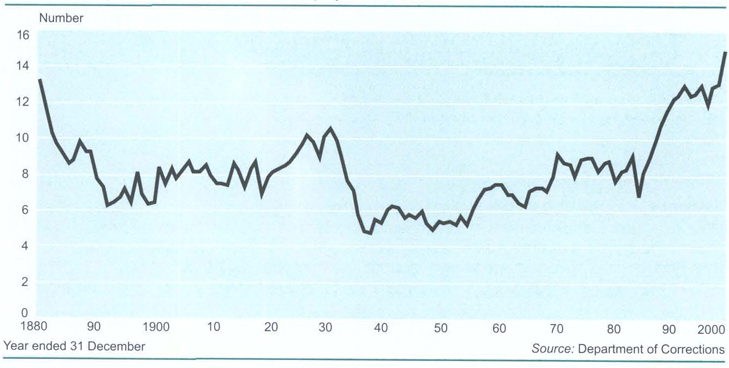
The service manages inmates’ sentences, with two key priorities – community safety, ensuring inmates are securely contained in prison for the duration of their sentence, and encouraging inmates to address factors that drive their criminal lifestyles and take steps to change their offending behaviour.
The priorities take into account:
Factors which drive offending behaviour (eg substance abuse, violence propensity, anti-social attitudes, criminal companions).
‘Readiness to change’ – the inmate's motivation to participate in rehabilitative programmes.
Factors relating to disconnection from Māori culture, if the offender identifies as Māori.
Educational deficits (including literacy).
Employment-related concerns – the presence or absence of marketable skills, and the development of adequate work habits.
Special needs (health, disability, emotional stability) which require attention during the course of the sentence.
Risks posed by the individual – the risk of re-offending, the risk of the person committing self-harm or harm to others and the risk of escape.
Significant problems the person is likely to face when they return to the community.
Individual sentence plans are drawn up for each inmate which set out objectives to be achieved during their time in prison, according to their assessed risk of re-offending and the needs each inmate might have that are assessed as contributing to that risk. In some cases, objectives might include the inmate spending time in one of the specialist treatment units located in various prisons around the country. These comprise four Māori focus units, three alcohol and drug units, two sex offender units and one violence prevention unit.
The Public Prisons Service introduced a drug reduction strategy in 1997 which incorporates the introduction of drug detector dogs to search for drugs inside prisons and at random visitor vehicle checkpoints. The service also collects about 9,100 urine samples a year from inmates for drug testing. The aim of the strategy is to help inmates overcome drug and alcohol abuse problems. many of which have led them to crime, to take full advantage of programmes and work offered in prisons, and to help reduce their chances of re-offending once they are released.
The service provides some escort and custodial supervision services, such as transporting inmates to and from court appearances.
The service's prisons are listed in table 10.14, as well as the Department of Corrections’ newest prison, Auckland Central Remand Prison, privately operated by Australasian Correctional Management Pty Ltd. Inmates with different security classifications are held at each institution. Fourteen prisons receive remand inmates as well as sentenced inmates.
The average cost of keeping a person in prison was $52,525 a year in the year to 30 June 2000, compared with $51,036 for the 1998 year.
Table 10.14. Penal institutions1
| Institution | Capacity |
|---|---|
| Male prisons | |
1As at 7 September 2001. Source: Department of Corrections | |
| Auckland Central Remand Prison (privately operated) | 272 |
| Auckland | 645 |
| Christchurch | 778 |
| Dunedin | 59 |
| Hawke's Bay Regional | 568 |
| Invercargill | 172 |
| Manawatu | 278 |
| Mt Eden | 381 |
| New Plymouth | 108 |
| Ohura | 100 |
| Rimutaka | 491 |
| Rolleston | 320 |
| Tongariro/Rangipo | 442 |
| Waikeria | 905 |
| Wanganui | 382 |
| Wellington | 120 |
| Female prisons | |
| Arohata | 152 |
| Christchurch Women's | 98 |
| Mt Eden (women's division) | 94 |
Apart from his role in company liquidations and bankruptcies, the Official Assignee has certain statutory responsibilities under the Proceeds of Crime Act 1991.
The high court may order that assets be placed in the custody and control of the Official Assignee. This is to ensure that the assets are not depleted or destroyed while a criminal trial is pending, or a further application under the act is to be heard. When the court orders forfeiture of a criminal's property, or that the restrained property be sold to satisfy a pecuniary penalty, the Official Assignee takes the necessary steps to realise those assets and transfer proceeds to the Crown.
In the year to 30 June 2001, the Official Assignee, in relation to proceeds of crime matters, returned $325,000 to the Crown, compared with $949,687 in the 1999 year.
Two new pieces of legislation, the Sentencing Act 2002 and the Parole Act 2002, came into effect on 30 June 2002 and largely replaced the Criminal Justice Act 1985. The result of a government commitment to review sentencing and parole regimes, the new acts seek to provide greater clarity, consistency and transparency in sentencing and improve the parole decision making structure.
The Public Prisons Service and Australasian Correctional Management Pty Ltd (ACM) administer and manage custodial sentences imposed on offenders sentenced to penal institutions. The service and ACM also manage remand offenders pending court appearances or sentencing.
At the time of sentencing, a judge may impose release conditions (both standard and special) on offenders sentenced to terms of imprisonment of 12 months or less, and must impose standard conditions on those sentenced to more than 12 months, but not more than 24 months. The courts may also impose special conditions on these offenders.
Under the new legislation, courts may defer the start date of a person's prison sentence for up to two months, instead of one month as had previously been the case. Courts can also impose a minimum non-parole period of imprisonment on any offender sentenced to more than 24 months, if they are satisfied that the circumstances of the offence are sufficiently serious. This period can be up to two-thirds of the sentence or 10 years, whichever is the lesser period. If sentenced to 24 months or less, offenders are released after serving half their sentence.
Offenders sentenced to more than 24 months imprisonment can be released before their sentence end date only by the parole board. Offenders are eligible to be seen by the parole board after serving one-third of their sentence, unless the judge imposes a minimum non-parole period greater than one-third. Offenders not released by the parole board on parole are released on their statutory release date, which is the last possible date they can be held. The board must impose standard conditions on an offender at their statutory release date to take effect for six months beyond that date. The board may also impose special conditions to apply for the same length of time.
Murder. A sentence of life imprisonment is no longer automatically imposed for murder. The law now states that the court must impose life imprisonment unless it is satisfied that this would be ‘manifestly unjust'. If the court chooses not to impose life imprisonment, it must give written reasons as to why not. Ten years is the minimum non-parole period for anyone sentenced to life imprisonment for murder. The court must impose a minimum non-parole period of at least 17 years (unless it would be ‘manifestly unjust') when the murder involves certain circumstances, including ‘if the deceased was a member of the police or a prison officer acting in the course of his or her duty'.
Preventive detention. Under the new legislation, the age limit for eligibility for preventive detention was lowered to 18. The range of offences to which preventive detention applies was also increased. A minimum non-parole period must be ordered by the court in each instance, but cannot be less than five years.
Victims. Victims are entitled to information about an inmate's sentence (including what programmes they have done and their security classification) to help them prepare a submission to a parole board hearing.
Determinate sentences. An inmate serving a finite term of imprisonment of 24 months or less is not eligible for parole, but is automatically released after serving one-half of his or her sentence. An inmate serving a finite term of imprisonment of more than 24 months is eligible for parole after serving one-third of his or her sentence, unless the court has imposed a minimum non-parole period of longer than this. A non-parole period can be for 10 years or two-thirds of the total sentence, whichever is the lesser. When the offender is eligible for parole, his or her suitability for parole will be considered once a year, although further hearings can be postponed for up to two years. The inmate must be released on his or her statutory release date, if not granted parole before then.
Indeterminate sentences. An inmate sentenced to preventive detention is subject to a minimum period of imprisonment specified by the court, which must be for a term of at least five years. When the offender is eligible for parole, his or her suitability for parole will be considered once a year, although further parole hearings can be postponed for up to three years. An inmate serving a life sentence for murder is normally eligible for parole after serving 10 years of his or her sentence, unless the court has imposed a minimum period of imprisonment of longer than this. However, where there are unusual mitigating factors, the court may decide to impose a determinate sentence. Where there are one or more specified aggravating factors, the court must, unless it would be ‘manifestly unjust', impose a minimum period of imprisonment of at least 17 years. When the offender is eligible for parole, his or her suitability for parole will be considered once a year, although further parole hearings can be postponed for up to three years.
New Zealand Parole Board. The New Zealand Parole Board, an independent statutory authority, hears all applications for parole. The board is made up of full-time and part-time members appointed from the community and the judiciary. The board operates in panels of three, with a district court judge convening each panel. The board's chairperson, who has oversight of all decisions, is a high court or former high court judge. When making decisions relating to the release of an offender, the paramount consideration for the board is the safety of the community. Part of the focus of the new legislation is to give full consideration to the rights of victims, particularly their rights to provide input into parole hearings and home detention hearings. Victims on the Victim Notification Register have the right to provide submissions in writing to the parole board and, in most cases, to present submissions in person to the board.
Inmate numbers. The increase in the number of offenders given custodial sentences, together with the increase in the length of sentences, has resulted in an increase in the number of inmates in New Zealand prisons. For the year to 30 June 2001, there was an average daily muster of 5,985 inmates (5,707 males and 278 females) in Public Prisons Service and ACM-administered prisons. This was made up of a daily average of 5,087 sentenced inmates and a daily average of 898 inmates remanded in custody. For the year ended 30 June 2000, there was a daily average of 5,661 inmates (4,956 sentenced and 705 on remand).
Census of prison inmates. There were 4,965 sentenced inmates in New Zealand when a census of inmates was carried out on 18 November 1999. This was an increase of 30 on the 20 November 1997 census figure. In 1999, 4,759 of the sentenced inmates were males (4,728 in 1997), while 206 (207 in 1997) were females.
In addition, there were 657 remand inmates within prisons in 1999 (529 in 1997), of whom 633 were males (516) and 24 females (13). In 1999, 25 offenders (22 males and three women) were held in home detention, making a grand total of 5,647 sentenced inmates (5,464).
Unless specified, the following figures refer to sentenced inmates on the day of the census:
Age and ethnicity – More than half of sentenced inmates were under 30 years of age (see table 10.15). The highest percentage of male inmates (22.4 percent) was in the 20–24 years bracket, while the highest percentages of female inmates (18.1 percent) were in the 20–24 and 35–39 years brackets. Twenty-one percent of males and 15 percent of females were at least 40 years old. For male sentenced inmates using a single ethnicity grouping, 51 percent identified themselves as Māori, 36 percent identified themselves as European and 10 percent identified as Pacific peoples. Corresponding figures for females were 59 percent Māori, 31 percent European and 10 percent Pacific peoples.
Table 10.15. Age distribution of inmates1
| Age | Female | Male | Total2 | |||
|---|---|---|---|---|---|---|
| Number | Percent | Number | Percent | Number | Percent | |
1As at 18 November 1999 census. 2Excludes 2 female and 73 male inmates where age was not available. Source Department of Corrections | ||||||
| 15–16 | 1 | 0.5 | 12 | 0.2 | 13 | 0.3 |
| 17–19 | 29 | 14.2 | 393 | 8.4 | 422 | 8.6 |
| 20–24 | 37 | 18.1 | 1,051 | 22.4 | 1,088 | 22.2 |
| 25–29 | 35 | 17.2 | 940 | 20.1 | 975 | 19.9 |
| 30–34 | 34 | 16.7 | 758 | 16.2 | 792 | 16.2 |
| 35–39 | 37 | 18.1 | 545 | 11.6 | 582 | 11.9 |
| 40–49 | 26 | 12.7 | 627 | 13.4 | 653 | 13.4 |
| 50–59 | 4 | 2.0 | 237 | 5.1 | 241 | 4.9 |
| 60+ | 1 | 0.5 | 123 | 2.6 | 124 | 2.5 |
| Total | 204 | 100.0 | 4,686 | 100.0 | 4,890 | 100.0 |
Major offence – The census showed that 62 percent of male inmates were imprisoned for violence offences (including sexual violence), as shown in table 10.16. The next largest group of male inmates was those imprisoned for property offences (21 percent), followed by drug offenders (7.5 percent) and traffic offenders (7 percent). Female inmates were most likely to be imprisoned for violent offences (40 percent) or property offences (30 percent). Fifteen percent of female inmates were drug offenders and 11 percent were traffic offenders. Nearly 40 percent of offenders, irrespective of gender, were in prison for robbery. The percentage of females in prison for homicide (31 percent) was higher than for males (22 percent).
Table 10.16. Major offence of sentenced inmates12
| Major offence | Female | Male | Total2 | |||
|---|---|---|---|---|---|---|
| Number | Percent | Number | Percent | Number | Percent | |
1As at 18 November 1999 census. 2Excludes 2 female and 46 male inmates where ‘major offence’ was not available. Source: Department of Corrections | ||||||
| Violence | 79 | 38.7 | 1,817 | 38.6 | 1,896 | 38.6 |
| Sexual violence | 3 | 1.5 | 1,096 | 23.3 | 1,099 | 22.3 |
| Against property | 61 | 29.9 | 1,001 | 21.2 | 1,062 | 21.6 |
| Involving drugs | 31 | 15.2 | 355 | 7.5 | 386 | 7.8 |
| Traffic | 22 | 10.8 | 341 | 7.2 | 363 | 7.4 |
| Miscellaneous | 8 | 3.9 | 103 | 2.2 | 111 | 2.3 |
| Total | 204 | 100.0 | 4,713 | 100.0 | 4,917 | 100.0 |
Sentence length – Males tended to have longer sentence lengths than females (see table 10.17). For male sentenced inmates, 28 percent were serving determinate sentences of more than five years, compared with 11 percent of females. Six percent of male inmates and five percent of female inmates were serving life imprisonment.
Table 10.17. Total sentence length imposed for sentenced inmates12
| Sentence length | Female | Male | Total2 | |||
|---|---|---|---|---|---|---|
| Number | Percent | Number | Percent | Number | Percent | |
1As at 18 November 1999 census. 2Excludes 12 female and 291 male inmates where ‘sentence length’ was not available. Source: Department of Corrections | ||||||
| Under 3 months | 9 | 4.6 | 130 | 2.9 | 139 | 3 |
| 3 months and under 6 months | 21 | 10.8 | 250 | 5.6 | 271 | 5.8 |
| 6 months and under 1 year | 40 | 20.6 | 560 | 12.5 | 600 | 12.9 |
| 1 and under 2 years | 39 | 20.1 | 816 | 18.3 | 855 | 18.3 |
| 2 and under 3 years | 32 | 16.5 | 564 | 12.6 | 596 | 12.8 |
| 3 and under 5 years | 21 | 10.8 | 545 | 12.2 | 566 | 12.1 |
| 5 and under 7 years | 14 | 7.2 | 507 | 11.3 | 521 | 11.2 |
| 7 and under 10 years | 5 | 2.6 | 505 | 11.3 | 510 | 10.9 |
| 10 years and over | 3 | 1.5 | 217 | 4.9 | 220 | 4.7 |
| Life | 10 | 5.2 | 281 | 6.3 | 291 | 6.2 |
| Preventive detention | 0 | 0 | 93 | 2.1 | 93 | 2 |
| Total | 194 | 100.0 | 4,468 | 100.0 | 4,662 | 100.0 |
Offending history – As shown in table 10.18, on average female inmates had fewer previous convictions than their male counterparts. Of female sentenced inmates, 25 percent had no previous record, 43 percent had at least six previous convictions and 3 percent had more than 20 previous convictions. For male sentenced inmates, 17 percent had no previous criminal convictions, 52 percent had at least six previous convictions and 10 percent had more than 20 previous convictions.
Table 10.18. Total time spent in prison on previous occasions12
| Total time spent in prison | Female | Male | ||
|---|---|---|---|---|
| Number | Percent | Number | Percent | |
1As at 18 November 1999 census. 2Excludes 9 female and 271 male inmates where ‘total time spent in prison’ was not available. Source: Department of Corrections | ||||
| No previous incarcerations | 115 | 58.4 | 1,744 | 38.9 |
| Under 6 months | 47 | 23.9 | 817 | 18.2 |
| 6 months and under 1 year | 16 | 8.1 | 441 | 9.8 |
| 1 and under 2 years | 10 | 5.1 | 530 | 11.8 |
| 2 and under 3 years | 4 | 2.0 | 293 | 6.5 |
| 3 and under 5 years | 3 | 1.5 | 298 | 6.6 |
| 5 and under 7 years | 0 | 0 | 161 | 3.6 |
| 7 and under 10 years | 1 | 0.5 | 110 | 2.5 |
| 10 years and over | 1 | 0.5 | 94 | 2.1 |
| Total | 197 | 100.0 | 4,488 | 100.0 |
Classification status – Males tended to have a higher security status than females. For male sentenced inmates, 51 percent were minimum security, 42 percent were medium security and 3 percent were maximum security. For female sentenced inmates, 65 percent were minimum security, 28 percent were medium security and 2 percent were maximum security. The remainder were unclassified.
Earnings. Modest earnings are paid to inmates who work or are involved in re-integrative programmes. Amounts vary depending on the nature of the work or activity and the standard of performance. The money is banked in a personal trust account and inmates can spend it on personal items through a weekly shopping system.
Any person who has been in custody for more than 31 days is eligible on release for the Steps to Freedom grant administered by the Ministry of Social Development. The grant is for up to $350, but the amount of any money in an inmate's trust account upon final release is deducted from the grant.
Punishment. An inmate charged with an offence against discipline appears before a prison superintendent, an authorised staff member or a visiting justice. If the inmate is found guilty, a penalty may be imposed. Serious criminal offences by inmates are referred to the police for investigation.
Release to work. A small number of selected inmates may be released during the day for outside employment. They are required to contribute to the cost of their board, and part of their earnings may also be withheld to fund debts and family expenses.
National administrative and operational control of the New Zealand Police is vested in the Police Commissioner, who is responsible to the government through the Minister of Police. New Zealand is divided into 12 police districts, each managed by a district commander. The Office of the Commissioner in Wellington provides policy advice and support to the government, the commissioner and districts. A number of service centres throughout New Zealand provide administrative support to districts.
Police have responsibility for enforcement of the criminal law, principally through the Crimes Act and the Summary Offences Act, but also through various other statutes such as the Arms Act, the Sale of Liquor Act, the Gaming and Lotteries Act, the Misuse of Drugs Act, Children, Young Persons and Their Families Act, the Police Act and the Transport Act.
Trained police prosecutors undertake summary prosecution in district courts of criminal offences investigated by the police. In some country districts, police hold additional appointments, such as registrars and bailiffs at district courts, and honorary fisheries officers.
The effective strength of the police at 30 June 2001 was 7,328 sworn personnel (420 more than at 30 June 1999), giving a full-time equivalent (FTE) of 7,046 sworn officers (an increase of 170). Approximately 16 percent of sworn officers in 2001 were women (see Figure 10.4). Figure 10.5 shows the New Zealand population per sworn officer from 1878–2001.
There were also 1,803 non-sworn full-time equivalent personnel (down 103 on the 1999 figure).
Self-publishing. Another new trend is the rise in self-publishing driven by the internet. Today, any individual with a minimum of technical expertise and a connection to the internet can publish creative or intellectual work for global access, in effect democratising the publishing process. This is changing the role of gatekeepers such as publishers, producers and censors, who traditionally exercised control over content, access and quality. Musicians, for instance, can now bypass music industry structures altogether and place their music on the internet for direct consumption. Nevertheless, gatekeepers will still be needed for their very function of guaranteeing reliability and quality, and for their marketing expertise. The opportunity for ordinary people to communicate inexpensively and publish globally is creating vital new business opportunities, particularly for small and medium-sized enterprises. The internet can negate New Zealand's isolation, and make global time differences a distinct advantage.
Future change. An important question is how growing access to increasing quantities of information, combined with greater communication opportunities, will change New Zealand's social, economic and governance structures. And how direct access to global stores of knowledge will change the geography of opportunity both within New Zealand and between New Zealand and the rest of the world. We do not know what effect the rise of narrowcasting over broadcasting may have on New Zealand's culture and social cohesion. Nor do we know what will happen if we are no longer limited by existing socio-political boundaries, business models, traditional notions of time, cost and distance. It is likely that communities of interest will form that have little to do with geographical locations or even national boundaries. It seems that technology is delivering a future that is both digital and global, and in which opportunity is amplified through participating in ever more complex networks. Plugging communities and individuals into global networks is an increasingly important part of economic development. However, the same technology that amplifies opportunity can also amplify existing disparities in society. Increasingly, public policy will have to focus on ensuring that all citizens have access to emerging global networks: that we do not create a digital divide of information haves and have-nots.
Electronic commerce. Electronic commerce – the use of information technology (IT) combined with the connectivity of the internet to carry out a wide range of business processes – is a vital part of New Zealand's emerging knowledge-based economy. The fundamental effect of e-commerce is to dramatically increase the speed and efficiency of the transfer of information. This has a significant impact on business processes, from opening up new global markets to significantly reducing the error rate in business processes. In addition, the ability to transfer and process large amounts of information cheaply offers potential for both innovation and the creation of new products and services. Following an e-commerce summit in November 2000, the government released its Electronic Commerce Strategy. The strategy identified three broad roles for the government:

A boy uses his home computer to surf the internet.
Leadership and communication, including, in particular, e-government.
Helping to build capability in business and the broader community.
Ensuring an enabling regulatory environment for e-commerce.
To help drive the uptake of e-commerce by New Zealand businesses, the government set up an Electronic Commerce Action Team of sector representatives in 2001. A number of regional e-commerce events were also held. In terms of publicly available indicators such as the cost and availability of internet access and the number of registered internet domain names, New Zealand is among the leading e-commerce nations. Government policy is aimed at maintaining and enhancing this position, particularly through policies which encourage the rollout and uptake of broadband (ie high-speed and always ‘on') internet services.
IT Policy Group. The role of the IT Policy Group, part of the Ministry of Economic Development's industry and regional development branch, is to provide policy advice to the government on IT issues as they affect the economy and society. The group monitors overseas trends in technology policy and development and acts as secretariat for the government's Electronic Commerce Action Team (ECAT). ECAT is a partnership among government, business and the broader community whose purpose is to drive the uptake of e-commerce by New Zealand businesses in support of the vision ‘that New Zealand will be world-class in embracing e-commerce for competitive advantage.’ ECAT consists of a core group, made up of industry/business leaders and e-commerce experts appointed by and reporting to the Minister for Information Technology, and an informal network of individuals and groups interested in e-commerce.
TUANZ. The e-business group within the Telecommunications Users’ Association of New Zealand (TUANZ) recognises the value of effective and efficient use of IT in business and is committed to leading the innovative use of e-commerce in New Zealand. The overall purpose of TUANZ is to lead informed and sophisticated usage of technology-based communications by New Zealand businesses. As well as the e-business group, TUANZ has an interactive group involved in raising awareness of, and developing, interactive multimedia, and a contact centre group, which works to raise the standard and develop the potential of the contact centre industry in New Zealand.
Education. IT has become a key component of the New Zealand classroom in the past decade. A survey by the Learning Centre Trust of New Zealand in 2001 showed that all secondary schools and 98 percent of primary schools had some form of internet access. Fifty-four percent of primary schools had 80 percent or more of their classrooms connected to the internet. Sixty-one percent of secondary schools, however, had 25 percent or less of their classrooms connected. Sixty-two percent of secondary schools, but only 27 percent of primary schools, had their own web pages. The report indicated that in 2001, primary schools averaged one computer to every 10 students and secondary schools averaged one computer to every six students, compared with one to 16 and one to eight respectively in a 1996 Ministry of Education survey.
Before 1989, most broadcasting services in New Zealand were provided by the government. In that year, a new broadcasting policy regime was established to improve economic efficiency within the broadcasting industry while ensuring that social objectives continued to be met. The government's aim was to increase economic efficiency through a more competitive and flexible market for broadcasting services. Under the new policy regime:
It would be easier for new broadcasters to enter the industry.
Ownership restrictions would be reduced or removed altogether.
It would be easier for new technologies to be used and new services to be provided.
In the interests of increasing efficiency, the government's commercial and non-commercial objectives would be separated.
The Broadcasting Corporation of New Zealand Restructuring Act 1988 dissolved the Broadcasting Corporation of New Zealand and replaced it with two state-owned enterprises, Radio New Zealand Ltd (RNZ) and Television New Zealand Ltd (TVNZ), each with its own management board. TVNZ was required to vest its transmission assets in a subsidiary company, Broadcast Communications Ltd. In 1995, Radio New Zealand was re-established as a Crown company with its own act. Limits on overseas shareholdings in New Zealand broadcasting companies were removed in 1991.
The Broadcasting Act 1989 established the Broadcasting Commission (NZ On Air) and the Broadcasting Standards Authority, provided for election broadcasting and restricted the scope for political intervention in the management or programming of TVNZ or RNZ.
Te Māngai Pāho, the Māori broadcasting funding agency, was established by the Broadcasting Amendment Act 1993 to provide funding to promote Māori language and culture through broadcasting.
In 2001, the government made a significant change to the broadcasting regime established in 1989 by deciding that, like Radio New Zealand, TVNZ would become a Crown company with its own act and a charter setting out in broad terms the kinds of programming it is to provide. The new company will be required to balance public service and commercial objectives. The new form of the company and its charter came into effect on 1 July 2002.
Broadcasting Commission (NZ On Air). The Broadcasting Commission's role is to promote in broadcasting cultural and social objectives and such other activities seen as unlikely to receive sufficient commercial provision. Members of the Broadcasting Commission, which operates as New Zealand On Air (NZ On Air), are appointed by the governor-general on the recommendation of the Minister of Broadcasting. Prior to July 12000, NZ On Air collected the Public Broadcasting Fee ($110 a year for each household with a television set) and disbursed it to meet its statutory objectives of:
Reflecting and developing New Zealand identity and culture by promoting programmes about New Zealand interests and promoting Māori language and culture.
Maintaining and, where considered appropriate, extending television and radio coverage to New Zealand communities that otherwise would not receive a commercially viable signal.
Ensuring a range of programmes is available to provide for the interests of women, youth, children, persons with disabilities and minorities in the community, including ethnic minorities, and encouraging a range of broadcasts that reflect the diverse religious and ethical beliefs of New Zealanders.
Encouraging establishment and operation of archives of programmes likely to be of historical interest in New Zealand.
NZ On Air fulfils these objectives by providing funds for broadcasting, production of programmes and archiving of programmes. When allocating funding for programme production, NZ On Air is required to take into account such factors as availability of other sources of funding, likely audience size and the likelihood of a programme being broadcast. In May 1999, the government announced that the Public Broadcasting Fee would be abolished with effect from 1 July 2000 and that funding for NZ on Air's activities would in future be a charge to Vote: Culture and Heritage. In the 2000/01 financial year, NZ On Air spent $55.7 million on the production of television programmes and $25 million on National Radio, Concert FM and access radio services. It also spent $1.7 million on remote television and radio coverage, $3.78 million on New Zealand music projects and $0.98 million on broadcasting archives.
Broadcasting standards. The Broadcasting Standards Authority (BSA) is a Crown entity established to enforce and oversee the standards and objectives specified by the Broadcasting Act 1989. The four members of the authority are appointed by the governor-general on the recommendation of the Minister of Broadcasting. The authority's functions are to:
Encourage broadcasters to develop and observe codes on the protection of children and the portrayal of violence; fair and accurate programming and procedures for correcting factual errors and redressing unfairness; restrictions on the promotion of liquor; safeguards in the area of human rights; and the presentation of appropriate warnings.
Develop other codes where appropriate.
Conduct research and publish findings.
In relation to complaints, the authority:
Hears and determines formal complaints against broadcasters when the complainant is dissatisfied with the action taken by broadcasters, or when there are issues of individual privacy.
Publishes its findings.
May impose penalties (the most severe being a 24-hour restriction on broadcasting).
There are appeal rights to the high court against the authority's decisions.
In the past five years, the authority has issued around 200 decisions every year. Of these decisions:
25 percent were upheld.
40 percent related to matters of good taste and decency.
45 percent related to matters of balance, fairness and accuracy.
15 percent related to matters of privacy.
75 percent concerned television broadcasters.
25 percent concerned radio broadcasters.
Complaints about the standard of advertising on radio and television are handled by the Advertising Standards Authority. In the year ended 31 December 2000, the Advertising Standards Authority considered 690 formal complaints, 27 percent of which concerned offensive/social responsibility issues and a further 27 percent misleading advertisements.
Election broadcasting. Under the Broadcasting Amendment Act 1996, the Electoral Commission is responsible for the allocation to political parties of free broadcasting time and funding for party political advertising broadcast before an election.
Māori broadcasting. Under the Radiocommunications Act 1989, frequencies suitable for radio and television were reserved throughout New Zealand for promotion of Māori language and culture. Prior to the 1988/89 broadcasting reforms, one iwi-based radio station (Wellington's Te Upoko o te Ika) had been broadcasting continuously. There are now 21 iwi-based radio stations.
After 1989, NZ On Air provided public funding for operating and capital costs of Māori radio stations and for production of Māori programmes broadcast on network television. The Broadcasting Amendment Act 1993 established a new Māori broadcasting funding agency, Te Reo Whakapuaki Irirangi (now known as Te Māngai Pāho). On 1 January 1995, Te Māngai Pāho assumed primary responsibility for allocation of public funding for Māori broadcasting. This includes purchase of Māori language programming broadcast on national television and iwi radio and some Māori radio programming produced by national providers and available to iwi stations through a radio programme distribution service.
In 2001, the government confirmed the establishment of a Māori television service. The principal function of the service is to promote te reo Māori me ngā tikanga Māori, through the provision of a high quality, cost effective Māori television service, in both Māori and English, which informs, educates and entertains, and in doing so, enriches New Zealand's society, culture and heritage.
The telecommunications market was fully opened to competition on 1 April 1989. Telecom New Zealand Ltd was established as a state-owned enterprise on 1 April 1987 after the break-up of the post office and was privatised in August 1990. Telecom is still the only provider of a full range of telephone services throughout New Zealand. However, there are a number of competitors who provide long-distance call services to most areas and a wide range of telephone services to central business districts and some suburban areas of larger cities.
Regulatory framework. Compared with other countries, New Zealand has a relatively light-handed telecommunications regulatory regime. There are no specific licensing requirements to commence business as a telecommunications carrier and no foreign ownership restrictions. However, new sector-specific regulations will come into force with passage of the Telecommunications Bill. A Telecommunications Commissioner within the Commerce Commission will administer most of the functions of the new regime. The commissioner's key functions will be to resolve disputes over regulated services, to report to the minister on the desirability of regulating additional services, and to monitor and enforce Telecommunications Service Obligations (TSO), such as the Kiwi Share Obligations (KSOs) provided by Telecom.
A regulated price will be set only if there is a pricing dispute the parties cannot resolve themselves. The commissioner will not have the power to overturn commercially negotiated agreements. Those services that can have access and pricing regulated will be:
Interconnection with Telecom's fixed telephone network.
Wholesaling of Telecom's fixed network services.
A telegram being prepared on a teleprinter around 1940.
Number portability, including 0800 and mobile phone number portability.
Fixed to mobile carrier pre-selection from Telecom's network.
Those services that can have only access regulated will be:
Mobile phone roaming.
Co-location on cellular transmission sites.
Co-location of equipment for fixed telecommunications services at sites used by Broadcast Communications Ltd.
Telecom agreed to observe certain KSOs when it was privatised. These protect the interests of residential telephone users and include a cap on the price of residential telephone line rentals. As at 7 December 2001, the government was negotiating with Telecom to upgrade the KSOs to:
Extend geographic coverage to current levels.
Clarify that free local calls include dial up data (eg internet) calls.
Bring basic internet access to virtually all New Zealanders by upgrading Telecom's network to provide 9.6kbps data capability to 99 percent and 14.4kbps to 95 percent of residential lines over two years from the passage of legislation. (Telecom is to bear the capital cost of this upgrade – the industry is to contribute to any ongoing KSOs losses).
There will also be a tighter monitoring regime on Telecom's performance under the KSOs, including 111 performance, dial tone availability and the infrastructure upgrade.
Competitive service provision. At least 15 companies were offering telecommunications services at February 2002, including Telecom, TelstraClear (in December 2001, TelstraSaturn and Clear Communications merged to form TelstraClear), Vodafone, Global One, WorldxChange, Teamtalk, Compass, Call Plus, City Link, Zip, DigiPlus and Ihug. The main competitive telecommunications services provided are international, national and cellular calls. In central business districts, competition extends to all telephone and data services. Facilities management services are also becoming increasingly important. Most competitors have interconnection agreements with Telecom and a number of new entrants have interconnection agreements with each other. A range of number portability agreements are also in place.
A particular feature of New Zealand's residential long distance services are off-peak, unlimited call duration, capped charges, such as $3 capped national calls, $4 capped calls to Australia and $8 capped calls to the United States and Canada and the United Kingdom and Ireland. A $5 capped call option for national peak calls is also available to residential users. Residential telephone service competition is developing, with TelstraClear currently offering an extensive range of services to residential and business customers in Wellington, the Hutt Valley and Kapiti, and parts of Christchurch. Telecom and Vodafone provide cellular mobile phone services with extensive coverage of New Zealand. Internet protocol telecommunications services are also increasingly available, offering competing national, international and landline to mobile calls. Telephone density is high in New Zealand, with more than 96 percent of households having access to a telephone. The number of mobile phones has doubled in recent years and there are now about 60 mobile phones per 100 people. High speed internet services are now becoming more common. Telecom's Jetstream service uses asymmetric digital subscriber line (ADSL) technology to enable internet data and voice to be sent at high speed down one telephone line at the same time in areas where Telecom has installed the technology. TelstraClear provides high speed internet access via cable modems connected to its co-axial cable television network. Ihug's Ultra provides high speed internet downloading via satellite dish anywhere in New Zealand and via microwave dish in Auckland.
Telecom Corporation of New Zealand Ltd (Telecom). Telecom is New Zealand's leading supplier of telecommunications services. Telecom provides a full range of telecommunications and on-line services to residential and business customers in New Zealand, and in Australia through its voice and data business, AAPT. Telecom has New Zealand's most extensive telecommunications network, which stretches from Kaitaia to Bluff. Since 1990, Telecom has invested $4.7 billion in maintaining and upgrading the network. Telecom has 1.7 million fixed line residential and business customers in New Zealand. Of these, 1.2 million have access to fast internet. Telecom has been privately owned since September 1990 when it was purchased from the government for $4.25 billion. The purchaser was a consortium of two leading United States telecommunications suppliers, Bell Atlantic and Ameritech, and two New Zealand companies, Fay Richwhite and Freightways. Today, about 25 percent of Telecom's shareholding is held locally. In May 1996, Telecom launched XTRA – an internet access, navigation and content service, which today has approximately 340,000 active customers. Through Telecom's ongoing investment in the future and global partnerships, its customers are able to access the latest ways of keeping in touch, doing business and being entertained. The Telecom website is www.telecom.co.nz and the XTRA website is www.xtra.co.nz
TelstraClear Ltd. TelstraClear Ltd is New Zealand's second largest full service communications company, providing products and services to the business, government, wholesale and residential sectors. Created from the merger of TelstraSaturn Ltd and Clear Communications Ltd in December 2001, TelstraClear Ltd provides a choice in the New Zealand communications market and seamless services to trans-Tasman customers. TelstraClear Ltd serves more than 300,000 business and residential customers in every major city of New Zealand and in more than 30 regional centres. This presents more than 11 percent of the New Zealand market with a voice, data, internet protocol, mobile and cable television product range. TelstraClear Ltd is owned by Telstra Corporation and Austar United Communications. Telstra Corporation is Australia's largest telecommunications company, and is listed on the Australian stock exchange, and Austar United Communications is an Australian company that provides pay television services, and is also listed on the Australian stock exchange. The TelstraClear website is www.telstraclear.co.nz
Television New Zealand Ltd. The TVNZ Group operates two national television channels, TV ONE and TV2, and has several subsidiary companies. TVNZ's local and international activities include programme production, an internet portal, outside broadcast services, multi-media development, merchandising, teletext, signal distribution and programming supply, and transmission consultancy services in Australia, South-east Asia and the Pacific. Under special legislation, the government has redesignated TVNZ as a Crown-owned company, with separate television and transmission businesses. The primary purpose of the television business is to meet its charter objectives while maintaining commercial performance. The transmission business will maintain a strong commercial focus, with a new governance structure yet to be determined. Under the TVNZ charter, TVNZ is required to inform, educate and entertain all New Zealanders, reflecting and fostering New Zealand's identity and culture. In addition, TVNZ aims to provide New Zealanders with quality communications products and services. TV ONE and TV2 broadcast to 98 percent of the New Zealand population. Both channels broadcast 24 hours a day, seven days a week, with 46 of the 50 most-watched programmes in 2001 broadcast by either TV ONE or TV2. TV ONE presents New Zealand and overseas drama, news, sport and information programming. TV2's mix of comedy, drama, children's, movie and entertainment programming attracts a younger audience. Imported programming for both channels is mainly sourced from the United Kingdom, the United States and Australia. TVNZ's internet portal – nzoom.com – is one of the five most visited New Zealand sites. TVNZ's transmission group includes signal distribution company Broadcast Communications Ltd (BCL), which provides services for all New Zealand television broadcasters and most radio stations, and TVNZ (Australia), which provides transmission services to the ABC and SBS in Australia. TVNZ Group revenue for the financial year to 30 June 2001 was $481.1 million, with a net surplus after taxation of $30 million.
TV3 Network Services Ltd. TV3, New Zealand's only privately-owned, free-to-air national television network, has been on air since November 1989. Headquarters are in Auckland, with offices and studio facilities in Wellington, Hamilton, Christchurch and Dunedin. TV3 is 100 percent owned by Can West Global Communications Corporation, a Canadian communications company. The network, a broad-based entertainment channel, primarily targets viewers aged 18–49 years, with a strong emphasis on news, current affairs, sport and local programming. TV3's documentary series, Inside New Zealand, has won national and international awards. Internationally-sourced programmes come primarily from the United States. TV3 has exclusive agreements with FOX, Disney and World Vision, as well as the ability to source drama and comedy from many other international distributors. In June 1997, TV3 launched a second free-to-air channel on VHF frequency, TV4. Targeting young, urban Kiwis aged 15–39 years, TV4 is broadcast to more than 70 percent of New Zealand, 24 hours a day, seven days a week. Around 2.3 million people can access the channel.
Table 11.1 shows the number of hours of local content the main commercial channels broadcast.
Table 11.1. Hours of local content on network television
| Year | TV One | TV2 | TV3 | Total |
|---|---|---|---|---|
1The decrease in hours in 1993 was mainly because coverage of the Olympic Games significantly increased the hours of local content broadcast in 1992. Source: NZ On Air | ||||
| 1990 | 2,474 | 772 | 1,003 | 4,249 |
| 1991 | 1,811 | 1,016 | 1,212 | 4,039 |
| 19921 | 2,526 | 1,227 | 1,962 | 5,715 |
| 19931 | 2,005 | 1,042 | 1,741 | 4,788 |
| 1994 | 2,210 | 1,041 | 1,718 | 4,969 |
| 1995 | 2,532 | 1,113 | 1,373 | 5,018 |
| 1996 | 2,407 | 1,255 | 1,404 | 5,066 |
| 1997 | 2,638 | 1,324 | 1,639 | 5,601 |
| 1998 | 3,503 | 1,307 | 1,487 | 6,297 |
| 1999 | 3,516 | 1,334 | 1,292 | 6,142 |
| 2000 | 3,544 | 1,158 | 1,484 | 6,186 |
SKY Network Television Ltd. SKY Network Television Ltd is a pay television company which began broadcasting in May 1990 using scrambled UHF channels. As at June 30 2001, SKY had 430,436 residential and approximately 6,000 commercial subscribers. SKY's UHF signal reaches 73 percent of New Zealand's estimated 1.3 million households. In December 1998, SKY launched its digital direct broadcast satellite (DBS) service, which means that virtually all New Zealand households can receive up to 25 channels. SKY's UHF service currently broadcasts seven channels on five frequencies: SKY Sport, SKY Movies, CNN, SKY 1, Nickelodeon, Discovery and Trackside.
Prime Television. In 1997, Prime Television acquired 34 UHF licences covering all major cities and towns in New Zealand and in August 1998 commenced broadcasting to a target audience demographic (30–plus). Prime Television is a free-to-air terrestrial broadcaster with its main office in Albany, Auckland, and regional offices in Hamilton, Tauranga, Hastings, Wellington, Christchurch and Dunedin. An initial potential reach of 65 percent of the population had been expanded to 71 percent (2.1 million) by the end of 2001 and was planned to increase to 90 percent during 2002. In March 2002, Prime Television began broadcasting an entertainment-based programme schedule following a joint venture agreement with the Nine Network of Australia, departing from its initial British programming lineup.
Regional and local television services. A number of small regional television services operate throughout New Zealand, providing programmes ranging from music television services to mixed local and international news and entertainment services. Other services provide information about local events and attractions, targeted primarily at tourists. Local television services operating as at November 2001 included: Family Television Network (Warkworth), Triangle Television (Auckland), Geyser Television (Rotorua), Eastland Television (Gisborne), Hawke's Bay Television and Channel 51 (Hawke's Bay), Taranaki Community Television Trust (Taranaki), Channel 7 (Wellington), Mainland Television (Nelson), CTV and CHTV (Christchurch) and Mercury Television (Invercargill).
Trackside. Owned by the Totalisator Agency Board (TAB), Trackside started broadcasting in November 1992. It broadcasts live racing, race results and programmes about racing on a nationwide basis, using UHF and satellite frequencies. The TAB has leased down-time on the channel to SKY Network Television Ltd.
Non-commercial television. The government has reserved UHF frequencies nationwide for the provision of non-commercial (community access) television services. As at November 1999, the Ministry of Economic Development had offered licences for non-commercial use to broadcasters in the Auckland, Waikato, Bay of Plenty, Taranaki, Wellington, Nelson/Marlborough, Christchurch and Dunedin regions. Three of these licences have been taken up. Triangle Television has been broadcasting in Auckland since July 1998, Channel 7 has been broadcasting in Wellington since June 1999 and Taranaki Community Television Trust Inc started broadcasting in December 1999. In December 2001, the Ministry of Economic Development and the Ministry for Culture and Heritage commenced processing a new series of applications for UHF non-commercial licences.
Sky Network Television Ltd's digital direct broadcast satellite system guarantees reception to most of New Zealand.
Since the broadcasting reforms of 1988–89, the number of registered radio frequencies in New Zealand has increased substantially. In July 1988, there were 47 AM and 17 FM stations, of which 30 were privately owned. As at 20 November 2001, there were 170 AM and 528 FM licences to broadcast in New Zealand, 486 of which were privately owned. In November 2001, the government, after considering submissions received, gave priority to reserving frequencies for:
National Radio – to be broadcast on FM.
Concert FM – to migrate to a designated group of frequencies in the upper FM band.
Māori radio – to enable establishment of a national programme for the promotion of Māori language and culture.
Pacific Island radio – to enable establishment of a national programme to enable Pacific peoples’ cultures and languages to be heard.
Radiocommunications. The Radiocommunications Act 1989 provided a revised framework for spectrum allocation in order to cope with an increased demand for frequencies resulting from broadcasting and telecommunications reforms. It established a market-based system for spectrum management, with up to 20-year tradeable spectrum access rights. Such rights not only encourage investment in spectrum use, but also provide for situations where a number of uses are possible. Broadcasters operating under warrants issued by the Broadcasting Tribunal on 1 July 1989 were entitled to a licence under the Radiocommunications Act. These licences were issued for a 20-year period in return for a one-off lump sum payment, or an annual payment for 20 years. The Radiocommunications Act has been amended, resulting in a range of amendments designed to allow greater flexibility in the Crown's management of the radio spectrum. These amendments are contained in the Radiocommunications Amendment Act 2000.
Allocation by tender/auction. Until early 1995, spectrum access rights were allocated by sealed-bid tender. Since early 1995, rights have been allocated by auction. Information on past and future auctions can be found on the Ministry of Economic Development's website at www.auction.med.govt.nz. Most of the currently available UHF television and FM and AM sound radio frequencies have now been allocated. In late 2001, the government consulted the public on the preferred use of frequencies in the 100 to 108MHz part of the FM band. Registration of licences following allocation establishes a tradeable right that is recorded in a publicly accessible register. An annual administration fee is payable to the Ministry of Economic Development by all registered licence holders. Additional licences are created, when technically possible, and allocated when there is demand for them. Amendments to licences (such as changes of transmission site, or increases in power) are accommodated, again when technically possible, in exchange for a formula-based payment reflecting the increased value of the licence. Pending auction, licences are often made available for interim use for a rental related to the value of the licence. These policies are periodically reviewed.
Public radio. State-owned radio has provided commercial and public radio services to New Zealand since the early 1930s. Private radio emerged in the late 1960s and, since then, privately-owned and state radio stations have been in competition. Radio New Zealand Ltd (RNZ) was constituted as a state-owned enterprise in 1988 when the Broadcasting Corporation of New Zealand (BCNZ), of which RNZ had been a service, was dissolved. The BCNZ's radio assets were to pass through the Crown into the state-owned enterprise. In December 1995, all commercial RNZ activities were vested in a stand-alone company, Radio New Zealand Commercial, and the new company was offered for sale. The non-commercial component, Radio New Zealand Ltd, was incorporated as a Crown-owned company under the Radio New Zealand Act 1995. This act established the Radio New Zealand Charter, which sets out the company's broadcasting functions. Public submissions were heard in 2001 on the first statutory review of the RNZ Charter.
Radio New Zealand. Radio New Zealand Ltd is a Crown entity established by the Radio New Zealand Act 1995. The company is New Zealand's public radio broadcaster consisting of three noncommercial radio networks: National Radio, Concert FM and the AM Network; a shortwave service: Radio New Zealand International; a news service: Radio New Zealand News and Current Affairs; and Sound Archives/Ngā Taonga Kōrero. National Radio and Concert FM are funded through New Zealand On Air. Radio New Zealand International is funded by the Ministry of Foreign Affairs and Trade.
National Radio focuses primarily on news and information, with a mix of features, drama and entertainment programmes. News bulletins are on the hour, every hour and Morning Report is regarded as the country's most authoritative news programme. Broadcasting 24 hours a day, the network reaches most New Zealanders on the AM band and FM in Auckland and Taupo.
Concert FM is Radio New Zealand's fine music network, broadcasting a programme of mainly classical music and spoken features about music, 24 hours a day, on the FM band. Both Concert FM and National Radio are also available through the SKY Television network. The AM Network broadcasts all sittings of parliament from transmitters in Auckland, Napier, Wellington, Christchurch and Dunedin. When not used for parliament, the network is leased out.
Radio New Zealand International is the country's international shortwave service, providing news and information programmes to listeners in the South Pacific 15 hours a day. Radio New Zealand International's 100 kilowatt signal is beamed to the South Pacific, but can be heard by listeners as far away as Japan, North America, the Middle East and Europe.
Radio New Zealand News provides comprehensive news coverage, current affairs and specialist reporting for National Radio and Concert FM. International news services, correspondents overseas and reporters throughout New Zealand deliver news to listeners throughout the day.
Sound Archives/Ngā Taonga Kōrero is a subsidiary of Radio New Zealand which gained archive status under section 90 of the Copyright Act in 1998/99, allowing material broadcast by any New Zealand network or station to be archived without breaching copyright. This will enable Sound Archives/Ngā Taonga Kōrero to become a truly national collection, representing all broadcast radio providers in New Zealand, as well as preserving existing collections largely created during the era of state-owned radio.
The Radio Network of New Zealand Ltd. The Radio Network began as a private radio broadcaster on 1 August 1996. Ownership subsequently changed from the New Zealand Government to a consortium comprising Australian Provincial Newspapers Holdings Ltd (a radio, newspaper and outdoor advertising group), Clear Channel Communications Incorporated (the largest United States radio, television and outdoor advertising operator) and Wilson and Horton Ltd (a New Zealand newspaper and publishing group). The Radio Network consists of 71 New Zealand radio stations. Its national radio brands are Newstalk ZB, Classic Hits, Radio Sport, ZM, Radio Hauraki and Easy I. The Radio Network reaches a listening audience of approximately 1.3 million New Zealanders aged 10+ on a weekly basis. Other divisions of The Radio Network are:
The Radio Bureau – the radio industry's one-stop shop for advertising. It manages the sale and placement of radio advertising from advertising agencies and national clients for Radio Network stations and other private stations. The Radio Bureau represents virtually all commercial radio stations in New Zealand.
Independent Radio News (IRN) – the supplier of news and sport bulletin services to the commercial radio industry. IRN supplies more than 300 radio news and sport bulletins a day and also supplies news to a number of internet sites.
Non-commercial radio broadcasting. The Crown has reserved AM and FM radio frequencies and UHF television frequencies throughout New Zealand for use by non-commercial broadcasters. AM frequencies have been reserved in all communities with populations of 10,000 or more. Broadcasters may have access to reserved spectrum for non-profit community purposes. Licences are allocated to appropriate community organisations who are responsible for ensuring that all interested groups have access to airtime on the frequencies. Access radio stations operating on reserved frequencies provide airtime on a non-profit basis to a range of minority groups in the community. In 2001, there were 11 access radio stations in New Zealand. All were assisted by NZ On Air, whose funding for access radio in 2001/02 was $1.86 million.
In 2001, the government agreed a new policy framework for the allocation of frequencies for noncommercial purposes, on both radio and television. Applications for frequencies are received by the Ministry of Economic Development and allocated on the advice of the Ministry for Culture and Heritage.
New Zealand has a high number of daily newspapers in relation to its population. There are 25 daily newspapers, of which 18 are evening papers, nearly all of them published in provincial towns and cities. Of the seven morning dailies, the Auckland-based New Zealand Herald has the largest audited net circulation of 209,898 copies daily. The biggest provincial paper is Hamilton's Waikato Times, with an audited net circulation of 40,427. Other daily newspapers have circulations ranging from about 2,100 to about 91,000. The majority of daily papers are owned by two major publishing groups, Independent Newspapers Ltd and Wilson and Horton Ltd. Between them, these groups account for just over 90 percent of New Zealand's aggregate daily newspaper circulation of about 980,000 copies. The previously dominant pattern of single family, or partnership, newspaper ownership survives only in some centres. Daily newspapers are widely read. On a typical day, more than 1.6 million New Zealanders over the age of 15 read a newspaper and New Zealanders spend approximately $4.5 million a week on daily and Sunday newspapers. There are two Sunday newspapers, Sunday Star-Times and Sunday News, both published by Independent Newspapers Ltd and distributed nationwide. The Sunday Star-Times circulates 198,535 copies every Sunday. There are also approximately 120 community newspapers in New Zealand, the great majority of which are tabloid in format. Many of these are owned by the two big newspaper publishing groups, or by publishers of other newspapers outside the groups. Some are owned by individuals or small companies.
Through international agreements with Reuters, Australian Associated Press and other news organisations, the cooperatively-owned New Zealand Press Association (NZPA) ensures New Zealanders are kept in touch with what is going on in the world by providing an international and domestic news service to all daily and Sunday newspapers. There are more than 6,000 magazines available in New Zealand on a regular basis, 650 of which are published in New Zealand.
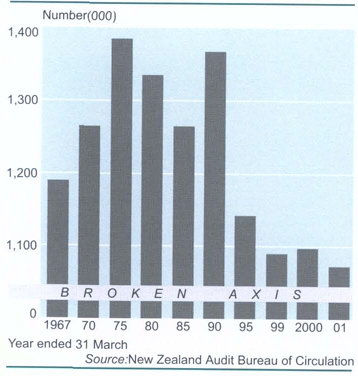
Figure 11.3 shows how newspaper circulation has declined since 1990. Table 11.2 lists the biggest circulating New Zealand magazines.
Table 11.2. Magazine circulation
| Publication (Audit Period = Jan-June) | Circulation | Published | |
|---|---|---|---|
| 2001 | 1999 | ||
** previously part of Straight Furrow. Source: Audit Bureau of Circulations | |||
| AA Directions | 566,780 | 545,818 | Quarterly |
| SkyWatch | 342,064 | 293,139 | Monthly |
| TV Guide | 229,126 | 241,356 | Weekly |
| New Zealand Woman's Day | 147,124 | 165,914 | Weekly |
| Reader's Digest (NZ Edition) | 105,000 | 124,589 | Monthly |
| New Zealand Woman's Weekly | 95,918 | 126,640 | Weekly |
| Rural News | 83,222 | 93,483 | Fortnightly |
| Australian Woman's Weekly (NZ Edition) | 82,764 | 80,045 | Monthly |
| New Zealand Listener | 81,761 | 90,521 | Weekly |
| Straight Furrow | 79,895 | 89,354 | Fortnightly |
| Agtrader | 78,790 | ** | Monthly |
| NZ House & Garden | 75,556 | 57,892 | Monthly |
| Next | 61,267 | 62,255 | Monthly |
| Cuisine | 60,061 | 40,311 | Alternate months |
| New Idea | 55,283 | 67,070 | Weekly |
| New Zealand Gardener | 54,756 | 68,850 | Monthly |
| Little Treasures | 49,700 | 60,655 | Alternate months |
| Your Home & Garden | 41,988 | 27,953 | Monthly |
| That's Life! | 41,636 | 38,959 | Weekly |
| Family Times | 40,148 | 39,800 | Quarterly |
Press freedom. Freedom of the press in New Zealand is of the highest degree. Newspapers participate from an editorial perspective in the Commonwealth Press Union (CPU) based in London. This Commonwealth-wide organisation of journalists and publishers is actively involved in promoting and defending press freedom throughout the Commonwealth by use of training, communications and advocacy. Freedom House, a New York-based, non-partisan, non-profit human rights organisation which presents a yearly report on press freedom, has given New Zealand the same rating since 1972. That rating is ‘1', representing the highest degree of freedom. Freedom House rates most of the countries in the world on their political rights, civil liberties and ‘freedom status'. Their website address is www.freedomhouse.org
The New Zealand Press Council. The press council is a self-regulatory body founded in 1972 with the primary function of investigating and adjudicating on complaints against newspapers and magazines. Its constituent members were the Newspaper Publishers Association (NPA) and the then New Zealand Journalists’ Association, (now part of the New Zealand Engineering, Printing and Manufacturing Union (EPMU)). The NPA and the EPMU remain the constituent members. The council consists of an independent chairman, five members representing the public and five representing the industry. Two of the five industry representatives are nominated by the NPA, two are nominated by the EPMU and one by magazine publishers. A panel including the Chief Ombudsman appoints public members. Since its inception, the council has had as its chairman retired high court judges. The principal objects of the press council are to:
Preserve the established freedom of the New Zealand press.
Maintain the character of the New Zealand press in accordance with the highest professional standards.
Consider complaints against the conduct of the press or the conduct of individuals and organisations towards the press; deal with these complaints in whatever manner might seem practical and appropriate; and record resultant action.
Keep under review developments likely to restrict the supply of information of public interest and importance.
The council does not see its job as setting standards for newspapers, but from time to time it issues recommendations to editors in general terms. The council issued a 13-point Statement of Principles in 1999, which set out a guide for complainants and the publishing industry.
Since its inception, the council has adjudicated on 850 complaints against newspapers and magazines. The number of complaints that reach the final stage represents about half the total received, many complainants failing to follow through after the initial complaint. Others are withdrawn for varying reasons. To make a complaint to the council, complainants are first required to complain in writing to the editor of the publication concerned. This allows the editor to take the opportunity of righting a possible wrong. If complainants are still not satisfied, they can then approach the council. There is no charge for the council's service. In circumstances where legally actionable issues may be involved, complainants are required to provide a waiver that, having referred the matter to the press council, no legal proceedings will be taken against the newspaper or journalist concerned. The council is funded by the constituent members, publishers of community newspapers, and Independent Newspapers Ltd and Wilson and Horton Ltd magazine publishing groups. The New Zealand Press Council is a member of the World Council of Press Councils.
Advertising industry. Approximately 1,000 people are employed in New Zealand advertising agencies and 2,500 in advertising-related services. Advertising revenue also contributes to the employment of another 10,000 people in the publishing, radio and television industries.
At the end of March 2001, there were approximately 180 advertising agencies, most of them New Zealand-owned, but with 25 (mostly larger agencies) affiliated to multinationals by total or partial ownership. Mainstream media advertising for the year ended December 2000 was approximately $1.485 billion.
Substantial additional money was spent on advertising using direct mail, telemarketing, and display material, brochures and the like. Although accurate figures are not available, expenditure in these categories is estimated to exceed $500 million. Approximately 45 percent of expenditure on media advertising was made through advertising agencies, with agencies placing around 80 percent of advertising on television, 80 percent in magazines, 30 percent on radio, 30 percent in newspapers and 20 percent of advertising through other media.
Table 11.3 shows the value of advertising spending in various media in 1999 and 2000, while table 11.4 shows advertising expenditure by industry grouping in 2001.
Table 11.3. Media advertising1
| Medium | 1999 | 20002 | ||
|---|---|---|---|---|
| Expenditure | Share | Expenditure | Share | |
1All cash advertising revenue plus agency commission where applicable. 2Year ended 31 December. 3The newspaper industry no longer supplies a breakdown between newspapers and community newspapers. Source: Advertising Agencies’ Association of New Zealand Inc (actual media revenue) | ||||
| $(million) | percent | $(million) | percent | |
| Daily newspapers | 462 | 32.5 | n/a | n/a |
| Community newspapers | 104 | 7.3 | n/a | n/a |
| Total newspapers3 | 566 | 39.8 | 596 | 40.1 |
| Television | 487 | 34.3 | 501 | 33.7 |
| Radio | 178 | 12.6 | 190 | 12.8 |
| Magazines | 159 | 11.2 | 157 | 10.6 |
| Outdoor and cinemas | 30 | 2.1 | 41 | 2.8 |
Table 11.4. Advertising expenditure by industry, 20011
| Industry | Expenditure |
|---|---|
1Oct 2000 to Sept 2001. Includes: Television, magazines, newspapers, radio, cinema. Source: ACNeilson Media International (rate card basis) | |
| $ | |
| Retail | 172,137,015 |
| Foodstuffs | 222,402,131 |
| Leisure/travel/entertainment | 261,171,674 |
| Agriculture | 19,163,995 |
| Household cleaning products | 19,331,910 |
| Investment/finance/banking | 78,858,963 |
| Toiletries/cosmetics | 85,978,988 |
| Automotive | 116,537,099 |
| Beverages | 95,706,978 |
| Pharmaceutical/Health | 63,442,435 |
| Government departments, services and community | 129,241,452 |
| Telecommunication | 70,836,155 |
Industry organisations and self-regulation. The Communication Agencies Association of New Zealand (CAANZ) is an incorporated body representing the interests of members on issues affecting the advertising industry and agencies. There are 90 member agencies, who collectively represent between 85 and 90 percent of agency billings in New Zealand, with combined turnover of about $900 million. The Association of New Zealand Advertisers (ANZA) represents the interests of advertisers and has 90 members. ANZA administers two pre-placement vetting systems – one for liquor advertising and one for therapeutic advertising.
The advertising industry has a self-regulatory system managed by the Advertising Standards Authority (ASA) and the Advertising Standards Complaints Board. The authority's function is to promulgate codes of practice and develop policies on advertising standards. The board's function is to adjudicate on complaints and advise the ASA on codes and public issues.
The CAANZ website is www.caanz.co.nz

A selection of magazines and newspapers published by Independent Newspapers Ltd.
New Zealand Post Ltd had the sole right till 1998 to carry standard letters weighing up to 200 grams, unless 80 cents or more per item was charged. The Postal Services Act 1998 removed this monopoly and permitted full competition in all areas of the postal services market. All mail must carry a mark to identify the postal operator that carried it. Postal operators have the right to open mail in certain circumstances (eg so it can be returned to the sender when an address is illegible). They also have the right to erect letterboxes. To carry out a business involving carriage of letters, a person or company must be registered as a postal operator with the Ministry of Economic Development. As at 1 September 2001, 33 operators were registered, five more than at 1 November 1999.
Under a deed of understanding with the government, New Zealand Post Ltd is required to meet certain social obligations, including maintaining a minimum number of delivery points and postal outlets, maintaining five or six-day-a week delivery to 99.88 percent of delivery points, not reintroducing the rural delivery fee abolished in 1995, and providing competitors with access to its network on terms and conditions no less favourable than terms and conditions offered to equivalent customers.
Table 11.5 shows the number of postal outlets.
Table 11.5. Postal outlets
| As at 31 March | 1997 | 1998 | 1999 | 2000 | 2001 |
|---|---|---|---|---|---|
| Source: New Zealand Post | |||||
| Post Shops (including franchises) | 297 | 308 | 314 | 315 | 314 |
| Post Centres | 705 | 717 | 719 | 714 | 705 |
| Stamp resellers | 3,663 | 2,945 | 3,141 | 2,994 | 2,940 |
| Total | 4,665 | 3,970 | 4,174 | 4,023 | 3,959 |
Until at least 1 April 2003, New Zealand Post Ltd is the sole operator designated as New Zealand's ‘postal administration’ to the Universal Postal Union (UPU) and has the exclusive right to issue ‘official’ UPU-stamps. From 1 April 2003, the government has the option of designating additional operators to fulfil New Zealand's international postal obligations.
New Zealand Post Ltd. New Zealand Post Ltd is a state-owned enterprise which has been operating in a completely deregulated postal environment since 1998. The Postal Services Act of that year removed New Zealand Post's monopoly on the standard letter, allowing full competition in postal services. New Zealand Post is internationally recognised as providing one of the most efficient and inexpensive postal services in the world. The price of standard letter postage was reduced from 45 cents to 40 cents on 2 October 1995, and has been maintained at that level, along with high service delivery standards.
New Zealand Post's service delivery – the independent measure of mail delivered on time – was 95.7 percent for the year to 30 June 2001, putting its service standards among the best in the world.
While it continues the tradition of carrying and delivering letters and parcels, New Zealand Post has responded to customers’ growing communications needs by providing electronic solutions to residential, business and international markets. Its business activities include letters, courier services, financial transactions, mail and stamp production, as well as data processing and electronic billing, commerce and messaging. New Zealand Post's website is www.nzpost.com
Inland postal services. FastPost or standard post can be used to send any postal item, from a letter to a parcel up to 20kgs. FastPost targets next working day delivery between major towns and cities, with standard post targeting next working day delivery across town, and two to three working days across New Zealand. Other services include boxlink, registered post and parcel post.
CourierPost offers urgent, overnight and economy delivery services. CourierPost's track and trace service gives customers the ability to check on their item at any time from pick-up to delivery. New Zealand Post also provides discounts for bulk mail and handles unaddressed mail (circulars) and direct mail.
Table 11.6 shows changes in the cost of sending one page of material from New Zealand to London.
Table 11.6. Sending one page of material from New Zealand to London, 1938 and 2000 Real (inflation adjusted) costs
| Cost (1999 dollars) for 300 words | 1938 | 2000 |
|---|---|---|
1Telegraph service no longer available in 2000. 2Standard envelope, 28 grams, by sea or economy air mail. 3Cost of a live-minute call in peak hours. 4Based on one minute of transmission time in peak hours. 5Marginal costing only, does not include cost of a PC and assumes flat rate charges from domestic site. Sources: NZ Post. Telecom NZ | ||
| $ | ||
| Telegraph1 | 1,315.00 | |
| Letter post2 | 0.88 | 0.80 |
| Telephone3 | 438.00 | 2.95 |
| Facsimile4 | 0.59 | |
| Email (internet)5 | <0.01< | |
Table 11.7 shows volumes ot articles delivered by post from 1997 to 2001.
Table 11.7. Postal delivery points and volume of articles posted
| Year ended 31 March | |||||
|---|---|---|---|---|---|
| 1997 | 1998 | 1999 | 2000 | 2001 | |
| Source: New Zealand Post | |||||
| Deliveries to – | number | ||||
| Residential | 1,105,824 | 1,155,153 | 1,181,141 | 1,240,263 | 1,283,261 |
| Business | 53,484 | 53,465 | 51,590 | 54,750 | 56,045 |
| Private box and bag | 169,484 | 174,219 | 174,074 | 204,942 | 188,044 |
| Rural delivery | 146,266 | 150,655 | 162,347 | 168,096 | 175,127 |
| Other | 25,262 | 22,387 | 13,915 | 10,825 | 22,392 |
| Total | 1,500,320 | 1,555,879 | 1,583,067 | 1,678,876 | 1,724,869 |
Overseas mail services. New Zealand Post International operates several overseas mail services. International Express is a track and trace courier service to more than 220 countries, with next-morning delivery to Australian centres and targeting two days to the rest of the world, including built-in insurance cover and additional cover options. International Air offers delivery in approximately one week, with built-in cover and the option of additional cover and/or track and trace facility to selected countries. International Economy offers cost-effective delivery to anywhere in the world within approximately three weeks.
Stamp issues. New Zealand Post's stamp unit produces around 12 commemorative stamp issues each year and one to three definitive stamp issues. Table 11.8 lists stamps issued during 2000/01. A variety of products are sold by mail order through the Philatelic Bureau at Wanganui, at stamp sales centres, through PostShops and from the stamps website www.stamps.co.nz.
Table 11.8. 2000/01 Stamp issues
| Dale of Issue | Issue Name | Denominations |
|---|---|---|
| Source: New Zealand Post | ||
| 2000 | ||
| 1 January | Millenium Part 6 – First to See the New Dawn | 40c |
| 9 February | Spirits and Guardians – Year of the Dragon | 40c, 80c, $1.10, $1.20, $1.50, $1.80 |
| 6 March | Scenic definitives | 90c, $1.00, $1.10, $1.30, $2.00, $3.00 |
| 6 March | Gold Round Kiwi | $1.00 |
| 7 July | Scenic Reflections | 40c, 80c, $ 1.10, $ 1.20, $ 1.50, $ 1.80 |
| 4 August | The Queen Mother – 100 Years | 40c, $1.10, $1.80 |
| 4 August | Olympic and Sporting Pursuits | 40c, 80c, $1.10, $1.20, $1.50, $1.80 |
| 6 September | Christmas 2000 | 40c, 80c, $1.10, $1.20, $1.50, $1.80 |
| 5 October | 2000 Children's Health – Bears and Dolls | 40c, 80c, $1.10, $1.20, $1.50, $1.80 |
| 4 November | Threatened Birds | 40c, 80c, $1.10, $1.20, $1.50, $1.80 |
| 2001 | ||
| 1 January | 100 Years of Moving the Mail | 40c x 10 |
| 1 February | Marine Reptiles – Year of the Snake | 40c, 80c, 90c, $1.30, $1.50, $2.00 |
| 7 March | Garden Flowers | 40c, 80c, 90c, $1.30, $1.50, $2.00 |
| 4 April | Art from Nature | 40c, 80c, 90c, $1.30, $1.50, $2.00 |
| 2 May | Aircraft | 40c, 80c, 90c, $1.30, $1.50, $2.00 |
| 6 June | Greetings | 40c x 5,90c x 5 |
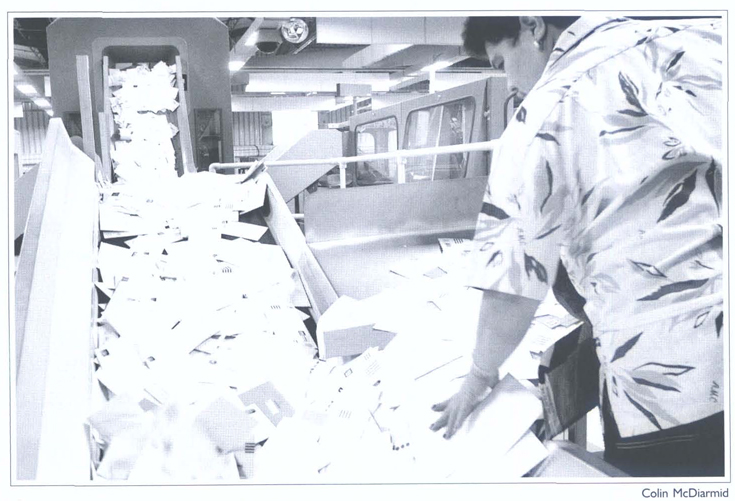
Letter sorting at the Wellington Mail Exchange.
Retail network. At 30 June 2001 New Zealand Post's retail network consisted of 144 company-owned PostShops, 136 franchised PostShops and 34 Books & More stores, with postal services available at a further 705 Post Centres. Stamps were available at a further 2,942 retailers. Financial transaction services including motor registration, ticketing for certain events and bill payment services are available at all PostShops and Books & More stores through the PostLink computer system.
Telegrams. The inland or international public consumer telegram service formerly available from New Zealand Post became unavailable from 17 September 2001.
Recent performances. New Zealand Post reported a profit of $21 million after tax for the 2000/01 financial year, compared with $30.2 million in the previous financial year, $23 million in 1998/99 and $18 million in 1997/98.
11.1 Ministry of Economic Development; Telecommunications Users Association of NZ Inc.
11.2 NZ On Air; Broadcasting Standards Authority; Electoral Commission; Te Māngai Pāho.
11.3 Ministry of Economic Development; Telecom Corporation of New Zealand Limited.
11.4 Telstra Clear.
11.5 Television New Zealand; TV3 Network Services Limited; Sky Television; Prime Television; Ministry of Culture and Heritage.
11.6 Ministry of Culture and Heritage; Radio New Zealand Limited; The Radio Network; NZ On Air.
11.7 New Zealand Audit Bureau of Circulations; Freedom House; New Zealand Press Council
11.8 Communications Agencies Association of New Zealand; AC Neilson.
11.9 Ministry of Economic Development, New Zealand Post Limited, The Telegram Company.
Statistics New Zealand divisional manager responsible: Tom Woodhouse.
Electronic Commerce: The ‘freezer ship’ of the 21st century (1998). Ministry of Economic Development, Wellington (available on-line).
Free-to-Air Television: Code of Broadcasting Practice (2002). Broadcasting Standards Authority, Wellington.
Information about Newspapers (annual). Newspaper Publishers Association of New Zealand, Wellington (available on-line).
Report of the Ministry of Economic Development (Parl paper G.46).
Statistics on Information Technology in New Zealand 2000 (2000). IT Policy Group, Ministry of Economic Development, Wellington.
Sullivan C, and Anso M (2000). ICT in Schools 1999, BRC Marketing and Social Research, Wellington (available on-line from www.med.govt.nz).
Summary of Audited Circulations (bi-annual). New Zealand Audit Bureau of Circulations, Wellington.
www.abc.org.nz – Audit Bureau of Circulations
www.bsa.govt.nz – Broadcasting Standards Authority
www.ecommerce.govt.nz – Electronic Commerce
www.knowledge.gen.nz – Knowledge Economy
www.med.govt.nz – Ministry of Economic Development
www.med.govt.nz/consumer/elcon/ecommerce – Ministry of Economic Development IT Policy Group
www.npa.co.nz – Newspaper Publishers Association
www.nzpost.co.nz – New Zealand Post Ltd
www.nzonair.govt.nz – NZ on Air
www.radio.nz.co.nz – Radio New Zealand Ltd
www.telecom.co.nz – Telecom Corporation of New Zealand
www.tvnz.co.nz – Television New Zealand Ltd
www.telstrasaturn.co.nz – TelstraClear Ltd
www.tv3.co.nz – TV3 Network Ltd
Table of Contents
The Museum of New Zealand Te Papa Tongarewa on the waterfront in Wellington.
In New Zealand, as in most other countries, both central and local government recognise the importance of the arts and the nation's cultural heritage in the life of the community, and provide support accordingly.
In May 2000, the government announced a one-off arts, culture and heritage package which delivered an initial $80 million to the creative sector, with funding increases of more than $20 million a year for each of the following three years. Some of the organisations to benefit from this funding included Creative New Zealand, New Zealand On Air, the New Zealand Symphony Orchestra, the Museum of New Zealand Te Papa Tongarewa, the New Zealand Film Archive, the Royal New Zealand Ballet and the New Zealand Historic Places Trust.
Profits from state-run lotteries are also used extensively to assist art galleries, museums, cultural organisations and projects. New Zealand Lottery Grants Board funding is administered by the Department of Internal Affairs.
Taonga tuku iho describes the maintenance and communication of those aspects of New Zealand culture that are uniquely Māori. It is taonga tuku iho that makes New Zealand culture unique, and because of this governments have tended to make special provision for its support.
The government provides support for taonga tuku iho through a range of measures. It created and funds the Museum of New Zealand Te Papa Tongarewa, which has a statutory responsibility to express the significance of Māori cultural heritage through its collections and programmes; the New Zealand Historic Places Trust, whose responsibility for Māori sites and structures is primarily executed through its Māori Heritage Council; Creative New Zealand, which delivers support for specifically Māori art across the range of genres through Te Waka Toi, the Māori Arts Board; the Māori Arts and Crafts Institute, which works to maintain traditional skills in areas such as carving and weaving; the Māori Language Commission, Te Taura Whiri i te Reo Māori, which promotes the use of the Māori language; and Te Mangai Pāho, which has responsibility for supporting Māori broadcasting.
The government also provides direct support to the Aotearoa Traditional Māori Performing Arts Society, which has an emphasis on maintaining traditional Māori performing arts expertise. From time to time it provides capital funding to regional museums which have nationally significant collections, including collections of Māori taonga.
A winning design in the 2001 Montana World of Wearable Art Awards, Cailleach Na Mara Sea Witch, created by Waikanae's Jan Kerr.
Other government interventions supporting taonga tuku iho are the New Zealand Lottery Grants Board, which allocates profits to a wide range of community enterprises, including restoration of marae; and the Antiquities Act 1975, which regulates the export of antiquities including taonga, and which provides for the protection of newly-discovered artefacts.
Ngāi Tahu representation. One of Creative New Zealand's highlights of 2001 was the first official New Zealand presence at the Venice Biennale of Art. Jacqueline Fraser and Peter Robinson (both of Ngāi Tahu descent) were selected to represent New Zealand at the 49th biennale, from June to November. A Ngāi Tahu kapa haka group, Pounamu Kai Tahu, was also invited to perform at the biennale. Creative New Zealand formed partnerships with a range of government and private organisations to support this outstandingly successful project.
Festival of Pacific Arts. New Zealand participated in the 8th Festival of Pacific Arts, a four-yearly event celebrating indigenous cultures of the Pacific, in Noumea in October 2000. More than 100 Māori artists took part, organised and funded by Te Waka Toi in partnership with the Aotearoa Traditional Māori Performing Arts Society. For the first time the delegation included 19 Pacific artists from New Zealand, organised and funded by the Pacific Arts Committee.
Artistic and cultural awards. Te Waka Toi holds Ngā Taonga Toi/Te Waka Toi Awards Evenings every year to celebrate and affirm Māori artistic and cultural achievements. In 2001, seven Māori artists were honoured for their contribution to Māori arts, and three post-secondary students received scholarships to further their studies in a field of Māori arts. Te Waka Toi presented its 2001 Te Tohu Tiketike a Te Waka Toi/Te Waka Toi exemplary award to author, artist and academic Katerina Te Heikoko Mataira (Ngāti Porou) at a ceremony on her marae.
The Museum of New Zealand Te Papa Tongarewa is New Zealand's national museum. Since opening in February 1998, it has established a national and international reputation as New Zealand's ‘must-see’ visitor attraction.
Te Papa's founding concept was developed through an extensive national consultative process and was adopted by the government in 1990. It introduced the concepts of unified collections, the narratives of culture and place, the idea of forum, the bicultural partnership between Māori and Pākehā, and a multidisciplinary approach to delivering a national museum for diverse audiences. Its mission, to be a forum for the nation to explore and preserve its unique cultural and natural heritage, is underpinned by the principles of the bicultural partnership, being customer focused, speaking with the authority that arises from scholarship and mātauranga Māori, being commercially positive and the waharoa or entryway for New Zealanders to explore and reflect on their cultural identity.
The museum contains 21 major constructed exhibitions and features a programme of innovative and exciting exhibitions that both draw on the richness of its collections and bring to New Zealand the best of the rest of the world.
Permanent exhibitions include Bush City, an outdoor space that recreates distinctive aspects of the New Zealand landform and its associated plant life, and The Time Warp, a dynamic interactive zone that uses motion-simulator technology and cinema effects to project visitors into New Zealand's distant past and near future. Te Papa is the only museum in the world with its own living, functioning marae.
Central to Te Papa's existence are its collections. The museum has particularly rich holdings of New Zealand plants and animals, taonga Māori and Pacific collections. Te Papa continues to develop its collection of art. In October 2001, Te Papa opened an additional 1,500 square metres of exhibition space for the display of art and visual culture as part of an ongoing major development programme. In order to ensure collections are housed in the best possible conditions, the museum purchased and refurbished the former Wellington City Council works depot. Completed in early 2000, this new collection storage, research and technical services facility gives Te Papa two world class buildings in which to preserve and present New Zealand's national heritage.
In its capacity as the national museum, Te Papa operates a number of services for customers outside its premises and a substantial national services programme that aims to work with other museums, iwi and related organisations on projects to improve services provided by museums in their local communities. The focus of national services is on five priority areas: marketing and promotion, training, bicultural development, assessment and revenue generation. Other services include Te Papa Press, touring exhibitions, a collections loans service, a programme of iwi partnership projects, and the Te Papa website.
Te Papa achieved overwhelming success in its first four years of operation. More than six million people visited the museum and many more benefited from its extension and national services programmes. There is increasing evidence that the existence of Te Papa has changed national and international tourism patterns. More than two-thirds of all visitors to Te Papa in the 2000/01 financial year came from outside the Wellington region and more than a third were overseas visitors. Te Papa's audience closely approximates the New Zealand population at large. For example, the proportion of Māori visitors equates roughly with the percentage of people identifying themselves as Māori in the 1996 Census. A similar pattern has emerged for those of Pacific peoples and other ethnicities.
Re-enactment of the Māori traditional sounding of visitor arrival.
There are about 600 public museums and art galleries in New Zealand. Many are relatively small collections oriented towards the history of a particular region or location. The larger museums, of which there are many, carry out research, print catalogues and research papers, and provide educational programmes. Many museums and art galleries are funded by local government. Funding for capital works may be provided by the lottery grants board, community trusts, electricity trusts or other funding bodies.
New Zealand's leading heritage agency since 1955, the New Zealand Historic Places Trust is now a statutory, non Crown-owned entity. With the advice and support of the Māori Heritage Council in matters of significance to Māori, the trust's board is responsible nationally for the identification, protection, preservation and conservation of the land-based historic and cultural heritage of New Zealand. This includes buildings and archaeological sites, historic areas and wāhi tapu (sites of special, often sacred, significance to Māori). The trust's Māori name, Pou Here Taonga, means ‘pillar that binds all treasures'.
One of the trust's key tasks is to process nominations for the national register of heritage places established by the Historic Places Act 1993. Another important aspect of the trust's work is liaising with territorial authorities to ensure registered historic places and sites are listed and receive the protection available through district plan provisions. Staff and trust branches also liaise with, and provide heritage advice to, private owners of registered historic places.
Historic places are registered as either Category I (places of special or outstanding historical or cultural heritage, significance or value) or Category II (places of historical or cultural significance or value). Historic areas and wāhi tapu are included on the register, but are not differentiated as Category I or Category II, though individual sites within historic areas may sometimes have individual registration categories.
The trust is responsible for aspects of the regulation of all archaeological sites, whether they are registered or not, including the authorisation of modification, damage or destruction of sites by development processes, or by scientific excavation. Other aspects of archaeological site protection are the responsibility of territorial authorities under the Resource Management Act 1991.
Auckland mansion Alberton, now owned by the New Zealand Historic Places Trust.
The trust owns or manages 58 properties throughout New Zealand, including 32 Crown properties. mostly reserves, which have either been vested in it or which it has been appointed to control and manage. Properties the trust manages range from Pompallier, in the Bay of Islands, New Zealand's oldest surviving industrial building, to the Southland Provincial Council building in Invercargill. A number of properties are open to the public, including Pompallier, which is a working museum complete with printery, tannery and bookbindery. The trust-owned Stone Store, at Kerikeri, the oldest stone building in New Zealand, reopened to the public in 1998 following major conservation work begun two years earlier.
Staff of the trust, including heritage property staff, are supported by about 26,000 members and 23 branch committees throughout New Zealand. In 1999/2000, the trust established a new regional structure, establishing new staff teams in Kerikeri, Auckland, Tauranga, Wellington, Christchurch and Dunedin. Since regionalisation, demand for trust services has grown. Strengthened by a special-purpose Crown funding package, the trust recently established a regionally-based Māori heritage team (Tira Pou Here Taonga), began work on further developing Crown properties managed by the trust, and is upgrading presentation of the register of New Zealand's heritage places with the aim of making register information available through the internet.
Protection of antiquities and archaeological and traditional sites. New Zealand has a number of legal provisions to protect items and sites of historical and cultural significance. The Antiquities Act 1975, administered by the Ministry for Culture and Heritage, includes provisions controlling the sale of Māori artefacts in New Zealand. Artefacts found after 1976 are deemed to be Crown property. There are export controls on a range of items of cultural significance: Māori artefacts; chattels relating to European discovery, settlement or development of New Zealand; written and printed matter; works of art, reproductions, prints, films and sound recordings: specimens of animals, plants and minerals; meteorites; remains of extinct fauna; and shipwreck items. It is necessary to obtain an authority from the New Zealand Historic Places Trust before damaging, destroying, or modifying any archaeological site, or undertaking an archaeological investigation of any site.
Establishment of Archives New Zealand: Te Whare Tohu Tuhituhinga o Aotearoa in October 2000 saw a new era in management of government records in New Zealand. The former National Archives had since 1957 provided public access to government archives, and advised and assisted government agencies with the storage and management of public records. Establishment of Archives New Zealand as a stand-alone department continued these services, but also gave the organisation a more prominent role in ensuring that good record-keeping was incorporated into all aspects of government activity.
Records held by Archives New Zealand represent the memory of government, providing evidence of its functions, policies, transactions, decisions and areas of responsibility. The archives show the social, political, economic, scientific, military, legal, technical and administrative development of New Zealand.
Archives are the raw material for the history of New Zealand. A reliable record of government actions enables its citizens to hold the government to account. In addition, a verifiable record provides government with the protection that comes from its citizens trusting it to be truthful and accountable in its dealings. Records available at Archives New Zealand include those of government departments such as education, railways, health, justice, works, police, post office, lands and survey. internal affairs, Māori affairs, parliament, the armed forces, the courts and commissions of inquiry.
The Constitution Room at Archives New Zealand's Wellington headquarters displays some of New Zealand's most significant documents, providing a walk-through history of New Zealand. Signed sheets of the original Treaty of Waitangi and the Women's Suffrage Petition are the central focus of this exhibition room. Both documents are noted in the UNESCO World Heritage Register as being of international significance.
Archives New Zealand has a statutory role to protect specified classes of local authority archives, and advises and assists these bodies in the care, preservation and disposal of their records.
The chief archivist has sole statutory authority over the disposal (including destruction) of all government records. Only those records deemed to have permanent evidential or informational value are selected for preservation. These are transferred to Archives New Zealand and given finding aids or indexes that enable researchers to access the information.
A major initiative begun in 2000 is development of electronic finding aids and documentation systems. Other recent significant work is development of a draft access standard. Many archive organisations look to Archives New Zealand for leadership in developing archival frameworks and standards to provide sound benchmarks for their own work.
Significant progress has also been made in investigating good practice for the management of electronic records, an area that challenges archives and public records organisations around the world. Archives New Zealand will continue to work closely with international organisations to ensure that sound decisions are made so that electronic records of long-term value are preserved.
Newspaper and magazine cartoons are important historical records because they capture the values and attitudes of the day, providing an extra dimension to our understanding of past events. The New Zealand Cartoon Archive, founded by Ian F Grant as a result of researching his cartoon history of New Zealand. The Unauthorized Version, was launched on April Fool's Day 1992. The archive's purpose is to collect historical and contemporary New Zealand editorial cartoons and to promote the collection to the New Zealand public.
The New Zealand Cartoon Archive has become New Zealand's principal cartoon collection and research institution. More than 20,000 cartoons – originals and copies – have been bequeathed to the archive by cartoonists and their relatives, collectors, politicians and organisations. Since 1992, the archive has received, by arrangement, copies and some originals of cartoons that appear in New Zealand newspapers and periodical press.
The collection includes the work of more than 60 New Zealand and expatriate New Zealand cartoonists. To date, more than 8,700 cartoons have been indexed and are available on the National Library's TAPUHI internet system and 1,045 cartoons and caricatures can be viewed on the library's Timeframes website.
The archive is a self-supporting organisation relying on income raised by the New Zealand Cartoon Archive Trust through sponsorship, donations, membership and other events. It is established within the Alexander Turnbull Library, National Library of New Zealand, Wellington. The library's role is to house the collection and make it publicly accessible. Promotion of the collection has led to increased use of cartoon images by teachers, researchers, writers, publishers and film makers.
The purpose of the National Library of New Zealand: Te Puna Mātauranga o Aotearoa is to inform New Zealand by forging links between information and people. The National Library was established in 1966 by an act of parliament, which also incorporated the Alexander Turnbull Library into the National Library. It collects, preserves and makes New Zealand's documentary heritage available to all New Zealanders. In its various collections, the National Library holds about 2.9 million books: about 1.8 million photographs and negatives; 70,000 paintings, drawings and prints; enough newspapers to form a stack about 2km high; 7km of manuscripts; more than 4km of serials; 100,800 music scores; a collection of sound recordings, including almost 13,000 music CDs; 6,000 oral history interviews; 589,000 children's books (including the schools collection); and about 125,000 ephemera items, ranging from propaganda material to theatre programmes. The National Library is a key adviser to the government on library and information issues. Recent work has included a review of aspects of the National Library Act 1965, leading to a number of proposed amendments, and a research report on the state of information literacy in New Zealand schools. The library provides access to its collections on site and by lending to other libraries through the interloans system. Some collections are available through the internet and on CD-ROM. The National Library Gallery, through a programme of exhibitions and public events, provides access to, and interpretation of, the heritage collections held by the Alexander Turnbull Library.
The library's website is www.natlib.govt.nz
Services available from the National Library include:
Collection services – The general collection includes serials, reference material, music, children's books, family history resources and the Māori reference collection. The family history area is a popular self-help section where people trace their family tree using books, CD-ROMs and microfiche information from both New Zealand and overseas. The general collection can be accessed on-line, through inter-library loan, or by visiting the library.
Te Puna – This is the web-based gateway to the library's on-line collections, catalogues and directories. All on-line collections, and many catalogues and directories, are available free. Te Puna's search, interloan and cataloguing services are specialist services aimed at New Zealand libraries and are available via subscription.
School services – This offers a range of services from 14 centres from Kerikeri to Invercargill, including strengthening school library services so that the school library/information centre can support teaching and learning more effectively. The curriculum information service offers teachers a wide range of curriculum-based resources for loan.
Services to Māori – Māori are acknowledged as a special group of users of the National Library because of their tangata whenua status in New Zealand. A services to Māori unit helps Māori gain optimum use of the library's resources and services. The library also has Māori district liaison librarians, who assist with Māori information needs by acting as a link between Māori and the library. The unit recently published Te Kaupapa Mahi Tahi – A Plan for Partnership, which supports the library's goal of developing an effective partnership with Māori.
Services to New Zealand publishers – Under the National Library Act 1965, publishers are required to deposit three copies (in some cases fewer) of every publication produced in New Zealand. The library has the responsibility to collect these publications and make them available to present and future generations. It lists these publications on the New Zealand National Bibliography, which is published monthly and is often used by potential buyers to order new titles. The library also issues publishers with international standard numbers, which give publications a unique identification that allows for easy location and ordering.
National Preservation Office: Te Tari Tohu Taonga – The National Library and National Archives established New Zealand's National Preservation Office, Te Tari Tohu Taonga in 1997. This provides a national advisory service, including training in preservation management and conservation assessments. The Preservation Officer, Māori offers advice to iwi, hapū or any other Māori organisation on preserving collections. This work includes organising workshops on how to care for paper-based collections and assisting with surveys. Māori organisations are also offered advice to help set up archives or libraries.
Print disabilities service – This service provides audio books (cassettes and CDs) to people with print disabilities who cannot independently obtain access to information in a print form. Users include those who are blind or vision impaired and are unable to read normal sized print, people with physical disabilities which limit their ability to hold or turn the pages of a book, and people with perceptual or other disabilities which limit their ability to follow a line of print or which affect their concentration. The service can be accessed through any local authority library, services for people with disabilities, school librarians or teachers with special needs responsibilities.
The Alexander Turnbull Library, part of the National Library of New Zealand, holds collections of books, photos, letters, drawings and prints, music, newspapers, maps and sound recordings that document the history of New Zealand and the Pacific. Other significant holdings are the major research collection on John Milton and his times, a selection of illuminated manuscripts, and New Zealand's largest collection of early printed books and fine printing. The library was started by Alexander Horsburgh Turnbull, a wealthy Wellington merchant who died in 1918 and bequeathed 55,000 volumes, as well as manuscripts, photographs, paintings and sketches collected during his lifetime, to the nation. The Turnbull collections can be accessed in person and some items are also available on the National Library's website. Some items, including microfilm copies of newspapers, manuscripts, and some oral history interviews, are available through inter-library lending. The collections are also regularly showcased through the National Library's exhibitions and events programme.
Oral History Centre. The many different voices of New Zealanders are recorded by the National Library of New Zealand's Oral History Centre. Interviewers use structured life history interviews to document people's experiences and to record those whose lives are relatively undocumented. The recordings provide valuable information about language, accent, inflection, emphasis and tone. The centre preserves and provides access to the oral history collection, as well as recording interviews for the library's oral history projects and carrying out commissioned projects for other organisations. The centre provides training workshops and information and advice to oral historians, and promotes professional, ethical and technical standards in recording and archiving, in conjunction with the National Oral History Association of New Zealand. The Oral Historian, Māori supports the recording of Māori oral history and provides training and support for iwi and other Māori projects. As part of one of its contemporary oral history projects, the centre conducts weekly or monthly interviews with people such as leading politicians or the long-term unemployed. The oral history collection consists of 16,000 cassettes, reel-to-reel tapes and videos comprising more than 7,000 recordings of interviews and events, accompanied by relevant documentation. The primary source of funding for oral history projects is the annual Awards in Oral History from the Australian Sesquicentennial Gift Trust, administered by the Department of Internal Affairs. Most interviews in the collection have been recorded since 1980 and include the life histories of 23 centenarians recorded in 1985, interviews with more than 80 veterans of World War I, the experiences of immigrant groups and ethnic minorities and interviews with winners of the Golden Shears shearing competition. Oral history complements other library collections such as the manuscripts and archives collection. For example, interviews with politicians or trade unionists can be considered alongside their personal papers. A reference service is provided for those who visit or write to the library. Researchers may listen to tapes and use accompanying written material in the library or request them by interloan through most other libraries.
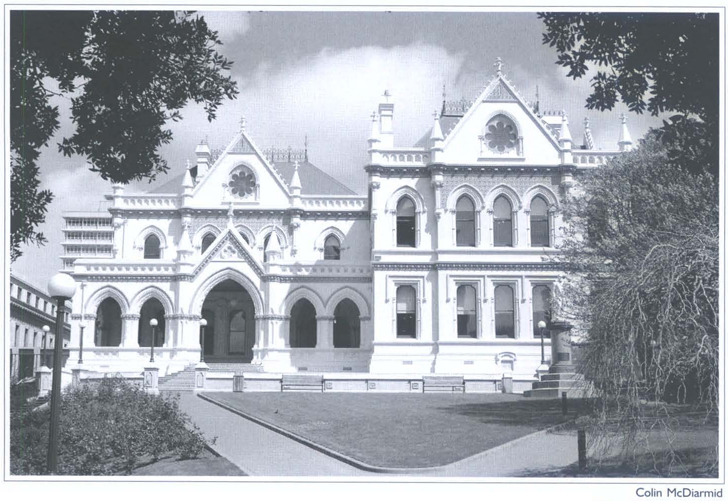
Wellington's Parliamentary Library, a striking example of 19th century Gothic architecture.
The Parliamentary Library provides information, research and reference services for parliament as required by the Parliamentary Service Commission. Library staff responded to more than 17,000 requests from Members of Parliament and their staff in the 2000/01 financial year. The library uses electronic resources to provide members with desktop access to information. The library's print collection of more than 500,000 volumes is strongest in economics, politics, public administration, law, social sciences and New Zealand serials and newspapers. International documents include government and parliamentary publications from a wide range of countries, with Australia, Canada, Japan, the United Kingdom and the United States particularly well covered. Publications from many intergovernment agencies such as the United Nations, the Organisation for Economic Cooperation and Development and the World Bank are also available. The international documents collection is available for public use. The Parliamentary Library building, which marked its centenary in 1999, is a striking example of 19th century Gothic architecture. Extensive refurbishment and earthquake strengthening took place from 1992 to 1996.
Founded in 1910 through the gift from Dr T M Hocken, Dunedin physician, bibliographer and collector, the Hocken Library contains major research collections of New Zealand, Pacific and early Australia. Administered in trust by the University of Otago for the people of New Zealand. the library includes substantial holdings of books, newspapers and periodicals (197,300); sound recordings (11,400); sheet music (1,800); videos (300); microforms (15,900); maps (10,000); photographs (1,010,700); posters (16,700); paintings (12,700), including modern works of art; and manuscripts, particularly of early missionaries and literary figures. The library's archives and manuscripts total 7,300 linear metres and are rich in Otago sources – business, local government, education, health, sport, community organisations, the churches and the University of Otago.
The library needs of the majority of New Zealanders are met through public libraries provided by local authorities. Since local authority amalgamation, most of the 74 cities and districts provide a coordinated library service to the whole district population. There is usually one central district or city library and a number of other service points. In 2001, there were 287 permanent service points within 84 library systems. In the year ended 30 June 2000, local authority libraries held a book stock of more than 12 million volumes and made more than 50 million issues.
Libraries in schools, tertiary institutions and government departments. There are 63 libraries in tertiary education institutions, including the eight university libraries, all of which have major collections, and there is provision for a library or library room in every school. New Zealand universities finance their libraries largely from government funding. They have developed research collections and all have on-line integrated library systems linked through the national electronic network, Tuianet. Developments in information technology, including easy access to the internet, have enabled much more intensive use of remote electronic databases and sourcing of material from external databases and collections. More than 300 specialist libraries and information centres serve government departments, businesses and other organisations. A cooperative inter-library lending system allows resource sharing among 250 libraries.
Postgraduate and undergraduate degree level education in library and information studies is available nationally. The Master of Library and Information Studies is offered on-campus and through distance learning by the School of Information Management at Victoria University of Wellington. More than 90 students enrol in the programme each year. The school also offers research degrees at masters and doctorate level in library and information studies and information and knowledge management. Two Diplomas in Information and Library Studies are offered at the undergraduate level by the Open Polytechnic of New Zealand, which, with additional coursework, may lead to a Bachelor of Applied Science in Information and Library Studies. Several hundred students are enrolled in the diploma courses.
The New Zealand Society of Authors (PEN NZ Inc) promotes improvement of the working conditions of New Zealand writers by raising their professional status and their fair treatment by others. The New Zealand PEN Centre, formed in 1934, was affiliated to PEN, an international organisation working on behalf of writers whose lives and freedoms are endangered. The name was changed in 1994 to one that more accurately reflected the society's trade union function, but New Zealand Society of Authors (NZSA) retains its international PEN connections, and contributes where it can to protect literary free speech.
NZSA has about 900 members, about 500 of whom (ordinary members) have published at least one book-length work (or its equivalent). The remaining 400 are associate members. They include most well-known New Zealand writers. Society membership is open to anyone interested in writers and writing.
As well as providing services to members, NZSA advocates for writers. New Zealand was one of the first English-speaking countries to set up a public lending right to compensate writers for royalties lost on books held in public libraries, and NZSA continues to monitor administration of the Authors’ Fund.
The society is represented on the New Zealand Book Council, the Robert Burns Fellowship selection committee, the Copyright Council, and Copyright Licensing Ltd, which distributes fees to authors and publishers for institutional photocopying of their work. NZSA is also represented on the committee of the Montana Book Awards, in which it sponsors three best first book awards.
A 1997 survey of members with work published within the previous two years revealed that across all types of books New Zealand writers could expect a return for their work of less than $10,000 a year.
Administered by Creative New Zealand, the New Zealand Authors’ Fund compensates authors for loss of earnings when their books are borrowed from public libraries.
Book marketing in the form of national promotions is undertaken by Booksellers New Zealand, an organisation representing booksellers and publishers. Booksellers New Zealand organises The Montana New Zealand Book Awards, Montana Poetry Day, The New Zealand Post Children's Book Festival and Awards and, in 2002, Book Day.
New Zealand's premier annual literary awards are the Montana New Zealand Book Awards and the New Zealand Post Children's Book Awards.
The Montana New Zealand Book Awards recognise excellence and provide recognition for the best books published annually in New Zealand. In 2001, the winner of the Deutz Medal for fiction was The Book of Fame, by Lloyd Jones. Winner of the Montana Medal for non-fiction was Wrestling with the Angel: A Life of Janet Frame, by Michael King. The winner of the New Zealand Society of Authors’ Hubert Church best first book of fiction award was Emerald Budgies, by Karen Hay, while the New Zealand Society of Authors’ Jessie MacKay best first book of poetry award was won by Animals Indoors, by Stephanie de Montalk. Winner of the New Zealand Society of Authors’ E H McCormick best first book of non-fiction award was Pukaki: A Comet Returns, by Paul Tapsell.
The New Zealand Post Children's Book Awards recognise the best in children's books. In 2001, Voyage with Jason, by Ken Catran, was the children's book of the year and was also the winner of the senior fiction category. The picture book category was won by Oliver in the Garden, by Margaret Beames and Sue Hitchcock. The junior fiction category was won by Shadrach Girl, by Joy Cowley. The non-fiction category was won by The Zoo: Meet the Locals by Colin Hogg.
The Book Publishers’ Association of New Zealand's annual book design awards (sponsored by Spectrum Print) recognise excellence in book design and aim to increase public awareness of the quality of New Zealand books.
A number of other book-related festivals and events are organised throughout New Zealand by independent groups. These include Māori Literature Week (Wellington), New Zealand Post Writers and Readers’ Week (Wellington), Going West (Auckland) and the Auckland Writers’ Festival. Also in 2001, the New Zealand Publishers’ Export Joint Action Group organised a New Zealand publishers’ stand at the annual Frankfurt Book Fair.
The National Library of New Zealand Te Puna Matauranga o Aotearoa recorded 4,030 titles published in New Zealand in the 2001 calendar year, including material from government departments and other agencies. The Book Publishers’ Association of New Zealand had about 60 registered members in 2001.
Notwithstanding the impact of new information technology on the sale or borrowing of books, school book spending increased by five percent in dollar terms from 1990 to 2000, even though spending per student decreased from $87.89 to $80.93. There was a trend away from the purchasing of reference books by schools to increased use of the internet, including support material for teachers.
The New Zealand Symphony Orchestra (NZSO) entered its 56th year in 2002. Numbering 95 players and supported by an administrative staff of 25, the NZSO is an orchestra of international standing that attracts prominent international artists and conductors. James Judd, director of the Florida Philharmonic, was appointed the orchestra's first Music Director in 1999 and is based in New Zealand for 12 weeks every year. Wilma Smith was appointed Concertmaster of the NZSO in 1993, the fifth concertmaster in the orchestra's history and the first woman appointed to the position. The NZSO is based in Wellington and performs regularly throughout New Zealand, travelling more than 50,000km each year, making it one of the world's most travelled orchestras.
The NZSO Chamber Orchestra was founded in 1987 and its players include leading members of the NZSO. It generally performs without a conductor and is directed from the first violin chair by Music Director Donald Armstrong.
Both the NZSO and NZSO Chamber Orchestra perform works from the major symphonic and chamber repertoire, playing around 90 concerts a year. The year 2001 saw an overall 30 percent increase in subscription numbers nationwide and ‘sold out’ signs around New Zealand for the Ludwig! A Feast of Beethoven series. As well as presenting a subscription series, the NZSO performs light music, family concerts, educational programmes and operas and ballets.
The NZSO's initiation of an education programme in 2000, the formation of audience development programmes, highly successful heartland concerts at non-subscription centres and a fresher, more ‘funky’ image have broadened its market appeal. The NZSO is also committed to commissioning, performing and recording works by New Zealand composers, introducing a composition competition in partnership with Concert FM named the Music 2000 Prize. In 2001, the NZSO commissioned New Zealand composer Edwin Carr, in recognition of his 75th birthday.
The NZSO has made five overseas visits, to Australia in 1974, to Hong Kong in 1980 and, in 1992, to Expo92 at Seville, where it won international praise for its New Zealand Day concert with Dame Kiri Te Kanawa and then Chief Conductor Franz-Paul Decker. In May 1997, the orchestra travelled to Australia and performed three concerts as part of the Brisbane Biennial International Music Festival. In September 2000, it performed at the Sydney Opera House, in a collaboration with performers from the Tainui iwi, as part of the Sydney Olympic Arts Festival.
The NZSO Foundation Charitable Trust was established in 1996 to aid the long-term funding needs of the orchestra. The foundation's endowment fund grows through contributions by individuals, corporations and associations interested in supporting the NZSO.
The NZSO National Youth Orchestra brings together about 100 young instrumental musicians each year for an intensive week of rehearsal, culminating in a public concert. In 2001, due to increased sponsorship, the youth orchestra was able to perform for the first time in Wellington and Auckland. Selected by nationwide auditions, the young players (aged from 13 to 23) receive coaching from NZSO principals, while gaining experience of professional symphony orchestra conditions. Many become NZSO and regional orchestra players. The youth orchestra is administered and funded by the NZSO.
The New Zealand Symphony Orchestra projects a modern image.
Chamber Music New Zealand is the major presenter of chamber music concerts in New Zealand. International and New Zealand artists perform in celebrity season concerts in nine centres, with additional concerts in 26 smaller cities and towns. There were more than 140 concerts and events in 2001. With more than 50 years’ experience, Chamber Music New Zealand has strong ties with artists’ managements and concert presenters worldwide. This offers the opportunity to tour the best of both established and emerging international ensembles. Chamber Music New Zealand has a strong commitment to the development of New Zealand musicians and composers.
In 1987, Chamber Music New Zealand established the New Zealand String Quartet, a professional full-time quartet which has developed an international reputation.
Chamber Music New Zealand has organised the National Secondary School Music Contest in both instrumental performance and composition categories for nearly 40 years. Many contestants have gone on to become New Zealand's finest musicians and enjoyed distinguished international careers. The 2001 contest attracted 443 group entries, representing 1,800 young musicians from throughout New Zealand.
Ticket sales are the major source of Chamber Music New Zealand's funding, with the rest coming from Creative New Zealand and sponsorship.
The New Zealand Choral Federation: Te Kotahitanga Manu Reo o Aotearoa (NZCF) has 389 community, chamber, youth, cathedral, church, school and children's choirs among its members. The NZCF, whose Māori name means ‘the assembly of the chorus of birds of New Zealand', promotes choral music in all its forms and aims to ensure that the experience of singing in a group is available to all New Zealanders. Its long-term goal is to develop a unique New Zealand ‘voice', a distinctive choral sound which amalgamates the singing traditions of Māori, Polynesian and western music.
Formed in 1985 and with 10 regional committees throughout New Zealand, the NZCF provides advisory and information services on all group singing matters, and is the link to the International Federation for Choral Music.
The NZCF's income is derived from membership fees, event management, sponsorship and Creative New Zealand.
The NZCF has developed a family of national events to promote group singing and to raise its profile. These showcase events encourage participation and promote excellence in group singing from an early age with The Kids Sing – Young Voices Choral Awards and The Big Sing – Secondary Schools Choral Festival. In 2001, 219 choirs from 125 schools entered the festival, which culminated in 20 schools being selected to attend the national final in Christchurch. The Classic Sing – Community Group Singing Awards were introduced in 2002.
The NZCF publishes Breve magazine quarterly, and books and videos on sight singing and choral direction.
The Royal New Zealand Ballet is one of New Zealand's largest performing arts organisations, comprising 32 permanent dancers and 22 staff in artistic support, production, marketing and management. Established in 1953, it is the oldest professional dance company in Australasia and one of only five ballet companies upon which the ‘Royal’ title has been bestowed by the British monarchy. With a strong classical base, but a healthy attitude towards innovation, the company regularly performs New Zealand ballets and master-works from the late 20th century, in addition to classics from the 19th and 20th centuries. The Royal New Zealand Ballet tours New Zealand more extensively and more frequently than any other major performing arts organisation and has the largest audience of any resident arts company – about 90,000 annually. The company receives 40 percent of its income directly from Ministry for Culture and Heritage funds and 60 percent from box office sales and sponsorship. International tours have taken the Royal New Zealand Ballet to the United States, Europe, Asia and Australia.
Dancers in the Royal New Zealand Ballet's production ofIhi FrENZy.
The New Zealand School of Dance trains about 55 students a year, offering two and three-year courses in dance performance. Students come mostly from New Zealand, but also from Australia and other countries. The school, founded in 1967, has a close relationship with the Royal New Zealand Ballet, with students often seconded by the company for performances. Each year the school offers its students the opportunity to work with a number of artists in residence. The school also offers a junior associate programme for aspiring young dancers. The New Zealand School of Dance is funded by the Ministry of Education, tuition fees and sponsorship. Annual fees are $3,000 plus GST.
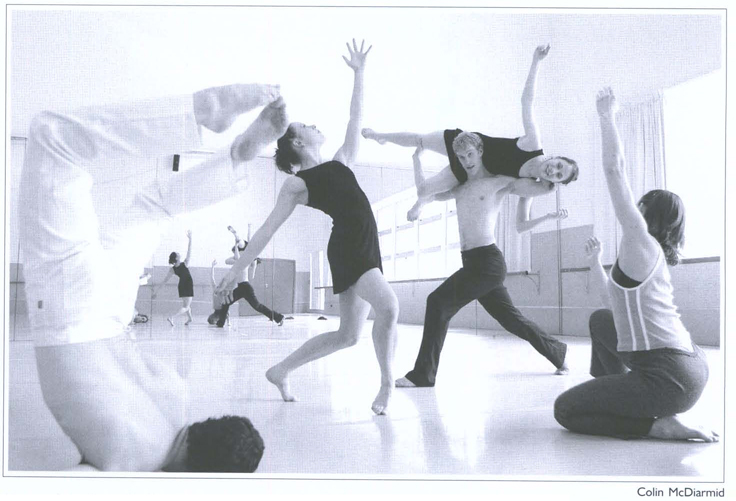
Expression through dance at the New Zealand School of Dance, Wellington.
The New Zealand Drama School: Te Kura Toi Whakaari O Aotearoa was established in 1970 by the Queen Elizabeth II Arts Council. More than 300 actors and technical production specialists have since graduated from the school. The school offers a three-year degree course in acting, a two-year diploma in technical production, a one-year advanced diploma in technical production and a two-year Master of Theatre Arts in Directing (MTA), offered jointly with Victoria University of Wellington. The school shows its commitment to the Treaty of Waitangi through the development of a multicultural environment. The school is funded by the Ministry of Education, tuition fees and sponsorship. Annual fees are $4,000 plus GST for acting and technical production, and $4,500 plus GST for the MTA.
The New Zealand Film Commission (NZFC) finances distinctly New Zealand films with the aims of reaching significant New Zealand audiences and producing high returns on investment, both in cultural and financial terms.
More than 140 feature films have been made in New Zealand since 1978 (see sidebar), more than 70 of these with NZFC finance.
The functions, powers and duties of the NZFC are defined in the New Zealand Film Commission Act 1978. The commission receives funding from central government and the Lottery Grants Board. The NZFC budget for the 2001/02 financial year was $12.9 million, of which 73 percent came from the Lottery Grants Board and 10 percent from the government. The budget varies from year to year according to public funding and returns on film investments. In the 2000/01 year, the commission spent $6.2 million on feature film production, to support nine feature films, and $1.1 million on feature film development, for a total of 53 projects. The commission's 2000/01 expenditure on short film production was $1.4 million, and it spent $1.3 million on marketing and sales. In the same financial year, the commission's sales agency grossed more than $4 million from sales of features and short films.
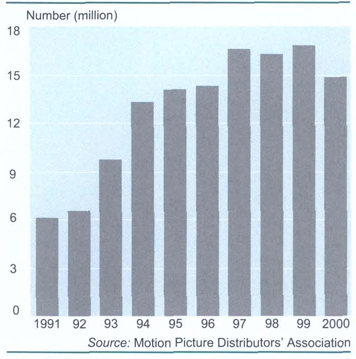
Figure 12.1 shows the number of cinema admissions in New Zealand from 1991 to 2000. Admissions have more than doubled from 6.1 million in 1991 to more than 14.8 million in 2000.
The New Zealand Film Archive: Ngā Kaitiaki O Ngā Taonga Whitiāhua was established in 1981 to acquire, preserve and make permanently available for research, study and public screening a national collection of film and television material of artistic, social and historic value. The film archive is a charitable trust, with a board of trustees selected to represent community, Māori, film and archival interests. Income is derived from central government, the Lottery Grants Board, the New Zealand Film Commission, NZ On Air, sponsorship and commercial activity.
The film and video collection comprises New Zealand and foreign films dating from 1895 to the present day, and includes documentaries, feature films, shorts, animation, newsreels, television programmes, advertisements and home movies.
Since 1997, the film archive has been contracted by NZ on Air as the official archive for New Zealand television production. The documentation collection comprises a variety of promotional, critical and historical material, including film reference books, periodicals, stills, posters, publicity, designs, unpublished scripts, special collections, clippings and production files, which are available for research.
As part of its acquisition programme, the film archive collected more than 7,000 New Zealand films during its Last Film Search project in New Zealand and Australia between 1992 and 1999. A video search started in 2001 aims to save recordings on historic video formats. Te Hokinga Mai O Ngā Taonga Whitiāhua is a film archive initiative facilitated in partnership with Te Papa's national services. The programme is designed to reconnect iwi with images housed at the archive, depicting their people, geography and events.
The film archive's public face is the Film Centre in Wellington, which offers exhibitions, archival television programmes and cinema screenings. Entry to the Film Centre is free.
The film archive website is www.nzfa.org.nz
The Films, Videos and Publications Classification Act 1993 combined censorship provisions for all types of publications into a single consistent regime. The act defines a ‘publication’ as:
Any film, book, sound recording, picture, newspaper, photograph, photographic negative, photographic plate or photographic slide.
Any print or writing.
Any print or other thing
(i) that has printed on it, or otherwise shown upon it, any word, statement, sign or representation
(ii) on which is recorded or stored any information that, by the use of computer or other electronic device, is capable of being reproduced or shown as any word, statement, sign or representation.
Film is further defined as including cinematographic film, video recordings and any other material record of visual moving images.
Administration. The Films, Videos and Publications Classification Act 1993 established the following bodies:
Office of Film and Literature Classification (the classification office) – A stand-alone Crown entity made up of a chief censor, a deputy chief censor, classification officers, an information unit and support staff. The classification office classifies publications likely to be restricted or objectionable. The chief censor and deputy chief censor are appointed by the governor-general on the recommendation of the Minister of Internal Affairs, with the concurrence of the Ministers of Justice and Women's Affairs.
The labelling body – An industry-based body responsible for rating unrestricted films and videos and issuing labels. It is guided by classifications assigned by Australian or British authorities. Ratings are consumer guides only and do not carry legal sanctions. If a film is likely to be restricted or objectionable, or if the body is having difficulty assigning a rating, the film must be referred to the classification office. The labelling function is carried out by the Film and Video Labelling Body Inc (the labelling body). Publications may be submitted for classification by the labelling body (on behalf of distributors), the Secretary for Internal Affairs, the chief executive of the New Zealand Customs Service, or by any other person with leave of the chief censor. The chief censor can also ‘call in’ publications where deemed necessary. Classifications assigned by the classification office are legally enforceable. Under the act, it is illegal to make an objectionable publication, or supply such a publication to any other person. The act also makes possession of objectionable publications illegal. This applies whether or not the publication has been classified by the classification office.
Film and Literature Board of Review – The board comprises members of the public appointed by the governor-general on the recommendation of the Minister of Internal Affairs, with the concurrence of the Ministers of Justice and Women's Affairs. The act provides for the original applicant, the owner, maker, publisher or authorised distributor, or any other person given leave by the Secretary for Internal Affairs, to submit a publication to the board for a review of its classification.
Classification. The Films, Videos and Publications Classification Act 1993 established a legal test which looks at whether the availability of a publication would be injurious to the public good. This test is applied to publications in order to ascertain whether restriction is required, and what level of restriction might be appropriate.
The Office of Film and Literature Classification can assign one of three classifications – unrestricted, restricted or objectionable. In general, publications classified by the office deal with matters such as sex, horror, crime, cruelty or violence and are restricted to people 16 years of age and over, or 18 years of age and over.
Following classification, films and videos are issued labels by the labelling body according to a ‘traffic light’ system. Films rated by the labelling body are issued with green labels for unrestricted films and yellow labels for unrestricted films recommended for a certain age or group. Red labels are issued for restricted material classified by the classification office.
Computer games requiring restriction are labelled in the same way as films.
Publications other than films are not required to be labelled before being supplied to the public. However, publications such as magazines and books can be submitted by distributors or publishers to the classification office for classification. The office will classify such material as unrestricted, restricted or objectionable. In addition, display conditions may be imposed and the publication may be required to be labelled.
Enforcement. The Censorship Compliance Unit of the Department of Internal Affairs enforces the Films, Videos and Publications Classification Act 1993. The unit's inspectors of publications ensure publications considered to be objectionable in terms of the act are not made available to the public. Police are also inspectors of publications under the act, with the same powers as inspectors employed by the unit. The New Zealand Customs Service is responsible for ensuring that material imported into New Zealand complies with the law. Material seized by customs may be referred to the Office of Film and Literature Classification. The office's website is www.censorship.govt.nz
Copyright in New Zealand is based on the Copyright Act 1994, administered by the Ministry of Economic Development. Copyright law is complex and only the essential aspects are discussed here. Copyright protection in New Zealand comes into existence automatically on the completion of any original literary, dramatic, musical and artistic work (including photographs), sound recording, film, broadcast, cable programme and published edition. Computer programs gain copyright protection under the definition ‘literary work'. No registration is necessary (or even possible), nor is any other formality required for securing copyright protection.
Duration of copyright. For literary, dramatic, musical and artistic works (including photographs), copyright continues for 50 years after the end of the calendar year in which the author dies. For sound recordings and films, copyright generally continues for 50 years from the end of the calendar year in which they were made or made available (whichever is later). For broadcasts and cable programmes, copyright continues for 50 years from the end of the calendar year in which they were made (broadcasts), or included in a cable programme service (cable programmes). Copyright in published editions is for 25 years from the end of the calendar year in which they were first published.
Ownership of copyright. The first owner of copyright is usually the author or maker. However, if this person was employed and made the work in the course of employment, then the employer is usually the first owner. If the author or maker of some kinds of work (such as sound recordings, films, photographs and computer programs) was commissioned to make that work, the first owner is usually the person who commissioned the work. For works commissioned or made by an employee, the parties can agree to vary the usual first ownership rule. Copyright can be assigned in writing to another person.
Moral rights. The author of literary, dramatic, musical or artistic work, or the director of a film, has the right to be identified as the author or director, provided this is asserted in accordance with the Copyright Act 1994. Authors and directors also have the right to object to certain treatments of their work which are derogatory (prejudicial to their honour or reputation), and the right not to have a work falsely attributed to them as an author or director. These rights cannot be assigned.
Exclusive rights of copyright owners. The owner of the copyright for a work has the exclusive right to do, and authorise others to do, a number of ‘restricted acts’ in relation to the work or an adaptation of that work in New Zealand. These include rights to make copies; issue copies to the public, including the rental of films and sound recordings; perform, play or show the work in public; broadcast the work or include the work in a cable programme service; and make an adaptation of the work. Copyright infringement occurs when a person undertakes a restricted act without the permission of, or a licence from, the copyright owner.
Performers’ rights. Performers have rights to control the recording, reproduction or live broadcast, or inclusion live in a cable programme, of certain performances.
Enforcement of copyright. Action for copyright infringement in New Zealand is generally by way of civil action by the copyright owner. Remedies from civil action include damages, injunctions, or an order for delivery up. Criminal offences apply to certain commercial activities concerning infringing copies and can result in fines up to $150,000, or three months imprisonment.
Copyright Tribunal. The role of the Copyright Tribunal is to resolve disputes regarding licences or proposed licences for the copying, performing or broadcasting of copyright works.
Protection overseas. Copyright protection given in New Zealand generally also extends to works originating from countries party to the Berne Convention for the Protection of Literary and Artistic Works, the Universal Copyright Convention, and the World Trade Organisation (WTO) Agreement. New Zealand is party to all three agreements. Conversely, countries party to either convention or the WTO agreement must give works originating from New Zealand the same protection they give works produced by their nationals.
The Ministry for Culture and Heritage assists the government in provision and management of cultural resources for the benefit of all New Zealanders, and provides advice and undertakes activities that support and promote the history and heritage of New Zealand. The ministry is responsible to the Minister for Arts, Culture and Heritage and also provides advice and services to the Minister of Broadcasting and the Minister for Sport, Fitness and Leisure.
The work of the ministry in the 2001/02 financial year was budgeted to cost $5.443 million. Of this, $4.943 million was made available through Vote: Arts, Culture and Heritage and $500,000 was contributed by third parties (eg from the writing of commissioned histories).
The ministry is responsible for:
Provision of policy advice and services on arts, culture, heritage and broadcasting issues.
Management and disbursement of payments to arts, culture, heritage, sport and broadcasting sector organisations and monitoring of the Crown's interests in these organisations.
Research, writing and publishing New Zealand history and providing advice about New Zealand history.
Management of national monuments, war and historic graves, and administration of the Antiquities Act 1975.
Administration of legislation relating to the symbols and emblems of New Zealand sovereignty, including the New Zealand flag, the national anthems and the New Zealand Coat of Arms.
Administration of the regional museums policy for capital construction projects and the government's indemnity to museums policy.
The ministry administers government funding to a number of statutory bodies in the cultural sector and manages the Crown's relationship with them. These organisations are: Creative New Zealand, New Zealand Film Commission, New Zealand Historic Places Trust, New Zealand Symphony Orchestra and the Museum of New Zealand Te Papa Tongarewa, which are responsible to the Minister for Arts, Culture and Heritage. They also include the Broadcasting Standards Authority, NZ On Air, Radio New Zealand International and the National Pacific Radio Trust, which are responsible to the Minister of Broadcasting, and Sport and Recreation New Zealand and the New Zealand Sports Drug Agency, which are responsible to the Minister for Sport, Fitness and Leisure.
The ministry also manages the Crown's relationship with the following cultural agencies, which receive ongoing government funding in return for the provision of services, but which have not been established by statute and are not owned by the Crown: Aotearoa Traditional Māori Performing Arts Society, the New Zealand Film Archive and the Royal New Zealand Ballet.
The ministry maintains a monitoring role with regard to three organisations that received one-off funding in the cultural recovery package of May 2000. These organisations are the New Zealand Music Industry Commission, which received funding to develop the popular music industry; the Edwin Fox Society, which received funding to undertake conservation work on the Edwin Fox in Picton; and the Christchurch Art Gallery, which received a contribution towards the cost of its new building. The ministry is also monitoring the work of the Antarctic Heritage Trust, which is receiving funding to undertake conservation work and planning for key historic sites in the Ross Dependency.
The ministry manages, or assists in the management of, the Crown's relationship with other organisations in which it has an interest. These include the National War Memorial Advisory Council, which advises the Minister for Arts, Culture and Heritage on all matters pertaining to the memorial; Te Māori Manaaki Taonga Trust, which supports the training of Māori in the care and display of taonga Māori, using funds from the Te Māori exhibition of the 1980s; the Pūkaki Trust, established by the government in 2001 to ensure the care of this important taonga; and the Advertising Standards Authority.
Table 12.1 shows government and Lottery Grants Board funding to the arts and cultural sector for the 2000/01 financial year.
Table 12.1. Funding to the arts and cultural heritage sector, 2000–01
| Group | Government funding1 | Lottery grant2 |
|---|---|---|
1Vole: Arts, Culture and Heritage: Archives New Zealand: and National Library. Includes GST. 2Lottery Board grants exclude GST. 3Funding for the nine months ended 30 June 2001. 4This was project funding, not an annual grant. Sources; Ministry for Culture and Heritage; Lottery Grants Board; Historic Places Trust; National Library; Archives New Zealand | ||
| $(000) | ||
| Te Papa | 20,006 | 1,250 |
| Te Papa capital contribution | 9,000 | n/a |
| Creative New Zealand | 2,687 | 20,410 |
| New Zealand Film Commission | 1,375 | 8,801 |
| New Zealand Film Archive | 200 | 650 |
| New Zealand Historic Places Trust | 4,484 | 4434 |
| Lottery community facilities (II: Cultural facilities) | n/a | 410 |
| Lottery environment and heritage (III: Cultural heritage) | n/a | 4,862 |
| New Zealand Symphony Orchestra | 11,390 | n/a |
| Ministry for Culture and Heritage | 5,972 | n/a |
| National Library | 48,183 | n/a |
| Archives New Zealand | 10,2843 | n/a |
| Aotearoa Traditional Māori Performing Arts Society | 1,103 | n/a |
| Royal New Zealand Ballet | 3,195 | n/a |
| New Zealand On Air | 91,121 | n/a |
Creative New Zealand is the main arts development organisation in New Zealand, established as a crown entity under the Arts Council of New Zealand Toi Aotearoa Act 1994. Its governing body is the Arts Council, and its two decision-making bodies are the Arts Board and Te Waka Toi. Members are appointed by the Minister for Arts, Culture and Heritage. Staff work in offices in Wellington, Christchurch and Auckland. It also has a Pacific Arts Committee.
Creative New Zealand's mission is ‘to encourage, promote and support the arts in New Zealand for the benefit of all New Zealanders'. It does this by advocating for the arts, undertaking initiatives and developing partnerships, allocating grants to artists and arts organisations, and carrying out research.
Most of Creative New Zealand's money comes from the New Zealand Lottery Grants Board, with the remainder from the government through Vote: Arts, Culture and Heritage.
In May 2000, Creative New Zealand also received a one-off lump sum of $20 million, to be spread over three years, as part of the government's cultural recovery package. With this additional lump sum, the organisation has developed three strategies: Future Strengths, which aims to strengthen the professional arts infrastructure; Seriously Māori, which addresses recognition (developing a Māori-made mark), development (iwi arts management plans) and promotion (profiling Māori arts and culture to New Zealanders); and Regional Strengths, developed in response to an identified need for arts initiatives spanning local authority boundaries.
Advocacy. A major focus of Creative New Zealand's work is promoting the role and value of the arts to society. One of the ways it does this is by working with other organisations, acting as a catalyst and providing quality information about the arts. In particular, it has become closely involved in recent times in cultural tourism, cultural diplomacy and arts employment.
Much of Creative New Zealand's recent work on cultural tourism has centred on development of the New Zealand Tourism Strategy 2010, ensuring the voice of the creative sector was heard. Published in September 2001, the strategy includes ‘celebrate our culture’ as part of its mission statement for tourism in New Zealand.
Creative New Zealand is an active member of the cultural diplomacy coordinating group, jointly hosted by the Ministry for Culture and Heritage and the Ministry of Foreign Affairs and Trade. To support the group's work, Creative New Zealand compiles, updates and distributes a list of New Zealand artists and arts events that are travelling internationally. The list is particularly useful to New Zealand's diplomatic posts and the media.
Creative New Zealand continues to support the work of the Auckland and Dunedin arts employment projects. In Auckland, the Arts Work Project is committed to delivering online tools (eg the Arts Work Navigator bulletin) and practical services to help individuals develop their careers in the creative industries. In Dunedin, the Higher Trust works with government employment agencies and others to improve employment prospects of arts practitioners in the region. This work in Auckland and Dunedin informed the government's national arts employment initiative called Pathways to Arts and Cultural Employment (PACE).
Creative New Zealand's website is www.creativenz.govt.nz
Arts development. As the country's main arts development organisation, Creative New Zealand allocates grants to projects spanning all artforms. It also offers residencies and scholarships, and develops partnerships and initiatives.
There are two project funding rounds each year. In 2000/01, Creative New Zealand offered project grants totalling $6.73 million to 580 artists and arts organisations. For example, a grant to the University of Iowa supported a New Zealand writer's participation in its three-month writing programme. Another grant supported a national tour of Bruce Mason's play The End of the Golden Weather.
Creative New Zealand's support for the creation of new work encourages risk and innovation, essential for developing the arts of New Zealand. For example, contemporary Māori weaver Christina Wirihana and Mudra Dance Company received grants to create new work, while the Bishop Suter Gallery in Nelson received funding to commission Christine Boswijk to create a new body of work, which was subsequently exhibited at the gallery in July 2001.
Creative New Zealand also funds 38 professional arts organisations on an annual or three-year basis. These organisations include the New Zealand String Quartet; Toi Māori Aotearoa; several national advocacy and service organisations such as Dance Aotearoa New Zealand; regional theatre companies and orchestras; galleries and opera companies.
Creative New Zealand's international residency programme includes residencies for visual artists and craft artists in Germany, New York and Australia. In 2000, it established the nine-month Creative New Zealand Berlin Writer's Residency, and in 2001 the three-month Cook Islands Artist's Residency for visual artists was established.
Research. Creative New Zealand carries out research to inform its strategic planning and policy development, to support its advocacy work and to provide information of value to the wider arts sector.
Findings from a major survey about New Zealanders’ participation in the arts, conducted by Creative New Zealand and published in Arts Every Day in 1999, showed the arts were an integral part of New Zealanders’ daily lives. Building on these initial findings, Creative New Zealand published two further reports in August 2000: Know Your Audience and A Survey of Māori Arts Participation.
In 1999, more than 1,000 professional practising artists across a range of artforms were interviewed for a survey exploring the working life and career path of being an artist in New Zealand. Findings from the survey were expected to be available in late 2002.
Creative Communities Scheme. Creative New Zealand enjoys a successful partnership with the local government sector. The Creative Communities Scheme is a partnership between Creative New Zealand and the country's 74 local authorities, which supports the arts at a community level. Local decision making is a key to the scheme, which distributed $2.7 million to community arts in 2000/01.
12.1 Statistics New Zealand; Ministry for Culture and Heritage; Creative New Zealand.
12.2 Museum of New Zealand Te Papa Tongarewa; Statistics New Zealand; New Zealand Historic Places Trust; Archives New Zealand; New Zealand Cartoon Archive.
12.3 National Library of New Zealand; Parliamentary Library; Hocken Library; New Zealand Library and Information Association of New Zealand; Victoria University of Wellington.
12.4 New Zealand Society of Authors; Creative New Zealand; Booksellers New Zealand, Book Publishers’ Association of New Zealand.
12.5 New Zealand Symphony Orchestra; Royal New Zealand Ballet; Chamber Music New Zealand; New Zealand School of Dance; New Zealand Choral Federation, New Zealand Drama School.
12.6 New Zealand Film Archive; New Zealand Film Commission, Motion Picture Distributors Association.
12.7 Office of Film and Literature Classification.
12.8 Ministry of Economic Development.
12.9 Ministry for Culture and Heritage; Creative New Zealand; Lottery Grants Board; New Zealand Historic Places Trust; National Library of New Zealand; Archives New Zealand.
Statistics New Zealand divisional manager responsible: Denise Brown.
Annual Report (annual). Archives New Zealand, Wellington.
The Regional Museums Policy for Capital Construction Projects (2001). Ministry for Culture and Heritage, Wellington (available on-line).
Report of the Board of Trustees, Museum of New Zealand Te Papa Tongarewa (Parl paper G.12).
Report of the New Zealand Historic Places Trust (Parl paper C.18).
Annual Report (annual). New Zealand Film Archive, Wellington.
Martin H and Edwards S (1997). New Zealand Film 1912–1996, Oxford University Press, Auckland.
Report of the New Zealand Film Commission (Parl paper G.19).
Annual Report (annual). Hocken Library, Dunedin.
Report of the National Library of New Zealand (Parl paper G.13).
Report of the Trustees of the National Library of New Zealand (Parl paper G.52).
Government Spending on Culture 1990–1999 (2000). Statistics New Zealand and Ministry for Culture and Heritage, Wellington.
Report of the Arts Council of New Zealand Toi Aotearoa (Parl paper G.11).
Report of the Department of Internal Affairs (Parl paper G.7).
Report of the Ministry for Culture and Heritage (Parl paper G.10).
Report of the New Zealand Lottery Grants Board (Parl paper G.7b).
www.archives.govt.nz – Archives New Zealand
www.chambermusic.co.nz – Chamber Music New Zealand
www.copyright.co.nz – Copyright Licensing Ltd
www.creativenz.govt.nz – Creative New Zealand
www.dia.govt.nz – Department of Internal Affairs
www.otago.ac.nz – Hocken Library
www.iponz..govt.nz – Intellectual Property Office of New Zealand
www.dia.govt.nz – Lottery Grants Board
www.mch.govt.nz – Ministry for Culture and Heritage
www.med.govt.nz – Ministry of Economic Development
www.tepapa.govt.nz – Museum of New Zealand Te Papa Tongarewa
www.natlib.govt.nz – National Library of New Zealand
www.nzfa.org.nz – New Zealand Film Archive
www.nzfilm.co.nz – New Zealand Film Commission
www.historic.org.nz – New Zealand Historic Places Trust
www.tewhaea.org.nz – New Zealand School of Dance
www.nzso.co.nz – New Zealand Symphony Orchestra
www.censorship.govt.nz – Office of Film and Literature Classification
www.oktobor.com – Oktobor
www.nzballet.org.nz – Royal New Zealand Ballet
www.soundarchives.co.nz – Sound Archives/Ngā Taonga Kōrero
www.stats.govt.nz – Statistics New Zealand
www.vuw.ac.nz – Victoria University of Wellington
Table of Contents
Snow sports attract many overseas ski enthusiasts to New Zealand.
Sport, fitness and leisure have played an important part in creating and shaping New Zealand's national image, both at home and abroad, and contribute much to the lifestyle New Zealanders enjoy. There is the potential in New Zealand for everyone to participate in some form of sport or leisure activity, and it is government policy to promote access to it for all New Zealanders.
Sport has been an important focus for cultural identity and New Zealand is widely known for the calibre of many of its international sportspeople.
Outdoor recreation is popular with New Zealanders, who enjoy a relatively pristine environment, rich in scenic beauty. In 1997, the Hillary Commission launched KiwiWalks to encourage New Zealanders to make use of their natural surroundings. Most local councils joined the scheme in its first four years and more than 350 KiwiWalks were launched around waterfronts, gardens, heritage sights and city vistas. They are identifiable by wooden plaques featuring the KiwiWalks logo. KiwiWalks are safe and fun, take no more than an hour and do not require any special gear. Locations of KiwiWalks are available from Sport and Recreation New Zealand
The government elected in 1999 brought with it a policy to review the sport and recreation sector. A ministerial taskforce empanelled in mid-2000 was asked to identify ways to encourage and sustain the interest, participation and achievement of New Zealanders in sport and physical recreation, and to review the organisational structure and dynamics of the sector.
The taskforce found that while sport and recreation could offer improvements in health, economic gains and other intangible benefits, general participation by New Zealanders was too low. Structurally, the taskforce found the sector to be fragmented and lacking common vision and coordination.
The taskforce recommended a new Crown agency to integrate the functions of the Hillary Commission, the New Zealand Sports Foundation and the sports policy arm of the Office of Tourism and Sport. The Hillary Commission, established in 1987, had supported young people's sport, encouraged physical recreation for the general population, and funded local clubs, regional trusts and national codes. The Sports Foundation, funded by the government and corporate sponsors, had supported New Zealanders at world championships and Commonwealth and Olympic Games for 22 years.
The minister introduced legislation to effect this structural change in May 2001. Shortly afterwards, the 2001 Budget announced funding for the sport sector of nearly $100 million over five years. The minister also appointed a new Hillary Commission board, which became the first board of the new organisation established in 2002, Sport and Recreation New Zealand.
The new organisation has three operating divisions covering high performance sport (including the national office of the New Zealand Academy of Sport established in 2000), sport development and physical recreation. As well as funding sports programmes and physical recreation, Sport and Recreation New Zealand has a public policy and research role. It also gives effect to government policy aimed at promoting a healthier and more active nation. With a staff of around 45, the agency works to ensure all New Zealanders recognise the value of, and have access to, an active lifestyle that will lead to a healthier and more socially cohesive nation.
High performance. A partnership was forged between the Hillary Commission and the New Zealand Sports Foundation in 1996, providing assistance to top athletes and coaches. In 2000/01, the commission invested $8 million in its contract with the foundation. To this the foundation added $1.87 million raised from the corporate sector. The funds were used as grants to elite coaches and athletes for international competition, as well as providing sports science and medical services, coaching academies and elite development.
The Push Play programme encourages New Zealanders to build exercise into their daily lives.
Junior sport. A strategic goal of the former Hillary Commission was to ensure that all young New Zealanders had access to healthy, active lifestyles. Commission surveys showed that at the end of a decade of commission activities, nearly three-quarters of people aged 5 to 17 were involved in sport and active leisure at school, around one-third played sport as part of a club, and about two-thirds participated with family and/or friends. Figure 13.1 shows the percentage of young people aged 5 to 17 years who had participated in sport or active leisure activities in the previous four weeks, averaged from a number of monthly surveys between 1997 and 2000.
The commission delivered sport to young people through schools and by supporting club-based activities. Most primary and intermediate schools participate in the KiwiSport programme, which introduces young children to sport. It gives children the chance to try different sports and physical activities and to have fun while learning skills, playing fair and experiencing success.
KiwiSport also encourages children to exercise daily and to explore the outdoors. More than 29,000 teachers, parents, community coaches and senior students attended KiwiSport training programmes in the 2000/01 financial year.
The Sportfit programme at secondary school level aims to keep teenagers interested and active in sport. Hillary Commission research showed some young people, such as 16 and 17-year-old girls, tended to drop out of sport. Sportfit aims to meet the needs of these young people and offers them exciting and rewarding reasons to stay in sport. The research showed young people were more likely to enjoy active lives once they left school if they had been well coached and had a positive experience of sport in school. Under the Sportfit programme, 28,000 sport leaders were trained in 2000/01, bringing the total to 121,000 since 1997.
The Hillary Commission also worked to promote links between schools and sports clubs. School sports programmes often lack coaches and management, while many clubs do not have the facilities owned by schools. By resource sharing, clubs can enjoy use of school facilities while benefiting from new members. Young people benefit from coaching and being in a setting in which they can ‘play on’ after they leave school.
Green Prescriptions. Approximately one-third of New Zealanders are not physically active in their leisure time. To overcome this public health issue, the Hillary Commission developed the Green Prescriptions programme, which encourages general practitioners (GPs) to prescribe exercise to those of their patients who would benefit from it. Launched in May 1997, Green Prescriptions, in conjunction with health agencies, has been implemented nationally. Fifty percent of GPs now write Green Prescriptions and more than 4,800 prescriptions are written each month. Eight Green Prescription area managers work with the 40 independent practitioners’ associations involved, helping GPs and practice nurses prescribe activity.
He Oranga Poutama. He Oranga Poutama is a Hillary Commission strategy to develop the potential of Māori in sport, as players, coaches, umpires and administrators. The programme forges links with local iwi and acknowledges and supports initiatives that are special to Māori. Sport and active leisure is now thriving on 200 marae throughout New Zealand.
Figure 13.1. Sport and active leisure participation of 5 to 17-year-olds
Annual participation 1997–2000
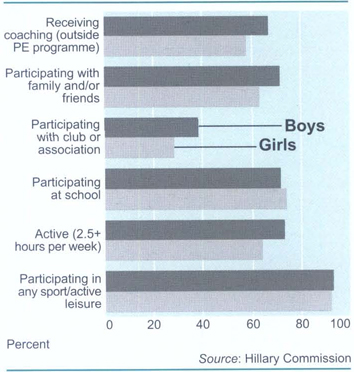
Sport development. The Hillary Commission-developed sport development programme provides coaches and training opportunities for officials and volunteers at all levels of sports club administration. The programme provides advice on funding and encourages efficiency and success throughout sporting organisations.
Coaching. Coaching is vital to the development of any athlete and the former Hillary Commission was committed to supporting and developing New Zealand's coaches at the national, regional and local level. Most clubs find it hard to attract and keep coaches and to address this problem the commission provided funds and information through its ‘Coaches Count’ programme. Under the programme, Coaching New Zealand is contracted to provide regional and local coaching courses. The programme focuses on the need for adults to become involved in coaching junior sport, and also reaches coaches who are interested in becoming involved at other levels. One in five New Zealand adults are involved with sports clubs as coaches, officials and/or administrators. Some take on more than one role. Eleven percent of adults are coaches or instructors, nine percent are referees or officials and eight percent are sports administrators.
Support for international events. Hosting international sporting events in New Zealand has long been the best way to expose athletes and officials to top competition. The Hillary Commission funded national bodies to bid for and, if successful, conduct such events in New Zealand. This helps build international competitiveness, while at the same time strengthening the local sports scene. Recent world class events held in New Zealand include the Rally of New Zealand, the women's cricket World Cup, the youth touch World Cup, Supergames and the Inter Pacific Pony Club Challenge.
No Exceptions. No Exceptions is New Zealand's national sports policy for people with disabilities. Following a successful pilot in Sport Bay of Plenty, the former Hillary Commission and strategic partner the Halberg Trust developed a network of 13 sports opportunity officers. They work with regional sports trusts and the community to advance implementation of No Exceptions. The programme emphasises integrating people with a disability into community-based sport, addressing access opportunities and barriers to inclusion, and providing an on-ramp to the sporting pathway.
SportsMark. The quality of a sporting experience often determines whether people remain attached to the sport, either as players, officials or spectators. The SportsMark standard, introduced to national governing bodies in 1998, measures the quality of service by sport and leisure providers who must meet demanding criteria to qualify for use of SportsMark. SportsMark is also available to regional sports trusts and schools.
Other central government bodies. A wide range of government departments, corporations and statutory bodies are involved in recreation. The Department of Conservation, for example, is a principal outdoor recreation land manager, while the Department of Internal Affairs administers a number of programmes to help local authorities and community organisations provide for the recreational needs of young people.
Local government. The provision of sport and leisure facilities such as libraries, community centres, parks and playing fields has long been an accepted part of the responsibilities of local and regional authorities. The former Hillary Commission operated the community sport fund, which distributed $4.72 million to communities in the year ended June 2001. Sports clubs or organisations apply to their local councils, who administer the scheme. The fund supported more than 5,100 projects in 2000/01. As well as administering the scheme and training their staff in its operation, local authorities often contribute their own funding. A minimum grant of $21,000 is guaranteed to smaller district councils so as to not disadvantage rural clubs, which often face additional costs due to their isolation. The Hillary Commission offered technical advice, information and recognition to help local authorities plan and deliver services. This included strategic planning development, policy and advocacy advice, and resources and expert opinion on the design and management of sport and active-living facilities and services.
Local authorities may apply to the community facilities fund administered by the Department of Internal Affairs for funding of major sports and recreation facilities. Creative New Zealand's creative communities scheme is devolved to local authorities for distribution through representative local assessment committees to support arts participation for the benefit of the district or city. The funding has a base grant per district/city and a per capita allocation given in two instalments each year.
Sport. For many New Zealanders, the successful New Zealand sportsman or woman represents the archetype of the battler succeeding against the odds. International sporting events in which New Zealand features have the power to arouse intense nationalistic fervour. New Zealanders have fared exceptionally well in the international arena despite the country's distance from the world's major venues and, until the early 1970s, a comparative lack of state or corporate funding.
Various reasons have been advanced for New Zealand's success. A small population may have helped produce an affinity between the national hero and the weekend athlete, and, while a generally temperate climate has made it possible for athletes to train year round, there is sufficient variety of terrain and climate to foster a wide range of summer and winter pursuits.
Traditionally, New Zealanders have excelled in rugby union, which has been regarded as the national sport, and, from time to time, in track and field athletics. However, Sir Edmund Hillary, who with Sherpa Tensing Norgay in 1953 was the first to climb Mt Everest, probably remains New Zealand's best internationally known sportsman.
In more recent years, New Zealanders have had international success in rowing, rugby league, netball, squash, softball, cricket, yachting, cycling and other disciplines.
Recent research confirms the value of sport to the New Zealand economy:
Sport and leisure is a $5 million-a-day business.
In 2001, sport and recreation supported 17,090 full-time equivalent jobs.
Sport and leisure benefits from more than $500 million worth of free volunteer effort every year.
The economy also benefits from major sporting events. The America's Cup defence in 1999/2000 generated $640 million of value added to the New Zealand economy.
In May 2001, the government announced a plan to increase funding for sports, fitness and leisure by almost $100 million over the following five years, acknowledging the health and economic benefits that strength in this area can bring to New Zealand.
Figures 13.2 and 13.3 show the 10 most popular sports by participation for New Zealand women and men, averaged from a number of monthly surveys between 1997 and 2000. The participation rate is the percentage of those surveyed who recorded any participation in the sport in the previous 12 months.
New Zealand Academy of Sport. The New Zealand Academy of Sport was established in July 2000 by the New Zealand Sports Foundation. Establishment of the academy was initiated by a substantial review of high performance development programmes in Australia, the United Kingdom, Ireland, Scandinavia and Canada aimed at identifying key elements of a successful programme. The review recommended establishment of a decentralised network of high performance centres to provide support services to New Zealand's elite athletes and coaches. The academy was established based on three high performance centres in Auckland, Wellington and Dunedin.
The academy provides high performance athletes, national organisations and coaches with a national network delivering an holistic programme of support services and facilities.
Athletes have access to a variety of generic facilities including training halls, running tracks and gymnasium facilities. Coaches have access to resource centres with research, analysis and presentation equipment. The academy also conducts workshops and seminars on the use of this equipment and also on developments in sport and coaching.
Sports science services include nutritional advice, fitness testing, mental skills training, biomechanical analysis, physiological monitoring, strength and conditioning, and body composition assessment. Sports medicine services include medical and physical screening, sports vision, podiatry, physiotherapy, injury prevention programmes and diagnosis.
Adventure tourism: abseiling in the Queenstown region.
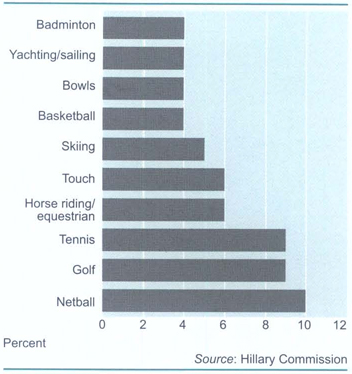
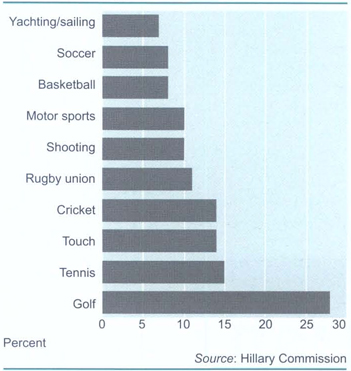
Trained career and education advisors coordinate career, education and professional development advice to assist athletes to better manage their personal, study and sporting commitments and prepare them for life after sport. Athletes and coaches are able to access career training, professional development and education scholarships through this programme.
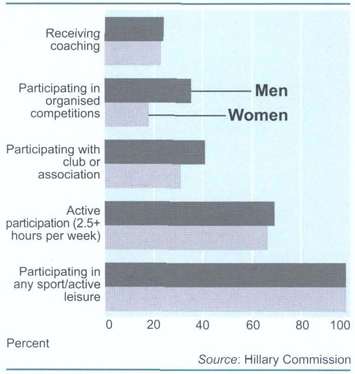
Specific services provided by the academy have been determined by an agreement between the national sport organisation and the New Zealand Sports Foundation, which has acted as the national office of the academy. These agreements are sport specific and are integrated into the individual sport's high performance plan. To access services, athletes are recognised at one of four levels –world, international, developmental and junior. Athletes receive a card, which recognises them as being an athlete at one of these levels and which entitles them to access services from the academy in accordance with their sport's service agreement. In 2001, there were 1,100 carded athletes in New Zealand representing 27 sports.
The academy programme is funded through a special purpose trust set up by the government in 2000 for the development of high performance sport over four years. A separate Prime Minister's Scholarship fund provides athletes with a scholarship for tuition fees and living expenses. The fund provided $1 million in 2001, which increases to $3 million in 2002 and $5 million in 2003. The Prime Minister's Scholarship fund also provided $1 million for professional development for coaches in 2002.
A snowboarder perfects his jump at the Mt Hutt ski area.
Push Play. An estimated 900,000 New Zealanders are ‘couch potatoes’ and do not lead an active lifestyle, but most would like to. The active-living team at the former Hillary Commission promoted the Push Play campaign to teach New Zealanders how to build exercise into their daily lives. Research suggests that being active leads to improved quality of life and the active-living programme provides New Zealanders with access to a wide range of sporting facilities and activities. Figure 13.4 shows the percentage of adults who had participated in sport or active leisure activities in the previous four weeks, averaged from a number of monthly surveys between 1997 and 2000. Active participation is considered to be half an hour a day or at least 2.5 hours a week.
Fishing. A wide variety of fish abound in bays and harbours around New Zealand's coast. Rainbow and brown trout are found in lakes and rivers of the North Island and in South Island lakes. The South Island also has sea-run brown trout in western coast rivers, sea-run quinnat salmon in eastern coast rivers and land-locked salmon. Average sizes of trout vary from district to district depending on environment, climate, food and the number of anglers. With the exception of the Lake Taupo fishery, which is managed by the Department of Conservation, trout and salmon fisheries are managed by Fish and Game New Zealand, established in 1990 to manage sportsfish and gamebirds and which replaced acclimatisation societies. Fish and Game New Zealand's website is www.fishandgame.org.nz
Big-game fishing. The warm waters off the east coast of the North Island provide some of the best surf, line and spear fishing in the world. The main bases for line fishing from charter boats are at Whangaroa, Bay of Islands (Russell, Otehei Bay and Waitangi), Tutukaka, Mercury Bay (Whitianga) and Tauranga (Mayor Island). The most prized catches are broadbill, black marlin, striped marlin and blue marlin, while other types of big-game fish found in New Zealand waters are tiger shark, hammerhead shark, mako shark, thresher shark, kingfish (yellow tail) and tuna. Best catches are usually made in February, but fishing is good from December to April.
Shooting and hunting. New Zealand's principal game birds are duck, swan, pheasant, quail, geese and chukor. The sport is limited, the season usually extending for about six to eight weeks depending on the region. By tradition, the season starts on the first weekend of May. A licence is required to hunt game birds and numbers taken are limited.
There are few restrictions on big game hunting. Generally speaking, there is no limit on the number of game animals that can be taken, there are no licence requirements and the season is open for most species all year round. Deer of several species, chamois, thar, wild pigs, goats and wallaby are numerous in several areas. For tourists and inexperienced hunters, the service of an experienced guide is recommended.
Skiing and snowboarding. The season in New Zealand extends from June to late October at ski areas in the North and South Islands. Many areas have snowmaking equipment to ensure reliable snow depth and quality. New Zealand has 13 commercial ski areas, 11 club ski fields and one commercial cross-country ski area.
In the North Island, the main snow sports centre is Mt Ruapehu, in the Tongariro National Park. There are two commercial ski areas, Whakapapa and Turoa, and one club field, Tukino. The Maunganui ski club operates on Mt Taranaki or Egmont.
In the South Island, the commercial ski areas are Coronet Peak and The Remarkables (Queenstown); Cardrona and Treble Cone (Wanaka); Ohau, Mt Dobson and Round Hill (Aorangi); Porter Heights, Mt Hutt and Mt Lyford (Canterbury); and Rainbow (Marlborough). There are nine club fields in the South Island.
The Waiorau Snow Farm Area, on the Pisa Range near Wanaka, offers 24 kilometres of cross-country skiing. Glacier skiing on the Tasman and Fox Glaciers, with access via ski-planes, is also available, while guided heli-skiing and ski touring give access to the Ben Ohau Ranges, the Harris Mountains, the Two Thumbs Range, the Mt Cook/Tasman Glacier area, Mt Hutt and Queenstown in the South Island.
A tramper crosses a swing bridge on the Routeburn Track, Fiordland.
The International Ski Federation (FIS) has sanctioned the holding of annual international snow sports competitions at Mt Hutt, Whakapapa, Coronet Peak, Cardrona and Turoa.
Mountaineering and tramping. The closeness of mountains and forests to the main centres of population in New Zealand gives the opportunity for adventures away from civilisation.
In the Waitakere and Hunua Ranges, near Auckland, the many national and forest parks and reserves of the North Island, and through the extensive parks and protected natural areas of the South Island, there are many tracks through beautiful scenery. Tramping tracks range from half-day, family-oriented walks to challenging tramps in back-country and alpine isolation.
Climbing (both rock and ice) is becoming increasingly popular, with many opportunities throughout New Zealand.
Information on mountaineering and tramping in New Zealand is available through commercial guiding companies or the Department of Conservation.
The Great Walks are New Zealand's most famous tracks, popular with both New Zealanders and overseas visitors. They include Lake Waikaremoana, Urewera National Park; Tongariro northern circuit, Tongariro National Park; Abel Tasman Coastal Track, Abel Tasman National Park; Heaphy Track, Kahurangi National Park; Routeburn Track, Mt Aspiring and Fiordland National Parks; and Milford Track, Kepler Track and Rakiura Track, Fiordland National Park. Most of these tracks take two to four days to complete and are well marked. Huts and campsites are provided for overnight accommodation. The Abel Tasman Coastal Track is the most popular of the tracks, with about 28,000 overnight visitors a year. The second most popular is Milford Track, followed by the Routeburn, Kepler, Lake Waikaremoana and Heaphy Tracks.
Walking. New Zealand's walkways system offers walking opportunities over primarily private land and is a complementary system to the network of back-country tramping tracks. Walkways vary from half-hour walks to four or five days for the St James Walkway in North Canterbury. In addition to walkways, government agencies and local authorities develop and maintain public walking tracks throughout New Zealand.
Trout fishing on the shores of Lake Rotorua.
Cycling. Cycling New Zealand holds the New Zealand affiliation to the UCI (International Cycling Union). New Zealand organisations affiliated to Cycling New Zealand are the New Zealand Mountain Bike Association, BMX New Zealand, New Zealand Masters Cycling Association and New Zealand Schools Cycling Association. Cycling New Zealand has about 2,000 licensed participants belonging to 44 clubs throughout the country. BMX New Zealand has approximately 1,000 licensed competitors. f here are around 150 major open events during the year, apart from club racing, which caters for racing at entry level. The New Zealand Mountain Bike Association has 300 licensed competitors.
Table 13.1 shows expenditure on gaming, including racing, Lotteries Commission products, gaming machines and casinos, from 1981 to 2000.
Racing. There are 72 thoroughbred, 50 harness and nine greyhound racing clubs in New Zealand. The number of meetings held by each club and the stakes they offer vary widely, particularly between large city clubs and small provincial clubs. New Zealand also has a strong horse breeding sector. Export of thoroughbred horses is worth about $100 million a year, with Australia and Asian countries the main markets. New Zealand-bred horses compete very well overseas and regularly win top races, although in total they constitute a small percentage of runners. The Racing Industry Board is considering significant changes to the industry to combat declining attendances and increased competition for the leisure time of New Zealanders.
Betting. On and off-course betting on racing in New Zealand is conducted through the Totalisator Agency Board (TAB). The board was established in 1950 and was the first in the world to facilitate off-course betting on a comprehensive national scale through a statutory body. Its legislative responsibilities and functions are now embodied in the Racing Act 1971.
The TAB has two fundamental objectives: to provide a safe and corruption-free mechanism for betting on horse, harness, greyhound racing and sport; and to support the racing industry by returning the profit it makes to racing clubs. There are more than 600 TAB outlets throughout New Zealand and in the 2000/01 racing year, TAB turnover on off-course racing totalled $996 million, with a further $75 million bet on-course. Sports betting totalled $70 million. The internet enables the TAB to compete for a share of the international racing and sports betting market. The TAB website www.tab.co.nz has a customer base of bettors from more than 70 countries.
Lotteries and gaming. The Gaming and Lotteries Act 1977 defines five forms of gambling: games of chance (including housie and gaming machines); lotteries (raffles); prize competitions (for example, pick the score competitions); instant games (mostly ‘scratch’ tickets); and bookmaking and betting (which is prohibited except for betting on horse and dog races and sports events in terms of the Racing Act). Generally, a licence is required to run any of these activities. However, very small activities are exempt from the act's licensing requirements, providing they meet the requirements of the act. The act also regulates activities of the New Zealand Lotteries Commission. Gambling is run under the act to raise funds for community purposes.
Non-casino gaming machines are licensed under the game of chance provisions in the act. They are owned and operated by non-commercial groups (societies) to raise funds for community purposes. Most of these machines operate in pubs and clubs. Club purposes are regarded as community purposes and clubs may therefore apply the profits of their machines to themselves. Publicans, however, cannot retain funds raised by machines in pubs because pubs are commercial operations. Trusts that operate machines in pubs must distribute at least 33 percent of profits to community purposes.
Betting on horse racing, greyhound racing and sports events is controlled through the Racing Act 1971. Casinos are regulated by the Casino Control Act 1990.
The New Zealand Lotteries Commission is responsible under the Gaming and Lotteries Act 1977 for promoting and conducting New Zealand Lotteries – Lotto, Lotto Powerball, Lotto Strike, Instant Kiwi and Daily Keno.
Net profits from the commission's games are distributed to arts, sports, charitable and community causes by the New Zealand Lottery Grants Board. In the 2001 financial year, the games raised $130 million for the grants board, the equivalent of $2.5 million a week.
The most popular game, Lotto, is played regularly by 67 percent of the adult population of New Zealand. The demographic profile of Lotto customers (their age, sex, socio-economic grouping etc) is almost identical to the demographic profile of the general adult population.
The weekly Lotto draw, broadcast live on TV2 at 8.00pm each Saturday, attracts an average viewing audience of just over 400,000.
Each week, about 1.2 million customers purchase tickets from one of the commission's 620 franchised retail outlets. These stores are independently owned or part of another retail chain or franchise. They employ around 3,577 full-time and part-time staff to service lottery customers.
From every dollar of sales, 93 cents goes back to the community in one form or another. Fifty-five cents are paid in prizes; 21 cents goes to the Lottery Grants Board; 10 cents is paid in taxes; 7 cents is paid in commission to Lotto shops and 7 cents pays expenses.
In the financial year ended 30 June 2001, sales were $605.7 million; prizes were $337.2 million; $130 million was paid to the Lottery Grants Board; tax paid was $63.1 million; retail commission was $42.4 million; and expenses were $48.6 million.
The New Zealand Lottery Grants Board: Te Puna Tahua is a completely separate and independent organisation, a Crown entity, currently chaired by the Minister Responsible for the Community and Voluntary Sector, which distributes lottery profits to arts, sports, welfare, recreation, environment, heritage, health research and community facilities, including marae. The funds are distributed by the board via Sport and Recreation New Zealand, Fitness and Leisure, Creative New Zealand, the New Zealand Film Commission and lottery distribution committees (see table 13.2). The board's mission is to ensure empowered communities, community well-being and a sense of nationhood; and that its Treaty of Waitangi obligations are fulfilled.
Table 13.2. Allocation of lottery profits1
| 1997 | 1998 | 1999 | 2000 | 2001 | 2002 | |
|---|---|---|---|---|---|---|
1For year ended 30 June. Source: New Zealand Lottery Grants Board | ||||||
| Recipient | $(million) | |||||
| Distribution committees | ||||||
| Lottery Aged | 3.7 | 3.4 | 3.6 | 3.12 | 3.12 | 3.12 |
| Lottery Community Facilities | 12.1 | 12 | 11.4 | 10.62 | 10.25 | 9.44 |
| Lottery Environment & Heritage | 10,706 | 10,415 | 9,925 | 9,377 | 9.09 | 6.63 |
| Lottery General | 19,627 | 15.26 | 13.3 | 11,983 | 11.75 | 10.77 |
| Lottery Health Research | 4 | 3.5 | 3.45 | 3.22 | 3.11 | 2.31 |
| Lottery Marae Heritage & Facilities | – | 6 | 6 | 6 | 5.79 | 4.99 |
| Lottery Science Research | 2 | 1 | – | – | – | – |
| Lottery Welfare | 14.4 | 12 | 11.9 | 11.08 | 11.08 | 11.08 |
| Lottery Welfare – Individuals with Disabilities | 3.2 | 3.2 | 3.2 | 3.2 | 3.2 | 3.2 |
| Lottery Youth | 6.8 | 5 | 5.6 | 5.22 | 5.22 | 5.22 |
| Minister of Internal Affairs | 0.28 | 0.28 | 0.28 | 0.28 | 0.35 | 0.1 |
| Statutory bodies | ||||||
| Creative New Zealand Toi Aotearoa | 20.25 | 20.25 | 20.25 | 20.31 | 20.31 | 20.31 |
| Arts Foundation of New Zealand | – | – | 1 | 1 | 0.1 | 1 |
| Film Commission | 8.775 | 8.775 | 8.775 | 8.801 | 8.801 | 8.801 |
| Film Archive | – | – | – | – | – | 0.65 |
| Sport and Recreation New Zealand | 27 | 27 | 27 | 27.08 | 27.08 | 27.08 |
| Sports 2000/High Performance Sports Fund | 3.66 | 3.717 | 3.7814 | 3.8075 | 3.81 | 3.81 |
| Other | ||||||
| Alcohol and Drug | 1.2 | 1 | 0.7 | 0.4 | – | – |
| Cultural Olympiad | 0.5 | ... | ... | ... | ... | ... |
| Millennium | 2 | 2 | 2 | 4 | ... | ... |
| Total | 140.198 | 134.797 | 132.1614 | 129.4985 | 123.061 | 118.511 |
Casino Control Authority. Established under the Casino Control Act 1990, the main functions of the Casino Control Authority are to consider applications and grant casino licences, act as an appeal authority for licence holders, and advise the Minister of Internal Affairs on the act and on casino policies generally. The authority also approves casino games and the rules under which they are played. Six casino licences have been granted. Five casinos are in operation in Christchurch, Auckland, Dunedin and Queenstown (two). A further casino is to open in Hamilton. There is now a moratorium on the consideration of any further casino licence applications until at least October 2003.
New Zealand is internationally renowned for its landscape, for its sense of adventure and for its distinctive culture and people. Traditionally, international tourists were drawn to New Zealand to experience the unpolluted air and water, the open spaces and unique flora and fauna. Today, as well as these traditional attractions, the international traveller is looking for adventure, culture, sophistication and cultural activity. New Zealand's tourism product has developed to meet these needs. As a land at the edge of the Pacific, New Zealand's unique positioning is an attraction that has made tourism one of New Zealand's biggest foreign exchange earners. Recognition of the fact that New Zealand is a small player in the global tourism market and the importance of sustainability, has resulted in a group consisting of the tourism industry, local and central government, Māori and conservation interests joining together to formulate the New Zealand Tourism Strategy 2010. This document will have far reaching implications for the structure of the tourism industry and should ensure the sustainability of the industry for the future.
The term ‘New Zealand tourism’ describes a market that caters for international travellers and New Zealanders. The tourism industry meets their needs, providing, among other things, accommodation, food, tours, activities and transport. A tourist includes anyone travelling for pleasure, business or education. Table 13.3 gives details about short-term commercial accommodation use for the December months of 2000 and 2001. Tourism is an important source of income for New Zealand's economy, so it is imperative the industry works together to provide a rewarding experience for travellers. New Zealand has two government-funded tourism organisations: The New Zealand Tourism Board (trading as Tourism New Zealand) and the Ministry of Tourism, which works with the industry to take a cohesive, coordinated approach to marketing New Zealand overseas.
Attractions. It is not only New Zealand's landscape, but its people, its culture and its sense of adventure that attracts overseas visitors. Visitors to New Zealand are discovering an island nation full of drama and discovery – a land of spiritual places where they can feel free. New Zealand's culture has come of age as a form of Pacifica, with a new wave of thinking reflecting this. This has become evident with New Zealand's culinary culture and sport, and its contemporary and wearable arts, all taking a distinctly New Zealand flavour. New Zealanders themselves are also part of what makes up the attraction to New Zealand and completes the visitor experience. Ingenious, passionate and inspiring yet straightforward people, New Zealanders are famous for looking at things in new ways and doing things with an attitude and an eye for adventure. These adventures are world-renowned for being innovative and intense. With a breathtaking landscape and an adventurous soul, Kiwis have a love of exploring new ways to be touched by nature – inventing the ski plane, jetboating and zorbing, and popularising activities such as bungy jumping.
Events. Sporting and cultural events such as wine, food, art and flower festivals, Māori cultural competitions, triathlons, fashion events and rugby matches put New Zealand in the international spotlight. Conferences and conventions also generate considerable business for many cities and towns. Hosting events such as the America's Cup, Rally of New Zealand and multi-sport events offers unique opportunities to promote New Zealand as a destination and Tourism New Zealand and its industry partners actively seek to ensure the opportunities provided by these major events are maximised.
According to the World Travel and Tourism Council, tourism is the world's largest industry, with nearly 700 million travellers worldwide spending an estimated US$476 billion in 1996. It is one of New Zealand's top foreign exchange earners, bringing an estimated $NZ5.1 billion in the year ending June 2001. In the year to March 2001, total visitor arrivals to New Zealand reached an all-time high of 1.85 million. This is a small share, however, of the international tourism market. Table 13.4 shows the number of international visitors to New Zealand for the year ending March, from 1986 to 2001.
Table 13.4. Number of international visitors
| Year ended 31 March | Holiday | Stay with friends and relatives | Business | Other1 | Total |
|---|---|---|---|---|---|
1Includes conference/convention, work and working holiday, education, medical, stopover and unspecified. Source: Statistics New Zealand | |||||
| 1986 | 404,036 | 140,481 | 74.661 | 69,895 | 689,073 |
| 1987 | 441,081 | 157.619 | 76.087 | 88,422 | 763,209 |
| 1988 | 455,834 | 194,932 | 88,215 | 116,511 | 855,492 |
| 1989 | 439,249 | 207,333 | 100,224 | 120,716 | 867,522 |
| 1990 | 464,545 | 224,875 | 109,110 | 134,901 | 933,431 |
| 1991 | 491,591 | 238,034 | 103,899 | 133,538 | 967,062 |
| 1992 | 519,274 | 245,845 | 106,238 | 128,357 | 999,714 |
| 1993 | 593,415 | 255,149 | 114,183 | 123,810 | 1,086,557 |
| 1994 | 702,945 | 272,507 | 121,925 | 115,941 | 1,213,318 |
| 1995 | 773,379 | 282,565 | 139,221 | 147,838 | 1,343,003 |
| 1996 | 811,194 | 319,350 | 156,018 | 155,276 | 1,441,838 |
| 1997 | 860,208 | 354,226 | 163,976 | 172,931 | 1,551,341 |
| 1998 | 765,077 | 355,260 | 173,629 | 170,800 | 1,464,766 |
| 1999 | 766,897 | 392,296 | 179,661 | 178,470 | 1,517,324 |
| 2000 | 841,033 | 431,312 | 196,784 | 179,859 | 1,648,988 |
| 2001 | 973,760 | 482,268 | 203,290 | 189,136 | 1,848,454 |
The Tourism Satellite Account brings together data about the industry from different sources. It is published by Statistics New Zealand and looks at the contribution of international and domestic tourism to the New Zealand economy. Tourism remains a labour-intensive industry, generating a wide range of jobs for New Zealanders. The Tourism Satellite Account estimated that more than 94,000 full-time equivalent persons were engaged directly in the tourism industry in 2000. Another 63,000 were estimated in 1997 to be engaged in jobs indirectly supporting tourism.
Tourism expenditure in New Zealand in the year ending March 2000 totalled an estimated $13.176 billion. Expenditure increased significantly in 1999 and 2000 following a fall between 1997 and 1998 due mainly to a decrease in international visitors, particularly from the Asian region.
The internet has become increasingly important in the world of destination marketing. There are an estimated 130 million global internet users worldwide and this figure is growing at an exponential rate. According to World Tourism Organisation figures, the top four tourism spenders in the world – the United States, Germany, Japan and the United Kingdom – also account for 79 percent of internet users. These regions are also four of New Zealand's main markets.
Tourism New Zealand's award-winning website www.purenz.com is New Zealand's ‘voice’ on the world wide web and is of increasing importance to New Zealand's international marketing. A comprehensive consumer website, the site features travel journals, planning tips, accommodation, activities and transport and gives potential visitors to New Zealand an insight into the country. It is available in a number of different languages, including Japanese, German and Chinese. Tourism New Zealand also has a corporate website www.tourisminfo.govt.nz which contains all research conducted by Tourism New Zealand. This includes the International Visitor Survey and other in-depth research conducted in New Zealand's main markets. Tourism Satellite Account figures and other tourism sector information is available on Statistics New Zealand's website, www.stats.govt.nz
More than 1.8 million overseas visitors arrived in New Zealand in the year ending 31 March 2001 – up seven percent on the previous year. The number of countries from which overseas visitors originate has grown in recent years, with nearly 200 represented in 2001. Table 13.5 shows international visitor spending by country of origin, while Table. 13.6 shows overseas visitor arrivals by country from 1999 to 2001, for the year ended March 31.
Table 13.5. International visitor expenditure, year ending June 2001
| Country of last permanent residence | Total foreign exchange earnings (excluding international airfares) | Average expenditure per person per visit | Average expenditure per person per day |
|---|---|---|---|
| (NZ$ million) | (NZ$) | (NZS) | |
| Source: Tourism New Zealand International Visitors Survey | |||
| Australia | 902 | 1,725 | 150 |
| United States | 821 | 4,469 | 299 |
| Canada | 139 | 3,680 | 139 |
| United Kingdom | 690 | 3,610 | 124 |
| Nordic | 81 | 2,867 | 123 |
| Germany | 204 | 4,076 | 125 |
| Switzerland | 50 | 4,495 | 153 |
| Netherlands | 91 | 3,727 | 119 |
| Other Central Europe | 121 | 3,139 | 151 |
| Japan | 680 | 4,318 | 275 |
| South Korea | 124 | 2,193 | 164 |
| Taiwan | 139 | 3,716 | 230 |
| Hong Kong | 113 | 2,852 | 201 |
| Other North Asia | 147 | 4,276 | 135 |
| Singapore | 108 | 3,107 | 284 |
| Malaysia | 51 | 2,447 | 182 |
| Thailand | 58 | 3,956 | 171 |
| Other SE Asia | 46 | 4,325 | 96 |
| Other countries | 525 | 2,925 | 127 |
| Total/Average | 5,086 | 3,041 | 166 |
Table 13.6. Overseas visitor arrivals1 by country of last permanent residence
| Country of last permanent residence | Year ended 31 March | ||
|---|---|---|---|
| 1999 | 2000 | 2001 | |
1Intended length of stay in New Zealand is less than 12 months. 2Includes unspecified. 3Actual counts. These may differ from summed country data. Source: Statistics New Zealand | |||
| Australia | 508,035 | 537,775 | 592,737 |
| Cook Islands | 6,596 | 6,061 | 6,873 |
| Fiji | 13,185 | 14,455 | 13,848 |
| French Polynesia | 7,183 | 8,847 | 12,752 |
| New Caledonia | 5,532 | 6,572 | 7,235 |
| Samoa, Western | 12,272 | 12,052 | 14,864 |
| Tonga | 7,663 | 7,418 | 8,917 |
| China, People's Republic of | 16,325 | 26,802 | 39,157 |
| Hong Kong | 30,393 | 29,147 | 30,408 |
| India | 5,529 | 6,788 | 9,202 |
| Indonesia | 7,116 | 6,322 | 8,597 |
| Japan | 149,561 | 145,637 | 157,509 |
| Korea, Republic of | 24,897 | 53,687 | 70,658 |
| Malaysia | 15,006 | 17,298 | 20,493 |
| Philippines | 4,183 | 5,214 | 4,992 |
| Singapore | 28,011 | 34,034 | 35,543 |
| Taiwan | 39,127 | 39,795 | 40,474 |
| Thailand | 15,438 | 23,998 | 26,088 |
| Austria | 4,324 | 4,503 | 5,176 |
| Belgium | 2,819 | 3,212 | 3,713 |
| Denmark | 7,354 | 7,194 | 7,378 |
| France | 7,629 | 10,792 | 10,002 |
| Germany | 44,853 | 48,206 | 53,842 |
| Ireland | 5,920 | 7,765 | 10,012 |
| Italy | 6,023 | 8,565 | 6,683 |
| Netherlands | 18,092 | 20,910 | 25,403 |
| Norway | 2,866 | 3,710 | 3,881 |
| Spain | 3,169 | 4,017 | 4,298 |
| Sweden | 8,813 | 10,670 | 11,051 |
| Switzerland | 11,641 | 13,123 | 13,676 |
| United Kingdom | 160,514 | 174,838 | 209,928 |
| Argentina | 4,792 | 5,377 | 5,023 |
| Brazil | 3,330 | 3,563 | 5,240 |
| Canada | 32,290 | 32,628 | 35,390 |
| United States | 165,980 | 186,842 | 195,551 |
| Israel | 4,001 | 4,591 | 6,078 |
| South Africa | 15,254 | 15,026 | 16,378 |
| Other2 | 88,777 | 71,977 | 87,395 |
| Total3 | 1,517,559 | 1,651,889 | 1,848,340 |
A traditional haka performed by a Māori Concert party.
Accommodation. A wide range of accommodation is available in New Zealand. Tourism New Zealand supports the work of Qualmark New Zealand Ltd, which has developed an independent rating system for assessing hotels, self contained and serviced accommodation, holiday parks and backpackers. Qualmark's website is www.qualmark.co.nz
Of all nights spent in commercial accommodation in New Zealand by international visitors in January 2001, 40 percent were spent in hotel/resorts, 24 percent in motels/motor inns/apartments, 17 percent in backpackers/hostels, 17 percent in caravan parks/camping grounds and the balance in bed and breakfasts, guesthouses, farmstays and private hotels.
Transport. In the year ended December 2000, an estimated 30 percent of all international visitors took a domestic air trip while they were in New Zealand, 24 percent hired a rental car, 23 percent took a coach tour, 15 percent took a ferry journey, 14 percent used a private car, 6 percent travelled on a scheduled bus service, 5 percent took a train trip and the balance used other forms of transport, including campervans, backpacker buses, cruise ships or hitchhiked.
The increasing importance of tourism has led to a strong interest in the concept of sustainable tourism, both internationally and within New Zealand.
In order to be sustainable, tourism must provide satisfying and distinctive experiences for visitors and reasonable returns on investment for investors. It must also protect and develop the environmental, cultural and social values on which tourism depends. Finally, it must be acceptable to host communities and provide them with real economic and social benefits.
Local government plays several vital roles in developing sustainable tourism. It is responsible for enforcing laws and rules associated with managing the effects of tourism. It contributes to the marketing of the region as a tourist destination. It must also plan for, and in some cases fund, much of the infrastructure on which tourism depends, ensuring that the water supply and sewerage systems, roads and carparks can cope with the additional demand. Local residents sometimes object to meeting these costs.
However, a Tourism New Zealand nationwide survey in December 1997 of residents’ attitudes towards tourism showed that 94 percent of those surveyed saw tourism as important or very important to the economy. More than half also believed tourism would improve the New Zealand lifestyle.
Many natural areas enjoyed by visitors are managed by the Department of Conservation (DOC). Private sector firms provide a variety of facilities or services for visitors, including ski fields, scenic flights and guiding services, to complement those provided by the department. These firms must comply with strict statutory procedures, strategies and plans introduced to protect the natural and historical features of conservation areas and the recreational experiences of other visitors. Firms also pay concession fees, which help DOC protect conservation values.
Many tourism businesses are becoming more aware of the advantages of maintaining high environmental standards in the way that they conduct their business. The Green Globe Programme has been introduced to encourage tourism operators to improve their environmental and business performance.
Tourism New Zealand. Tourism New Zealand is responsible for the coordinated marketing and promotion overseas of New Zealand as a tourist destination.
Tourism New Zealand's objective is to ensure that New Zealand is developed and marketed as a tourism destination to maximise the long-term benefits to New Zealand. Tourism New Zealand's marketing campaign, introduced in 1999, works on the basis of a single, concise brand position across all its offshore markets – a truly global marketing campaign.
Tourism New Zealand works with the tourism industry to develop quality systems, new tourism products and on international marketing to encourage international visitors to come now, do more and come back again.
Tourism New Zealand maintains a network of offices in Bangkok, Frankfurt, London, Los Angeles, Hong Kong, New York, Osaka, Singapore, Shanghai and Taipei and has general service agents in Bangkok, Seoul and Johannesburg.
Ministry of Tourism. The Office of Tourism and Sport was restructured as the Ministry of Tourism on 1 January 2002, operating as a ministry within the Ministry of Economic Development and providing independent policy advice to the Minister of Tourism. The new ministry was established to develop a greater capacity to lead policy development across government on key tourism issues, build stronger relationships within government and with other stakeholders, advise on and evaluate government tourism expenditure and enhance the value of tourism research. Work on tourism issues relating to conservation, Māori and wider economic development links have been identified as policy priorities for 2002.
Boaties from the Mangonui Cruising Club prepare for a day out.
Tourism Industry Association New Zealand. Established in 1953 as the New Zealand Travel and Holiday Association, the functions of the association have evolved as the tourism industry has increased in economic importance in New Zealand. It serves as the united voice of its 3,500 member organisations. These range from large corporate members through to small one-person service providers. The Tourism Industry Association organises the New Zealand Tourism Conference, the New Zealand Tourism Awards and Tourism Rendezvous New Zealand (TRENZ), which is New Zealand's largest tourism trade show. These events are each held annually.
Many other government agencies are involved in the tourism sector. For example, New Zealand Customs and the Ministry of Agriculture and Forestry's quarantine service screen all visitors entering New Zealand to ensure that no prohibited or restricted materials are brought into the country. Statistics New Zealand is a key provider of data needed for the management of tourism. New Zealand police investigate crimes committed by or against visitors and the Foundation for Research, Science and Technology allocates funds for tourism research.
13.1 Sport and Recreation New Zealand (formerly Hillary Commission for Sport, Fitness and Leisure); Statistics New Zealand; New Zealand Academy of Sport; Fish and Game New Zealand; New Zealand Snowsports Council; Department of Conservation; Cycling New Zealand Federation; Totalisator Agency Board; Department of Internal Affairs; New Zealand Lotteries Commission.
13.2 Tourism New Zealand; Statistics New Zealand; Ministry of Tourism; Tourism Industry Association New Zealand.
Statistics New Zealand divisional manager responsible: Mike Moore.
Annual Report and Statement of Accounts for the Year ended 31 December (annual). New Zealand Olympic Committee, Wellington.
The Growing Business of Sport and Leisure: Social impact of physical leisure – an update (1998). Hillary Commission for Sport, Fitness and Leisure, Wellington.
The Growing Business of Sport and Leisure: The economic impact of sport and leisure in New Zealand – an update to 1996 (1998). Hillary Commission for Sport, Fitness and Leisure, Wellington.
Push Play Facts (1999). Hillary Commission for Sport, Fitness and Leisure, Wellington.
Report of the Department of Internal Affairs (Parl paper G.7).
Report of the Hillary Commission for Sport, Fitness and Leisure (Parl paper E.32).
Report of the New Zealand Lottery Grants Board (Parl paper G.7b)
Report of the Queen Elizabeth II National Trust (Parl paper C.2).
Annual Report (annual). Totalisator Agency Board, Wellington.
People s Participation in, and Attitudes to Gaming, 1985–2000: Final Results from the 2000 Survey (2001). Department of Internal Affairs, Wellington.
Report of the New Zealand Lotteries Commission (Parl paper G.7a).
New Zealand International Visitor Survey (annual and monthly updates). New Zealand Tourism Board, Wellington.
New Zealand Tourism Strategy 2010 (2001). New Zealand Tourism Board, Wellington.
Provisional Tourism Satellite Account 1998–2000 (2001). Statistics New Zealand, Wellington.
Report of the Ministry of Economic Development (Parl paper G.46).
Report of the New Zealand Tourism Board (Parl paper G.25).
Tourism Industry Outlook (six-monthly). New Zealand Tourism Industry Association, Wellington
Understanding the Dynamics of New Zealand Tourism (2001). Tourism Research Council of New Zealand, Wellington.
Visitor Strategy (1996). Department of Conservation, Wellington.
www.cycling.org.nz – Cycling New Zealand
www.doc.govt.nz – Department of Conservation
www.dia.govt.nz – Department of Internal Affairs
www.fishandgame.org.nz – Fish and Game New Zealand
www.hillarysport.org.nz – Hillary Commission for Sport, Fitness and Leisure
www.med.govt.nz – Ministry of Economic Development
www.dia.govt.nz – New Zealand Lottery Grants Board
www.olympic.org.nz – New Zealand Olympic Committee
www.purenz.com – New Zealand Tourism Board
www.qualmark.co.nz – Qualmark New Zealand Ltd
www.nationaltrust.org.nz – Queen Elizabeth II National Trust
www.stats.govt.nz – Statistics New Zealand
www.tab.co.nz – Totalisator Agency Board
www.tianz.org.nz – Tourism Industry Association New Zealand
www.transit.govt.nz – Transit New Zealand
Table of Contents
Skill New Zealand promotes post-school pathways into vocational education and training.
New Zealand has a range of legislation dealing with the employment relationship, with the main framework set out in the Employment Relations Act 2000. Other employment legislation sets out minimum statutory conditions of employment, including minimum entitlements to wages and various forms of leave.
The Employment Relations Act 2000 came into effect on 2 October 2000. It replaced the Employment Contracts Act 1991 and was introduced in response to a government desire to create a balanced employment relationship framework. In particular, the new act reflected the desire for greater promotion of collectivism, as opposed to individualism and the contractual nature of employment relationships which had been the focus of the previous act.
The key provision of the Employment Relations Act 2000 is to build productive employment relationships through the promotion of mutual trust and confidence in all aspects of the employment environment and the employment relationship. In particular, the act aims to promote productive employment relationships by:
Recognising that employment relationships must be built on good faith.
Acknowledging and addressing the inherent inequality of bargaining power in employment relationships.
Promoting collective bargaining.
Protecting the integrity of individual choice.
Promoting mediation as the primary problem-solving mechanism.
Reducing the need for judicial intervention.
The act also aims to promote observance in New Zealand of the principles underlying International Labour Organisation Convention 87 on Freedom of Association and Convention 98 on the Right to Organise and Bargain Collectively.
The legislation recognises the potential imbalance of bargaining power between employers and employees in the employment relationship and, therefore, encourages collective bargaining. The act affirms the right of employees to have the freedom to choose whether or not to form a union, or be a member of a union, for the purpose of advancing their collective employment interests. Unions are legally recognised by the act, and collective agreements can be negotiated only between unions and employers. In formally recognising the role of unions in promoting their members’ collective employment interests, the act views unions as providing a counterbalance to power imbalances in direct bargaining between employees and employers.
Minimal barriers to the formation of unions allows employees to form their own unions to represent their collective interests when bargaining, and provides protection to union and non-union members. No person may, in relation to an employment issue, give any preference or apply any undue influence on another because that person is or is not a member of a union.
In forming unions, the act establishes a Registrar of Unions, who must register an incorporated society as a union if it complies with the provisions of the act.
Union representatives are entitled to enter a workplace, within certain limitations, for purposes related to the employment of union members or for purposes related to the union's business.
The act recognises the social and economic elements of the employment relationship, signalling a change from viewing the employment relationship as a purely contractual exchange. Mutual trust and confidence among employers, unions and employees enables the parties to interact effectively and efficiently, minimising employment relationship problems. The act aims to achieve this primarily by recognising that employment relationships must be built on good faith.
Employment relationships include those between employers and employees, unions and their members, and unions and other unions who are bargaining together. Good faith applies not just at the bargaining table, but when any matter under a collective or individual agreement arises, at all times between an employer and employee, and when unions visit a workplace or consult their members. It is a requirement not just on employers, but on employees and unions as well.
Good faith primarily involves maintaining good relations and mutual respect. The State Services Commission, the New Zealand Council of Trade Unions, Business New Zealand and the government have jointly prepared a Code of Good Faith.
The act recognises that despite the requirement for all parties to an employment relationship to act in good faith, certain employment relationship problems will require specialised assistance and institutions to promote and restore productive employment relationships. An underlying assumption of the Employment Relations Act 2000 is that if problems in employment relationships are to be resolved promptly, expert problem-solving support, information and assistance needs to be available at short notice. The act accordingly established the Mediation Service and the Employment Relations Authority, while maintaining the Employment Court (see Chapter 10: Justice and Law).
The act promotes mediation as the primary employment relationship problem solving mechanism and aims to reduce the need for judicial intervention in problem solving. The Mediation Service provides mediators to help parties decide on the process that is most likely to resolve problems as quickly and fairly as possible. Mediation focuses primarily on solving the problem, and legal issues involved are considered only part of the picture.
The Employment Relations Authority, like the Mediation Service, recognises that procedures for problem-solving need to be flexible, and that the low-level judicial intervention provided by the authority should be that of a specialist decision-making body not inhibited by strict procedural requirements. The authority is, accordingly, an investigative body that aims to make decisions based on the facts of the case, not on legal technicalities.
The act recognises that access to both information and mediation services are more important than adherence to rigid formal procedures. The Department of Labour's employment relations service maintains a toll-free information line (0800 800 863) and a website www.ers.dol.govt.nz as a first ‘port of call’ and the service is actively involved in disseminating information and conducting seminars on minimum employment rights and how productive employment relationships can best be maintained. The service also publishes and distributes a range of information regarding minimum employment rights and a series of ‘best practices’ guidelines. All are available through employment relations service offices and on the website.
Employment Relations Authority. The Employment Relations Authority consists of the Chief of the Employment Relations Authority and 11 other members. The authority is established as an investigative body with the role of resolving employment relationship problems by establishing the facts and making a determination according to the substantial merits of the case, without regard to technicalities. The authority's jurisdiction includes:
Disputes about the interpretation, application, or operation of an employment agreement.
Matters related to a breach of an employment agreement.
Making determinations of unresolved personal grievances.
Matters relating to the registration of unions, such as whether a person is entitled to be a member of a union, or whether the rules of a union or a prospective union comply with the provisions of the Employment Relations Act.
Any proceeding relating to a strike or lockout.
The authority has a duty to first consider whether an attempt has been made to resolve the matter by the use of mediation and must direct or refer the parties to mediation or further mediation if it is deemed that mediation could contribute to resolving the matter. The authority has offices in Auckland, Wellington and Christchurch, although it can travel to other locations. Appeals or reviews of authority determinations can be taken to the Employment Court.
In the year ending 30 June 2001, the authority received 892 applications, of which 495 were disposed of, with the authority making 129 determinations. Forty-three percent of the determinations involved personal grievances alleging unjustified dismissal, while 22 percent involved applications for recovery of wages. Compliance orders made up another 11 percent of determinations.
Mediation Service. The Mediation Service provides expert and flexible problem-solving assistance at short notice. Under the Employment Relations Act 2000, the chief executive of the Department of Labour must employ personnel to provide free mediation services to support all employment relationships. The Mediation Service has offices in Auckland, Hamilton, Napier, Palmerston North, Wellington, Christchurch and Dunedin and employs 38 mediators.
Mediation focuses on problem solving, with legal issues only part of the picture. Once parties reach a settlement in mediation, they can agree to ask the mediator to sign it. Once signed, the settlement cannot be challenged and is enforceable in the Employment Relations Authority or the Employment Court. If the employer and employee cannot reach agreement in mediation, they can agree, in writing, to the mediator making a final and binding decision, which, likewise, is enforceable in the authority or the court. If either or both parties do not want the mediator to make a decision, the problem may be taken to the authority. Employees and employers can reach a settlement without using the Mediation Service and make it binding by having the written settlement signed by a mediator, after which it is enforceable in the authority or the court. In the year ended 30 June 2001, the Mediation Service received 4,767 applications, of which 3,959 were disposed of. Settlements were achieved in 2,118 cases, while 554 were not settled. A further 440 recorded settlements were dealt with. Of the settlements achieved in mediation, 31 percent involved personal grievances alleging unjustified dismissal, while 11 percent involved personal grievances alleging disadvantage. Other personal grievances and recovery of wages were the next most common settlements achieved.
Statutory minimum entitlements apply to all employees. These include:
An adult minimum wage for employees aged 18 and over and a youth minimum wage for people aged 16 and 17.
Protection from unlawful deductions from wages.
Eleven paid public holidays, where the holiday would otherwise be a working day.
Three weeks paid annual leave after 12 months employment.
Five days special leave after six months employment.
Parental leave and employment protection.
Equal pay for men and women doing substantially the same work.
The youth minimum wage for people aged 16 and 17 was $6.40 on hour in 2002.
Minimum wage. The Minimum Wage Act 1983 determines national minimum wages for adults and young people, below which wages cannot generally fall. The Minimum Wage Order 2001, effective from 18 March 2002, set the adult minimum wage for those aged 18 and over at $8.00 an hour, $64.00 for an eight-hour day and $320.00 for a 40-hour week. The youth minimum wage for people aged 16 and 17 is $6.40 an hour, $51.20 for an eight-hour day and $256.00 for a 40-hour week. Those not entitled to the minimum wage are those under the age of 16, those undergoing certain training in some professions, holders of under-rate worker permits (issued by the Department of Labour to those with recognised disabilities who are incapable of earning the minimum wage) and employees with disabilities in sheltered workshops.
Legislative changes. At the beginning of May 2002, the Minimum Wage (Training) Amendment Bill, which would provide for a minimum wage for certain groups based on training status, was before parliament. In addition, the government has agreed to repeal the Disabled Persons Employment Promotion Act 1960, which allows sheltered workshops to apply for exemptions from employment legislation, including the Minimum Wage Act. Employees with disabilities in sheltered workshops should be paid the applicable minimum wage or more. If they are unable to earn the minimum wage, they will be able to apply for under-rate worker permits.
Hours of work. Hours of work are not directly governed by statute, but are negotiated into employment agreements.
Holidays. The Holidays Act 1981 contains minimum rights and obligations concerning annual leave, public holidays and special leave for sickness, domestic or bereavement reasons. These apply to employees whether they are full time, part time, permanent, casual or temporary. Employers and employees cannot contract out of the Holidays Act 1981, but can agree to better terms and conditions.
Public holidays. The Holidays Amendment Act 1991 ensures that all employees receive 11 paid public holidays as of right if they fall on days which would otherwise be working days for them. The statutory and public holidays are New Year's Day (1 January), 2 January (or another day in its place), Waitangi Day (6 February), Anzac Day (25 April), Good Friday, Easter Monday, Queen's Birthday, Labour Day, Christmas Day (25 December), Boxing Day (26 December) and the anniversary of the province where the employee is employed. Where employees work on a public holiday, and that public holiday falls on a day they would normally work, they are entitled to a paid day in lieu. There are special exceptions for Anzac Day and Waitangi Day, where employees who work for greater than ordinary rates on either Anzac Day or Waitangi Day do not have to be granted a day in lieu. In the case of the Christmas/New Year period falling on either a Saturday or Sunday, the holidays are transferred to a Monday or Tuesday. Table 14.1 lists the dates of New Zealand's movable public holidays from 2002 to 2005.
Annual leave. After one year's continuous service with the same employer, an employee is entitled to three weeks paid annual leave. At least two uninterrupted weeks holiday must be allowed within six months of the holiday entitlement becoming due. Public holidays are additional to annual holidays.
Special leave. On completion of six months employment with an employer, an employee is entitled to five days special leave on pay for each subsequent 12 months of employment. Special leave that is unused cannot be carried over. Special leave can be taken if an employee is sick; if an employee's spouse is sick, if a dependent child, or dependent parent of an employee, or an employee's spouse, is sick; on the death of an employee's spouse, parent, child, brother, sister, grandparent, father-in-law or mother-in-law; or on any occasion on which the employer accepts that by reason of the death of any person, an employee has suffered a bereavement.
Table 14.1. Movable public holidays
| 2002 | 2003 | 2004 | 2005 | |
|---|---|---|---|---|
1The Queen's actual birthday is 21 April 1926. Source: Employment Relations Service, Department of Labour | ||||
| Good Friday | 29 Mar | 18 Apr | 9 Apr | 25 Mar |
| Easter Monday | 1 Apr | 21 Apr | 12 Apr | 28 Mar |
| Queen's Birthday1 | 3 Jun | 2 Jun | 7 Jun | 6 Jun |
| Labour Day | 28 Oct | 27 Oct | 25 Oct | 24 Oct |
New Zealanders are entitled to three weeks paid annual leave after one year's continuous service with the same employer.
Parental leave. Under the Parental Leave and Employment Protection Act 1987, parental leave is available to employees having a child and to their partners. It is also available to employees, male or female, adopting a child under five years of age. A certificate of pregnancy may be required, or, in the case of adoption, a letter from the Department of Child, Youth and Family Services. To apply for parental leave under the act, an employee must have worked at least an average of 10 hours a week for 12 months at the expected date of birth and for the same employer.
Applications for parental leave should, in most cases, be made in writing at least three months in advance. There are some exceptions for medical or work problems during pregnancy, and special provisions for adoption. Employers may not unreasonably refuse a late application.
The government in 2002 introduced a scheme to provide 12 weeks tax-funded payment for parental leave. This is available where the baby is expected, or is born or adopted, on or after 1 July 2002. Any parental leave taken after the 12 weeks payment period is unpaid, as is special leave and partner's/paternity leave.
The payment is available to a female employee (or adoptive parent nominated as the primarily eligible spouse) who is eligible for parental leave for up to 12 weeks of their leave. All or part of the payment may be transferred to the employee's spouse (husband or de facto partner, including same-sex partner) if also eligible for parental leave.
The payment replaces the employee's gross earnings up to a maximum of $325 per week, and is taxable on the same basis as wages. The maximum payment will be adjusted annually in accordance with any increase in average ordinary time weekly earnings as determined by the Quarterly Employment Survey published by Statistics New Zealand.
Employees who are eligible for both paid parental leave and parental tax credit (a form of family assistance) may choose whichever is more beneficial to them.
Applications for parental leave payments should be made to the Inland Revenue Department after the employer has approved parental leave. Application forms and information on paid parental leave are available from the Department of Labour's Employment Relations Infoline (0800 800 863) or website www.ers.dol.govt.nz
Types of parental leave available include:
Special parental leave. Leave of up to 10 days is available to a woman during pregnancy for reasons connected with the pregnancy.
Maternity leave. A woman is entitled to up to 14 weeks maternity leave, of which up to six weeks may be taken before the birth or the adoption of a child under five years of age, or, if agreed by the employer, at any date before the birth or adoption.
Partner's/paternity leave. The woman's spouse is entitled to two weeks partner's/paternity
leave about the time of the birth or adoption of a child.
Extended leave. One or both parents are entitled to a total of up to 12 months leave before the first birthday or anniversary of adoption of a new child. The entitlement may be taken by either parent, or shared between both parents, although any period taken as maternity leave is deducted from the total available. Partner's/paternity leave is additional to the 12-month entitlement.
Where employees take parental leave of four weeks or less, their jobs must be kept open. Where parental leave of more than four weeks is applied for, the employer may decide that the job is a key position and cannot be filled by a temporary replacement. This situation is not common, and the employee has the right to challenge this decision. If parental leave of more than four weeks is taken and the employee has accepted that the job cannot be kept open, the employee will be entitled to a preference period of six months after the parental leave finishes where the employer must offer that employee any available job substantially similar to the previous one. Employers may not dismiss an employee for being pregnant, or for applying for parental leave. Labour inspectors can enforce rights and benefits under the Parental Leave and Employment Protection Act, including assisting with disputes over eligibility or payment for parental leave.
Provisions of the Parental Leave and Employment Protection Act are minimum standards and employment agreements may have different provisions. If the employment agreement has provisions which are overall less favourable to an employee than the act, the employee can claim under the act. If the employment agreement provisions on parental leave are better overall than the act, the employee can claim those. However, employees entitled to parental leave payments under an employment agreement continue to receive both those payments and the statutory parental leave payment.
An equal employment opportunities (EEO) environment assists those who are vulnerable or disadvantaged in the labour market, and helps ensure employers tap the full potential of a diverse workforce.
EEO principles are supported by anti-discrimination legislation. The Equal Pay Act 1972 provides that employers cannot differentiate in pay rates between employees on the basis of their sex. Under the Human Rights Act 1993, an employer cannot discriminate in hiring or firing, training or promotion, because of an employee's sex, marital status, religious or ethical belief, colour, race, ethnic or national origins, disability, age, political opinion, employment status, family status or sexual orientation. Discrimination in terms and conditions of employment, training, promotion and dismissal because of an employee's colour, race, ethnic or national origins, sex, age, marital status, or religious or ethical belief, and sexual harassment are also grounds for taking a personal grievance under the Employment Relations Act 2001. Employees may make a complaint under the Human Rights Act, or may use personal grievance procedures under the Employment Relations Act, to enforce their rights in cases of alleged discrimination or sexual harassment. Where both procedures are available, the employee must choose one or the other.
The Equal Employment Opportunities Trust was established in 1991 to promote EEO principles and best practice in the workplace. It encourages employers to recognise the business benefits of employing on the basis of merit, and assists them to get the full potential from a diverse workforce.
The CTU is the national advocate of worker interests. The CTU was formed in October 1987 to unite private and public sector unions previously represented by separate national organisations. It organises unions on issues of mutual concern and represents New Zealand workers internationally. Thirty unions (representing 90 percent of union members) are affiliated to the CTU. The CTU website is www.union.org.nz
Business New Zealand is New Zealand's largest business advocacy body, representing the combined members of five regional business organisations and more than 50 national business organisations. Business New Zealand promotes public policy that supports an open, competitive economy and private enterprise. Business New Zealand was formed as the result of a merger between the New Zealand Employers’ Federation and the New Zealand Manufacturers’ Federation. The Business New Zealand website is www.business.nz.org.nz
Work stoppage information is used as an indicator of the state of industrial relations in New Zealand. It focuses particularly on the economic impact of events such as strikes and lockouts, but does not cover forms of industrial unrest such as stopwork meetings, strike notices, protest marches and public rallies. Demarcation and coverage disputes are included only where the participants are on strike or locked out.
Work stoppages decreased dramatically in the decode between 1991 and 2000.
For statistical purposes, work stoppages are defined not only as those disputes which result in the complete withdrawal of labour by workers or a lockout by employers, but also disputes in which there is an organised ‘go-slow’, refusal to work overtime, or other methods of passive resistance. Several stoppages over the same period over the same issue are treated as one stoppage. Indicators used to measure work stoppages are the number of stoppages (measuring frequency), the duration of stoppages (measuring persistence), the number of workers involved (measuring extent), the number of working days lost (measuring economic impact) and the estimated loss in wages and salaries (also measuring economic impact).
Statistics regarding the number of workers involved in work stoppages include workers who, while not directly participating in the stoppage, are suspended because of the unavailability of normal work. Work stoppage statistics are compiled by Statistics New Zealand from the Record of strike or lockout forms collected by the Department of Labour under the Employment Relations Act 2000. The department identifies stoppages by scanning newspapers and through regular contact with employee and employer organisations. Once a dispute is identified, a form is sent to the employer for completion.
The Employment Relations Act 2000 places restrictions on the ability of employees to strike and the ability of employers to lock workers out. The right to strike and lockout is recognised, but the legislation attempts to minimise the extent and wider economic impact of industrial action. Work stoppages are recorded, for statistical purposes, even when they are illegal.
Table 14.2 and Figure 14.1 show that since 1986, the number of work stoppages has fallen to levels not recorded since the early 1930s. The Employment Contracts Act was introduced in 1991 and replaced by the Employment Relations Act in October 2000 during this period. There were 21 work stoppages in the year ended December 2000, compared with 71 in 1991 and 215 in 1986 (pre Employment Contracts Act). The number of employees involved in work stoppages has also decreased. In 2000, 2,632 people were involved, considerably lower than the hundreds of thousands involved in stoppages during the 1970s and 1980s.
Table 14.2. Work stoppages: 1921–2000
| Year | Total stoppages | No. of employees involved | Person-days of work lost | Average person-days lost per employee involved | Estimated loss of wages and salaries |
|---|---|---|---|---|---|
| Source: Department of Labour and Statistics New Zealand | |||||
| $(000) | |||||
| 1921 | 77 | 10,433 | 119,208 | 11.43 | 180 |
| 1926 | 59 | 6,264 | 47,811 | 7.63 | 65 |
| 1931 | 24 | 6,356 | 48,486 | 7.63 | 89 |
| 1936 | 43 | 7,354 | 16,980 | 2.31 | 26 |
| 1941 | 89 | 15,261 | 26,237 | 1.72 | 69 |
| 1946 | 96 | 15,696 | 30,393 | 1.94 | 80 |
| 1951 | 109 | 36,878 | 1,157,390 | 31.38 | 6,223 |
| 1956 | 50 | 13,579 | 23,870 | 1.76 | 168 |
| 1961 | 71 | 16,626 | 38,185 | 2.30 | 299 |
| 1966 | 145 | 33,132 | 99,095 | 2.99 | 878 |
| 1971 | 313 | 86,009 | 162,563 | 1.89 | 2,109 |
| 1976 | 487 | 201,085 | 488,441 | 2.43 | 10,840 |
| 1981 | 291 | 135,006 | 388,086 | 2.87 | 20,411 |
| 1986 | 215 | 100,633 | 1,329,054 | 13.21 | 119,496 |
| 1991 | 71 | 51,962 | 99,032 | 1.91 | 11,577 |
| 1992 | 54 | 26,803 | 113,742 | 4.24 | 19,372 |
| 1993 | 58 | 21,303 | 23,770 | 1.12 | 2,863 |
| 1994 | 69 | 16,042 | 38,263 | 2.39 | 4,580 |
| 1995 | 69 | 32,048 | 53,352 | 1.66 | 6,813 |
| 1996 | 72 | 42,307 | 69,514 | 1.64 | 9,768 |
| 1997 | 42 | 7,646 | 24,616 | 3.2 | 3,126 |
| 1998 | 35 | 15,205 | 11,778 | 0.8 | 1,886 |
| 1999 | 32 | 10,747 | 16,674 | 1.6 | 3,343 |
| 2000 | 21 | 2,632 | 11,495 | 4.4 | 2,272 |
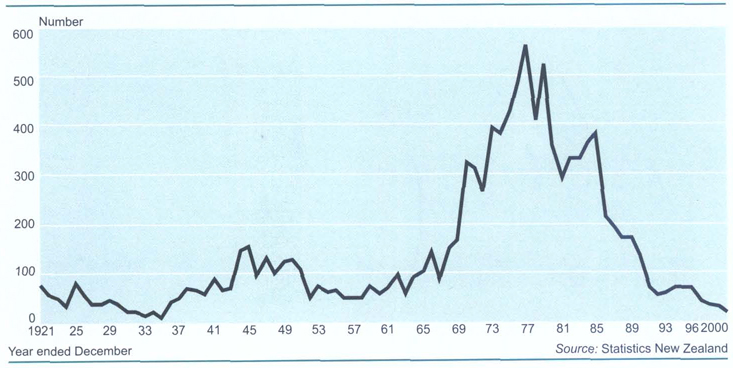
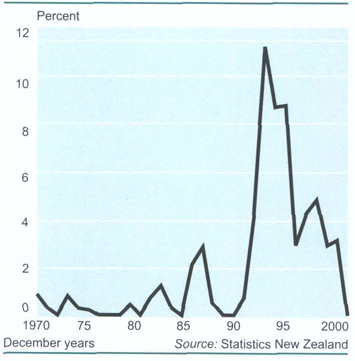
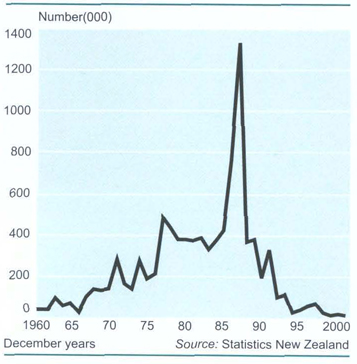
Figure 14.2 shows the percentage of all stoppages from 1970 to 2000 that involved lockouts.
The health and community services industry accounted for more than 25 percent of the 21 stoppages that occurred in 2000. However, the manufacturing industry had the greatest number of employees involved, 1,285 being nearly half of the total involved.
Manufacturing also had the greatest number of person-days of work lost – 8,962, or more than 75 percent of all working days lost.
Figure 14.3 shows total person-days of work lost in New Zealand between 1960 and 2000.
Statistics on separate stoppages in the public and private sectors have been collected since 1988. Table 14.3 shows that in the 2000 calendar year slightly more than half of stoppages occurred in the public sector. However, the number of employees in the public sector is slightly less than half of those in the private sector.
Private sector totals for person-days of work lost in 2000 was 9,007, which was more than 75 percent of that recorded in the public sector.
Table 14.3. Work stoppages by institutional sector1
| Year ended 31 December | Number of stoppages | Number of employees involved2 | Person-days of work lost34 | Average person days lost per employee involved | Estimated loss in wages and salaries5 |
|---|---|---|---|---|---|
1Some stoppages may affect more than one sector. For this reason the sum of the stoppages for each sector may not equal the total number of stoppages. 2Rounded to nearest 100 employees. 3Rounded to nearest 100 days. 4Previously termed working days lost. 5Rounded to nearest $1,000. 6Central and local government. Source: Department of Labour, Statistics New Zealand | |||||
| Public sector6 | (000) | $(000) | |||
| 1990 | 43 | 21.2 | 64.2 | 3.0 | 7,205 |
| 1991 | 31 | 31.5 | 54.5 | 1.7 | 6,280 |
| 1992 | 25 | 21.9 | 21.3 | 1.0 | 2,536 |
| 1993 | 29 | 18.8 | 19.2 | 1.0 | 2,347 |
| 1994 | 24 | 6.5 | 10.2 | 1.6 | 1,206 |
| 1995 | 30 | 25.2 | 27.4 | 1.1 | 3,779 |
| 1996 | 36 | 35.2 | 45.1 | 1.3 | 6,379 |
| 1997 | 20 | 2.5 | 4.2 | 1.7 | 553 |
| 1998 | 19 | 13.6 | 8.9 | 0.7 | 1,566 |
| 1999 | 13 | 3.3 | 4.7 | 1.4 | 658 |
| 2000 | 12 | 1.3 | 2.5 | 2.0 | 498 |
| Private sector | |||||
| 1990 | 97 | 28.8 | 266.7 | 9.3 | 41,228 |
| 1991 | 43 | 20.5 | 44.5 | 2.2 | 5,297 |
| 1992 | 30 | 4.9 | 92.4 | 18.9 | 16,836 |
| 1993 | 29 | 2.5 | 4.5 | 1.8 | 516 |
| 1994 | 45 | 9.5 | 28.1 | 2.9 | 3.373 |
| 1995 | 39 | 6.8 | 26.0 | 3.8 | 3,034 |
| 1996 | 36 | 7.1 | 24.4 | 3.4 | 3,389 |
| 1997 | 22 | 5.2 | 20.4 | 4.0 | 2,573 |
| 1998 | 16 | 1.6 | 2.9 | 1.8 | 320 |
| 1999 | 19 | 7.4 | 12.0 | 1.6 | 2,685 |
| 2000 | 9 | 1.4 | 9.0 | 6.6 | 1,774 |
| All sectors | |||||
| 1990 | 137 | 50.0 | 330.9 | 6.6 | 48,433 |
| 1991 | 71 | 52.0 | 99.0 | 1.9 | 11,577 |
| 1992 | 54 | 26.8 | 113.7 | 4.2 | 19,372 |
| 1993 | 58 | 21.3 | 23.8 | 1.1 | 2,863 |
| 1994 | 69 | 16.0 | 38.3 | 2.4 | 4,580 |
| 1995 | 69 | 32.0 | 53.4 | 1.7 | 6,813 |
| 1996 | 72 | 42.3 | 69.5 | 1.6 | 9,768 |
| 1997 | 42 | 7.6 | 24.6 | 3.2 | 3,126 |
| 1998 | 35 | 15.2 | 11.8 | 0.8 | 1,887 |
| 1999 | 32 | 10.7 | 16.7 | 1.6 | 3,343 |
| 2000 | 21 | 2.6 | 11.5 | 4.4 | 2,272 |
In general terms, the labour force includes people 15 years and over who are either employed or unemployed. Statistics New Zealand collects labour force data in five ways:
Through the Household Labour Force Survey, which produces quarterly estimates of labour market indicators, including the official measure of unemployment, and is based on a sample of about 15,000 households.
Through the Quarterly Employment Survey, which counts the number of jobs in various industries.
Through the labour cost index, which surveys labour-related costs for a fixed set of job descriptions.
Through a record of work stoppages provided by the Department of Labour.
Through the five-yearly Census of Population and Dwellings.
The Department of Labour also produces statistics on the number, coverage and content of collective employment contracts covering 20 or more employees, as lodged with the Industrial Relations Service. The Ministry of Social Development provides information on registered job seekers and employment programmes offered.
Definitions of the labour force in the 1996 and 2001 Censuses and in the Household Labour Force Survey include all people who work for one hour or more a week for pay or profit (including unpaid family members working in a family enterprise), plus unemployed people who are available for and are actively seeking work. In addition, the Household Labour Force Survey counts as unemployed those who have a job to start within four weeks, regardless of whether they were actively looking for work. Definitions of the terms employed and unemployed used in the Household Labour Force Survey can be found in the Glossary.
The Household Labour Force Survey series was revised in 1998 as part of a process which follows each population census. The revision occurred for all Household Labour Force Survey series back to the September 1991 quarter.
A new estimation methodology was also introduced, which extended the range of statistics that could be produced to include households as well as individuals. The updating had a negligible effect on ratio estimates, for example on the unemployment rate. However, there were some small increases in labour force status level estimates, ie the number of people employed, unemployed and not in the labour force.
Table 14.4 shows that between December 1998 and December 2001, the number of people in employment increased by 125,500. At the same time, the number of people unemployed decreased by 37,700.
The total labour force (members of the working age population who, during their survey week, were classified as ‘employed’ or ‘unemployed’) grew by 87,800 (4.7 percent) over the three years to reach 1,963,400 in the December 2001 quarter.
The working age population (the usually resident non-institutionalised civilian population of New Zealand aged 15 years and over) increased by 67,300 (2.3 percent) in the same period.
Between the December 1998 and December 2001 quarters, the male labour force increased by 3.9 percent, while the female labour force increased by 5.5 percent. The labour force participation rates for both males and females remained steady during this period.
Table 14.4. The labour force1, December 1998–December 2001
| Employed | Unemployed | Total labour force | Not in the labour force | Working age population | Labour force participation rate | Unemployment rate | |
|---|---|---|---|---|---|---|---|
1The civilian, non-institutionalised usually resident New Zealand population aged 15 and over. Source: Household Labour Force Survey | |||||||
| Male | (000) | (percent) | (percent) | ||||
| 1998 December | 949.4 | 78.5 | 1,027.9 | 367.2 | 1,395.1 | 73.7 | 7.6 |
| 1999 March | 953.5 | 80.6 | 1,034.1 | 362.6 | 1,396.7 | 74.0 | 7.8 |
| June | 947.8 | 73.0 | 1,020.8 | 376.6 | 1,397.4 | 73.0 | 7.1 |
| September | 948.7 | 71.5 | 1,020.2 | 379.0 | 1,399.2 | 72.9 | 7.0 |
| December | 976.3 | 64.5 | 1,040.8 | 361.2 | 1,402.0 | 74.2 | 6.2 |
| 2000 March | 969.8 | 68.9 | 1,038.7 | 366.6 | 1,405.3 | 73.9 | 6.6 |
| June | 961.9 | 62.2 | 1,024.1 | 382.7 | 1,406.8 | 72.8 | 6.1 |
| September | 967.9 | 62.2 | 1,030.1 | 378.0 | 1,408.1 | 73.2 | 6.0 |
| December | 991.4 | 60.5 | 1,051.9 | 360.4 | 1,412.3 | 74.5 | 5.8 |
| 2001 March | 990.0 | 59.4 | 1,049.4 | 365.4 | 1,414.8 | 74.2 | 5.7 |
| June | 981.5 | 56.0 | 1,037.5 | 379.1 | 1,416.6 | 73.2 | 5.4 |
| September | 992.1 | 52.8 | 1,044.9 | 375.8 | 1,420.7 | 73.6 | 5.1 |
| December | 1,011.8 | 56.7 | 1,068.5 | 359.8 | 1,428.3 | 74.8 | 5.3 |
| Female | |||||||
| 1998 December | 785.8 | 62.0 | 847.8 | 624.7 | 1,472.5 | 57.6 | 7.3 |
| 1999 March | 787.6 | 61.2 | 848.8 | 626.1 | 1,474.9 | 57.5 | 7.2 |
| June | 789.1 | 57.0 | 846.1 | 629.8 | 1,475.9 | 57.3 | 6.7 |
| September | 792.8 | 52.3 | 845.1 | 632.7 | 1,477.8 | 57.2 | 6.2 |
| December | 805.5 | 51.1 | 856.6 | 624.9 | 1,481.5 | 57.8 | 6.0 |
| 2000 March | 795.8 | 57.6 | 853.4 | 630.9 | 1,484.3 | 57.5 | 6.7 |
| June | 791.3 | 52.1 | 843.4 | 642.4 | 1,485.8 | 56.8 | 6.2 |
| September | 810.9 | 45.3 | 856.2 | 631.3 | 1,487.5 | 57.6 | 5.3 |
| December | 827.0 | 44.8 | 871.8 | 619.9 | 1,491.7 | 58.4 | 5.1 |
| 2001 March | 816.4 | 49.7 | 866.1 | 628.2 | 1,494.3 | 58.0 | 5.7 |
| June | 827.4 | 44.4 | 871.8 | 623.9 | 1,495.7 | 58.3 | 5.1 |
| September | 825.5 | 44.3 | 869.8 | 629.8 | 1,499.6 | 58.0 | 5.1 |
| December | 848.8 | 46.0 | 894.8 | 611.6 | 1,506.4 | 59.4 | 5.1 |
| Total | |||||||
| 1998 December | 1,735.2 | 140.4 | 1,875.6 | 991.9 | 2,867.5 | 65.4 | 7.5 |
| 1999 March | 1,741.1 | 141.7 | 1,882.8 | 988.7 | 2,871.5 | 65.6 | 7.5 |
| June | 1,736.9 | 130.0 | 1,866.9 | 1,006.4 | 2,873.3 | 65.0 | 7.0 |
| September | 1,741.5 | 123.8 | 1,865.3 | 1,011.7 | 2,877.0 | 64.8 | 6.6 |
| December | 1,781.8 | 115.6 | 1,897.4 | 986.1 | 2,883.5 | 65.8 | 6.1 |
| 2000 March | 1,765.6 | 126.5 | 1,892.1 | 997.5 | 2,889.6 | 65.5 | 6.7 |
| June | 1,753.2 | 114.3 | 1,867.5 | 1,025.1 | 2,892.6 | 64.6 | 6.1 |
| September | 1,778.8 | 107.5 | 1,886.3 | 1,009.3 | 2,895.6 | 65.1 | 5.7 |
| December | 1,818.4 | 105.3 | 1,923.7 | 980.2 | 2,903.9 | 66.2 | 5.5 |
| 2001 March | 1,806.3 | 109.1 | 1,915.4 | 993.5 | 2,908.9 | 65.8 | 5.7 |
| June | 1,808.9 | 100.3 | 1,909.2 | 1,003.1 | 2,912.3 | 65.6 | 5.3 |
| September | 1,817.6 | 97.1 | 1,914.7 | 1,005.5 | 2,920.2 | 65.6 | 5.1 |
| December | 1,860.7 | 102.7 | 1,963.4 | 971.4 | 2,934.8 | 66.9 | 5.2 |
While labour force participation rates have remained steady for both males and females, there is a distinct difference between male and female participation rates. For the year ended December 2001, the overall labour force participation rate for males was 74.8 percent and 59.4 percent for females.
Table 14.5 shows that in the year ended December 2001, women made up 45.6 percent of the labour force. This compares with 44.6 percent five years before and 43.5 percent 10 years before.
Table 14.5. Females in the labour force 1991–2001
| December quarter | |||||||||
|---|---|---|---|---|---|---|---|---|---|
| Female | Total | Female as percent of total | |||||||
| Employed | Unemployed | Total labour force | Employed | Unemployed | Total labour force | Employed | Unemployed | Total labour force | |
| Source: Household Labour Force Survey | |||||||||
| (000) | (percent) | ||||||||
| 1991 | 646.8 | 66.8 | 713.6 | 1,467.5 | 173.7 | 1,641.2 | 44.1 | 38.5 | 43.5 |
| 1996 | 780.7 | 46.2 | 826.9 | 1,744.3 | 110.1 | 1,854.4 | 44.8 | 42.0 | 44.6 |
| 2001 | 848.8 | 46.0 | 894.8 | 1,860.7 | 102.7 | 1,963.4 | 45.6 | 44.8 | 45.6 |
The differences in male and female labour force participation is particularly evident when the participation rates are broken down by age groups (table 14.6 and Figure 14.4). Female participation in the labour force is lower than male participation at every age group. This disparity is most marked in the 25 to 39-year group, which includes the main childbearing ages.
Table 14.6. Labour force participation rates by sex, December 2001 quarter
| Age group | Male | Female | Total |
|---|---|---|---|
| Source: Household Labour Force Survey | |||
| 15–19 | 54.1 | 52.9 | 53.5 |
| 20–24 | 80.0 | 68.1 | 74.2 |
| 25–29 | 90.2 | 69.3 | 79.4 |
| 30–34 | 91.4 | 66.4 | 78.3 |
| 35–39 | 92.1 | 71.8 | 81.6 |
| 40–44 | 91.6 | 81.6 | 86.4 |
| 45–49 | 91.8 | 82.0 | 86.8 |
| 50–54 | 90.2 | 76.8 | 83.5 |
| 55–59 | 83.0 | 60.4 | 71.7 |
| 60–64 | 63.8 | 41.7 | 52.6 |
| 65 and over | 13.4 | 4.8 | 8.7 |
| Total all ages | 73.9 | 58.4 | 66.0 |
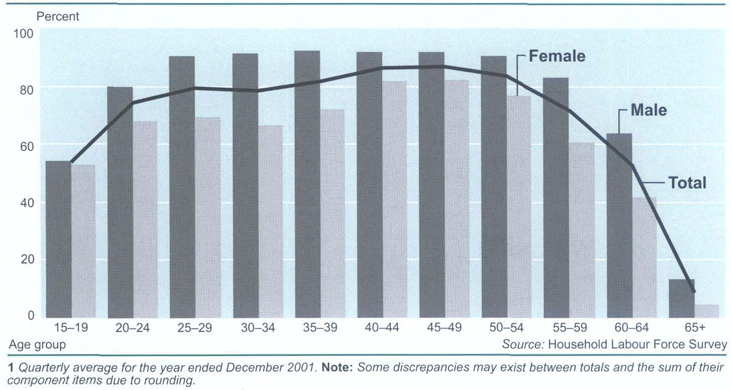
National Advisory Council on the Employment of Women (NACEW). The function of the NACEW is to advise the Minister of Labour on all matters relating to the employment of women and to promote the dissemination of information on the employment of women in New Zealand and overseas. The council has 18 members, eight of whom, including the chairperson, are appointed by the Minister of Labour for their knowledge and experience of women's employment issues. The remaining members represent the Ministry of Education, the Ministry of Women's Affairs, the Department of Labour, the Ministry of Māori Development, the Ministry of Social Development, the State Services Commission, the Council of Trade Unions and Business New Zealand. A major survey commissioned by the NACEW in 1998 gathered information on childcare arrangements and the relationship between childcare and employment. The survey was attached to Statistics New Zealand's Household Labour Force Survey for the September quarter 1998. Findings of the survey are available on the NACEW website www.nacew.govt.nz
People are classified as working full time if their usual hours of work total 30 or more a week. Those whose usual hours of work are between 1 and 29 hours a week are classified as working part time. For the year ended December 2001, 1,409,700 people were employed in full-time work and 413,700 in part-time work (see table 14.7). Compared with five years ago, full-time employment increased by 5 percent and part-time employment increased by 7.2 percent. In the decade from December 1991, full-time employment increased by 22.2 percent and part-time employment increased by 33.8 percent.
Women make up the bulk of part-time workers, 300,700 in 2001 compared with 112,900 males. However, the rate at which males are taking up part-time employment is higher than for females. The number of males working part time increased by 15.3 percent between December 1996 and December 2001, while the number of females working part time increased by only 4.4 percent. The rate at which females took up full-time employment was greater than males for the same period.
From December 1996 to December 2001, the number of females working full time increased by 8.5 percent, while the number of males working full time grew by only 2.9 percent.
Figure 14.5 shows the number of people employed in New Zealand between 1985 and 2001, while table 14.7 shows full and part-time employment by sex in 1991, 1996 and 2001.
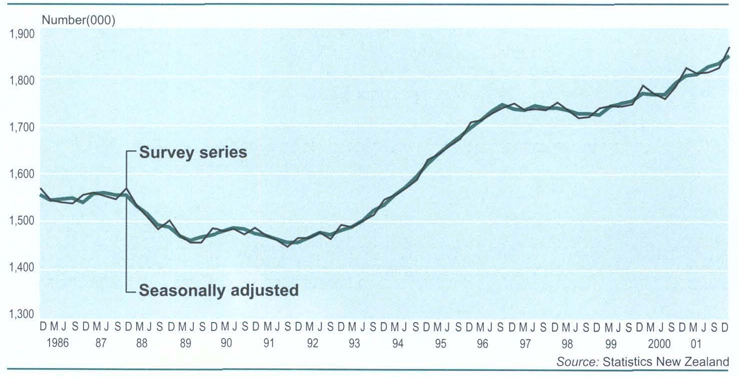
Table 14.7. Full-time and part-time employment by sex1
| Year | Employed full time | Employed part time | Employed total | ||||||
|---|---|---|---|---|---|---|---|---|---|
| Male | Female | Total | Male | Female | Total | Male | Female | Total | |
1Annual average for the year ended December Source: Household Labour Force Survey | |||||||||
| (000) | (000) | (000) | |||||||
| 1991 | 739.3 | 414.2 | 1,153.4 | 79.6 | 229.5 | 309.1 | 818.8 | 643.7 | 1,462.5 |
| 1996 | 855.9 | 487.2 | 1,343.1 | 97.9 | 287.9 | 385.8 | 953.8 | 775.1 | 1,728.9 |
| 2001 | 880.9 | 528.8 | 1,409.7 | 112.9 | 300.7 | 413.7 | 993.9 | 829.5 | 1,823.4 |
Information on the number of hours worked in a week is collected by Statistics New Zealand from two sources:
The Household Labour Force Survey (HLFS), which asks respondents for the number of hours they actually worked in the survey reference week and for the hours they usually work each week. Where the actual and usual hours differ, the main reason for the difference is also collected.
The Quarterly Employment Survey (QES), which asks enterprises for details of the number of paid ordinary and overtime hours worked by employees in the surveyed week.
Average total weekly paid hours increased on an annual basis during the early to mid-1990s. Decreases in overtime hours were more than compensated for by increasing ordinary time hours. Substitution of overtime hours for ordinary time hours was most likely related to introduction of the Employment Contracts Act in 1991 and its replacement, the Employment Relations Act 2001, which extended the range of hours defined as ‘ordinary time’. This increase in hours continued until February 1995, when the average full-time equivalent employee worked 38.93 hours a week. Since then, average total weekly paid hours have decreased each consecutive year. This may reflect stronger growth in part-time work, as well as decreasing ordinary time and overtime hours, as highlighted in table 14.8. The decrease in average total weekly paid hours can be seen for both male and female employees.
Table 14.8. Average weekly paid hours by sex, 1991–2001
| Year as at February | Males | Females | Total | ||||||
|---|---|---|---|---|---|---|---|---|---|
| Ordinary time | Over-time | Total | Ordinary time | Over-time | Total | Ordinary time | Over-time | Total | |
| Source: Quarterly Employment Survey | |||||||||
| 1991 | 37.41 | 2.44 | 39.86 | 35.28 | 0.97 | 36.25 | 36.47 | 1.79 | 38.27 |
| 1992 | 37.74 | 2.22 | 39.96 | 35.50 | 0.80 | 36.30 | 36.74 | 1.59 | 38.33 |
| 1993 | 38.11 | 2.22 | 40.33 | 36.68 | 0.72 | 36.40 | 37.02 | 1.54 | 38.57 |
| 1994 | 38.28 | 2.14 | 40.41 | 35.76 | 0.71 | 36.46 | 37.14 | 1.49 | 38.64 |
| 1995 | 38.50 | 2.25 | 40.74 | 35.97 | 0.73 | 36.70 | 37.36 | 1.56 | 38.93 |
| 1996 | 38.56 | 2.11 | 40.68 | 35.98 | 0.65 | 36.63 | 37.40 | 1.45 | 38.85 |
| 1997 | 38.38 | 1.94 | 40.32 | 35.89 | 0.61 | 36.50 | 37.26 | 1.34 | 38.60 |
| 1998 | 38.31 | 1.79 | 40.10 | 35.64 | 0.61 | 36.25 | 37.09 | 1.25 | 38.34 |
| 1999 | 38.43 | 1.59 | 40.02 | 35.63 | 0.54 | 36.17 | 37.14 | 1.10 | 38.24 |
| 2000 | 38.56 | 1.58 | 40.14 | 35.44 | 0.61 | 36.05 | 37.10 | 1.13 | 38.23 |
| 2001 | 38.61 | 1.52 | 40.13 | 35.07 | 0.60 | 35.67 | 36.94 | 1.09 | 38.02 |
Table 14.9 shows how actual hours worked per week (as opposed to usual hours) changed between 1996 and 2001. The 40-hour week was still worked by the largest number of people. The number of people working these hours increased by 10.7 percent, with the largest percentage increase for females (16.5 percent compared with 7 percent for males). The 40-hour week also had the biggest percentage increase for those that specified a number of hours worked, followed by 10–19 hours a week. Between 1996 and 2001, the largest increases for males were in the 10–19 hours band (up 12.3 percent), followed by the 20–29 hours band (up 8.8 percent). For females, the largest increase was in the 40-hour band, followed by the 30–34 hours band. People employed who worked zero hours are those who were not at work during their reference week for the survey. This may have been for a variety of reasons, including holiday leave or illness.
Table 14.9. Employed persons by actual hours worked, 1996 and 20011
| Actual hours worked per week | Males | Females | Total | ||||||
|---|---|---|---|---|---|---|---|---|---|
| 1996 | 2001 | Change | 1996 | 2001 | Change | 1996 | 2001 | Change | |
1Annual average for the year ended December. Same discrepancies may exist between totals, the sum of the component items and the percentage change due to rounding. Source: Household Labour Force Survey | |||||||||
| (000) | (000) | percent | (000) | (000) | percent | (000) | (000) | percent | |
| 0 hours | 57.4 | 62.0 | 8.0 | 62.6 | 64.8 | 3.5 | 120.0 | 126.7 | 5.7 |
| 1–9 | 33.3 | 35.1 | 5.2 | 73.7 | 69.9 | -5.2 | 107.1 | 105.0 | -2.0 |
| 10–19 | 40.7 | 45.7 | 12.3 | 97.5 | 105.4 | 8.2 | 138.2 | 151.1 | 9.4 |
| 20–29 | 43.7 | 47.5 | 8.8 | 103.8 | 112.6 | 8.4 | 147.5 | 160.1 | 8.5 |
| 30–34 | 53.9 | 55.4 | 2.8 | 68.9 | 77.2 | 12.0 | 122.9 | 132.6 | 7.9 |
| 35–39 | 44.0 | 42.8 | -2.7 | 68.5 | 67.1 | -2.1 | 112.6 | 109.9 | -2.3 |
| 40 hours | 245.0 | 262.0 | 7.0 | 160.4 | 186.8 | 16.5 | 405.4 | 448.8 | 10.7 |
| 41–44 | 46.0 | 43.9 | -4.5 | 27.5 | 23.9 | -13.2 | 73.5 | 67.8 | -7.7 |
| 45–49 | 112.6 | 118.5 | 5.2 | 41.4 | 43.1 | 4.0 | 154.0 | 161.6 | 4.9 |
| 50 and above | 275.5 | 276.9 | 0.5 | 69.6 | 75.8 | 9.0 | 345.1 | 352.7 | 2.2 |
| Not specified | 1.6 | 4.0 | 144.9 | 1.2 | 3.0 | 157.7 | 2.8 | 7.0 | 150.2 |
| Total | 953.8 | 993.9 | 4.2 | 775.1 | 829.5 | 7.0 | 1,728.9 | 1,823.4 | 5.5 |
Times of day New Zealanders work The first national Time Use Survey, conducted in 1998/99, showed that at any given time of the day or week, someone was at work. In that sense, New Zealand has a 24-hour, 7-day a week economy. The majority of paid work continues, however, to take place at traditional times on weekdays. Figure 14.6, showing the percentage of workers who were at work at each time of the day on weekdays, illustrates the concentration of paid work between the hours of 7am and 6pm. Figure 14.6 shows that many people have an early start to their working day. By 7am, around 18 percent of males and 9 percent of females are already at work. During peak hours in mid-morning, up to 84 percent of the men who work that day, and up to 75 percent of the women, are at work. Participation rates are also high in the early afternoon, but fall rapidly between 4pm and 7pm. Between midnight and 4am, very few of the day's workers are at work: on average only around 3 percent. Approximately 13 percent of working hours were worked on a Saturday or Sunday. During weekends, as on weekdays, paid work was concentrated within daylight hours. Analysis of individuals’ working days suggests few people work solely at non-traditional times, such as in the evening or at night. The majority of those who recorded some paid work after 6pm or before 8am, also worked within the core period of 8am and 6pm and simply spread part of their working day into non-traditional hours. Average working time patterns vary a good deal across industries and occupations. Workers in industries that maintain essential 24-hour services, such as health care professionals, transportation workers and protective service workers, recorded rates of participation in evening, night and weekend work that were well above national averages. Variations in working-time patterns reflect the influence of a wide range of factors, including the nature of production processes and the timing of the demand for different products and services. Source: Department of Labour |
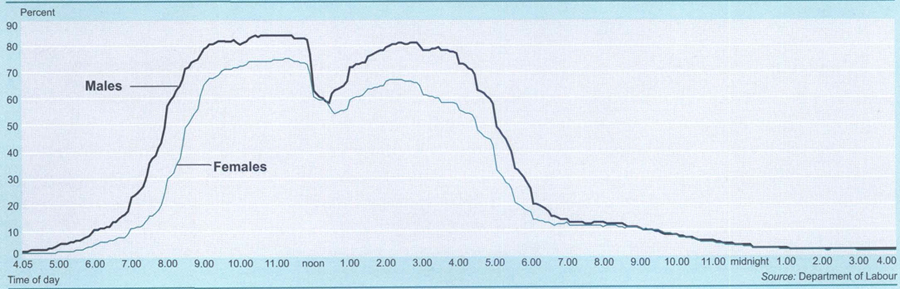
Table 14.10 shows that the majority of employed people were employees (wage or salary earners) in their main job. In the year ended December 2001, 80.1 percent of employed people were employees. The next largest category was the self employed (and not employing others), accounting for 11.8 percent of the employed. While the number of employees are similar for males and females, males dominate the employer and self-employed categories, comprising 70.2 percent and 68.9 percent respectively for the year ended December 2001. The unpaid relative assisting category is dominated by females, who made up 64.3 percent of this group.
There were a number of shifts in employment status between 1996 and 2001 when the total number of employed people increased by 94,500 (5.5 percent). The number of employees increased by 97,800 (7.2 percent) and the number of employers grew by 1,400 (1.1 percent). There was an increase of 4,100 (1.9 percent) in the number of self-employed (and not employing others), while the number of unpaid relatives assisting fell by 5,100 (24.5 percent).
Table 14.1. Status in employment of employed people, 1996 and 20011
| Status | Males | Females | Total | ||||||
|---|---|---|---|---|---|---|---|---|---|
| 1996 | 2001 | Change | 1996 | 2001 | Change | 1996 | 2001 | Change | |
1Quarterly averages for the years ended December 1996 and December 2001… Denotes estimates fewer than 1,000. Note: Some discrepancies may exist between totals and the sum of their component items due to rounding. Source: Household Labour Force Survey | |||||||||
| (000) | percent | (000) | percent | (000) | percent | ||||
| Employee | 705.4 | 747.7 | 6.0 | 657.7 | 713.3 | 8.5 | 1,363.2 | 1,461.0 | 7.2 |
| Employer | 93.8 | 92.5 | -1.4 | 36.6 | 39.3 | 7.4 | 130.4 | 131.8 | 1.1 |
| Self employed | 145.7 | 148.0 | 1.6 | 64.8 | 66.7 | 2.9 | 210.6 | 214.7 | 1.9 |
| Unpaid relative assisting | 6.7 | 5.6 | -16.4 | 14.1 | 10.1 | -28.4 | 20.8 | 15.7 | -24.5 |
| Not specified | 2.1 | ... | ... | 1.8 | ... | ... | 3.9 | ... | ... |
| Total | 953.8 | 993.9 | 4.2 | 775.1 | 829.5 | 7.0 | 1,728.9 | 1,823.4 | 5.5 |
The nature of the New Zealand economy changed in the last 15 years of the 20th century and as a result more people became employed in the services sector (wholesale and retail trade, business and financial services and community, social and personal services) and fewer in manufacturing.
Table 14.11 shows the average number of employed people by industry in the year ended December 2001. The largest number of employed people worked in the community, social and personal services area (26.6 percent); followed by wholesale and retail trade, restaurants and hotels (22.2 percent); and manufacturing (15.8 percent). Divisions that employed the least number of people were electricity, gas and water supply; and mining; which each employed less than 1 percent of the total employed.
Male employment was highest in the wholesale and retail trade, restaurants and hotels and in manufacturing (which both employed 20.7 percent of males), followed by community, social and personal services (16.2 percent). Combined, they accounted for 57.2 percent of male employment. Females made up 45.5 percent of the employed, with 66.9 percent of employed females in community, social and personal services and 49.2 percent in wholesale and retail trade, restaurants and hotels.
Figures 14.7 and 14.8 compare full-time male and female employment by industry in 1996 and 2001.
Figure 14.7. Full-time male employment
By industry, 1996
and 2001
Karen Mellish, dump truck driver, works in the male-dominated plant and machine-operator sector.
Employment for women was concentrated in two occupation groups. The largest group for women was service and sales workers, accounting for 21.4 percent of female employment. This was followed by the clerks group, in which 20.0 percent of women were employed. The smallest group for women was trades workers, in which only 1.4 percent were employed. So-called ‘male’ and ‘female’ occupations continue to exist in the New Zealand labour force. Males are over-represented compared with females as agriculture and fishery workers; trades workers; plant and machine operators and assemblers; and legislators, administrators and managers. Women are over-represented in the service and sales; and clerk occupations.
The official measure of unemployment in New Zealand is the Household Labour Force Survey, in which unemployed people are defined as all persons in the working age population who, during the reference week, were without a paid job, were available for work and had actively sought work in the past four weeks, or had a new job to start within four weeks. A person whose only job search method in the previous four weeks had been to look at job advertisements in newspapers is not considered to be actively seeking work. Figure 14.9 shows the unemployment rate in New Zealand from 1985 to 2001 and Figure 14.10 shows the number of registered job seekers from 1953 to 2000.
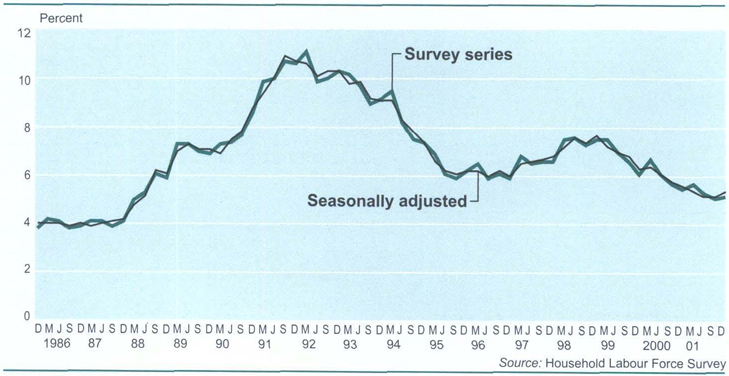
Figure 14.1. Number of registered job seekers
Annual averages
(excludes vacation workers), 1953–2000
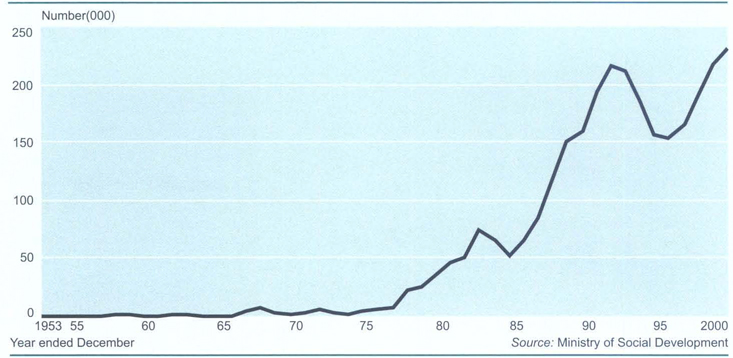
1Numbers for 1999 and 2000 are affected by policy changes which required a wider range of income support clients and their partners to register as job seekers.
In the year ended December 2001, an average of 102,300 people were counted by the Household Labour Force Survey as being unemployed. This was equivalent to 5.3 percent of the total labour force. Unemployment rates for males and females were very similar, at 5.4 percent and 5.3 percent respectively.
Variations in unemployment rates are wider when demographic and social characteristics are taken into account. Table 14.13 shows the average number of unemployed in the year ended December 2001 by educational attainment. The unemployment rate is highest among those people with no educational qualifications (8.7 percent) and lowest for those people with post-school and school qualifications (3.5 percent).
Table 14.13. Number of unemployed people by educational attainment, 20011
| Educational attainment | Number of unemployed | Unemployment rate | ||||
|---|---|---|---|---|---|---|
| Male | Female | Total | Male | Female | Total | |
1Quarterly average fur the year ended December 2001. … Denotes estimates fewer than 1,000 and subject to sampling errors too great for most practical purposes. Note: Some discrepancies may exist between totals and the sum of their component items clue to rounding. Source: Statistics New Zealand | ||||||
| (000) | percent | |||||
| No qualifications | 19.9 | 13.3 | 33.2 | 9.2 | 8.0 | 8.7 |
| School qualification | 14.2 | 13.1 | 27.3 | 5.9 | 5.3 | 5.6 |
| Post-school but no school qualification | 6.0 | 5.1 | 11.1 | 5.2 | 8.0 | 6.2 |
| Post-school and school qualification | 16.0 | 14.5 | 30.5 | 3.4 | 3.7 | 3.5 |
| Not specified | … | … | … | … | … | … |
| Total | 56.1 | 46.0 | 102.3 | 5.4 | 5.3 | 5.3 |
The percentage unemployed with no qualifications decreased in the 1991–2001 intercensal period, from 40.8 percent to 32.4 percent, while the percentage with post-school and school qualifications increased from 21.7 percent to 29.8 percent. Table 14.14 compares the number of unemployed people by qualification for the three census years of 1991, 1996 and 2001.
Table 14.14. Numbers of unemployed people by qualification, 1991–20011
| No qualification | School qualification | Post-school but no school qualification | Post-school and school qualification | Not specified | Total unemployed | |
|---|---|---|---|---|---|---|
1Figures for the year ended December. … Denotes estimates (ewer than 1,000 and subject to sampling errors too great for most practical purposes. Note: Some discrepancies may exist between totals and the sum of their component items due to rounding. Source: Household Labour Force Survey | ||||||
| Year | (000) | |||||
| 1991 | 68.3 | 43.7 | 17.4 | 36.4 | 1.8 | 167.6 |
| 1996 | 44.0 | 28.7 | 11.0 | 28.1 | … | 112.4 |
| 2001 | 33.2 | 27.3 | 11.1 | 30.5 | … | 102.3 |
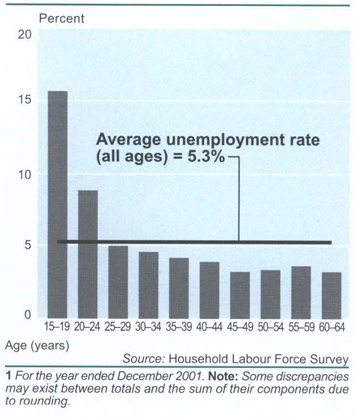
Unemployment was highest among younger age groups in 2001. Table 14.15 shows the rate of unemployment for 15 to 19-year-olds was nearly three times as high as the overall rate of unemployment. Similarly, the unemployment rate of 20 to 24-year-olds was also significantly higher than the overall unemployment rate. The lowest unemployment rates were in all the age groups from 45 to 49 years and above. Figure 14.11 shows the unemployment rate by age for 2001.
Table 14.15. Unemployed people by age, 20011
| Age | Number of unemployed | Unemployment rate | ||||
|---|---|---|---|---|---|---|
| Male | Female | Total | Male | Female | Total | |
1Quarterly average for the year ended December 2001. … Denotes estimates fewer than 1,000 and subject to sampling errors too great for most practical purposes. Note: Some discrepancies may exist between totals and the sum of their component items due to rounding. Source: Statistics New Zealand | ||||||
| (000) | percent | |||||
| 15–19 | 12.5 | 10.6 | 23.0 | 16.2 | 14.9 | 15.6 |
| 20–24 | 9.5 | 7.4 | 16.9 | 9.1 | 8.6 | 8.9 |
| 25–29 | 5.8 | 4.3 | 10.1 | 5.3 | 4.8 | 5.1 |
| 30–34 | 5.1 | 5.0 | 10.1 | 4.2 | 5.1 | 4.6 |
| 35–39 | 5.3 | 4.9 | 10.2 | 4.0 | 4.4 | 4.2 |
| 40–44 | 5.4 | 4.7 | 10.1 | 4.2 | 3.9 | 4.0 |
| 45–49 | 3.8 | 3.4 | 7.1 | 3.2 | 3.1 | 3.2 |
| 50–54 | 3.5 | 3.2 | 6.7 | 3.2 | 3.5 | 3.4 |
| 55–59 | 3.2 | 1.7 | 4.9 | 4.2 | 3.0 | 3.7 |
| 60 and over | 1.8 | … | 2.7 | 3.8 | … | 3.3 |
| Total | 56.1 | 46.0 | 102.3 | 5.4 | 5.3 | 5.3 |
In the decade 1991 to 2001, there was an increase in the percentage of the unemployed aged 15 to 19 years and in all the age groups from 35 to 39 years and older (see table 14.16). The percentage of unemployed aged 20 to 24 decreased from 21.1 percent to 16.5 percent, with the 25 to 29 and 30 to 34-year groups also decreasing.
Table 14.16. Percentage of unemployed people by age, 1991–20011
| Year | Age | |||||||||||
|---|---|---|---|---|---|---|---|---|---|---|---|---|
| 15–19 | 20–24 | 25–29 | 30–34 | 35–39 | 40–44 | 45–49 | 50–54 | 55–59 | 60–64 | 65 and over | Total all ages | |
1Figures for the December quarter. …Denotes estimates fewer than 1,000 and subject to sampling errors too great for most practical purposes. Note: Some discrepancies may exist between totals and the sum of their component items due to rounding. Source: Statistics New Zealand | ||||||||||||
| Percent | ||||||||||||
| 1991 | 20.1 | 21.1 | 14.6 | 12.3 | 9.0 | 7.8 | 6.0 | 5.0 | 3.3 | … | … | 100 |
| 1996 | 21.2 | 17.3 | 12.4 | 11.3 | 9.8 | 9.2 | 7.7 | 5.6 | 4.0 | 1.4 | … | 100 |
| 2001 | 22.5 | 16.5 | 9.9 | 9.9 | 10.0 | 9.9 | 6.9 | 6.5 | 4.8 | 2.6 | … | 100 |
Unemployment rates for Māori and Pacific peoples are higher than the rate for New Zealand Europeans. Table 14.17 shows the average unemployment rate for New Zealand Europeans was 3.9 percent, 12.3 percent for Māori and 9.6 percent for Pacific peoples for the year ended December 2001.
Table 14.17. Unemployed people by ethnicity1, 20012
| Number unemployed | Unemployment rate | |||||
|---|---|---|---|---|---|---|
| Male | Female | Total | Male | Female | Total | |
1Ethnic origin is self determined by respondents. They can choose up to three different ethnic origins. A person who identifies with more than one ethnic group will he counted more than once ie, counted in each of the ethnic groups they have identifies as belonging to, 2Quarterly average for the year ended December 2001. …Denotes estimates fewer than 1,000 and subject to sampling errors too great for most practical purposes. Note: Some discrepancies may exist between totals and the sum of their component items due to rounding. Source: Household Labour Force Survey | ||||||
| (000) | percent | |||||
| European | 32.8 | 27.2 | 60.0 | 3.9 | 3.9 | 3.9 |
| NZ Māori | 11.8 | 11.2 | 23.0 | 11.9 | 12.7 | 12.3 |
| Pacific peoples | 5.2 | 3.0 | 8.1 | 10.8 | 8.1 | 9.6 |
| Other | 6.3 | 4.7 | 11.0 | 9.1 | 8.3 | 8.7 |
| Not specified | … | … | … | … | … | … |
| Total | 56.1 | 46.0 | 102.3 | 5.4 | 5.3 | 5.3 |
Short-term unemployment is defined in the Household Labour Force Survey as unemployed for 26 weeks or fewer, and long-term unemployment as for 27 weeks or more. Table 14.18 shows how the numbers of people unemployed by duration have changed in recent years. In 1991, the long-term unemployed accounted for an average of 45.2 percent of those unemployed who specified a duration in the year to December 1991. Five years later, they accounted for 36.6 percent and in the year to December 2001, an average of 31.1 percent of those unemployed who specified a duration were long term.
Table 14.18. People unemployed by duration of unemployment and sex, 1991–20011
| Weeks | ||||||||
|---|---|---|---|---|---|---|---|---|
| Up to 4 | 5 to 8 | 9 to 13 | 14 to 26 | 27 to 52 | 53 or over | Not specified | Total | |
1Quarterly average for the year ended December. Note: Some discrepancies may exist between totals and the sum of their component items due to rounding. Source: Household Labour Force Survey | ||||||||
| Male | (000) | |||||||
| 1991 | 12.5 | 9.4 | 8.1 | 16.8 | 21.1 | 25.5 | 6.4 | 99.9 |
| 1992 | 10.1 | 7.5 | 7.6 | 15.4 | 19.5 | 34.0 | 6.9 | 101.1 |
| 1993 | 10.4 | 7.0 | 6.7 | 13.0 | 17.3 | 33.1 | 6.5 | 94.0 |
| 1994 | 10.4 | 6.5 | 5.9 | 10.7 | 13.7 | 27.5 | 7.1 | 81.7 |
| 1995 | 10.0 | 5.7 | 5.4 | 7.7 | 10.4 | 16.6 | 6.0 | 61.8 |
| 1996 | 11.7 | 6.7 | 5.6 | 9.7 | 9.3 | 13.6 | 5.3 | 61.9 |
| 1997 | 13.2 | 7.4 | 6.2 | 10.5 | 11.4 | 13.9 | 5.2 | 67.9 |
| 1998 | 12.7 | 9.5 | 7.0 | 12.9 | 13.3 | 16.2 | 5.7 | 77.4 |
| 1999 | 10.8 | 8.6 | 5.6 | 12.7 | 12.8 | 15.1 | 6.8 | 72.4 |
| 2000 | 12.0 | 7.4 | 5.8 | 9.2 | 9.3 | 13.1 | 6.6 | 63.4 |
| 2001 | 12.2 | 7.6 | 4.5 | 8.4 | 7.3 | 9.7 | 6.5 | 56.1 |
| Female | ||||||||
| 1991 | 11.8 | 8.2 | 7.0 | 11.1 | 12.0 | 11.5 | 6.0 | 67.7 |
| 1992 | 9.3 | 6.5 | 6.1 | 10.6 | 13.8 | 16.2 | 6.1 | 68.7 |
| 1993 | 10.5 | 6.4 | 5.9 | 9.8 | 11.2 | 15.6 | 5.6 | 64.8 |
| 1994 | 10.4 | 5.8 | 5.4 | 8.5 | 8.8 | 13.7 | 6.0 | 58.6 |
| 1995 | 10.8 | 5.4 | 4.5 | 6.7 | 7.2 | 8.7 | 6.3 | 49.7 |
| 1996 | 11.8 | 6.5 | 5.1 | 7.6 | 6.9 | 7.6 | 4.9 | 50.4 |
| 1997 | 12.5 | 7.7 | 5.7 | 8.1 | 7.6 | 7.9 | 5.9 | 55.5 |
| 1998 | 13.9 | 8.6 | 5.9 | 8.6 | 10.3 | 8.5 | 5.9 | 61.8 |
| 1999 | 11.8 | 6.8 | 5.4 | 8.5 | 8.0 | 8.8 | 6.1 | 55.4 |
| 2000 | 11.5 | 5.9 | 5.0 | 7.6 | 7.7 | 6.3 | 6.0 | 50.0 |
| 2001 | 12.9 | 6.6 | 4.3 | 5.7 | 5.7 | 5.4 | 5.5 | 46.0 |
| Total | ||||||||
| 1991 | 24.4 | 17.6 | 15.2 | 27.9 | 33.2 | 37.0 | 12.4 | 167.6 |
| 1992 | 19.4 | 14.1 | 13.8 | 26.0 | 33.4 | 50.2 | 13.0 | 169.8 |
| 1993 | 20.9 | 13.4 | 12.6 | 22.8 | 28.4 | 48.6 | 12.1 | 158.8 |
| 1994 | 20.8 | 12.3 | 11.3 | 19.2 | 22.5 | 41.2 | 13.0 | 140.4 |
| 1995 | 20.9 | 11.1 | 9.9 | 14.4 | 17.6 | 25.3 | 12.3 | 111.5 |
| 1996 | 23.4 | 13.2 | 10.8 | 17.3 | 16.2 | 21.2 | 10.2 | 112.3 |
| 1997 | 25.6 | 15.1 | 11.9 | 18.6 | 19.1 | 21.8 | 11.1 | 123.3 |
| 1998 | 26.6 | 18.1 | 13.0 | 21.5 | 23.6 | 24.8 | 11.6 | 139.1 |
| 1999 | 22.6 | 15.4 | 11.1 | 21.2 | 20.8 | 23.9 | 12.9 | 127.8 |
| 2000 | 23.5 | 13.3 | 10.7 | 16.9 | 17.0 | 19.4 | 12.6 | 113.4 |
| 2001 | 25.1 | 14.2 | 8.8 | 14.1 | 13.0 | 15.1 | 12.0 | 102.3 |
New Zealand needs to develop a highly-skilled, flexible and productive workforce if it is to achieve levels of economic growth that will improve its competitive advantage as a small player in a global economy. Equipping New Zealanders with tomorrow's skills improves not just individual job prospects, but the economic prospects of the nation.
Skill New Zealand is a Crown agency which assists learners and industry throughout New Zealand from a national office in Wellington and a network of 11 regional offices. The agency works with many stakeholder groups, including industry, educators, Māori and Pacific peoples. Skill New Zealand purchases quality training on behalf of the government for these groups. The agency works closely with the Ministry of Social Development, the Ministry of Education, the Ministry of Māori Development, the New Zealand Qualifications Authority, Workbridge, the Department of Labour and senior schools.
Skill New Zealand's aim is to remove barriers to employment, and to further education and training to those under-represented in the labour market or in particular areas of training. Such groups may include Māori, Pacific peoples, school leavers with low or no qualifications, and older workers with redundant or unrecognised skills.
Skill New Zealand is a leader in the development of work-related education and training. The agency contracts a wide range of education and training providers to develop innovative and effective learning pathways under Training Opportunities, Youth Training, and Skill Enhancement programmes. The aim is to empower local communities to respond quickly to the educational and training needs of their learners and employers. This practical focus is underpinned by ongoing research into adult education and learning, which enables Skill New Zealand to provide strategic leadership and promote best practice in key education and training issues.
Skill New Zealand supports workplace learning that raises skills and boosts competitive advantages for businesses. Skill New Zealand aims to improve access to structured training in the workplace throughout people's working lives. The agency purchases training in most areas of industry through Industry Training Organisations and also oversees a range of complementary initiatives at enterprise level aimed at identifying skill needs and improving productivity.
Skill New Zealand also administers Modern Apprenticeships. A key focus is on integrating capability skills, such as literacy, numeracy and communication, into workplace education and training.
Skill New Zealand is able to respond quickly to changing labour market and government policy requirements. The agency has the ability to trial new delivery designs and to tailor purchasing to evolving needs and circumstances.
In recent years, Skill New Zealand has implemented a range of new workplace learning initiatives for employed and unemployed people generally, and for Māori in particular. In the process, the agency has accumulated a great deal of organisational knowledge about what works under which circumstances for different types of trainees.
Skill New Zealand is responsible for the following major training initiatives and training support activities:
Skills for employees – The Industry Training and Modern Apprenticeships programmes working directly with enterprises to initiate structured workplace learning.
Advice to enterprises – The Working With Enterprises programme to promote skills development in the workplace.
Skills for unemployed adults – The Training Opportunities programme (including work-based training) for long-term unemployed people and Workbridge clients.
Skills for school leavers – The Youth Training programme for school leavers with no or low qualifications and the Skill Enhancement programme for young Māori and Pacific peoples.
Advice to schools – Assistance with the Ministry of Education's Secondary Tertiary Alignment Resource (STAR) and Alternative Education programmes.
Skills for school students – The Gateway programme to assist young people to make the transition from school to work.
Skills for migrants – The English for Migrants programme to assist recent migrants develop the English language skills required for the workplace.
In the year to 30 June 2001, Skill New Zealand received $21 million operational funding from the government, compared with $19.1 million in 1999/2000. Skill New Zealand also receives some funding from fees paid by migrants for English language training.
Training Opportunities. The Training Opportunities programme provides full-time, fully-funded training options to targeted clients of the Ministry of Social Development and Workbridge, enabling them to develop skills and gain credits towards nationally-recognised qualifications. This helps them move into employment or further education and training. Training Opportunities is targeted at those who are most disadvantaged in the labour market, particularly long-term unemployed people, domestic purposes beneficiaries and Workbridge clients. The majority of trainees (85 percent in the year 2000) enter the programme with no, or low qualifications. Training may focus on essential workplace skills, such as communication and cooperative skills, or it may be vocationally based, such as fishing or computing courses. Work experience is an important part of vocationally-based courses, and work-based training, where trainees are placed with employers for on-job training, is also available. Trainees may remain in the programme until they have accumulated 240 credits on the National Qualifications Framework.
Providers design the delivery of training and assessment methods around the learning needs of the individual, maximising the chances for individuals to achieve the qualifications for which they are undertaking training. Skill New Zealand purchases training pathways using contestable and other purchasing mechanisms, with a strong focus on outcomes. This results in training that is cost effective, available in a wide range of geographical localities, and which covers a diverse range of industries and delivery styles. Training is delivered in a variety of responsive learning environments, including marae, polytechnics, community organisations and the workplace. Training providers are expected to support trainees by assisting them into employment, or providing pathways into further vocational education and training.
A greater focus on outcomes in recent years has lifted the performance of Training Opportunities considerably. Generally, labour market outcomes have improved over time for all trainees participating in Training Opportunities, increasing 19 percentage points since the 1993 calendar year. Sixty-two percent of all trainees who left Training Opportunities in the 2000 calendar year achieved a positive outcome, compared with 43 percent in 1993. Most trainees moved into employment (51 percent), while 11 percent progressed onto further training or education outside the programme. Sixty percent of Māori trainees moved on to further training or employment within two months of leaving Training Opportunities. Sixty-three percent of Pacific peoples achieved a positive result on leaving the programme. A total of 22,146 individuals were placed in Training Opportunities programmes in 2000, with an average 8,235 trainees in place at any one time. Of these, 53 percent were women, while 43 percent were Māori, 37 percent European/Pākehā, 11 percent Pacific peoples and the remainder from other ethnic groups. Training was purchased from 403 providers. A total of 16,484 trainees gained credits on the National Qualifications Framework. On average, each individual participating in the programme during 2000 achieved 22 credits. The average weekly cost of training one trainee under Training Opportunities for the year to 30 June 2001 was $227 (including work-based training options). This compared with $216 in 1999/2000. Total expenses of the Training Opportunities programme for the year to June 30 2001 were $95.2 million, compared with $96.5 million in the previous year.
Youth Training. The Youth Training programme provides an alternative stream of educational and training experiences to young people who have left school with no or very low qualifications. Youth Training provides a high level of trainee support as part of the learning package, which may include literacy and numeracy skills, as well as essential workplace skills or vocationally-based skills. Work experience and work-based options are also available.
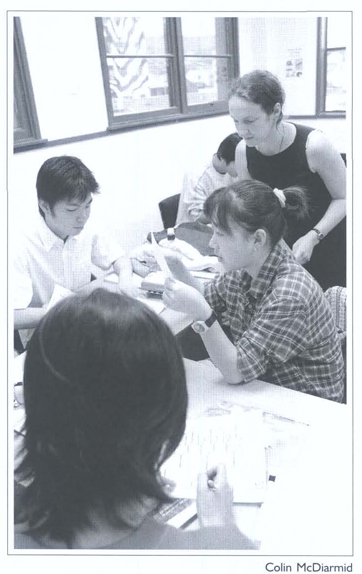
The English for Migrants programme enables migrants to access English language courses on their arrival in New Zealand.
Training and assessment methods are designed around the learning needs of the individual in a supportive environment, where personal and social difficulties may also be addressed. This maximises the chances for individuals to acquire skills and achieve qualifications. Training providers support trainees by assisting them into employment, or by providing pathways into further education. Skill New Zealand and training providers focus strongly on delivering educational and employment outcomes for young people. The programme is fully funded by the government and is free to eligible trainees. Trainees may remain in the programme until they have accumulated up to a maximum of 240 credits on the National Qualifications Framework. This is broadly equivalent to two years schooling. Sixty-five percent of all trainees who left Youth Training during 2000 moved on to further training or employment within two months of leaving the programme. Forty-three percent of these moved into employment, while 22 percent progressed on to further training or education outside the programme. Māori trainees have achieved their highest level of positive outcomes to date, with 59 percent moving into employment or further training outside the programme during 2000, compared with 57 percent in 1999. Pacific peoples also achieved positive results, with 60 percent moving on to either further training or employment within two months of leaving the programme. A total of 13,125 individuals were placed in Youth Training programmes in the year 2000. There was an average 5,531 trainees in place at any one time. Of these, 44 percent were women, while 48 percent were Māori, 39 percent European/Pākehā, 10 percent Pacific peoples and the remainder from other ethnic groups. Training was purchased from 347 providers. During 2000, 9,846 trainees achieved credits on the National Qualifications Framework. On average, each gained 19 credits, which was a significant contribution towards increasing access to quality education and training for young people with low or no school qualifications. The average weekly cost of training each trainee under the programme in the 2000/01 financial year was $223, compared with $220 in 1999/2000. For the year to 30 June 2000, total expenses of Youth Training were $64.5 million, compared with $64.4 million in the previous year.
Skill Enhancement. The Skill Enhancement programme is the successor to Māori Vocational Training (previously Māori Trade Training), transferred from Te Puni Kokiri to Skill New Zealand from 1 July 1993. The programme is delivered in two strands: Rangatahi Māia for young Māori and Tupulaga Le Lumana’i for young Pacific peoples. Skill Enhancement provides vocational training for Māori and Pacific peoples mainly aged between 16 and 21 years. Training pathways are linked to the National Qualifications Framework and include an on-job training component. Trainee outcomes sought are the achievement of educational qualifications and movement into further training or employment. Training is purchased through a combination of contestable and negotiable processes. Skill New Zealand aims to purchase training that offers a variety in terms of delivery style, learning environment, occupations and industries, and locations. Training providers must be registered with the New Zealand Qualifications Authority and are expected to provide training that leads to a qualification on the National Qualifications Framework at levels 3 and 4. In the year 2000, more than 1,082 young Māori and Pacific learners participated in Skill Enhancement. Seventy-five percent of them achieved a positive outcome within two months of leaving the programme, compared with 70 percent in 1999. Forty percent of these progressed into full-time employment, while 35 percent went on to further education. Seventy-six percent of Pacific students and 75 percent of Māori students finishing their programmes moved into employment or further training. This was well above the target of 65 percent. There was an average of 721 trainees in place at any one time during 2000. Of these, 48 percent were female, while 85 percent were Māori and 15 percent were Pacific peoples. Training was purchased from 72 providers. A total of 659 students achieved credits on the National Qualifications Framework during 2000. On average, each gained 35 credits. Ninety-three percent of learners attained at least 70 percent of the educational credits for which they were assessed. The average weekly training cost for each Skill Enhancement trainee in the 2000/01 financial year was $249, compared with $247 in 1999/2000. For the year ended 30 June 2000, total expenses of Skill Enhancement were $9.3 million, compared with $9.1 million in the previous year.
Industry training. The government's industry training strategy was introduced in 1992 to assist in the development of an internationally-competitive and highly-skilled workforce. The strategy is industry-led and is designed to be responsive to the needs of enterprises and employees. All training is assessed against national standards set by industry and earns credits and qualifications registered on the National Qualifications Framework. Skill New Zealand purchases industry training through Industry Training Organisations (ITOs) which are responsible for maintaining standards and developing and administering training within their industries (including traineeships, apprenticeships and cadetships). ITOs do not provide training themselves, but make arrangements for workplace assessment and off-job delivery. ITOs that seek government recognition and funding are required to be responsive to the needs of people who have previously been under-represented in industry training. Skill New Zealand monitors the degree to which ITOs provide for the training needs of under-represented groups in their industries and develops strategies for promoting equal access and participation. More than 22,000 employers from a wide range of industries were involved in industry training during 2000. The industry training strategy continues to deliver excellent results thanks to the efforts of participating trainees, employers and ITOs. More New Zealanders than ever before are involved in systematic industry training linked to nationally-recognised qualifications. The number of trainees grew from 16,711 apprentices and cadets in June 1992 to 63,102 trainees registered with ITOs as at 30 June 2000. These statistics demonstrate the significance of the workplace as a place of learning. Nearly one and-a-half million National Qualifications Framework credits and more than 6,000 National Certificates were achieved in the year to 31 December 2000. For many industry trainees this was their first experience of educational success and provided powerful motivation to keep learning. The benefits of industry training are being extended to a wider range of New Zealanders than ever before. During 2000, 17 percent of industry trainees were Māori and 5 percent were Pacific peoples. Māori and Pacific peoples thus accounted for nearly a quarter of those participating and their participation has nearly doubled in the past five years. The proportion of these two groups in National Qualifications Framework-linked industry training is proportionate to their representation in the labour force.
There has been a notable increase in the number of Māori participating in industry training. At 31 December 2000, Māori comprised 17 percent of industry trainees, compared with 11 percent at 30 June 1996. This compared favourably with Māori participation in the labour force, which was 10 percent at 31 March 2001. More than 70 percent of Māori trainees were in level 3 or higher industry training programmes during 2000 and more than half the National Certificates achieved by Māori were at level 4 of the National Qualifications Framework. There has also been a gradual upward trend in participation levels of Pacific peoples in industry training. The participation level of Pacific peoples was 2 percent in June 1996. This had increased to 5 percent at 31 December 2000 and participation levels are now consistent with levels of participation (4 percent) in the labour force. More than 40 percent of Pacific peoples were in level 3 or higher industry training programmes during the year 2000. As at 30 June 2000, 50 ITOs were recognised by Skill New Zealand. Skill New Zealand paid for 22,072 Standard Training Measures (STMs) from ITOs for the period 1 July 1999 to 30 June 2000 at an average cost of $2,776 per STM. Total expenses of industry training for the year ended 30 June 2001 were $69.7 million, compared with $62.6 million in the previous year.
English for Migrants. Since 30 November 1998, migrants applying for residency in New Zealand have been required to have a minimum level of English language skill or to have pre-purchased English language tuition. A migrant's level of English ability is assessed by the International English Language Testing System (IELTS) examination and the amount of English tuition they are required to pre-purchase is based on the result. The English for Migrants programme enables migrants who have pre-purchased tuition to access a range of English language courses on their arrival in New Zealand. Migrants have up to three and-a-half years to take up their English language training. Skill New Zealand purchases English language training on behalf of eligible migrants, including business migrants and non-principal general skills migrants. Skill New Zealand ensures that training purchased is of high quality, and advises migrants of the training options available to them. Training is pre-purchased by migrants through the New Zealand Immigration Service. Since the initiative began in March 1999, the number of migrants participating in the programme has continued to build and at 30 June 2000, 707 migrants had pre-paid English tuition fees through the New Zealand Immigration Service.
Migrants who have taken up their training are clearly demonstrating improvement in English language ability. Providers are required to report to Skill New Zealand against a nine-point learning gains scale, which is broadly equivalent to the IELTS scale. On average, migrants improve by one point on the scale after each course. Migrants may take four, five or more English training courses before completing their training entitlement. Migrants who have pre-paid for English language tuition come from a variety of countries. However, most migrants (86 percent) originate from Asian countries, with 50 percent of these coming from China. To date, 68 percent of migrants who prepaid their tuition and arrived in New Zealand have settled in the Auckland region. The number of contracted training providers increased from 33 at June 1999 to 56 at 30 June 2000. Providers include private training establishments, schools and community education providers, polytechnics and universities.
Work experience programmes help develop motivation and work discipline.
Working with enterprises. Skill New Zealand works with individual enterprises and other stakeholders to promote skills development in the workplace, and helps to get training started. The development of industry training is still progressing, and it is the agency's role to help fill gaps where the market is not yet developed. These activities complement the work done by Industry Training Organisations (ITOs). An important aspect is facilitating relationships between the key players, the enterprise, the ITO, training providers, assessors, schools and government agencies. In the year to 30 June 2001, Skill New Zealand worked with 209 enterprises (192 in 1999/2000) to encourage participation in the industry training strategy. Of these, 187 went on to develop plans to implement systematic training in the workplace. In addition, Skill New Zealand continued to assist 120 enterprises still active from previous years, 113 of which went on to develop plans to implement training. In total, 91 percent of all active enterprises were developing or implementing training arrangements for their staff during 2000/01. There were 194 employees involved in new training arrangements with enterprises that the agency worked with during 2000/01, compared with 703 in 1999/2000. During 2000/01, 78 activities were undertaken specifically to encourage employer participation and to promote skills training in the workplace. In addition, 160 general marketing activities were undertaken to encourage other stakeholders’ participation in Skill New Zealand programmes. These marketing activities included networking forums with Work and Income staff and inter-agency advisory groups, career expos, conference presentations and participation in regional employment groups. One hundred and ninety-one marketing activities were undertaken with schools during 2000/01. Regional staff continued to maintain Skill New Zealand's focus on providing support and contact with employers, making 747 employer contacts during 2000/01.
Secondary Tertiary Alignment Resource (STAR). Skill New Zealand promotes additional pathways into vocational education and training, including work and institution-based pathways, and assists in the development of comprehensive post-school pathways to ensure young people remain within education and training, or move into the labour market, preferably including an element of systematic training. This may include working with selected schools to assist with Secondary Tertiary Alignment Resources (STAR) or alternative education programmes for young people alienated from school. Throughout 2000/01, Skill New Zealand staff assisted 116 schools (79 in 1999/2000), both individually and in cluster groups, to provide brokerage and consultancy services to assist them with the ongoing development of STAR programmes. In addition, Skill New Zealand's eastern region continues to manage a contract for the delivery of alternative education programmes on behalf of a cluster of 24 schools in the region. Skill New Zealand staff continued to work closely with local Ministry of Education non-enrolment truancy service and district truancy staff. As at 30 June 2001, more than 120 learners (aged 14–15 years) had been placed with 11 education and training providers, compared with 40 learners placed with 10 providers in the previous year.
A Crown entity and New Zealand's leading provider of career information, advice and planning, Career Services: Rapuara contracts with the Associate Minister of Education (Tertiary Education) to deliver a range of services to private and public sector clients. Career Services consultants work with clients to identify skills, investigate career and training options, develop career plans, teach interview and job search techniques and prepare CVs. In the year to 30 June 2001, more than 1,100 targeted individuals received funded career action plans.
The KiwiCareers website (www.kiwicareers.govt.nz) is the most comprehensive source of career information in New Zealand. It provides free, up-to-date information and links to jobs, vacancies, industries, training, qualifications and funding available in New Zealand. KiwiCareers is funded by the government.
Career planning resources produced by Career Services include:
Courses Galore, a quick-reference book containing about 5,000 course and training opportunities available in New Zealand.
Jobs Galore, a quick-reference book containing descriptions of 693 occupations available in New Zealand.
Planit, a series of career planning workshops produced for intermediate, junior and secondary school students.
CareerQuest, a self-help, computer-aided career guidance programme designed to assist people who are making career decisions or looking for job and training ideas.
In fulfilment of its vision to ensure all New Zealanders have access to up-to-date, neutral, quality career information, Career Services provided information and advice to more than 357,000 people in the year to 30 June 2001 through its network of 18 career centres, its CareerPoint freephone service and the KiwiCareers website.
One of the roles of the Ministry of Social Development is to provide employment assistance to New Zealanders. These services are provided through the ministry's 170 Work and Income service centres throughout New Zealand. Work and Income provides a range of services to assist job seekers into paid employment:
Information services, job search skills, work confidence programmes, and Ministry of Youth Affairs development programmes: These programmes help with motivation and confidence when seeking paid work, and provide information on job search techniques and job search resources.
Work experience – These programmes provide unpaid experience in a workplace or in a situation resembling work that helps develop or maintain self-esteem, motivation, work discipline, work ethic and dignity.
Work transition grants. These assist to remove small financial barriers preventing job seekers from making the transition to unsubsidised employment.
Wage subsidies – These act as incentives for employers to provide work for job seekers.
Skills training – These programmes aim to improve job-related skills, increasing the client's chances of finding employment.
Self-employment assistance – This programme provides financial help and advice for long-term unemployed people to move into self-employment.
New initiatives – These programmes have been developed by Work and Income to respond to local labour markets; meet emerging needs of job seekers, employers and communities; trial new types of products and services; and promote learning and awareness of best practice in the design and delivery of work services.
The number of times people started programmes within each service type in the year to 30 June 2001 were:
| Service type | Number |
|---|---|
| Information, work search assistance, work confidence and Ministry of Youth Affairs development courses | 27,186 |
| Work experience | 11,061 |
| Work transition grants | 40,511 |
| Wage subsidies | 20,408 |
| Skills training | 7,770 |
| Self-employment assistance | 5,671 |
| New initiatives | 21,947 |
Job placements. Work and Income placed 88,073 people into work in the year to 30 June 2001, compared with 73,877 people in the previous June year.
Employment and training for Māori. Under the Māori Development Act 1991, the Ministry of Māori Development: Te Puni Kōkiri is responsible for providing advice on key policies as they affect Māori, including policies that lead to improvement in Māori achievement in employment and training. It does this through policy advice to the Minister of Māori Affairs, cabinet and government departments and agencies that purchase or provide training and employment services for Māori. Te Puni Kōkiri also facilitates consultation between government training and employment agencies and iwi, hapū and other Māori organisations and individuals. This includes helping Māori at local level to access appropriate government service delivery agencies.
The Community Employment Group (CEG) is a service of the Department of Labour which works alongside communities and community organisations to strengthen collective human capabilities, grow skills and knowledge, establish effective working partnerships and build capacity for positive change. In this way, the CEG assists communities to take advantage of sustainable local economic and employment opportunities.
The group works primarily with communities that face disadvantage in the labour market, particularly Māori, Pacific peoples, women and those living in disadvantaged urban and rural areas.
To assist communities to achieve their goals, the CEG operates a small national office and a network of 70 field advisers, with comprehensive community networks that range from local hapū and other grassroot collectives, to business, industry, local and central government.
CEG fieldworkers work directly with community organisations to help plan and carry out projects that improve economic and social well-being. This includes providing advice and information, assisting with strategic and project planning, helping to coordinate local employment initiatives, brokering resources and funding, and assisting with upskilling and mentoring of individuals, groups and communities.
The group also provides grant funding to assist organisations during their development and kick-start community employment initiatives.
The CEG encourages effective working partnerships with community, local government, private sector and central government stakeholders, and each case is tailored to meet the specific needs of the community.
Since its inception, the CEG has supported a wide range of community development activities. These include:
Community regeneration – the CEG has contributed to projects such as the revitalisation of Moerewa, in Northland, and the creation of a historic precinct in Oamaru.
Community enterprise – the CEG has assisted a number of community-based enterprises, including Whale Watch Kaikoura and the Community Business and Enterprise Centre (CBEC) in Kaitaia.
Recycling and ecology-based development – as well as assisting CBEC with its recycling enterprise, CEG has assisted other ecological projects, such as the Mangere WasteWise Trust's ‘wormaculture’ project, Buller's Community Fertiliser Company, and Sun First Organics, in Ruatoria.
Overcoming barriers to employment – the CEG works with groups that help people move into employment. For example, the Rotorua Women's Support Network provides a range of services to assist disadvantaged women to move into work, and the Genesis Trust, in Palmerston North, works with ex-inmates.
Information technology – the CEG provided assistance to help set up Wairoadot.com, Wairoa's community information technology access centre. CEG has also contributed to other IT projects, such as the Kapiti Telecentre.
Social entrepreneurs – the CEG is starting to fund innovative individuals who are able to get things happening in their communities. Many of these ‘social entrepreneurs’ have been behind some of the projects described above.
Capacity building – the CEG has provided a number of grants designed to build collective skills and resources in the community. This includes building the leadership capacity of Māori and Pacific women, assisting groups seeking to develop multiple-owned Māori land, improving the capacity of groups to deliver labour market services, and facilitating partnerships with other organisations.
Māori Women's Development Fund – the CEG contributes to the Māori Women's Development Fund, which assists Māori women to enter into, remain in, or expand, businesses. The fund is administered by Māori Women's Development Inc.
Income is a fundamental determinant of human welfare and life chances. It is central as a means of achieving many of the social and cultural objectives in people's lives. Information on trends in the sources and distribution of income, for both individuals and households, is vital in monitoring social change.
Table 14.19 shows the average weekly earnings by sex in New Zealand for the years 1991 to 2001.
Table 14.19. Average weekly earnings by sex
| Males | Females | Total | |||||||
|---|---|---|---|---|---|---|---|---|---|
| Ordinary time | Overtime | Total | Ordinary time | Overtime | Total | Ordinary time | Overtime | Total | |
| Source: Quarterly Employment Survey, Statistics New Zealand | |||||||||
| Year as at February | $ per week | ||||||||
| 1991 | 577.40 | 45.00 | 622.40 | 450.63 | 15.76 | 466.40 | 521.45 | 32.10 | 553.55 |
| 1992 | 599.16 | 40.93 | 640.09 | 466.27 | 13.10 | 479.37 | 539.84 | 28.50 | 568.34 |
| 1993 | 607.15 | 40.20 | 647.35 | 468.66 | 11.68 | 480.33 | 545.06 | 27.41 | 572.47 |
| 1994 | 615.24 | 39.05 | 654.29 | 474.58 | 11.72 | 486.30 | 551.98 | 26.76 | 578.73 |
| 1995 | 631.12 | 41.65 | 672.77 | 485.48 | 12.26 | 497.75 | 565.67 | 28.44 | 594.11 |
| 1996 | 652.55 | 40.00 | 692.55 | 500.35 | 11.15 | 511.49 | 583.70 | 26.95 | 610.65 |
| 1997 | 676.18 | 38.01 | 714.18 | 521.88 | 11.13 | 533.02 | 606.66 | 25.90 | 632.56 |
| 1998 | 689.12 | 35.82 | 724.94 | 536.06 | 11.09 | 547.15 | 619.19 | 24.52 | 643.71 |
| 1999 | 711.94 | 31.85 | 743.79 | 554.04 | 9.69 | 563.73 | 638.79 | 21.59 | 660.38 |
| 2000 | 725.09 | 31.68 | 756.76 | 562.64 | 11.09 | 573.73 | 649.24 | 22.06 | 671.31 |
| 2001 | 751.15 | 31.33 | 782.48 | 572.50 | 11.12 | 583.62 | 666.80 | 21.79 | 688.59 |
Major sources of information on incomes are:
The five-yearly Census of Population and Dwellings, which has contained a question on income groups since 1926. The strength of census data is that it provides information on income for subgroups of the population.
The Household Economic Survey, a survey of about 3,000 households which collects detailed income information for those aged 15 and over. The comprehensiveness of this data allows analysis of components of income at both an individual and household level, and after-tax income, to be modelled. However, the small sample size limits the amount of analysis for subgroups of the population.
The New Zealand Income Survey, which has been run since June 1997 as an annual supplement to the Household Labour Force Survey, which goes to about 15,000 households. The survey collects gross income data on wages and salaries, self-employment, government transfers, private pensions and annuities for those aged 15 years and over. This enables analysis of earnings and transfer income by various socio-demographic variables such as age, sex, occupation, education and ethnicity. However, interest and investment income is not collected and consequently the reported income may not represent the entire income of an individual or a household. Being a sample, the amount of analysis that can be done for subgroups of the population is also limited.
The Quarterly Employment Survey, a survey of about 18,000 businesses which collects information on the average earnings (ordinary time and overtime) and hours of paid employees in those businesses. The survey provides information on earnings of employees by variables such sex, industry and sector.
The labour cost index, which measures movements in base salary and ordinary time wage rates, overtime wage rates and non-wage labour-related costs. It differs from the Quarterly Employment Survey in that it is a quality-controlled measure. Only changes in salary and wage rates for the same quality and quantity of work are reflected in the index.
Inland Revenue Department personal tax data of which Statistics New Zealand holds a sample. This contains detailed income information about individuals and permits analysis of subgroups such as high income earners. At present, however, there is a restricted range of demographic variables, which limits the amount of analysis that can be done and the data is at the individual level only.
In general, income is regarded as all receipts that were received regularly or were of a recurring nature. Individuals can receive income from various sources such as wages and salaries, self-employment income, investment income, social welfare payments and other regular sources like private superannuation.
The major component of an individual's total income is what he or she earns from employment. Data from the Quarterly Employment Survey shows that growth in average hourly earnings was relatively modest in the last decade of the 20th century, particularly in the first half of that decade. During the 10 years from November 1991 to November 2001, average hourly earnings increased by $3.81 to reach $18.53, an increase of 25.9 percent. Overtime earnings for full-time equivalent employees decreased steadily throughout the 1990s. This was due to a trend towards expansion in the range of hours considered ‘normal’, reflected by a steady increase in ordinary time earnings as overtime earnings decreased. However, the average employee has been working fewer and fewer hours since 1995 and this is also reflected in the decrease in overtime earnings.
The New Zealand Income Survey allows analysis of the income disparity between males and females.
Table 14.20 shows the gaps between male and female earnings for full-time wage and salary workers.
For each age group except the 15 to 19 group, the median full-time weekly wage and salary income is higher for males than females. Between the ages of 35 and 59, the median full-time wage and salary income for males is at least 20 percent higher than for females.
Table 14.2. Median wage and salary income for full-time workers by age and sex
| Age group | Males | Females | Difference |
|---|---|---|---|
| Source: New Zealand Income Survey, June 2001 quarter. Statistics New Zealand | |||
| $ per week | |||
| 15–19 | 378 | 380 | -2 |
| 20–24 | 540 | 531 | 9 |
| 25–29 | 652 | 600 | 52 |
| 30–34 | 758 | 638 | 120 |
| 35–39 | 792 | 643 | 149 |
| 40–44 | 806 | 588 | 218 |
| 45–49 | 800 | 620 | 180 |
| 50–54 | 786 | 595 | 191 |
| 55–59 | 720 | 572 | 148 |
| 60–64 | 652 | 600 | 52 |
| 65 or over | 600 | 556 | 44 |
According to the 2001 Census, people in the Wellington region had the highest median annual income at $22,400, followed by the Auckland and Waikato regions at $21,100 and $18,100 (see table 14.21). The Wellington region also had the highest proportion of people (1 in 25) earning annual incomes of more than $100,000.
Table 14.21. Median income by region
| Region | Median($) |
|---|---|
| Source: 2001 Census of Population and Dwellings, Statistics New Zealand | |
| Wellington | 22,400 |
| Auckland | 21,100 |
| Waikato | 18,100 |
| Southland | 17,800 |
| Canterbury | 17,600 |
| Taranaki | 17,300 |
| Nelson | 17,100 |
| Marlborough | 17,000 |
| Bay of Plenty | 16,800 |
| Hawke's Bay | 16,700 |
| Manawatu-Wanganui | 16,300 |
| Tasman | 16,100 |
| Otago | 15,700 |
| Gisborne | 15,300 |
| Northland | 15,200 |
| West Coast | 14,600 |
It is commonly assumed that income is shared within households. On this basis, it can be argued that income and income inequality is best analysed at a household level as opposed to an individual level.
Tables 14.22 and 14.23 use data from the Household Economic Survey to analyse income at a household level. Table 14.22 shows the proportion of taxable income received and tax paid by each household gross income decile. This shows that the top 10 percent of households receive 30.2 percent of total income and pay 39.7 percent of personal income tax. Table 14.23 shows that while more males live in higher income households than females, this difference is not large.
In 2000/01, 40 percent of males lived in households that received $62,300 or more, compared with 36 percent of females.
Table 14.22. Percentage of taxable income received and tax paid by household gross income decile
| Household gross income decile | Percentage of taxable income received | Percentage of tax paid1 |
|---|---|---|
1The concept of tax used includes personal income lax. family support, relevant rebates and the surcharge on New Zealand Superannuation. Source: Household Economic Survey, adjusted to year ended June 2001, Statistics New Zealand | ||
| 1 (under $14,500) | 1.7 | 0.7 |
| 2 ($14,500–$18,799) | 3.1 | 1.1 |
| 3 ($18,800–524,199) | 4.1 | 2.1 |
| 4 ($24,200–$31,499) | 5.3 | 3.3 |
| 5 ($31,500–539,999) | 6.8 | 5.2 |
| 6 ($40,000–550,699) | 8.6 | 7.3 |
| 7 ($50,700–561,699) | 10.7 | 10.0 |
| 8 ($61,700–576,599) | 13.0 | 13.0 |
| 9 ($76,600–5101,099) | 16.6 | 17.6 |
| 10 ($101,100 or more) | 30.2 | 39.7 |
Table 14.23. Number and percentage of each sex by decile of annual household income
| Annual household income decile | Males | Females | Males | Females |
|---|---|---|---|---|
| Source: Household Economic Survey, year ended June 2001, Statistics New Zealand | ||||
| numbers (000s) | percent | |||
| 1 (under $14,900) | 67.4 | 103.1 | 5.0 | 7.2 |
| 2 ($14,900–520,699) | 58.0 | 123.4 | 4.3 | 8.6 |
| 3 ($20,700–$25,899) | 111.2 | 129.3 | 8.3 | 9.0 |
| 4 ($25,900–$32,399) | 117.2 | 126.6 | 8.7 | 8.8 |
| 5 ($32,400–$40,599) | 135.6 | 132.1 | 10.1 | 9.2 |
| 6 ($40,600–$51,099) | 153.8 | 150.2 | 11.5 | 10.5 |
| 7 ($51,100–$62,299) | 164.9 | 148.3 | 12.3 | 10.3 |
| 8 ($62,300–$76,699) | 162.7 | 161.3 | 12.1 | 11.2 |
| 9 ($76,700–$101,099) | 171.8 | 180.4 | 12.8 | 12.6 |
| 10 ($101,100 or more) | 199.3 | 181.5 | 14.8 | 12.6 |
| 11 All income groups | 1,342.1 | 1,436.1 | 100.0 | 100.0 |
Inland Revenue Department tax data is the best source of information to analyse the characteristics of high income individuals and households. Using tax data, it is possible to show the amount of tax different groups of individuals pay. Table 14.24 shows the percentage of tax paid and taxable income received by each income decile for the 1998/99 tax year. Income deciles are grouping of tenths of the population (individuals) ranked by income, in this case ranked by taxable income. The bottom decile has the bottom 10 percent of individuals in terms of taxable income.
Table 14.24. Percentage of taxable income received and tax paid by deciles of individuals, 1998/99 tax year
| Decile | Percentage of taxable income received | Percentage of tax paid1 |
|---|---|---|
1The concept of tax used includes personal income tax. family support, relevant rebates and the surcharge on New Zealand Superannuation. Source: Sample of Personal Tax Returns, 1998/99. Statistics New Zealand | ||
| 1 (under $2,500) | 0.3 | -1.3 |
| 2 ($2,500–$7,599) | 2.1 | 0.6 |
| 3 ($7,600–$9,899) | 3.7 | 3.0 |
| 4 ($9,900–$12,499) | 4.6 | 3.5 |
| 5 ($12,500–$15,099) | 5.6 | 4.1 |
| 6 ($15,100–$20,799) | 7.3 | 4.7 |
| 7 ($20,800–$27,999) | 10.0 | 8.1 |
| 8 ($28,000–$35,999) | 13.1 | 12.1 |
| 9 ($36,000–$48,799) | 17.1 | 17.5 |
| 10 ($48,800 or more) | 35.9 | 47.7 |
As can be seen from the table, for all but those in the top two deciles of taxable income, the percentage of total taxable income received is greater than the percentage of total tax paid in the 1998/99 tax year. Decile 10 receives 35.9 percent of the total taxable income of the population, but pays 47.7 percent of the total tax paid by the population. If the amount of tax paid were evenly distributed throughout the population, then each decile of the population would pay 10 percent of the total tax paid.
As can be seen from the table, those in deciles 1 to 7 pay less than 10 percent each of the total tax, while those in deciles 8 to 10 pay more than 10 percent each.
An examination of the gender of those who receive high incomes shows that of the 51,900 people (1.8 percent of the population) who received a taxable income of $100,000 or more for the 1998/99 tax year, 82 percent (42,600) were male and 18 percent (9,400) were female.
Figure 14.12. Labour cost
Movement of labour cost index
(LCI)
Cawthron Institute researchers collect oceanographic data from mussel beds.
New Zealand's science sector consists of many organisations with specialised roles. These include a policy agency, major research-funding agencies and a myriad of organisations carrying out research. These research organisations include universities and polytechnics, Crown Research Institutes, private companies and research associations.
Ministry of Research, Science and Technology (MoRST): Te Mānatu Pūtaiao. The ministry is the main policy agency for research, science and technology in New Zealand. Its mission is ‘to inspire and assist New Zealanders to create a better future through research and innovation’. The ministry's main roles are:
Providing policy advice to the government on research and innovation, including investment priorities, science matters and international science issues.
Applying innovation policies to grow New Zealand's economy.
Managing contracts on behalf of the Minister of Research, Science and Technology with agencies that directly invest in research and innovation.
Raising the profile of research and innovation with New Zealanders making career choices, and with the social, environmental and business sectors.
The ministry's website is www.morst.govt.nz
Crown Company Monitoring Advisory Unit (CCMAU). The Crown Company Monitoring Advisory Unit (CCMAU) provides ownership monitoring advice to, and manages issues on behalf of, the shareholding Minister of Crown Research Institutes, state-owned enterprises and other Crown companies. The CCMAU website is www.ccmau.govt.nz
The Independent Biotechnology Advisory Council (IBAC). The Independent Biotechnology Advisory Council (IBAC) was set up by the government in May 1999 to help New Zealanders explore and consider issues in biotechnology. It provides independent advice to the government on the environmental, economic, ethical, social and health aspects of biotechnology. IBAC consults extensively with the public and organisations involved in biotechnology. The council's website is www.ibac.org.nz
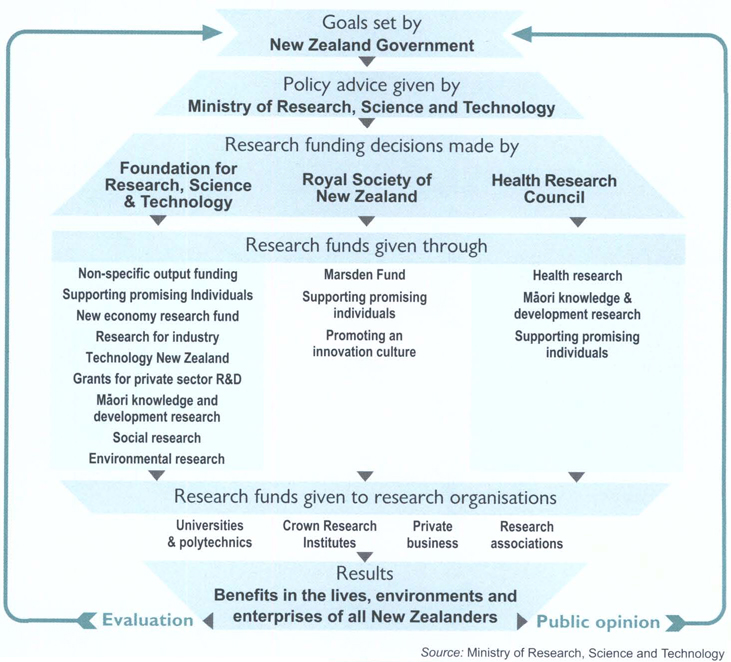
Scientific and technological research in New Zealand is funded by the government, by universities and by the private sector (see Figure 15.1). Major government investments related to research, science and technology include Vote: Research, Science and Technology ($485.7 million in 2001/02); Vote: Crown Research Institutes ($0.9 million in 2001/02); and Vote: Education. The government also made a one-off capital commitment of $100 million in its 2001 Budget to the New Zealand Venture Investment Fund.
Vote: Research, Science and Technology invests in four major goal areas:
Knowledge ($122.745 million in the 2001/02 financial year). The goal is to accelerate knowledge creation and develop people, learning systems and networks to enhance New Zealand's capacity to innovate.
The Marsden Fund encourages excellence in the advancement of knowledge by supporting research exploring the frontiers of new knowledge. For example, it is funding research to discover whether a water-resistant protein that sticks mussels to rocks could lead to the design of adhesive materials for treating injuries. The Marsden Fund had a budget of $27.839 million in the 2001/02 financial year.
The New Economy Research Fund develops research capability and knowledge in areas of science and technology where new industries and enterprises are emerging. For example, the fund has helped scientists develop a software watermarking system that enables developers to embed identifying information in their products to help address New Zealand's $30 million a year computer piracy problem. The fund had a budget of $53.084 million in the 2001/02 financial year.
Non-specific output funding helps Crown Research Institutes carry out research they identify as important. For example, funds have been allocated to scientists working on a technology using special methane-inhibiting bacteria to reduce emissions of methane, New Zealand's main greenhouse gas. In the 2001/02 financial year, $28.026 million was available for this type of funding.
Supporting promising individuals makes awards and fellowships available to people needed to sustain future development of the innovation system in New Zealand. For example, a Whangarei teacher is using her Science. Maths and Technology Teacher Fellowship to research technological change to meet the increasing demand for natural food and skin care products. Awards and fellowships worth $10.736 million were available in the 2001/02 financial year.
Promoting an innovation culture supports activities that strengthen and encourage the culture of innovation in New Zealand. This includes promoting positive attitudes and forging international links for science and technology. For example, funds were used to bring New Zealand-born scientist and Nobel Laureate and Rutherford Medal winner Professor Alan MacDiarmid to New Zealand in June and July 2001. Professor MacDiarmid won the Nobel Prize for Chemistry for his work on conducting polymers, which will eventually provide new conducting materials for manufacturers. Funds totalling $3.060 million were available under this programme in the 2001/02 financial year.
Economic ($210.060 million in the 2001/02 financial year). The goal is to increase the contribution of knowledge to the competitiveness of New Zealand enterprises.
Research for industry provides research funds to increase the competitiveness of sectors such as the food and fibre industries, manufacturing and services industries and infrastructures such as communications, energy, water and waste. For example, researchers at the Leather and Shoe Research Association were funded to develop an alternative, eco-friendly compound for tanning New Zealand lamb pelts that will provide significant environmental benefits. Research for industry had a budget of $170.809 million in the 2001/02 financial year.
Cypress canker research in a Forest Research nursery.
Technology New Zealand supports businesses by increasing their ability to adopt and learn to use new technology and innovation. It has three investment programmes: Technology for Business Growth, which encourages technological innovation in product and process development and strengthens technology management skills; TechLink, which provides access to local and international technology information sources and advisory services; and Technology in Industry Fellowships, which fund research and development of new technologies within businesses. For example, after three years of research funded by Technology New Zealand, PhD graduate Andrew Bell successfully bred the rare and desirable golden oyster, which is now set for export to Japan and the United States. Technology New Zealand had a budget of $24.494 million in the 2001/02 financial year.
Grants for private sector research and development co-funds new research projects, especially within small and medium-sized businesses. For example, funds have been made available to a company developing a thermoplastic recycled rubber mat by engineering polymer formulations and using recycled rubber to substantially reduce costs. The private sector research and development assistance programme had a budget of $10 million in the 2001/02 financial year.
Environmental ($85.004 million in the 2001/02 financial year). The goal is to increase knowledge of the environment and factors that affect it, and to establish and maintain a healthy environment.
Environmental research builds understanding of the environment through public good research in areas such as New Zealand's ecosystems, its biophysical environment, the human environment and in sustainable management of the environment by the production sector. For example, research funds have enabled scientists at Landcare Research and HortResearch to discover the bacteria responsible for the disease that has been devastating native cabbage trees in recent years, offering hope that it finally can be beaten. In another project, scientists from the National Institute of Water and Atmospheric Research Ltd (NIWA) are researching ways to reduce the effects of fishing industry activities on seabird populations.
Social ($47.261 million in the 2001/02 financial year). The goal is to increase knowledge of the determinants of well-being to build a society in which all New Zealanders enjoy health and independence, with a strong sense of identity and partnership.
Health research supports public good research, science and technology to improve the health of New Zealanders. For example, funding has enabled a decade of studies by Canterbury University scientists into issues related to suicidal behaviour, providing most of the information for New Zealand's youth suicide prevention strategy. Health research funding of $38.434 million was available in the 2001/02 financial year.
Māori knowledge and development research encourages excellence in the delivery of knowledge for Māori, builds the Māori research skill base and consolidates the Māori knowledge base. For example, funds have been available to researchers at Canterbury University looking at assisting managers of Māori-owned forests to achieve sustainable production. Funding of $4.49 million was available under this research programme in the 2001/02 financial year.
Social research supports public good research, science and technology to improve social well-being. Funding of child-raising research has established key factors that contribute to the well-being of New Zealand families. Funds available under the social research programme totalled $4.337 million in the 2001/02 financial year
About four percent ($20.034 million in the 2001/002 financial year) of the government's total investment is also spent on ‘shaping the system’ – funding, among other things, research contract management undertaken by the Ministry of Research, Science and Technology, and the work of the Science and Innovation Advisory Council.
The Foundation for Research, Science and Technology: Tūāpapa Rangahau Pūtaiao is a statutory authority, with an independent board reporting to the Minister of Research, Science and Technology. It is responsible for investing in research, science and technology on behalf of the government so as to enhance the wealth and well-being of New Zealanders; for providing independent policy advice on science and technology to the government; for encouraging technological innovation through the Technology New Zealand scheme; and for administering the New Zealand Science and Technology Post Doctoral Fellowship, Tūāpapa Pūtaiao Māori Fellowship schemes and the Bright Future scholarships. ‘Investing in innovation for New Zealand's future’ is the mission statement of the foundation, which considers innovation a key to a prosperous and productive future for New Zealand. The foundation sees innovation as providing organisations and the nation with fundamental competitive advantages and considers innovation to be just as applicable in the social and environmental arenas as it is in the commercial world. The foundation receives applications from Crown Research Institutes, research associations, government departments, incorporated societies, non-profit private trusts, private individuals, state-owned enterprises and universities to undertake agreed research programmes which contribute to the achievement of the government's science goals. The foundation's website is www.frst.govt.nz
The Health Research Council (HRC) is the Crown entity responsible for purchasing health research on behalf of the government. The council consults with the wider health research and user communities to set priorities for investment in public good health research. A budget of $42.3 million in the 2001/02 financial year was provided from the government's direct research, science and technology investment. The council's website is www.hrc.govt.nz
The Royal Society of New Zealand is an independent, statutory body incorporating the National Academy of Sciences and a federation of scientific and technological societies. It encourages professional development through research grants, fellowships, awards and prizes. The society advances and promotes science and technology in New Zealand, recognises and encourages excellence in research, establishes ethical standards, supports science and technology education, and publishes scientific journals, reports and educational resources. Established in 1867 as the New Zealand Institute, the society is incorporated under The Royal Society of New Zealand Act 1997. It is charged with the statutory responsibility of fostering a culture supportive of science and technology in New Zealand and of initiating appropriate international linkages. It also provides expert advice on important public issues to the government and the community. Membership comprises elected fellows, regional branches, constituent scientific and technological societies and more than 20,000 professional people in New Zealand and overseas. The society's website is www.rsnz.org.nz
The New Zealand Venture Investment Fund (VIF) was established as part of the government's 2001 Budget. VIF is a $100 million investment programme designed to accelerate development of a venture capital market in New Zealand. VIF invests its capital in individual investment funds operated by professional venture capital fund managers. Each fund operates for 7 to 10 years, investing in a number of New Zealand enterprises before terminating and distributing profits among investors. The VIF investment programme targets seed-stage investment (funding to develop, test and prepare a product for service or commercialisation) and start-up investment (funding to enable a business enterprise to begin trading). The VIF website is www.nzvif.com
In the 2001/02 financial year, an estimated $144 million of Equivalent Full-Time Student (EFTS) funding and $99 million in government contracts with universities was spent on research. Universities also carried out a further $161 million of research from their own and other funding sources. These figures are based on pro-rata estimates from total university funding sources for the 1998 year.
An important element of science and technology promotion is the support of fellowships that enable role models to be recognised and publicised. The New Zealand Science and Technology Promotion Programme was launched by the government in May 1998 to foster appreciation of the value of science and technology within a knowledge economy. It is run by the Royal Society of New Zealand.
The programme has developed the Royal Society's communicators programme, provides an advanced website (www.science.net.nz), a calendar of events, and networks to help science and technology communicators, educators, parents and students. It includes research on attitudes and investment trends for science and technology and fosters events involving all New Zealanders.
The Science and Technology Promotion Fund supports activities that will result in New Zealanders having positive attitudes towards science and technology. In 1999/2000, one project was awarded $100,000, with five receiving up to $30,000 from a budget of $400,000.
New Zealand Science and Technology Post-Doctoral Fellowships recognise outstanding talent in young New Zealand scientists, engineers, researchers and technologists by providing early career financial support. In 2000/01, 53 fellowships were awarded from a fund of more than $4.5 million.
Tūāpapa Pūtaiao Māori Fellowships develop and promote Māori in science, technology, engineering and research by providing fellowships for suitably qualified Māori students to undertake postgraduate study. Seven fellowships were offered in 2000/01 from a fund of $400,000.
James Cook Research Fellowships are administered by the Royal Society with funding from the government. The fellowships are awarded to senior researchers who will make a significant contribution to New Zealand's knowledge base. They allow recipients to concentrate on their chosen research for two years. Fellowships are awarded to New Zealanders involved in social sciences, research of relevance to the people of New Zealand and/or the south-west Pacific, biological sciences, physical sciences, health sciences, and engineering sciences and technologies.
The International Science and Technology Linkages Fund (ISAT) brings together a number of programmes which enhance New Zealand's science and technology linkages. The programmes are administered by the Ministry of Research, Science and Technology.
A land-based vehicle navigation device for motorists developed by Talon Technology. The Foundation for Research, Science and Technology has provided significant funding for further developments by this company.
There are nine autonomous Crown Research Institutes registered as companies. Each has its own board of directors appointed by the government and manages its own assets. Ownership of the institutes remains with the government, represented by two shareholding ministers, the Minister for Crown Research Institutes and the Minister of Finance.
The Association of Crown Research Institutes (ACRI) coordinates inter-institute activities for those institutes that belong to the association.
Forest Research is a major provider of research and development to the forestry and related industries, both in New Zealand and overseas. Based in Rotorua and with offices in Auckland, Christchurch, Sydney and Melbourne, 380 staff provide science and technology research and solutions spanning the entire forestry value chain, from genetics and nursery technologies, through forest management and harvesting, and the development of new products and processes, to trading and marketing of wood-based products. The Forest Research website is www.forestresearch.co.nz
The Foundation for Research, Science and Technology has provided funding to Renegade Surfcraft for the redesign of traditional outrigger canoes, as shown above, to provide new sporting opportunities.
AgResearch Ltd performs scientific research to benefit New Zealand and the world. AgResearch has a traditional role in pastoral and agricultural science and is now aligning itself to the rapidly-advancing global life sciences industry. AgResearch provides contract research and development for local and international customers through its 10 science platforms: AgSystems, animal genomics, animal health, biocontrol and biosecurity, food science, food systems and technology, land and environmental management, nutrition and behaviour, plant breeding and genomics, and reproductive technologies. In October 2000, AgResearch launched Celentis Ltd, a commercial business involved in product development and with putting AgResearch's science discoveries into the marketplace. AgResearch was established in 1992 as a government-owned company. The company has 921 permanent staff members, with 281 holding PhDs. AgResearch's corporate office is at Ruakura (Hamilton) and it has campuses at Invermay (Dunedin), Grasslands (Palmerston North), Lincoln (Christchurch) and Wallaceville (Upper Hutt). The AgResearch website is www.agresearch.co.nz and the Celentis website is www.celentis.com
HortResearch (Horticulture and Food Research Institute of New Zealand Ltd) is New Zealand's largest horticulture and food research organisation, helping to grow exports and develop new markets. To remain internationally competitive and profitable for growers, vigorous research and development is vital. HortResearch scientists work alongside some of New Zealand's largest plant-based and food processing industries. HortResearch's research spans genomics, molecular biology, plant and tree breeding, crop production, food processing, fruit storage and transport, and evaluation of consumer preferences. New fruits developed to meet consumer requirements have resulted from HortResearch's breeding programmes. These include Hort 16A (yellow-fleshed kiwifruit), the Pacific series of apples, and blueberries with a longer fruiting season. HortResearch has 510 permanent science and support staff and up to 150 casual workers in 10 regional research centres and orchards throughout New Zealand. HortResearch aims to support sustainable production systems and the purity, safety and customer acceptability of plant-based products. Research and development covers a large range of crops of economic importance to New Zealand, including fruit, cut flowers, forest trees, ornamentals and vegetables. The HortResearch website is www.hortresearch.co.nz
Crop and Food Research: Mana Kai Rangahau (New Zealand Institute for Crop and Food Research Ltd) provides research, technology and services to support development of high quality, commercially successful products, particularly from grain, vegetable and flower crops and seafood. The institute has more than 330 staff in New Zealand and Australia who have expertise in nutritional science, food biochemistry and processing, post-harvest technology, plant breeding and molecular biology, as well as sustainable crop management. The institute's aim is to develop and commercialise intellectual property with clients who range from corporations to grower groups and small businesses. Government investment in science encourages cooperation between science and industry and institute business managers advise clients of ways they can benefit from various funding programmes. The institute carries out research for clients under a range of flexible agreements, including exclusive contracted research, collaborative research and development arrangements and licensing and purchasing agreements. Crop and Food Research's website is www.crop.cri.nz
Landcare Research New Zealand Limited: Manaaki Whenua has about 400 staff working on all aspects of resource management – sustainability of land-use practices; documenting indigenous biodiversity; enhancing natural habitats; urban ecology; restoration projects; managing weeds, pests and biosecurity risks; maintaining quality of soil, land, air and water resources; reducing pollution and mitigating contamination; minimising waste and using resources more efficiently; and reducing greenhouse gas emissions and enhancing carbon sinks. Attention is also given to the economic, social and cultural implications of environmental management. The company also develops innovative applications for technology (eg satellite imagery and remote sensing, radio telemetry equipment, and geographic information systems) to assist resource management. It maintains a wide range of analytical laboratories, including environmental health and toxicology services. Landcare Research is a strong proponent of collaboration with other Crown Research Institutes, universities, overseas research agencies and with end users. This approach enhances effectiveness and relevance of its research. Landcare Research works with New Zealand and overseas governments, local and regional authorities, corporates, private enterprises and industry, recreational land-users and land owners. Its science programmes contribute to global research projects and it has a specialist consultancy team working on sustainable development and poverty alleviation in international aid projects. Landcare Research is a founding member of the New Zealand Business Council for Sustainable Development. Landcare Research's website is www.landcare.cri.nz
The Institute of Geological and Nuclear Sciences Ltd (GNS) is New Zealand's leading supplier of earth and isotope scientific research and consultancy services. As well as public good research, activities include resource evaluation for the petroleum exploration industry, assessment and mitigation of natural hazards, geological mapping, engineering geology, geophysical surveys, assessment and development of geothermal fields, assessment of groundwater quality and quantity, environmental chemistry, marine geology, and the application of isotope sciences to age dating and to the medical, environmental and manufacturing industries. GNS has a 130-year history in earth sciences. It has 258 staff and its library, databases and fossil collections are of national importance. GNS has eight sections – hydrocarbons, geothermal and minerals, earthquakes, volcanoes, active landscapes, mapping, isotope applications, and geological time. It has offices in Wellington, Wairakei and Dunedin. GNS research and commercial services benefit a wide range of private sector companies and government organisations in New Zealand and overseas. To strengthen effectiveness, the institute has developed many partnerships with private sector companies, SOEs, universities, and international research organisations. The GNS website is www.gns.cri.nz
Industrial Research Ltd's purpose is to nurture and enhance New Zealand's development as an advanced technology, value-added economy. The company has 370 staff in Auckland, Wellington and Christchurch. Through research partnerships, Industrial Research Ltd helps companies to position themselves at the leading edge of their market. Activities are focused in six technology areas – communication, information and electronics, intelligent devices and systems, advanced materials and performance, biochemical, and sustainable and distributed energy, as well as complex measurement and analysis. Industrial Research Ltd's website is www.irl.cri.nz
The National Institute of Water and Atmospheric Research Ltd: Taihoro Nukurangi (NIWA) conducts research and provides related services to establish a scientific basis for the sustainable management of New Zealand's atmospheric, marine and freshwater systems and associated resources. The principal focus is on New Zealand and its territorial waters. NIWA employs more than 600 staff and has revenue of more than $77 million. Its research base covers the following:
Atmosphere and climate: Research and consultancy services on the physical and chemical processes affecting the atmosphere and climate, including global effects, stratospheric research and interactions with the surface and oceans.
Freshwater: Research on the chemistry, physics and biology of lakes and rivers, the complex interactions influencing these ecosystems and their response to environmental disturbances.
Marine and coastal: Research and surveys on the geological, biological and physical properties of oceans, coastal waters, estuaries and harbours.
Fisheries: Fisheries stock assessment; fisheries modelling and population dynamics; fish biology and ecology, genetics and pathology.
Aquaculture and fisheries enhancement: Research on breeding, early life history, growth, hatchery technology and other research designed to lead to commercial development.
NIWA is the owner and operator of New Zealand's major research vessels Tangaroa (deep water) and Kaharoa (coastal) through its vessel-operating subsidiary company. NIWA also has subsidiaries in the United States and Australia. NIWA's website is www.niwa.cri.nz
The Institute of Environmental Science and Research Ltd (ESR) provides science-related research and consulting services in public health, environmental health and forensic sciences to the public and private sectors in New Zealand and the Asia-Pacific region. In 1995, ESR established ESR Malaysia, a joint venture in environmental health training and consultancy, with Malaysian partners. ESR employs 250 staff who work from the Mt Albert Science Centre in Auckland, the Christchurch Science Centre, the Kenepuru Science Centre in Porirua and corporate headquarters at Kenepuru. Each science centre is equipped with advanced technologies and information systems to support teams of nationally and internationally recognised scientists. The institute's website is www.esr.cri.nz
A NIWA scientist monitors food resources in a stream.
Carter Observatory. Carter Observatory was established by act of parliament in 1938 and is named after Charles Rooking Carter, a prominent pioneer in Wellington and the Wairarapa. The act was amended in 1977 to recognise Carter Observatory as the National Observatory of New Zealand.
The Wellington-based observatory has a full-time permanent staff of eight, plus three permanent part-time and 11 casual staff. In addition, it can call upon specialist honorary consultants and honorary research associates. It has four distinct functions: public astronomy, astronomical education, facilitating astronomical research and heritage preservation.
The observatory has an annual government contract to promote science through the provision of public astronomy services. These include planetarium shows, lectures, telescope viewing sessions and evening courses leading to a Carter Observatory Diploma of Astronomy, special school holiday programmes and ‘Overnight Extravaganzas’ (when groups of children and accompanying adults sleepover at the observatory).
The observatory has a three-year government contract, which began in January 2001, to provide support for the astronomy strand in the school science curriculum. It offers programmes for visiting school groups, resource booklets and special workshops for teachers.
Through government contracts and local body support, the observatory also caters for the information, recreation and leisure needs of New Zealanders and overseas tourists. It manufactures its own planetarium programmes, audio-visual shows and displays and offers a public information service in astronomy. It produces a monthly newsletter and a range of media information releases, offers annual Carter Memorial Lectures throughout New Zealand and maintains an active website where clients are able to make their own bookings for various programmes on offer. Work is under way on producing a local television series, which will review the current southern night sky.
The Honorary Research Associate programme is being rejuvenated to encourage and facilitate amateur astronomical research, with the opportunity to have results published under the Carter Observatory name.
As the national repository for astronomical heritage, the observatory has collections of instruments and archives relating to important New Zealand amateur and professional astronomers. Staff have been involved in restoration of the Thomas King Observatory in the Wellington Botanic Gardens, one of New Zealand's earliest observatories. This reopened to the public in August 2001 and is available for guided solar observations. The Carter Observatory website is www.carterobs.ac.nz
The Cawthron Institute, a private scientific research centre with 135 staff, was established under the Thomas Cawthron Trust Act 1924. Operations are based in central Nelson, with an aquaculture research facility near the city. Its testing laboratories are IANZ registered and accredited by the United States Food and Drug Agency for shellfish testing.
The institute undertakes research into marine and freshwater microbiology and ecology. Most of this work is funded through government scientific research programmes.
The institute also provides commercial services to the seafood industry, specialist scientific advice to resource managers and users on environmental issues, and analytical and microbiological laboratory services for a wide range of New Zealand clients. Research interests include aquaculture (particularly shellfish), shellfish breeding and husbandry, and seaweed.
Biosecurity is another area of interest, with invasions by foreign marine organisms representing a threat to New Zealand's biosecurity. Joint projects with other laboratories and shipping companies have examined the efficiency of ballast water exchange practices, and methods of treatment to remove unwanted organisms. Recent work has centred on hull fouling as a source of introduction and dispersal.
A third area of interest is coastal, estuarine and freshwater resource management. This work includes resource surveys and impact assessments, such as the effects of discharges and land use on the aquatic environment, baseline surveys, monitoring of coastal and freshwater environs and oil spill contingency planning. Research into the impact of guided trout fishing in back country rivers on other anglers has also generated much interest.
Cawthron Institute scientists work closely with other research organisations and have good links with overseas groups. Combined research with Shizuoka University, in Japan, involves natural products and pharmacology. Research on toxic algal blooms has resulted in a close relationship with researchers at Tohoku University, Japan; the Japan National Fisheries Agency in Sendai; the Monterey Bay Aquarium Research Institute, California; the Florida Marine Institute; the Cork Institute of Technology, Ireland; and the Irish Marine Institute, Dublin. The website for the Cawthron Institute is www.cawthron.org.nz
Government departments carry out research and development to support their own activities. This includes research to help develop and implement policy. Departments with a substantial research interest include the Ministry of Education, the Department of Conservation, the Ministry of Agriculture and Forestry, the Ministry of Fisheries and the Ministry for the Environment.
Universities and polytechnics offer a broad range of tertiary education services that include science in all cases and aspects of technology in most. As well as this education and training function, the eight universities carry out basic and strategic research and make substantial contributions in applied science and technology fields. Several universities have formal links with Crown Research Institutes. There are 21 polytechnics in New Zealand that offer certificate and diploma courses in a variety of subjects related to science and technology, such as building, engineering, manufacturing, software engineering, agriculture, horticulture, forestry and viticulture.
Research associations are non-governmental, industry-linked institutions. They provide capabilities in research and technology transfer which individual companies in the sector may not be able to justify. Major research associations include the Building Research Association of New Zealand, the Cement and Concrete Association of New Zealand, the Heavy Engineering Research Association, the New Zealand Dairy Research Institute, the New Zealand Fertiliser Manufacturers’ Research Association, the New Zealand Leather and Shoe Research Association and the Wool Research Organisation of New Zealand. Social science research is carried out by universities, by research units in government departments and some local government authorities, by independent social research units such as the New Zealand Council for Educational Research and the New Zealand Institute for Economic Research Inc, by commercial market research firms, private research consultancies and research or analysis units within private enterprises, and by voluntary agencies.
Paul Sapsford, director of Ecoglo, alongside pathfinding stair lighting developed using photo luminescence technology in Jade Stadium, Christchurch. This technology was developed in a joint research project with Linclab, assisted with funding by the Foundation for Research, Science and Technology.
The Intellectual Property Office of New Zealand (IPONZ) is a business unit of the Ministry of Economic Development. IPONZ operates under the Patents Act 1953, the Trade Marks Act 1953 and the Designs Act 1953. These acts place statutory obligations on IPONZ and the Commissioner of Patents, Trade Marks and Designs in relation to the filing, examination, registration/grant and renewal of intellectual property rights. IPONZ also maintains registers of these rights and interests for searching by clients. IPONZ is a receiving office for applications filed under the Patent Cooperation Treaty (PCT), administered by the World Intellectual Property Organisation (WIPO).
Patents. The owner of an invention in any country may apply to the Intellectual Property Office of New Zealand (IPONZ) to patent it under the New Zealand Patents Act 1953. A patent grants the owner the exclusive right to exploit the invention commercially in New Zealand for a maximum of 20 years. After the patent expires, anyone may make use of the invention. The Patents Act 1953 is currently under review. A new Patents Bill is in the process of being drafted to ensure that New Zealand's patent legislation reflects developments in international patent practice and continues to promote innovation and competition within New Zealand. It was expected that the bill would be introduced into parliament in the second half of 2002. The IPONZ Information Centre holds a comprehensive collection of patent specifications from a number of countries. It receives newly-published patents from New Zealand and other industrialised countries on CD-ROM, microfilm and microfiche. Available to the public, these patents describe the latest advances worldwide in every field of manufacture and have the potential to save New Zealand manufacturers substantial amounts of time and money in research and development. In the year ended June 2001, letters patent were sealed on 3,886 applications. Most were in the areas of organic chemistry, biochemistry and microbiology. The IPONZ website is www.iponz.govt.nz
Trade marks. The owner of a trade mark for any lawful product or service in any country may apply to register it under the New Zealand Trade Marks Act 1953. Once the trade mark is registered, the owner has the exclusive right to use it in New Zealand for the goods or services covered by the registration. If anyone else copies a registered mark without permission, the owner has a quick and simple legal remedy. Trade marks may remain registered indefinitely by the payment of a renewal fee from time to time. Anyone proposing to use a trade mark in New Zealand may search the online trade mark database at www.iponz.govt.nz Anyone planning to apply to register a trade mark may request IPONZ, for a fee, to conduct a search of its records and report if someone else has already registered a similar mark, or request an official opinion on whether the mark is eligible for registration. A new Trade Marks Bill has been introduced to parliament that will replace and substantially amend existing law. The objective of the bill is to update the legislation, simplify the registration process to meet the needs of today's business environment, address some concerns of Māori regarding the inappropriate registration of Māori text and imagery, and take account of international developments in the area of trade mark law. There were 22,620 trade marks registered in the year ended June 2001.
Designs. The owner of an industrial design (a novel shape or surface pattern on a manufactured article) in any country may apply to register it under the New Zealand Designs Act 1953. Registration protects the design from unauthorised copying in New Zealand for a maximum of 15 years. The Intellectual Property Office of New Zealand (IPONZ) maintains a public register of designs, which anyone may search. There were 886 designs registered in the year ended June 2001. Applications for patents, trademarks and designs are shown in Table 15.1.
Plant variety rights. Plant variety rights are intellectual property rights provided under the Plant Variety Rights Act 1987. A plant variety right gives the breeder of a new plant variety the exclusive right to sell seed or reproductive material of the variety. The Plant Variety Rights Office of the Ministry of Economic Development administers the act from Lincoln, Canterbury.
Copyright. Copyright is granted automatically upon the completion of any original literary, dramatic, musical or artistic work, sound recording, film, broadcast, cable programme or published edition. The Copyright Act 1994 is administered by the regulatory and competition policy branch of the Ministry of Economic Development. (See Chapter 12: Arts and Cultural Heritage.)
Layout designs. The Layout Designs Act 1994 provides protection for the designs of integrated circuits. The act protects layout designs from unauthorised copying in New Zealand for up to 15 years. The act is administered by the regulatory and competition policy branch of the Ministry of Economic Development.
Telarc Ltd is a registered company owned by the Testing Laboratory Registration Council. Telarc provides assessment and recognition services for management systems and operates from Auckland, Hamilton, Tauranga, Wellington and Christchurch.
Recognition services. Telarc provides recognition of achievement of quality and environmental management systems to the following standards:
Quality Management Systems certification to ISO 9001. Telarc has provided the ISO 9000 certification service since 1983, being the first organisation in New Zealand to achieve formal accreditation by the Joint Accreditation System – Australia and New Zealand (JAS-ANZ).
Telarc Q-Base – a basic, entry-level management system, based on the ISO 9000 series of standards. Telarc Q-Base identifies the basic quality management disciplines essential for managing the quality of small to medium size enterprises.
Environmental Management Systems certification to ISO 14001 standard. Telarc has provided this service since 1994 and was the first organisation in New Zealand to be accredited, in 1996, by JAS-ANZ to certify ISO 14001 standard.
Assessments. Telarc provides assessment services for a wide range of management systems, including occupational health and safety, food safety and rail safety.
Training. Telarc works closely with the New Zealand Quality College to provide training courses to promote excellence in management system practices.
International Accreditation New Zealand (IANZ) is the accreditation service of the Testing Laboratory Registration Council. It is a user-funded statutory body responsible for ensuring technical professional service standards are met in New Zealand's industrial, scientific, commercial, regulatory, health care and administrative sectors. All laboratories, radiology services and inspection bodies previously registered with Telarc New Zealand are now accredited by IANZ. IANZ's functions include:
Laboratory accreditation – Assessing the technical competence of testing, measurement and calibration laboratories in all fields of science and technology, including biological, chemical, dairy, water, electrical, gas cylinder, mechanical, medical, physical and wool testing; and metrology and calibration. Accreditation is to ISO/IEC 17025 standard.
Inspection body accreditation – Providing formal recognition that an inspection body, or food safety assessment body, is capable of meeting standards of quality, performance, technical expertise and competence. Accreditation is to ISO/IEC 17020 standard.
Radiology service accreditation – Providing radiology services with formal recognition of their skills, expertise, competence, systems, procedures and facilities, based on independent, peergroup assessment. Accreditation is to a version of ISO/IEC 17025 standard.
Good laboratory practice – The government has designated IANZ as the Compliance Monitoring Authority in New Zealand for the OECD Principles of Good Laboratory Practice. This programme is relevant to research laboratories undertaking non-clinical safety trials for new veterinary pharmaceuticals and agricultural chemicals.
CE marking – The government has appointed IANZ as the Designating Authority for Conformity Assessment Bodies approved as competent to undertake testing or inspection against European directives for CE product standard marking purposes. This appointment is under the New Zealand/European Union Governmental Mutual Recognition Agreement.
Meat industry laboratory approval – IANZ has been appointed by the Ministry of Agriculture and Forestry Food Assurance Authority (Animal Products) to assess meat industry laboratories under the MILAB Laboratory Approval Scheme.
International. IANZ represents New Zealand in international conformity assessment forums and maintains close liaison with similar national organisations overseas. It has formal mutual recognition agreements with national accreditation authorities in Australia, Austria, Belgium, Brazil, Canada, Chinese Taipei, Czech Republic, Denmark, Finland, France, Germany, Hong Kong China, India, Indonesia, Ireland, Italy, Japan, Korea, the Netherlands, Norway, Portugal, Singapore, Slovak Republic, Spain, South Africa, Sweden, Switzerland, United Kingdom, United States and Vietnam.
Training. The New Zealand Quality College is the training division of IANZ and provides training in association with IANZ and Telarc Limited, together with organisations recognised as national experts in their fields. The college is registered as a private training establishment with the New Zealand Qualifications Authority.
Standards New Zealand is the trading arm of the Standards Council, a Crown entity operating under the Standards Act 1988. The council, an appointed body with representatives from all sectors of the community, oversees the development and adoption of standards and standards-related products. Standards New Zealand has a full-time staff of 46 and is supported by more than 1,500 New Zealanders who voluntarily serve on boards and committees. Its revenue comes from contracts with industry and the government for the development and support of standards and from the sale of standards and standards-related publications. Standards New Zealand acts as the New Zealand enquiry point for the World Trade Organisation and supplies specialist advice on overseas standards, regulations, codes of practice and testing and approval procedures in foreign markets. Standards New Zealand is closely involved in the development and application of national, regional and international standards, many of which are developed in partnership with Australia. It represents New Zealand on the International Organisation for Standardisation (ISO) and on the International Electrotechnical Commission (IEC). Standards New Zealand's website is www.standards.co.nz
15.1 Ministry of Research, Science and Technology; Crown Company Monitoring and Advisory Unit.
15.2 Ministry of Research, Science and Technology; Foundation for Research, Science and Technology; Health Research Council; Royal Society of New Zealand.
15.3 Association of Crown Research Institutes and individual CRIs (as listed); Carter Observatory; Cawthron Institute; Ministry of Research, Science and Technology.
15.4 Intellectual Property Office; Commissioner of Plant Varieties; Ministry of Economic Development; Telarc Limited; International Accreditation New Zealand; Standards New Zealand.
Statistics New Zealand divisional manager responsible: Ron McKenzie.
The Bulletin (quarterly). Intellectual Property Office of New Zealand.
New Zealand Patent Office Journal (monthly). CD-ROM only, Intellectual Property Office of New Zealand.
Report of the Commissioner of Patents, Trade Marks and Designs (Parl paper G.14).
Report of the Foundation for Research, Science and Technology (Parl paper G.53).
Report of the Ministry of Research, Science and Technology’ Te Mānatu Pūtaiao (Parl paper G.50).
Report of the Standards Council (Parl paper G.15).
Report of the Testing Laboratory Registration Council of New Zealand (Parl paper G.31).
Standards (bimonthly). Standards New Zealand.
www.morst.govt.nz – Ministry of Research, Science and Technology
www.frst.govt.nz – Foundation for Research, Science and Technology
www.hrc.govt.nz – Health Research Council
www.technz.co.nz – Technology New Zealand
www.rsnz.govt.nz – The Royal Society of New Zealand
www.nzvif.com – New Zealand Venture Investment Fund
www.iponz.govt.nz – Intellectual Property Office of New Zealand
www.standards.co.nz – Standards New Zealand
www.esr.cri.nz – Institute of Environmental Science and Research Ltd
www.irl.cri.nz – Industrial Research Ltd
www.gns.cri.nz – Institute of Geological and Nuclear Sciences
www.landcare.cri.nz – Landcare
www.crop.cri.nz – Crop and Food Research
www.agresearch.co.nz – Agresearch
www.forestresearch.co.nz – Forest Research Institute Ltd
www.hortresearch.co.nz – Hortresearch
www.niwa.cri.nz – National Institute of Water and Atmospheric Research Ltd
Table of Contents
Marram grass and windproof fencing protect sand dunes at Omaha beach, north of Auckland.
New Zealand has a unique environment, the health of which is dependent upon a balance between interacting systems of living and non-living parts. As the population grows and technology advances, the relationship between humans and the environment continually changes, and the potential exists for increased pressure to be placed on these systems and New Zealand's natural and physical resources.
Human settlement, with its consequent deforestation and introduction of exotic species, impacted greatly upon New Zealand's biodiversity and affected many aspects of the natural environment. Native forest covered 75 percent of New Zealand's land area prior to human arrival in the 11 th century, but had been reduced to 53 percent by 1840. With the arrival of Europeans, the rate of deforestation increased as early settlers sought to re-create familiar European landscapes. By the mid-20th century. forest cover had dropped to less than 25 percent of New Zealand's land area, as productive and accessible land was sought for farming.
Farming expanded rapidly between 1885 and 1935, with the area of land under cultivation rising from 2.6 million hectares to 7.9 million hectares. Sown grass covered nearly 90 percent of cultivated land by the end of this period. Burgeoning pastures supported an equally rapid rise in livestock numbers. In 1886, about 16 million sheep grazed New Zealand pastures. Numbers increased rapidly in the 20th century, eventually peaking at more than 70 million in 1982. Cattle numbers increased from 853,000 to nearly 8 million during the same period.
By the 1930s, decades of overgrazing land and clearing forests caused large-scale erosion and degradation of soils, which hastened the demand for manufactured fertilisers. Concern about the decline in native forests grew, resulting in the formation of various lobby groups. Increasing pressure by the lobby groups eventually resulted in the decline in native deforestation and the establishment of a number of protected native forests. Today, only 0.1 percent of New Zealand's total forest production is harvested from indigenous forests. Native and plantation forests now cover approximately 23 percent and 7 percent respectively of New Zealand's total land area (see Figure 16.1).
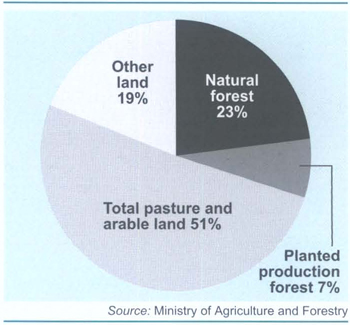
New Zealand has a unique biodiversity resulting from geographic isolation for more than 80 million years. All four frog species, 60 reptiles, two bats, and over 90 percent of insects and marine molluscs, approximately 80 percent of vascular plants and a quarter of all bird species are endemic to New Zealand. With the exception of two species of bat, New Zealand has no indigenous land mammals. As a result, many species developed without natural predators, and a number of birds became flightless, for example, the kiwi, kākāpō, takahē, weka and the now extinct moa.
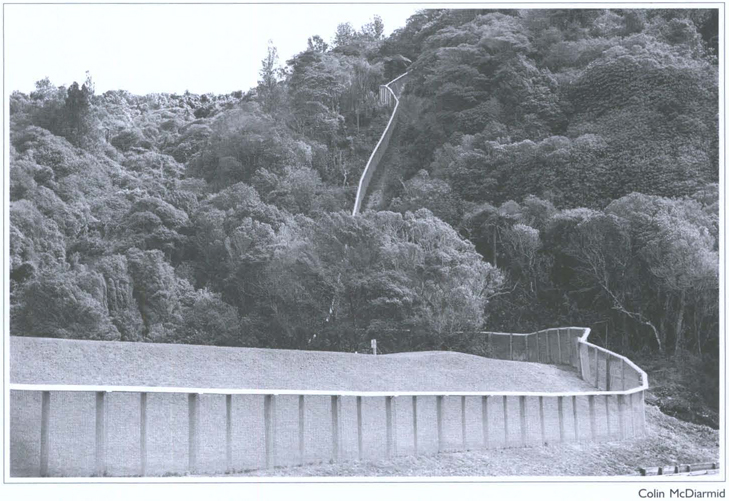
A 2.3 metre fence surrounding the inner-city Karori Wildlife Sanctuary protects the area from predators.
The arrival of humans and the introduction of exotic species of birds, mammals, plants and insects, both deliberately and accidentally, continues to disrupt New Zealand's biodiversity. New Zealand was one of the last countries in the world to become inhabited with humans, but has one of the worst records of indigenous biodiversity loss. Numerous species of birds, frogs and invertebrates, as well as various plants and reptiles, have become extinct during the past 700 to 800 years. Currently, 1,000 known species of animals, plants and fungi are classified as threatened.
A number of organisations are now working to protect New Zealand's biodiversity and to manage threats from introduced species. The New Zealand Biodiversity Strategy was released by the government in 2000 to help coordinate biodiversity management nationally. The Department of Conservation manages invasive animal pests and weeds in New Zealand's national parks and reserves. Many private landowners and businesses actively manage biodiversity, through fencing special areas, replanting or setting up covenants, and by controlling troublesome pests and weeds.
The protection of threatened animals is being improved through better monitoring allowed by technologically-advanced transmitting devices for the tracking of wildlife. One of the new innovations in transmitting devices is the KiwiSat 101 platform transmitter terminal, a satellite transmitter which can be used in terrestrial or aquatic environments.
The North Island brown kiwi is one of New Zealand's endangered species.
The use of Geographic Information Systems (GIS) is contributing towards the management and protection of New Zealand's biodiversity. The ability of GIS to integrate data, undertake analysis of geographic areas and visualise data enables ecological information to be presented in a form that can be understood easily. As technology has developed, the need for extensive computer hardware and software for mapping has diminished, allowing more extensive use of GIS for biodiversity management.
Through the use of satellite imagery, a land cover database is now available for New Zealand, which specifies land cover and enables comparisons to be made between forest types, both regionally and temporally. This database, combined with indicators and maps of New Zealand's ecosystems, is being used to monitor the state of New Zealand's biodiversity as part of the Ministry for the Environment's environmental reporting programme.
Compared with other countries, New Zealand has relatively good air quality because of its small population, its limited heavy industry, its distance from other countries and regular westerly winds in most places. Nevertheless, air pollution gets high enough to cause adverse health effects in many urban areas. Common pollutants are particulate matter, sulphur dioxide, nitrogen oxides, carbon monoxide, benzene and polyaromatic hydrocarbons. Main contributors to air pollution in New Zealand are the transport industry, home heating fires and other energy sectors.
New Zealand has a small and dispersed population and therefore relies heavily on private transport. Motor vehicle emissions are a significant source of air pollution, emitting pollutants such as carbon monoxide, dioxins, nitrogen oxides, volatile organic compounds and particulate matter. Increased vehicle numbers, larger average engine sizes, traffic congestion and lower proportions of vehicles using alternative energy supplies relative to previous years all contribute to increasing pressure on air quality. The number of vehicles on New Zealand roads continues to increase, with the number of vehicles licensed in New Zealand at March 2002 estimated to be 2,846,657.
Home heating, particularly domestic fires, is a large contributor to air pollution in residential areas, particularly through the burning of coal and wood, which are major sources of particulate matter and sulphur dioxide. The number of households with open fires has decreased in the past decade, while the proportion of homes with slow-combustion fires, such as woodburners. has increased.
A number of New Zealand regional councils, including Environment Canterbury. Auckland Regional Council and Nelson City Council, and the Ministry for the Environment have air monitoring stations which monitor levels of pollutants, including particulate matter, carbon monoxide and sulphur dioxide. Technological developments have allowed accurate data to be collected with minimal operator intervention. Complex and sophisticated meteorological systems complement the information supplied by air quality monitors, providing an overall increase in the quality of information available.
Global warming, through the release of greenhouse gases, is one of the most significant environmental issues facing New Zealand and the world. The greenhouse effect occurs when gases in the atmosphere, for example nitrous oxide, carbon dioxide and methane, trap solar radiation, wanning the atmosphere. This process occurs naturally, but there is evidence that human activity has been a major cause of most of the warming of the past 50 years.
Figure 16.2. Emissions by source category, in kilotonnes CO2 equivalent weight1
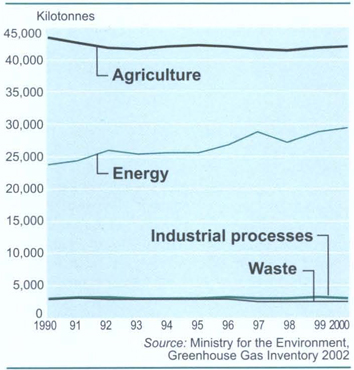
1The CO2equivalent weight is a measure that quantifies emissions of different greenhouse gases according to their contribution to global warming, using carbon dioxide (CO2) as a reference. For example, the greenhouse gas methane is about 21 times as effective as carbon dioxide in warming the atmosphere, and hence one kilotonne of methane is recorded in this table as 21 kilotonnes of CO2. The global warming potentials used for this calculation are those provided by the Second Assessment Report of the Intergovernmental Panel on Climate Change (1996). using a 100-year timeframe.
The global average temperature increased approximately 0.6 degrees Celsius between 1861 and 2000 and sea levels rose 10 to 20cm between 1900 and 2000. In New Zealand, total greenhouse gas emissions in 1990 were equivalent to approximately 73 million tonnes of carbon dioxide. While more than 50 percent of New Zealand's greenhouse gas emissions come from the agricultural sector, increases in greenhouse gas emissions since 1990 are largely due to a 20 percent increase in carbon dioxide emissions, primarily from the energy sector. Figure 16.2 illustrates the changes in greenhouse gas emissions by source category from 1990 to 2000.
The magnitude of climate changes in New Zealand is uncertain, but it is likely that drought problems may increase in already drought-prone eastern regions, while western regions may become even more vulnerable to flooding. Higher temperatures and fewer frosts could lead to increased pest problems, while industries based on snow and ice, such as skiing, may become increasingly vulnerable. However, climate change may also improve plant and crop growth, through rising temperature and carbon dioxide levels, but the overall effects on productivity and species composition are still uncertain.
Two major international agreements have been formulated to address climate change: the United Nations Framework Convention on Climate Change (UNFCCC) (adopted at the Rio Earth Summit in 1992) and the Kyoto Protocol, a further agreement negotiated in accordance with the UNFCCC and finalised in December 1997. Whereas the UNFCCC is an agreement on non-binding targets, the focus of the Kyoto Protocol is on legally-binding targets. The Kyoto Protocol requires developed countries to reduce greenhouse gas emissions to specified targets by 2008–2012. New Zealand has signed the agreement and legislation to ratify it was before parliament in 2002. Ratification by at least 55 countries is required before the Kyoto Protocol can be binding.
Depletion of the ozone layer, caused primarily by the emission of chlorofluorocarbons (CFC), is also a significant concern for New Zealand. The ozone layer is situated 15 to 30km above the earth's surface and shields the earth from the sun's ultraviolet radiation. While ozone screening decreased globally by three percent in the decade to 2002, the ozone layer above New Zealand has decreased by approximately eight percent since 1980. In the summer of 1998, the peak level of ultraviolet radiation measured at the National Institute of Water and Atmospheric Research Ltd's (NIWA) laboratory in Lauder, Central Otago, was approximately 12 percent higher than when measurements began 10 years earlier.
A declining ozone layer has serious implications for New Zealand, particularly in relation to human and animal health. International efforts to halt the decline in ozone led to the formation of the Montreal Protocol in 1987 and it is now expected that the ozone layer will eventually be restored. However, the period over which full recovery will occur is still uncertain and it is expected that the greenhouse effect will delay full recovery. Figure 16.3 shows changes in the mean levels of ozone measured at Lauder, Central Otago.
Figure 16.3. Annual mean levels of ozone
Measured at
Lauder1
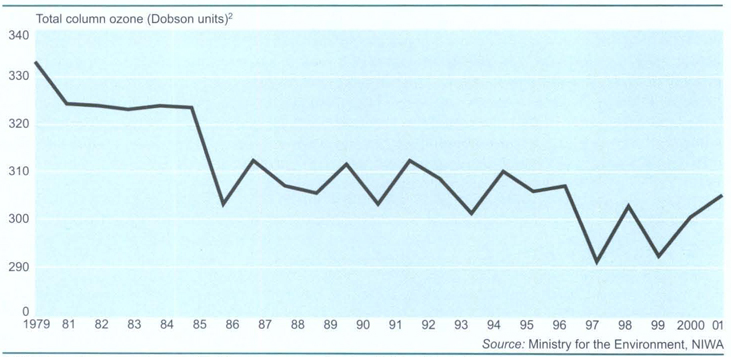
1This figure shows annual means of total column ozone at Lauder (45.0S, 169.7E). The values can be considered as representative of the ozone layer over New Zealand. These results are based on Dobson spectrophotometer measurements at Lauder and supplemented with satellite measurements which have been standardised to the Dobson measurements.
2Annual mean ozone levels are given in Dobson units (DU) where 1DU is 0.01mm of ozone layer thickness at 0 degrees Celsius at sea level.
Advanced computing systems have allowed the collection and storage of a large amount of international climate information. In New Zealand, NIWA has developed a computer-accessible national climate data series on many aspects of New Zealand's climate. Climate change and ozone depletion are global in nature and require international cooperation and agreement. Developments in technology have greatly increased the speed by which information can be transferred and reduced the time in which communication can occur. This is particularly beneficial in the formulation of international environmental agreements.
Runoff from farmland and flooding can affect water quality.
Relative to other countries, New Zealand has abundant fresh water, with total annual rainfall varying between 300.000 million and 600.000 million cubic metres. Although well endowed with water, the availability of fresh water varies significantly among regions, with the amount of annual rainfall generally decreasing as one moves east.
While water in New Zealand has, in the past, been considered plentiful, rising demand and competing uses are increasingly placing pressure on both the availability and quality of the water resource. Water is of particular significance to Māori and is essential in maintaining the life-supporting capacity of ecosystems. However, New Zealand is also an agriculturally-based economy and the intensification of fanning, particularly in the South Island, requires trade-offs to be made between ecological, recreational and economic values of the water resource. Irrigation consumes 74 percent of total groundwater allocation.
The clearance of land and the rise of agriculture in New Zealand has resulted in a number of adverse environmental effects on water. These include more frequent flooding and increased sedimentation, nutrients and harmful micro-organisms in streams from erosion and farm run-off. The need for enhanced soil quality for pasture production results in the application of fertilisers, with nitrogen sales more than trebling between 1990 and 1997. The environmental effects associated with fertiliser application can be numerous, including soil acidification and the eutrophication and contamination of waterbodies with nitrates.
Monitoring of water levels and water quality has historically been labour intensive and time-consuming, requiring the manual reading of a number of gauging sites throughout New Zealand. However, the increasing use of telemetered gauging, whereby water level monitoring stations automatically collect and send information on a regular basis to the relevant regional council, has greatly enhanced the quality and quantity of water data available. Use of telemetry also enables prompt warning of river flood conditions. Advances in information technology have also resulted in the increasingly extensive use of GIS for water management and hydraulic modelling. Combined with river environment classification for environmental reporting, GIS can be used to draw together a range of information, such as topography, land use and land cover data, with water data to identify relationships within a specific geographic area and river environment for management purposes. From this information, a range of human activity scenarios can be modelled and potential impacts on freshwater environments predicted and analysed.
The marine environment within New Zealand's exclusive economic zone harbours a diverse range of ecosystems and covers an area approximately 15 times bigger than New Zealand. New Zealand has the eighth longest coastline of any nation in the world, the fourth largest area for fishing and its exclusive economic zone covers approximately 4 million square kilometres.
Most of New Zealand's population lives close to the coast. Construction, land reclamation, drainage, urban infrastructure and shoreline developments can affect the coastal environment through the alteration of physical characteristics of shorelines and the discharge of pollutants into the sea. Nevertheless, New Zealand's small population has meant that impacts on the marine environment have been minor compared with other developed countries.
Given that New Zealand is a trading nation, with much trading occurring via sea transport, New Zealand is vulnerable to the introduction of exotic species. Fishing activities are widespread and affect virtually every habitat type except the deepest sea floors. Fishing impacts on the marine environment include: direct harvest, bycatch effects, benthic habitat disturbance, food web changes and genetic changes. Marine farming can also have important impacts on the coastal environment. These impacts can include extensive changes to the seafloor and altered local nutrient inputs.
Because New Zealand is an island nation, there are many competing users of its marine environment. This means there is a need for effective environmental management. The fisheries sector is managed using the quota management system whereby catch limits for each fish stock are set by the government and allocated to commercial fishers through individual quotas. Commercial harvest, including wild stocks and aquaculture, is approximately 650,000 tonnes a year, with New Zealand contributing approximately one percent of global fish production. See Chapter 19: Forestry and Fishing for more details on total allowable commercial catch.
The increasing use of sophisticated surveillance techniques enabling the monitoring of vessel movements and fishing activity is likely to improve fisheries management by reducing the volumes of unauthorised takes.
The Resource Management Act 1991 imposes strict standards on discharges into the coastal marine area according to differing classifications of the coast. A committee of ministerial representatives has been established to develop a comprehensive national oceans policy for management of the marine environment. New Zealand's marine environment contains many fragile fisheries and marine resources, the management of which requires good information on which to base decisions and develop models. Improvements in tracking devices such as satellite tags and remote acoustic telemetry systems have enabled close monitoring of marine animals, providing data covering much greater time periods and at lower spatial resolutions than has previously been possible. Development of hydroacoustic techniques has enabled better data on New Zealand's hoki populations and assisted in the determination of transient fish population biomass. Advancement in computer systems has also enabled more complex models to be developed and large quantities of data to be processed. As a result, models are increasingly able to represent the complex interactions that occur within the environment, enabling changes in the physical and biogeochemical aspects of the marine environment to be predicted, with the ability to provide early warning for potentially harmful ecological effects. The fisheries quota management system uses information provided by models to assess the maximum sustainable yield of a fishery. Improved data through advanced information technology is likely to be reflected in more accurate models.
Good environmental management requires ecosystem science combined with management, decision making and planning. The Ministry for the Environment, recognising the need for the development of ecosystem classifications as a means of organising environmental data for good management, is supporting development of a marine environment classification system. This system, like those developed for land and rivers, will help resource managers analyse and manage natural and physical resources in relation to sustainability.
New Zealand has many energy sources, including fossil fuels, water, geothermal steam and wind. As technology has developed, alternative energy sources have been harnessed.
Coal is one of New Zealand's oldest sources of energy, with coal-produced electricity peaking in the 1920s and remaining high until the 1960s. With the introduction of vehicles and the development of technology, consumption of oil and hydroelectricity increased and from 1950 to 1980, oil and hydrogeneration became the dominant sources of energy.
Today, oil and gas are the major sources of New Zealand's energy, accounting for approximately 31 and 29 percent respectively of the total primary energy supply. Total primary energy is the amount of energy available for use in New Zealand for energy transformation and end use. Consumer energy is energy used by final consumers and excludes energy used or lost in transformation and in bringing the energy to the final consumers. Figure 16.4 shows the proportions of consumer energy by fuel for 2000.
New Zealand's gas, which accounted for only 3.3 percent of total primary energy supply in 1974, is produced in Taranaki, with the primary natural gas field – offshore south-west of New Plymouth – supplying 77 percent of the country's natural gas requirements. However, the Maui field is in decline and is expected to become depleted around the end of this decade.
Although self sufficient in electricity, gas and coal, New Zealand relies on imported oil to meet domestic oil demand. Oil consumption comprises about 49 percent of total energy consumption. The largest energy consumer is the domestic transport sector. Domestic transport is the dominant user of oil products, taking approximately 85 percent during the year ended March 2001. This can largely be attributed to New Zealand's small and sparsely-distributed population and its remoteness from trading partners, which requires extensive use of shipping and air transport.
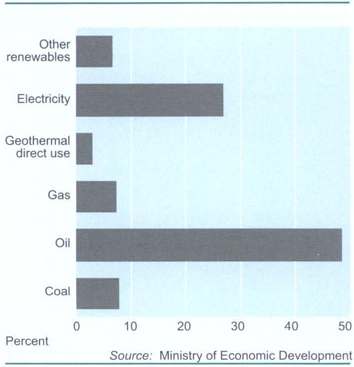
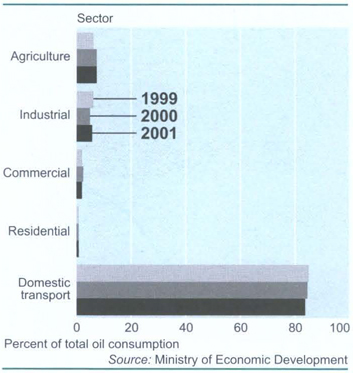
Figure 16.5 shows the percentage of oil consumption by sector for the years 1999 to 2001.
Renewable resources, such as hydro-generation, geothermal, biomass, wind and sunlight, currently account for approximately 73 percent of electricity generation in New Zealand. Hydro-generation is the major supplier of electricity, producing 64 percent.
Energy is an essential element of life, but its production and use has varying impacts on the environment, depending on the types of energy that are used and produced. The growth in greenhouse gas emissions is largely attributable to the energy sector, in particular electrical generation from coal, and transport. Geothermal production has the potential to cause land subsidence and releases sulphur into the atmosphere, which leads to pollution and the creation of unpleasant odours. Construction of dams has a transforming and potentially detrimental effect on the landscape and alters river systems and aquatic life. Environmental impacts from thermal, geothermal and even hydroelectric generation set limits for future development. Much potential for energy generation in the future lies in advanced and innovative renewable technologies and in energy sources that are still considered alternative at present, such as solar and wind generation. As technology develops, many of these alternative sources will become economically and commercially viable in New Zealand and competitive with fossil fuels.
The potential exists to improve productivity and efficiency by redefining how products and services are designed, produced and operated. Potential also exists for efficiencies in energy use to be made through enhancing communication and replacing physical transportation systems with alternative electronic services. However, while products and services are becoming more energy efficient, the benefits gained from these efficiency savings may be offset by the overall increase in use of technology. The increasing use of more sophisticated audio and television equipment and additional demand for leisure and long-distance travel, as well as the increasing use of personal computers, is likely to exceed the resource savings gained through the production of more efficient technology.
New Zealand has a large variety of mineral deposits and is well known for its production of gold and coal. The mineral industry is a significant contributor to the New Zealand economy. Some minerals are also of cultural importance to New Zealanders. For example, the pounamu, or New Zealand greenstone, is of particular significance to Māori, specifically Ngāi Tahu who have ownership of this resource.
Gold was first discovered in New Zealand in the 1850s and was retrieved either by washing alluvial gravels, silts and sands, by crushing gold-bearing veins of quartz, or by hydraulic sluicing. In 1881, the first dredge was used to work riverbeds to recover gold. These gold extraction techniques scarred the landscape, leaving piles of tailings, and rivers and lakes with high concentrations of minerals. Today, however, mining is subject to strict environmental standards. Currently, there are two large opencast goldmines in New Zealand, with a number of medium and small-sized mines. A third open cast mine is proposed at Reefton on the West Coast of the South Island.
Coal is New Zealand's largest energy resource, with recoverable reserves of approximately 8.6 billion tonnes. While coal has a long history of use in New Zealand, the quantities of coal exported have increased markedly in the past decade, with Japan and India the main markets. Opencast coal mining has caused environmental problems in the past, with Huntly mines discharging large quantities of silt into the Waikato river in the 1970s. The government has since tightened regulations, and mining companies are now required to treat waste and remove deposits before water can be discharged. However, the use of coal also has adverse environmental effects resulting from its combustion, which contributes towards the greenhouse effect. As environmental concerns increase at an international level, the potential combustion effects of coal are likely to limit its use.
Aerial photography, photogrammetric mapping and use of GIS in digital terrain modelling, and 3D modelling of subsurface ore bodies, are now being used as tools for exploration, mine design and measurement. Remote sensing is being used to provide high resolution images of the earth's crust, which, when combined with other information, can identify targets for detailed ground investigation. Advancements in technology have meant that minerals once inaccessible now have the potential to be extracted.
Soil provides a wide range of services to the environment and humans, including the absorption of waste, the supply of nutrients to plants and regulation of water. Erosion, although a natural process, has been accelerated by human activities, particularly by the clearance of land.
Studies have identified that more soil has been lost than gained since the arrival of Europeans in New Zealand. It is estimated that approximately 10 million hectares are currently at risk from erosion in the North Island hill country, with each landslip requiring approximately 20 years to recover to within 70 to 80 percent of its original productivity level.
Land-based industries are a central part of New Zealand's economy and a major generator of New Zealand's export income. Soil erosion, therefore, has many implications for New Zealand, including loss of productive capacity, reduced fertility, loss of water-holding capacity and decreased water quality.
To address increasing soil quality problems, the government has encouraged the development of practical on-ground techniques and monitoring tools which farmers can readily use to improve management of soils. These tools are promoted through the New Zealand Landcare Trust, regional council land management officers and other advisers.
Advanced GIS applications enable identification of different soil and land types and, when combined with geostatistical analyses, can be used to interpret and extrapolate data. The results can be used to assist in decision making, such as whether remedial work may be most effective or where further sampling is required.
A New Zealand land cover database is used to assess carbon sequestration rates, identify change in areas at risk from soil erosion or rural fires and monitor general land use change.
Soil slip erosion on North Island farmland.
Sustainable development is now the international focus as a result of increased awareness of interactions among society, the economy and the environment. World leaders have come together to work for solutions to the many environmental and developmental problems facing the world. In 1992, the United Nations Conference on Environment and Development (the Earth Summit) saw the signing of two legally-binding conventions: the Framework Convention on Climate Change and the Convention on Protection of Biological Diversity. Three non-binding agreements were also adopted: the Rio Declaration on Environment and Development, Agenda 21 and Forest Principles. A World Summit on Sustainable Development was held in Johannesburg in 2002 as a follow on from the 1992 Earth Summit. The World Summit, Rio+10, reviewed what had been achieved since 1992 and set out a vision of sustainability. New Zealand is in the process of developing headline indicators for measuring progress towards sustainable development and a progress report was presented at the World Summit.
Tourism. New Zealand's tourism industry is an example of where integration of environmental, economic and social goals is essential to sustaining an industry. Tourism can place pressure on the natural environment through overloading the infrastructure and reducing the quality of relatively unspoiled natural environments. With visitor numbers to New Zealand continuing to rise, there will be a need to ensure that the quality of New Zealand's natural assets are maintained.
Environmental management. Maintaining and protecting New Zealand's biodiversity will be a continuing focus of environmental management in New Zealand, as will be the management of climate change, ozone depletion, waste and pollution. Central to all environmental issues will be how to balance economic growth and social well-being with maintaining the quality of the natural environment.
Information technology development will continue to aid the way in which humans interact with the environment. Whether collecting and analysing data or modelling potential scenarios, information technology will assist humans to increase resource use efficiencies, enhance communication and raise public awareness about impending environmental issues. Whether opportunities for improved environmental management are taken will depend upon society and the values that are placed on the environment and sustainable development.
New Zealand occupies approximately 27.1 million hectares. It is predominantly mountainous and hilly and can be categorised in terms of slope and altitude. More than two-thirds (18.5 million hectares) slopes at greater than 12 degrees and nearly half at greater than 28 degrees.
Approximately three-fifths of the country (16 million hectares) is more than 300 metres above sea level, with one-fifth above 900 metres. It has been estimated that in pre-Polynesian times 78 percent of the total area (21 million hectares) was under forest cover, 14 percent was made up of the alpine zone and the balance was drylands, lakes and swamps. Polynesian and European settlement has seen a marked reduction of the original forest cover by fire and conversion, through the use of traditional and new development methods, to suit human needs. Table 16.1 shows the approximate distribution of land use in 2001.
Table 16.1. Land use today1
| Type of land | Approximate area2 | Percentage of total area |
|---|---|---|
1As at 11 December 2001. 2NEFD information as at 1 April 2000. Source: Ministry of Agriculture and Forestry | ||
| hectares (million) | ||
| Total forested land | 8.0 | 29.7 |
| Pasture, tussock and arable land | 13.9 | 51.3 |
| Shrubland and other land | 5.2 | 19.0 |
| Total land area of New Zealand | 27.1 | 100.0 |
Geology, soils, vegetation, wildlife and other aspects of the New Zealand environment are described briefly in Chapter 1: Geography.
Coordination of New Zealand's international response to environmental issues is carried out by the environment division of the Ministry of Foreign Affairs and Trade. The division has responsibility for issues such as climate change, ozone depletion, biodiversity and endangered species, hazardous wastes, marine pollution, conservation of whales and other marine living resources, and a range of sustainable resource management issues, including forestry. Staff comprises a director, eight policy officers and two support staff. The division works closely with other government departments with responsibility for environment and conservation issues, in particular the Ministry for the Environment and the Department of Conservation, and with a wide range of agencies responsible for various aspects of resource management policy. It also consults with a range of public interest bodies, including non-government organisations, business and Māori. The environment division manages New Zealand's participation in the work of international environmental agencies, including the Commission for Sustainable Development, the United Nations Environment Programme, the Global Environment Facility, the South Pacific Regional Environment Programme, the International Whaling Commission, and related treaties. The division provides support for New Zealand attendance at regional and international meetings on environmental issues and handles negotiations on related international legal instruments.
The Resource Management Act became law in New Zealand in October 1991. The act is, first and foremost, a means of planning how the people of New Zealand are going to use, distribute or preserve natural and physical resources. These resources include rivers, lakes, coastal and geothermal areas; land, including soils, forests and farmlands; the air; and the built environment – buildings, bridges and other structures in cities and towns.
The purpose of the act is to promote sustainable management of natural and physical resources. This means the environment is looked at as a whole when local authorities are planning and making decisions. The focus of the legislation is on the effects proposed activities will have on the environment not, as in the past, on whether an activity is or is not allowed.
The act says that, to the greatest extent possible, people should be allowed to make their own choices as to the development, use or protection of natural and physical resources. But they must do this within the objectives of the act – the promotion of sustainable management. Local authorities prepare plans to assist them to manage natural and physical resources. Members of the community have the opportunity, in the formulation of these plans and policies, of saying what they want to happen in their communities, with the act encouraging councils to seek the views of their residents, iwi and business people when developing resource management plans.
National policies. In the preparation, implementation and administration of regional policy statements, and regional and district plans, the following matters, declared to be of national importance, must be recognised and provided for;
Preservation of the natural character of the coastal environment (including the coastal marine area), wetlands, lakes and rivers and their margins, and the protection of them from inappropriate subdivision, use and development.
Protection of outstanding natural features and landscapes from inappropriate subdivision, use and development.
Protection of areas of significant indigenous vegetation and significant habitats of indigenous fauna.
Maintenance and enhancement of public access to and along the coastal marine area, lakes and rivers.
The relationship of Māori and their culture and traditions with their ancestral lands, water, sites, waahi tapu and other taonga.
Those exercising functions and powers are required to have particular regard to kaitiakitanga (the exercise of guardianship); the ethic of stewardship; the efficient use and development of natural and physical resources; the maintenance and enhancement of amenity values; intrinsic values of ecosystems; recognition and protection of the heritage values of sites, buildings, places or areas; maintenance and enhancement of the quality of the environment; any finite characteristics of natural and physical resources; protection of the habitat of trout and salmon.
The Minister of Conservation provides a management framework for the coast through the New Zealand coastal policy statement. The minister's functions and powers also include approval of regional coastal plans and, in certain situations, a consent-granting function for coastal permits.
Sustainable management. Under the Resource Management Act, sustainable management means managing the use, development and protection of natural and physical resources in a way, or at a rate, which enables people or communities to provide for their social, economic and cultural well-being and for their health and safety, while:
Sustaining the potential of natural and physical resources (excluding minerals) to meet the reasonably foreseeable needs of future generations.
Safeguarding the life-supporting capacity of air, water, soil and ecosystems.
Avoiding, remedying or mitigating any adverse effects of activities on the environment.
Regional policies and plans. Regional councils have a pivotal role in resource management administration. Each region has to prepare a regional policy statement, which sets out objectives for managing all resources of the region in an integrated manner. Regional plans deal with specific resource management issues. Regional councils have been given primary responsibility for the management of water, soil, geothermal resources and pollution control. In addition, regional councils have joint responsibility with territorial authorities for natural hazards mitigation and hazardous substances. They also have joint control with the Minister of Conservation in the coastal marine area.
District planning. Territorial authorities (district and city councils) have primary responsibility for land use management (including uses on the surface of water, subdivision and noise control). They have joint responsibility with regional councils for natural hazard mitigation and hazardous substances. Matters to be considered by the territorial authority in preparing district plans include the preservation and conservation of the amenities of the district, buildings, trees, bush, plants, landscapes, objects, or areas of architectural, historical, scientific, wildlife, visual, or other interest. Each territorial authority must have one district plan, which must be consistent with any national policy statement or the regional policy statement. The district plan may include rules which prohibit, regulate or allow activities.
Resource consents. A resource consent gives a person or organisation permission to develop a natural or physical resource and/or carry out an activity that affects the environment in some way for a stated period.
Under the Resource Management Act there are five types of resource consent:
Land use consent (granted by district, and sometimes regional, councils).
Subdivision consent (district councils).
Water permit (regional councils).
Discharge permit (regional councils).
Coastal permit (regional councils).
All applications for consents follow the same procedures. The basic rule is that the applicant, whether a landowner intending to subdivide, or a farmer needing water for irrigation, should check to see if a consent is required and, if so, what type and category. The applicant also needs to assess what impact the proposal is likely to have on the environment and submit this assessment to the consent authority. The applicant may also have to explain what consultation has taken place with any persons who may be affected by the proposal. Some resource consent applications require public notification, which gives members of the community a chance to consider the application and make submissions if they wish.
Public involvement. The Resource Management Act provides for members of the community to take part in managing the resources of their area. Members of the community can have input into initial consultations by local authorities when they are preparing policy statements and plans, and can make submissions to local authorities after they have notified the public about policy statements or plans, plan changes and resource consents. A new funding scheme was established in March 2001 to provide community, environmental and Māori groups with assistance to go to the Environment Court. Recognising the high cost of involvement in court cases, the environmental legal aid scheme exists to assist groups presenting a case of environmental public interest, but who are under resourced financially.
Use of land. The Resource Management Act requires councils to address the effects of activities rather than the activity itself. The presumption is that people can use their land in the way they wish, provided there are no adverse environmental effects. Constraints must be clearly identified in policy and plans. The inclusion of amenity values in the definition of environment is important. By providing for amenity values, it is possible for policies and plans to consider ‘those natural or physical qualities and characteristics of an area that contribute to people's appreciation of its pleasantness, aesthetic coherence, and cultural and recreational attributes’. It is up to councils to identify appropriate ways to maintain those qualities and characteristics, of which controls on the man-made environment may be one.
Hazardous substances and new organisms. The Hazardous Substances and New Organisms Act (1996) reformed the law relating to the management of hazardous substances and new organisms. The Environmental Risk Management Authority (ERMA) was established to administer the act.
The purpose of the act is to protect the environment and the health and safety of people and communities by preventing or managing the adverse effects of hazardous substances and new organisms.
Although enacted in 1996, the act was brought into force in stages. Those parts of the act relating to new organisms came into effect in July 1998, while those relating to hazardous substances commenced in July 2001. There is a transitional period during which controls on substances under the repealed Toxic Substances, Dangerous Goods, Explosives and Pesticides Act are retained. During this period, these substances will be progressively transferred to control under the act. Hazardous substances managed under the act are substances which are explosive, flammable, oxidising, corrosive, toxic and ecotoxic. Radioactive substances are managed under the Radiation Protection Act.
Sustainable management ensures the environment is kept safe for public enjoyment now and in the future.
The degree of control is related to the hazardousness of the substance. The controls are expressed in a way that allows for changing technology and alternative means of compliance. The controls are contained in a set of regulations, which ERMA uses to set requirements for specific substances or groups of substances. The controls apply at all points in a hazardous substance's life cycle where the environment and the health and safety of New Zealanders may be at risk. The controls are designed to set consistent national minimum standards for resource consents that involve hazardous substances.
In addition, the controls are designed to provide consistent standards in workplace and transport legislation relating to hazardous substances. The act is also designed to work closely with regulations for specific use areas, for example, when hazardous substances are also medicines, agricultural components or veterinary medicines.
The act covers the deliberate introduction of new species, such as for primary production or for biological control of pests, and the development of genetically modified organisms. The development, testing or release of genetically modified organisms all require separate approval. This part of the act stands alongside the Biosecurity Act, which aims to prevent the unintended introduction of unwanted species into the country.
The principles of the new legislation require that all hazardous substances and new organisms are assessed before their introduction, development or manufacture in New Zealand, and that they all follow a similar assessment process. Most assessments are publicised and open to public comment, and the final decision is also made public. The legislation is also used to ensure that New Zealand's obligations under international agreements relating to hazardous substances and new organisms are adhered to.
The impact of prospecting, exploration and mining of minerals, whether Crown or private, is controlled through the Resource Management Act 1991 by local authorities. Controls are imposed through plans and resource consents established by that act. They control the environmental impact of all mining activities, including the rehabilitation of land.
Exploitation of Crown-owned minerals is governed by the Crown Minerals Act 1991, administered by the Ministry of Economic Development. Under the act, the Minister of Energy is required to prepare minerals programmes that establish policies, procedures and provisions to be applied to the management of Crown minerals. The minerals programme for petroleum came into effect on 1 January 1995. The mineral programmes for coal and for minerals other than coal and petroleum came into effect on 1 October 1996. Using procedures established in the minerals programmes, the Minister of Energy issues permits allocating Crown-owned minerals, or the rights to search for them. Permits have conditions relating to management of the mineral resource and royalties. In addition to a minerals permit, the act provides that anyone prospecting, exploring or mining Crown minerals must also make land access arrangements with the surface landowner and/or occupier.
New Zealand's water and soil resources are administered in accordance with the Resource Management Act 1991, with protection against flooding covered by the Soil Conservation and Rivers Control Act 1941. Both acts are administered by the Ministry for the Environment. Under the acts, regional councils are responsible for management of water use, control of rivers, prevention of erosion, assessment of coastal, landslip and flooding hazards, and protection of scenic and recreational waterways.
Water resources. It has been estimated that New Zealand's consumption of water approaches 2 billion cubic metres a year, with households using 210 million cubic metres, industry 260 million cubic metres, livestock 350 million cubic metres and irrigation 1.1 billion cubic metres.
About 87 percent of the population is supplied from public water-supply systems, while the rest rely on independent domestic supplies, such as rainwater collection or aquifer bores. Industry obtains about 33 percent of its requirements from public supply systems and 66 percent from its own sources.
These figures do not include water for hydroelectric generation, which exceeds 100 billion cubic metres a year. Water flowing through hydro station turbines can be used again. On the Waikato River, including its tributaries, 10 state-owned hydroelectric stations, and a number owned by local authorities, use and reuse a flow which, at Karapiro (the final station), is more than 7 billion cubic metres a year. Thus the total irrigation, agricultural, industrial and domestic water consumption could be supplied three times over by the Waikato River at Karapiro alone.
In terms of total water resources, New Zealand has an estimated 300 billion cubic metres a year, although these are by no means evenly distributed. High mountains, especially in the South Island, create substantial rain-shadow areas (relatively dry areas sheltered from rain-bearing winds by hills). In a few areas, such as Milford Sound, annual rainfalls of more than 10,000mm have been measured, while in others, such as Alexandra, as little as 340mm may fall in a year.
In some parts of New Zealand, including the Canterbury Plains, the Heretaunga Plains in Hawke's Bay and the Waimea Plain near Nelson, underground water is an important resource. The cities of Christchurch, Lower Hutt, Napier and Hastings draw at least some of their domestic and industrial supplies, as well as irrigation water, from such sources. Management of underground water, and its protection from contamination, is an increasing concern for regional councils in these areas.
Testing the quality of drinking water at a Wellington reservoir.
Water quality. Maintenance of water quality is the responsibility of regional councils under the Resource Management Act. The act controls contamination of water (as well as discharges onto or into land and into the air) through a discharge permit. Regional policy statements and regional plans are the statutory vehicle for water quality policies, objectives and rules.
The Resource Management Act continues earlier legislation which provided for water conservation orders to be placed over rivers, streams, wetlands and lakes. An order can preserve a water body in its natural state, or it can protect certain features by placing restrictions on the issue of future water permits. New Zealand now has 11 water conservation orders.
The Ministry for the Environment assists regional councils to manage water resources by producing guidelines for such things as river flows and water quality. Guidelines give regional councils discretion in developing appropriate local standards.
While having high quality fresh and coastal waters has major benefits, achieving it everywhere would incur considerable costs. For example, it has been estimated that providing secondary treatment schemes for all urban communities around New Zealand coasts could cost at least $1 billion in the next decade.
A major freshwaster microbiological research programme is under way to examine the health, environmental and agricultural risks associated with disease-causing organisms in fresh water. The programme is a joint venture between the Ministries of Environment, Health, and Agriculture and Forestry. This research, and some previous studies, indicates that a range of pathogens is present in New Zealand waters. These organisms, which appear to be mostly at low levels but which have been found in some places at higher levels than expected, can cause stomach upsets and diarrhoea. New Zealand has high rates of illnesses that can be spread through water, particularly campylobacter. Once the source of contamination has been identified, preventative action, such as fencing stock off from waterways and upgrading sewage treatment systems, can be taken. The research programme funding concluded at the end of the 2000/01 financial year and analysis of information is continuing. The outcome is expected to be improved quality guidelines for drinking water, for fresh water used for bathing and for stock drinking water.
River control. River control projects carried out by local government are usually designed to prevent damage by erosion and protect property from flood damage. River training works are designed to give the river channel a stable alignment to prevent bank erosion. Stopbanks are constructed to provide flood relief to low-lying and highly-productive agricultural lands. A catchment-wide approach to water and soil problems is encouraged. Comprehensive catchment control schemes embrace land retirement from grazing and protection planting of trees in the upper catchment; bank protection works in the middle reaches; and flood alleviation and drainage works in the lower reaches of a river. Increasingly, flood plain management planning is being adopted to identify and mitigate risks associated with flooding.
Soil conservation. The change from forest cover to pastoral land use in many parts of New Zealand has resulted in disturbed soil conditions. The protective, stabilising and water-controlling combination of vigorous native vegetation, litter and spongy soil has given way to a shallow-rooted, less protective carpet of grass on a compacted, impervious and often exhausted soil. Natural erosion, caused by climatic factors such as high-intensity rainfall and frost heave, combined with the geological instability of much of the country, has been aggravated by man-made effects. Nearly 10 percent of land is classified as having severe to extreme erosion problems. Successful techniques developed to control erosion include control of burning and animal pests, oversowing, topdressing, strict grazing control, soil conservation fencing, gully control, contour ploughing, terraces, grassed waterways and open and close-tree planting.
Water pollution. Water pollution problems are addressed by regional councils under the Resource Management Act 1991. Pollution of rivers and lakes can be caused by soil erosion, farm run-off, industrial waste, domestic sewage or urban runoff. The act provides for the control of waste discharges through discharge permits and rules in plans. These include conditions ensuring that the discharge has had sufficient treatment to protect the receiving waters. Diffuse forms of pollution, such as erosion and farm run-off, require different approaches, such as changing land-use practices or fencing streams. The Ministry for the Environment has developed a sustainable land management strategy which, in part, addresses the impacts of agriculture on aquatic ecosystems and water quality. Regulations under the Resource Management Act 1991 control dumping of waste and other matters and discharge of contaminants within the coastal marine area (12 nautical mile limit). Controls of dumping and discharges beyond the coastal marine area come under the marine protection rules of the Maritime Transport Act 1994. This covers the area extending from the 12 nautical mile limit to the edge of New Zealand's economic zone (200 nautical miles).
Waste and landfills. Landfills are the traditional means of disposing of most solid waste in New Zealand. In the past, ‘rubbish tips’ were poorly managed and there was a lack of control on acceptance of hazardous wastes. Since introduction of the Resource Management Act 1991, and more stringent environmental controls, many older tip sites have been closed. Some councils are now cooperating by establishing modern regional landfills, with strict controls on environmental effects.
In partnership with Local Government New Zealand, the Ministry for the Environment has prepared a national waste minimisation and management strategy, which contains actions to achieve the government's commitment to significantly reduce waste and improve waste management. The strategy deals with all wastes in solid, liquid and gaseous forms. Independently, some communities, councils and businesses are also adopting waste reduction and cleaner production initiatives.
In 1997, the Minister for the Environment set up a programme to improve management of hazardous waste in New Zealand. The ministry is developing a national definition for hazardous waste, tailored to the New Zealand situation while providing consistency with international definitions. In addition, landfill acceptance criteria for waste with hazardous properties are being developed.
Other activities undertaken by the ministry include:
Preparation of guidelines for integrated and cohesive hazardous waste management, including record keeping.
Monitoring landfill management practices.
Preparation of guidelines for waste analysis, landfill management and wastewater monitoring.
Support for cleaner production practices by industry and business through the Sustainable Management Fund.
Development of a used oil recovery programme for the collection and appropriate reuse or disposal of used lubricating oil.
Contaminated sites. According to national estimates, New Zealand has about 1,500 seriously contaminated sites and thousands more which have some level of contamination. Seriously contaminated land includes sites used for landfills, service stations, sawmills, timber treatment plants, railway yards, engine works, metal industries and chemical manufacture. Sites with lower contamination levels include former sheep dipping and agricultural sites.
The Ministry for the Environment is working with other departments, local government and industry to develop guidelines for managing and cleaning up contaminated sites. Guidelines have been produced covering chemicals found on sawmills and timber treatment sites, petrol stations and oil storage depots, and old gaswork sites. The ministry also provides guidance for local government on collecting and managing information on contaminated sites.
Under the Resource Management Act 1991, the owner, occupier or polluter can be required to clean up a contaminated site when contamination occurred after 1991. The government proposes that for sites contaminated earlier than 1991, the same three parties will be made potentially liable. However, an ‘innocent landowner’ defence is to be introduced for sites contaminated before 1991 that need to be cleaned up. This means that landowners who can show that they had no knowledge of, or association with, contamination of the site would no longer be potentially liable.
In addition, a clean-up fund has been established to help fund the management of ‘orphan’ sites if there is no clearly liable party or party capable of paying. The Ministry for the Environment is to develop rules covering liability and funding. The fund will be first used to assist the Tasman District Council clean up the old Fruitgrowers Chemical Company site at Mapua, near Nelson. Stormwater discharge from this site (contaminated with the organochlorine pesticides DDT and dieldrin) has adversely affected the marine environment nearby.
Some of the most pressing environmental problems extend beyond national borders. They are known as global environmental issues and include climate change as a result of the enhanced greenhouse effect and ozone depletion. No one country is responsible for them, but all countries ultimately suffer the consequences. New Zealand's comparative isolation does not make it any less vulnerable.
Greater awareness of the importance of global action on environmental matters has led to increasing international activity. Much of the international debate involves striking the right balance between the twin imperatives of environmental protection and economic activity to provide for future generations and to protect the earth's resources and biodiversity. The goal is to achieve sustainable development. This goal, highlighted by the 1987 report of the World Commission for the Environment and Development, Our Common Future, was the theme for the United Nations Conference on Environment and Development (UNCED), or Earth Summit, in Rio de Janeiro, Brazil, in 1992. The UNCED brought together governments, business, non-government organisations, indigenous people, women and youth in unprecedented numbers. A two-day meeting of political leaders brought together the largest number of heads of government and state and senior politicians ever assembled at a meeting of this kind.
The UNCED produced the Rio Declaration, a list of principles for governments, individuals and the world community to follow; Agenda 21, an action plan setting benchmarks for behaviour and identifying directions in which the world community should move; and a statement of forest principles for the protection and sustainable management of all world forests. The Framework Convention on Climate Change and the Convention on Biological Diversity were opened for signature by governments, with more than 150 countries doing so at Rio de Janeiro. The UNCED also established the Commission on Sustainable Development (CSD) to monitor progress with implementation of Agenda 21.
New Zealand has wide-ranging interests in international environmental work, which it pursues within its means. Priority issues have included climate change, ozone depletion, Antarctica, forestry, waste issues, the protection of marine mammals, sustainable resource use and South Pacific environment matters.
Environmental policy development, which is led by the Ministry for the Environment and the Ministry of Foreign Affairs and Trade, involves a wide range of government agencies and, as highlighted by the UNCED process, appropriate wider consultation. The environment division of the Ministry of Foreign Affairs and Trade advises the government on international aspects of global environment issues, including representation of New Zealand interests and concerns in negotiations. The Ministry for the Environment provides advice on the domestic aspects of global environmental issues, as well as on purely domestic matters.
The main method available under international law for countries to work together on global environmental issues is through Multilateral Environmental Agreements (MEAs). These are agreements between states which may take the form of ‘soft law’, setting out non-legally binding principles that parties will regard when considering actions which affect particular environmental issues, or ‘hard law’, which specify legally-binding actions to be taken to work towards an environmental objective (eg conventions such as the United Nations Framework Convention on Climate Change). Further information on MEAs in force in New Zealand, and key obligations under these agreements, can be found on the Ministry for the Environment's website at www.mfe.govt.nz/management/international/meas.htm and www.mfe.govt.nz/management/international/homepmea.htm
New Zealand ratified the Framework Convention on Climate Change (FCCC) and the Convention on Biological Diversity (CBD) in 1993. It was the third country (and first developed nation) to ratify the London Amendment to the Montreal Protocol on Substances that Deplete the Ozone Layer. It agreed to contribute about NZ$10.4 million to the 1994/96 replenishment of the Global Environment Facility (GEF), which provides funding for projects addressing four global environmental problems (climate change, biodiversity loss, ozone depletion and international waters). A further contribution of NZ$8.3 million to a second replenishment of the facility was agreed in 1998 and is to be drawn down over a 10-year period. New Zealand participated actively in negotiations on amendments to the London Convention on the Prevention of Marine Pollution by Dumping of Wastes 1972, and ratified the Basel Convention on the Control of Transboundary Movements of Hazardous Wastes and their Disposal in 1995.
New Zealand was active in the UN Conference on Straddling Fish Stocks and Highly Migratory Fish Stocks, which, in 1995, resulted in agreement on a new convention to complement existing provisions of the UN Convention on the Law of the Sea. The convention contains innovative provisions on enforcement of conservation and management measures on the high seas and was opened for signing in December 1995.
New Zealand plays an active conservationist role in the International Whaling Commission (IWC) and was a major proponent of the creation of a circumpolar southern ocean whale sanctuary agreed at the 1994 IWC meeting. The sanctuary extends from the Antarctic ice edge to points between 40° and 55° south latitude, and includes much of New Zealand.
New Zealand has been particularly active in questions relating to trade and environment, including discussions held at the OECD and in GATT. This will continue, especially in the new World Trade Organisation Committee on Trade and Environment.
New Zealand recognises the special vulnerability of South Pacific countries to global environment problems. Through the South Pacific Regional Environment Programme (SPREP), the South Pacific Forum and other international environmental negotiations, New Zealand has sought to support Pacific Islands countries and to ensure their concerns are heard. It was active in the Global Conference on the Sustainable Development of Small Island Developing States in Barbados in 1994, and in the 1999 UN Special Session to review the Barbados Programme of Action. In 1995, New Zealand signed the Waigani Convention to Ban the Importation into Forum Island Countries of Hazardous and Radioactive Wastes and to Control the Transboundary Movement and Management of Hazardous Wastes within the South Pacific Region.
Domestic implications of the United Nations Framework Convention on Climate Change. Having ratified the United Nations Framework Convention on Climate Change (UNFCCC) in September 1993, New Zealand, along with other developed countries, has an obligation to reduce its emissions of greenhouse gases and to protect and enhance forest sinks. New Zealand must report its progress in annual greenhouse gas inventories, and detail its policies, measures and associated greenhouse gas projections in national communications periodically.
The New Zealand climate change programme aims to raise the awareness of the community about how climate change impacts will affect them and what planning mechanisms could be involved.
In July 2001, Climate Change Impacts on New Zealand was published, updating a government-led assessment produced in 1990. It was based on contributions from experts and peer-reviewed scientific studies published internationally and in New Zealand. The report states that our sea levels are projected to rise, rainfall patterns are likely to shift and temperatures will rise significantly by 2100. These changes could affect our health, agriculture, native ecosystems, coastlines and urban environment.
Several other reports have been produced for specific groups providing further details about climate change impacts and adaptation options on agriculture, human health and New Zealand's coastline.
The climate change programme will develop a long-term adaptation strategy to reduce the risks and increase the benefits that climate change may bring. Climate models indicate that because of past and present greenhouse gas emissions in New Zealand, some degree of climate change will occur, even if global greenhouse gas emissions are reduced under international frameworks such as the Kyoto Protocol. Adaptation is a complementary measure to the commitment to international efforts to reduce greenhouse gas emissions.
Land Information New Zealand (LINZ) advises the government, administers the Crown's interests in land and makes government-held land information available to the public.
It is the government spatial referencing authority, and the steward and standard setter for core national land databases, including the spatial referencing system, cadastral system, land titles, topography, hydrography and Crown property (excluding the conservation estate).
The valuer-general, whose office is established within LINZ, sets standards for rating valuations carried out by local authorities.
LINZ has two broad focuses: policy and regulatory responsibilities and standards for land-related and seabed information; and direct services to the public, such as the state-guaranteed issue of land titles, availability of land information and approval of survey plans.
Specifically, LINZ undertakes to:
Provide expert advice to the government on land-related laws and policies.
Provide a secure environment for buying, selling and subdividing property.
Administer the Crown's interests in land through the acquisition, disposal and administration of Crown land and the management of Crown land liabilities.
Assist the government and its agencies address Treaty of Waitangi issues through the provision of information on land history and status.
Ensure New Zealand has high-quality databases for its survey, topographic, hydrographic and property activities.
The main acts administered by LINZ are: the Crown Grants Act 1908; Deeds Registration Act 1908; The Hunter Gift for the Settlement of Discharged Soldiers Act 1921; Land Act 1948 and regulations; Land Transfer Act 1952 and regulations; New Zealand Geographic Board Act 1946; Public Works Act 1981 (Parts II to VI and VIII) and regulations; Rating Valuations Act 1998 and regulations; various reserves and other lands disposal acts; Survey Act 1986 and regulations; and the Unit Titles Act 1972.
The chief executive has statutory functions under the Public Works Act relating to the disposal of surplus land. More than 450 other statutes give LINZ specific responsibilities for land transactions.
Surveying infrastructure. The New Zealand survey system provides a national spatial reference framework for the accurate location of land and seabed rights and resources.
The spatial reference framework is based on a national network of survey control marks, including trig stations, connected to the global reference framework. Land Information New Zealand (LINZ) administers the survey system, primarily to provide for the reliable identification and definition of land boundaries for recording land rights for Crown, Māori, leasehold and freehold tenures.
The system also makes it possible to integrate other land and geographic information for activities such as defining electoral and other administrative boundaries, land development, resource management, granting mining and marine licences, locating utilities, engineering and construction, topographic mapping and hydrographic charting, scientific studies, location of marine and air navigation aids, both nationally and internationally, and determination of New Zealand's national and economic zone boundaries.
The extent and location of boundaries of rights and interests in land are defined and documented by registered land surveyors, mainly in the private sector. They submit records of surveys to LINZ for validation against existing records. LINZ maintains registers of rights and interests in land and undertakes checks to ensure new rights do not conflict with existing rights. This ensures certainty and security as to the extent of land rights and interests, irrespective of tenure.
LINZ is in the process of converting survey and title records and processes to a computerised system known as Land online. The new system will provide for the semi-automated processing of survey and title transactions and for on-line access to survey and title records.
The LINZ website is www.linz.govt.nz
Aerial photography. Extensive use is made of aerial photography to support revision of New Zealand's national mapping programme. LINZ holds and maintains a national air photo library which provides a comprehensive national source of land information data available to the public. Terralink New Zealand Ltd also receives and holds multi-spectral imagery collected by earth resource satellites.
A Land Information New Zealand employee examines output from a topographical database.
Topography and hydrography. The topographic database, which consists of 1:50,000 and other core topographic maps (including maps of the Pacific and the Antarctic), the digital topographic database, and Crown copyright aerial photographs provide a reliable and authoritative record of New Zealand's land form and its features. This information is used for planning, construction, development, environmental assessment, local government administration, emergency services, search and rescue and defence purposes.
Hydrographic charts and publications must be carried by commercial ships navigating in New Zealand waters. This is a statutory requirement contributing to safety at sea. Recreationalists are encouraged to use the information for small craft navigation. Charts range from detailed representations of harbours and their entrances to depictions of deep-sea passages.
The national topographic/hydrographic authority of LINZ manages national topography and hydrography.
Registration of land ownership. Almost all privately-owned land in New Zealand is held under the land title system, as embodied in the Land Transfer Act 1952. All property rights are derived from the Crown and title to land in private ownership is a matter of public record. The creation of new rights and termination of existing rights in land, providing certainty of title to interests of land with a state guarantee, is the function of LINZ, as is the keeping of title records. The objectives of LINZ's title services are primarily to provide state-guaranteed certainty of title to land and to provide and maintain the Torrens Land Title System.
New Zealand is divided into 12 land registration districts. Each district has a land registry office responsible for recording transactions affecting the land in that district. A certificate of title to a piece of land is the basic record of transactions concerning that land. It provides the legal description and diagram of the land, both current and historic owners and a summary of registered legal documents concerning the land. Documents listed on a certificate of title may include mortgages, leases, various types of charges, and rights and restrictions which affect the land in some way. Certificates of title and the documents listed on them are held in the land registry office in the district where the land is situated and are available for public search. Table 16.2 shows the number of land transfer documents processed by LINZ from 1994 to 2001
Table 16.2. Land transfer documents processed
| Year ended 30 June | Instruments received | Certificates of title | Plans lodged | Guaranteed searches | Title searches | Document searches |
|---|---|---|---|---|---|---|
| Source: Land Information New Zealand | ||||||
| 1994 | 863,743 | 42,947 | 16,019 | 137,713 | 1,024,426 | 282,013 |
| 1995 | 873,883 | 48,839 | 17,726 | 145,773 | 982,846 | 273,784 |
| 1996 | 925,263 | 50,665 | 16,462 | 182,394 | 1,048,717 | 287,394 |
| 1997 | 859,162 | 63,012 | 18,995 | 184,995 | 948,565 | 257,638 |
| 1998 | 799,370 | 56,643 | 16,866 | 183,275 | 861,720 | 226,624 |
| 1999 | 777,236 | 53,143 | 13,610 | 195,974 | 862,449 | 195,088 |
| 2000 | 759,003 | 52,983 | 13,455 | 195,125 | 838,453 | 197,993 |
| 2001 | 662,945 | 46,803 | 11,700 | 181,618 | 824,708 | 179,417 |
Table 16.3 lists sales of freehold rural land for each half year from December 1993 to June 2001.
Table 16.3. Market sales of freehold rural land
| Half year ended | No. of sales | Total sale price $(million) | Index number1 | Percentage change from previous half year |
|---|---|---|---|---|
1Base (= 1000) half year ended December 1989. Note:From June 2000 half year onwards sales are collated by sale date. Prior to that sales were collated by the date the sale notice was received by Quotable Value New Zealand. Source: Quotable Value New Zealand | ||||
| Dec 1993 | 1,510 | 469.2 | 1696 | +5.9 |
| Jun 1994 | 2,216 | 1,018.6 | 1988 | +17.2 |
| Dec 1994 | 1,393 | 556.2 | 2073 | +4.3 |
| Jun 1995 | 2,013 | 1,094.1 | 2270 | +9.5 |
| Dec 1995 | 1,153 | 483.0 | 2295 | +1.1 |
| Jun 1996 | 2,006 | 1,133.9 | 2323 | +1.2 |
| Dec 1996 | 1,121 | 452.7 | 2334 | +0.5 |
| Jun 1997 | 1,365 | 635.0 | 2272 | -2.7 |
| Dec 1997 | 1,023 | 411.5 | 2270 | -0.1 |
| Jun 1998 | 1,160 | 559.2 | 2192 | -3.4 |
| Dec 1998 | 718 | 299.0 | 2224 | +1.5 |
| Jun 1999 | 1,347 | 701.9 | 2243 | +0.9 |
| Dec 1999 | 952 | 438.0 | 2256 | +0.6 |
| Jun 2000 | 1,293 | 714.3 | 2268 | +0.5 |
| Dec 2000 | 1,192 | 739.0 | 2369 | +4.5 |
| Jun 2001 | 1,349 | 923.1 | 2434 | +2.7 |
The Overseas Investment Regulations 1995 repealed provisions of the Land Settlement Promotion and Land Acquisition Act 1952 and amended the Overseas Investment Regulations 1985 governing the acquisition of New Zealand rural land by overseas parties. The regulations provide a more liberal approach and set clearer criteria for consent, either by a joint ministerial decision from the Treasurer and Minister for Food, Fibre, Biosecurity and Border Control, or by the Overseas Investment Commission under delegated authority.
Among other things, the regulations:
Define land transactions that would normally require joint ministerial consent. These include transactions for land exceeding five hectares in area; on offshore islands (specified in the regulations) which exceed 0.4 hectares in area; exceeding 0.4 hectares in area that is on, includes or adjoins, foreshore, certain sized lakes, or land provided as reserve, or is an historic place or is conservation land; of more than $10 million in value. Where land is to be used for agricultural purposes, the applicant's planned use, and whether it is for experimental or research work, is considered. When persons wish to farm the land individually, their capacity to do so is noted, while consideration is given to any intention to reside permanently in New Zealand. Additionally, the applicant is required to demonstrate that the acquisition makes a material contribution to the regional or national economy.
Stipulate the need for applicants to have relevant business experience and acumen and demonstrate a financial commitment to the overseas investment.
Require that the following ‘national interest’ benefits accrue: creation of new job opportunities in New Zealand or retention of existing jobs; introduction of new technology or business skills; development of new export markets and the introduction of new capital to New Zealand; promotion of competition, efficiency, productivity and processing of primary product in New Zealand; and enhancement of domestic services.
Provide for requisition of information from applicants when evasion or non-compliance with regulations is suspected.
Provide for the joint consents of the Treasurer and Minister for Land Information, or for the revocation of consents when appropriate.
The Overseas Investment Commission administers legislation, while LINZ provides technical assistance and advice to the commission and ministers.
Before European settlement, all land was held by various groups and tribes of Māori in accordance with traditional customs and usage. Land remaining in this tenure is termed ‘Māori customary land’. By the Treaty of Waitangi, the right to purchase land from Māori was reserved to the Crown. Almost all of what had been Māori customary land was converted to other forms of title by one or other of the following processes:
Purchase or other acquisition by the Crown (from whom European settlers obtained land for farms etc).
The issue of a Crown grant to a Māori owner on the recommendation of the Māori Land Court.
The issue of a freehold order by the Māori Land Court in favour of the Māori individual found entitled upon investigation of title. (This process was used instead of the second process after introduction of the land transfer system into New Zealand).
Land in titles issued under the latter two processes became known as Māori freehold land. A Māori may buy or otherwise acquire land which is not Māori freehold land, and for this reason there is an unknown but considerable amount of general land owned by Māori in addition to their holdings of Māori freehold land. Māori freehold land is subject to the jurisdiction of the Māori Land Court, pursuant to the Te Ture Whenua Māori Act 1993, and some general land owned by Māori is subject to certain provisions of that act.
Māori Land Court: Te Kooti Whenua Māori. The purpose of the Māori Land Court is to contribute to the administration of Māori land, the preservation of taonga Māori and to promote the management of Māori land by its owners. The Māori Land Court:
Maintains records of title and ownership of Māori land.
Provides accurate and accessible information from the Māori Land Court and Crown records.
Provides support and services through the Māori Land Court Business Unit within the Department for Courts.
In 1999, the Māori Land Court simplified the processing of land applications and created a computer database of Māori land for each title. This includes information on the block, ownership, management and memorial schedules, and a sophisticated search facility.
The next step is to copy most of the original record held by the court into electronic format to ensure its protection, preservation and improved accessibility.
Table 16.4 lists the total number of blocks administered by the Māori Land Court, by district.
Table 16.4. Land administered by Māori Land Court 2001
| Māori Land Court districts | Total blocks administered |
|---|---|
| Source: Māori Land Court | |
| Tai Tokerau | 3,998 |
| Waikato/Maniapoto | 5,361 |
| Waiariki | 5,183 |
| Tai Rāwhiti | 1,561 |
| Takitimu | 1,856 |
| Aotea | 5,092 |
| Te Wai Pounamu | 3,817 |
| Total | 26,868 |
Māori land development. Former government programmes aimed at the development of Māori land have largely been concluded and Te Puni Kōkiri encourages administration of Māori land by Māori landowners. A significant proportion of the more than 2 million ownership shares in Māori land are believed to be held by deceased or absentee owners. This hinders decision making and utilisation of Māori land, and makes it more difficult for the Māori Land Court to ascertain the wishes of the owners when a proposal comes before the court for approval or confirmation. To help address some of these issues, Te Puni Kōkiri and the Māori Land Court have produced five booklets aimed at educating Māori land owners. They are Guide to Succession, Guide to Māori Land Trusts, Māori Incorporations, Māori Reservations and Guide to Loan Securities.
The Department for Courts has made it a strategic goal to make the services of the Māori Land Court, in particular the provision of title and ownership information, easily accessible to Māori.
Prior to 1987, Crown-owned land was administered by various Crown agencies pursuant to the Public Works Act 1981, the Land Act 1948, the Reserves Act 1977, the National Parks Act 1980 and the Forests Act 1949.
Significant reconstruction of the public sector began in 1987, including reorganisation of the government's environmental and public works administrations. Much of the Crown's commercial or productive land was subsequently transferred to state-owned enterprises. Land remaining in Crown ownership is administered by service delivery departments where the land is required for the running of the business, the Department of Conservation in the case of reserves etc, and LINZ in the case of residual Crown-owned land.
Land administered by Land Information New Zealand. Land Information New Zealand (LINZ) is responsible for the administration and eventual disposal or alienation of residual Crown-owned land pursuant to the:
Land Act 1948 and various endowment acts, comprising unalienated Crown land (2,736 properties).
Crown Pastoral Land Act 1998, comprising 2.4 million hectares of South Island high country Crown pastoral leasehold (354 properties).
Crown Forest Assets Act 1989, comprising Crown forest land over which Crown forest licences have been issued (98 licences).
Public Works Act 1981, comprising land no longer required to be held by the Crown for the public work purpose for which it was acquired, including hydroelectric power development, post offices, public works depots and government office accommodation (197 properties).
Railways Corporation Restructuring Act 1990, comprising land no longer required for railway operations (1,524 properties).
The department manages the process and policy for the review of South Island high country Crown pastoral leasehold land. This tenure review process provides opportunities for better land use and sustainable land management objectives.
All Crown forest land, and a significant amount of the other land administered by the department, is required to be held in Crown ownership pending the Crown's resolution of Māori land claims lodged pursuant to the Treaty of Waitangi Act 1975, or the completion of direct negotiations between the Crown and claimants.
The department also administers an estimated 150 Crown land-related liabilities such as contaminated sites, subsidence areas and residual issues concerning Crown land.
Land administered by service delivery Crown agencies. A significant quantity of Crown-owned land is held by service delivery Crown agencies. This land is held for government works pursuant to the Public Works Act 1981 and other functional legislation including education, defence and law and order.
Land administered by the Department of Conservation. The Department of Conservation administers national and forest parks, world heritage areas, wilderness areas, marginal strips around lakes and rivers and more than 1,000 other reserves. It also protects privately-owned land under special arrangements with landowners. The department is responsible for conservation in New Zealand's sub-antarctic islands and the Ross Dependency in Antarctica.
Landcorp Farming Ltd. Landcorp Farming Ltd (Landcorp) commenced business as a state-owned enterprise on 1 April 1987, primarily to handle the government's commercial farming and land management operations previously undertaken by the Department of Lands and Survey. It now operates completely in the private sector. Landcorp has one subsidiary, Landcorp Investments Ltd, which is responsible for 714 leases, licences and mortgages.
Landcorp Farming is responsible for farming operations involving some 1.5 million stock units on 110 properties throughout New Zealand. The company is also involved in animal breeding schemes covering a wide range of animal species and provides research, development and marketing to enhance profitability and support its products in the market.
Landcorp's head office is in Wellington and there are business centres in Rotorua and Christchurch.
Equitable land values are needed for:
Levying rates by local authorities.
Apportioning rating levies across contributing local authorities.
Lending money on mortgage by government agencies and by trustees under the Trustee Act 1956.
Assessing stamp, estate and gift duties.
Fixing prices for transfers of land to or from the Crown.
Quotable Value New Zealand (QVNZ) competes with other providers to gain contracts with local authorities to assess values of real estate for local rating purposes. The valuer-general audits the work of QVNZ and other providers.
Valuers are required to determine:
The capital value of the whole property (land and buildings, plus improvements).
The value of the land as if it were vacant.
The value of improvements (if any) upon the land.
Improvements on land are defined as items of work done or structural additions resulting from materials used on, or for the benefit of, the land.
The valuation roll. A valuation roll is prepared for each district over which a territorial local authority sets rates. The roll shows the ownership, description and valuation of each property, including rates postponement and special rateable values when required. District valuation rolls are revised at least once every three years. Objections can be lodged against revaluations and taken to the Land Valuation Tribunal.
Rating valuations. The Rating Powers Act 1988 makes provision for equalisation of values as a basis for the equitable adjustment of rates and levies among a number of local authorities or between parts of a territorial or regional authority if they have been revalued at different times.
Valuers’ Registration Board. The Valuers’ Act 1948 provides for the protection of the public through registration of valuers of land. The Valuers’ Registration Board, chaired by the valuer-general, sets standards of education and practical experience required for registration. The board maintains a register of valuers who meet required standards and issues annual practising certificates to public valuers. In addition, the board exercises disciplinary power when a valuer is charged with incompetent or improper or unethical behaviour. In the year ended December 2001, there were 24 complaints, which resulted in five inquiries. Three valuers were found guilty of charges brought against them. Of the 1,400 valuers registered at 31 December 2001, 910 held annual practising certificates.
The Department of Conservation administers the majority of publicly-owned land in New Zealand protected for scenic, scientific, historic and cultural reasons, or set aside for recreational purposes. More than 8 million hectares – nearly 30 percent of New Zealand's total area – are administered by the department. There are 14 national parks, covering more than 3 million hectares, nearly 170 forest and conservation parks, covering about 1.3 million hectares, and about 3,500 reserves, including marine reserves. Additionally, more than 61,000 hectares of protected private land and covenants have been set aside for scenic, scientific or ecological reasons. The department also has responsibility for preservation and management of wildlife and has a role in management of the coastal marine area.
The National Parks Act 1980 provides for the establishment of national parks in areas where the scenery is of such distinctive quality, or the natural features or ecological systems so important scientifically, that their preservation is in the national interest. The act also provides for the public to have access to the parks, though this is subject to conditions and restrictions necessary for the preservation of native plants and animals, or for the welfare of the parks in general. Access to specially protected areas, which total 55,000 hectares, is by permit only.
The act states that national parks are to be maintained as far as possible in their natural state so that their value as soil, water and forest conservation areas is maintained. Native plants and animals are to be preserved, and introduced plants and animals are to be removed if their presence conflicts with the aims of the act.
Development in wilderness areas within national parks is restricted to foot tracks and huts essential for wild animal control or scientific research. The act allows the Department of Conservation to provide houses for park staff, accommodation houses and other buildings, hostels, huts, camping grounds, ski tows and similar facilities, parking areas, reading and tracks within the parks. Accommodation, transport and other services at entry points to parks are provided by the department, other government agencies, voluntary organisations and private enterprise. Some services within parks, such as guided walks and skiing instruction, are provided by private firms under concessions from the department.
Figure 16.6 shows the location of New Zealand's national parks, state forest parks and maritime parks.
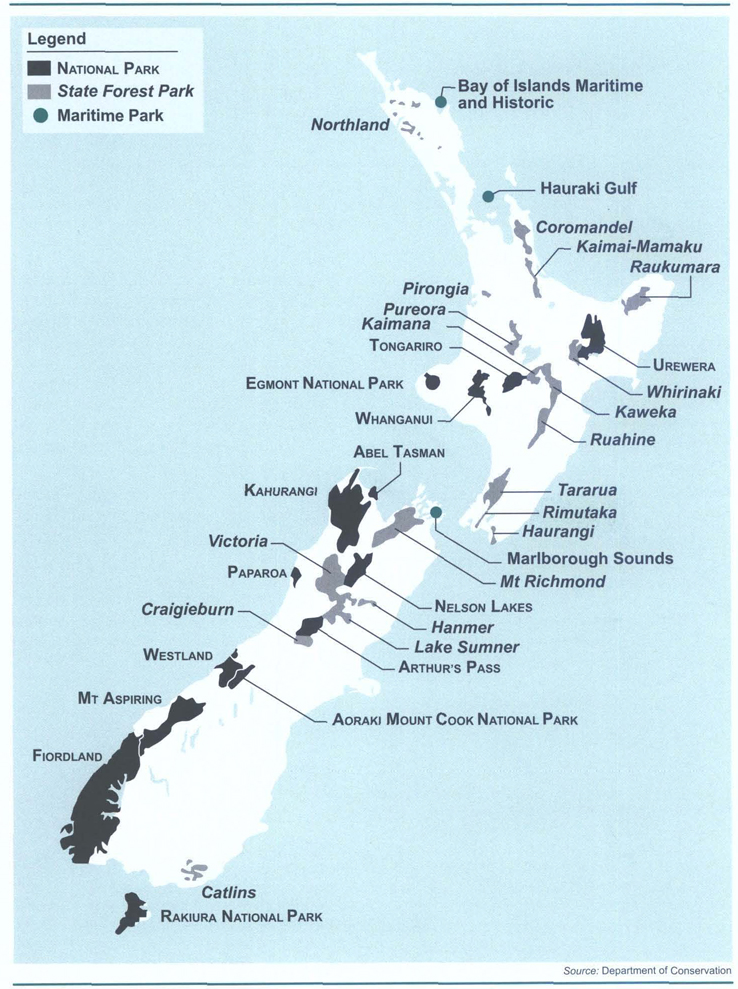
New Zealand has two world heritage sites, Te Wahipounamu (south-west New Zealand) and Tongariro National Park. World heritage areas consist of more than 440 sites listed under the United Nations Economic, Scientific and Cultural Organisation's world heritage convention as the most outstanding natural and cultural places on earth. Te Wahipounamu is one of the world's great forest and mountain wildernesses. It consists of 2.6 million hectares (10 percent of the area of New Zealand) of the south-west of the South Island, including Fiordland, Mt Aspiring, Westland and Mt Cook national parks and the coastal swamp kahikatea forests of south Westland. Tongariro National Park is one of a limited number of sites accorded world heritage status for both its natural and cultural values. It is considered to contain some of the most continuously active stratovolcanoes in the world. It was the first national park in the world to be freely gifted to the nation by an indigenous people, the Ngāti Tūwharetoa, to whom the mountains are sacred.
National Parks management systems balance preservation of the environment with visitor enjoyment.
The Department of Conservation administers about 20 forest parks. Primary purpose of the parks, in most cases, is to protect catchments of forested mountain ranges, but they also provide a less restricted range of recreational activities than national parks and reserves, including tramping, camping, fishing and shooting for a variety of game. Forest parks include coastal areas, lakes, mountains, tablelands and tussock grasslands within an approximate total area of 1.8 million hectares.
Reserve land includes scenic, nature, scientific, historic, national and recreational reserves, wildlife reserves, protected private land and land protected under various conservation and open space covenants.
Scenic reserves – About 382,000 hectares are classified scenic reserves. They include areas of scenic interest such as native forests, limestone and glow-worm caves, thermal areas, coastal areas, lakes, rivers, waterfalls and scenic vantage points.
Nature reserves – These reserves are established for preservation of native plants and animals. They generally consist of areas where rare plants are growing or which supply a suitable habitat for rare birds or other animals. Some of the 50-odd reserves (109,400 hectares) in this category are on the mainland, but most are on offshore or outlying islands.
National reserves – National reserves protect areas of outstanding natural beauty or scientific or ecological importance. They are second only to national parks in the degree of protection they offer. The Snares Islands, Auckland Islands, Campbell Island, Antipodes Island and the Bounty Islands together form the sub-antarctic Islands National Reserve of approximately 74,885 hectares. The islands are the major breeding places for several species of birds and animals, including the yellow-eyed penguin, the royal albatross and the Hooker's sea lion. The threat of rats or other predatory animals accidentally being introduced to the islands has led the Department of Conservation to allow access by permit only. Previous experience has shown that one pregnant rat arriving on a previously rat-free island could lead to extinction of a vulnerable species. Total area of national reserves is 96,300 hectares.
Scientific reserves – These are generally smaller areas reserved to protect examples of rare or endangered plants, animals or unique geographical features for scientific research or education. Entry may be prohibited if this is considered necessary to prevent disturbance. Their total area is 15,200 hectares.
Historic reserves – These reserves include Māori rock drawings, sites of prehistoric fortifications, landing places of Captain Cook, sites of engagements during the New Zealand wars and buildings of historic importance. The Department of Conservation and the New Zealand Historic Places Trust cooperate in the investigation and administration of reserve sites and buildings. There are 16,122 hectares of historic reserves.
Recreation reserves – These include public domains, camping grounds and other public recreational areas administered by the Department of Conservation. Their total area is 60,261 hectares.
Wildlife reserves – Wildlife reserves may be proclaimed over land of any tenure, prohibiting certain actions in respect of wildlife, but without affecting land ownership. Their total area is just more than 19,000 hectares.
New Zealand has been actively promoting a South Pacific whale sanctuary to provide long-term protection for the breeding grounds of the region's great whales. The proposal received the support of more than 60 percent of members of the International Whaling Commission at its 2000 and 2001 meetings, but a 75 percent majority is required for establishment of sanctuaries. New Zealand sponsored a regional workshop to progress a South Pacific whale sanctuary in Apia, Samoa, in April 2001, which was attended by 15 Pacific Island nations and territories. The meeting strongly endorsed the sanctuary proposal. Since then, the Cook Islands has declared its exclusive economic zone a whale sanctuary, and French Polynesia was expected to make a similar declaration in 2002. Two whale sanctuaries already exist, the Indian Ocean sanctuary established in 1978, and the Southern Ocean sanctuary set up in 1994. All New Zealand waters south of 40° are included within the latter (see Figure 16.7).
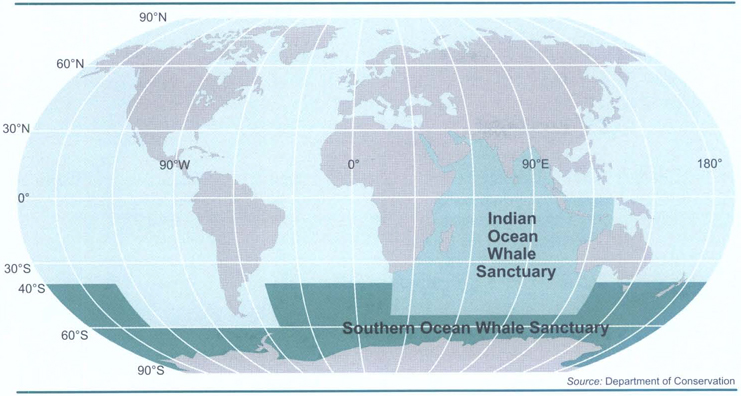
New Zealand has 16 marine reserves. The Kermadec Islands Marine Reserve is the largest, at 748,000 hectares. The Cape Rodney-Okakari Point Marine Reserve (518 hectares) was the first gazetted in 1975, followed by the Poor Knights Islands (2,410 hectares) in 1981. All the remaining reserves have been gazetted since 1990: Wanganui-A-Hei (84 hectares), Tuhua/Mayor Island (1,060 hectares), Kapiti (2,167 hectares), Long Island (619 hectares), Westhaven Te Tai Tapu (536 hectares), Tonga Island (1,835 hectares), Te Awaatu Channel (93 hectares), Piopiotahi (690 hectares), Pohatu Marine (218 hectares), Te Angiangi Marine Reserve (446 hectares), Pollen Island (500 hectares), Long Bay-Okura (980 hectares) and Te Tapuwae o Rongokako (2450 hectares).
Several applications for new marine reserves are part way through the statutory process.
Two marine parks, Mimiwhangata and Tawharanui, are protected by fisheries regulations.
The Sugar Loaf Islands, previously a marine park, is now a marine protected area under its own legislation.
The Department of Conservation is responsible for fire control in state areas, which include national parks and reserves, forest parks and unalienated Crown land, together with a 1km fire safety margin adjoining all these lands.
Members of the Kiwi Conservation Club plant native trees in the Kapiti region.
Preservation of all classes of natural ecosystems and landscapes which give New Zealand its natural character is required by the Reserves Act 1977, and the Protected Natural Areas Programme has been developed to help achieve this goal. The programme operates in two phases: an ecological survey to identify unprotected areas that best represent a wider area (generally using the framework of ecological regions and districts), and negotiation with landowners of effective forms of protection for proposed representative areas. Most programme surveys are carried out by the Department of Conservation or local government councils.
The Forest Heritage Fund and Ngā Whenua Rahui were established as part of New Zealand's indigenous forest policy. Both funds aim at the permanent protection of conservation value forest on general and Māori land. With the Forest Heritage Fund, this is achieved through gifting, covenanting and outright purchase. The Ngā Whenua Rahui fund uses a range of mechanisms to achieve protection, with covenanting being the most suitable. Iwi perceive covenants acceptable in lessening the sense of alienation from the land. Ngā Whenua Rahui, in particular, encourages voluntary protection of forests on Māori-owned land, while honouring the rights guaranteed to Māori landowners under the Treaty of Waitangi, and affirming the status and tino rangatiratanga of the tangata whenua. Both funds are contestable. Anyone can apply to the Forest Heritage Fund. Ngā Whenua Rahui is restricted to Māori landowning interests. Applications for funds are considered by the advisory committees of the funds, who make recommendations to the Minister of Conservation.
New Zealand Conservation Authority. The New Zealand Conservation Authority provides advice to the Minister of Conservation on departmental policy development, including customary Māori use, Treaty of Waitangi issues and other conservation matters of national importance. The authority, established in 1990 under the Conservation Act 1987, approves conservation management strategies and maintains close involvement in ecosystem protection, including animal and weed pests and the use of 1080 in animal control, and in the development of strategies and plans to protect New Zealand's biodiversity. It also has a particular interest in recreation and tourism, and is concerned that the department plans for tourism, develops performance measures and carries out research on physical and social impacts. Under the National Parks Act 1980, the authority approves national park management plans and investigates new national parks and additions to existing parks.
Conservation boards. New Zealand has 14 conservation boards serviced by the Department of Conservation. Conservation boards are statutory bodies providing community advice on the conservation areas, policies, activities and responsibilities of the department. They ensure the community has a voice in conservation management and represent the long-term public interest. including that of tangata whenua, in conservation.
New Zealand Fish and Game Council. The New Zealand Fish and Game Council represents nationally the interests of anglers and hunters, and provides coordination of the management, enhancement and maintenance of sports fish and game. The council advises the minister and, together with regional fish and game councils, develops national policies for carrying out its functions. It oversees effective implementation of any general policies established by the minister. Other functions include an advocacy role in statutory planning processes and fair distribution of revenues among regional fish and game councils.
Regional fish and game councils. There are 12 regional fish and game councils throughout New Zealand whose functions include assessing and monitoring fish and game, promotion and education, planning, representing the interests of anglers and hunters in planning processes, and issuing licences to fish or hunt.
Taupo Fishery Advisory Committee. The Taupo Fishery Advisory Committee advises the Department of Conservation and the minister on day-to-day management by the department of the Taupo Fishing District and on allocation and expenditure of funds.
Queen Elizabeth II National Trust. The trust encourages the provision, protection and enhancement of open space for the benefit of all New Zealanders. Most often, the trust enters into voluntary open space covenants with private or non-government landowners. While the land itself remains in private ownership, the landscape is protected by the trust, which acts as independent perpetual trustees. Covenant agreements specify how the area is to be managed and are registered against the land title. At June 2001, there were 1,343 registered covenants protecting natural features on 49,883 hectares of land throughout New Zealand. The trust also owns property, most of which has been gifted or bequeathed, and encompasses a range of natural, cultural, scientific or aesthetic values. In 2001, the trust received an operating grant of $1,638,222 from the government. It also generates funds from its own activities and investments.
New Zealand Historic Places Trust. The trust is a non-profit organisation which exists to identify, record and preserve New Zealand's historic buildings, archaeological sites and wāhi tapu, and to encourage public interest in the nation's past. The trust is described in more detail in Chapter 12: Arts and Cultural Heritage.
Waitangi National Trust Board. The board administers the Waitangi National Reserve, which includes the Treaty House. The reserve was gifted to the nation in 1932 by then Governor-General Lord Bledisloe and his wife. The Minister of Conservation is administrator of the trust and is an ex officio member of the board. Other members of the board are the governor-general (chairman), the prime minister, the Minister of Māori Affairs and nine others representing those with a close association with the Treaty of Waitangi. A number of other boards have been set up to aid the government and the Department of Conservation in administering specific responsibilities. These include the Guardians of Lakes Manapouri, Monowai and Te Anau, the Guardians of Lake Wanaka, Te Roaroa Waipoua Archaeological Advisory Committee, the Forest Heritage Fund, the South Westland Environmental and Community Advice Group, Nga Whenua Rahui and the Wild Animal Recovery Service Appeal Authority.
New Zealand has many private organisations involved in conservation and environmental issues. These vary from local clubs concerned with protection or restoration of the local environment to national and international groups concerned about preserving the environment for its ecological, scientific, recreational or scenic value.
The Royal Forest and Bird Society (www.forest-bird.org.nz) is New Zealand's oldest environmental non-government organisation, founded in 1923. It has branches throughout New Zealand, including a children's branch, the Kiwi Conservation Club.
Environment and Conservation Organisations of New Zealand (www.converge.org.nz/eco) is a network of about 70 organisations concerned for the environment. Members range from large international organisations such as Greenpeace to small local groups.
Federated Mountain Clubs (www.fmc.org.nz) is a national organisation of more than 100 tramping, mountaineering, skiing, mountainbiking and deerstalking clubs. It has approximately 14,000 members and promotes rights of access, preservation and sound management of the backcountry.
16.1 Statistics New Zealand.
16.2 Ministry for the Environment; Ministry of Agriculture and Forestry; Ministry of Economic Development; Ministry of Foreign Affairs and Trade.
16.3 Land Information New Zealand; Quotable Value New Zealand; Department for Courts; Māori Land Court; Department of Conservation; Land Corporation Limited; Valuers’ Registration Board.
16.4 Department of Conservation; Queen Elizabeth II National Trust; Statistics New Zealand.
Statistics New Zealand manager responsible: Zane Colville.
Annual Report (annual). Land Corporation Ltd, Wellington.
Report of Quotable New Zealand (Parl paper G.26).
Conveyancing Bulletin (eight times a year). Butterworths, Wellington.
Geographic Information: Australian and New Zealand land use codes (1999). Standards Australia, Homebush, NSW and Standards New Zealand, Wellington.
Report of the Ministry of Justice (Parl paper E.5).
Report of Land Information New Zealand (LINZ) (Parl paper C.14).
Air Quality, Climate Change and the Ozone Layer – Environmental Statistics Series (1998), Statistics New Zealand, Wellington.
Climate Change: New Zealand's greenhouse gas emissions (2001). Ministry for the Environment, Wellington.
Environmental Performance Indicator Programme: Vehicle fleet composition (2001). Ministry for the Environment, Wellington.
Erosion (2001). On-line, Landcare Research.
Fenemore AD, and Robb CA (2001). Groundwater Management in New Zealand, in Groundwaters of New Zealand, Rosen MR and White PA (eds), New Zealand Hydrological Society, Wellington.
Hackwell K, and Bertram G (1999). Pests and weeds: The cost of restoring an indigenous dawn chorus: a blueprint for action against the impacts of introduced pest organisms on the New Zealand environment. New Zealand Conservation Authority, Wellington.
Managing our Impacts on New Zealand's Marine Environment (1999). 2v, Ministry for the Environment, Wellington.
The New Zealand Biodiversity Strategy (2000). Department of Conservation, Wellington.
New Zealand Forestry Statistics 2000 (2001). Ministry of Agriculture and Forestry, Wellington.
The New Zealand Waste Strategy: Towards zero waste and a sustainable New Zealand (2002). Ministry for the Environment, Wellington.
The Resource Management Act and You: Getting in on the act (2001). Ministry for the Environment, Wellington.
Soil Quality Monitoring for Sustainable Agriculture (1997). On-line, Crop and Food Research, Christchurch.
The State of New Zealand's Environment (1997). Ministry for the Environment, Wellington.
Sustainable Land Management (2001). On-line, Ministry for the Environment, Wellington.
Ultraviolet Radiation. On-line, National Institute of Water and Atmospheric Research Ltd, Wellington.
Annual Report of the Department of Conservation (Parl paper C.13).
Report of the New Zealand Conservation Authority (Parl paper C.10).
Report of the Queen Elizabeth the Second National Trust (Parl paper C.2).
Table of Contents
New Zealand exported goods worth nearly $25 billion in the March 2000 year.
New Zealand has a mixed economy that operates on free market principles. It has sizeable manufacturing and service sectors complementing a highly efficient agricultural sector. The economy is strongly trade oriented, with exports of goods and services accounting for about 33 percent of total output.
From around 1984 onwards, the direction of economic policy in New Zealand turned away from intervention toward the elimination of many forms of government assistance. On the macroeconomic level, policies have aimed at achieving low inflation and a sound fiscal position, while microeconomic reforms have been intended to open the economy to competitive pressures. Reforms have included floating of the exchange rate; abolition of controls on capital movements; ending of industry assistance; removal of price controls; deregulation across a number of sectors of the economy; corporatisation and privatisation of state-owned assets; and labour market legislation aimed at facilitating more flexible patterns of wage bargaining.
Adjustment to this new economic framework has taken time and is ongoing. During the mid to late 1980s, the economy virtually stagnated and then entered recession in the early 1990s as necessary fiscal consolidation took place and a cyclical downturn occurred in key trading partners. The mid-1990s, however, saw output recover strongly before a slowdown in the economies of key Asian trading partners during the latter part of 1997 and through 1998 took a toll on New Zealand's economic activity. In addition, a drought affected large parts of New Zealand in the summers of 1997/98 and 1998/99. These shocks occurred when the economy was already in a slowing phase and the end result saw the New Zealand economy contract in the first half of 1998.
Since then the economy has seen a broad-based recovery. The second half of 1999 saw growth significantly above trend. A reversal of some of the factors leading to this growth led to the economy slowing in the first half of 2000, and actually contracting in the second quarter.
Looking ahead to the medium term, the reforms of the past 17 years mean New Zealand should be on a growth track that is more sustainable than in the past.
The first half of 2001 saw a recovery in business and consumer confidence and growing momentum in the domestic economy. A good agricultural season, combined with relatively high commodity prices and a competitive exchange rate, saw gains in farm incomes. Together with gains in household incomes on the back of the strong labour market and stimulatory monetary conditions, this helped to boost consumer spending and to provide support to the housing market. A rebound in business investment also contributed to growth of 4.0 percent in the year to 30 September 2001.
This increasingly broad-based growth took place despite the backdrop of a slowing world economy. The tragic events of 11 September 2001 created greater uncertainty about the magnitude and duration of the downturn in the United States, which had previously been widely expected to be nearing the bottom of the cycle. While New Zealand was favourably ‘out of sync’ with the slowdown in the world economy in the first half of 2001, growth slowed in the September quarter.
Growth is expected to be only moderate in the short term as export demand weakens and increased uncertainty feeds through into domestic confidence and activity.
Compared with the two most recent periods of slower trading partner growth (1990/91 and 1997/98), monetary conditions are at more stimulatory levels, commodity prices in New Zealand dollar terms are high and the labour market is in a strong position, with solid real income growth through 2000 and the first half of 2001. The fiscal position is also in healthy shape, with continued operating surpluses and low debt levels.
Monetary conditions have generally become easier since the start of 1997 as the exchange rate has trended down. Following a period of rising interest rates through 1998 to 2000, the Reserve Bank of New Zealand (RBNZ) lowered its official cash rate from 6.5 percent in late 2000 to 4.75 percent in November 2001.
Inflation peaked at 4 percent in the year to 31 December 2000, mainly due to high world oil prices and the fall in the exchange rate. Inflation declined throughout 2001, falling to 1.8 percent in the year to 31 December 2001, and is expected to continue to track back towards the centre of the RBNZ's 0 to 3 percent target band.
The current account deficit peaked at 6.7 percent in the year to March 2000 before improving to 3.1 percent in the year to September 2001. One-off imports (including the import of a naval frigate) and rising oil prices were part of the reason for the size of the deficit in 1999 and in the first half of 2000.
On an annual basis, the deficit was expected to decline further going into the first half of 2002 on the back of a better trade performance, before weakening in 2002/03 as declining world demand feeds through to the current account. The investment income deficit is expected to remain large.
The Fiscal Responsibility Act 1994 is intended to assist in achieving consistent, good-quality fiscal management, which should enable the government to make a major contribution to the economic health of the country and be better positioned to provide a range of services on a sustained basis.
The act requires the Crown's financial reporting to be in accordance with New Zealand Generally Accepted Accounting Practice.
The primary fiscal indicators are the operating balance, net debt and net worth.
The government is required to pursue its policy objectives in accordance with the principles of responsible fiscal management set out in the act. These include:
Reducing debt to prudent levels to provide a buffer against future adverse events.
Maintaining operating balances once prudent debt levels are reached, ie the government is to live within its means over time, with some scope for flexibility through the business cycle.
Achieving and maintaining levels of net worth to provide a buffer against adverse events.
Managing risks facing the Crown.
Pursuing policies consistent with a reasonable degree of predictability about the level and stability of future tax rates.
Operating balance. Following a prolonged period of fiscal deficits, New Zealand achieved surpluses in 1993/94.
The initial improvement in the operating balance from 1993/94 onwards reflected a growing economy, increasing tax revenues and firm expense control. Subsequent reductions in the operating balance reflected two rounds of tax reductions, lower nominal economic growth which reduced tax revenue growth, and changes in accounting policy.
Government operating expenses have been reduced as a percentage of gross domestic product (GDP) from 41.6 percent in 1992/93 to 34.5 percent in 2000/01.
Expenses have been controlled with output budgeting, accrual reporting and decentralised cost management. In 2000/01, the operating balance was $1.4 billion.
Operating surpluses are expected to continue. Forecasts for 2001/02, 2002/03, 2003/04, 2004/05 and 2005/06 are $1 billion, $1.8 billion, $2.9 billion, $3.7 billion and $3.9 billion respectively.
Expenses as a percentage of GDP are expected to fall to around 32.4 percent by 2005/06. The operating balance result of $1.4 billion for 2000/01 included liability valuation movements. If such valuation movements are excluded, the operating balance becomes $2.1 billion, reflecting a steady increase in the previous three years.
Net debt. Net debt has fallen from 49 percent of GDP in 1992/93 to 18.1 percent in 2000/01. Debt repayments have been financed from operating surpluses and asset sales proceeds.
Looking forward, net debt is projected to remain steady at around 18 percent of GDP. From 2001/02 onwards, it is assumed surpluses will contribute to building up financial assets to begin pre-funding future superannuation costs, rather than solely paying down debt. These assets do not form part of net debt.
The cumulative contributions towards pre-funding (excluding ongoing revenue earned on the contributions) reach around 3 percent of GDP in 2003/04. These assumptions are indicative only because the mechanisms and extent of pre-funding have not been finalised.
Net worth. Net worth increased from -$7.7 billion in 1992/93 to $9.9 billion in 1997/98. In 1998/99, net worth fell to around $6 billion. The fall reflected recognition of the net future costs of already-accepted Accident Compensation Corporation claims ($6.1 billion), partly offset by a $1.8 billion operating surplus.
Net worth increased again to $11.5 billion in 2000/01. This improvement reflected the ongoing operating surplus, and revaluations of physical assets.
With operating surpluses forecast to continue, net worth is projected to reach $24.7 billion in 2005/06.
Before March 1985, governments borrowed under a fixed exchange-rate regime to finance the balance of payments deficit. Since adoption of a freely floating exchange rate, governments have undertaken new external borrowing only to rebuild the nation's external reserves and to meet refinancing needs.
Direct public debt increased by a net amount of $ 1,004 billion, including swaps, between 1 July 2000 and 30 June 2001. This increase consisted of a net increase in internal debt of $1.061 billion and a net decrease in external debt of $57 million.
The government achieved its objective of zero net foreign-currency debt in September 1996 following the sale of the Forestry Corporation of New Zealand for $1.6 billion.
Government gross direct debt amounted to 34.1 percent of GDP in the year ended June 2001, down from 35.5 percent the previous year.
Proceeds from the domestic bond programme were used to finance maturing domestic term debt and to finance the forecast cash deficit during 2001/02 and to partially pre-fund the 2002/03 borrowing requirement.
Objectives. The Reserve Bank of New Zealand Act 1989 stipulates that the bank is to formulate and implement monetary policy with the objective of achieving and maintaining stability in the general level of prices.
The act requires a Policy Targets Agreement between the Minister of Finance and the Governor of the Reserve Bank. Initially, the agreement required the bank to maintain consumers price index (CPI) inflation in the range of 0 to 2 percent in any 12-month period. The range was increased to 0 to 3 percent in December 1996. (The CPI excludes interest and credit costs).
The Policy Targets Agreement acknowledges there is a range of unusual events that can have a significant temporary effect on inflation as measured by the CPI and mask the underlying trend in prices that is the proper focus of monetary policy.
Such events could lead to inflation outcomes outside the target range. Possible disturbances include, for example:
Shifts in the aggregate price level as a result of exceptional movements in the prices of commodities traded in world markets.
Changes in indirect taxes.
Significant government policy changes that directly affect prices.
Natural disasters affecting a major part of the economy.
The Reserve Bank of New Zealand is required to maintain stability in the general level of prices.
When pressures of this kind arise, the bank is required to react in a manner that prevents general inflation pressures emerging. The agreement requires the bank, in pursuing the price stability target, to avoid unnecessary instability in output, interest rates and the exchange rate. The act contains certain provisions that enable the government to override the price stability objective and the Policy Targets Agreement, provided it is done in accordance with a set of procedures that would make the override publicly transparent.
Implementation. The Reserve Bank of New Zealand acts with a considerable degree of autonomy. The bank controls the cost of liquidity by setting an Official Cash Rate (OCR). The bank stands ready to lend cash overnight at 25 basis points above the OCR and will take deposits at 25 basis points below the OCR. By controlling the cost of liquidity for financial institutions, the bank has leverage over interest rates faced by households and firms. There are pre-announced dates (eight each year) at which the bank may reset the OCR. Four of the dates coincide with publication of the bank's Monetary Policy Statements, which contain projected paths for future conditions and the bank's policy response. As a small, open economy, both interest rates and the exchange rate can influence New Zealand's economic activity and inflation. The bank, therefore, takes the influence of both of these into account when setting the OCR. Other important factors to consider include credit conditions, inflation expectations and external conditions.
For all of these, the emphasis when setting monetary conditions is on their medium-term effects – that is, the bank will generally set the OCR on the basis of what it perceives to be the consequences of current economic conditions approximately six to eight quarters in the future. New Zealand has now been operating a monetary policy under a formal inflation-targeting regime for more than a decade.
During this time the economy has been through a full business cycle, which saw monetary conditions tighten and loosen. Inflation remained low and stable. There is some evidence that inflation expectations are more anchored now than they were during the transition to low inflation, and this has made it easier for the bank to implement monetary policy with a medium-term, forward-looking focus.
Moderation in growth in the short term, followed by an upturn on the back of a pick-up in global growth, is expected to be the most likely economic outlook for New Zealand. There are substantial risks and uncertainties surrounding this outlook given greater uncertainty about the global economy. A deeper and more protracted global downturn will have a more pronounced impact on New Zealand, impacting on exports and continuing to dampen business and consumer confidence. On the other hand, a stronger pick-up in the global economy in 2002 could see the New Zealand economy follow a stronger growth path.
Countless transactions take place in the New Zealand economy every day. Businesses buy and sell goods and services, the government collects taxes and pays beneficiaries, and individuals are paid for their labour and buy groceries or pay the rent. Measuring all these transactions is a complex task, but essential to understanding how the economy operates.
In New Zealand, as in most other countries, myriads of transactions are classified, measured and recorded in the national accounts, which provide a convenient summary of key economic and financial flows. Moreover, they provide a framework in which to analyse and compare important economic variables such as household consumption and savings.
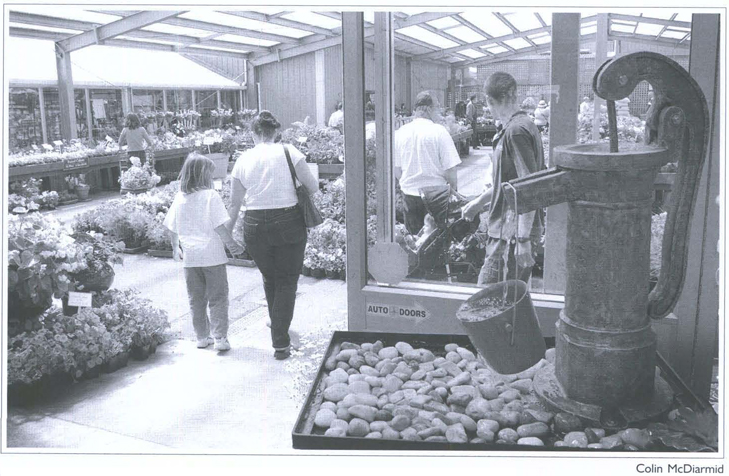
Purchases made by consumers are recorded in the national accounts.
The national accounts are organised within the framework of the New Zealand System of National Accounts (NZSNA). This framework, containing data collected from a wide range of surveys and censuses, provides the basis for socio-economic analysis.
The national accounts capture all types of transactions. They do so for the economy as a whole, or for certain groups or sectors within it, such as business, government or households. This provides information on economic activities such as:
The production of goods and services and the costs involved in producing them.
Incomes earned by various groups within the economy, and what they do with them.
The economic relationship with the rest of the world.
National accounts are produced annually and quarterly. Annual accounts for the year ended 31 March are published each year. For the latest March year, provisional estimates are prepared only for the consolidated accounts of the nation.
Revised estimates for previous years are also prepared, along with more detailed breakdowns. The information used to compile the accounts becomes available progressively over a long period, and for some areas of the economy may not be available for up to three years after the March year to which it relates.
Gross domestic product (GDP) represents the income earned from production in New Zealand, whether that is carried out by New Zealanders or foreign firms operating within New Zealand. It does not measure the final incomes which New Zealand residents earn. Gross national income (GNI), which in the past has been referred to as gross national product, is a better measure of New Zealanders’ income or claim on resources, as it excludes income remitted abroad (dividends, interest and other transfers) and includes similar income earned by New Zealanders from overseas investments. Further adjustments to take account of depreciation and transfers from the rest of world give an even better measure of income (national disposable income).
Table 17.1 shows that the New Zealand economy grew in the year ended March 2000. GDP rose by 4.6 percent between 1999 and 2000 in both current and constant prices. The recovery came after the Asian economic downturn and two successive droughts slowed economic growth in the previous year. Both exports and internal demand contributed to the recovery. Consumer and government spending were both up, as was investment in housing and in machinery and equipment. There was also a build-up in inventories.
Table 17.1. Principal aggregates: 1988–2000
| Year ended March | Gross domestic product (GDP) | Gross national income (GNI)1 | National disposable income (NDI)2 | GDP Chain-volume 1995/96 prices |
|---|---|---|---|---|
1GNI = GDP plus net primary incomes from the rest of the world. 2NDI = GNI less consumption of fixed capital plus net current transfers from the rest of the world. Source: Statistics New Zealand | ||||
| $(million) | ||||
| 1988 | 62,719 | 59,242 | 50,677 | 79,265 |
| 1989 | 67,526 | 64,429 | 55,443 | 79,159 |
| 1990 | 71,441 | 68,143 | 58,647 | 79,604 |
| 1991 | 73,113 | 70,379 | 60,181 | 79,590 |
| 1992 | 72,918 | 68,142 | 57,343 | 78,540 |
| 1993 | 75,274 | 70,571 | 59,360 | 79,406 |
| 1994 | 81,502 | 75,749 | 64,512 | 84,527 |
| 1995 | 87,321 | 81,366 | 69,654 | 89,000 |
| 1996 | 92,679 | 86,680 | 74,413 | 92,680 |
| 1997 | 96,911 | 89,647 | 77,539 | 95,515 |
| 1998 | 99,631 | 93,231 | 80,225 | 97,327 |
| 1999 | 101,169 | 96,192 | 82,421 | 97,762 |
| 2000 | 105,852 | 99,249 | 85,102 | 102,267 |
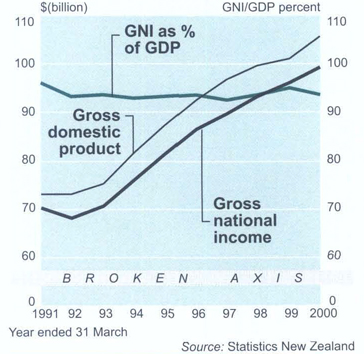 -->
-->Figures 17.1 and 17.2 show GNI as a percentage of GDP, and changes in real GDP and real GDP per head, in the years 1991–2000.
The ratio of GNI to GDP shows what proportion of income from domestic production remains available to New Zealanders after adjusting for net profits, interest and dividends remitted abroad.
Since 1986, the ratio has been historically low, with the private sector increasing borrowing as a result of financial market liberalisation and with increased foreign ownership of New Zealand business (eg banks, Telecom, Tranz Rail, etc).
By 1997, the ratio of GNI to GDP had fallen to 92 percent, the lowest recorded in a decade.
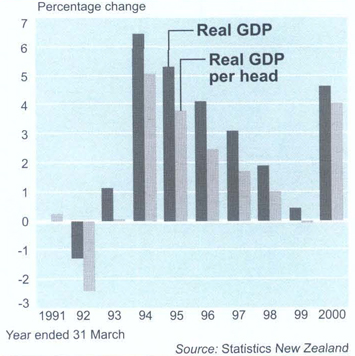 .jpg" alt=
The consolidated accounts of the nation consist of four accounts:
Gross domestic product and expenditure account (table 17.2). Gross domestic product is a measure of the value added from all economic activity in New Zealand.
The account shows the various forms of income generated by production, and the categories of the final expenditure on available goods and services.
Table 17.2. Gross domestic product and expenditure
| Item | Year ended 31 March | |||||
|---|---|---|---|---|---|---|
| 1995 | 1996 | 1997 | 1998 | 1999 | 2000 | |
| Source: Statistics New Zealand | ||||||
| $(million) | ||||||
| Compensation of employees | 37,184 | 39,450 | 41,786 | 42,815 | 43,158 | 44,539 |
| Gross operating surplus | 38,480 | 40,962 | 42,292 | 43,658 | 44,882 | 47,671 |
| Taxes on production and imports | 11,974 | 12,583 | 13,153 | 13,473 | 13,426 | 13,971 |
| Less subsidies | 317 | 315 | 320 | 316 | 297 | 329 |
| Gross domestic product | 87,321 | 92,679 | 96,911 | 99,631 | 101,169 | 105,852 |
| Final consumption expenditure- | ||||||
| private households | 50,186 | 53,525 | 56,429 | 58,466 | 60,463 | 62,681 |
| private non-profit organisations serving households | 991 | 996 | 1,058 | 1,019 | 1,051 | 1,062 |
| central government | 13,135 | 14,048 | 14,646 | 16,185 | 16,629 | 17,799 |
| local government | 2,203 | 2,330 | 2,394 | 2,416 | 2,395 | 2,431 |
| Changes in inventories | 1,166 | 1,182 | 779 | 845 | -117 | 1,294 |
| Gross fixed capital formation | 17,747 | 19,890 | 21,110 | 20,708 | 19,971 | 20,806 |
| Gross national expenditure | 85,427 | 91,971 | 96,418 | 99,640 | 100,392 | 106,075 |
| Exports of goods and services | 26,951 | 27,125 | 27,511 | 28,534 | 30,378 | 33,151 |
| Less imports of goods and services | 25,326 | 26,417 | 27,018 | 28,193 | 30,144 | 34,448 |
| Balance on external goods and services | 1,625 | 708 | 493 | 341 | 234 | -1,297 |
| Expenditure on gross domestic product | 87,052 | 92,679 | 96,911 | 99,980 | 100,625 | 104,778 |
| Statistical discrepancy | 269 | – | – | -349 | 544 | 1,075 |
National income and outlay account (table 17.3). National disposable income is the value of income available to New Zealanders, consisting mainly of the incomes generated in New Zealand.
Adjustments are made for the income paid to, and received from, the rest of the world.
The account also shows the part of disposable income spent by New Zealanders on current consumption, and the portion of income that was saved.
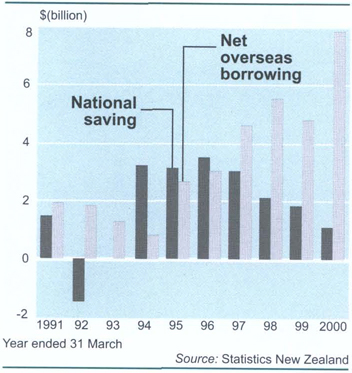
Table 17.3. National income and outlay
| Year ended 31 March | ||||||
|---|---|---|---|---|---|---|
| 1995 | 1996 | 1997 | 1998 | 1999 | 2000 | |
| Source: Statistics New Zealand | ||||||
| $(million) | ||||||
| Use of income | ||||||
| Final consumption expenditure | ||||||
| private households | 50,186 | 53,525 | 56,429 | 58,466 | 60,463 | 62,681 |
| private non-profit organisations serving households | 991 | 996 | 1,058 | 1,019 | 1,051 | 1,062 |
| central government | 13,135 | 14,048 | 14,646 | 16,185 | 16,629 | 17,799 |
| local government | 2,203 | 2,330 | 2,394 | 2,416 | 2,395 | 2,431 |
| Total final consumption expenditure | 66,514 | 70,898 | 74,528 | 78,087 | 80,537 | 83,973 |
| Saving | 3,139 | 3,515 | 3,011 | 2,139 | 1,884 | 1,128 |
| Use of national disposable income | 69,653 | 74,413 | 77,539 | 80,226 | 82,421 | 85,102 |
| Income | ||||||
| Compensation of employees | 37,184 | 39,450 | 41,786 | 42,815 | 43,158 | 44,539 |
| Compensation of employees from the rest of the world, net | – | – | – | – | – | – |
| Gross operating surplus | 38,480 | 40,962 | 42,292 | 43,658 | 44,882 | 47,671 |
| Taxes on production and imports | 11,974 | 12,583 | 13,153 | 13,473 | 13,426 | 13,971 |
| Less subsidies | 317 | 315 | 320 | 316 | 297 | 329 |
| Investment income from rest of world, net | -5,955 | -5,999 | -7,263 | -6,399 | -4,977 | -6,604 |
| Gross national income | 81,366 | 86,680 | 89,647 | 93,231 | 96,192 | 99,249 |
| Current transfers from the rest of the world, net | 220 | 140 | 757 | 477 | 358 | 509 |
| Gross national disposable income | 81,585 | 86,821 | 90,405 | 93,708 | 96,550 | 99,757 |
| Less consumption of fixed capital | 11,932 | 12,407 | 12,865 | 13,483 | 14,129 | 14,656 |
| National disposal income | 69,653 | 74,413 | 77,539 | 80,226 | 82,421 | 85,102 |
National capital account (table 17.4). Capital expenditure is recorded in this account. The difference between the accumulation of capital assets and the sources of funds (mainly savings and the income set aside for the replacement of capital equipment) gives a residual to be borrowed from (or lent to) the rest of the world.
Figure 17.3 shows national saving and net overseas borrowing from 1991 to 2000.
Table 17.4. National capital account
| Item | Year ended 31 March | |||||
|---|---|---|---|---|---|---|
| 1995 | 1996 | 1997 | 1998 | 1999 | 2000 | |
1Includes all government-owned producer enterprises. Source: Statistics New Zealand | ||||||
| $(million) | ||||||
| Change in inventories | 1,166 | 1,182 | 779 | 845 | -117 | 1,294 |
| Gross fixed capital formation | ||||||
| private | 15,414 | 17,211 | 18,154 | 17,358 | 16,876 | 17,721 |
| central government1 | 1,506 | 1,559 | 1,732 | 1,962 | 1,722 | 1,807 |
| local government1 | 827 | 1,121 | 1,225 | 1,388 | 1,374 | 1,278 |
| Purchase of non-produced non-financial | ||||||
| assets from rest of world, net | – | – | – | – | 17 | 6 |
| Net lending to rest of world | -2,648 | -3,016 | -4,568 | -5,527 | -4,789 | -7,807 |
| Capital accumulation | 16,265 | 18,057 | 17,321 | 16,026 | 15,082 | 14,300 |
| Saving | 3,139 | 3,515 | 3,011 | 2,139 | 1,884 | 1,128 |
| Consumption of fixed capital | 11,932 | 12,407 | 12,865 | 13,483 | 14,129 | 14,656 |
| Capital transfers from the rest of the world, net | 1,463 | 2,135 | 1,445 | 54 | -387 | -409 |
| Finance of capital accumulation | 16,534 | 18,058 | 17,321 | 15,676 | 15,626 | 15,375 |
| Statistical discrepancy | -269 | – | – | 349 | -544 | -1,075 |
The two key components of national income, employment income and business profits, both recorded stronger growth in 2000, with the strongest lift occurring for gross operating surplus. However, with net investment flows out of New Zealand up $1.6 billion, national disposable income rose only 3.3 percent.
Furthermore, final consumption expenditure increased, with the result that national saving recorded its fourth annual decline, being down $756 million.
As a percentage of national disposable income, saving was 1.3 percent, down from 2.3 percent in 1999 and well below the previous 10-year peak of 4.9 percent.
As a result, much of the increase in investment in 2000 (inventory build-up of $1.3 billion and fixed asset investment up $835 million) has had to be financed from abroad.
External account (table 17.5). This account brings together all transactions with the rest of the world.
The residual ‘balance on the external current account’, when adjusted for net capital transfers, records New Zealand's net lending/borrowing to the rest of the world.
With the nation recording a deficit on commodity trade (goods and services) for the first time since 1987, combined with lower investment earnings from overseas and increased outflows to foreign investors, the result was a record overall deficit on the external current account.
The need to increase net external borrowing was further exacerbated by an outflow of capital transfers.
The majority of the capital account is made up of migrant transfers.
Net migrant transfers into New Zealand peaked in 1996. Since then, migrant transfers into New Zealand have fallen markedly, while transfers out of New Zealand have increased only slightly. The result was that in 1999 and 2000, net migrant transfers were negative for the first time in a decade.
In the year ended March 2000, net borrowing from the rest of the world climbed to $7.8 billion and reached 7.4 percent of GDP.
Table 17.5. External account
| Item | Year ended 31 March | |||||
|---|---|---|---|---|---|---|
| 1995 | 1996 | 1997 | 1998 | 1999 | 2000 | |
| Source: Statistics New Zealand | ||||||
| $(million) | ||||||
| Current Income from the rest of the world | ||||||
| Exports of goods | 20,743 | 20,174 | 20,914 | 22,041 | 22,952 | 24,762 |
| Exports of services | 6,208 | 6,951 | 6,597 | 6,493 | 7,426 | 8,389 |
| Compensation of employees | – | – | – | – | – | – |
| Investment income | 1,068 | 1,960 | 1,280 | 2,095 | 3,196 | 2,899 |
| Current transfers | 884 | 790 | 1,374 | 1,177 | 1,147 | 1,287 |
| Total income from the rest of the world | 28,903 | 29,875 | 30,165 | 31,806 | 34,721 | 37,338 |
| Payments to the rest of the world | ||||||
| Imports of goods | 18,522 | 19,303 | 19,957 | 20,632 | 21,530 | 25,574 |
| Imports of services | 6,804 | 7,114 | 7,061 | 7,561 | 8,613 | 8,875 |
| Compensation of employees | – | – | – | – | – | – |
| Investment income | 7,023 | 7,959 | 8,543 | 8,494 | 8,173 | 9,502 |
| Current transfers | 664 | 649 | 617 | 700 | 789 | 779 |
| Balance on the external current account | -4,111 | -5,151 | -6,014 | -5,581 | -4,385 | -7,392 |
| Total payments to the rest of the world | 28,903 | 29,875 | 30,165 | 31,806 | 34,721 | 37,338 |
| Capital | ||||||
| Capital transfers from the rest of the world | 2,065 | 2,822 | 2,189 | 867 | 447 | 484 |
| Less capital transfers to the rest of the world | 602 | 687 | 744 | 812 | 834 | 893 |
| Capital transfers from the rest of the world, net | 1,463 | 2,135 | 1,445 | 54 | -387 | -409 |
| Balance on the external current account | -4,111 | -5,151 | -6,014 | -5,581 | -4,385 | -7,392 |
| Capital receipts | -2,648 | -3,016 | -4,568 | -5,527 | -4,772 | -7,801 |
| Purchase of non-produced non-financial assets from rest of the world, net | – | – | – | – | 17 | 6 |
| Net lending to rest of world | -2,648 | -3,016 | -4,568 | -5,527 | -4,789 | -7,807 |
| Capital disbursements | -2,648 | -3,016 | -4,568 | -5,527 | -4,772 | -7,801 |
| Memorandum: Investment income | ||||||
| Investment income from the rest of the world of which: | 1,068 | 1,960 | 1,280 | 2,095 | 3,196 | 2,899 |
| Reinvested earnings on overseas direct investment | 538 | 1,262 | 228 | 709 | 1,847 | 546 |
| Investment income to the rest of the world of which: | 7,023 | 7,959 | 8,543 | 8,494 | 8,173 | 9,502 |
| Reinvested earnings on direct investment in New Zealand | 2,113 | 1,833 | -5 | 772 | -431 | 249 |
The ‘value added’ component of industrial production is measured by taking the value of goods and services produced by an industry (output) and deducting the cost of goods and services used by the industry in the production process (intermediate consumption). GDP is then obtained by summing the value added for all industries.
GDP by industry is calculated annually in current and constant prices, and quarterly in constant prices. Industries are combined to form the following broad groupings:
Primary industries (agriculture; fishing; forestry; mining and quarrying).
Goods-producing industries (manufacturing; electricity, gas and water; construction).
Service industries (wholesale trade; retail trade, accommodation and restaurants; transport and communications; finance, insurance, real estate and business services, including owner-occupied dwellings; government administration and defence; personal and community services).
There was a noticeable improvement in the agricultural sector in the year to March 2000, following two difficult years of drought conditions that led to lower stock numbers and lower output in 1999. Primary production recorded growth of 3.8 percent for the year ended March 2000, as good spring pasture growth resulted in record milk production for the season. The lift in dairy processing contributed to increased manufacturing activity, up 4.6 percent for the March 2000 year.
Tables 17.6 and 17.7 show production-based GDP statistics, while Figure 17.4 shows annual changes in business activity by industry groupings.
Table 17.6. Gross domestic product in constant prices1
| Primary industries | Goods producing industries | Service industries | Gross domestic product | |||||
|---|---|---|---|---|---|---|---|---|
| $(million) | Percentage change | $(million) | Percentage change | $(million) | Percentage change | $(million) | Percentage change | |
| Year ended March | Actual annual values and percentage change from the previous year | |||||||
| 1988 | 6,318 | 20,669 | 48,662 | 79,265 | ||||
| 1989 | 6,230 | -1.4 | 20,220 | -2.2 | 49,327 | 1.4 | 79,159 | -0.1 |
| 1990 | 5,799 | -6.9 | 20,110 | -0.5 | 50,024 | 1.4 | 79,604 | 0.6 |
| 1991 | 6,773 | 16.8 | 19,143 | -4.8 | 50,089 | 0.1 | 79,590 | 0.0 |
| 1992 | 6,884 | 1.6 | 18,356 | -4.1 | 50,063 | -0.1 | 78,540 | -1.3 |
| 1993 | 6,227 | -9.5 | 18,667 | 1.7 | 51,369 | 2.6 | 79,406 | 1.1 |
| 1994 | 7,141 | 14.7 | 19,985 | 7.1 | 53,908 | 4.9 | 84,527 | 6.4 |
| 1995 | 7,067 | -1.0 | 21,400 | 7.1 | 56,673 | 5.1 | 89,000 | 5.3 |
| 1996 | 7,518 | 6.4 | 22,005 | 2.8 | 59,239 | 4.5 | 92,680 | 4.1 |
| 1997 | 8,389 | 11.6 | 22,424 | 1.9 | 60,822 | 2.7 | 95,515 | 3.1 |
| 1998 | 8,420 | 0.4 | 22.677 | 1.1 | 62,470 | 2.7 | 97,327 | 1.9 |
| 1999 | 8,264 | -1.8 | 21,656 | -4.5 | 64,135 | 2.7 | 97,762 | 0.4 |
| 2000 | 8,582 | 3.8 | 22,744 | 5.0 | 66,785 | 4.1 | 102,267 | 4.6 |
| Quarter ended | Seasonally adjusted quarterly values and percentage change from the previous quarter | |||||||
| 1998 Mar | 1,989 | -5.6 | 5,599 | -0.7 | 15,643 | -0.1 | 24,090 | -0.9 |
| Jun | 2,074 | 4.2 | 5,526 | -1.3 | 15,770 | 0.8 | 24,255 | 0.7 |
| Sep | 2,053 | -1.0 | 5,415 | -2.0 | 15,885 | 0.7 | 24,289 | 0.1 |
| Dec | 2,068 | 0.7 | 5,316 | -1.8 | 16,174 | 1.8 | 24,447 | 0.6 |
| 1999 Mar | 2,064 | -0.2 | 5,423 | 2.0 | 16,305 | 0.8 | 24,727 | 1.1 |
| Jun | 2,059 | -0.3 | 5,410 | -0.2 | 16,328 | 0.1 | 24,804 | 0.3 |
| Sep | 2,181 | 5.9 | 5,622 | 3.9 | 16,638 | 1.9 | 25,480 | 2.7 |
| Dec | 2,153 | -1.3 | 5,787 | 2.9 | 16,843 | 1.2 | 25,798 | 1.3 |
| 2000 Mar | 2,191 | 1.8 | 5,941 | 2.7 | 16,972 | 0.8 | 26,100 | 1.2 |
1Chain-volume series expressed in 1995/96 prices. Source: Statistics New Zealand | ||||||||
Record low interest rates in October 1998 kick-started a surge in residential building activity during the first half of the 1999 calendar year.
Rising employment levels and new apartment buildings in Auckland associated with the America's Cup yachting challenge helped construction activity grow by 12.4 percent for the March 2000 year.
Service industries also performed strongly, with significant contributions coming from wholesale and transport and communication activities.
The transport and communication industry recorded a 10.6 percent rise for the March year, reflecting increased activity in farming, dairy processing, logging and exports.
The industry also benefited from the increased number of international visitors to New Zealand, many attracted by millennium and America's Cup events.
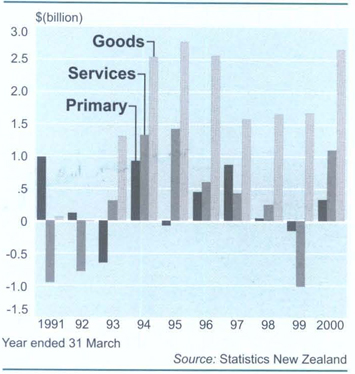
Table 17.7. Gross domestic product in constant prices by industry1
| Year ended March | Agriculture | Fishing, forestry, mining | Manufacturing | Electricity, gas and water | Construction | Wholesale trade | Retail accommodation, restaurants | Transport & communication | Finance, insurance & bus. serv, etc | Government administration & defence | Personal and community services | Gross domestic product |
|---|---|---|---|---|---|---|---|---|---|---|---|---|
1Chain-volume series expressed in 1995/96 prices. Source: Statistics New Zealand | ||||||||||||
| $(million) | ||||||||||||
| 1988 | 4,332 | 1,978 | 14,763 | 2,001 | 4,023 | 5,894 | 6,134 | 4,397 | 20,523 | 4,297 | 7,904 | 79,265 |
| 1989 | 4,061 | 2,190 | 14,469 | 1,974 | 3,887 | 6,175 | 5,972 | 4,702 | 20,582 | 4,129 | 8,102 | 79,159 |
| 1990 | 3,752 | 2,075 | 14,126 | 2,043 | 4,049 | 6,469 | 5,993 | 4,840 | 20,505 | 4,258 | 8,219 | 79,604 |
| 1991 | 4,443 | 2,338 | 13,588 | 2,146 | 3,432 | 6,383 | 5,826 | 4,934 | 20,436 | 4,298 | 8,415 | 79,590 |
| 1992 | 4,457 | 2,433 | 13,319 | 2,117 | 2,899 | 5,920 | 5,708 | 5,199 | 20,607 | 4,148 | 8,646 | 78,540 |
| 1993 | 3,773 | 2,486 | 13,763 | 2,046 | 2,830 | 6,266 | 5,840 | 5,512 | 20,833 | 4,142 | 8,903 | 79,406 |
| 1994 | 4,584 | 2,561 | 14,671 | 2,171 | 3,124 | 6,639 | 6,176 | 6,024 | 21,557 | 4,210 | 9,384 | 84,527 |
| 1995 | 4,550 | 2,521 | 15,643 | 2,248 | 3,509 | 7,125 | 6,668 | 6,699 | 22,101 | 4,180 | 9,926 | 89,000 |
| 1996 | 4,947 | 2,572 | 15,941 | 2,367 | 3,698 | 7,316 | 6,864 | 7,526 | 22,939 | 4,274 | 10,319 | 92,680 |
| 1997 | 5,547 | 2,842 | 16,231 | 2,164 | 4,030 | 7,247 | 6,953 | 7,901 | 23,666 | 4,264 | 10,792 | 95,515 |
| 1998 | 5,526 | 2,893 | 16,512 | 2,119 | 4,059 | 7,388 | 7,044 | 8,251 | 24,434 | 4,223 | 11,132 | 97,327 |
| 1999 | 5,479 | 2,786 | 15,793 | 2,152 | 3,702 | 7,519 | 7,084 | 8,767 | 25,116 | 4,192 | 11,476 | 97,762 |
| 2000 | 5,767 | 2,819 | 16,520 | 2,084 | 4,160 | 8,309 | 7,462 | 9,695 | 25,246 | 4,170 | 12,029 | 102,267 |
Another way of measuring GDP is to sum all final domestic expenditures on goods and services, add the value of exports and subtract the value of imports. There are three broad categories of final domestic expenditures:
Final consumption expenditure of households, private non-profit institutions serving households, and general government.
Gross fixed capital formation by producers.
Change in inventories, which consist of increases/decreases in producers’ stockholdings of raw materials, work in progress and finished goods.
Conceptually, both the production and expenditure-based GDP series are the same. However as each series uses independent data and estimation techniques, some differences between the alternative measures do arise. Expenditure on GDP is calculated annually and quarterly in current and constant prices.
Expenditure on GDP is summarised in table 17.8.
Table 17.8. Expenditure on gross domestic product
| Year ended March | Private final consumption expenditure | General government final consumption expenditure | Change in inventories | Gross fixed capital formation | Gross national expenditure | Exports of goods & services | Less imports of goods & services | Expenditure on gross domestic product |
|---|---|---|---|---|---|---|---|---|
| Source: Statistics New Zealand | ||||||||
| $(million) | ||||||||
| Current prices | ||||||||
| 1988 | 36,569 | 11,633 | -413 | 13,904 | 61,693 | 16,451 | 15,488 | 62,655 |
| 1989 | 39,606 | 12,543 | -114 | 13,647 | 65,682 | 17,811 | 15,476 | 68,017 |
| 1990 | 42,438 | 13,252 | 1,289 | 14,857 | 71,835 | 18,943 | 18,913 | 71,865 |
| 1991 | 44,640 | 14,058 | -154 | 14,421 | 72,965 | 19,755 | 19,569 | 73,152 |
| 1992 | 44,494 | 14,319 | -88 | 11,972 | 70,696 | 21,488 | 19,248 | 72,936 |
| 1993 | 45,351 | 14,865 | 624 | 12,571 | 73,411 | 23,700 | 21,865 | 75,246 |
| 1994 | 47,434 | 15,109 | 1,432 | 15,035 | 79,011 | 25,085 | 22,708 | 81,387 |
| 1995 | 51,177 | 15,337 | 1,166 | 17,747 | 85,427 | 26.951 | 25,326 | 87,052 |
| 1996 | 54,521 | 16,378 | 1,182 | 19,890 | 91,971 | 27,125 | 26,417 | 92,679 |
| 1997 | 57,487 | 17,041 | 779 | 21,110 | 96,418 | 27,511 | 27,018 | 96,911 |
| 1998 | 59,485 | 18,601 | 845 | 20,708 | 99,640 | 28,534 | 28,193 | 99,980 |
| 1999 | 61,514 | 19,024 | -117 | 19,971 | 100,392 | 30,378 | 30,144 | 100,625 |
| 2000 | 63,743 | 20,230 | 1,294 | 20,806 | 106,075 | 33,151 | 34,448 | 104,778 |
| Chain-volume series expressed in 1995/96 prices | ||||||||
| 1988 | 46,894 | 14,355 | -397 | 15,612 | 76,227 | 18,750 | 16,617 | 78,528 |
| 1989 | 47,897 | 14,367 | -180 | 15,312 | 77,146 | 19,198 | 16,627 | 79,942 |
| 1990 | 48,192 | 14,958 | 1,379 | 16,187 | 80,683 | 18,787 | 19,275 | 80,128 |
| 1991 | 48,297 | 15,126 | 317 | 15,615 | 79,285 | 20,152 | 19,412 | 80,127 |
| 1992 | 47,558 | 15,064 | -153 | 12,851 | 75,486 | 22,147 | 18,711 | 79,204 |
| 1993 | 47,771 | 15,202 | 765 | 13,147 | 77,009 | 22,873 | 20,065 | 80,001 |
| 1994 | 49,570 | 15,466 | 1,350 | 15,505 | 81,990 | 24,452 | 21,602 | 85,011 |
| 1995 | 52,647 | 15,608 | 1,292 | 17,948 | 87,529 | 26,525 | 24,723 | 89,380 |
| 1996 | 54,521 | 16,378 | 1,182 | 19,890 | 91,971 | 27,125 | 26,417 | 92,679 |
| 1997 | 56,590 | 16,657 | 802 | 21,242 | 95,291 | 28,385 | 28,151 | 95,524 |
| 1998 | 57,771 | 18,051 | 766 | 21,049 | 97,641 | 29,378 | 28,937 | 98,045 |
| 1999 | 58,824 | 18,046 | 202 | 20,232 | 97,297 | 30,123 | 29,581 | 97,834 |
| 2000 | 60,784 | 18,934 | 1,429 | 21,467 | 102,623 | 32,175 | 32,890 | 101,946 |
Growth in the economy for the year ended March 2000 was driven by both exports and internal demand. Consumer and government spending were both up, as was investment in housing and machinery and equipment. There was also a build up in inventories. Following rundowns in 1999, manufacturers’ inventory levels remained stable, while distributors recorded a sizeable increase, partly attributable to precautionary inventory build-ups associated with Y2K. preparedness and the lift in economic activity.
The rise in government spending was influenced by the purchase of the second Anzac frigate in the December 1999 quarter, and this also contributed to imports being up 14.3 percent. However when the purchase of the frigate is excluded, imports still increased 12.2 percent, confirming that much of internal demand was met from imports.
Households consist of New Zealand resident individuals and families. Table 17.9 shows all sources of household income and how this income is transformed into household saving. Income is earned from businesses as wages and salaries and entrepreneurial income, or from investments as interest and dividends. Incomes are gross and therefore outlays include direct income taxes paid to the government, from which households receive various forms of social assistance, mainly as government benefits. Households buy goods and services from businesses and incur interest charges to service borrowing. Consumer spending on goods and services (such as motor vehicles, food, recreation, health and education) is by far the largest part of household outlays. Indirect taxes (such as GST) are included in the value of consumer spending on goods and services. Saving is calculated as the difference between income and expenditure.
Table 17.9. Household income and saving
| Year ended 31 March | 1995 | 1996 | 1997 | 1998 | 1999 | 2000 |
|---|---|---|---|---|---|---|
| Source: Statistics New Zealand | ||||||
| $(million) | ||||||
| Gross national income | 81,366 | 86,680 | 89,647 | 93,231 | 96,192 | 99,249 |
| Gross national income earned by households | ||||||
| – from employment | 37,184 | 39,450 | 41,786 | 42,815 | 43,158 | 44,539 |
| – from business ownership | 9,470 | 10,582 | 10,990 | 11,001 | 11,736 | 12,794 |
| – from imputed home ownership | 5,580 | 6,243 | 6,646 | 6,939 | 7,221 | 7,333 |
| - from net investment | 2,024 | 2,135 | 2,384 | 1,634 | 1,597 | 1,296 |
| Total | 54,258 | 58,410 | 61,806 | 62,389 | 63,712 | 65,962 |
| less depreciation on own homes | 1,483 | 1,604 | 1,686 | 1,746 | 1,804 | 1,852 |
| Net national income earned by households | 52,775 | 56,806 | 60,120 | 60,643 | 61,908 | 64,110 |
| less taxes, fines, fees and ACC levies | 15,870 | 16,977 | 17,527 | 17,809 | 17,115 | 17,135 |
| plus social benefits in cash | 11,373 | 11,687 | 12,153 | 12,699 | 12,849 | 12,803 |
| plus pension fund flows and other current transfers (net) | 93 | 215 | 291 | 217 | 233 | 167 |
| Household disposable income | 48,371 | 51,731 | 55,037 | 55,750 | 57,875 | 59,945 |
| less consumer spending on goods and services (excl. GST) | 45,877 | 48,947 | 51,914 | 53,813 | 55,673 | 57,672 |
| less goods and services tax (GST) | 4,309 | 4,578 | 4,515 | 4,653 | 4,790 | 5,009 |
| Saving | -1,813 | -1,795 | -1,394 | -2,714 | -2,588 | -2,735 |
Household consumption expenditure increased by 3.7 percent for the year ending March 2000, following a similar increase the previous year. The year to March 2000 generally saw positive economic conditions, including increased employment levels following recovery from the Asian economic crisis and drought. Increased consumer spending more than counteracted the rise in households’ employment income and the resultant increase in household disposable income. The outcome was that households continued to spend beyond their current income. Table 17.10 shows household spending by the use made of the goods and services purchased. Accordingly, a mixture of goods and services may be combined in a single category, for example, the hotel and restaurants item includes expenditure on food, alcohol and accommodation.
Table 17.1. Household consumption expenditure by purpose
| Year ended March | Food & beverages | Clothing & footwear | Housing | household goods & services | Health & medical | Transport | Recreation & education | Hotels & restaurants | Other goods & services | Net tourist expenditure | Total household consumption |
|---|---|---|---|---|---|---|---|---|---|---|---|
| Source: Statistics New Zealand | |||||||||||
| $(million) | |||||||||||
| Current Prices | |||||||||||
| 1990 | 7,143 | 2,233 | 8,443 | 4,608 | 1,268 | 6,949 | 3,664 | 3,056 | 4,758 | -405 | 41,718 |
| 1991 | 7,849 | 2,252 | 9,136 | 4,631 | 1,397 | 6,873 | 3,891 | 3,064 | 5,086 | -357 | 43,823 |
| 1992 | 7,863 | 2,202 | 9,396 | 4,712 | 1,545 | 6,445 | 3,915 | 2,990 | 5,079 | -541 | 43,606 |
| 1993 | 8,127 | 2,242 | 9,439 | 4,973 | 1,640 | 6,338 | 4,149 | 3,074 | 5,144 | -661 | 44,464 |
| 1994 | 8,299 | 2,366 | 9,715 | 5,521 | 1,610 | 6,675 | 4,691 | 3,340 | 5,170 | -896 | 46,491 |
| 1995 | 8,814 | 2,511 | 10,313 | 5,932 | 1,646 | 7,712 | 5,344 | 3,810 | 5,339 | -1,235 | 50,186 |
| 1996 | 9,306 | 2,523 | 11,243 | 6,143 | 1,657 | 8,699 | 5,842 | 4,077 | 5,941 | -1,905 | 53,525 |
| 1997 | 9,602 | 2,628 | 11,977 | 6,193 | 1,682 | 9,340 | 6,338 | 4,301 | 6,218 | -1,850 | 56,429 |
| 1998 | 9,953 | 2,680 | 12,560 | 6,470 | 1,717 | 8,754 | 6,685 | 4,463 | 6,581 | -1,398 | 58,466 |
| 1999 | 10,393 | 2,764 | 12,958 | 6,658 | 1,830 | 8,964 | 7,041 | 4,590 | 6,749 | -1,484 | 60,463 |
| 2000 | 10,822 | 2,993 | 13,126 | 6,971 | 1,939 | 9,533 | 7,342 | 4,946 | 7,044 | -2,036 | 62,681 |
| Chain-volume series expressed in 1995/96 prices | |||||||||||
| 1990 | 7,617 | 2,376 | 10,395 | 5,079 | 1,195 | 8,105 | 4,318 | 3,488 | 5,590 | -483 | 47,522 |
| 1991 | 7,922 | 2,313 | 10,558 | 4,956 | 1,370 | 7,611 | 4,351 | 3,336 | 5,664 | -407 | 47,560 |
| 1992 | 8,045 | 2,208 | 10,704 | 4,978 | 1,572 | 7,034 | 4,354 | 3,172 | 5,405 | -657 | 46,738 |
| 1993 | 8,237 | 2,226 | 10,825 | 5,149 | 1,660 | 6,793 | 4,454 | 3,224 | 5,330 | -890 | 46,936 |
| 1994 | 8,414 | 2,326 | 10,947 | 5,605 | 1,769 | 7,022 | 4,894 | 3,455 | 5,384 | -1,100 | 48,653 |
| 1995 | 8,922 | 2,486 | 11,083 | 5,941 | 1,723 | 7,934 | 5,553 | 3,908 | 5,502 | -1,376 | 51,660 |
| 1996 | 9,306 | 2,523 | 11,243 | 6,143 | 1,657 | 8,699 | 5,842 | 4,077 | 5,941 | -1,905 | 53,525 |
| 1997 | 9,428 | 2,639 | 11,395 | 6,244 | 1,632 | 9,389 | 6,292 | 4,208 | 6,080 | -1,783 | 55,524 |
| 1998 | 9,595 | 2,696 | 11,548 | 6,535 | 1,630 | 8,962 | 6,527 | 4,272 | 6,318 | -1,346 | 56,738 |
| 1999 | 9,714 | 2,758 | 11,701 | 6,746 | 1,705 | 9,405 | 6,698 | 4,307 | 6,338 | -1,602 | 57,760 |
| 2000 | 10,164 | 2,934 | 11,879 | 7,131 | 1,766 | 9,897 | 6,928 | 4,559 | 6,564 | -2,081 | 59,721 |
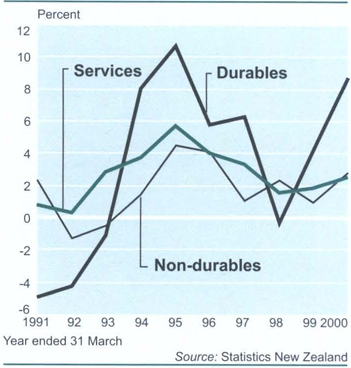
As Figure 17.5 shows, the increase in spending by households was most noticeable in purchases of durable goods in the year ended March 2000.
Main contributors to the increase were ‘big ticket’ items such as furniture, appliances and motor vehicles.
Spending by households on non-durable goods showed a moderate increase, with the biggest contribution coming from spending on food.
Household spending on services also rose, with spending on restaurants and hotels increasing significantly.
Growth in the volume of household consumption peaked in the second half of the 1999 calendar year, assisted by low interest rates, high levels of lending to consumers, and, reportedly, Y2K precautionary spending and millennium celebrations.
Table 17.11 records the outlays of producers on durable real assets, such as buildings, motor vehicles, plant and machinery, hydroelectric construction, roading and improvements to land.
In measuring the outlays, sales of similar goods are deducted.
Land is excluded from gross fixed capital formation. Included is the value of construction work done by a firm's own employees.
The term ‘gross’ indicates that consumption of fixed capital has not been deducted from the value of the outlays.
Table 17.11. Gross fixed capital formation: all sectors by asset type
| Year ended March | Residential buildings | Non-residential buildings | Other construction | Land improvements | Transport equipment | Plant machinery and equipment | Intangible assets | Total |
|---|---|---|---|---|---|---|---|---|
| $(million) | ||||||||
| Current prices | ||||||||
| 1988 | 2,753 | 3,081 | 1,350 | 132 | 1,619 | 4,469 | 500 | 13,904 |
| 1989 | 2,812 | 2,950 | 1,470 | 174 | 1,158 | 4,474 | 608 | 13,647 |
| 1990 | 3,369 | 2,839 | 1,408 | 197 | 1,812 | 4,774 | 457 | 14,857 |
| 1991 | 3,457 | 2,413 | 1,471 | 180 | 1,656 | 4,711 | 534 | 14,421 |
| 1992 | 2,992 | 1,595 | 1,639 | 198 | 1,515 | 3,715 | 318 | 11,972 |
| 1993 | 3,152 | 1,543 | 1,188 | 205 | 1,824 | 4,267 | 392 | 12,571 |
| 1994 | 3,883 | 1,888 | 1,159 | 240 | 2,199 | 5,299 | 367 | 15,035 |
| 1995 | 4,815 | 2,502 | 1,226 | 221 | 2,473 | 6,106 | 403 | 17,747 |
| 1996 | 5,200 | 3,042 | 1,747 | 281 | 2,726 | 6,455 | 440 | 19,890 |
| 1997 | 5,764 | 3,225 | 1,991 | 355 | 2,918 | 6,411 | 447 | 21,110 |
| 1998 | 5,963 | 3,118 | 2,200 | 325 | 2,215 | 6,365 | 522 | 20,708 |
| 1999 | 5,090 | 3,261 | 2,238 | 306 | 2,206 | 6,123 | 746 | 19,971 |
| 2000 | 6,209 | 3,202 | 2,059 | 284 | 2,031 | 6,224 | 798 | 20,806 |
| Chain-volume series expressed in 1995/96 prices | ||||||||
| 1988 | 3,806 | 3,653 | 1,709 | 168 | 1,863 | 4,093 | 339 | 15,612 |
| 1989 | 3,970 | 3,303 | 1,737 | 200 | 1,455 | 4,175 | 425 | 15,312 |
| 1990 | 4,482 | 3,110 | 1,587 | 230 | 2,231 | 4,368 | 331 | 16,187 |
| 1991 | 4,457 | 2,611 | 1,597 | 206 | 2,024 | 4,332 | 453 | 15,615 |
| 1992 | 3,784 | 1,702 | 1.763 | 226 | 1,734 | 3,453 | 310 | 12,851 |
| 1993 | 3,902 | 1,682 | 1,259 | 219 | 1,912 | 3,894 | 355 | 13,147 |
| 1994 | 4,583 | 2,008 | 1,213 | 253 | 2,189 | 4,953 | 348 | 15,505 |
| 1995 | 5,158 | 2,577 | 1,245 | 222 | 2,449 | 5,898 | 418 | 17,948 |
| 1996 | 5,200 | 3,042 | 1,747 | 281 | 2,726 | 6,455 | 440 | 19,890 |
| 1997 | 5,518 | 3,188 | 1,969 | 351 | 2,962 | 6,733 | 520 | 21,242 |
| 1998 | 5,632 | 3,072 | 2,184 | 310 | 2,267 | 7,024 | 565 | 21,049 |
| 1999 | 4,785 | 3,229 | 2,179 | 293 | 2,279 | 6,843 | 679 | 20,232 |
| 2000 | 5,829 | 3,157 | 1,984 | 271 | 2,198 | 7,303 | 761 | 21,467 |
| Source: Statistics New Zealand | ||||||||
Capital investment picked up during the March 2000 year after two years of declines. However, the lift principally resulted from increased spending on housing.
Business investment expenditure, on the other hand, recorded almost no change, although when changes in prices are removed, the volume of investment increased, with investment in machinery and equipment up by 6.7 percent.
The development of capital stock measures for the New Zealand economy has arisen out of two fundamental needs underlying different aspects of economic analysis:
The need to measure national wealth through the development of balance sheets. Needed are statistics of net capital stock which measure the current value of all fixed assets still in use.
The need to understand and explain economic growth which requires measures of productivity. Needed are statistics of ‘productive’ capital stock from which the real value of capital services used in production can be derived.
While the two concepts of capital stock are different, they are linked and are derived from the same underlying capital formation data.
The new capital stock series (table 17.12) has been developed using a perpetual inventory model. Briefly, this involves progressively building up capital stock estimates using the following equation:
opening stock + acquisitions – disposals – consumption of fixed capital = closing stock
The series developed are for fixed assets only, covering buildings, infrastructure, transport equipment, machinery and other equipment and intangible assets, owned by producers. Each asset type is further analysed by industry.
Table 17.12. Capital stock
| Year ended March | Net capital stock1$(million) | Productive capital stock2$(million) |
|---|---|---|
1Current prices (replacement cost). 2Chain-volume series expressed in 1995/96 prices. Source: Statistics New Zealand | ||
| 1996 | 264,551 | 319,267 |
| 1997 | 274,754 | 328,222 |
| 1998 | 280,426 | 335,596 |
| 1999 | 287,443 | 342,896 |
| 2000 | 294,838 | 351,055 |
An important additional output from the model – needed to estimate the wealth measure of capital stocks – is consumption of fixed capital at replacement cost, included in the national accounts.
Exports. Table 17.13 and Figure 17.6 show that export volumes grew strongly, rising 6.8 percent, in the year to March 2000, with a noticeable lift occurring for forest products. Another major contribution came from services, buoyed by increased numbers of overseas visitors. New Zealand hosted the APEC conference and the America's Cup yachting defence during the year, while Asian visitor numbers also picked up following their decline at the time of the Asian economic crisis.
Table 17.13. Exports of goods and services
| Year ended March | Dairy products | Meat & meat products | Seafood | Other food & beverages | Wood & wood products | Crude materials | Machinery & transport equipment | Other manufactured goods | Total exports of goods | Exports of Services | Total |
|---|---|---|---|---|---|---|---|---|---|---|---|
| Source: Statistics New Zealand | |||||||||||
| $(million) | |||||||||||
| Current prices | |||||||||||
| 1989 | 2,165 | 2,150 | 732 | 1,371 | 1,134 | 3,949 | 874 | 1,620 | 13,994 | 3,818 | 17,811 |
| 1990 | 2,279 | 2,441 | 767 | 1,504 | 1,345 | 3,847 | 962 | 1,887 | 15,031 | 3,912 | 18,943 |
| 1991 | 2,787 | 2,541 | 756 | 1,613 | 1,523 | 3,356 | 1,068 | 2,042 | 15,686 | 4,069 | 19,755 |
| 1992 | 2,708 | 2,795 | 1,050 | 1,744 | 1,726 | 3,505 | 1,215 | 2,284 | 17,029 | 4,458 | 21,488 |
| 1993 | 3,202 | 3,103 | 1,163 | 2,010 | 2,048 | 3,416 | 1,269 | 2,581 | 18,793 | 4,907 | 23,700 |
| 1994 | 3,309 | 3,012 | 1,172 | 1,912 | 2,532 | 3,505 | 1,418 | 2,808 | 19,670 | 5,415 | 25,085 |
| 1995 | 3,257 | 2,724 | 1,179 | 2,066 | 2,528 | 4,005 | 1,577 | 3,407 | 20,743 | 6,208 | 26,951 |
| 1996 | 3,207 | 2,680 | 1,226 | 2,027 | 2,623 | 3,812 | 1,628 | 2,971 | 20,174 | 6,951 | 27,125 |
| 1997 | 3,956 | 2,728 | 1,129 | 2,094 | 2,344 | 3,819 | 1,800 | 3,044 | 20,914 | 6,597 | 27,511 |
| 1998 | 4,290 | 2,947 | 1,115 | 2,121 | 2,373 | 3,844 | 2,080 | 3,271 | 22,041 | 6,493 | 28,534 |
| 1999 | 4,860 | 2,867 | 1,232 | 2,373 | 2,339 | 3,696 | 2,262 | 3,322 | 22,952 | 7,426 | 30,378 |
| 2000 | 4,647 | 3,245 | 1,285 | 2,537 | 2,870 | 3,618 | 2,738 | 3,821 | 24,762 | 8,389 | 33,151 |
| Chain-volume series expressed in 1995/96 prices | |||||||||||
| 1989 | 1721 | 2,313 | 939 | 1,383 | 1,467 | 3,653 | 807 | 1,566 | 14,734 | 4,475 | 19,198 |
| 1990 | 2,248 | 2,215 | 938 | 1,433 | 1,648 | 3,458 | 833 | 1,729 | 14,430 | 4,367 | 18,787 |
| 1991 | 3,091 | 2,158 | 956 | 1,698 | 1,896 | 3,357 | 911 | 1,866 | 15,787 | 4,325 | 20,152 |
| 1992 | 3,089 | 2,410 | 1,106 | 1,644 | 2,177 | 3,937 | 1,036 | 2,211 | 17,491 | 4,605 | 22,147 |
| 1993 | 3,032 | 2,480 | 1,030 | 1,777 | 2,414 | 3,610 | 1,072 | 2,416 | 17,749 | 5,072 | 22,873 |
| 1994 | 3,286 | 2,427 | 1,163 | 1,732 | 2,432 | 3,847 | 1,284 | 2,727 | 18,804 | 5,609 | 24,452 |
| 1995 | 3,700 | 2,472 | 1,119 | 1,803 | 2,597 | 4,001 | 1,521 | 3,047 | 20,158 | 6,345 | 26,525 |
| 1996 | 3,207 | 2,680 | 1,226 | 2,027 | 2,623 | 3,812 | 1.628 | 2,971 | 20,174 | 6,951 | 27,125 |
| 1997 | 4,302 | 2,603 | 1,204 | 2,051 | 2,743 | 4,037 | 1,752 | 3,157 | 21,846 | 6,538 | 28,385 |
| 1998 | 4,689 | 2,802 | 1,207 | 2,094 | 2,831 | 3,972 | 2,120 | 3,386 | 23,126 | 6,278 | 29,378 |
| 1999 | 4,822 | 2,569 | 1,206 | 2,040 | 2,821 | 3,974 | 2,234 | 3,517 | 23,189 | 6,934 | 30,123 |
| 2000 | 4,920 | 2,618 | 1,087 | 2,234 | 3,148 | 3,814 | 2,565 | 3,915 | 24,318 | 7,834 | 32,175 |
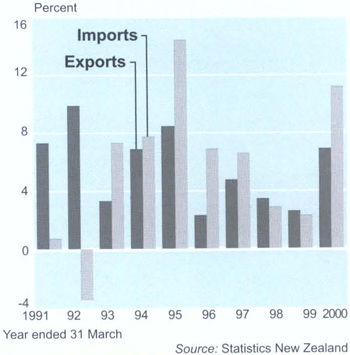
Imports. Table 17.14 shows that import volumes for the year ended March 2000 increased 11.2 percent. Merchandise imports were up across most commodity groups, the only exception being fuel. Imports of machinery and equipment, including computers, were also up, reflecting increased business investment on these assets. Import of the frigate Te Mana added to the increase.
Table 17.14. Imports of goods and services
| Year ended March | Food & beverages | Mineral fuels | Crude materials | Textiles & clothing | Chemicals | Metals | Transport equipment | Machinery & electrical equipment | Non-food manufactures | Total imports of goods | Imports of services | Total |
|---|---|---|---|---|---|---|---|---|---|---|---|---|
| Source: Statistics New Zealand | ||||||||||||
| $(million) | ||||||||||||
| Current prices | ||||||||||||
| 1989 | 780 | 648 | 729 | 787 | 1,584 | 568 | 1,401 | 3,021 | 2,065 | 10,589 | 4,888 | 15,476 |
| 1990 | 973 | 955 | 818 | 1,024 | 2,012 | 744 | 2,279 | 3,591 | 2,475 | 13,543 | 5,370 | 18,913 |
| 1991 | 964 | 1,293 | 833 | 1,015 | 1,977 | 622 | 1,947 | 4,116 | 2,471 | 13,920 | 5,648 | 19,569 |
| 1992 | 983 | 1,106 | 824 | 1,088 | 2,074 | 577 | 1,685 | 3,570 | 2,575 | 13,243 | 6,005 | 19,248 |
| 1993 | 1,123 | 1,129 | 933 | 1,249 | 2,514 | 667 | 2,019 | 4,032 | 2,866 | 15,192 | 6,673 | 21,865 |
| 1994 | 1,233 | 1,078 | 968 | 1,254 | 2,689 | 714 | 2,387 | 4,548 | 2,936 | 16,382 | 6,326 | 22,708 |
| 1995 | 1,350 | 1,105 | 994 | 1,415 | 2,897 | 808 | 2,895 | 5,318 | 3,250 | 18,522 | 6,804 | 25,326 |
| 1996 | 1,399 | 1,225 | 1,052 | 1,345 | 3,002 | 805 | 2,876 | 5,695 | 3,445 | 19,303 | 7,114 | 26,417 |
| 1997 | 1,419 | 1,442 | 1,008 | 1,362 | 2,919 | 765 | 3,317 | 5,596 | 3,669 | 19,957 | 7,061 | 27,018 |
| 1998 | 1,573 | 1,377 | 1,059 | 1,545 | 3,052 | 764 | 3,091 | 5,791 | 3,935 | 20,632 | 7,561 | 28,193 |
| 1999 | 1,748 | 1,368 | 1,153 | 1,579 | 3,445 | 748 | 3,176 | 5,864 | 4,119 | 21,530 | 8,613 | 30,144 |
| 2000 | 1,908 | 2,091 | 1,206 | 1,780 | 3,721 | 919 | 4,512 | 6,490 | 4,644 | 25,574 | 8,875 | 34,448 |
| Chain-volume series expressed in 1995/96 prices | ||||||||||||
| 1989 | 820 | 774 | 731 | 887 | 1,312 | 609 | 2,063 | 2,719 | 2,262 | 10,988 | 5,715 | 16,627 |
| 1990 | 959 | 866 | 813 | 1,097 | 1,728 | 680 | 3,204 | 3,170 | 2,606 | 13,452 | 5,821 | 19,275 |
| 1991 | 944 | 938 | 790 | 1,071 | 1,742 | 595 | 2,647 | 3,720 | 2,626 | 13,686 | 5,711 | 19,412 |
| 1992 | 950 | 927 | 787 | 1,091 | 1,869 | 560 | 2,062 | 3,231 | 2,664 | 12,917 | 5,788 | 18,711 |
| 1993 | 1,047 | 895 | 880 | 1,195 | 2,277 | 642 | 2,141 | 3,409 | 2,766 | 13,970 | 6,090 | 20,065 |
| 1994 | 1,198 | 995 | 993 | 1,237 | 2,620 | 777 | 2,380 | 3,985 | 2,870 | 15,633 | 5,968 | 21,602 |
| 1995 | 1,315 | 1,104 | 994 | 1,394 | 2,917 | 866 | 2,877 | 4,965 | 3,231 | 18,163 | 6,561 | 24,723 |
| 1996 | 1,399 | 1,225 | 1,052 | 1,345 | 3,002 | 805 | 2,876 | 5,695 | 3,445 | 19,303 | 7,114 | 26,417 |
| 1997 | 1,392 | 1,338 | 1,038 | 1,402 | 3,166 | 835 | 3,433 | 6,028 | 3,858 | 20,882 | 7,269 | 28,151 |
| 1998 | 1,495 | 1,314 | 1,063 | 1,515 | 3,278 | 808 | 2,990 | 6,525 | 4,109 | 21,445 | 7,489 | 28,937 |
| 1999 | 1,549 | 1,527 | 1,095 | 1,417 | 3,425 | 761 | 3,265 | 6,391 | 4,099 | 21,907 | 7,673 | 29,581 |
| 2000 | 1,713 | 1,516 | 1,153 | 1,627 | 3,639 | 918 | 4,304 | 7,341 | 4,549 | 25,073 | 7,826 | 32,890 |
New Zealand's international accounts comprise balance of payments (BOP) and international investment position (IIP) statistics.
The BOP statistics are statements of New Zealand's transactions in goods, services, income and transfers with the rest of the world, and net flows of foreign investment in New Zealand, and New Zealand investment abroad.
International investment position statistics show the value of foreign investment in New Zealand, and the value of New Zealand investment abroad, at specific points in time.
The IIP statement includes statistics measuring New Zealand's gross and net overseas debt, for both the government and private sectors.
New Zealand's BOP and IIP statistics are produced in accordance with internationally accepted guidelines set out by the International Monetary Fund.
Statistics New Zealand publishes BOP and IIP statements for each quarter within 13 weeks of the end of the reference quarter. For example, the statistics for the March quarter are published in the last week of June.
Annual BOP and IIP statements are published with additional information using a March reference period. The annual statements are published within six months of the end of the March year. The level of detail in the published quarterly series is intended to be sufficient to provide a useful basis for analysis and assessment of the country's external financial situation.
The main focus of the quarterly accounts is the current account balance, which, broadly speaking, is the difference between New Zealand receipts from abroad less its expenses abroad. Compared with the quarterly series, the annual series has further breakdowns of some components and presents country and industry breakdowns of investment statistics.
The balance of payments statistics are presented in a set of accounts consisting of the current account, the capital account and the financial account. To aid analysis, each of the BOP accounts is further subdivided into major components and balances. A component ‘balance’ is the inflows (credits) less the outflows (debits) for a particular component.
The balance on current account is made up of the sum of the balances on goods and services, and income and transfers. In New Zealand's balance of payments, the balance on capital account is of relatively low significance. The balance on financial account represents the difference between the net change in foreign investment in New Zealand and the net change in New Zealand investment abroad. Table 17.15 presents these accounts for the five years to 2001.
Table 17.15. Balance of payments – major components1,2
| Year ended March | |||||
|---|---|---|---|---|---|
| 1997 | 1998 | 1999 | 2000 | 2001 | |
1These tables are presented in general accordance with principles laid down by the International Monetary Fund, in the fifth edition of the balance of payments manual. 2Data may not add to stated totals due to rounding. 3Due to methodology and data collection changes, the financial account statistics for 2001 are not directly comparable with the statistics for earlier periods. Source: Statistics New Zealand | |||||
| NZ$(million) | |||||
| New Zealand's current account summary | |||||
| Balance on goods | 956 | 1,409 | 1,422 | -812 | 2,119 |
| Exports (fob) | 20,914 | 22,040 | 22,952 | 24,763 | 31,121 |
| Imports (fob) | 19,957 | 20,633 | 21,531 | 25,572 | 29,000 |
| Balance on services | -462 | -1,068 | -1,187 | -485 | -263 |
| Exports of services | 6,597 | 6,493 | 7,426 | 8,390 | 9,946 |
| Imports of services | 7,062 | 7,561 | 8,613 | 8,875 | 10,209 |
| Balance on income | -7,264 | -6,399 | -4,976 | -6,604 | -7,736 |
| Income from investment abroad | 265 | 1,217 | 1,650 | 1,466 | 1,093 |
| Income from foreign investment in New Zealand | 7,528 | 7,616 | 6,626 | 8,069 | 8,827 |
| Balance on current transfers | 756 | 477 | 359 | 509 | 466 |
| Inflow of current transfers | 1,375 | 1,177 | 1,147 | 1,288 | 1,385 |
| Outflow of current transfers | 618 | 700 | 789 | 779 | 919 |
| Current account balance | -6,014 | -5,581 | -4,385 | -7,391 | -5,414 |
| New Zealand's capital account summary | |||||
| Balance on capital account | 1,446 | 54 | -403 | -415 | -184 |
| Inflow of capital account | 2,188 | 867 | 451 | 484 | 779 |
| Outflow of capital account | 743 | 813 | 855 | 900 | 962 |
| New Zealand's financial account summary3 | |||||
| New Zealand investment abroad | 356 | 683 | 2,934 | 5,811 | 12,156 |
| Direct investment | -2,368 | 750 | 2,029 | 1,342 | 1,745 |
| Portfolio investment | 636 | 3,073 | 59 | 1,665 | 4,587 |
| Other investment | 1,474 | -2,554 | 1,720 | 2,976 | 5,816 |
| Reserve assets | 614 | -586 | -874 | -172 | 5 |
| Foreign investment in New Zealand | 4,376 | 6,975 | 5,798 | 9,981 | 17,215 |
| Direct investment | 2,900 | 3,411 | 1,779 | 2,964 | 7,715 |
| Portfolio investment | -285 | 927 | 743 | -6,041 | 3,890 |
| Other investment | 1,761 | 2,638 | 3,276 | 13,058 | 5,608 |
| Net errors and omissions | 549 | -765 | 1,925 | 3,636 | 524 |
The current account records New Zealand's transactions in:
Goods, with the balance on goods being the value of exports less the value of imports. The primary source of data is export and import entry documents lodged with the New Zealand Customs Service by importers, exporters and their agents.
Services, with the balance on services being sales less purchases. Services include transportation (including the cost of shipping New Zealand's exports and imports), passenger airfare revenue and expenditure, the expenditure of New Zealand tourists abroad and overseas tourists in New Zealand, and other services such as business services, telecommunications, insurance and financial services. Also included are royalties and licence fees. Quarterly surveys are the primary data source.
Income, which encompasses income earned by foreign investors from their investments in New Zealand, and income earned by New Zealand investors from their investments abroad. Income includes profits and losses, earnings retained in the business or distributed as dividends, and interest on debt instruments. Data is sourced from quarterly surveys.
Current transfers, which include benefits and pensions received and paid, foreign aid and withholding tax. Data is sourced from administrative records. Transfers are classified into either current transfers (which affect the level of disposable income of the donor and recipient). or capital transfers (which involve transfers in ownership of fixed assets or forgiveness of financial liabilities and are included in the capital account).
Goods dominate New Zealand's current account. Exports of goods account for approximately 71 percent of total current account inflows (credits), and imports account for approximately 59 percent of total current account outflows (debits).Goods cover all movable merchandise products.
To bring data provided by New Zealand Customs Service documentation into accord with balance of payments measurement concepts, adjustments are made to the overseas trade statistics. These adjustments include reclassification of some goods into other BOP components, and adjustments to the time of recording in the statistics of some goods transactions to meet the BOP requirement for recording transactions at the time of ownership change.
Further information on the range of exports and imports of goods is available in Chapter 25: Overseas Trade.
Table 17.1 6 lists New Zealand's international trade in services for the five March years to 200I and shows how the value of New Zealand's international trade in services has increased significantly during the period, with the value of exports and imports each increasing by more than $3 billion.
Table 17.16. Trade in services1
| Year ended March | |||||
|---|---|---|---|---|---|
| 1997 | 1998 | 1999 | 2000 | 2001 | |
| NZ$(million) | |||||
1Data may not add 10 slated totals due 10 rounding. Source: Statistics New Zealand | |||||
| Exports of services | |||||
| Total exports of services | 6,597 | 6,493 | 7,426 | 8,390 | 9,946 |
| Transportation | 2,008 | 1,957 | 2,189 | 2,383 | 2,977 |
| Travel | 3,582 | 3,323 | 3,784 | 4,449 | 5,068 |
| Business | 34 1 | 426 | 500 | 548 | 571 |
| Personal | 3,241 | 2,897 | 3,284 | 3,901 | 4,498 |
| Education | 378 | 418 | 403 | 457 | 568 |
| Health | 10 | 12 | 12 | 12 | 12 |
| Other | 2,852 | 2,468 | 2,870 | 3,432 | 3,918 |
| Communication | .. | .. | 358 | 358 | 392 |
| Construction | .. | .. | 3 | 10 | 20 |
| Insurance | 7 | 15 | 19 | 24 | 32 |
| Financial | 39 | 50 | 71 | 69 | 86 |
| Computer and information | 52 | 69 | 114 | 147 | 174 |
| Royalties and licence fees | 27 | 52 | 95 | 98 | 11 9 |
| Other business services | 747 | 860 | 616 | 657 | 850 |
| Personal, cultural and recreational | 25 | 55 | 66 | 80 | 97 |
| Government services, nei | 111 | 111 | 111 | 115 | 129 |
| Imports of services | |||||
| Total imports of services | 7,062 | 7,561 | 8,613 | 8,875 | 10,209 |
| Transportation | 2,418 | 2,591 | 2,789 | 2,867 | 3,397 |
| Travel | 2,193 | 2,330 | 2,797 | 2,944 | 3,244 |
| Communication | 0 | 0 | 341 | 361 | 447 |
| Construction | 0 | 0 | 2 | I I | 13 |
| Insurance | 191 | 197 | 232 | 227 | 189 |
| Financial | 28 | 39 | 45 | 83 | III |
| Computer and information | 93 | 126 | 188 | 201 | 230 |
| Royalties and licence fees | 460 | 522 | 567 | 617 | 715 |
| Other business services | 1,534 | 1,598 | 1,498 | 1,393 | 1,686 |
| Personal, cultural and recreational | 16 | 20 | 24 | 36 | 39 |
| Government services, nei | 128 | 137 | 129 | 136 | 137 |
| Balance on services | -462 | -1,068 | -1,187 | -485 | -263 |
Travel services is the single largest service type for both exports and imports.
Travel in BOP statistics represents the value of the goods and services acquired for personal use by foreigners travelling in New Zealand (exports), and New Zealanders travelling abroad (imports).
Travel services showed strong growth in the five-year period, illustrating the importance international tourism has for the New Zealand economy.
Transportation is the second largest service type and represents transactions provided by the operators of carriers (ships and aircraft) of freight and passengers.
The capital account records debt forgiveness, migrants' transfers and sale sand purchases of intangible assets, eg licenses, patents, copyrights and franchises.
In the New Zealand accounts, no transactions have been recorded for debt forgiveness.
Migrants' transfers data is estimated using migration data and New Zealand Immigration Service information. Data on licenses, patents etc is sourced from a quarterly survey. New Zealand's capital account is the least significant of the accounts in the balance of payments statement.
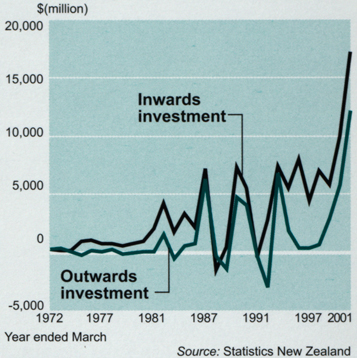
The financial account records financial investment transactions between New Zealand residents and the rest of the world. These transactions increase or decrease the level of foreign investment in Zealanders the level of New Zealand investment abroad. Investment instruments include equity capital (shares in companies) and debt instruments, eg bonds and notes, money market instruments, loans, deposits and trade finance (trade credits and debits). The net flows of investment into and out of New Zealand increased substantially in the five years to 31 March 2001 (see Figure 17.7).
Classification of investment categories in the financial account is further determined by the relationship between transactors, and is presented as direct, portfolio and other investment.
Direct investment is defined as all the financial capital transactions occurring between parties where there is an ownership relationship of 10 percent or more. For example, where a foreign investor owns 10 percent or more of the equity capital of a New Zealand company, then all the financial capital transactions between the New Zealand company (the direct investee) and the overseas investor (the direct investor) are classified as direct investment. These transactions increase or decrease the level of foreign direct investment in New Zealand. Direct investment transactions include transactions in equity capital and debt instruments, including bonds, loans, trade credits and debits. Income from the foreign direct investor's investment in New Zealand is recorded in the current account as income from foreign investment in New Zealand; direct investment income.
Portfolio investment is defined as encompassing those transactions in equity and debt instruments where the ownership relationship between the transactors does not meet the criteria for direct investment. Therefore, in addition to equity securities, this category includes marketable debt instruments - bonds and notes and money market instruments. Banking sector funding transactions in marketable debt instruments between direct investors and direct investees are included here where these transactions are defined as being in the nature of usual banking business, rather than transactions aimed at increasing or decreasing the direct investor's ownership role. Main contributors to New Zealand portfolio equity investment abroad are New Zealand resident fund managers. Foreign portfolio equity investment in New Zealand is dominated by investment in to New Zealand companies via New Zealand resident nominees. New Zealand portfolio investment abroad in the form of debt securities is dominated by banks and fund managers. Foreign portfolio investment in New Zealand in the form of debt securities is spread more widely across the sectors, with banks and government and monetary authorities significant in the statistics.
Other investment is a residual component comprising financial assets and liabilities not classified as direct or portfolio, such as loans, deposits, trade finance (trade credits and debits) and other instruments.
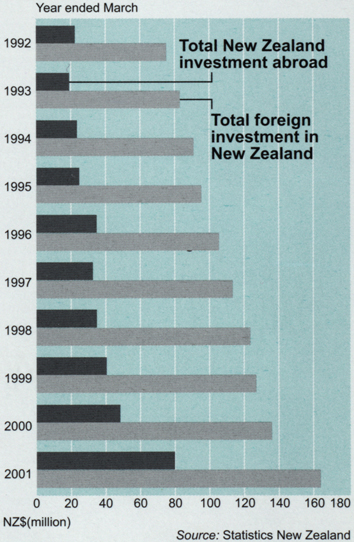
The international investment position records the stock (or level) of an economy's international financial assets and liabilities at a particular point in time (see Figure 17.8).
BOP and IIP statistics are closely related, with BOP measuring the transaction flows and IIP measuring stock positions.
The difference in the level of international financial assets and liabilities between two points in time is due to BOP financial account transactions, and other (non-transaction) changes that occurred during the reference period, such as revaluations, changes in market prices and other adjustments such as write-offs.
The sources of financial account and IIP data in the New Zealand accounts are the following regular surveys of New Zealand resident entities:
The quarterly international investment survey of a sample of resident New Zealand enterprises that have ownership links with non-residents, or which undertake financial transactions with non-residents. This is supplemented by an annual survey of a selection of those enterprises not in the quarterly sample.
The quarterly survey of New Zealand nominees, which captures information on investment into New Zealand companies by non-residents via a New Zealand resident nominee company.
The quarterly managed funds survey, which captures investments abroad of New Zealand fund managers.
A quarterly survey of the New Zealand Treasury and the Reserve Bank of New Zealand.
Table 17.17 shows New Zealand's IIP at each March from 1997 to 2001.
The statistics show that the value of New Zealand's investments abroad is much smaller than the value of foreign investment in New Zealand.
This net debtor position of New Zealand is reflected in the current account component investment income, where the income accruing to foreign investors from their New Zealand investments exceeds the income accruing to New Zealand investors from their overseas investments.
Table 17.17. International investment position1,2
| As at 31 March | |||||
|---|---|---|---|---|---|
| 1997 | 1998 | 1999 | 2000 | 2001 | |
1These tables are presented in general accordance with principles laid down by the International Monetary Fund, in the fifth edition of the Balance of Payments Manual. 2Data may not add to stated totals due to rounding. Note: Due to methodology and data collection changes, the international investment position statistics for 2001 are not directly comparable with the statistics for earlier periods. Source: Statistics New Zealand | |||||
| NZ$(million) | |||||
| New Zealand investment abroad | |||||
| Direct investment abroad | 9,706 | 10,421 | 13,458 | 13,778 | 16,512 |
| Equity capital and reinvested earnings | 18,838 | 19,340 | 30,024 | 31,449 | 15,080 |
| Other capital | -9,132 | -8,920 | -16,566 | -17,671 | 1,432 |
| Claims on affiliated enterprises | 2,465 | 2,919 | 3,658 | 3,280 | 6,418 |
| Liabilities to affiliated enterprises | -11,597 | -11,839 | -20,223 | -20,951 | -4,985 |
| Portfolio investment abroad | 9,253 | 11,686 | 12.717 | 17,036 | 26,098 |
| Equity securities | 7,040 | 8,337 | 8,367 | 13,416 | 15,219 |
| Debt securities | 2,213 | 3,348 | 4,350 | 3,620 | 10,880 |
| Other investment abroad | 7,641 | 5,058 | 6,689 | 9,676 | 15,760 |
| Trade credits | 2,239 | 1,630 | 1,791 | 1,049 | 1,610 |
| Loans | 3,741 | 1,954 | 3,466 | 6,902 | 11,452 |
| Currency and deposits | 1,143 | 859 | 673 | 1,690 | 2,306 |
| Other assets | 519 | 616 | 759 | 34 | 391 |
| Financial derivatives | .. | .. | .. | .. | 12,674 |
| Reserve assets | 6,495 | 7,568 | 7,256 | 7,877 | 8,566 |
| Total New Zealand investment abroad | 33,096 | 34,733 | 40,121 | 48,366 | 79,611 |
| Foreign investment in New Zealand | |||||
| Direct investment in New Zealand | 53,920 | 62,953 | 63,121 | 63,766 | 50,278 |
| Equity capital and reinvested earnings | 43,641 | 50,618 | 50,632 | 50,969 | 39,957 |
| Other capital | 10,279 | 12,335 | 12,489 | 12,798 | 10,321 |
| Claims on direct investors | -1,342 | -667 | -1,346 | -2,684 | -2,417 |
| Liabilities to direct investors | 11,621 | 13,002 | 13,834 | 15,482 | 12,738 |
| Portfolio investment in New Zealand | 29,003 | 31,723 | 33,315 | 27,722 | 56,752 |
| Equity securities | 1,503 | 376 | 453 | 817 | 9,310 |
| Debt securities | 27,500 | 31,347 | 32,862 | 26,905 | 47,442 |
| Other investment in New Zealand | 30,043 | 29,380 | 30,825 | 43,962 | 48,240 |
| Trade credits | 1,064 | 1,242 | 1,132 | 1,246 | 1,433 |
| Loans | 10,165 | 11,999 | 11,774 | 12,222 | 36,891 |
| Currency and deposits | 18,315 | 15,125 | 17,790 | 30,318 | 9,181 |
| Other liabilities | 500 | 1,014 | 130 | 177 | 735 |
| Financial derivatives | .. | .. | .. | .. | 18,685 |
| Total foreign investment in New Zealand | 112,966 | 124,056 | 127,261 | 135,451 | 163,955 |
| Net international investment position | -79,870 | -89,323 | -87,140 | -87,084 | -84,344 |
The balance on the current account is the sum of the balance on goods, services, income and current transfers. The current account is typically in either deficit (outflows greater than inflows) or surplus for each reference period. A deficit represents the value of the excess of inflows of resources to the New Zealand economy from abroad. Conversely, a surplus represents the value of the excess of outflows of resources from the New Zealand economy to abroad over the inflows of resources from abroad. Because they involve the exchange of resources, current account surpluses and deficits have financial implications. Surpluses (net outflows of resources) will result in increases in New Zealand's net financial claims over the rest of the world. Conversely, deficits (net inflows of resources) will translate into reductions in New Zealand's net financial claims over the rest of the world.
Figure 17.9 shows the current account balance as a percentage (ratio) of gross domestic product (GDP) from 1951 to 2001. This ratio measures New Zealand's net provision or acquisition of resources to or from abroad as a proportion of the value of New Zealand's annual output. The use of the ratio is an indication of the ability of the economy to sustain a current account imbalance. For example, an increasing current account deficit has different implications for a growing economy than for one where GDP is static or falling. Many economic analysts regard a current account deficit to GDP ratio in excess of -7 percent as unsustainable. This is because the continuing debt servicing implications of such deficits will have flow-on effects in the income component of the current account. New Zealand has incurred persistent current account deficits since the mid-1970s. These deficits have ranged between -13.6 percent of GDP in 1975 at the height of the oil crisis, to -0.8 percent in 1989. More recently, the -3.2 percent ratio for the December 2001 year represents a recovery from the -7.0 percent ratio for the March 2000 year.
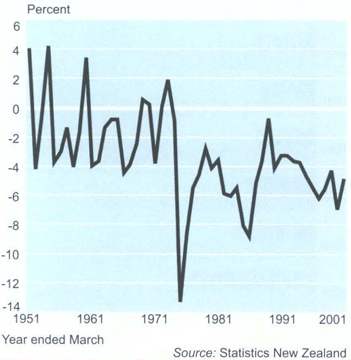 ->
->From the mid-1960s to the effects of the first oil crisis in the mid 1970s, New Zealand's balance on current account was relatively stable, fluctuating around a near balance. From then, the variability in the balance has increased, and the balance has always been in deficit. These effects toughened in 1975 (oil crisis), 1986 following market liberalisation, and, more recently, in 1997 (Asian crisis) and in 2000. Other major influences have included the effects of the sale of state-owned assets to foreign investors, and economic liberalisation. Among the larger of the earlier asset sales were Post Office Bank (1989), Telecom (1990), Bank of New Zealand (1992) and Tranz Rail (1993). In the balance of payments, these events were recorded as investment transactions in the financial account, with associated levels of foreign investment in New Zealand in the IIP, and, in the current account, the income flows earned from foreign investment in New Zealand.
Growth in the investment income attributed to foreign investors has contributed significantly to the growth of current account deficits.
Market liberalisation from the mid-1980s, abolition of controls on foreign exchange in 1984 and the floating of the New Zealand dollar in March 1985, facilitated the internationalisation of the New Zealand economy, with resultant increased activity in international investment activity. This activity is shown in the financial account, where flows of foreign investment into New Zealand, and flows of New Zealand investment abroad increased significantly in size and variability after 1985. The IIP statement shows that the value of New Zealand's liabilities to foreign investors, and claims (assets) over foreigners, increased significantly after 1992. Because New Zealand's international liabilities have grown more than its assets, the net international investment position continues to be negative, ie liabilities exceed assets. This is reflected in the current account item ‘income’, where income attributed to foreign investors from their investments in New Zealand significantly exceeds New Zealand's income from its overseas investments.
Table 17.18 shows the main countries of direct investment into New Zealand (ie investment where there is a significant ownership relationship) are the United States, Australia and the United Kingdom. The main regions are Organisation for Economic Cooperation and Development, European Union and Asia Pacific Economic Cooperation countries. These same regions are the main destinations for New Zealand's direct investment abroad, while Australia is the main country destination.
Table 17.18. Stock of foreign direct investment by country1,2
| As at 31 March | |||||
|---|---|---|---|---|---|
| 1997 | 1998 | 1999 | 2000 | 2001 | |
1These tables are presented in general accordance with principles laid down by the International Monetary Fund, in the fifth edition of the Balance of Payments Manual. 2Due to methodology and data collection changes, the foreign direct investment statistics for 2001 are not directly comparable with the statistics for earlier periods. Source: Statistics New Zealand | |||||
| NZ$(million) | |||||
| New Zealand's direct investment abroad | |||||
| APEC | 8,391 | 9,147 | 12,245 | 14,267 | 11,483 |
| ASEAN | 295 | 585 | 785 | 692 | 796 |
| EU | -741 | -1,531 | -2,522 | -2,060 | 2,116 |
| OECD | 7,839 | 7,985 | 10,417 | 11,934 | 15,456 |
| Australia | 5,774 | 7,146 | 9,438 | 10,404 | 9,313 |
| Canada | 2,446 | 1,959 | 2,917 | 2,833 | ..C |
| Germany | 32 | 44 | 46 | 45 | ..C |
| Hong Kong | -678 | -1,086 | -1,632 | -583 | ..C |
| Japan | 90 | 88 | 116 | 167 | -9 |
| Netherlands | -2,704 | -2,162 | -4,163 | -3,851 | ..C |
| Singapore | 176 | 301 | 288 | 193 | 320 |
| Switzerland | ..C | ..C | -9 | -21 | |
| United Kingdom | 1,911 | 355 | 1,260 | 1,318 | ..C |
| United States | 279 | 327 | 457 | 590 | 2,805 |
| Foreign direct investment in New Zealand | |||||
| APEC | 38,557 | 42,528 | 41,714 | 42,038 | 28,191 |
| ASEAN | 3,635 | 2,986 | 1,830 | 1,494 | 1,184 |
| EU | 9,822 | 11,627 | 13,757 | 14,719 | 15,263 |
| OECD | 43,750 | 50,323 | 52,944 | 54,348 | 46,625 |
| Australia | 15,713 | 19,626 | 23,074 | 24,571 | 17,245 |
| Canada | 965 | 1,600 | 968 | 995 | ..C |
| Germany | 243 | 265 | 241 | 590 | 340 |
| Hong Kong | 1,355 | 1,117 | 875 | 1,067 | 1,124 |
| Japan | 1,690 | 1,227 | 2,327 | 2,025 | 749 |
| Netherlands | 1,371 | 1,345 | 3,622 | 3,353 | 7,069 |
| Singapore | 2,547 | 2,162 | 1,177 | 1,023 | 1,165 |
| Switzerland | 477 | 379 | 315 | 363 | 175 |
| United Kingdom | 6,894 | 8,509 | 8,586 | 9,242 | 6,741 |
| United States | 14,955 | 15,809 | 12,452 | 11,601 | 6,971 |
Table 17.19 shows that the main industries in which foreigners hold their New Zealand investments are finance and insurance, and manufacturing.
Retail trade, wholesale trade and property and business services are also significant recipients of foreign investment, and together with finance and insurance, are significant investors abroad.
Government administration and defence is a significant investor abroad and recipient of foreign investment from abroad because of reserve assets and government debt held abroad.
Table 17.19. International assets and liabilities by industry1,2
| As at 31 March | |||
|---|---|---|---|
| 1999 | 2000 | 2001 | |
1This table is prepared on a balance sheet basis. 2Data may not add to stated totals due to rounding. Source: Statistics New Zealand | |||
| NZ$(million) | |||
| New Zealand's international assets | |||
| Agriculture, forestry and fishing | 21 | 15 | ..C |
| Mining | 75 | 67 | ..C |
| Manufacturing | 21,945 | 21,902 | 7,114 |
| Electricity, gas and water supply | ..C | ..C | ..C |
| Construction | 87 | ..C | 35 |
| Wholesale trade | 2,122 | 2,193 | 2,887 |
| Retail trade | ..C | ..C | 1,957 |
| Accommodation, cafes and restaurants | 1 | 1 | – |
| Transport and storage | ..C | ..C | ..C |
| Communication services | ..C | ..C | ..C |
| Finance and insurance | 29,535 | 38,440 | 55,123 |
| Property and business services | 1,044 | 2,726 | 1,339 |
| Government administration and defence | 2,699 | 2,753 | 4,766 |
| Education | ..C | ..C | ..C |
| Health and community services | ..C | ..C | ..C |
| Cultural and recreational services | ..C | ..C | ..C |
| Personal and other services | 3 | 5 | ..C |
| Total international assets | 61,690 | 72,001 | 87,103 |
| New Zealand's international liabilities | |||
| Agriculture, forestry and fishing | 108 | 110 | ..C |
| Mining | 1,140 | 633 | ..C |
| Manufacturing | 35,719 | 37,585 | 23,309 |
| Electricity, gas and water supply | 1,659 | 1,805 | ..C |
| Construction | 219 | 253 | 170 |
| Wholesale trade | 6,374 | 5,952 | 5,248 |
| Retail trade | 4,111 | 4,004 | 7,525 |
| Accommodation, cafes and restaurants | 940 | 976 | 792 |
| Transport and storage | 1,514 | 2,179 | 1,120 |
| Communication services | ..C | ..C | ..C |
| Finance and insurance | 56,362 | 66,941 | 98,900 |
| Property and business services | 4,965 | 4,915 | 5,798 |
| Government administration and defence | 17,371 | 16,322 | 7,278 |
| Education | ..C | ..C | ..C |
| Health and community services | ..C | ..C | ..C |
| Cultural and recreational services | 763 | 822 | 758 |
| Personal and other services | ..C | ..C | ..C |
| Total international liabilities | 148,830 | 159,086 | 171,448 |
New Zealand's international financial assets and liabilities are shown in tables 17.20, 17.21 and 17.22.
This balance sheet presentation enables breakdowns by sector, instrument types and currency of denomination of international financial assets and liabilities.
The balance sheet presentation produces the same net position as the IIP, but the categories used in the IIP are based on functional classifications (direct, portfolio and other investment) and are not directly reconcilable. As shown in table 17.20, the composition of New Zealand international assets is more varied than the composition of its international liabilities.
Since September 2000, equity assets have ranged between 33 percent and 44 percent of total assets, with lending making up the balance of the assets and ranging between 56 percent and 67 percent of the total. By contrast, the composition of New Zealand's international liabilities is marked by relative stability; equity has comprised between 27 percent and 29 percent of total liabilities, with the remainder borrowing, ranging between 71 percent and 73 percent of total liabilities.
From September 2000, the banking sector has accounted for between 51 percent and 54 percent of New Zealand's international borrowing. This reflects the sector's role as financial intermediary – pooling the resources of net savers to meet the needs of net borrowers.
New Zealand banks also lend significant amounts abroad, accounting for between 36 percent and 49 percent of New Zealand's lending abroad.
Borrowing by the government and monetary authorities represents primarily the New Zealand Government's overseas debt, while the international lending of these sectors represents primarily the country's official reserve assets. The category ‘other sectors’ encompasses all other sectors, including non-bank private sector companies and state-owned enterprises. From September 2000, borrowing by this sector accounted for about 34 percent of total borrowing, and between 33 percent and 47 percent of total lending.
Table 17.2. International financial assets and liabilities1,2
| As at end of quarter | ||||||
|---|---|---|---|---|---|---|
| 2000 | 2001 | |||||
| Sep | Dec | Mar | Jun | Sep | Dec | |
1This table is prepared on a balance sheet basis. 2Data may not add to slated totals due to rounding. Source: Statistics New Zealand | ||||||
| $NZ (million) | ||||||
| New Zealand's international financial assets | ||||||
| Equity assets | 36,800 | 31,128 | 30,299 | 31,341 | 27,533 | 29,711 |
| Lending | 47,043 | 46,628 | 56,804 | 52,646 | 55,306 | 52,348 |
| Banks | 19,252 | 17,411 | 20,700 | 19,133 | 27,355 | 23,893 |
| General government | 4,462 | 4,551 | 4,414 | 4,422 | 4,806 | 4,359 |
| Monetary authorities | 5,280 | 5,365 | 4,907 | 4,909 | 5,055 | 5,007 |
| Other sectors | 18,049 | 19,301 | 26,782 | 24,182 | 18,089 | 19,089 |
| Total international assets | 83,843 | 77,756 | 87,103 | 83,987 | 82,839 | 82,059 |
| New Zealand's international financial liabilities | ||||||
| Equity liabilities | 49,320 | 47,530 | 49,267 | 48,707 | 47,011 | 48,724 |
| Borrowing | 122,134 | 118,544 | 122,181 | 122,085 | 125,476 | 122,171 |
| Banks | 63,677 | 60,434 | 63,704 | 63,367 | 67,648 | 65,131 |
| General government | 8,282 | 8,081 | 7,409 | 7,233 | 7,747 | 6,871 |
| Monetary authorities | 8,572 | 9,268 | 9,540 | 8,827 | 8,985 | 9,266 |
| Other sectors | 41,603 | 40,761 | 41,527 | 42,658 | 41,095 | 40,903 |
| Total international liabilities | 171,454 | 166,074 | 171,448 | 170,792 | 172,487 | 170,895 |
| New Zealand's net international asset position | ||||||
| Net international equity | -12,520 | -16,402 | -18,968 | -17,365 | -19,478 | -19,013 |
| Net international debt | -75,091 | -71,917 | -65,376 | -69,439 | -70,170 | -69,824 |
| Net international asset position | -87,612 | -88,319 | -84,344 | -86,804 | -89,648 | -88,836 |
Figure 17.10 shows overseas debt by sector.
Table 17.21. International financial assets and liabilities by instrument1,2
| As at end of quarter | ||||||
|---|---|---|---|---|---|---|
| 2000 | 2001 | |||||
| Sep | Dec | Mar | Jun | Sep | Dec | |
1This table is prepared on a balance sheet basis. 2Data may not add to stated totals due to rounding. Source: Statistics New Zealand | ||||||
| New Zealand's international financial assets | $NZ (million) | |||||
| Loans | 6,315 | 7,762 | 16,330 | 16,022 | 18,786 | 18,151 |
| Bonds and notes | 17,276 | 17,578 | 18,946 | 17,723 | 19,345 | 18,677 |
| Deposits | 1,681 | 3,363 | 2,402 | 2,651 | 2,285 | 2,586 |
| Trade credits | 2,912 | 3,597 | 3,385 | 3,918 | 3,579 | 4,024 |
| Money market instruments | ..C | 1,215 | 665 | ..C | ..C | ..C |
| Financial derivatives | 13,218 | 10,309 | 12,786 | 8,370 | 7,921 | 6,222 |
| Other instruments | ..C | 2,803 | 2,291 | ..C | ..C | ..C |
| Total international financial assets | 47,043 | 46,628 | 56,804 | 52,646 | 55,306 | 52,348 |
| New Zealand's international financial liabilities | ||||||
| Loans | 54,628 | 50,716 | 51,969 | 51,316 | 57,058 | 56,510 |
| Bonds and notes | 37,397 | 38,338 | 38,730 | 38,910 | 37,195 | 37,092 |
| Deposits | 7,742 | 8,926 | 9,181 | 10,611 | 11,255 | 10,702 |
| Trade credits | 2,357 | 2,214 | 2,730 | 2,695 | 2,308 | 1,986 |
| Money market instruments | 7,916 | 9,421 | 9,424 | ..C | ..C | ..C |
| Financial derivatives | 10,307 | 8,011 | 8,776 | 8,296 | 7,781 | 6,561 |
| Other instruments | 1,788 | 918 | 1,371 | ..C | ..C | ..C |
| Total international financial liabilities | 122,134 | 118,544 | 122,181 | 122,085 | 125,476 | 122,171 |
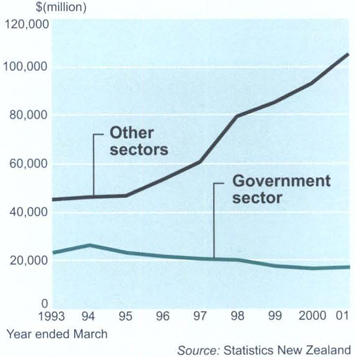 ->
->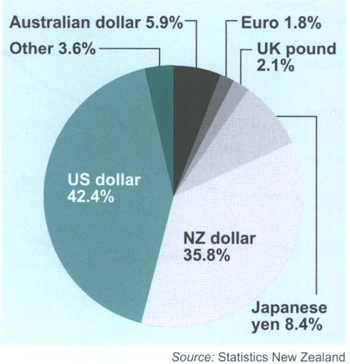 ->
->The main instruments in which New Zealand's international financial assets and liabilities are held are loans, and bonds and notes. Together, these two instruments accounted for 70 percent of New Zealand's financial assets and 77 percent of its financial liabilities at 31 December 2001. Financial assets and liabilities associated with trade in goods and services (trade credits and debits) form a small and relatively stable proportion of New Zealand's total assets and liabilities; ranging between 6 and 8 percent of assets and around 2 percent of liabilities. Financial derivative positions are now significant features of New Zealand's international financial assets and liabilities. Since September 2000, financial derivative net asset positions, ie those derivative contracts in effect at the survey date and in an asset position, have ranged between 14 and 28 percent of total financial assets. Derivative liabilities positions have been more stable, ranging between 5 and 8 percent of total liabilities.
Table 17.22 shows New Zealand's international financial assets and liabilities by currency. The majority of both New Zealand's international financial assets and liabilities are held in either New Zealand dollars or United States dollars. Figure 17.11 shows overseas debt by currency.
Table 17.22. International financial assets and liabilities by currency1,2
| As at end of quarter | Quarter | |||||
|---|---|---|---|---|---|---|
| 2000 | 2001 | |||||
| Sep | Dec | Mar | Jun | Sep | Dec | |
1This table is prepared on a balance sheet basis. 2Only a limited currency profile is shown in this table. Therefore, data does not add to stated totals. Source: Statistics New Zealand | ||||||
| $NZ (million) | ||||||
| New Zealand's international financial assets | ||||||
| Australian dollar | 3,781 | 4,458 | 5,615 | 5,561 | 5,590 | 5,586 |
| European Community euro | 2,224 | 2,631 | 3,633 | 3,280 | 3,368 | 2,983 |
| United Kingdom pound | 1,529 | 825 | 1,744 | 1,561 | 1,846 | 1,878 |
| Japanese yen | 4,548 | 3,868 | 3,866 | 2,627 | 2,760 | 2,443 |
| New Zealand dollar | 15,391 | 18,398 | 20,789 | 16,788 | 20,531 | 17,447 |
| United States dollar | 16,957 | 13,698 | 19,001 | 20,397 | 17,941 | 18,483 |
| Total international financial assets | 47,043 | 46,628 | 56,804 | 52,646 | 55,306 | 52,348 |
| New Zealand's international financial liabilities | ||||||
| Australian dollar | 6,781 | 10,291 | 7,168 | 7,721 | 8,240 | 8,680 |
| European Community euro | 1,644 | 2,200 | 2,194 | ..C | 2,848 | ..C |
| United Kingdom pound | 2,703 | 2,041 | 2,554 | 3,096 | 4,729 | 4,052 |
| Japanese yen | 12,027 | 9,424 | 10,309 | 13,183 | 10,017 | 8,615 |
| New Zealand dollar | 37,624 | 44,316 | 43,749 | 43,832 | 48,545 | 46,867 |
| United States dollar | 48,676 | 45,708 | 51,788 | 47,912 | 47,423 | 48,435 |
| Total international financial liabilities | 122,134 | 118,544 | 122,181 | 122,085 | 125,476 | 122,171 |
Annual and quarterly surveys conducted by Statistics New Zealand (SNZ) provide comprehensive information about business in New Zealand. The Annual Enterprise Survey, which covers most industries, collects information on the financial performance and position of New Zealand businesses. Quarterly business surveys, such as the Economic Survey of Manufacturing and Distribution, provide information on short-term activity, while the Quarterly Employment Survey offers a broad picture of employment across the economy. In addition to these financial surveys, SNZ also produces business demographic statistics, sourced from SNZ's Business Frame, a register of businesses primarily used to select businesses for inclusion in business surveys. The Business Frame records names and addresses, predominant type of industrial activity, employment levels and the degree of overseas ownership. This information can also be used to produce statistics on changes in the number, type and location of businesses in New Zealand. Analyses can be undertaken using a range of variables, including geographic area, industry, institutional sector, business type, overseas ownership and employment levels. Business demographic statistics are produced annually from the Business Frame. Up until 1994, business demographic statistics included businesses that compulsorily registered for GST. Since then, statistics have been based on economically significant enterprises. These are generally defined as those with annual GST expenses or sales greater than $30,000, or those in a GST-exempt industry.
Statistics in table 17.23, on geographic units and full-time equivalent (FTE) people engaged, are derived from a snapshot of the Business Frame. The table uses the Australian and New Zealand Standard Industrial Classification (ANZSIC), for comparability with Annual Enterprise Survey results presented elsewhere. A ‘geographic unit’ is a separate operating unit engaged in one (or predominantly one) kind of economic activity from a single physical location. ‘Full-time equivalent persons engaged’ equals the sum of full-time employees and working proprietors engaged, plus half the part-time employees and working proprietors. A person is regarded as full time if he or she works 30 or more hours a week.
Table 17.23. Businesses1 and FTE persons2 in economically significant enterprises, 2001
| Enterprises | Geographic units | Full-time equivalent persons engaged |
|---|---|---|
1Generally defined as those enterprises with greater than $30,000 annual GST expenses or sales, or in a GST-exempt industry. 2Full-lime equivalent (FTE) persons engaged equals the sum of the full-time persons engaged plus half the part-time persons engaged. FTE numbers have been rounded and sums of component items may not match totals. Source: Statistics New Zealand | ||
| Services to agriculture; hunting and trapping | 4,192 | 18,060 |
| Forestry and logging | 5,642 | 10,030 |
| Commercial fishing | 2,069 | 4,870 |
| Total agriculture, forestry and fishing (excl. farms) | 11,903 | 32,980 |
| Coal mining | 37 | 630 |
| Oil and gas extraction | 22 | 400 |
| Metal ore mining | 79 | 480 |
| Other mining | 332 | 1,900 |
| Services to mining | 51 | 280 |
| Total mining | 521 | 3,680 |
| Food, beverage and tobacco | 1,788 | 59,310 |
| Textile, clothing, footwear and leather manufacturing | 2,028 | 20,280 |
| Wood and paper product manufacturing | 2,313 | 25,690 |
| Printing, publishing and recorded media | 2,119 | 19,610 |
| Petroleum, coal, chemical and associated product manufacturing | 1,291 | 19,090 |
| Non-metallic mineral product manufacturing | 863 | 6,640 |
| Metal product manufacturing | 3,326 | 26,970 |
| Machinery and equipment manufacturing | 5,485 | 42,570 |
| Other manufacturing | 3,056 | 14,730 |
| Total manufacturing | 22,269 | 234,890 |
| Electricity and gas supply | 248 | 4,850 |
| Water supply, sewerage and drainage services | 172 | 1,460 |
| Total electricity, gas and water supply | 420 | 6,300 |
| General construction | 13,480 | 45,130 |
| Construction trade services | 22,541 | 62,100 |
| Total construction | 36,021 | 107,220 |
| Basic material wholesaling | 4,202 | 23,930 |
| Machinery and motor vehicle wholesaling | 6,510 | 35,690 |
| Personal and household good wholesaling | 8,704 | 42,810 |
| Total wholesale trade | 19,416 | 102,420 |
| Food retailing | 9,383 | 58,470 |
| Personal and household good retailing | 18,821 | 75,710 |
| Motor vehicle retailing and services | 10,459 | 45,840 |
| Total retail trade | 38,663 | 180,020 |
| Accommodation, cafes and restaurants | 10,596 | 69,400 |
| Total accommodation, cafes and restaurants | 10,596 | 69,400 |
| Road transport | 7,693 | 31,360 |
| Rail transport | 93 | 1,860 |
| Water transport | 240 | 2,240 |
| Air and space transport | 537 | 7,660 |
| Other transport | 87 | 220 |
| Services to transport | 2,647 | 17,380 |
| Storage | 516 | 3,420 |
| Total transport and storage | 11,813 | 64,130 |
| Communication services | 3,673 | 28,330 |
| Total communication services | 3,673 | 28,320 |
| Finance | 6,137 | 23,310 |
| Insurance | 1,552 | 7,730 |
| Services to finance and insurance | 3,901 | 11,580 |
| Total finance and insurance | 11,590 | 42,630 |
| Property services | 51,783 | 31,960 |
| Business services | 39,451 | 158,040 |
| Total property and business services | 91,234 | 189,990 |
| Government administration | 1,752 | 42,090 |
| Defence | 59 | 9,760 |
| Total government administration and defence | 1,811 | 51,840 |
| Education | 7,531 | 101,100 |
| Total education | 7,531 | 101,100 |
| Health services | 11,394 | 89,430 |
| Community services | 3,089 | 35,420 |
| Total health and community services | 14,483 | 124,840 |
| Motion picture, radio and television services | 1,721 | 8,330 |
| Libraries, museums and the arts | 3,056 | 11,110 |
| Sport and recreation | 5,939 | 17,090 |
| Total cultural and recreational services | 10,716 | 36,530 |
| Personal services | 7,618 | 21,310 |
| Other services | 5,972 | 28,510 |
| Private households employing staff | 13 | 60 |
| Total personal and other services | 13,603 | 49,870 |
| Total | 306,263 | 1,426,190 |

In February 2001, there were 101,100 full-time equivalent people engaged in the education sector.
Table 17.24 is also based on business demographic data and shows full-time equivalent people engaged by regional council areas, as at February 2001. The table is not a measure of total employment and farms are not included.
Table 17.24. FTE persons1 engaged in economically significant enterprises2 by regional council area
| Regional council | Agriculture, forestry and fishing | Mining | Manufacturing | Electricity gas and water supply | Construction | Wholesale track | Retail trade | Accommodation, cafes and restaurants | Transport and storage | Communication services | Finance and insurance | Property and business services | Government administration and defence | Education | Health and community services | Cultural and recreational services | Personal and other services | Total |
|---|---|---|---|---|---|---|---|---|---|---|---|---|---|---|---|---|---|---|
1Full-time equivalent (FTE) persons engaged equals the sum of the full-time persons engaged plus half the part-time persons engaged. 2Generally defined as those enterprises with greater than $30,000 annual GST expenses or sales, or in a GST-exempt industry. Source: Statistics New Zealand | ||||||||||||||||||
| Northland | 1,830 | 190 | 5,440 | 270 | 3,530 | 1,740 | 6,110 | 2,580 | 1,600 | 410 | 620 | 3,540 | 1,020 | 3,450 | 4,430 | 780 | 1,440 | 38,980 |
| Auckland | 1,890 | 330 | 83,010 | 1,660 | 36,940 | 51,770 | 58,230 | 19,840 | 25,160 | 11,120 | 18,460 | 83,230 | 12,070 | 29,730 | 36,250 | 12,820 | 16,200 | 498,720 |
| Waikato | 5,180 | 890 | 19,870 | 930 | 10,490 | 5,950 | 16,420 | 5,970 | 4,270 | 1,880 | 2,110 | 11,910 | 3,340 | 9,650 | 10,610 | 2,720 | 4,270 | 116,450 |
| Bay of Plenty | 3,980 | 150 | 12,390 | 430 | 7,160 | 4,390 | 11,400 | 4,280 | 3,790 | 990 | 1,370 | 8,040 | 1,930 | 5,700 | 7,720 | 1,900 | 2,650 | 78,310 |
| Gisborne | 1,350 | 18 | 1,710 | 40 | 1,060 | 630 | 1,820 | 610 | 530 | 80 | 150 | 1,080 | 360 | 1,340 | 1,440 | 230 | 540 | 12,990 |
| Hawke's Bay | 3,220 | 85 | 10,340 | 160 | 3,440 | 2,580 | 6,510 | 2,090 | 2,210 | 360 | 710 | 4,450 | 1,130 | 3,620 | 4,710 | 780 | 1,630 | 48,050 |
| Taranaki | 630 | 550 | 7.970 | 280 | 2,460 | 1,650 | 4,730 | 1,390 | 1,230 | 350 | 520 | 3,290 | 750 | 2,380 | 3,590 | 590 | 1,060 | 33,460 |
| Manawatu-Wanganui | 2,260 | 80 | 11,130 | 400 | 5,300 | 3,800 | 10,160 | 3,430 | 2,240 | 800 | 1,240 | 6,670 | 4,690 | 7,620 | 7,660 | 1,570 | 2,710 | 71,790 |
| Wellington | 1,220 | 170 | 17,540 | 800 | 12,190 | 10,860 | 20,240 | 7,850 | 6,800 | 6,660 | 10,910 | 34,230 | 16,530 | 12,330 | 15,420 | 5,980 | 8,210 | 187,940 |
| Total North Island | 21,590 | 2,450 | 169,430 | 4,970 | 82,580 | 83,380 | 135,640 | 48,030 | 47,820 | 22,660 | 36,100 | 156,450 | 41,820 | 75,830 | 91,820 | 27,380 | 38,720 | 1,086,660 |
| Tasman | 1,140 | 35 | 2,210 | 75 | 1,080 | 450 | 1,610 | 720 | 500 | 60 | 120 | 910 | 130 | 710 | 530 | 310 | 250 | 10,840 |
| Nelson | 1,390 | 3 | 2,960 | 18 | 1,250 | 1,110 | 2,350 | 990 | 1,080 | 230 | 310 | 1,840 | 440 | 1,100 | 2,270 | 390 | 690 | 18,410 |
| Marlborough | 1,210 | 50 | 3,090 | 85 | 1,110 | 480 | 1,930 | 1,090 | 650 | 80 | 170 | 1,070 | 900 | 680 | 870 | 240 | 350 | 14,060 |
| Canterbury | 2,940 | 260 | 36,440 | 630 | 13,000 | 12,380 | 23,850 | 10,040 | 8,700 | 4,370 | 4,050 | 20,920 | 5,710 | 12,950 | 18,130 | 4,990 | 6,090 | 185,450 |
| West Coast | 640 | 450 | 450 | 30 | 840 | 330 | 1,460 | 1,230 | 600 | 50 | 140 | 530 | 330 | 670 | 1,040 | 270 | 330 | 10,370 |
| Otago | 2,030 | 300 | 10,590 | 390 | 5,060 | 2,730 | 8,920 | 5,560 | 2,920 | 640 | 1,160 | 6,180 | 1,700 | 7,070 | 7,150 | 2,340 | 2,180 | 66,920 |
| Southland | 1,930 | 140 | 8,670 | 110 | 2,300 | 1,580 | 4,250 | 1,710 | 1,830 | 240 | 580 | 2,080 | 830 | 2,070 | 3,030 | 580 | 1,260 | 33,210 |
| Total South Island | 11,270 | 1,240 | 65,410 | 1,330 | 24,630 | 19,050 | 44,380 | 21,350 | 16,290 | 5,670 | 6,530 | 33,540 | 10,030 | 25,260 | 33,020 | 9,130 | 11,150 | 339,230 |
| Area outside region | 120 | ... | 50 | 3 | 12 | 3 | 18 | 15 | 20 | ... | 3 | 18 | 3 | 15 | 6 | 18 | 9 | 300 |
| Total New Zealand | 32,970 | 3,690 | 234,890 | 6,300 | 107,220 | 102,430 | 180,030 | 69,400 | 64,140 | 28,320 | 42,630 | 190,000 | 51,840 | 101,090 | 124,840 | 36,530 | 49,870 | 1,426,190 |
17.1 The Treasury.
17.2–4 Statistics New Zealand.
Statistics New Zealand divisional manager responsible: Jeff Cope.
Balance of Payments – Sources and Methods (2001). Statistics New Zealand, Wellington.
Balance of payments manual (5th ed). 1993. International Monetary Fund, Washington DC.
Financial Derivatives: A supplement to the fifth edition of the balance of payments manual (2000). International Monetary Fund, Washington DC.
External debt: definition, statistical coverage and methodology (1998). The World Bank Group, Washington DC.
Key Statistics (monthly). Statistics New Zealand, Wellington.
New Zealand Economic and Financial Overview (2002). The Treasury, Wellington.
New Zealand Institutional Sector Accounts: Experimental series 1987–1997 (1998). Statistics New Zealand. Wellington.
New Zealand System of National Accounts (annual). Statistics New Zealand, Wellington.
Quarterly Predictions (quarterly). New Zealand Institute of Economic Research, Wellington.
Tourism Satellite Account 1997 (2001). Statistics New Zealand, Wellington.
Provisional Tourism Satellite Account 1998–2000 (2001). Statistics New Zealand, Wellington.
Inter-industry Study 1996: Interim release of tables (2001). Statistics New Zealand, Wellington.
Table of Contents
Fields being ploughed near Rae's Junction, Southland.
The major industries of farming and horticulture continue to be significant export earning industries for New Zealand. In the year to March 2001, the agricultural, horticultural and forestry sectors made up more than 60 percent of New Zealand's export earnings. Dairying, deer and wine are the fastest growing sectors.
Dairying expanded in the five years from 1996 in response to product price signals. Farms have been converted into dairying, especially in Canterbury and Southland, and dairy farms across New Zealand have increased in size. While the number of traditional sheep and cattle farms has decreased through conversion and amalgamation, productivity has increased through improved breeds and strains of livestock and plant cultivars and their management. Cereal crops and horticultural products have traditionally been grown mainly for the home market, but horticulture has become an important export earner since the 1970s, recently achieving an annual free on board (fob) value of $2 billion.
Organic farming continues to expand, encouraged by promising market signals and by the active support of coalition partners in the current administration. Production of arable and vegetable crops by organic systems is now well established and has been followed closely by the apple and kiwifruit sectors. The organic industry is working to resolve the major management issues that livestock producers confront (woody weeds, internal parasites and mastitis). The lead taken by the organics sector is of interest to many conventional producers, and industry analysts see the two sectors moving closer together through time.
New Zealand has also considered the strategic opportunities of genetic modification. Following a Royal Commission of Inquiry, the government accepted its themes of proceeding with caution and preserving opportunities. Releases of genetically modified organisms will be constrained for two years, but research will continue under strict containment conditions. The government will use this time to establish a bioethics council, develop a biotechnology strategy, make legislative changes recommended by the royal commission, and do further work on the coexistence of production systems that use genetically modified organisms and those that do not. New Zealand researchers have developed genetically modified potatoes to resist pests and genetically modified cattle to produce therapeutic proteins in their milk.
Rural produce makes up more than half of New Zealand's merchandise exports. Uniquely among developed countries, New Zealand farmers are almost totally exposed to world market forces. They receive no subsidies from the government and have to compete with subsidised production from other countries. However, the GATT Uruguay Round Agriculture Agreement began to take effect in 1995. This agreement imposes progressive reductions on subsidies other countries can give to agricultural production and exports. One effect is to increase access opportunities for New Zealand's exports into overseas markets.
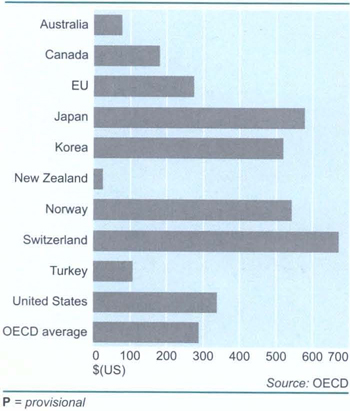
New Zealand's total milk production (including milk used on farms and domestic market milk) for the season to 31 May 2001 was estimated at 13.2 million tonnes (approximately 1.080 million kilograms of milksolids (kgMS)). This was up 7 percent from the previous season due to a favourable spring, offset by a dry summer on the East Coast. The number of dairy cows in milk was estimated at 3.549 million at 30 June 2001. The average dairy company payout for the 2000/01 season was $5.01/kg of milksolids, up 33 percent from the previous season's level. Approximately 1.045 million kgMS were processed into dairy products during the season, 8 percent higher than the 1999/2000 season.
Total sheep numbers were estimated at 44 million at 30 June 2001 and sheepmeat production for the year ended September 2001 was 562,000 tonnes. Wool production fell 6 percent to 183,000 tonnes for the year ended June 2001. The New Zealand beef cattle herd was estimated at 4.7 million at June 2001. Beef and veal production increased to 591,455 tonnes for the year ended September 2001.
Tables 18.1 and 18.2 show land use by pastoral and horticultural farm types respectively, while table 18.3 shows farm land use by regional council area. Figure 18.1 compares New Zealand's agricultural assistance with that provided by other OECD countries.
Table 18.1. Land use by farm type (pastoral), as at 30 June 19991
| Farm type | Number of farms | Grazing, arable, fodder and fallow land | Land in horticulture | Plantations of exotic timber | Other land | Total land |
|---|---|---|---|---|---|---|
C = an estimate that has been suppressed for reasons of respondent confidentiality. S = an estimate that has been suppressed for reasons of poor quality. 1The population for the 1999 Agricultural Production Survey differs from that of previous agricultural surveys, Therefore, figures supplied in this table are not directly comparable with those from previous agricultural surveys. Source: Statistics New Zealand, Agricultural Production Survey for the year ended 30 June 1999 | ||||||
| number | hectares | |||||
| Grain growing | 543 | 43,590 | 1,135 | 160 | 1,130 | 46,015 |
| Grain-sheep and grain-beef cattle farming | 2,085 | 429,670 | 6,444 | 6,939 | 17,070 | 460,123 |
| Sheep-beef cattle farming | 10,908 | 5,283,182 | 5,593 | 109,742 | 589,826 | 5,988,343 |
| Sheep farming | 9,420 | 2,783,475 | 6,021 | 38,233 | 189,212 | 3,016,941 |
| Beef cattle farming | 12,138 | 561,270 | 3,002 | 23,258 | 81,664 | 669,194 |
| Dairy cattle farming | 15,951 | 1,640,419 | 2,711 | 19,754 | 93,006 | 1,755,890 |
| Poultry farming (meat) | 123 | 2,684 | ..C | ..C | 411 | 3,223 |
| Poultry farming (eggs) | 84 | 1,057 | ..S | ..S | ..S | 1,212 |
| Pig farming | 270 | ..S | 177 | 185 | ..S | ..S |
| Horse farming | 618 | 15,250 | ..C | ..C | ..S | 16,379 |
| Deer fanning | 1,914 | 166,589 | 353 | 3,573 | 11,592 | 182,108 |
| Mixed livestock | 4,320 | 1,290,187 | 1,718 | 25,410 | 126,583 | 1,443,898 |
| Livestock fanning nec | 678 | 14,417 | ..S | 802 | ..S | 16,204 |
| Horticulture and fruit growing | 1,917 | 27,030 | 19,180 | 1,391 | 3,820 | 51,420 |
| Other | 6,231 | 164,936 | 2,072 | 189,800 | 81,862 | 438,669 |
| Unknown | 13,176 | 1,426,003 | 5,114 | 27,012 | 22,922 | 1,481,050 |
| Total | 80,376 | 13,863,279 | 53,692 | 446,954 | 1,221,103 | 15,585,027 |
Table 18.2. Land use by farm type (horticulture), as at 30 June 20001
| Farm type | Number of farms2 | Grazing, arable, fodder and allow land | Land in horticulture | Plantations of exotic timber | Other land | Total land |
|---|---|---|---|---|---|---|
1The population for the 2000 Agricultural Production Survey – Horticulture differs from that of previous agricultural surveys. Therefore, figures supplied in this table are not directly comparable with those from previous agricultural surveys. 2Figures have been rounded to multiples of three and discrepancies may occur between sums of component items and totals. Source: Statistics New Zealand, Agricultural Production Survey – Horticulture for the year ended 30 June 2000 | ||||||
| number | hectares | |||||
| Plant nurseries | 840 | 2,591 | 2,553 | 700 | 976 | 6,821 |
| Cut flower and flower seed growing | 1,362 | 4,388 | 2,329 | 307 | 2,186 | 9,210 |
| Vegetable growing | 2,391 | 53,180 | 47,242 | 1,343 | 3,649 | 105,413 |
| Grape growing | 945 | 8,814 | 13,170 | 693 | 1,559 | 24,236 |
| Apple and pear growing | 1,488 | 9,278 | 16,945 | 657 | 1,773 | 28,652 |
| Stone fruit growing | 336 | 1,844 | 2,411 | 64 | 630 | 4,949 |
| Kiwifruit growing | 2,340 | 11,596 | 13,901 | 1,306 | 3,435 | 30,238 |
| Citrus growing | 522 | 2,109 | 2,201 | 359 | 563 | 5,233 |
| Berry fruit growing | 285 | 3,493 | 2,388 | 272 | 520 | 6,673 |
| Other fruit growing nec | 1,647 | 5,364 | 5,849 | 714 | 2,669 | 14,596 |
| Grain, sheep and beef cattle fanning | 969 | 115,171 | 13,261 | 3,750 | 7,520 | 139,701 |
| Other | 1,053 | 54,144 | 6,460 | 4,071 | 6,104 | 70,778 |
| Total | 14,172 | 271,971 | 128,712 | 14,234 | 31,583 | 446,500 |
Table 18.3. Farmland use by regional council area as at 30 June 1999
| Region | Number of farms | Grazing, arable, fodder and fallow land | Land in horticulture | Plantations of exotic timber | Other land | Total land |
|---|---|---|---|---|---|---|
Note:Figures have been rounded and discrepancies may occur between sums of component items and totals. The population for the 1999 Agricultural Production Survey differs from that of previous agricultural surveys. Therefore figures supplied in this table are not directly comparable with those from previous agricultural surveys. C = an estimate that has been suppressed for reasons of respondent confidentiality S = an estimate that has been suppressed for reasons of poor quality Source: Statistics New Zealand, Agricultural Production Survey for the year ended 30 June 1999 | ||||||
| hectares | ||||||
| Northland | 7,554 | 656,600 | 3,651 | 24,805 | 89,548 | 774,604 |
| Auckland | 7,983 | 268,286 | ..S | 20,363 | 26,383 | 318,311 |
| Waikato | 14,478 | 1,329,027 | 4,930 | 39,397 | 108,612 | 1,481,967 |
| Bay of Plenty | 4,020 | 254,548 | 2,595 | 13,564 | 41,434 | 312,140 |
| Gisborne | 1,092 | 375,723 | 3,099 | 27,304 | 48,848 | 454,974 |
| Hawke's Bay | 2,988 | 795,663 | 7,065 | 47,447 | 71,726 | 921,901 |
| Taranaki | 5,898 | 430,042 | ..S | 17,630 | 76,832 | 525,511 |
| Manawatu-Wanganui | 7,560 | 1,374,106 | 3,554 | 40,602 | 128,240 | 1,546,501 |
| Wellington | 3,540 | 444,767 | 2,023 | 20,729 | 55,013 | 522,532 |
| Total North Island | 55,104 | 5,928,762 | 31,203 | 251,841 | 646,635 | 6,858,441 |
| Tasman | 1,965 | 151,275 | 4,600 | 11,598 | 38,516 | 205,989 |
| Nelson | 111 | 5,819 | ..C | ..C | 2,183 | 8,955 |
| Marlborough | 1,419 | 550,596 | 6,122 | 21,203 | 110,665 | 688,586 |
| West Coast | 1,287 | 184,314 | 421 | 36,317 | 38,540 | 259,591 |
| Canterbury | 10,581 | 3,318,433 | 9,586 | 35,411 | 222,761 | 3,586,191 |
| Otago | 5,073 | 2,516,453 | 1,174 | 68,397 | 96,022 | 2,682,047 |
| Southland | 4,791 | 1,158,632 | 567 | 21,017 | 54,607 | 1,234,822 |
| Chatham Islands | 39 | 48,995 | ..C | ..C | 11,174 | 60,405 |
| Total South Island | 25,272 | 7,934,517 | 22,489 | 195,113 | 574,467 | 8,726,586 |
| Total New Zealand | 80,376 | 13,863,279 | 53,692 | 446,954 | 1,221,103 | 15,585,027 |
Statistics New Zealand's Agriculture Production Account is a statistical series that provides a summary of the activities of all market-oriented establishments classified under agricultural and livestock production or agricultural services. Table 18.4 sets out recent annual figures from the account. All types of farms are included, together with agricultural services operated by contractors, such as topdressing, weed spraying, harvesting, threshing, shearing and scrub cutting. Other services included are herd testing and artificial insemination. Farms operated as trading enterprises by government departments and other organisations are included. The account includes all income derived from the activities of the establishments covered, including their characteristic farming activities, and also their other productive activities. However, investment income (such as dividends and interest) accruing to proprietors is excluded. Figure 18.2 shows New Zealand's agricultural production by commodity.
Table 18.4. Agriculture Production Account: analysis of intermediate consumption
| Item | Year ended March | ||||
|---|---|---|---|---|---|
| 1994 | 1995 | 1996 | 1997P | 1998P | |
1This series does not measure total capitalised development. P = provisional Note:Some figures have been revised. Source: Statistics New Zealand | |||||
| $(million) | |||||
| Purchase of livestock | 815 | 581 | 416 | 689 | 1,136 |
| Feed and grazing | 480 | 532 | 577 | 580 | 598 |
| Animal health and breeding | 379 | 368 | 381 | 407 | 399 |
| Weed and pest control | 175 | 174 | 168 | 180 | 190 |
| Fertiliser, lime and seeds | 827 | 770 | 829 | 878 | 894 |
| Fuel and power | 342 | 378 | 313 | 317 | 336 |
| Repairs and maintenance | 776 | 673 | 688 | 660 | 696 |
| Freight | 154 | 154 | 146 | 147 | 160 |
| Other (nec) | 1,973 | 1,969 | 1,890 | 1,736 | 1,772 |
| Subtotal | 5,922 | 5,600 | 5,407 | 5,594 | 6,182 |
| Less capitalised development1 | 25 | 23 | 22 | 23 | 16 |
| Total intermediate consumption | 5,897 | 5,577 | 53,85 | 5,571 | 6,166 |
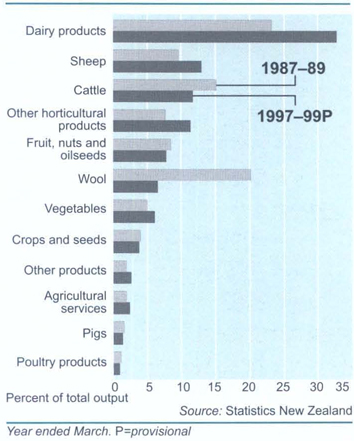 ->
->Table 18.5 shows recent annual values of gross agricultural production by commodity.
Table 18.5. Gross agricultural production
| Commodity | Year ended March | ||||
|---|---|---|---|---|---|
| 1994 | 1995 | 1996 | 1997P | 1998P | |
1Wool output has been revised due to changes in wool stocks methodology. 2Other products nec have been revised due to timber stock changes now being recorded separately and a revision of timber sales figures. 3Revisions have occurred to stock changes as a result o/ methodology updates. 4Non-farm income category, introduced in July 1994. includes rental, income from farm-stays etc. P = provisional Note:Some figures have been revised. Source: Statistics New Zealand | |||||
| $(million) | |||||
| Wool1 | 702 | 951 | 774 | 652 | 696 |
| Sheep | 1,216 | 1,102 | 1,014 | 1,293 | 1,364 |
| Cattle | 1,531 | 1,379 | 1,174 | 951 | 1,260 |
| Pigs | 147 | 140 | 142 | 133 | 138 |
| Dairy products | 2,584 | 2,593 | 3,245 | 3,323 | 3,210 |
| Poultry products | 97 | 112 | 99 | 97 | 94 |
| Crops and seeds | 361 | 312 | 359 | 413 | 340 |
| Fruit, nuts and oilseeds | 591 | 736 | 671 | 731 | 685 |
| Vegetables | 506 | 577 | 564 | 543 | 579 |
| Other horticulture products | 208 | 229 | 220 | 219 | 231 |
| Agriculture services | 966 | 898 | 1,121 | 1,129 | 1,120 |
| Other products nec2 | 220 | 205 | 286 | 255 | 261 |
| Value of change in stocks3 Sheep | 9 | -49 | -47 | -4 | -69 |
| Cattle | 412 | 249 | 41 | 58 | -47 |
| Pigs, deer and goats | 29 | -24 | -12 | 66 | 85 |
| Timber | 53 | 43 | 41 | 44 | 46 |
| Sales of live animals | 887 | 624 | 455 | 710 | 1,145 |
| Non-farm income4 | 180 | 199 | 183 | 187 | 190 |
| Gross output | 10,698 | 10,276 | 10,332 | 10,799 | 11,327 |
The farm expenses price index measures price changes of fixed inputs of goods and services to the farming industry. A selection of the published indexes is shown in tables 18.6 and 18.7. Capital expenditure and depreciation are not covered.
For price indexes of capital expenditure, refer to the capital goods price index in Chapter 26: Prices.
Farm type indexes from the farm expenses price index are also used in the agricultural inputs of the producers price index in Chapter 26: Prices.
Table 18.6. Farm expenses price index – all farms1
| Input type | Percentage of base expenditure | Price index for quarter ended | ||||
|---|---|---|---|---|---|---|
| 2000 Jun | Sep | Dec | 2001 Mar | Jun | ||
1Base: December quarter 1992 (=1000). Source: Statistics New Zealand | ||||||
| Administration | 4.9 | 1202 | 1211 | 1216 | 1226 | 1240 |
| Animal health and breeding | 4.1 | 1096 | 1107 | 1129 | 1155 | 1162 |
| Dairy shed expenses | 0.5 | 1105 | 1078 | 1133 | 1191 | 1194 |
| Electricity | 1.6 | 1108 | 1127 | 1115 | 1115 | 1113 |
| Feed, grazing, cultivation and harvesting | 7.6 | 1093 | 1114 | 1147 | 1177 | 1249 |
| Fertiliser, lime and seeds | 9.2 | 929 | 943 | 964 | 1031 | 1037 |
| Freight | 1.9 | 892 | 901 | 937 | 940 | 953 |
| Fuel | 3.8 | 1159 | 1297 | 1434 | 1253 | 1272 |
| Insurance premiums | 1.7 | 1091 | 1098 | 1101 | 1107 | 1131 |
| Rent and hire | 2.2 | 1421 | 1424 | 1443 | 1449 | 1456 |
| Repairs, maintenance, motor vehicle repairs | 10.3 | 1102 | 1110 | 1136 | 1148 | 1158 |
| Packaging costs | 3.5 | 891 | 889 | 891 | 886 | 890 |
| Shearing | 3.7 | 1259 | 1229 | 1251 | 1258 | 1268 |
| Weed and pest control | 2.9 | 1097 | 1093 | 1097 | 1123 | 1131 |
| Livestock purchases | 10.7 | 1179 | 1229 | 1335 | 1443 | 1555 |
| Subtotal excluding livestock | 57.9 | 1081 | 1103 | 1130 | 1140 | 1158 |
| Subtotal including livestock | 68,6 | 1096 | 1123 | 1162 | 1187 | 1220 |
| Local and central government | ||||||
| Rates and fees | 3.6 | 1176 | 1176 | 1182 | 1182 | 1182 |
| Interest rates | 17.3 | 838 | 859 | 864 | 850 | 838 |
| Wages and salaries | 10.5 | 1101 | 1106 | 1111 | 1118 | 1128 |
| All inputs excluding livestock | 89.3 | 1040 | 1059 | 1079 | 1083 | 1094 |
| All inputs including livestock | 100 | 1055 | 1077 | 1106 | 1122 | 1143 |
Table 18.7. Farm expenses price index1
| Quarter | Sheep and beef farms | Dairy farms | Horticultural farms | Cropping and other farms | All farms |
|---|---|---|---|---|---|
1All inputs excluding livestock. Prices used exclude GST. Base: December quarter 1992 (=1000). Source: Statistics New Zealand | |||||
| 1999 Jun | 1008 | 1006 | 998 | 1028 | 1008 |
| 1995–Sep | 1009 | 1004 | 997 | 1033 | 1008 |
| 1995–Dec | 1018 | 1011 | 1005 | 1040 | 1016 |
| 2000 Mar | 1031 | 1024 | 1015 | 1051 | 1028 |
| 1995–Jun | 1043 | 1036 | 1027 | 1060 | 1040 |
| 1995–Sep | 1067 | 1053 | 1039 | 1074 | 1059 |
| 1993–Dec | 1088 | 1073 | 1052 | 1098 | 1079 |
| 2001 Mar | 1092 | 1081 | 1052 | 1106 | 1083 |
| 1995–Jun | 1102 | 1096 | 1060 | 1114 | 1094 |
New Zealand remains a world leader in agricultural research, reflecting the importance of agriculture to the country. There are also a broad range of administrative and special interest organisations in the sector; a network of local, regional and national farmer associations to advance the interests of the industry; growers and livestock breeders' associations; produce marketing authorities; and others.
Ministry of Agriculture and Forestry (MAF). On 1 March 1998, the Ministry of Agriculture and the Ministry of Forestry merged into a new Ministry of Agriculture and Forestry: Te Manatu Ahuwhenua, Ngaherehere. Its mission is to help the government create an environment allowing the food, fibre and timber industries to make the best contribution to sustainable economic growth and environmental quality, while managing both resources and risks to human, animal and plant health.
MAF Policy advises the government on policies and legislation affecting agriculture and forestry. There are five directorates: international policy; biosecurity policy; sector performance; sustainable resource use; and policy information. MAF Policy also contributes to and comments on relevant policies and positions being developed by other departments, represents government policy, both domestically and internationally, and provides information to promote and facilitate sustainable resource use practices and agricultural and forestry development on Maori land.
The Biosecurity Authority and the Food Assurance Authority. In 1999, the Ministry of Agriculture and Forestry's Regulatory Authority was separated into the Biosecurity Authority and the Food Assurance Authority. The Biosecurity Authority manages risks to plant and animal health. It has four units: animal biosecurity; animal welfare; plant biosecurity; and forests biosecurity. The Food Assurance Authority sets standards for primary production and the processing of meat, game and dairy products for both domestic and export markets. There are seven units: animal products; dairy and plant products; agricultural compounds and veterinary medicine; compliance and investigation; programme development; policy coordination; and business services.
MAF Operations. MAF Operations has three subgroups:
The Quarantine Service provides inspection and clearance services for incoming passengers, cargo and vessels or aircraft, and identifies and protects against potential biosecurity risks; ensures that import and export health standards are complied with; and maintains capability to respond to exotic diseases and pests.
The Verification Agency validates inspection processes; verifies and certifies export and domestic meat and meat by-products, dairy products, seafood and seafood by-products, plants and petfood; and certifies food preparation, packing and storage facilities.
The New Zealand Animal Health Reference Laboratory and Exotic Disease Control Centre at Wallaceville has responsibility for national reference and diagnostic services, and management and contingency planning of responses to exotic diseases and pests.
Asure New Zealand Ltd and AgriQuality New Zealand Ltd. These state-owned enterprises replaced MAF Quality Management in November 1998 and target specific areas of MAF's business, while MAF retains control of regulatory functions and the certification process. Asure New Zealand Ltd provides frontline meat inspection services, solutions to food safety issues and other services to the meat processing industry. AgriQuality New Zealand Ltd provides services covering farm quality and animal health, quality assurance for food products, and biosecurity and food safety services. Health surveillance and emergency disease and pest response, as well as border quarantine control, are the types of functions retained by MAF.
Pastoral agriculture is practised throughout New Zealand, with beef cattle predominating in the Far North, dairying in Waikato and Taranaki, and sheep farming with cattle in the hills in the south of the North Island. In the South Island, sheep farming (both intensive and extensive) is the main form of pastoral agriculture with a sprinkling of beef cattle farmed in the high and hill country and wetter flat areas. An increasing amount of dairying is carried out on the flat land of Southland, Canterbury and Otago where irrigation is possible.
New Zealand livestock are predominantly grass-fed, but feeding of natural, grass-based supplements such as hay and silage occurs in winter and during very dry periods. Grass growth is seasonal, largely dependent on location and climatic fluctuations, but normally occurs in the spring and autumn. Feed surpluses are harvested and stored for feeding out during winter or in time of feed shortages. Stock is grazed in paddocks, often with movable electric fencing, which allows rotation of grazing. Lambing and calving are carefully managed to take full advantage of spring grass growth. A few feed-lot units have been built in recent years to produce table beef for export.
Probably New Zealand's best known statistic was that it had more than 20 times as many sheep as people. As at 30 June 2001, however, the ratio had dropped to 11.5. Climatic conditions, soil types and contours determine stocking rates for farms. Finishing sheep and beef land in both islands carry around 11 to 12 stock units per hectare, while South Island high country farms average around one stock unit per hectare. The average dairy farm carries 2.5 cows per hectare at peak milk.
Trends in livestock numbers are largely determined by world market prices for farm products, including meat, wool, dairy products and, more recently, venison and goat fibre. The sheep population has declined from 70.3 million at June 1982 to around 44 million at June 2001. The beef cattle population fell 5 percent in the same period to 5 million. The number of dairy cattle at June 2001 totalled 4.73 million, up 1.72 million on the June 1982 total. Table 18.8 shows distribution of livestock throughout the country.
Table 18.8. Distribution of livestock, as at 30 June 1999
| Regional council | Total dairy cattle | Total beef cattle | Total sheep | Total deer | Total Pigs | Total goats |
|---|---|---|---|---|---|---|
C = an estimate that has been suppressed for reasons of respondent confidentiality Source: Statistics New Zealand, Agriculture Production Survey for the year ended 30 June 1999 | ||||||
| Northland | 386,640 | 543,395 | 583,770 | 27,557 | 6,962 | 15,791 |
| Auckland | 131,967 | 178,716 | 478,793 | 29,346 | 17,442 | 11,383 |
| Waikato | 1,503,208 | 679,406 | 2,865,674 | 153,651 | 67,130 | 32,407 |
| Bay of Plenty | 346,255 | 119,084 | 496,237 | 71,618 | 5,294 | 14,148 |
| Gisborne | 5,765 | 280,676 | 1,608,006 | 25,113 | 3,574 | 2,520 |
| Hawke's Bay | 44,852 | 542,003 | 4,501,563 | 109,489 | 4,551 | 12,797 |
| Taranaki | 608,315 | 122,966 | 816,819 | 14,427 | 25,188 | 6,785 |
| Manawatu-Wanganui | 329,325 | 751,898 | 6,955,560 | 149,948 | 32,425 | 8,978 |
| Wellington | 97,284 | 181,889 | 2,270,704 | 26,441 | 13,989 | 5,699 |
| Total North Island | 3,453,611 | 3,400,032 | 20,577,127 | 607,589 | 176,556 | 110,508 |
| Tasman | 74,216 | 57,322 | 433,680 | 35,227 | 1,254 | 6,767 |
| Nelson | ..C | 1,844 | 12.997 | ..C | ..C | ..C |
| Marlborough | 33,018 | 85,018 | 943,977 | 21,110 | 14,301 | 5,432 |
| West Coast | 120,992 | 52,364 | 103,837 | 34,244 | 1,496 | 910 |
| Canterbury | 275,305 | 515,657 | 9,217,644 | 432,737 | 148,291 | 40,217 |
| Otago | 124,690 | 292,449 | 7,569,022 | 151,052 | 24,344 | 13,432 |
| Southland | 232,966 | 229,830 | 6,738,097 | 393,371 | 2,602 | 7,156 |
| Chatham Islands | ..C | 9,190 | 83,510 | ..C | ..C | ..C |
| Total South Island | 862,798 | 1,243,673 | 25,102,764 | 1,069,199 | 192,331 | 75,882 |
| Total New Zealand | 4,316,409 | 4,643,705 | 45,679,891 | 1,676,788 | 368,887 | 186,390 |
Goats. Goats are farmed commercially in New Zealand for their milk, mohair and meat production, as well as for weed control. Goat numbers have declined in recent years, but niche markets for milk products and fibres have been developed.
Sheep. The major sheep breed in New Zealand is the Romney, an English breed that is run mainly in the North Island and southern regions of the South Island. The Romney has been developed as a dual-purpose breed, carried for both meat and wool production. The Romney has been cross-bred with such breeds as the coarse-woolled Border Leicester and, more recently, the East Friesian, Finn and Texel to get hybrid vigour and better meat production. After the Romney, the Coopworth, Corriedale and Perendale are the most common breeds. Corriedale and half-bred sheep are mainly farmed in Canterbury, Marlborough and parts of Otago. Merino sheep are predominately fanned on South Island high country for their fine wool. Table 18.9 shows recent annual sheep categories figures.
Sheep grazing on fertile land at Tapanui, Southland.
Table 18.9. Sheep categories
| As at 30 June | Breeding ewes including hoggets | Other sheep | Total sheep |
|---|---|---|---|
1Changes in survey population definition introduced in 1994. 2Figures do not equate to the total due to the estimates for the components of livestock types being calculated independently from the estimates for the totals. 3Caution should he used when making comparisons between 1999 and earlier years because of changes to the survey populations. Source: Statistics New Zealand, Agricultural Production Surveys for years ended 30 June | |||
| (000) | |||
| 1990 | 42,097 | 15,755 | 57,8522 |
| 1991 | 39,833 | 15,329 | 55,1622 |
| 1992 | 38,399 | 14,169 | 52,5682 |
| 1993 | 36,638 | 13,661 | 50,2982 |
| 19941 | 35,754 | 13,618 | 49,4662 |
| 1995 | 34,999 | 13,818 | 48,8162 |
| 1996 | 34,392 | 13,002 | 46,3692 |
| 19993 | 32,333 | 13,446 | 47,394 |
Beef cattle. The major beef cattle breeds in New Zealand are the Angus and the Hereford. Approximately 75 percent of beef numbers are located in the North Island, with 25 percent of the beef herd run on small non-commercial farms.
Dairy cattle. The major dairy cow breed in New Zealand is the Holstein-Friesian, followed by the Jersey. Eighty percent of the dairy herd is in the North Island, with 55 percent located in the Waikato-Bay of Plenty area and regions further north. Table 18.10 shows cattle categories.
Table 18.1. Cattle categories
| Category | As at 30 June | |
|---|---|---|
| 1996 | 19991 | |
1Caution should be used when making comparisons between 1999 and earlier years as the population for the Agricultural Production Surrey has changed. Source: Statistics New Zealand. Agriculture Production Surveys for the years ended 30 June 1996 and 1999 | ||
| Dairy cows and heifers in milk or calf | 3,219,546 | 3,337,486 |
| Dairy cows and heifers not in milk or calf | 182,158 | 170,227 |
| Dairy heifer yearlings and calves (including bobby) | 730,994 | 769,039 |
| Dairy bulls for breeding | 32,400 | 39,657 |
| Total dairy | 4,165,098 | 4,316,409 |
| Beef cows and heifers bred from | 1,595,548 | 1,457,413 |
| Beef cows and heifers not bred from | 527,855 | 522,104 |
| Bulls – all ages | 548,201 | 841,287 |
| Other beef cattle | 2,180,575 | 1,822,901 |
| Total beef cattle | 4,852,179 | 4,643,705 |
| Total cattle | 9,017,277 | 8,960,114 |
Deer. Deer fanning in New Zealand has developed since the early 1970s to become an important livestock industry. As venison finds a ready overseas market, most of the meat produced is exported. In the year to 30 June 2001, 28,740 tonnes of chilled and frozen venison, valued at $230 million, were exported, compared with 22,300 tonnes, worth $157 million, in 2000. Most venison is exported to Germany, Belgium and the United States, but New Zealand has developed more than 50 export markets.
In recent years, elk from Canada and deer from Europe have been imported to cross with New Zealand's red deer. Deer farming is generally permitted in most regions, but some species may be farmed in specified areas only. Red, Wapiti and fallow deer are the predominant fanned species. There are currently around 2.6 million deer in New Zealand.
Figure 18.3 shows livestock numbers from 1961 to 1999, while Figure 18.4 shows meat production from 1988 to 2001.
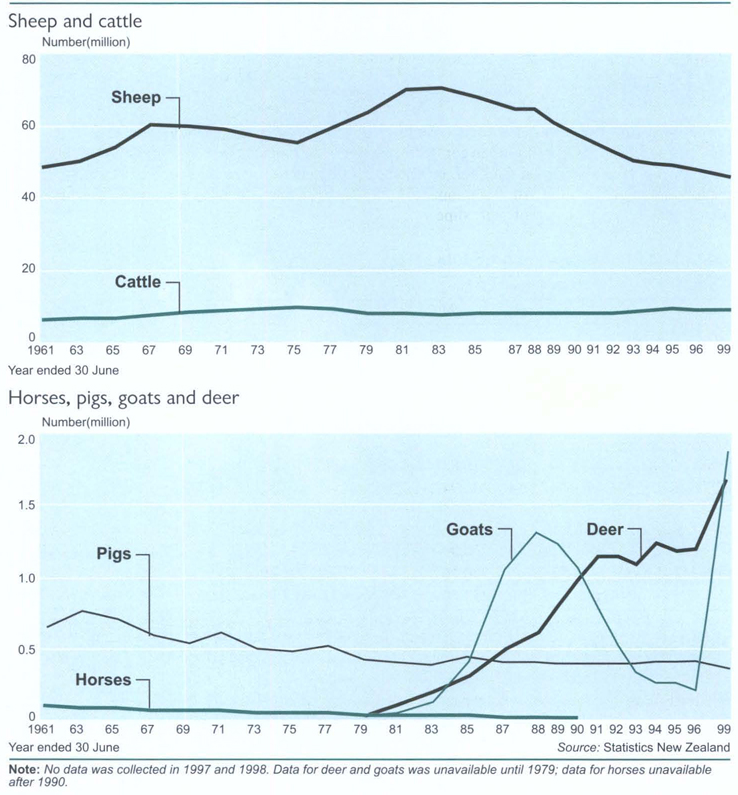
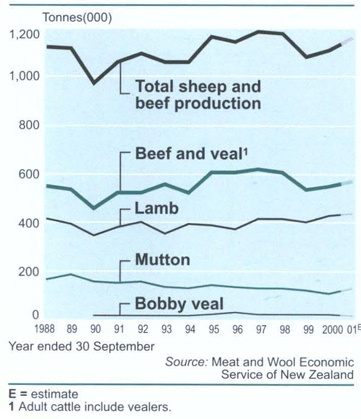
Meat products are New Zealand's second largest export income earner behind dairy products. Meat exports accounted for 14 percent of total New Zealand produced merchandise exports in the year to 1 July 2001. New Zealand's main meat exports are lamb, mutton and beef. Approximately 92 percent of lamb, 77 percent of mutton and 80 percent of beef produced in New Zealand was exported overseas in the year ended 30 September 2000. Increasingly, lamb exports are further processed as high value bone-in cuts. Mutton tends to be exported as boneless cuts and carcass product, and beef as boneless cuts. The domestic market takes all pigmeat and poultry produced in New Zealand.
Lamb – a young sheep under 12 months of age, or one that does not have any permanent incisor teeth in wear.
Hogget – a young male sheep, or maiden ewe having no more than two permanent incisors in wear.
Ram – an adult uncastrated male sheep having more than two permanent incisors in wear.
Mutton – ewes and castrated males (wethers) with more than two permanent incisors in wear. A wether must not show any ram characteristics.
Steers, heifers, cows and bulls – A steer is a male bovine castrated when young. A heifer is a female bovine, which has no more than six permanent incisors. Cows have more than six permanent incisors. A bull is an entire bovine with masculine characteristics.
Bobby calves – Bobby veal carcasses are derived from milk-fed bovine calves generally less than two weeks of age.
Veal – Veal is no longer an export meat type, as numbers are now insignificant. Previously, veal was defined as maiden female, castrated male, or entire males (not showing masculine characteristics) up to 14 months of age.
A compulsory standard system of classifying export meat on animal type, including maturity, sex, fat content and muscling, has been in use in New Zealand for many years. The Meat Board Act 1997 allowed for the replacement of mandatory beef and sheepmeat classification with a voluntary carcass description from 1 October 1999. A significant number of companies have chosen to retain the Meat New Zealand-developed system, now audited by Asure New Zealand Ltd on a voluntary basis, although some plan to develop their own system in the medium to long term.
Figure 18.5 shows the volume of meat exports from 1988 to 2001.
Some meat processors publish their schedules of stock purchase prices in the weekly Agrifax publication, daily newspapers and in company newsletters. Producers can sell their stock on schedule, on a pool account system, on the hoof, on contract, or by auction. Season average net schedules are compiled by the Meat and Wool Economic Service and are reproduced in table 18.11. The schedule prices quoted are inclusive of pelt, slipe wool and hide payments.
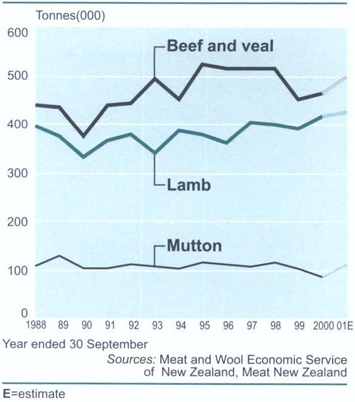
Table 18.11. Average net schedule prices
| Classification | 1992–93 | 1993–94 | 1994–95 | 1995–96 | 1996–97 | 1997–98 | 1998–99 | 1999–2000 | 2000–01P |
|---|---|---|---|---|---|---|---|---|---|
P= provisional PL = lamb, medium fat content, 9.1 to 13.2 kg: PM = lamb, medium fat content. 13.3 to 17.0 kg; YL = lamb, low fat content. 9.1 to 13.2 kg; MX1 = mutton, low fat content, under 23 kg; MX2 = mutton, low fat content, over 23 kg; P2steer = steer, light to medium fat content: M cow = manufacturing with under 4 mm fat depth; M bull = manufacturing with under 3 mm fat depth; 1Includes skin and one kilogram wool pull. Source: Meat and Wool Economic Service: red meat production | |||||||||
| Lamb (S/head)1 | |||||||||
| PL 9.1–13.2kg | 31.96 | 35.23 | 26.83 | 27.28 | 31.39 | 27.94 | 25.90 | 33.54 | 40.38 |
| PM 13.3–17.0kg | 41.08 | 41.32 | 34.59 | 38.01 | 43.98 | 39.53 | 41.44 | 48.67 | 62.74 |
| YL 9.1–13.2kg | 31.79 | 34.01 | 26.07 | 26.61 | 31.38 | 27.85 | 25.98 | 33.50 | 41.44 |
| Mutton (S/head)1 | |||||||||
| MX1 < 23kg | 26.34 | 26.88 | 22.58 | 24.80 | 31.53 | 28.29 | 23.54 | 25.56 | 38.23 |
| MX2 > 23kg | 31.44 | 31.94 | 25.75 | 28.18 | 36.92 | 33.57 | 27.91 | 29.92 | 46.19 |
| Beef (cents/kg) | |||||||||
| P2 steer 245.5–270kg | 300.50 | 270.90 | 213.40 | 172.20 | 176.20 | 206.80 | 241.00 | 304.50 | 356.10 |
| M cow 145.5–170kg | 221.80 | 200.10 | 157.30 | 119.80 | 139.30 | 179.10 | 199.80 | 260.90 | 317.90 |
| M bull 245.5–270kg | 291.20 | 259.50 | 210.00 | 173.10 | 181.70 | 222.90 | 256.30 | 320.90 | 361.90 |
The New Zealand production season runs from 1 October to 30 September. New Zealand accounts for one percent of global beef and veal production, and 7 percent of global lamb and mutton production.
The 2000/01 farming year was, for a third successive year, dominated by La Nina summer patterns. Storms from mid-September resulted in losses on later lambing and calving properties. Drought conditions developed in the east of the South Island and lower North Island early in 2001. Rainfall was particularly low from February to April 2001. Demand for supplementary feed and grazing land increased, and some destocking of farms was needed to ease pressure on feed shortages. Cold, frosty weather in early winter reduced the chance for much needed pasture growth. Table 18.12 shows recent annual meat production volumes.
Table 18.12. Meat production1
| Carcasses | Year ended September | ||||||||
|---|---|---|---|---|---|---|---|---|---|
| 1992 | 1993 | 1994 | 1995 | 1996 | 1997 | 1998 | 1999 | 2000P | |
1Inspected meal production at meat export works and abattoirs. P = provisional R = revised Source: Ministry of Agriculture and Forestry | |||||||||
| Tonnes (000) | |||||||||
| Beef | 522 | 558 | 523 | 606R | 606 | 620 | 609 | 538 | 557 |
| Veal | 14 | 14 | 14 | 23 | 27 | 26 | 25 | 23 | 20 |
| Mutton | 158 | 134 | 125 | 144 | 134 | 124 | 129 | 117 | 106 |
| Lamb | 400 | 352 | 398 | 389 | 375 | 419 | 416 | 400 | 428 |
| Pigmeat | 47 | 49 | 49 | 51 | 50 | 48 | 48 | 48 | 46 |
| Total | 1,141 | 1,107 | 1,109 | 1,216R | 1,192 | 1,237 | 1,227 | 1,126 | 1,157 |
Meat New Zealand, the operational name for the New Zealand Meat Board, exists primarily to further the interests of New Zealand's meat producers. The board does not buy or sell meat. Funded by producers through a levy on stock slaughtered (see table 18.13), the board works to ensure that its levypayers obtain the best possible long-term return on their investment. On their behalf, it is involved in market access, market development and international promotion, and provides market support through offices in Wellington, Brussels, London, Tokyo, Washington and Seoul. It is also involved in commissioning or funding research and development activities, with a major focus on on-farm activities designed to help livestock farmers increase the profitability of their farms. Meat New Zealand provides funding for a number of organisations, including the beef, sheep and goat councils, and provides partial funding for the New Zealand Beef and Lamb Marketing Bureau and The Economic Service.
Table 18.13. Meat New Zealand levies, 1 October 2000
| Class of meat | Cents per head1 |
|---|---|
1Excluding GST. Source: Meat and Wool Economic Service | |
| Lambs, sheep and goats | 40 |
| Bobby calves | 20 |
Figure 18.6 shows changes in meat consumption between 1991 and 2000.
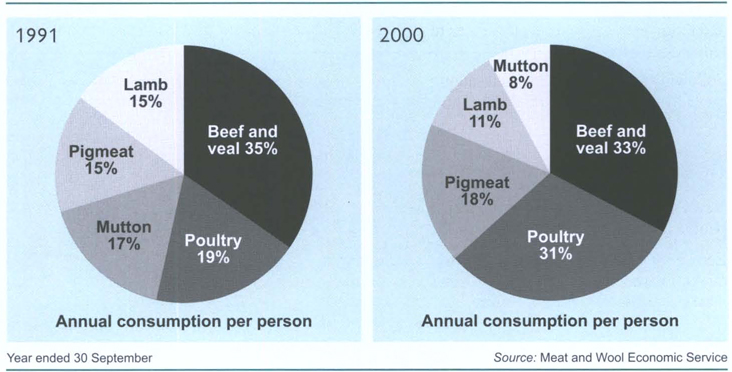
New Zealand beef and lamb is sold overseas by around 300 companies fully licensed by Meat New Zealand. New Zealand is a major exporter of sheepmeat, accounting for 51 percent of the world export trade. New Zealand's major sheepmeat markets are the United Kingdom, Germany. France, North America and the Middle East.
Compared with sheepmeat, New Zealand is a smaller player in the global market for beef, accounting for 8 percent of all world beef exports. North America and Asia (Japan, Taiwan, Hong Kong, Korea, Singapore and Malaysia) are the major markets for beef and veal. Table 18.14 shows the number of livestock slaughtered at meat export works, while table 18.15 shows export meat production by shipping weight.
Table 18.14. Livestock slaughter at meat export works and abattoirs1
| Animals | Year ended September | ||||||||
|---|---|---|---|---|---|---|---|---|---|
| 1992 | 1993 | 1994 | 1995 | 1996 | 1997 | 1998 | 1999 | 2000P | |
P = provisional 1Excludes condemned carcasses. Source: Ministry of Agriculture and Forestry | |||||||||
| head of stock (000) | |||||||||
| Lambs | 28,020 | 23,342 | 26,174 | 26,646 | 24,680 | 26,402 | 27,024 | 24,472 | 26,010 |
| Sheep | 7,682 | 6,564 | 5,796 | 6,824 | 6,280 | 5,555 | 5,761 | 5,136 | 4,505 |
| Adult cattle | 2,133 | 2,260 | 2,042 | 2,410 | 2,436 | 2,424 | 2,462 | 2,219 | 2,168 |
| Calves and vealers | 780 | 793 | 814 | 1,237 | 1,389 | 1,387 | 1,381 | 1,290 | 1,109 |
| Pigs | 807 | 817 | 822 | 846 | 813 | 772 | 775 | 765 | 713 |
Table 18.15. Export meat production
| Year ended September | 1994 | 1995 | 1996 | 1997 | 1998 | 1999 | 2000 |
|---|---|---|---|---|---|---|---|
Source: Meat and Wool Economic Service | |||||||
| Tonnes shipping weight | |||||||
| Lamb | 302,715 | 288,818 | 277,264 | 298,550 | 291,210 | 281,711 | 289,800 |
| Mutton | 59,155 | 74,473 | 70,939 | 58,505 | 63,260 | 57,585 | 45,933 |
| Beef | 300,494 | 347,215 | 333,076 | 339,204 | 324,611 | 304,341 | 315,212 |
| Bobby veal | 6,725 | 12,308 | 13,971 | 13,250 | 13,507 | 12,933 | 10,876 |
| Goat | 1,579 | 1,677 | 1,167 | 1,567 | 1,405 | 1,406 | 945 |
| Variety meats | 41,947 | 52,853 | 52,324 | 50,021 | 50,782 | 49,016 | 54,995 |
| Inedible meats and offal | 18,045 | 17,167 | 7,734 | 15,878 | 22,639 | 21,337 | 20,362 |
| 730,660 | 794,511 | 756,475 | 776,975 | 767,414 | 728,329 | 738,123 | |
Lamb exports totalled 289,800 tonnes (shipped weight) in the 1999/2000 season, an increase of 8,089 tonnes on the previous season.
Shipments increased to each of the five main markets. The United Kingdom took 70,323 tonnes, followed by Germany (22,630 tonnes), France (19,387 tonnes), Saudi Arabia (19,275 tonnes) and the United States (17,195 tonnes).
Total mutton exports decreased 11,652 tonnes in the 1999/2000 season to 45,933 tonnes shipped weight.
The United Kingdom remained the largest single market for mutton, taking 12,457 tonnes. Germany (6,838 tonnes), Taiwan (4,422 tonnes), Malaysia (3,016 tonnes) and South Africa (2,854) were the next largest markets.
Under the GATT Uruguay Round Agreement, New Zealand's sheepmeat exports to the European Union are limited by a tariff rate quota of 266,700 tonnes.
In July 1999, the United States imposed temporary tariffs and quotas on all lamb imports from New Zealand and Australia for a three-year period. The quota for the first year was set at 14,500 tonnes, with a tariff of 9 percent within that quota and a 40 percent tariff out-of-quota. In the second and third years, the in-quota tariff was to reduce to 6 and then 3 percent, with the out-of-quota tariff reducing to 32 then 24 percent.
Following a World Trade Organisation ruling, the United States agreed to terminate the tariff and quota system in November 2001. The United States has grown to become New Zealand's fourth largest lamb market by value.
New Zealand's biggest market for beef and veal in the 1999/2000 season remained the United States, with shipments up 30,000 tonnes on the previous year to 221,553 tonnes.
Beef shipments to Canada declined from 28,923 tonnes in 1998/99 to 13,978 tonnes in 1999/2000 due to increased competition from South American exporters. Canada remained the second largest market, however, closely followed by Japan (13,309 tonnes) and Taiwan (11,449 tonnes).
The International Meat Trade Association in the United Kingdom compiles a weekly London wholesale meat price list. The London wholesale prices in table 18.16 are an indicator of price trends, but are not as important as they used to be because the majority of New Zealand's lamb is now exported as frozen and chilled cut, or boneless product, rather than in carcass form.
Table 18.16. London wholesale lamb prices
| Mid-month March | P class | Y class | |||
|---|---|---|---|---|---|
| PL class 9–12.5kg | PM class 13–16kg | PX class 16.5–20kg | YL class 9–12.5kg | YM class 13–16kg | |
Source: Meat and Wool Economic Service; International Meat Trade Association Inc | |||||
| Pence per kilogram | |||||
| 1994 | 194.0 | 191.8 | 178.6 | 194.0 | 191.8 |
| 1995 | 160.9 | 164.2 | 163.1 | 158.7 | 163.1 |
| 1996 | 167.5 | 167.5 | 164.2 | 162.0 | 165.3 |
| 1997 | 209.4 | 209.4 | 205.0 | 203.9 | 208.3 |
| 1998 | 165.3 | 162.0 | 156.5 | 163.1 | 162.0 |
| 1999 | 152.1 | 147.7 | 145.5 | 149.9 | 147.7 |
| 2000 | 169.8 | 170.9 | 172.0 | 167.5 | 169.8 |
| 2001 | 213.8 | 207.2 | 202.8 | 213.8 | 207.2 |
Table 18.17 gives a measure of New Zealand exported beef prices, derived from Meat New Zealand's weekly price series for imported manufacturing beef to the United States.
Table 18.17. United States cif beef prices
| Mid-month March | Manufacturing bull | Manufacturing cow |
|---|---|---|
cif = cost including insurance and freight Source: Meat and Wool Economic Service | ||
| US cents per kilogram | ||
| 1994 | 285.3 | 282.0 |
| 1995 | 215.9 | 209.3 |
| 1996 | 176.2 | 165.2 |
| 1997 | 220.3 | 208.2 |
| 1998 | 198.3 | 182.8 |
| 1999 | 198.3 | 184.0 |
| 2000 | 215.9 | 202.7 |
| 2001 | 229.1 | 207.1 |
New Zealand sheep are largely dual-purpose wool/meat animals and their wool is predominantly strong. New Zealand is the world's largest producer of crossbred (strong) wool. This type of wool is used mainly in interior textiles, such as carpets, upholstery, furnishings, bedding and rugs. It is also used for hand-knitting yarn, in knitwear and in blankets.
It is estimated that, worldwide, 42 percent of New Zealand wool is used in machine-made carpets, 10 percent in hand-knotted and hand-tufted carpets, 39 percent in apparel, and 9 percent in other uses, primarily upholstery and bedding. Uses vary markedly from country to country. Net domestic consumption of wool in New Zealand is among the highest in the world on a per head basis.
Wool production. Although New Zealand's sheep flock ranks fifth largest in the world, the country's total wool fibre production is second only to Australia on a clean mass basis. This is due to the high clip yield per head and lower quantities of grease and other contaminants in New Zealand wool.
Table 18.18 gives recent annual wool production figures and average auction prices.
Table 18.18. Wool production1
| Season ended 30 June | Flock size2 | Yield/head | Total wool production (clean) | Average auction price (clean basis) |
|---|---|---|---|---|
1Wool quantities are measured at point of sale rather than at source, and are therefore not strictly measures of production. In 2000 and 2001 no account is taken of changes in grower-owned stocks of wool held in the likes of brokers stores. 2Flock size as at the beginning of the season. Source: WoolPro | ||||
| million | kg | tonnes (000) | cents/kg | |
| 1994 | 50.3 | 5.6 | 214 | 414 |
| 1995 | 49.5 | 5.8 | 213 | 554 |
| 1996 | 48.8 | 5.5 | 199 | 494 |
| 1997 | 47.4 | 5.8 | 203 | 443 |
| 1998 | 46.8 | 5.7 | 197 | 449 |
| 1999 | 46.0 | 5.5 | 185 | 408 |
| 2000 | 45.7 | 5.6 | 193 | 440 |
| 2001 | 45.4 | 5.2 | 178 | 520 |
The New Zealand Wool Board promotes the use of New Zealand wool in new and existing markets; encourages efficiencies in the preparation, handling, distribution, shipping and selling of wool; and promotes and undertakes research and development work into wool, sheep and wool products. Sheep farmers fund the New Zealand Wool Board through a two percent levy on their annual wool sales. Funds are then allocated to various business unit programmes.
The board is in the process of disestablishing itself and its functions will transfer to a mix of commercial enterprises and an incorporated society that will undertake levy-funded industry-good programmes. The wool board's website is www.woolboard.co.nz
Wool Production Technology Ltd (WoolPro). WoolPro works to improve wool quality, sheep production and on-farm efficiency. It funds new production technologies that provide New Zealand sheep farmers with information to help them improve or fine-tune their production and meet customer demand. WoolPro runs wool harvesting training programmes, and the Fernmark quality programme, the only programme in the world that assures quality throughout the wool production and supply pipeline.
The most common way of selling wool in New Zealand is by open auction and 44 percent was sold this way in the year ending 30 June 2001. The auction season runs from July to the following June and sales are held in Napier and Christchurch.
Table 18.19 lists recent annual quantities and value of wool sold at auction. The sales attract buyers from all the main wool importing countries. Private sales by growers to merchants accounted for 42 percent of sales in the year to 30 June 2001.
Table 18.19. Wool sold at auction
| Season ended June | Greasy and scoured new season wool (clean equivalent) | Average clean price per kilogram | Total sale value |
|---|---|---|---|
Source: WoolPro | |||
| tonnes (000) | cents | $(million) | |
| 1993 | 116 | 433 | 517.3 |
| 1994 | 125 | 414 | 568.3 |
| 1995 | 119 | 554 | 656.5 |
| 1996 | 107 | 494 | 520.0 |
| 1997 | 104 | 443 | 447.7 |
| 1998 | 98 | 449 | 432.3 |
| 1999 | 84 | 408 | 336.1 |
| 2000 | 81 | 440 | 353.5 |
| 2001 | 78 | 520 | 407.3 |
About 90 percent of the New Zealand clip leaves the country in greasy, scoured or slipe form, with 77 percent scoured. Of the 10 percent of the clip processed in New Zealand, roughly half is exported in product form, mainly as carpet yarn, carpets or knitted jerseys. Figure 18.7 compares wool export destinations in 1990/91 with 2000/01 destinations.
It is important to distinguish between initial and final destinations of New Zealand wool exports, as initial destinations have changed substantially over the years, and there are sometimes large changes from year to year. Export destinations for wool fibre are shown in table 18.20.
Table 18.2. Export destinations of New Zealand wool fibre
| Country | 1995–96 | 1996–97 | 1997–98 | 1998–99 | 1999–00 | 2000–01P |
|---|---|---|---|---|---|---|
P = provisional 1Commonwealth of Independent States. Source: WoolPro | ||||||
| clean tonnes | ||||||
| China | 50,864 | 40,617 | 35,548 | 25,169 | 27,350 | 29,431 |
| Italy | 4,826 | 7,240 | 8,694 | 9,854 | 12,242 | 13,063 |
| Nepal | 8,196 | 8,630 | 4,007 | 5,254 | 6,700 | 7,255 |
| United Kingdom | 17,093 | 25,040 | 27,725 | 23,859 | 25,952 | 28,895 |
| Japan | 9,898 | 11,228 | 8,855 | 9,175 | 8,185 | 8,443 |
| Belgium | 7,882 | 8,487 | 12,368 | 11,996 | 12,630 | 10,554 |
| India | 7,716 | 12,675 | 14,126 | 15,070 | 17,752 | 12,613 |
| Germany | 12,139 | 12,034 | 12,047 | 12,101 | 11,233 | 11,230 |
| Hong Kong | 16,395 | 9,521 | 9,004 | 2,572 | 2,014 | 1,492 |
| United States | 8,433 | 8,835 | 9,268 | 8,786 | 7,233 | 8,942 |
| Australia | 8,713 | 10,283 | 11,295 | 10,407 | 12,174 | 9,164 |
| CIS1 | – | – | – | 100 | 65 | 423 |
| Other | 29,535 | 30,650 | 28,653 | 25,165 | 26,408 | 23,980 |
| Total | 181,690 | 185,240 | 181,590 | 159,508 | 169,938 | 165,485 |
During 2000/01, the largest importers were China, the United Kingdom, Italy, India and Germany. Final destinations of end products made from New Zealand wool are fairly stable. Much of the wool tends to be used in the same countries as it was years ago, even though the location of early-stage processing may have changed. Countries such as the United States and West Germany use less wool fibre, but import made-up carpets from other countries. India and Nepal have emerged as large customers for New Zealand wool, mostly for processing into handknotted carpets for export to Europe and North America.
Wool product exports. The most important wool product exports from New Zealand are floor coverings and yarns, particularly carpet yarns. Carpets and rugs accounted for 26 percent of wool product export earnings in the 2000/01 financial year. Carpet yarn accounted for 25 percent and other yarn for 2 percent. Other wool-based export items included raw and processed sheepskins, tops, wool waste, blankets, fabrics, knitwear and other clothing.
Total export earnings from wool products increased 8 percent to $324.1 million in the 2000/01 financial year. These export earnings are summarised in table 18.21.
Table 18.21. Wool sector export earnings1
| Product | 1996 | 1997 | 1998 | 1999 | 2000 | 2001P |
|---|---|---|---|---|---|---|
P = provisional 1Year ended 30 June. Source: WoolPro | ||||||
| $(million) fob | ||||||
| Carpets/rugs | 72.5 | 72.9 | 71.9 | 82.4 | 93.8 | 84.7 |
| Wool yarn | 59.8 | 67.4 | 84.1 | 91.2 | 98.1 | 86.9 |
| Wool apparel | 14.9 | 21.8 | 24.4 | 23.7 | 27.2 | 30.4 |
| Sheepskin final products | 34.7 | 20.3 | 7.7 | 19.4 | 17.8 | 40.9 |
| Sheepskins – raw and processed | 57.7 | 62.4 | 53.7 | 46.1 | 34.1 | 47.3 |
| All other | 20.3 | 30.9 | 25.6 | 24.4 | 28.4 | 33.9 |
| Total | 260.0 | 275.7 | 267.4 | 287.2 | 299.4 | 324.1 |
| Wool fibre – greasy, scoured slipe | 1,034.0 | 946.6 | 911.2 | 741.0 | 801.0 | 883.8 |
| Total wool sector | 1,294.0 | 1,222.5 | 1,178.6 | 1,028.2 | 1,100.4 | 1,208.1 |
| Wool sector as percentage of total merchandise exports | 6.5 | 6.0 | 5.5 | 4.7 | 4.4 | 3.9 |
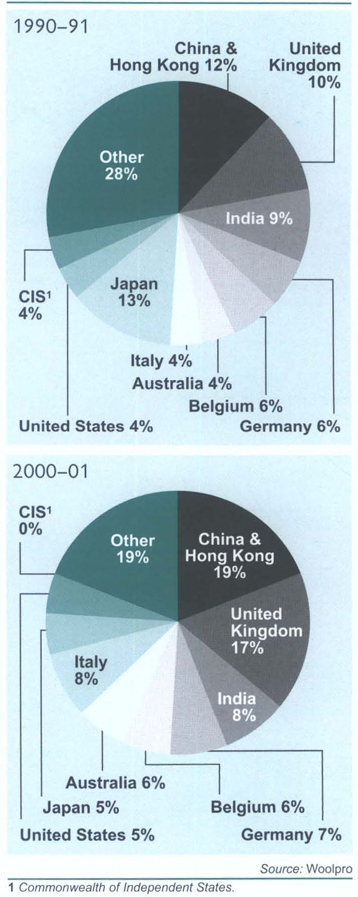
Dairy cattle grazing in Marlborough.
Dairy product exports made up 23 percent of total merchandise trade receipts for New Zealand in the year ended 30 June 2001. With the exception of milk and some dairy products for local consumption, the industry is primarily geared towards overseas markets, which account for about 93 percent of all milk produced. There are four major product groupings manufactured from liquid whole milk by dairy factories in New Zealand: milk powders such as whole milk powder, skim milk powder and buttermilk powder; cream products such as butter, anhydrous milkfat and ghee; cheese; and protein products such as casein and caseinates.
Liquid whole milk can be broken down into three chief components: milkfat, solids-non-fat (principally protein) and water. Skim milk powder is made from skim milk after the cream (milkfat) has been separated from the liquid whole milk. Whole milk powder is manufactured directly from the liquid whole milk, without separation of the cream. Buttermilk powder is made from buttermilk, a by-product of the butter manufacturing process. Most butter produced is of a ‘sweet cream’ type, and anhydrous milkfat and ghee are further refinements of butter.
The predominant cheese variety manufactured in New Zealand is cheddar or cheddar types, although the manufacture of speciality cheese types has recently shown considerable growth.
The final product grouping, milk proteins, are derived from the by-products of skim milk and also from the by-products of other dairy product manufacture such as cheese. Table 18.22 provides recent annual production quantities from dairy factories by product type.
Table 18.22. Dairy factory production
| Product | 1995–96 | 1996–97 | 1997–98 | 1998–99 | 1999–2000 | 2000–01 |
|---|---|---|---|---|---|---|
1A variety of products which fail under all the product categories. Source: New Zealand Dairy Board | ||||||
| tonnes | ||||||
| Butter | 241,537 | 291,789 | 270,929 | 232,948 | 254,639 | 257,738 |
| Anhydrous milkfat | 55,832 | 59,098 | 72,729 | 84,527 | 89,192 | 94,694 |
| Frozen cream | 8,652 | 11,069 | 4,273 | 8,198 | 4,502 | 3,526 |
| Cheese | 229,086 | 253,638 | 265,635 | 238,535 | 296,745 | 289,096 |
| Whole milk powder | 298,307 | 337,854 | 355,871 | 347,308 | 392,533 | 466,075 |
| Nutritional products | 34,869 | 36,162 | 40,522 | 34,705 | 56,184 | 49,620 |
| Skim milk powder | 172,149 | 192,267 | 177,573 | 172,611 | 186,904 | 251,421 |
| Buttermilk powder | 29,984 | 32,710 | 37,770 | 30,371 | 31,491 | 39,656 |
| Casein products | 79,157 | 92,157 | 103,659 | 86,653 | 97,229 | 95,934 |
| Lactose | 20,132 | 6,015 | 29,213 | 29,578 | 41,791 | 39,679 |
| Whey powders | 22,414 | 20,746 | 21,703 | 22,017 | 23,387 | 15,510 |
| Other1 | 40,671 | 55,667 | 61,092 | 90,019 | 124,507 | 111,414 |
At the end of the 2000/01 dairy season (31 May) there were four cooperative manufacturing dairy companies in New Zealand operating nearly 30 dairy factories. Each company was governed by a board of directors elected by supplying farmers, with the provision for the appointment of a small number of non-farmers noted for their commercial expertise. The cooperatives utilised funds supplied in the form of share capital by the farmers.
The cooperative dairy industry produces nearly all dairy products manufactured in New Zealand. On an annual basis, the companies convert approximately 13 billion litres of milk into more than 1.7 million tonnes of dairy products, of which 1.6 million tonnes is exported. The balance is consumed in the relatively small domestic market. In addition, there are approximately 20 small private dairy companies producing around 2,000 tonnes of cheese a year, plus several ice cream manufacturers.
Milk sold on the New Zealand market, known as town milk, has traditionally been produced by different farmers from those who supply dairy factories. However, in recent years some companies that have interests in both town milk and manufacturing dairy products have ceased drawing milk from separate sources. But they have offered a winter premium for town milk supplies to reflect the additional input costs in producing out-of-season milk. The majority of town milk sold in New Zealand is provided by the four cooperatives that own the New Zealand Dairy Board, although five small independent companies produce around 10 percent.
Table 18.23 shows recent annual milk production and utilisation.
Table 18.23. Milk production and utilisation
| Product | 1993–94 | 1994–95 | 1995–96 | 1996–97 | 1997–98 | 1998–99 | 1999–2000 | 2000–01 |
|---|---|---|---|---|---|---|---|---|
| Source: New Zealand Dairy Board | ||||||||
| million litres | ||||||||
| Production | ||||||||
| Total milk production | 9,023 | 8.997 | 9.774 | 10.648 | 10,929 | 10,563 | 11,860 | 12,713 |
| Utilisation | ||||||||
| Milk sent to dairy factories | 8,603 | 8,633 | 9,325 | 10,339 | 10,545 | 10,068 | 11,480 | 12,321 |
Fonterra. In recent years there has been a steady amalgamation of dairy cooperatives. In 1975 there were around 75; by the end of the 2000/01 season there were four. On 18 June 2001, more than 80 percent of the shareholders of the New Zealand Dairy Group and Kiwi Co-op Dairies (which between them supply more than 96 percent of the milk produced in New Zealand) voted to merge their companies and form the Fonterra Cooperative Group. In September 2001, parliament passed legislation that brought Fonterra into being as the country's largest company. It was the culmination of a process that had begun in December 2000 when the two companies signed an agreement, which involves the assets of the New Zealand Dairy Board being incorporated into the new company.
The Fonterra Cooperative Group is one of the world's five largest dairy companies. Its principal activities are the collection, treatment and distribution of milk and cream, and the manufacture and sale of milk powder, butter, cheese, casein and other milk products. The company is structured around two main operating divisions:
NZMP – a milk collection and processing business which oversees all components of the cow-to-consumer product chain.
New Zealand Milk – a company marketing global consumer goods.
Fonterra is owned by 13,500 New Zealand dairy farmers and has more than $12 billion in assets. It generates more than 20 percent of New Zealand's export revenues and more than 7 percent of its GDP.
New Zealand Dairy Board. The board was established under statute in 1961 as the single organisation responsible for marketing dairy produce manufactured for export. As the exporting and administrative arm of the industry, it linked manufacturing and industry growth plans with export market requirements. The board exported to more than 140 countries annually and had its own marketing network in many of these countries. With more than 95 fully-owned subsidiaries, associate companies and joint venture companies, the board was the largest dairy exporting organisation in the world, accounting for about 30 percent of international trade in dairy products.
The international market for dairy products is characterised by its small size relative to total world milk production, with only about 7 percent of production entering international trade. Because of this, the market is especially vulnerable to shifts in climatic, commercial and political forces. Marginal production changes by major producers can trigger massive shifts in supplies of, and prices for, products on the international market.
The major dairy exporters are the European Union (EU), New Zealand, Australia and, to a lesser degree, the United States and Canada. These five exporters supply about 90 percent of dairy products traded on the international market. Relatively smaller quantities are exported by the Nordic countries, Eastern Europe and Latin America.
The New Zealand dairy industry has been working to diversify its markets and product range for many years, as shown in Figure 18.8.
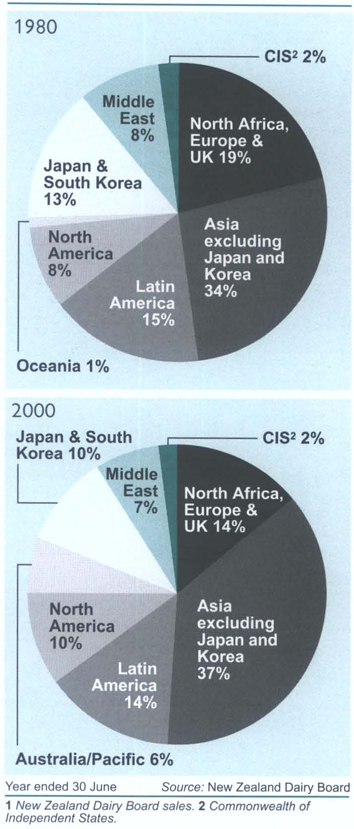
Today, major markets vary for different products, but the United Kingdom and the EU remain New Zealand's most valuable markets for butter.
The primary markets for casein and cheese are the United States, Japan, and the EU. New Zealand is the world's largest exporter of casein and caseinate products and is also moving forward in its range of other sophisticated and specialised milk protein products. These are highly specialised, high-cost products which are put to a myriad of uses, from automobile manufacture to meat processing and alcohol distillation.
The most important milk powder markets are in Central and South America and South-east Asia, but there has also been growth in skim milk powder exports to the Middle East.
Export markets 2001. Butter and skim milk powder prices fell to 10-year lows in 1999. Late in 1999, however, skim milk powder prices began a steady increase, rising by about 70 percent in just over a year. A major factor behind the increase was a reduction in European export subsidies for skim milk powder, which fell from US$900 a tonne in October 1999 to zero in June 2001. The principal reason for this was a shortage of powder within the European Union as a number of producers switched from manufacturing skim milk powder to making more cheese, in response to growing demand.
Prices for cheese, whole milk powder and casein products have also strengthened from the lows they reached in 1999.
Market conditions in South-east Asia and Latin America improved as both regions recovered from the economic downturns that affected them in 1998/99. This has led to a recovery in demand for milk powders. However, the Russian market has not recovered from the financial crisis it suffered in the late 1990s. This has been a major factor behind butter prices still being at low levels. Russia was at one stage the world's largest importer of butter. In 1996/97, New Zealand butter exports to Russia reached 80,000 tonnes (one-third of New Zealand's total butter exports). Since then, however, butter exports to Russia have fallen to a quarter of that level.
Increased milk production in New Zealand enabled exports to increase by more than 7 percent in volume terms, while improving international prices, plus the fall in the value of the New Zealand dollar, saw the value of exports increase by 45 percent in 2001.
Dairy farmers who supply the Fonterra Cooperative Group are paid for their milk based on a commercial pricing model. Under this model, dairy companies receive a price for standard products based on the international commodity price.
Four business segments have been established by Fonterra to pay companies for their products, depending on the value they have added to the product. These are: commodity products; standard products with value added from marketing; products to which both the manufacturer and the marketer add value; and speciality products.
Table 18.24 lists recent annual prices the dairy board paid to farmers for milkfat, protein and milk solids. Dairy companies pay farmers an extra sum to reflect local market sales and production efficiencies. In the 2000/01 season this extra payment averaged 41c, taking the total average payout to farmers to $5.01 per kg.
Table 18.24. Dairy board prices for milkfat, protein and milk solids
| Season ended 31 May | Milkfat component | Protein component | Milk solids |
|---|---|---|---|
| Source: New Zealand Dairy Board | |||
| cents per Kg | |||
| 1993 | 253.57 | 422.62 | 325 |
| 1994 | 198.56 | 413.66 | 290 |
| 1995 | 194.82 | 442.79 | 300 |
| 1996 | 233.70 | 531.13 | 360 |
| 1997 | 214.94 | 457.33 | 318 |
| 1998 | 205.49 | 428.09 | 300 |
| 1999 | 219.68 | 467.38 | 325 |
| 2000 | 226.46 | 481.82 | 335 |
| 2001 | 306.48 | 666.27 | 460 |
Domestic pork production in terms of the volume of meat produced and in the number of pigs slaughtered has generally been in decline in New Zealand since 1995 due to the importation of competitively-priced Canadian, Australian, American and Danish frozen pork, and relatively high feed costs. In the year ending September 2000, 713,853 pigs were slaughtered in New Zealand, a decrease of 52,655 on the previous year. The tonnage of domestic pigmeat produced dropped 2,634 tonnes to 44,984 tonnes. During the same period, New Zealand imported 20,521 tonnes (estimated on a carcass weight basis) of pork products, an increase of 18 percent on the previous year. Consumption of imported and domestic pigmeat products was 17.3kg per head, a small increase on the 17.1kg a head consumed in the previous year.
New Zealand Pork Industry Board. The board is a statutory body that operates under the Pork Industry Board Act 1997. The act aims to assist attainment, in the interest of pig farmers, of the best possible net ongoing returns for pigs, pork products and co-products. To achieve this, the board has five strategic areas of focus; industry leadership; market development; environment and animal welfare; research and development; and quality. Board income is sourced from a levy on pigs slaughtered at licensed premises. The board consists of seven members, five of whom are elected by producers and two appointed by the government.
Technology transfer and research and development activities are carried out on behalf of the board by the Monogastric Research Centre, at Massey University. Technology transfer is achieved by means of seminars and workshops for farmers and others involved in the industry. The board funds research into pig production and into a number of environmental issues, especially the land application of piggery effluents. A pig farming code of practice sets out guidelines for the establishment and management of pig farms to ensure environmental risks are minimised. Maintaining animal welfare standards is another area of board activity. A total quality management culture has been encouraged throughout the industry, complemented by industry-agreed minimum standards.
While the board does not own products, it undertakes generic market development as appropriate. Recent annual pig numbers are shown in table 18.25.
Table 18.25. Pigs
| At 30 June | Breeding sows and mated gilts | Other pigs of all ages (including boars) | Total pigs |
|---|---|---|---|
1A shortened agricultural census was undertaken in these years and there was no question on the number of breeding sows. 2Change in survey population definition introduced in 1994. 3In 1999, population definition was changed to all farm units on the Agribase known to hold livestock and/or engage in grain/arable cropping ... = figures not available. Source: Statistics New Zealand and New Zealand Pork Industry Board | |||
| 1990 | 50,990 | 343,711 | 394,701 |
| 19911 | .. | .. | 407,306 |
| 1992 | 51,324 | 359,824 | 411,148 |
| 19931 | .. | .. | 395,117 |
| 19942 | 58,065 | 364,701 | 422,766 |
| 1995 | 59,250 | 371,755 | 431,005 |
| 1996 | 57,065 | 367,009 | 424,074 |
| 1997 | .. | .. | .. |
| 1998 | .. | .. | .. |
| 19993 | 60,626 | 308,261 | 368,887 |
The poultry meat industry is relatively new in New Zealand and is expanding rapidly. It is now the major intensive livestock industry in New Zealand. For the year ending December 2000, the New Zealand poultry industry produced more than 111,000 tonnes of poultry meat, almost solely for the domestic market. More than 96 percent was chicken meat produced from 67 million broiler chickens, with turkey, duck and roasting fowl making up the remaining 4 percent. Table 18.26 gives recent annual chicken production numbers and percentages of fresh and frozen chicken.
Table 18.26. Chicken production
| Year | Birds | Dressed weight | Fresh | Frozen |
|---|---|---|---|---|
Source: Poultry Industry Association of NZ Inc | ||||
| number | tonnes | percent | percent | |
| 1990 | 43,469,000 | 55,379 | 55,2 | 44.8 |
| 1991 | 45,891,000 | 59,036 | 53.5 | 46,5 |
| 1992 | 48,187,000 | 62,792 | 55.0 | 45.0 |
| 1993 | 51,006,000 | 69,570 | 52.2 | 47.8 |
| 1994 | 55,844,000 | 76,811 | 58.6 | 41,4 |
| 1995 | 63,756,000 | 89,157 | 60.0 | 40.0 |
| 1996 | 60,712,000 | 87,165 | 65.4 | 34.6 |
| 1997 | 60,749,000 | 88,904 | 66.2 | 33.8 |
| 1998 | 64,667,000 | 97,120 | 64.6 | 35.4 |
| 1999 | 63,945,000 | 100,085 | 70.7 | 29.3 |
| 2000 | 67,067,000 | 108,929 | 71.2 | 28.8 |
The Poultry Industry Association of New Zealand (PIANZ) represents the interests of all poultry processing and livestock breeding companies in New Zealand. Membership is voluntary, but more than 98 percent of New Zealand's poultry production is represented by PIANZ.
Tegel Foods, Inghams Enterprises, and PH van den Brink produce more than 90 percent of New Zealand's broiler chickens. The poultry meat industry earns nearly $500 million in retail sales and provides jobs for about 3,000 people.
Declining prices in real terms, lifestyle changes and consumer perceptions have seen poultry consumption continue to increase, up from 14kg a person 10 years ago to 29.2kg a person in 2000. Total meat consumption was relatively static during this period, so the percentage of poultry meat consumed increased from 15 percent to 25 percent, largely at the expense of sheep meat.
Industry-funded innovations in processing and sound marketing have been factors in this growth. Increases in chicken consumption have been mainly in the fresh and further processed areas, with 71 percent of chicken now sold fresh and less than 40 percent sold as whole birds.
Poultry production maintains a competitive advantage over other meat industries because of genetic advantages and rapid rates of improvement; intensive land use; low transport costs; highly automated processing plants, with continuous processing rather than seasonal variation; consistent product quality; excellent product image; competition and economies of scale.
A high level of vertical integration in the industry enables participants to maintain control over all facets of production, promote quality management, increase efficiency and plan for the future.
Eggs. New Zealand's estimated 2.5 million laying hens produced around 65 million dozen eggs in 2000. More than 85 percent of eggs are sold as table eggs within the domestic market, with the remainder used in the baking and catering industries. Retail sales of eggs are worth more than $160 million a year. Total egg production has remained relatively static for the past decade, with a slight increase in per capita consumption – now around 208 eggs per person annually. Most eggs produced in New Zealand are from caged hens, with free-range and barn egg production accounting for 5 percent of the total.
The late 1980s saw the abolition of both price and production controls in the egg industry, and disestablishment of the New Zealand Poultry Board. This change was followed by a dramatic reduction in returns to producers, though this was not always matched by a reduction in retail egg prices. Deregulation changed the relationship and relative profitability of producers and egg wholesalers. Many producers now sell direct to the wholesale and retail trade rather than through cooperatives or other organisations.
New Zealand has around 160 commercial egg producers, with the largest 20 producers accounting for more than half of total production. After deregulation, the number of commercial egg producers declined rapidly and there has been subsequent consolidation among producers. The Egg Producers' Federation of New Zealand Inc (EPF), funded via producer levies under the Commodity Levies Act, represents the industry and plays a growing role in research funding and direction. Eggs Incorporated (Eggs Inc), which is contracted to the EPF, provides nationwide activities to promote eggs on a generic basis. A wider choice of egg types has become available in recent years, from standard white and brown to wholegrain, vegetarian, omega enriched, barn, and free-range eggs. There are some exports of specialist table eggs to niche markets overseas, in addition to sizeable fertile egg and day-old chick exports to the Pacific.
In the more than 150 years honeybees have been kept in New Zealand, beekeeping has moved from being a home craft to a progressive industry. New Zealand is now recognised as one of the world's most advanced beekeeping countries and is a leader in several important fields.
English missionaries were the first to successfully ship honeybees to New Zealand when they brought two basket hives (skeps) of bees into Northland in 1839. The original honeybees brought to the country were the black strain from Western Europe and Britain. They were kept in traditional straw skeps or wooden boxes with frames. Around 1880, first stocks of the yellow Italian strain were imported. They, along with movable-frame hives, provided the foundation for modern commercial beekeeping development.
American foulbrood (a bacterial disease of larval bees) was accidentally imported in some of the original bee stocks and by the 1880s had become established in many hives. The fixed frame hives in common use at the time meant combs could not easily be inspected for the disease and beekeeping was greatly affected in many parts of the country.
Isaac Hopkins, a prominent commercial beekeeper, campaigned for bee disease control legislation in the last two decades of the 19th century and in 1905 was appointed Government Apiarist. Shortly after, the first Apiaries Act was passed. The act made the keeping of fixed frame hives illegal and introduced measures to control American foulbrood. The act was one of the first modern bee disease control laws in the world and, along with a concerted campaign to reduce the incidence of the disease, helped make the commercial keeping of bees in New Zealand a viable farming activity.
The late 1970s and early 1980s saw large changes in the beekeeping industry. The centralised Honey Marketing Authority ceased operations and private individuals and companies began exporting honey products. The number of hives increased by more than 40 percent to 335,000, spurred on by the demand for paid pollination services. Since then the number of beekeepers and hives has decreased to the point where, in 2000, there were 4,777 registered beekeepers owning 322,539 hives.
In 1991, the government announced it would no longer fund the endemic honeybee disease programme. The industry decided to fund American foulbrood control from its own resources and currently contracts AgriQuality New Zealand Ltd and HortResearch NZ Ltd to provide disease control services. In 2000/2001, American foulbrood was found by inspectors and/or reported by beekeepers in 0.46 percent of beehives.
The Biosecurity Act 1993, which replaced the Apiaries Act 1969, allows beekeepers to develop their own strategies for controlling nationally significant bee diseases. The beekeeping industry has prepared a Pest Management Strategy (PMS) for American Foulbrood Disease, which became law on 1 October 1998.
In April 2000, the serious bee mite varroa destructor was found in Auckland and has since spread throughout the upper half of the North Island. Attempts are being made to keep it out of the lower half of the North Island and the South Island for as long as possible. The mite, if left untreated, will kill beehives. While it can be controlled using miticide strips and some organic acids, these can be expensive to buy or apply. The mite has changed the future of New Zealand beekeeping and many hobby beekeepers have decided not to continue keeping bees. Some commercial beekeepers will also not be able to sustain their businesses in light of the increased costs caused by varroa destructor and the number of registered beekeepers has decreased by nearly 1,000 since 1999.
The total saleable crop for 2001 was assessed by AgriQuality New Zealand at 9,144 tonnes (29.5 kg per hive), which is slightly above the six-year average of 8,842 tonnes (29.4 kg per hive). While most areas in New Zealand were close to their six-year average production, the Waikato and Bay of Plenty regions had their lowest crops for 20 years. Exports of bulk, retail pack, comb and honeydew honeys totalled about 2,500 tonnes, with Europe, particularly Germany, and Japan being the largest importers. Table 18.27 gives industry statistics for 1999, 2000 and 2001 by district.
New Zealand's rich pasture lands and some of its forest and bush areas are favourable for apiculture and produce high-grade honey. Although clover (trifolium repens) is still the principal variety, a number of other New Zealand native honey sources have wide national and international consumer appeal. Examples are pohutukawa (metrosideros excelsa), manuka (leptospermum scoparium) and ling heather (caluna vulgaris) from the North Island. South Island sources include rata (meterosideros robusta), blue borage (echium vulgare) and thyme (thymus vulgaris). As well, honeydew (a non-floral source of honey) is produced from South Island beech forests. This source, with a strong, pronounced flavour, is exported primarily to Europe.
In 1992, Waikato University researchers confirmed that manuka honey was unusually effective as an antiseptic dressing for wounds and burns. As a result, both the demand and the price for manuka honey have risen dramatically.
The marketing of bees and bee products has become more sophisticated and other products are now blended with honey to add value, eg deer velvet, bee venom, dried fruits, pollen and royal jelly. There is a growing demand for bee products such as royal jelly, propolis (an antibiotic gum or resin from plants), pollen and honeys, like manuka, which have strong antibacterial properties.
The industry's other products include beeswax and live bees, which include package bees and queen bees. Package bees are ventilated containers with usually 1.5 kg of bees, a queen bee and some food supplies. Bee pests and diseases, as well as the aggressive Africanised honeybees have spread through many of the countries where bees are kept. This has increased the demand for bees from countries like New Zealand and Australia. Exports of live bees annually are usually around 20,000 to 25,000 queen bees and 25,000 x 1.5 kg package bees.
New Zealand beekeepers provide a commercial pollination service to growers of tree and berry fruits, kiwifruit, cucurbits (squash and melons) and small seeds. About 90,000 hives are moved for pollination each season.
The National Beekeepers' Association (NBA) levies beekeepers with more than three apiaries and/ or more than 10 hives under the Commodity Levies Act 1991 to pay for its activities, including its pest management strategy. The association publishes a monthly magazine The New Zealand Beekeeper, and maintains a loan library. Its website is www.nba.org.nz
Table 18.27. Number of beekeepers, apiaries, hives and honey production1
| District | Beekeepers | Apiaries | Hives | Honey production | ||||||||
|---|---|---|---|---|---|---|---|---|---|---|---|---|
| 1999 | 2000 | 2001 | 1999 | 2000 | 2001 | 1999 | 2000 | 2001 | 1999 | 2000 | 2001 | |
1Year ended 30 June Source: AgriQuality New Zealand | ||||||||||||
| number | tonnes | |||||||||||
| Whangarei | 996 | 1,168 | 1,069 | 2,359 | 3,033 | 2,540 | 30,505 | 36,086 | 32,065 | 869 | 982 | 615 |
| Hamilton | 475 | 486 | 421 | 2,711 | 2,800 | 2,742 | 47,092 | 49,863 | 48,042 | 672 | 1,434 | 1,617 |
| Tauranga | 488 | 496 | 452 | 2,854 | 2,971 | 2,852 | 49,892 | 51,008 | 52,510 | 794 | 1,300 | 1,800 |
| Palmerston North | 1,282 | 1,214 | 1,123 | 3,719 | 3,655 | 3,577 | 41,523 | 43,534 | 43,193 | 1,735 | 1,323 | 1,416 |
| Blenheim | 447 | 414 | 376 | 1,746 | 1,741 | 1,691 | 25,405 | 28,443 | 26,362 | 606 | 705 | 770 |
| Canterbury | 729 | 727 | 678 | 4,836 | 4,748 | 4,419 | 59,979 | 60,356 | 60,899 | 2,743 | 2,310 | 1,782 |
| Otago/Southland | 497 | 451 | 420 | 3,568 | 3,495 | 3,483 | 48,592 | 50,823 | 51,020 | 1,725 | 1,555 | 1,069 |
| New Zealand | 4,914 | 4,956 | 4,539 | 21,793 | 22,443 | 21,304 | 302,988 | 320,113 | 314,091 | 9,144 | 9,609 | 9,069 |
Spray irrigation of crops.
Although pastoral farming is the major land use in New Zealand, there have been significant increases in recent years in areas planted in horticulture and crops. After a period of decline in the 1980s, the area planted in traditional cereals, such as wheat, barley and maize, stabilised by the 1990s. Major crops for the export market include kiwifruit, pipfruit, stonefruit, onions, squash, flowers and berryfruit. Increasing volumes of grapes are grown for the rapidly expanding export wine market. Table 18.28 shows recent annual values of horticultural exports by type and the proportion of total horticultural exports each type comprises.
Table 18.28. Value of horticultural exports (fob)
| Year ended 30 June | 1997 | 1997 | 1998 | 1998 | 1999 | 1999 |
|---|---|---|---|---|---|---|
| Source: Statistics New Zealand | ||||||
| $(million) | percent | $(million) | percent | $(million) | percent | |
| Fresh fruit | 768.5 | 59.0 | 817.6 | 56.6 | 1,039.1 | 59.8 |
| Processed fruit | 166.9 | 12.8 | 178.6 | 12.4 | 203.0 | 11.7 |
| Fresh vegetables | 150.8 | 11.6 | 217.3 | 15.0 | 232.0 | 13.4 |
| Processed vegetables | 136.7 | 10.5 | 142.6 | 9.9 | 170.5 | 9.8 |
| Cut flowers | 42.0 | 3.2 | 47.0 | 3.3 | 45.9 | 2.6 |
| Seeds, plants and foliage | 37.7 | 2.9 | 42.0 | 2.9 | 47.0 | 2.7 |
| Total | 1,302.6 | 100.0 | 1,445.1 | 100.0 | 1,737.5 | 100.0 |
Stock feed. Animals can be grazed in open pasture in New Zealand for the full 12 months of the year. The winter growth of grass, except in certain favoured localities, needs to be supplemented in order to keep stock in good condition during the colder months, and in some districts supplementary fodders are necessary in the drier summer months. Hay and silage crops are grown almost exclusively on the farms where they are consumed; though some districts specialise in the growing of certain other supplementary fodder crops. The bulk of the supplementary fodders, other than grass and clover, hay, and silage, are grown in the South Island, since the colder climate necessitates more extensive supplementary feeding than in the North Island.
Wheat. New Zealand wheat is primarily grown for domestic human consumption and is milled for flour. Some wheat grain and the by-products of flour milling, bran and pollard, are used for stock feed. Most wheat is grown in the South Island, in the Canterbury region.
Barley. Most barley grown in New Zealand is used for the manufacture of stock feed and for malting. Exports of malting and feed barley fluctuate in response to price changes, which reflect international supply and demand.
Maize. Primarily grown in the eastern North Island, maize grain is used as poultry feed and, increasingly, as a supplementary feed for pigs and other livestock. Maize silage is also used as a supplementary feed.
Oats. Grown mainly for threshing and green feed, oats are also used to produce milled rolled-oats, oatmeal and oaten foods. The main growing areas for oats are Canterbury and Southland.
Table 18.29 shows the number of hectares within regional council boundaries sown in various grain crops in 1999.
Table 18.29. Grain and peas 19991
| Regional council | Wheat (bread cultivars) | Wheat (other cultivars) | Barley | Oats | Field/seed peas | Maize | Other crops |
|---|---|---|---|---|---|---|---|
1Year ended it) June. C = an estimate that has been suppressed for confidentiality reasons; S = an estimate that has been suppressed because of poor quality: Figures may not equate to the total due to rounding. Source: Statistics New Zealand: Agriculture Production Survey 1999. | |||||||
| Area sown (hectares) | |||||||
| Northland | 64 | 47 | 98 | 23 | 40 | 614 | 171 |
| Auckland | 106 | 63 | 187 | 32 | 55 | ..S | 173 |
| Waikato | 129 | 125 | 155 | 99 | 84 | 6,818 | 1,338 |
| Bay of Plenty | 14 | 10 | 25 | 378 | ..C | 1,492 | 25 |
| Gisborne | 6 | 4 | ..S | ..S | ..C | 2,348 | 793 |
| Hawke's Bay | 490 | 483 | 1,173 | 141 | 831 | 1,321 | 862 |
| Taranaki | 68 | ..S | ..S | 26 | 43 | ..S | 282 |
| Manawatu-Wanganui | 3,161 | ..S | 5,875 | 217 | ..S | 3,327 | 1,603 |
| Wellington | 294 | 290 | 1,324 | 131 | 679 | 85 | ..S |
| Total North Island | 4,334 | 2,600 | 9,588 | 1,065 | 2,358 | 17,388 | 5,811 |
| Tasman | 24 | 17 | 154 | 14 | 12 | 62 | 164 |
| Nelson | ..C | ..C | ..C | ..C | ..C | 2 | ..C |
| Marlborough | ..S | 306 | 852 | 88 | 358 | 30 | 1,205 |
| West Coast | ..C | ..C | ..C | ..C | ..C | 2 | ..C |
| Canterbury | 25,529 | 13,983 | 35,218 | 5,693 | 13,177 | 1,933 | 45,890 |
| Otago | 1,733 | 2,238 | 6,733 | 1,145 | 611 | 11 | 2,624 |
| Southland | 362 | 1,538 | 3,196 | 1,922 | 308 | 19 | 1,441 |
| Chatham Islands | 0 | 0 | 0 | 0 | 0 | 0 | 0 |
| Total South Island | 27,778 | 18,085 | 46,204 | 8,864 | 14,468 | 2,059 | 51,332 |
| Total New Zealand | 32,111 | 20,686 | 55,792 | 9,929 | 16,826 | 19,446 | 57,143 |
Figure 18.9 shows hectares sown in major crops from 1961 to 1999.
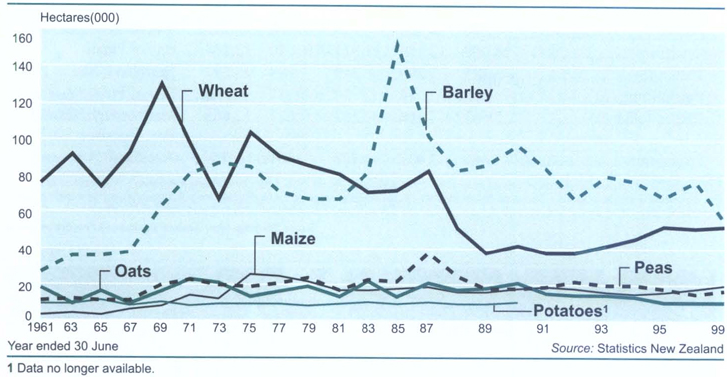
Seed certification. AgriQuality operates a seed certification scheme covering all main herbage and arable species, and participates in the Organisation for Economic Cooperation and Development's seed scheme.
New Zealand certified seed is exported to European Union countries, countries of the Pacific Basin, and North and South America.
Plant variety rights. Any breeder of a new and distinct plant variety may obtain a grant of plant variety rights.
Such a grant gives the breeder, for a prescribed number of years, exclusive rights of commercialisation for the variety. The Ministry of Economic Development administers the scheme.
Rights may be obtained for varieties of all plants, except algae and bacteria. The New Zealand scheme complies with the 1978 Convention of the International Union for the Protection of New Varieties of Plants (UPOV).
Table 18.30 lists recent annual plantings in fruit as well as the main growing regions for each type of fruit. Exports are dealt with in Chapter 25:Overseas Trade. Production and export of avocados, berry fruit, tamarillos, citrus fruit and feijoas are all making an impact on the local and international market. Effective research is critical to the development of the horticultural sector and in 1996, the industry itself funded 40 percent of the $9.7 million spent on research.
Table 18.3. Areas planted in fruit
| Fruit | At 30 June | |||||
|---|---|---|---|---|---|---|
| 1993 | 19941 | 1995 | 1996 | 20002 | Main regions | |
1Change in survey population definition introduced in 1994. 2The population for the 2000 Agricultural Production Survey – Horticulture differs from that of previous agricultural surveys. Therefore, figures for 2000 are not directly comparable with previous years. 3Areas of grapes planted by activities classified to winemaking are not included here. S = an estimate that has been suppressed because of its very poor statistical quality. Source: Statistics New Zealand: Agriculture Production Survey | ||||||
| hectares | ||||||
| Citrus – | ||||||
| Grapefruit/goldfruit | 156 | 117 | 117 | 115 | 117 | Bay of Plenty |
| Lemons | 283 | 263 | ..S | 330 | 339 | Northland |
| Mandarins | 533 | 619 | 654 | 637 | 946 | Northland |
| Oranges | 760 | 789 | 757 | 607 | 597 | Gisborne, Northland |
| Tangelos | 357 | 295 | 316 | 230 | 167 | Bay of Plenty |
| Pip fruit – | ||||||
| Apples | 12,937 | 15,257 | 15,916 | 15,819 | 14,114 | Hawke's Bay |
| Pears | 1,068 | 1,279 | 1,266 | 1,151 | 958 | Hawke's Bay, Tasman |
| Nashi (Asian pears) | 484 | 418 | 413 | 313 | 185 | Bay of Plenty, Auckland |
| Stone fruit – | ||||||
| Apricots | 804 | 844 | 831 | 735 | 759 | Otago |
| Nectarines | 845 | 667 | 705 | 559 | 618 | Otago, Hawke's Bay |
| Peaches | 869 | 714 | 738 | 756 | 725 | Hawke's Bay |
| Plums | 303 | 342 | 336 | 303 | 408 | Hawke's Bay |
| Cherries | 273 | 274 | 353 | 339 | 535 | Otago, Marlborough |
| Berry fruit – | ||||||
| Blackcurrants | 795 | 720 | 714 | 614 | 834 | Canterbury |
| Blueberries | 340 | 357 | 377 | 280 | 348 | Waikato |
| Boysenberries | 223 | 231 | 222 | 227 | 263 | Tasman |
| Raspberries | 224 | 199 | ..S | ..S | 254 | Canterbury |
| Strawberries | 247 | 331 | ..S | ..S | 384 | Auckland |
| Subtropicals – | ||||||
| Avocados | 1,260 | 1,375 | 1,588 | 1,573 | 2,646 | Bay of Plenty, Northland |
| Feijoas | 226 | 161 | ..S | 138 | 217 | Auckland |
| Kiwifruit | 14,099 | 12,174 | 11,873 | 11,640 | 12,184 | Bay of Plenty |
| Tamarillos | 325 | 299 | 249 | 188 | 297 | Northland, Bay of Plenty |
| Passionfruit | 68 | 54 | 54 | 41 | 66 | Bay of Plenty |
| Grapes (outdoor)3 | 5,663 | 7,160 | 7,382 | 7,627 | 12,665 | Marlborough, Hawke's |
| Bay, Gisborne | ||||||
| Persimmons | 400 | 412 | 428 | 361 | 384 | Auckland |
Picking apples for export at an orchard near Motueka.
Avocados. The number of avocado trees planted has increased in recent years. Much of the exported fruit goes to Australia, with smaller quantities to the United States, Korea and Singapore. New Zealand has an excellent climate for Hass avocados and the industry is regarded as coordinated, efficient and well positioned for growth.
Berryfruit. The blackcurrant industry is in a steady growth phase, having proved to be internationally competitive. The quality of New Zealand blackcurrant concentrate is rated as good as any produced in the world. Strawberry production is increasing steadily, with most of the increase absorbed by the local market over a longer season. Boysenberries are expected to increase in production by 10 percent each year for the next few years. Blueberries also face a positive long-term future, although it is expected competition from South America and South Africa will lead to rationalisation of grower numbers in the short-term. Local demand for blueberries increases every year.
Citrus. Citrus growers have been restructuring their cultivar base to better cope with international competition. Orange growers have suffered from the effects of large Australian navel orange imports and have been shut out of the Japanese market by heavy volumes from other suppliers. This situation is not expected to change, so local growers have adapted by planting mandarins and Yen Ben lemon to create a distinct niche, which is expected to do better.
Feijoas. While still relatively unknown as a fruit, promotion of feijoas on the domestic market is proving successful in raising awareness of this fruit, which also appeals to Asian tastes. A similar promotional campaign to raise awareness of the fruit overseas should lead to export growth.
Persimmons. Persimmons are well known in the Asian market. New Zealand persimmons are well established in some markets and developing a presence in others. New Zealand is seen to produce excellent quality, blemish-free fruit and to have a strong and evolving industry.
Pipfruit. The New Zealand pipfruit industry was deregulated in October 2001, meaning that any company can source pipfruit in New Zealand for export. Before deregulation, ENZA (formally the Apple and Pear Marketing Board) held a statutory monopoly on pipfruit exports. ENZA exports to more than 50 countries worldwide, with most of its product going to Europe, the United Kingdom and the United States. About 30 varieties of apples and pears are sold under the ENZA brand. ENZA exported about 12 million 18kg cartons of apples and pears in 2001 on behalf of approximately 1,200 New Zealand pipfruit growers, at an average return of $19.75 a carton. Table 18.31 shows recent annual earnings from apple and pear sales.
Table 18.31. Apple and pear sales1
| 1995 | 1996 | 1997 | 1998 | 1999 | 2000 | |
|---|---|---|---|---|---|---|
1For year ended 30 September. 2The New Zealand Apple and Pear Marketing Board no longer controls market sales or the processing sector Source: ENZA | ||||||
| $(000) | ||||||
| Fresh fruit export | 556,662 | 631,645 | 519,725 | 535,347 | 536,624 | 663,345 |
| Commercial operations2 | 227,889 | 242,236 | 265,069 | 211,774 | 93,675 | 78,217 |
| Net return | 784,551 | 873,881 | 784,794 | 647,121 | 630,299 | 741,562 |
Figure 18.10 shows pipfruit exports from 1975 to 2000.
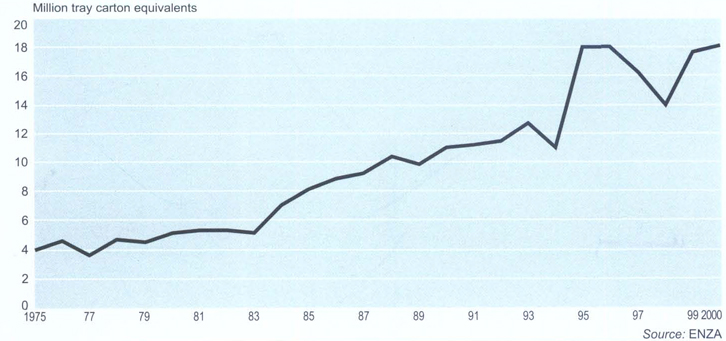
Summerfruit. Summerfruit includes cherries, peaches, nectarines, apricots and plums. The New Zealand industry consists of approximately 550 growers on 3,000 hectares. The main growing areas are Central Otago, Hawke's Bay and Marlborough and they produce, respectively, 50 percent, 30 percent and 10 percent of the crop. Local markets take 60 percent of the product, with Taiwan, Australia and the United States taking another 25 percent. Processing of mainly peaches and apricots accounts for between 10 and 15 percent of the market. Apricots make up 51 percent of exports, followed by cherries (17 percent), peaches (5 percent), nectarines (2 percent) and plums (1 percent). Summerfruit New Zealand is a recognised product group under the New Zealand Horticulture Export Authority.
Kiwifruit. Kiwifruit is one of New Zealand's most important horticultural export earners. New Zealand is a major world supplier of kiwifruit and has led the development of the global industry. ZESPRI International Ltd is a custom-built, consumer-driven, grower-owned company dedicated to the global marketing of kiwifruit. It is one of New Zealand's leading exporters, earning in excess of $700 million annually and with a growth strategy in place to propel revenues to more than $ 1 billion a year as the company moves into year-round marketing of multiple kiwifruit products. With global headquarters in New Zealand and a network of offices in Europe, the United Kingdom, North America, Japan, Asia and the Pacific, ZESPRI is the biggest marketer of kiwifruit in the world and is regarded as the world leader in all aspects from quality to innovation. In 2000, ZESPRI sold 60.4 million trays of New Zealand kiwifruit in around 60 countries.
Sales (by volume) were focused in five major markets: Europe (63 percent), Japan (16 percent), East Asia and South-east Asia (9 percent), North America (7 percent) and developing markets, which include South America, Australia, the Middle East, the Indian Ocean region, New Zealand and Far East Russia, (5 percent).
While New Zealand growers supply about a quarter of world production, kiwifruit generally accounts for less than 1 percent of world fresh fruit production. Other major producers include Italy, France, Greece, Spain, Japan, China, Korea, Chile and the United States. Kiwifruit is produced in many regions of the North Island, as well as in the north of the South Island, but the Bay of Plenty, with more than 80 percent of production, is the major growing area. There are about 1,700 kiwifruit growers in New Zealand.
Recent annual kiwifruit plantings and sales are given in table 18.32.
Table 18.32. Kiwifruit production
| Year ended 31 March | Area | Export trays | Sales trays |
|---|---|---|---|
| Source: ZESPRI International Annual Report 2001 | |||
| hectares | million | ||
| 1991 | 14,980 | 59.8 | 54.7 |
| 1992 | 14,594 | 67.3 | 52.3 |
| 1993 | 12,265 | 55.3 | 49.2 |
| 1994 | 10,161 | 55.8 | 49.9 |
| 1995 | 10,210 | 58.8 | 48.7 |
| 1996 | 10,329 | 63.1 | 56.2 |
| 1997 | 10,243 | 60.6 | 56.2 |
| 1998 | 10,015 | 63.1 | 59.4 |
| 1999 | 10,234 | 54.1 | 51.8 |
| 2000 | 10,376 | 65.5 | 61.5 |
Grape growing and wine production. The area planted in producing grapevines increased from 10,197 hectares in 2000 to 11,275 hectares in 2001. Marlborough (4,354 hectares in 2001), Hawke's Bay (2,800 hectares) and Gisborne (1,848 hectares) are the major grape-producing areas. The 2001 season produced 71,000 tonnes of grapes. Sauvignon blanc (20,826 tonnes), chardonnay (17,067 tonnes) and pinot noir (8,015 tonnes) were the most popular grapes of the season. Exports of wine increased from 19.1 million litres in 2000 to 19.2 million in 2001. The United Kingdom, which imported 9.9 million litres of wine in the year to 30 June 2001, was New Zealand's major export market for wine. The United States, which imported 3.1 million litres, was the second-largest export market.
The number of wineries in New Zealand increased from 150 in 1991 to 382 in 2001. The Wine Institute of New Zealand's website is www.nzwine.com
Table 18.33 gives recent annual figures for the wine industry.
Table 18.33. Wine industry statistics
| Year ending 30 June | 1996 | 1997 | 1998 | 1999 | 2000 | 2001 |
|---|---|---|---|---|---|---|
E = Estimate Source: Wine Institute of New Zealand | ||||||
| Number of wineries | 238 | 262 | 293 | 334 | 358 | 382 |
| Producing area (hectares) | 6,610 | 7,410 | 7,580 | 9,000 | 10,197 | 11,275 |
| Average yield (tonnes per hectare) | 11.2 | 8.1 | 10.3 | 8.9 | 7.8 | 6.3 |
| Crushed (tonnes) | 75,300 | 60,000 | 78,300 | 79,700 | 80,100 | 71,000 |
| Total production (million litres) | 57.3 | 45.8 | 60.6 | 60.2 | 60.2 | 53.3E |
| Domestic sales (million litres) | 35.6 | 38.8 | 38.2 | 38.4 | 41.3 | 37.4E |
| Consumption per capita (litres NZ wine) | 9.9 | 10.4 | 10.1 | 10.1 | 10.6 | 9.6E |
| Stock: sales ratio | 2.06:1 | 1.66:1 | 1.72:1 | 1.78:1 | 1.60:1 | 1.65:1E |
| Export volume (million litres) | 11.0 | 13.1 | 15.2 | 16.6 | 19.2 | 19.2 |
| Export value ($(million) | 60.3 | 75.9 | 97.6 | 125.3 | 168.6 | 198.1 |
Crates of kiwifruit being loaded for export.
| 18.1–2 | Ministry of Agriculture and Forestry; Statistics New Zealand. |
| 18.3 | Meat New Zealand; Ministry of Agriculture and Forestry; Meat and Wool Economic Service of New Zealand. |
| 18.4 | WoolPro. |
| 18.5 | New Zealand Dairy Board; Fonterra. |
| 18.6 | New Zealand Pork Industry Board; Poultry Industry Association of New Zealand;National Beekeepers' Association of New Zealand; AgriQuality New Zealand. |
| 18.7 | Ministry of Agriculture and Forestry; Statistics New Zealand; Summerfruit New Zealand; ZESPRI International; Fruit Industry Innovation Council of New Zealand; ENZA; Wine Institute of New Zealand. |
Statistics New Zealand divisional manager responsible: Mike Moore.
1999 Agricultural Production Survey (2001). On-line tables, Statistics New Zealand, Wellington.
Annual Review of the New Zealand Sheep and Beef Industry (annual). Meat and Wool Economic Service of New Zealand, Wellington.
Biosecurity (eight times a year). Ministry of Agriculture and Forestry Regulatory Authority. Animal Health and Welfare Group, Wellington.
New Zealand Contacts in Agriculture, Horticulture, Forestry and Fishing (annual). Contacts Unlimited, Picton.
Farm Expenses Price Index (quarterly). Statistics New Zealand. Wellington.
Farm Monitoring Reports (series of individual titles). Ministry of Agriculture and Forestry, Wellington.
Horticultural Facts and Figures (annual). HortResearch, Palmerston North.
Key Statistics (monthly). Statistics New Zealand, Wellington.
Meat Matters (fortnightly). Meat New Zealand, Wellington.
Report of the Ministry of Agriculture and Forestry (Parl paper C.5).
Situation and Outlook for New Zealand Agriculture (annual). Ministry of Agriculture and Forestry, Wellington.
Statistical Handbook (annual). WoolPro, Wellington.
www.agriquality.co.nz – AgriQuality
www.enza.co.nz – ENZA
www.fonterra.com – Fonterra
www.hort.cri.nz – HortResearch
www.nzmeat-wool.co.nz – Meat and Wool Economic Service of New Zealand
www.nzmeat.co.nz – Meat New Zealand
www.maf.govt.nz – Ministry of Agriculture and Forestry
www.beekeeping.co.nz – National Beekeepers' Association of New Zealand
www.pork.co.nz – New Zealand Pork Industry Board
www.woolboard.co.nz – New Zealand Wool Board
www.pianz.org.nz – Poultry Industry Association of New Zealand
www.stats.govt.nz – Statistics New Zealand
www.summerfmitnz.co.nz – Summerfruit New Zealand
www.nzwine.com – Wine Institute of New Zealand
www.woolpro.co.nz – WoolPro
www.zespri.com – Zespri International
Table of Contents
A pinus radiata forest in the central North Island.
Forests cover nearly 30 percent, or 8.1 million hectares, of New Zealand's land area. Of this, about 6.3 million hectares are indigenous forest and 1.8 million hectares are planted production forests. In addition to tall forests, there are 2.7 million hectares of shrublands, some of which is reverting to indigenous forest. Of the total planted production forest estate, 90 percent is radiata pine (pinus radiata), and 5 percent is Douglas fir (pseudotsuga menziesii). Hardwoods comprise about 3 percent of planted production forests, the most important being eucalyptus species from Australia.
Since 1992, new forest planting rates have been above the average 40,000 hectares a year achieved during the 1970s and 1980s, with an average 55,000 hectares a year planted in the 10-year period to 2000. There are, however, large year-to-year fluctuations in new planting rates and in 2000 only 40,000 hectares of planted forest were established.
Although radiata pine is the principal plantation species, its properties mean it is not suitable for all uses, especially where decorative features, dimensional stability and surface hardness are important. With the declining supply of timber from indigenous forests, special-purpose species such as blackwood (acacia melanoxylon), macrocarpa (cupressus macrocarpa) and black walnut (juglans nigra) have been established to meet specialist markets.
Available wood resource from plantations will rise rapidly in the next two decades. Because the domestic demand for timber is not expected to change significantly in the future, the volume of wood available for export is expected to increase dramatically, with a 60 percent increase forecast between 2000 and 2010.
Figure 19.1 shows past and future wood supply from 1950, with forecasts to 2040.
Forestry research is described in Chapter 15: Science and Technology, while the role of the Ministry of Agriculture and Forestry is summarised in Chapter 3: Government.
Indigenous forests. New Zealand's 6.3 million hectares of indigenous forests are located mainly in mountainlands, particularly on the West Coast of the South Island. New Zealand's indigenous forests comprise a mix of more than 2,450 species of trees, shrubs and smaller plants. The major indigenous tree species in these complex forests are beech, rimu, kauri, taraire and tawa. Indigenous forests harbour about 330 species of native birds (some classed as endangered or threatened), two species of bat, reptiles, freshwater fish, amphibians and invertebrates, most notably land snails and giant weta. The forests' significance include recreational, scientific, historic and scenic values.
Figure 19.1. Past and future wood supply
Forecast based on
40,000 hectares of new planting per year
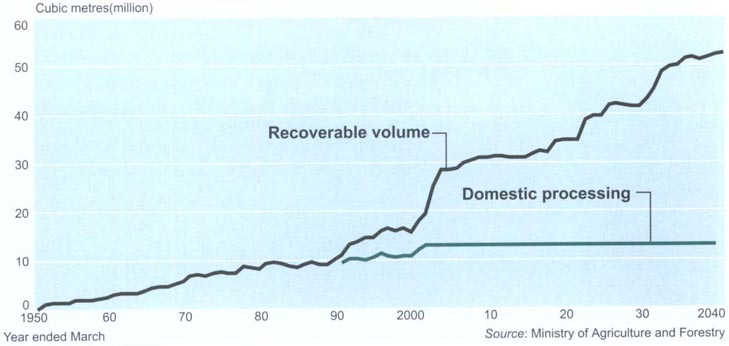
Note:Estimated roundwood removals have been revised from 1990 to 2040. Actual data is used up to 2001. From 2002. data has been taken from the National Exotic Forest Description Wood Supply Forecasts 2000. Domestic processing data is based on actual data from 1990 to 2001.
Indigenous forests are a key part of New Zealand's environment and help protect the natural values of the ecosystem. The main threats to these forests are introduced animals and plants, and an increasing demand for access and recreational opportunities.
The Crown owns about 83 percent of indigenous forests, with the remainder in private hands. Part IIIA of the Forests Act 1949, introduced in 1993, promotes sustainable management of privately-owned indigenous forests. This means the forests are managed in a way that maintains their ability to provide products and amenities in perpetuity. The act does this by requiring private owners to manage their forests through sustainable management plans and permits, by controlling indigenous timber input to sawmills, and by prohibiting indigenous woodchip and log exports.
Having a large planted forest resource enables New Zealand to protect and sustainably manage its Crown and privately-owned indigenous forests. Less than 1 percent of New Zealand's total forest production is harvested from indigenous forests. Figure 19.2 shows annual forest plantings by the state and private sectors from 1921.
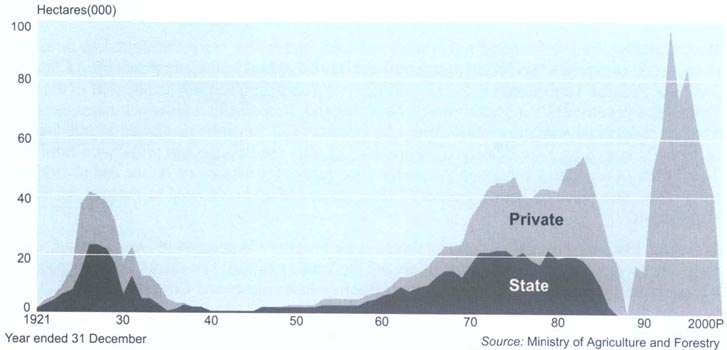
Planted production forests. Trees planted in the second boom of afforestation (1970 through to the mid-1980s) are reaching large-scale utilisation, providing opportunities to maximise the economic return from tree growing. Special-purpose plantation species have also been evaluated, and these are being planted by small-scale forest growers on suitable sites. Uses for these timbers include furniture, cabinet work, turnery, joinery, veneers and boat-building.
Indigenous production forests. There are 6.3 million hectares of indigenous forests remaining in New Zealand, of which around 5.2 million hectares (83 percent) are on state-owned land and unavailable for timber production. These conservation forests are instead managed for heritage, conservation, soil and water, and recreation values. The Department of Conservation manages most of these forests.
Harvesting timber from state-owned indigenous forests has been confined to about 8,000 hectares on the West Coast of the South Island, managed by Timberlands West Coast Ltd. However, this area, plus all previous state-owned indigenous production forests on the West Coast, totalling about 130,000 hectares, became conservation forest administered by the Department of Conservation from 31 March 2002.
A further 12,000 hectares of indigenous forest in Southland, set aside for production and managed by state-owned enterprise Crown Forest Management Ltd, was transferred to the Waitutu Incorporation in 1996. These forests are required to be managed under approved sustainable forest management regimes.
Timber production from privately-owned indigenous forests must be done in accordance with statutory sustainable forest management provisions. Harvesting and milling of ‘salvaged’ timber from areas of farmland and non-natural forest, along with windblown and naturally dead trees from indigenous forests not being managed under an approved sustainable forest management regime, is permitted. Approval is necessary for harvesting and milling timber for a landowner's personal use. All sawmills milling timber from indigenous forests must be registered and are restricted to processing timber from approved sources. Exports of indigenous forest produce are limited to those sourced from an area managed under an approved sustainable forest management plan or permit, or where the product is manufactured to a finished form.
Many early plantation forests were developed by the state, but ownership has moved increasingly to the private sector in the past decade. This led to the sale in 1990 of cutting rights to 247,000 hectares of the state's planted production forest resource, and the sale in 1991 of a further 97,000 hectares. In August 1996, the government sold its shares in the Forestry Corporation of New Zealand, which owned licences to cutting rights of 188,000 hectares of planted forest in the Bay of Plenty. Prior to these sales, ownership of plantation forests was shared almost evenly between the public and private sectors. Today, approximately 92 percent of the plantation resource is in private ownership.
Sale of state forest assets. The sale of management and cutting rights to Crown commercial forestry assets was officially launched by New Zealand Forestry Corporation Ltd in 1989 when rights to about 550,000 hectares of plantation forests were offered for sale. State-owned sawmilling operations at Waipa and Conical Hill were also offered for sale. The sale did not include the land or Maori-leased forests. Bids for the forests were called prior to 30 June 1990 and there was no distinction between domestic and overseas bidders. The government retained the right to remain owner of the resource if bids were unacceptable. Major purchasers of the first sale were the established New Zealand forestry companies Carter Holt Harvey Ltd, which purchased 94,000 hectares, and Fletcher Challenge, which purchased 49,000 hectares. Several foreign-owned companies made significant investments in New Zealand plantation forests. Juken Nissho Ltd acquired rights to 43,000 hectares, Ernslaw One Ltd acquired 24,000 hectares, and Wenita Forestry Ltd acquired 21,000 hectares. The Conical Hill sawmill was purchased by Ernslaw One Ltd, but the Waipa sawmill remained in Crown ownership.
Where management and cutting rights were not sold, plantations were transferred to three new state-owned enterprises, the Forestry Corporation of New Zealand Ltd, Timberlands West Coast Ltd and New Zealand Timberlands Ltd. The Minister of Finance subsequently announced in the 1991 Budget the government's intention to sell New Zealand Timberlands Ltd, which managed about 116,000 hectares of plantation forest. American company ITT Rayonier purchased 97,000 hectares of forest managed by New Zealand Timberlands Ltd after the balance was withdrawn from sale. The Forestry Corporation continued to manage these forests for the Crown. At the end of 1995, the corporation was renamed Crown Forestry Management Ltd and continued to manage the unsold state forests.
In August 1996, the government sold its shares in the Forestry Corporation of New Zealand, which owned licences to 188,000 hectares of forest and the Waipa sawmill. The shares were purchased by a consortium made up of Fletcher Challenge, Brierley Investments and Citifor.
An agreement among the Crown, the Maori Council and the Federation of Maori Authorities provides security of tenure for purchasers of state plantations and protects the interests of Maori who have claims before the Waitangi Tribunal. Purchasers have the right to use the land for a period sufficient to permit any existing tree crop to reach maturity and be harvested. The right to use the land is automatically extended by one year each year unless notice of termination is given. If notice of termination is given, the purchaser will still have time to harvest tree crops planted prior to the notice. In the event of a successful Maori claim, the government will issue notice of termination to the purchaser and compensate the claimant for the rights the purchaser retains until the end of the termination period.
Private forestry. Around 37 percent of New Zealand's planted production forests is owned or managed by two major forestry companies, Carter Holt Harvey Ltd and Fletcher Challenge Ltd. Seven medium-sized forestry companies own a further 20 percent of forests. Five percent of the forest area remains in central government ownership, managed primarily by the Ministry of Agriculture and Forestry and two state-owned enterprises. Local authorities own a further 3 percent of the area, while the remaining 35 percent is owned by a large number of private owners, including Maori trusts. Small private investors and landowners continue to develop an expanding area of planted production forests.
Table 19.1 summarises forestry planting and production from 1920.
Table 19.1. Forestry planting and production: summary 1920–2001
| Year ended 31 March | New area planted | Rough-sawn timber | Wood pulp1 | Paper and paperboard | |
|---|---|---|---|---|---|
| State | Private | ||||
P = provisional 1Chemical and mechanical wood pulp. Source: Ministry of Agriculture and Forestry | |||||
| hectares | hectares | cubic metres | tonnes | tonnes | |
| (000) | (000) | (000) | |||
| 1920 | .. | .. | 726 | .. | .. |
| 1925 | 6 | 8 | 812 | .. | .. |
| 1930 | 22 | 15 | 668 | .. | .. |
| 1935 | 5 | 7 | 575 | .. | .. |
| 1940 | 2 | .. | 793 | 221 | 13,079 |
| 1945 | .. | – | 803 | 15,681 | 20,949 |
| 1950 | 2 | 1 | 1,131 | 21,781 | 22,136 |
| 1955 | 3 | 2 | 1,453 | 53,016 | 40,917 |
| 1960 | 4 | 2 | 1,638 | 221,408 | 164,255 |
| 1965 | 8 | 5 | 1,739 | 370,499 | 316,104 |
| 1970 | 15 | 11 | 1,803 | 521,654 | 445,976 |
| 1975 | 22 | 23 | 2,086 | 843,244 | 546,834 |
| 1980 | 17 | 21 | 2,000 | 1,122,456 | 673,853 |
| 1985 | 18 | 30 | 2,306 | 1,144,911 | 770,098 |
| 1990 | – | 16 | 2,121 | 1,233,809 | 757,371 |
| 1995 | – | 74 | 2,955 | 1,360,389 | 876,187 |
| 1996 | – | 84 | 2,904 | 1,405,307 | 892,969 |
| 1997 | – | 64 | 3,023 | 1,377,264 | 877,152 |
| 1998 | – | 51 | 3,195 | 1,412,165 | 879,576 |
| 1999 | – | 40 | 3,226 | 1,400,739 | 814,314 |
| 2000 | – | 37P | 3,806 | 1,527,565 | 829,812 |
| 2001 | – | .. | 3,807 | 1,572,277 | 871,607 |
Pine seedlings growing in a commercial nursery.
Roundwood. In the year ended March 2001, logs from planted production forests supplied 18.60 million cubic metres, or 99.7 percent, of total roundwood removals. Table 19.2 shows the quantities of roundwood removed from the forests of New Zealand to support approximately 350 sawmills, 10 veneer, six plywood and six fibreboard mills in 2000/01. Roundwood production does not include firewood.
Table 19.2. Estimated roundwood removals from New Zealand forests
| Year ended 31 March | Natural forest removals total | Planted production forest removals | Total removals | ||||
|---|---|---|---|---|---|---|---|
| Saw logs | Pulp logs | Export logs | Other1 | Total | |||
1Other includes peeler logs, small logs and export chips. Source: Ministry of Agriculture and Forestry | |||||||
| cubic metres (000) | |||||||
| 1994 | 204 | 5,171 | 3,781 | 4,253 | 1,462 | 14,667 | 14,871 |
| 1995 | 205 | 5,310 | 4,060 | 4,762 | 1,846 | 15,978 | 16,183 |
| 1996 | 130 | 5,271 | 3,757 | 5,608 | 1,926 | 16,562 | 16,692 |
| 1997 | 110 | 5,459 | 3,142 | 5,469 | 1,894 | 15,964 | 16,074 |
| 1998 | 75 | 5,811 | 3,152 | 5,593 | 2,074 | 16,630 | 16,705 |
| 1999 | 125 | 5,865 | 2,971 | 4,803 | 2,050 | 15,689 | 15,814 |
| 2000 | 76 | 6,985 | 2,962 | 5,806 | 2,280 | 18,033 | 18,109 |
| 2001P | 59 | 6,988 | 3,050 | 6,151 | 2,409 | 18,598 | 18,657 |
Sawn timber. Radiata pine accounts for about 94 percent of the total cut of exotic timber, Douglas fir for 4 percent and other conifers for most of the remainder. Less than 1 percent of New Zealand's sawn timber production comes from indigenous forests, and this proportion has reached the point where only a small, sustained yield in native timber is possible for special purposes.
Table 19.3 shows recent annual rough sawn timber production and table 19.4 shows sawn timber production by species.
Table 19.3. Rough-sawn timber production
| Year ended 31 March | Softwoods from | Hardwoods from | Total | ||||
|---|---|---|---|---|---|---|---|
| Natural forests | Planted production forests | Total softwoods | Natural forests | Planted production forests | Total hardwoods | ||
P = provisional. Source: Ministry of Agriculture and Forestry | |||||||
| cubic metres (000) | |||||||
| 1994 | 73 | 2,730 | 2,803 | 8 | 6 | 14 | 2,817 |
| 1995 | 75 | 2,863 | 2,938 | 10 | 7 | 17 | 2,955 |
| 1996 | 48 | 2,843 | 2,891 | 7 | 6 | 13 | 2,904 |
| 1997 | 48 | 2,964 | 3,012 | 8 | 3 | 11 | 3,023 |
| 1998 | 32 | 3,154 | 3,186 | 6 | 3 | 9 | 3,195 |
| 1999 | 33 | 3,185 | 3,218 | 5 | 3 | 8 | 3,226 |
| 2000 | 23 | 3,771 | 3,794 | 7 | 5 | 12 | 3,806 |
| 2001P | 19 | 3,814 | 3,833 | 9 | 6 | 15 | 3,848 |
Table 19.4. Sawn timber production by species
| Species | Year ended 31 March | |||||
|---|---|---|---|---|---|---|
| 1996 | 1997 | 1998 | 1999 | 2000 | 2001P | |
| Source: Ministry of Agriculture and Forestry | ||||||
| cubic metres (000) | ||||||
| Natural forest – | ||||||
| Rimu and miro | 44 | 44 | 28 | 30 | 22 | 17 |
| Matai | 2 | 1 | 1 | 1 | – | 1 |
| Totara | – | – | 1 | – | – | – |
| Kahikatea | 1 | 1 | – | – | 1 | – |
| Tawa | 3 | 1 | 1 | 1 | 1 | 1 |
| Beech | 4 | 7 | 5 | 4 | 6 | 8 |
| Other | 1 | 2 | 2 | 1 | 1 | 1 |
| Total natural forest species | 55 | 56 | 38 | 37 | 31 | 28 |
| Planted production forest – | ||||||
| Radiata pine | 2,631 | 2,761 | 2,995 | 2,996 | 3,583 | 3,625 |
| Douglas fir | 104 | 122 | 105 | 143 | 134 | 135 |
| Eucalypts | 5 | 3 | 2 | 3 | 4 | 3 |
| Other | 109 | 81 | 55 | 46 | 55 | 57 |
| Total planted production forest species | 2,849 | 2,967 | 3,157 | 3,188 | 3,776 | 3,820 |
| Total all species | 2,904 | 3,023 | 3,195 | 3,226 | 3,806 | 3,848 |
Figure 9.3 shows indigenous and exotic timber production from 1921 to 2001.
A mature stand of pinus radiata near Rotorua.
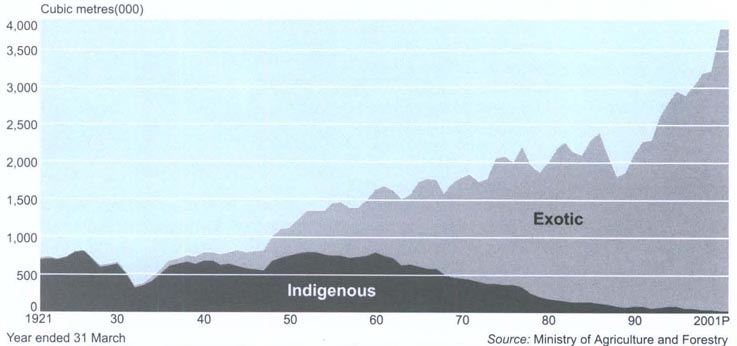
Round and split produce. As with forest products in general, most post and pole requirements formerly met by native timber are now met from plantation forests. The effective introduction and maintenance of timber preservation standards has greatly assisted utilisation of plantation-grown roundwood for these requirements.
Export wood chips. The export wood chip industry originated in the Nelson region. Other wood chip export ports include Whangarei, Mt Maunganui, Port Chalmers and Southport. Both native and exotic trees unsuitable for sawn timber production are used. The process also uses forest and sawmill residues which would normally be wasted. Chip exports during the year ended June 2001 totalled 301,000 bone-dry units.
Timber preservation. More than a million cubic metres of timber, including roundwood, is preservative treated in New Zealand each year. Factors which have encouraged growth in the timber preservation industry include the versatility, availability and high permeability of non-durable exotic softwood species such as radiata pine; regulations requiring timber to be preservative treated for particular uses; high levels of quality control; and a research programme carried out by Forest Research. Timber preservation has expanded markets for timber products in the building, farming and export sectors. The Timber Preservation Council is responsible for maintaining standards in the industry.
Quarantine and inspection. New Zealand's quarantine and inspection services provide a degree of insurance to the forest industry by limiting movement of insects and disease into and out of the country. Ministry of Agriculture and Forestry (MAF) protection officers inspect imported wood and wood products, including dunnage and packaging materials within shipping containers, bulk cargo, logs, sawn timber and manufactured wood products. Ships assessed as having called at high-risk countries may be inspected for gypsy moth, a potentially devastating insect for New Zealand's forestry industry. Inspection of forestry exports such as logs and timber is also undertaken by MAF protection officers where the importing country requires a phytosanitary certificate.
Wood utilisation standards. There are a number of inter-related standards required in the processing and use of timber. These promote safety and the correct processing and use of timber, and provide consumer protection and a sound basis for trading.
Pulp and paper. Annual production details of pulp and paper products from 1940 are shown in Figure 19.4 and recent annual production volumes of pulp and paper products are shown in table 19.5.
An export log preservation trial at Forest Research.
Table 19.5. Pulp and paper production
| Year ended 31 March | Wood pulp | Paper and paperboard | ||||
|---|---|---|---|---|---|---|
| Chemical1 | Mechanical2 | Newsprint | Other printing and writing paper | Other paper and paperboard | Total paper paperboard | |
1Chemical includes semi-chemical pulp 2Mechanical includes groundwood pulp, thermo-mechanical and chemithermo-mechanical pulp. P = provisional Source: Ministry of Agriculture and Forestry | ||||||
| tonnes | ||||||
| 1994 | 701,630 | 669,604 | 370,853 | 13,794 | 450,966 | 835,613 |
| 1995 | 684,454 | 675,935 | 374,865 | 14,924 | 486,398 | 876,187 |
| 1996 | 702,575 | 702,732 | 391,436 | 13,084 | 488,449 | 892,969 |
| 1997 | 652,308 | 724,956 | 384,147 | 11,870 | 481,135 | 877,152 |
| 1998 | 675,453 | 736,712 | 393,545 | 13,556 | 472,475 | 879,576 |
| 1999 | 645,032 | 755,707 | 383,372 | 11,586 | 419,356 | 814,314 |
| 2000 | 753,885 | 773,680 | 360,623 | 10,285 | 458,904 | 829,812 |
| 2001P | 744,991 | 827,286 | 380,614 | 4,155 | 486,838 | 871.607 |
The pulp and paper industry is mainly concentrated near the large planted production forests on the volcanic plateau of the North Island. All eight plants are located in the North Island, and four are integrated with sawmills to fully utilise the total input of wood. There are four main pulp and paper companies:
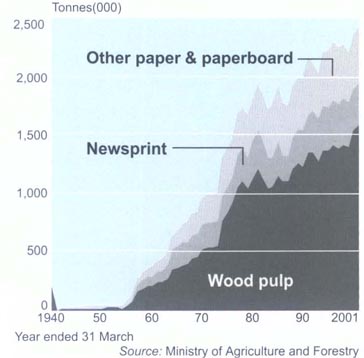
Norske Skog Australasia operates the Tasman pulp and paper mill at Kawerau, in the Bay of Plenty. This plant produces mechanical pulp, newsprint and directory paper.
Carter Holt Harvey operates pulp and paper plants at five sites in New Zealand. The Penrose, South Auckland, plant produces corrugated medium paper from recycled waste paper. At the large Kinleith site, near Tokoroa, bleached and unbleached market kraft pulp, linerboards and corrugated paper mediums are produced. A plant at Whakatane produces paperboard from mechanical pulp, outsourced kraft pulp and waste paper-based pulps. A tissue plant at Kawerau has a chemical thermo-mechanical pulp mill that manufactures a wide range of tissue, towelling and speciality grades. Carter Holt Harvey acquired Norske Skog's Tasman kraft pulp manufacturing business at Kawerau in March 2001.
Pan Pac Forest Products operates an integrated sawmill and thermo-mechanical pulp mill at Whirinaki, near Napier.
Winstone Pulp International has a chemical thermo-mechanical pulp mill at Karioi, near Waiouru. The plant uses wood from surrounding forests, as well as sawmill residues.
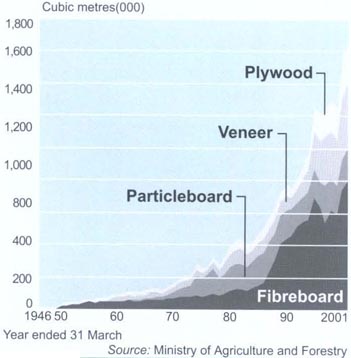
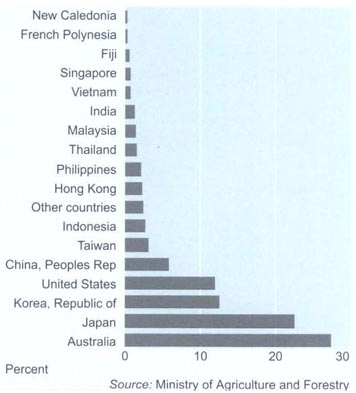
Panel products. Table 19.6 shows recent production volumes of veneer, plywood, particleboard and fibreboard. Figure 19.5 shows annual production volumes for wood panel products.
Table 19.6. Veneer, plywood, particleboard and fibreboard production
| Year ended 31 March | Veneer | Plywood | Particleboard | Fibreboard |
|---|---|---|---|---|
P = provisional. Source: Ministry of Agriculture and Forestry | ||||
| cubic metres | ||||
| 1994 | 140,516 | 96,953 | 175,786 | 553,670 |
| 1995 | 235,444 | 150,543 | 175,995 | 690,175 |
| 1996 | 259,928 | 160,481 | 159,082 | 632,019 |
| 1997 | 300,648 | 180,713 | 233,988 | 536,831 |
| 1998 | 292,171 | 189,447 | 196,395 | 613,345 |
| 1999 | 285,825 | 192,445 | 169,569 | 600,673 |
| 2000 | 378,282 | 239,947 | 188,054 | 744,879 |
| 2001P | 401,590 | 243,702 | 204,524 | 801,493 |
Exports. Forest products are important earners of overseas funds for New Zealand. In the year ended 30 June 2001, exports of forest products were valued at $3,569 billion, compared with $3.247 billion in 2000. Australia took 27 percent (by value) of exports, mainly in sawn timber, wood pulp and panel products. Japan took 23 percent, mainly logs, sawn timber, panel products, pulp and paper, and paperboard. The remaining 50 percent was taken by smaller customers, of which the largest was Korea, with 13 percent. Table 19.7 gives recent annual volumes of timber exports and Figure 19.6 shows provisional proportions of exports going to each country in 2001.
Table 19.7. Volume of timber exports
| Year ended 30 June | Sawn timber | Other | Total | Logs and poles | ||
|---|---|---|---|---|---|---|
| From natural forest | Radiata pine | Douglas fir | ||||
P = provisional. Source: Ministry of Agriculture and Forestry | ||||||
| cubic metres (000) | ||||||
| 1994 | 2 | 852 | 32 | 35 | 921 | 4,315 |
| 1995 | 1 | 994 | 42 | 28 | 1,065 | 4,802 |
| 1996 | 1 | 897 | 31 | 19 | 948 | 5,460 |
| 1997 | 2 | 1,017 | 41 | 23 | 1,082 | 5,915 |
| 1998 | 1 | 1,105 | 16 | 30 | 1,152 | 4,657 |
| 1999 | 1 | 1,202 | 61 | 34 | 1,298 | 5,190 |
| 2000 | 1 | 1,398 | 26 | 55 | 1,480 | 6,170 |
| 2001P | 1 | 1,353 | 35 | 103 | 1,492 | 6,175 |
Imports. The main categories of sawn timber imports are tropical hardwoods, Australian hardwoods and North American softwoods. Imported sawn timbers generally have specialist applications, such as weatherboards with a natural finish, decorative furniture, panelling and boat-building. Durable Australian hardwoods are imported for use as large poles, cross-arms and wharf, bridge and constructional timbers. Oregon pine, redwood and western red cedar, from North America, are imported for structural uses, exterior joinery and weatherboards. Speciality pulps, manufactured articles of paper and paperboard, together with paper and paperboard not produced in New Zealand, accounted for 77 percent of the value of total forest product imports in the year ended 30 June 2001. Table 19.8 shows annual volumes of timber imports since 1994.
Table 19.8. Volume of timber imports
| Year ended 30 June | Hardwoods | Softwoods | Total | Logs and poles |
|---|---|---|---|---|
P = provisional. Source: Ministry of Agriculture and Forestry | ||||
| cubic metres (000) | ||||
| 1994 | 8 | 23 | 32 | 3 |
| 1995 | 10 | 23 | 34 | 2 |
| 1996 | 13 | 24 | 38 | 2 |
| 1997 | 10 | 21 | 32 | 3 |
| 1998 | 11 | 19 | 32 | 3 |
| 1999 | 12 | 15 | 29 | 4 |
| 2000 | 13 | 20 | 35 | 4 |
| 2001P | 14 | 15 | 33 | 6 |
Table 19.9 shows annual values of forest product imports and exports since 1944.
Table 19.9. Overseas trade in forest products
| Year ended 30 June | Wood and wood products | Wood pulp | Paper and paper products | All forest products |
|---|---|---|---|---|
P = provisional. Source: Ministry of Agriculture and Forestry | ||||
| Imports cif | $(000) | |||
| 1994 | 114,804 | 12.749 | 485,560 | 613,113 |
| 1995 | 136,641 | 14,070 | 565,298 | 716,009 |
| 1996 | 163,355 | 17,655 | 596,785 | 777,795 |
| 1997 | 181,578 | 11,855 | 636,531 | 829,964 |
| 1998 | 202,980 | 8,880 | 666,511 | 878,371 |
| 1999 | 217,648 | 18,710 | 738,154 | 974,512 |
| 2000 | 263,995 | 7,596 | 832,263 | 1,103,854 |
| 2001P | 271,437 | 11,235 | 909,671 | 1,192,343 |
| Exports fob | ||||
| 1994 | 1,738,412 | 326,977 | 403,666 | 2,469,055 |
| 1995 | 1,720,893 | 480,862 | 430,782 | 2,632,537 |
| 1996 | 1,605,231 | 456,788 | 523,438 | 2,585,457 |
| 1997 | 1,625,339 | 344,086 | 409.954 | 2,379,379 |
| 1998 | 1,491,896 | 350,785 | 488,830 | 2,331,511 |
| 1999 | 1,562,242 | 353,918 | 535,451 | 2,451,611 |
| 2000 | 2,098,199 | 517,845 | 631,173 | 3,247,217 |
| 2001P | 2,289,741 | 602,306 | 676,661 | 3,568,708 |
Table 19.10 show annual import and export volumes of pulp and paper since 1994.
Table 19.1. Volume of overseas trade in pulp and paper
| Year ended 30 June | Wood pulp | Paper and paperboard | Total | |
|---|---|---|---|---|
| Newsprint | Other paper and paperboard1 | |||
P = provisional 1Products manufactured from paper and paperboard are excluded. Source: Ministry of Agriculture and Forestry | ||||
| Imports | tonnes | |||
| 1994 | 17,037 | 87 | 143,912 | 143,999 |
| 1995 | 14,324 | 65 | 174,981 | 175,046 |
| 1996 | 15,299 | 24 | 161,129 | 161,153 |
| 1997 | 18,690 | 1,987 | 226,047 | 228,034 |
| 1998 | 11,209 | 128 | 247,463 | 247,591 |
| 1999 | 21,662 | 105 | 302.973 | 303,078 |
| 2000 | 6,895 | 467 | 339.924 | 340,391 |
| 2001P | 8,839 | 105 | 311,400 | 311,505 |
| Exports | ||||
| 1994 | 628,928 | 251,712 | 117,029 | 368,741 |
| 1995 | 665,274 | 232,418 | 116,516 | 348,934 |
| 1996 | 654,326 | 245.972 | 121,710 | 367,682 |
| 1997 | 667,682 | 250,910 | 121,914 | 372,824 |
| 1998 | 626,579 | 262,060 | 171,422 | 433,482 |
| 1999 | 622,636 | 246,386 | 201,648 | 448,034 |
| 2000 | 687,624 | 228,022 | 252,070 | 480,092 |
| 2001P | 707,234 | 227,180 | 245,412 | 472,592 |
A beech forest near Lake Sylvester, west of Takaka.
New Zealand's Exclusive Economic Zone (EEZ) is one of the largest in the world. At 1.3 million square nautical miles, it covers an area 15 times New Zealand's land mass. In spite of the size of the zone, the waters are relatively deep and not particularly rich in nutrients and. because of that, the average productivity of fishery resources tends to be low. Less than one-third of the New Zealand EEZ is shallower than 1,000 metres, which is the fishable area where most fish resources occur. Only one-twentieth of the EEZ is coastal water shallower than 200 metres.
There are more than 1,000 species of marine fish in New Zealand's waters, about 100 of which are commercially significant. Species include shallow water shellfish, open water migratory pelagic fish and deepwater species, which live more than a kilometre below the surface. The fisheries range from numerous, but mostly small, resources of subtropical species in the north, to moderate resources of many warm temperate species on the shelves around the main islands, to large resources of a few cool water species on the extensive plateau to the south-east and east of the country.
Fisheries within New Zealand's Exclusive Economic Zone (EEZ) are a ‘common property’ resource and the government has an important role in ensuring their use is sustainable. In practice, this means ensuring the fisheries are not overfished, while balancing the competing demands of various user groups. Because most New Zealanders, at some time or other, use the fisheries as a source of food, for work or for relaxation, demands on the fisheries are steadily increasing. In under 30 years, the commercial fishing industry has expanded from a small, domestic industry to a 1.5 billion-dollar-a-year export business.
The main method used to manage fisheries in New Zealand is the Quota Management System (QMS), a system based on controlling the levels of catch. Under this system, catch limits are set for each fish stock and rights to harvest fish for sale are acquired by purchasing or leasing quota. The main goals of the QMS are to set sustainable commercial catch limits and to improve economic efficiency in the fishing industry. The QMS also provides security for participants in the fishing industry to invest in harvesting and processing capacity. The QMS applies throughout the New Zealand EEZ for main commercial species.
Catch limits, known as Total Allowable Catches (TACs) and Total Allowable Commercial Catches (TACCs), are reviewed annually. The review process involves consideration of the latest fisheries research and stock assessments, and consultation with representatives from the commercial fishing industry, Maori, recreational fishing groups and environmental organisations.
A large catch of hoki.
Table 19.11 shows TACCs of fish and shellfish for 2001–2002.
Table 19.11. Total allowable commercial catch (TACC) 2001–20021
| Fish or shellfish | Tonnes |
|---|---|
1Excludes tuna species. 2From 1/2/02 the TACC will be 420,150 kilograms. Source: Ministry of Fisheries | |
| Alfonsino | 2,995.70 |
| Anguilla (South Island freshwater eels)2 | 376.22 |
| Barracouta | 32,672.50 |
| Black cardinal fish | 3,670.00 |
| Blue cod | 2,681.50 |
| Blue moki | 608.11 |
| Blue warehou | 4,512.36 |
| Bluenose | 3,058.40 |
| Elephant fish | 1,068.50 |
| Frostfish | 3,858.00 |
| Gemfish | 1,060.39 |
| Ghost shark | 2,943.00 |
| Ghost shark, pale | 803.00 |
| Grey mullet | 1,005.60 |
| Gurnard | 5,147.28 |
| Hake | 14,066.54 |
| Hapuku/bass/groper | 2,181.60 |
| Hoki | 200,010.00 |
| Jack mackerel | 60,547.23 |
| John Dory | 1,106.70 |
| Ling | 19,843.20 |
| Mixed flats | 6,670.30 |
| Orange roughy | 15,921.00 |
| Oreos | 20,143.00 |
| Oysters | 505.00 |
| Oysters (Foveaux) | 14,950,000 units |
| Packhorse rock lobster | 40.30 |
| Paua | 1,194.16 |
| Red cod | 16,074.09 |
| Ribaldo | 1,282.00 |
| Rig | 2,034.08 |
| Ruby fish | 595.00 |
| Scallop | 760.00 |
| School shark | 3,120.18 |
| Sea perch | 1,778.00 |
| Silver warehou | 9,512.20 |
| Snapper | 6,494.60 |
| Southern blue whiting | 45,148.00 |
| Spiny rock lobster | 2,685.24 |
| Squid | 127,332.38 |
| Stargazer | 5,116.10 |
| Tarakihi | 5,994.16 |
| Trevally | 3,933.10 |
| Trumpeter | 144.00 |
| White warehou | 3,374.00 |
| Yellow-eyed mullet | 68.00 |
The Fisheries Settlement Act 1992 provided a legislated settlement of fishing claims with two main impacts. First, the settlement addressed the right of Maori to a commercial stake in New Zealand's fishing industry and a role in its management. The second part of the settlement was less well known, but no less important. It addressed claims to a non-commercial, customary fishing right.
The Kaimoana Customary Fishing Regulations were developed by the Crown and Maori. They aim to provide effectively for customary non-commercial fishing, while ensuring sustainability of the resource. The introduction to the regulations clearly states the relationship between the regulations, the Treaty of Waitangi (Fisheries Claims) Settlement Act 1992 and the Treaty of Waitangi itself. The definition of customary food gathering in the regulations refers to traditional rights confirmed by the Treaty of Waitangi and the act. Regulations for the South Island were effective from April 1998 and in the North Island from February 1999.
The regulations cover non-commercial customary fishing only and do not remove the right of tangata whenua to catch recreational limits under amateur fishing regulations. Those given permission to take fish under customary fishing regulations cannot trade the fish, exchange the fish for money or accept any other form of payment. The regulations do not provide for commercial fishing. In the North Island, fish taken in freshwater fisheries are not covered by the regulations, but they are in the South Island.
Establishment of mataitai reserves is also covered by the regulations. These reserves provide a tool for tangata whenua to manage all non-commercial fishing in some of their traditional fishing grounds. Generally there is no commercial fishing within mataitai reserves.
Sealord trawler Rehua.
The regulations apply only in an area where tangata whenua have appointed tangata kaitiaki/tiaki for North Island areas and tangata tiaki/kaitiaki for areas in the South Island. Tangata kaitiaki/tiaki and tangata tiaki/kaitiaki are individuals or groups who can authorise customary fishing within their rohe moana, in accordance with tikanga Maori. Their appointments are notified by the tangata whenua of an area. Tangata whenua is defined in the regulations as the whanau, hapu or iwi which holds manawhenua manamoana over a particular area. To date more than 80 tangata tiaki/kaitiaki have been appointed in the South Island, and 13 tangata kaitiaki/tiaki in the North Island, with other appointments underway.
The sidebar Nga kai o te moana kaupapa tiakina gives more details about the Maori concepts used in this section.
The Treaty of Waitangi Fisheries Commission: Te Ohu Kai Moana was established following the agreement between Maori and the Crown over Maori commercial fishing rights and settlement of Maori commercial fishing claims. As a result of an interim settlement in 1989 and a final settlement in 1992, Te Ohu Kai Moana is now one of the largest single players in New Zealand's commercial fishing industry. Te Ohu Kai Moana Group – which includes interests in Sealord Group Ltd, Moana Pacific Fisheries Ltd, Chatham Processing Ltd, Pacific Marine Farms Ltd and Prepared Foods Group – owns approximately 33 percent by volume of New Zealand's commercial fisheries quota and has the right of ownership of 20 percent of the quota for all new species brought into the quota management system. Through ownership of fishing companies and quota, Te Ohu Kai Moana is responsible for more than $800 million worth of fisheries assets – more than triple the value of the original settlement.
A major task of Te Ohu Kai Moana is to devise a method to allocate, or distribute the benefits of, fisheries assets, but it also has a role in protecting and increasing the assets, and building capacity within Maori to manage the assets. Te Ohu Kai Moana helps coordinate Maori fishing activities to integrate Maori interests across both commercial and customary fishing. Within the commercial sector, it also works to build substantive mechanisms to assist integration and cooperation between aquaculture and wild fisheries. In proposals for allocation of pre-settlement assets and distribution of the benefits of post-settlement assets, Te Ohu Kai Moana also aims to provide a platform that takes into account the need for Maori to have appropriate influence at both the international and domestic level.
Te Ohu Kai Moana proposes that Maoridom, as a whole, cooperates to ensure that collective interests continue to grow in size and scope. As part of this, it is looking to make arrangements that have Te Ohu Kai Moana subsidiaries included among the entities working with iwi on joint venture arrangements to mutual advantage. It is looking to provide appropriate skill development over time to ensure that Maori can fill key positions in these companies. It is also looking to provide commercial mechanisms that ensure settlement assets remain with Maori and provide enduring benefits.
Te Ohu Kai Moana's role. By law, Te Ohu Kai Moana (TOKM) is charged with helping Maori to enter and develop the business and activity of fishing. Its functions include:
Development of a method of allocating pre-settlement fisheries assets and distributing the benefits of post-settlement fisheries assets to iwi, according to the provisions of the Maori Fisheries Act 1989, as amended by the Settlement Act and the Deed of Settlement.
Making available annual catch entitlements to iwi until an allocation scheme is in place. This includes providing catch entitlements to iwi at a rate calculated below true market rates.
Encouraging Maori into the business and activity of fishing.
Ensuring the widest possible iwi representation in the legislative process. TOKM has a major role in development of the Maori Fisheries Act 1989 to define how post-settlement assets are distributed, according to proposals developed after full consultation with Maori. The developed act will also set out requirements for the appointment, composition and powers of any organisation succeeding Te Ohu Kai Moana.
Implementation of a training and development strategy, through a charitable trust set up for that purpose, aimed at ensuring Maori have the skills to match their fisheries assets.
Allocation of assets to iwi. The Treaty of Waitangi Fisheries Commission: Te Ohu Kai Moana has formally recognised 78 iwi for fisheries matters. However, before fisheries assets can be returned to any iwi, its representative organisation is required to meet certain minimum constitutional standards with regard to representation (‘mandate’) and organisational structures.
Since advent of the quota management system, control of New Zealand's fisheries resources has been firmly held by New Zealanders and New Zealand companies. About 55 percent of the New Zealand catch (by greenweight) was taken by New Zealand-registered vessels in 1999/2000. Much of the remainder was caught by foreign-registered vessels working under chatter to New Zealand companies. Many of these vessels have been involved in such arrangements for a considerable time (some for a decade or more) and many carry a high proportion of New Zealand crew. The charter fleet dominates high-volume, deep-water catches such as hoki and southern blue whiting, and the seasonal squid.
Table 19.12 lists the number of registered fishing vessels.
Table 19.12. Registered commercial fishing vessels1
| Year | Foreign licensed vessels | Foreign chartered vessels | Domestic vessels |
|---|---|---|---|
1At 30 September. Source: Ministry of Fisheries | |||
| 1992 | 44 | 79 | 2,802 |
| 1993 | 25 | 167 | 2,707 |
| 1994 | 32 | 63 | 2,569 |
| 1995 | 32 | 54 | 2,575 |
| 1996 | 22 | 55 | 2,458 |
| 1997 | 16 | 59 | 2,170 |
| 1998 | 17 | 52 | 1.965 |
| 1999 | 10 | 46 | 1,861 |
| 2000 | 0 | 37 | 1,752 |
| 2001 | 0 | 36 | 1,700 |
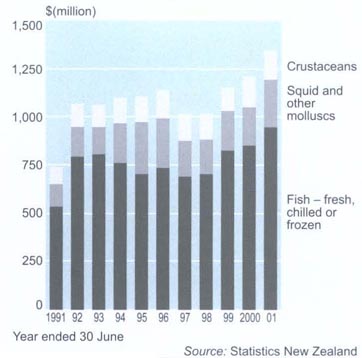
Exports. The seafood industry generated a record $ 1.2 billion in 1992 and since then annual seafood export receipts have remained about the same. Although exchange rates improved during 2000 and overseas seafood prices improved, these factors were offset by a fall in export volumes. Volumes have declined as companies have moved towards more value-added product forms, thereby reducing bulk. Figure 19.7 plots recent annual values of fisheries exports.
Table 19.13 shows recent annual export quantities and values of the main fish species exported, table 19.14 gives the values of fisheries exports to the three main markets and Table 19.15 shows recent annual quantities and values for finfish, rock lobster and shellfish exports.
Table 19.13. Principal fish exports
| Species | 1996 | 1997 | 1998 | 1999 | 2000 | |||||
|---|---|---|---|---|---|---|---|---|---|---|
| Quantity | Value | Quantity | Value | Quantity | Value | Quantity | Value | Quantity | Value | |
Source: New Zealand Seafood Industry Council | ||||||||||
| tonnes | $(m) | tonnes | $(m) | tonnes | $(m) | tonnes | $(m) | tonnes | $(m) | |
| (000) | fob | (000) | fob | (000) | fob | (000) | fob | (000) | fob | |
| Abalone | 1.0 | 41.2 | 1.1 | 61.3 | 1.0 | 45.3 | 1.0 | 55.8 | 0.9 | 75.8 |
| Barracouta | 13.6 | 16.3 | 12.8 | 15.4 | 10.3 | 13.4 | 10.5 | 13.2 | 9.3 | 12.4 |
| Gemfish | 1.0 | 9.6 | 1.0 | 10.9 | 0.5 | 4.3 | 0.5 | 5.2 | 0.4 | 6.5 |
| Hake | 6.3 | 26.1 | 8.3 | 30.6 | 8.1 | 3.5 | 7.7 | 40.3 | 6.1 | 39.2 |
| Hoki | 48.8 | 123.6 | 55.8 | 136.9 | 68.5 | 187.0 | 89.3 | 325.8 | 74.9 | 310.9 |
| Ling | 9.0 | 48.3 | 9.9 | 52.7 | 10.4 | 62.2 | 8.9 | 60.9 | 9.4 | 78.5 |
| Mackerel, blue | 2.6 | 2.5 | 3.3 | 2.8 | 2.7 | 2.9 | 4.5 | 4.1 | 5.6 | 5.3 |
| Mackerel, jack | 22.8 | 17.5 | 24.3 | 20.4 | 20.6 | 18.1 | 23.2 | 20.0 | 11.4 | 9.8 |
| Mussels | 26.9 | 97.6 | 27.1 | 87.0 | 33.2 | 118.2 | 29.3 | 116.9 | 28.1 | 169.2 |
| Orange roughy | 11.4 | 124.7 | 10.0 | 103.8 | 6.7 | 78.8 | 6.8 | 103.6 | 5.3 | 85.3 |
| Oreo dory | 5.6 | 23.5 | 6.0 | 21.3 | 5.4 | 22.2 | 6.6 | 28.1 | 5.2 | 28.6 |
| Rock lobster | 3.1 | 114.5 | 2.9 | 111.2 | 2.9 | 101.6 | 3.0 | 115.7 | 2.8 | 128.9 |
| Salmon | 5.6 | 34.2 | 3.6 | 28.2 | 3.8 | 32.2 | 2.9 | 29.9 | 2.5 | 31.9 |
| Scallops | 0.4 | 8.5 | 0.6 | 8.9 | 0.4 | 9.6 | 0.5 | 13.0 | 0.4 | 10.4 |
| Scampi | 1.1 | 21.4 | 1.0 | 19.8 | 0.8 | 16.4 | 1.0 | 22.0 | 1.0 | 25.0 |
| Snapper | 6.1 | 47.4 | 6.2 | 43.2 | 5.6 | 39.4 | 5.5 | 41.1 | 4.6 | 38.9 |
| Southern blue whiting 1.6 | 2.1 | 2.4 | 3.3 | 3.8 | 5.9 | 4.0 | 5.0 | 4.2 | 6.3 | |
| Squid | 54.4 | 117.9 | 40.2 | 72.6 | 36.7 | 64.0 | 23.3 | 41.2 | 13.5 | 41.9 |
| Tuna | 9.8 | 24.5 | 9.8 | 20.1 | 12.4 | 33.4 | 9.0 | 32.4 | 15.3 | 43.9 |
| Warehou | 7.7 | 26.6 | 9.3 | 28.7 | 8.6 | 23.1 | 7.7 | 28.6 | 8.2 | 34.3 |
Table 19.14. Value of fisheries exports to principal markets1
| Country | 1996 | 1997 | 1998 | 1999 | 2000 | |||||
|---|---|---|---|---|---|---|---|---|---|---|
| Percentage of total Value exports | Percentage of total Value exports | Percentage of total Value exports | Percentage of total Value exports | Percentage of total Value exports | ||||||
1Total includes exports to other markers. Source: New Zealand Seafood Industry Council | ||||||||||
| $(m) | $(m) | $(m) | $(m) | $(m) | ||||||
| fob | fob | fob | fob | fob | ||||||
| Japan | 345.5 | 29.3 | 283.4 | 25.2 | 258.0 | 20.9 | 288.6 | 21.6 | 318.7 | 22.2 |
| United States | 213.5 | 18.1 | 195.5 | 17.4 | 205.7 | 16.6 | 270.7 | 20.3 | 258.3 | 18.1 |
| Australia | 127.9 | 10.8 | 130.9 | 11.6 | 146.7 | 11.9 | 155.8 | 11.7 | 167.4 | 11.7 |
| Total fisheries exports | 1,179.2 | 1,125.4 | 1,236.8 | 1,334.1 | 1,431.5 | |||||
Table 19.15. Seafood exports
| Commodity exported | 1999 | 2000 | ||
|---|---|---|---|---|
| Quantity (thousand tonnes) | Value $(m) fob | Quantity (thousand tonnes) | Value $(m) fob | |
Source: New Zealand Seafood Industry Council | ||||
| Finfish (wetfish) | 261.5 | 954.2 | 229.6 | 958.8 |
| Rock lobster | 2.9 | 117.3 | 2.8 | 129.0 |
| Shellfish | 56.6 | 243.2 | 45.1 | 314.3 |
| Other crustaceans | 1.6 | 25.4 | 1.6 | 28.7 |
| Total | 322.6 | 1,340.1 | 279.1 | 1,430.8 |
Imports. Imports of fish and fish preparations into New Zealand in the year to December 2001, including provisional data, totalled 20,995 tonnes with a value of $117 million (cif). Imported fish products consisted largely of frozen shrimps and prawns, canned tuna, canned salmon and frozen tuna fillets.
Employment. The seafood industry provided 26,620 full-time equivalent jobs through direct employment and flow-on effects in 2000, according to the New Zealand Seafood Industry Economic Review 1997–2001. Employment in the industry in the mid-1990s rose by 14 percent, with jobs in the processing sector increasing by 41 percent. This growth was a direct result of the increasing proportion of catch taken by New Zealand-operated vessels and increased commitment to added value processing. The increase in processing jobs offset an 8 percent decline in jobs in catching and farming. The decline arose from work efficiencies in the catch sector and economies of scale in the aquaculture sector.
Measurements being taken during a rock lobster sampling programme.
Aquaculture. Greenshell mussels, salmon and Pacific oysters continue to be the mainstay of New Zealand's aquaculture industry. Greenshell mussels and salmon exports totalled $NZ 169 million and $NZ29 million respectively in 2000. Main markets were Japan, the European Union, Australia and the United States.
Production tonnages and the range of species farmed have increased substantially in recent years and the aquaculture industry is involved in research to extend the range of species and the technologies involved. This includes consideration of turbot and brill, oysters, sponges for chemical production, kingfish and rock lobster, as well as enhancement prospects for species such as paua, scallops and snapper.
Changes to industry organisation. Imposition by the government of full cost recovery of fisheries management and related research costs on industry has stimulated reorganisation of commercial stakeholder interests away from national industry associations into a wide variety of new bodies. These focus on the management and research needs of individual and related fisheries. The new organisations have generally been established as companies, with constitutions structured to represent the interests of quota owners and other commercial interests.
Between 1997 and early 2002, the New Zealand Fishing Industry Board (NZFIB), which oversaw orderly, profitable industry development, contracted most of its operations to the New Zealand Seafood Industry Council Ltd (SeaFIC), which was financed by a statutory levy collected by the NZFIB on all fish caught and processed by the New Zealand industry.
Invercargill mayor Tim Shadbolt enjoys Bluff oysters.
In early 2002, the NZFIB, along with the statutory levy, ceased to exist and SeaFIC began funding its operations through a different levy system under the Commodities Levy Act.
SeaFIC combines most of the operations of the NZFIB, the Fishing Industry Association and the Federation of Commercial Fishermen. Its focus is on issues of generic concern, such as refinement of fisheries law and regulation, further development of property rights in capture fisheries and aquaculture, fisheries science and research, trade policy and trade development, and information services to industry. The Seafood Industry Training Organisation operates as a business unit of SeaFIC.
Statistics on fish landed and fish exports are compiled annually by the New Zealand Seafood Industry Council (SeaFic). Statistics New Zealand produces broad economic data on the fishing industry through the Annual Enterprise Survey. A summary of results is given in Table 19.16.
Table 19.16. Fishing industry: statistical summary
| Financial item | 1998 | 19991 | 20001 | Percentage change from previous year | |
|---|---|---|---|---|---|
| 1999 | 2000 | ||||
1These figures are provisional. Source: Statistics New Zealand | |||||
| Financial performance $(million) | |||||
| Total income | 965 | 954 | 944 | -1.1 | -1.1 |
| Sales of goods and services | 942 | 928 | 920 | -1.5 | -0.9 |
| Interest, dividends and donations | 5 | 8 | 11 | 57.9 | 40.4 |
| Government funding, grants and subsidies | 2 | 0 | 2 | ... | ... |
| Non-operating income | 16 | 18 | 11 | 12.0 | -40.7 |
| Total expenditure | 878 | 832 | 818 | -5.3 | -1.7 |
| Interest and donations | 24 | 24 | 18 | -2.0 | -24.0 |
| Indirect taxes | 2 | 19 | 19 | ... | -3.6 |
| Depreciation | 60 | 55 | 48 | -7.7 | -12.0 |
| Salaries and wages paid to employees | 88 | 72 | 82 | -18.7 | 14.9 |
| Redundancy and severance | 0 | ... | ... | ... | ... |
| Salaries and wages to working proprietors (SW to WPs) | 12 | 5 | 15 | -60.0 | 217.9 |
| Purchases and other operating expenses | 687 | 647 | 621 | -5.8 | -4.0 |
| Non-operating expenses | 6 | 11 | 14 | 84.1 | 35.9 |
| Opening stocks | 36 | 31 | 36 | -14.1 | 15.6 |
| Closing stocks | 45 | 34 | 46 | -24.0 | 34.9 |
| Operating surplus before income tax | 99 | 127 | 141 | 29.2 | 10.8 |
| Financial position $(million) | |||||
| Total assets | 1,053 | 963 | 955 | -8.5 | -0.9 |
| Current assets | 230 | 188 | 231 | -18.1 | 22.8 |
| Fixed tangible assets | 575 | 530 | 544 | -7.8 | 2.6 |
| Additions to fixed assets | 88 | 56 | 40 | -36.3 | -29.2 |
| Disposals of fixed assets | 53 | 19 | 30 | -64.9 | 58.7 |
| Other assets | 248 | 245 | 180 | -1.3 | -26.7 |
| Total equity and liabilities | 1,053 | 963 | 955 | -8.5 | -0.9 |
| Shareholders funds or owners equity | 486 | 596 | 553 | 22.7 | -7.2 |
| Current liabilities | 372 | 137 | 254 | -63.1 | 84.7 |
| Other liabilities | 195 | 230 | 148 | 17.7 | -35.6 |
| Financial ratios2 | |||||
| Total income per full-time equivalent (FTE) | $201,900 | $181,500 | $200,200 | -10.1 | 10.3 |
| Operating surplus per full-time equivalent (FTE) | $20,600 | $24,200 | $29,900 | 17.5 | 23.6 |
| Current ratio | 61.8% | 137.1% | 91.1% | ||
| Quick ratio | 49.7% | 112.2% | 73.0% | ||
| Return on equity | 20.3% | 21.4% | 25.5% | ||
| Return on total assets | 9.4% | 13.2% | 14.8% | ||
| Liabilities structure | 46.1% | 61.9% | 57.9% | ||
| 19.1 | Ministry of Agriculture and Forestry; Statistics New Zealand. |
| 19.2 | Ministry of Agriculture and Forestry. |
| 19.3 | Ministry of Fisheries; Treaty of Waitangi Fisheries Commission; New Zealand Seafood Industry Council. |
| 19.4 | Ministry of Fisheries; New Zealand Seafood Industry Council; Statistics New Zealand. |
Statistics New Zealand divisional manager responsible: Tom Woodhouse.
A National Exotic Forest Description as at I April (annual). Ministry of Agriculture and Forestry, Wellington.
Branching Out – A Career in Forestry (1995). Ministry of Forestry, Wellington.
Business Activity Statistics (annual). Statistics New Zealand, Wellington.
Forestry Insights (a series of five education resource kits held by most New Zealand schools) (1992–1995). Forestry Insights, Auckland.
Forestry Projects – Sources of Assistance (1995). Ministry of Forestry, Wellington.
Forestry Report (quarterly). Ministry of Forestry, Wellington.
Forestry Sector Issues (2001). Ministry of Agriculture and Forestry, Wellington.
Hammond D (ed) (1995). Forestry Handbook, New Zealand Institute of Forestry, Christchurch.
National and Regional Wood Supply Forecasts 2000 (2000). Ministry of Agriculture and Forestry,
Wellington.
New Zealand Forestry Statistics 2000 (2001). Ministry of Agriculture and Forestry, Wellington.
New Zealand's Forest Growing and Wood Processing Sector: Regional studies (1997). 11v, Ministry of Forestry, from 2001 being updated by Ministry of Agriculture and Forestry, Wellington.
Report of the Ministry of Forestry (Parl paper C.16).
Statistical Release (series). Ministry of Agriculture and Forestry, Wellington.
Achieving Sustainable Fisheries (1996). Ministry of Fisheries, Wellington.
An Introduction to the Fisheries Act (1996). Ministry of Fisheries, Wellington.
Changing Course: Towards fisheries 2010 (1996). Ministry of Fisheries, Wellington.
Economy Wide Census 1987 (1987–1991). 7v, Department of Statistics, Wellington.
NIWA Technical Report (series). National Institute of Water and Atmospheric Research, Wellington.
New Zealand Journal of Marine and Freshwater Research (quarterly). Royal Society of New Zealand, Wellington.
Report of the Ministry of Fisheries (Parl paper C.20).
Report of the New Zealand Fishing Industry Board (Parl paper C.6).
Report of the Treaty of Waitangi Fisheries Commission Te Ohu Kai Moana (Parl paper C.19).
Hui-a-Tau (annual). Treaty of Waitangi Fisheries Commission: Te Ohu Kai Moana, Wellington.
Strategic Plan (annual). Treaty of Waitangi Fisheries Commission: Te Ohu Kai Moana, Wellington.
Table of Contents
Roughnecks on an oil rig drill floor wipe the drill pipe clean.
There have been general moves within the New Zealand economy since the mid-1980s to remove statutory barriers to competition and to reduce the government's direct involvement in business activities. These have included the removal of direct government involvement in the operational aspects of energy supply and demand through corporatisation of previously government-owned and operated energy trading departments. Energy markets have been substantially deregulated, with all sectors affected, including gas, oil, coal and electricity.
The Ministry of Energy divested the generation and transmission assets of its electricity division to the Electricity Corporation of New Zealand Ltd (ECNZ) in 1987. The Ministry of Energy itself was disestablished in 1989 and its policy and regulatory activities are now the responsibility of the resources and networks branch of the Ministry of Economic Development.
In the late 1980s, major energy sector changes included corporatisation of New Zealand's electricity generation and transmission, and deregulation of the petroleum industry, including removal of price controls on diesel and petrol.
The government's energy policy objective during the 1990s was to ensure the continuing availability of energy services at the lowest cost to the economy as a whole, consistent with sustainable development. This led to competitive markets operating within a stable regulatory framework set by the government.
Legislation passed in 1992 deregulated and reformed the electricity and gas industries, including removal of traditional electricity and gas franchise areas, removal of price control on gas, and corporatisation of electric power boards and municipal electricity departments. In 1994, Transpower New Zealand Ltd was established as a stand-alone, state-owned enterprise responsible for the national grid.
In 1996, New Zealand's major generator, ECNZ, was split into two state-owned enterprises with the formation of Contact Energy. In the same year, a competitive wholesale electricity market was established. ECNZ was further split into three competing state-owned enterprises on 1 April 1999 so that in total there had been four competing generators (Meridian, Contact Energy, Genesis and Mighty River Power) formed from the initial ECNZ. The government sold a 40 percent ‘cornerstone’ shareholding in Contact Energy to United States-based Edison Mission Energy in March 1999. A public share float closed in May 1999 with more than 225,000 New Zealanders purchasing shares in Contact Energy.
The energy sector in New Zealand is characterised by a number of activities that have strong natural monopoly characteristics. Notable among these are electricity and gas transmission and distribution lines. There is potential for owners of such facilities to over-charge and to restrict access to competitors, to the detriment of consumers and the economy as a whole.
The government introduced ‘light-handed’ regulation in the early 1990s, which depends on Commerce Act provisions to prohibit anti-competitive actions. The Commerce Act is supported by regulations that require extensive disclosure of information, in particular on the operation of electricity and gas lines. There are legislative powers available through the Commerce Act to introduce price regulation if necessary.
In 1998, the government instituted a round of reforms to further promote greater economic efficiency in the electricity generation, distribution and retail industries. The Electricity Industry Reform Act 1998 required local power companies to separate ownership and control of line businesses from energy retailing and generation activity by April 1999, and to dispose of one or other business by December 2003. Power companies complied well ahead of the specified time frame.
The New Zealand economy used only 14 percent more energy in 1998 than it did in 1990, in spite of a 21 percent growth in overall economic activity and a 12 percent growth in population. The energy to gross domestic product (GDP) ratio fell 3.6 percent between 1993 and 1994, 4 percent between 1994 and 1995, 1 percent between 1995 and 1996, 1.5 percent between 1996 and 1997 and 3.3 percent between 1997 and 1998.
Technical improvements made a key contribution to net improvements in energy intensity. Energy efficiency gains were achieved in spite of growth in more energy-intensive activities within the economy:
Transport: This is the largest and fastest-growing energy-consuming sector in New Zealand, accounting for 40 percent of total consumer energy use. Between 1991 and 1998, both overall passenger transport energy intensity and overall freight transport energy intensity decreased by 5 percent.
Residential: Between 199land 1998, residential sector energy use per capita declined by 5 percent. During this period, energy use per household decreased by 6 percent and energy use per square metre of floor area declined by 9 percent.
Commercial: The commercial sector's energy intensity declined by 24 percent between 1991 and 1998. Energy use per working person declined by 13 percent; energy use per square metre of floor area decreased by 16 percent; and energy use per building declined by 9 percent.
The decline in energy intensity is thought to be the combined result of increased energy efficiency of buildings and equipment and improved energy management practices by occupants.
The industrial sector produced approximately 25 percent of New Zealand's GDP and used 33 percent of consumer energy in 1998. A few relatively large energy users dominate New Zealand's industrial sector, with more than 70 percent of total industrial energy use occurring within the basic metals, food and paper products sub-sectors. Between 1992 and 1998, industrial sector energy use decreased by approximately 9 percent. During the same period, this sector's output (measured in constant 1991/92 prices) grew by nearly 26 percent, even though the rate of change was not constant.
The declining trend in energy use and the rising trend in GDP growth suggests that New Zealand has succeeded in decoupling energy use from the level of economic activity.
Hau Nui wind farm in the Wairarapa. Each turbine can produce up to 500 kilowatts of power.
Table 20.1 shows government spending for energy efficiency from 1998 to 2002.
Table 20.1. Government funding for energy efficiency1
| Year ended 30 June | 1998 | 1999 | 2000 | 2001 | 2002 |
|---|---|---|---|---|---|
1Excludes funding for research or complementary initiatives such as transport policies which also address climate change. 2The new EECA was established under the Energy Efficiency and Conservation Act 2000 and began its operational and policy activities on 1 July 2000. 3Includes $2–25m allocated to conduct a campaign responding to the shortage of hydroelectricity. 4The Ministry for the Environment also provides policy advice on energy efficiency, effective from I July 2000. 5Capital contribution of$0.4m in 2001 and an additional capital injection of $0.1m in 2002 have been excluded. All figures are GST inclusive. Source: Energy Efficiency and Conservation Authority | |||||
| $(million) | |||||
| Energy Efficiency and Conservation | |||||
| Authority (EECA)2 | |||||
| Crown funding | 5.6 | 5.0 | 4.6 | 6.8 | 8.53 |
| Other revenue | 0.5 | 0.6 | 0.6 | 0.4 | 0.4 |
| Grant Schemes | 4.0 | 2.5 | 2.0 | 2.0 | 2.0 |
| Crown Loan Scheme | 1.0 | 1.0 | 1.0 | 1.0 | 1.0 |
| Crown funding for Ministry for the Environment4 | N/A | N/A | N/A | 0.3 | 0.3 |
| Total funding5 | 11.1 | 9.1 | 8.2 | 10.5 | 12.2 |
The government's National Energy Efficiency and Conservation Strategy was publicly released in September 2001 after 15 months of preparation. It will result in economic, social and environmental benefits for New Zealand, playing a significant part in New Zealand's response to climate change, and providing tangible commitment to sustainable development.
The strategy aims to improve New Zealand's energy efficiency by 20 percent by 2012. It also seeks to increase renewable energy production (eg wind, solar, geothermal and biomass) by between 19 and 42 percent by 2012.
Analysis indicates that for an investment of $1.1 billion, New Zealand can expect benefits worth around $2 billion. The strategy is a key plank in New Zealand's efforts to develop a sustainable energy future. Benefits that can be expected include a more productive and internationally competitive economy, a cleaner environment, healthier and happier communities in warmer and drier homes, increased transport choices, more jobs and industry development, and less chance of energy supply disruptions and price shocks.
The strategy was required by the Energy Efficiency and Conservation Act 2000, the first time legislation has required New Zealand to implement energy efficiency and renewable energy initiatives on a national basis. The act also established the Energy Efficiency and Conservation Authority (EECA) to encourage, promote and support the uptake of energy efficiency and new renewable energy. EECA had a key role in developing the strategy, in conjunction with the Ministry for the Environment.
Containing numerous initiatives targeting the government, energy supply, industry, building and appliances and transport sectors, the strategy has the following objectives:
Central and local government
Fifteen percent improvement in energy efficiency in five years.
Commit to adopting sustainable energy principles.
Introduce policies and actions to support economy-wide sustainable energy.
Energy supply
Increase renewable energy supply and develop industry base.
Improve efficiency in the energy sector.
Improve price signals to consumers.
Industry
Achieve international best practice in energy efficiency.
Maximise cost-effective use of renewable energy.
Buildings and appliances
Upgrade the energy efficiency rating of existing homes and commercial buildings.
Achieve best practice design in new buildings.
Improve appliance energy efficiency to best practice.
Transport
Reduce energy use by reducing the need for travel.
Improve performance of the transport fleet.
Increase use of low energy transport options.
New Zealand's energy sector is predicted to undergo significant change in the next 25 years as the demand for energy grows, the Maui gas field declines and new technologies become economic.
The Ministry of Economic Development predicted in 2000 that between 1998 and 2020, consumer energy demand would grow by 1.1 percent a year for an assumed 3 percent GDP growth scenario.
The Maui B production platform 16km off the southern Taranaki coast.
This represents a significant decline in the ratio of energy growth to GDP growth, from around 1.3 to 1 in the past 25 years to around 0.4 to 1 in the next 20 years, as the New Zealand economy becomes less energy intensive.
Residential sector consumer energy demand is projected to grow at around 2.1 percent a year between 1998 and 2020, the industrial and commercial sector to decline by 0.3 percent and the transport sector to grow by around 2 percent a year. During the same period, electricity consumption is projected to grow each year by around 1.8 percent, the consumer energy of coal by 0.7 percent, oil by 1.9 percent, while gas is projected to decline by an average of around 2.6 percent. The drawdown of the Maui field in the years to 2010 and likely closure of petrochemical plants will affect gas consumption.
In the baseline scenario, around 2,200 megawatts of new electricity generating capacity is projected to become economic between 2000 and 2020, as demand for electricity exceeds the economic capacity of the current system. Around 300 megawatts of gas combined cycle, 260 megawatts of geothermal and 675 megawatts of coal are projected to become economic in the same period, along with around 395 megawatts of hydro, 295 megawatts of cogeneration, 150 megawatts of wind and 125 megawatts of distillate plant.
Composition of electricity generation is projected to change significantly as new increments are installed, when Huntly switches to coal, and as gas prices rise above coal prices in the years leading up to 2005. The share of electricity generation from the hydro system is expected to decline from 65 percent in 1998 to around 52 percent in 2020 and the gas share from around 20 percent in 1998 to around 15 percent in 2020. Electricity generated from coal is expected to experience rapid fuel share growth, from around 5 percent in 1998 to around 14 percent in 2020.
The following points should be considered when examining table 20.2:
Supply data is compiled from monthly returns. Figures for geothermal are estimated. Approximately 80 percent of geothermal is used as an input to electric power generation. The rest is used directly as a heat source. Liquified petroleum gas (LPG) production is included in indigenous oil production.
Total primary energy supply is the amount of energy available for use in New Zealand for energy conversion and end use. Primary energy = indigenous production + imports - exports +/- stock change - international transport.
Transformation of energy from one form to another always results in conversion losses, which are shown as negative entries in the table. Efficiencies for electricity generation are assumed to be 34 percent for gas and coal plants and 30 percent for cogeneration. Hydro and wind are taken as being 100 percent efficient and geothermal as 10 percent.
Consumer energy (calculated) = total primary energy supply + total transformation + non-energy used (primary energy used for other purposes, eg bitumen for roads and natural gas as feedstock to produce methanol and ammonia/urea).
Energy demand. Consumption data is estimated from information about where and how energy is used. Transport refers to road, rail and domestic air transport. Direct use of geothermal energy for commercial consumption is included in the domestic figure.
Consumer energy (observed) = agriculture + industrial + commercial + domestic transport.
The Ohaaki geothermal power station north of Taupo.
Table 20.2. Energy supply and demand balance, excluding coal 20001,2
| Oil | Gas | Hydro | Geothermal | Other renewables | Electricity | Total | |
|---|---|---|---|---|---|---|---|
1Data for coal unavailable due to confidentiality requirements. 2Year ended December. Source: Ministry of Economic Development | |||||||
| Petajoules | |||||||
| Supply | |||||||
| Indigenous | |||||||
| production | 83.5 | 235.2 | 87.8 | 86.0 | 51.9 | – | 544.4 |
| + Imports | 267.6 | – | – | – | – | – | 267.6 |
| - Exports | 64.2 | – | – | – | – | – | 64.2 |
| - Stock change | 2.4 | – | – | – | – | – | 2.4 |
| - International transport | 36.4 | – | – | – | – | – | 36.4 |
| Total primary energy supply | 248.1 | 235.2 | 87.8 | 86.0 | 51.9 | – | 709.0 |
| Transformation | |||||||
| Electricity generation | – | -73.7 | -87.8 | -65.2 | -1.3 | 127.9 | -100.1 |
| Cogeneration | – | -17.8 | – | -0.9 | -21.0 | 9.9 | -29.8 |
| Liquid fuels production | -5.8 | – | – | – | – | – | -5.8 |
| Losses and own use | -4.4 | -6.1 | – | -6.0 | – | -11.8 | -28.3 |
| Total transformation | -10.2 | -97.5 | -87.8 | -72.1 | -22.3 | 126.0 | -163.9 |
| Non-energy use | -13.9 | -98.6 | – | – | – | – | -112.5 |
| Consumer energy (calculated) | 224.0 | 39.1 | 0.0 | 13.8 | 29.6 | 126.0 | 432.5 |
| Demand | |||||||
| Agriculture | 13.8 | – | – | – | – | 4.8 | 18.6 |
| Industrial | 13.2 | 23.7 | – | 11.2 | 23.0 | 47.9 | 119.0 |
| Commercial | 5.2 | 9.6 | – | – | 0.2 | 25.4 | 40.4 |
| Residential | 1.7 | 5.7 | – | 2.6 | 6.4 | 42.3 | 58.7 |
| Domestic transport | 186.2 | 0.1 | – | – | – | 2.1 | 188.4 |
| Consumer energy (observed) | 220.0 | 39.1 | – | 13.8 | 29.6 | 122.4 | 425.1 |
| Discrepancies | 6.0 | 0.0 | – | – | – | 3.6 | 9.4 |
Energy contributes about 3 percent to New Zealand's gross domestic product (GDP) and directly employs about 8,000 people, or around 0.5 percent of the workforce. The efficiency with which New Zealand produces and uses energy impacts directly on its international competitiveness, on its economic growth and on the quality of the environment.
New Zealand is self-sufficient in all energy forms apart from oil. In 2000, New Zealand was 73 percent self-sufficient in its total primary energy needs and 37 percent self-sufficient in oil, down from the 44 percent of 1996. Total primary energy supply in petajoules, from 1978 to 2000, broken into various sources, is shown in table 20.3.
Table 20.3. Total primary energy supply
| Calendar year | Coal | Imported oil & oil products | Indigenous oil (net) | Gas | Hydro | Geothermal | Other renewables | Total | Imported oil as % of total |
|---|---|---|---|---|---|---|---|---|---|
Source: Ministry of Economic Development | |||||||||
| Petajoules | |||||||||
| 1978 | 53.50 | 142.16 | 26.81 | 57.92 | 55.81 | 50.65 | 27.94 | 414.79 | 34.3 |
| 1979 | 47.70 | 145.84 | 17.90 | 38.06 | 65.73 | 45.68 | 27.38 | 388.30 | 37.6 |
| 1980 | 49.06 | 148.02 | 15.71 | 35.31 | 69.02 | 57.06 | 30.12 | 404.30 | 36.6 |
| 1981 | 48.88 | 139.06 | 21.04 | 43.63 | 70.14 | 54.42 | 30.76 | 407.92 | 34.1 |
| 1982 | 47.27 | 123.61 | 32.13 | 78.56 | 65.24 | 55.19 | 29.81 | 431.80 | 28.6 |
| 1983 | 53.09 | 124.15 | 31.52 | 85.43 | 70.39 | 70.94 | 29.75 | 465.27 | 26.7 |
| 1984 | 50.68 | 116.05 | 40.80 | 109.23 | 72.62 | 83.05 | 31.41 | 503.84 | 23.0 |
| 1985 | 45.57 | 115.36 | 31.38 | 140.56 | 70.24 | 78.93 | 31.07 | 513.11 | 22.5 |
| 1986 | 52.37 | 99.99 | 58.56 | 168.90 | 78.76 | 82.26 | 30.83 | 571.67 | 17.5 |
| 1987 | 48.06 | 104.74 | 59.44 | 162.80 | 78.15 | 71.70 | 32.05 | 556.94 | 18.8 |
| 1988 | 47.42 | 100.33 | 61.72 | 176.33 | 81.84 | 63.06 | 33.35 | 564.05 | 17.8 |
| 1989 | 51.51 | 114.09 | 57.01 | 181.46 | 80.40 | 79.26 | 33.78 | 597.52 | 19.1 |
| 1990 | 52.55 | 141.13 | 46.92 | 180.93 | 82.63 | 92.65 | 35.23 | 632.04 | 22.3 |
| 1991 | 46.61 | 137.59 | 46.63 | 196.26 | 81.60 | 96.16 | 34.97 | 639.81 | 21.5 |
| 1992 | 49.37 | 141.89 | 46.39 | 208.20 | 75.17 | 97.70 | 35.78 | 654.51 | 21.7 |
| 1993 | 54.57 | 144.52 | 44.04 | 203.05 | 83.73 | 101.99 | 36.13 | 668.03 | 21.6 |
| 1994 | 43.84 | 161.74 | 37.21 | 188.90 | 92.08 | 96.05 | 36.06 | 655.89 | 24.7 |
| 1995 | 48.80 | 189.40 | 31.22 | 179.16 | 98.13 | 93.30 | 36.38 | 676.39 | 28.0 |
| 1996 | 45.41 | 186.77 | 40.99 | 204.17 | 92.57 | 91.87 | 38.94 | 700.72 | 26.7 |
| 1997 | 48.03 | 182.14 | 49.65 | 218.92 | 84.94 | 95.95 | 41.93 | 721.56 | 25.2 |
| 1998 | 50.48 | 206.53 | 30.73 | 193.06 | 86.99 | 105.49 | 48.25 | 721.55 | 28.6 |
| 1999 | 49.57 | 223.56 | 26.71 | 223.53 | 83.60 | 115.24 | 50.95 | 773.16 | 28.9 |
| 2000 | 47.49 | 223.63 | 26.40 | 235.18 | 87.79 | 85.97 | 51.89 | 758.36 | 29.5 |
New Zealand's energy intensity (energy use per dollar of GDP) is among the highest of Organisation for Economic Cooperation and Development (OECD) countries. Total energy consumption was 453 petajoules in 2000, which was equivalent to about 3,430 litres of petrol per person, the same as in 1998. As table 20.4 shows, New Zealand's consumer energy (energy used by final consumers) is dominated by oil, comprising 220 petajoules a year (48 percent), electricity 122 petajoules (27 percent), coal 35 petajoules (8 percent), gas 39 petajoules (8 percent), with renewables such as geothermal, wastes and wood making up the remainder.
Table 20.4. Trends in consumer energy use
| Calendar year | Solid1 | Oil | Gas | Electricity | Geothermal2 | Total |
|---|---|---|---|---|---|---|
1Solid fuels include wood and other renewables. 2Direct use of geothermal. R = revised. Source: Ministry of Economic Development | ||||||
| Petajoules | ||||||
| 1954 | 55 | 59 | 2 | 16 | .. | 132 |
| 1964 | 48 | 90 | 2 | 30 | .. | 170 |
| 1974 | 41 | 151 | 7 | 58 | .. | 257 |
| 1984 | 40 | 140 | 48 | 83 | 30 | 341 |
| 1985 | 35 | 136 | 54 | 84 | 31 | 340 |
| 1986 | 41 | 141 | 53 | 88 | 32 | 355 |
| 1987 | 42 | 140 | 54 | 105 | 22 | 363 |
| 1988 | 55 | 147 | 52 | 94 | 13 | 361 |
| 1989 | 57 | 154 | 44 | 97 | 12 | 364 |
| 1990 | 71 | 162 | 40 | 100 | 11 | 384 |
| 1991 | 73 | 160 | 41 | 102 | 12 | 388 |
| 1992 | 69 | 171 | 41 | 100 | 13 | 394 |
| 1993 | 75 | 171 | 40 | 105 | 14 | 405 |
| 1994R | 71 | 186 | 37 | 107 | 13 | 414 |
| 1995 | 67 | 196 | 36 | 110 | 13 | 422 |
| 1996 | 68 | 197 | 35 | 113 | 13 | 426 |
| 1997 | 65 | 202 | 35 | 114 | 13 | 429 |
| 1998 | 67 | 204 | 37 | 118 | 14 | 439 |
| 1999 | 65 | 208 | 39 | 118 | 14 | 445 |
| 2000 | 65 | 220 | 39 | 122 | 14 | 460 |
Environmental impacts. The Resource Management Act 1991 ensures that environmental costs are recognised in the energy production planning process and that local impacts are avoided, remedied or mitigated. In the global environmental field, there is considerable debate about how best to deal with carbon dioxide emissions resulting from the use of fossil fuels (oil, gas and coal) and the associated risk of climate change. Considerable attention has focused on ‘polluter pay’ approaches, whereby perceived environmental costs are incorporated in energy prices through introducing low level carbon taxes or tradeable emission permits. New Zealand is a signatory to the Kyoto Protocol under which emission levels of greenhouse gases during 2008–2012 have to be reduced to levels prevailing in 1990. By 2002, the government had not ratified the protocol, however.
Greenhouse gas emissions. The energy sector contributes around 91 percent of New Zealand's national gross human-made carbon dioxide (CO2) emissions, with industrial processes contributing the remainder. Gross CO2 emissions from energy sources and industrial processes were about 31 million tonnes in 2000, compared with about 29 million tonnes in 1998 and are projected to increase by about 1.6 percent a year in the next two decades, with transport and electricity generation contributing most of the growth. New Zealand's emission of about eight tonnes of CO2 per capita, which has not changed much in recent years, compares favourably with those of most other developed countries. Other greenhouse gases emitted from energy sources include nitrous oxide (N,0) and methane (CH4). The agriculture sector is the main contributor to N2O and CH4 emissions, with the energy sector's contribution small.
Energy research and development. The government has a process for setting long-term priorities for the allocation of funds for research. Priorities set in 1992 for the five-year period to 1997/98 provided increased funding and a shift in focus from fossil fuels and traditional renewables (hydro and geothermal) to energy efficiency and non-traditional renewables (wind, biomass, biofuel etc). These priorities were reviewed in 1998 and funding for energy research and development was increased by 11 percent between 1997/98 and 1999/2000 to $6.42 million. This compared with an overall increase of 5 percent in funding from the Foundation for Research, Science and Technology (FRST). FRST funding for energy research increased further in 2001/02 to about $10.1 million. Allocated expenditure across broad areas is as follows: Petroleum and coal 49 percent, energy efficiency and non-traditional renewables 20 percent, geothermal 14 percent, and other non-specific areas 17 percent.
Fuel share. Depending on demand, rainfall and lake storage conditions, about 70 percent of New Zealand's electricity demand is met by renewable resources, with hydro contributing 64 percent in 2000 and geothermal 6 percent. More than two-thirds of hydroelectricity is generated in the South Island and all geothermal electricity is generated in the North Island. Most of the balance of electricity demand is met by generation from natural gas (25 percent in 2000), with a small amount from coal and a small but increasing contribution from non-traditional renewables, wind and landfill gas. Table 20.5 shows a time series of electricity generation in gigawatt hours by fuel type.
Table 20.5. Electricity generation by fuel type
| Calendar years | Hydro | Geo | Oil | Coal | Gas | Biogas | Steam | Wood | Wind | Total |
|---|---|---|---|---|---|---|---|---|---|---|
1Negative generation due to net import of electricity into the station to maintain station viability and system voltage stability. R = revised. Source: Ministry of Economic Development | ||||||||||
| Gigawatt hours (GWh) | ||||||||||
| 1992 | 20,882 | 2,180 | 188 | 1,044 | 7,005 | 156 | 63 | 336 | 0.7 | 31,853 |
| 1993 | 23,258 | 2,284 | 59 | 563 | 6,542 | 156 | 63 | 336 | 1.0 | 33,262 |
| 1994 | 25,579 | 2,140 | 10 | 509 | 5,137 | 162 | 63 | 336 | 1.0 | 33,938 |
| 1995 | 27,259 | 2,049 | 47 | 687 | 4,539 | 202 | 63 | 336 | 1.0 | 35,153 |
| 1996 | 25,713 | 2,020 | 15 | 974 | 6,422 | 227 | 63 | 311 | 8.2 | 35,753 |
| 1997R | 23,594 | 2,130 | (14)1 | 1,279 | 8,074 | 139 | 335 | 312 | 13.5 | 35,863 |
| 1998R | 24,165 | 2,386 | (1)1 | 1,043 | 8,086 | 137 | 481 | 409 | 21.8 | 36,727 |
| 1999 | 23,221 | 2,637 | 0 | 1,183 | 8,294 | 114 | 570 | 438 | 38.8 | 36,497 |
| 2000 | 24,387 | 2,756 | 0 | 940 | 8,941 | 103 | 593 | 447 | 119.0 | 38,285 |
Generation. The four electricity generators arising from the break-up of the Electricity Corporation of New Zealand accounted for 79 percent of total generation capacity in 2000, with Meridian providing 32 percent, Contact Energy 22 percent, Genesis 14 percent and Mighty River Power 11 percent. Smaller generating schemes provided a combined 17 percent, with the remaining 4 percent of total generation capacity coming from on-site cogenerators.
Transmission. In April 1994, the Electricity Corporation of New Zealand Ltd's (ECNZ) transmission business was separated from ECNZ into a new state-owned enterprise, Transpower (New Zealand) Ltd. Transpower is the owner and operator of the high voltage electricity transmission grid, including the direct current link between the North and South Islands, which links generators to distribution companies and direct supply customers throughout New Zealand. Transpower also has primary responsibility for maintaining power quality and security between 40 or so grid injection points and more than 100 grid exit points.
Conveyance. New Zealand is fully reticulated through a national (high voltage) transmission network and local (low voltage) distribution networks largely operated by the electric power companies. Power transmission between the North and South Islands is via a high voltage direct current link from the Benmore power station in the South Island to Haywards substation just north of Wellington. Part of this link is a submarine cable running under Cook Strait. The link allows surplus power generated in the South Island to be transmitted to the North Island, where demand is greatest, but also allows transmission from north to south.
Distribution. The Energy Companies Act 1992 required corporatisation of electric power boards and municipal electricity departments of local authorities. The resultant mix of companies included municipal, consumer/community trusts and private owners. Many amalgamations and mergers occurred, particularly between neighbouring companies. The Electricity Industry Reform Act 1998 required power companies to separate ownership and control of line businesses from energy retailing and generation activity. However, further reforms in August 2001 relaxed controls on line companies generating from new renewable resources, and also extended rights to generate small quantities of electricity from conventional plant.
From April 1999, the electricity industry, as required by the government, put in place a low cost system to enable domestic and small consumers of electricity to switch suppliers. Such switching has developed steadily, although the major cause of consumer migration in 2001 was the purchase of retailing businesses by major generator-retailers, as high winter prices put pressures on retailers without generation. Government pressures have led to retailers offering variable pricing options to domestic consumers. Distributors are being encouraged to support this programme by lowering fixed charges.
From 2002, the industry has been moving towards adoption of industry-wide governance arrangements that will promote the rationalisation of transmission and distribution contracts.
The wholesale market. New Zealand's wholesale market for trading electricity, the New Zealand Electricity Market (NZEM), came into effect on 1 October 1996. The rules of the NZEM cover every aspect of trading, from entry criteria to the physical dispatch of electricity, and include procedures for the receipt of bids from purchasers and offers from generators, as well as financial settlement. They allow for a number of generators to compete to offer varying amounts of electricity via a pooled arrangement for dispatch and transmission through the national grid, operated by Transpower. Buyers compete to buy electricity from the pool for on sale to retail customers. As with other markets, interaction between supply and demand establishes price. NZEM is a self-regulating market, with a surveillance and compliance function built into its rules. NZEM is administered by The Marketplace Company Ltd (M-co).
Consumption. New Zealand's largest electricity-using sector is industry (an aluminium smelter, iron and steel works, several pulp and paper mills and large dairy factories), which accounted for 44 percent in 2000, followed by the household sector (33 percent) and commercial applications (23 percent). Table 20.6 compares electricity consumption by the residential, commercial and industrial sectors, by gigawatt hours, number of consumers and average price per kilowatt hour. Annual per capita end use is about 31 gigajoules (8,700 kilowatt hours).
Table 20.6. Electricity consumption by sector
| Year ended 31 March | Residential | Commercial | Industrial | Total consumption | ||||||
|---|---|---|---|---|---|---|---|---|---|---|
| Consumption | Number of consumers | Average price (excl. GST) | Consumption | Number of consumers | Average price (excl. GST) | Consumption | Number of consumers | Average price (excl. GST) | ||
R=revised. Source: Ministry of Economic Development | ||||||||||
| GWh | (000) | cents/KWh | GWh | (000) | cents/KWh | GWh | (000) | cents/KWh | GWh | |
| 1992 | 10,474 | 1,326 | 8.87 | 5,550 | 148 | 11.54 | 12,584 | 125 | 5.80 | 28,609 |
| 1993 | 10,124 | 1,333 | 9.21 | 5,397 | 145 | 11.47 | 12,265 | 130 | 6.07 | 27,786 |
| 1994 | 10,256 | 1,343 | 9.70 | 5,580 | 146 | 11.04 | 13,392 | 132 | 5.99 | 29,228 |
| 1995 | 10,416 | 1,356 | 10.24 | 5,675 | 139 | 10.86 | 13,834 | 132 | 5.84 | 29,925 |
| 1996 | 10,584 | 1,371 | 10.73 | 5,595 | 141 | 11.12 | 14,342 | 131 | 6.33 | 30,522 |
| 1997 | 10,959 | 1,377 | 11.45 | 6,101 | 138 | 10.99 | 14,200 | 136 | 6.12 | 31,260 |
| 1998R | 10,824 | 1,418 | 12.08 | 7,173 | 137 | 9.98 | 13,937 | 125 | 7.01 | 31,934 |
| 1999R | 11,290 | 1,423 | 11.61 | 7,334 | 140 | 9.72 | 14,010 | 127 | 6.98 | 32,635 |
| 2000 | 11,112 | 1,522 | 11.83 | 7,611 | 151 | 9.49 | 14,507 | 113 | 6.64 | 33,230 |
Oil, which includes condensate, crude oil and oil products, accounted for 249 petajoules (31 percent) of primary energy and 218 petajoules (48 percent) of consumer energy in the year ended March 2001.
The Marsden Point oil refinery in Northland.
Reserves. New Zealand's estimated remaining crude oil and condensate reserves are dominated by the Maui field which, at 1 January 2001, contained more than 60 percent of New Zealand's reserves, with Kapuni, Kupe and McKee dominating the balance.
Table 20.7 shows reserves and production figures for oil and condensate.
Table 20.7. Oil and condensate reserves and production
| Field | Reserves | Production | |||
|---|---|---|---|---|---|
| Ultimate Recoverable | As at 1 January 2001 | 2000 | |||
| Mm3 | Mm3 | PJ | Mm3 | PJ | |
1Includes LPG. Source: Ministry of Economic Development | |||||
| Kaimiro | 0.54 | 0.19 | 7.0 | 0.029 | 1.08 |
| Kapuni1 | 9.90 | 0.61 | 21.6 | 0.173 | 6.12 |
| Kupe | 2.59 | 2.59 | 95.4 | 0.000 | 0.00 |
| Maui1 | 38.57 | 12.37 | 402.3 | 2.013 | 65.45 |
| McKee | 7.57 | 0.79 | 30.1 | 0.191 | 7.28 |
| Mangahewa | 0.12 | 0.11 | 4.0 | 0.000 | 0.00 |
| Ngatoro | 0.63 | 0.17 | 5.4 | 0.055 | 1.73 |
| Piakau | 0.24 | 0.00 | 0.0 | 0.000 | 0.00 |
| Tariki/Ahuroa1 | 1.00 | 0.60 | 22.0 | 0.050 | 2.73 |
| Waihapa/Ngaere | 3.79 | 0.08 | 33 | 0.026 | 1.05 |
| Total | 64.95 | 17.51 | 591.1 | 2,537 | 85.44 |
Production. New Zealand's production of crude oil and condensate was 81.1 petajoules in 2000, all from onshore and offshore fields in the Taranaki region. About 75 percent of total production comes from the offshore Maui field. About 44 percent (36.6 petajoules) of oil production is in the form of condensate from the Kapuni and Maui fields. Around 37 percent of oil production (27.5 petajoules) is as crude oil, produced mainly at the McKee, Kaimiro, Waihapa and Ngatoro fields, and more recently from Maui's F Sands production field. The remaining 19 percent of oil production (15.8 petajoules) is as naphtha, produced at the Maui field. Average daily production of crude oil and condensate is 0.2 petajoules (about 35,500 barrels or 5.7 million litres). About 20 percent of local production is used for refinery feedstock and the rest is exported.
Refinery. New Zealand's only oil refinery is at Marsden Point, near Whangarei. Main feedstocks are imported crude oil (about 93 percent) and local crude oil and condensate (about 7 percent). The refinery produces petrol, diesel, aviation kerosene, fuel oils and bitumen.
Imports. New Zealand imports crude oil from Saudi Arabia, Australia, the United Arab Emirates, Malaysia and Indonesia. To meet demand, oil wholesalers also import refined petroleum. Imports of crude oil increased 45 percent from 1990 to 2000, in part due to the upturn in the economy.
Exports. New Zealand exported about 73 percent of local crude oil and condensate production in 2000. In addition, 2.4 percent of refined products is exported from New Zealand and 16 percent is used by international transport. Production and trade figures are given in table 20.8.
Table 20.8. Crude oil and condensate, production and trade
| Year | Crude oil and condensate | Refinery intake | Exports | |
|---|---|---|---|---|
| New Zealand production | Imports | |||
| Source: Ministry of Economic Development | ||||
| Gross petajoules | ||||
| 1989 | 79.17 | 137.88 | 188.46 | 27.56 |
| 1990 | 81.55 | 143.28 | 188.48 | 40.24 |
| 1991 | 85.28 | 143.84 | 182.52 | 44.88 |
| 1992 | 80.36 | 141.52 | 182.36 | 40.50 |
| 1993 | 84.70 | 158.38 | 192.28 | 47.58 |
| 1994 | 81.51 | 175.84 | 202.02 | 51.35 |
| 1995 | 68.33 | 169.37 | 196.28 | 44.11 |
| 1996 | 90.74 | 165.55 | 189.61 | 56.83 |
| 1997 | 120.56 | 168.30 | 212.29 | 77.70 |
| 1998 | 95.67 | 202.51 | 217.72 | 70.97 |
| 1999 | 84.34 | 198.77 | 212.72 | 63.45 |
| 2000 | 74.95 | 203.30 | 221.03 | 55.07 |
Self-sufficiency. New Zealand's primary self-sufficiency in oil depends on indigenous oil production and demand. From 1974 to 1986, self-sufficiency increased dramatically from below 5 percent to more than 50 percent. By 1995, with demand having increased faster than production, the figure was 36 percent. Self-sufficiency was at 37 percent for the year ended March 2000, with full production of naphtha from the Maui field and crude oil from the Maui F Sands, but declined to 34 percent for the year ended March 2001 due to lower production at several key fields.
Workers with a bit before an exploratory drill in the Canterbury Basin.
Distribution. A refinery-owned pipeline transports about a third of Marsden Point's refined production to Wiri (South Auckland) to supply the Auckland area. The rest of New Zealand is mostly supplied by coastal tankers supplying port depots, which in turn supply road tankers, which then distribute supplies to retailers.
Retailing. Traditionally, four major oil suppliers, BP, Caltex, Mobil and Shell, have serviced the New Zealand market. In April 1998, Challenge entered the market and towards the end of 1998, Australian independent Gull also began selling. Challenge imports product directly into New Plymouth. In July 2001, Caltex secured Commerce Commission approval to purchase Challenge.
End use. New Zealand's consumer energy is dominated by oil, comprising 218 petajoules (48 percent) of total consumer energy of 454 petajoules. Domestic transport dominates consumer energy use of petroleum products, with 85 percent of oil consumption being used for transport and 73 percent of this for road transport. Annual per capita end use of petroleum products is 57 gigajoules (about nine barrels or 1,466 litres).
Unleaded petrol. Unleaded regular grade petrol, introduced into New Zealand in 1987, comprised about 77 percent of total unleaded petrol demand for the year ending March 2000. Premium unleaded petrol made up the remainder, with the sale of leaded petrol banned since 1 October 1996.
Reserves. New Zealand's major gas resource is the Maui offshore field, which has about two-thirds of New Zealand's estimated economically recoverable gas reserves of around 2,200 petajoules. Kapuni and the as yet undeveloped Kupe field have about 12 percent each. Gas reserves are estimated to last until about 2015, with the Maui field possibly running out between 2005 and 2007.
Production. Total New Zealand natural gas supply in the year 2000 was 235 petajoules, 29 percent of total primary energy supply. Gas is produced predominantly in the Taranaki region, with the Maui and Kapuni fields accounting for about 90 percent. The McKee, Kamiro, Waihapa and Ngatoro fields produced most of the remaining 10 percent (see table 20.9).
Table 20.9. Gas reserves and production
| Field | Reserves | Production | ||||
|---|---|---|---|---|---|---|
| Recoverable | As at 1 Jan 2001 | Year ending 31 Dec, 2000 | ||||
| Mm3 | PJ | Mm3 | PJ | Mm3 | PJ | |
1Net of gas re-injection which occurs only at the Kapuni Field. 2Excludes LPG. Source: Ministry of Economic Development | ||||||
| Kamiro | 585 | 22 | 334 | 12 | 17.3 | 0.61 |
| Kapuni2 | 37,425 | 1,011 | 12,549 | 339 | 966.3 | 25.851 |
| Kupe | 7,476 | 309 | 7,476 | 309 | 0.0 | 0.00 |
| Maui2 | 108,375 | 4,130 | 35,094 | 1,337 | 4,692.0 | 188.27 |
| McKee | 3,283 | 138 | 1,290 | 54 | 228.8 | 9.36 |
| Mangahewa | 2,948 | 129 | 2,871 | 125 | 0.0 | 0.00 |
| Ngatoro | 224 | 10 | 86 | 4 | 39.0 | 2.01 |
| Piakau | 136 | 7 | 0 | 0 | 0.0 | 0.00 |
| Tariki/Ahuroa2 | 3,098 | 127 | 2,249 | 92 | 233.8 | 10.45 |
| Waihapa/Ngaere | 611 | 22 | 20 | 0.7 | 6.9 | 0.28 |
| Total | 164,161 | 5,905 | 61,969 | 2,273 | 6,184.1 | 236.83 |
Distribution. Natural gas distribution occurs only in the North Island and consists of 2,600km of high pressure gas transmission pipelines and low pressure distribution systems in most cities.
Electricity generation. Around 44 percent of New Zealand's natural gas production is used for electricity generation. Of the 32 petajoules of consumer energy reticulated from natural gas in the year ended March 2001, 21 petajoules were used in industry, about 5 petajoules each in the commercial and the residential sectors and 0.1 petajoules in transport (as compressed natural gas). Annual per capita end use of gas is 8.4 gigajoules (about 224 cubic metres).
Petrochemicals. About 42 percent of New Zealand's natural gas production in the year ended March 2001 was used to produce petrochemicals and chemical methanol at the Waitara and Motunui methanol plants. Crude methanol is produced from natural gas, primarily from the Maui and Kapuni fields, and is distilled into high (‘AA’) grade petrol. Some Maui and Kapuni gas is also used in the production of ammonia/urea.
The Kapuni gas field in southern Taranaki.
Compressed natural gas. Compressed natural gas (CNG) is supplied for the automotive market through a shrinking network of North Island service stations. The gas industry also produces liquefied petroleum gas, which is transported by sea and rail throughout New Zealand and exported.
Table 20.10 shows production and demand figures for gas.
Table 20.1. Gas production and demand
| Calendar year | Total gross natural gas production | Gas re-injected | LPG extracted | Flared | Production losses and own use | Net natural gas production | Direct sales (est) | Reticulated sales (est) |
|---|---|---|---|---|---|---|---|---|
| Source: Ministry of Economic Development | ||||||||
| Petajoules | ||||||||
| 1992 | 243.23 | 25.15 | 7.69 | 1.88 | 4.30 | 204.21 | 164.82 | 40.32 |
| 1993 | 237.70 | 24.79 | 7.98 | 1.57 | 4.41 | 198.95 | 158.87 | 39.65 |
| 1994 | 227.84 | 28.66 | 8.14 | 1.85 | 4.77 | 184.41 | 142.07 | 41.89 |
| 1995 | 207.67 | 19.41 | 7.61 | 1.24 | 4.72 | 174.68 | 132.03 | 42.18 |
| 1996 | 243.62 | 27.67 | 8.94 | 2.48 | 5.43 | 199.10 | 154.02 | 44.50 |
| 1997 | 253.43 | 20.48 | 9.78 | 3.97 | 5.76 | 213.43 | 161.23 | 51.65 |
| 1998 | 226.85 | 21.12 | 9.54 | 3.09 | 5.57 | 187.53 | 131.15 | 55.93 |
| 1999 | 253.46 | 17.74 | 10.02 | 1.93 | 5.56 | 218.21 | 159.36 | 58.22 |
| 2000 | 254.16 | 6.85 | 10.47 | 1.62 | 5.51 | 229.70 | 172.27 | 56.85 |
Resources. Coal occurs widely in New Zealand, with total in-ground coal resources estimated at about 15 billion tonnes. Of this, 8.6 billion tonnes is judged to be economically recoverable, made up of about 80 percent relatively low grade lignite, 15 percent middle grade sub-bituminous coal, and the remaining 5 percent bituminous coal. About 90 percent of the economically recoverable coal by weight, or 75 percent by energy content, is located in the South Island. Of the economically recoverable resources, about one-third is in existing mines, while the remainder could be mined without significant investigatory work.
Production. Coal production figures are confidential, but about 70 percent of coal production by energy content, comprising lignite, sub-bituminous and bituminous ranks, is produced in the South Island. Coal produced in the North Island, mostly from the Waikato region, is of sub-bituminous rank.
Exports. Export markets for premium grade New Zealand coals developed rapidly between 1991 and 1996, but declined during the next two years due to the collapse of the steel and coal markets. Coal exports from New Zealand have resumed steady growth since 1998.
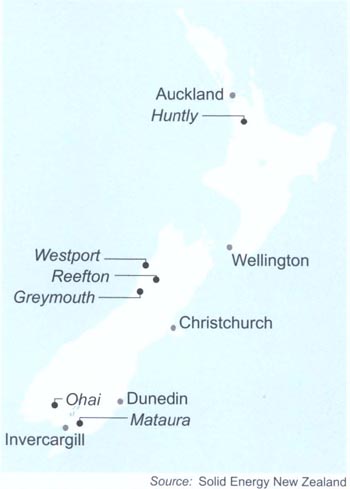
Coal transportation by aerial ropeway from the Stockton, West Coast, mine.
Table 20.11 shows coal export, production and consumption figures from 1992 to 1998. Data from 1998 onwards is confidential. Figure 20.1 shows the location of productive coal fields.
Table 20.11. Coal production, exports and consumption1
| Calendar year | Gross petajoules | Tonnes (000) | ||||
|---|---|---|---|---|---|---|
| Total production | Exports2 | Total consumption3 | Total production | Exports2 | Total consumption3 | |
1Data from 1999 onwards is confidential. 2Based on information obtained from Statistics New Zealand (INFOS database). Exports of coal include bituminous and lignite. 3This hybrid series includes exports, electricity generation (including cogeneration) and basic metals consumption. The difference between production and consumption is a change in stock levels. Source: Ministry of Economic Development | ||||||
| 1992 | 73.40 | 24.15 | 76.90 | 2,948.5 | 769.7 | 3,148.6 |
| 1993 | 79.24 | 24.71 | 76.10 | 3,098.6 | 787.6 | 3,082.5 |
| 1994 | 76.48 | 32.74 | 81.28 | 2,997.6 | 1,043.6 | 3,202.5 |
| 1995 | 91.50 | 42.71 | 91.63 | 3,446.0 | 1,333.8 | 3,477.3 |
| 1996 | 96.21 | 50.90 | 98.92 | 3,610.6 | 1,589.5 | 3,698.7 |
| 1997 | 86.85 | 38.90 | 90.71 | 3,370.7 | 1,243.6 | 3,521.4 |
| 1998R | 84.53 | 34.18 | 80.17 | 3,319.2 | 1,092.8 | 3,165.3 |
End use. Main end users of coal in New Zealand for the year ending March 2001 were the iron and steel industry 31 percent, electricity generation (including cogeneration) 20 percent, other industry (mainly cement, lime and plaster, meat, dairy products, forestry and timber products) 34 percent, commercial 7 percent, and residential 3 percent. Annual per capita end use is about 8.6 gigajoules (320kg).
Solid Energy New Zealand Ltd. State-owned enterprise Solid Energy New Zealand Ltd produces about 3 million tonnes of coal a year – over three-quarters of New Zealand's total production, according to is website. It exports about 2 million tonnes a year, generating more than $100 million in export earnings annually. Its website is www.solidenergy.co.nz.
Renewables are a major part of New Zealand's total primary energy supply, contributing 220 petajoules, in 2001 (see table 20.12 for figures by renewable energy type, from 1994 to 2001). This is dominated by hydro and geothermal at around 78 petajoules and 89 petajoules in 2001 respectively. Total biomass and waste (wood and wood products) provided the next largest renewable contribution of 51 petajoules (35 petajoules from woody biomass and animal products, 15 petajoules from industrial waste and about 1 petajoule from biogas and landfill gas).
Table 20.12. Renewable energy1 supply and consumption (PJ)
| Calendar year | 1994 | 1995 | 1996 | 1997 | 1998 | 1999 | 2000 | 20012 |
|---|---|---|---|---|---|---|---|---|
1Sources of data include the Ministry of Economic Development's electricity annual questionnaires and Statistics Sew Zealand. 2Provisional data for 2001. 3Totals and subtotals may not add up due to rounding. 4Efficiency of geothermal plants for electricity generation has been assumed to be 10 percent prior to 2000. From 2000. it is assumed to he 15 percent. 5No data available. 6Refers to biomass and wastes only. Source: Ministry of Economic Development | ||||||||
| Total primary energy supply3 | 224.20 | 227.81 | 223.38 | 222.82 | 240.73 | 249.80 | 225.66 | 220.19 |
| Hydro | 92.08 | 98.13 | 92.57 | 84.94 | 86.99 | 83.60 | 87.79 | 78.77 |
| Geothermal4 | 96.05 | 93.30 | 91.87 | 95.95 | 105.49 | 115.24 | 85.97 | 89.30 |
| Other renewables | 0.004 | 0.004 | 0.030 | 0.048 | 0.079 | 0.140 | 0.428 | 0.493 |
| Solar5 | – | – | – | – | – | – | – | – |
| Wind | 0.004 | 0.004 | 0.030 | 0.048 | 0.079 | 0.140 | 0.428 | 0.493 |
| Tide, wave and ocean5 | – | – | – | – | – | – | – | – |
| Biomass and wastes26 | 36.06 | 36.37 | 38.91 | 41.89 | 48.17 | 50.82 | 51.47 | 51.63 |
| Woody biomass and animal products | 32.19 | 32.37 | 32.09 | 31.71 | 34.53 | 35.21 | 35.43 | 35.86 |
| Biogas and landfill gas | 2.01 | 2.13 | 1.81 | 1.74 | 1.71 | 1.51 | 1.38 | 1.27 |
| Municipal waste5 | – | – | – | – | – | – | – | – |
| Industrial waste | 1.86 | 1.87 | 5.01 | 8.44 | 11.93 | 14.09 | 14.66 | 14.50 |
| Total final consumption3 | 40.77 | 41.49 | 41.24 | 40.93 | 42.72 | 43.76 | 43.39 | 42.78 |
| Geothermal | 13.01 | 13.53 | 13.17 | 13.26 | 13.61 | 14.31 | 13.83 | 13.04 |
| Biomass and wastes2,6 | 27.76 | 27.96 | 28.07 | 27.67 | 29.10 | 29.45 | 29.56 | 29.74 |
| Woody biomass and animal products | 27.35 | 27.52 | 27.63 | 27.22 | 28.64 | 28.90 | 29.00 | 29.13 |
| Biogas and landfill gas | 0.06 | 0.06 | 0.06 | 0.07 | 0.07 | 0.14 | 0.15 | 0.18 |
| Municipal waste5 | – | – | – | – | – | – | – | – |
| Industrial waste | 0.35 | 0.37 | 0.38 | 0.39 | 0.40 | 0.41 | 0.42 | 0.43 |
Electricity generation. The major use of renewable energy resources in New Zealand is for electricity generation. About 70 percent of New Zealand's electricity is generated from renewable resources, predominantly hydro (64 percent) and geothermal (6 percent).
Direct use. Apart from electricity, 10 percent (44 petajoules) of consumer energy is provided by the direct use of renewables. This is dominated by wood (30 petajoules a year). Direct geothermal use for heating contributes 14 petajoules and wastes and biogas provide 0.6 petajoules. Annual per capita direct end use of geothermal energy is 4 gigajoules a person, with per capita end use of biofuels, predominantly wood, estimated at 7 gigajoules. While non-traditional renewable sources such as biomass, micro-hydro, wind and solar schemes make a small contribution to overall consumer energy supply, they have the potential to make a greater contribution in the future.
Landfill gas. Landfill gas is used to produce energy at plants in Auckland and Wellington.
Wind. The best sites for wind generation of electricity are those which experience wind speeds above 8–9 metres a second, have uniform annual wind speed distribution and are not too distant from the national grid. Most sites that meet the first two criteria are in remote areas distant from the national grid. The best sites for wind generation as a non-traditional renewable resource are those nearest to being commercially competitive at 6 to 8 cents per kilowatt hour. New Zealand's first commercial wind farm in the southern Wairarapa began generating electricity in June 1996. Several energy companies in the lower half of the North Island are considering wind farms as an alternative source of electricity generation. A 31.7 megawatt wind farm in the Tararua ranges is the largest in the Southern Hemisphere.
Solar. While solar energy is potentially available throughout New Zealand, amounts vary according to topography and regional, diurnal and seasonal variations. New Zealand's sunniest regions are near Blenheim, the Nelson-Motueka area and Whakatane, where the average duration of bright sunshine exceeds 2,350 hours a year. A large portion of New Zealand has at least 2,000 hours of sunshine a year. Peak solar energy supply is in the middle of the day, while peak household energy demand in New Zealand is morning and evening. This is unlike Australia or California where air-conditioning needs closely match supply. The main immediate markets for solar water heating in New Zealand are the residential and commercial building industries. The flat plate systems presently available are mostly limited to operating at temperatures below 60° Celsius in order to maintain a relatively high conversion efficiency of about 35–45 percent. This makes them useful for swimming pool heating and domestic hot water applications. Solar hot water technologies are cost effective in applications at 7–10 cents per kilowatt hour. Solar energy for water heating is currently priced at 13 to 16 cents per kilowatt hour. The main barrier to the dissemination of solar technologies is their initial capital cost. The general uptake could be assisted, however, by newly-introduced methods of energy ratings for buildings.
New Zealand has a wide variety of minerals reflecting its diverse geology and dynamic tectonic history. While it is best known for its gold production (just under 10 tonnes in 2000), there is also production of silver, ironsand, coal, aggregate, limestone, clay, dolomite, pumice, salt, serpentine, zeolite and bentonite. In addition, there are resources or potential for deposits of titanium (ilmenite beachsands), platinum, sulphur, phosphate, silica and mercury.
Excavation at New Zealand's largest gold mine at Macraes Flat, east Otago.
Mineral legislation. Minerals and coal in the ground can be Crown or privately owned. All gold, silver, uranium and petroleum is owned by the Crown. Ownership of other materials is identified by Land Information New Zealand. Permits to prospect, explore or mine Crown-owned minerals are issued under the Crown Minerals Act 1991. The relevant minerals programme and regulations are administered by Crown Minerals, a group within the Ministry of Economic Development. A permit from Crown Minerals does not give land access, which is negotiated with each landowner and occupier. Environmental impacts are regulated under the Resource Management Act 1991, with resource consents granted by district or regional councils.
Figure 20.2 shows New Zealand's metal deposits.
Gold. Gold is present in New Zealand in quartz veins, disseminated gold or finely dispersed through host rocks, and as alluvial (placer) gold in river gravels. The majority of gold production during 2000 came from two hardrock mines, Macraes Mine, at Macraes Flat, in east Otago, and Martha Mine, at Waihi, in the Coromandel area. Plant at Macraes, the largest mine in New Zealand, was expanded in 1999, lifting annual production from 94,000 ounces in 1998, to 180,000 ounces in 2000. The modern, opencast Martha Mine, which began operating in 1987, also carried out extensive expansion in 2000, increasing production to about 110,000 ounces and extending the mine life to approximately 2007. Alluvial gold mining takes place in the South Island, predominantly on the West Coast and in Otago and Southland. Extraction methods range from small hand-held plants worked by up to three people; to medium and large floating or skid-mounted plants fed by hydraulic excavators; to the Grey River dredge – one of the world's largest bucket-ladder dredges capable of processing 800 cubic metres of gold-bearing gravel an hour. Development of the versatile trommel and excavator mining method in New Zealand during the late 1970s provided a high-throughput, low-cost means of extraction, bringing many operators into the industry. Plant numbers peaked in 1988 at approximately 120, but have since declined to fewer than 40. The current trend is away from small plants to those of medium and large size, which have a high throughput, can mine to greater depths (more than 30m) and can efficiently recover the fine gold that characterises alluvial deposits of the South Island.
Silver. Silver is almost always associated with gold in various proportions. Historically, the Coromandel area has produced most of the silver mined in New Zealand, and production in recent years has been mostly from the Martha Mine.
Iron. New Zealand has a large resource of iron ore in the black sands of North Island west coast beaches, especially between Wanganui and Muriwai. Two deposits of titanomagnetite ‘ironsand’ are currently mined by BHP New Zealand Steel Ltd. The deposit at Waikato North Head has been mined since 1969. Mining is carried out using two bucket-wheel excavators and the ore is conveyed to concentration plants. The titanomagnetite concentrate slurry is then pumped through an 18km pipeline to the Glenbrook steel mill, where it is reduced in a solid state process and smelted with scrap in an electrically-fired furnace to produce a range of steel products. The operation at Taharoa, carried out since 1972, pumps titanomagnetite concentrate slurry to ships moored offshore for export to Japan, South Korea and China.
Ilmenite. Ilmenite-bearing sands occur at intervals over 320km of coastline along the western coast of the South Island. The largest known ilmenite resource is at Barrytown, where exploration by Westland Ilmenite Ltd has defined a 50 million tonne resource. South of Westport, Austpac Titanium Ltd has defined an indicated resource of between 17 and 30 million tonnes of contained ilmenite. Ilmenite is a source of titanium dioxide, which is used as an opacifier and a pigment in paint, paper, plastics, cloth and rubber. Garnet is a major component of the sand and zircon a minor component.
Platinum group metals. A number of areas in the South Island, particularly in Southland, are being explored for platinum group metals. The Longwood Range layered gabbro complex, in western Southland, is the only place in New Zealand where platinum has historically been produced, in association with alluvial gold.
Other metallic minerals. There are small deposits of manganese minerals in many localities. Some areas of Northland, Coromandel, Nelson and Westland have potential for base metals (copper, lead and zinc), but there is little prospecting. Iron ore, stibnite (antimony), orpiment (arsenic), chromite, monazite (rare earths), nickel and rutile have all been mined in the past. Cassiterite (tin) is known in Stewart Island. Bauxite is present in Northland, where reserves of 20 million tonnes have been identified. Cinnabar, the principal ore of mercury, was historically produced in limited quantities from sinter deposits in Northland.
Figure 20.3 shows New Zealand's mineral deposits.
Aggregates. Aggregates are produced from a variety of rocks, gravels and sands and are used in road construction and in concrete. Suitable rock for aggregate production is found throughout New Zealand. Aggregate production is dominated by several large companies – Firth Industries, Winstone Aggregates, Stevensons and Fulton Hogan. There are also many smaller companies supplying products for local needs.
Clays. Clays are found throughout New Zealand, and include bentonite, halloysite and kaolinite. They are used in the manufacture of sanitary ware, ceramics, bricks, tiles, pipes and pottery; as fillers in the manufacture of paper, paint, pharmaceutical and animal health products; and as pelletising agents. White halloysite from Matauri Bay, in Northland, is exported for the manufacture of fine ceramics and porcelain. Bentonite, found in substantial quantities in Hawke's Bay and Canterbury, is used as a bonding agent and for specialist drilling products. Although bentonite is still being imported for drilling operations because long-established overseas sources are commonly preferred, New Zealand bentonite is being increasingly used.
Dolomite. Dolomite rock, used in agriculture, glassmaking and for harbour protection blocks, is produced near Collingwood.
Greenstone. Nephrite and bowenite, popularly known as greenstone, are present in north Westland and northern Fiordland. A deposit of nephrite boulders in a tributary of the Arahura River has been the main source of greenstone. Best known occurrences of bowenite, the serpentine variety of greenstone, are in Fiordland. Boulders of greenstone are reduced in size using a portable diamond saw, and airlifted by helicopter. Ownership of greenstone was recently returned to Ngai Tahu, the largest Maori tribe in the South Island, as part of its Treaty of Waitangi settlement.
Limestone. Limestone is found throughout New Zealand and is used in cement manufacture, roading, industry and agriculture. High quality limestone from Te Kuiti and Nelson is processed for export. Limestone is also used in New Zealand as a filler in the paint, glass, rubber, plastic and paper industries. Marble, a crystallised form of limestone, is mined in Nelson and is used as a filler and in building construction.
Salt. Salt is produced by the solar evaporation of sea water at Lake Grassmere, in Marlborough. Low rainfall, long hours of sunlight and the right wind conditions make this locality the most suitable in New Zealand for salt production. About 60,000 tonnes is produced each year for domestic consumption.
Serpentine. Serpentine is a magnesium-rich rock used as a fertiliser additive and in the manufacture of decorative tiles. Deposits are mined at Wairere, in Northland, and at Greenhills, in Southland.
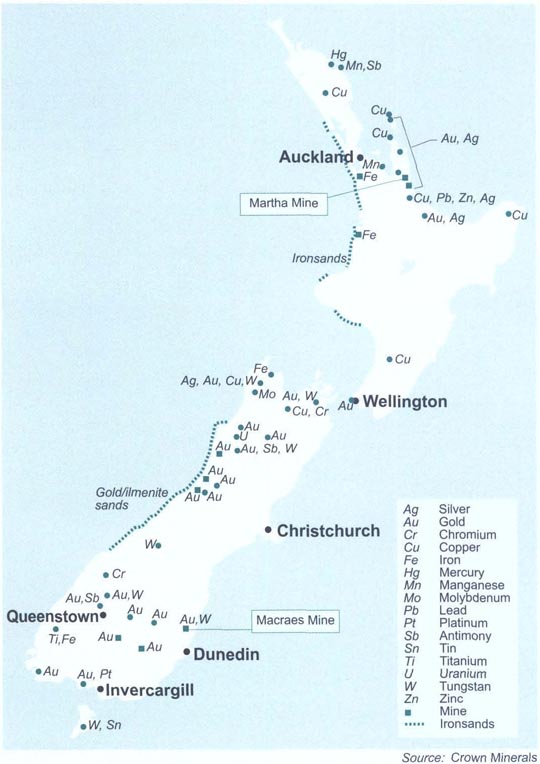
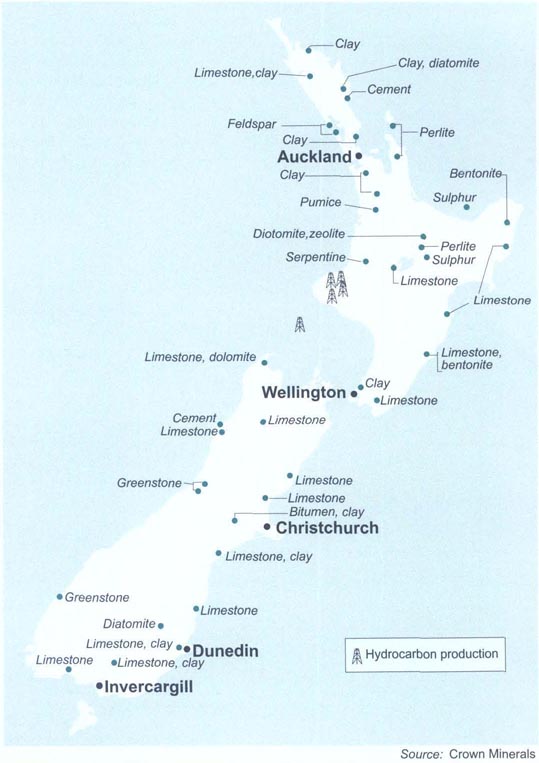
Silica sand. Northland, North Auckland and Canterbury have deposits of silica sand, mined for use in glass manufacture, foundry moulds and in the building industry.
Sulphur. Sulphur, mainly used in the production of agricultural fertiliser, is mined at Rotokawa, near Taupo.
Zeolite. Zeolite is mined at Ngakuru, in the central North Island near Rotorua. It is used in horticulture and as animal litter.
Other non-metallic minerals. The following non-metallic minerals, some of which have been mined in the past, are also present in New Zealand: Diatomite (industrial filtration), barite (industrial uses, including glassmaking and fillers), asbestos (building material), feldspar (glassmaking, ceramics and enamels), magnesite (agriculture), mica (electronics), phosphate (fertiliser), talc (cosmetics) and wollastonite (paper, asbestos substitute, ceramics, adhesives and plastics).
Broad economic data on the mining and quarrying industry is updated annually by Statistics New Zealand's Annual Enterprise Survey. Table 20.13 gives data for 1998 to 2000.
Table 20.13. Mining
| 1998 | 19991 | 20001 | Percentage change from previous year | ||
|---|---|---|---|---|---|
| 1999 | 2000 | ||||
1These figures are provisional. Source: Statistics New Zealand | |||||
| Financial item | $(million) | ||||
| Sales of goods and services | 1,965 | 1,764 | 2,022 | -10.2 | 14.6 |
| Interest, dividends and donations | 74 | 80 | 18 | 8.5 | ... |
| Government funding, grants and subsidies | 0 | 0 | 0 | ... | ... |
| Non-operating income | 52 | 62 | 32 | 19.9 | -49.1 |
| Total income | 2,091 | 1,906 | 2,072 | -8.8 | 8.7 |
| Interest and donations | 80 | 80 | 53 | -0.3 | -33.8 |
| Indirect taxes | 8 | 150 | 183 | ... | 22.3 |
| Depreciation | 401 | 364 | 370 | -9.1 | 1.4 |
| Salaries and wages paid to employees | 189 | 192 | 185 | 1.7 | -3.8 |
| Redundancy and severance | 5 | 1 | 1 | ... | ... |
| Salaries and wages to working proprietors | 4 | 6 | 6 | 50.5 | 1.2 |
| Purchases and other operating expenses | 718 | 691 | 711 | -3.7 | 2.8 |
| Non-operating expenses | 191 | 152 | 17 | -20.6 | ... |
| Total expenditure | 1,592 | 1,636 | 1,525 | 2.8 | -6.8 |
| Opening stocks | 110 | 102 | 100 | -7.7 | -1.9 |
| Closing stocks | 108 | 99 | 96 | -8.2 | -3.0 |
| Operating surplus before income tax | 503 | 277 | 553 | -45.0 | 100.1 |
| Current assets | 1,083 | 1,258 | 1,059 | 16.1 | -15.8 |
| Fixed tangible assets | 2,625 | 2,576 | 2,347 | -1.9 | -8.9 |
| Additions to fixed assets | 226 | 194 | 402 | -14.1 | 107.2 |
| Disposals of fixed assets | 24 | 56 | 51 | 134.4 | -8.4 |
| Other assets | 1,866 | 1,305 | 1,680 | -30.1 | 28.7 |
| Total assets | 5,574 | 5,139 | 5,086 | -7.8 | -1.0 |
| Shareholders funds or owners equity | 2,318 | 2,164 | 2,700 | -6.6 | 24.8 |
| Current liabilities | 1,252 | 1,593 | 1,018 | 27.2 | -36.1 |
| Other liabilities | 2,005 | 1,382 | 1,369 | -31.0 | -1.0 |
| Total equity and liabilities | 5,574 | 5,139 | 5,086 | -7.8 | -1.0 |
| Ratios | |||||
| Total income per full-time equivalent (FTE) | $593,500 | $590,600 | $708,800 | -0.5 | 20.0 |
| Operating surplus per full-time equivalent (FTE) | $142,700 | $85,700 | $189,300 | -39.9 | 120.9 |
| Current ratio | 86.5% | 79.0% | 104.1% | ||
| Quick ratio | 77.9% | 72.8% | 94.7% | ||
| Return on equity | 21.7% | 12.8% | 20.5% | ||
| Return on total assets | 9.0% | 5.4% | 10.9% | ||
| Liabilities structure | 41.6% | 42.1% | 53.1% | ||
Coverage. The mining and quarrying division of the Australian and New Zealand Standard Industrial Classification (ANZSIC) includes the extraction, dressing and purifying of minerals occurring naturally such as solids like coal and ores, liquids like crude petroleum, and gases like natural gas. Included are underground and surface mines, quarries, and all exploration, prospecting and drilling for minerals. All supplementary activities aimed at preparing crude materials for marketing are coded to the mining and quarrying division. Excluded is the refining or smelting of minerals or ores (other than the preliminary smelting of gold). Where a business undertakes both mining activities and manufacturing activities to further process mined material, but does not keep separate accounts for each, it is classified to manufacturing.
| 20.1 | Energy modelling and statistics unit (EMSU), Ministry of Economic Development; Energy Efficiency and Conservation Authority. |
| 20.2 | Ministry of Economic Development. |
| 20.3 | Ministry of Economic Development; Transpower; Electricity Networks Association; M-co. |
| 20.4–5 | Ministry of Economic Development. |
| 20.6 | Ministry of Economic Development; Solid Energy New Zealand. |
| 20.7 | Ministry of Economic Development. |
| 20.8 | Crown Minerals, Ministry of Economic Development; Statistics New Zealand. |
Statistics New Zealand divisional manager responsible: Mike Moore.
Annual Report (annual). Contact Energy Ltd.
Annual Report (annual). Electricity Corporation of New Zealand Ltd.
Barry JM, Duff SW, and MacFarlan DAB (1994). Coal Resources of New Zealand, Ministry of Commerce. Wellington.
Bradley DA (1983). Wave Power Generation, New Zealand Electricity, Wellington.
Cave MP, Lumb JT, and Clelland L (1999). Geothermal Resources of New Zealand. Resource Information Report 8, Ministry of Commerce. Wellington.
Cherry NJ (1987). Wind Energy Resource Survey of New Zealand: National resource assessment: summary and final report. Report 140, New Zealand Energy Research and Development Committee, Auckland.
The Coal Resources of New Zealand (1998). Coal Geology Report 4, Ministry of Energy, Wellington.
Economy Wide Census, Mining and Quarrying (1991). Department of Statistics, Wellington.
Energy Data File (six-monthly; 2000). EMSU, Ministry of Economic Development, Wellington.
Energy Efficiency: A guide to current and emerging technologies (1996). 2v, Centre for Advanced Engineering, University of Canterbury, Christchurch.
Explore New Zealand Petroleum (annual). Ministry of Economic Development, Wellington.
Geothermal Resources of New Zealand (1993). Resource Information Reports, Ministry of Commerce, Wellington.
Greenhouse Gas Emissions from New Zealand Energy Sources (annual). Ministry of Economic Development, Wellington.
Key Statistics (monthly). Statistics New Zealand, Wellington.
Mander NK (ed) (1999). Threshold 2000: Can our cities become sustainable? (1999). Proceedings of the 6th conference of the Sustainable Energy Forum held at Auckland in June 1999, Sustainable Energy Forum, Wellington.
New and Emerging Renewable Energy Opportunities in New Zealand (1996). Energy Efficiency and Conservation Authority, Wellington, and Centre for Advanced Engineering, University of Canterbury, Christchurch.
New Zealand Energy Outlook to 2020: A report (2000). EMSU, Ministry of Commerce, Wellington.
New Zealand Petroleum Handbook (1999). Louthean Publishing in association with Crown Minerals, Ministry of Economic Development, Wellington.
Renewable Energy Opportunities For New Zealand (1993). Ministry of Commerce, Wellington.
Taylor, PC (1999). New Zealand Coal Resources Survey Programme, 1976–1989. Ministry of Commerce, Wellington.
Explore New Zealand Mining 2001. Crown Minerals, Ministry of Economic Development, Wellington.
Kear D (ed) (1989). Mineral Deposits of New Zealand: The Gordon J Williams memorial volume. The Australasian Institute of Mining and Metallurgy, Parkville, Vic.
Key Statistics (monthly). Statistics New Zealand, Wellington.
Mineral Resources of New Zealand (2000). Crown Minerals, Ministry of Economic Development, Wellington.
New Zealand Mining (six-monthly). Crown Minerals, Ministry of Economic Development, Wellington.
Thompson B, Brathwaite B, and Christie T (1995). Mineral Wealth of New Zealand, Institute of Geological and Nuclear Sciences, Wellington.
www.contactenergy.co.nz – Contact Energy
www.eeca.govt.nz – Energy Efficiency and Conservation Authority
www.genesispower.co.nz – Genesis
www.irl.cri.nz – Industrial Research Ltd
www.med.govt.nz – Ministry of Economic Development
www.meridianenergy.co.nz – Meridian Energy
www.mightyriverpower.co.nz – Mighty River
www.nzelectricity.co.nz – New Zealand Electricity
www.solidenergy.co.nz – Solid Energy Ltd
www.stats.govt.nz – Statistics New Zealand
www.transpower.co.nz – Transpower New Zealand Ltd
www.windenergy.org.nz – New Zealand Wind Energy Association
Table of Contents
An operator checks carpet tufting machinery at Cavalier Bremworth Ltd, Auckland.
The environment in which New Zealand manufacturers operate has undergone significant change in the past decade.
Key features affecting import policy were the complete removal of import licensing in 1992 and the removal of tariffs on all imported goods for which there was no local manufacture of suitable alternatives. Tariffs were initially reviewed in 1987, with announcement of a five-step tariff reduction programme that halved the majority of tariffs between 1 July 1988 and 1 July 1992. This was followed by further annual reductions. Under a 1997/2000 programme, all ad valorem tariffs were to reduce to levels of 15 percent, 10 percent, or 5 percent by 1 July 2000. It was also announced that goods with a 5 percent tariff on 1 July 1996 would become duty free from 1 July 1998.
A review of post-2000 tariff policy was conducted in 1998, in the context of a decision announced in the 1997 Budget that all tariffs would reduce to zero well before 2010. Following that review, the Tariff (Zero Duty) Amendment Act 1998 was passed. It provided for the removal of most remaining tariffs on 1 July 2001, with all tariffs falling to zero by July 2006.
The end to the process of unilateral tariff reductions came with the government's announcement on 10 April 2000 that tariffs would be frozen until at least 1 July 2005. The government also announced that reductions scheduled for 1 July 2000 would not take place and it would move urgently to repeal the previous government's zero tariff legislation.
The government would, however, continue to remove tariffs on beer, paper, paper products and printed material, reductions agreed as part of the Uruguay Round of trade negotiations. In those cases, it said, New Zealand's major trading partners had also agreed to remove their tariffs over the same timeframe. The government removed tariffs on imports originating in Singapore on 1 January 2001 under an economic partnership agreement. Remaining tariffs on imports originating in ‘least developed countries’ (eg Bangladesh and Somalia) were removed on 1 July 2001, a decision which affected clothing and footwear.
The manufacturing sector today is more reliant on general economic conditions than it has been in the past. In this regard, balanced monetary and fiscal policies, maintenance of low inflation, stability of interest and exchange rate policies, and flexibility of labour markets provide a competitive base to manufacturing and create certainty for present and future investment decisions. Manufacturing is also dependent on the competitiveness of support industries and the services sector. This competitiveness has provided substantial flow-on benefits to the manufacturing sector through the lowering of input costs and the provision of more efficient, reliable and competitive services. This is especially notable in deregulation of the transport, energy, communications and finance sectors, which has resulted in cost savings and more efficient service to the manufacturing sector and the economy generally. See table 21.1 for an overview of manufacturing sector performance.
Manufacturers are now more dependent on their ability to create and seize their own initiatives, and to distinguish themselves from their competitors. Firms are reliant on being innovative, enterprising and able to respond swiftly to market demands. To achieve this, manufacturers are encouraging high levels of quality in their operations and management.
Skills training and education are also important for the continuing development of manufacturers’ competitiveness. The National Qualifications Framework and the introduction of Industry Training Organisations have provided flexibility for industries to determine their own skill and training needs, and for these needs to be met by the educational framework in a timely manner.
The government recognises the importance of science and technology and set a target of increasing funding for manufacturing-related science to $35.9 million a year by 2001.
The business environment, having changed substantially, now provides a more robust and outwardly focused economy. It also provides manufacturers with a strong framework in which to create and capitalise on opportunities. The sector will, however, have to continue to respond to a constantly changing external environment.
Table 21.1. Manufacturing sector performance 1996–2000
| Year ended March | Contribution to GDP1 | Change from previous year | GDP1 |
|---|---|---|---|
1Chain-volume series expressed in 1995/96 prices. Source: Statistics New Zealand | |||
| $(million) | percent | $(million) | |
| 1996 | 15,941 | 1.9 | 92,680 |
| 1997 | 16,231 | 1.8 | 95.515 |
| 1998 | 16.512 | 1.7 | 97,327 |
| 1999 | 15,793 | -4.4 | 97,762 |
| 2000 | 16,520 | 4.6 | 102,267 |
The government's business development programme (BIZ) aims to improve management capabilities of small and medium enterprises (SMEs) and, therefore, their performance. In doing so, it aims to increase understanding of the value of seeking external assistance. The programme has a business development component which contracts private providers to deliver services to SMEs aimed at improving their management capabilities, and an information and referral service, which provides information on public and private business assistance initiatives through BIZ shops in 32 localities.
State-of-the art bottling machinery at DB Breweries, Auckland.
Essential elements of the programme are contestable funding for both design and delivery of services, and contracting out of all elements to private providers and non-government organisations.
Providers contracted to provide business development services include enterprise development agencies, private consulting companies, Maori trusts, industry associations, newly-formed ventures, polytechnics and community-based initiatives.
Business services include:
Diagnostics/assessments of a firm's strengths, weaknesses and opportunities for development. leading to the formulation of an agreed action plan.
Skills training, involving workshops, seminars and interactive training, on competencies such as business planning, quality, marketing, tax. finance and human resources.
Coaching, involving a one-on-one counselling service, often following up on training.
Networking by providing a forum in which businesses in similar circumstances provide exemplars and advice to each other.
The BIZ website is www.bizinfo.co.nz
Business development quality awards. Business development quality awards are designed to foster a commitment to quality principles by New Zealand small and medium enterprises and to recognise the application of total quality management. The awards are administered by the business development group of the Ministry of Economic Development and are promoted annually. The awards are based on the United States Malcolm Baldrige National Quality Awards and are open to all organisations. The awards have proved an attractive incentive for New Zealand businesses to apply total quality management principles and to benefit from independent assessment. In the seven years since their inception, the awards have attracted more than 700 applications from private and public sector organisations.
The following is a brief description of some of the major secondary industries in New Zealand.
Wine. Export volumes of wine reached a record 21.8 million litres in the 2001 calendar year. This was 8.5 percent ahead of the previous year. The value of exports rose strongly, reaching $230.3 million in the 2001 year, 17.9 percent ahead of the previous year. The rise in dollar returns reflected short-term benefits from the lower New Zealand dollar, coupled with a long-term trend to higher-quality, higher-value exports. Despite product shortages, shipments to some markets continued to grow strongly. Extensive positive media coverage is encouraging strong consumer and trade interest in the United States and continued growth is expected.
Carpet. Tufted and woven carpet production in the June 1999 year, the most recent figures compiled, increased by 7 percent on the previous year to 10.1 million square metres. Production of wool-rich carpets (80 percent or more wool content) was 9.175 million square metres, or 91 percent of total production. The remaining 9 percent of carpet produced was made from man-made fibres. New Zealand manufacturers exported 2.78 million square metres of tufted carpet in the 12 months to June 1999, an increase of 45 percent compared with 1998. Australia was the principal purchaser, taking 93 percent of exports. In the year to June 1999, New Zealand imported 2 million square metres of carpet, with the most prevalent fibre being nylon. The value of carpet and other textile floor coverings exported during the year ending 30 June 2001 was $99 million, compared with $106 million in the previous June year. In the June years 1999, 1998 and 1997, exports receipts were $96 million, $82 million and $80 million respectively.
Textiles and apparel. Removal of import licensing and a progressive reduction in tariffs have seen apparel imports from all sources increase significantly, from $129 million (cif) in 1989 to $616 million (cif) in the year ended June 1999, the most recent figures compiled. This has led to considerable rationalisation within the industry, with an accompanying reduction in employment levels. The most recent survey of employment in the apparel, textile and footwear industries showed that jobs fell from 28,451 to 25,578 between February 1995 and February 1997. Taken together, however, these industries remain significant employers. The most recent survey conducted indicated that apparel exports increased from $49 million (fob) in 1989 to $185.7 million (fob) in the year ending March 1998. Australia is New Zealand's main export market for apparel, but efforts have been made to diversify export destinations, particularly into Asia. Joint Action Groups (JAGs), supported by Trade NZ and industry, bring exporters together to develop strategies to overcome constraints and achieve export success.
The companies making up the New Zealand apparel industry are diverse in terms of size, structure and the range of garments produced. They range from cut, make and trim operations that produce finished garments on a contract basis using fabrics supplied to them, through to vertically-integrated operations which produce their own fabric, manufacture their own garments, and sell these garments in their own stores. New Zealand manufacturers produce all major garment categories, including outerwear, underwear, hosiery, nightwear, swimwear, ties, headwear and leather apparel. A number of companies have moved manufacturing operations offshore to take advantage of lower labour costs.
Figure 21.1 shows percentages of people employed in various manufacturing industries in 2001. Figures 21.2 and 21.3 show numbers employed by region.
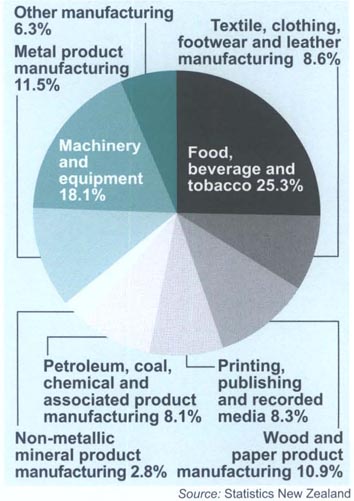
Figure 21.2. Regional employment in
manufacturing1 2001 – North
Island
By major types of industry,
in full-time equivalents2
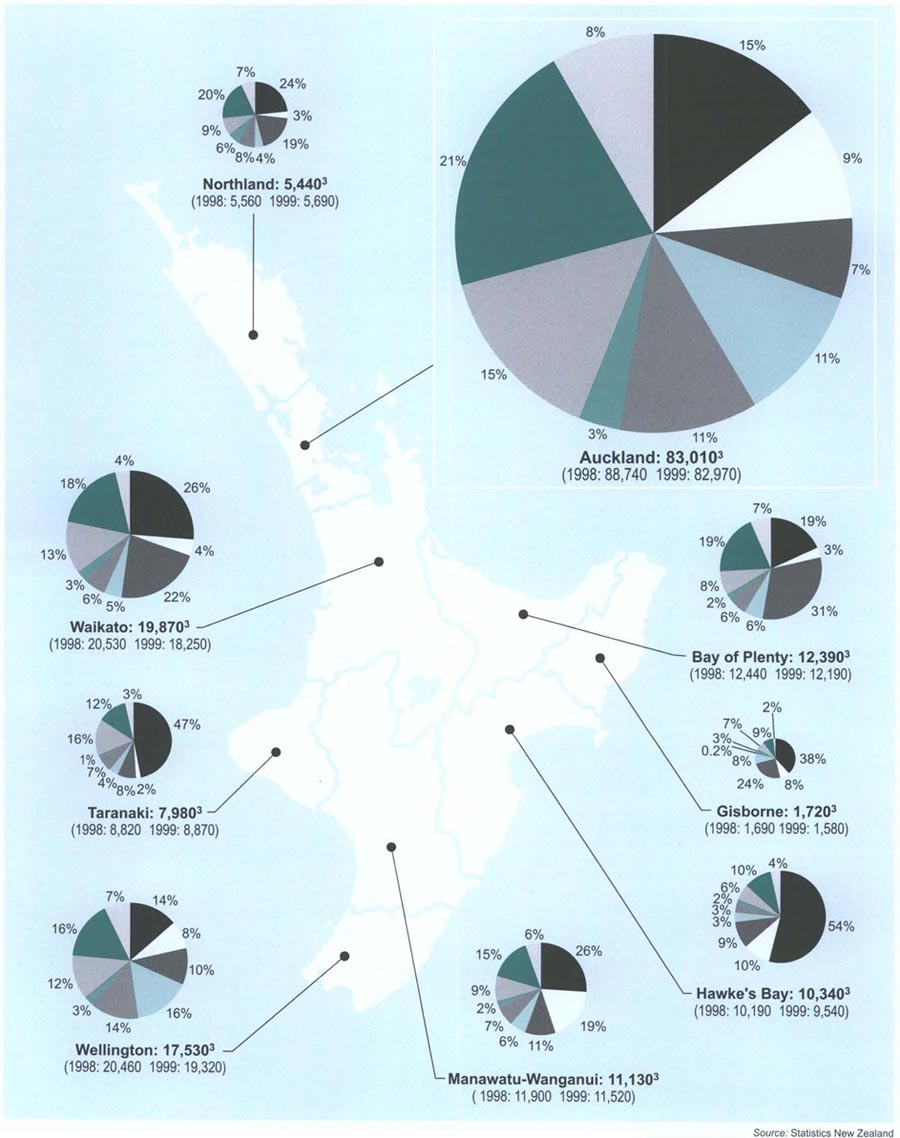
Figure 21.3. Regional employment in
manufacturing1 2001 – South
Island
By major types of industry,
in full-time equivalents2
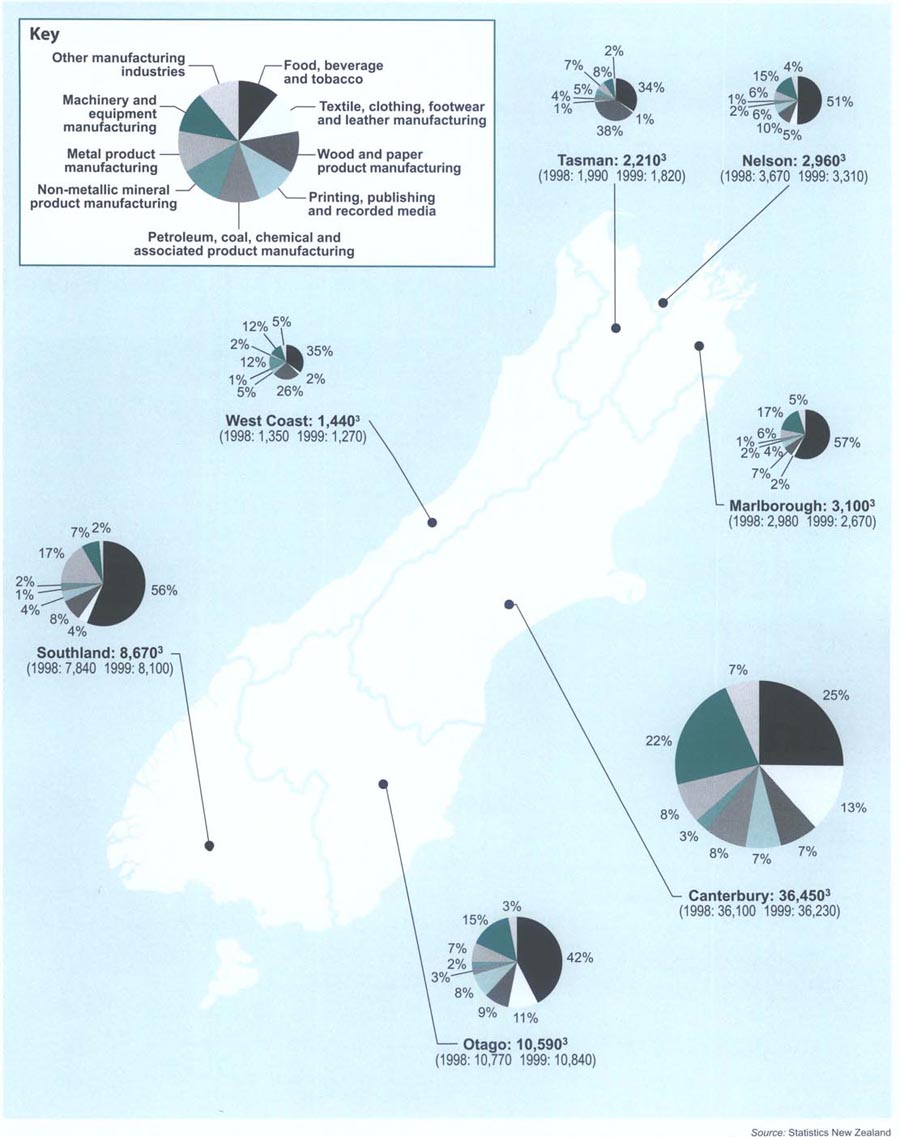
Footwear. New Zealand has a long-established footwear manufacturing industry. Considerable rationalisation of the footwear industry has taken place since 1986 when the first significant reductions in protection occurred. Domestic production reduced from 7.7 million pairs in 1986/87 to 1.5 million pairs in 1997/98, the latest statistics available. Reduction in assistance to domestic manufacturers also led to a significant increase in footwear imports. In 1998, imports totalled more than 9.9 million pairs, compared with 7.7 million pairs in 1993 and 6.1 million pairs in 1990 (June years). Exports increased from 623,000 pairs in 1992 to 704,000 pairs in 1998 (June years). Australia is the main market for New Zealand footwear exports. The value of footwear exports in the year ending June 30 2001 was $53 million, compared with $52 million in the previous June year. In the June years 1999, 1998 and 1997, export receipts were $51 million, $43 million and $43 million respectively.
Portable radios being manufactured at Tait Electronics, Christchurch.
Motor vehicles. The New Zealand motor vehicle assembly industry comprised, until 1998, the basic assembly of imported completely knocked down packs, supplemented by locally made components. A review of motor vehicle tariffs in late 1997 resulted in a decision to reduce tariffs from 15 percent to zero by 1 December 2000, or sooner if the New Zealand assembly plants closed. Following this announcement, and together with a significant downturn in the new vehicle market in particular, the remaining four assemblers, Mitsubishi, Nissan, Honda and Toyota, all announced their decisions to cease local production during 1998. In response to a request from the motor vehicle industry, the government then agreed to remove tariffs on all passenger and light commercial vehicles, excluding motor homes and ambulances. This decision was announced on 14 May 1998 and took immediate effect. The decision aimed to remove uncertainty from the vehicle market and achieve savings for New Zealand families and businesses. It represented the removal of a major cost impost and was designed to lower transportation costs across the economy, thereby improving the international competitiveness of New Zealand firms. Remaining tariffs on motor vehicles are subject to the government's current tariff freeze. Although the automotive component-manufacturing sector has been affected by closure of the local assembly industry, it is still a significant sector in terms of production and exports. There are around 40 manufacturers producing about $400 million worth of automotive components a year, with exports totalling around $180 million. Exports include tyres, alloy wheels, wiring harnesses, springs and windscreens. The automotive component sector employs about 4,000 people.
Statistics New Zealand's Quarterly Economic Survey of Manufacturing (QMS) gives a representative survey estimate of economic activity for 15 groups within the manufacturing sector.
The QMS was redesigned in 2001 and comprises a postal sample of approximately 1,400 firms, as well as a tax strata of approximately 17,000 firms. This will vary slightly each quarter. The survey asks for operating income, purchases and operating expenditure, salaries and wages, closing stocks of material and finished goods, additions to and disposals of fixed assets. Table 21.2 presents the data in the form of annual series, while table 21.3 shows the sum of the four quarters for the year ended March 2002, with total manufacturing divided into industry groups.
The QMS provides a quarterly sample estimate that is a useful short-term indicator of the manufacturing sector's activity. The Annual Enterprise Survey (AES) provides a more in-depth measure at a higher level of financial and industry detail.
Table 21.2. The manufacturing sector 1998–2002
| Year ended 31 March | Operating income | Purchases and operating expenditure | Salaries and wages | Stocks of raw materials for use in production | Finished goods, work in progress and trading stocks | Additions to fixed assets | Disposals of fixed assets |
|---|---|---|---|---|---|---|---|
| $(million) | |||||||
| 1998 | 52,678 | 38,376 | 8,547 | 9,770 | 15,666 | 2,975 | – |
| 1999 | 50,896 | 37,043 | 8,356 | 9,334 | 15,419 | 2,242 | – |
| 2000 | 54,147 | 39,103 | 8,583 | 9,290 | 15,309 | 2,314 | – |
| 2001 | 60,537 | 43,698 | 8,797 | 10,038 | 17,101 | 1,950 | – |
| 2002 | 64,144 | 47,968 | 8,991 | 10,289 | 18,517 | 3,743 | 337 |
| Source: Statistics New Zealand's Quarterly Survey of Manufacturing | |||||||
Table 21.3. Contributions by industry groups to New Zealand manufacturing, 20021
| Industry groups | Operating income | Purchases and operating expenditure | Salaries and wages | Stocks of raw materials for use in production | Finished goods, work in progress and trading stocks | Additions to fixed assets | Disposals of fixed assets |
|---|---|---|---|---|---|---|---|
1Year ended 31 March. C = confidential. Source: Statistics New Zealand's Quarterly Survey of Manufacturing | |||||||
| $(million) | |||||||
| Dairy and meat products | 17,436 | 15,029 | 1,398 | 1,086 | 3,915 | C | C |
| Other food | 6,546 | 4,955 | 824 | 894 | 2,558 | C | C |
| Beverage, malt and tobacco | 2,700 | 1,812 | 273 | 551 | 1,349 | 333 | 18 |
| Textile and apparel | 2,945 | 2,074 | 556 | 780 | 1,283 | 56 | C |
| Wood products | 3,671 | 2,766 | 577 | 416 | 1,259 | 364 | C |
| Paper and paper products | 2,846 | 1,955 | 392 | 529 | 775 | 173 | C |
| Printing, publishing and recorded media | 3,613 | 2,168 | 828 | 386 | 449 | C | C |
| Petroleum and industrial chemical | 3,126 | 2,461 | 248 | 969 | 834 | 104 | 13 |
| Rubber, plastic and other chemical products | 3,888 | 2,844 | 664 | 813 | 1,828 | C | C |
| Non-metallic mineral products | 1,787 | 1,203 | 277 | 171 | 480 | 66 | C |
| Basic metal | 2,095 | 1,530 | 313 | 459 | 587 | C | C |
| Structural, sheet and fabricated metal products | 3,832 | 2,687 | 710 | 722 | 777 | 91 | 20 |
| Transport equipment manufacturing | 2,094 | 1,404 | 450 | 686 | 402 | 72 | C |
| Machinery and equipment | 5,725 | 3,846 | 1,097 | 1,341 | 1,596 | 123 | 26 |
| Furniture and other manufacturing | 1,841 | 1,231 | 386 | 479 | 423 | 33 | C |
21.1 Ministry of Economic Development; Statistics New Zealand; Wine Institute of New Zealand. Statistics New Zealand divisional manager responsible: Tom Woodhouse.
Business Activity Statistics (annual). Statistics New Zealand, Wellington.
Economic Survey of Manufacturing (quarterly). Statistics New Zealand, Wellington.
Key Statistics (monthly). Statistics New Zealand, Wellington.
Report of the Ministry of Economic Development (Parl paper G.46).
Table of Contents

Isolation devices fitted under foundations of buildings minimise earthquake damage.
Housing is an important element in New Zealand society and forms a significant part of public policy. Housing provides shelter and security for both the family and the individual, providing a physical centre within the environment. A home can fulfil social requirements as well as physical needs, allowing individuals the opportunity to express aspirations and tastes. Housing is a central part of the domestic economy, since it is a major source of investment for many New Zealanders and provides employment and livelihood for a variety of trades.
Home ownership is seen as a form of investment saving, an expression of independence and a mechanism for achieving security and self-determination. New Zealanders have a strong tradition of home ownership. While still the predominant form of tenure, the level of home ownership is, however, experiencing a downward trend.
The 2001 Census recorded 1,359,843 occupied private dwellings and 8,364 non-private dwellings. There were 1,344,267 households in occupied private dwellings and 868,656 of these owned their dwellings with or without a mortgage. This level of home ownership was 2.9 percent lower than in 1996, down from 70.7 percent to 67.8 percent. The number of households renting their dwellings (where the household is making rent payments) increased from 290,124 at the 1996 Census to 358,890 households in 2001, an intercensal increase of 23.7 percent.
Of households in private dwellings, 37.4 percent had access to the internet, while 96.3 percent said they had access to a telephone.
Family households are still dominant in New Zealand. At the 2001 Census, 71.3 percent of households contained families, down from 73.9 percent in 1996. The most common family type remained the ‘couple with children’ family. However, the proportions of couple with children families at 42.1 percent (44 percent in 1996) and couple-only families at 39 percent (37.3 percent in 1996) were quite similar. One-person households, numbering 307,632, constituted 22.9 percent of all households, compared with 20.2 percent, or 256,572, in 1996. The average number of usual residents per household declined from 2.8 people per household in 1996 to 2.7 in 2001.
House sales. There has been a significant decrease in the number of house sales. A total of 49,475 freehold open market house sales were notified to Quotable Value New Zealand for the year to December 2000. This was a 20.6 percent decrease on the 59,708 sales recorded for the previous year.
Freehold open market sales cover approximately 80 percent of all sales, but exclude forced sales, sales between family members with a gift element, and sales of leasehold and mixed tenure properties.
Residential prices. The average sale price for houses in the year to December 2001 was $197,626 (see table 22.1). This was 4.5 percent higher than the average sale price recorded for the previous year ($189,032) and 39.6 percent higher than that recorded in 1994 ($141,506). The sale prices are exclusive of chattels and other considerations.
Table 22.1. Residential prices
| Average sale price | December year | |||||||
|---|---|---|---|---|---|---|---|---|
| 1994 | 1995 | 1996 | 1997 | 1998 | 1999 | 2000 | 2001 | |
Note:From the December 1999 year onwards sales are collated by sale date. Prior to this sales are collated by the date the sale notice was received. Source: Quotable Value New Zealand | ||||||||
| $ | ||||||||
| Sections | 55,049 | 62,350 | 69,341 | 77,478 | 80,537 | 84,113 | 90,472 | 96,200 |
| Houses | 141,506 | 156,578 | 170,675 | 183,986 | 184,100 | 182,973 | 189,032 | 197,626 |
| Owner-occupier flats | 126,312 | 140,670 | 155,343 | 167,819 | 166,264 | 161,136 | 161,743 | 168,105 |
The urban house property price index compiled by Quotable Value New Zealand is designed to measure changes in the average level of prices paid for residential properties sold during each half-year. Variations in the average age of properties transferred, as an indicator of the average quality of such properties, are eliminated in the index methodology in order to arrive at a valid index of price level changes.
Table 22.2 shows how house prices have increased nationally from 1995 to 2001.
Table 22.2. House price index1,2
| Locality | 1995 | 1996 | 1997 | 1998 | 1999 | 2000 | 2001 |
|---|---|---|---|---|---|---|---|
1Base: Half-year ended December 1989 = 1000. 2Half-year ended June. 3Auckland includes North Shore city. Waitakere city, Manukau city, Papakura district and Auckland city. 4Wellington includes Porirua city. Upper Hutt city. Wellington city, Hutt city. Source: Quotable Value New Zealand | |||||||
| Whangarei district | 1225 | 1328 | 1533 | 1670 | 1646 | 1631 | 1631 |
| Auckland area3 | 1316 | 1613 | 1756 | 1738 | 1712 | 1706 | 1694 |
| Hamilton city | 1329 | 1475 | 1599 | 1665 | 1608 | 1567 | 1518 |
| Tauranga district | 1361 | 1438 | 1609 | 1746 | 1654 | 1663 | 1700 |
| Rotorua district | 1270 | 1400 | 1556 | 1667 | 1566 | 1598 | 1587 |
| Gisborne district | 1620 | 1720 | 1730 | 1642 | 1587 | 1703 | 1704 |
| Napier city | 1493 | 1517 | 1549 | 1559 | 1546 | 1582 | 1597 |
| Hastings district | 1533 | 1578 | 1575 | 1582 | 1557 | 1588 | 1618 |
| New Plymouth district | 1441 | 1481 | 1441 | 1419 | 1408 | 1423 | 1423 |
| Wanganui district | 1186 | 1191 | 1193 | 1152 | 1126 | 1128 | 1114 |
| Palmerston North city | 1213 | 1216 | 1206 | 1191 | 1187 | 1236 | 1237 |
| Masterton district | 1126 | 1098 | 1077 | 1070 | 1087 | 1188 | 1220 |
| Wellington area4 | 1018 | 1073 | 1161 | 1312 | 1372 | 1484 | 1495 |
| Nelson city | 1416 | 1457 | 1485 | 1498 | 1468 | 1488 | 1487 |
| Christchurch city | 1404 | 1507 | 1620 | 1654 | 1611 | 1604 | 1563 |
| Timaru district | 1390 | 1425 | 1443 | 1427 | 1393 | 1366 | 1368 |
| Dunedin city | 1447 | 1496 | 1460 | 1362 | 1343 | 1366 | 1373 |
| Invercargill district | 1372 | 1375 | 1345 | 1215 | 1162 | 1092 | 1097 |
| Total New Zealand | 1310 | 1478 | 1588 | 1624 | 1607 | 1624 | 1617 |
Figure 22.1 shows movements in the real cost of housing from 1991 to 2001.
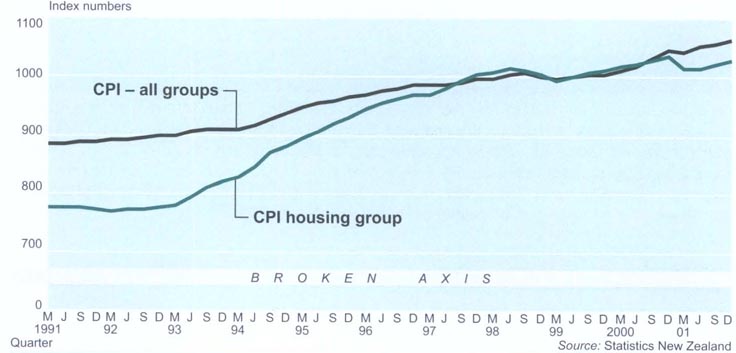

A Quotable Value employee compiles a residential valuation.
Housing New Zealand Corporation. Housing New Zealand Corporation (HNZC) was established on 1 July 2001 through the merger of Housing New Zealand Ltd (HNZ), Housing Corporation of New Zealand (HCNZ), Community Housing Ltd (CHL) and the housing policy unit of the former Ministry of Social Policy.
The corporation's key focus is to:
Provide access to sustainable housing solutions that are affordable and of good quality to those in greatest need.
Establish partnerships with community organisations, local government, iwi and other providers to deliver locally-based housing solutions.
Provide assistance to householders on low and modest incomes who wish to become homeowners.
Provide housing policy advice to the Minister of Housing.
The corporation is a Crown entity established under the Housing Corporation Act 1974 (as amended by the Housing Corporation Amendment Act 2001). The legislation requires the corporation to give effect to the Crown's social objectives by providing housing, and services related to housing, in a businesslike manner and in a way which exhibits a sense of social, environmental and financial responsibility.
The corporation offers the following services (detailed information is available on the corporation website www.hnzc.co.nz):
Housing Services: Provision of approximately 60,000 state-owned or managed rental properties. Applicants apply for state housing through a network of 43 neighbourhood unit offices in 14 areas from Whangarei to Invercargill. Eligibility for housing is determined on the basis of residency status, income and assets, and need. Once eligibility is established, priority is given to those in greatest need, determined through a range of criteria under a social allocation system. People with disabilities are also helped to find homes suitable to their needs, with the corporation providing a link between occupational therapists, landlords, architectural services, advocates, funders and the family. A housing assistance line (0800 284 063) helps people with housing problems, especially in Auckland areas.
Housing Partnerships: This group broadens the range of housing options available within New Zealand by working in partnership with the community sector, iwi and local government, among others. Housing Partnerships oversees the Special Housing Action Zone (SHAZ) programme that works with specific communities and iwi to develop and build housing solutions, along with wider community capacity building. Community Group Housing forms part of the partnerships division and provides approximately 1,300 properties as rental housing for community groups who support people with physical, intellectual and psychiatric disabilities, women's refuges, emergency accommodation and support for children.
Asset and development services: These initiate, coordinate and deliver a range of projects and programmes to improve the overall standard of housing and provide housing solutions that better meet people's needs. The services are responsible for the building, buying or leasing of properties to respond to housing demand. Particular initiatives include the community renewal and healthy housing projects, along with modernisation of, and energy efficiency improvements to, the corporation's housing stock. Community renewal projects are being developed in five areas to address social exclusion and foster strong communities, while the Healthy Housing Project is operating with health authorities in three areas of South Auckland to address particular issues related to overcrowding and disease.
Home ownership: The corporation's main role in the home ownership market is to provide home ownership finance options to people who have been refused finance within the private sector and to applicants who can afford repayments and meet other standard corporation lending criteria. Home ownership products are specific and particularly aimed at people living in the rural North Island, particularly in areas of serious housing need. See table 22.3 for details of the corporations's recent annual loan approvals and sales.
Table 22.3. Housing Corporation loan approvals and sales
| Programme (year ending 30 June) | 1996 | 1997 | 1998 | 1999 | 2000 | 2001 | ||||||
|---|---|---|---|---|---|---|---|---|---|---|---|---|
| No. | Value | No. | Value | No. | Value | No. | Value | No. | Value | No. | Value | |
1Complete information unavailable. Source: Housing Corporation | ||||||||||||
| ($m) | ($m) | ($m) | ($m) | ($m) | ($m) | |||||||
| Painstaking | 16 | 1.08 | 6 | 0.40 | 33 | 1.16 | 18 | 0.79 | 20 | – | 7 | 0.4 |
| LDRL | 53 | 3.15 | 67 | 4.66 | 79 | 6.02 | 108 | 8.05 | 165 | – | 130 | 11.0 |
| Home Buy | 240 | 16.00 | 140 | 8.79 | 335 | 24.68 | 110 | 7.68 | – | – | 49 | 1.2 |
| Suspensory | 618 | 5.28 | 454 | 3.82 | 579 | 4.93 | 664 | 5.99 | – | – | – | – |
| General | 314 | 10.10 | 87 | 3.85 | 87 | 3.23 | 63 | 2.10 | 13 | – | 12 | 0.6 |
| Special | 4 | 0.39 | 0 | 0.00 | 9 | 1.36 | 0 | 0.00 | – | – | – | – |
| Total | 1,245 | 36.00 | 754 | 21.52 | 1,122 | 41.38 | 963 | 24.61 | 1981 | 37.01 | 198 | 13.2 |
Housing New Zealand Ltd. Housing New Zealand Ltd was established under the Housing Restructuring Act 1992. A Crown-owned company, it owns and manages around 60,000 rental properties nationwide. Housing New Zealand's principal objectives are to provide rental housing to those on low incomes and those not having their needs adequately met in the private sector. These services are to be provided in a manner which meets the Crown's social objectives, enhances shareholder value and provides a strong customer service focus.
Housing New Zealand is the single largest owner of rental housing in New Zealand, accounting for around 20 percent of all national rental accommodation.
In 1999, Housing New Zealand introduced income-related rents and an associated social allocation system for assessing the housing need of applicants. This system ensures applicants with the greatest and most urgent needs receive priority and are housed in a property that best meets their needs. The system also ensures that qualifying Housing New Zealand tenants pay in rent the lesser amount of 25 percent of their household income, or the market rent for their rental property.
Of all new tenancies in the year to 30 June 2000, 45.2 percent were to single people with children and 19.9 percent to couples with children (see table 22.4 for recent annual details).
Table 22.4. Housing New Zealand activity
| Year ended 30 June | 1997 | 1998 | 1999 | 2000 |
|---|---|---|---|---|
1Includes Home Lease properties. 2Income of $500 per week or less. 3Includes vacant sales and sales to tenants only. 4Includes the transfer of properties to Community Housing Ltd. Source: Housing New Zealand | ||||
| Total rental units1 | 65,821 | 63,866 | 60,418 | 59,462 |
| Number of allocations (new tenancies) | 14,619 | 14,107 | 18,927 | |
| Number of new tenancies for priority customers | 2,637 | 2,922 | 2,629 | 3,091 |
| Percentage of allocation to low-income households2 | 97 | 99 | 99 | 99.3 |
| Property disposals3 | 3,216 | 2,284 | 3,361 | 1,141 |
| Properties acquired or contracted4 | 484 | 1,224 | 662 | 564 |
Housing New Zealand has three regions and 43 Neighbourhood Units (local outlets) throughout the country. Tenancy management, day-to-day property maintenance, applications and new lettings are carried out from the units, which each control between 500 to 3,500 properties.
A Home Lease programme was established in 1995 to assist the Crown meet demand for housing. Under this scheme, private owners lease vacant properties in areas of high demand to Housing New Zealand for a predetermined period of time. Property owners are guaranteed a rental income from the property, less a management fee, in return for which Housing New Zealand takes full responsibility for managing tenants. There were 773 Home Lease properties at 30 June 2000.
Ministry of Housing. Established on 1 July 1992, the ministry's main functions are the provision of tenancy bond and dispute resolution services. The ministry, through its Tenancy Service Division, administers the Residential Tenancies Act 1986. The Ministry's Monitoring Unit advises the government in relation to the Housing New Zealand Corporation (HNZC). The Tenancy Services Division has 21 dispute resolution offices throughout New Zealand providing education, advice, mediation and referrals to the Tenancy Tribunal and a bond centre in Porirua for the processing of all tenancy bonds. While the Tenancy Services Division runs the mediation service, the Tenancy Tribunal is administered by the Department for Courts. In the year to 30 June 2001, there were 41,736 applications to the Tenancy Tribunal. Of these, 79 percent were referred to mediation and 55.8 percent of those were resolved at that stage. The remaining applications were not resolved or only partially resolved in mediation and were referred to the Tenancy Tribunal. The ministry received 168,920 bond lodgements and made 162,059 refunds during the year. As at June 2001, $115.62 million was held in bonds on behalf of tenants and landlords.
The percentage increase in loans outstanding for housing in New Zealand in the five years to December 2001 was significantly smaller than for the five years to 1996: 53 percent compared with 84 percent. Slower economic growth and much lower net migration contributed to the change. It is also likely that as total household debt levels have increased to a ratio of more than 120 percent of personal disposable income at December 2001, compared with close to 70 percent 10 years earlier, the desire and capacity of households to accumulate more debt has abated. Figure 22.2 shows mortgages registered and discharged from 1915 to 2001.
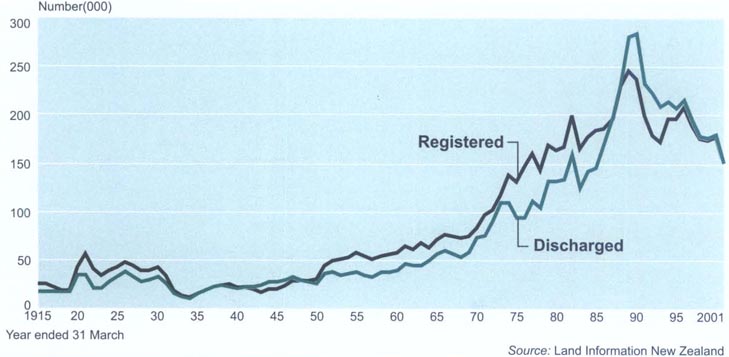
Figure 22.3 show that the average annual rate of interest on floating rate mortgages has been considerably lower in recent years than during the period of strong growth and immigration in the mid 1990s.
Since 1994, when fixed rate interest mortgages began to be widely offered in New Zealand, floating mortgage rates have not been a good indicator of the cost of borrowing on mortgage. By 1998, around 60 percent of all housing loans were at fixed rates, a level that has remained relatively constant since. Figure 22.4 shows the difference between the weighted average earnings of banks from floating and fixed rate loans over the period since 1998. Many borrowers choose both a fixed and floating loan, secured on the same mortgage, when borrowing to buy a home.
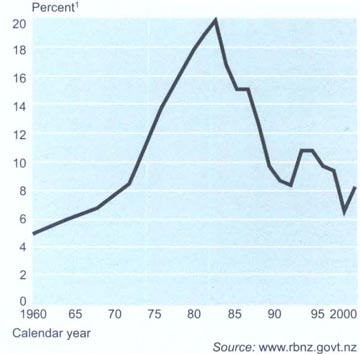
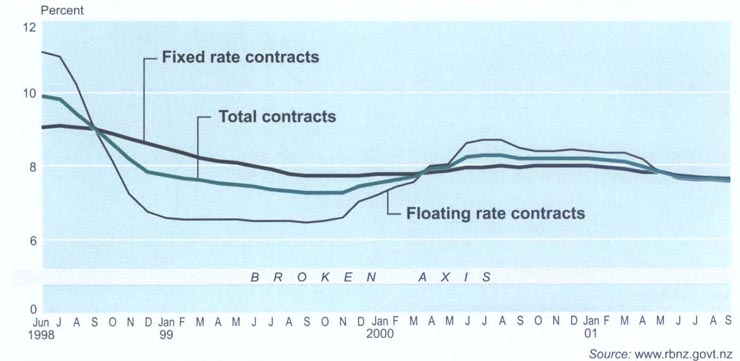
Table 22.5 shows household borrowing for housing and other purposes obtained from a Reserve Bank of New Zealand monthly survey. Five banking groups of the 25 respondents in the survey are the source of more than 90 percent of the survey's total household debt. This total is in turn around 95 percent of total household debt measured annually in a census survey.
Table 22.5. Household claims
| Quarterly average | Total household claims | ||
|---|---|---|---|
| Housing | Other | Total | |
| Source: Reserve Bank of New Zealand | |||
| $(million) | |||
| 1990 – | |||
| December | 22,041 | 3,014 | 25,055 |
| 1991 – | |||
| March | 22,289 | 3,046 | 25,335 |
| June | 22,740 | 3,048 | 25,788 |
| September | 23,231 | 3,080 | 26,311 |
| December | 23,937 | 3,123 | 27,060 |
| 1992 – | |||
| March | 24,575 | 3,194 | 27,769 |
| June | 25,143 | 3,169 | 28,312 |
| September | 25,670 | 3,226 | 28,896 |
| December | 26,351 | 3,257 | 29,608 |
| 1993 – | |||
| March | 26,912 | 3,296 | 30,208 |
| June | 27,541 | 3,335 | 30,876 |
| September | 28,386 | 3,443 | 31,829 |
| December | 29,402 | 3,582 | 32,984 |
| 1994 – | |||
| March | 30,286 | 3,671 | 33,957 |
| June | 31,491 | 3,733 | 35,224 |
| September | 32,626 | 3,832 | 36,458 |
| December | 33,753 | 3,932 | 37,685 |
| 1995 – | |||
| March | 34,656 | 4,049 | 38,705 |
| June | 35,714 | 4,151 | 39,865 |
| September | 36,942 | 4,271 | 41,213 |
| December | 38,434 | 4,451 | 42,885 |
| 1996 – | |||
| March | 39,998 | 4,600 | 44,598 |
| June | 41,653 | 4,748 | 46,401 |
| September | 42,799 | 4,864 | 47,663 |
| December | 44,047 | 5,034 | 49,081 |
| 1997 – | |||
| March | 45,662 | 5,155 | 50,817 |
| June | 47,023 | 5,137 | 52,160 |
| September | 48,305 | 5,172 | 53,477 |
| December | 49,712 | 5,316 | 55,028 |
| 1998 – | |||
| March | 50,813 | 5,437 | 56,250 |
| June | 51,785 | 5,443 | 57,228 |
| September | 52,573 | 5,417 | 57,990 |
| December | 53,760 | 5,439 | 59,199 |
| 1999 – | |||
| March | 55,205 | 5,557 | 60,763 |
| June | 56,833 | 5,673 | 62,507 |
| September | 58,235 | 5,697 | 63,931 |
| December | 59,553 | 5,928 | 65,481 |
| 2000 – | |||
| March | 60,714 | 6,010 | 66,724 |
| June | 61,730 | 6,070 | 67,799 |
| September | 62,430 | 6,190 | 68,620 |
| December | 63,216 | 6,433 | 69,649 |
| 2001 – | |||
| March | 64,123 | 6,559 | 70,682 |
| June | 65,294 | 6,620 | 71,914 |
| September | 66,301 | 6,733 | 73,034 |
| December | 67,444 | 6,981 | 74,425 |
Accommodation supplement. The accommodation supplement was introduced on 1 July 1993 and is available to low-income households, irrespective of whether they are renters, mortgagees or boarders, provided they are not living in Housing New Zealand Corporation accommodation. The supplement is a cash payment administered by Work and Income and takes account of higher housing costs in main urban centres. The low-income threshold depends on circumstances and an abatement regime assists in targeting the supplement to households on lower incomes. The supplement is subject to an asset test. Tables 22.6 and 22.7 (see sidebar) give recent annual figures for Work and Income accommodation supplements.
The introduction on 1 December 2000 of income-tested rents for Housing New Zealand Corporation tenants resulted in a large number of people losing eligibility for the accommodation supplement because of lower rent levels. At 30 June 2001, 268,612 people were receiving the accommodation supplement, 51,155 fewer than the 319,767 at 30 June 2000. During the year to 30 June 2001,244,893 applications for the supplement were granted, 42,541 less than during the year to 30 June 2000.
Table 22.6. Accommodation assistance from Work and Income
| Benefits current at 30 June | Annual expenditure, year to 30 June | |
|---|---|---|
1Accommodation benefit until 30 June 1993, subsequently accommodation supplement. 2At 31 May. .. = not available Source: Ministry of Social Development | ||
| number | $(million) | |
| Accommodation benefit1 | ||
| 1990 | 106,408 | .. |
| 1991 | 112,658 | .. |
| 1992 | 140,356 | 180.1 |
| 1993 | 150,6692 | 210.8 |
| Accommodation supplement | ||
| 1994 | 251,505 | 351.3 |
| 1995 | 266,275R | 491.4 |
| 1996 | 280,369R | 561.8 |
| 1997 | 297,134 | 661.6 |
| 1998 | 311,618 | 792.7 |
| 1999 | 18,189 | 843.3 |
| 2000 | 319,767 | 867.0 |
| 2001 | 268,612 | .. |
Building and construction is an important part of the New Zealand economy. For the year ended 31 March 2001, there was $10.6 billion of gross fixed capital investment on building and other construction. For the previous year, the equivalent figure was $11.5 billion.
The number of people employed in the industry at the end of February 2001 was 115,670, which was 6.9 percent of those employed in industries other than farming. In addition, tens of thousands were employed indirectly, supporting the industry in manufacturing, material supplies and transport.
During the mid-1990s through to the first quarter of 2000, the share of New Zealand's gross domestic product (GDP) contributed by the construction industry has risen steadily. The share (in constant prices) was 3.7 percent in the year ended 31 March 1994, rising to 4.1 percent in the year ended 31 March 2000. This increasing importance existed during a period of high GDP growth during the mid-1990s, making the industry's proportional increase even more noteworthy. In the year ended 31 March 2001, however, it fell to 3.6 percent of GDP.
During this period of high growth, related output increased as well. Production of ready-mixed cement and sawn timber grew steadily through the 1990s, in line with the increased requirements of the construction industry.
The most common construction systems used in New Zealand are light timber framing for housing, reinforced concrete (precast and in situ) for multi-storey buildings and light steel framing for industrial buildings. However, with introduction of a performance-based building code, traditional systems are slowly being replaced with new methods and products, and with shortages of timber on the local market, light steel framing is becoming more common.
New Zealand has developed particular expertise in the design of earthquake-resistant structures, in other specialist areas such as hydro and geothermal power station design and construction, and in the construction of economic granular-based road pavements.
Table 22.7. Accommodation supplement by type of accommodation Current at 30 June 2001
| Type | Beneficiaries and pensioners | Low income earners | All |
|---|---|---|---|
| Source: Ministry of Social Development | |||
| Renters | |||
| Te Puni Kokiri | 6 | 0 | 6 |
| Council | 3,721 | 57 | 3,778 |
| Residential care home | 2,543 | 233 | 2,776 |
| Other | 135,212 | 14,593 | 149,805 |
| All renters | 141,482 | 14,883 | 156,365 |
| Boarders | 64,247 | 551 | 64,798 |
| Mortgagees | |||
| Housing Corporation | 2,628 | 92 | 2,720 |
| Housing New Zealand | 2 | 0 | 2 |
| Residential home | 2,858 | 703 | 3,561 |
| Other | 32,976 | 8,182 | 41,158 |
| All mortgagees | 38,464 | 8,977 | 47,441 |
| Not classified | 16 | 2 | 18 |
| Total classified | 244,193 | 24,411 | 268,604 |
| Total | 244,209 | 24,413 | 268,622 |
| Total for 2000 | 292,146 | 27,621 | 319,767 |
Building controls in New Zealand are managed by the Building Industry Authority, a Crown entity established under the Building Act 1991 and responsible for writing the New Zealand Building Code. The building code specifies essential requirements for building performance, to ensure the health and safety of building users and the protection of other people's property. The Building Industry Authority also writes technical documents (known as The New Zealand Building Code Handbook and Approved Documents), which provide methods of satisfying the code. Solutions published in these documents are not mandatory, and the building industry is encouraged to develop new materials and systems as alternatives to traditional methods. Important requirements of the building code are durability, ease of access for all users, and energy efficiency in buildings.
Day-to-day administration of building controls is the responsibility of territorial authorities, which must confirm that building projects satisfy code provisions. Building consents are required for new buildings and for alterations to existing buildings. Any such work must also comply with district plans of territorial authorities prepared under the Resource Management Act 1991. For completed buildings, the requirement for regular maintenance of essential systems, such as fire alarms, lifts and air conditioning, is covered by the act's compliance schedule and annual building warrant of fitness provisions.
As of mid-2001, there were 26 building certifiers approved by the Building Industry Authority, some of whom were limited to approving work covered by the approved documents for housing, while others specialised in disciplines such as automatic sprinkler systems and lifts.
The worldwide move to performance-based building codes as a means of overcoming trade barriers sees New Zealand as a leader among countries who implement such reforms. The New Zealand Building Code was used extensively as the model for the revised Building Code of Australia. All clauses of the building code and supporting documents are reviewed every five years to ensure the code remains current. Safe and healthy buildings are one of the authority's goals, and work on the dangerous buildings provisions of the Building Act 1991 continues to be a high priority, in particular earthquake-prone buildings. Other factors, like fire and insanitary conditions, can also make a building dangerous.
Providing adequately for people with disabilities is an important consideration in all new building work. Such provisions have existed under the Disabled Persons and Community Welfare Act since 1975, but the building code has ensured that designers and building owners fully appreciate them and that territorial authorities have taken them seriously when issuing consents. The code's objective of ensuring that people with disabilities are able to enter and carry out normal activities and functions within buildings is now accepted as a right of those with disabilities.
The Building Industry Authority is funded by a building consent levy at the rate (since December 1995) of $0.65 for every $1,000 of building work, applicable to projects exceeding $20,000. This produced income of about $3.6 million for the year to 30 June 2001. The authority's approved expenditure for that year was $2.7 million, of which approximately 20 percent was spent on education and information activities.
New Zealand's main official building statistics are Statistics New Zealand's monthly analyses of building authorisations, and its quarterly analyses of the value of work put in place. The prime source of these statistics is building consents issued by territorial authorities. Building authorisations are applied for under the building consents system administered by territorial authorities. Table 22.8 shows the location and value of building authorisations for 2001. The authorisation value shown usually represents the contract price or estimated cost of the building prior to the commencement of construction. The finished cost may be higher or lower due to changes in wage rates and material prices.
Table 22.8. Location and value of building authorisations 20011,2
| Region | Number | Residential value | Non residential value | Total building value | ||||
|---|---|---|---|---|---|---|---|---|
| 2000 | 2001 | 2000 | 2001 | 2000 | 2001 | 2000 | 2001 | |
1Year ended 31 March. 2Does not include alterations and additions. C = confidential Source: Statistics New Zealand | ||||||||
| $(million) | ||||||||
| Northland | 1,142 | 945 | 144.9 | 129.9 | 41.7 | 24.6 | 186.6 | 154.4 |
| Auckland | 10,950 | 7,428 | 1,482.6 | 1,083.2 | 564.7 | 544.6 | 2,047.3 | 1,627.8 |
| Waikato | 2,761 | 2,020 | 383.6 | 299.6 | 113.0 | 109.0 | 496.6 | 408.7 |
| Bay of Plenty | 2,123 | 1,547 | 333.0 | 238.9 | 61.1 | 97.5 | 394.1 | 336.5 |
| Gisborne | 110 | 84 | 14.9 | 12.1 | 5.3 | 4.6 | 20.2 | 16.7 |
| Hawke's Bay | 456 | 406 | 73.7 | 65.5 | 44.7 | 34.4 | 118.5 | 99.9 |
| Taranaki | 207 | 169 | 29.8 | 25.2 | 24.8 | 33.0 | 54.6 | 58.2 |
| Manawatu-Wanganui | 652 | 553 | 82.9 | 81.6 | 42.3 | 35.6 | 125.2 | 117.2 |
| Wellington | 2,456 | 2,156 | 339.6 | 328.4 | 96.5 | 123.6 | 436.1 | 452.0 |
| Nelson | 165 | 149 | 22.5 | 19.3 | 10.7 | 20.5 | 33.2 | 39.8 |
| Tasman | 372 | 344 | 48.8 | 45.9 | 12.0 | 16.9 | 60.9 | 62.8 |
| Marlborough | 299 | 272 | 39.0 | 38.3 | 18.6 | 12.0 | 57.6 | 50.3 |
| West Coast | 72 | 98 | 9.8 | 10.0 | 18.0 | 8.2 | 14.6 | 18.2 |
| Canterbury | 3,307 | 2,366 | 422.8 | 326.6 | 120.7 | 245.1 | 543.6 | 571.7 |
| Otago | 701 | 710 | 98.3 | 112.6 | 65.0 | 55.1 | 163.2 | 167.7 |
| Southland | 84 | 121 | 9.5 | 16.2 | 19.9 | 26.9 | 29.4 | 43.1 |
| Area Outside | C | ..C | ..C | ..C | ..C | ..C | 0.4 | 0.3 |
| Total New Zealand | 25,858 | 19,370 | 3,533.2 | 2,833.5 | 1,248.9 | 1,391.8 | 4,782.1 | 4,225.3 |
Authorisation was given for $2.8 billion worth of new dwelling construction in the year ending March 2001.
Some categories of buildings used in building authorisation tables require additional explanation. ‘Hostels and boarding houses', for example, includes barracks, orphanages, nurses’ homes, and boarding school accommodation; ‘hotels and motels’ includes private and licensed hotels, but excludes taverns. ‘Education buildings’ includes primary and secondary schools, colleges of education, technical institutes, university buildings, kindergartens, and playcentres. The broad category of ‘social, cultural and recreational buildings’ includes churches, halls, theatres, cinemas, clubrooms, community centres and grandstands.
Table 22.9 show the values of building authorisations by building type for the five years to March 2001. Authorisations cover alterations and additions, as well as new buildings.
Table 22.9. Value of building authorisations issued
| Type of building | Year ended 31 March | ||||
|---|---|---|---|---|---|
| 1997 | 1998 | 1999 | 2000 | 2001 | |
| Source: Statistics New Zealand | |||||
| $(million) | |||||
| Residential | |||||
| New dwellings | 2,927.4 | 3,252.0 | 2,775.9 | 3,533.2 | 2,833.5 |
| Alterations/additions and outbuildings | 635.2 | 686.4 | 680.4 | 729.7 | 710.6 |
| Total residential buildings | 3,562.6 | 3,938.3 | 3,456.3 | 4,262.8 | 3,544.1 |
| Non-residential (includes additions and alterations) | |||||
| Hostels, boarding houses | 16.2 | 63.2 | 101.2 | 76.8 | 43.4 |
| Hotels, motels, etc | 126.8 | 149.2 | 154.1 | 123.8 | 134.2 |
| Hospitals and nursing homes | 165.9 | 165.6 | 173.6 | 198.1 | 218.8 |
| Education buildings | 315.9 | 312.2 | 355.8 | 346.1 | 312.4 |
| Social, cultural, religious and recreational buildings | 243.6 | 171.0 | 319.8 | 166.8 | 275.1 |
| Shops, restaurants, taverns | 291.3 | 342.7 | 304.4 | 338.7 | 371.8 |
| Office and administrative | 381.1 | 477.9 | 407.0 | 336.7 | 478.0 |
| Storage buildings | 226.3 | 235.9 | 154.7 | 173.3 | 187.9 |
| Factories and industrial | 422.3 | 332.8 | 264.2 | 314.5 | 312.1 |
| Farm buildings | 98.6 | 85.7 | 93.3 | 89.8 | 123.5 |
| Miscellaneous buildings | 41.7 | 26.7 | 29.8 | 40.9 | 21.2 |
| Total non-residential buildings | 2,329.6 | 2,362.9 | 2,357.8 | 2,205.6 | 2,478.4 |
| Total all buildings | 5,892.1 | 6,301.2 | 5,814.1 | 6,468.4 | 6,0224 |
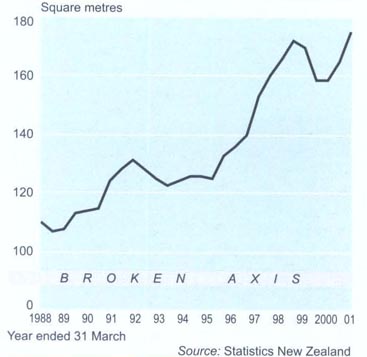
Residential building authorisations are shown in table 22.10. The high proportion of the total value of building authorisations represented by dwellings built by the private sector (households) highlights the importance of private investment in residential buildings as a key to stability in the building industry. The total for dwellings during 2000–2001 includes 19,370 unit authorisations, for a total value of $2.8 billion for new dwellings. This includes authorisations for 37 new government dwellings. Figure 22.5 shows how the size of new dwellings has surpassed the peak of 1998 and Figure 22.6 shows residential consents as a percentage of all buildings consents.
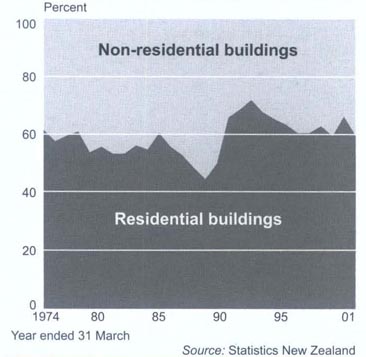
Figure 22.7 shows the number of new dwelling units authorised since 1974.
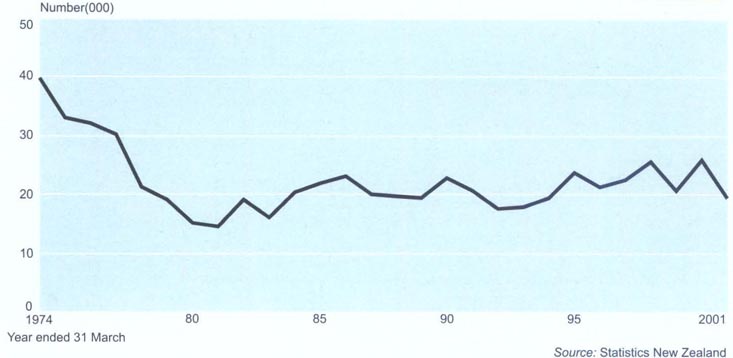
Table 22.1. Residential building authorisations
| Year ended 31 March | New dwellings | Residential buildings1 | All buildings1 | ||
|---|---|---|---|---|---|
| Units | Value | Floor area | |||
1Includes outbuildings, additions and alterations. Source: Statistics New Zealand | |||||
| number | $(million) | sq m (000) | $(million) | ||
| 1997 | 22,418 | 2,927.4 | 3,820.4 | 3,562.6 | 5,892.1 |
| 1998 | 25,565 | 3,252.0 | 4,077.3 | 3,938.3 | 6,301.2 |
| 1999 | 20,766 | 2,775.9 | 3,310.3 | 3,456.3 | 5,814.1 |
| 2000 | 25,858 | 3,533.2 | 4,261.5 | 4,262.8 | 6,468.4 |
| 2001 | 19,370 | 2,833.5 | 3,382.4 | 3,544.1 | 6,022.4 |
Work put in place. Statistics New Zealand conducts quarterly surveys of building work put in place (see table 22.11). In contrast with statistics based on building authorisations, these figures show the gross value of actual work done, excluding GST. It should be noted there are varying time-lags between the issue of the building authorisation and the commencement of building, and the actual work for which an authorisation is issued can be extended over varying periods.
Table 22.11. Work put in place
| Year ended 31 March | Dwellings | |||
|---|---|---|---|---|
| New dwellings | Alterations, additions and outbuildings | Subtotal | ||
| Government | Other | |||
| $(million) | ||||
| 1997 | 16.4 | 3,393.4 | 687.4 | 4,097.2 |
| 1998 | 13.4 | 3,590.2 | 641.6 | 4,245.2 |
| 1999 | 9.0 | 2,967.8 | 619.6 | 3,596.3 |
| 2000 | 4.8 | 3,864.3 | 735.1 | 4,604.2 |
| 2001 | 14.1 | 3,268.1 | 662.5 | 3.944.7 |
| Year ended 31 March | Non-residential buildings (including alterations and additions) | |||||||
|---|---|---|---|---|---|---|---|---|
| Hotels and boarding homes | Hospitals and nursing homes | Factories and industrial buildings | Commercial buildings1 | Education buildings | Miscellaneous2 buildings | Subtotal | Total | |
1Includes ships, restaurants. taverns, offices, administrative buildings and storage buildings. 2Includes social, cultural, religions, recreational and farm buildings. Source: Statistics New Zealand | ||||||||
| $(million) | ||||||||
| 1997 | 244.4 | 183.9 | 473.0 | 753.6 | 378.2 | 837.7 | 2,870.8 | 6,968.0 |
| 1998 | 206.1 | 197.1 | 427.9 | 763.2 | 345.7 | 738.0 | 2,678.0 | 6,923.2 |
| 1999 | 276.3 | 211.2 | 258.3 | 746.3 | 404.9 | 780.6 | 2,677.6 | 6,273.9 |
| 2000 | 304.4 | 270.4 | 326.0 | 776.9 | 354.3 | 705.8 | 2,737.8 | 7,342.0 |
| 2001 | 212.7 | 293.7 | 309.4 | 920.9 | 403.7 | 634.5 | 2,774.9 | 6,719.6 |
Building and construction price indexes. Price indexes for buildings and construction are contained within the capital goods price index. Two series for residential buildings, four for non-residential buildings, four other construction and four land improvement price indexes have been produced since the December 1989 quarter. For the quarter ended June 2001. the index recorded increases of 0.2 percent for residential buildings, 0.7 percent for non-residential buildings, 0.9 percent for other construction and 1.1 percent for land improvements.
Rentals. The dwelling rentals component of the consumers price index decreased by 9.9 percent in the year to June 2001.
Industry statistics. Statistics New Zealand's periodic Census of Building and Construction has provided broad economic data on the industry. The most recent census formed part of the 1987 Economy Wide Census. Results from the census are updated annually by the Annual Enterprise Survey. Both the census and the enterprise survey cover the activities of all business classed in Division E of the Australian and New Zealand Standard Industrial Classification. A summary of results is given in table 22.12.
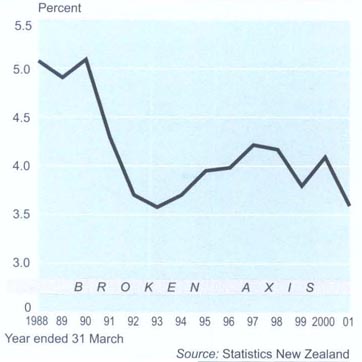
Figure 22.8 shows the annual value of construction as a percentage of gross domestic product.
Table 22.12. Building and construction: statistical summary
| Financial item | 1998 | 1999 | 2000 | Percentage change from previous year | |
|---|---|---|---|---|---|
| 1999 | 2000 | ||||
| Source: Statistics New Zealand | |||||
| Financial performance | $(million) | Percent | |||
| Total income | 13,564 | 13,890 | 15,229 | 2.4 | 9.6 |
| Sales of goods and services | 13,470 | 13,791 | 15,126 | 2.4 | 9.7 |
| Interest, dividends and donations | 64 | 67 | 59 | 5.2 | -11.6 |
| Government funding, grants and subsidies | 2 | 6 | 2 | 159.9 | -61.0 |
| Non-operating income | 28 | 26 | 41 | -6.7 | 56.7 |
| Total expenditure | 12,623 | 12,919 | 14,133 | 2.3 | 9.4 |
| Interest and donations | 185 | 191 | 174 | 3.6 | -9.0 |
| Indirect taxes | 65 | 65 | 68 | -0.7 | 4.6 |
| Depreciation | 344 | 334 | 330 | -2.8 | -1.3 |
| Salaries and wages paid to employees | 2,009 | 2,107 | 2,329 | 4.9 | 10.6 |
| Redundancy and severance | 7 | 6 | 7 | -7.3 | 12.4 |
| Salaries and wages to working proprietors (SW to WPs) | 501 | 548 | 594 | 9.4 | 8.3 |
| Purchases and other operating expenses | 9,429 | 9,598 | 10,557 | 1.8 | 10.0 |
| Non-operating expenses | 91 | 76 | 81 | -16.4 | 6.8 |
| Opening stocks | 683 | 784 | 783 | 14.7 | -0.1 |
| Closing stocks | 725 | 805 | 897 | 11.0 | 11.5 |
| Operating surplus before income tax | 1,442 | 1,520 | 1,690 | 5.4 | 11.2 |
| Financial position | $(million) | Percent | |||
| Total assets | 6,828 | 8,268 | 7,565 | 21.1 | -8.5 |
| Current assets | 3,455 | 3,717 | 3,882 | 7.6 | 4.4 |
| Fixed tangible assets | 2,529 | 2,830 | 2,393 | 11.9 | -15.4 |
| Additions to fixed assets | 678 | 734 | 828 | 8.3 | 12.8 |
| Disposals of fixed assets | 175 | 250 | 216 | 42.5 | -13.7 |
| Other assets | 845 | 1,721 | 1,290 | 103.7 | -25.0 |
| Total equity and liabilities | 6,828 | 8,268 | 7,565 | 21.1 | -8.5 |
| Shareholders funds or owners equity | 2,309 | 3,191 | 2,232 | 38.2 | -30.1 |
| Current liabilities | 2,996 | 3,146 | 3,480 | 5.0 | 10.6 |
| Other liabilities | 1,523 | 1,932 | 1,853 | 26.8 | -4.1 |
| Financial ratios | |||||
| Total income per full-time equivalent (FTE) | $134,300 | $128,500 | $137,300 | -4.3 | 6.8 |
| Operating surplus per full-time equivalent (FTE) | $14,300 | $14,100 | $15,200 | -1.4 | 7.8 |
| Current ratio | 115.3% | 118.2% | 111.5% | ||
| Quick ratio | 91.1% | 92.6% | 85.8% | ||
| Return on equity | 62.5% | 47.6% | 75.7% | ||
| Return on total assets | 21.1% | 18.4% | 22.3% | ||
| Liabilities structure | 33.8% | 38.6% | 29.5% | ||
22.1 Statistics New Zealand; Quotable Value New Zealand; Housing New Zealand Corporation; Housing New Zealand; Ministry of Housing.
22.2 Reserve Bank of New Zealand; Land Information New Zealand; Ministry of Social Development.
22.3 Statistics New Zealand; Building Industry Authority.
Statistics New Zealand divisional manager responsible: Mike Moore.
Annual Report (annual). Housing New Zealand Ltd, Wellington.
Annual Report of Quotable Value New Zealand (Parl. paper G.26).
On-line statistical publications (including residential, New Zealand real estate market, urban and rural), Quotable Value New Zealand (www.quotable.co.nz), Wellington.
Report of the Ministry of Housing (Parl paper B.12).
Annual Enterprise Survey (annual). Statistics New Zealand, Wellington.
Annual Report (annual). Building Industry Authority, Wellington.
BIA News (monthly). Building Industry Authority, Wellington.
BUILD (bimonthly). Building Research Association of New Zealand, Wellington.
Building Consents Issued (monthly). Statistics New Zealand, Wellington.
New Zealand Building Code Handbook and Approved Documents. Building Industry Authority, Wellington (available from Victoria University Book Centre).
Progressive Building (bimonthly). AGM Publishing, Auckland.
Value of Work Put in Place (quarterly). Statistics New Zealand, Wellington.
www.bia.co.nz – Building Industry Authority
www.branz.org.nz – Building Research Association of New Zealand
www.hnzc.co.nz – Housing New Zealand Corporation
www.minhousing.govt.nz – Ministry of Housing
www.quotable.co.nz – Quotable Value New Zealand
www.rbnz.govt.nz – Reserve Bank of New Zealand
www.stats.govt.nz – Statistics New Zealand
Table of Contents
Seventeen foreign airlines now serve New Zealand following liberalisation of external aviation policy.
The evolution of New Zealand's transport system has been characterised not only by the country's remoteness from many of its trading partners, but also by its relatively low population density. International air and telecommunication links have helped overcome New Zealand's isolation, but there is still a heavy reliance on sea transport for overseas trade. Internally, comprehensive rail and road networks have been established over difficult terrain, using innovative engineering. Taking into account the size of the population, the capital cost has been high.
The period from the late 1970s has been marked by ongoing and continuing change in the New Zealand transport sector. Major regulatory changes have encouraged competition within the industry and allowed the ongoing introduction of a wide range of new technologies. Organisational changes have seen a greater use of commercial structures for publicly owned transport systems, with some of these being transferred to the private sector.
At the start of the 21st century, there is a new focus on environmental issues in the transport sector, while debate continues on the way in which the New Zealand transport sector fits into the rapidly changing global system.
Restructuring of railways centred on the need to improve efficiency. The then Railways Corporation became a state-owned enterprise in 1986, responsible for managing its resources and rationalising its operations on commercial lines. NZ Rail was sold to the private sector in 1994 and was renamed Tranz Rail Ltd in 1995.
The road transport industry has also undergone major changes. Largely deregulated by the end of 1989, the qualitative system of road licensing replaced the quantitative system. Rather than the government regulating the number of operators allowed on the road, the industry now has to meet certain quality controls. As well, a new Crown agency, Transit New Zealand, has taken over the functions of the former National Roads Board and the Urban Transport Council. The Land Transport Safety Authority, responsible for road and rail safety, was established in 1993 from the former land transport division of the Ministry of Transport. In 1996, Transfund New Zealand was formed and is responsible for funding roading and alternatives to roading, leaving Transit New Zealand as the state highway operator.
Civil aviation in New Zealand has undergone tremendous changes in recent times. Domestic air services were effectively deregulated in 1983 by liberalising the licensing regime. Competition was further stimulated by revocation of overseas investment limitations in 1986, and qualitative licensing was removed in 1990, leaving safety certification as the only criterion for market entry.
The government announced a new, liberalised external aviation policy in 1985 which resulted in an expansion in international air services. Seventeen foreign airlines, including five cargo airlines, operate to New Zealand and an additional seven serve New Zealand on a code-share basis. There are two New Zealand international scheduled airlines, Air New Zealand and Freedom Air International, which commenced services in 1995. Air New Zealand, which was privatised in 1989, returned to majority government ownership in 2001.
Airports, previously run by local and central government, have been encouraged to form companies. Auckland, Wellington and Christchurch international airports have been corporatised, as have several regional airports.
Other changes have occurred within the aviation infrastructure, such as the creation of the state-owned enterprise Airways Corporation of New Zealand Ltd, the stand-alone Civil Aviation Authority, which regulates all safety issues, and the independent Transport Accident Investigation Commission.
Comprehensive reforms of New Zealand's waterfront since 1988 have resulted in cost savings and efficiency improvements.
Thirteen port companies were established in 1988 to take over ownership and operation of commercial port facilities and waterfront labour was reformed in 1989. This reform saw the end of the government-managed labour pool system and introduced direct employment and enterprise bargaining to the waterfront. In 1995, new shipping legislation allowed foreign operators to enter New Zealand's coastal shipping trade and some non Australasian-crewed ships began to enter the trans-Tasman trade.
Statistics New Zealand's Annual Enterprise Survey covers the activities of all transport and storage businesses. Some of the survey's results are shown in table 23.1. They are the latest final data available.
Table 23.1. Transport and storage: statistical summary
| Financial item | Road transport 19991 | Water transport 19991 | Other transport 19991 |
|---|---|---|---|
1These figures are provisional Source: Statistics New Zealand | |||
| Financial performance $(million) | |||
| Total income | 3,355 | 451 | 2,602 |
| Sales of goods and services | 3,255 | 445 | 2,523 |
| Interest, dividends and donations | 23 | 1 | 35 |
| Government funding, grants and subsidies | 64 | I | 2 |
| Non-operating income | 13 | 4 | 42 |
| Total expenditure | 3,167 | 414 | 2,215 |
| Interest and donations | 92 | 11 | 92 |
| Indirect taxes | 167 | 5 | 28 |
| Depreciation | 232 | 19 | 191 |
| Salaries and wages paid to employees | 734 | 103 | 719 |
| Redundancy and severance | 2 | 1 | 22 |
| Salaries and wages to working proprietors | 87 | 1 | 64 |
| Purchases and other operating expenses | 1,832 | 271 | 1,109 |
| Non-operating expenses | 23 | 4 | 12 |
| Opening stocks | 17 | 3 | 14 |
| Closing stocks | 16 | 2 | 19 |
| Operating surplus before income tax | 275 | 38 | 451 |
| Financial position $(million) | |||
| Total assets | 2,939 | 199 | 3,929 |
| Current assets | 960 | 47 | 868 |
| Fixed tangible assets | 1,571 | 140 | 2,739 |
| Additions to fixed assets | 220 | 22 | 293 |
| Disposals of fixed assets | 98 | 40 | 184 |
| Other assets | 408 | 13 | 322 |
| Total equity and liabilities | 2,939 | 199 | 3,929 |
| Shareholders funds or owners equity | 1,142 | 91 | 2,195 |
| Current liabilities | 924 | 69 | 893 |
| Other liabilities | 873 | 39 | 840 |
| Financial ratios | |||
| Total income per full-time equivalent (FTE) | $94,600 | $262,200 | $181,800 |
| Operating surplus per full-time equivalent (FTE) | $7,800 | $22,000 | $31,500 |
| Current ratio | 103.9% | 68.1% | 97.2% |
| Quick ratio | 102.1% | 65.2% | 95.0% |
| Return on equity | 24.1% | 41.6% | 20.5% |
| Return on total assets | 9.4% | 19.1% | 11.5% |
| Liabilities structure | 38.8% | 45.8% | 55.9% |
Nearly 85 percent of New Zealand exports by value and 99 percent by volume are carried by sea. Imports carried by sea account for around 75 percent by value and 99 percent by volume. This clearly illustrates the importance to New Zealand of efficient and cost-competitive international shipping services, especially considering the country's distance from overseas markets. Coastal shipping provides inter-island links and plays a key role in the distribution of petroleum products and cement.
In the 1990s, New Zealand shipping policy reflected the philosophy that the country's interests were best served by being a ship-using, rather than a ship-operating nation. The policy sought to ensure for New Zealand exporters and shippers unrestricted access to the carrier of their choice, and to the benefits of fair competition among carriers. The Maritime Transport Act 1994 introduced measures that allowed foreign ships transiting the New Zealand coast in the course of their international voyages to carry coastal cargo. The then government also supported the opening of trans-Tasman shipping to international competition and foreign-crewed ships. The trade had historically been reserved for Australian and New Zealand-crewed ships through a maritime union accord.
The Maritime Transport Act 1994 also regulates ship safety, maritime liability and marine environmental protection. The Maritime Safety Authority of New Zealand is responsible for maritime safety, marine pollution prevention and response functions under the act.
The most recent employment statistics available on the transport industry, Statistics New Zealand's business demographic statistics of February 2001, recorded 710 full-time equivalent persons engaged in international sea transport, 1,020 in coastal water transport and 500 in inland water transport.
Ninety-nine percent of New Zealand's imports by volume arrive by sea.
Conference lines and vessel sharing agreements (VSAs) are involved in much of New Zealand's overseas shipping. Conferences are associations among shipping companies to provide joint services on several trade routes. VSAs are more limited arrangements than conferences, involving separate services jointly scheduling the same vessels to better utilise vessel capacity. Increased competition in recent years has seen greater participation by independent carriers.
United Kingdom/Europe. The New Zealand European Shipping Association plays a major role in servicing Mediterranean and Northern European ports. P & O Nedlloyd Ltd has the largest trade, with the balance held by a number of continental carriers.
Middle East/Indian subcontinent. A direct service is provided by Contship Containerline. Transhipment services, principally via Singapore, are provided by a number of lines, including NYK Line, P & O Nedlloyd, Malaysia International Shipping Corporation and Maersk Sealand.
East Asia/South-east Asia. The Australian and New Zealand Eastern Shipping Conference provides a direct container service between New Zealand, Japan and Korea. A range of direct and transhipment services are provided by many lines, including China Ocean Shipping Company, New Zealand Unit Express, Tasman Orient Line, Far Eastern Shipping Company, Malaysia International Shipping Corporation, Pacific International Lines and Maersk Sealand.
North America. The Australia/New Zealand Direct Line (ANZDL) operates between Australia, New Zealand and the west coast of the United States and provides for the through transport of cargo by road and rail throughout the United States and Canada. Columbus Line and Blue Star Line service both the east and west coasts. Other lines, including Maersk Sealand and Contship Containerlines, provide transhipment services to either coast. ANZDL, Columbus Line, FESCo and P&O Nedlloyd operate a VSA for services between New Zealand, Australia and North America.
Trans-Tasman. Participation in the Tasman trade has changed considerably in recent years, with foreign cross traders supplanting most Australasian tonnage. Carriers now include Australia/New Zealand Direct Line, P&O Nedlloyd, Tasman Express Line, Chief Container Service, Columbus Line and Pacific Forum Line.
South Pacific. The regionally-owned Pacific Forum Line operates services linking New Zealand, Australia, Fiji, Papua New Guinea, the Cook Islands, Tonga, Samoa and American Samoa. Australia/ New Zealand Direct Line, Columbus Line, Sofrana Unilines, Black Bart Shipping and Pacific Direct Line also operate ships in the New Zealand-South Pacific trade or provide services in conjunction with North American trades. These operators cumulatively provide New Zealand links with the Cook Islands, Fiji, Kiribati, New Caledonia, Niue, Papua New Guinea, the Solomon Islands, Tahiti, Tonga, Tuvalu, Vanuatu, Samoa and American Samoa.
Tranz Rail's Interisland Line provides a rail ferry service across Cook Strait between Wellington and Picton, transporting passengers, vehicles and freight. Since late 1994, Tranz Rail has also operated a high-speed car and passenger ferry service between Wellington and Picton during the summer season. This was increased to a full-year service in late 2000. Pacifica Shipping operates four roll-on roll-off vessels on services linking Auckland, Tauranga, Wellington, Nelson, Lyttelton, Timaru and Dunedin. Strait Shipping operates a livestock carrier and a roll-on roll-off vessel between Wellington, Picton and Nelson. Auckland-based Sea-Tow operates tugs and barges on tramp services around the New Zealand coast. Black Robin Shipping operates a general cargo and livestock service between the North and South Islands and the Chatham Islands. A new service operated by BB Shipping has replaced the former Cook Islands National Line service linking Napier and the Chatham Islands into a South Pacific service.
Tranz Rail's high-speed Cook Strait ferry moved to year-round operations in late 2000.
Overseas trade. New Zealand's bulk-shipping needs are served in the main by a mix of vessels, few of which operate in fixed services. Imported bulk cargoes include crude oil, phosphate rock, bauxite and petroleum coke. Exports include ironsand, coal, forest products and methanol. Sea-Tow provides tug and barge services, which can operate to Australia and the South Pacific.
Coastal. Bulk cement distribution is handled by three small cement vessels operated by Milburn New Zealand (2) and the Golden Bay Cement Company (1). Two product tankers operated by Coastal Tankers Ltd distribute petroleum products from the Marsden Point oil refinery.
Ports. Port companies established under the Port Companies Act 1988 operate New Zealand's 13 commercial ports. These companies are predominantly local government-owned, although six are partly privatised and five of these are listed on the New Zealand Stock Exchange.
Registration of ships. As at 31 December 2001, there were 2,997 ships on the New Zealand Register of Ships, with a total gross tonnage of 262,242 and net tonnage of 133,303. This compared with 3,023 ships with a gross tonnage of 258,264 and net tonnage of 134,601 at 31 December 2000. Under provisions of the Ship Registration Act 1992, ships not exceeding 24m register length are not required to have tonnages registered. New registrations and re-registrations during 2001 included the cargo vessels Spirit of Enterprise and Rangatira, the passenger vessel Milford Mariner, and the fishing vessels Rover, San Nikunau, San Nanumea, Petersen and Aorere. Vessels removed from the New Zealand register during 2001 included the inter-island passenger ferry Arahanga.
Table 23.2 shows the number and capacity of vessels involved in domestic and overseas trade.
Table 23.2. Registered vessels involved in domestic and overseas trade
| Number of vessels | Net registered tonnage1 | Number of crew2 | |
|---|---|---|---|
1The shipping register is not metricated and 1 net register ton equals 100 cubic feet (or 2.83 cubic metres) of cargo capacity. 2Crew figures not necessarily up to dale. Source: Maritime Safety Authority | |||
| Domestic | |||
| 1997 | 12 | 26,048 | 302 |
| 1998 | 8 | 16,875 | 200 |
| 1999 | 8 | 16,875 | 200 |
| 2000 | 8 | 14,580 | 145 |
| 2001 | 9 | 14,406 | 158 |
| Overseas | |||
| 1997 | 7 | 54,711 | 115 |
| 1998 | 7 | 43,763 | 111 |
| 1999 | 4 | 32,543 | 42 |
| 2000 | 3 | 29,484 | 23 |
| 2001 | 3 | 29,484 | 40 |
Seafarer qualifications. The Maritime Safety Authority (MSA) is the licensing body for merchant navy personnel. After qualifying for sea service, followed by further training and examination at approved teaching institutions, seafarers are issued with certificates of competency as master, mate, engineer, as well as deck and engine room ratings. There are different classes of certificates of competency for foreign-going, coastal or restricted-limit ships. The foreign-going certificates, and endorsements for service on special types of ships, meet in full the requirements of relevant United Nations conventions and are accepted (subject to appropriate checks) for use in other countries. The authority issues separate certificates of competency to masters, mates, engineers and deckhands of deep-sea, coastal and inshore fishing boats. These also require sea service followed by training and examination at approved teaching institutions. The Royal New Zealand Coastguard Federation looks after pleasure-boat mariners. The federation holds courses and conducts voluntary examinations for certificates of competency as day skipper, boat master, coastal skipper and ocean yachtmaster.
Maritime safety. The New Zealand Government is a signatory to many International Maritime Organisation (IMO) and International Labour Organisation (ILO) conventions which specify safety standards for ships and health and safety standards for crews. The Maritime Safety Authority is responsible for administering these conventions, which are reflected in the Maritime Transport Act 1994. The authority inspects foreign and New Zealand ships to ensure they meet required standards.
Marine safety services. There are 142 navigational aids owned and maintained by the Maritime Safety Authority (MSA) on headlands, capes, reefs and shoals around 5,400 nautical miles (9,000 kilometres) of New Zealand coastline. The aids consist of 96 automatic lights, 41 day beacons and five navigational buoys. There are no staffed lighthouses in New Zealand.
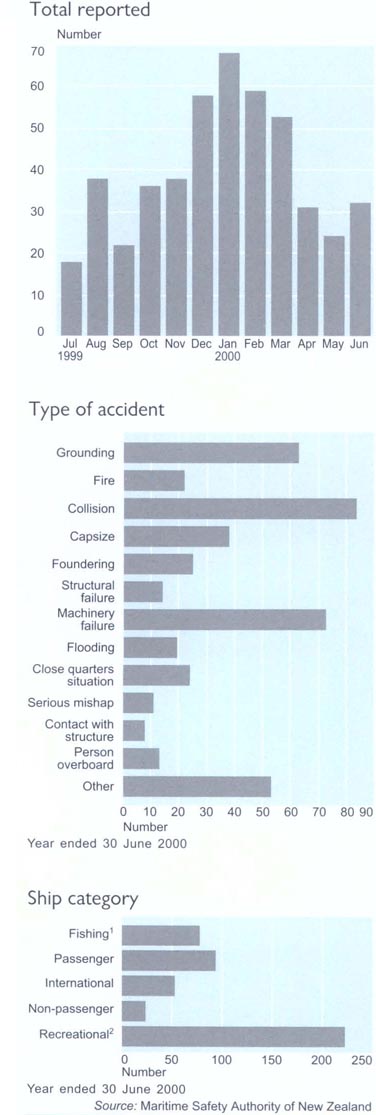
The MSA provides a distress and safety radio communication system for mariners. Radio frequencies dedicated to distress messages are monitored around the clock in the very high, medium and high frequency bands. The system also broadcasts weather reports, warnings of maritime hazards and assists during search and rescue operations and medical emergencies at sea. The cost of providing navigation aids and the distress and safety radio system is met from a marine safety charge levied on all commercial ships (New Zealand and foreign). The government also contributes to costs, on behalf of the recreational boating sector.
Wrecks. Where ships are wrecked on the New Zealand coast or in lakes and rivers, the Director of Maritime Safety has powers for preserving life and protecting property. Contrary to popular belief, a wreck or any article belonging to it remains the property of the owner and it is illegal for others to take any items of wreckage.
Maritime accidents. The MSA investigates maritime accidents and incidents to identify their causes, analyses trends and makes recommendations as to how similar occurrences can be avoided. Investigations also assess whether there has been any breach of the law. Figure 23.1 shows monthly reported marine accidents for the year ended 30 June 2000.
Marine pollution. The MSA is required to promote a clean marine environment and is responsible for developing and implementing New Zealand's marine oil spill response strategy. It sets out principles to ensure that New Zealand is prepared for, and can respond to, marine oil spills. A tiered planning and response system for dealing with oil spills has been established at local. regional, national and international levels to respond to an oil spill of any size. While New Zealand's equipment, trained personnel and services are designed to be able to respond to a one in 100-year spill, arrangements are in place to use international assistance when needed. The National Oil Spill Service Centre at Te Atatu, Auckland, houses equipment which can be mobilised immediately in the event of an oil spill. This national stockpile complements equipment the MSA stores in key locations throughout New Zealand.
Shipping industry review. The government established a shipping industry review in August 2000 to enquire into New Zealand's shipping industry. A six-member review team reported back to the government in December 2000 with its report A Future for New Zealand Shipping. The government is considering the review's proposals, which include, among other things, the need for more shipping and cargo-related statistics.
The most recent employment statistics available on the transport industry, Statistics New Zealand's business demographic statistics for February 2001, recorded 3,880 full-time equivalent persons in scheduled international air transport, 3,070 persons in scheduled domestic air transport, and 710 others, giving a total of 7,660 engaged in civil aviation.
New Zealand is one of the most aviation-oriented nations in the world. In a population of just 3.9 million, there are more than 8,620 pilots and 3,295 aircraft – one pilot for every 450 people and one aircraft for every 1,180 people. During the 2000/01 year, 3,253 million people arrived in New Zealand with international air carriers. The number of aircraft in the New Zealand civil fleet decreased slightly in the year 2000, from 3,313 to 3,305. The number of licensed aircraft engineers continues to increase, from 1,616 in 2000 to 1,697 in 2001. The number of hours flown also continues to increase, by 2 percent annually for the total number of hours flown and by 2 percent annually for the number of flights.
The CAA was established in August 1992 and operates under the Civil Aviation Act 1990. It is New Zealand's aviation safety regulator, with the prime function of promoting civil aviation safety at a reasonable cost. Specific functions include establishing safety and security standards relating to entry into and exit from the civil aviation system; monitoring adherence to safety and security standards within the civil aviation system; ensuring regular review of the civil aviation system to promote the improvement and development of its safety and security; investigating and reviewing civil aviation accidents and incidents; providing civil aviation safety and security policy advice to the Minister of Transport; promoting safety and security in the civil aviation system through information, advice and education programmes; maintaining the New Zealand Register of Aircraft, the Civil Aviation Registry and other records and documents relating to activities within the civil aviation system; and providing search and rescue services.
The CAA also acts on behalf of the Crown in respect of the International Civil Aviation Organisation (ICAO). The CAA is also designated the Aviation Security Authority, Air Traffic Services Authority. Personnel Licensing Authority and the Meteorological Authority, and meets New Zealand's ICAO obligations for aeronautical information. It also undertakes those ICAO responsibilities of a technical or safety regulatory nature associated with the ICAO Air Navigation Bureau and Technical Assistance Bureau. The CAA is a Crown-owned entity headed by a five-member authority appointed by the governor-general on the recommendation of the Minister of Transport. The authority reports directly to the minister. The Director of Civil Aviation (the chief executive of the CAA) has a wide range of technical responsibilities, conferred on the position directly under legislation and through delegation from the authority, and is independently responsible for exercising control over entry and exit from the civil aviation system through the granting (and withdrawal) of aviation documents under civil aviation legislation. CAA has a staff of 156. The CAA received $18.65 million in 2000/01 from levies on airline tickets, government funding, and charges for services, such as certificating new aviation companies, issuing flight crew licences and carrying out audits. The domestic passenger levy of $1.91 generated $10.32 million in the 2000/01 financial year and the international levy of 89 cents per departing passenger generated $2.80 million (excluding GST). The CAA website is www.caa.govt.nz
Figure 23.2 shows the number of notifiable aircraft accidents in New Zealand from 1995 to 2001.
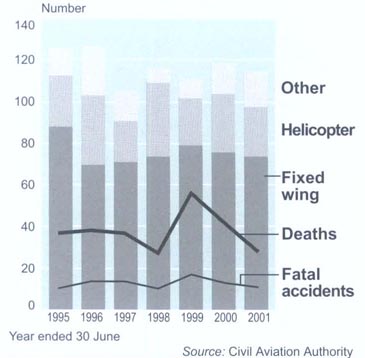
Airways provides air navigation services for the aviation industry within New Zealand's domestic and oceanic airspace. Established in 1987 as a state-owned enterprise, Airways was the first fully-commercialised air navigation services organisation in the world. Airways provides air traffic services, including flight information, to civil and military air traffic and is responsible for the planning, provision and maintenance of radar, navigational aids and communications. Air navigation facilities provided in New Zealand include electronic aids such as non-directional medium frequency beacons (NDB), Doppler very high frequency omni-directional radio ranges (DVOR), instrument landing systems (ILS), primary surveillance radar equipment (PSR), secondary surveillance radar (SSR), distance measuring equipment (DME) and very high frequency direction-finding equipment (VDF).
Airways aims to ensure the safe, orderly and expeditious flow of air traffic within the 34 million square kilometres of Pacific airspace assigned to New Zealand by the International Civil Aviation Organisation (ICAO).
Aircraft operators and pilots pay Airways for the services they use. These include radar control, landing charges and aeronautical charts and publications. Airways also assists search and rescue and airport emergency organisations. Its technicians perform installation and maintenance of technical facilities, including runway lighting and navigation aids, for airport companies in New Zealand and overseas.
In its first seven years of existence, Airways completed modernisation of New Zealand's entire air traffic control system, upgrading the nation's network of navigation aids and moving to the next generation of air traffic control technology. The first air navigation services organisation in the world to install a satellite-based Oceanic Control System (OCS) in 1995, Airways has received four major international awards for achievement in infrastructure and the implementation of the OCS. The new system, which can track aircraft across the Pacific, increases airline efficiency and air traffic safety. The second phase of OCS was implemented in early 2000.
Airways assists in discharging the operational and technical commitments arising from New Zealand's membership of ICAO. All military air traffic control and radar surveillance is supplied on contract to the Royal New Zealand Air Force.
In 1998, Airways became more customer focused, moving from a geographical to a market focused approach. Four new business units were established, one for each customer market, providing customers with a single point of contact, supporting their businesses better, and making Airways more competitive. Specialised divisions provide a range of related aviation services. Aviation Publishing is responsible for producing aeronautical charts and manuals on behalf of the Civil Aviation Authority and the Airways Training Centre, in Christchurch, conducts courses in air traffic services and telecommunications for New Zealand and international students. Airways Consulting has applied New Zealand's expertise in commercialisation and the implementation of communication, navigation and surveillance systems in India, Mauritius and the Pacific region. Airways’ website is www.airways.co.nz.
Deregulation of domestic aviation commenced in 1983 and was completed in 1990 with abolition of air services licensing. New Zealand allows up to 100 percent foreign ownership of domestic airlines. Air New Zealand is the major domestic operator and has regional connections through ‘Air New Zealand Link’ branding of commuter airlines. Qantas provides jet services on the main trunk and has regional connections through Nelson-based Origin Pacific.
International air services are operated under formal agreements negotiated between governments. New Zealand has 45 such agreements and a non-governmental agreement with Taiwan. Agreements outline routes by which airlines can operate to and from New Zealand and, in some cases, capacity that can be used on those routes.
Nelson-based airline Origin Pacific provides regional connections to major airports.
New Zealand's International Air Transport Policy, restated by the Minister of Transport in February 1998, is to maximise economic benefits to New Zealand, including trade and tourism, consistent with foreign policy and strategic considerations. The policy says the best way to achieve this is to encourage bilateral partners towards mutual liberalisation of air services. The aim is to facilitate access to existing and potential markets of interest to New Zealand.
Air New Zealand operates services to five gateways in Australia (Sydney, Melbourne, Brisbane, Perth and Cairns). In the Pacific, Air New Zealand operates to the Cook Islands, Samoa, Fiji, Tonga, Tahiti, Norfolk Island and New Caledonia. Services to Europe are offered on both an own-aircraft (London) and code-share basis. Air New Zealand operates to Singapore, Japan (Tokyo, Osaka and Nagoya), Hong Kong and Taiwan in Asia and offers code-share services to Bangkok (passenger) and Kuala Lumpur and Penang (cargo). Own-aircraft services are operated to Honolulu and Los Angeles and code-share services are offered to a variety of other points in the United States, as well as to Vancouver and Toronto in Canada. Code-share services are also offered to Guadalajara and Mexico City, in Mexico. Freedom Air International, an Air New Zealand subsidiary, offers budget services across the Tasman.
The Tasman is the busiest air route into New Zealand in both the number of passengers carried and the number of airlines operating. Nine passenger and four cargo airlines offer services between Australia and New Zealand.
There were 603,527 visitor arrivals from Australia in the year to March 2001. In the same period, 657,219 departing New Zealanders indicated Australia was the destination in which they expected to spend most time. In the March 2001 year, 1,848,454 foreigners visited New Zealand. Most were Australians, followed by Britons, Americans and Japanese.
Companies operating scheduled services to or from New Zealand must hold a valid air operator certificate and an international air service licence. The certificate ensures all technical and safety standards have been met, and is issued by the Director of Civil Aviation. The licence, issued by the Minister of Transport or, in the case of foreign airlines, the Secretary for Transport, ensures services operated are in accord with bilateral arrangements.
Table 23.3 lists the foreign airlines operating in New Zealand as at October 2001.
Table 23.3. Foreign airline operations – date of commencement and routes served, as at October 2001
| Date commenced | Airline | Routes now served |
|---|---|---|
1British Airways and American Airlines (on Qantas). EVA Air. Japan Airlines. Mexicana and Royal Tongan Airlines (on Air New Zealand). Air Canada (on Air New Zealand and United Airlines) and KLM (on Malaysia Airlines) serve New Zealand on a code-share basis only United Airlines and Singapore Airlines operate their own aircraft to New Zealand and also code-share on Air New Zealand. Polynesian Airlines and Aerolineas Argentinas operate their own aircraft to New Zealand and also code-share on Qantas. Qantas operates own aircraft services to New Zealand and also code-shares on Air Tahiti Nui and Polynesian Airlines. Air Tahiti Nui operates own aircraft services to New Zealand and also code-shares on Polynesian Airlines (to Sydney). Lufthansa operates own-aircraft cargo services to New Zealand and also code-shares on Air New Zealand and Thai Airways. 2American Airlines originally commenced services to New Zealand in 1970 hut ceased operating in 1974. Services recommenced for the period February 1990–March 1992. The airline now code-shares on Qantas. Source: Ministry of Transport | ||
| 1 Apr 1961 | Qantas1 | Sydney/Melbourne/Brisbane/Perth/Cairns–Auckland/Christchurch/Wellington Sydney–Auckland–Papeete Melbourne–Auckland–Los Angeles Brisbane–Auckland–Los Angeles Sydney-Auckland–Buenos Aires Melbourne/Sydney–Auckland/–Apia |
| 4 Apr 1963 | British Airways1 | London–Los Angeles–Auckland Auckland/Wellington/Christchurch–Sydney |
| 1 Oct 1974 | Air Pacific | Suva/Nadi–Auckland Nadi–Christchurch |
| 1 May 1976 | Singapore Airlines1 | Singapore–Auckland/Christchurch Singapore–Sydney–Auckland–Singapore (freight) |
| 25 Feb 1978 | Polynesian Airlines1 | Apia-Auckland Apia–Tonga–Auckland–Sydney |
| 1 Jul 1980 | Japan Airlines1 | Tokyo–Auckland Tokyo–Christchurch–Auckland Osaka–Auckland |
| 3 Dec 1985 | Cathay Pacific | Hong Kong–Auckland |
| 20 Dec 1985 | Aerolineas Argentinas1 | Buenos Aires–Auckland–Sydney |
| 11 Feb 1986 | United Airlines1 | Los Angeles–Auckland–Melbourne/Sydney/Brisbane/Cairns/Rarotonga/Nadi |
| 8 Nov 1987 | Air Caledonie International | Noumea–Auckland |
| 5 Nov 1987 | Thai Airways | Bangkok–Sydney–Auckland |
| 4 Nov 1988 | Garuda Indonesia | Denpasar–Brisbane–Auckland Denpasar–Auckland |
| 1 Nov 1989 | Air Vanuatu | Port Vila–Auckland |
| 5 Dec 1989 | Malaysia Airlines | Kuala Lumpur–Auckland |
| 1 Jul 1991 | Royal Tongan Airlines1 | Tonga–Auckland–Sydney |
| 29 Oct 1991 | Lufthansa1 | Frankfurt-Los Angeles-Auckland Frankfurt–Bangkok–Auckland Frankfurt–Singapore–Christchurch Frankfurt–Chicago–Honolulu–Auckland–Melbourne–Penang–Sharjah–Frankfurt (freight) Frankfurt–Atlanta–Chicago–Honolulu–Auckland–Melbourne–Penang–Delhi–Frankfurt (freight) Frankfurt–Chicago–Honolulu–Auckland–Kuala Lumpur–Delhi–Frankfurt (freight) |
| 3 Nov 1993 | Korean Air | Seoul–Auckland |
| 7 Nov 1993 | EVA Air1 | Taipei–Brisbane–Auckland Taipei–Auckland |
| 1 Nov 1995 | American Airlines2 | Los Angeles–Auckland–Melbourne/Sydney/Brisbane |
| 27 Mar 1997 | Asian Express | Sydney–Auckland (freight) |
| 1 Sep 1998 | Air Canada1 | Vancouver/Toronto–Los Angeles-Honolulu–Nadi–Auckland Vancouver/Toronto–Los Angeles–Auckland |
| 18 Sep 1999 | Cargolux | Luxembourg–Beirut–Bangkok–Melbourne–Auckland–Hong Kong–Abu Dhabi–Luxembourg (freight) Luxembourg–Bangkok–Melbourne–Auckland–Los Angeles–Guadalajara–Luxembourg (freight) |
| 16 Dec 1999 | Mexicana1 | Mexico City/Guadalajara–Los Angeles–Auckland |
| 24 Aug 2000 | Air Tahiti Nui | Papeete–Auckland–Sydney |
| 29 Oct 2000 | KLM Royal Dutch Airlines1 | Amsterdam–Kuala Lumpur–Auckland |
Distances to overseas destinations. Distances to Australian cities from airports at Wellington and Christchurch differ slightly from the Auckland figures given in table 23.4.
The distances are: Wellington to Sydney 2,235km, to Melbourne 2,589km and to Brisbane 2,508km. Christchurch to Sydney 2, 124km, to Melbourne 2, 413km, to Brisbane 2,495 km and to Hobart 2,024km.
Table 23.4. Distances from Auckland airport to selected overseas destinations1
| Destination | Distance (km) |
|---|---|
1These are airport-to-airport great circle distances in kilometres. Source: Ministry of Transport | |
| Adelaide | 3,247 |
| Apia | 2,893 |
| Bangkok | 11,500 |
| Brisbane | 2,293 |
| Buenos Aires | 15,884 |
| Hong Kong | 9,145 |
| Honolulu | 7,086 |
| Los Angeles | 10,480 |
| Melbourne | 2,635 |
| Nadi | 2,156 |
| Norfolk Island | 1,091 |
| Noumea | 1,859 |
| Pago Pago | 2,902 |
| Papeete | 4,093 |
| Perth | 5,400 |
| Port Moresby | 4,126 |
| Rarotonga | 3,013 |
| San Francisco | 10,503 |
| Santiago | 12,822 |
| Seoul | 12,869 |
| Singapore | 8,410 |
| Suva | 2,141 |
| Sydney | 2,158 |
| Taipei | 10,654 |
| Tokyo | 8,837 |
| Tonga | 2,004 |
| Townsville | 3,359 |
There has been significant change in the structure of the airport industry since 1986, with many airports, formerly partnerships between central and local government, restructured as airport companies. These include the three main international airports at Auckland, Christchurch and Wellington.
Auckland International Airport Ltd and Wellington International Airport Ltd have become majority privately-owned companies. Auckland International Airport Ltd, New Zealand's largest airport company, was floated in July 1998.
A number of provincial airports have also been corporatised, ranging in size from Dunedin Airport Ltd to the smallest airport company, Chatham Islands Airport Ltd. The Crown's interests in Rotorua Regional Airport Ltd and Palmerston North Airport Ltd have been sold.
Another major change for provincial airports has been development of international business. Airports operated by Dunedin Airport Ltd, Palmerston North Airport Ltd, Queenstown Airport Corporation Ltd and Waikato Regional Airport Ltd have regular international flights, mostly to and from Australia. This growth has occurred with emergence of airlines targeting the budget travel market.
The New Zealand railway network spans 3,912 kilometres, from Otiria in the north to Bluff in the south, and includes 149 tunnels and 2,178 bridges. More than 500 kilometres of the network is electrified. The track is narrow gauge of 1,067 millimetres. Since 1962, the network has included inter-island rail ferries connecting the North and South Island sections of the network.
Construction and development of the network began in earnest after 1870 and in 1876 all provincial and colonial railways were brought under the control of the government.
The Railways Department was reorganised in 1982 to become a government-owned corporation with a commercial mandate. The same year, the government began the deregulation of the transport industry, removing statutory protections for rail against competition by road.
In 1990, the operating assets of the Railways Corporation were transferred to a limited liability company, under government ownership, and in 1993 that company, New Zealand Rail Ltd, was sold to a private consortium comprising Wisconsin Central Transportation Corporation and two investment groups. Three years later, the new owners made a public offering of shares in Tranz Rail Holdings, listing the company on the New Zealand Stock Exchange and the NASDAQ National Market in the United States.
The process of deregulation, commercialisation and privatisation has seen a reduction in the number of employees. In 1982, the Railways Department employed 21,000 staff; in 2001, Tranz Rail employed 4,100.
Since the sale in 1993, the New Zealand Railways Corporation has continued as a residual government body with two principal activities: to manage all known litigation, contingent issues and statutory obligations; and to manage the rail corridor lease with Tranz Rail and other Crown land held for operational rail purposes so as to achieve the best return to the Crown. Lease and other income for the year ended June 2001 was $1,823,000.
Tranz Rail today is no longer a line-haul railway, carrying goods from station to station, but is New Zealand's leading multi-modal transport company, with integrated links between road, rail and sea networks. Its three core businesses are freight and distribution; rail passengers; and inter-island ferries. It also operates trucks, warehouses and services such as refrigeration, international freight forwarding and door-to-door distribution.
Investment in the rail infrastructure has had a major impact on Tranz Rail's ability to increase capacity, on service reliability and on efficiency of the network.
During the 1990s, the company expanded into new markets, including the movement of bulk milk to dairy processing plants and establishment of New Zealand's first inland port south of Auckland. The new port, a joint development with the Port of Tauranga, is connected by train with Tauranga, creating a significant new line of containerised freight business.
Freight transport. Tranz Rail's freight business is carried out under the brand name Tranz Link. In the 2000/01 financial year, 14.4 million tonnes of freight was carried, providing, like the previous year, more than 70 percent of Tranz Rail's revenue. The bulk of freight revenue is from agriculture and food products, followed by manufactured products, forestry products and coal.
Tranz Link is divided into two groups, rail freight and distribution.
Passenger services. Tranz Rail operates long-distance passenger services, as well as urban commuter services in Auckland and Wellington. Passenger services provide about 23 percent of Tranz Rail's revenue.
Tranz Rail earns nearly a quarter of its revenue from long-distance and urban commuter passenger services.
Tranz Scenic – The flagship of Tranz Rail's four long-distance rail services, the TranzAlpine between Christchurch and Greymouth is renowned as one of the great train journeys of the world, travelling through the spectacular scenery of the Southern Alps. Other services include the Coastal Pacific, between Picton and Christchurch; the Overlander (daytime) and the Northerner (night-time) services between Auckland and Wellington.
Tranz Metro – Tranz Metro operates urban commuter services in Auckland and Wellington, providing more than 10 million passenger trips a year. Wellington has traditionally been a strong rail commuter market, with services linking the central city to Johnsonville, Paraparaumu, the Hutt Valley, Palmerston North and Masterton. In Auckland, urban passenger services were boosted by the introduction of diesel multiple units in 1993. Tranz Rail is currently working with the Auckland Regional Council to increase line capacity to meet heavy public demand for its services. Services link central Auckland with Waitakere and Papakura.
Interisland Line – Interisland Line operates three conventional ferries on round-the-clock sailings across the Cook Strait between Wellington and Picton. Arahura and Aratere are multi-purpose, roll-on roll-off vessels carrying passengers, rail wagons and commercial vehicles. On-board facilities include movie theatres, restaurants, food courts, bars, shops, study rooms and children's play areas. Arahanga caters for rail freight and commercial vehicle markets. The Interisland Line also operates The Lynx, a fast ferry operating year-round between Wellington and Picton, carrying passengers and cars.
Technology. Tranz Rail has invested heavily in new technology to improve the efficiency of its services. The company is able to keep track of individual items of freight in its network and has an electronic link to customers for the transfer of waybills and invoices and the ordering of wagons.
In a world first, Tranz Rail's workshops have developed portable remote control units for use when shunting, which can be fitted to all locomotives, including mainline ones.
The workshops are also installing microprocessor control systems into locomotives to lift their performance by 10–15 percent.
Environment and safety. Part of a Ministry of Transport pricing study on the impact of the major transport modes on local air quality found pollutants discharged by trains to be generally low, particularly compared with road vehicles. It also found there was a much lower possibility that people would be exposed to rail emissions compared with other sources.
Trains offer an efficient, environmentally-friendly alternative to moving people and freight, particularly when compared with congested roads.
Tranz Rail runs the RailSafe programme in primary schools, and community education programmes in urban areas with high trespass levels. The company also supports safety in the community through sponsorship of helicopter rescue services based in Taupo, the Manawatu, the South Island West Coast and Otago; and marine rescue services based in Greymouth and Marlborough.
Tranz Rail supports safety in the community by sponsoring air ambulances based in Palmerston North, Taupo, the West Coast and Dunedin. The Tranz Rail Marine Safety Centre in Greymouth and the Tranz Rail Rescue Boat in Marlborough Sounds are also part of the safety programme. Table 23.5 provides a summary of New Zealand railway operations.
Table 23.5. New Zealand railways – summary of operations
| Category | Unit | As at 30 June | |||||
|---|---|---|---|---|---|---|---|
| 1996 | 1997 | 1998 | 1999 | 2000 | 2001 | ||
| Source: Tranz Rail | |||||||
| Route – | |||||||
| North Island | km | 2,423 | 2,416 | 2,416 | 2,416 | 2,416 | 2,410 |
| (electrified) | km | 506 | 506 | 506 | 506 | 506 | 506 |
| South Island | km | 1,492 | 1,492 | 1,488 | 1,488 | 1,488 | 1488 |
| (electrified) | km | 14 | 14 | 0 | 0 | 0 | 0 |
| Bridges | no. | 2,178 | 2,178 | 2,178 | 2,178 | 2,178 | 2,178 |
| km | 75 | 75 | 75 | 75 | 75 | 75 | |
| Tunnels | no. | 149 | 149 | 149 | 149 | 149 | 149 |
| km | 87.3 | 87.3 | 87.3 | 87.3 | 87.3 | 87.3 | |
| Locomotives – | |||||||
| diesel/diesel-electric | no. | 181 | 196 | 218 | 188 | 187 | 184 |
| electric | no. | 27 | 27 | 27 | 27 | 27 | 27 |
| Rolling stock – | |||||||
| freight | no. | 6,828 | 6,728 | 6,382 | 6,004 | 5,948 | 5,606 |
| passenger (incl. motorised) | no. | 256 | 301 | 328 | 321 | 321 | 314 |
| Passengers carried – | |||||||
| long distance | no. | 453,000 | 472,000 | 458,000 | 466,400 | 465,800 | 513,500 |
| suburban | no. | 10,600,000 | 11,100,000 | 11,293,000 | 11,422,000 | 12,118,00 | 12,577,000 |
| Total freight carried | tonnes | 10,305,000 | 11,525,000 | 11,706,000 | 12,900,000 | 14,699,000 | 14,461,000 |
Capital investment in New Zealand's roading and road transport system exceeds that on all other forms of transport. There are about 91,800 kilometres of formed roads and streets, and more than 3.1 million motor vehicles.
The most recent employment statistics available on the transport industry, Statistics New Zealand's business demographic statistics for February 2001, recorded 9,190 full-time equivalent persons engaged in the provision of road passenger transport, and 22,170 persons engaged in providing road freight transport.
Commercial road users are regulated through a system of quality controls which focus primarily on safety regulation, although there is an increasing emphasis on environmental performance as well.
Transfund New Zealand, established in 1996, is responsible for funding roads and public passenger transport. The state highway network is managed by Transit New Zealand, a Crown entity established in 1989. Local roads are the responsibility of territorial authorities.
The Land Transport Safety Authority, established in 1993, manages all road safety issues, including the licensing and registration of all drivers and vehicles.
Transfund New Zealand is a Crown entity established in 1996 under the Transit New Zealand Act 1989. Transfund is charged with allocating funds from the National Roads Account to achieve a safe and efficient roading system and efficient alternatives to roading.
The National Roads Fund is a dedicated fund comprising revenue from the fuel excise tax, road user charges and motor vehicle registration fees. A portion is used for road safety initiatives (managed by the police and the Land Transport Safety Authority) and the remainder goes into the National Roads Account, managed by Transfund.
Transfund funds a range of transport solutions based on funding applications received from Transit New Zealand, territorial authorities and regional councils. Specific roles of the organisation include:
To determine funding policy for the maintenance and construction of roads managed by road controlling authorities, for passenger transport services and for alternatives to roading contracted by regional councils.
To develop an annual national roading programme for the allocation of funding for the construction and maintenance of New Zealand's road network, the provision of publicly funded passenger transport infrastructure and services, and alternatives to roading.
To provide advice to road controlling authorities and regional councils on the requirements of the national roading programme and to the wider industry on transportation issues.
To approve competitive pricing procedures governing the procurement of professional services, physical works and passenger transport services.
To audit the performance of every territorial authority against its regional programme or district roading programme.
To audit the performance of Transit New Zealand against its state highways programme.
To provide the Minister of Transport with advice on key funding issues and other matters relating to reading and road-related services, and to carry out such other functions and duties in relation to reading as the Minister may from time to time prescribe.
Transit New Zealand, a Crown entity established on 1 October 1989, manages, maintains and develops New Zealand's state highway network.
Transit New Zealand reports to the Transit New Zealand Authority, an independent authority appointed by the government.
Transit New Zealand prepares an annual work programme for state highways each year and submits this to Transfund New Zealand for funding approval. This programme is competitively assessed against applications for funding submitted by New Zealand's 74 territorial authorities.
The roles of Transit New Zealand include:
Managing and maintaining the state highway network.
Developing, in consultation with territorial local authorities, standards and guidelines for state highway management practices that are safe and cost-effective. This includes road maintenance, standards for signage at roadworks and advisory signs.
Ensuring activities outlined in Transit's state highway programme are achieved.
Transit New Zealand is changing the focus of its business in two important ways. It is placing a greater emphasis on balancing the social, environmental and economic impacts of the state highway system and undertaking longer term planning for the development, funding and delivery of state highways.
While Transit New Zealand will continue to focus on managing the state highway network, it will look for innovative ways in which it can contribute to land transport as a whole, such as by establishing priority lanes for passenger transport on some state highways, development of walkways and cycleways, and transport solutions that are integrated with regional land transport strategies.
Seventy-four national and provincial road controlling authorities manage state highways and motorways in New Zealand.
As table 23.6 shows, there are 16,122km of urban roads, 10,775km of state highways and 65,311km of rural roads, making a total of 92,208km of developed roading, which includes more than 16,237 bridges.
The operation and management of the roading network is prescribed by the Transit New Zealand Act 1989. The act allows for freedom of use of land, while ensuring that the roading network provides for the safe and effective movement of people and goods. Roading taxation is described in Chapter 28.
Table 23.6. Formed roads and streets
| Nature of surface | Local authority roading | State highways motorways | Total | |
|---|---|---|---|---|
| Urban roads | Rural roads | |||
| Source: Transfund New Zealand | ||||
| At 30 June 1997 | kilometres | |||
| Paved or sealed | 15,128 | 30,845 | 10,365 | 56,338 |
| Metal or gravel | 445 | 35,063 | 121 | 35,629 |
| Total maintained roads | 15,573 | 65,908 | 10,486 | 91,967 |
| At 30 June 1998 | ||||
| Paved or sealed | 15,238 | 30,764 | 10,500 | 56,502 |
| Metal or gravel | 443 | 35,127 | 71 | 35,641 |
| Total maintained roads | 15,681 | 65,891 | 10,571 | 92,143 |
| At 30 June 1999 | ||||
| Paved or sealed | 15,520 | 30,968 | 10,540 | 57,028 |
| Metal or gravel | 442 | 34,540 | 65 | 35,047 |
| Total maintained roads | 15,962 | 65,508 | 10,605 | 92,075 |
| At 30 June 2000 | ||||
| Paved or sealed | 15,590 | 31,475 | 10,707 | 57,772 |
| Metal or gravel | 419 | 33,809 | 54 | 34,282 |
| Total maintained roads | 16,009 | 65,283 | 10,761 | 92,054 |
| At 30 June 2001 | ||||
| Paved or sealed | 15,708 | 31,762 | 10,716 | 58,186 |
| Metal or gravel | 414 | 33,549 | 59 | 34,002 |
| Total maintained roads | 16,122 | 65,311 | 10,775 | 92,188 |
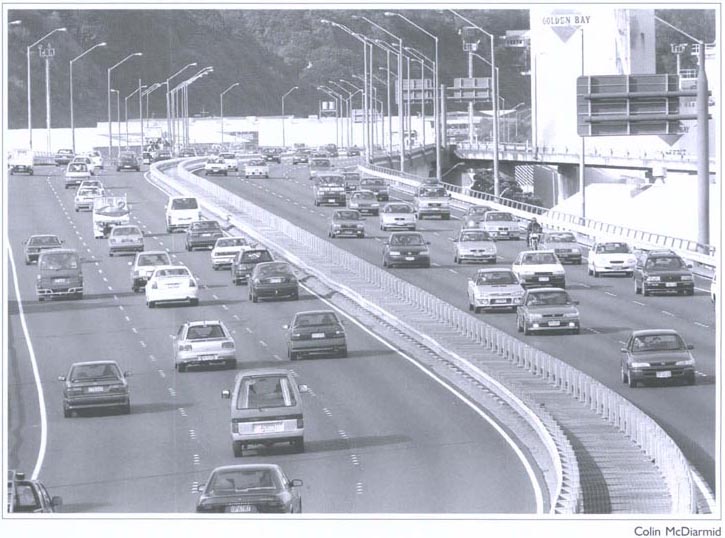
Management and maintenance of New Zealand's state highway network is the responsibility of Transit New Zealand.
Tables 23.7 and 23.8 show expenditure on state highways and public roading respectively.
Table 23.7. Expenditure on state highways
| Class of expenditure | 1995 | 1996 | 1997 | 1998 | 1999 | 2000 |
|---|---|---|---|---|---|---|
1Excludes motorway structures. 2Maintenance figures include the cost of fload damage repairs when applicable. Source: Transfund New Zealand | ||||||
| $(000) | ||||||
| Construction and improvement | 114,933 | 136,170 | 166,606 | 194,120 | 240,181 | 303,736 |
| Bridges and other structures1 | 1,572 | 910 | 6,624 | 39,403 | 17,539 | 13,926 |
| Maintenance, repairs, etc2 | 221,199 | 226,051 | 244,861 | 236,255 | 257,964 | 275,471 |
| Total | 337,704 | 363,131 | 418,091 | 469,778 | 515,684 | 593,133 |
Table 23.8. Public roading expenditure
| Item | 1995 | 1996 | 1997 | 1998 | 1999 | 2000 | 2001 |
|---|---|---|---|---|---|---|---|
1Expenditure is based on Transfund contribution and does not include local authority contribution. The rate of assistance to local authority for construction work varies from 43 to 83 percent. Source: Transfund New Zealand | |||||||
| $(000) | |||||||
| State highways expenditure | 337,704 | 363,131 | 418,091 | 469,778 | 515,684 | 593,133 | 547,346 |
| Special purpose roads | 2,585 | 4,240 | .. | .. | .. | ||
| Local authority roading expenditure1 | 260,902 | 256,726 | 269,853 | 287,570 | 297,886 | 290,926 | 296,458 |
| Total | 601,191 | 624,097 | 687,944 | 757,348 | 813,570 | 884,059 | 843,804 |
The Transport Services Licensing Act 1989 replaced sections in the Transport Act 1962 relating to transport licensing as the main legislation governing road transport licensing. The act provides for a system of road transport licensing which operates on a qualitative basis for goods, passenger, rental and vehicle recovery services.
Anyone who enters the industry needs to meet certain minimum standards of quality.
As of 1 November 1989, the concept of ‘a fit and proper person’ was adopted as the principal criterion for road transport operators.
In 1992, the Transport Services Licensing Act was amended to include railway operator licensing requirements. From 1 April 1993, all railway operators were required to develop a safety system to cover standards, practices and procedures.
All vehicles using public roads in New Zealand are required to be registered. An annual relicensing charge is payable, which includes a licence fee, accident compensation levy, goods and services tax (GST) and, in some cases, a certificate of fitness or transport licence fee.
The country's more than 3.1 million vehicles are relicensed progressively throughout the year.
Annual relicensing charges are: Ordinary motorcars $202.85, motorcycles (60cc or less) $177.45, motorcycles (61cc and over) $188.70, rental cars $228.30, taxis $228.30, trucks, vans and utilities (private passenger) from $202.85 to $204.35, when subject to transport licence fee, from $226.85 to $228.30, and tractors (non-exempt) $85.70. All figures include GST.
Motor vehicles exempted from the annual licence fee include a variety of machines such as pedestrian-controlled goods service vehicles, motor vehicles propelled and supported by self-laying tracks, vehicles used in a declared road construction zone and vehicles used on a road that is not a public highway.
Table 23.9 shows the number of registrations of new commercial vehicles in New Zealand, while table 23.10 lists the registrations of new cars and station wagons. Not included in these tables are new tractors, which are shown in Figure 23.3. The number of ex-overseas cars as a percentage of total registrations of new cars is shown in Figure 23.4.
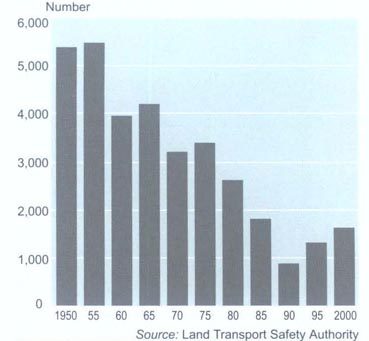
Table 23.9. Registrations of new commercial vehicles
| December year | New commercial vehicles by gross weight in kilograms | ||||||
|---|---|---|---|---|---|---|---|
| 2,500 or less | 2,501 to 4,500 | 4,501 to 9,001 | 9,001 to 14,501 | 14,501 and over | Omnibus and service coaches | Total commercial vehicles | |
| Source: Statistics New Zealand | |||||||
| 1993 | 12,969 | 10,337 | 1,930 | 484 | 1,150 | 532 | 27,402 |
| 1994 | 13,668 | 11,860 | 2,257 | 707 | 1,454 | 588 | 30,534 |
| 1995 | 12,526 | 11,690 | 2,213 | 741 | 1,714 | 714 | 29,598 |
| 1996 | 10,859 | 12,702 | 2,654 | 882 | 1,747 | 1,000 | 29,844 |
| 1997 | 9,005 | 9,718 | 2,549 | 866 | 1,566 | 816 | 24,520 |
| 1998 | 6,301 | 9,456 | 2,038 | 781 | 1,184 | 780 | 20,540 |
| 1999 | 5,737 | 11,290 | 2,036 | 865 | 1,566 | 834 | 22,328 |
| 2000 | 4,859 | 13,375 | 1,738 | 674 | 1,881 | 764 | 23,291 |
Table 23.1. Registrations of new cars and station wagons
| cc rating | |||||||||
|---|---|---|---|---|---|---|---|---|---|
| 850 and under | 851 to 1300 | 1301 to 1600 | 1601 to 2000 | 2001 to 5000 | 5001 and over | Total | Cars previously registered overseas1 | New motor cycles | |
1Included in total. Source: Land Transport Safety Authority | |||||||||
| December year | |||||||||
| 1991 | 806 | 10,523 | 35,361 | 41,601 | 14,497 | 178 | 102,966 | 47,351 | 4,042 |
| 1992 | 592 | 7,209 | 30,241 | 36,679 | 17,174 | 205 | 92,100 | 39,146 | 2,469 |
| 1993 | 453 | 6,674 | 30,943 | 38,701 | 20,734 | 158 | 97,663 | 43,841 | 2,601 |
| 1994 | 494 | 6,676 | 38,936 | 47,744 | 29,691 | 312 | 123,853 | 62,088 | 3,337 |
| 1995 | 579 | 5,246 | 46,952 | 56,035 | 37,375 | 469 | 146,656 | 80,976 | 3,451 |
| 1996 | 586 | 3,799 | 56,066 | 67,402 | 47,829 | 496 | 176,178 | 111,764 | 3,812 |
| 1997 | 694 | 2,680 | 45,275 | 58,379 | 48,256 | 315 | 155,599 | 97,041 | 4,078 |
| 1998 | 608 | 2,685 | 41,669 | 59,868 | 48,932 | 332 | 154,094 | 99,937 | 4,067 |
| 1999 | 118 | 3,949 | 48,418 | 76,899 | 59,208 | 721 | 189,313 | 131,118 | 3,849 |
| 2000 | 120 | 4,120 | 41,114 | 69,834 | 57,146 | 1,408 | 173,742 | 116,124 | 3,598 |
Figure 23.4. Registration of
ex-overseas1 cars
1940–2000
Percentage of
total registrations of new cars
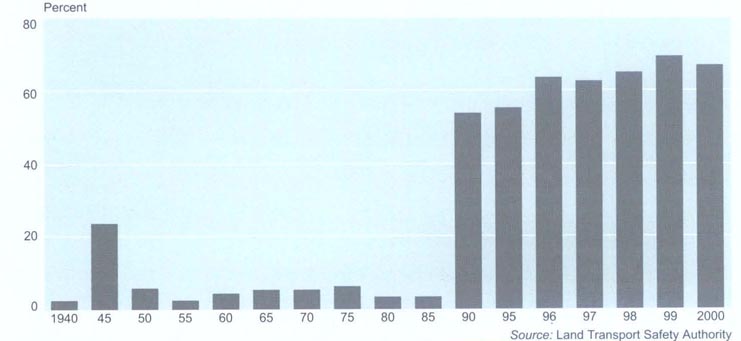
Table 23.11 shows the number of licensed motor vehicles by vehicle type for the years 1998 to 2000 and table 23.12 shows how many people there are per licensed car or other motor vehicle in New Zealand. As a comparison, table 23.13 shows the number of persons per car in various other OECD countries.
Table 23.11. Licensed motor vehicles
| Type of vehicle | at 30 June | ||
|---|---|---|---|
| 1998 | 1999 | 2000 | |
| Source: Land Transport Safety Authority | |||
| Cars | 1,762,813 | 1,868,297 | 1,886,982 |
| Rental cars | 13,154 | 15,117 | 18,022 |
| Taxis | 6,572 | 7,280 | 7,588 |
| Trucks | 359,411 | 371,365 | 368,624 |
| Buses and coaches | 10,950 | 11,748 | 12,397 |
| Trailers | 308,751 | 339,325 | 354,487 |
| Motorcycles | 38,151 | 40,664 | 37,794 |
| Mopeds | 8,034 | 7,495 | 7,253 |
| Tractors | 19,492 | 19,669 | 20,369 |
| Exempt vehicles | 6,348 | 6,628 | 7,369 |
| Miscellaneous | 14,119 | 15,090 | 15,096 |
| Total all vehicles | 2,547,795 | 2,702,678 | 2,735,981 |
Table 23.12. Licensed vehicles by population
| As at 31 March | Number of persons in population per licensed car | Number of persons in population per licensed motor vehicle1 |
|---|---|---|
1Excluding trailers and caravans. 21999 and 2000 figures are as at 30 June. Source: Land Transport Safety Authority; Statistics New Zealand | ||
| 1992 | 2.21 | 1.72 |
| 1993 | 2.21 | 1.72 |
| 1994 | 2.18 | 1.69 |
| 1995 | 2.15 | 1.66 |
| 1996 | 2.20 | 1.64 |
| 1997 | 2.22 | 1.75 |
| 1998 | 2.14 | 1.70 |
| 19992 | 2.04 | 1.61 |
| 20002 | 2.03 | 1.61 |
A motor vehicle securities register is administered by the Ministry of Economic Development's commercial affairs division under the Motor Vehicle Securities Act 1989.
The register was established to help buyers avoid the situation of their vehicles being repossessed because money is still owed on them. It also provides protection for the party having an interest over the vehicle.
The Autocheck service opened to the public on 1 April 1990. As at 1 October 2001, there were 672,636 security interests registered over vehicles.
Autocheck means a consumer considering buying a vehicle can phone the register toll free to check if any security interest is registered against the vehicle. The register includes vehicles such as private and commercial motor vehicles, motorcycles, trucks, trailers, caravans and farm vehicles. It does not cover boats, trains or aircraft. The Autocheck service is not connected with change of ownership or registration of vehicles, which is handled by New Zealand Post.
Table 23.14 shows how people who had a job travelled to work on 6 March 2001, the day of the 2001 Census of Population and Dwellings. The table excludes the 195,318 people who did not go to work that day for whatever reason.
By far the most popular way of getting to work was by car, truck or van – either driving or as a passenger. These categories made up 73 percent of those who travelled to work on census day, up from 71.8 percent on census day, 1996. The gender split was fairly even, with 74.1 percent of males and 71.7 percent of females using this means of transport. On census day 2001, 996,126 people drove cars, trucks or vans to work, compared with 929,355 in 1996.
Use of public transport for travelling to work continued to be low in spite of a slight increase between censuses. In 2001, 5.9 percent of women and 3.5 percent of men used either a public bus or train to get to work, compared with 5.6 and 3.2 respectively in 1996. The Wellington region stood out as having a high proportion (13.3 percent) of people using public transport. Next highest was the Auckland region (5.6 percent). Of all people who used either public buses or trains to travel to work, 28.9 percent and 78.6 percent respectively came from the Wellington region.
There is no evidence that more people are using their journey to work to exercise. In 2001, 9.1 percent of the working population rode a bike, walked or jogged to work, compared with 10.1 percent in 1996. As the weather was fine throughout New Zealand on census day 2001, bad weather was not a reason for the drop in people riding, walking or jogging to work.
There was little change (11.3 percent in 2001 and 11.2 percent in 1996) in the number of those who did not travel to work because they worked at home. More women (12.6 percent) worked at home than men (10.3 percent).
More males (71.3 percent) than females (57.4 percent) were employers or self-employed. Women who worked at home were more likely to be either employees or unpaid family workers than males (42.6 percent and 28.7 percent for females and males respectively). People who were classified as agriculture and fishery workers and who worked at home made up the largest percentage in terms of occupation. However, this decreased from 47.2 percent in 1996, to 37.6 percent in 2001.
Travel to work patterns also varied by occupation. Around 80 percent of trades workers and 74 percent of plant and machine operators and assemblers drove or were a passenger in a private or company car, truck or van when they travelled to work. At the other end of the scale, labourers and unskilled workers and service and sales workers had higher proportions who rode a bicycle or walked or jogged to work (12.9 and 11.3 percent respectively).
Table 23.14. Travel to work 1991,1996 and 2001 censuses
| Means of transport | 1991 Male | 1991 Female | 1996 Male | 1996 Female | 2001 Male | 2001 Female | ||||||
|---|---|---|---|---|---|---|---|---|---|---|---|---|
| number | percent | number | percent | number | percent | number | percent | number | percent | number | percent | |
| Source: Statistics New Zealand | ||||||||||||
| Worked at home | 56,061 | 7.7 | 49,833 | 9.7 | 80,370 | 10 | 77,730 | 12.6 | 83,394 | 10.3 | 83,079 | 12.6 |
| Public bus | 18,168 | 2.5 | 29,199 | 5.7 | 19,110 | 2.4 | 28,527 | 4.6 | 20,979 | 2.6 | 31,077 | 4.7 |
| Train | 5,718 | 0.8 | 5,073 | 1.0 | 6,321 | 0.8 | 6,072 | 1.0 | 7,680 | 0.9 | 7,410 | 1.1 |
| Drove a private car, truck or van | 330,432 | 45.7 | 293,817 | 57.1 | 390,060 | 48.8 | 368,508 | 59.8 | 422,856 | 52.1 | 408,663 | 62.2 |
| Drove a company car, truck or van | 140,970 | 19.5 | 18,684 | 3.6 | 148,974 | 18.6 | 21,813 | 3.5 | 141,723 | 17.5 | 22,884 | 3.5 |
| Passenger in a car, truck or company bus | 42,273 | 5.8 | 49,632 | 9.6 | 42,063 | 5.3 | 46,374 | 7.5 | 36,834 | 4.5 | 39,684 | 6.0 |
| Motor cycle or power cycle | 25,764 | 3.6 | 4,185 | 0.8 | 18,174 | 2.3 | 2,943 | 0.5 | 14,880 | 1.8 | 2,379 | 0.4 |
| Bicycle | 43,716 | 6.0 | 17,298 | 3.4 | 38,622 | 4.8 | 12,189 | 2 | 31,320 | 3.9 | 9,273 | 1.4 |
| Walked or jogged | 50,961 | 7.0 | 43,725 | 8.5 | 46,053 | 5.8 | 46,419 | 7.5 | 44,085 | 5.4 | 48,318 | 7.4 |
| Other | 9,351 | 1.3 | 3,429 | 0.7 | 10,350 | 1.3 | 5,904 | 1.0 | 8,154 | 1.0 | 4,434 | 0.7 |
| Total (without ‘not specified') | 723,414 | 100 | 514,875 | 100 | 800,097 | 100 | 616,479 | 100 | 811,905 | 100 | 657,201 | 100 |
| Not specified | 12,357 | 9,942 | 27,339 | 26,469 | 20,232 | 17,553 | ||||||
| Total | 735,771 | 524,817 | 827,436 | 642,948 | 832,137 | 674,754 | ||||||
Road safety has been under the control of the Land Transport Safety Authority (LTSA) since 1993. The LTSA is the government's chief adviser on land transport safety and suggests policy, develops standards and reviews land transport safety systems in full consultation with industry groups.
Road laws are enforced by the New Zealand Police following their merger with the traffic safety service of the Ministry of Transport in 1992. In addition, they investigate serious and fatal accidents; enforce laws regarding heavy traffic and allowable weights of vehicles and loads; and assist with the licensing of road transport services such as taxis, buses and tow-trucks.
The road toll for the 2000 calendar year was the lowest for 36 years with police maintaining an emphasis on speed, alcohol and restraint usage.
Driver licensing. A New Zealand driver's licence is valid for up to 10 years. At age 75, the holder is required to undergo a medical check. At age 80, and every two years thereafter, the holder is required to undergo a medical check and to pass an older-driver practical test.
A graduated system for obtaining a driver's licence involves a number of restrictions on learner drivers to ensure they are protected from high-risk situations until they have obtained experience on the road. Incentives to attend driver education courses are available to all first applicants for licences. The system has three stages: Learner, restricted and full licence. A full licence test must be passed in order to graduate to a full licence.
Inspection of motor vehicles. All vehicles using New Zealand roads must be inspected regularly to ensure mechanical and structural fitness. They are inspected every six months, except for vehicles first registered since 1 August 1987 and less than six years old, which may be inspected every 12 months. Most lightweight vehicles require a Warrant of Fitness, which can be issued at approved garages, at testing stations operated by local authorities, or by Vehicle Testing New Zealand. All heavy vehicles, with minor exceptions, undergo a more exacting examination for a Certificate of Fitness, which, in respect of passenger service buses, has special regard for the safety and comfort of passengers. Taxicabs and rental vehicles also require a Certificate of Fitness, which can be issued by approved testing agencies only.
Table 23.15 shows the age of major vehicle types in New Zealand as at 31 December 2000.
Table 23.15. Age profile of major vehicle types
| Age in whole Years | At 31 December 2000 | ||||||
|---|---|---|---|---|---|---|---|
| Cars | Trucks | Buses | Motor caravans | Motorcycles | Mopeds | Trailers | |
1All vehicles recorded in the Motor Vehicle Register, excluding vehicles with cancelled/lapsed registration. 2Mean age: the sum of the products of vehicles multiplied by age, divided by the total vehicles. Source: Land Transport Safety Authority | |||||||
| Years | |||||||
| Under 1 year | 56,880 | 15,875 | 355 | 207 | 2,632 | 469 | 17,113 |
| 1 | 58,123 | 13,314 | 485 | 491 | 2,822 | 402 | 17,396 |
| 2 | 55,749 | 11,426 | 352 | 242 | 2,866 | 286 | 16,823 |
| 3 | 64,600 | 13,239 | 462 | 151 | 2,549 | 159 | 16,090 |
| 4 | 81,225 | 15,304 | 597 | 256 | 1,959 | 210 | 15,224 |
| 5 | 85,786 | 12,988 | 474 | 314 | 1,401 | 156 | 14,329 |
| 6 | 122,229 | 17,439 | 483 | 473 | 1,417 | 108 | 13,158 |
| 7 | 131,040 | 16,769 | 436 | 199 | 1,252 | 109 | 11,688 |
| 8 | 152,362 | 18,571 | 499 | 225 | 1,466 | 221 | 11,249 |
| 9 | 157,247 | 21,532 | 690 | 229 | 2,118 | 367 | 10,761 |
| 10 | 170,749 | 30,164 | 736 | 507 | 2,663 | 549 | 15,484 |
| 11 | 167,467 | 28,907 | 794 | 483 | 3,306 | 777 | 14,215 |
| 12 | 132,951 | 26,141 | 737 | 517 | 4,197 | 869 | 13,215 |
| 13 | 116,100 | 23,940 | 798 | 522 | 4,503 | 987 | 12,180 |
| 14 | 106,141 | 22,621 | 852 | 643 | 4,350 | 1,026 | 12,302 |
| 15 | 104,292 | 23,008 | 722 | 1,023 | 2,991 | 746 | 14,520 |
| 16 | 100,888 | 21,260 | 561 | 500 | 2,511 | 513 | 12,131 |
| 17 | 64,964 | 15,188 | 425 | 465 | 2,381 | 367 | 9,974 |
| 18 | 52,302 | 14,329 | 328 | 316 | 2,312 | 577 | 10,313 |
| 19 | 40,720 | 10,907 | 289 | 249 | 2,254 | 505 | 9,866 |
| 20 | 27,654 | 8,322 | 255 | 253 | 2,053 | 506 | 14,655 |
| 21 | 18,858 | 6,143 | 297 | 210 | 1,541 | 334 | 11,824 |
| 22 | 14,759 | 4,868 | 325 | 191 | 885 | 109 | 13,830 |
| 23 | 10,443 | 4,358 | 266 | 210 | 732 | 102 | 14,279 |
| 24 | 10,214 | 3,876 | 250 | 228 | 769 | 115 | 16,456 |
| 25 | 10,553 | 3,153 | 182 | 245 | 919 | 149 | 15,770 |
| 26 to 30 | 51,049 | 11,273 | 519 | 1,104 | 3,416 | 452 | 46,954 |
| 31 to 35 | 22,244 | 4 576 | 311 | 693 | 1,008 | 132 | 23,523 |
| 36 to 40 | 12,485 | 2,481 | 143 | 537 | 642 | 76 | 12,890 |
| 41 to 50 | 11,083 | 2,724 | 81 | 766 | 1,920 | 78 | 7,611 |
| 51 years plus | 10,501 | 2,327 | 12 | 134 | 1,283 | 25 | 1,541 |
| Total vehicles1 | 2,221,658 | 427,023 | 13,716 | 12,583 | 67,118 | 11,481 | 447,364 |
| Mean age (in years)2 | 11.42 | 12.25 | 13.03 | 18.44 | 14.83 | 13.94 | 16.28 |
Laws governing heavy vehicle weights and loads are enforced by the New Zealand Police.
Safety belts. Wearing safety belts is compulsory in New Zealand for drivers and front-seat passengers in most classes of light vehicles registered after January 1955. It is compulsory for rear-seat passengers to wear safety belts in all cars. All children under five must be properly restrained by an approved child restraint when travelling in cars and vans. Drivers must make sure that children between five and seven are safely restrained if there is a child restraint or safety belt in the vehicle. If no restraint is available, children must be seated in the rear of the car. Drivers are also responsible for making sure children between 8 and 14 use safety belts when available. All motor cyclists and pillion riders must wear safety helmets at all speeds. Bicycle helmets have been compulsory since 1 January 1994.
Alcohol impairment. Police have several tests available to deal with drivers affected by alcohol. Any driver may be required to give a passive test at any time. A breath-screening test may be administered after a police officer has detected alcohol on a driver's breath using a passive alcohol detector. If this screening test is positive, the person may be required to give an evidential breath test. If this is also positive, the person has the option of either accepting the breath test reading or providing a blood sample for analysis. A driver commits an offence and is liable for prosecution if either:
Breath-alcohol concentration as recorded on an evidential breath-testing device exceeds 400 micrograms of alcohol per litre of breath, or 150 micrograms of alcohol per litre of breath in the case of a person under the age of 20.
Blood-alcohol concentration exceeds 80 milligrams of alcohol per 100 millilitres of blood, or 30 milligrams of alcohol per 100 millilitres of blood in the case of a person under the age of 20.
Speed limits. New Zealand's reading network is essentially a two-way system with one lane each way. Management of speed is, therefore, a critical aspect of traffic safety. Maximum speed limits for highways and motorways are 100km/h for cars, motorcycles, vans and light vehicles; 90km/h for buses, heavy motor and articulated vehicles; and 80km/h for school buses and any vehicles towing trailers. A general speed limit of 50km/h is fixed in all closely populated areas. In recent years, road-controlling authorities have been given more flexibility in setting speed limits and this has seen the introduction of more 60km/h zones on arterial roads. The Minister of Transport may also specify areas with a speed limit of 70km/h, and limited speed zones may be established, for which the maximum permitted speed may be either 100km/h or 50km/h depending on conditions and circumstances.
Speed cameras. Police introduced a speed camera programme in 1993, using mobile cameras in police vehicles and pole-mounted fixed cameras at a range of sites in city streets (see Chapter 10).
Laser speed management. Police introduced LIDAR speed measuring equipment to supplement other enforcement tools in 1996. LIDAR uses a laser beam to measure the speed of vehicles. It is particularly useful in heavy traffic and multi-lane situations, where its ability to isolate and measure individual vehicles permits targeting of speeding vehicles in the traffic stream.
Insurance. See Chapter 8 (accidents) and Chapter 24 (insurance).
Road safety education. Details on road safety campaigns are given in Chapter 8.
Traffic offences. Penalties are imposed by courts for driving and other offences under the Transport Act 1962, the Land Transport Act 1998 and attendant regulations. Breaches of certain laws are dealt with under an infringement system whereby a driver may pay an infringement fee within a specified time to avoid court proceedings. There is also a system whereby demerit points are automatically registered, according to a fixed scale, against people convicted of driving offences, or people who pay certain infringement fees. The director of the Land Transport Safety Authority may suspend a driver's licence for three months where 100 or more demerit points are received within two years. Some demerit points are awarded on a graduated scale, based on the speed a driver is detected travelling at above the limit. Table 23.16 shows the number of traffic offences and infringements in New Zealand for the years to June 2000 and 2001. Figure 23.5 shows the rate of traffic convictions per 10,000 population.
Table 23.16. Traffic offences and infringements
| Type of offence or infringement | Year ended 30 June | ||
|---|---|---|---|
| 1999/2000 | 2000/01 | Percent variation | |
Note: The above entries include both offences and infringements unless the wording specifies otherwise. 1Includes traffic offences reported to the police but no prosecution initiated. Source: New Zealand Police | |||
| Drink/drive offences | 28,646 | 26,139 | -9 |
| Dangerous/reckless driving offences | 4,311 | 4,346 | 1 |
| Unsafe use of vehicle infringements | 16,625 | 17,758 | |
| Careless/inconsiderate driving or overtaking offences | 20,267 | 11,823 | -42 |
| Speeding (under 100 kph) | 67,756 | 91,404 | 35 |
| Speeding (over 100 kph) | 52,998 | 81,375 | 54 |
| Speeding – trailer, towing, heavy motor vehicle | 2,804 | 5,524 | 97 |
| Speeding – speed camera | 440,195 | 523,362 | 19 |
| Failure to stop/give way | 23,723 | 28,515 | 20 |
| Failure to obey officer/fulfil duties | 20,959 | 17,681 | -16 |
| Vehicle licence | 17,004 | 17,469 | 3 |
| Driving while disqualified offences | 9,432 | 8,626 | -9 |
| Certificate of fitness | 83,271 | 87,168 | 5 |
| Driver licence and vehicle registration | 161,994 | 187,073 | 15 |
| Driver hours/log book | 3,429 | 3,685 | 7 |
| Seat-belt | 26,711 | 33,077 | 24 |
| Safety helmet | 455 | 420 | -8 |
| Passenger/recovery/rental service vehicle | 1,546 | 1,851 | 20 |
| Vehicle condition | 6,078 | 9,438 | 55 |
| Vehicle noise/loading | 4,207 | 4,590 | 9 |
| Bicycle | 2,050 | 1,935 | -6 |
| Cycle helmet | 5,207 | 5,298 | 2 |
| Pedestrian and other | 426 | 324 | -24 |
| Stock and vehicle bylaws offences | 150 | 180 | 20 |
| Local body bylaw infringements | 304 | 961 | 216 |
| Other transport offences | 74 | 8,3861 | 11,232 |
| Total | 1,000,622 | 1,178,408 | 18 |
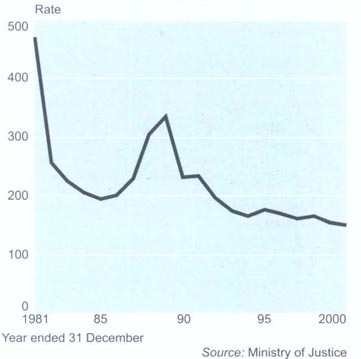
23.1 Ministry of Transport; Maritime Safety Authority; Statistics New Zealand.
23.2 Statistics New Zealand; Civil Aviation Authority; Airways Corporation of New Zealand; Ministry of Transport.
23.3 Tranz Rail Limited; New Zealand Railways Corporation.
23.4 Statistics New Zealand; Ministry of Transport; Transfund New Zealand; Transit New Zealand; Land Transport Safety Authority; Motor Vehicles Securities Register; New Zealand Police.
Statistics New Zealand divisional manager responsible: Mike Moore.
Annual Enterprise Survey (annual). Statistics New Zealand, Wellington.
Annual Report (annual). Transit New Zealand, Wellington.
Key Statistics (monthly). Statistics New Zealand, Wellington.
Report of the Ministry of Transport (Parl paper F.5).
Annual Report (annual). Maritime Safety Authority, Wellington.
Maritime Accidents (annual). Maritime Safety Authority, Wellington.
Annual Report (annual). Air New Zealand Ltd, Auckland.
Annual Report (annual). Airways Corporation of New Zealand, Wellington.
Annual Report annual). Civil Aviation Authority, Wellington.
New Zealand Register of Aircraft (database). On-line, Civil Aviation Authority of New Zealand. Wellington.
Annual Report (annual). Tranz Rail Holdings Ltd, Wellington.
Miles R (1998). The Privatisation Experience: New Zealand Railways 1992–2000. Central Highfield Press, Timaru.
Annual Report of the Road Safety Trust (Parl paper F.15).
Report of the New Zealand Police (Parl paper G.6).
www.airnewzealand.co.nz – Air New Zealand Ltd
www.airways.co.nz – Airways Corporation of New Zealand
www.autocheckextra.co.nz – Autocheck
www.caa.govt.nz – Civil Aviation Authority of New Zealand
www.ltsa.govt.nz – Land Transport Safety Authority
www.msa.govt.nz – Maritime Safety Authority of New Zealand
www.med.govt.nz – Ministry of Economic Development
www.transport.govt.nz – Ministry of Transport
www.customs.govt.nz – New Zealand Customs Service
www.police.govt.nz – New Zealand Police
www.stats.govt.nz – Statistics New Zealand
www.transfund.govt.nz – Transfund New Zealand
www.transit.govt.nz – Transit New Zealand
www.trtaic.org.nz – Transport Accident Investigation Commission
www.tranzrail.co.nz – Tranz Rail Ltd
Table of Contents
Garden centres want the law changed to allow Easter Sunday trading.
Rather than relying on traditional marketing alliances and arrangements, New Zealand's export industries in recent years have had to compete in the international marketplace. The emphasis has also been on competitiveness within the New Zealand economy, with the government encouraging structural change through deregulation.
The process of change has been rapid since 1984 as governments have followed a programme of industry assistance reform (notably a significant across-the-board tariff reduction programme); a continued move away from import licensing (which disappeared completely on 1 July 1992, 54 years after it first came into force); the removal of restrictions on the operation of financial markets; and reorganisation of state trading enterprises on a more competitive basis. Among specific sectors deregulated to allow greater competition have been the telecommunications, transport and petroleum industries.
Withdrawal of subsidies and import controls exposed large areas of the domestic economy to new levels of competition. The result has been reorganisation and, in some cases, attrition, especially in manufacturing. These policy changes have made it necessary to review the legal environment in which business is conducted. Like virtually every developed market economy, New Zealand has laws aimed at protecting the competitive process. The Commerce Act 1986, the Fair Trading Act 1986 and the Electricity Industry Reform Act 1997 are New Zealand's main competition laws. In general terms, they rest on the premise that open and competitive markets will ensure the efficient allocation of economic resources.
The Commerce Act prohibits anti-competitive, collusive and unilateral behaviour, and mergers that substantially lessen competition in a market. The act also constitutes the Commerce Commission as a public enforcement agency and provides scope for private remedies. The Commerce Act was reviewed in 1992 to ensure its provisions were consistent with other government policies promoting economic growth. Several amendments have been made to the act since then, including the latest in May 2001 which prohibits business acquisitions that substantially lessen competition in any market. Previously the act prohibited business acquisitions that resulted in dominance being acquired or strengthened in any market.
The Fair Trading Act protects consumers and competitors from the consequences of inaccurate information. False or misleading information leads to consumers being cheated and competitors gaining an unfair advantage. Under the act, a customer, competitor or the Commerce Commission can take action if the act has been breached and, for example, erroneous material has been distributed about a product or a service.
As the economy has become more market-oriented, traditional controls in the retail sector have also been reviewed. Laws controlling shop trading hours and the sale of liquor have been reviewed, and relaxed in some areas, to encourage competition and provide structures for businesses to compete with imported products and meet consumer demand. A Ministry of Consumer Affairs was established in 1986 and administers the Consumer Guarantees Act 1993.
Summary information on distribution is provided by Statistics New Zealand's Annual Enterprise Survey (see table 24.1).
Table 24.1. Distribution: statistical summary
| Financial item | Wholesale trade 19911 | Retail trade 19911 | Wholesale trade 20001 | Retail trade 20001 |
|---|---|---|---|---|
1These figures are provisional. Source: Statistics New Zealand | ||||
| Financial performance $(million) | ||||
| Total income | 53,840 | 33,693 | 59,236 | 35,930 |
| Sales of goods not further processed | 45,023 | 28,825 | 50,988 | 31,737 |
| Sales of other goods and services | 8,230 | 4,678 | 7,732 | 3,966 |
| Interest, dividends and donations | 342 | 130 | 314 | 99 |
| Government funding, grants and subsidies | 6 | 4 | 1 | 20 |
| Non-operating income | 240 | 57 | 200 | 108 |
| Total expenditure | 53,421 | 32,893 | 59,601 | 35,024 |
| Interest and donations | 582 | 297 | 521 | 267 |
| Indirect taxes | 1,257 | 118 | 1,236 | 137 |
| Depreciation | 551 | 466 | 787 | 514 |
| Salaries and wages paid to employees | 3,288 | 3,226 | 3,299 | 3,417 |
| Redundancy and severance | 58 | 4 | 20 | 3 |
| Salaries and wages to working proprietors | 443 | 708 | 513 | 662 |
| Purchases of goods bought for resale | 35,326 | 22,211 | 41,324 | 24,031 |
| Other purchases and operating expenses | 11,584 | 5,728 | 11,221 | 5,757 |
| Non-operating expenses | 389 | 139 | 701 | 240 |
| Opening stocks | 7,498 | 3,253 | 6,939 | 3,496 |
| Closing stocks | 7,181 | 3,424 | 7,917 | 3,861 |
| Operating surplus before income tax | 863 | 1,508 | 147 | 1,568 |
| Financial position $(million) | ||||
| Total assets | 25,196 | 10,757 | 28,931 | 11,007 |
| Current assets | 18,388 | 6,009 | 21,426 | 6,278 |
| Fixed tangible assets | 3,539 | 3,205 | 3,629 | 3,203 |
| Additions to fixed assets | 669 | 567 | 1,031 | 568 |
| Disposals of fixed assets | 552 | 140 | 263 | 161 |
| Other assets | 3,269 | 1,543 | 3,876 | 1,527 |
| Total equity and liabilities | 25,196 | 10,757 | 28,931 | 11,007 |
| Shareholders funds or owners equity | 8,713 | 3,413 | 9,363 | 3,060 |
| Current liabilities | 12,572 | 4,763 | 15,440 | 5,036 |
| Other liabilities | 3,911 | 2,581 | 4,128 | 2,911 |
| Financial ratios | ||||
| Total income per full-time equivalent (FTE) | $557,400 | $200,200 | $587,300 | $208,800 |
| Operating surplus per full-time equivalent (FTE) | $8,900 | $9,000 | $1,500 | $9,100 |
| Current ratio | 146.3% | 126.2% | 138.8% | 124.7% |
| Quick ratio | 89.1% | 54.3% | 87.5% | 48.0% |
| Margin on sales of goods for resale | 21.5% | 22.9% | 19.0% | 24.3% |
| Return on equity | 9.9% | 44.2% | 1.6% | 51.2% |
| Return on total assets | 3.4% | 14.0% | 0.5% | 14.2% |
| Liabilities structure | 34.6% | 31.7% | 32.4% | 27.8% |
Fair Trading Act 1986. The Fair Trading Act 1986 consolidates laws on misleading advertising, prohibits deceptive or misleading conduct and false representations about the provision of goods and services, prohibits certain unfair trading practices, and provides for consumer information and product safety standards. Any person, including those not directly affected, can take action if he or she believes the act has been contravened. Those breaching criminal provisions of the act can be fined up to $100,000. Damages can also be awarded against businesses. Enforcement of the act's general provisions is undertaken by the Commerce Commission.
Consumer Guarantees Act 1993. The Consumer Guarantees Act 1993, administered by the Ministry of Consumer Affairs, creates statutory guarantees given automatically when a trader supplies goods or services to a consumer. A consumer is anyone who acquires goods or services which are ordinarily for personal, domestic or household use or consumption. This includes all items bought for everyday use by a person or their family. All foodstuffs, clothing, jewellery, furniture, appliances, cars, personal computers and phones are covered by the act.
Any trader supplying goods automatically guarantees that:
The consumer has the right to ownership of the goods unless they are bought on hire purchase, or the consumer knows the trader is holding ownership until the goods are paid for.
The goods are of acceptable quality, which means fit for their common purpose, of acceptable appearance, free from minor faults, safe and durable. How goods measure up depends on the type of goods, the price, how they are represented or described and any other relevant factors.
The goods are fit for any particular purpose the consumer has informed the trader of, except when the consumer doesn't, or it is unreasonable to, rely on the trader's judgement.
The goods correspond with any description, sample or demonstration model given or shown to the consumer.
The consumer will pay no more than a reasonable price, unless a price has been agreed.
Manufacturers and importers automatically guarantee they will be bound by any express guarantees they give over goods. They must make spare parts and repair facilities reasonably available. Notices saying that repairs and parts will not be available override the guarantee. Manufacturers and importers must ensure goods are of acceptable quality and correspond with any description given. Any trader supplying services, including professional, banking and insurance services, automatically guarantees the services will be carried out with reasonable care and skill. It must be clear that the services, and any product resulting from them, will be fit for any particular purpose the consumer has told the trader about, except when the consumer doesn't, or it is unreasonable to, rely on the trader's judgement. When no time is agreed for completion, services should be completed within a reasonable time, and when no price is agreed, the consumer should pay no more than a reasonable price. When goods or services do not meet guarantees, a consumer can insist the supplier remedy the failure. If the supplier does not fix the fault, the consumer can have the product fixed elsewhere and recover costs from the supplier. If a fault cannot be corrected, or cannot be corrected in a reasonable time, or the fault is substantial, the consumer can:
Reject the goods and claim a full refund or replacement, or keep the goods and claim compensation for any drop in value.
Claim a remedy offered under a manufacturer's express guarantee.
Cancel the service and claim a refund, or claim compensation for any drop in value.
Claim compensation for any loss that could have been foreseen by the trader.
The Consumer Guarantees Act makes it easier for consumers to get a fair remedy when they buy faulty or poor goods and services. In most cases, when the fault can be fixed easily and speedily, the trader will have the opportunity to repair. When the problem is more serious and a repair is not good enough, the consumer can get a replacement or a refund in cash.
The vision of the Ministry of Consumer Affairs: Manatu Kaihokohoko is well-informed consumers, fair trading practices and safe products used safely. The ministry seeks to ensure that:
Consumer interests are well represented in public and private sector policies and decisions.
Appropriate, accurate and accessible information, education and advice is available for consumers and businesses.
Information is available to help consumers make comparisons between goods, services, prices and production processes.
Goods and services are sold using fair rules and ethical practices.
Appropriate redress, remedies and penalties are available for the benefit of consumers when things go wrong.
Accurate, informed and effective measures are invoked in trade transactions.
Safe products can be used safely.
The production, distribution, installation and use of electricity and gas is safe.
The ministry's policy unit provides advice to the government on matters affecting consumers and promotes and participates in the review of consumer-related legislation, policies and programmes. The ministry monitors laws such as the Fair Trading, Consumer Guarantees, Motor Vehicle Dealers, Hire Purchase, and Credit (Repossession) Acts.
The Consumer Information Service was launched in 1997 to promote awareness among consumers and the business sector of their rights and obligations in the marketplace through consumer education and information programmes. It has offices in Auckland, Wellington and Christchurch. The service provides community education and advice, particularly for those most often disadvantaged in the market place, and training for key community groups. Citizens Advice Bureaux, Community Law Centres and Budget Advice Services are supported by the ministry to provide consumer advice.
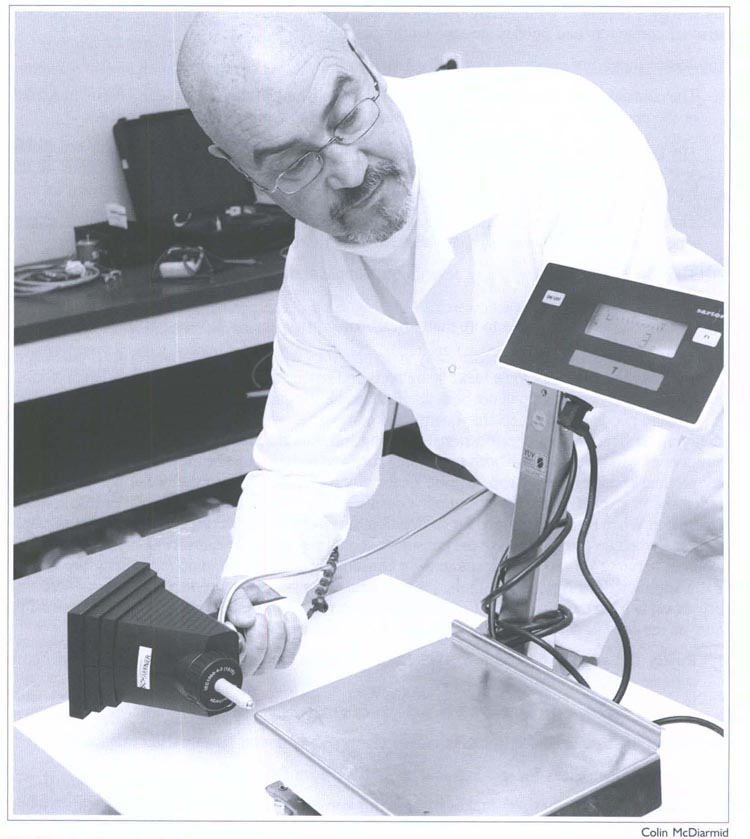
The Trading Standards Service ensures adherence to the Weights and Measures Act 1987.
The Trading Standards Service, with offices in Auckland, Palmerston North, Petone, Wellington and Christchurch, works to:
Ensure goods are exchanged on the basis of recognised, informed and accurate weights or measures under the Weights and Measures Act 1987.
Uphold consumers’ rights to safe products and services by participating in development of product safety-related legislation, promoting effective market practices and investigating reports of unsafe products.
The General Manager of the Ministry of Consumer Affairs is also responsible for managing the Energy Safety Service, established in 1999. This service is responsible for safeguarding people and property from the dangers of electricity and gas, the safety of electrical and gas appliances, electrical installation, wiring, gas supply and electrical supply and generating systems, and the quality of petrol and diesel.
The ministry was established in 1986 and operates as a division of the Ministry of Economic Development (previously the Ministry of Commerce). The ministry's website is www.consumerministry.govt.nz
The Consumers’ Institute is an independent, impartial and comprehensive provider of consumer information and advice. It aims to provide effective and timely consumer advocacy. Most of the institute's activities centre on publication and distribution of its magazines, Consumer (circulation 85,000) and Consumer Home & Garden (circulation 45,000). The institute's work covers a wide range of consumer protection and information activities, including comparative tests and surveys of consumer goods and services, and research into and advice on financial, food, health, safety, welfare and environmental matters. All survey and test results are sent to named parties before publication and draft articles are checked by expert commentators. The institute makes submissions on behalf of consumers to parliamentary committees and public inquiries and its representatives liaise with government, business, trade and safety organisations. It maintains an interest in consumer education and complaints mechanisms on behalf of its members. The institute is funded by membership subscription and sale of publications. No donations or sponsorships are accepted from any commercial source and no government funding is received. The institute is governed by a board elected by subscribing members. The institute's website is www.consumer.org.nz
Shops can open in New Zealand every day of the year, 24 hours a day, except on Christmas Day, Good Friday, Easter Sunday and up to 1 pm on Anzac Day. Exceptions allow dairy/mixed businesses, service stations, takeaway outlets, souvenir and duty free shops, shops at public passenger transport terminals and genuine exhibitions and shows to open on any day. The government is considering options to change this legislation.
The minimum drinking age was lowered to 18 years on 1 December 1999 under the Sale of Liquor Amendment Act 1999. Under the act, a person under 18 years may have access to any licensed premises (other than restricted areas) and be supplied liquor, providing he or she is accompanied by a parent or legal guardian and liquor is supplied by the parent or legal guardian.
Holders of an off-licence are allowed to sell liquor on Sundays.
All on and off-licence premises are permitted to sell liquor on Sundays. However, hotels, taverns and off-licences are prohibited from selling and supplying liquor on Good Friday, Easter Sunday, Anzac Day (before 1pm) and Christmas Day. The law does not apply to people living in the hotel or tavern, or people present dining.
The 1999 act allows supermarkets and groceries to sell beer as well as wine.
The object of sale of liquor legislation is to establish a reasonable system of control over the sale and supply of liquor to the public, with the aim of contributing to a reduction of liquor abuse, so far as that can be achieved by legislative means.
Sale of liquor to any member of the public requires a licence, of which there are four:
On-licences authorise the sale and supply of liquor on the premises or conveyance (such as a ship or aircraft) for consumption on the premises only. Examples include taverns, licensed restaurants and nightclubs.
Off-licences authorise the sale or delivery of liquor on or from the premises to any person for consumption off the premises. Examples are wine resellers, supermarkets and bottlestores.
Club licences authorise the sale and supply of liquor on the premises for consumption on the premises by a club member or guest of a member, or members of a club who have reciprocal visiting rights. A ‘club’ means a chartered club; a club that participates in or promotes any sporting or other recreational activity other than for gain; or any group of people combined for any purpose other than gain.
Special licences enable the sale and supply of liquor on the premises, for consumption on the premises, to any person attending any occasion or event.
Hours of sale. The hours during which liquor is allowed to be sold or consumed are not spelt out in legislation. Each application is dealt with on its merits.
Liquor licensing. New Zealand's central liquor licensing body is the Liquor Licensing Authority. consisting of a district court judge as chairperson, together with three or four members appointed by the governor-general on the recommendation of the Minister of Justice. The authority considers and determines applications for on, off and club licences, and for manager's certificates. It also decides on appeals against decisions by district licensing agencies.
There are 74 district licensing agencies, which are essentially the local authority in each district or city throughout New Zealand. District licensing authorities receive applications for liquor licences, gather reports and determine all unopposed applications. Opposed applications are forwarded to the Liquor Licensing Authority. District licensing authorities grant special licenses and temporary authorities, whether unopposed or not.
The minimum drinking age in New Zealand is 18 unless accompanied by a parent or legal guardian.
Individuals wishing to start a business can do so by:
Trading in their own name or in partnership under the Partnership Act 1908, which covers ordinary partnerships and the more rarely used special partnerships.
Forming a company under the Companies act 1993.
If, as usually happens, they wish to limit their individual liability for any losses that the business may suffer, they will choose to incorporate a limited liability company under the Companies Act 1993. This is by far the most usual form of business operation in New Zealand.
Companies are founded on three concepts:
That the shareholders have limited liability, meaning that their liability is limited to the amount they have agreed to pay for their shares, so that if the company should fail owing money, their other assets are protected from seizure to pay the outstanding debt.
Their shares are transferable.
The company is a separate legal entity from the shareholders.
Companies in which shareholders have limited liability have names ending in Limited (Ltd).
Companies. A company incorporated under the Companies Act 1993 must have at least one shareholder, one share and one director. There is no limit on the number of any of these. The distinction between private and public companies no longer exists. The act treats all companies uniformly, with certain exemptions available to companies that have only a few shareholders.
An incorporated company is a separate legal entity from its shareholders. Certain important consequences flow from this. A company can hold property, can sue and be sued and can enter contracts in its own name. Its debts are its own. Shareholders’ liability for debts is limited, unless they guarantee repayment by a separate contractual obligation.
A company exists indefinitely, unaffected by the death or bankruptcy of its shareholders. Its existence terminates when it is removed from the register of companies.
A company can incorporate with, or later adopt, a constitution. This enables a company to depart from the procedures of the act where permitted, allows the company certain powers and can include other matters of importance that bind the shareholders. A constitution can be altered or revoked. with or without adopting a replacement constitution. A company that does not have a constitution will have its internal procedures governed by the text of the act.
Shareholders are essentially investors who receive a share in return for their investment. This is essentially a right of participation, entitling the holder to attend and vote at general meetings, receive dividends as a return on the investment, and share in any surplus assets, being assets that remain after a company has ceased its activity and is ready for removal from the register.
Shareholders are not agents of the company and cannot enter into binding contracts on its behalf. They have no right to deal with the company's assets. Shares are transferable, so that if a shareholder wishes to cease having an investment in the company and can find a buyer, the shareholder can sell the shares to the buyer, who notifies the company accordingly. Shares in certain companies, known as listed companies from their listing on the New Zealand Stock Exchange, can be traded publicly.
Directors are appointed by shareholders to manage the business and affairs of the company. They owe duties to the company and to the shareholders. Duties owed to the company include acting in good faith in what they believe to be the company's best interests, for a proper purpose, in accordance with the act and the constitution, using proper care, diligence and skill and in a manner that does not commit the company to incur obligations it cannot reasonably perform or where there is a substantial risk of serious loss to the company's creditors. Duties owed to shareholders include maintaining the register of shareholders.
Anyone who occupies the position of a director, even though not named as such, is treated as a director and is bound by these duties.
Table 24.2 shows the number of new companies registered, companies dissolved or struck off and the number of registered companies each year from 1990 to 2000. Figure 24.1 illustrates the rate of new company registrations per 100,000 population in New Zealand.
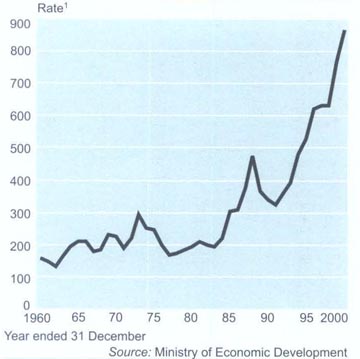
Table 24.2. Company registrations
| Year ended 30 June | New companies registered | Companies dissolved or struck off | Companies on register |
|---|---|---|---|
1Year ended 31 March. R = revised Source: Ministry of Economic Development | |||
| 19901 | 11,289 | 12,377 | 159,922 |
| 1991 | 10,953 | 14,984 | 153,275 |
| 1992 | 12,330 | 11,144 | 154,526 |
| 1993R | 14,160 | 11,884 | 156,925 |
| 1994 | 17,263 | 9,711 | 168,391 |
| 1995 | 16,249 | 11,320 | 170,350 |
| 1996 | 19,863 | 13,101 | 177,093 |
| 1997 | 23,172 | 7,936 | 192,224 |
| 1998 | 24,083 | 14,173 | 202,317 |
| 1999 | 26,502 | 11,861 | 217,000 |
| 2000 | 33,234 | 20,255 | 230,359 |
Company law reformed. The Companies Act 1993, which came into force on 1 July 1994, streamlined and simplified company law, making it more intelligible and accessible.
The act requires companies to satisfy a solvency test in circumstances where a company is parting with money with no apparent benefit to it, as with the payment of a dividend or where the company agrees to purchase shares from a shareholder (previously not permitted) subject to safeguards. At the conclusion of the transaction, the company must have assets exceeding liabilities and be able to pay its debts in the normal course of its business.
The act defines directors’ duties (previously not included) and remedies available to shareholders. It also simplifies the law relating to company liquidations – a frequent means of removing companies from the register, particularly those unable to pay their creditors.
A number of other acts were also introduced on 1 July 1994. These included:
The Financial Reporting Act 1993, which regulates aspects of company accounting and reporting to the Registrar of Companies. It requires overseas companies registered to carry on business in New Zealand, New Zealand incorporated subsidiaries of overseas companies, and New Zealand incorporated companies with more that 25 percent overseas control of their voting shares, to file copies of their audited financial statements with the Registrar of Companies. The act also established an Accounting Standards Review Board to promote accounting standards.
The Receiverships Act 1993, which separates the law concerning receiverships – a remedy available to secured creditors of a company – from general company legislation, as was previously the case. It provides for receiverships to be notified to the Registrar of Companies and regular reports to be filed until the receivership ends.
The Takeovers Act 1993, which regulates company takeovers under the supervision of a takeovers panel and a takeovers code. Provisions for the enforcement of the code came into force on 1 July 2001.
Partnerships. A partnership is defined in the Partnership Act 1908 as the relationship between persons carrying on a business in common with a view of profit. Partnerships are started by mutual agreement, which can be informal, but the terms would normally be contained in a written agreement. Characteristics of a partnership are that each partner is usually under a joint liability for all partnership debts; a partnership will as a rule be dissolved by the death or retirement of a partner; partnership interests are not usually capable of being assigned or transferred; control and management of a partnership's affairs are (subject to the partnership agreement) vested in all partners. Lastly, a partner is ostensibly an agent for the other partners, and can commit the partnership to binding arrangements.
The Commerce Commission exists to enforce a number of general and specific regulatory regimes set out in the Commerce Act 1986, the Fair Trading Act 1986, Electricity Industry Reform (EIR) 1998, the Dairy Industry Restructuring Act 2001 and the Telecommunications Act 2001.
The commission was established under the Commerce Act 1986 and is a Crown entity under Schedule IV of the Public Finance Act 1989. The commission comprises up to five members, including a chair and deputy chair. In addition, associate members may be appointed. Commission members are appointed by the governor-general on the recommendation of the Minister of Economic Development. At the end of April 2001, the commission had four members and two associate members. A new position of Telecommunications Commissioner was appointed in December 2001.
The commission's revenue is derived mainly from the Crown, supplemented by fees from parties seeking adjudication decisions. In addition, the commission receives some revenue from court costs awarded and from interest. New responsibilities in the electricity, telecommunications and dairy industries are, for the most part, ultimately funded by government-imposed industry levies. The operational implications of the new responsibilities have seen the commission's budget increase significantly from $9.3m in 2000/01 to $18.3m in 2001/02. In addition, the commission has increased its resources to meet its new responsibilities and had 95 staff at January 2002. The commission operates from a head office in Wellington and has additional offices in Auckland and Christchurch which deal with Fair Trading Act responsibilities.
Commerce Act and Fair Trading Act. These acts are designed to prevent or deter abuses of market power, collusion, anti-competitive mergers and misleading or deceptive behaviour. The aim of the Commerce Act is to promote the efficient operation of markets through the promotion of competition for the long-term benefit of consumers. The act applies to all individuals and commercial organisations, including state-owned enterprises, local government and government departments in so far as they engage in trade. The act prohibits a range of anti-competitive activities called ‘restrictive trade practices'. Restrictive trade practices include substantially lessening competition, excluding competitors, price fixing, taking advantage of market power, and resale price maintenance. Parties planning to be involved in business practices which may be restrictive trade practices can apply to the commission for authorisation, which will be granted if the commission is satisfied that the public will ultimately benefit from the business practice, even though there is a lessening in competition. The act prohibits the acquisition of assets or shares in a business if acquisition results in that business substantially lessening competition in a market. Under the act, those acquiring assets or shares can apply to the commission for clearance or authorisation. The commission will grant a clearance if it is satisfied an acquisition will not substantially lessen competition in a market. It will grant an authorisation, even if the acquisition results in the acquiring or strengthening of a dominant position in a market, if there is sufficient public benefit to outweigh the detriment to competition. If granted, clearance or authorisation exempts the business practice or acquisition from the act's prohibitions and protects the business from action by the commission and private individuals.
The act gives the Minister of Economic Development the power to set price controls for goods or services. Price controls may be imposed only where there is limited competition in the market for particular goods or services and control is seen as necessary or desirable in the interests of users, consumers or suppliers. The last price control, on natural gas, was lifted on 1 April 1993. Penalties for breaching the act are up to $10 million for companies and up to $500,000 for individuals.
The Fair Trading Act ensures accurate information about goods and services.
The aim of the Fair Trading Act is to ensure customers receive accurate information about goods and services, and to promote product safety. It prohibits people in trade from engaging in ‘conduct that is misleading or deceptive or is likely to mislead or deceive'. It also lists and prohibits certain types of false or misleading representations about goods and services. These include false statements that goods or services are a particular price or involve particular savings; are of a particular kind, standard, quality, grade or origin; are of a particular style or model; are endorsed by an organisation or sponsor; are supplied with particular warranties or guarantees; have a particular history of use; have particular uses or benefits. The act specifically prohibits certain practices which are unfair or misleading and makes it a criminal offence to engage in any of these. They include:
Offering free gifts or prizes when supplying goods or services if those involved do not intend awarding the gift or prize.
‘Bait’ advertising, such as advertising of ‘specials’ or Toss leaders', to attract customers into a shop if the advertiser does not intend to make available the goods or services for a reasonable time and in reasonable quantities.
Demanding or accepting payment without intending to supply goods or services ordered.
Making misleading representations about profitability, risk or other matters affecting a business run from a home.
Use of physical force, harassment or coercion when supplying goods or services.
Pyramid selling schemes.
The act gives the Minister of Consumer Affairs the power to make consumer information and product safety standards mandatory. In October 1999, consumer information standards covered country of origin labelling of clothing and footwear; care labelling for textile goods (such as dry-cleaning, washing, ironing instructions); and fibre content labelling of textile goods. Product safety standards covered cigarette lighters, toys for children aged up to three years, bicycles, and night clothes for children from six months to 14 years. Fines for breaching the act are up to $ 100,000 for a company and up to $30,000 for an individual.
Electricity Industry Reform Act. Under this act, businesses selling more than a specified amount of electricity cannot also own powerlines or generators. Businesses can apply to the commission for exemptions from the act.
Telecommunications Act. This act is aimed at reforming the telecommunications industry in New Zealand to deliver a better deal for consumers. The act aims to bring greater certainty, investment, competition, opportunity and consumer benefit.
Dairy Industry Restructuring Act. This act provides for the regulatory and structural reform of the dairy industry. The act authorises the amalgamation of New Zealand's two largest dairy cooperatives, the New Zealand Cooperative Dairy Company Ltd and Kiwi Cooperative Dairies Ltd, into Fonterra Cooperative Group Ltd and the resulting ownership by Fonterra of all the shares in the New Zealand Dairy Board. The resulting cooperative may have a substantial degree of market power in a number of key domestic New Zealand dairy markets. The act provides for a legislative package of measures to mitigate the risks of that market power.
The Serious Fraud Office (SFO) is a specialist department established by the Serious Fraud Office Act 1990 to facilitate the detection, investigation and expeditious prosecution of serious and/or complex fraud offenders. The office had a staff of 37 at 30 June 2001, comprising forensic accountants, investigators, prosecutors and support staff. Multi-disciplinary teams are used in the investigation and prosecution of cases.
For the purposes of determining whether an offence involves serious or complex fraud, the act provides that the director of the office may, among other things, have regard to the suspected nature and consequences of the fraud, the suspected scale of the fraud, the legal, factual and evidential complexity of the matter, and any relevant public interest considerations. The director's decision to investigate or take proceedings is discretionary and not subject to review.
During the 2000/01 financial year, 96 complaints were received and 21 full investigations were concluded. Of these, 12 resulted in prosecution, some with multiple offenders. In addition, nine investigations were concluded, but did not result in prosecution. Nineteen investigations were tinder way at 30 June 2001. Ten successful prosecutions were concluded during the year. There was one unsuccessful case and one stayed decision.
The office's statutory powers are the most extensive in the area of criminal investigation in New Zealand. Briefly, they require any person whose affairs are being investigated, or any other person whom the director has reason to believe may have relevant information or documents, to appear before the director to answer questions and produce such documents for inspection. In the year to 30 June 2001, 1,158 notices were issued under these powers (979 requiring documents or information and 179 requiring people to attend interviews), compared with 1,082 in the previous year. Twenty search warrants were executed, compared with 41 the year before.
Government funding for the year to June 2001 was $4,472 million.
The Takeovers Panel was established as a body corporate under the Takeovers Act 1993, which sets out its functions and powers. In summary, the panel's functions are:
To formulate and recommend a takeovers code applying to takeovers of specified companies.
To formulate and recommend amendments to the takeovers code.
To keep under review practices relating to takeovers of specified companies.
To investigate any act or omission or practice for the purpose of exercising its powers under the enforcement provisions of the act.
To make determinations and orders and make applications to the court under the enforcement provisions of the act.
To promote public understanding of the law and practice relating to takeovers.
To comply with the principles of natural justice in exercising its functions and powers.
The powers of the panel are set out in Sections 9 and 13 and Part III of the Takeovers Act 1993. In summary, the powers of the panel are:
To issue summonses and to take evidence on oath.
To make confidentiality orders.
To authorise the Registrar of Companies to undertake inspections.
To grant exemptions from the code.
To enforce the takeovers code by making determinations on whether a person is complying with the code, to issue restraining orders and to apply for court orders.
Under the takeovers code, the panel has powers to approve independent advisers and appoint independent experts. The Takeovers Panel's website is www.takeovers.govt.nz
The purpose of the Securities Commission, established as a body corporate under the Securities Act 1978, is to strengthen confidence in New Zealand's capital markets, both in New Zealand and overseas, by promoting the efficiency, integrity and cost-effectiveness of these markets, thereby fostering capital investment in New Zealand.
The commission aims for good standards of disclosure; reliable and ethical procedures for effecting transactions; flexibility in development of best regulatory practice; sound principles for market regulation; cost-effective rules of law; compliance with the law; good working relationships with overseas regulators; and public understanding of the law and practice of securities.
The Securities Commission is an active member of the International Organisation of Securities Commissions (IOSCO). This consists of 166 regulatory and self-regulatory agencies, including representatives of all significant securities jurisdictions.
The work of IOSCO is divided into five areas:
Multi-national disclosure of information, including harmonisation of international accounting and audit standards.
Regulation of secondary securities markets, including examining the implications of use of the internet and other electronic communication networks.
Regulation of market intermediaries and their products.
Enforcement and exchange of information, in particular across national borders.
Investment management.
The Securities Commission is a member of the committee implementing IOSCO's Statement of Objectives and Principles of Securities Regulation. The statement promotes a concept of high regulatory standards on a global basis, which takes account of the values and principles of small but highly reputable countries such as New Zealand.
The commission's website is www.sec-com.govt.nz
There are three broad categories of stock bought and sold on the New Zealand Stock Exchange – shares in companies; bonds, debentures and other loans; and government and semi-government stock. As on other world stock exchanges, company shares account for the bulk of trading.

New Zealand Stock Exchange trading is facilitated automatically through the FASTER trading system.
New Zealand Stock Exchange. The New Zealand Stock Exchange (NZSE) is the national corporate body representing its sharebroker members. It was established by the Sharebrokers Amendment Act 1981 as the successor to the Stock Exchange Association of New Zealand. The purpose of the exchange is to provide and operate an efficient market for the raising of capital for listed companies and the trading of securities, including shares and fixed interest securities such as bonds and government stock. Members of the NZSE assist companies raise capital by issuing securities, and also provide investment advice and act as agents for clients buying and selling securities. The NZSE maintains professional standards among its members and listed companies through the NZSE Code of Conduct, members’ rules and listing rules. The exchange is funded from fees paid by members, listed companies and charges for information services. There were 149 New Zealand companies and 71 overseas companies listed with the exchange at 31 December 2001. Exchange trading is facilitated automatically through the NZSE's FASTER trading system. Orders to buy and sell securities are placed into the system by member firms and these are matched on a continuous basis by a strict price and time priority algorithm. As orders are matched, delivery of securities and payment occur simultaneously, allowing a zero credit risk for investors. There is a maximum settlement period of three days for all equity trades of more than $100,000. As at December 2001, however, the average settlement time for FASTER trades was one day. The NZSE has introduced Common Shareholder Numbers (CSN) for security holders. This eliminates the inconvenience of multiple shareholder numbers and FASTER Identification Numbers (FIN) and makes it easier to maintain and transfer security holdings. In November 2001, the NZSE profiled its new investor market for the trading in listed interest rate securities through the launch of its new website www.debtmarket.co.nz
The NZSE Debt Market will provide better access to information on the value of listed interest rate securities and improve the visibility and transparency of the market for investors. The NZSE plans to demutualise. Once approved by the government and NZSE members, the exchange plans ultimately to become a listed company. This will separate owners from customers, improve accountability and provide more flexibility for raising capital to service market developments.
Figure 24.2 illustrates the movement of the share price index from July 1986 to August 2001.
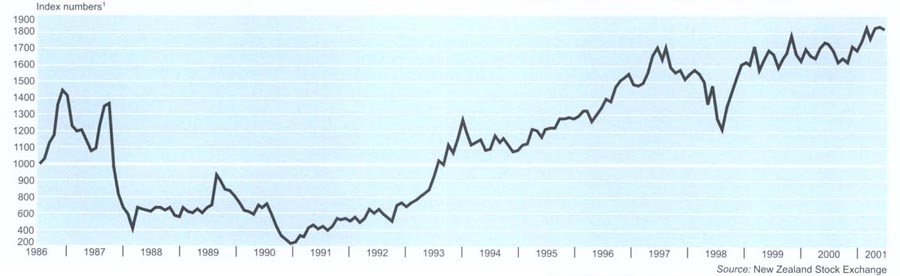
New Capital Market. The New Zealand Stock Exchange (NZSE), in recognition of the need to provide an equity financing option for small to medium-sized businesses, launched the New Capital Market (NCM) in March 2000.
The NCM is used by small to medium-sized businesses wanting to list on the NZSE. The NCM provides a structured, cost-effective and fast initial public offering mechanism, along with the ability for companies to conduct fast and economical subsequent public offers.
In general terms, the main aims of the NCM are to:
Create opportunity for investors and businesses by providing an alternative investment option for investors and an initial public offering alternative for businesses.
Encourage participation by companies wanting to grow and develop their businesses through equity financing.
Lower costs of access to equity by fostering a change of culture from traditional debt financing to equity financing.
Provide access to the public securities market by allowing shares in NCM companies to trade on the NZSE.
Provide for the sharing and spreading of risks by allowing businesses to share equity ownership of the company.
Provide investors with access to reliable information by providing a facility through the internet where investors can access market announcements and trading data for NCM-listed companies.
As at 30 September 2001, 11 companies had listed on the NZSE using the NCM mechanism.
Bankruptcy. Bankruptcy refers to the financial insolvency of individuals. Laws relating to bankruptcy in New Zealand are contained predominantly in the Insolvency Act 1967, the Insolvency Regulations 1970 and the High Court Amendment Rules (No 2) 1999, which came into effect on 1 February 2000. Jurisdiction in bankruptcy matters is vested in the high court.
All proceedings in bankruptcy are commenced by a petition filed in the court by either the debtor or a creditor. Not less than $200 in total must be owing by the debtor to any creditor filing a petition.
The Official Assignee is a statutory officer in whom all the assets of a bankrupt vest on adjudication, apart from certain statutory exceptions, and who acts as a trustee in respect of those assets.
An Official Assignee is empowered to sell the bankrupt's property, enforce debts due to the bankrupt's estate, or carry on the business of the bankrupt so far as it is necessary or expedient for its disposal or conclusion.
When all assets are realised, the assignee deducts expenses incurred, pays any debts given statutory priority, and then divides the proceeds among creditors. Secured creditors are paid from the proceeds of the security and other creditors are paid on a pro rata basis.
Creditors may accept a composition (an agreement among all creditors of a debtor to accept a percentage of the debts as full payment) in satisfaction of the debts due to them.
Upon application by the bankrupt, the court is empowered to grant an order of discharge, which can be absolute, conditional or suspended. The application may be opposed by the Official Assignee, or by any creditor whose claim has been proved, and public examination of the bankrupt may be demanded.
When an objection to discharge is lodged, the court determines whether a discharge should be granted. In all other cases, a person adjudicated bankrupt is automatically discharged three years after adjudication. When a creditor is concerned that a bankrupt may realise assets and depart without regard to financial obligations, an application may be made for the assignee to be appointed as a receiver/manager of the property prior to the hearing of the creditor's petition.
Another form of financial failure is covered by private assignments, which are not included in official bankruptcy statistics. (An assignment is the transfer of rights in a contract to a person who was not originally a party to the contract.) General bankruptcy statistics do not cover assignments and compositions, but relate only to cases dealt with by the Official Assignee.
The Official Assignee's role under the Proceeds of Crime Act 1991 is described in Chapter 10: Justice and Law.
Table 24.3 shows the number of personal bankruptcies in New Zealand and Figure 24.3 shows the bankruptcy rate per 100,000 population.
Table 24.3. Personal bankruptcies
| Year ended 30 June | Number |
|---|---|
1Year ended 31 March. Source: Ministry of Economic Development | |
| 19801 | 530 |
| 19851 | 849 |
| 1990 | 1,900 |
| 1991 | 2,052 |
| 1992 | 2,837 |
| 1993 | 2,532 |
| 1994 | 2,312 |
| 1995 | 1,963 |
| 1996 | 2,158 |
| 1997 | 2,466 |
| 1998 | 2,974 |
| 1999 | 3,297 |
| 2000 | 2,700 |
| 2001 | 2,886 |
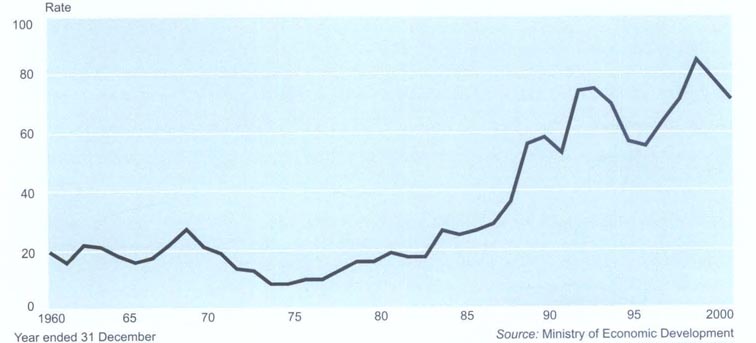
Company liquidation. Liquidation, sometimes called winding up, is the legal process by which a company's life is ended. The company's assets are realised, its creditors paid, any surplus is distributed to shareholders, and the company is then dissolved.
Liquidation is carried out in accordance with the relevant provisions of Part XVI and XVII of the Companies Act 1993.
Company receivership. Companies with heavy debt loads and cash-flow problems can have a receiver appointed over their assets, either by the court, or, more commonly, under an express clause in a mortgage or debenture.
Debentures often contain a lengthy recital of events which will enable debenture-holders to recover their loans if borrowers get into financial difficulties. One of these provisions will be the power of the debenture-holder to appoint a receiver.
The function of a receiver, once appointed, is to realise the assets charged by the debenture, that is to sell what is necessary to recover the amount owed to the debenture-holder (plus costs), or manage the company's business for this purpose, and then retire as receiver.
No property of the company is actually vested in the receiver, and although the directors remain in office, the receiver supersedes them and exercises their powers.
The receiver's status is one of agent, not officer of the company. Receivership is quite distinct from liquidation, as a receiver acts for the benefit only of the debenture-holder who appointed him or her, whereas a liquidator acts for unsecured creditors.
Table 24.4 shows the number of companies placed under receivership and company liquidations in New Zealand from 1990 to 2001.
Table 24.4. Company insolvencies
| Year ended 30 June | Companies placed under receivership | Company liquidations | |
|---|---|---|---|
| Court order | Voluntary | ||
Note: Collection of figures for voluntary liquidation ceased in year ended June 2000. Source: Ministry of Economic Development | |||
| 1990 | 777 | 1,033 | 4,406 |
| 1991 | 690 | 1,031 | 1,356 |
| 1992 | 575 | 1,052 | 1,182 |
| 1993 | 286 | 991 | 943 |
| 1994 | 222 | 888 | 1,367 |
| 1995 | 219 | 739 | 1,593 |
| 1996 | 174 | 760 | 1,691 |
| 1997 | 240 | 727 | 1,611 |
| 1998 | 276 | 1,078 | 2,038 |
| 1999 | 219 | 987 | 2,099 |
| 2000 | 235 | 810 | .. |
| 2001 | 462 | 697 | .. |
The insurance industry in New Zealand, both life and non-life, has a number of characteristics which make international comparison difficult. In taking an overview of the New Zealand industry, it is necessary to identify and understand these characteristics.
Regulation. The Insurance Companies’ (Ratings and Inspections) Act, which came into force in November 1994, requires fire and general insurance (not life insurance) companies to obtain, register and disclose a claims-paying ability rating. The requirement also applies to any non-life business, such as disability products of life insurance companies. While some insurers not providing property or disaster insurance can apply for an exemption, the legislation effectively introduces a form of market regulation that allows consumers to judge the financial strength of their insurers, which they had not been able to do before. The other important regulatory legislation is the Insurance Companies’ Deposits Act 1953, which requires any person or company carrying on the business of insurance in New Zealand to lodge approved securities with a market value of not less than $500,000 with the Public Trustee. The deposits are held by the Public Trustee as security for policyholders or claimants in respect of policies or other contracts issued, granted or entered into by the person making the deposit. The value of deposits held by the Public Trustee under the Insurance Companies’ Deposits Act 1953 was $49.5 million in June 2001 ($53.5 million in 2000); and $26.5 million in June 2001 under the Life Insurance Act 1908 ($26.5 million in 2000).
Statutory reporting is required under the Life Insurance Act 1908. The Insurance Companies’ Deposits Act 1953 was amended in 1983 to require detailed annual reports and statements of financial condition to be provided to the Ministry of Economic Development. New Zealand has no insurance commissioner or equivalent public official and there are no statutory solvency requirements or controls, nor is there any restriction or control on re-insurance. Life insurance companies may apply to the Securities Commission on an annual basis to be ‘authorised’ in terms of the Securities Act 1978, which gives certain exemptions from the requirements of that act. The life and general insurance industries are also required to comply with all consumer protection legislation such as the Fair Trading Act 1986 and the Consumer Guarantees Act 1993.
There are no fiscal regulations designed to direct life or fire insurance investment funds to particular investment sectors. There are some limited reporting and disclosure requirements contained in the Marine Insurance Act 1908. Other insurance companies are subject in the ordinary way to the provisions of the Companies Act 1993 and must comply with New Zealand company law in the same manner as other business enterprises.
The Mutual Insurance Act 1955 provides for the establishment of mutual insurance associations, which are intended to provide insurance primarily for farm owners and certain rural industries and their employees.
The size and close-knit nature of the New Zealand insurance market has meant regulation of the industry has proceeded through a combination of loose government supervision, coupled with a measure of self-regulation. Competition has also been an important factor in regulating all parts of the insurance market. During 1990 the Insurance Council of New Zealand adopted self-regulation in order to provide greater information to consumers. In 1995 the complaints procedure and review authority under the Code of Business Practices were replaced by the independent disputes mechanism provided by the Insurance and Savings Ombudsman service. This is in addition to the Fair Insurance Code and minimum solvency levels. Following the report of the Government Working Group on Improved Product and Investment Adviser Disclosure, the Investment Savings and Insurance Association (which includes insurance companies providing financial services) has issued standards for point of sale disclosure.
Insurance intermediaries. The Insurance Intermediaries Act 1994 established insurance broker client accounts, limitations on how premiums received by brokers may be used and 50-day terms of credit. Traditionally, the insurance needs of the community have been served through a network of agents established by each insurance company. This agency network is now reinforced by other networks of international and local insurance brokers, the former servicing major commercial accounts and providing access to international insurance services, and a growing network of independent insurance agents selling fire and general insurance. The life insurance agency system has substantially moved away from a tied agency system with individual agents contracted to a particular life insurance company. Multiple agency agreements with different companies are now common.
Government involvement. Some classes of insurance which make a substantial contribution to the premium pool of countries overseas do not feature in New Zealand because of the different legal climate and background. For instance, the accident compensation scheme effectively removed many classes of liability insurance in New Zealand. The comprehensive ‘no fault’ scheme abolished all common law actions in tort for negligence and provided a system of compensation and rehabilitation in respect of accidental injury. The Accident Rehabilitation and Compensation Insurance Act 1992 is administered by the Accident Rehabilitation and Compensation Insurance Corporation (ACC), which also has statutory responsibilities for accident prevention. The system of accident compensation is described in Chapter 8: Health and Safety. Historically, the government has also been involved in both fire and general and life insurance through government-backed life insurance and mutual funds. But in recent years it has withdrawn from these activities. The taxation regime in New Zealand in respect of both life insurance, non-life insurance and reinsurance includes the imposition of goods and services tax on non-life insurance services, and income tax in respect of both life and non-life insurers and insurance transactions. A major review of life office taxation was undertaken several years ago.
Fire services in New Zealand are funded through a levy upon all fire insurance policyholders. The role of the New Zealand Fire Service Commission is outlined in Chapter 8: Health and Safety. Each of these government interventions in the insurance market affects the size of the premium pool by influencing the cost and perceived level of insurance required by businesses and individuals in the private sector.
Natural disaster insurance. New Zealand is susceptible to damage caused by earthquakes and other geophysical events and insurance against these events has presented a considerable problem. The Earthquake and War Damage Commission was established in 1944 to provide a government-guaranteed fund for damage caused by war and earthquakes. The fund was created with premiums collected from fire insurance policy holders. The original act was replaced by the Earthquake Commission Act 1993, which introduced several changes to the original scheme. These included dropping war damage and non-residential property from the cover. Under the act, the Earthquake Commission (EQC) provides cover of $100,000 (excluding GST) for dwellings and $20,000 (excluding GST) for contents. Perils covered are earthquake, natural landslip, volcanic eruption, hydrothermal activity and tsunami, residential land in the case of storm or flood, and fire caused by any of these. Cost of cover is five cents a year for every $100 value of property insured. The maximum premium for one year is $67.50 (including GST). The commission is a Crown entity controlled by provisions of the Public Finance Act 1989. It is a body corporate with perpetual succession, a common seal and capital of $1.5 billion. It is responsible to the Minister of Finance. The commission's board has between five and nine members, appointed by the governor-general. Each commissioner is appointed for a term of up to three years, but may be reappointed. Claims for the year ended 30 June 2001 totalled 1,255 earthquake and volcanic activity claims ($1,478,000) and 807 landslip claims ($4,748,000). EQC premium income for the year was $73.7 million and the reinsurance premium was $51.7 million. The EQC website is www.eqc.govt.nz
The life insurance industry in New Zealand has major importance as an investor and savings vehicle. The industry has undergone considerable change in recent years, with demutualisations, takeovers and establishment of units to provide staff and services to other units being key contributing factors to the overall performance of the industry. Statistics New Zealand's business demographic statistics recorded 38 life insurance enterprises at February 2001. The market is dominated by AMP, National, Colonial, New Zealand Insurance Life, Tower Retirement Investment and Prudential, who among them write about 75 percent of New Zealand's life insurance and superannuation business, measured by annual premium income.
The non-life insurance market is divided among 128 enterprises, including life companies doing non-life business who have made deposits under the Insurance Companies’ Deposits Act 1953. Many of these depositors, however, are not active in the New Zealand market. Some deposits are made to support placements overseas by brokers, or by international reinsurers, and some are retained to support the runoff of workers’ compensation business by insurers no longer active in New Zealand. Some New Zealand insurance business is placed directly offshore with Lloyds and the insurance company market in London. The ability to spread risk through international reinsurance markets has allowed New Zealand insurers to absorb large increases in business flowing from the government's decision to remove the Earthquake and War Damage Commission from non-residential disaster insurance.
Business demographic statistics recorded 62 health and 78 general insurance enterprises in New Zealand at February 2001 and the annual business directory update recorded 7,730 full-time equivalent people engaged in the insurance industry.
The considerable change which has taken place in the New Zealand insurance industry is likely to continue. The number of direct underwriters is reducing, with amalgamations and withdrawals, and this has been accompanied by a decrease in the number of reinsurers establishing a place of business in New Zealand. It is also probable that the number of major international brokers will be reduced, but that there will be a growing number of brokers operating on a local or regional level to service small businesses and the domestic market.
It is generally expected that market growth will increase in the life insurance and superannuation fields to compensate for reduced government commitment to the provision of New Zealand Superannuation.
The Accident Rehabilitation and Compensation Insurance Corporation (ACC) has the statutory duty to promote occupational safety and accident prevention, and this activity has had some indirect benefit to the insurance industry.
The Insurance Council of New Zealand, along with the Fire Service Commission, is active in fire prevention and fire safety education.
Most other activity in the field of loss prevention and accident prevention is undertaken by the government, or by quasi-government bodies which are wholly or partly public funded. The Building Research Association of New Zealand (BRANZ) undertakes work in assessing building materials and methods of construction, and the New Zealand Automobile Association and similar organisations are active in the field of prevention of motor vehicle accidents.
Much of New Zealand's effort in loss prevention has traditionally been organised and financed through the insurance industry, in areas such as electrical safety and registration, research into fire prevention and fire safety equipment, and the approval of passive fire protection and alarm systems.
The principle insurance organisations in New Zealand are the:
Insurance Council of New Zealand Inc. (fire and general insurers).
Investment Savings and Insurance Association of New Zealand Inc. (maintained by life insurers).
Corporation of Insurance Brokers of New Zealand (made up of brokers).
Independent Insurance Agents Association (representing independent brokers and agents).
Chartered Institute of Loss Adjusters and the Institute of Loss Adjusters of New Zealand Inc. (comprising adjusters and assessors).
Australian and New Zealand Institute of Insurance and Finance (the educational body of the industry).
The insurance council operates a disaster emergency scheme and both the insurance council and the life office association operate consumer inquiry facilities.
Government Superannuation Fund. Responsibility for the Government Superannuation Fund (GSF) was transferred from the Ministry of Economic Development (MED) to a new Crown entity, the Government Superannuation Fund Authority, on 2 October 2001. Primary objective of the change was to facilitate diversification of investment of the fund's assets in order to improve long-term returns. Executive support for the authority is provided by Annuitas Management Ltd, a new joint venture company, which also provides executive support to the joint venture partner, the board of trustees of the National Provident Fund. The Government Superannuation Fund administers six superannuation schemes – the general scheme for employees in government service, and the five sub-schemes for the armed forces, police, prison service, members of parliament and judges. All schemes were closed to new contributors from 1 July 1992.
The schemes are all partially-funded, defined-benefit schemes. The government, as the major employer of members of the schemes, does not meet its contribution to the benefits as they accrue, but meets its share of the benefits as they fall due. As a result, the GSF had an unfunded liability of $8,481 million at 30 June 2001. GSF assets of $3.5 billion are held and invested by the authority. The authority is also responsible for determining issues of interpretation and discretion. Decisions of the authority are subject to appeal to the GSF Appeals Board, an independent body. AXA New Zealand administers the schemes for the GSF.
Table 24.5 summarises fund activity.
Table 24.5. Government Superannuation Fund: summary
| Year ended 30 June | Number of contributors | Annual contributions | Income from investments | Subsidy from government trading departments and others | Annual value of allowances1 | Accumulated fund at 30 June |
|---|---|---|---|---|---|---|
1Tax exempt. Source: Government Superannuation Fund | ||||||
| (individuals) | $(000) | |||||
| 1997 | 39,684 | 112,243 | 486,406 | 520,158 | 644,866 | 3,348,195 |
| 1998 | 36,437 | 112,894 | 248,804 | 503,724 | 631,929 | 3,402,094 |
| 1999 | 33,690 | 107,042 | 249,829 | 483,908 | 629,100 | 3,450,706 |
| 2000 | 31,245 | 102,966 | 185,943 | 488,256 | 629,662 | 3,454,127 |
| 2001 | 29,094 | 97,082 | 251,924 | 493,332 | 639,476 | 3,494,646 |
The National Provident Fund. The National Provident Fund (NPF) was first established in 1910 to provide state-subsidised pensions to low income earners. The NPF now consists of 14 separate schemes. The fund has undergone a number of changes since inception, including a restructuring in 1991 which saw the closure of schemes to new members and the scheme administration, funds management and custody functions outsourced to private providers.
Legislative amendments in 1997 enabled the fund's board of trustees to begin implementing a series of changes to further streamline administration and reduce costs. A major development was establishment of a new pension scheme, which now holds a large percentage of NPF pensioners previously paid by individual schemes. As at 31 March 2001, NPF had total funds of $2.52 billion (invested with nine specialist managers), 39,187 contributors, 1,307 participating employers and it paid pensions to 19,748 annuitants.
Statistics New Zealand's annual enterprise survey covers activities of all businesses classified in Division K of the Australian and New Zealand Standard Industrial Classification (ANZSIC), with the exception of superannuation funds.
Life insurance. Units mainly engaged in providing life insurance, life re-insurance and other life insurance, including mortgage repayment insurance.
Health insurance. Units mainly engaged in providing insurance cover for hospital, medical, dental, pharmaceutical or funeral expenses or costs. This includes units operating employee benefit funds, welfare societies and friendly society funds not classified elsewhere.
General insurance. Units mainly engaged in providing fire insurance for commercial and domestic purposes and motor vehicle, marine, aviation and other accidental insurance.
Table 24.6 provides a statistical summary of the insurance industry.
Table 24.6. Insurance: statistical summary
| 1998 | 19991 | 20001 | |
|---|---|---|---|
1These figures are provisional. Source: Statistics New Zealand | |||
| Financial item | |||
| Total income | 3,663 | 6,331 | 6,973 |
| Sales of goods and services | 2,079 | 4,555 | 5,286 |
| Interest, dividends and donations | 821 | 790 | 775 |
| Government funding, grants and subsidies | 0 | 0 | – |
| Non-operating income | 764 | 986 | 911 |
| Total expenditure | 3,506 | 6,765 | 5,975 |
| Interest and donations | 16 | 45 | 30 |
| Indirect taxes | 12 | 11 | 8 |
| Depreciation | 25 | 52 | 64 |
| Salaries and wages paid to employees | 356 | 357 | 417 |
| Redundancy and severance | 7 | 8 | 11 |
| Salaries and wages to self-employed commission agents | 282 | 362 | 344 |
| Salaries and wages to working proprietors | 1 | 1 | 1 |
| Purchases and other operating expenses | 2,246 | 5,140 | 4,619 |
| Non-operating expenses | 568 | 798 | 493 |
| Opening stocks | – | – | – |
| Closing stocks | – | – | – |
| Operating surplus before income tax | 157 | -433 | 998 |
| Financial position | $(million) | ||
| Total assets | 17,039 | 18,313 | 19,791 |
| Current assets | 3,184 | 4,367 | 4,720 |
| Fixed tangible assets | 326 | 325 | 309 |
| Additions to fixed assets | 94 | 117 | 103 |
| Disposals of fixed assets | 30 | 55 | 54 |
| Other assets | 13,529 | 13,621 | 14,762 |
| Total equity and liabilities | 17,039 | 18,313 | 19,791 |
| Shareholders funds or owners equity | 13,664 | 13,539 | 11,343 |
| Current liabilities | 2,209 | 2,581 | 2,713 |
| Other liabilities | 1,165 | 2,193 | 5,735 |
| Financial ratios | |||
| Total income per full-time equivalent (FTE) | $419,300 | $724,300 | $744,900 |
| Operating surplus per full-time equivalent (FTE) | $18,000 | -$49,600 | $106,600 |
| Current ratio | 144.1% | 169.2% | 174.0% |
| Quick ratio | 144.1% | 169.2% | 174.0% |
| Return on equity | 1.2% | -3.2% | 8.8% |
| Return on total assets | 0.9% | -2.4% | 5.0% |
| Liabilities structure | 80.2% | 73.9% | 57.3% |
Retailing embraces retail businesses, hotels, restaurants and businesses providing household and personal services. Retail trade is one of the most important indicators of economic activity, as it constitutes a large proportion of personal expenditure on consumer goods and services.
Statistics New Zealand's Retail Trade Survey collects data monthly on sales of goods and services. Each quarter, the value of stocks held on the last day of the quarter is also obtained. The sample of businesses surveyed is drawn from Statistics New Zealand's business frame, a comprehensive and up-to-date list of all New Zealand's economically-significant businesses – those with income greater than $30,000 or with more than two full-time employees. The survey is sometimes redesigned to ensure it reflects changes in the economy. The most recent redesign, in May 1995, altered population and store-type definitions and also included improvements in business frame coverage.
Total actual retail sales increased by 5.4 percent to $44.007 billion in the year ended March 2001, compared with $41.749 billion in the previous March year. The most significant increases were recorded by motor vehicle services, up 14.8 percent, other stores (antique and used goods retailing, garden supplies retailing, flower retailing, watch and jewellery retailing, household equipment repairs and other retailing activities not classified elsewhere), up 7.9 percent, and recreational goods, up 7.2 percent. Motor vehicle retailing recorded the largest decrease in annual sales for the year ended March 2001, down 0.6 percent. Furniture and floorcoverings were down 0.2 percent, and accommodation, hotels and liquor down 0.2 percent.
Table 24.7 shows annual sales for retail trade store-types.
Table 24.7. Annual actual retail sales
| Store-type | 1996 | 1997 | 1998 | 1999 | 2000 | 2001 |
|---|---|---|---|---|---|---|
Year ended 31 March. R=revised Source: Retail Trade Survey, Statistics New Zealand | ||||||
| $(million) | ||||||
| Food retailing | 7,878 | 8,253 | 8,672 | 9,086 | 9,534 | 10,061 |
| Footwear | 251 | 235 | 239 | 241 | 242 | 249 |
| Clothing and softgoods | 1,441 | 1,384 | 1,391 | 1,393 | 1,501 | 1,578 |
| Furniture and floor coverings | 957 | 1,001 | 1,044 | 1,071 | 1,134 | 1,136 |
| Appliance retailing | 1,368 | 1,325 | 1,272 | 1,307 | 1,365 | 1,450 |
| Hardware | 732 | 810 | 806 | 756 | 775 | 798 |
| Chemist | 1,073 | 1,103 | 1,254 | 1,211 | 1,274 | 1,311 |
| Department | 1,839 | 1,870 | 1,952 | 2,161 | 2,421 | 2,587 |
| Recreational goods | 1,409 | 1,531 | 1,598 | 1,580 | 1,654 | 1,785 |
| Accommodation, hotels and liquor | 3,372 | 3,487 | 3,524 | 3,573 | 3,641 | 3,634 |
| Cafes, restaurants and takeaways | 2,247 | 2,414 | 2,529 | 2,596 | 2,896 | 3,064 |
| Personal and household services | 964 | 1,020 | 1,065 | 1,079 | 1,172 | 1,213 |
| Other | 2,092 | 2,012 | 2,038 | 2,083 | 2,273 | 2,453 |
| Subtotal | 25,623 | 26,445 | 27,383 | 28,138 | 29,882 | 31,319 |
| Motor vehicle retailing | 7,196 | 6,872 | 6,040 | 5,833 | 6,071 | 6,036 |
| Motor vehicle services | 5,015 | 5,227 | 5,369 | 5,325 | 5,796 | 6,653 |
| All stores total | 37,834 | 38,544 | 38,792 | 39,296 | 41,749 | 44,007 |
| Per head of population by total | 10,301 | 10,337 | 10,286R | 10,344R | 10,934R | 11,465 |
Table 24.8 shows sales by region. Retail sales in the North Island in the year to March 2001 increased by 4.9 percent compared with the March 2000 year. The South Island recorded an increase of 7.1 percent for the same period. Waikato recorded the strongest growth in sales, up 7.4 percent, or $280 million.
Table 24.8. Sales by geographical region1
| North Island | South Island | ||||||||
|---|---|---|---|---|---|---|---|---|---|
| Auckland region | Waikato region | Wellington region | Remainder of North Island | Total North Island | Canterbury region | Remainder of South Island | Total South Inland | Total New Zealand | |
1Comparisons of retail trade regional sales should be made with caution, as shoppers from outside their regional areas also patronise the main city stores and make use of mail order services. Figures are exclusive of GST. Year ended 31 March. Source: Statistics New Zealand | |||||||||
| $(million) | |||||||||
| 1995 | 11,710 | 3,495 | 4,264 | 7,902 | 27,371 | 4,825 | 4,192 | 9,017 | 36,388 |
| 1996 | 12,604 | 3,597 | 4,486 | 8,154 | 28,840 | 4,914 | 4,081 | 8,994 | 37,834 |
| 1997 | 12,807 | 3,600 | 4,591 | 8,362 | 29,361 | 4,945 | 4,238 | 9,183 | 38,544 |
| 1998 | 12,727 | 3,599 | 4,810 | 8,478 | 29,613 | 4,999 | 4,180 | 9,179 | 38,792 |
| 1999 | 12,691R | 3,649 | 4,903 | 8,590 | 29,833R | 5,224 | 4,239 | 9,463 | 39,296 |
| 2000 | 13,670 | 3,789 | 5,151 | 9,006 | 31,617 | 5,667 | 4,464 | 10,132 | 41,749 |
| 2001 | 14,400 | 4,069 | 5,251 | 9,434 | 33,155 | 6,068 | 4,784 | 10,853 | 44,007 |
Statistical series have three components – trend, seasonal and irregular. To allow direct comparison between figures from different periods, seasonality and irregularity can be removed.
Seasonal adjustment aims to eliminate the impact of regular seasonal events such as climatic effects (eg ice cream sales fall in winter) or calendar effects (eg retail sales increase at Christmas). These seasonal effects occur every year and can easily mask the often smaller effects of underlying economic trends. In addition, retail sales are adjusted for trading-day effects.
A trading-day component reflects the variation in the monthly sales totals due to the changing number of times each day of the week occurs in a month.
The trend series also has irregular elements removed. An example of an irregular event would be an increase in the rate of GST. Trend estimates reveal the underlying direction of the movement in retail sales and are likely to indicate turning points (points in time where the underlying direction of the trend can be confirmed) more accurately than seasonally-adjusted or actual series.
The impact of price can also be removed. Price indexes are prepared in such a way as to deflate retail sales figures. The principal source of the prices used in these indexes is the consumers price index. The prices have been appropriately weighted and the whole index expressed in March quarter 1995 prices. This gives a series in constant March 1995 dollars that shows the real change in the volume of retail sales.
Table 24.9 summarises the actual, seasonally-adjusted and constant price series for quarterly retail sales and sales per head of population, while Figure 24.4 illustrates total sales by quarter.
Table 24.9. Retail sales1 summary by quarter
| Total retail sales | Retail sales per head of population | Total value retail stocks | ||||||
|---|---|---|---|---|---|---|---|---|
| Actual | Trend2 | Seasonally adjusted2 | Seasonally adjusted at March 1995 quarter prices2 | Actual | Trend2 | Seasonally adjusted at March 1995 quarter prices2 | Actual | |
1Figures are exclusive of GST. 2. All previously published figures are subject to revision when the seasonal adjustment programme is run each period. R = revised Source: Retail Trade Survey, Statistics New Zealand | ||||||||
| $(million) | ||||||||
| 1998 Sep | 9,432 | 9,734R | 9,734R | 9,611R | 2,485R | 2,565R | 2,533R | 3,441 |
| Dec | 10,700 | 9,872R | 9,868R | 9,731R | 2,814R | 2,597R | 2,560R | 3,540 |
| 1999 Mar | 9,796 | 10,000 | 10,013R | 9,847R | 2,573R | 2,627R | 2,586R | 3,559 |
| Jun | 9,763 | 10,139R | 10,087R | 9,932R | 2,563R | 2,661R | 2,607R | 3,556 |
| Sep | 10,045 | 10,329R | 10,372R | 10,187R | 2,634 | 2,709R | 2,672R | 3,594 |
| Dec | 11,431 | 10,514R | 10,533R | 10,294R | 2,992 | 2,752R | 2,694R | 3,811 |
| 2000 Mar | 10,510 | 10,623R | 10,625R | 10,298R | 2,746 | 2,775R | 2,690R | 3,779 |
| Jun | 10,382 | 10,754R | 10,732R | 10,339R | 2,710 | 2,808R | 2,699R | 3,801 |
| Sep | 10,605 | 915R | 10,943R | 10,346R | 2,766 | 2,847R | 2,699R | 3,915 |
| Dec | 12,003 | 11,071R | 11,057R | 10,312R | 3,126 | 2,883R | 2,686R | 3,944 |
| 2001 Mar | 11,004 | 11,262R | 11,250R | 10,458R | 2,862 | 2,929R | 2,720R | 4,000 |
| Jun | 11,107 | 11,471R | 11,502R | 10,582R | 2,886R | 2,981R | 2,750R | 4,021 |
| Sep | 11,272 | 11,649R | 11,628R | 10,638R | 2,923 | 3,021 | 2,759 | 4,092 |
| Dec | 12,877 | 11,878R | 11,867R | 10,865R | 3,326 | 3,068R | 2,806R | 4,215 |
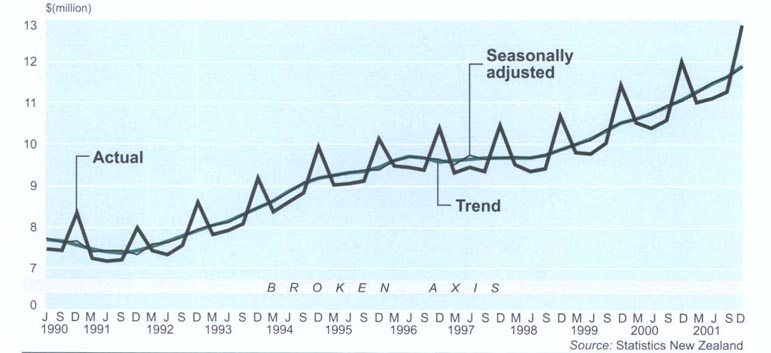
Table 24.10 shows the value of retail stocks by store-type from 1996 to 2001.
Table 24.1. Retail stocks by store-type1
| Store-type | Retail stocks at 31 March | |||||
|---|---|---|---|---|---|---|
| 1996 | 1997 | 1998 | 1999 | 2000 | 2001 | |
1All figures are exclusive of GST. Source: Statistics New Zealand | ||||||
| $(million) | ||||||
| Food retailing | 307 | 294 | 312 | 343 | 351 | 377 |
| Footwear | 72 | 63 | 67 | 58 | 55 | 57 |
| Clothing & softgoods | 309 | 297 | 301 | 279 | 300 | 327 |
| Furniture & floor coverings | 134 | 144 | 156 | 164 | 172 | 174 |
| Appliance retailing | 200 | 195 | 181 | 190 | 205 | 197 |
| Hardware | 175 | 160 | 160 | 153 | 158 | 164 |
| Chemist | 124 | 127 | 129 | 131 | 129 | 132 |
| Department | 386 | 354 | 384 | 393 | 407 | 454 |
| Recreational goods | 288 | 312 | 321 | 337 | 363 | 426 |
| Accommodation, hotels & liquor | 131 | 134 | 134 | 155 | 154 | 149 |
| Cafes, restaurants & takeaways | 40 | 42 | 44 | 49 | 51 | 53 |
| Personal & household services | 34 | 28 | 26 | 28 | 34 | 36 |
| Other | 337 | 320 | 335 | 366 | 378 | 449 |
| Subtotal | 2,537 | 2,468 | 2,551 | 2,646 | 2,757 | 2,995 |
| Motor vehicle retailing | 912 | 893 | 797 | 733 | 840 | 821 |
| Motor vehicle services | 201 | 193 | 177 | 180 | 182 | 195 |
| Total | 3,650 | 3,553 | 3,525 | 3,559 | 3,779 | 4,011 |
Hire-purchase. Instalment credit trading in New Zealand has grown steadily since its introduction. Consumer credit is provided either by retailers or finance companies. A major activity of finance companies is the financing of motor vehicles on hire-purchase. The Hire Purchase Act 1971 is the governing legislation in New Zealand. Regulations to control hire-purchase trade, including limits on minimum deposit and the maximum period of credit, were removed in September 1983. The Credit Contracts Act 1981 reformed the law relating to the provision of credit under contracts of various kinds. Included in the act are provisions which prevent oppressive contracts and ensure disclosure of the cost of credit on a uniform basis.
Credit card sales. The value of purchases using credit cards has risen strongly in recent years, more rapidly than borrowing on credit cards. The increase in credit card purchases has been spurred partly by wider acceptance of the card as a means of payment, for example in supermarkets, and by loyalty schemes, such as the offer of airpoints for spending using a card. The share of the value of total retail sales (excluding sales of cars) made using a credit card as a payment means has doubled in three years to more than a third of the total (see table 24.11).
Figure 24.5 shows the value of personal credit card loans outstanding, and personal credit cards as a percentage of total household credit.
Table 24.11. Value of credit card sales1
| Advances | Billings | Average monthly retail sales (excluding) motor vehicle retailing) | Percentage of retail sales purchased by NZ cardholders in NZ | |||
|---|---|---|---|---|---|---|
| Total outstanding at 31 Dec | NZ cardholders spending in NZ | Overseas cards spending in NZ | Total | |||
1Figures are monthly averages over the complete year (2001 uses forecast retail sales for December). Source: Reserve Bank of New Zealand | ||||||
| Calendar year | $(million) | |||||
| 1998 | 2,067 | 498 | 107 | 606 | 2,762 | 18 |
| 1999 | 2,403 | 656 | 119 | 775 | 2,926 | 22 |
| 2000 | 2,904 | 900 | 142 | 1,042 | 3,121 | 29 |
| 2001 | 3,390 | 1,150 | 165 | 1,315 | 3,317 | 35 |
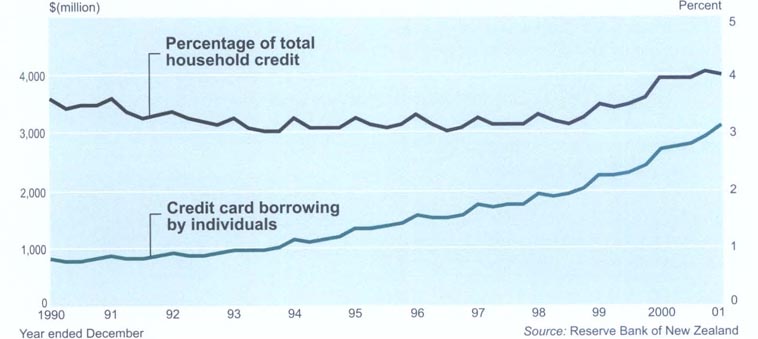
24.1 Commerce Commission; Ministry of Consumer Affairs; Statistics New Zealand; Consumers’ Institute; Department of Labour; Ministry of Justice.
24.2 Ministry of Economic Development; Commerce Commission; Serious Fraud Office; Securities Commission; New Zealand Stock Exchange.
24.3 Insurance Council of New Zealand; Earthquake Commission; Statistics New Zealand; Ministry of Economic Development; Government Superannuation Fund; National Provident Fund.
24.4 Statistics New Zealand; Ministry of Consumer Affairs; Reserve Bank of New Zealand.
Statistics New Zealand divisional manager responsible: Tom Woodhouse.
The Fair Trading Act: A guide for advertisers and traders (1999). Commerce Commission, Wellington.
Report of the Department of Labour, Te Tari Mahi (Parl paper G.1).
Report of the Liquor Licensing Authority (Parl paper E.8).
Personal Property Securities Act 1999.
Current Issues in New Zealand Competition and Consumer Law (1998). Commerce Commission, Wellington.
Report of the Commerce Commission (Parl paper G.34).
Report of the Ministry of Justice (Parl paper E.64).
Report of the Law Commission (Parl paper E.31f).
Report of the Serious Fraud Office (Parl paper E.40).
Annual Report (annual). Board of Trustees of the National Provident Fund, Wellington.
Annual Report (annual). Insurance Council of New Zealand Inc, Wellington.
Annual Report (annual). Insurance and Savings Ombudsman, Wellington.
Report of the Earthquake Commission (Parl paper B. 11).
Report of the Government Superannuation Board (Parl paper B.20).
Report on the New Zealand Fire Service Commission: Adequacy of the arrangements to ensure that the fire service levy is properly and fully paid (1998). Office of the Controller and Auditor-General, Wellington.
Financial Statistics (monthly). Reserve Bank of New Zealand. Wellington.
Key Statistics (monthly). Statistics New Zealand, Wellington.
Reserve Bank of New Zealand Bulletin (quarterly). Reserve Bank of New Zealand, Wellington.
Business Activity Statistics (2001). Statistics New Zealand, Wellington.
www.comcom.govt.nz – Commerce Commission
www.dol.govt.nz – Department of Labour
www.eqc.govt.nz – Earthquake Commission
www.icnz.org.nz – Insurance Council of New Zealand
www.lawcom.govt.nz – Law Commission
www.courts.govt.nz – Liquor Licensing Authority
www.justice.govt.nz – Ministry of Justice
www.fire.org.nz – New Zealand Fire Service Commission
www.oag.govt.nz – Office of the Controller and Auditor-General
www.iombudsman.org.nz – Office of the Insurance and Savings Ombudsman
www.ombudsmen.govt.nz – Office of the Ombudsmen
www.rbnz.govt.nz – Reserve Bank of New Zealand
www.sec-com.govt.nz – Securities Commission
www.sfo.govt.nz – Serious Fraud Office
www.stats.govt.nz – Statistics New Zealand
www.takeovers.govt.nz – Takeovers Panel
Table of Contents
Seafood exports earned New Zealand $1.366 billion in the year ended June 2001.
The New Zealand Trade Development Board (Trade NZ), formerly Tradenz, was established in 1988 to develop New Zealand's foreign exchange earnings by utilising resources invested by the government. Although largely government funded, Trade NZ has a board of directors with a predominantly private-sector background. Funding (from Vote: Ministry of Foreign Affairs and Trade) was $55.8 million for the year to 30 June 2000 ($53.9 million in 1999) and there was client income of $3 million ($2.7 million in 1999). Working through 40 offices overseas and nine in New Zealand, Trade NZ:
Builds New Zealand's commitment to exporting and encourages more companies to export.
Assists companies in market-selection decisions, then helps them enter chosen markets.
Assists existing exporters to further their international business, including, where appropriate, moving beyond direct exporting into business alliances such as joint ventures.
Promotes opportunities for exporters to work in groups which benefit each company.
Supports initiatives to improve the capability and competitiveness of New Zealand companies, including improving investment flows from domestic or foreign sources.
Trade NZ's website is www.tradenz.govt.nz
Services in New Zealand, Trade NZ's offices in Auckland, Hamilton, Tauranga, Napier, Palmerston North, Wellington, Nelson, Christchurch and Dunedin deliver a broad range of services to export companies, or companies preparing to export.
The core service is working with individual companies of all sizes on thorough and comprehensive planning and market research.
Other services include facilitating networking opportunities with other exporters, referrals to sources of finance and potential overseas investors, organising company participation in offshore missions and trade fairs, and educational seminars.
Trade NZ works with groups of companies as well as with individual exporters. Companies can often achieve better and more cost-effective export results through a collective effort on specific projects. This is particularly so for small to medium-sized companies.
To promote the concept of ‘cooperating to compete’, Trade NZ mainly uses export networks and industry groups. Export networks bring together groups of three or more exporters to develop a cohesive approach that targets and maximises specific, clearly identified offshore market opportunities. Industry groups comprise groups of companies who represent a clearly identified New Zealand industry sector. Members of industry groups share a common commitment to address industry export capability issues and strategic approaches to offshore market development.
Services overseas. Trade NZ's overseas staff have in-depth knowledge of local markets and can provide market intelligence, recommend appropriate export market entry and development strategies, identify partners and contacts, investigate competitors, monitor markets, liaise with government officials offshore, undertake market research, and determine regulatory requirements, including tariffs, taxes, product standards and labelling requirements.
Brand New Zealand. Trade NZ, together with the New Zealand Tourism Board, is responsible for developing and implementing a promotional campaign for Brand New Zealand. Supported by New Zealand's leading exporters and tourism operators, this long-term campaign is designed to help achieve a premium positioning overseas for New Zealand and its products and services.
The New Zealand Customs Service is a fully participating member of the World Customs Organisation (WCO), established (as the Customs Cooperation Council) in 1952. The WCO is an intergovernmental organisation of 157 members with headquarters in Brussels. The WCO's functions include:
Promoting cooperation among members on all customs matters.
Examining technical aspects of customs systems and procedures with a view to promoting the highest degree of uniformity, simplification and transparency among members.
Promoting the uniform application and interpretation of conventions and other instruments, and encouraging members to accede to conventions.
Promoting the exchange of information among members.
Cooperating with other intergovernmental agencies on matters within its competence.
The WCO has developed many conventions, declarations and instruments enabling customs services worldwide to enhance trade facilitation and integrity within their administrations. Some of these are:
The Harmonised Commodity and Description Coding System Convention used by 98 percent of countries as the basis for customs duties derived from tariffs, and for the collection of international trade statistics.
The Revised Kyoto Convention – an international instrument for the harmonisation and simplification of customs procedures, aimed at fostering international cooperation and contributing to the facilitation of international trade.
The Nairobi Convention – an agreement promoting mutual assistance for the prevention, investigation and repression of customs offences.
The Arusha Declaration – defining adverse and economic consequences of customs malpractice and seeking to limit corruption and promote integrity.
The WCO also provides technical expertise to the World Trade Organisation (WTO) on certain aspects of international trade impacting on customs, such as the GATT Valuation Agreement, which provides the basis for the customs valuation of goods. Annexes to the agreement establishing the WTO include agreements on pre-shipment inspection and intellectual property rights.
The New Zealand Customs Service provides protection at the border by managing the import and export of goods and the movement of international passengers, aircraft and vessels in accordance with customs, immigration, quarantine and other statutory requirements. Customs seeks to ensure a safe and secure border, with minimum intervention to legitimate trade and travel. To achieve this, the service employs risk management techniques to monitor and assess the risk of arriving and departing persons, craft and goods. Border operations involve checking and clearance of passengers and craft at airports and seaports, surveillance and search for prohibited items, and investigation of customs offences and related items. Underpinning these activities is the collection and processing of intelligence on potential breaches of legislation the customs service enforces.
Overseas merchandise trade statistics measure the value and quantity of New Zealand's merchandise exports to, and imports from, other countries. The statistics are compiled monthly based on entries lodged with the New Zealand Customs Service by exporters, importers and their agents. Table 25.1 provides overseas merchandise trade figures for the 10 years to 2001.
Exports are all material goods which leave New Zealand for other countries and are valued ‘fob’ (free on board). The fob value is the market value of the goods at the New Zealand port of loading. It includes all value added in bringing the goods to the port of loading, but excludes international freight and associated insurance.
Imports are all material goods which enter New Zealand from abroad and are valued ‘cif’ (cost, insurance and freight) and ‘vfd’ (value for duty). The cif value is the market value of the goods at the New Zealand port of unloading. It includes the value added for cost of international freight and associated insurance.
The imports vfd value is the value assessed for duty. It is a close approximation of the fob value at the overseas port of loading.
Unless otherwise stated, all import values quoted in this chapter are cif values. Figure 25.1 plots overseas merchandise trade figures from 1984.
Table 25.1. Overseas merchandise trade1
| Exports (fob) | Imports (cif) | Balance of merchandise trade | |
|---|---|---|---|
1Some statistics may not add to stated totals due to rounding. fob = free on board (the value of goods at New Zealand ports before export; includes reexports.) cif = cost of goods, including insurance and freight to New Zealand Source: Statistics New Zealand | |||
| Year ended June | $(million) | ||
| 1992 | 17,840 | 15,483 | 2,356 |
| 1993 | 18,971 | 17,332 | 1,638 |
| 1994 | 19,827 | 18,468 | 1,358 |
| 1995 | 20,790 | 21,260 | -470 |
| 1996 | 20,545 | 21,352 | -806 |
| 1997 | 21,033 | 21,323 | -290 |
| 1998 | 21,990 | 22,588 | -598 |
| 1999 | 22,600 | 24,248 | -1,648 |
| 2000 | 26,027 | 29,193 | -3,165 |
| 2001 | 31,938 | 31,926 | 11 |
An important analytical result of New Zealand's overseas trade is the ‘balance of merchandise trade’.
This is calculated by deducting the merchandise imports value from the merchandise exports value for the same period.
An excess of exports over imports is a ‘surplus’, which is treated as a positive number. Conversely, an excess of imports over exports is a ‘deficit’, which is treated as a negative number.
In the June 2001 year, New Zealand's balance of merchandise trade was a surplus of $12 million, compared with a deficit of $3.166 billion for the June 2000 year.
Exports are valued fob (free on board), which represents the transaction price of goods, including costs incurred in delivering the goods on board ships and aircraft at New Zealand ports of export.
In this chapter, export values include re-exports, which are goods imported into New Zealand and then exported later without being significantly altered. Typical re-exports are aircraft and heavy machinery.
Exports in the June 2001 year totalled $31.939 billion, 22.7 percent higher than the June 2000 year total of $26.027 billion.
Dairy produce, birds' eggs and honey (as defined in the New Zealand Harmonised Classification system (HS)); and meat and edible offal were New Zealand's two major export commodity categories in the year ended June 2001. See Figure 25.2.
For the year ended June 2001, the largest increases were for the HS categories dairy produce, birds' eggs and honey (up $1.839 billion); miscellaneous and confidential articles (up $954 million mostly due to confidential items); meat and edible offal (up $803 million); albuminoidal substances and glues (up $449 million mostly due to casein and caseinates); and raw hides, skins and leather (up $279 million).
The largest falls were for aircraft and parts (down $464 million); organic chemicals (down $166 million); and paper and paper articles excluding newsprint (down $148 million). See table 25.2.
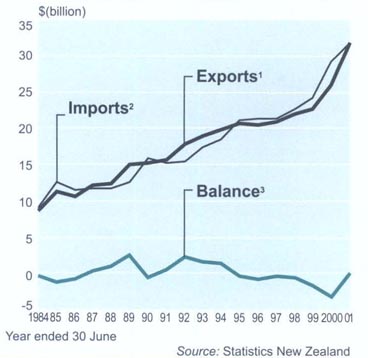
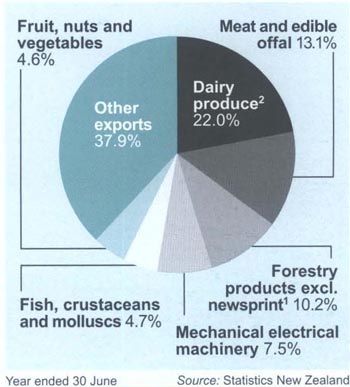
Table 25.2. Commodities by HS category1 exported2,3
| Year ended June | Value of exports | ||||
|---|---|---|---|---|---|
| 1997 | 1998 | 1999 | 2000 | 2001 | |
1HS = New Zealand Harmonised Classification system 1996. 2Exports are valued fob – free on board (the value of goods at New Zealand parts before export). 3Some statistics may not sum to stated totals due to rounding. 4Export values exclude confidential data for the latest 3, 12 or 24 months. 5Data that is no longer confidential is assigned to specific commondities. Source: Statistics New Zealand | |||||
| Commodity | $(million) | ||||
| Live animals | 126 | 140 | 144 | 175 | 151 |
| Meat and edible offal | 2,730 | 2,903 | 2,828 | 3,376 | 4,179 |
| Fish, crustaceans and molluscs | 1,027 | 1,026 | 1,171 | 1,223 | 1,366 |
| Dairy produce, birds' eggs and honey | 3,529 | 3,738 | 3,874 | 3,994 | 5,833 |
| Other animal originated products | 296 | 283 | 274 | 278 | 285 |
| Trees, plants, bulbs and cut flowers4 | 67 | 73 | 75 | 79 | 81 |
| Vegetables4 | 272 | 336 | 390 | 366 | 446 |
| Fruit and nuts | 779 | 894 | 1,063 | 975 | 1,033 |
| Coffee, tea and spices | 1 | 2 | 1 | 2 | 2 |
| Cereals | 3 | 15 | 1 | 3 | 7 |
| Products of the milling industry4 | 19 | 18 | 15 | 9 | 8 |
| Seeds, raw peanuts and soya flour4 | 68 | 77 | 83 | 82 | 75 |
| Lac, gums and resins | 1 | 1 | 1 | 1 | 2 |
| Vegetable plaiting materials | – | – | – | – | – |
| Animal and vegetable fats and oils | 157 | 165 | 166 | 146 | 162 |
| Meat and fish preparations | 122 | 113 | 128 | 156 | 204 |
| Sugars and sugar confectionery | 78 | 80 | 72 | 66 | 72 |
| Cocoa and cocoa preparations | 53 | 52 | 65 | 66 | 83 |
| Preparations of cereals, flour and starch | 92 | 103 | 112 | 117 | 140 |
| Preparations of vegetables, fruit and nuts | 125 | 120 | 97 | 109 | 179 |
| Miscellaneous edible preparations | 114 | 123 | 145 | 191 | 311 |
| Beverages, spirits and vinegar | 131 | 160 | 191 | 271 | 376 |
| Food residues, wastes and fodder | 69 | 75 | 77 | 122 | 190 |
| Tobacco and substitutes | 7 | 7 | 8 | 7 | 8 |
| Salt, earths, stone, lime and cement4 | 37 | 38 | 42 | 37 | 34 |
| Ores, slag and ash | 19 | 26 | 34 | 35 | 30 |
| Mineral fuels4 | 552 | 494 | 442 | 604 | 777 |
| Inorganic chemicals4 | 19 | 17 | 15 | 18 | 15 |
| Organic chemicals4 | 432 | 361 | 274 | 391 | 226 |
| Pharmaceutical products | 84 | 87 | 112 | 134 | 171 |
| Fertilisers | 5 | 7 | 13 | 11 | 7 |
| Tanning extracts, dyes, paints and putty | 29 | 22 | 29 | 33 | 36 |
| Essential oils, perfumes and toiletries | 63 | 52 | 50 | 60 | 60 |
| Soap and organic surface-active agents | 86 | 78 | 90 | 99 | 103 |
| Albuminoidal substances and glues | 672 | 770 | 910 | 993 | 1,442 |
| Explosives, fireworks and matches | 5 | 5 | 4 | 4 | 5 |
| Photographic films, papers and chemicals | 8 | 8 | 11 | 10 | 14 |
| Other chemical products4 | 95 | 114 | 149 | 154 | 149 |
| Plastics and plastic articles | 272 | 291 | 309 | 347 | 407 |
| Rubber and rubber articles | 73 | 90 | 99 | 96 | 106 |
| Raw hides, skins and leather4 | 663 | 602 | 537 | 559 | 838 |
| Articles of leather and animal gut | 17 | 17 | 16 | 17 | 19 |
| Furskins and artificial fur | 85 | 55 | 63 | 54 | 92 |
| Logs, wood and wood articles | 1,566 | 1,435 | 1,496 | 2,018 | 2,219 |
| Cork and cork articles | 7 | 8 | 7 | 5 | 4 |
| Basketware and plaited goods | – | – | – | – | – |
| Wood pulp and waste paper | 357 | 358 | 362 | 544 | 633 |
| Paper and paperboard and articles4 | 413 | 492 | 542 | 637 | 489 |
| Books, newspapers and printed matter | 40 | 40 | 47 | 46 | 66 |
| Silk | – | – | – | – | – |
| Wool and animal hair | 1,043 | 1,021 | 855 | 929 | 1,008 |
| Cotton | 9 | 8 | 7 | 6 | 7 |
| Vegetable textile fibres | – | – | – | 1 | – |
| Synthetic filaments | 2 | 5 | 4 | 4 | 4 |
| Synthetic staple fibres | 6 | 6 | 8 | 8 | 10 |
| Wadding, felt, twine, ropes and cables | 13 | 10 | 13 | 14 | 25 |
| Carpets and other textile floor coverings4 | 80 | 82 | 96 | 106 | 99 |
| Fabrics – woven, tufted, laced or quilted | 8 | 11 | 8 | 10 | 10 |
| Textile fabrics – coated or laminated | 5 | 4 | 4 | 4 | 5 |
| Fabrics – knitted or crocheted | 16 | 20 | 23 | 22 | 25 |
| Apparel – knitted or crocheted | 62 | 69 | 67 | 86 | 96 |
| Apparel – not knitted or crocheted | 83 | 97 | 101 | 114 | 104 |
| Textiles – made up articles | 32 | 30 | 30 | 30 | 47 |
| Footwear | 43 | 43 | 51 | 52 | 53 |
| Headgear | 6 | 8 | 8 | 11 | 12 |
| Umbrellas, walking-sticks and whips | – | – | – | – | 1 |
| Feathers and down and articles | – | – | 1 | 1 | 1 |
| Stone, plaster, concrete and asbestos | 7 | 8 | 11 | 14 | 16 |
| Ceramic products | 3 | 4 | 4 | 5 | 8 |
| Glass and glassware | 31 | 32 | 17 | 36 | 48 |
| Precious metals, jewellery and coins | 266 | 261 | 207 | 240 | 281 |
| Iron and steel4 | 271 | 295 | 278 | 301 | 302 |
| Iron and steel articles4 | 149 | 164 | 179 | 202 | 213 |
| Copper and copper articles | 90 | 95 | 97 | 108 | 98 |
| Nickel and nickel articles | – | – | – | – | – |
| Aluminium and aluminium articles | 811 | 960 | 958 | 1,116 | 1,295 |
| Lead and lead articles | 15 | 16 | 11 | 11 | 10 |
| Zinc and zinc articles | 2 | 1 | 1 | 2 | 3 |
| Tin and tin articles | – | 1 | 1 | 2 | 8 |
| Other metals | – | – | – | – | – |
| Metal tools, implements and cutlery | 52 | 76 | 73 | 77 | 90 |
| Miscellaneous metal products | 48 | 38 | 34 | 47 | 56 |
| Mechanical machinery and equipment | 881 | 1,040 | 1,037 | 1,125 | 1,327 |
| Electrical machinery and equipment | 554 | 669 | 693 | 831 | 1,068 |
| Railway stock and signalling equipment | 3 | 4 | 12 | 8 | 10 |
| Vehicles, parts and accessories | 92 | 116 | 172 | 239 | 310 |
| Aircraft and parts | 251 | 56 | 118 | 535 | 71 |
| Ships, boats and floating structures | 83 | 86 | 114 | 139 | 170 |
| Optical, medical and measuring equipment | 148 | 239 | 285 | 307 | 333 |
| Clocks, watches and parts | 2 | 5 | 5 | 4 | 5 |
| Musical instruments and parts | 1 | 2 | 1 | 1 | 1 |
| Arms, ammunition and parts | 2 | 2 | 2 | 2 | 2 |
| Furniture, furnishings and light fittings | 81 | 93 | 117 | 116 | 151 |
| Toys, games and sports requisites | 30 | 35 | 37 | 38 | 58 |
| Miscellaneous manufactured articles | 15 | 13 | 10 | 10 | 11 |
| Miscellaneous and confidential commodities5 | 274 | 296 | 215 | 394 | 1,347 |
| New Zealand miscellaneous provisions | – | – | – | – | – |
| All merchandise exports | 21,033 | 21,990 | 22,600 | 26,027 | 31,939 |
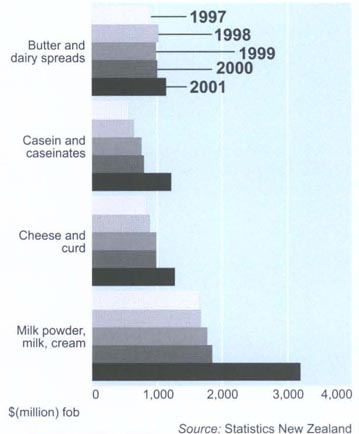
Table 25.3 shows the export value of dairy produce was $7.025 billion in the year ended June 2001, up 47 percent from the previous June year. Dairy produce made up 22 percent of total merchandise export value. Main dairy products exported were milk powder ($3.192 billion), butter ($1.135 billion), cheese ($1.272 billion) and casein and caseinates ($1.213 billion).
New Zealand dairy produce is sold around the world to a wide range of countries (see table 25.4). The main export markets are the United States, Japan, and Malaysia. Exports to Vietnam, Indonesia and Mexico showed strongest growth in the year ended June 2001. Largest falls were to Singapore, Peru and the United Kingdom. The United States was the main export market for casein and caseinates, accounting for 48.5 percent of the total exported. Germany and Japan were the next largest markets. Figure 25.3 shows the value of major dairy produce exports from 1997 to 2001.
Table 25.3. Dairy produce exports1, 2
| Year ended June | |||||
|---|---|---|---|---|---|
| 1997 | 1998 | 1999 | 2000 | 2001 | |
1Exports are valued fob (free on board at New Zealand ports before export; re-exports are included). 2Some statistics may not add to stated totals due to rounding. Source: Statistics New Zealand | |||||
| Product | $(million) | ||||
| Milk powder, milk, cream | 1,655 | 1,682 | 1,771 | 1,857 | 3,192 |
| Buttermilk products, yoghurt | 83 | 91 | 93 | 87 | 160 |
| Whey and other products | 21 | 24 | 24 | 40 | 53 |
| Butter, dairy spreads | 918 | 1,029 | 990 | 1,004 | 1,135 |
| Cheese and curd | 838 | 899 | 983 | 987 | 1,272 |
| Casein and caseinates | 569 | 652 | 763 | 803 | 1,213 |
| Total dairy produce exports | 4,085 | 4,376 | 4,625 | 4,778 | 7,025 |
| Percentage contribution to total exports | 19.4 | 19.9 | 20.5 | 18.4 | 22.0 |
Table 25.4. Destination of dairy produce exports1, 2
| Year ended June | |||||
|---|---|---|---|---|---|
| 1997 | 1998 | 1999 | 2000 | 2001 | |
1Exports are valued fob (free on hoard at New Zealand ports before export: re-exports are included). 2Some statistics may not add to staled totals due to rounding. Source: Statistics New Zealand | |||||
| Country | $(million) | ||||
| United States | 401 | 496 | 635 | 714 | 864 |
| Japan | 346 | 348 | 388 | 367 | 489 |
| Malaysia | 255 | 222 | 245 | 272 | 378 |
| Philippines | 181 | 191 | 192 | 198 | 337 |
| Indonesia | 102 | 77 | 84 | 139 | 335 |
| Mexico | 141 | 194 | 195 | 136 | 320 |
| Australia | 137 | 149 | 185 | 221 | 275 |
| Vietnam | 17 | 18 | 79 | 64 | 267 |
| Taiwan | 165 | 173 | 175 | 188 | 264 |
| United Kingdom | 391 | 367 | 281 | 265 | 245 |
| Belgium | 131 | 179 | 204 | 152 | 227 |
| Thailand | 120 | 114 | 117 | 119 | 214 |
| Venezuela | 82 | 141 | 104 | 103 | 211 |
| Saudi Arabia | 98 | 109 | 113 | 123 | 189 |
| Hong Kong (Special Administrative Region) | 66 | 52 | 38 | 142 | 180 |
| China, People's Republic of | 56 | 109 | 128 | 100 | 168 |
| Sri Lanka | 88 | 105 | 113 | 108 | 166 |
| Germany | 72 | 95 | 87 | 88 | 153 |
| Canada | 40 | 38 | 29 | 48 | 131 |
| Egypt | 43 | 55 | 115 | 91 | 121 |
| Other countries | 1,151 | 1,143 | 1,120 | 1,140 | 1,492 |
| Total dairy produce exports | 4,085 | 4,376 | 4,625 | 4,778 | 7,025 |
In the year ended June 2001, the value of exports of meat and edible offal rose 23.8 percent to $4.179 billion, 13.1 percent of total merchandise exports. This followed a 19.4 percent rise in the June 2000 year. Main contributors to the increase in meat and edible offal exports were sheep meat exports, which rose by 25.2 percent ($428 million), and beef exports, which rose 19.4 percent ($273 million). See table 25.5. Destinations of exports are provided in table 25.6.
The United States, at $1.220 billion, was the main export market for meat and edible offal. This was an increase of 12.9 percent ($140 million) on the previous June year. Exports to the United Kingdom and Germany, the next largest markets, rose 15.6 percent ($73 million) and 39.5 percent ($119 million) respectively. Increases were recorded for Canada (up $162 million), France (up $79 million) and Japan (up $38 million), while decreases were recorded for Spain (down $5.3 million), Algeria (down $4.2 million) and Australia (down $4.2 million). The main Asian markets were Japan at $199 million, Taiwan at $102 million and Hong Kong (Special Administrative Region) at $64 million.
Table 25.5. Meat and edible offal exports1, 2
| Year ended June | |||||
|---|---|---|---|---|---|
| 1997 | 1998 | 1999 | 2000 | 2001 | |
1Experts are valued fob (free on board at New Zealand ports before export; re-exports ore included). 2Some statistics may not add to stated totals due to rounding. Source: Statistics New Zealand | |||||
| Product | $(million) | ||||
| Beef | 992 | 1,175 | 1,087 | 1,403 | 1,676 |
| Pig | 0 | 0 | 0 | 1 | 2 |
| Sheep | 1,503 | 1,486 | 1,504 | 1,697 | 2,125 |
| Goat | 6 | 6 | 6 | 6 | 6 |
| Venison | 137 | 137 | 138 | 157 | 230 |
| Offal | 85 | 93 | 89 | 110 | 136 |
| Poultry | 1 | 0 | 0 | 0 | 1 |
| Other | 6 | 5 | 4 | 3 | 3 |
| Total meat and edible offal exports | 2,730 | 2,903 | 2,828 | 3,376 | 4,179 |
| Percentage contribution to merchandise exports | 13.0 | 13.2 | 12.5 | 13.0 | 13.1 |
Table 25.6. Destination of meat and edible offal exports1, 2
| Year ended June | |||||
|---|---|---|---|---|---|
| 1997 | 1998 | 1999 | 2000 | 2001 | |
1Exports are valued fob (free on hoard at New Zealand ports be/ore export; re-exports are included). 2Some statistics may not add to stated totals due to rounding. Source: Statistics New Zealand | |||||
| Country | $(million) | ||||
| United States | 570 | 799 | 782 | 1.080 | 1,220 |
| United Kingdom | 504 | 446 | 439 | 468 | 541 |
| Germany | 256 | 272 | 273 | 301 | 420 |
| Canada | 147 | 120 | 131 | 116 | 278 |
| France | 119 | 100 | 110 | 150 | 229 |
| Japan | 163 | 172 | 159 | 160 | 199 |
| Belgium | 88 | 162 | 153 | 168 | 175 |
| Taiwan | 69 | 74 | 87 | 101 | 102 |
| Saudi Arabia | 64 | 50 | 56 | 66 | 82 |
| Mexico | 8 | 10 | 15 | 28 | 77 |
| Hong Kong (Special Administrative Region) | 42 | 56 | 50 | 56 | 64 |
| Malaysia | 47 | 32 | 32 | 46 | 57 |
| Switzerland | 46 | 33 | 30 | 54 | 55 |
| Italy | 42 | 40 | 35 | 38 | 52 |
| Korea, Republic of | 48 | 32 | 28 | 49 | 46 |
| Netherlands | 42 | 51 | 35 | 44 | 45 |
| Greece | 36 | 32 | 25 | 32 | 40 |
| China, People's Republic of | 9 | 9 | 14 | 18 | 38 |
| French Polynesia | 24 | 25 | 28 | 33 | 37 |
| Singapore | 27 | 52 | 38 | 29 | 31 |
| Other countries | 379 | 336 | 306 | 339 | 391 |
| Total meat and edible offal exports | 2,730 | 2,903 | 2,828 | 3,376 | 4,179 |
Forest product exports excluding newsprint in the year ended June 2001 totalled $3.270 billion, an increase of 10.8 percent ($319 million) on the previous June year. Main contributors to this increase were a rise of 16.5 percent ($90 million) in exports of wood pulp, a rise of 19.2 percent ($83 million) in exports of board (fibre, veneer, plywood) and a rise of 12.1 percent ($79 million) in exports of wood (rough). The main type of forest product exported was sawn wood ($770 million). See table 25.7. The destination of forestry product exports is shown in table 25.8. Figure 25.4 shows the destination of forest product exports from 1997 to 2001.
Table 25.7. Forest product exports1, 2
| Year ended June | |||||
|---|---|---|---|---|---|
| 1997 | 1998 | 1999 | 2000 | 2001 | |
1Exports are valued fob (free on board at New Zealand ports before export; re-exports are included). 2Some statistics may not add to stated totals due to rounding. 3Full trade year data unavailable for 2001 due to the value of exports of newsprint being confidential for 12 months. Source: Statistics New Zealand | |||||
| Product | $(million) | ||||
| Wood (sawn) | 407 | 479 | 558 | 734 | 770 |
| Wood (rough) | 675 | 516 | 465 | 653 | 733 |
| Wood pulp, etc | 357 | 358 | 362 | 544 | 633 |
| Board (fibre, veneer, plywood) | 354 | 308 | 331 | 434 | 517 |
| Paper and paperboard excluding newsprint | 208 | 255 | 302 | 390 | 418 |
| Other | 129 | 132 | 142 | 197 | 200 |
| Total forestry products excluding newsprint | 2,130 | 2,047 | 2,159 | 2,951 | 3,270 |
| Percentage contribution to total exports | 10.1 | 9.3 | 9.6 | 11.3 | 10.2 |
| $(million) | |||||
| Newsprint3 | 205 | 238 | 240 | 247 | n/a |
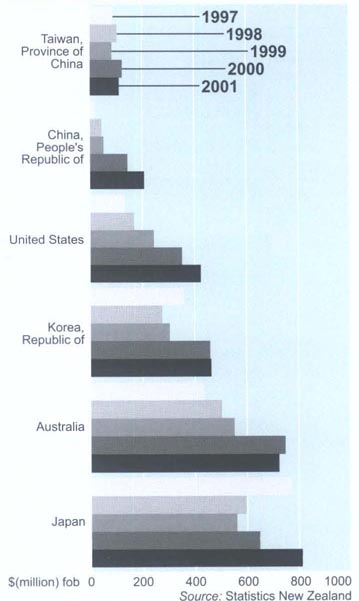
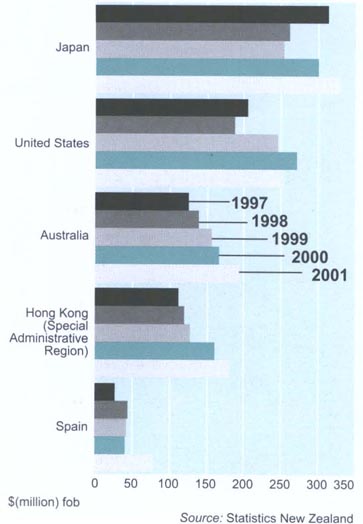
Table 25.8. Destination of forest product exports1, 2
| Year ended June | |||||
|---|---|---|---|---|---|
| 1997 | 1998 | 1999 | 2000 | 2001 | |
1Exports are valued fob (free on board at Sew Zealand ports before export; re-exports are included). 2Some statistics may not add to stated totals due to rounding. Source: Statistics New Zealand | |||||
| Country | $(million) | ||||
| Japan | 771 | 598 | 561 | 648 | 812 |
| Australia | 436 | 506 | 552 | 747 | 722 |
| Korea, Republic of | 359 | 277 | 302 | 459 | 463 |
| United States | 135 | 169 | 244 | 352 | 426 |
| China, People's Republic of | 20 | 42 | 54 | 145 | 208 |
| Taiwan | 89 | 106 | 82 | 122 | 111 |
| Indonesia | 79 | 62 | 54 | 86 | 98 |
| Philippines | 51 | 47 | 34 | 61 | 79 |
| Hong Kong (Special Administrative Region) | 47 | 71 | 66 | 67 | 71 |
| Malaysia | 33 | 32 | 33 | 48 | 49 |
| India | 11 | 21 | 31 | 24 | 41 |
| Thailand | 28 | 21 | 22 | 43 | 38 |
| Vietnam | 4 | 10 | 8 | 13 | 27 |
| Fiji | 11 | 13 | 11 | 19 | 20 |
| Singapore | 15 | 20 | 24 | 32 | 18 |
| United Arab Emirates | 0 | 2 | 14 | 11 | 8 |
| Samoa, Western | 5 | 5 | 5 | 6 | 8 |
| Samoa, American | 1 | 1 | 1 | 1 | 6 |
| New Caledonia | 9 | 8 | 8 | 8 | 6 |
| Tonga | 3 | 4 | 3 | 5 | 5 |
| Other | 25 | 33 | 49 | 51 | 53 |
| Total forestry products exports | 2,130 | 2,047 | 2,159 | 2,951 | 3,270 |
Exports of fish, crustaceans and molluscs, including extracts and preparations, were valued at $1.492 billion in the year ended June 2001, up 12.6 percent ($168 million) from the previous June year. Excluding extracts and preparations, the export value of fish, crustaceans and molluscs was $1.366 billion, up 11.7 percent ($143 million) from the previous June year.
Main contributors to the overall rise were fish fillets and other fish meat, up by $50 million to $535 million. and molluscs and other aquatic invertebrates, up by $45 million to $249 million. See table 25.9.
Exports of fish, crustaceans and molluscs to Spain rose by 90.1 percent ($37 million), contributing 22.1 percent of the export rise in the June 2001 year. See Figure 25.5.
Exports to Japan rose by 10.1 percent ($30 million) and contributed 18.1 percent of the export rise.
Japan was the main export market, taking 22.1 percent of New Zealand's fish, crustacean and mollusc exports in the year ended June 2001, while the United States, taking 16.9 percent, was the next biggest market. See table 25.10.
Table 25.9. Fish, crustacean and mollusc exports1, 2
| Year ended June | |||||
|---|---|---|---|---|---|
| 1997 | 1998 | 1999 | 2000 | 2001 | |
1Exports arc valued fob (free on board at Sew Zealand ports before export: re-exports are included). 2Some statistics may not add to stated totals due to rounding. Source: Statistics New Zealand | |||||
| Product | $(million) | ||||
| Fish, live | 2 | 1 | 3 | 3 | 4 |
| Fish, fresh or chilled | 67 | 73 | 75 | 85 | 92 |
| Fish, frozen | 247 | 237 | 261 | 280 | 321 |
| Fish fillets and other fish meat | 375 | 396 | 490 | 485 | 535 |
| Fish and edible fish meal, dried, salted or smoked | 11 | 11 | 12 | 14 | 17 |
| Crustaceans | 134 | 126 | 115 | 152 | 149 |
| Molluscs and other aquatic invertebrates | 191 | 182 | 214 | 204 | 249 |
| Fish, crustaceans and molluscs | 1,027 | 1,026 | 1,171 | 1,223 | 1,366 |
| Extracts and juices of fish, crustaceans and molluscs | 0 | 0 | 0 | 0 | 0 |
| Prepared or preserved fish (including fish eggs) | 21 | 25 | 29 | 34 | 40 |
| Prepared or preserved crustaceans | 0 | 0 | 0 | 0 | 0 |
| Prepared or preserved molluscs | 56 | 56 | 53 | 67 | 86 |
| Total fish, crustacean and mollusc exports, including extracts and preparations | 1,104 | 1,107 | 1,253 | 1,325 | 1,492 |
| Percentage contribution to merchandise exports | 5.3 | 5.0 | 5.5 | 5.1 | 4.7 |
Table 25.1. Destination of fish, crustacean and mollusc exports1, 2
| Year ended June | |||||
|---|---|---|---|---|---|
| 1997 | 1998 | 1999 | 2000 | 2001 | |
1Exports are valued fob (free on board at New Zealand ports before export; re-exports are included). 2Same statistics may not add to slated totals doe to rounding. Source: Statistics New Zealand | |||||
| Country | $(million) | ||||
| Japan | 313 | 261 | 254 | 299 | 329 |
| United States | 205 | 188 | 246 | 271 | 253 |
| Australia | 126 | 140 | 157 | 166 | 193 |
| Hong Kong (Special Administrative Region) | 113 | 119 | 128 | 160 | 180 |
| Spain | 27 | 45 | 42 | 41 | 78 |
| Korea, Republic of | 47 | 26 | 39 | 33 | 48 |
| Germany | 10 | 18 | 62 | 47 | 46 |
| France | 18 | 25 | 41 | 44 | 44 |
| Singapore | 31 | 30 | 23 | 35 | 43 |
| China, People's Republic of | 40 | 48 | 44 | 22 | 42 |
| United Kingdom | 13 | 14 | 28 | 21 | 30 |
| Taiwan, | 45 | 31 | 21 | 30 | 24 |
| Italy | 14 | 12 | 12 | 13 | 22 |
| Netherlands | 8 | 20 | 15 | 11 | 21 |
| Malaysia | 12 | 14 | 12 | 14 | 21 |
| Thailand | 14 | 21 | 22 | 23 | 17 |
| Canada | 9 | 8 | 10 | 13 | 15 |
| Greece | 4 | 12 | 13 | 13 | 12 |
| Belgium | 6 | 12 | 24 | 13 | 12 |
| Portugal | 5 | 9 | 13 | 4 | 7 |
| Other countries | 43 | 54 | 45 | 50 | 54 |
| Total fish, crustaceans and molluscs exports | 1,104 | 1,107 | 1,253 | 1,325 | 1,492 |
Table 25.11 shows fruit, nut and vegetable exports were valued at $1.479 billion in the year ended June 2001, up 10.3 percent ($137 million) from the previous June year. Kiwifruit was the main contributor to the increase, rising by 26.7 percent ($123 million) to $586 million.
Other contributors to the increase included legumes, up $24 million to $121 million, and alliaceous vegetables (eg onions), which increased $19 million to $101 million.
Partly offsetting these rises was a decrease in the value of apples exported, down $65 million to $339 million.
The two largest contributors to fruit, nut and vegetable exports in the year ended June 2000 were kiwifruit and apples, which respectively contributed 39.6 and 22.9 percent. See Figure 25.6.
In the year ended June 2001, the main destinations for New Zealand's fruit, nuts and vegetable exports were Japan, which took $366 million worth, up 13.9 percent ($45 million) on the previous year, the United States, at $149 million up 2.2 percent ($3 million), and the United Kingdom, at $129 million down 18.1 percent ($28 million). See table 25.12.
A significant proportion of New Zealand's fruit, nut and vegetable exports are sold on consignment and classified to Destination unknown – EU (European Union). In the June 2001 year, $293 million was classified as Destination unknown – EU, up 12 percent ($31 million). Spain and Germany emerged as important markets in the five years leading up to the June 2001 year.
Table 25.11. Fruit, nut and vegetable exports1, 2
| Year ended June | |||||
|---|---|---|---|---|---|
| 1997 | 1998 | 1999 | 2000 | 2001 | |
1Exports are valued fob (free an board at New Zealand ports before export; re-exports are included). 2Same statistics may not add to stated totals due to rounding. Source: Statistics New Zealand | |||||
| Product | $(million) | ||||
| Kiwifruit | 377 | 429 | 474 | 462 | 586 |
| Apples | 338 | 382 | 489 | 405 | 339 |
| Legumes | 81 | 80 | 105 | 96 | 121 |
| Onions, shallots, garlic, leeks etc | 54 | 102 | 106 | 82 | 101 |
| Squash & gourds | 56 | 57 | 61 | 60 | 71 |
| Corn | 38 | 38 | 46 | 47 | 63 |
| Berry fruit | 20 | 25 | 30 | 29 | 33 |
| Avocados | 9 | 14 | 19 | 25 | 26 |
| Capsicum | 5 | 11 | 10 | 15 | 23 |
| Carrots and other edible roots | 7 | 11 | 16 | 23 | 21 |
| Other fruit, nuts and vegetables | 64 | 8J | 97 | 96 | 96 |
| Total fruit and nuts and vegetables | 1,050 | 1,230 | 1,453 | 1,341 | 1,479 |
| Percentage contribution to merchandise exports | 5.0 | 5.6 | 6.4 | 5.2 | 4.6 |

Kiwifruit exports were worth $586 million to New Zealand in the year ending June 2001.
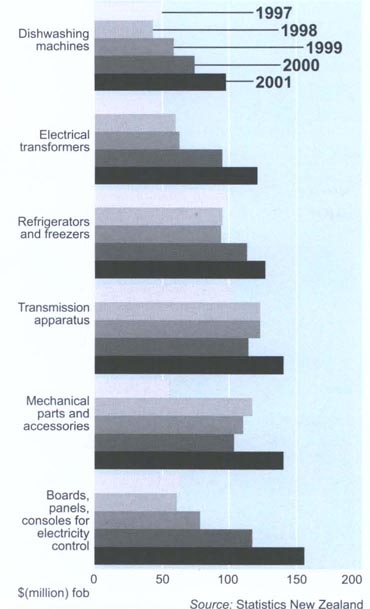
Table 25.12. Destination of fruit, nut and vegetable exports1, 2
| Year ended June | |||||
|---|---|---|---|---|---|
| 1997 | 1998 | 1999 | 2000 | 2001 | |
1Exports are valued fob (free on board at New Zealand ports before export; re-exports are included). 2Same statistics may not add to stated totals due to rounding. Source: Statistics New Zealand | |||||
| Country | $(million) | ||||
| Japan | 245 | 277 | 294 | 321 | 366 |
| Destination unknown – EU | 291 | 347 | 361 | 261 | 293 |
| United States | 82 | 107 | 138 | 146 | 149 |
| United Kingdom | 101 | 99 | 182 | 158 | 129 |
| Australia | 71 | 74 | 89 | 88 | 127 |
| Taiwan | 33 | 49 | 48 | 50 | 56 |
| Spain | 5 | 8 | 30 | 57 | 48 |
| Hong Kong (Special Administrative Region) | 38 | 40 | 37 | 39 | 42 |
| Malaysia | 21 | 22 | 28 | 30 | 33 |
| Germany | 12 | 26 | 41 | 20 | 32 |
| Other countries | 151 | 182 | 206 | 172 | 204 |
| Total fruit, nut and vegetable exports | 1,050 | 1,230 | 1,453 | 1,341 | 1,479 |
New Zealand's machinery exports totalled $2.396 billion in the year ended June 2001. This was an increase of 22.5 percent ($440 million) on the previous June year. The main types of machinery exported were boards, panels and consoles for electricity control ($156 million), mechanical parts and accessories ($141 million), transmission apparatus ($141 million) and refrigerators and freezers ($127 million). See table 25.13, Figure 25.7 shows the value of machinery exports from 1997 to 2001.
Destinations of mechanical and electrical machinery exports are shown in table 25.14. In the year ended June 2001, Australia ($941 million) and the United States ($476 million) were New Zealand's two main destinations for machinery exports, showing an increase of 5.3 percent and 47.7 percent respectively. These two countries accounted for 59.1 percent of total machinery exports for the year. The United Kingdom, the third main destination for machinery exports, showed a 13.6 percent increase to $119 million in the June 2001 year.
Table 25.13. Mechanical and electrical machinery exports1, 2
| Year ended June | |||||
|---|---|---|---|---|---|
| 1997 | 1998 | 1999 | 2000 | 2001 | |
1Exports are valued fob (free on board at New Zealand ports before export; re-exports are included). 2Some statistics may not add to stated totals due to rounding. nes = not elsewhere specified Source: Statistics New Zealand | |||||
| Product | $(million) | ||||
| Boards, panels and consoles for electricity control | 63 | 61 | 79 | 117 | 156 |
| Mechanical parts and accessories | 55 | 117 | 111 | 104 | 141 |
| Transmission apparatus | 102 | 124 | 123 | 114 | 141 |
| Refrigerators and freezers | 98 | 95 | 94 | 114 | 127 |
| Electrical transformers | 50 | 60 | 63 | 96 | 122 |
| Dish washing machines | 50 | 44 | 60 | 75 | 98 |
| Electrical machines nes having individual functions 40 | 55 | 55 | 75 | 93 | |
| Automatic data processing machines (computers) | 35 | 39 | 39 | 42 | 73 |
| Insulated wire and cable | 35 | 47 | 56 | 49 | 64 |
| Transmission apparatus parts | 26 | 31 | 38 | 61 | 63 |
| Other | 881 | 1,034 | 1,015 | 1,110 | 1,319 |
| Total mechanical and electrical machinery exports | 1,435 | 1,708 | 1,730 | 1,956 | 2,396 |
| Percentage contribution to merchandise exports | 6.8 | 7.8 | 7.6 | 7.5 | 7.5 |
Table 25.14. Destination of mechanical and electrical machinery exports1, 2
| Year ended June | |||||
|---|---|---|---|---|---|
| 1997 | 1998 | 1999 | 2000 | 2001 | |
1Exports are valued Job (free on board at New Zealand ports before export; re-exports are included). 2Some statistics may not add to stated totals due to rounding. Source: Statistics New Zealand | |||||
| Country | $(million) | ||||
| Australia | 686 | 787 | 803 | 894 | 941 |
| United States | 147 | 221 | 241 | 322 | 476 |
| United Kingdom | 60 | 88 | 108 | 105 | 119 |
| Hong Kong (Special Administrative Region) | 55 | 79 | 63 | 62 | 98 |
| Singapore | 40 | 64 | 55 | 52 | 86 |
| Japan | 21 | 22 | 19 | 34 | 56 |
| Taiwan | 11 | 24 | 24 | 27 | 42 |
| Canada | 16 | 23 | 33 | 34 | 41 |
| Germany | 25 | 23 | 20 | 33 | 38 |
| China, People's Republic of | 20 | 10 | 16 | 15 | 34 |
| Fiji | 35 | 31 | 36 | 34 | 30 |
| Malaysia | 31 | 27 | 15 | 15 | 30 |
| Samoa, Western | 10 | 12 | 19 | 22 | 23 |
| South Africa | 25 | 34 | 17 | 20 | 21 |
| Netherlands | 10 | 12 | 16 | 13 | 19 |
| Brazil | 7 | 9 | 11 | 25 | 19 |
| Chile | 12 | 11 | 5 | 9 | 19 |
| Denmark | 2 | 5 | 5 | 5 | 17 |
| Iran | 0 | 0 | 0 | 0 | 16 |
| Mexico | 0 | 1 | 4 | 3 | 15 |
| Other countries | 222 | 228 | 218 | 233 | 257 |
| Total mechanical and electrical machinery exports | 1,435 | 1,708 | 1,730 | 1,956 | 2,396 |
Table 25.15 provides the value of commodities imported to New Zealand between 1997 and 2001. Imports referred to in this chapter are valued at cif (cost, insurance and freight), which is the cost of buying the goods and bringing them to a New Zealand port. Statistics on imports valued at vfd (value for duty) are also available. This is the value used to assess customs duty and excludes insurance and freight to New Zealand. The vfd level equates approximately with the fob (free on board) value used for exports.
Imports are valued in New Zealand dollars. Foreign currency values are converted to New Zealand dollars when import documents are processed by the New Zealand Customs Service. Customs sets the exchange rates used for conversions each fortnight.
Imports for the year ended June 2001 were valued at $31.927 billion cif, an increase of 9.4 percent ($2.734 billion) on the previous June year. Figure 25.8 shows major commodity imports by percentage.
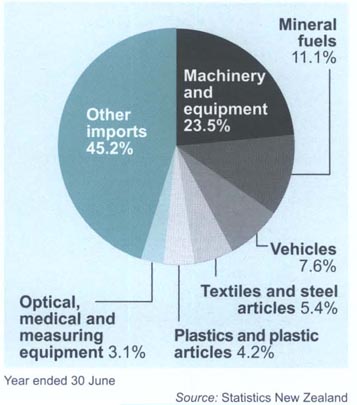
Vehicle imports into New Zealand in the June 2001 year were valued at $2.415 billion.
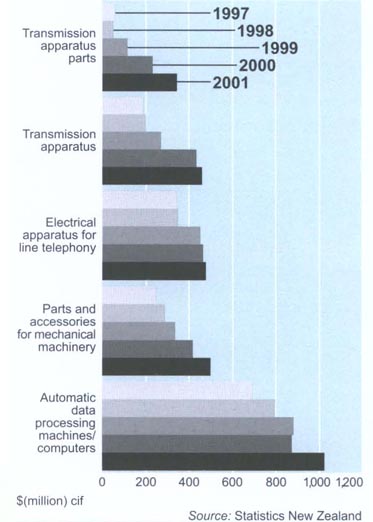
Table 25.15. Commodities by HS category1 imported2, 3
| Year ended June | |||||
|---|---|---|---|---|---|
| 1997 | 1998 | 1999 | 2000 | 2001 | |
1HS = New Zealand Harmonised Classification system 1996. 2Imports are valued cif least including insurance and freight). 3Figures are calculated on unrounded data. 4Import values exclude confidential data far the latest 6 or 12 months. 5Data that is no longer confidential is assigned to specific commodities. Source: Statistics New Zealand | |||||
| Commodity | $(million) | ||||
| Live animals | 35 | 35 | 49 | 66 | 66 |
| Meat and edible offal | 43 | 42 | 53 | 74 | 100 |
| Fish, crustaceans and molluscs | 24 | 20 | 29 | 48 | 64 |
| Dairy produce, birds' eggs and honey | 26 | 31 | 25 | 35 | 40 |
| Other animal originated products | 26 | 32 | 23 | 25 | 50 |
| Trees, plants, bulbs and cut flowers | 8 | 8 | 9 | 11 | |
| Vegetables | 43 | 44 | 51 | 57 | 64 |
| Fruit and nuts | 165 | 174 | 185 | 195 | 219 |
| Coffee, tea and spices4 | 61 | 81 | 78 | 66 | 70 |
| Cereals | 101 | 79 | 96 | 113 | 116 |
| Products of the milling industry | 21 | 25 | 24 | 26 | 32 |
| Seeds, raw peanuts and soya flour | 55 | 41 | 52 | 51 | 58 |
| Lac, gums and resins | 10 | 11 | 10 | 13 | 15 |
| Vegetable plaiting materials | 2 | 2 | 2 | 2 | 2 |
| Animal and vegetable fats and oils | 112 | 113 | 132 | 129 | 125 |
| Meat and fish preparations | 52 | 65 | 72 | 86 | |
| Sugars and sugar confectionery | 150 | 148 | 147 | 137 | 217 |
| Cocoa and cocoa preparations | 71 | 83 | 101 | 93 | 104 |
| Preparations of cereals, flour and starch | 128 | 165 | 181 | 192 | 200 |
| Preparations of vegetables, fruit and nuts | 103 | 111 | 140 | 146 | 161 |
| Miscellaneous edible preparations | 205 | 212 | 234 | 310 | 333 |
| Beverages, spirits and vinegar | 183 | 222 | 241 | 281 | 336 |
| Food residues, wastes and fodder | 87 | 109 | 106 | 118 | 126 |
| Tobacco and substitutes | 36 | 37 | 37 | 37 | 41 |
| Salt, earths, stone, lime and cement | 138 | 164 | 161 | 191 | 246 |
| Ores, slag and ash | 2 | 2 | 2 | 2 | 3 |
| Mineral fuels4 | 1,439 | 1,368 | 1,378 | 2,319 | 3,545 |
| Inorganic chemicals4 | 394 | 446 | 427 | 476 | 551 |
| Organic chemicals4 | 272 | 287 | 302 | 337 | 391 |
| Pharmaceutical products | 545 | 622 | 682 | 724 | 781 |
| Fertilisers | 190 | 194 | 219 | 229 | 336 |
| Tanning extracts, dyes, paints and putty | 160 | 185 | 231 | 275 | 303 |
| Essential oils, perfumes and toiletries | 189 | 230 | 261 | 296 | 342 |
| Soap and organic surface-active agents4 | 108 | 116 | 130 | 145 | 161 |
| Albuminoidal substances and glues | 44 | 52 | 61 | 66 | 65 |
| Explosives, fireworks and matches | 11 | 10 | 14 | 11 | 14 |
| Photographic films, papers and chemicals | 138 | 145 | 145 | 162 | 172 |
| Other chemical products | 281 | 283 | 354 | 359 | 388 |
| Plastics and plastic articles4 | 916 | 968 | 996 | 1,191 | 1,337 |
| Rubber and rubber articles | 275 | 288 | 313 | 335 | 380 |
| Raw hides, skins and leather | 42 | 38 | 45 | 39 | 55 |
| Articles of leather and animal gut | 69 | 75 | 79 | 94 | 111 |
| Furskins and artificial fur | 6 | 6 | 8 | 6 | 8 |
| Logs, wood and wood articles | 102 | 113 | 117 | 142 | 146 |
| Cork and cork articles | 12 | 13 | 17 | 18 | 18 |
| Basketware and plaited goods | 4 | 5 | 5 | 5 | 6 |
| Wood pulp and waste paper | 12 | 9 | 19 | 8 | II |
| Paper and paperboard and articles | 637 | 667 | 739 | 833 | 910 |
| Books, newspapers and printed matter | 335 | 350 | 387 | 407 | 423 |
| Silk | 3 | 4 | 3 | 4 | 5 |
| Wool and animal hair | 30 | 32 | 34 | 40 | 49 |
| Cotton | 95 | 92 | 89 | 92 | 89 |
| Vegetable textile fibres | 16 | 13 | 12 | 13 | 12 |
| Synthetic filaments | 82 | 89 | 91 | 99 | 102 |
| Synthetic staple fibres | 110 | 120 | 117 | 130 | 135 |
| Wadding, felt, twine, ropes and cables | 51 | 49 | 58 | 61 | 62 |
| Carpets and other textile floor coverings | 51 | 55 | 62 | 65 | 65 |
| Fabrics – woven, tufted, laced or quilted | 22 | 25 | 25 | 29 | 33 |
| Textile fabrics – coated or laminated | 59 | 64 | 67 | 77 | 73 |
| Fabrics – knitted or crocheted | 48 | 56 | 45 | 42 | 48 |
| Apparel – knitted or crocheted | 252 | 302 | 307 | 377 | 432 |
| Apparel – not knitted or crocheted | 261 | 317 | 330 | 394 | 448 |
| Textiles – made up articles | 120 | 130 | 132 | 159 | 185 |
| Footwear | 174 | 174 | 193 | 221 | 249 |
| Headgear | 16 | 18 | 18 | 22 | 25 |
| Umbrellas, walking-sticks and whips | 5 | 6 | 6 | 8 | 8 |
| Feathers and down and articles | 4 | 5 | 5 | 5 | 7 |
| Stone, plaster, concrete and asbestos | 66 | 69 | 79 | 89 | 89 |
| Ceramic products | 113 | 125 | 120 | 132 | 143 |
| Glass and glassware | 151 | 159 | 155 | 203 | 214 |
| Precious metals, jewellery and coins | 89 | 93 | 105 | 122 | 127 |
| Iron and steel4 | 389 | 368 | 370 | 462 | 477 |
| Iron and steel articles4 | 351 | 371 | 352 | 402 | 448 |
| Copper and copper articles | 106 | 110 | 100 | 126 | 150 |
| Nickel and nickel articles | 2 | 3 | 3 | 3 | 4 |
| Aluminium and aluminium articles | 214 | 220 | 254 | 279 | 286 |
| Lead and lead articles | 9 | 6 | 7 | 3 | 3 |
| Zinc and zinc articles4 | 33 | 39 | 38 | 43 | 50 |
| Tin and tin articles | 2 | 5 | 5 | 3 | 4 |
| Other metals | 6 | 6 | 5 | 6 | 7 |
| Metal tools, implements and cutlery | 130 | 142 | 152 | 167 | 185 |
| Miscellaneous metal products | 89 | 100 | 106 | 115 | 113 |
| Mechanical machinery and equipment | 3,262 | 3,548 | 3,445 | 3,807 | 4,111 |
| Electrical machinery and equipment4 | 2,206 | 2,323 | 2,525 | 2,938 | 3,380 |
| Railway stock and signalling equipment | 11 | 20 | 16 | 8 | 10 |
| Vehicles, parts and accessories | 2,700 | 2,303 | 2,984 | 3,594 | 3,667 |
| Aircraft and parts | 306 | 384 | 801 | 1,503 | 884 |
| Ships, boats and floating structures | 306 | 670 | 362 | 694 | 246 |
| Optical, medical and measuring equipment | 673 | 747 | 762 | 845 | 984 |
| Clocks, watches and parts | 40 | 42 | 51 | 53 | 56 |
| Musical instruments and parts | 18 | 20 | 19 | 17 | 19 |
| Arms, ammunition and parts | 37 | 33 | 22 | 28 | 37 |
| Furniture, furnishings and light fittings | 220 | 247 | 267 | 326 | 343 |
| Toys, games and sports requisites | 252 | 273 | 291 | 315 | 381 |
| Miscellaneous manufactured articles | 59 | 66 | 73 | 84 | 92 |
| Miscellaneous and confidential commodities5 | 21 | 23 | 16 | 18 | 51 |
| New Zealand miscellaneous provisions | – | – | – | ||
| All merchandise imports | 21,324 | 22,589 | 24,248 | 29,193 | 31,927 |
Machinery imports (mechanical and electrical) totalled $7.491 billion in the year ended June 2001.
This was an increase of 11.1 percent ($746 million) on the previous June year.
Main types of machinery imported in the year ended June 2001 were automatic data processing machines/computers ($ 1.024 billion), parts and accessories for mechanical machinery ($498 million), electrical apparatus for line telephony ($479 million) and transmission apparatus ($461 million). See Figure 25.9.
The United States was the main source of imported machinery; supplying 27.3 percent ($2.043 billion) in the year ended June 2001. See table 25.16.
Japan supplied 10.9 percent ($815 million) and Australia 9.8 percent ($737 million).
Compared with the previous June year, the largest increases in supply of imported machinery were recorded by the United States (up $273 million), the People's Republic of China (up $147 million) and Mexico (up $62 million).
The largest decrease was by Singapore (down $37 million).
Table 25.16. Origin of mechanical and electrical machinery imports1, 2, 3
| 1997 | 1998 | 1999 | 2000 | 2001 | |
|---|---|---|---|---|---|
1Imports are valued cif (cost including insurance and freight). 2Figures are calculated on unrounded data. 3Import values exclude confidential data. Year ended 30 June Source: Statistics New Zealand | |||||
| Country | $(million) | ||||
| United States | 1,456 | 1,627 | 1,534 | 1,770 | 2,043 |
| Japan | 700 | 681 | 675 | 805 | 815 |
| Australia | 657 | 602 | 651 | 706 | 737 |
| China, People's Republic of | 148 | 189 | 240 | 311 | 457 |
| Germany | 353 | 398 | 323 | 380 | 410 |
| Malaysia | 169 | 221 | 251 | 333 | 356 |
| Singapore | 210 | 220 | 323 | 358 | 321 |
| Taiwan | 299 | 264 | 252 | 266 | 295 |
| United Kingdom | 274 | 323 | 247 | 245 | 276 |
| Italy | 192 | 179 | 185 | 206 | 231 |
| Other countries | 1,011 | 1,165 | 1,289 | 1,364 | 1,551 |
| Total machinery imports | 5,468 | 5,870 | 5,970 | 6,745 | 7,491 |
| Percentage contribution to total imports | 25.6 | 25.9 | 24.6 | 23.1 | 23.4 |
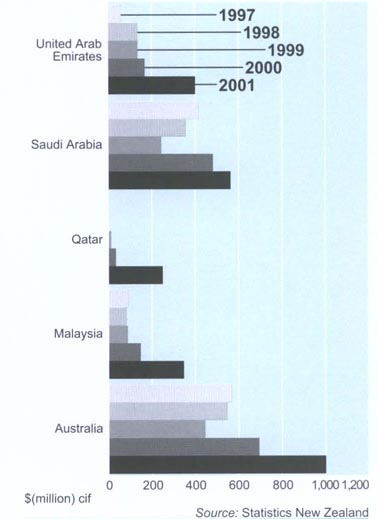
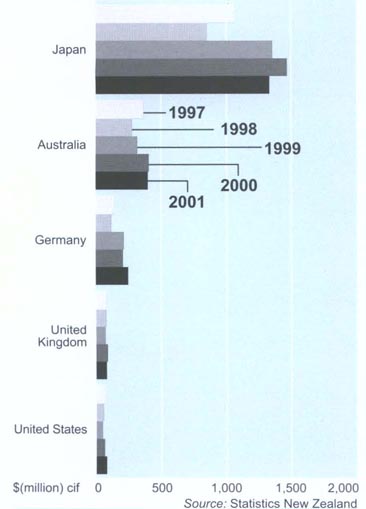
Table 25.17 shows imports of mineral fuels in the year ended June 2001 were valued at $3.545 billion. up by 52.9 percent ($1.226 billion) from the previous June year. Imports of crude petroleum rose by 57.3 percent ($858 million) and imports of non-crude petroleum rose by 41.7 percent ($307 million). Crude petroleum made up 66.4 percent, by value, of all mineral fuel imports.
Table 25.18 and Figure 25.10 show the countries that supply mineral fuel to New Zealand. For the year ended June 2001, Australia provided 28.3 percent of New Zealand's mineral fuel imports, while Saudi Arabia provided 15.8 percent. Suppliers of mineral fuels can fluctuate in importance from year to year. Qatar, Oman and Kuwait together accounted for 18.7 percent of New Zealand's mineral fuel imports in the year ended June 2001, whereas five years before no mineral fuel was imported from those countries.
Table 25.17. Mineral fuel imports1, 2, 3
| 1997 | 1998 | 1999 | 2000 | 2001 | |
|---|---|---|---|---|---|
1Imports are valued cif (cost including insurance and freight). 2Figures are calculated on unrounded data. 3Import values exclude confidential data. Year ended 30 June Source: Statistics New Zealand | |||||
| Product | $(million) | ||||
| Crude petroleum | 822 | 844 | 891 | 1,497 | 2,355 |
| Non-crude petroleum | 551 | 446 | 409 | 737 | 1,044 |
| Coal, coke, briquettes, etc | 59 | 69 | 70 | 76 | 134 |
| Other | 8 | 8 | 8 | 10 | 12 |
| Total mineral fuel imports | 1,439 | 1,368 | 1,378 | 2,319 | 3,545 |
| Percentage contribution to total imports | 6.7 | 6.1 | 5.7 | 7.9 | 11.1 |
Table 25.18. Mineral fuel suppliers1, 2, 3
| 1997 | 1998 | 1999 | 2000 | 2001 | |
|---|---|---|---|---|---|
1Imports are valued cif (cost including insurance and freight). 2Figures are calculated on unrounded data. 3Import values exclude confidential data. Year ended 30 June Source: Statistics New Zealand | |||||
| Country | $(million) | ||||
| Australia | 568 | 543 | 444 | 690 | 1,002 |
| Saudi Arabia | 415 | 356 | 241 | 481 | 560 |
| United Arab Emirates | 59 | 136 | 135 | 168 | 398 |
| Malaysia | 92 | 84 | 85 | 145 | 345 |
| Qatar | 0 | 0 | 12 | 32 | 249 |
| Oman | 0 | 29 | 66 | 185 | 239 |
| Kuwait | 0 | 0 | 13 | 57 | 174 |
| United States | 47 | 53 | 59 | 53 | 126 |
| Argentina | 0 | 0 | 67 | 77 | 110 |
| Indonesia | 55 | 6 | 10 | 11 | 71 |
| Singapore | 53 | 20 | 16 | 25 | 64 |
| Other countries | 150 | 141 | 229 | 395 | 207 |
| Total mineral fuel imports | 1,439 | 1,368 | 1,378 | 2,319 | 3,545 |
Vehicle imports in the year ended June 2001 were valued at $2.415 billion, a decrease of 4.4 percent ($112 million) on the previous June year. Japan was New Zealand's main source of imported vehicles, supplying 55.1 percent by value and 76.2 percent by number during the year ended June 2001. The value of vehicles from Japan was 9 percent ($132 million) lower than in the previous June year and the number was down by 6.5 percent. The value of vehicle imports from Australia decreased by 1.7 percent ($7 million), while vehicle imports from Germany increased by 21.5 percent. See table 25.19 and Figure 25.11.
Table 25.19. Origin of passenger vehicle imports1, 2
| 1997 | 1998 | 1999 | 2000 | 2001 | ||||||
|---|---|---|---|---|---|---|---|---|---|---|
| Country | $million | Number | $million | Number | $million | Number | $million | Number | $million | Number |
1Imports are valued elf least including Insurance and freight). 2Figures are calculated on unrounded data. Year ended 30 June Source: Statistics New Zealand | ||||||||||
| Japan | 1,068 | 138,067 | 850 | 97,197 | 1,352 | 156,788 | 1,462 | 152,491 | 1,330 | 142,528 |
| Australia | 365 | 13,849 | 276 | 11,115 | 321 | 12,637 | 409 | 15,541 | 402 | 14,439 |
| Germany | 146 | 6,838 | 117 | 5,018 | 215 | 8,387 | 205 | 7,391 | 248 | 8,873 |
| United Kingdom | 77 | 3,470 | 80 | 4,044 | 69 | 3,061 | 90 | 3,611 | 79 | 3,240 |
| United States | 76 | 7,035 | 57 | 5,140 | 50 | 4,293 | 66 | 5,422 | 77 | 5,361 |
| Korea, Republic of | 69 | 6,357 | 65 | 5,932 | 76 | 7,096 | 90 | 6,920 | 59 | 4,083 |
| Thailand | 0 | 6 | 18 | 1,365 | 44 | 2,924 | 43 | 1,845 | 44 | 1,750 |
| France | 19 | 1.086 | 14 | 723 | 22 | 1,194 | 29 | 1,372 | 36 | 1,434 |
| Belgium | 35 | 2,020 | 34 | 2,105 | 21 | 1,224 | 30 | 1,512 | 27 | 1,276 |
| South Africa | 1 | 23 | 3 | 86 | 1 | 23 | 12 | 292 | 25 | 503 |
| Other countries | 45 | 2,349 | 36 | 3,119 | 53 | 2,537 | 91 | 4,491 | 88 | 3,539 |
| Total vehicle imports | 1,901 | 181,100 | 1,549 | 135,844 | 2,224 | 200,164 | 2,527 | 200,888 | 2,415 | 187,026 |
Imports of plastic and plastic articles in the year ended June 2001 were valued at $1.337 billion, up 12.2 percent ($146 million) on the previous June year.
Australia and the United States together supplied 39.7 percent of plastic and plastic article imports in the June 2001 year. Compared with the previous June year, an increase of 6.1 percent ($16 million) was recorded for imports from Australia, while the United States recorded a 12.8 percent ($28 million) increase. See table 25.20 and Figure 25.12.
Table 25.2. Plastics and plastic article imports1, 2
| 1997 | 1998 | 1999 | 2000 | 2001 | |
|---|---|---|---|---|---|
1Imports are valued cif (cost including insurance and freight). 2Figures are calculated on unrounded data. Year ended 30 June Source: Statistics New Zealand | |||||
| Country | $(million) | ||||
| Australia | 220 | 212 | 232 | 266 | 283 |
| United States | 214 | 215 | 194 | 220 | 248 |
| Korea, Republic of | 45 | 46 | 55 | 79 | 91 |
| Germany | 48 | 54 | 57 | 64 | 81 |
| Japan | 65 | 70 | 63 | 90 | 76 |
| China, People's Republic of | 23 | 36 | 42 | 48 | 65 |
| United Kingdom | 55 | 58 | 52 | 60 | 58 |
| Taiwan | 37 | 35 | 36 | 41 | 47 |
| Thailand | 6 | 12 | 14 | 26 | 40 |
| Saudi Arabia | 17 | 17 | 16 | 25 | 39 |
| Other countries | 187 | 213 | 233 | 271 | 309 |
| Total plastics and plastic articles imports | 916 | 968 | 996 | 1,191 | 1,337 |
For the year ended June 2001, 77.6 percent of New Zealand's merchandise exports went to Northeast Asia, Australia, Europe and Northern America, compared with 79.8 percent in the year ended June 2000 and 79.1 percent in the year ended June 1999. For the year ended June 2001, 81.1 percent of New Zealand's merchandise imports came from these same country groups, compared with 84.1 percent in the year ended June 2000 and 85.2 percent in the year ended June 1999. These four country groups are the cornerstones of New Zealand's overseas trade. See table 25.21 for a summary of trade figures.
North-east Asia is the most important country group for both export and import merchandise trade, followed by Australia, Northern America and Europe. North-east Asia includes Japan, the People's Republic of China, the Republic of Korea and Taiwan, which are all major trading partners for New Zealand. Figure 25.13 shows imports and exports from four of New Zealand's major trading partners. Figures 25.14 and 25.15 show destination of exports and origin of imports by proportions.
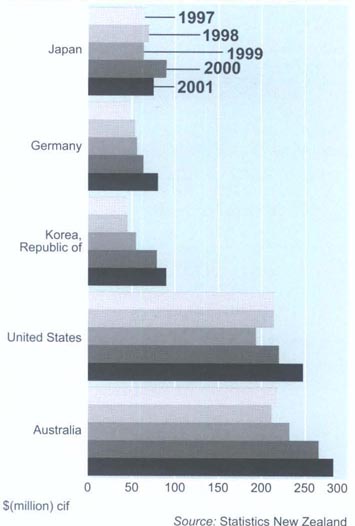
Table 25.21. Trade by geographic region and country1
| Year ended June | ||||||
|---|---|---|---|---|---|---|
| Value of exports (fob) $(million) | Value of imports (cif) $(million) | |||||
| 1999 | 2000 | 2001 | 1999 | 2000 | 2001 | |
| Region and country | Oceania and Antarctica | |||||
1Figures are calculated on unrounded data. fob = free on board (the value of goods at New Zealand parts before export. Re-exports are included.) cif = cost of goods, including insurance and freight to New Zealand Source: Statistics New Zealand | ||||||
| Australia | 4,841 | 5,503 | 6,083 | 5,367 | 6,843 | 7,010 |
| Christmas Island | – | – | – | 5 | 2 | 4 |
| Cocos (Keeling) Islands | – | – | – | – | – | – |
| Norfolk Island | 9 | 9 | 9 | – | – | – |
| Australia and external territories | 4,851 | 5,512 | 6,092 | 5,372 | 6,846 | 7,014 |
| New Zealand (re-imports) | – | – | – | 121 | 138 | 165 |
| New Caledonia | 82 | 81 | 85 | 1 | – | – |
| Papua New Guinea | 99 | 90 | 101 | 32 | 45 | 53 |
| Solomon Islands | 17 | 18 | 11 | 2 | 1 | 1 |
| Vanuatu | 14 | 15 | 20 | 1 | 1 | 1 |
| Melanesia | 213 | 205 | 217 | 36 | 47 | 55 |
| Guam | 12 | 12 | 14 | – | 1 | – |
| Kiribati | 2 | 4 | 4 | – | – | – |
| Marshall Islands | 2 | 1 | 3 | – | – | – |
| Federated States of Micronesia | – | 1 | 2 | – | – | – |
| Nauru | – | – | 1 | 21 | 24 | 17 |
| Northern Mariana Islands | 1 | 1 | 2 | – | – | – |
| Palau | – | – | – | – | – | – |
| Micronesia | 18 | 20 | 24 | 21 | 25 | 17 |
| Cook Islands | 31 | 40 | 50 | 2 | 2 | 2 |
| Fiji | 222 | 227 | 222 | 58 | 65 | 55 |
| French Polynesia | 101 | 121 | 139 | 2 | 3 | 3 |
| Niue | 5 | 4 | 5 | 1 | 1 | |
| Samoa | 63 | 70 | 79 | 4 | 6 | 3 |
| American Samoa | 32 | 40 | 51 | 1 | 1 | 1 |
| Tokelau | – | – | – | – | – | – |
| Tonga | 35 | 42 | 51 | 1 | 1 | 2 |
| Tuvalu | 2 | 1 | 2 | – | – | – |
| Wallis and Futuna | 5 | 5 | 6 | – | – | – |
| Pitcairn Island | – | – | – | – | – | – |
| Polynesia (excludes Hawaii) | 495 | 549 | 606 | 67 | 78 | 67 |
| Antarctica | – | – | – | – | – | – |
| Oceania and Antarctica | 5,576 | 6,286 | 6,940 | 5,617 | 7,133 | 7,318 |
| Percentage of total exports/imports | 24.7 | 24.2 | 21.7 | 23.2 | 24.4 | 22.9 |
| North-west Europe | ||||||
| United Kingdom | 1,401 | 1,609 | 1,552 | 1,066 | 1,161 | 1,187 |
| Ireland | 24 | 22 | 31 | 107 | 112 | 147 |
| Austria | 9 | 9 | 17 | 85 | 111 | 105 |
| Belgium | 485 | 426 | 520 | 197 | 230 | 255 |
| France | 230 | 420 | 348 | 463 | 701 | 592 |
| Germany | 623 | 644 | 842 | 1,088 | 1,182 | 1,419 |
| Liechtenstein | – | – | – | – | – | – |
| Luxembourg | – | 1 | – | 18 | 16 | 24 |
| Monaco | – | – | – | – | – | 1 |
| Netherlands | 150 | 139 | 207 | 262 | 252 | 275 |
| Switzerland | 56 | 79 | 78 | 239 | 242 | 245 |
| Western Europe | 1,553 | 1,719 | 2,013 | 2,352 | 2,734 | 2,916 |
| Denmark | 66 | 57 | 90 | 147 | 134 | 149 |
| Faeroe Islands | – | 1 | 1 | – | – | – |
| Finland | 11 | 16 | 18 | 154 | 179 | 204 |
| Greenland | – | – | – | – | – | – |
| Iceland | 1 | – | 1 | 2 | 4 | 4 |
| Norway | 27 | 13 | 16 | 68 | 37 | 66 |
| Sweden | 48 | 46 | 52 | 294 | 359 | 368 |
| Northern Europe | 154 | 133 | 179 | 665 | 713 | 790 |
| Destination unknown – European Union | 361 | 261 | 293 | – | – | – |
| North-west Europe | 3,493 | 3,744 | 4,068 | 4,190 | 4,720 | 5,039 |
| Percentage of total exports/imports | 15.5 | 14.4 | 12.7 | 17.3 | 16.2 | 15.8 |
| Southern and Eastern Europe | ||||||
| Andorra | – | – | – | – | – | – |
| Gibraltar | – | – | 1 | – | – | – |
| Vatican City State | – | – | – | – | – | – |
| Italy | 396 | 426 | 586 | 518 | 581 | 676 |
| Malta | 6 | 8 | 10 | 1 | 1 | 1 |
| Portugal | 31 | 23 | 43 | 40 | 34 | 38 |
| Spain | 126 | 151 | 170 | 231 | 127 | 141 |
| Southern Europe | 559 | 609 | 809 | 789 | 743 | 856 |
| Albania | – | – | – | – | – | – |
| Bosnia-Herzegovina | – | – | – | – | 1 | – |
| Bulgaria | 1 | 1 | 1 | – | – | 1 |
| Croatia | – | – | 2 | 1 | 1 | 1 |
| Cyprus | 5 | 7 | 10 | – | – | – |
| Former Yugoslav Republic of Macedonia | – | – | – | – | – | – |
| Greece | 64 | 70 | 68 | 13 | 12 | 11 |
| Moldova | – | – | – | – | – | – |
| Romania | 3 | 2 | 2 | 1 | 2 | 3 |
| Slovenia | 1 | 1 | 1 | 7 | 7 | 8 |
| Federal Republic of Yugoslavia | – | – | 1 | – | – | – |
| South Eastern Europe | 75 | 83 | 86 | 23 | 23 | 25 |
| Belarus | – | – | – | – | – | 1 |
| Czech Republic | 1 | 2 | 3 | 9 | 10 | 12 |
| Estonia | – | 2 | 4 | – | – | – |
| Hungary | 2 | 1 | 2 | 10 | 11 | 17 |
| Latvia | – | 61 | 57 | – | – | – |
| Lithuania | – | – | 4 | – | – | – |
| Poland | 7 | 15 | 14 | 85 | 6 | 9 |
| Russia | 138 | 43 | 53 | 10 | 5 | 13 |
| Slovakia | – | 2 | – | 2 | 3 | 6 |
| Ukraine | 1 | 1 | 1 | 2 | 11 | 10 |
| Eastern Europe | 149 | 127 | 138 | 118 | 47 | 69 |
| Southern and Eastern Europe | 784 | 819 | 1,034 | 930 | 813 | 951 |
| Percentage of total exports/imports | 3.5 | 3.1 | 3.2 | 3.8 | 2.8 | 3.0 |
| Total Europe | 4,277 | 4,563 | 5,101 | 5,120 | 5,533 | 5,990 |
| Percentage of total exports/imports | 18.9 | 17.5 | 16.0 | 21.1 | 19.0 | 18.8 |
| North Africa and the Middle East | ||||||
| Algeria | 80 | 55 | 111 | – | – | – |
| Egypt | 137 | 119 | 153 | 8 | 8 | 3 |
| Libya | 10 | 2 | 2 | – | – | – |
| Morocco | 24 | 25 | 32 | 89 | 164 | 158 |
| Sudan | – | 1 | 1 | – | – | – |
| Tunisia | 8 | 3 | 11 | 8 | 5 | 17 |
| North Africa | 258 | 205 | 310 | 105 | 176 | 178 |
| Bahrain | 12 | 12 | 17 | 12 | 15 | 13 |
| Iran | 58 | 82 | 112 | 16 | 23 | 10 |
| Iraq | – | – | – | – | – | – |
| Israel | 10 | 10 | 12 | 102 | 59 | 68 |
| Jordan | 36 | 28 | 30 | 7 | 5 | 1 |
| Kuwait | 26 | 25 | 45 | 16 | 60 | 179 |
| Lebanon | 3 | 4 | 8 | – | – | – |
| Oman | 18 | 35 | 18 | 66 | 185 | 239 |
| Qatar | 5 | 5 | 6 | 13 | 33 | 250 |
| Saudi Arabia | 190 | 208 | 304 | 294 | 536 | 660 |
| Syria | 3 | 8 | 6 | – | – | – |
| Turkey | 29 | 32 | 39 | 26 | 31 | 68 |
| United Arab Emirates | 107 | 113 | 196 | 146 | 182 | 421 |
| Yemen | 13 | 17 | 20 | 37 | – | – |
| Middle East | 511 | 579 | 814 | 735 | 1,129 | 1,909 |
| North Africa and the Middle East | 770 | 783 | 1,125 | 840 | 1,305 | 2,086 |
| Percentage of total exports/imports | 3.4 | 3.0 | 3.5 | 3.5 | 4.5 | 6.5 |
| South-east Asia | ||||||
| Myanmar | 7 | 10 | 14 | 1 | 1 | 3 |
| Cambodia | 1 | – | 3 | 1 | 1 | 1 |
| Laos | – | 2 | – | – | – | – |
| Thailand | 238 | 287 | 389 | 322 | 426 | 490 |
| Vietnam | 113 | 95 | 319 | 48 | 56 | 78 |
| Mainland South-east Asia | 359 | 394 | 726 | 372 | 484 | 571 |
| Brunei Darussalam | 7 | 3 | 3 | 17 | 32 | – |
| Indonesia | 191 | 362 | 557 | 267 | 274 | 398 |
| Malaysia | 424 | 490 | 687 | 525 | 717 | 966 |
| Philippines | 280 | 316 | 503 | 57 | 68 | 80 |
| Singapore | 362 | 480 | 434 | 478 | 539 | 578 |
| East Timor | – | – | 3 | – | – | – |
| Maritime South-east Asia | 1,264 | 1,650 | 2,189 | 1,344 | 1,630 | 2,022 |
| South-east Asia | 1,623 | 2,044 | 2,914 | 1,716 | 2,114 | 2,594 |
| Percentage of total exports/imports | 7.2 | 7.9 | 9.1 | 7.1 | 7.2 | 8.1 |
| North-east Asia | ||||||
| People's Republic of China | 619 | 731 | 1,114 | 1,234 | 1,630 | 2,149 |
| Hong Kong (Special Administrative Region) | 535 | 710 | 847 | 177 | 167 | 168 |
| Japan | 2,878 | 3,371 | 4,277 | 3.056 | 3,474 | 3,427 |
| Democratic People's Republic of Korea | – | – | – | – | – | – |
| Republic of Korea | 883 | 1,172 | 1,405 | 504 | 687 | 700 |
| Macau | 6 | 4 | 7 | 1 | 3 | 4 |
| Mongolia | – | 1 | 1 | – | – | – |
| Taiwan | 529 | 649 | 722 | 547 | 627 | 683 |
| North-east Asia | 5,451 | 6,638 | 8,373 | 5,520 | 6,588 | 7,131 |
| Percentage of total exports/imports | 24.1 | 25.5 | 26.2 | 22.8 | 22.6 | 22.3 |
| Southern and Central Asia | ||||||
| Bangladesh | 19 | 17 | 20 | 10 | 13 | 9 |
| Bhutan | – | – | – | – | – | – |
| India | 172 | 185 | 166 | 147 | 166 | 182 |
| Maldives | 14 | 9 | 10 | – | – | – |
| Nepal | 23 | 32 | 38 | 1 | 1 | 1 |
| Pakistan | 26 | 27 | 24 | 48 | 60 | 72 |
| Sri Lanka | 125 | 117 | 177 | 16 | 19 | 20 |
| Southern Asia | 379 | 387 | 435 | 221 | 258 | 284 |
| Afghanistan | – | – | – | – | 1 | – |
| Armenia | – | – | – | – | – | – |
| Azerbaijan | – | – | – | – | – | – |
| Georgia | 1 | 2 | 2 | – | – | – |
| Kazakhstan | – | – | – | 3 | 3 | 6 |
| Kyrgyzstan | 1 | – | – | – | – | – |
| Tajikistan | – | – | – | – | – | – |
| Turkmenistan | – | 8 | – | – | – | – |
| Uzbekistan | – | – | – | – | – | – |
| Central Asia | 2 | 9 | 2 | 3 | 4 | 7 |
| Southern and Central Asia | 380 | 396 | 437 | 224 | 262 | 291 |
| Percentage of total exports/imports | 1.7 | 1.5 | 1.4 | 0.9 | 0.9 | 0.9 |
| Total Asia | 7,454 | 9,077 | 11,724 | 7,460 | 8,964 | 10,015 |
| Percentage of total exports/imports | 33.0 | 34.9 | 36.7 | 30.8 | 30.7 | 31.4 |
| The Americas | ||||||
| Bermuda | 11 | 3 | 5 | 1 | 1 | – |
| Canada | 294 | 327 | 581 | 364 | 461 | 449 |
| United States | 3,005 | 3,739 | 4,644 | 4,283 | 5,127 | 5,298 |
| United States Minor Outlying Islands | – | – | – | – | – | – |
| Northern America | 3,310 | 4,069 | 5,229 | 4,648 | 5,590 | 5,747 |
| Argentina | 37 | 32 | 35 | 87 | 92 | 125 |
| Bolivia | 4 | 1 | – | 1 | 1 | 1 |
| Brazil | 94 | 76 | 81 | 60 | 68 | 89 |
| Chile | 51 | 59 | 65 | 25 | 24 | 30 |
| Colombia | 4 | 4 | 23 | 7 | 6 | 6 |
| Ecuador | 3 | 1 | 4 | 57 | 64 | 69 |
| Falkland Islands | – | – | 1 | – | – | – |
| French Guiana | 1 | 1 | 1 | – | – | – |
| Guyana | 6 | 5 | 9 | – | 1 | 1 |
| Paraguay | 1 | – | – | – | – | – |
| Peru | 91 | 94 | 73 | 10 | 4 | 5 |
| Suriname | – | – | 1 | – | – | – |
| Uraguay | 7 | 7 | 13 | 1 | 1 | 1 |
| Venezuela | 106 | 106 | 215 | 6 | 10 | 1 |
| South America | 404 | 386 | 521 | 254 | 271 | 328 |
| Belize | – | – | – | – | – | – |
| Costa Rica | 2 | 2 | 1 | 1 | 1 | 1 |
| El Salvador | 51 | 69 | 107 | – | – | – |
| Guatemala | 21 | 6 | 8 | 1 | 1 | 2 |
| Honduras | 1 | 1 | 2 | – | – | – |
| Mexico | 233 | 239 | 446 | 129 | 129 | 194 |
| Nicaragua | 1 | – | – | – | – | – |
| Panama | 19 | 13 | 28 | 2 | 1 | 32 |
| Central America | 327 | 329 | 593 | 134 | 132 | 229 |
| Antigua and Barbuda | – | – | 1 | – | – | – |
| Aruba | – | – | 1 | – | – | – |
| Bahamas | 2 | 3 | 2 | – | – | – |
| Barbados | 12 | 16 | 21 | – | – | – |
| Cayman Islands | – | – | – | – | – | – |
| Cuba | 31 | 4 | 82 | 1 | 1 | 1 |
| Dominica | – | – | – | – | – | – |
| Dominican Republic | 27 | 13 | 40 | 1 | 1 | 1 |
| Grenada | 2 | 2 | 4 | – | – | – |
| Guadeloupe | 4 | 7 | 5 | – | – | – |
| Haiti | 3 | – | – | – | – | – |
| Jamaica | 31 | 35 | 34 | 8 | 7 | 10 |
| Martinique | 4 | 4 | 4 | – | – | – |
| Montserrat | – | – | – | – | – | – |
| Netherlands Antilles | 2 | 2 | 1 | 1 | – | – |
| Puerto Rico | 6 | 7 | – | 38 | 54 | 58 |
| St Kitts and Nevis | – | – | – | – | – | – |
| St Lucia | 2 | 2 | 3 | – | – | – |
| St Vincent and the Grenadines | – | – | 1 | – | – | – |
| Trinidad and Tobago | 12 | 12 | 20 | – | – | – |
| British Virgin Islands | – | – | – | – | – | – |
| United States Virgin Islands | – | 1 | – | – | – | – |
| Caribbean | 138 | 109 | 221 | 49 | 63 | 70 |
| The Americas | 4,180 | 4,893 | 6,564 | 5,085 | 6,056 | 6,375 |
| Percentage of total exports/imports | 18.5 | 18.8 | 20.6 | 21.0 | 20.7 | 20.0 |
| Sub-Saharan Africa | ||||||
| Benin | – | – | – | – | – | – |
| Burkina Faso | – | – | – | – | – | – |
| Cameroon | – | – | 1 | – | – | – |
| Cape Verde | – | – | – | – | – | – |
| Central African Republic | – | – | – | – | – | – |
| Congo | – | – | – | – | – | – |
| The Democratic Republic of the Congo | – | – | – | – | – | – |
| Cote d'Ivoire | – | 1 | 1 | – | – | – |
| Gabon | – | – | – | – | – | – |
| Gambia | – | – | – | – | – | – |
| Ghana | 13 | 5 | 4 | 1 | 1 | 1 |
| Guinea | – | – | – | – | – | – |
| Liberia | – | – | – | – | – | – |
| Mali | – | – | – | – | – | – |
| Mauritania | – | – | – | – | – | – |
| Niger | – | – | – | – | – | – |
| Nigeria | 5 | 3 | 4 | 25 | 79 | 26 |
| Sao Tome and Principe | – | – | – | – | – | – |
| Senegal | – | 1 | 1 | – | – | – |
| Sierra Leone | – | – | – | – | – | – |
| Togo | – | – | – | – | – | – |
| Central and West Africa | 19 | 12 | 11 | 26 | 81 | 27 |
| Angola | – | 1 | 4 | – | – | – |
| Botswana | 1 | – | – | – | – | – |
| Burundi | – | – | – | – | – | – |
| Comoros | – | – | – | – | – | – |
| Djibouti | – | 1 | 1 | – | – | – |
| Eritrea | – | – | – | – | – | – |
| Ethiopia | – | – | – | – | – | – |
| Kenya | 2 | 2 | 3 | 3 | 3 | 3 |
| Lesotho | – | – | – | – | – | – |
| Madagascar | 2 | 1 | 3 | – | – | – |
| Malawi | 1 | – | – | 3 | 5 | 4 |
| Mauritius | 27 | 20 | 26 | 1 | 1 | 1 |
| Mozambique | 6 | 1 | 1 | – | – | – |
| Namibia | – | – | – | – | – | – |
| Reunion | 7 | 11 | 10 | – | – | – |
| Rwanda | – | – | – | – | – | – |
| Seychelles | 2 | 4 | 3 | – | – | – |
| Somalia | – | – | – | – | – | – |
| South Africa | 73 | 82 | 119 | 84 | 104 | 99 |
| Swaziland | – | – | – | – | – | – |
| Tanzania | 2 | 1 | 2 | 1 | – | – |
| Uganda | – | – | – | – | – | – |
| Zambia | – | – | – | 1 | – | – |
| Zimbabwe | 2 | – | 1 | 5 | 6 | 6 |
| Southern and East Africa | 126 | 125 | 173 | 99 | 120 | 114 |
| Sub-Saharan Africa | 145 | 137 | 184 | 125 | 201 | 142 |
| Percentage of total exports/imports | 0.6 | 0.5 | 0.6 | 0.5 | 0.7 | 0.4 |
| Bunkering, passengers baggage and ships stores | ||||||
| Bunkering | 39 | 64 | 82 | – | – | – |
| Passengers' baggage | 130 | 194 | 184 | – | – | – |
| Ships' stores | 29 | 29 | 36 | – | – | – |
| Bunkering, passengers' baggage and ships' stores | 198 | 288 | 302 | – | – | – |
| All merchandise exports/imports | 22,600 | 26,027 | 31,939 | 24,248 | 29,193 | 31,927 |
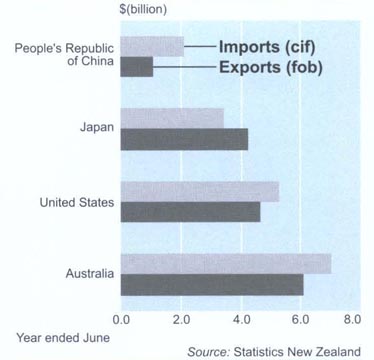
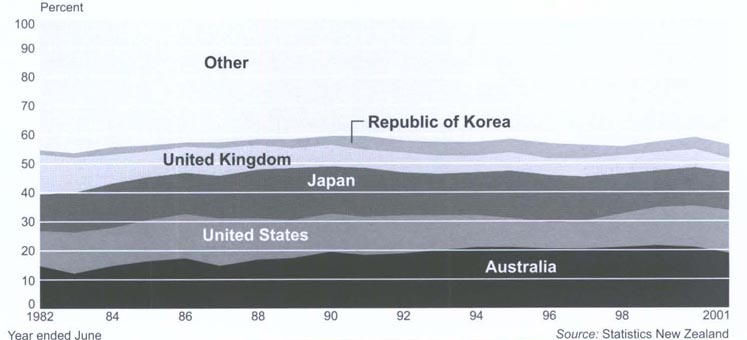
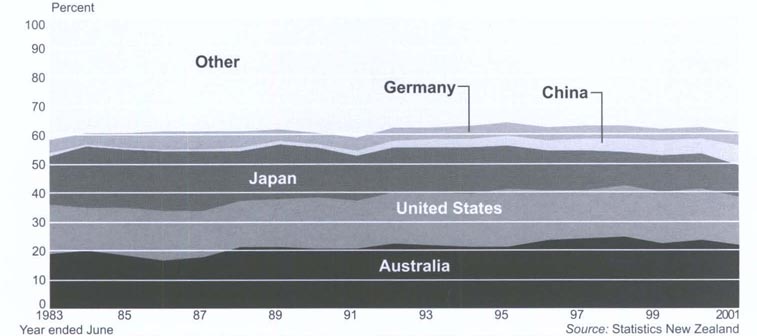
For the year ended June 2001, New Zealand's top 10 trading partners received 68.9 percent of its merchandise exports and supplied 73.7 percent of merchandise imports.
The single most important trading partner for merchandise exports and imports was Australia, followed by the United States and Japan.
In the year ended June 2001, these three countries took 47 percent of New Zealand's merchandise exports and provided 49.3 percent of imports.
Tables 25.22 and 25.23 show the level of exports and imports from 1997 to 2001.
Table 25.22. Top ten countries for exports1, 2
| Year ended June 1997 | Year ended June 1998 | Year ended June 1999 | Year ended June 2000 | Year ended June 2001 | |
|---|---|---|---|---|---|
1Exports are valued fob (five on board at New Zealand parts before export). Re-exports are included. 2Figures are calculated on unrounded data. Source: Statistics New Zealand | |||||
| Country | $(million) | ||||
| Australia | 4,276 | 4,578 | 4,841 | 5,503 | 6,083 |
| United States | 2,085 | 2,596 | 3,005 | 3,739 | 4,644 |
| Japan | 3,138 | 3,030 | 2,878 | 3,371 | 4,277 |
| United Kingdom | 1,354 | 1,327 | 1,401 | 1,609 | 1,552 |
| Korea, Republic of | 978 | 762 | 883 | 1,172 | 1,405 |
| China, People's Republic of | 560 | 613 | 619 | 731 | 1,114 |
| Hong Kong (Special Administrative Region) | 575 | 633 | 535 | 710 | 847 |
| Germany | 511 | 579 | 623 | 644 | 842 |
| Taiwan | 554 | 564 | 529 | 649 | 722 |
| Belgium | 307 | 470 | 485 | 426 | 520 |
| Top 10 countries | 14,338 | 15,153 | 15,799 | 18,554 | 22,006 |
| Other countries | 6,695 | 6,837 | 6,801 | 7,474 | 9,932 |
| All countries | 21,033 | 21,990 | 22,600 | 26,027 | 31,938 |
Table 25.23. Top ten countries for imports12
| Year ended June 1997 | Year ended June 1998 | Year ended June 1999 | Year ended June 2000 | Year ended June 2001 | |
|---|---|---|---|---|---|
1Imports are valued cif (cost including insurance and freight). 2Figures arc calculated on unrounded data. Source: Statistics New Zealand | |||||
| Country | $(million) | ||||
| Australia | 5,080 | 5,579 | 5,367 | 6,843 | 7,010 |
| United States | 3,623 | 3,974 | 4,283 | 5,127 | 5,298 |
| Japan | 2,846 | 2,539 | 3,056 | 3,474 | 3,427 |
| China, People's Republic of | 889 | 1,107 | 1,234 | 1,630 | 2,149 |
| Germany | 944 | 995 | 1,088 | 1,182 | 1,419 |
| United Kingdom | 1,133 | 1,199 | 1,066 | 1,161 | 1,187 |
| Malaysia | 396 | 450 | 525 | 717 | 966 |
| Korea, Republic of | 414 | 445 | 504 | 687 | 700 |
| Taiwan | 579 | 554 | 547 | 627 | 683 |
| Italy | 498 | 499 | 518 | 581 | 676 |
| Top 10 countries | 16,402 | 17,340 | 18,188 | 22,030 | 23,516 |
| Other countries | 4,921 | 5,249 | 6,061 | 7,163 | 8,411 |
| All countries | 21,324 | 22,589 | 24,248 | 29,193 | 31,927 |
Australia is New Zealand's main trading partner, receiving 19 percent of New Zealand's merchandise exports and supplying 22 percent of merchandise imports for the year ended June 2001. Exports to Australia rose by 10.5 percent ($580 million) from the previous June year and imports rose by 2.4 percent ($167 million). See table 25.24. Figure 25.16 shows trading figures since 1983. A summary of exports to Australia is provided in table 25.25. Exports of petroleum and petroleum products in the year ended June 2001 rose by 28.8 percent ($118 million) from the previous June year, while exports of logs, wood and wood articles fell by 20.2 percent ($86 million). See Figure 25.17. Imports of petroleum and petroleum products from Australia for the year ended June 2001 rose 41 percent ($281 million) on the previous June year. Imports of inorganic chemicals, and paper, paperboard and paper articles rose by 16.9 percent ($54 million) and 11.4 percent ($42 million), respectively, while imports of textiles and textile articles fell by 8.7 percent ($25 million). See table 25.26. Figure 25.18 shows selected category imports from Australia from 1997 to 2001.
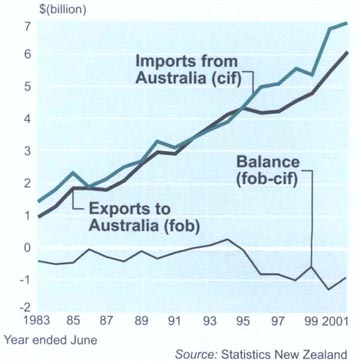
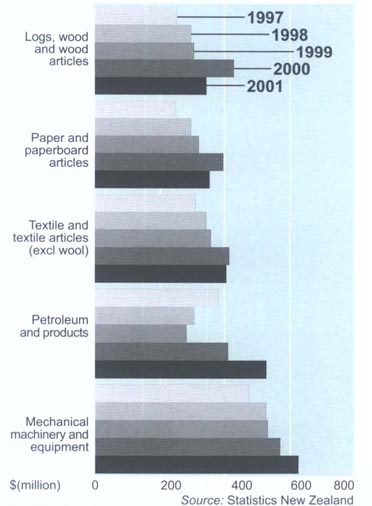
Table 25.24. Trade with Australia1, 2, 3
| Exports (fob) | Imports (cif) | Balance of merchandise trade (fob-cif) | |
|---|---|---|---|
1Exports are valued fob (free on board at New Zealand ports before export). Re-exports are included. 2Imports are valued cif (cost including insurance and freight). 3Figures are calculated an unrounded data. Source: Statistics New Zealand | |||
| Year ended June | $(million) | ||
| 1990 | 2,980 | 3,257 | -277 |
| 1991 | 2,937 | 3,117 | -180 |
| 1992 | 3,388 | 3,427 | -39 |
| 1993 | 3,786 | 3,747 | 38 |
| 1994 | 4,162 | 3,942 | 220 |
| 1995 | 4,342 | 4,444 | -101 |
| 1996 | 4,205 | 4,964 | -759 |
| 1997 | 4,276 | 5,080 | -804 |
| 1998 | 4,578 | 5,579 | -1,001 |
| 1999 | 4,841 | 5,367 | -526 |
| 2000 | 5,503 | 6,843 | -1,341 |
| 2001 | 6.083 | 7,010 | -927 |
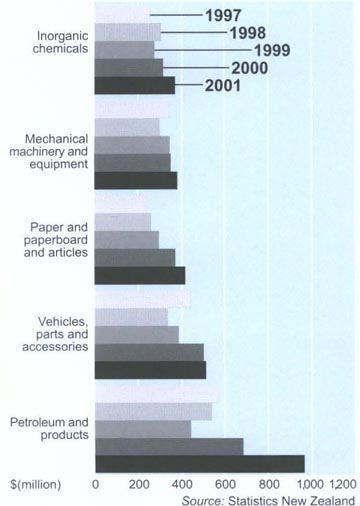
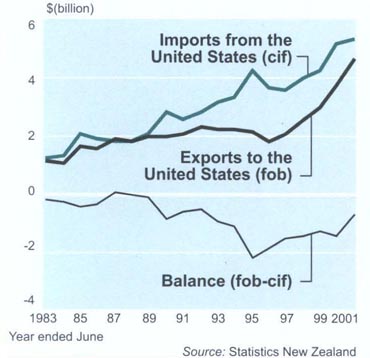
Table 25.25. Main commodities exported to Australia1, 2
| Year ended June 1997 | Year ended June 1998 | Year ended June 1999 | Year ended June 2000 | Year ended June 2001 | |
|---|---|---|---|---|---|
1Exports are valued fob (free on board at New Zealand ports before export). Re-exports are included. 2Figures are calculated on unrounded data. 3Export values exclude confidential data. This affects the latest 12 or 24 months. 4Data that is no longer confidential is assigned to specific commodities. Source: Statistics New Zealand | |||||
| Commodity | $(million) | ||||
| Mechanical machinery and equipment | 474 | 527 | 533 | 571 | 626 |
| Petroleum and products | 380 | 307 | 283 | 408 | 526 |
| Textile and textile articles (excl wool)3 | 309 | 342 | 357 | 415 | 406 |
| Paper and paperboard and articles3 | 250 | 297 | 322 | 393 | 352 |
| Logs, wood and wood articles | 253 | 298 | 305 | 428 | 342 |
| Electrical machinery and equipment | 212 | 259 | 270 | 322 | 314 |
| Precious metals, jewellery & coin | 253 | 246 | 191 | 224 | 262 |
| Milk powder, butter and cheese | 127 | 139 | 176 | 210 | 260 |
| Plastics and plastic articles | 186 | 203 | 205 | 230 | 256 |
| Iron and steel articles3 | 141 | 170 | 174 | 191 | 203 |
| Other commodities3 | 1,691 | 1,790 | 2,024 | 2,107 | 2,429 |
| Confidential data4 | 0 | 0 | 0 | 3 | 107 |
| All merchandise exports to Australia | 4,276 | 4,578 | 4,841 | 5,503 | 6,083 |
Table 25.26. Main commodities imported from Australia1, 2
| Year ended June 1997 | Year ended June 1998 | Year ended June 1999 | Year ended June 2000 | Year ended June 2001 | |
|---|---|---|---|---|---|
1Imports are valued cif (cost, including insurance and freight to New Zealand). 2Figures are calculated on unrounded data. 3Import values exclude confidential data. This affects the latest 6 or 12 months. 4Data that is no longer confidential is assigned to specific commodities. Source: Statistics New Zealand | |||||
| Commodity | $(million) | ||||
| Petroleum and products | 567 | 540 | 441 | 685 | 966 |
| Vehicles, parts and accessories | 440 | 337 | 385 | 503 | 514 |
| Paper and paperboard and articles | 239 | 261 | 295 | 373 | 415 |
| Mechanical machinery and equipment | 349 | 303 | 348 | 353 | 382 |
| Inorganic chemicals3 | 256 | 304 | 278 | 317 | 371 |
| Electrical machinery and equipment3 | 308 | 299 | 303 | 353 | 356 |
| Iron and steel and articles3 | 268 | 243 | 290 | 311 | 332 |
| Plastics and plastic articles3 | 220 | 212 | 232 | 266 | 283 |
| Textiles and textile articles | 281 | 275 | 286 | 291 | 266 |
| Pharmaceutical products | 209 | 215 | 203 | 242 | 238 |
| Other commodities3 | 1,944 | 2,592 | 2,305 | 3,149 | 2,886 |
| Confidential data4 | 0 | 0 | 0 | 0 | 2 |
| All merchandise imports from Australia | 5,080 | 5,579 | 5,367 | 6,843 | 7,010 |
Table 25.27 shows the value of trade with the United States. The United States is New Zealand's second main export destination and import supplier. For the year ended June 2001, merchandise exports increased by 24.2 percent ($905 million), and merchandise imports increased by 3.3 percent ($171 million), on the previous June year.
Main commodities contributing to the increase in exports were casein and caseinates, up 33.5 percent ($148 million), meat and edible offal, up 12.9 percent ($140 million), and electrical machinery and equipment, up 56.5 percent ($80 million). See table 25.28.
Main commodities contributing to the rise in imports from the Unites States were electrical machinery and equipment, up 34.5 percent ($238 million), petroleum and petroleum products, up 136.8 percent ($72 million), and optical, medical and measuring equipment, up 21.2 percent ($60 million). The main drop in imports was for aircraft and parts, down 34.8 percent ($414 million). See table 25.29. Figure 25.19 shows United States trade figures from 1983 to 2001.
Table 25.27. Trade with the United States1, 2, 3
| Export (fob) | Imports (cif) | Balance of merchandise trade (fob-cif) | |
|---|---|---|---|
1Exports are valued fob (free on board at New Zealand ports before export). Re-exports are included. 2Imports are valued cif(cost including insurance and freight). 3Figures are calculated on unrounded data. Source: Statistics New Zealand | |||
| Year ended June | $(million) | ||
| 1990 | 1,979 | 2,798 | -819 |
| 1991 | 2,047 | 2,610 | -562 |
| 1992 | 2,293 | 2,808 | -515 |
| 1993 | 2,257 | 3,199 | -942 |
| 1994 | 2,229 | 3,321 | -1,093 |
| 1995 | 2,142 | 4,274 | -2,132 |
| 1996 | 1,860 | 3,687 | -1,827 |
| 1997 | 2,085 | 3,623 | -1,538 |
| 1998 | 2,596 | 3,974 | -1,379 |
| 1999 | 3,005 | 4,283 | -1,277 |
| 2000 | 3,739 | 5,127 | -1,388 |
| 2001 | 4,644 | 5,298 | -654 |
Table 25.28. Main commodities exported to the United States1, 2
| Year ended June 1997 | Year ended June 1998 | Year ended June 1999 | Year ended June 2000 | Year ended June 2001 | |
|---|---|---|---|---|---|
1Exports are valued fob (free on board at New Zealand ports before export). Re-exports are included. 2Figures are calculated on unrounded data. 3Export values exclude confidential data. This affects the latest 12 or 24 months. 4Data that is no longer confidential is assigned to specific commodities. Source: Statistics New Zealand | |||||
| Commodity | $(million) | ||||
| Meat and edible offal | 570 | 799 | 782 | 1,080 | 1,220 |
| Casein and caseinates | 263 | 327 | 385 | 441 | 588 |
| Logs, wood and wood articles | 112 | 149 | 212 | 311 | 377 |
| Milk powder, butter and cheese | 138 | 170 | 251 | 273 | 275 |
| Mechanical machinery and equipment | 79 | 132 | 154 | 180 | 253 |
| Fish, crustaceans and molluscs | 202 | 182 | 240 | 262 | 248 |
| Electrical machinery and equipment | 68 | 88 | 87 | 142 | 223 |
| Fruit and nuts | 79 | 103 | 133 | 143 | 141 |
| Vehicles, parts and accessories | 37 | 35 | 42 | 92 | 134 |
| Optical, medical and measuring equipment | 30 | 66 | 86 | 92 | 93 |
| Other commodities3 | 508 | 544 | 633 | 722 | 1.011 |
| Confidential data4 | 0 | 0 | 0 | 1 | 81 |
| All merchandise exports to USA | 2,085 | 2,596 | 3,005 | 3,739 | 4,644 |
Table 25.29. Main commodities imported from the United States1, 2
| Year ended June 1997 | Year ended June 1998 | Year ended June 1999 | Year ended June 2000 | Year ended June 2001 | |
|---|---|---|---|---|---|
1Imports are valued cif (cost, including insurance and freight to New Zealand). 2Figures are calculated on unrounded data. 3Import values exclude confidential data. This affects the latest 6 or 12 months. 4Data that is no longer confidential is assigned to specific commodities. Source: Statistics New Zealand | |||||
| Commodity | $(million) | ||||
| Mechanical machinery and equipment | 984 | 1,086 | 1,043 | 1,079 | 1,114 |
| Electrical machinery and equipment3 | 472 | 542 | 490 | 691 | 929 |
| Aircraft and parts | 226 | 348 | 738 | 1,191 | 777 |
| Optical, medical and measuring equipment | 235 | 260 | 273 | 282 | 342 |
| Plastics and plastic articles3 | 214 | 215 | 194 | 220 | 248 |
| Vehicles, parts and accessories | 182 | 178 | 154 | 221 | 218 |
| Organic chemicals3 | 89 | 104 | 119 | 112 | 137 |
| Petroleum and products | 47 | 52 | 57 | 53 | 125 |
| Other chemical products | 98 | 83 | 110 | 100 | 116 |
| Books, newspapers and printed matter | 70 | 77 | 83 | 85 | 102 |
| Other commodities3 | 1,007 | 1,030 | 1,022 | 1,093 | 1,189 |
| Confidential data4 | 0 | 0 | 0 | 0 | 0 |
| All merchandise imports from the USA | 3,623 | 3,974 | 4,283 | 5,127 | 5,298 |
Japan is New Zealand's third main trading partner (after Australia and the United States) for both merchandise exports and merchandise imports. Merchandise exports to Japan in the year ended June 2001 were up by 26.9 percent ($906 million) from the previous June year, while merchandise imports were down by 1.4 percent ($47 million). See table 25.30 for the value of trade with Japan.
Main contributors to the rise in exports were aluminium and aluminium articles, up 25.9 percent ($166 million), and logs, wood and wood articles, up 29.4 percent ($164 million).
Main contributor to the fall in imports was vehicles, parts and accessories, down 6.7 percent ($125 million). Exports and imports are provided in tables 25.31 and 25.32.
Table 25.3. Trade with Japan1, 2, 3
| Exports (fob) | Imports (cif) | Balance of merchandise trade (fob-cif) | |
|---|---|---|---|
1Exports are valued fob (free on board at New Zealand ports before export). Re-exports are included. 2Imports are valued cif (cost including insurance and freight). 3Figures are calculated on unrounded data. Source: Statistics New Zealand | |||
| Year ended June | $(million) | ||
| 1990 | 2,486 | 2,652 | -167 |
| 1991 | 2,611 | 2,337 | 274 |
| 1992 | 2,715 | 2,375 | 340 |
| 1993 | 2,759 | 2,653 | 106 |
| 1994 | 2,887 | 2,928 | -41 |
| 1995 | 3,417 | 3,176 | 241 |
| 1996 | 3,302 | 2,885 | 417 |
| 1997 | 3,138 | 2,846 | 292 |
| 1998 | 3,030 | 2,539 | 490 |
| 1999 | 2,878 | 3,056 | -178 |
| 2000 | 3,371 | 3,474 | -103 |
| 2001 | 4,277 | 3,427 | 850 |
Table 25.31. Main commodities exported to Japan1, 2
| Year ended June 1997 | Year ended June 1998 | Year ended June 1999 | Year ended June 2000 | Year ended June 2001 | |
|---|---|---|---|---|---|
1Exports are valued fob (free on board at New Zealand ports before export). Re-exports are included. 2Figures are calculated on unrounded data. 3Export values exclude confidential data. This affects the latest 12 or 24 months. 4Data that is no longer confidential is assigned to specific commodities. Source: Statistics New Zealand | |||||
| Commodity | $(million) | ||||
| Aluminium and aluminium articles | 424 | 560 | 501 | 642 | 808 |
| Logs, wood and wood articles | 663 | 508 | 478 | 559 | 723 |
| Milk powder, butter and cheese | 245 | 269 | 282 | 275 | 348 |
| Fish, crustaceans and molluscs | 306 | 254 | 246 | 292 | 320 |
| Meat and edible offal | 163 | 172 | 159 | 160 | 199 |
| Vegetables | 133 | 148 | 162 | 177 | 196 |
| Organic chemicals3 | 205 | 174 | 112 | 158 | 194 |
| Fruit and nuts | 112 | 128 | 132 | 145 | 170 |
| Casein and caseinates | 100 | 79 | 107 | 92 | 141 |
| Miscellaneous edible preparations | 27 | 20 | 25 | 46 | 89 |
| Other commodities3 | 760 | 716 | 675 | 789 | 916 |
| Confidential data4 | 0 | 0 | 0 | 35 | 172 |
| All merchandise exports to Japan | 3,138 | 3,030 | 2,878 | 3,371 | 4,277 |
Table 25.32. Main commodities imported from Japan1, 2
| Year ended June 1997 | Year ended June 1998 | Year ended June 1999 | Year ended June 2000 | Year ended June 2001 | |
|---|---|---|---|---|---|
1Imports are valued cif (cost, including insurance and freight to New Zealand). 2Figures are calculated on unrounded data. 3Import values exclude confidential data. This affects the latest 6 or 12 months. 4Data that is no longer confidential is assigned to specific commodities. Source: Statistics New Zealand | |||||
| Commodity | $(million) | ||||
| Vehicles, parts and accessories | 1,401 | 1,142 | 1,646 | 1,858 | 1,733 |
| Mechanical machinery and equipment | 424 | 421 | 407 | 496 | 500 |
| Electrical machinery and equipment3 | 276 | 261 | 268 | 310 | 316 |
| Optical, medical and measuring equipment | 132 | 142 | 121 | 152 | 158 |
| Iron and steel and articles3 | 122 | 116 | 101 | 115 | 120 |
| Plastics and plastic articles3 | 65 | 70 | 63 | 90 | 76 |
| Rubber and rubber articles | 62 | 61 | 68 | 70 | 75 |
| Photographic films, papers and chemicals | 36 | 44 | 42 | 50 | 60 |
| Paper and paperboard and articles | 28 | 26 | 36 | 43 | 37 |
| Toys, games and sports requisites | 19 | 29 | 40 | 23 | 33 |
| Other commodities3 | 280 | 228 | 263 | 268 | 318 |
| Confidential data4 | 0 | 0 | 0 | 0 | 1 |
| All merchandise imports from Japan | 2,846 | 2,539 | 3,056 | 3,474 | 3,427 |
The United Kingdom was New Zealand's largest trading partner until the late 1970s when Australia, Japan and the United States became dominant.
In the year ended June 2001, the United Kingdom received $1.552 billion of New Zealand's merchandise exports, down 3.5 percent ($57 million) from the previous June year. Main commodities exported were meat and edible meat offal ($541 million), milk powder, butter and cheese ($233 million), wool ($123 million) and fruit and nuts ($104 million). See table 25.33.
New Zealand's merchandise imports from the United Kingdom for the year ended June 2001 totalled $1.187 billion, up 2.3 percent ($26 million) from the previous June year. Main commodities imported were vehicles, parts and accessories ($201 million), mechanical machinery and equipment ($155 million) and electrical machinery and equipment ($121 million). The value of imports is provided in table 25.34.
Table 25.33. Main commodities exported to the United Kingdom1, 2
| Year ended June 1997 | Year ended June 1998 | Year ended June 1999 | Year ended June 2000 | Year ended June 2001 | |
|---|---|---|---|---|---|
1Exports are valued fob (free on board at New Zealand ports before export). Re-exports are included. 2Figures are calculated on unrounded data. 3Export values exclude confidential data. This affects the latest 12 or 24 months. 4Data that is no longer confidential is assigned to specific commodities. Source: Statistics New Zealand | |||||
| Commodity | $(million) | ||||
| Meat and edible offal | 504 | 446 | 439 | 468 | 541 |
| Milk powder, butter and cheese | 378 | 356 | 266 | 255 | 233 |
| Wool | 110 | 124 | 103 | 104 | 123 |
| Fruit and nuts | 86 | 71 | 151 | 139 | 104 |
| Beverages, spirits and vinegar | 48 | 54 | 69 | 86 | 95 |
| Electrical machinery and equipment3 | 35 | 43 | 59 | 55 | 70 |
| Mechanical machinery and equipment | 26 | 45 | 49 | 50 | 49 |
| Fish, crustaceans and molluscs | 12 | 13 | 28 | 21 | 28 |
| Vegetables | 16 | 27 | 31 | 19 | 25 |
| Albumins, gelatin, glues and enzymes | 4 | 3 | 5 | 12 | 24 |
| Other commodities3 | 136 | 145 | 203 | 401 | 258 |
| Confidential data4 | 0 | 0 | 0 | 0 | 1 |
| All merchandise exports to the UK | 1,354 | 1,327 | 1,401 | 1,609 | 1,552 |
Table 25.34. Main commodities imported from the United Kingdom1, 2
| Year ended June 1997 | Year ended June 1998 | Year ended June 1999 | Year ended June 2000 | Year ended June 2001 | |
|---|---|---|---|---|---|
1Imports are valued cif (cost. including insurance and freight to New Zealand). 2Figures arc calculated on unrounded data. 3Import values exclude confidential data. This affects the latest 6 or 12 months. 4Data that is no longer confidential is assigned to specific commodities. Source: Statistics New Zealand | |||||
| Commodity | $(million) | ||||
| Vehicles, parts and accessories | 181 | 155 | 140 | 182 | 201 |
| Mechanical machinery and equipment | 163 | 208 | 130 | 136 | 155 |
| Electrical machinery and equipment3 | 110 | 115 | 118 | 109 | 121 |
| Pharmaceutical products | 76 | 100 | 79 | 91 | 103 |
| Books, newspapers and printed matter | 81 | 83 | 90 | 85 | 85 |
| Plastics and plastic articles3 | 55 | 58 | 52 | 60 | 58 |
| Optical, medical and measuring equipment | 50 | 59 | 56 | 53 | 54 |
| Textiles and textile articles | 49 | 53 | 51 | 45 | 49 |
| Beverages, spirits and vinegar | 24 | 25 | 26 | 26 | 34 |
| Iron and steel and articles3 | 52 | 46 | 37 | 45 | 34 |
| Other commodities3 | 292 | 296 | 287 | 329 | 292 |
| Confidential data4 | 0 | 0 | 0 | 0 | 1 |
| All merchandise imports from the UK | 1,133 | 1,199 | 1,066 | 1,161 | 1,187 |
APEC (Asia Pacific Economic Cooperation) provides 21 countries in the region (including New Zealand, Australia, Japan and the United States) with a forum to promote economic interaction and policy coordination to ensure regional economic growth.
APEC countries received 73 percent ($23.304 billion) of New Zealand's merchandise exports in the year ended June 2001, compared with 72.1 percent in the previous June year.
APEC countries supplied 71.3 percent ($22.769 billion) of New Zealand's merchandise imports in the year ended June 2001, compared with 73.1 percent in the previous June year. Figure 25.20 shows trade with APEC countries since 1990.
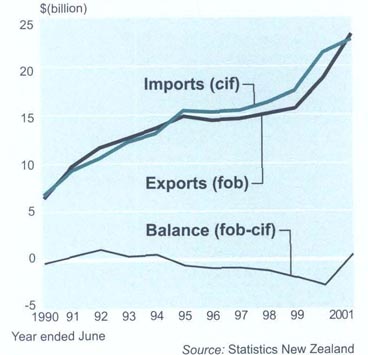
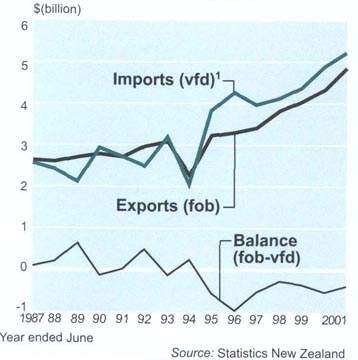
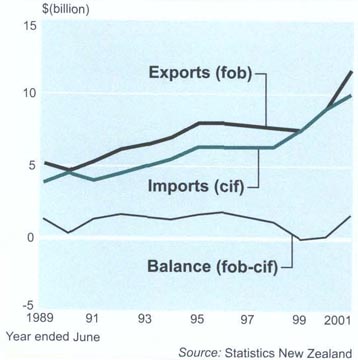
The European Union (EU) was formed in 1993 and replaced the earlier European Economic Community (EEC). EU founding members were Belgium, Denmark, France, Germany, Greece, Ireland, Italy, Luxembourg, the Netherlands, Portugal, Spain and the United Kingdom. In 1995, Austria, Finland and Sweden became members. Several Eastern European and Mediterranean countries are candidates for membership.
In the year ended June 2001, the EU received 15.1 percent ($4.837 billion) of New Zealand's merchandise exports and supplied 17.5 percent ($5.591 billion) of New Zealand's merchandise imports.
Trading figures for EU countries are shown in Figure 25.21.
Exports to Asia increased during most of the 1990s but were affected in the later years by the Asian economic crisis. Exports recovered, however, in the years ended June 2000 and 2001. Merchandise exports to Asia were $11.724 billion in the year ended June 2001, up 29.2 percent ($2.647 billion) on the previous June year.
In the year ended June 2001, 36.7 percent of New Zealand's merchandise exports went to Asia. Merchandise imports from Asia totalled $ 10.015 billion for the year ended June 2001, up 11.7 percent ($ 1.051 billion) on the previous June year. Asia supplied 31.4 percent of New Zealand's merchandise imports during the June 2001 year.
Tables 25.35 and 25.36 show the value of exports and imports with selected countries and regions since the trade year 1991/92. Figure 25.22 shows Asian trade statistics since 1989.
Table 25.35. Exports to selected regions and country groupings
| Asia | Europe | EU | OECD | APEC | ASEAN | Total exports | |
|---|---|---|---|---|---|---|---|
Source: Statistics New Zealand | |||||||
| fob ($NZ million) | |||||||
| Year ended June | |||||||
| 1992 | 6,210 | 3,086 | 2,946 | 11,976 | 12,179 | 1,309 | 17,840 |
| 1993 | 6,566 | 3,257 | 2,988 | 12,575 | 12,920 | 1,338 | 18,971 |
| 1994 | 6,962 | 3,429 | 3,058 | 13,232 | 13,770 | 1,281 | 19,827 |
| 1995 | 7,990 | 3,498 | 3,213 | 13,837 | 14,763 | 1,446 | 20,790 |
| 1996 | 8,043 | 3,568 | 3,279 | 13,329 | 14,360 | 1,644 | 20,546 |
| 1997 | 7,904 | 3,822 | 3,414 | 14,191 | 14,543 | 1,793 | 21,033 |
| 1998 | 7,616 | 4,185 | 3,811 | 15,440 | 15,062 | 1,663 | 21,990 |
| 1999 | 7,454 | 4,277 | 4,025 | 16,283 | 15,649 | 1,623 | 22,600 |
| 2000 | 9,077 | 4,563 | 4,321 | 18,815 | 18,757 | 2,043 | 26,027 |
| 2001 | 11,724 | 5,101 | 4,837 | 22,426 | 23,304 | 2,911 | 31,939 |
| Percentage of all merchandise exports | |||||||
| Percent | |||||||
| 1992 | 34.8 | 17.3 | 16.5 | 67.1 | 68.3 | 7.3 | 100.0 |
| 1993 | 34.6 | 17.2 | 15.7 | 66.3 | 68.1 | 7.1 | 100.0 |
| 1994 | 35.1 | 17.3 | 15.4 | 66.7 | 69.4 | 6.5 | 100.0 |
| 1995 | 38.4 | 16.8 | 15.5 | 66.6 | 71.0 | 7.0 | 100.0 |
| 1996 | 39.1 | 17.4 | 16.0 | 64.9 | 69.9 | 8.0 | 100.0 |
| 1997 | 37.6 | 18.2 | 16.2 | 67.5 | 69.1 | 8.5 | 100.0 |
| 1998 | 34.6 | 19.0 | 17.3 | 70.2 | 68.5 | 7.6 | 100.0 |
| 1999 | 33.0 | 18.9 | 17.8 | 72.0 | 69.2 | 7.2 | 100.0 |
| 2000 | 34.9 | 17.5 | 16.6 | 72.3 | 72.1 | 7.9 | 100.0 |
| 2001 | 36.7 | 16.0 | 15.1 | 70.2 | 73.0 | 9.1 | 100.0 |
Table 25.36. Imports from selected regions and country groupings
| Asia | Europe | OECD | APEC | EU | ASEAN | Total imports | |
|---|---|---|---|---|---|---|---|
Source: Statistics New Zealand | |||||||
| fob ($NZ million) | |||||||
| Year ended June | |||||||
| 1992 | 4,465 | 3,229 | 12,115 | 10,861 | 2677 | 736 | 15,483 |
| 1993 | 5,083 | 3,724 | 13,585 | 12,197 | 3,057 | 773 | 17,333 |
| 1994 | 5,552 | 4,050 | 14,534 | 13,016 | 3,305 | 858 | 18,469 |
| 1995 | 6,274 | 4,627 | 16,830 | 15,309 | 4,088 | 1,081 | 21,261 |
| 1996 | 6,250 | 4,839 | 16,829 | 15,239 | 4,560 | 1,301 | 21,352 |
| 1997 | 6,344 | 4,604 | 16,811 | 15,352 | 4,242 | 1,272 | 21,324 |
| 1998 | 6,376 | 4,804 | 17,858 | 16,212 | 4,408 | 1,360 | 22,589 |
| 1999 | 7,460 | 5,120 | 18,823 | 17,415 | 4,681 | 1,716 | 24,248 |
| 2000 | 8,964 | 5,533 | 22,253 | 21,335 | 5,191 | 2,114 | 29,193 |
| 2001 | 10,015 | 5,990 | 23,095 | 22,769 | 5,591 | 2,594 | 31,927 |
| Percentage of all merchandise exports | |||||||
| Percent | |||||||
| 1992 | 28.8 | 20.9 | 78.2 | 70.1 | 17.3 | 4.8 | 100.0 |
| 1993 | 29.3 | 21.5 | 78.4 | 70.4 | 17.6 | 4.5 | 100.0 |
| 1994 | 30.1 | 21.9 | 78.7 | 70.5 | 17.9 | 4.6 | 100.0 |
| 1995 | 29.5 | 21.8 | 79.2 | 72.0 | 19.2 | 5.1 | 100.0 |
| 1996 | 29.3 | 22.7 | 78.8 | 71.4 | 21.4 | 6.1 | 100.0 |
| 1997 | 29.8 | 21.6 | 78.8 | 72.0 | 19.9 | 6.0 | 100.0 |
| 1998 | 28.2 | 21.3 | 79.1 | 71.8 | 19.5 | 6.0 | 100.0 |
| 1999 | 30.8 | 21.1 | 77.6 | 71.8 | 19.3 | 7.1 | 100.0 |
| 2000 | 30.7 | 19.0 | 76.2 | 73.1 | 17.8 | 7.2 | 100.0 |
| 2001 | 31.4 | 18.8 | 72.3 | 71.3 | 17.5 | 8.1 | 100.0 |
Overseas cargo records all goods (by value and gross weight) loaded or unloaded at New Zealand's seaports and airports. Overseas cargo statistics, like overseas merchandise trade statistics, are sourced from customs entries. However, there are some conceptual differences between overseas trade statistics and overseas cargo statistics. Some items are included in overseas cargo statistics, but not in overseas merchandise trade statistics. These include goods on short-term loan or lease; service transactions, eg computer data tapes and drawings; goods consigned to New Zealand forces or diplomatic representatives; goods consigned for modification or repair; and returnable containers and samples. Overseas cargo statistics exclude large self-propelled items, such as aircraft and ships that arrive in or depart from New Zealand using their own power. Overseas cargo loaded at New Zealand ports in the year ended June 2001 weighed 22,167 million tonnes, up 0.2 percent on the previous June year. The value of cargo loaded was $32.858 billion, up 24.5 percent. See table 25.37. By cargo weight, the main seaport was Tauranga (28.3 percent of the total loaded), followed by New Plymouth (15.7 percent) and Auckland (9.1 percent). By value, the main seaports were Tauranga (22.2 percent) and Auckland (21.1 percent), followed by Auckland airport (10.7 percent). By weight, air cargo was only 0.4 percent of cargo loaded, but by value it was 15 percent, reflecting the comparatively high value and perishable nature of much air cargo. Figures 25.23 and 25.24 show overseas cargo loaded and unloaded by port in the June 2001 year.
Table 25.37. Overseas cargo loaded at New Zealand ports1, 2, 3
| Value of exports (fob) | Gross weight | |||||
|---|---|---|---|---|---|---|
| Year ended 30 June | Year ended June | |||||
| 1999 | 2000 | 2001 | 1999 | 2000 | 2001 | |
1Overseas cargo includes merchandise freight, goods for repair, loaned and leased goods, military and diplomatic goods, and returnable containers and samples. 2Some statistics may not add to slated totals due to rounding. 3fob = free on board. (The value of goods at New Zealand ports before export.) Re-exports are included. R = revised Source: Statistics New Zealand | ||||||
| New Zealand port | $(million) | tonnes | ||||
| Tauranga | 3,454R | 5,511 | 7,283 | 5,348,173 | 6,360,471 | 6,271,172 |
| New Plymouth | 943R | 1,285 | 1,923 | 3,779,829 | 3,680,465 | 3,475,091 |
| Auckland | 6,310R | 5,589 | 6,948 | 2,228,911 | 2,007,186 | 2,026,570 |
| Napier | 1,399 | 1,678 | 2,119 | 1,046,603 | 1,432,624 | 1,599,986 |
| Whangarei | 188R | 276 | 306 | 662,830 | 1,035,654 | 1,068,918 |
| Taharoa | 22R | 27 | 23 | 744,857 | 1,229,395 | 876,393 |
| Wellington | 1,449 | 1,264 | 1,423 | 563,102 | 527,434 | 613,994 |
| Gisborne | 97 | 104 | 135 | 514,148 | 547,000 | 570,364 |
| North Island sea ports | 13,861R | 15,733 | 20,160 | 14,888,453 | 16,820,229 | 16,502,488 |
| Lyttelton | 2,611 | 2,722 | 2,902 | 2,047,101 | 2,339,088 | 2,442,206 |
| Nelson | 754 | 756 | 852 | 925,968 | 1,127,452 | 1,175,688 |
| Dunedin | 1,204 | 1,444 | 2,248 | 823,426 | 836,917 | 978,532 |
| Invercargill (Bluff) | 825 | 1,042 | 1,250 | 492,688 | 649,996 | 644,883 |
| Timaru | 163 | 240 | 501 | 106,083 | 142,086 | 226,978 |
| Picton | 10 | 11 | 13 | 76,295 | 71,734 | 105,510 |
| Greymouth | – | 1 | – | – | 519 | 236 |
| Westport | 13 | 4 | – | 140,162 | 50,029 | – |
| South Island sea ports | 5,579 | 6,218 | 7,766 | 4,611,723 | 5,217,821 | 5,574,032 |
| New Zealand sea ports | 19,441 | 21,952 | 27,927 | 19,500,176 | 22,038,051 | 22,076,519 |
| Auckland airport | 2,988 | 3,274 | 3,520 | 68,030 | 69,163 | 67,363 |
| Christchurch airport | 798 | 1,025 | 1,289 | 18,196 | 18,737 | 20,424 |
| Wellington airport | 136 | 134 | 113 | 4,454 | 3,951 | 2,785 |
| Total airports | 3,922 | 4,433 | 4,922 | 90,680 | 91,851 | 90,571 |
| Parcel post | 12 | 9 | 9 | 17 | 8 | 9 |
| Total cargo loaded | 23,375 | 26,394 | 32,858 | 19,590,872 | 22,129,909 | 22,167,100 |
More than 42 percent of New Zealand's overseas cargo by value was unloaded at Ports of Auckland in the year ended June 2001.
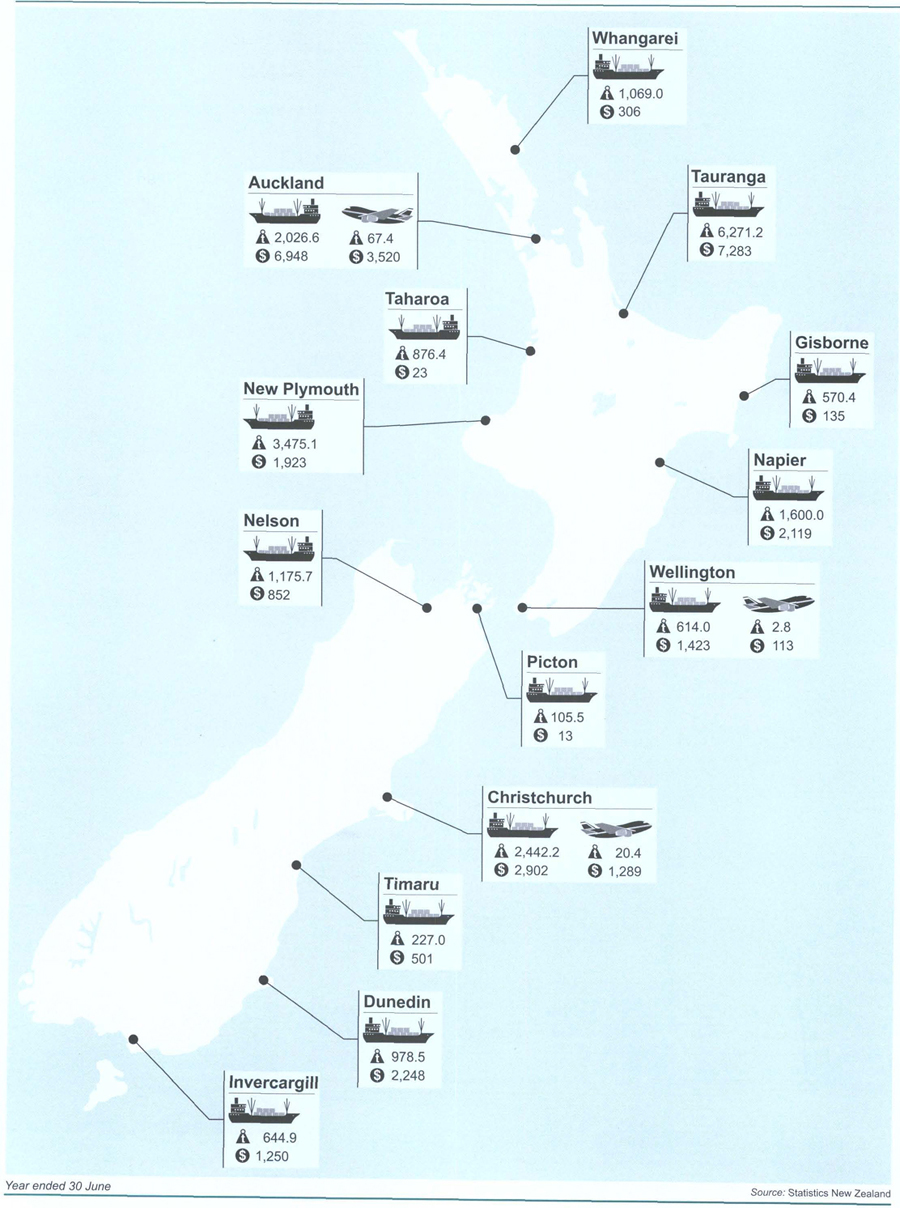
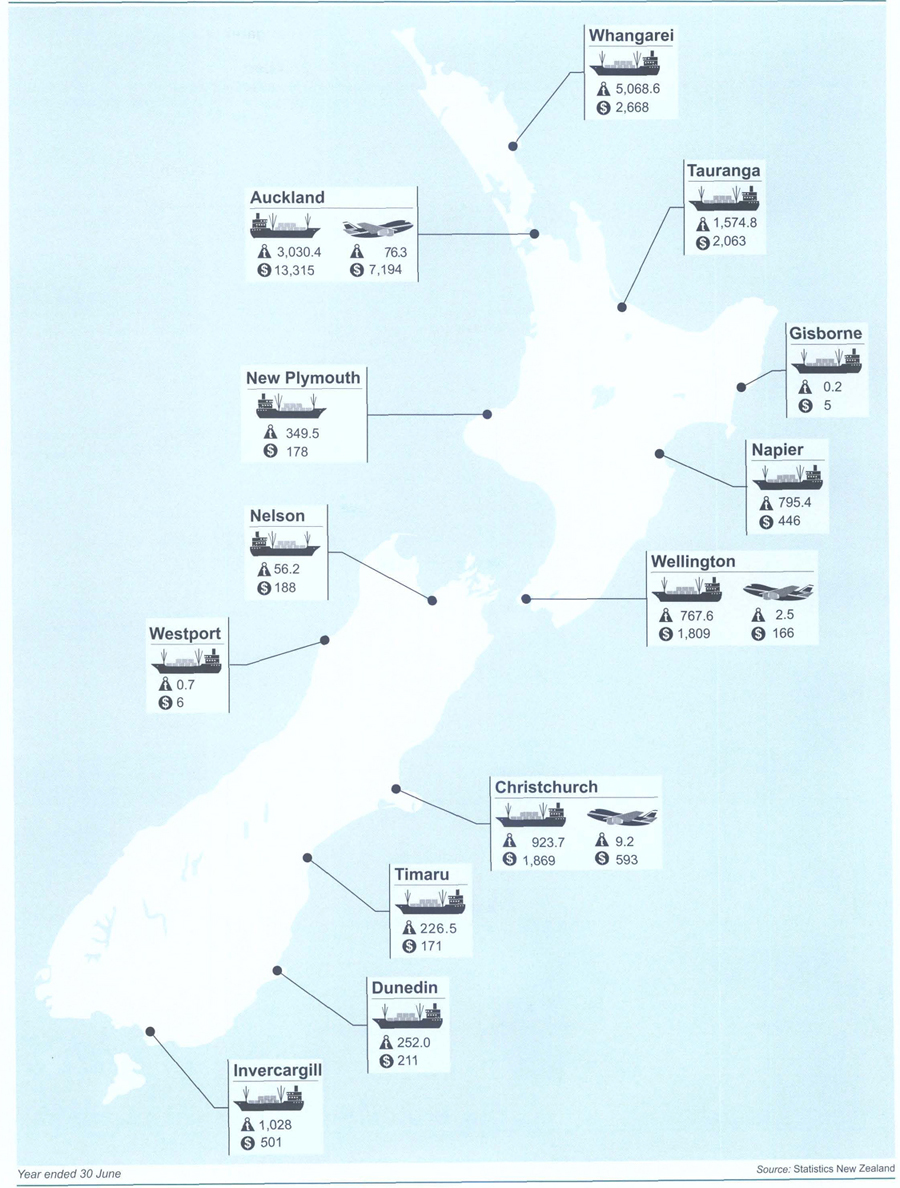
Overseas cargo unloaded at New Zealand ports in the year ended June 2001 weighed 14,162 million tonnes, up 4.1 percent from the previous June year. The value of cargo unloaded was $31.448 billion, up 15.4 percent. By cargo weight, the main port was Whangarei seaport (which handled 35.8 percent of the total unloaded), followed by Auckland seaport (21.4 percent). By value, the main port was Auckland seaport (42.3 percent), followed by Auckland airport (22.9 percent). By weight, air cargo was only 0.6 percent of cargo unloaded, but by value it represented 25.3 percent. See table 25.38.
Table 25.38. Overseas cargo unloaded at New Zealand ports1, 2, 3
| Value of imports (cif) | Gross weight | |||||
|---|---|---|---|---|---|---|
| Year ended 30 June | Year ended 30 June | |||||
| 1999 | 2000 | 2001 | 1999 | 2000 | 2001 | |
1Overseas cargo includes merchandise freight, goods for repair, loaned and leased goods, military and diplomatic goods, and returnable containers and samples. 2Some statistics may not add to staled totals due to rounding. 3cif = cost of goods, including insurance and freight to New Zealand. Source: Statistics New Zealand | ||||||
| New Zealand port | $(million) | tonnes | ||||
| Whangarei | 1,003 | 1,624 | 2,668 | 4,883,705 | 4,616,762 | 5,068,600 |
| Auckland | 11,334 | 11,969 | 13,315 | 3,035,776 | 3,184,953 | 3,030,421 |
| Tauranga | 589 | 1,719 | 2,063 | 1,057,023 | 1,404,757 | 1,574,848 |
| Napier | 333 | 379 | 446 | 549,606 | 642,403 | 795,421 |
| Wellington | 1,412 | 1,677 | 1,809 | 686,268 | 831,755 | 767,622 |
| New Plymouth | 91 | 155 | 178 | 253,535 | 373,489 | 349,500 |
| Gisborne | 7 | 2 | 5 | 8,151 | 280 | 232 |
| North Island sea ports | 14,771 | 17,524 | 20,485 | 10,474,063 | 11,054,401 | 11,586,644 |
| Invercargill (Bluff) | 354 | 389 | 501 | 936,250 | 973,534 | 1,027,936 |
| Lyttelton | 1,498 | 1,789 | 1,869 | 797,606 | 975,400 | 923,674 |
| Dunedin | 186 | 192 | 211 | 226,845 | 227,897 | 252,041 |
| Timaru | 50 | 89 | 171 | 151,032 | 180,101 | 226,512 |
| Nelson | 126 | 159 | 188 | 59,936 | 96,079 | 56,165 |
| Westport | – | – | 6 | – | – | 671 |
| South Island sea ports | 2,213 | 2,619 | 2,946 | 2,171,669 | 2,453,011 | 2,486,999 |
| New Zealand sea ports | 16,984 | 20,143 | 23,431 | 12,645,733 | 13,507,412 | 14,073,643 |
| Auckland airport | 5,575 | 6,304 | 7,194 | 77,260 | 80,079 | 76,277 |
| Christchurch airport | 535 | 524 | 593 | 8,728 | 8,959 | 9,234 |
| Wellington airport | 216 | 220 | 166 | 3,971 | 3,191 | 2,535 |
| Hamilton airport | – | – | – | – | 2 | – |
| Total airports | 6,326 | 7,048 | 7,953 | 89,959 | 92,230 | 88,046 |
| Parcel post | 59 | 62 | 64 | 166 | 205 | 134 |
| Total cargo unloaded | 23,369 | 27,253 | 31,448 | 12,735,857 | 13,599,847 | 14,161,823 |
Overseas trade indexes measure changes in the levels of prices and volumes of New Zealand's imports and exports. Statistics New Zealand produces price indexes for services and merchandise trade exports and imports and volume indexes for merchandise trade.
The merchandise trade index numbers (see Figure 25.25), which reflect the percentage rise or fall of price and volume levels, are expressed on a base of the year ended June 1989 (= 1000).
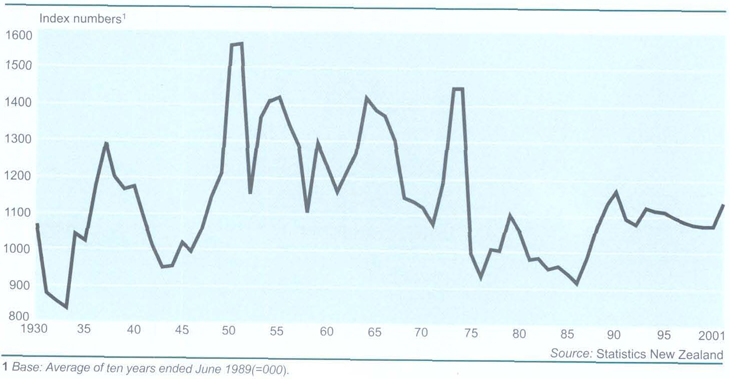
Data used in calculating the merchandise trade export and import price and volume indexes is derived from Statistics New Zealand's overseas trade data, which is in turn processed from import and export entry forms lodged with the New Zealand Customs Service.
The merchandise trade indexes cover all commodities classified as merchandise trade, although the export indexes exclude re-exports, bunkering, ships' stores and passengers' effects. Import indexes use ‘cost including insurance and freight’ (cif) values, while export indexes are calculated using ‘free on board’ (fob) values.
The services trade index numbers (see Figure 25.26) are expressed on a base of the quarter ended June 1997 (=1000).
Data used in calculating the weights for the service indexes is derived from the balance of payments current account.
The prices used in the service indexes are from Statistics New Zealand's Commodity Price Survey and international price indexes.
Services trade indexes exist for the service components of transportation, travel, government services and other services.
Overseas terms of trade indexes measure the changing volume of imports that can be funded by a unit volume of New Zealand's exports.
The indexes are calculated as the ratio of the total export price index to the total import price index.
An increase in a terms of trade index indicates that the real purchasing power of exports has increased, while a decrease indicates a drop in the purchasing power of exports.
The overseas merchandise terms of trade index is expressed on a base of the average of the 10 years ended June 1989 (=1000).
An index value above or below 1000 indicates the terms of trade are either more or less favourable than the average for the 1980–89 base period.
The overseas services terms of trade index is expressed on a base of the quarter ended June 1997.
Table 25.39 provides the indexes for export and import prices.
Table 25.39. Indexes for export and import prices and terms of trade
| Merchandise | Services1 | |||||
|---|---|---|---|---|---|---|
| Exports price index | Imports price index2 | Terms of trade index2 | Exports price index | Imports price index | Terms of trade index | |
1 Base: Quarter ended June 1997 (=1000). 2Base: Year ended June 1989 (=1000). 3Base: The average of the 10 years ended June 1989 (=1000). 4Annual indexes for merchandise trade are volume weighted averages whereas the services indexes are simple averages. R = revised Source: Statistics New Zealand | ||||||
| June year4 | ||||||
| 1990 | 1064 | 1034 | 1172 | – | – | – |
| 1991 | 1004 | 1044 | 1095 | – | – | – |
| 1992 | 1031 | 1086 | 1081 | – | – | – |
| 1993 | 1115 | 1129 | 1125 | – | – | – |
| 1994 | 1067 | 1087 | 1118 | – | – | – |
| 1995 | 1054 | 1076 | 1115 | – | – | – |
| 1996 | 1031 | 1069 | 1098 | – | – | – |
| 1997 | 979 | 1026 | 1087 | 1000 | 1000 | 1000 |
| 1998 | 1004 | 1057 | 1082 | 1024 | 1086 | 943 |
| 1999 | 1024 | 1084 | 1076 | 1042 | 1154 | 903 |
| 2000 | 1099 | 1161 | 1078 | 1067 | 1209 | 882 |
| 2001 | 1326 | 1324 | 1141 | 1142 | 1379 | 828 |
| Quarterly | ||||||
| 1999 Mar | 1006 | 1078 | 1062 | 1035 | 1140 | 908 |
| Jun | 1021 | 1085 | 1072 | 1033 | 1122 | 921 |
| Sep | 1053 | 1085 | 1106 | 1035 | 1162 | 891 |
| Dec | 1083 | 1144 | 1078 | 1053 | 1187 | 887 |
| 2000 Mar | 1103 | 1199 | 1048 | 1090 | 1241 | 878 |
| Jun | 1149 | 1230 | 1064 | 1089 | 1247 | 873 |
| Sep | 1261 | 1293 | 1111 | 1106 | 1320R | 838R |
| Dec | 1362 | 1393 | 1113 | 1157 | 1444R | 801R |
| 2001 Mar | 1325 | 1288 | 1171 | 1150 | 1363R | 844R |
| Jun | 1348 | 1316 | 1167 | 1153 | 1388R | 831R |
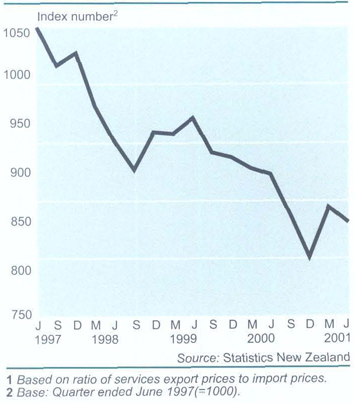
Tables 25.40 and 25.41 provide a summary of changes in the export and import price indexes for merchandise trade.
Table 25.4. Merchandise export price indexes1
| All pastoral and dairy products | Fish and fish preparations | Food and beverages | Forestry products | Non-fuel crude materials | Non-food manufactured goods | Total exports2 | ||||||
|---|---|---|---|---|---|---|---|---|---|---|---|---|
| Dairy products | Meat, wool and by-products | Aluminium | Total2 | |||||||||
| Meat | Wool | Total2 | Total2 | |||||||||
1Year ended June 1989 (=1000). 2Includes commodities not listed. Source: Statistics New Zealand | ||||||||||||
| June year | ||||||||||||
| 1991 | 1039 | 1193 | 697 | 975 | 995 | 1005 | 1077 | 1000 | 848 | 856 | 959 | 1004 |
| 1992 | 1108 | 1224 | 639 | 982 | 1037 | 1210 | 1156 | 995 | 834 | 721 | 946 | 1031 |
| 1993 | 1281 | 1309 | 675 | 1054 | 1123 | 1330 | 1252 | 1144 | 955 | 726 | 971 | 1115 |
| 1994 | 1154 | 1235 | 636 | 1007 | 1052 | 1240 | 1157 | 1277 | 1005 | 672 | 932 | 1067 |
| 1995 | 1055 | 1083 | 779 | 993 | 999 | 1266 | 1066 | 1226 | 1043 | 865 | 1004 | 1054 |
| 1996 | 1194 | 1027 | 760 | 945 | 1006 | 1177 | 1078 | 1219 | 1000 | 803 | 948 | 1031 |
| 1997 | 1058 | 1074 | 680 | 956 | 964 | 1134 | 1032 | 1039 | 922 | 703 | 892 | 979 |
| 1998 | 1123 | 1078 | 671 | 953 | 991 | 1142 | 1068 | 1067 | 927 | 819 | 920 | 1004 |
| 1999 | 1180 | 1184 | 618 | 984 | 1041 | 1297 | 1156 | 1035 | 883 | 775 | 898 | 1024 |
| 2000 | 1125 | 1307 | 607 | 1052 | 1051 | 1528 | 1193 | 1202 | 958 | 937 | 971 | 1099 |
| 2001 | 1499 | 1513 | 682 | 1233 | 1280 | 1733 | 1437 | 1342 | 1086 | 1142 | 1198 | 1326 |
| Quarterly | ||||||||||||
| 1999 Mar | 1145 | 1163 | 609 | 976 | 1023 | 1319 | 1138 | 1027 | 875 | 743 | 876 | 1006 |
| Jun | 1121 | 1207 | 604 | 982 | 1040 | 1354 | 1163 | 1041 | 854 | 729 | 881 | 1021 |
| Sept | 1096 | 1292 | 597 | 1024 | 1033 | 1434 | 1174 | 1112 | 893 | 829 | 920 | 1053 |
| Dec | 1086 | 1258 | 652 | 1029 | 1049 | 1512 | 1187 | 1180 | 953 | 923 | 952 | 1083 |
| 2000 Mar | 1139 | 1311 | 589 | 1051 | 1039 | 1567 | 1182 | 1228 | 964 | 1005 | 987 | 1103 |
| Jun | 1185 | 1350 | 581 | 1093 | 1077 | 1642 | 1223 | 1282 | 1018 | 1000 | 1021 | 1149 |
| Sept | 1347 | 1387 | 663 | 1141 | 1177 | 1701 | 1332 | 1400 | 1092 | 1081 | 1140 | 1261 |
| Dec | 1505 | 1486 | 742 | 1233 | 1306 | 1793 | 1466 | 1407 | 1137 | 1194 | 1232 | 1362 |
| 2001 Mar | 1493 | 1529 | 644 | 1240 | 1287 | 1723 | 1445 | 1315 | 1066 | 1134 | 1201 | 1325 |
| Jun | 1609 | 1603 | 666 | 1291 | 1325 | 1713 | 1485 | 1249 | 1049 | 1154 | 1216 | 1348 |
Table 25.41. Merchandise import price indexes1
| Non-food manufactured goods | |||||||||||
|---|---|---|---|---|---|---|---|---|---|---|---|
| Food and beverages | Petroleum and petroleum products | Non-fuel crude materials | Plastic and non-plastic articles | Textile yarn, fabrics and related products | Iron and steel2 | Non-electrical machinery | Electrical machinery and apparatus | Transport equipment | Total3 | Total imports3 | |
1Year ended June 1989 (=1000). 2Excludes manufactured articles of steel. 3Includes commodities not listed. Source: Statistics New Zealand | |||||||||||
| June year | |||||||||||
| 1991 | 1038 | 1570 | 1032 | 858 | 1046 | 999 | 988 | 988 | 1064 | 1004 | 1044 |
| 1992 | 1078 | 1392 | 1049 | 798 | 1100 | 1070 | 1056 | 1052 | 1226 | 1065 | 1086 |
| 1993 | 1098 | 1466 | 1027 | 804 | 1100 | 1027 | 1105 | 1107 | 1383 | 1111 | 1129 |
| 1994 | 1054 | 1171 | 960 | 737 | 1024 | 949 | 1070 | 1114 | 1450 | 1090 | 1087 |
| 1995 | 1038 | 1175 | 988 | 788 | 1030 | 934 | 1054 | 1037 | 1472 | 1076 | 1076 |
| 1996 | 1042 | 1169 | 998 | 769 | 1010 | 1011 | 1030 | 1006 | 1440 | 1067 | 1069 |
| 1997 | 1042 | 1277 | 950 | 690 | 975 | 926 | 971 | 958 | 1409 | 1009 | 1026 |
| 1998 | 1103 | 1168 | 1011 | 726 | 1051 | 979 | 979 | 978 | 1475 | 1044 | 1057 |
| 1999 | 1157 | 1086 | 1027 | 702 | 1094 | 969 | 1071 | 1012 | 1401 | 1078 | 1084 |
| 2000 | 1145 | 1817 | 1059 | 771 | 1127 | 1035 | 1117 | 980 | 1482 | 1116 | 1161 |
| 2001 | 1271 | 2674 | 1230 | 896 | 1271 | 1223 | 1244 | 1038 | 1583 | 1230 | 1324 |
| Quarterly | |||||||||||
| 1999 Mar | 1143 | 942 | 1009 | 680 | 1059 | 945 | 1098 | 1013 | 1369 | 1087 | 1078 |
| Jun | 1146 | 1184 | 997 | 667 | 1063 | 950 | 1090 | 1014 | 1412 | 1076 | 1085 |
| Sept | 1127 | 1409 | 997 | 703 | 1079 | 962 | 1076 | 951 | 1391 | 1060 | 1085 |
| Dec | 1140 | 1754 | 1043 | 759 | 1116 | 996 | 1107 | 942 | 1504 | 1103 | 1144 |
| 2000 Mar | 1162 | 1917 | 1102 | 804 | 1130 | 1079 | 1144 | 1020 | 1507 | 1145 | 1199 |
| Jun | 1157 | 2144 | 1101 | 833 | 1199 | 1118 | 1144 | 1016 | 1520 | 1170 | 1230 |
| Sept | 1236 | 2655 | 1175 | 885 | 1248 | 1194 | 1234 | 1013 | 1529 | 1201 | 1293 |
| Dec | 1305 | 3,041 | 1284 | 934 | 1357 | 1303 | 1320 | 1070 | 1611 | 1286 | 1393 |
| 2001 Mar | 1271 | 2434 | 1226 | 867 | 1221 | 1198 | 1194 | 1012 | 1600 | 1203 | 1288 |
| Jun | 1269 | 2616 | 1231 | 892 | 1255 | 1192 | 1221 | 1052 | 1598 | 1225 | 1316 |
Table 25.42 shows changes in the price indexes of overseas trade in services.
Table 25.42. Price indexes of overseas trade in services1
| Services exports | Services imports | |||||||||
|---|---|---|---|---|---|---|---|---|---|---|
| Transportation | Travel | Other services | Govt services | Total exports | Transportation | Travel | Other services | Govt services | Total imports | |
1Base: Quarter ended June 1997 (=1000). Source: Statistics New Zealand | ||||||||||
| June year | ||||||||||
| 1999 | 1039 | 1026 | 1114 | 1021 | 1042 | 1055 | 1219 | 1191 | 1272 | 1154 |
| 2000 | 1103 | 1061 | 1024 | 1035 | 1067 | 1081 | 1328 | 1227 | 1415 | 1209 |
| 2001 | 1254 | 1100 | 1086 | 1069 | 1142 | 1203 | 1538 | 1405 | 1702 | 1379 |
| Quarterly | ||||||||||
| 1998 Sep | 1039 | 1014 | 1213 | 1032 | 1050 | 1086 | 1253 | 1257 | 1312 | 1197 |
| Dec | 1037 | 1023 | 1182 | 1032 | 1050 | 1060 | 1214 | 1196 | 1276 | 1155 |
| 1999 Mar | 1044 | 1032 | 1034 | 1012 | 1035 | 1043 | 1216 | 1165 | 1262 | 1140 |
| Jun | 1037 | 1034 | 1026 | 1007 | 1033 | 1031 | 1194 | 1146 | 1236 | 1122 |
| Sep | 1037 | 1042 | 1012 | 1010 | 1035 | 1043 | 1267 | 1184 | 1321 | 1162 |
| Dec | 1066 | 1063 | 1002 | 1030 | 1053 | 1058 | 1302 | 1206 | 1385 | 1187 |
| 2000 Mar | 1154 | 1072 | 1037 | 1052 | 1090 | 1102 | 1377 | 1251 | 1466 | 1241 |
| Jun | 1155 | 1067 | 1045 | 1046 | 1089 | 1119 | 1364 | 1265 | 1489 | 1247 |
| Sep | 1178 | 1080 | 1061 | 1058 | 1106 | 1146 | 1495 | 1330 | 1595 | 1320 |
| Dec | 1305 | 1098 | 1101 | 1074 | 1157 | 1242 | 1627 | 1474 | 1826 | 1444 |
| 2001 Mar | 1269 | 1110 | 1083 | 1071 | 1150 | 1199 | 1501 | 1396 | 1676 | 1363 |
| Jun | 1265 | 1113 | 1098 | 1071 | 1153 | 1225 | 1527 | 1418 | 1711 | 1388 |
Table 25.43 and Figure 25.27 provide a summary of the export volume indexes and table 25.44 and Figure 25.28 of the import volume indexes. These indexes are expressed on a base of the year ended June 1989 (=1000). In tables 25.43 and 25.44, the quarterly index numbers are given as annual equivalents.
Table 25.43. Merchandise export volume indexes1
| All pastoral and dairy products | Fish and fish preparations | Food and beverages | Forestry products | Non-fuel crude materials | Non-food manufactured goods | Total exports2 | ||||||
|---|---|---|---|---|---|---|---|---|---|---|---|---|
| Dairy products | Meat, wool and by-products | Aluminium | Total2 | |||||||||
| Meat | Wool | Total2 | Total2 | |||||||||
1Year ended June 1989 (=1000). 2Includes commodities not listed. Source: Statistics New Zealand | ||||||||||||
| June year | ||||||||||||
| 1991 | 1037 | 899 | 769 | 856 | 938 | 960 | 1002 | 1276 | 936 | 1024 | 1148 | 1033 |
| 1992 | 1147 | 1017 | 952 | 966 | 1039 | 1151 | 1123 | 1475 | 1064 | 1077 | 1297 | 1152 |
| 1993 | 1112 | 968 | 751 | 875 | 960 | 1062 | 1072 | 1634 | 1010 | 1011 | 1416 | 1136 |
| 1994 | 1310 | 969 | 930 | 920 | 1053 | 1188 | 1171 | 1556 | 1049 | 1082 | 1610 | 1246 |
| 1995 | 1396 | 1010 | 901 | 934 | 1098 | 1156 | 1241 | 1716 | 1085 | 1081 | 1738 | 1322 |
| 1996 | 1338 | 1083 | 764 | 952 | 1107 | 1260 | 1286 | 1694 | 1054 | 1102 | 1769 | 1343 |
| 1997 | 1779 | 1061 | 787 | 933 | 1208 | 1190 | 1407 | 1828 | 1076 | 1231 | 1902 | 1446 |
| 1998 | 1769 | 1115 | 762 | 939 | 1223 | 1177 | 1441 | 1715 | 999 | 1246 | 2002 | 1466 |
| 1999 | 1748 | 994 | 673 | 846 | 1165 | 1171 | 1396 | 1857 | 988 | 1308 | 2088 | 1462 |
| 2000 | 1887 | 1074 | 742 | 915 | 1236 | 1052 | 1461 | 2118 | 1095 | 1294 | 2231 | 1546 |
| 2001 | 2070 | 1152 | 733 | 954 | 1313 | 1046 | 1584 | 2117 | 1094 | 1250 | 2232 | 1601 |
| Quarterly | ||||||||||||
| 1999 Mar | 1921 | 1215 | 633 | 979 | 1279 | 1045 | 1488 | 1788 | 996 | 1285 | 1918 | 1470 |
| Jun | 1453 | 1095 | 508 | 886 | 1265 | 1041 | 1507 | 1857 | 964 | 1247 | 2139 | 1522 |
| Sep | 1581 | 892 | 651 | 769 | 1045 | 1329 | 1306 | 2124 | 1058 | 1376 | 2214 | 1462 |
| Dec | 2287 | 861 | 825 | 782 | 1122 | 1084 | 1346 | 2114 | 1082 | 1235 | 2273 | 1495 |
| 2000 Mar | 1925 | 1340 | 799 | 1112 | 1361 | 818 | 1538 | 1903 | 1083 | 1157 | 2060 | 1536 |
| Jun | 1754 | 1204 | 693 | 995 | 1419 | 978 | 1653 | 2332 | 1157 | 1410 | 2376 | 1691 |
| Sep | 1589 | 933 | 678 | 791 | 1112 | 1157 | 1386 | 2034 | 1031 | 1188 | 2253 | 1494 |
| Dec | 2324 | 995 | 865 | 869 | 1225 | 1097 | 1497 | 2194 | 1125 | 1332 | 2320 | 1592 |
| 2001 Mar | 2190 | 1327 | 695 | 1062 | 1368 | 884 | 1616 | 1969 | 1031 | 1211 | 2081 | 1564 |
| Jun | 2176 | 1352 | 695 | 1094 | 1549 | 1045 | 1840 | 2270 | 1189 | 1272 | 2274 | 1753 |
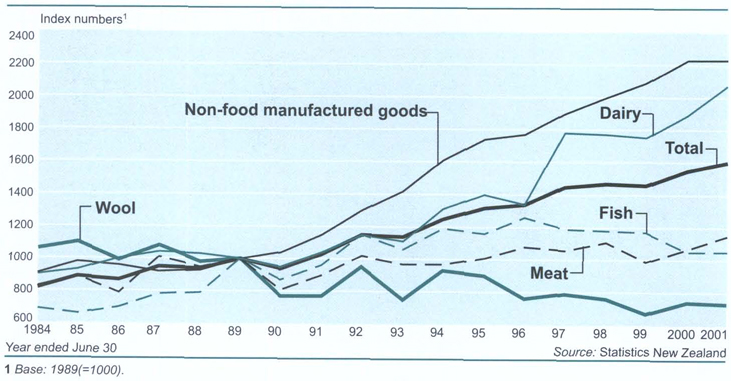
Table 25.44. Merchandise import volume indexes1
| Non-food manufactured goods | |||||||||||
|---|---|---|---|---|---|---|---|---|---|---|---|
| Food and beverages | Petroleum and petroleum products | Non-fuel crude materials | Plastic and non-plastic articles | Textile yarn, fabrics and related products | Iron and steel2 | Non-electrical machinery | Electrical machinery and apparatus | Transport equipment | Total2 | Total imports2 | |
1Year ended June 1989 (=1000). 2Excludes manufactured articles of iron and steel. 3Includes commodities not listed. Source: Statistics New Zealand | |||||||||||
| June year | |||||||||||
| 1991 | 1090 | 1243 | 1045 | 1219 | 975 | 946 | 1171 | 1405 | 1199 | 1194 | 1175 |
| 1992 | 1090 | 1198 | 1170 | 1414 | 1015 | 919 | 1075 | 1103 | 1046 | 1144 | 1142 |
| 1993 | 1226 | 1226 | 1184 | 1660 | 1099 | 1167 | 1215 | 1142 | 1030 | 1238 | 1230 |
| 1994 | 1406 | 1391 | 1324 | 1891 | 1165 | 1459 | 1479 | 1219 | 1054 | 1359 | 1361 |
| 1995 | 1535 | 1472 | 1334 | 2020 | 1189 | 1568 | 1673 | 1570 | 1496 | 1610 | 1583 |
| 1996 | 1590 | 1694 | 1332 | 1998 | 1130 | 1422 | 1858 | 1684 | 1246 | 1611 | 1600 |
| 1997 | 1648 | 1728 | 1331 | 2194 | 1092 | 1546 | 1799 | 1750 | 1329 | 1685 | 1664 |
| 1998 | 1718 | 1785 | 1351 | 2205 | 1082 | 1388 | 1941 | 1805 | 1290 | 1732 | 1712 |
| 1999 | 1792 | 1940 | 1350 | 2347 | 1044 | 1410 | 1722 | 1896 | 1674 | 1809 | 1792 |
| 2000 | 2019 | 1958 | 1424 | 2554 | 1121 | 1647 | 1825 | 2279 | 2204 | 2067 | 2015 |
| 2001 | 2103 | 2020 | 1484 | 2467 | 1050 | 1445 | 1769 | 2482 | 1711 | 1956 | 1932 |
| Quarterly | |||||||||||
| 1999 Mar | 1617 | 2059 | 1391 | 2308 | 1009 | 1419 | 1655 | 1757 | 1451 | 1683 | 1685 |
| Jun | 1697 | 2049 | 1322 | 2362 | 1013 | 1744 | 1684 | 1953 | 1626 | 1766 | 1756 |
| Sep | 2082 | 1845 | 1471 | 2682 | 1240 | 1617 | 1931 | 2394 | 2000 | 2139 | 2078 |
| Dec | 2341 | 1859 | 1487 | 2924 | 1212 | 1924 | 1855 | 2490 | 3,406 | 2485 | 2369 |
| 2000 Mar | 1729 | 2110 | 1256 | 2339 | 1036 | 1604 | 1695 | 1866 | 1436 | 1743 | 1733 |
| Jun | 1923 | 2018 | 1482 | 2271 | 998 | 1445 | 1821 | 2367 | 1975 | 1903 | 1879 |
| Sep | 2187 | 2104 | 1495 | 2451 | 1090 | 1503 | 1856 | 2783 | 1841 | 2074 | 2035 |
| Dec | 2305 | 1858 | 1619 | 2731 | 1090 | 1525 | 1822 | 2928 | 1695 | 2078 | 2029 |
| 2001 Mar | 1863 | 2188 | 1358 | 2310 | 1032 | 1388 | 1624 | 2043 | 1509 | 1784 | 1794 |
| Jun | 2056 | 1932 | 1464 | 2375 | 989 | 1362 | 1776 | 2175 | 1798 | 1886 | 1869 |
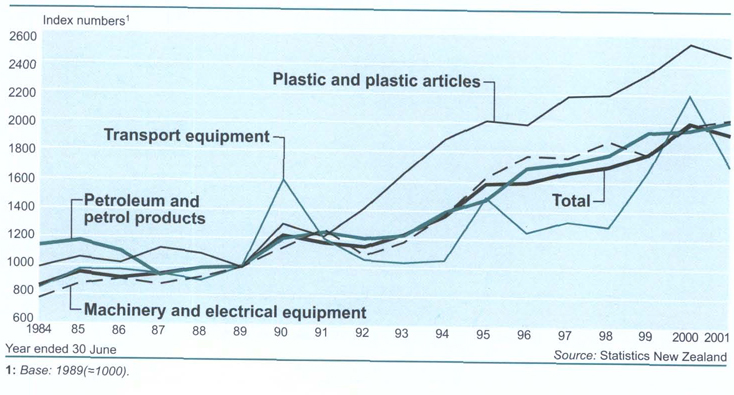
25.1 Trade New Zealand; Customs New Zealand; Statistics New Zealand.
25.2–25.6 Statistics New Zealand.
Statistics New Zealand divisional manager responsible: Shirley Nesbit.
Export News. Trade NZ (fortnightly).
Key Statistics (monthly). Statistics New Zealand, Wellington.
New Zealand Harmonised System Classification (annual). Statistics New Zealand, Wellington.
New Zealand Standard Classification of Countries (1999). Statistics New Zealand, Wellington.
Report of the New Zealand Customs Service (Parl paper B.24).
Report of New Zealand Trade Development Board (Parl paper G.45).
Table of Contents
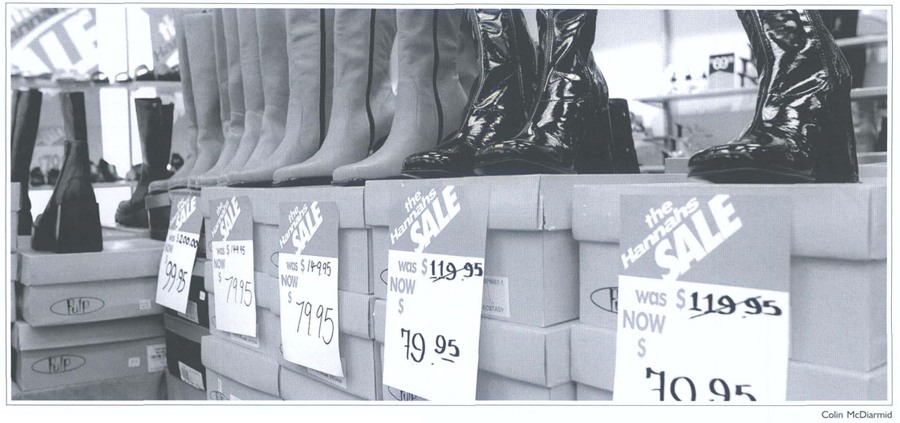
Footwear prices are influenced by seasonal factors and high tariffs.
Statistics New Zealand collects prices for a large number of goods and services to compile price indexes for retail prices, farming inputs, capital expenditure and both input and output producer prices. Overseas trade indexes are calculated from import and export documentation.
Price indexes are constructed from prices weighted to reflect the importance of each item to the sector as a whole. Changes in the importance of individual items to a sector, the introduction of new items, or the deletion of items that have no future significance, require periodic revisions of weights.
The consumers price index (CPI) is used as a measure of the Reserve Bank of New Zealand's monetary policy target agreement. The relationship between the CPI and other price indexes is outlined in Figure 26.1. This section gives a brief overview of how these indexes fit together to give a picture of where price pressures come from and to what extent they result in households paying higher prices.
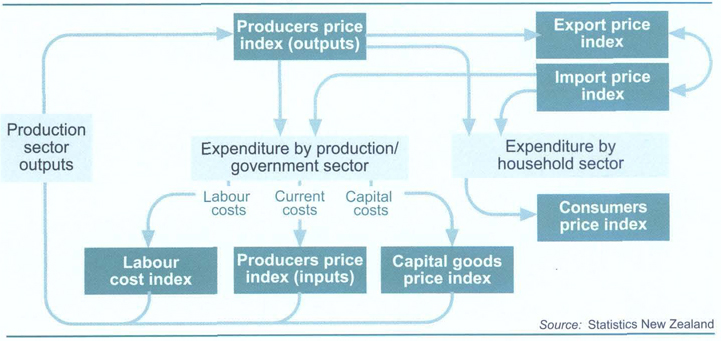
Table 26.1. Consumers price index: 1930–2001 all groups
| June quarter | Percentage change from previous quarter1 | |
|---|---|---|
1Percentage changes are calculated from index numbers which are unrounded prior to the June 1999 quarters. Base:June 1999 quarter(=1000). Source: Statistics New Zealand | ||
| 1930 | 30 | -1.0 |
| 1931 | 28 | -7.8 |
| 1932 | 26 | -8.1 |
| 1933 | 24 | -5.1 |
| 1934 | 25 | 2.0 |
| 1935 | 25 | 2.8 |
| 1936 | 26 | 2.5 |
| 1937 | 28 | 7.4 |
| 1938 | 29 | 3.5 |
| 1939 | 30 | 3.4 |
| 1940 | 31 | 4.7 |
| 1941 | 33 | 3.9 |
| 1942 | 33 | 2.6 |
| 1943 | 34 | 2.6 |
| 1944 | 35 | 2.0 |
| 1945 | 36 | 1.3 |
| 1946 | 36 | 1.0 |
| 1947 | 36 | 0.9 |
| 1948 | 40 | 10.6 |
| 1949 | 40 | 1.1 |
| 1950 | 42 | 5.0 |
| 1951 | 47 | 11.1 |
| 1952 | 51 | 8.6 |
| 1953 | 53 | 4.1 |
| 1954 | 57 | 5.9 |
| 1955 | 58 | 2.3 |
| 1956 | 59 | 2.6 |
| 1957 | 61 | 2.8 |
| 1958 | 62 | 2.3 |
| 1959 | 66 | 5.7 |
| 1960 | 66 | 0.4 |
| 1961 | 67 | 1.4 |
| 1962 | 69 | 3.3 |
| 1963 | 71 | 1.9 |
| 1964 | 73 | 3.0 |
| 1965 | 75 | 3.6 |
| 1966 | 78 | 3.3 |
| 1967 | 83 | 6.4 |
| 1968 | 86 | 3.6 |
| 1969 | 90 | 5.2 |
| 1970 | 95 | 5.2 |
| 1971 | 106 | 11.0 |
| 1972 | 113 | 7.4 |
| 1973 | 122 | 7.6 |
| 1974 | 134 | 10.0 |
| 1975 | 154 | 14.9 |
| 1976 | 181 | 17.7 |
| 1977 | 207 | 14.0 |
| 1978 | 232 | 12.3 |
| 1979 | 261 | 12.4 |
| 1980 | 308 | 17.9 |
| 1981 | 354 | 15.1 |
| 1982 | 415 | 17.0 |
| 1983 | 449 | 8.3 |
| 1984 | 470 | 4.7 |
| 1985 | 548 | 16.6 |
| 1986 | 605 | 10.4 |
| 1987 | 720 | 18.9 |
| 1988 | 766 | 6.3 |
| 1989 | 800 | 4.4 |
| 1990 | 861 | 7.6 |
| 1991 | 885 | 2.8 |
| 1992 | 894 | 1.0 |
| 1993 | 905 | 1.3 |
| 1994 | 915 | 1.1 |
| 1995 | 957 | 4.6 |
| 1996 | 976 | 2.0 |
| 1997 | 987 | 1.1 |
| 1998 | 1004 | 1.7 |
| 1999 | 1000 | -0.4 |
| 2000 | 1020 | 2.0 |
| 2001 | 1053 | 3.2 |
Households can face price pressures from imported goods or from domestically produced goods. In the price measurement system, this is measured by the import price index and the producers price outputs (PPI) index respectively. The PPI outputs measures the change in what businesses receive for what they produce. These businesses can in turn face price pressures from import prices. The cumulative effects of these pressures on businesses are described by the three sets of indexes at the bottom of the diagram. These indexes summarise the impact of changes in prices faced by businesses.
The export price index is also an important part of this picture. Some price pressures that build up in the New Zealand economy have only a marginal impact on prices paid by New Zealand consumers if these goods are exported. This situation can be examined by looking at the relationship between the export price index and the producers price index for outputs.
There are a number of situations where indexes are used to adjust payments. These indexation arrangements can apply to both public sector and private arrangements:
Adjusting for changes in the cost of living. Many public sector arrangements are based on ensuring a sufficient level of income for people to enable them to continue to buy a range of goods and services. In the context of income support, much depends on whether the objective is to maintain the spending power of a benefit, or to match changes in the average wage. In the first case the tendency is to use the CPI to adjust payments, while in the latter it is more useful to use a measure of an average wage.
Compensating businesses for costs beyond their control. A common situation in business contracts is service providers wanting to be compensated for changes in input costs that they have little or no control over. In determining which index to use in adjusting a contract, firms typically either use an index that is closely related to the cost concerned, or use a more general measure that the parties agree would give a picture of relevant price pressures.
Ensuring regular payments maintain their value. There are ranges of regular payments (rents for example) that need to be adjusted from time to time. Adjustment methods used are varied and a wide variety of indexation practices are used.
Coverage and pricing. The CPI measures changes in the prices of goods and services purchased by private New Zealand households. It is the best available measure of the effect of changes in retail prices on the average household budget. Statistics New Zealand endeavours to keep the basket of goods and services for which prices are regularly surveyed constant in quantity and quality, so that only ‘pure’ price movements are recorded. Table 26.1 (sidebar) shows annual movements in the CPI since 1930, while Figure 26.2 plots quarterly movements since June 1991.
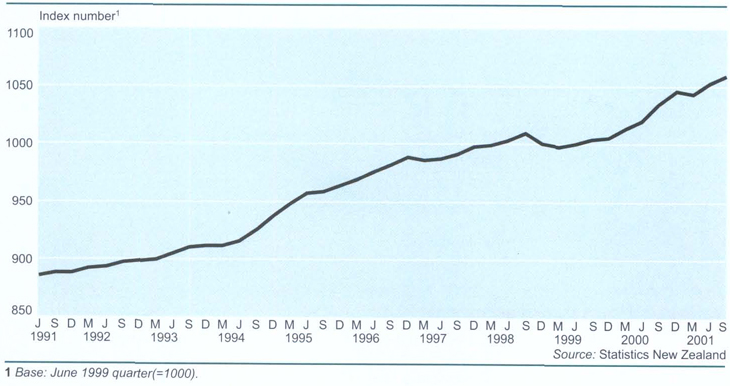
Price surveys. Retail outlets and organisations are selected for price surveys for the CPI so that the sample of outlets reflects changes in market trends and household buying behaviour. Prices for a wide range of commodities are collected, monthly for food and quarterly for other commodities. These are compared against the previous period's results and price changes are recorded. Prices in retail establishments are surveyed by specially-trained field staff in 15 urban areas throughout New Zealand. In addition to recording prices at outlets, Statistics New Zealand conducts a number of postal surveys. These surveys are continually being developed and adapted to meet the changing variety of goods and services available to New Zealanders. Postal surveys cover most items that are heavily weighted in the index, including mortgage interest rates, rentals, sports club subscriptions, vehicle licensing and insurance, used car prices and charges for contractors such as electricians and plumbers.
Index reviews. Spending patterns have changed considerably since the CPI was first calculated in 1914, as new goods and services appear and as lifestyles and consumer tastes alter. The CPI is reviewed regularly to keep up to date with changing expenditure patterns and all surveys that collect prices for the CPI are reviewed and updated on a regular basis. The reviews of these surveys cover items for which prices are collected, the relative importance given to each commodity, the sample of outlets from which the data is collected and the method by which Statistics New Zealand collects the data.
Weightings. Weights for the CPI are based on the average expenditure of the population as measured by Statistics New Zealand's Household Economic Survey (HES). This survey covers a large, statistically representative sample of private households and provides comprehensive details of expenditure. In some areas, the HES data does not provide adequate information, so surveys of businesses and government organisations are also used to supplement the HES. Table 26.2 gives weights for each group. The base weights represent expenditure allocated from similar commodities, as well as the expenditure on each commodity for which prices are surveyed. Some types of expenditure are excluded from the index:
Consumption from own production, goods received as income-in-kind and goods and services supplied free of charge.
Direct tax and commodities which represent savings and investment.
Goods and services for which prices cannot be satisfactorily measured, nor can the price movements be represented by those of other commodities which could be priced, eg artwork.
Table 26.2. Consumers price index regimen expenditure weights
| Quarter1 | Food | Housing | Household operation | Apparel | Transportation | Tobacco and alcohol | Personal and health care | Recreation and education | Credit services |
|---|---|---|---|---|---|---|---|---|---|
1December quarters except 1999, which is June quarter. Source: Statistics New Zealand | |||||||||
| 1930 | 29.52 | 21.93 | 9.95 | 12.61 | 3.46 | 1.30 | 0.54 | 2.00 | – |
| 1944 | 39.00 | 25.00 | 13.00 | 14.00 | 4.50 | 1.50 | 1.00 | 2.00 | – |
| 1949 | 34.40 | 16.75 | 10.88 | 20.31 | 3.58 | 6.57 | 3.83 | 3.68 | – |
| 1956 | 32.26 | 15.40 | 10.77 | 15.43 | 8.77 | 8.36 | 3.70 | 5.32 | – |
| 1965 | 30.09 | 11.13 | 11.70 | 13.12 | 9.44 | 7.54 | 4.55 | 5.56 | 6.86 |
| 1974 | 17.82 | 26.39 | 14.37 | 8.55 | 14.70 | 6.35 | 4.00 | 6.09 | 1.70 |
| 1977 | 19.12 | 22.60 | 17.11 | 7.95 | 13.84 | 7.81 | 4.28 | 6.05 | 1.24 |
| 1980 | 19.62 | 15.27 | 16.10 | 7.13 | 18.26 | 9.11 | 4.83 | 6.27 | 3.40 |
| 1983 | 18.35 | 16.97 | 16.00 | 6.37 | 17.68 | 9.31 | 4.36 | 6.18 | 4.77 |
| 1988 | 18.35 | 17.04 | 15.41 | 5.34 | 14.68 | 9.72 | 4.90 | 6.65 | 7.87 |
| 1993 | 17.76 | 19.50 | 14.92 | 4.50 | 14.58 | 8.46 | 6.27 | 7.50 | 6.50 |
| 1999 | 18.17 | 23.04 | 14.79 | 3.73 | 15.43 | 9.25 | 6.07 | 8.82 | 0.69 |
Bias limitation. The main types of bias likely to occur in the CPI include quality adjustment bias, outlet substitution bias and commodity substitution bias. The magnitude of these can be limited by the use of frequent re-selection and re-weighting of the CPI basket of goods and services; frequent reviews of the outlets used to collect prices; probability sampling for outlet selection; and application of alternative methods of quality adjustment.
The review of the CPI has been moved from a five to a three-year cycle.
Reviews of the expenditure weights at the lower level of the index, outlet re-selection, improved sampling and price surveys will occur in the intervening years.
The CPI was re-weighted in June 2002, using newly available household expenditure data. Unlike previous reviews, such as the 1999 rebase, there was no major change in the basis of the index or to the commodities in the index. Most changes involved adding, re-weighting and removing items to reflect changes in technology and consumer spending.
The following section discusses price changes in New Zealand as measured by the CPI. These price changes are expressed in percentages and show movements in the CPI between the June quarters of the relevant years (see table 26.3).
From the early 1980s till 1987, the CPI recorded large annual increases (except in 1983 and 1984 when the CPI increased by 8.3 percent and 4.7 percent respectively).
In 1988, the annual increase in the CPI fell to 6.3 percent, marking the beginning of a period of single-digit increases. These lower increases continued through the 1990s and led to a period of deflation in 1999 when the CPI fell 0.4 percent.
The CPI moved back to single-digit annual inflation in the following two years.
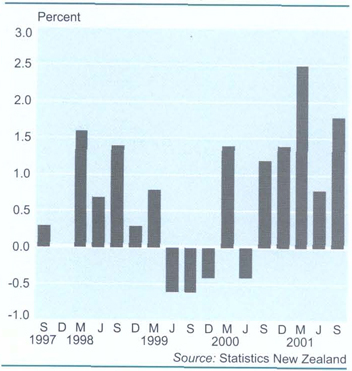
Table 26.3. Consumers price index – New Zealand by group
| June quarter | All groups | Food | Housing | Household operations | Apparel | Transportation | Tobacco and alcohol | Personal and health care | Recreation & education | Credit services |
|---|---|---|---|---|---|---|---|---|---|---|
1Percentage changes are calculated from index numbers which are unrounded prior to the June 1999 quarter. Base:June 1999 quarter(=1000). Source: Statistics New Zealand | ||||||||||
| 1981 | 354 | 395 | .. | 455 | 441 | 499 | 245 | .. | .. | .. |
| 1982 | 415 | 454 | .. | 524 | 494 | 579 | 281 | .. | .. | .. |
| 1983 | 449 | 468 | .. | 540 | 537 | 624 | 321 | .. | .. | .. |
| 1984 | 470 | 493 | .. | 548 | 559 | 650 | 336 | .. | .. | .. |
| 1985 | 548 | 571 | .. | 620 | 624 | 790 | 412 | .. | .. | .. |
| 1986 | 605 | 617 | .. | 702 | 700 | 828 | 429 | .. | .. | .. |
| 1987 | 720 | 723 | .. | 827 | 834 | 950 | 562 | .. | .. | .. |
| 1988 | 766 | 764 | .. | 845 | 877 | 957 | 607 | .. | .. | .. |
| 1989 | 800 | 809 | 696 | 864 | 901 | 954 | 670 | 669 | 678 | 1236 |
| 1990 | 861 | 895 | 755 | 913 | 949 | 980 | 737 | 733 | 747 | 1290 |
| 1991 | 885 | 904 | 777 | 932 | 981 | 1004 | 767 | 797 | 783 | 1290 |
| 1992 | 894 | 897 | 773 | 944 | 991 | 1029 | 817 | 907 | 800 | 1101 |
| 1993 | 905 | 909 | 795 | 957 | 1003 | 1053 | 830 | 889 | 823 | 1039 |
| 1994 | 915 | 906 | 846 | 964 | 996 | 1044 | 843 | 905 | 843 | 971 |
| 1995 | 957 | 929 | 905 | 968 | 990 | 1052 | 866 | 917 | 868 | 1287 |
| 1996 | 976 | 933 | 956 | 979 | 982 | 1048 | 898 | 945 | 907 | 1268 |
| 1997 | 987 | 956 | 979 | 988 | 975 | 1028 | 927 | 975 | 927 | 1225 |
| 1998 | 1004 | 982 | 1016 | 976 | 980 | 1013 | 959 | 990 | 959 | 1239 |
| 1999 | 1000 | 1000 | 1000 | 1000 | 1000 | 1000 | 1000 | 1000 | 1000 | 1000 |
| 2000 | 1020 | 1000 | 1023 | 984 | 1004 | 1060 | 1043 | 1029 | 1023 | 987 |
| 2001 | 1053 | 1060 | 1017 | 1006 | 1019 | 1118 | 1114 | 1074 | 1043 | 919 |
| Percentage change from same quarter of previous year1 | ||||||||||
| 1981 | 15.1 | 16.0 | .. | 12.3 | 11.6 | 16.9 | 17.4 | .. | .. | .. |
| 1982 | 17.0 | 14.9 | .. | 15.2 | 12.0 | 16.0 | 14.5 | .. | .. | .. |
| 1983 | 8.3 | 3.0 | .. | 3.0 | 8.6 | 7.7 | 14.4 | .. | .. | .. |
| 1984 | 4.7 | 5.4 | .. | 1.5 | 4.1 | 4.3 | 4.8 | .. | .. | .. |
| 1985 | 16.6 | 15.9 | .. | 13.2 | 11.6 | 21.5 | 22.5 | .. | .. | .. |
| 1986 | 10.4 | 8.0 | .. | 13.1 | 12.3 | 4.8 | 4.2 | .. | .. | .. |
| 1987 | 18.9 | 17.2 | .. | 17.8 | 19.1 | 14.8 | 30.8 | .. | .. | .. |
| 1988 | 6.3 | 5.7 | .. | 2.2 | 5.2 | 0.7 | 8.1 | .. | .. | .. |
| 1989 | 4.4 | 5.9 | .. | 2.2 | 2.7 | -0.4 | 10.4 | .. | .. | .. |
| 1990 | 7.6 | 10.6 | 8.6 | 5.7 | 5.4 | 2.8 | 10.0 | 9.5 | 10.2 4.4 | |
| 1991 | 2.8 | 1.0 | 2.8 | 2.2 | 3.3 | 2.4 | 4.0 | 8.8 | 4.8 | 0.0 |
| 1992 | 1.0 | -0.8 | -0.5 | 1.3 | 1.1 | 2.5 | 6.4 | 13.8 | 2.1 | -14.7 |
| 1993 | 1.3 | 1.4 | 2.9 | 1.3 | 1.2 | 2.3 | 1.7 | -2.0 | 2.9 | -5.6 |
| 1994 | 1.1 | -0.4 | 6.4 | 0.8 | -0.7 | -0.8 | 1.5 | 1.8 | 2.4 | -6.6 |
| 1995 | 4.6 | 2.5 | 7.0 | 0.4 | -0.6 | 0.8 | 2.8 | 1.3 | 3.0 | 32.6 |
| 1996 | 2.0 | 0.5 | 5.6 | 1.1 | -0.8 | -0.4 | 3.7 | 3.1 | 4.5 | -1.5 |
| 1997 | 1.1 | 2.4 | 2.4 | 1.0 | -0.7 | -1.9 | 3.3 | 3.1 | 2.2 | -3.3 |
| 1998 | 1.7 | 2.7 | 3.8 | -1.3 | 0.5 | -1.5 | 3.4 | 1.6 | 3.4 | 1.1 |
| 1999 | -0.4 | 1.9 | -1.5 | 2.5 | 2.0 | -1.2 | 4.3 | 1.0 | 4.3 | -19.3 |
| 2000 | 2.0 | – | 2.3 | -1.6 | 0.4 | 6.0 | 4.3 | 2.9 | 2.3 | -1.3 |
| 2001 | 3.2 | 6.0 | -0.6 | 2.2 | 1.5 | 5.5 | 6.8 | 4.4 | 2.0 | -6.9 |
Food. The food group is the only group of the CPI priced monthly. Food prices showed strong increases from September 2000 to September 2001. See Figure 26.3.
One of the major influences on this was higher prices for meat, fish and poultry. As most meat is exported, the domestic price of meat was influenced during this period by the low value of the New Zealand dollar and rising export prices.
This also affected grocery food items, as many of these items are imported, or have a significant imported content. In particular, dairy products recorded two sharp increases in 2001, mainly attributed to higher international commodity prices.
Fruit and vegetable prices are a particularly volatile component of the CPI and are given special treatment to reduce the influence of normal seasonal price fluctuations. Food prices fell in the June, September and December 1999 quarters, and much of this decrease could be attributed to lower fruit and vegetable prices.
Following the drought in the summer of 1999, a mild winter with optimal growing conditions had a strong influence on fruit and vegetable prices.
Table 26.4 (sidebar) shows food price index subgroup weights.
Housing. The housing group includes rents, costs of purchasing and constructing a new home, legal and real estate expenses, upkeep costs of a home, insurance and local authority rates.
As Figure 26.6 shows there was a 1.9 percent fall in housing prices in March 2001, largely the result of a fall in rented dwellings. The main reason for this drop was a decrease in rent for Housing New Zealand tenants, following the move from market rents to income-related rents on 1 December 2000.
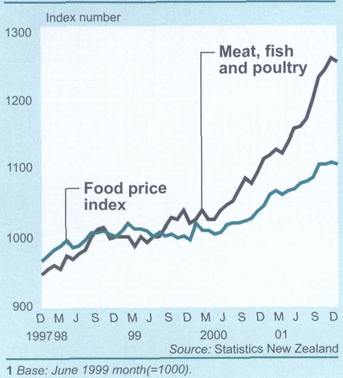
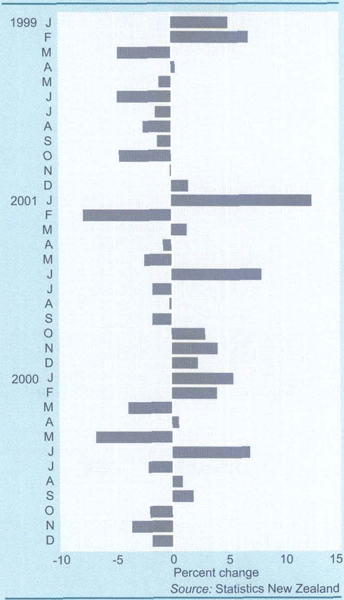
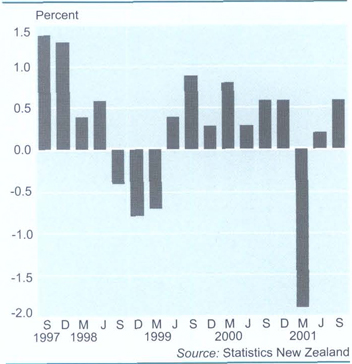
Purchase and construction of new dwellings, at nearly 10 percent of the CPI, are the most highly weighted items overall. From the June 1999 quarter, construction prices recorded 10 consecutive quarterly increases (see Figure 26.7). This followed three quarterly decreases, which were largely responsible for the deflationary period in the housing group from September 1998 to June 1999.
Local authority rates are surveyed annually. Changes in rates are mainly reflected in the CPI over the September and December quarters when local authorities strike their rates.
Figure 26.7. Construction
Comparison of purchase and
construction of new dwelling prices with movements in housing prices in the
CPI
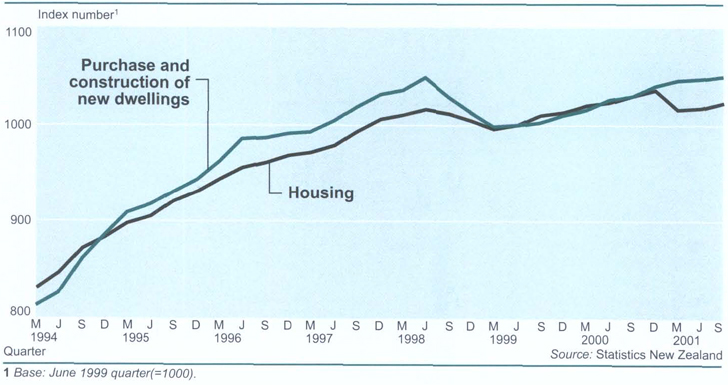
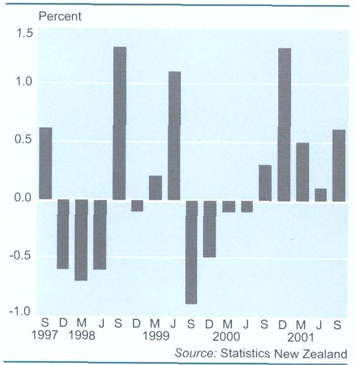
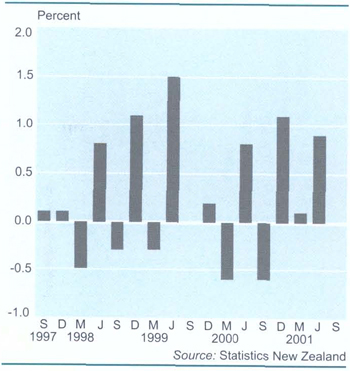
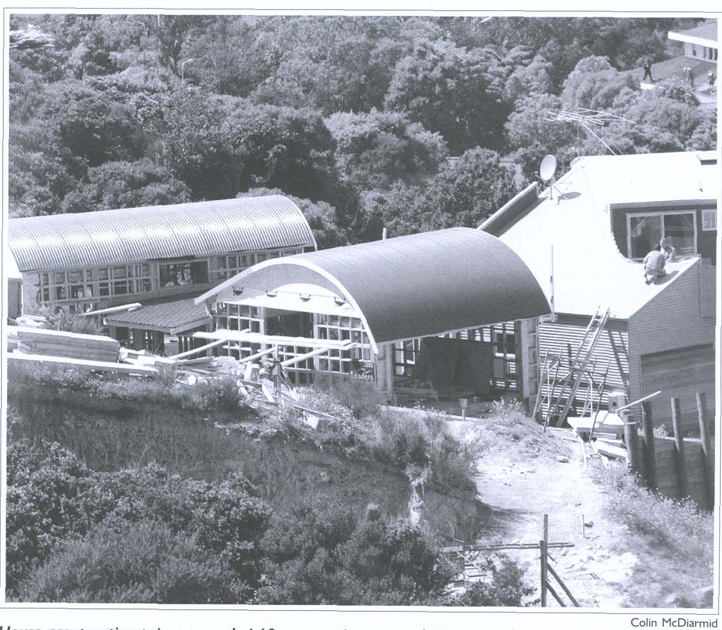
House construction prices recorded 10 consecutive quarterly increases from the June 1999 quarter.
Household operation. A major component of household operation is electricity. Following deregulation of the electricity industry in 1999, increased competition resulted in substantial customer shifts among competing retailers. However, prices did not change significantly, with electricity prices in September 2001 at the same level as June 1999. By contrast, strong competition in the telecommunications industry resulted in significant price falls. Prices for telephone call charges (which includes national toll calls, international toll calls and cellular call charges) fell 41 percent between September 1997 and September 2001. Also included in the household operation group are household appliances and furnishings. The large increase in household operation prices in December 2000 (see Figure 26.8). was driven by price rises in a number of these items, including refrigerators, freezers, televisions, videos, bedroom furniture and lounge suites. This was largely due to the lower value of the New Zealand dollar pushing import prices up.
Apparel. Apparel prices are highly volatile, reflecting the seasonal aspects of clothing and footwear. As Figure 26.9 shows, prices tend to rise in the June and December quarters as new season's items become available, and fall in the March and September quarters when clearance sales occur. Apparel prices are also influenced by import tariffs, with clothing and footwear attracting high tariffs compared with other imported goods. In May 2000, the government announced a five-year freeze on unilateral tariff reductions, which precluded price cuts on imported apparel. Although the effect of this is difficult to gauge, there has been only one quarterly decrease in apparel prices since the June 2000 quarter.
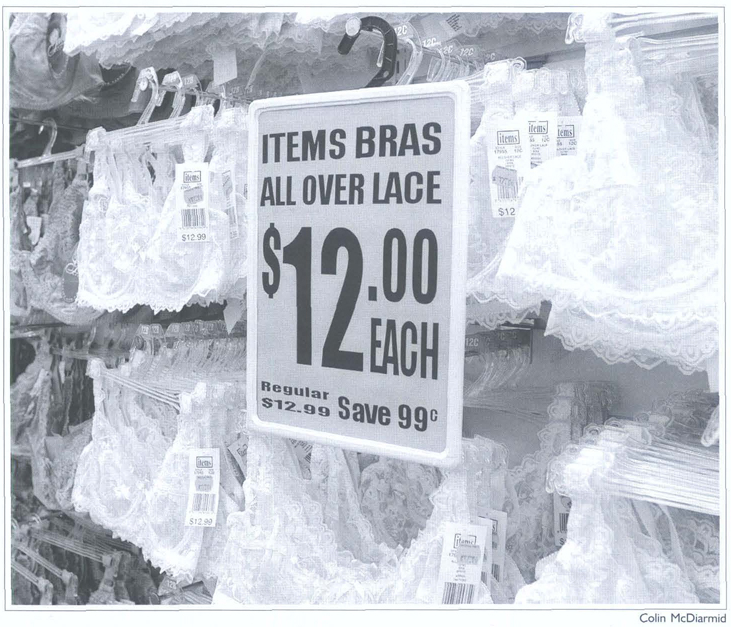
Apparel prices tend to fall in the March and September quarters when clearance sales occur.
Transportation. Transportation prices have been strongly influenced by petrol prices in recent years. Petrol prices fell in all four quarters of 1998 due to strong competition, but then rose dramatically during most of 1999 and 2000. See Figure 26.10. As both refined petrol and crude oil are imported, high oil prices and a low New Zealand dollar were particularly influential on petrol prices during this period.
High fuel costs have a flow-on effect on other parts of the transportation group. Domestic airfares rose by 20.2 percent and 8.9 percent in the years to the June and September 2001 quarters and higher fuel costs were partly to blame for this. Changes in demand also affect the price of air travel. This is particularly evident with international airfares, where prices typically rise at the high points of the season in the June and December quarters, and fall in the March and September quarters. The removal of tariffs on imported cars and a strong New Zealand dollar resulted in large drops in car prices in 1997 and 1999. These falls contributed to drops in the transportation group in seven of the 12 quarters from 1997 to 1999. See Figure 26.11.
Figure 26.1. Transportation prices
Comparison of petrol
prices with movements in transportation prices in the CPI
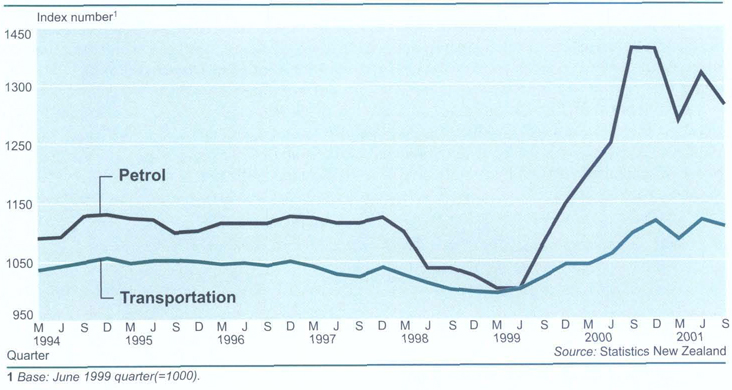
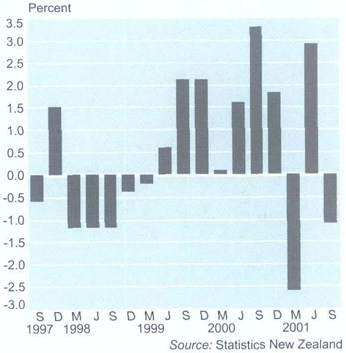
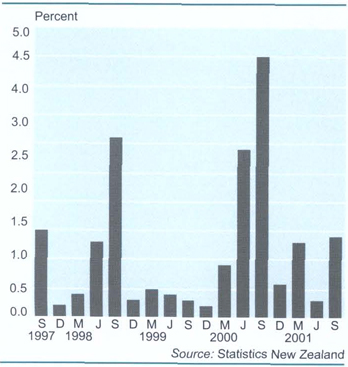
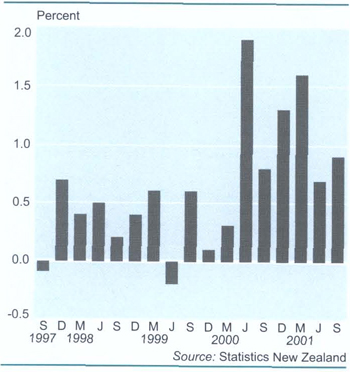
Table 26.5 shows movements in the CPI by subgroup.
Table 26.5. Consumers price index – New Zealand by subgroup
| June quarter | Fruit and vegetables | Meat, fish and poultry | Grocery foods, soft drinks and confectionery | Restaurant meals and ready-to-eat food | Rented dwellings | Home ownership | Energy | House-hold appliances and furnishings | House-hold supplies and services | Clothing | Foot-wear |
|---|---|---|---|---|---|---|---|---|---|---|---|
1Percentage changes are calculated from index numbers which are unrounded prior to the June 1999 quarter. Base:June 1999 quarter(=1000). | |||||||||||
| 1981 | 452 | 447 | .. | .. | 204 | .. | 293 | 574 | 436 | 424 | 517 |
| 1982 | 530 | 507 | .. | .. | 245 | .. | 338 | 655 | 509 | 477 | 571 |
| 1983 | 549 | 526 | .. | .. | 262 | .. | 341 | 678 | 526 | 520 | 615 |
| 1984 | 586 | 564 | 470 | 430 | 280 | .. | 347 | 690 | 530 | 541 | 640 |
| 1985 | 681 | 630 | 556 | 496 | 364 | .. | 426 | 781 | 574 | 605 | 707 |
| 1986 | 730 | 617 | 620 | 563 | 432 | .. | 479 | 863 | 678 | 681 | 789 |
| 1987 | 844 | 738 | 705 | 696 | 486 | .. | 584 | 993 | 814 | 819 | 903 |
| 1988 | 907 | 754 | 747 | 751 | 586 | .. | 620 | 989 | 850 | 860 | 955 |
| 1989 | 880 | 826 | 801 | 790 | 646 | 710 | 636 | 996 | 885 | 881 | 983 |
| 1990 | 947 | 969 | 877 | 861 | 683 | 778 | 658 | 1030 | 968 | 931 | 1030 |
| 1991 | 889 | 968 | 897 | 891 | 707 | 798 | 701 | 1036 | 987 | 966 | 1042 |
| 1992 | 874 | 953 | 888 | 900 | 710 | 792 | 730 | 1033 | 1003 | 978 | 1050 |
| 1993 | 834 | 1004 | 900 | 907 | 727 | 816 | 773 | 1044 | 999 | 989 | 1062 |
| 1994 | 847 | 982 | 895 | 913 | 809 | 856 | 821 | 1046 | 985 | 984 | 1047 |
| 1995 | 1014 | 936 | 903 | 931 | 873 | 914 | 856 | 1038 | 979 | 976 | 1048 |
| 1996 | 903 | 917 | 941 | 948 | 938 | 961 | 907 | 1018 | 991 | 972 | 1022 |
| 1997 | 951 | 941 | 959 | 965 | 980 | 977 | 948 | 991 | 1011 | 968 | 999 |
| 1998 | 980 | 976 | 984 | 984 | 1017 | 1014 | 981 | 973 | 975 | 980 | 976 |
| 1999 | 1000 | 1000 | 1000 | 1000 | 1000 | 1000 | 1000 | 1000 | 1000 | 1000 | 1000 |
| 2000 | 931 | 1035 | 1001 | 1016 | 1005 | 1029 | 1003 | 996 | 963 | 1005 | 1000 |
| 2001 | 1064 | 1147 | 1035 | 1054 | 906 | 1058 | 1012 | 1043 | 974 | 1022 | 1006 |
| Percentage change from same quarter of previous year1 | |||||||||||
| 1981 | 9.3 | 11.8 | .. | .. | 11.5 | .. | 13.1 | 12.3 | 12.6 | 11.5 | 12.0 |
| 1982 | 17.3 | 13.5 | .. | .. | 20.1 | .. | 15.6 | 14.2 | 16.7 | 12.5 | 10.5 |
| 1983 | 3.6 | 3.8 | .. | .. | 7.2 | .. | 0.7 | 3.6 | 3.4 | 8.9 | 7.7 |
| 1984 | 6.7 | 7.1 | .. | .. | 6.9 | .. | 1.7 | 1.8 | 0.9 | 4.1 | 4.1 |
| 1985 | 16.2 | 11.8 | 18.4 | 15.4 | 29.9 | .. | 23.0 | 13.2 | 8.1 | 12.0 | 10.5 |
| 1986 | 7.1 | -2.1 | 11.4 | 13.5 | 18.7 | .. | 12.4 | 10.5 | 18.1 | 12.5 | 11.6 |
| 1987 | 15.6 | 19.6 | 13.8 | 23.7 | 12.5 | .. | 21.8 | 15.1 | 20.1 | 20.2 | 14.4 |
| 1988 | 7.5 | 2.1 | 5.9 | 7.9 | 20.6 | .. | 6.2 | -0.4 | 4.5 | 5.0 | 5.8 |
| 1989 | -2.9 | 9.5 | 7.2 | 5.2 | 10.2 | .. | 2.6 | 0.7 | 4.1 | 2.5 | 3.0 |
| 1990 | 7.6 | 17.4 | 9.5 | 8.9 | 5.7 | 9.6 | 3.4 | 3.4 | 9.3 | 5.7 | 4.7 |
| 1991 | -6.1 | -0.2 | 2.3 | 3.5 | 3.6 | 2.5 | 6.5 | 0.6 | 2.0 | 3.7 | 1.1 |
| 1992 | -1.7 | -1.5 | -1.0 | 1.0 | 0.4 | -0.7 | 4.2 | -0.3 | 1.6 | 1.3 | 0.8 |
| 1993 | -4.6 | 5.3 | 1.4 | 0.8 | 2.3 | 3.0 | 5.9 | 1.1 | -0.4 | 1.2 | 1.1 |
| 1994 | 1.6 | -2.2 | -0.5 | 0.7 | 11.3 | 5.0 | 6.3 | 0.2 | -1.4 | -0.5 | -1.4 |
| 1995 | 19.7 | -4.7 | 0.9 | 2.0 | 7.8 | 6.7 | 4.3 | -0.8 | -0.6 | -0.8 | 0.1 |
| 1996 | -10.9 | -2.1 | 4.2 | 1.9 | 7.5 | 5.2 | 5.9 | -1.9 | 1.2 | -0.4 | -2.5 |
| 1997 | 5.2 | 2.7 | 1.9 | 1.7 | 4.4 | 1.7 | 4.6 | -2.7 | 2.0 | -0.4 | -2.3 |
| 1998 | 3.1 | 3.7 | 2.5 | 2.0 | 3.8 | 3.8 | 3.4 | -1.8 | -3.6 | 1.2 | -2.3 |
| 1999 | 2.0 | 2.5 | 1.7 | 1.7 | -1.7 | -1.4 | 1.9 | 2.8 | 2.6 | 2.0 | 2.5 |
| 2000 | -6.9 | 3.5 | 0.1 | 1.6 | 0.5 | 2.9 | 0.3 | -0.4 | -3.7 | 0.5 | – |
| 2001 | 14.3 | 10.8 | 3.4 | 3.7 | -9.9 | 2.8 | 0.9 | 4.7 | 1.1 | 1.7 | 0.6 |
Tobacco and alcohol. Prices for tobacco products and alcoholic drinks are strongly influenced by changes in excise tax. Excise taxes are adjusted annually based on movement of the CPI, excluding credit services. The excise on alcoholic drinks is adjusted annually on 1 June, while the excise on cigarettes and tobacco is adjusted on 1 December. As prices for these items are collected monthly and averaged over the three months of a quarter, the alcohol excise adjustment affects the June and September quarter CPIs, while the cigarette excise adjustment affects the December and March quarter CPIs. In addition to the annual adjustment of excise tax on cigarettes and tobacco, one-off increases occurred in May 1998 and in May 2000. The result of these increases was a large increase in the tobacco and alcohol group of the CPI in both the June and September quarters of 1998 and 2000. See Figure 26.12.
Personal and health care. The personal and health care group (Figure 26.13) includes personal goods and services (such as hairdressing, cosmetics and jewellery) and health care supplies and services (such as prescription medicines, general practitioner fees and medical insurance). Government health care policy often has a significant influence on this group. This was the case with a fall in the September 1997 quarter mainly due to the removal of outpatient charges at public hospitals, and an increase in general practitioner subsidies for children under the age of six. Another major policy change to influence this subgroup occurred in the March 1992 quarter when user part-charges for health care were introduced, raising the price of pharmaceuticals, hospital stays and general practitioner consultations. Medical insurance also has a significant influence on this group. The increase of 1.9 percent in the personal and health care group in June 2000 was largely influenced by increases in medical insurance premiums, as was the increase of 1.6 percent in March 2001.
| Public transport | Private transport | Cigarettes and tobacco | Alcoholic drinks | Personal goods and services | Health care | Stationery books magazines and news papers | Leisure and recreation | Education and child care | Financial and credit service charges | |
|---|---|---|---|---|---|---|---|---|---|---|
Source: Statistics New Zealand | ||||||||||
| 1981 | 486 | .. | 127 | 323 | .. | .. | .. | .. | .. | .. |
| 1982 | 577 | .. | 145 | 371 | .. | .. | .. | .. | .. | .. |
| 1983 | 640 | .. | 177 | 413 | .. | .. | .. | .. | .. | .. |
| 1984 | 638 | .. | 187 | 432 | .. | .. | .. | .. | .. | .. |
| 1985 | 714 | .. | 229 | 529 | .. | .. | .. | .. | .. | .. |
| 1986 | 797 | .. | 240 | 550 | .. | .. | .. | .. | .. | .. |
| 1987 | 791 | .. | 381 | 669 | .. | .. | .. | .. | .. | .. |
| 1988 | 785 | .. | 400 | 732 | .. | .. | .. | .. | .. | .. |
| 1989 | 828 | 970 | 515 | 759 | 793 | 565 | 644 | 822 | 351 | .. |
| 1990 | 886 | 991 | 578 | 828 | 869 | 619 | 707 | 864 | 541 | .. |
| 1991 | 967 | 1000 | 622 | 848 | 906 | 707 | 758 | 895 | 568 | .. |
| 1992 | 988 | 1032 | 725 | 863 | 914 | 901 | 798 | 910 | 554 | .. |
| 1993 | 940 | 1081 | 739 | 877 | 942 | 844 | 817 | 925 | 617 | .. |
| 1994 | 962 | 1063 | 743 | 893 | 958 | 860 | 823 | 930 | 678 | .. |
| 1995 | 1001 | 1065 | 757 | 922 | 962 | 879 | 844 | 955 | 713 | .. |
| 1996 | 981 | 1064 | 814 | 941 | 986 | 912 | 916 | 960 | 788 | .. |
| 1997 | 974 | 1041 | 845 | 968 | 992 | 960 | 919 | 960 | 865 | .. |
| 1998 | 967 | 1024 | 913 | 982 | 1002 | 980 | 945 | 982 | 919 | .. |
| 1999 | 1000 | 1000 | 1000 | 1000 | 1000 | 1000 | 1000 | 1000 | 1000 | 1000 |
| 2000 | 984 | 1087 | 1099 | 1015 | 1008 | 1048 | 1008 | 1007 | 1075 | 987 |
| 2001 | 1033 | 1148 | 1258 | 1041 | 1054 | 1094 | 1066 | 1016 | 1088 | 919 |
| Percentage change from same quarter of previous year1 | ||||||||||
| 1981 | 25.9 | .. | 17.2 | 17.5 | .. | .. | .. | .. | .. | .. |
| 1982 | 18.6 | .. | 14.2 | 14.6 | .. | .. | .. | .. | .. | .. |
| 1983 | 10.9 | .. | 22.5 | 11.4 | .. | .. | .. | .. | .. | .. |
| 1984 | -0.4 | .. | 5.6 | 4.6 | .. | .. | .. | .. | .. | .. |
| 1985 | 12.1 | .. | 22.2 | 22.5 | .. | .. | .. | .. | .. | .. |
| 1986 | 11.6 | .. | 4.9 | 3.9 | .. | .. | .. | .. | .. | .. |
| 1987 | -0.7 | .. | 58.6 | 21.7 | .. | .. | .. | .. | .. | .. |
| 1988 | -0.8 | .. | 5.0 | 9.3 | .. | .. | .. | .. | .. | .. |
| 1989 | 5.5 | .. | 28.8 | 3.7 | .. | .. | .. | .. | .. | .. |
| 1990 | 7.0 | 2.2 | 12.2 | 9.2 | 9.5 | 9.5 | 9.8 | 5.1 | 53.8 | .. |
| 1991 | 9.2 | 0.9 | 7.6 | 2.3 | 4.2 | 14.2 | 7.2 | 3.6 | 5.1 | .. |
| 1992 | 2.2 | 3.2 | 16.6 | 1.8 | 0.9 | 27.5 | 5.2 | 1.6 | -2.4 | .. |
| 1993 | -4.9 | 4.7 | 1.9 | 1.6 | 3.1 | -6.3 | 2.4 | 1.7 | 11.3 | .. |
| 1994 | 2.4 | -1.6 | 0.5 | 1.9 | 1.7 | 1.8 | 0.7 | 0.6 | 9.8 | .. |
| 1995 | 4.0 | 0.2 | 1.9 | 3.3 | 0.4 | 2.3 | 2.5 | 2.6 | 5.2 | .. |
| 1996 | -2.0 | -0.1 | 7.6 | 2.0 | 2.5 | 3.8 | 8.6 | 0.6 | 10.5 | .. |
| 1997 | -0.7 | -2.2 | 3.7 | 2.9 | 0.7 | 5.3 | 0.3 | 0.0 | 9.7 | .. |
| 1998 | -0.8 | -1.6 | 8.1 | 1.5 | 1.0 | 2.0 | 2.9 | 2.3 | 6.3 | .. |
| 1999 | 3.4 | -2.3 | 9.5 | 1.8 | -0.2 | 2.1 | 5.8 | 1.8 | 8.8 | .. |
| 2000 | -1.6 | 8.7 | 9.9 | 1.5 | 0.8 | 4.8 | 0.8 | 0.7 | 7.5 | -1.3 |
| 2001 | 5.0 | 5.6 | 14.5 | 2.6 | 4.6 | 4.4 | 5.8 | 0.9 | 1.2 | -6.9 |
Recreation and education. Education fees are a significant part of the recreation and education group (see Figure 26.14). Tertiary fees are priced in the March quarter each year. From 1994 to 2000, the average increase in tertiary fees was 13.4 percent a year. However in March 2001, tertiary fees were generally stable. This was the result of two government initiatives: the fee stabilisation agreement and the removal of the Study Right fee subsidy.
Primary and secondary school fees are priced quarterly and the bulk of the movement is shown in the March quarter, when fees are set each year. The start of the school year has an influence on stationery prices, as prices typically fall in the March quarter due to the customary back-to-school specials. Prices then rise in the June quarter as many items come off special. As well as educational fees and stationery supplies, the recreation and education group includes items such as newspapers, magazines, books, leisure and recreation supplies and services, and accommodation services. A notable item is home computers and software, where prices dropped 53.4 percent in the decade to September 2001.

Primary school fees are set in the March quarter and influence education costs in that quarter.
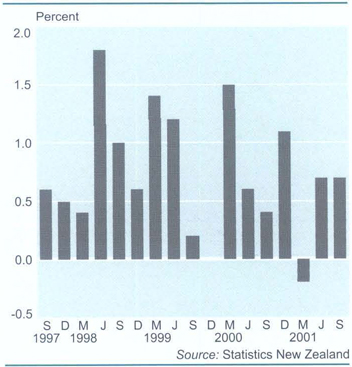
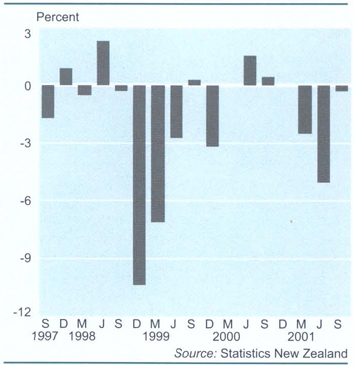
Credit services. Before the June 1999 quarter, the credit services group was dominated by movements in interest rates. Large drops in the December and March 1998 quarters and the June 1999 quarter were predominately due to falls in mortgage interest rates (see Figure 26.15). However, the June 1999 quarter was the last quarter where credit services included interest. The group now includes fees on credit cards, store cards, hire purchase, loan application fees and bank charges. Drops in the December 1999 quarter, as well as the March, June and September 2001 quarters can all be attributed to reduced loan application fees. Bank charges were introduced into the CPI for the first time at the June 1999 quarter rebase. From June 1999 to September 2001, bank charges increased 7.6 percent.
Table 26.6 shows weighted average prices of goods and services in each of the June quarters from 1999 to 2001. These weighted average prices of selected items are used in the calculation of the CPI and provide reliable movements in price levels when compared with average prices for earlier periods. The quantity and price of any goods or service will differ from shop to shop and over time, so these prices are not designed to give a statistically accurate measure of absolute average transaction prices.
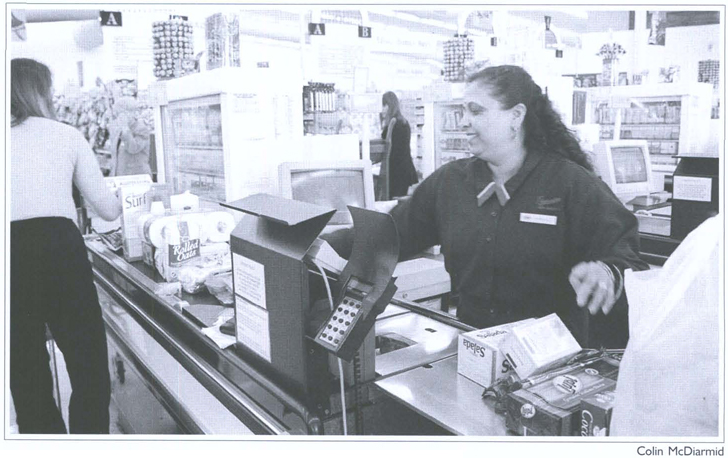
Prices of goods tend to differ from shop to shop and over time.
Table 26.6. Retail prices of selected items
| Item | Unit | June quarter | ||
|---|---|---|---|---|
| 1999 | 2000 | 2001 | ||
Source: Statistics New Zealand | ||||
| $ | ||||
| House paint – acrylic, white | 41 | 74.66 | 76.11 | 79.89 |
| Concrete blocks | per 100 | 262.63 | 264.88 | 273.41 |
| Gib-type board | per sheet | 16.69 | 17.17 | 18.43 |
| Spouting/guttering – plastic | per 3 m | 19.91 | 19.96 | 21.20 |
| Bleach | 1.51 | 2.28 | 2.16 | 1.98 |
| Detergent – dishwashing | 900 ml | 2.86 | 2.90 | 3.03 |
| Soap powder | 1 kg | 4.12 | 4.10 | 4.31 |
| Cling food wrap – refill roll | 15 m | 1.49 | 1.56 | 1.69 |
| Electric light bulb, 100 watt | each | 0.96 | 0.97 | 0.98 |
| Batteries – heavy duty, size D | twin pack | 3.39 | 3.59 | 3.94 |
| Veterinary services – speying a cat | 74.28 | 74.63 | 75.89 | |
| Postage – standardpost, medium size | each | 0.40 | 0.4 | 0.40 |
| Socks – men's, wool/nylon | pair | 8.00 | 7.84 | 8.41 |
| Pantyhose – 15 denier, average size | pair | 3.99 | 4.03 | 4.35 |
| Wool – hand knitting, double crepe | 50 g | 4.06 | 4.08 | 4.59 |
| Warrant of fitness – private car | 27.71 | 29.18 | 31.23 | |
| Cigarettes – filter tipped | pkt of 25 | 8.34 | 9.10 | 10.40 |
| Whisky – scotch | 1125 ml | 39.14 | 39.76 | 39.71 |
| Tissues – facial | box of 200 | 2.41 | 2.43 | 2.55 |
| Toilet paper | 4 rolls | 2.70 | 2.65 | 3.10 |
| Hairdressing – men's, dry cut | 16.20 | 16.57 | 16.89 | |
| Hairdressing – women's, wet cut | 39.19 | 40.38 | 41.89 | |
| Soluble aspirin | pkt of 24 | 2.75 | 2.78 | 2.81 |
| Envelopes – 90mm x 152mm | pkt of 20 | 1.19 | 1.20 | 1.33 |
| Newspaper – local daily | each | 0.90 | 0.90 | 0.96 |
| Audio cassette – current top 10 album | each | 20.73 | 19.87 | 20.02 |
| Developing and printing film, 35mm colour film | 24 prints | 16.37 | 16.68 | 17.11 |
Geographic coverage. Prices for the CPI are surveyed in 15 urban areas: Whangarei, Auckland, Hamilton, Tauranga, Rotorua, Napier-Hastings, New Plymouth, Wanganui, Palmerston North, Wellington, Nelson, Christchurch, Timaru, Dunedin and Invercargill. Indexes are compiled for all regions and a number of combinations of regions. These indexes do not indicate whether it is more expensive to live in one city than another, or in the North Island or the South Island. The indexes, however, can be used to show where prices of goods and services are rising or falling. For some CPI groups (such as housing and credit services), prices are not collected on a regional basis and therefore comparisons of price movements between different regions is not possible. As table 26.7 shows, the fall in the CPI from the June 1998 quarter to the June 1999 quarter was reflected in falls in the CPI for the North and South Islands. Prices in all but three centres (Christchurch, New Plymouth and Wanganui) fell during the year. In the year to the June 2001 quarter, all regions recorded an increase of at least 3 percent, except for New Plymouth, which had a 2.7 percent increase.
Table 26.7. Consumers price index – all groups, percentage change from same June quarter of previous year
| Region | 1997 | 1998 | 1999 | 2000 | 2001 |
|---|---|---|---|---|---|
Source: Statistics New Zealand | |||||
| Whangarei | 1.2 | 1.6 | -0.7 | 2.3 | 3.2 |
| Auckland | 1.4 | 1.5 | -0.6 | 2.0 | 3.4 |
| Hamilton | 0.8 | 1.1 | -0.5 | 2.1 | 3.0 |
| Tauranga | 0.9 | 1.9 | -0.7 | 2.1 | 3.0 |
| Rotorua | 1.4 | 1.3 | -0.5 | 1.9 | 3.1 |
| Napier–Hastings | 1.1 | 1.2 | -0.2 | 2.0 | 3.2 |
| New Plymouth | 1.1 | 1.7 | 0.1 | 2.1 | 2.7 |
| Wanganui | 1.1 | 1.8 | 0.0 | 2.2 | 3.2 |
| Palmerston North | 1.1 | 1.3 | -0.1 | 2.1 | 3.5 |
| Wellington | 0.6 | 1.4 | -0.1 | 2.3 | 3.2 |
| Nelson | 1.1 | 1.3 | -0.4 | 1.7 | 4.1 |
| Christchurch | 1.1 | 1.4 | 0.2 | 1.9 | 3.0 |
| Timaru | 1.0 | 2.1 | -0.2 | 1.4 | 3.4 |
| Dunedin | 1.0 | 1.7 | -0.7 | 1.5 | 3.3 |
| Invercargill | 0.9 | 1.5 | -0.2 | 1.2 | 3.3 |
| New Zealand | 1.1 | 1.7 | -0.4 | 2.0 | 3.2 |
Like many other countries, New Zealand experienced a rapid increase in consumer goods and services prices in the early 1980s. By the end of 1982, many countries had experienced some reprieve from rising prices, but New Zealanders continued to suffer large price increases until the late 1980s. It was a different situation in the 1990s, with New Zealand showing annual increases below 5 percent from 1991. See table 26.8 and Figure 26.16.
Housing and credit services have been excluded from comparisons as the conceptual and practical treatment of these areas can differ significantly between the CPI in each country. Of the seven countries in the table, Australia experienced the highest increase between the June 2000 quarter and the June 2001 quarter. Japan was the only country where prices fell, continuing the downward trend of the past three years.
Figure 26.16. Consumers price index comparisons
International comparisons of CPI excluding housing and credit
services
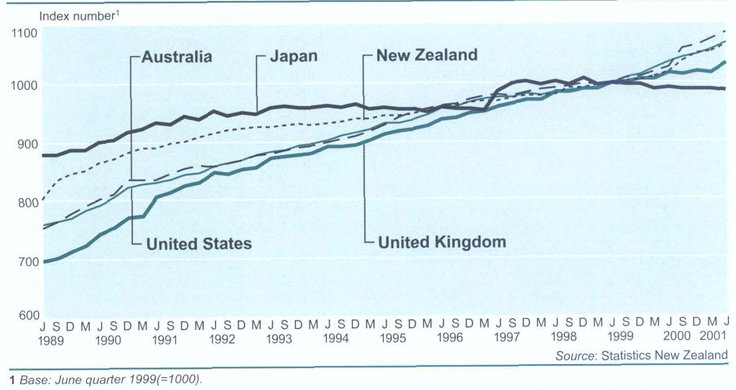
Table 26.8. International comparisons of consumers price indexes, excluding housing and credit services
| June quarter | New Zealand | Australia | Canada | Japan | Germany | United Kingdom | United States |
|---|---|---|---|---|---|---|---|
1Percentage changes are calculated from unrounded index numbers. For New Zealand, index numbers from the June 1999 quarter onwards are rounded. Base:June 1999 quarter (=1000). Source: Statistics New Zealand | |||||||
| 1984 | 489 | 522 | 640 | 837 | 765 | 572 | 647 |
| 1985 | 567 | 557 | 666 | 854 | 779 | 601 | 669 |
| 1986 | 620 | 603 | 694 | 860 | 783 | 617 | 672 |
| 1987 | 740 | 662 | 727 | 858 | 788 | 637 | 695 |
| 1988 | 772 | 709 | 754 | 858 | 798 | 662 | 720 |
| 1989 | 804 | 754 | 788 | 880 | 819 | 698 | 761 |
| 1990 | 865 | 804 | 822 | 901 | 836 | 744 | 793 |
| 1991 | 890 | 837 | 877 | 933 | 860 | 807 | 832 |
| 1992 | 914 | 859 | 887 | 952 | 901 | 846 | 857 |
| 1993 | 927 | 880 | 904 | 957 | 929 | 872 | 882 |
| 1994 | 931 | 899 | 904 | 962 | 950 | 891 | 903 |
| 1995 | 946 | 929 | 933 | 959 | 963 | 913 | 930 |
| 1996 | 959 | 961 | 951 | 959 | 973 | 938 | 955 |
| 1997 | 970 | 980 | 971 | 985 | 983 | 958 | 974 |
| 1998 | 980 | 992 | 982 | 1002 | 998 | 982 | 984 |
| 1999 | 1000 | 1000 | 1000 | 1000 | 1000 | 1000 | 1000 |
| 2000 | 1019 | 1027 | 1023 | 991 | 1012 | 1015 | 1034 |
| 2001 | 1065 | 1087 | 1052 | 986 | 1041 | 1032 | 1068 |
| Percentage change from same quarter of previous year1 | |||||||
| 1984 | 4.4 | 3.3 | 4.9 | 2.0 | 2.5 | 4.8 | 4.1 |
| 1985 | 16.0 | 6.6 | 4.1 | 2.0 | 1.8 | 5.0 | 3.4 |
| 1986 | 9.3 | 8.3 | 4.1 | 0.7 | 0.5 | 2.6 | 0.5 |
| 1987 | 19.2 | 9.8 | 4.8 | -0.3 | 0.6 | 3.3 | 3.5 |
| 1988 | 4.4 | 7.1 | 3.8 | 0.0 | 1.3 | 4.0 | 3.6 |
| 1989 | 4.2 | 6.3 | 4.5 | 2.6 | 2.6 | 5.4 | 5.6 |
| 1990 | 7.5 | 6.7 | 4.2 | 2.4 | 2.1 | 6.5 | 4.2 |
| 1991 | 2.9 | 4.1 | 6.7 | 3.6 | 2.9 | 8.4 | 4.9 |
| 1992 | 2.7 | 2.5 | 1.1 | 2.0 | 4.7 | 4.9 | 3.0 |
| 1993 | 1.5 | 2.5 | 1.9 | 0.6 | 3.1 | 3.0 | 3.0 |
| 1994 | 0.4 | 2.1 | 0.0 | 0.5 | 2.2 | 2.2 | 2.3 |
| 1995 | 1.6 | 3.4 | 3.2 | -0.3 | 1.4 | 2.5 | 3.0 |
| 1996 | 1.4 | 3.4 | 1.9 | 0.0 | 1.0 | 2.7 | 2.7 |
| 1997 | 1.2 | 2.0 | 2.1 | 2.7 | 1.0 | 2.2 | 2.0 |
| 1998 | 1.1 | 1.2 | 1.2 | 1.7 | 1.6 | 2.5 | 1.0 |
| 1999 | 2.0 | 0.8 | 1.8 | -0.2 | 0.2 | 1.8 | 1.7 |
| 2000 | 1.9 | 2.7 | 2.3 | -0.9 | 1.2 | 1.5 | 3.4 |
| 2001 | 4.5 | 5.8 | 2.9 | -0.5 | 2.9 | 1.6 | 3.2 |
The producers price index (PPI) compiled by Statistics New Zealand is a series of quarterly economic indicators designed to measure price changes in the production sector of the economy. The consumers price index (CPI), on the other hand, measures price changes in the household sector of the economy. The PPI has two types of indexes. ‘Outputs’ indexes measure changes in prices received by producers, and ‘inputs’ indexes measure price changes in costs of production, excluding labour and capital.
Uses of the PPI. The PPI can be used in analysis of inflationary trends, in economic forecasting and in estimating economic growth. It can be used to measure changes in production in constant dollar values. The index is also widely used to determine increases allowable under escalation clauses in commercial contracts.
Coverage. The PPI is calculated quarterly from price quotes collected mainly by postal survey. Approximately 13,000 individual commodity items are surveyed from about 3,000 respondents. Prices are generally collected each quarter, with the price on the 15th day of the middle month of the quarter being measured. Prices may be obtained monthly or annually, depending on the nature of the item.
Prices used to calculate the outputs indexes are those prevailing at the ‘factory door’ (price received by the producer). Outputs indexes cover primary products, manufactured goods, revenue from renting and leasing, provision of services, capital work undertaken by own employees, and margins on goods purchased for resale. Excluded from the outputs indexes are interest and dividends, royalties and patent fees, receipts from insurance claims, government cash grants and subsides, and GST and other indirect taxes. Inputs indexes measure price changes in the cost of production and cover materials, fuels and electricity, transport and communication, commission and contract services, rent and lease of land, buildings, vehicles and plant, business services, and insurance premiums less claims. Excluded from inputs indexes are wages and salaries, capital expenditure and depreciation costs, ACC levies and other government charges, rates, royalties, patent fees, bad debts and donations.
Classification and calculation. The format of the PPI is based on the economic activities assigned in the Australian and New Zealand Standard Industrial Classification. Weightings applied to prices collected for the PPI are determined by the relative importance of commodities and businesses within the industry or industry group. Information from various economic surveys and censuses is used to determine the weightings. The specifications of commodities to be price-surveyed are determined in consultation with suppliers to ensure they are representative. The index is calculated at several different levels. An example is the business services index. At the lowest level, commodity products such as accounting services or management fees are calculated. The commodity indexes are combined to form sub-industry indexes, such as legal and accounting services. The sub-industry indexes are then combined to form published industry indexes, such as business services. The business services index also forms part of the all industries index, also re-expressed to a base quarter of December 1997. Tables 26.9 and 26.10 and Figure 26.17 show PPI inputs and outputs indexes.
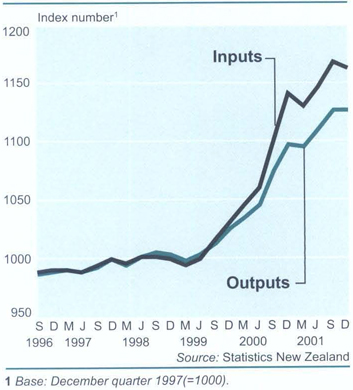
Table 26.9. Producers price index – inputs Base: December 1997 quarter (=1000)
| 2000 | 2000 | |||||
|---|---|---|---|---|---|---|
| Industry groups | Mar | Jun | Sep | Dec | Mar | Jun |
1Agriculture input indexes by form type are bused on farm expenses price index (FEPI) allegories, not Australian and New Zealand Standard Industrial Classification 1993 (ANZSIC) categories. Output agriculture indexes by farm types are based on ANZSIC. 2Tobacco product manufacturing has been combined with beverage and malt manufacturing for confidentiality reasons. 3The water supply industry index is not of sufficient quality and a separate Index for it is not published. 4The series reference has changed, as at the June 2000 quarter, for consistency with series references for other divisions. The composition of this index is unchanged. 5Rail transport has been combined with other transport and storage services for confidentiality reasons. Source: Statistics New Zealand | ||||||
| Agriculture, forestry and fishing | 1034 | 1048 | 1073 | 1106 | 1121 | 1144 |
| Horticultural & fruitgrowing | 1021 | 1034 | 1047 | 1067 | 1070 | 1083 |
| Sheep and beef farming1 | 1042 | 1059 | 1092 | 1138 | 1172 | 1196 |
| Dairy cattle farming | 1051 | 1063 | 1083 | 1117 | 1135 | 1199 |
| Cropping and other farming1 | 999 | 1023 | 1043 | 1078 | 1105 | 1126 |
| Services to agriculture, hunting and trapping | 1061 | 1075 | 1099 | 1134 | 1130 | 1139 |
| Forestry and logging | 1003 | 1010 | 1032 | 1041 | 1034 | 1041 |
| Fishing | 1102 | 1117 | 1143 | 1189 | 1179 | 1177 |
| Mining | 1049 | 1059 | 1086 | 1129 | 1110 | 1123 |
| Manufacturing | 1044 | 1065 | 1121 | 1163 | 1154 | 1168 |
| Meat and meat product mfg | 1144 | 1208 | 1315 | 1387 | 1336 | 1444 |
| Dairy product mfg | 976 | 982 | 1131 | 1151 | 1152 | 1157 |
| Other food mfg | 1103 | 1045 | 1075 | 1106 | 1105 | 1108 |
| Tobacco, beverage and malt mfg2 | 1071 | 1088 | 1094 | 1126 | 1124 | 1132 |
| Textile and apparel mfg | 972 | 999 | 1052 | 1083 | 1073 | 1092 |
| Wood product mfg | 1010 | 1033 | 1073 | 1097 | 1098 | 1083 |
| Paper and paper product mfg | 1112 | 1141 | 1191 | 1238 | 1160 | 1152 |
| Printing, publishing and recorded media | 1063 | 1068 | 1100 | 1129 | 1147 | 1157 |
| Petroleum, coal and basic chemical mfg | 1011 | 1038 | 1092 | 1148 | 1207 | 1165 |
| Rubber, plastics and other chemical mfg | 1045 | 1067 | 1088 | 1144 | 1148 | 1160 |
| Non-metallic mineral product mfg | 1032 | 1038 | 1050 | 1077 | 1092 | 1094 |
| Basic metal mfg | 1054 | 1053 | 1071 | 1131 | 1095 | 1110 |
| Sheet and fabricated metal product mfg | 1035 | 1057 | 1077 | 1135 | 1117 | 1118 |
| Transport equipment mfg | 1068 | 1071 | 1085 | 1118 | 1113 | 1124 |
| Machinery and equipment mfg | 1055 | 1081 | 1112 | 1189 | 1179 | 1178 |
| Other manufacturing | 1024 | 1035 | 1050 | 1073 | 1077 | 1083 |
| Electricity, gas and water3 | 934 | 932 | 931 | 944 | 972 | 1061 |
| Electricity generation and supply | 918 | 915 | 912 | 925 | 957 | 1059 |
| Gas supply | 1019 | 1023 | 1027 | 1054 | 1053 | 1079 |
| Construction4 | 1040 | 1049 | 1085 | 1132 | 1128 | 1130 |
| Wholesale trade4 | 1121 | 1149 | 1262 | 1322 | 1234 | 1287 |
| Retail trade4 | 1025 | 1028 | 1042 | 1060 | 1060 | 1071 |
| Accommodation, cafes and restaurants5 | 1035 | 1037 | 1053 | 1059 | 1061 | 1071 |
| Transport and storage | 1132 | 1141 | 1184 | 1328 | 1264 | 1237 |
| Road transport | 1081 | 1118 | 1144 | 1206 | 1220 | 1209 |
| Water transport | 1072 | 1087 | 1097 | 1149 | 1106 | 1122 |
| Air transport | 1226 | 1214 | 1292 | 1569 | 1400 | 1344 |
| Rail, other transport and storage services5 | 1046 | 1056 | 1066 | 1103 | 1118 | 1110 |
| Communication services4 | 9,919 | 921 | 928 | 939 | 957 | 967 |
| Finance and insurance | 1,028 | 1,031 | 1,042 | 1,056 | 1,065 | 1,072 |
| Finance | 1,025 | 1,028 | 1,040 | 1,054 | 1,062 | 1,068 |
| Insurance | 1,034 | 1038 | 1047 | 1062 | 1071 | 1078 |
| Services to finance and insurance | 1025 | 1027 | 1038 | 1054 | 1065 | 1072 |
| Property and business services | 1036 | 1039 | 1050 | 1070 | 1083 | 1090 |
| Real estate | 1029 | 1033 | 1045 | 1058 | 1066 | 1073 |
| Ownership of owner-occupied dwellings | 1015 | 1018 | 1035 | 1053 | 1067 | 1076 |
| Other property services | 1061 | 1061 | 1076 | 1089 | 1104 | 1114 |
| Business services | 1042 | 1045 | 1055 | 1078 | 1091 | 1098 |
| Public administration and defence4 | 1029 | 1036 | 1051 | 1067 | 1072 | 1081 |
| Central government and defence4 | 1031 | 1035 | 1048 | 1061 | 1067 | 1076 |
| Local government and civil defence | 1027 | 1036 | 1055 | 1074 | 1078 | 1088 |
| Education4 | 1024 | 1027 | 1039 | 1055 | 1067 | 1074 |
| Health and community services4 | 1028 | 1032 | 1046 | 1063 | 1071 | 1082 |
| Cultural and recreational services4 | 032 | 1035 | 1045 | 1060 | 1063 | 1073 |
| Personal and community services4 | 1062 | 1073 | 1095 | 1116 | 1137 | 1139 |
| All industries excl admin health education | 1047 | 1062 | 1105 | 1147 | 1134 | 1151 |
| All industries | 1046 | 1060 | 1101 | 1142 | 1130 | 1146 |
Table 26.1. Producers price index – outputs Base: December 1997 quarter (=1000)
| 2000 | 2001 | |||||
|---|---|---|---|---|---|---|
| Industry groups | Mar | Jun | Sep | Dec | Mar | Jun |
1Tobacco product manufacturing has been combined with beverage and malt manufacturing far confidentiality reasons. 2The water supply industry index is not of sufficient quality and a separate index for it is not published. 3The series reference has changed, as at the June 2000 quarter, for consistency with series references for other divisions. The composition of this index is unchanged. 4Rail transport has been combined with other transport and storage services for confidentiality reasons. Source: Statistics New Zealand | ||||||
| Agriculture, forestry and fishing | 1054 | 1092 | 1189 | 1221 | 1207 | 1248 |
| Horticulture and fruit growing | 1029 | 1033 | 1139 | 1112 | 1090 | 1135 |
| Livestock and cropping farming | 1101 | 1172 | 1288 | 1361 | 1357 | 1463 |
| Dairy cattle farming | 1014 | 1029 | 1204 | 1222 | 1211 | 1242 |
| Other farming | 1023 | 1037 | 1087 | 1100 | 1051 | 1110 |
| Services to agriculture, hunting and trapping | 1017 | 1021 | 1042 | 1076 | 1079 | 1087 |
| Forestry and logging | 979 | 1025 | 1047 | 1058 | 1041 | 994 |
| Fishing | 1293 | 1352 | 1375 | 1451 | 1439 | 1420 |
| Mining | 1227 | 1251 | 1389 | 1496 | 1385 | 1409 |
| Manufacturing | 1054 | 1069 | 1107 | 1131 | 1135 | 1147 |
| Meat and meat product mfg | 1114 | 1143 | 1301 | 1304 | 1281 | 1370 |
| Dairy product mfg | 1042 | 1089 | 1076 | 1128 | 1144 | 1195 |
| Other food mfg | 1090 | 1097 | 1104 | 1139 | 1148 | 1144 |
| Tobacco, beverage and malt mfg1 | 1046 | 1058 | 1077 | 1084 | 1097 | 1097 |
| Textile and apparel mfg | 1003 | 1022 | 1054 | 1076 | 1084 | 1096 |
| Wood product mfg | 1048 | 1055 | 1080 | 1101 | 1082 | 1073 |
| Paper and paper product mfg | 1110 | 1145 | 1196 | 1217 | 1148 | 1133 |
| Printing, publishing and recorded media | 1148 | 1158 | 1167 | 1208 | 1184 | 1175 |
| Petroleum, coal and basic chemical mfg | 1004 | 982 | 1216 | 1204 | 1261 | 1212 |
| Rubber, plastics and other chemical mfg | 1030 | 1038 | 1049 | 1068 | 1090 | 1101 |
| Non-metallic mineral product mfg | 997 | 998 | 999 | 1011 | 1026 | 1030 |
| Basic metal mfg | 984 | 990 | 1008 | 1038 | 1056 | 1060 |
| Sheet and fabricated metal product mfg | 981 | 1000 | 997 | 1015 | 1036 | 1036 |
| Transport equipment mfg | 1033 | 1042 | 1063 | 1096 | 1086 | 1093 |
| Machinery and equipment mfg | 1051 | 1055 | 1064 | 1095 | 1133 | 1131 |
| Other manufacturing | 1020 | 1029 | 1035 | 1058 | 1071 | 1082 |
| Electricity, gas and water2 | 940 | 932 | 931 | 934 | 953 | 1020 |
| Electricity generation and supply | 931 | 920 | 916 | 918 | 938 | 1014 |
| Gas supply | 1019 | 1031 | 1045 | 1066 | 1075 | 1091 |
| Construction3 | 1012 | 1019 | 1028 | 1043 | 1048 | 1054 |
| Wholesale trade3 | 1047 | 1067 | 1104 | 1158 | 1137 | 1158 |
| Retail trade3 | 1030 | 1036 | 1053 | 1070 | 1076 | 1089 |
| Accommodation, cafes & restaurants3 | 1031 | 1031 | 1037 | 1043 | 1053 | 1052 |
| Transport and storage | 1040 | 1047 | 1061 | 1103 | 1108 | 1112 |
| Road transport | 1006 | 1013 | 1024 | 1055 | 1063 | 1066 |
| Water transport | 1121 | 1129 | 1149 | 1223 | 1182 | 1208 |
| Air transport | 1058 | 1068 | 1085 | 1140 | 1158 | 1165 |
| Rail, other transport and storage services4 | 1044 | 1047 | 1062 | 1097 | 1089 | 1090 |
| Communication services3 | 884 | 880 | 883 | 888 | 893 | 902 |
| Finance and insurance | 1053 | 1055 | 1063 | 1054 | 1055 | 1064 |
| Finance | 1066 | 1064 | 1071 | 1058 | 1054 | 1061 |
| Insurance | 1028 | 1040 | 1043 | 1045 | 1056 | 1065 |
| Services to finance and insurance | 1040 | 1040 | 1065 | 1054 | 1059 | 1081 |
| Property and business services | 1020 | 1019 | 1025 | 1031 | 1033 | 1036 |
| Real estate | 1003 | 1003 | 1006 | 1009 | 1003 | 1003 |
| Ownership of owner-occupied dwellings | 1011 | 1008 | 1007 | 1008 | 1008 | 1009 |
| Other property services | 1024 | 995 | 998 | 1018 | 1036 | 1022 |
| Business services | 1036 | 1040 | 1053 | 1063 | 1072 | 1078 |
| Cultural and recreational services3 | 1080 | 1098 | 1113 | 1123 | 1122 | 1125 |
| Personal and community services1 | 1031 | 1039 | 1044 | 1051 | 1058 | 1061 |
| All industries | 1035 | 1046 | 1075 | 1097 | 1096 | 1110 |
The capital goods price index (CGPI) provides a measure of the price level changes for physical capital assets purchased by producers of goods and services throughout the economy, which includes New Zealand businesses and the government. In addition to the all groups index, six group indexes and 54 asset-type indexes are produced (see table 26.11). For the asset-type indexes, quarterly index numbers are available from the December 1979 quarter. The six group indexes and the all groups index have been produced from the December 1989 quarter. Weights of commodities are determined by the relative importance within each of the asset type indexes. Weighting information is derived from statistics on external trade, manufacturing and building, and vehicle registrations. This data is supplemented with information obtained from discussions with manufacturers, importers, wholesalers and retailers. Data for several years is used, as expenditure on capital goods can be irregular. Prices used in the calculation are those paid by final users.
Table 26.11. Capital goods price index1
| 2000 | 2001 | |||||
|---|---|---|---|---|---|---|
| Index | Mar | Jun | Sep | Dec | Mar | Jun |
1Base: September 1999 quarter (=1000). Indexes relate to price levels ruling at mid-point of each quarter. 2This index does not purport to reflect all price changes in building work because of measurement difficulties, particularly with respect to discounts on labour and material prices. Source: Statistics New Zealand | ||||||
| Residential buildings2 | 1013 | 1023 | 1026 | 1035 | 1043 | 1045 |
| Dwellings and out-buildings | 1013 | 1023 | 1027 | 1036 | 1043 | 1045 |
| Hostels, boarding houses2 | 1000 | 1000 | 1000 | 1008 | 1012 | 1014 |
| Non-residential buildings2 | 1004 | 1003 | 1004 | 1010 | 1013 | 1020 |
| Shops, offices2 | 1003 | 1003 | 1003 | 1005 | 1009 | 1014 |
| Warehouses, factories2 | 1004 | 1004 | 1004 | 1018 | 1021 | 1033 |
| Farm buildings | 1010 | 1011 | 1011 | 1013 | 1019 | 1026 |
| Other non-residential buildings2 | 1004 | 1003 | 1003 | 1010 | 1012 | 1017 |
| Other construction | 1013 | 1027 | 1039 | 1060 | 1065 | 1075 |
| Transport ways | 1014 | 1031 | 1052 | 1071 | 1076 | 1104 |
| Pipelines | 1019 | 1036 | 1047 | 1079 | 1085 | 1093 |
| Electrical works | 1007 | 1018 | 1026 | 1035 | 1039 | 1039 |
| Earthmoving and site work | 1010 | 1020 | 1026 | 1058 | 1066 | 1072 |
| Land improvements | 1021 | 1025 | 1047 | 1070 | 1084 | 1096 |
| Land clearing and establishment | 1005 | 1007 | 1015 | 1033 | 1047 | 1062 |
| Fencing | 1009 | 1006 | 1042 | 1045 | 1059 | 1073 |
| Irrigation and land drainage | 1071 | 1093 | 1133 | 1195 | 1215 | 1220 |
| Reclamation and river control | 1014 | 1020 | 1025 | 1046 | 1055 | 1062 |
| Transport equipment | 1021 | 1030 | 1042 | 1062 | 1073 | 1078 |
| Cars 1600cc and under | 1027 | 1038 | 1051 | 1068 | 1072 | 1082 |
| Cars over 1600cc | 1013 | 1017 | 1026 | 1036 | 1052 | 1057 |
| Commercial vehicles 3500kg and under | 1038 | 1063 | 1081 | 1101 | 1108 | 1118 |
| Commercial vehicles over 3500kg | 1023 | 1032 | 1046 | 1097 | 1097 | 1090 |
| Buses | 1004 | 1006 | 1007 | 1011 | 1012 | 1012 |
| Trailers | 1000 | 1008 | 1044 | 1071 | 1138 | 1143 |
| Motorcycles | 1010 | 1102 | 1147 | 1151 | 1240 | 1240 |
| Helicopters | 1127 | 1145 | 1222 | 1397 | 1308 | 1349 |
| Plant, machinery and equipment | 1015 | 1020 | 1039 | 1082 | 1072 | 1076 |
| Glass and glass products | 949 | 953 | 964 | 970 | 970 | 936 |
| Furniture | 998 | 993 | 984 | 996 | 997 | 1006 |
| Other manufactured articles | 1005 | 1017 | 1024 | 1060 | 1070 | 1077 |
| Structural metal products | 1003 | 1010 | 992 | 1011 | 1023 | 1034 |
| Metal tanks, reservoirs and containers | 1028 | 1131 | 1152 | 1164 | 1166 | 1167 |
| Steam generators | 970 | 970 | 973 | 999 | 1023 | 1023 |
| Other fabricated metal products | 1009 | 1014 | 1031 | 1050 | 1052 | 1082 |
| Engines and turbines | 1001 | 1004 | 1029 | 1056 | 1053 | 1060 |
| Pumping and compressing equipment | 1004 | 1009 | 1008 | 1038 | 1041 | 1045 |
| Ovens and furnace burners | 1000 | 1000 | 1040 | 1056 | 1056 | 1102 |
| Lifting and handling equipment | 1051 | 1085 | 1109 | 1169 | 1131 | 1128 |
| Other general purpose machinery | 1010 | 1020 | 1032 | 1053 | 1059 | 1066 |
| Agricultural and forestry equipment | 1006 | 1009 | 1021 | 1033 | 1037 | 1044 |
| Machine tools | 1015 | 1021 | 1045 | 1066 | 1074 | 1081 |
| Machinery for mining, quarrying and construction | 1031 | 1043 | 1094 | 1176 | 1144 | 1145 |
| Machinery for food, beverage and tobacco processing | 1012 | 1016 | 1045 | 1064 | 1074 | 1102 |
| Machinery for textile, apparel and leather production | 1039 | 1046 | 1081 | 1173 | 1155 | 1146 |
| Domestic appliances | 1002 | 1010 | 1052 | 1074 | 1092 | 1112 |
| Other special purpose machinery | 1052 | 1055 | 1135 | 1242 | 1229 | 1224 |
| Office and accounting machinery | 999 | 1011 | 1032 | 1038 | 1039 | 1047 |
| Computer machinery | 1000 | 999 | 1008 | 1074 | 1008 | 1008 |
| Electric motors, generators and transformers | 1011 | 1020 | 1020 | 1030 | 1036 | 1055 |
| Electricity distribution and control apparatus | 1001 | 1000 | 971 | 982 | 961 | 971 |
| Insulated wire and cable; optical fibre cables | 1027 | 1029 | 1090 | 1161 | 1220 | 1210 |
| Accumulators, primary cells and primary batteries | 988 | 989 | 980 | 1010 | 1003 | 1015 |
| Other electrical equipment | 1016 | 1014 | 1001 | 1042 | 1027 | 1037 |
| Television and radio transmitters and apparatus | 1007 | 995 | 972 | 994 | 1004 | 1011 |
| Medical and surgical equipment | 1004 | 1034 | 1069 | 1127 | 1140 | 1139 |
| Measuring, testing and navigating instruments | 1025 | 1039 | 1077 | 1105 | 1103 | 1090 |
| Optical instruments and photographic equipment | 1026 | 1033 | 1044 | 1126 | 1137 | 1138 |
| Bodies for motor vehicles and trailers | 1004 | 1010 | 1043 | 1071 | 1110 | 1098 |
| Other plant, machinery and equipment | 1026 | 1041 | 1050 | 1084 | 1085 | 1078 |
| All groups | 1014 | 1020 | 1031 | 1054 | 1055 | 1059 |
26.1–26.3 Statistics New Zealand.
Statistics New Zealand divisional manager responsible: Vina Cullum.
All About the Consumers Price Index (A Layperson's Guide) (2000). Statistics New Zealand, Wellington.
Key Statistics (monthly). Statistics New Zealand.
Producers Price Index – Concepts, Sources and Methods (1999). Statistics New Zealand, Wellington.
Table of Contents
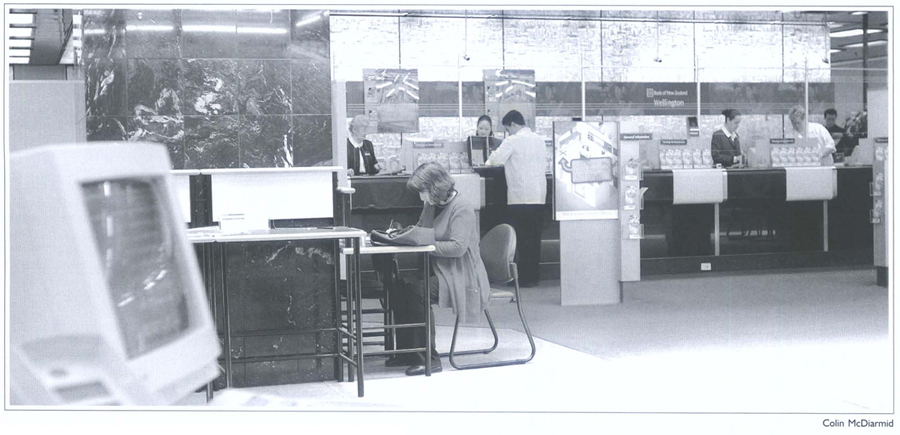
As at March 2002, there were 17 registered banks in New Zealand.
Unlike most other countries, New Zealand has no specific restrictions on the provision of financial services such as deposit taking. Only financial institutions wishing to use the word ‘bank’ (or one of its derivatives) in their name or title are required to obtain authorisation to operate as registered banks. Nevertheless, in terms of volume, registered banks dominate financial intermediation in New Zealand, although there are a substantial number of small non-bank financial institutions, such as finance companies, credit unions and building societies. The majority of registered banks are subsidiaries, or branches, of overseas banks. Only two of the 17 banks registered at March 2002 were New Zealand owned.
The Reserve Bank of New Zealand is New Zealand's central bank. The reserve bank has three main functions:
Operating monetary policy to maintain price stability.
Promoting maintenance of a sound and efficient financial system.
Meeting the currency needs of the public.
The reserve bank is required to independently manage monetary policy – the supply of money and credit – to maintain overall price stability. Price stability is defined in a separate contract between the bank's governor and the treasurer as keeping inflation between 0 and 3 per cent. This is achieved through influencing short-term interest rates, which in turn influence longer-term interest rates and thus spending, saving and borrowing by the public and businesses.
The reserve bank is also responsible for the registration and prudential supervision of registered banks, to help ensure a sound and efficient financial system.
The reserve bank issues New Zealand's currency and manages foreign exchange reserves (intervention in the foreign exchange market has not occurred since the exchange rate began freely floating in March 1985). The bank provides cash and debt management services to the government, and secretariat services to the Overseas Investment Commission.
The Reserve Bank of New Zealand Act 1989 defines the bank's duties and governance arrangements. but makes the bank operationally independent. The bank's chief executive officer, or governor, is accountable for the bank's actions. The bank's performance is monitored by a board of directors on the treasurer's behalf.
Bank registration and supervision. The Reserve Bank of New Zealand (RBNZ) is responsible for bank registration and prudential supervision of registered banks in New Zealand.
The legislation under which the bank operates, the Reserve Bank of New Zealand Act 1989, requires the bank to maintain a sound and efficient financial system and to avoid significant damage to the financial system that could result from the failure of a registered bank. Accordingly, the bank's supervision and registration framework does not aim to protect depositors or individual banks from loss. Instead, the main focus is on the efficient and effective operation of the banking system as a whole.
A major disruption in the provision of financial services, or lack of efficiency in the delivery of services, could potentially impose significant costs on other sectors of the economy. In the event that a bank does fail, the reserve bank has crisis management powers that allow it to take steps to minimise any flow-on effects to the rest of the financial sector.
There is no upper limit on the number of banks that can be registered in New Zealand. The policy behind this is based on the belief that competitive forces encourage efficiency and innovation, and that overseas banks coming into New Zealand can bring valuable expertise to the local market. Nevertheless, all applicants for registration must satisfy the reserve bank that they can meet minimum prudential requirements. Applicants must satisfy the bank that they are primarily involved in providing financial services. In addition, when considering an application for registration, the reserve bank is required to have regard to:
Incorporation and ownership structure.
Size (a minimum capital of $15 million is required).
Size and nature of any part of the applicant's business.
Standing or reputation in the financial market.
Ability to carry on business in a prudent manner.
If the applicant is an overseas bank, the amount and frequency of disclosure in the home jurisdiction.
If the applicant is an overseas bank, the law and regulatory requirements in the home jurisdiction relating to bank registration or authorisation, the priority of claims of creditors in an insolvency and disclosure of financial and other information.
As at March 2002, there were 17 registered banks, with the most recent registration being that of Kiwibank Ltd (a subsidiary of state-owned enterprise New Zealand Post Ltd). Kiwibank's registration brought the number of New Zealand-owned banks to two.
The reserve bank's supervision framework focuses primarily on public disclosure and director attestation requirements. Each bank must publish a quarterly disclosure statement containing a comprehensive range of financial information on the bank, the banking group it heads and, where applicable, the parent company. The bank's directors are required to sign each disclosure statement and a number of attestations about key prudential matters, including one relating to the adequacy of the bank's systems and controls. In addition, banks are required to meet the internationally agreed minimum capital adequacy ratio of 8 percent and to limit their exposures to connected persons.
The disclosure and attestation requirements strengthen market disciplines on banks and sharpen incentives for directors to take appropriate responsibility for the prudent operation of their banks. The disclosure regime also provides depositors and other creditors with the information they need to make informed decisions on where best to place their money.
The Reserve Bank of New Zealand has a wide range of powers to respond to a bank distress or failure, including the power to give directions to the bank and the ability to recommend to the Minister of Finance that a bank be placed under statutory management.
Tables 27.1 and 27.2 list the assets and liabilities of the Reserve Bank of New Zealand.
Table 27.1. Assets of the Reserve Bank of New Zealand
| As at 30 June | Denominated in foreign currency | Denominated in New Zealand dollars | Total assets | |||||||||
|---|---|---|---|---|---|---|---|---|---|---|---|---|
| Advances | Investment in NZ | Fixed assets and inventories | Other assets3 | |||||||||
| Current account advances | Marketable securities | IMF holdings of SDRs | Foreign assets | Settlement institutions1 | Crown settlement account2 | Advances to Treasury | Government securities | Other | ||||
1Repurchase advances, secured loans, overnight advances and accrued interest owing from settlement institutions. 2Net overdrawn balances in the Crown settlement account. 3Includes accounts receivable and sundry assets. Source: Reserve Bank of New Zealand | ||||||||||||
| $(million) | ||||||||||||
| 1994 | 1,254 | 2,900 | – | – | 850 | – | 1,176 | 1,247 | – | 70 | 11 | 7,508 |
| 1995 | 1,113 | 2,889 | – | – | 773 | – | 1,250 | 1,519 | – | 61 | 9 | 7,614 |
| 1996 | 1,297 | 3,056 | 1 | – | 682 | – | 1,249 | 1,982 | – | 61 | 7 | 8,335 |
| 1997 | 1,133 | 3,340 | – | – | 750 | – | 1,236 | 2,041 | – | 58 | 8 | 8,566 |
| 1998 | 1,860 | 4,490 | 2 | 1 | 1,059 | – | 1,204 | 2,149 | – | 58 | 6 | 10,829 |
| 1999 | 2,283 | 3,602 | – | – | 3,064 | – | – | 2,256 | 1 | 56 | 6 | 11,268 |
| 2000 | 2,020 | 4,109 | – | – | 1,600 | – | – | 2,492 | – | 48 | 5 | 10,274 |
| 2001 | 1,810 | 4,056 | – | – | 2,517 | – | – | 2,708 | – | 44 | 4 | 11,139 |
Table 27.2. Liabilities of the Reserve Bank of New Zealand
| As at 30 June | Denominated in foreign currency | Denominated in New Zealand dollars | Other liabilities7 | Capital reserves | Total liabilities | ||||||
|---|---|---|---|---|---|---|---|---|---|---|---|
| Current1 | Long term2 | IMF allocations of SDRs3 | Deposits | ||||||||
| Reserve bank bills4 | Government5 | Settlement Institutions | Other6 | Current in circulation | |||||||
1Foreign currency denominated repurchase, secured loan and credit line financing provided by foreign counterparties. 2Foreign currency denominated financing provided by The Treasury (and the earthquake commission up to 3 June 1998). 3SDR denominated financing provided by the IMF. In December 1998. SDR assets and liabilities were transferred to the Treasury. SDRs are now directly accounted for as the Crown balance sheet. 4Short-term discount securities issued by the reserve bank. The bank ceased issuing reserve bank bills on 5 February 1999. All reserve bank bills and related advances to The Treasury were repaid by 9 April 1999. 5Net in funds balance in the Crown settlement and other government accounts held at the reserve hank. 6Includes IMF number 1 account, staff deposits and Other sundry deposits. 7Creditors and accounts payable. Source: Reserve Bank of New Zealand | |||||||||||
| $(million) | |||||||||||
| 1994 | 260 | 3,546 | 347 | 1,132 | 264 | 1 | 74 | 1,413 | 30 | 441 | 7,508 |
| 1995 | 72 | 3,596 | 334 | 1,241 | 280 | 3 | 58 | 1,516 | 29 | 485 | 7,614 |
| 1996 | 381 | 3,670 | 301 | 1,249 | 535 | 18 | 28 | 1,599 | 5 | 549 | 8,335 |
| 1997 | 595 | 3,586 | 292 | 1,236 | 608 | 1 | 46 | 1,665 | 143 | 394 | 8,566 |
| 1998 | 1,266 | 4,714 | 370 | 1,203 | 957 | 2 | 25 | 1,733 | 158 | 401 | 10,829 |
| 1999 | 1,474 | 4,405 | – | – | 2,881 | 1 | 55 | 1,885 | 13 | 554 | 11,268 |
| 2000 | 1,541 | 4,589 | – | – | 1,328 | 49 | 36 | 2,160 | 14 | 557 | 10,274 |
| 2001 | 963 | 4,756 | – | – | 2,250 | 66 | 70 | 2,463 | 166 | 405 | 11,139 |
Before 1984, a range of regulatory distinctions existed among different types of deposit-taking financial institution. Aside from trading (commercial) banks, there were trustee and private savings banks, building societies, credit unions, merchant banks, stock and station agents and many finance companies. Regulations prescribed the activities each of these institutions could engage in.
Since 1984, however, deregulation has led to a concentration of business in banks.
There are now two broad categories of deposit-taking financial institution – registered banks and ‘other financial institutions’.
After the banking industry was deregulated in the 1980s, the number of registered banks increased significantly, partly as a result of non-bank financial institutions obtaining registered bank status and partly due to an inflow of foreign banks.
Registered banks proved very efficient intermediaries in the deregulated market and the business of many finance companies was absorbed by them. In 1985 banks provided a quarter of all domestic credit, whereas by 2000 they had an 85 percent share. Most competitors had transferred their activities to the banking framework, or lost ground.
By 2000, banks provided more than 90 percent of household credit, compared with 20 percent in 1985.
Non-bank financial institutions declined in importance following deregulation as most of the larger ones became banks, while some of the banks which owned separate finance companies consolidated those operations within the bank itself.
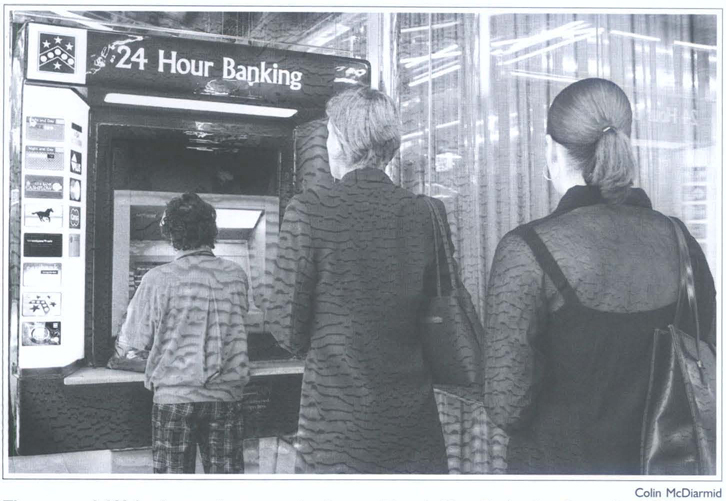
There were 1,692 bank-owned automated teller machines in New Zealand at December 2000
Cheques accounted for 54 percent of transactions in 1993, but only 18 percent in 2000.
More recently, there has been some rationalisation in the banking sector, with a number of banks acquiring other banks and merging operations. In addition, a number of overseas banks who entered New Zealand in the 1980s have withdrawn or scaled back operations. At 31 March 2002, there were 17 registered banks in New Zealand. In spite of rationalisation, the number of banks per capita is still relatively high by international standards. In part, this reflects the open nature of the registration regime. The non-bank financial sector following deregulation is small compared with other countries, for example, Australia.
The New Zealand banking system is characterised by a high degree of foreign, particularly Australian, ownership. Around 99 percent of the assets of the New Zealand banking system are under ownership of a foreign bank parent, with approximately 70 percent under Australian ownership. This provides a source of strength for the system, giving local banks access to capital resources and banking expertise.
Registered banks operating in New Zealand as at March 2002 were: ABN AMRO Bank, AMP Bank Ltd. ANZ Banking Group (New Zealand) Ltd, ASB Bank Ltd, Bank of New Zealand Ltd, Bank of Tokyo-Mitsubishi (Australia) Ltd, Citibank NA, Commonwealth Bank of Australia, Deutsche Bank AG, Kiwibank Ltd, Kookmin Bank, Rabobank Nederland, Rabobank New Zealand Ltd, The Hong Kong and Shanghai Banking Corporation Ltd, The National Bank of New Zealand Ltd, TSB Bank Ltd, Westpac Banking Corporation.
Table 27.3 lists the liabilities and assets of M3 financial institutions.
Table 27.3. Liabilities and assets of M3 financial institutions
| Item | As at September quarter | ||||
|---|---|---|---|---|---|
| 1997 | 1998 | 1999 | 2000 | 2001 | |
1Includes trade creditors debtors, accounts payable receivable, and items in transit, timing and statistical adjustments. 2Any two entities, ie companies. organisations or individuals with the same shareholders and/or any company which holds 20 percent or more of the paid up capital of another company (the associated). A subsidiary is an associate. 3The large decline in this category is due to the reserve bank no longer issuing reserve hank bills since the implementation of the overnight cash rate regime in early 1999. Source: Reserve Bank of New Zealand | |||||
| Liabilities –NZ$(million) | |||||
| NZ dollar funding – | |||||
| NZ residents | 83,780 | 87,637 | 93,584 | 93,869 | 104,048 |
| Non-residents | 12,419 | 13,565 | 15,033 | 14,507 | 27,335 |
| Total NZ$ funding | 96,199 | 101,203 | 108,617 | 108,376 | 131,383 |
| Foreign currency funding – | |||||
| NZ residents | 3,381 | 3,624 | 3,022 | 3,726 | 2,750 |
| Non-residents | 13,590 | 21,967 | 26,937 | 39,032 | 37.696 |
| Total | 16,971 | 25,591 | 29,959 | 42,758 | 40,446 |
| Capital and reserves | 6.970 | 7,874 | 8,533 | 9,623 | 10,503 |
| Other liabilities1 | 5,623 | 7,291 | 4,769 | 11,670 | 13,967 |
| Total liabilities | 125,763 | 141,959 | 151,877 | 172,426 | 196,299 |
| Funding from associates2 | 11,304 | 17,646 | 23,001 | 29,800 | 29,792 |
| Assets – | |||||
| Total NZ Government securities | 3,593 | 5,626 | 8,264 | 6,953 | 6,858 |
| NZ notes and coin | 279 | 282 | 330 | 452 | 555 |
| Claims on the reserve bank3 | 1,233 | 1,096 | 21 | 2 | 17 |
| NZ dollar claims – | |||||
| NZ residents (M3) | 7,193 | 10,719 | 10,602 | 10,419 | 12,460 |
| NZ residents (non M3) | 98,528 | 104,637 | 114,158 | 120,693 | 130,179 |
| Non-residents | 3,689 | 4,576 | 5,950 | 7,762 | 14,930 |
| Total NZ$ claims | 109,409 | 119,932 | 130,710 | 138,874 | 157,569 |
| Foreign currency claims | |||||
| NZ residents | 3,245 | 3,407 | 3,366 | 4,010 | 5,767 |
| Non-residents | 1,003 | 817 | 2,764 | 5,664 | 8,697 |
| Total | 4,248 | 4,225 | 6,130 | 9,674 | 14,464 |
| Foreign currency fixed assets and equity investment | 4 | 35 | 36 | 41 | 75 |
| Shares (in NZ companies) | 397 | 496 | 294 | 281 | 153 |
| Other assets1 | 6,600 | 10,268 | 6,092 | 16,148 | 16,609 |
| Total Assets | 125,763 | 141,959 | 151,877 | 172,426 | 196,299 |
| Financial claims on associates2 | 1,454 | 1,842 | 3,897 | 5,471 | 12,894 |
Access to branches and services. With electronic banking systems enabling customers to access accounts outside normal banking hours, there has been a reduction in the number of bank branches throughout New Zealand. At December 2000, there were 849 branches, 127 fewer that two years before. The first automated teller machines (ATMs) were introduced to New Zealand in mid-1979 and by the end of 1982 all major trading banks offered ATM services. The number of machines steadily increased through the 1980s as new retail banks emerged after deregulation, although there has been some rationalisation in recent years. There were 1,692 bank-owned ATMs in New Zealand at December 2000, compared with 1,521 two years before.
Electronic Funds Transfer at Point of Sale (Eftpos) was introduced to New Zealand in 1984 as a means of paying for retail goods and services. Banks agreed in 1990 to integrate their Eftpos services and growth of the network has since been rapid. At December 2000, there were 84,351 Eftpos terminals in New Zealand supermarkets, service stations, liquor markets and other retail outlets, compared with 65,246 two years before. Credit cards have become popular for the purchase of goods and services and at December 2000 there were 2.3 million cards on issue nationally, an increase of more than 15 percent in two years. Figure 27.1 (in sidebar) shows growth in credit card debt.
Industry self-regulation. The New Zealand Bankers' Association is a professional industry association established in 1891. The association represents and promotes the interests of the banking industry and delivers to its members those services which can effectively be undertaken on an industry basis. The association introduced a Code of Banking Practice in 1992 which established minimum standards of practice to be observed by banks in their dealings with personal customers. It covered the responsibilities of banks and their customers (including the protection of customer information), the use of Eftpos cards and guidelines for customer complaints procedures. A second edition of the code was published in 1996 and a third edition in 2002 following a comprehensive public consultation process. The code is linked to an independent external complaints review process, the Banking Ombudsman scheme, established in July 1992.
Notwithstanding the dominance of banks in the market, there remain more than 70 smaller deposit-taking financial institutions in New Zealand, in addition to more than 70 small credit unions. Among them is one large regionally-based building society continuing to specialise in housing finance, and fewer than 10 others that have mostly diversified their lending portfolios away from personal lending since deregulation.
The many smaller finance companies tend to gather funds to lend secured by hire purchase, for cars or consumer goods, for business leasing purposes or for commercial and residential property development. Credit unions, while numerous, have total loans to members of less than $300 million, or less than half of 1 percent of all loans to households.
More recent developments in the ‘other financial institution’ market include the growth of residential mortgage managers – lenders who fund their loans via securitisation in wholesale markets. In addition, several retail groups have stepped up their involvement in personal finance, for example. by issuing a credit card or offering direct personal loans in addition to providing hire purchase finance. Since the late 1990s, the banks' share of the personal lending market has stabilised as other institutions have developed a range of niche markets.
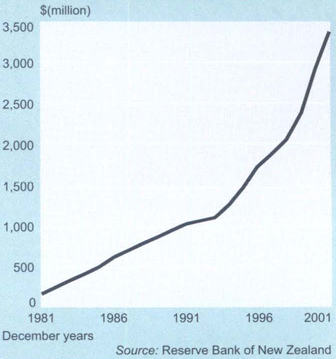
There were nearly 85,000 Eftpos terminals in New Zealand retail outlets at December 2000.
Statistics on the banking and finance industry are collected in Statistics New Zealand's Annual Enterprise Survey. Table 27.4 provides a summary. Statistics New Zealand's website is www.stats.govt.nz
The Reserve Bank of New Zealand publishes statistics on financial sector activity on its website www.rbnz.govt.nz
Table 27.4. Finance: statistical summary
| Financial item | 1998 | 19991 | 20001 | Percentage change from previous year | |
|---|---|---|---|---|---|
| 1999 | 2000 | ||||
1These figures are provisional. Source: Statistics New Zealand | |||||
| Financial performance $(million) | |||||
| Total income | 28,192 | 26,248 | 28,909 | -6.9 | 10.1 |
| Sales of goods and services | 2,076 | 2,343 | 3,112 | 12.9 | 32.8 |
| Interest, dividends and donations | 20,032 | 20,558 | 21,654 | 2.6 | 5.3 |
| Government funding, grants and subsidies | 4 | 15 | 7 | ... | -55.8 |
| Non-operating income | 6,081 | 3,332 | 4,137 | -45.2 | 24.2 |
| Total expenditure | 20,324 | 19,402 | 24,150 | -4.5 | 24.5 |
| Interest and donations | 12,555 | 11,763 | 12,704 | -6.3 | 8.0 |
| Indirect taxes | 45 | 40 | 140 | -9.5 | 246.0 |
| Depreciation | 501 | 561 | 458 | 12.1 | -18.5 |
| Salaries and wages paid to employees | 1,453 | 1,458 | 1,559 | 0.3 | 7.0 |
| Redundancy and severance | 44 | 30 | 16 | -32.9 | -46.6 |
| Salaries and wages to self-employed commission agents | 4 | 8 | 6 | 80.2 | -29.6 |
| Salaries and wages to working proprietors | 38 | 60 | 26 | 56.2 | -56.1 |
| Purchases and other operating expenses | 2,120 | 2,200 | 2,899 | 3.8 | 31.8 |
| Non-operating expenses | 3,609 | 3,313 | 6,360 | -8.2 | 92.0 |
| Opening stocks | – | 7 | 7 | ... | -1.9 |
| Closing stocks | – | 8 | 9 | ... | 16.8 |
| Operating surplus before income tax | 7,906 | 6,906 | 4,785 | -12.6 | -30.7 |
| Financial position $(million) | |||||
| Total assets | 287,897 | 349,450 | 411,438 | 21.4 | 17.7 |
| Current assets | 70,826 | 92,708 | 94,962 | 30.9 | 2.4 |
| Fixed tangible assets | 3,470 | 2,976 | 5,696 | -14.2 | 91.4 |
| Additions to fixed assets | 783 | 752 | 1,001 | -4.0 | 33.1 |
| Disposals of fixed assets | 338 | 322 | 727 | -4.9 | 126.0 |
| Other assets | 213,601 | 253,766 | 310,779 | 18.8 | 22.5 |
| Total equity and liabilities | 287,897 | 349,450 | 411,438 | 21.4 | 17.7 |
| Shareholders funds or owners equity | 67,588 | 97,552 | 117,628 | 44.3 | 20.6 |
| Current liabilities | 144,733 | 160,775 | 171,490 | 11.1 | 6.7 |
| Other liabilities | 75,575 | 91,124 | 122,320 | 20.6 | 34.2 |
| Financial ratios | |||||
| Total income per full-time equivalent (FTE) | $975,600 | $890,800 | $1,152,100 | -8.7 | 29.3 |
| Operating surplus per full-time equivalent (FTE) | $273,600 | $234,400 | $190,700 | -14.3 | -18.6 |
| Current ratio | 48.9% | 57.7% | 55.4% | ||
| Quick ratio | 48.9% | 57.7% | 55.4% | ||
| Return on equity | 11.7% | 7.1% | 4.1% | ||
| Return on total assets | 2.7% | 2.0% | 1.2% | ||
| Liabilities structure | 23.5% | 27.9% | 28.6% | ||
Coverage. Banking, finance and investment includes the operation of the central bank and registered banks empowered to issue cheques, accept demand and time deposits and extend loans. Other financial institutions dealing in finance and investing activities are also included, but holder investing units are excluded.
New Zealand's decimal currency system was introduced in 1967, when dollars and cents replaced pounds, shillings and pence as monetary units.
One of the Reserve Bank of New Zealand's key statutory obligations is to provide New Zealand's currency. The total face value of currency in circulation (bank notes and coins) was $2.54 billion at 30 June 2001, which was a 12 percent increase on the previous June year. The currency consisted of about 92 million bank notes and 983 million coins.
The first substantial change to New Zealand's banknotes since the introduction of decimal currency occurred in 1992 when a new series was issued which contained more security features. Portraits on the notes are: $5, Sir Edmund Hillary; $10, Kate Sheppard; $20, Queen Elizabeth II; $50, Sir Apirana Ngata; and $100, Ernest Lord Rutherford of Nelson. Queen Elizabeth II features on the watermark of all notes. Rare New Zealand birds are featured on the backs of the notes. The $5 note was released on 10 July 1992, the $20 on 1 September 1992, the $50 and $100 on 3 November 1992 and the $10 on 18 May 1993.
In 1999, the bank began replacing paper notes with polymer notes, which are more durable and incorporate additional security features.
Monetary policy is implemented by the Reserve Bank of New Zealand under the terms of the Reserve Bank of New Zealand Act 1989. The government has given the reserve bank responsibility for keeping inflation between 0 and 3 percent a year. Specifics are set out in a written contract between the bank and the Minister of Finance, called the Policy Targets Agreement (PTA).
The reserve bank changed the way it implements monetary policy in March 1999 when the settlement cash target system, used since the mid-1980s, was replaced by an implementation system based on an official cash rate (OCR). Previously, the bank relied on adjustments to the quantity of settlement cash in the banking system to ensure monetary conditions were appropriate. These adjustments were rare, however, as generally financial markets adjusted monetary conditions appropriately in response to the bank's quarterly inflation projections.
Early in 1999, the bank concluded that a better approach was to use its financial resources directly to influence a key short-term interest rate, which would then influence other short-term interest rates. This led to the launch of the OCR, first announced in the March 1999 Monetary Policy Statement at 4.5 percent.
Under the OCR system, the reserve bank influences short-term interest rates by being prepared to lend an unlimited amount of overnight cash, or borrow an unlimited amount of overnight cash, at interest rates fractionally above or below the stated OCR. This moves other interest rates on short-term money, such as 90–day bill rates, close to the OCR, adjusting demand within the economy and therefore inflationary pressures.
The Reserve Bank of New Zealand Act stipulates that Statements specify how the bank intends to maintain the 0 to 3 percent inflation target in the PTA, and the reasons for the policies and means chosen. They must also provide a medium-term policy outlook and review and assess the implementation of monetary policy since the last Statement.
To meet these requirements, Statements are 30–40 page documents (available on the bank's website) that provide economic projections underpinning the monetary policy decision and explanations.
The OCR is reviewed eight times a year – at each of the bank's quarterly Monetary Policy Statements, and approximately halfway between each statement.
Figure 27.2 shows the movement of monthly average wholesale interest rates for 90-day bills and 5-year government stock from January 1989 to September 2001.
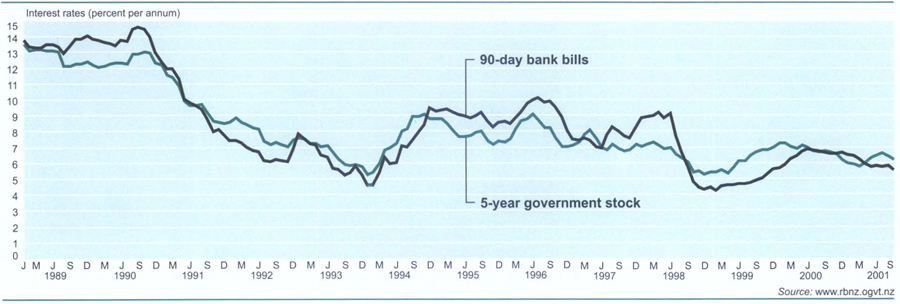
Table 27.5 lists money supply and credit aggregates for the years ending September 1996 to 2001.
Table 27.5. Money supply and credit aggregates
| As at 30 September | ||||||
|---|---|---|---|---|---|---|
| 1996 | 1997 | 1998 | 1999 | 2000 | 2001 | |
| Source: Reserve Bank of New Zealand | ||||||
| Monetary aggregates | $million | |||||
| 1. Currency in circulation | 1,689 | 1,742 | 1,851 | 2,046 | 2,310 | 2,597 |
| 2. Less currency held by M3 institutions | 339 | 279 | 282 | 330 | 452 | 555 |
| Notes and coin held by the public (1-2) | 1,350 | 1,463 | 1,569 | 1,717 | 1,858 | 2,042 |
| 3. Transaction balances (cheque) | 9,004 | 9,528 | 10,305 | 12,820 | 12,807 | 14,779 |
| 4. Less inter-institutional transaction balances (cheque) | 348 | 36 | 73 | 31 | 27 | 58 |
| 5. Less Government transaction deposits | 15 | 27 | 32 | 34 | 29 | 51 |
| M1 (Notes & coin +3-4-5) | 9,991 | 10,929 | 11,769 | 14,472 | 14,609 | 16,712 |
| 6. Transaction EFTPOS (excl. cheque) | .. | .. | 11,947 | 13,694 | 11,855 | 13,917 |
| 7. Total other call funding | 24,269 | 25,098 | 14,896 | 17,391 | 14,037 | 19,968 |
| 8. Less inter-institutional EFTPOS (excl. cheque) | – | – | – | – | – | – |
| 9. Less other call inter-institutional funding | 2,218 | 1,154 | 1,818 | 1,984 | 589 | 1,784 |
| M2 (M1+6+7-8-9) | 32,043 | 34,873 | 36,794 | 43,572 | 39,912 | 48,813 |
| 10. NZD funding | 92,514 | 96,199 | 101,203 | 108,617 | 108,376 | 131,383 |
| 11. Less NZD inter-institutional claims | 9,078 | 7,193 | 10,719 | 10,602 | 10,419 | 12,460 |
| 12. Less Government deposits | 139 | 27 | 388 | 497 | 481 | 568 |
| M3 (Notes & coin +10-11-12) | 84,647 | 90,443 | 91,664 | 99,235 | 99,333 | 120,397 |
| 13. Less NZD funding from non-residents | 13,156 | 12,419 | 13,565 | 15,033 | 14,507 | 27,335 |
| M3R (M3-13) | 71,491 | 78,024 | 78,099 | 84,202 | 84,826 | 93,062 |
| Credit aggregates | ||||||
| 1. NZD claims (all surveyed institutions) | 101,300 | 109,410 | 119,932 | 130,710 | 138,874 | 157,569 |
| 2. Less NZD inter-institutional claims | 9,078 | 7,193 | 10,719 | 10,602 | 10,419 | 12,460 |
| PSC(1-2) | 92,222 | 102,217 | 109,214 | 120,108 | 128,455 | 145,109 |
| 3. Less NZD claims on non residents | 3,654 | 3,689 | 4,576 | 5,950 | 7,762 | 14,930 |
| PSCR (PSC-3) | 88,568 | 98,528 | 104,638 | 114,159 | 120,693 | 130,179 |
| 4. Claims on Govt by M3 institutions | 4,063 | 3,593 | 5,626 | 8,264 | 6,953 | 6,858 |
| 5. Claims on Govt by Reserve Bank | 2,391 | 2,814 | 3,006 | 160 | 1,766 | 295 |
| DC (PSC+4+5) | 98,676 | 108,624 | 117,845 | 128,533 | 137,175 | 152,262 |
| DCR (PSCR+4+5) | 95,022 | 104,935 | 113,269 | 122,583 | 129,413 | 137,332 |
| 1. Net foreign currency assets of M3 institutions | -11,287 | -12,720 | -21,332 | -23,792 | -33,043 | -25,907 |
| 2. Net foreign currency assets of the Reserve Bank | 286 | 280 | 378 | 327 | 635 | 621 |
| Net foreign currency assets NFCA (1+2) | -11,001 | -12,439 | -20,953 | -23,465 | -32,407 | -25,286 |
| 1. Capital & Reserves of M3 institutions | -5,903 | -6,970 | -7,874 | -8,533 | -9,623 | -10,503 |
| 2. Balance sheet items nec. net | 2,875 | 1,228 | 2,647 | 2,701 | 4,188 | 3,925 |
| Residual items (1+2) | -3,028 | -5,741 | -5,227 | -5,832 | -5,434 | -6,578 |
| M3 (DC + NFCA + Residual) | 84,647 | 90,443 | 91,664 | 99,235 | 99,333 | 120,397 |
The government sells three types of debt instruments to meet its financing requirements:
Government bonds are a medium-term (usually with maturity of 3 to around 10 years) instrument paying a fixed coupon interest rate and aimed at the wholesale market (mainly institutional investors). Since September 1983, government bonds have been sold through regular, competitive tenders.
Treasury bills are short-term (usually with maturity of up to around 12 months), wholesale debt instruments. Bills have been sold through regular, weekly tenders since January 1985 to meet the government's ongoing funding requirements. They are also used to meet the government's seasonal financing needs. Bills do not pay interest but rather are sold (and subsequently traded) at a discount to their par (maturity) value, producing an effective yield for the holder.
Kiwi Bonds, introduced in 1985, are aimed at retail investors. These bonds are fixed-interest instruments issued on demand in six-month, one, two and four-year maturities. On issue, Kiwi Bond interest rates are related to the current market yields on wholesale government bonds (of comparable maturities). They are transferable and may be sold by the holder to another party.
The Reserve Bank of New Zealand maintains registers of government securities (and those of local authorities and other public bodies and several state-owned enterprises). At December 2001, the value of total government securities registered was $33.081 billion. Of this, $5.559 billion comprised Treasury bills. Kiwi Bonds to the value of $481 million were also on issue at this date. (These figures exclude securities issued by state-owned enterprises.)
Table 27.6 details government securities on issue at six monthly intervals from September 1996 to September 2001.
Table 27.6. Government securities on issue
| As at | |||||||||||
|---|---|---|---|---|---|---|---|---|---|---|---|
| September 1996 | March 1997 | September 1997 | March 1998 | September 1998 | March 1999 | September 1999 | March 2000 | September 2000 | March 2001 | September 2001 | |
| Source: Reserve Bank of New Zealand | |||||||||||
| NZ$(million) | |||||||||||
| Ordinary government stock, by maturity: | |||||||||||
| Less than or equal to 1 month | 303 | – | – | – | – | – | – | – | – | – | – |
| More than 1 month, up to 3 months | 2,340 | – | – | – | – | 15 | – | – | – | – | – |
| More than 3 months, up to 6 months | 2– | 2,55 | – | 2,634 | – | – | 3,755 | – | 3,566 | 65 | 3,060 |
| More than 6 months, up to 2 years | 4,987 | 2,674 | 2,689 | 3,770 | 3,770 | 7,421 | 3,731 | 6,776 | 3,110 | 3,060 | 3,663 |
| More than 2 years, up to 5 years | 5,979 | 9,484 | 10,219 | 6,464 | 6,686 | 4,264 | 8,534 | 6,305 | 6,969 | 8,754 | 6,063 |
| More than 5 years | 9,619 | 6,714 | 7,564 | 8,426 | 10,076 | 11,028 | 8,093 | 9,193 | 9,904 | 11,137 | 12,433 |
| Treasury bills by maturity: | |||||||||||
| Less than or equal to 3 months | 4,304 | 3,539 | 4,684 | 3,061 | 4,723 | 3,659 | 2,953 | 3,102 | 2,673 | 2,673 | 2,823 |
| More than 3 months, up to 6 months | 2,383 | 1,772 | 1,944 | 1,582 | 2,245 | 1,800 | 1,625 | 1,625 | 1,723 | 1,700 | 1,674 |
| More than 6 months | 1,100 | 1,100 | 1,100 | 1,100 | 1,150 | 1,150 | 1,225 | 1,175 | 1,150 | 1,150 | 1,150 |
| Index linked stock | 363 | 562 | 712 | 862 | 1,010 | 1,160 | 1,402 | 1,611 | 1,623 | 1,651 | 1,521 |
| Government stock coupons | 171 | 171 | 171 | 171 | 171 | 171 | 114 | 114 | 114 | 114 | 114 |
| Kiwi stock | – | – | – | – | – | – | – | – | – | – | – |
| Kiwi bonds | 430 | 438 | 441 | 431 | 836 | 741 | 508 | 448 | 432 | 435 | 445 |
| Total Internal Public Debt | 31,979 | 28,709 | 29,524 | 28,501 | 30,667 | 31,409 | 31,941 | 30,349 | 31,263 | 30,738 | 32,945 |
New Zealand has had a floating exchange rate since 1985. That is, the value of the New Zealand dollar against other currencies is set solely by the market. However, successive governments have resolved to retain a capacity, via the Reserve Bank of New Zealand, to intervene in the foreign exchange market. Intervention could be undertaken, for example, in the event of disorderly conditions in the market for New Zealand dollars following a major political or financial crisis, or natural disaster. Intervention would involve buying or selling New Zealand dollars in exchange for other currencies, with the aim of restoring a smoothly-functioning private market. To maintain a capacity to do this, the Reserve Bank of New Zealand holds and manages the government's foreign exchange reserves, invested in a diversified portfolio of liquid foreign currency assets of about $4.5 billion. There has been no intervention in the foreign exchange market since the currency was floated. Table 27.7 shows monthly foreign exchange rates from September 1999 to September 2001
Table 27.7. Foreign exchange rates1
| Month | USA mid-rate US$/NZ$1 | UK mid-rate Stg/NZ$1 | Aust. mid-rate A$/NZ$1 | Japan mid-rate Yen/NZ$1 | Euro mid-rate E$/NZ$1 | TWI base Jun 79 100% | TWI percent change | |
|---|---|---|---|---|---|---|---|---|
| Monthly change% | Annual change | |||||||
1All average exchange rates use representative 11.10am market mid-rates. Source: Reserve Bank of New Zealand | ||||||||
| 1999– | ||||||||
| September | 0.5224 | 0.3221 | 0.8053 | 56.05 | 0.4978 | 55.7 | -1.9 | -1.3 |
| October | 0.5148 | 0.3105 | 0.7895 | 54.60 | 0.4805 | 54.3 | -2.4 | -2.7 |
| November | 0.5124 | 0.3157 | 0.8014 | 53.68 | 0.4951 | 54.6 | 0.6 | -3.5 |
| December | 0.5085 | 0.3153 | 0.7943 | 52.18 | 0.5024 | 54.3 | -0.6 | -2.3 |
| 2000– | ||||||||
| January | 0.5141 | 0.3132 | 0.7815 | 54.19 | 0.5062 | 54.8 | 0.9 | -3.8 |
| February | 0.4914 | 0.3066 | 0.7812 | 53.74 | 0.4992 | 53.6 | -2.1 | -7.8 |
| March | 0.4908 | 0.3104 | 0.8042 | 52.37 | 0.5087 | 53.9 | 0.5 | -6.6 |
| April | 0.4969 | 0.3136 | 0.8310 | 52.33 | 0.5236 | 54.9 | 1.7 | -6.9 |
| May | 0.4712 | 0.3118 | 0.8143 | 50.99 | 0.5196 | 53.4 | -2.8 | -11.2 |
| June | 0.4699 | 0.3112 | 0.7908 | 49.87 | 0.4951 | 52.2 | -2.2 | -10.3 |
| July | 0.4609 | 0.3054 | 0.7836 | 49.70 | 0.4900 | 51.6 | -1.2 | -10.4 |
| August | 0.4464 | 0.2993 | 0.7677 | 48.30 | 0.4925 | 50.6 | -1.9 | -10.9 |
| September | 0.4188 | 0.2922 | 0.7546 | 44.69 | 0.4805 | 48.3 | -4.5 | -13.2 |
| October | 0.4012 | 0.2762 | 0.7578 | 43.47 | 0.4690 | 46.9 | -2.8 | -13.6 |
| November | 0.3988 | 0.2796 | 0.7638 | 43.43 | 0.4667 | 46.9 | -0.1 | -14.2 |
| December | 0.4284 | 0.2932 | 0.7853 | 47.97 | 0.4785 | 49.6 | 5.8 | -8.7 |
| 2001– | ||||||||
| January | 0.4444 | 0.3006 | 0.7998 | 51.93 | 0.4734 | 51.1 | 3.0 | -6.8 |
| February | 0.4351 | 0.2996 | 0.8143 | 50.59 | 0.4726 | 50.6 | -0.9 | -5.6 |
| March | 0.4199 | 0.2904 | 0.8309 | 50.84 | 0.4610 | 49.9 | -1.5 | -7.5 |
| April | 0.4066 | 0.2834 | 0.8128 | 50.39 | 0.4553 | 48.8 | -2.1 | -11.0 |
| May | 0.4221 | 0.2957 | 0.8107 | 51.46 | 0.4816 | 50.4 | 3.2 | -5.5 |
| June | 0.4148 | 0.2960 | 0.7999 | 50.72 | 0.4858 | 50.0 | -0.9 | -4.3 |
| July | 0.4087 | 0.2889 | 0.8014 | 50.87 | 0.4752 | 49.4 | -1.1 | -4.1 |
| August | 0.4306 | 0.2997 | 0.8211 | 52.35 | 0.4782 | 51.0 | 3.1 | 0.8 |
| September | 0.4198 | 0.2869 | 0.8280 | 49.86 | 0.4605 | 49.6 | -2.8 | 2.7 |
Figure 27.3 shows movements in the trade-weighted index since 1980.
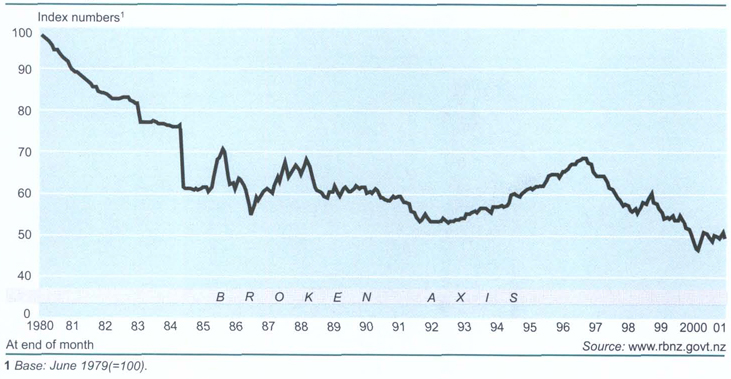
27.1 Reserve Bank of New Zealand; Statistics New Zealand; New Zealand Bankers' Association.
27.2 Reserve Bank of New Zealand.
Statistics New Zealand divisional manager responsible: Jeff Cope.
Annual Review (annual). New Zealand Bankers' Association, Wellington.
Bank Facts (annual). New Zealand Bankers' Association, Wellington.
Banking in New Zealand. (1997). 3rd edition, New Zealand Bankers' Association, Wellington.
Budget (Parl paper B.6).
Central Banking in New Zealand (2001). Reserve Bank of New Zealand, Wellington.
Code of Banking Practice (1996). New Zealand Bankers' Association, Wellington.
Explaining Currency (1993). Updates available on-line, Reserve Bank of New Zealand, Wellington.
Getting it right: A guide to banking (1997). 2nd edition, New Zealand Bankers' Association, Wellington.
Key Statistics (monthly). Statistics New Zealand, Wellington
Monetary Policy Statement (quarterly). Reserve Bank of New Zealand, Wellington.
Peare P (1999). An Introduction to the New Zealand Financial System. Longman, Auckland.
Report of the Registrar of Friendly Societies and Credit Unions (Parl paper B.18).
Report of the Reserve Bank of New Zealand. (Parl paper B. 16).
The Impact of Monetary Policy on Growth (2001). Reserve Bank of New Zealand, Wellington.
Your Bank's Disclosure Statement – what's in it for you? (1998). Reserve Bank of New Zealand, Wellington.
Table of Contents
Minister of Finance Dr Michael Cullen checks a proof of the 2001 Budget.
The New Zealand financial management system is concerned with public sector performance in all forms. Each element of the system reinforces other elements to provide a comprehensive approach to implementing the government's strategy, facilitating high-quality decision making by management, and enabling effective scrutiny by parliament. The system is designed to help the government translate strategy into action, to promote informed decision making and accountability, and to encourage the state sector to be responsive and efficient. The system achieves these aims through planning, decision making and scrutiny processes that culminate in passage of the government's Budget, through incentives for managing efficiently, and through reporting and feedback processes. The system emphasises expected performance within the control of managers, delegating authority to achieve high-quality performance, providing incentives to perform to levels expected, and measuring that achievement in a timely and consistent manner. The system is continuously examined and refined to meet emerging needs. A number of policy projects and pilots are underway which seek to improve areas such as Crown entity governance and accountability, departmental accountability and reporting, collaboration among departments, and contracting with non-government organisations.
Cabinet ministers are formally responsible for specifying performance requirements of departmental chief executives. Chief executives are in turn responsible for service delivery and have the necessary managerial decision making authority delegated to them. There are incentives to perform and requirements for performance information as a basis for monitoring and assessment. The following chart summarises this.
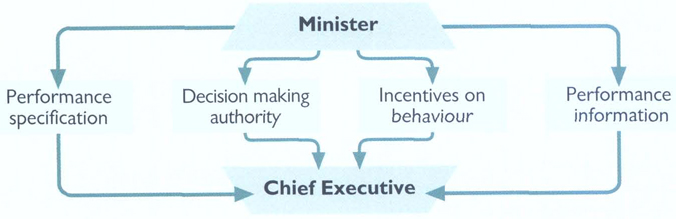
This scheme was implemented by two acts of parliament, the State Sector Act 1988 and the Public Finance Act 1989. In 1994, the scheme was supplemented by the Fiscal Responsibility Act, which specifies principles of responsible fiscal management and requires the government to be transparent about its fiscal policy objectives.
Roles and responsibilities. The State Sector Act 1988 sets out roles and responsibilities of ministers and chief executives. These are further clarified by annual performance agreements negotiated by the parties. These agreements:
Link to the goals of government the critical medium-term objective for the public sector.
Identify key priorities and major contributions each department will make to the government's goals.
Specify outputs to be delivered and key management objectives for the overall health of each department.
Chief executives have five-year contracts with tenure based on performance. They are appointed and employed by the State Services Commissioner, though cabinet may veto appointments. As the legal employer of staff in their departments, chief executives have the power to hire and fire, set salaries and negotiate conditions of employment.
The Public Finance Act 1989 governs the financial management regime of the public service. The act removed many detailed administrative controls, defined the appropriation process in terms of outputs, made chief executives responsible for departmental financial management and established departmental and Crown reporting requirements. The provisions were designed to clarify accountabilities of chief executives.
Centralised input controls through Treasury instructions and the requirement to use centralised suppliers for such things as accommodation, vehicles, computers and office services are no longer features of the government management system. The government, nevertheless, expects departments to collaborate where joint activities are beneficial, such as sharing the provision of some services.
Purchase and ownership interests. Chief executives' annual performance agreements distinguish between the government's interest in the performance of a department, as the owner seeking efficient stewardship of its resources on the one hand, and as the purchaser of services directly to the government or to third parties on the other. The government looks for a balance between strong, healthy departments and value for money in their operations.
Setting objectives. Setting objectives within the public service focuses mainly on outputs, rather than inputs or outcomes. With this focus, the delivery of services is more able to be attributed to chief executives rather than any ultimate consequences (outcomes) of that service delivery. Outputs are placed firmly in the context of government policy goals.
The Fiscal Responsibility Act 1994 requires clear formulation and reporting by the government on its fiscal policy objectives. Using Generally Accepted Accounting Practice (GAAP), a number of principles have been formulated to define responsible fiscal management. These are that:
Debt should be reduced to prudent levels.
Operating expenses should not exceed operating revenues over a reasonable period.
Crown net worth should be maintained at sufficient levels to counter adverse events.
Fiscal risks facing the government should be managed prudently.
Fiscal policies should be consistent with predictable, stable tax rates.
As part of the Budget process, the Minister of Finance must report on the government's fiscal objectives, on the extent to which these objectives are consistent with the above principles, and provide justification for any inconsistencies. These fiscal objectives must be first presented to parliament by 31 March – three months before the start of the financial year – in the Budget Policy Statement. In practice, the objectives are generally presented in December, allowing debate on them to take place well before the Budget itself.
The government maintains a baseline Budget, projecting policies forward four years. Baseline updates occur regularly as the government makes adjustments in accordance with its strategic and fiscal objectives. Outside these Budget update processes, amendments to the baseline are permitted only for fiscally-neutral adjustments, unavoidable or uncontrollable expenses, natural disasters or civil emergencies, recognition of existing liabilities, and capital investments supported by business plans and a sound business case.
The Budget must be introduced to parliament by the end of July, and the associated appropriation act must be passed by the end of October. Revised economic and fiscal forecasts are published half-yearly and immediately before a general election. These forecasts must be prepared on a GAAP basis consistent with other reports and must include a statement of specific fiscal risks, including contingent liabilities which describe, and quantify if possible, all specific and general fiscal risks associated with the forecasts.
Accrual-based appropriations. Parliament authorises expenditure of public money by ministers, departments and offices of parliament through the appropriation process. Appropriations are made separately for expenses incurred on each class of outputs, for benefits or other unrequited expenses, for borrowing expenses, for other expenses, for capital injections, for the purchase or development of capital assets, and for the repayment of debt. This gives parliament control over outputs purchased from departments and others, what size balance sheets it thinks are needed to produce those outputs, and what resources it wants transferred among different groups in the community, but which do not involve production of outputs.
Charging for capital. A common weakness in government financial management systems is the incentive for budget maximisation and for accumulating assets of low utility. To counter this, the government now charges departments for the capital they use.
Cost allocations. Focusing on outputs requires cost accounting systems which allocate costs, including the capital charge, to those outputs. Costs can then be compared with similar costs that would be incurred by other suppliers, both in the public and private sectors. These costing systems help ministers reprioritise and choose the appropriate mix of outputs to achieve desired outcomes. The systems also identify opportunities for improving output performance and facilitate cost recovery where there are recognisable recipients of the service or output.
Cash management. Before the start of each year, each department negotiates with Treasury a profile of cash injections during the year. Treasury operates a central cash management system which sweeps all departmental bank accounts each night and invests spare funds in the overnight money market.
Generally Accepted Accounting Practice (GAAP). The Public Finance Act 1989 requires the government's financial statements to be prepared in accordance with the Generally Accepted Accounting Practice (GAAP). The Financial Reporting Act 1993 established the Accounting Standards Review Board to set accounting standards binding on government agencies and private sector companies.
Parliament's scrutiny of the government's financial performance follows the Budget and reporting events through the year. The following chart summarises these:
Budget and reporting events
Budget documents incorporate:
The government's Budget speech and fiscal strategy for the medium term (10 years).
An economic and fiscal outlook, including the government's forecast financial statements.
Estimates of appropriations ministers seek from parliament.
Departmental forecast reports for each government department.
Progress against the Budget is reported monthly from the end of the first quarter. These reports are prepared on a (GAAP) basis, consistent with the forecasts, and must be published within six weeks of the end of the month. Annual financial statements must be prepared and audited within three months.
Parliament and its committees scrutinise financial management of the executive, comparing actual performance with planned performance, in three ways.
Scrutiny of the government's intentions for the current year, as expressed in its Budget proposals, and of its actual performance reported in the financial statements of the government.
Examination of the actual performance of departments as reported in their annual reports and financial statements and in comparison with plans laid a year earlier.
Examination of the performance of state-owned enterprises and other non-departmental government entities.
Table 28.1 details actual or forecast government expenses for the years 2001 to 2005.
Table 28.1. Expenses
| Year ending 30 June | |||||
|---|---|---|---|---|---|
| 2001 actual | 2002 forecast | 2003 forecast | 2004 forecast | 2005 forecast | |
| Source: Budget Economic and Fiscal Update 24 May 2001, The Treasury; Financial Statements of the Government of New Zealand for the Year Ended 30 June 2001, The Treasury | |||||
| $(million) | |||||
| Subsidies and transfer payments (see analysis below) | |||||
| 13,274 | 13,886 | 14,326 | 14,773 | 15,173 | |
| Operating expenses (see analysis below) | 17,719 | 18,307 | 18,446 | 18,637 | 18,831 |
| Personnel | |||||
| Personnel expenses (excluding pension expenses) | 2,632 | 2,762 | 2,732 | 2,724 | 2,722 |
| GSF pension expenses | 691 | 718 | 742 | 756 | 775 |
| Movement in unfunded pension liability | 164 | -51 | -74 | -87 | -96 |
| Other pension expenses | 56 | 53 | 53 | 53 | 53 |
| Depreciation | |||||
| Physical assets | 751 | 785 | 813 | 823 | 826 |
| State highways | 174 | 94 | 96 | 98 | 100 |
| Rental and leasing costs | 282 | 256 | 251 | 249 | 249 |
| Loss/(gain) on sale of assets | 7 | .. | .. | .. | .. |
| Finance costs (see analysis below) | 2,483 | 2,395 | 2,334 | 2,409 | 2,431 |
| Net foreign-exchange (gains)/losses on liabilities | 404 | .. | .. | .. | .. |
| Net foreign-exchange (gains)/losses on assets | -451 | .. | .. | .. | .. |
| Provision for future initiatives | .. | 160 | 955 | 1,855 | 2,755 |
| Total expenses | 38,186 | 39,365 | 40,674 | 42,290 | 43,819 |
| Analysis of subsidies and transfer payments | |||||
| Social assistance grants | |||||
| New Zealand Superannuation | 5,273 | 5,472 | 5,656 | 5,878 | 6,122 |
| Community wage | 1,849 | .. | .. | .. | .. |
| Unemployment benefit | .. | 1,527 | 1,600 | 1,652 | 1,707 |
| Domestic purposes benefit | 1,444 | 1,489 | 1,522 | 1,560 | 1,586 |
| Family support | 878 | 899 | 906 | 909 | 911 |
| Student allowances | 391 | 428 | 446 | 462 | 477 |
| Other social assistance grants | 3,073 | 3,692 | 3,798 | 3,895 | 3,993 |
| Subsidies | 115 | 125 | 144 | 163 | 123 |
| Other transfer payments | |||||
| Official development assistance | 226 | 227 | 227 | 227 | 227 |
| Other | 25 | 27 | 27 | 27 | 27 |
| Total subsidies and transfer payments | 13,274 | 13,886 | 14,326 | 14,773 | 15,173 |
| Analysis of operating expenses | |||||
| Education purchases | |||||
| Early childhood education | 331 | 357 | 372 | 374 | 375 |
| Primary and secondary education | 3,505 | 3,677 | 3,704 | 3,724 | 3,726 |
| Tertiary education and training | 1,508 | 1,635 | 1,691 | 1,716 | 1,749 |
| Health purchases | 6,807 | 6,967 | 7,106 | 7,221 | 7,320 |
| Science purchases | 467 | 478 | 480 | 480 | 482 |
| Other operating expenses | 5,101 | 5,193 | 5,093 | 5,122 | 5,179 |
| Total operating expenses | 17,719 | 18,307 | 18,446 | 18,637 | 18,831 |
| Analysis of finance costs | |||||
| Interest | |||||
| New Zealand dollars | 2,035 | 2,044 | 2,017 | 2,103 | 2,153 |
| Foreign currencies | 428 | 328 | 294 | 283 | 255 |
| Other finance costs | 20 | 23 | 23 | 23 | 23 |
| Total finance costs | 2,483 | 2,395 | 2,334 | 2,409 | 2,431 |
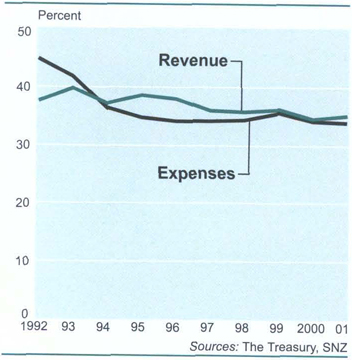
Figure 28.1 illustrates the relationship between revenue and expenses as a percentage of GDP.
The Financial Statements of the Government of New Zealand include the following key statements: statement of financial performance (see table 28.2), statement of financial position (see table 28.3), statement of movements in equity, statement of cash flows (see table 28.4), statement of borrowings (see table 28.10 in section 28.3), statements of commitments, statement of contingent liabilities, and statement of unappropriated expenditure, expenses or liabilities.
Departmental financial statements contain the same key statements, as well as a statement of objectives and a statement of service performance.
Publication of financial statements, with an audit opinion attached, within three months of the end of the financial year for the whole of government is an important feature of the New Zealand financial management system. Very few countries account for government operations under accrual accounting rules.
Valuation problems are generally dealt with in conventional and pragmatic ways that provide a good estimate of net current value by using a realisable value, or a depreciated replacement cost approach.
The underlying information systems provide new and superior information to the national statistical data collection for the system of national accounts. The balance sheet can also indicate movements in net worth caused by the relationship between capital consumption and new investment. It can provide an indicator of whether the government is running down its estate to maintain current consumption.
In a real economic sense, the power of the government to tax its citizens provides a guarantee of revenue which is not available to a private sector company. This power can, however, be viewed as analogous to mutual or cooperative organisations that levy their members. This is not treated as an asset, as members want to know the financial position of the organisation before exercise of the power to levy. Further, it is impossible to value this ‘asset’ with sufficient reliability, and any attempt to do so would drown other information in the balance sheet.
On the liabilities side, the value of future social welfare obligations is a similarly large item over which the government has significant discretion and which is very difficult to quantify.
Table 28.2. Government finance: statement of financial performance
| Year ending 30 June | |||||
|---|---|---|---|---|---|
| 2001 actual | 2002 forecast | 2003 forecast | 2004 forecast | 2005 forecast | |
| Source: Budget Economic and Fiscal Update 24 May 2001, The Treasury; Financial Statements of the Government of New Zealand for the Year Ended 30 June 2001, The Treasury | |||||
| Revenue | $(million) | ||||
| Levied through the Crown's sovereign power | |||||
| Direct taxation | 23,863 | 24,505 | 26,145 | 27,437 | 28,717 |
| Indirect taxation | 12,875 | 13,180 | 13,673 | 14,224 | 14,751 |
| Total taxation revenue | 36,738 | 37,685 | 39,818 | 41,661 | 43,468 |
| Compulsory fees, fines, penalties and levies | 385 | 418 | 440 | 462 | 475 |
| Total revenue levied through the Crown's sovereign power | 37,123 | 38,103 | 40,258 | 42,123 | 43,943 |
| Earned through the Crown s operations | |||||
| Investment income | 1,369 | 934 | 1,098 | 1,409 | 1,717 |
| Sales of goods and services | 659 | 654 | 639 | 609 | 606 |
| Other operational revenue | 381 | 305 | 292 | 290 | 287 |
| Unrealised losses arising from changes in the value of commercial forests | -40 | .. | .. | .. | .. |
| Total revenue earned through the Crown's operations | 2,369 | 1,893 | 2,029 | 2,308 | 2,610 |
| Total revenue | 39,492 | 39,996 | 42,287 | 44,431 | 46,553 |
| Expenses | |||||
| By functional classification | |||||
| Social security and welfare | 13,216 | 13,826 | 14,236 | 14,651 | 15,077 |
| GSF pension expenses | 855 | 667 | 668 | 669 | 679 |
| Health | 7,342 | 7,684 | 7,766 | 7,896 | 8,019 |
| Education | 6,690 | 7,056 | 7,176 | 7,243 | 7,319 |
| Core government services | 1,817 | 1,552 | 1,530 | 1,504 | 1,510 |
| Law and order | 1,560 | 1,640 | 1,616 | 1,620 | 1,617 |
| Defence | 1,267 | 1,153 | 1,151 | 1,152 | 1,112 |
| Transport and communications | 1,026 | 1,027 | 1,032 | 1,059 | 1,101 |
| Economic and industrial services | 1,141 | 1,225 | 1,254 | 1,258 | 1,217 |
| Primary services | 287 | 320 | 306 | 295 | 292 |
| Heritage, culture and recreation | 424 | 456 | 454 | 484 | 498 |
| Housing and community development | 50 | 90 | 86 | 85 | 82 |
| Other | 75 | 114 | 110 | 110 | 110 |
| Finance costs | 2,483 | 2,395 | 2,334 | 2,409 | 2,431 |
| Net foreign-exchange gains | -47 | .. | .. | .. | .. |
| Provision for future initiatives | .. | 160 | 955 | 1,855 | 2,755 |
| Total expenses | 38,186 | 39,365 | 40,674 | 42,290 | 43,819 |
| Revenue less expenses | 1,306 | 631 | 1,613 | 2,141 | 2,734 |
| Surplus attributable to state-owned enterprises and Crown entities (excl. ACC liability valuation) | 844 | 953 | 1,050 | 1,163 | 1,185 |
| ACC outstanding claims liability valuation | -420 | .. | .. | .. | .. |
| Dividends and other distributions | -321 | -208 | -222 | -247 | -267 |
| Net surplus attributable to state-owned enterprises and Crown entities | 103 | 745 | 828 | 916 | 918 |
| Operating balance | 1,409 | 1,376 | 2,441 | 3,057 | 3,652 |
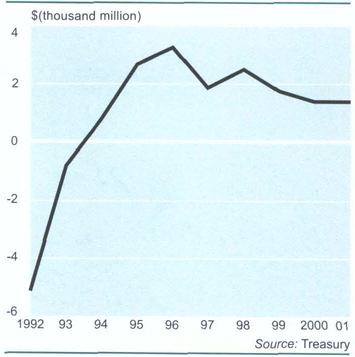
Figure 28.2 shows operating balances from 1992 to 2001.
Table 28.3. Government finance: statement of financial position
| Year ending 30 June | |||||
|---|---|---|---|---|---|
| 2001 Actual | 2002 Forecast | 2003 Forecast | 2004 Forecast | 2005 Forecast | |
| Source: Budget Economic and Fiscal Update 24 May 2001. The Treasury; Financial Statements of the Government of New Zealand for the Year Ended 30 June 2001. The Treasury | |||||
| Assets | ($million) | ||||
| Cash and bank balances | 115 | 45 | 47 | 63 | 93 |
| Marketable securities and deposits | 12,060 | 8,450 | 8,118 | 8,345 | 8,141 |
| Advances | 4,615 | 5,873 | 6,681 | 7,730 | 8,321 |
| New Zealand Superannuation | .. | 617 | 1,888 | 3,852 | 6,665 |
| Receivables | 6,197 | 5,439 | 5,499 | 5,489 | 5,489 |
| Inventories | 193 | 280 | 289 | 309 | 300 |
| State-owned enterprises and Crown entities | 14,077 | 15,114 | 16,111 | 17,241 | 18,204 |
| Other investments | 354 | 432 | 432 | 432 | 432 |
| Physical assets | 16,102 | 16,076 | 16,109 | 16,042 | 15,717 |
| Commercial forests | 310 | 359 | 359 | 359 | 359 |
| State highways | 11,055 | 10,847 | 11,028 | 11,215 | 11,410 |
| Intangible assets | 3 | 3 | 3 | 3 | 3 |
| Contingency capital provision | .. | 315 | 675 | 1,525 | 2,375 |
| Total assets | 65,081 | 63,850 | 67,239 | 72,605 | 77,509 |
| Liabilities | |||||
| Payables and provisions | 5,831 | 4,758 | 4,724 | 4,639 | 4,540 |
| Currency issued | 2,539 | 2,570 | 2,570 | 2,570 | 2,570 |
| Borrowings | 36,761 | 35,831 | 36,887 | 39,368 | 40,815 |
| Pension liabilities | 8,487 | 8,734 | 8,660 | 8,573 | 8,477 |
| Total liabilities | 53,618 | 51,893 | 52,841 | 55,150 | 56,402 |
| Total assets less total liabilities | 11,463 | 11,957 | 14,398 | 17,455 | 21,107 |
| Crown balance | |||||
| Accumulated operating balance | 3,456 | 4,058 | 6,499 | 9,556 | 13,208 |
| Revaluation reserve | 8,007 | 7,899 | 7,899 | 7,899 | 7,899 |
| Crown balance | 11,463 | 11,957 | 14,398 | 17,455 | 21,107 |
Table 28.4. Government finance: statement of cash flows
| Year ending 30 June | |||||
|---|---|---|---|---|---|
| 2001 actual | 2002 forecast | 2003 forecast | 2004 forecast | 2005 forecast | |
| Source: Budget Economic and Fiscal Update 24 May 2001, The Treasury; Financial Statements of the Government of New Zealand for the Year Ended 30 June 2001, The Treasury | |||||
| Cash flows from operations | $(million) | ||||
| Cash provided from | |||||
| Direct taxation | |||||
| Individuals | 17,132 | 17,907 | 19,154 | 20,185 | 21,228 |
| Companies | 4,592 | 4,817 | 5,154 | 5,331 | 5,501 |
| Withholding taxes | 1,879 | 1,761 | 1,840 | 1,916 | 1,984 |
| Other direct taxation | 2 | 2 | 2 | 2 | 2 |
| Total direct taxation | 23,605 | 24,487 | 26,150 | 27,434 | 28,715 |
| Indirect taxation | $(million) | ||||
| Goods and services tax | 8,947 | 9,336 | 9,782 | 10,283 | 10,788 |
| Excise duties | 1,985 | 2,055 | 2,070 | 2,079 | 2,088 |
| Other indirect taxation | 1,713 | 1,803 | 1,822 | 1,862 | 1,875 |
| Total indirect taxation | 12,645 | 13,194 | 13,674 | 14,224 | 14,751 |
| Total taxation receipts | 36,250 | 37,681 | 39,824 | 41,658 | 43,466 |
| Compulsory fees, fines, penalties and levies | 324 | 349 | 368 | 360 | 394 |
| Other receipts | |||||
| Interest, profits and dividends | 892 | 755 | 853 | 1,074 | 1,232 |
| Sales of goods and services | 622 | 644 | 617 | 590 | 581 |
| Other operating receipts | 383 | 301 | 284 | 281 | 278 |
| Total other receipts | 1,897 | 1,700 | 1,754 | 1,945 | 2,091 |
| Total cash from operations | 38,471 | 39,730 | 41,946 | 43,963 | 45,951 |
| Cash disbursed to | |||||
| Departmental outputs | 4,749 | 5,040 | 4,838 | 4,791 | 4,782 |
| Other outputs | 16,008 | 16,610 | 16,884 | 17,090 | 17,300 |
| Finance costs | 2,499 | 2,402 | 2,382 | 2,494 | 2,508 |
| Subsidies | 133 | 181 | 203 | 220 | 171 |
| Current transfers | |||||
| Social assistance grants | 12,910 | 13,610 | 13,990 | 14,414 | 14,858 |
| Other transfers | .. | 250 | 255 | 255 | 255 |
| Provision for future initiatives | 160 | 955 | 1,855 | 2,755 | |
| Total cash disbursed to operations | 36,549 | 38,258 | 39,507 | 41,119 | 42,629 |
| Net cash flows from operations | 1,922 | 1,472 | 2,439 | 2,844 | 3,322 |
| Cash flows from investing activities | |||||
| Cash provided from | |||||
| Net sale of investments | 174 | .. | .. | .. | .. |
| Sale of physical assets | 75 | 91 | 61 | 44 | 37 |
| Total cash provided | 249 | 91 | 61 | 44 | 37 |
| Cash disbursed to | |||||
| Purchase of physical assets | 1,205 | 1,288 | 1,258 | 1,135 | 883 |
| Net increase in advances | 617 | 1,318 | 897 | 1,141 | 681 |
| Net (sale)/purchase of investments | .. | 294 | 163 | 207 | 38 |
| Net (sale)/purchase of marketable securities and deposits | 1,001 | -3,185 | -278 | 153 | -223 |
| Contribution to Government Superannuation Fund | .. | 600 | 1,200 | 1,800 | 2,510 |
| Contingency capital provision | .. | 315 | 360 | 850 | 850 |
| Total cash disbursed | 2,823 | 630 | 3,600 | 5,286 | 4,739 |
| Net cash flows from investing activities | -2,574 | -539 | -3,539 | -5,242 | -4,702 |
| Net cash flows from operating and investing activities | -652 | 933 | -1,100 | -2,398 | -1,380 |
| Cash flows from financing activities | |||||
| Cash provided from | |||||
| Issue of circulating currency | 303 | .. | .. | .. | .. |
| Total cash provided | 303 | .. | .. | .. | .. |
| Cash disbursed to | |||||
| Net (issue)/repayment of government stock | -1,066 | -391 | -1,112 | -1,892 | -1,428 |
| Net repayment/(issue) of foreign-currency borrowing | 514 | 853 | 107 | -465 | -1 |
| Net repayment/(issue) of other | |||||
| New Zealand-dollar borrowing | 305 | 479 | -97 | -57 | 19 |
| Total cash disbursed | -247 | 941 | -1,102 | -2,414 | -1,410 |
| Net cash flows from financing activities | 550 | -941 | 1,102 | 2,414 | 1,410 |
| Net movement in cash | -102 | -8 | 2 | 16 | 30 |
| Opening cash balance | 210 | 53 | 45 | 47 | 63 |
| Foreign-exchange gains on opening cash balances | 7 | .. | .. | .. | .. |
| Closing cash balance | 115 | 45 | 47 | 63 | 93 |
The New Zealand tax year is from 1 April to 31 March. The Inland Revenue Department (IRD) administers three principle acts, the Income Tax Act 1994, the Tax Administration Act 1994 and the Goods and Services Tax Act 1985.
New Zealand attempts, as far as practicable, to deduct taxes at source, with a graduated scale pay-as-you-earn (PAYE) tax deducted from wages and salaries, and withholding tax deducted from various other specified categories of income.
The tax system has been simplified by removing the requirement for wage and salary earners to file annual income tax returns. In certain circumstances, wage and salary earners receive a statement showing whether they have tax to pay or are to get a refund.
The PAYE system has been amended to require employers to provide the IRD with a monthly schedule detailing each employee's salary or wage income, PAYE deductions and other information such as student loan repayments.
Income tax is levied under the Income Tax Act 1994 and is charged on most income, including business profits, employment income, royalties, interest, dividends and pensions.
Rates of income tax for the 2001/02 tax year were:
| Income up to and including $38,000 | 19.5c for every dollar |
| Income over $38,000 | 33c for every dollar |
| Income over $60,000 | 39c for every dollar |
Rates used for assessment are based on annual income (normally from 1 April to 31 March).
Resident withholding tax (RWT) is deducted at source from interest and dividends that are not fully imputed before the net amount is credited to the recipient. The tax is at a rate of 33 percent for dividends and the taxpayer can choose between a 19.5 percent, 33 percent and 39 percent rate for interest. If the recipient does not provide the interest payer with a taxpayer identification number, a ‘no declaration’ rate of 39 percent applies. Certain recipients of interest or dividends (such as charitable/non-profit organisations, sports clubs and others) may claim exemption from RWT.
Dividends received from a New Zealand company may have imputation credits and/or withholding payment credits attached. An imputation credit is a portion of the tax paid by the company on its taxable profit, and it thus avoids the double payment of tax (by the company and shareholders) on the same income. Withholding payment credits arise when a New Zealand company receives dividends from a country with which New Zealand has a double tax agreement. The imputation system integrates personal and business tax with respect to company income distributed as dividends, and allows a credit for tax paid by the company on that income.
New Zealand has a minimal number of rebates available to personal taxpayers. Those currently available are:
A low-income rebate for New Zealand resident taxpayers in receipt of non-investment income.
A transitional tax allowance for certain full-time employees.
A child rebate for taxpayers who are under 18 years of age and are attending school or a tertiary educational establishment.
A housekeeper/childcare rebate for working parents who pay for childcare, or for disabled people who pay for help with childcare or housekeeping. The maximum rebate is $310.
A rebate for charitable donations, which is 33.3 percent of all qualifying charitable donations. The minimum qualifying charitable donation is $5 and the maximum rebate is $500.
Company taxation is levied under the Income Tax Act 1976, although companies in New Zealand are taxed differently from individual taxpayers. The main differences are that a company does not get any of the exemptions or rebates individuals are entitled to, and a flat tax rate of 33 percent applies to companies. Company taxation in the year ended 30 June 2001 produced $4.831 billion.
A company resident in New Zealand is assessable on all income, whether derived in New Zealand or elsewhere. A company is a New Zealand resident if it is incorporated in New Zealand, if it has its head office in New Zealand, if it has its centre of management in New Zealand or if control of the company by its directors is exercised in New Zealand. When companies pay dividends to shareholders, they receive a credit for tax they have paid.
A company not resident in New Zealand is liable for tax only on income derived from New Zealand. Non-resident companies are taxed at 33 cents in the dollar in respect of any activity they conduct in New Zealand. For most non-residents who simply derive interest off dividend income, non-resident withholding tax is the final New Zealand tax on that income.
Fringe benefit tax (FBT) is a tax at 64 percent of the value of fringe benefits provided by an employer to an employee. It is payable by the employer on an annual or quarterly basis.
Taxable fringe benefits include private use of a motor vehicle by an employee, low-interest loans, free, subsidised or discounted transport and other goods and services, and the employer's contribution to accident, sickness or death benefit fund and insurance policies.
Total FBT collected in the year ended 30 June 2001 was $342.361 million.
Goods and services tax (GST) is a tax charged at 12.5 percent on supplies of goods and services made in New Zealand by a registered person in the course of a taxable activity. GST was introduced at a rate of 10 percent in 1986 and increased to 12.5 percent in 1989.
Anyone with an annual turnover of $30,000 or more must register for GST. People registered for GST must charge and collect GST from their customers. GST-registered suppliers of goods and services pay GST on purchases and expenses made in the course of their business, but may claim it back later. Registered persons must account for and pay the GST they have collected, less the GST on their purchases, to the IRD.
GST is charged on the supply of goods and services. Some activities, such as salaries and wages, hobby activities and private sales of personal and domestic items, are not taxable. GST is not charged on exempt supplies. Exempt supplies include all financial services, renting of residential property, and the sale of donated goods and services by a non-profit organisation.
At 30 June 2001, there were 530,675 registered clients in New Zealand. Total GST assessed in the year ended 30 June 2001 was $5.787 billion.
The Customs and Excise Act 1996 provides for imposition of excise duty on alcoholic beverages, tobacco products, super and regular grade petroleum, liquefied petroleum gas (LPG) and compressed natural gas (CNG) when compressed by a natural gas fuelling facility for use as a motor vehicle fuel. Similarly, excise-equivalent duty is levied on the same goods imported into New Zealand.
The excise regime is dependent on the licensing of areas within which excisable goods may be manufactured or stored and within which customs powers may be exercised. These areas are called customs controlled areas and may be licensed for the purpose of:
The manufacture of excisable goods (breweries, wineries, tobacco manufacturing plants, distilleries, petrol refineries etc).
Adjustment to the rate of excise duty on alcohol may be made on 1 June each year.
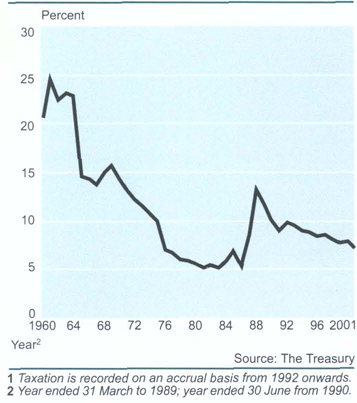
The deposit, keeping or securing of imported goods, without payment of duty on the goods, pending export of those goods (eg ships' provedores).
Storage by or for the manufacturer or the first owner of the goods, being the holder of a wine maker's licence under the Wine Makers Act 1981, of wine manufactured in New Zealand, where the wine cannot be physically accommodated within the area in which it was manufactured (ie off-site storage of wine).
Storage of imported goods or goods manufactured in a manufacturing area, of a kind that are subject to duty, and on which duty has not been paid, pending the sale of those goods to people departing to or arriving from a country outside New Zealand or to people exercising an entitlement to the supply of goods free of duty. These premises are usually duty free shops.
Liability for excise duty arises at the time of removal of the excisable product from the place of manufacture or, in the case of wine, from the off-site storage area, other than to an export warehouse or to another customs controlled area for further manufacture. Liability for excise-equivalent duty is triggered by importation of the goods.
Excise duty on alcoholic beverages is due for payment by the last working day of the month following the month in which the liability was triggered.
Excise duty on tobacco products and fuels is payable within 15 working days after the last day of the month in which the goods were removed from the customs controlled area.
Excise-equivalent duty is payable in accordance with the customs deferred payment system, or prior to the delivery of the goods from customs control.
Rates of excise duty and excise-equivalent duty are contained in the third schedule to the act. The legislation provides discretionary authority for the government to apply increases to the rates of excise and excise-equivalent duties on alcoholic beverages and tobacco products in accordance with movement in the consumers price index.
Adjustments may be made to alcoholic beverage rates on 1 June of any year and to rates of duty on tobacco products on 1 December in any year. Excise-equivalent duty rates are similarly adjusted.
Figure 28.3 illustrates customs and excise receipts from 1960 to 2001, as a percentage of consolidated account taxation.
The Road User Charges Act 1977 provides for payment of road user fees by all vehicles of more than 3.5 tonnes and smaller vehicles powered by diesel fuel, which is not taxed for road purposes. Road user charges vary depending on the number of axles, the number of wheels and the weight of the vehicle.
Fuel excise duty is paid on all petrol, liquid petroleum gas (LPG) and compressed natural gas (CNG) used on the roading network. Fuel excise duty rates are: petrol, 38.5 cents a litre excluding GST; LPG, 10.4 cents a litre; and CNG, 10.5 cents a litre.
In the case of petrol excise duty, 17.725 cents per litre of the duty, and the total excise duty for CNG and LPG, is paid into the national roads fund. All road user charges are also paid into the fund. The national roads fund also includes vehicle registration fees paid by motorists. The fund pays for maintenance and construction of New Zealand's roading network, and makes a contribution to public passenger transport, to traffic enforcement, and to road safety education and publicity.
Gift duty is paid by a donor of property at progressive rates according to the total value of gifts within a 12-month period. Dutiable gifts with a value up to $27,000 are not taxed. Thereafter, starting at 5 percent, the gift duty rate rises progressively, reaching the top rate of 25 percent on gifts exceeding $72,000 in a 12-month period. A gift duty statement must be provided to the IRD when the value of the gift exceeds $12,000, or when the value of gifts within the previous 12 months exceeds $12,000.
The Stamp Duty Abolition Act 1999 abolished stamp duty requirements from 21 May 1999. Stamp duty is still payable, however, on the sale and lease of commercial land by transfer or by lease if the transaction was completed before 21 May 1999.
Bills of exchange are liable to cheque duty (with exceptions) and banks are required to forward to the IRD each quarter statements containing particulars of all bill of exchange forms. Licensed printers who print pre-paid bills of exchange are required to forward statements to the IRD monthly. Cheque duty is set at the rate of 5 cents per bill of exchange or 5 cents per form when the duty is prepaid.
Gaming duty consists of totalisator duty, lottery duty, gaming machine duty and casino duty.
Totalisator duty is payable at the rate of 20 percent of the betting profits of a racing club or the Totalisator Agency Board. Statements must be forwarded to the IRD by the 20th of the month following the event. Totalisator duty totalled $38,538,422 for the period ended 30 June 2001, compared with $35,800,000 in the year ended June 30 1999.
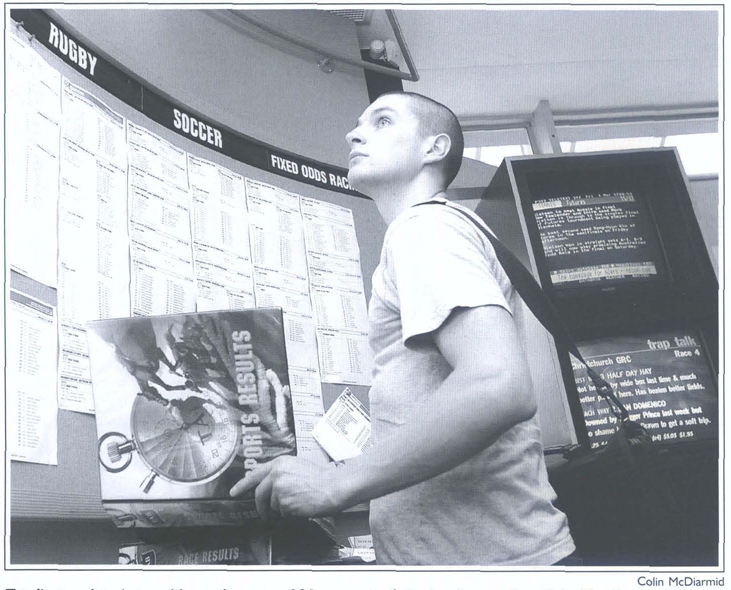
Totalisator duty is payable at the rate of 20 percent of the betting profits of the Totalisator Agency Board.
Lottery duty is payable at the rate of 5.5 percent of the nominal value of all tickets in the drawing of a lottery, including instant games, lotteries and prize competitions promoted by the New Zealand Lotteries Commission. Organisers of a lottery are required to supply to the IRD a statement of lottery duty payable, and pay it, within 14 days of drawing the lottery.
Gaming machine duty at the rate of 20 percent is payable on profits from dutiable games played on gaming machines. Gaming machine operators are required to forward a statement to the IRD each month setting out gaming machine duty, and pay the duty by the due date for furnishing the statement.
Casino duty is payable by licensed casino operators at the rate of four percent on the ‘casino win’ of all authorised games conducted or played in the casino. Casino operators are required to deliver to the IRD a statement of the ‘casino win’ and pay casino duty on a monthly basis.
Non-residents. Non-residents are taxed in New Zealand only if their income is from a New Zealand source. If the income is interest, dividends or royalties, a person is liable for non-resident withholding tax (NRWT). The approved issuer levy can be paid on interest, however. NRWT is deducted by the bank or other paying institution. For tax purposes, individuals are considered to be resident in New Zealand when they fulfil one or more of the following criteria:
They have an enduring relationship with New Zealand, ie strong financial, personal or other ties with New Zealand. Each case is considered on its facts.
They have been in New Zealand for more than 183 days in any 12-month period.
They are away from New Zealand in the service of the New Zealand Government.
Individuals cease to be a resident in New Zealand if they are absent from New Zealand for more than 325 days (about 11 months) in any 12-month period and during that time they do not have an enduring relationship with New Zealand.
Pensions. Pensions paid to New Zealand residents by countries with which New Zealand has a double tax agreement are generally exempt from tax in the country of origin and subject to tax in New Zealand. If a pension is taxed in the country of origin, credit is allowed in a New Zealand income tax assessment for the overseas tax paid, up to the amount of New Zealand tax payable on that income.
Double tax agreements. Agreements to avoid double taxation have been entered into between New Zealand and Australia, Belgium, Canada, China, Denmark, Fiji, Finland, France, Germany, India, Indonesia, Ireland, Italy, Japan, Korea, Malaysia, Netherlands, Norway, Philippines, Singapore, Sweden, Switzerland, Taiwan, Thailand, the United Kingdom and the United States. A visitor from one of these countries who received income in New Zealand should refer to the relevant agreement.
Family assistance. Family assistance is financial help for low to middle income families with children under 18 years of age living at home. Entitlement is based on combined family income and the number and age of children. Family assistance consists of family support, parental tax credit, child tax credit and family tax credit.
Family support is the core of family assistance and involves a payment to low to middle income families for each child living at home up to the age of 18. How much is paid depends on how many children are living at home, how old they are and combined family income. If the family receives an income-tested benefit, family support is paid by Work and Income, otherwise it is paid by the IRD. Child tax credit, parental tax credit and family tax credit are paid by IRD. These can be received when a family's income does not include income-tested benefits from Work and Income, New Zealand superannuation, veteran's pension, accident insurance payments for more than three months, or a student allowance.
The child tax credit is payment of up to $15 a week for each child under 18. The parental tax credit provides extra financial support to a maximum of $150 a child a week for the first eight weeks after a child is born. The family tax credit tops up a family's total income to at least $18,363 a year ($280 after tax each week). At least one parent must work for salary or wages. The combined weekly hours of work in a two-parent family must be at least 30 hours and in a single-parent family, weekly hours of work must be at least 20 hours. If, in either of these situations, either partner has been injured and is receiving accident compensation payments, but would usually be working, they can still be eligible for the family tax credit.
Child support. The IRD administers Child Support, a voluntary service that operates under the principle that the financial obligations of parents to their children do not end just because they have separated. Either parent can apply for child support and it is compulsory for custodians to apply if they are on a benefit.
Child Support collects payments from the paying parent and passes them on to the custodian, or to the government if the custodian is on a benefit. If an assessment is more than the benefit, then the excess is paid to the custodian. If the paying parent is on a benefit, child support is deducted from it. The service uses a formula to work out the liability of a paying parent. Liability exists until children turn 19, marry or enter into a de facto relationship or become financially independent. A parent's taxable income, less a living allowance, multiplied by a percentage, equals the amount of support a paying parent is liable for each year. Parents can appeal a formula assessment by applying for an administrative review. This free and informal process can alter an assessment by taking into account special circumstances. For example, parents may have the extra expense of caring for a child with disabilities.
There are approximately 210,000 paying parents and 315,000 children involved in the scheme. Since Inland Revenue began administering the scheme in 1992, the overall debt collection rate (excluding penalties) has been approximately 90 percent. Prior to that, under the Social Welfare liable parent contribution scheme, the collection rate was around 34 percent. For the year ended 30 June 2001, Child Support collected $218.9 million from paying parents, of which $83.65 million was paid to custodial parents and $135.25 million to the Crown.
Student loans. The student loans scheme started on 1 January 1992. The Ministry of Education is responsible for student loan policy and the scheme is administered by Work and Income. Work and Income makes loans available to borrowers and at the end of each academic year the loans are transferred to the IRD. The IRD assesses and collects loan repayments until the loan is repaid.
Interest rates and repayment thresholds are reviewed annually and are effective from 1 April to 31 March. The interest rate in 2001/02 was seven percent and the repayment threshold $15,132. Borrowers earning over the repayment threshold are required to pay 10 cents in the dollar of every dollar earned in excess of the repayment threshold. Those who are on salary and wages generally have their loan repayments deducted at source, along with PAYE deductions. Employers pay these deductions to the IRD monthly or twice monthly with their PAYE deductions. Repayments from borrowers not on salary and wages are generally made direct to the IRD in three annual instalments. Borrowers can also make voluntary repayments of any amount at any time.
Tables 28.5 and 28.6 are from government accounts. As well as taxes and duties collected by the IRD, they also include taxes and duties collected by New Zealand Customs Service.
Table 28.5. Breakdown of tax revenue
| 1993/94 | 1994/95 | 1995/96 | 1996/97 | 1997/98 | 1998/99 | 1999/2000 | 2000/01 | |
|---|---|---|---|---|---|---|---|---|
| Source: The Treasury | ||||||||
| $(million) | ||||||||
| Income tax (wages and salaries) | 10,901 | 11,766 | 12,539 | 12.264 | 12,773 | 12,295 | 12,972 | 13,703 |
| Income tax (self-employed and FBT) | 2,626 | 3,091 | 3,087 | 3,060 | 2,896 | 2,646 | 2,804 | 3,423 |
| Company tax | 3,001 | 3,967 | 4,063 | 3,233 | 3,721 | 3,694 | 4,158 | 4,831 |
| Withholding taxes on residents | 708 | 741 | 1,073 | 1,108 | 1,208 | 935 | 828 | 1,144 |
| Withholding taxes on non-residents | 344 | 285 | 491 | 824 | 662 | 717 | 735 | 760 |
| Total direct taxes | 17,580 | 19,850 | 21,253 | 20,489 | 21,260 | 20,287 | 21,497 | 23,861 |
| Goods and services tax | 6,779 | 6,809 | 7,263 | 7,725 | 8,030 | 8,404 | 8,871 | 9,126 |
| Sales tax | 0 | 0 | 0 | 0 | 0 | 0 | 0 | 0 |
| Excise duty | 1,829 | 1,867 | 1,875 | 1,796 | 1,906 | 1,948 | 2,027 | 2,010 |
| Customs duty | 658 | 780 | 843 | 909 | 750 | 528 | 612 | 648 |
| Other duties | 861 | 907 | 1,000 | 997 | 1,036 | 989 | 1,028 | 1,093 |
| Total indirect taxes | 10,127 | 10,363 | 10,981 | 11,427 | 11,722 | 11,869 | 12,538 | 12,877 |
| Total taxes | 27,707 | 30,213 | 32,234 | 31,916 | 32,982 | 32,156 | 34,035 | 36,738 |
| Taxes to GDP (percent) | 34.00 | 34.60 | 34.78 | 32.93 | 33.08 | 31.87 | 32.22 | 32.71 |
Table 28.6. Breakdown of tax revenue (as percentage of total)
| 1993/94 | 1994/95 | 1995/96 | 1996/97 | 1997/98 | 1998/99 | 1999/2000 | 2000/01 | |
|---|---|---|---|---|---|---|---|---|
| Source: The Treasury | ||||||||
| percent | ||||||||
| Income tax (wages and salaries) | 39 | 39 | 38 | 38 | 38 | 38 | 38 | 38 |
| Income tax (self-employed | ||||||||
| and FBT) | 9 | 10 | 10 | 10 | 9 | 9 | 8 | 9 |
| Company tax | 11 | 13 | 13 | 10 | 11 | 11 | 12 | 13 |
| Withholding taxes on residents | 3 | 2 | 3 | 3 | 4 | 3 | 3 | 3 |
| Withholding taxes on non residents | 1 | 1 | 2 | 3 | 2 | 2 | 2 | 2 |
| Total direct taxes | 63 | 65 | 66 | 64 | 64 | 63 | 63 | 65 |
| Goods and services tax | 24 | 23 | 23 | 24 | 25 | 26 | 26 | 25 |
| Sales tax | 0 | 0 | 0 | 0 | 0 | 0 | 0 | 0 |
| Excise duty | 7 | 6 | 6 | 6 | 6 | 6 | 6 | 5 |
| Customs duty | 2 | 3 | 2 | 3 | 2 | 2 | 2 | 2 |
| Other duties | 3 | 3 | 3 | 3 | 3 | 3 | 3 | 3 |
| Total indirect taxes | 37 | 35 | 34 | 36 | 36 | 37 | 37 | 35 |
| Total taxes | 100 | 100 | 100 | 100 | 100 | 100 | 100 | 100 |
Tables 28.7 and 28.8 show actual or forecast direct and indirect taxation for the years 2001 to 2005.
Table 28.7. Direct taxation
| Year ending 30 June | |||||
|---|---|---|---|---|---|
| 2001 actual | 2002 forecast | 2003 forecast | 2004 forecast | 2005 forecast | |
| Source: Budget Economic and Fiscal Update 24 May 2001, The Treasury; Financial Statements of the Government of New Zealand for the Year Ended 30 June 2001, The Treasury | |||||
| Income tax | $(million) | ||||
| Individuals | |||||
| Source deductions | 13,703 | 14,358 | 15,307 | 16,127 | 16,955 |
| Other persons | 3,871 | 3,881 | 4,134 | 4,366 | 4,591 |
| Refunds | -790 | -656 | -644 | -655 | -664 |
| Fringe benefit tax | 342 | 336 | 354 | 346 | 346 |
| Total individuals | 17,126 | 17,919 | 19,151 | 20,184 | 21,228 |
| Companies | |||||
| Gross companies | 4,954 | 4,938 | 5,270 | 5,450 | 5,623 |
| Refunds | -123 | -121 | -116 | -119 | -122 |
| Total companies | 4,831 | 4,817 | 5,154 | 5,331 | 5,501 |
| Withholding taxes | $(million) | ||||
| Residents' interest income | 990 | 993 | 1,043 | 1,101 | 1,138 |
| Non-residents' income | 760 | 685 | 704 | 736 | 763 |
| Residents' dividend income | 71 | 53 | 55 | 47 | 49 |
| Foreign-source dividends | 83 | 36 | 36 | 36 | 36 |
| Total withholding taxes | 1,904 | 1,767 | 1,838 | 1,920 | 1,986 |
| Total income tax | 23,861 | 24,503 | 26,143 | 27,435 | 28,715 |
| Other direct taxation | |||||
| Estate and gift duties | 2 | 2 | 2 | 2 | 2 |
| Total other direct taxation | 2 | 2 | 2 | 2 | 2 |
| Total direct taxation | 23,863 | 24,505 | 26,145 | 27,437 | 28,717 |
Table 28.8. Indirect taxation
| Year ending 30 June | |||||
|---|---|---|---|---|---|
| 2001 actual | 2002 forecast | 2003 forecast | 2004 forecast | 2005 forecast | |
| Source: Budget Economic and Fiscal Update 24 May 2001, The Treasury; Financial Statements of the Government of New Zealand for the Year Ended 30 June 2001, The Treasury | |||||
| Goods and services tax | $(million) | ||||
| Gross goods and services tax | 15,133 | 15,054 | 15,490 | 16,090 | 16,405 |
| Refunds | -6,007 | -5,718 | -5,708 | -5,807 | -5,617 |
| Total goods and services tax | 9,126 | 9,336 | 9,782 | 10,283 | 10,788 |
| Excise duties | |||||
| Petroleum fuels | 810 | 806 | 814 | 822 | 831 |
| Tobacco products | 764 | 802 | 805 | 803 | 800 |
| Alcoholic beverages | 436 | 447 | 451 | 454 | 457 |
| Total excise duties | 2,010 | 2,055 | 2,070 | 2,079 | 2,088 |
| Other indirect taxation | |||||
| Customs duty | 648 | 649 | 654 | 670 | 683 |
| Road user charges | 532 | 575 | 595 | 615 | 613 |
| Motor vehicle fees | 181 | 181 | 185 | 187 | 190 |
| Gaming duties | 206 | 220 | 226 | 229 | 230 |
| Energy resources levies | 111 | 96 | 93 | 93 | 91 |
| Stamp, cheque and credit card duties | 61 | 68 | 68 | 68 | 68 |
| Total other indirect taxation | 1,739 | 1,189 | 1,821 | 1,862 | 1,875 |
| Total indirect taxation | 12,875 | 13,180 | 13,673 | 14,224 | 14,751 |
Table 28.9 provides a comparison of public account taxation and national disposable income in New Zealand for the years 1986 to 2000.
Table 28.9. Comparison of public account taxation and national disposable income
| Year ended 31 March | National disposable income1,3 | Public account taxation | |
|---|---|---|---|
| Total2 | Percentage of national disposable income | ||
1National disposable income is calculated on a year aided 31 March. 2From 1992 accounts prepared on an accrual basis. 3Data from 1987 to 1999 has been revised. Source: Statistics New Zealand | |||
| $(million) | percent | ||
| 1986 | 39,125 | 14,235.9 | 36.4 |
| 1987 | 44,855 | 17,408.1 | 38.8 |
| 1988 | 50,676 | 21,528.1 | 42.5 |
| 1989 | 55,443 | 22,863.9 | 41.2 |
| 1990 | 58,647 | 26,198.1 | 44.7 |
| 1991 | 60,181 | 25,797.6 | 42.9 |
| 1992 | 57,343 | 23,901.0 | 41.7 |
| 1993 | 59,360 | 25,812.0 | 43.5 |
| 1994 | 64,512 | 27,705.0 | 42.9 |
| 1995 | 69,653 | 30,213.0 | 43.4 |
| 1996 | 74,413 | 32,233.0 | 43.3 |
| 1997 | 77,539 | 31,916.0 | 41.2 |
| 1998 | 80,327 | 32,982.0 | 41.1 |
| 1999 | 82,349 | 32,156.0 | 39.0 |
| 2000 | 85,283 | 34,035.0 | 39.9 |
The Taxation Review Authorities Act 1994 established one or more taxation review authorities. There are three authorities, each consisting of one person who is either a district court judge or a barrister or solicitor of the high court of no fewer than seven years practice. They are appointed by the governor-general. The authorities sit as judicial authorities for hearing and determining objections to assessments of tax or duty, or to decisions or determinations of the Commissioner of Inland Revenue.
The New Zealand Debt Management Office (NZDMO) was established in 1988 as part of reform of the government's financial management. The role of the office is to improve management of risk associated with the government's fixed income portfolio, which comprises liabilities in both New Zealand and overseas markets and some liquidity assets. Categories of risk managed are market, credit, funding, liquidity, portfolio concentration and operational risk. In 1988, the NZDMO introduced reform of public sector cash management involving centralisation of surplus cash funds for investment and cash management purposes, and decentralisation to departments of the responsibility for payments and other banking operations. Separation of the government's financial management from monetary policy enables the NZDMO to focus on defining a low-risk net liability portfolio for the government and implementing it in a cost-effective manner.
Before March 1985, governments had borrowed under a fixed exchange rate regime to finance the balance of payments deficit. Since adoption of a freely floating exchange rate regime, the government has borrowed externally only to rebuild the nation's external reserves and to meet refinancing needs.
From 1993/94, the government has been running a surplus on its operating balance and has used these surpluses to pay down foreign currency debt. In September 1996, New Zealand reached zero net foreign currency public debt.
Under existing legislation, amounts payable in respect of principal and interest on New Zealand securities are a charge upon the public revenues of New Zealand, payable under permanent appropriation. All the indebtedness of New Zealand is otherwise unsecured.
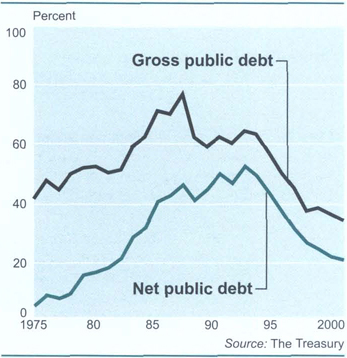
New Zealand has always paid, when due, the full amount of principal, interest and amortisation requirements upon its external and internal debt, including guaranteed debt.
Quantifiable contingent liabilities of the government, including the Reserve Bank of New Zealand, state-owned enterprises and Crown entities, amounted to approximately $6.501 billion at 30 June 2001 ($6.327 billion in the 2000 year).
The government's long-term fiscal objectives include running operating surpluses on average over the economic cycle to allow a build-up of assets to meet future New Zealand superannuation costs.
Gross debt will be reduced below 30 percent of gross domestic product and net debt below 20 percent on average over the economic cycle.
Figure 28.4 illustrates gross and net public debt as a percentage of GDP for the years 1975 to 2000.
Table 28.10 is one of the key statements from the Financial Statements of the Government of New Zealand, statement of borrowings.
Table 28.1. Statement of borrowings
| Movements during the year ended 30 June 2001 | ||||||
|---|---|---|---|---|---|---|
| As at 1 July 2000 | Net increases/(decreases) | Foreign exchange contracts | Currency realignment | Unamortised premiums/discounts | As at 30 July 2001 | |
| Source: Financial Statements of the Government of New Zealand for the Year Ended 30 June 2001. The Treasury | ||||||
| Outstanding debt | $(million) | |||||
| New Zealand-dollar debt | ||||||
| Government stock | 22,239 | 1,165 | .. | .. | -73 | 23,331 |
| Treasury bills | 5,370 | 177 | .. | .. | 11 | 5,558 |
| Loans and foreign-exchange contracts | 230 | -503 | .. | .. | 1 | -272 |
| Retail stock | 474 | 24 | .. | .. | .. | 498 |
| Total New Zealand-dollar debt | 28,313 | 863 | .. | .. | -61 | 29,115 |
| Foreign-currency debt | ||||||
| United States dollars | 4,329 | -14 | .. | 467 | -2 | 4,780 |
| Japanese yen | 2,054 | -597 | .. | -44 | 19 | 1,432 |
| European and other currencies | 1,345 | 31 | .. | 58 | .. | 1,434 |
| Total foreign-currency debt | 7,728 | -580 | .. | 481 | 17 | 7,646 |
| Total outstanding debt | 36,041 | 283 | .. | 481 | -44 | 36,761 |
| Less | ||||||
| Financial assets | ||||||
| Marketable securities and deposits | ||||||
| New Zealand dollars | 2,324 | 913 | 733 | .. | 1 | 3,971 |
| United States dollars | 4,467 | 860 | -741 | 488 | 19 | 5,093 |
| Japanese yen | 2,277 | -842 | 137 | -18 | -6 | 1,548 |
| European and other currencies | 1,372 | 115 | -114 | 73 | 2 | 1,448 |
| Total marketable securities and deposits | 10,440 | 1,046 | 15 | 543 | 16 | 12,060 |
| Advances and cash | 4,205 | 518 | .. | 7 | .. | 4,730 |
| Total financial assets | 14,645 | 1,564 | 15 | 550 | 16 | 16,790 |
| Net crown debt | 21,396 | -1,281 | -15 | -69 | -60 | 19,971 |
Table 28.11 shows the percentage of Crown debt outstanding as foreign or domestic currency.
Table 28.11. Type of Crown debt
| Outstanding at 30 June | Foreign currency debt | Domestic currency debt | Total debt | |||
|---|---|---|---|---|---|---|
| Amount | Percentage of total debt | Amount | Percentage of total debt | Amount | Percentage increase on previous year | |
| Source: Budget Economic and Fiscal Update 24 May 2001, The Treasury; Financial Statements of the Government of New Zealand for the Year Ended 30 June 2001. The Treasury | ||||||
| $(million) | $(million) | $(million) | ||||
| 2001 | 7,646 | 20.8 | 29,115 | 79.2 | 36,761 | 2 |
| 2002 (forecast) | 6,943 | 19.4 | 28,888 | 80.6 | 35,831 | -2.5 |
| 2003 (forecast) | 6,836 | 18.5 | 30,051 | 81.5 | 36,887 | 2.9 |
| 2004 (forecast) | 7,301 | 18.5 | 32,067 | 81.5 | 39,368 | 6.7 |
| 2005 (forecast) | 7,302 | 17.9 | 33,513 | 82.1 | 40,815 | 3.7 |
Table 28.12 shows central government debt from 1986 to 2001 as the amount owed per head of population in New Zealand.
Table 28.12. Gross indebtedness of central government
| As at 31 March | Amount | Per head of population |
|---|---|---|
| Source: Statistics New Zealand | ||
| $(million) | $ | |
| 1986 | 32,002 | 9,776.44 |
| 1987 | 42,472 | 12,933.77 |
| 1988 | 39,068 | 11,780.60 |
| 1989 | 39,721 | 11,933.96 |
| As at 30 June | ||
| 1990 | 44,347 | 13,204.26 |
| 1991 | 43,936 | 12,936.58 |
| 1992 | 47,105 | 13,795.98 |
| 1993 | 47,478 | 13,565.14 |
| 1994 | 46,429 | 13,166.12 |
| 1995 | 44,096 | 12,062.92 |
| 1996 | 41,500 | 11,173.64 |
| 1997 | 35,972 | 9,564.22 |
| 1998 | 37,892 | 9,991.56 |
| 1999 | 36,712 | 9,633.93 |
| 2000 | 36,041 | 9,408.22 |
| 2001 | 36,761 | 9,550.79 |
Table 28.13 shows the maturity profile of New Zealand government debt as at 30 June 2001.
Table 28.13. Maturity profile as at 30 June 2001
| 2001/02 | 2002/03 | 2003/04 | 2004/05 | 2005/06 | 2006/11 | 2012 and after | Total book value | |
|---|---|---|---|---|---|---|---|---|
Note: The maturities of marketable securities and deposits in this table are based on the contractual maturity dates. Source: Financial Statements of the Government of New Zealand for the Year Ended 30 June 2001, The Treasury | ||||||||
| Outstanding debt | $(million) | |||||||
| New Zealand dollar debt | ||||||||
| Government stock | 2,999 | 3,278 | 3,606 | 1,435 | .. | 6,916 | 5,097 | 23,331 |
| Treasury bills | 5,558 | .. | .. | .. | .. | .. | .. | 5,558 |
| Loans and foreign exchange contracts | 149 | 50 | -112 | 18 | -124 | -253 | .. | -272 |
| Retail stock | 376 | 78 | 27 | 17 | .. | .. | .. | 498 |
| Total New Zealand-dollar debt | 9,082 | 3,406 | 3,521 | 1,470 | -124 | 6,663 | 5,097 | 29,115 |
| Foreign-currency debt | ||||||||
| United States dollars | 2,265 | 114 | 494 | 288 | 336 | 714 | 569 | 4,780 |
| Japanese yen | 816 | 384 | .. | 101 | .. | .. | 131 | 1,432 |
| European and other currencies | 471 | .. | 342 | 194 | 198 | 218 | 11 | 1,434 |
| Total foreign-currency debt | 3,552 | 498 | 836 | 583 | 534 | 932 | 711 | 7,646 |
| Total outstanding debt | 12,634 | 3,904 | 4,357 | 2,053 | 410 | 7,595 | 5,808 | 36,761 |
| Marketable securities and deposits | ||||||||
| New Zealand dollars | 3,495 | 267 | 146 | 14 | 3 | 46 | .. | 3,971 |
| United States dollars | 4,022 | 449 | -71 | 98 | 357 | 158 | 80 | 5,093 |
| Japanese yen | 837 | 484 | 101 | 126 | .. | .. | .. | 1,548 |
| European and other currencies | 898 | 45 | 264 | 100 | 85 | 31 | 25 | 1,448 |
| Total marketable securities and deposits | 9,252 | 1,245 | 440 | 338 | 445 | 235 | 105 | 12,060 |
Most of New Zealand's 86 local authorities separate their activities into regulatory-type functions and those run along the lines of normal businesses. To facilitate this, councils have set up business units which compete with outside businesses for council contracts, such as those involving reading, works and maintenance and refuse collection.
In addition to business units, councils often have shareholdings in electrical supply companies, as well as companies which operate ports, airports and bus transport.
Financial information covering councils and business units is shown in table 28.14.
Table 28.14. Local authority statistics – non-trading activities1
| Year ended 30 June | 1997 | 1998 | 1999 | 2000 | 2001 |
|---|---|---|---|---|---|
1Covers all activities of local authorities not classified as trading activities, eg local government administration, provision of water-supply, reading, parks and reserves, town planning and regulation. Source: Statistics New Zealand | |||||
| Operating income | $(million) | ||||
| Rates (including water values) | 1,882.4 | 1,921.8 | 1,992.5 | 2,102.9 | 2195.3 |
| Petroleum tax | 24.9 | 25.2 | 25.4 | 26.4 | 26.3 |
| Grants, subsidies and levies | 341.1 | 370.3 | 390.6 | 398.7 | 394.6 |
| Fees and fines | 155.1 | 159.9 | 158.1 | 178.9 | 193.9 |
| Sales and other income | 681.5 | 661.4 | 687.5 | 708.4 | 736.1 |
| Investment income | 258.0 | 318.3 | 372.3 | 334.3 | 300.7 |
| Total operating income | 3,343.0 | 3,456.9 | 3,626.4 | 3,749.7 | 3847.0 |
| Operating expenditure | |||||
| Employee costs | 854.9 | 848.7 | 849.1 | 830.9 | 841.1 |
| Interest | 169.3 | 166.1 | 165.6 | 153.9 | 146.1 |
| Depreciation | 369.3 | 404.1 | 697.3 | 715.7 | 730.5 |
| Purchases and other expenditure | 1,859.1 | 1,902.9 | 1,754.3 | 1,808.1 | 1902.6 |
| Total operating expenditure | 3,252.6 | 3,321.9 | 3,466.4 | 3,508.5 | 3620.3 |
| Surplus/(deficit) before non-operating items | 90.3 | 135.0 | 160.0 | 241.2 | 226.7 |
| Net gains from non-operating items | 278.4 | 98.6 | 1,348.0 | 672.9 | 247.7 |
| Surplus/(deficit) after non-operating items | 368.7 | 233.6 | 1,508.1 | 914.1 | 474.4 |
| Additions to fixed assets | 939.7 | 1,094.5 | 1,260.5 | 1,249.9 | 1386.1 |
| Disposals of fixed assets | 222.4 | 116.7 | 163.2 | 131.4 | 107.2 |
28.1 The Treasury.
28.2 Inland Revenue Department; The Treasury; New Zealand Customs Service; Ministry of Transport; Statistics New Zealand; Taxation Review Authority.
28.3 The Treasury; Statistics New Zealand.
28.4 Statistics New Zealand.
Statistics New Zealand divisional manager responsible: Ian McLeod.
Financial Statements of the Government of New Zealand (monthly, half-yearly and annually). The Treasury. Wellington.
Budget Policy Statement (annual). New Zealand Government, Wellington.
Departmental Forecast Report of The Treasury (Parl paper B.27).
Economic and Fiscal Update (Parl paper B.6).
Estimates of Appropriations for the Government of New Zealand for the Year ending 30 June (annual). The Treasury, Wellington.
Supplementary Estimates of Appropriations for the Government of New Zealand (annual). The Treasury, Wellington.
GST Guide 2002 (2002). Inland Revenue Department, Wellington.
Fiscal Results for the Government of New Zealand (annual). The Treasury, Wellington.
Fiscal Strategy Report. New Zealand Government, Wellington.
Budget Documents. New Zealand Government, Wellington.
Treasury's Forecasting Process. The Treasury, Wellington.
Fiscal Responsibility Act 1994: An Explanation (1995). The Treasury, Wellington.
Report on Unappropriated Expenditure. Expenses and Liabilities for the Financial Year (Parl paper B.15).
Local Authority Statistics (quarterly). Statistics New Zealand, Wellington.
New Zealand System of National Accounts 2000 (2000). Statistics New Zealand, Wellington.
Quarterly Gross Domestic Product – Sources and Methods (1996). Statistics New Zealand, Wellington.
Report of the Inland Revenue Department (Parl paper B.23).
Report of the Local Authorities Loans Board (Parl paper B.17).
www.acc.co.nz – Accident Compensation Corporation
www.ird.govt.nz – Inland Revenue Department
www.ltsa.govt.nz – Land Transport Safety Authority
www.localgovtnz.co.nz – Local Government New Zealand
www.msd.govt.nz – Ministry of Social Development
www.customs.govt.nz – New Zealand Customs Service
www.rbnz.govt.nz – Reserve Bank of New Zealand
www.ssc.govt.nz – State Services Commission
www.stats.govt.nz – Statistics New Zealand
www.treasury.govt.nz – The Treasury
www.transfund.govt.nz – Transfund New Zealand
www.winz.govt.nz – Work and Income New Zealand
Statistical terms defined here are a selection of those frequently used in censuses and surveys of population and businesses, and other data and index series referred to in this book.
- Actual consumption expenditure
(national accounts). Expenditure on goods and services according to which sector actually acquires the goods and services. The difference between final consumption expenditure and actual consumption expenditure is social transfers in kind. These can be social benefits in kind or transfers of individual non-market goods and services. Examples include pharmaceutical subsidies, medical care paid directly by the Accident Compensation Corporation and provision of education services in public schools.
- Additions to fixed assets.
Purchases of new and second-hand fixed assets and the cost of work done by a firm's own employees in producing, constructing and installing fixed assets for its own use.
- ANZSIC.
The Australia New Zealand Standard Industry Classification is a hierarchical industrial classification which goes to the four-digit level. It is closely based on the International Standard Industrial Classification Revision 3 (United Nations 1990).
- Balance of payments.
A statistical statement that systemically summarises, for a specific time period, the economic transactions of an economy with the rest of the world.
- Balance of payments conceptual adjustments.
Adjustments to international trade statistics to bring the value of exports and imports into line with balance of payments concepts. Imports are adjusted to free on board (fob) value. Exports are adjusted for goods shipped and sold on consignment.
- Balance on current account.
A balance of payments statement is presented as a series of accounts – current, capital and financial. The current account records the export and import of goods and services, income earned and paid and, under current transfers, offsetting entries to resources supplied or received from nonresidents. The sum of the exports of goods and services, earnings and resources received (inflows), less imports of goods and services, income paid and resources supplied (outflows) is the balance on current account. The account is usually in either surplus (inflows exceed outflows) or deficit (outflows exceed inflows).
- Balance on current transfers.
This is calculated by deducting total debit entries from total credit entries for all current transfers components, eg income tax and international aid.
- Balance on goods.
This is calculated by deducting the total imports of goods from the total exports of goods. The balance is in surplus when exports of goods exceed imports.
- Balance on income.
This is calculated by deducting the total income accruing to foreign investors from their investments in New Zealand from the total income earned by New Zealand investors from their investments abroad. Income includes profits, dividends and interest.
- Balance on services.
This is calculated by deducting total imports of services from total exports of services. Services include transportation, travel and insurance.
- Balance on the external current account
(national accounts). The residual item for the external account, this is the excess of income from the rest of the world over payments to the rest of the world. A negative value indicates payments exceed income.
- Banking sector.
All units engaging in financial intermediation as a principal activity and having liabilities in the form of deposits or financial instruments.
- Birth rate (crude).
The number of births per 1,000 estimated mean population.
- BPM5.
Balance of Payments Manual, edition 5.
- Bonds and notes.
Financial instruments that give the holder the unconditional right to a fixed money income or a contractually-determined variable money income.
- Capital account.
This account records all transactions that involve the receipt or payment of capital transfers and acquisition or disposal of non-produced, non-financial assets, eg patents and copyrights. The balance is equal to debit entries (inflows) minus credit entries (outflows).
- Capital transfers to/from the rest of the world
(national accounts). The excess of capital transfers by non-residents to New Zealand residents over the value of similar transfers by residents to non-residents. Capital transfers are unrequited transfers in cash or in kind which are not considered by the recipient as adding to current income, nor by the donor as reducing current income. Examples are unilateral transfers of capital goods, legacies, investment grants and transfers of migrants' funds. In the New Zealand System of National Accounts, it has been possible to separately identify some of these flows only since 1984/85. Otherwise, they have been included in current transfers to/ from the rest of the world.
- Census.
A survey of the total population of interest. The Census of Population and Dwellings, carried out at five-yearly intervals, is an example of a census. (See also sample survey).
- Census night population count.
This is all people counted in New Zealand on census night, including overseas visitors but excluding New Zealand residents temporarily overseas.
- Census usually resident population count.
This is all people counted in New Zealand on census night excluding overseas visitors and New Zealand residents temporarily overseas.
- Change in inventories
(national accounts). This includes work-in-progress and consists of changes in:
Stocks of outputs that are still held by the units that produced them prior to their being further processed, sold or delivered to other units.
Stocks of products acquired from other units that are intended to be used for intermediate consumption or for resale without further processing.
They are measured by the value of the entries into inventories less the value of withdrawals and the value of any recurrent losses of goods held in inventories.
- cif
(cost including insurance and freight). A basis for valuation of merchandise imports, representing the cost to the importer of buying the goods and bringing them to the wharfside or airport in the importing country.
- Compensation of employees
(national accounts). Total remuneration, in cash or in kind, payable by enterprises to employees. It includes contributions paid on an employee's behalf to a superannuation fund, a private pension scheme, the Accident Compensation Corporation, a casualty and life insurance scheme and other fringe benefits.
- Compensation of employees to/from the rest of the world
(national accounts). In principle, these items cover the compensation residents of one country earn from employment in another where, because their stay is for a period of less than 12 months, they are classed as nonresident. In practice, data available does not permit estimates of these items.
- Consumers price index.
See indexes.
- Consumption of fixed capital
(national accounts). This represents the reduction in the value of fixed assets used in production during the accounting period resulting from physical deterioration. normal obsolescence or normal accidental damage. It is valued at replacement cost.
- Crude marriage rate.
The number of marriages per 1,000 estimated mean population.
- Current account.
This account records all transactions (other than those in financial items) that involve economic values and occur between resident and non-resident entities. Also recorded are offsets to current economic values provided or acquired without a quid pro quo. The major classifications are goods, services, income and transfers.
- Current transfers to/from the rest of the world
(national accounts). These refer to current transfers which take place between residents and non-residents. Examples include government aid in the form of food, clothing and medical supplies; social contributions and/or benefits; and personal transfers such as gifts.
- Death rate (crude).
The number of deaths per 1,000 estimated mean population.
- Density (of population).
The average number of people per square kilometre (or hectare) in a particular locality.
- Depreciation.
As charged in books of account on fixed tangible assets owned by establishments and ancillary units.
- Direct investment.
Investments made to acquire a lasting interest in an enterprise located in an economy other than the resident economy of the investor, the investor's purpose being to have a significant influence in the management of the enterprise. The criterion set out by the International Monetary Fund to determine ‘significant influence’ in the direct investment enterprise is that the investor must hold at least 10 percent of the voting capital of the enterprise. Once the direct investment relationship has been established, all forms of financial capital investment between the direct investor and direct investment enterprise are classed as direct investment, ie equity and debt.
- Direct investment income.
Income earned by investors from their direct investment relationship with an enterprise. The income includes dividends (including bonus issues of shares). interest, earnings of branches and direct investors' portions of the earnings of direct investment enterprises that are not distributed.
- Divorce rate.
The number of divorces per 1,000 estimated existing marriages.
- Domestically-issued securities.
Domestically-issued securities consist of domestically-issued bonds and notes taken up directly by non-resident organisations and individuals, or through New Zealand organisations acting as nominees.
- Economically-significant enterprise.
An enterprise which meets at least one of the following criteria: has greater than $30,000 annual GST expenses or sales; has more than two full-time equivalent paid employees; is in a GST-exempt industry except residential property leasing and rental; is part of a group of enterprises; is a new GST registration that is compulsory, special or forced (this means the business is expected to exceed the $30,000 limit); is registered for GST and is involved in agriculture or forestry.
- Employed.
All people in the working-age population who, during the reference week, worked for one hour or more for pay or profit in the context of an employee/employer relationship, or in self-employment. Also people who worked without pay for one hour or more in work which contributed directly to the operation of a farm, business or professional practice owned or operated by a relative.
- Employer contributions.
Payments by employers to superannuation, pension and welfare schemes and accident compensation levies.
- Employment, Status in.
A respondent's employment status within the labour force. This applies to people in full and part-time employment. Employment status categories are: paid employee; self-employed and without employees; employer; and unpaid family worker.
- Enterprise.
A business or service entity operating in New Zealand. It can be a company, a partnership, a trust, an estate, an incorporated society, a producer board, a local or central government organisation, a voluntary organisation or a self-employed individual.
- Estimated resident population.
The population of New Zealand including all people who usually live in New Zealand at a given date. It includes all residents present in New Zealand and counted by the census, an estimate of those residents temporarily overseas who are not included in the census, and an adjustment for residents missed or counted more than once by the census (census net undercount). Visitors from overseas are excluded.
- Ethnicity.
The ethnic group that people identify with or feel they belong to. It is a measure of cultural affiliation as opposed to race, ancestry, nationality or citizenship. It is self-perceived and people can affiliate to more than one ethnic group.
- Ex-nuptial birth.
A child which is born out of wedlock (includes a child born from a de facto relationship).
- Ex-nuptial birth rate.
The number of ex-nuptial births per 1,000 estimated mean not-married women aged 15–49 years.
- Exports of goods and services.
All goods and services produced by New Zealand residents and purchased by non-residents.
- Fertility.
The actual level of reproduction of a population based on the number of live births that occur. Fertility is normally measured in terms of women of childbearing age, defined as 15–44 years, although births to women outside this age range can occur.
- Final consumption expenditure
(national accounts). Expenditure, including imputed expenditure, on goods and services according to which sector (private and government) actually pays for the goods and services and therefore makes the decision on the expenditure.
- Financial account.
This account records transactions associated with changes in ownership of the foreign financial assets and liabilities of an economy. For example, foreign investors' purchases and sales of equity (shares) issues by resident New Zealand companies, and the borrowing overseas, and lending overseas, by New Zealand entities.
- Financial derivatives.
Financial derivatives are based on other products, either financial or real, or prices associated with financial products, and which involve:
Future delivery, receipt or exchange of financial items such as cash or another derivative instrument.
Future exchange of real assets for financial items where the contract may be tradable and have market value.
Financial derivatives include such things as currency swaps, interest rate swaps, futures, forward foreign exchange contracts, options (put and call) and warrants.
- Financial performance.
The broad heading for variables which measure the financial performance of a unit or group of units, including variables for such things as income, expenditure, profit and stocks.
- Financial position.
The broad heading for variables which measure the financial position of a unit or group of units. Previously called the balance sheet, it includes assets, liabilities, equity and investment in fixed assets.
- Foreign direct investment in New Zealand.
Investment in New Zealand-located enterprises by non-resident investors which meets the direct investment criteria. The financial account measures transactions which increase and decrease these investments. The international investment position (IIP) statement measures the value of this investment at points in time.
- fob
(free on board). The current market value of goods in the country of origin, including all costs necessary to get them on board a ship or aircraft, but excluding freight, insurance and other costs involved in transporting them between countries.
- Full time.
People working 30 hours or more a week.
- Full-time equivalents.
The number of full-time equivalent persons engaged equals the number of full-time employees and working proprietors, plus half the part-time employees and working proprietors.
- General government sector.
Central and local government units, other than the monetary authority.
- General marriage rate.
The number of marriages per 1,000 of the estimated mean not-married population aged 16 years and over.
- Geographic unit.
A separate operating unit engaged in New Zealand in one or predominately one kind of economic activity from a single physical location or base.
- Gross
(national accounts). Used to denote values before deducting consumption of fixed capital.
- Gross domestic product
(GDP, national accounts). The total market value of goods and services produced in New Zealand after deducting the cost of goods and services utilised in the process of production, but before deducting allowances for the consumption of fixed capital.
- Gross fixed capital formation
(national accounts). Measured by the total value, less disposals, of a producer's purchases of fixed assets, plus certain additions to the value of non-produced assets (such as subsoil assets or major improvements in the quantity, quality or productivity of land) realised by the productive activity of institutional units. The term ‘gross’ indicates that consumption of fixed capital has not been deducted from the value of the outlays.
- Gross national expenditure
(national accounts). The total expenditure within a given period on final goods and services by New Zealand residents, ie excluding goods and services used up during the production process.
- Gross national income
(national accounts). The income accruing within a given period to New Zealand residents from their services in supplying factors of production in New Zealand and overseas, plus net taxes on production and imports, and before the deduction of allowances for the consumption of fixed capital. Previously referred to as gross national product.
- Gross operating surplus
(national accounts). The residual item to the gross domestic product and expenditure account, obtained after deducting compensation of employees and taxes on production, less subsidies, from value added.
- Gross reproduction rate.
The average number of daughters a woman would have during her reproductive life, assuming that the age-of-mother specific birth rates experienced during a particular year/period continue to apply.
- Gross tonne.
The unit of actual weight of cargo, including packaging but not including the weight of reusable containers.
- Harmonised system.
The New Zealand Harmonised System Classification was adopted from the January 1988 reference month for processing customs entries and publishing statistics on external trade. It replaced the Customs Cooperation Council Nomenclature (CCCN) commodity classification and the Standard International Trade Classification (SITC).
- IMF.
International Monetary Fund.
- Imports of goods and services.
All goods and services produced by non-residents and purchased by New Zealand residents.
- Indexes.
Indexes are used to measure the total impact of changes in the attributes of commodities which cannot be compared directly. In New Zealand, the most common use of index numbers is to measure changes in prices, volumes or money values over time. When calculating a price index, the type, quantity and quality of each commodity is held constant so that the price movement can be measured. There are a number of methods for calculating index numbers. The Laspeyres index is most commonly encountered. The most frequently quoted index is the consumers price index, which reports quarterly changes in price levels of goods and services purchased by private New Zealand households during a specified base period. By expressing the changes in index form, price changes in commodities as diverse as beef, hairdressing and club subscriptions can all be aggregated to produce a measure of overall price change. Using the consumers price index as an example, a fixed-base Laspeyres index is compiled as follows:
The base for measurement is established by choosing a representative selection of goods and services from the range of commodities purchased by New Zealand households in a recent year. The commodities in the base are often referred to as a basket of goods and services, or as an index regimen. By convention, the index number of 1000 is used to express the value of the basket of goods in the index base quarter.
As part of the process of establishing the base, a weight is assigned to each commodity. This weight reflects the relative importance of the commodity in household expenditure. Weighting commodities according to their relative shares of household expenditure ensures that changes in price have an appropriate effect on the overall level of price change. For example, a 5 percent increase in the price of petrol would have a greater impact on the consumers price index than a 5 percent increase in the price of newspapers, because households spend more on petrol than on newspapers.
Once the base for measurement is established, the quantity, type and quality of the commodities chosen are kept constant so that the price movement alone is measured. This continues to be the case until the index base is revised. Such revisions are needed at regular intervals because new products come onto the market, old products disappear and the pattern of household expenditure changes.
Prices of commodities in the base are obtained at quarterly intervals, or more frequently for some commodities.
Once collected, prices for the current quarter are compared with prices in the base quarter, after adjustments have been made to remove the effect of any observed quantity or quality change that has occurred since the base quarter. The percentage increase or decrease in price for each commodity is computed. Finally, the index is obtained by multiplying the percentage change for each commodity by its assigned weight, and aggregating these changes across all commodities.
- Indirect taxes.
Taxes which are assessed on producers in respect of the production, sale, purchase and use of goods and services, and which add to the market prices of those goods and services. They includes sales tax, local authority rates, import and excise duties, fringe benefit tax and registration fees such as motor vehicle registration paid by producers.
- Insurance
(balance of payments). This covers the provision of various types of insurance by non-residents to residents, and vice versa. All types of insurance and reinsurance are included, including freight insurance on goods, reinsurance and other forms of direct insurance, such as life, marine, general and fire and accident. Also included are commissions related to insurance transactions earned by agents.
- Intermediate consumption
(national accounts). The value of goods and services used as inputs in production.
- International investment position.
A statistical statement of:
The value and composition of the stock of an economy's financial assets, or the economy's claims on the rest of the world.
The value and composition of the stock of an economy's liabilities to the rest of the world.
- Investment income.
Income earned by foreign investors from their equity and financial assets invested in New Zealand (the debit or expenditure item), and the income New Zealand investors earn from their equity and financial assets invested abroad (the credit or income earned item).
- Investment income to/from the rest of the world
(national accounts). This consists of:
Investment income, which represents transfers of income accruing to the owners of financial assets (mainly from earning interest and dividends) and tangible non-produced assets (from owning natural assets such as land, subsoil assets and water resources). This now includes reinvested earnings on overseas direct investment, where the retained earnings of a direct foreign investment enterprise are treated as if they were distributed and remitted to foreign direct investors in proportion to their ownership of the equity of the enterprise and then reinvested by them in the enterprise.
Entrepreneurial income, which refers to actual withdrawals of income from enter-prises operating overseas, such as branches of foreign companies.
- Kind of activity unit.
A subdivision of an enterprise consisting of a set of one or more activity units for which a single set of accounting records is available.
- Labour force.
The labour force consists of people aged 15 years and over who regularly work for one hour or more a week for financial gain, or who work without pay in a family business, as well as those who are unemployed and actively seeking work.
- Labour income (total).
Income before tax which people aged 15 years and over receive in a financial year from all sources, eg wages, salary, government benefits, interest, dividends, commission, pre-tax business or farming income (less expenses).
- Life expectancy at birth.
The number of years of life remaining for a new-born person. It assumes that the person experiences the age and sex-specific mortality rates of a given period throughout his/her lifetime. It represents the average longevity of the whole population and does not necessarily reflect the longevity of an individual.
- Loans.
Direct agreements between borrowers and lenders, involving the transfer of funds to the borrower and the repayment to the lender over time. Loans include secured and unsecured loans, trade related loans, overdrafts, roll-over loans, revolving credit advances, advances from overseas parent and/or subsidiary companies, the use of swingline facilities and non-market debentures and notes.
- Long term.
Refers to financial instruments with an original maturity of more than one year.
- Main urban areas.
Centres with populations of 30,000 or more.
- Maturity profile.
Time to run to scheduled maturity, ie the residual maturity at the survey time point.
- Mean population.
The average number of people in an area during a given period, usually a year. This measure may be estimated in terms of simple or weighted averages of population monthly or quarterly during the reference period.
- Median.
A value with an equal number of items on either side of it.
- Merchandise exports.
Goods of domestic origin, and re-exports, sent from New Zealand to other countries, including goods leased for a year or more, but excluding goods for repair.
- Merchandise imports.
Goods from other countries landed in New Zealand, including goods leased for a year or more, but excluding goods for repair.
- Merchandise trade.
All goods which add to or subtract from the stock of material resources in a country as a result of their movement in or out of it, including goods leased for a year or more, but excluding goods for repair.
- Minor urban areas.
Centres with populations of 1,000 or more not already classified as a main or secondary urban area.
- Monetary authorities sector.
New Zealand's monetary authority is the Reserve Bank of New Zealand.
- Money market instruments.
Securities generally giving the holder the unconditional right to receive a stated fixed sum of money on a specified date. These instruments are usually traded at a discount in organised markets. The predominant money market instruments in New Zealand are treasury bills, reserve bank bills, bills of exchange and certificates of deposit.
- National disposable income
(national accounts). The total income of New Zealand residents from all sources available for either final consumption (current spending) or saving.
- Natural increase.
The excess of births over deaths. When deaths exceed births, this is described as a natural decrease or a negative natural increase.
- Net errors and omissions.
A balancing item. The balance of payments statement employs a double entry system and so in the accounting sense it should always balance. In practice, this seldom occurs due to factors such as the variety of data sources used, the probability that some transactions will not be captured, and the possibility of errors in reporting and compilation. Net errors and omissions (or residual) is used to balance the accounts.
- Net lending to the rest of the world
(national accounts). The residual item for the national capital account. If the nation's savings are insufficient to pay for all capital investment needed for production, the shortfall must be borrowed from overseas. Net lending to the rest of the world is then a negative item.
- Net reproduction rate.
The average number of daughters a woman would have during her reproductive life, assuming that the age-of-mother specific birth rates and mortality rates experienced during a particular year/period continue to apply.
- New Zealand direct investment abroad.
Investment by New Zealand investors in overseas-located enterprises which meets the direct investment criteria. The balance of payments financial account measures transactions which increase and decrease these investments. The international investment position statement measures the value of this investment at points in time.
- New Zealand residents departing temporarily or returning after a short-term absence.
Those whose absence is intended to be or was less than 12 months.
- NZSNA.
New Zealand System of National Accounts.
- Operating expenditure.
Expenditure from the main activities of a unit, usually directly incurred from sales of goods and services. Excludes salaries and wages, interest, donations and extraordinaries.
- Operating income.
Income incurred from the main activities of a unit, usually from the sales of goods and services. Generally excludes extraordinaries, interest, dividends and subsidies.
- Operating surplus
(financial accounts). Surplus or deficit of total income less total expenditure, before direct tax, payments to owners and stock change.
- Other investment.
A residual category encompassing all forms of financial capital not included elsewhere, ie direct, portfolio or reserves. Types of capital include trade finance (trade creditor and debtor accounts), loans and deposits.
- Other sectors.
Includes non-financial corporations, insurance companies, pension funds, other non-depository financial intermediaries, private non-profit institutions and households.
- Output
(national accounts). Output represents the value of total production, including intermediate inputs. Deduction of intermediate inputs from output gives value added. (Previously, output was referred to as ‘gross output’).
- Overseas trade – exports and imports.
Customs entries relating to goods cleared. Overseas trade statistics show exports valued free on board (fob) and imports valued cost including insurance and freight (cif) and value for duty (vfd).
- Paid employees.
People who have an employment agreement and who receive remuneration for their work in the form of wages, salary, commission, tips, piece rates or pay in kind. An employee has certain rights under employment legislation not usually available to the self-employed.
- Part time.
People who work fewer than 30 hours a week.
- Permanent and long-term arrivals.
Overseas visitors arriving in New Zealand intending to stay for 12 months or more (or permanently), plus New Zealand residents returning after an absence of 12 months or more.
- Permanent and long-term departures.
New Zealand residents departing for an intended period of 12 months or more (or permanently), plus overseas visitors departing from New Zealand after a stay of 12 months or more.
- Population projection.
An estimate of the future size and/or composition of a specified population. It calculates the effect on the current (base) population during successive periods if certain stated assumptions about fertility, mortality and migration apply.
- Portfolio investment.
Investment in equity securities of less than 10 percent of the voting stock of an enterprise; and investment in debt securities, such as bonds and notes and money market instruments.
- Provisional (statistics).
Statistics which are derived using preliminary or incomplete data and released before final data becomes available.
- Purchase of non-produced non-financial assets to/from the rest of the world net
(national accounts). This refers to assets (tangible and intangible) that come into existence other than through processes of production. Also included are the costs of ownership transfer on, and major improvements to, such assets.
- Re-exports.
Merchandise exports that were earlier imported into New Zealand and comprise less than 50 percent New Zealand content by value. Examples are computer hardware, machinery and aircraft.
- Re-imports.
Goods, materials or articles imported in the same condition as they were exported from New Zealand. (One-third of New Zealand re-imports are made up of live animals, principally racehorses and dogs).
- Reserve assets.
External financial assets denominated in foreign currencies that are readily available to, and controlled by, monetary authorities.
- Residents and non-residents.
An individual or enterprise is a resident of New Zealand when the centre of economic interest is in New Zealand. Broadly, an individual is resident in New Zealand if:
The person resides in New Zealand for one year or more.
The person's general centre of interest is determined to be New Zealand. This case can apply to people who spend much of their time outside of New Zealand, but still retain ‘permanent’ links with New Zealand.
Resident individuals include:
All people whose usual place of living is New Zealand.
New Zealanders living, travelling or working abroad for less than a year.
New Zealanders living abroad who are studying, or New Zealand diplomatic or military personal.
All individuals and entities not regarded as residents of New Zealand are defined as nonresidents. An entity is resident in New Zealand if it engages in production of goods or services in New Zealand.
Resident enterprises may be incorporated or unincorporated; privately or government owned and/or controlled; and locally or foreign owned and/or controlled.
Resident entities include:
New Zealand-located subsidiaries of overseas companies.
New Zealand-located unincorporated entities (branches, partnerships) of an overseas-located entity..
Non-resident entities include overseas-located subsidiaries, associates and branches of New Zealand companies.
- Revised (statistics).
In this volume, any data which is different from that printed in previous editions.
- Rural areas.
Areas not defined as urban. They include:
Rural centres – centres with populations of 300 to 999 in a reasonably compact area which service their surrounding rural areas (district territory).
Districts not included in main, secondary or minor urban areas, and inlets, islands, inland waters and oceanic waters outside urban areas. The population aboard ships is excluded from the rural-urban classification.
- Salaries and wages.
Gross earnings during the accounting year of all paid employees (full-time, part-time and casual). Included are such items as overtime, sick and holiday pay, bonuses, payments under penal-rate schemes, severance pay, value of free supplies and sales commission paid to own employees. Excluded are drawings of working proprietors or partners.
- Sample survey.
A type of survey in which only a representative part of the population of interest provides detailed information. The sample statistics are summarised and are used to estimate statistics for the full population.
- Saving
(national accounts). The residual item in the national income and outlay account. It is the amount of national disposable income left after current spending.
- Seasonal adjustments.
Adjustments made to statistical time series (usually monthly or quarterly) to provide a refined series in which the estimated fluctuations due to seasonal variations have been removed.
- Secondary urban areas.
Centres with populations between 10,000 and 29,999.
- Short term.
Financial instruments with an original maturity of less than one year.
- Short-term visitors.
Those whose intended stay in New Zealand is less than 12 months.
- Statistical discrepancy.
In the New Zealand System of National Accounts (NZSNA), items making up gross domestic product (GDP) and expenditure on GDP are estimated independently, using diverse data sources. The combination of survey and other measurement and timing errors in the various components results in a difference between the estimates, known as the statistical discrepancy. In the past, the statistical discrepancy has been included on the expenditure side of the consolidated GDP account. This practice was the result of convention and did not imply that one side of this account was more accurate than the other. Presentation of the statistical discrepancy has been reorganised to more clearly illustrate the independence of the two estimates of GDP and the difference that exists between them. Expenditure on GDP is now calculated as the sum of expenditure components. The discrepancy is now outside the GDP and expenditure on GDP calculations. This format more clearly illustrates the true nature of the relationship between the two estimates. It also has the advantage of removing any distortion associated with the previous practice of including the discrepancy within the expenditure on GDP series.
- Stocks.
This includes materials such as components, stores, fuels, containers and other packaging materials, as well as finished goods and work in progress such as goods purchased for resale without further processing.
- Subsidies (national accounts).
Current unrequited payments made by governments to enterprises on the basis of the levels of their production activities or the quantities or values of the goods and services that they produce, sell or import.
- Taxes on production and imports
(national accounts). Taxes payable on goods and services when they are produced, delivered, sold, transferred or otherwise disposed of by their producers. Also included are taxes and duties on imports that become payable when goods enter the economic territory by crossing the frontier or when services are delivered to resident units by non-resident units. They also include other taxes on production, which consist mainly of taxes on the ownership or use of land, buildings or other assets used in production, or on the labour employed, or compensation of employees paid.
- Total fertility rate.
The average number of births a woman would have during her reproductive life if she were exposed to the fertility rates characteristic of various childbearing age groups in a particular year/period.
- Trade credits.
Accounts payable to, and prepayments received from, non-residents for imports and exports of goods and services.
- Transfers
(balance of payments). Special counter entries for one-sided transactions such as gifts of goods, services and financial assets.
- Transportation
(balance of payments). Exports and imports of services associated with the international carriage of goods and passengers, including freight, air fares, freight insurance, port services and stevedoring.
- Travel
(balance of payments). The expenditure of foreign travellers in New Zealand and New Zealanders travelling overseas.
- Unemployed.
All people in the working-age population who, during the reference week, were without a paid job, were available for work, and had actively sought work in the past four weeks, or had a new job to start within four weeks.
- Urban areas.
Non-administrative areas with urban characteristics and a high to moderate concentration of population. Comprises a three-part classification consisting of main, secondary and minor urban areas differentiated by population size.
- vfd
(value for duty). The assessed value of merchandise imports on which duty is based. It approximates the current domestic value of goods in the exporting country.
- Vital statistics.
Statistics of events such as births, deaths and marriages which influence population numbers.
- Value added
(national accounts). The value added to goods and services by the contributions of capital and labour (ie after the costs of bought-in materials and services have been deducted from the total value of output).
- Working-age population.
The usually resident, non-institutionalised civilian population of New Zealand aged 15 years and over.
Names of people who feature in short articles are indexed. Names of places and geographic features are generally not indexed separately, but can be found on pages listed under the relevant headings, eg cities; mountains; population. Exceptions are names of countries and inhabited islands.
Acts of Parliament and statutory bodies are indexed separately only where there is a major reference.
A large number of organisations and bodies indexed by name have the prefixes ‘National’ or ‘New Zealand’. If there is no reference under a more generally known name, they may be found under these prefixes (eg National Library; New Zealand Customs Service). In most cases New Zealand has been abbreviated to NZ to save space.
Individual commodities or products are indexed separately only when they are unusually significant, eg wool. When there is no individual entry, look on pages listed under the appropriate general index entry:
General commodity or product headings, eg meat, minerals, pipfruit, or
General economic and business activity headings, eg exports and imports, mining, prices, retail trade and services.
20th century events, 17–18
A
- Abortion, 190–191
- Accident Compensation Corporation (ACC), 198–199
- Accidents
- prevention,
- Safety
- Accommodation, 307, 310, 482–483
- Accounts
- international, 396–404
- national, 386–396
- Acts and regulations, 33, 43,
- Adoption, 166–167
- Adult education, 229–230
- Advertising, 273
- Aerial photography, 372
- African countries, relations with, 68–69
- Age
- and sex of population, 110–111
- Asians, 137
- at divorce, 150
- at marriage, 102–104, 148–150
- by ethnic group, 117
- distribution of population, 92, 110–111
- Māori, 112–113, 125–126
- median, 111
- of child bearing, 103
- Pacific peoples, 134–135
- Aggregates, mineral, 464
- AgResearch, 350
- Agricultural Production Account, 409
- Agricultural Fieldays, 418
- Agriculture, generally, 407–432
- and climate change, 4
- international policies, 408, 410
- Ministry of (MAF), 42
- quarantine, 411
- survey facts, 420
- Agriquality NZ Ltd, 411
- Aid to developing countries, 69–72
- AIDS (Acquired Immune Deficiency Syndrome), 181
- Air
- accidents and deaths, 495–496
- Civil aviation
- aviation services, 495–496, 412
- Civil aviation
- quality, 359
- Civil aviation
- transport,
- Civil aviation
- Air force, 85–86
- Airlines, 497
- Airports, 498
- Airways Corporation of NZ, 495, 497
- Alcohol
- (Wine), 179–180, 506, 513–514, 572
- Alexander Turnbull Library, 282
- Allowances, child disability, 158
- Amenities, household, 146
- Americas, relations with, 67
- America's Cup, 310
- Animals and plants, 13, 357–358
- Animals, farm,
- Livestock
- Antarctica, 6, 77, 82, 368, 498
- Anthems, national, 60
- Antiquities, protection of, 280
- Anzac (Australian and New Zealand Army Corps), 78
- ANZCERTA,
- Australia New Zealand Closer Economic Relations Trade Agreement
- ANZUS,
- Australia, New Zealand and United States security treaty
- APEC,
- Asia Pacific Economic Cooperation
- Apparel, 471–473, 570–571
- Apples,
- Pipfruit
- Appliances, household,
- Amenities
- Aquaculture, 447
- Archaeological sites, protection of, 280
- Architecture Awards, NZ, 486
- Archives New Zealand, 42, 280–281, 290
- Area of NZ, 6
- Armed forces,
- Defence Force, NZ
- Arms control (PACDAC), 86
- Army, NZ, 84–85
- Art galleries, 279
- Arts and culture, 278
- ASEAN,
- Association of South-east Asian Nations
- Asia, 66–67, 556
- Asia 2000 Foundation, 66
- Asia Pacific Economic Cooperation (APEC), 64, 555
- Asian Development Bank, 75
- Asians in NZ, 137–139
- Assaults, criminal, 244, 258
- Assets and liabilities, international, 402–404
- Assistance, 69–72, 155–163, 408, 482–483, 602
- Association of South-east Asian Nations (ASEAN), 67
- Astronomy, 352
- Asure NZ Ltd, 411
- ATLAS software, 434
- Auckland, 58
- Audit Office,
- Controller and Auditor-General
- Australia, 65–66
- benefit reciprocity, 162
- defence partner, 78
- double taxation agreement, 602
- New Zealanders in, 104
- social security agreements, 162
- trade with, 551–552
- Australia New Zealand Closer Economic Relations Trade Agreement (ANZCERTA), 66
- Australia, New Zealand and United States security treaty (ANZUS), 79
- Authorisations, building, 484–486
- Automobiles,
- Motor vehicles
- Aviation, civil,
- Civil aviation
- Awards, 26, 278, 471, 486, 534–535
B
- Balance of merchandise trade, 533
- Balance of payments (international), 397
- Ballet, Royal NZ, 287
- Baltics, relations with, 68
- Banking Ombudsman, 586
- Bankruptcy, 520–522
- Banks and banking
- Asian Development Bank, 75
- assets and liabilities, 582–583, 584
- Kiwibank, 581
- other financial institutions, 585
- ownership, 582
- registration and supervision, 582–585
- statistics, 586
- World Bank, 75
- BDM,
- Births, Deaths and Marriages Registry
- Bees and beekeeping, 424–425
- Benefits and pensions
- accident compensation, 198–199
- children's, 158, 160
- expenditure, 158
- health service, 175–177
- income support, 155–158
- reciprocity agreements, 162–163
- superannuation, 160–163
- various, 159–160
- war pensions, 161–162
- Berryfruit, 428–429
- Bestsellers, 2001, 284
- Betting and gaming, 304–306
- Bilateral assistance to developing countries, 70–72
- Bill of Rights Act 1990, NZ, 241
- Biodiversity, 357–358
- Biosecurity Authority, 411
- Biotechnology survey, 347
- Birth, country of, 117–118
- Births and deaths, 104, 105, 107–108
- median age of childbearing, 103
- Births, Deaths and Marriages Registry (BDM), 107
- Blood Service, NZ, 172
- Books
- (Libraries), 284–285
- Border operations (NZ Customs Service), 532
- BRANZ,
- Building Research Association of NZ
- Breast cancer screening, 186
- Broadcasting, generally, 264–271
- archives, 280
- of parliament, 35
- Broadcasting Commission (NZ On Air), 265
- Broadcasting Standards Authority, 265–266
- Budget process, 592
- Building Research Association of NZ (BRANZ), 484
- Building and construction
- (Housing), 480, 483–488
- Buildings, Parliament, 480
- Business, 470–471, 401, 404–406
- Business NZ, 318
C
- CAB,
- Citizens Advice Bureaux
- Cabinet, 28, 48
- and Executive Council, 35–36
- Callaghan, Paul, 352
- Canada, 67, 162
- Cancer, 186, 189, 192
- Capital accounts, 389, 399
- Capital goods price index, 579–580
- Capital stock statistics, 394–395
- Carbon dioxide emissions, 360
- Care and protection plans, 163–164
- Career Services: Rapuara, 229, 336–337
- Cargo, overseas, 557–560
- Caribbean, relations with, 67
- Carpet industry, 471
- Cars,
- Motor vehicles
- Carter Observatory, 352
- Cartwright, Dame Silvia, 27
- Casein, 420–422
- Casino Control Authority, 306
- Casinos, 305
- Cattle, 413
- Caves, 8
- Cawthron Institute, 352
- CCMAU,
- Crown Company Monitoring Advisory Unit
- Censorship, 290–291, 292
- Census of Building and Construction, 487
- Census of Population and Dwellings 2001, 97
- ethnicity, 112–113, 115–116, 125–127, 134–138
- households, 142–146
- labour force, 320–328
- Māori population, 112–113, 125–127
- Pacific peoples, 113, 134–137
- religious affiliations, 118
- results on website, 89
- total population, 90
- Central Europe, relations with, 67–68
- Central government finance
- accountability, 591
- Taxes and taxation
- Budget process, 592–3
- Taxes and taxation
- external reporting, 585–587
- Taxes and taxation
- financial management, 592
- Taxes and taxation
- local government, 607–608
- Taxes and taxation
- parliamentary scrutiny, 593–594
- Taxes and taxation
- public debt, 605–607
- Taxes and taxation
- revenue,
- Taxes and taxation
- securities on issue, 589
- statement of financial position, 596
- CER,
- Australia New Zealand Closer Economic Relations Trade Agreement
- Certificates, tertiary, 225–226
- Cervical screening, 185
- Chamber music, 285–286
- Chatham Islands, 125
- Cheque duty, 600
- Chickens,
- poultry and eggs
- Child, UN Convention on the Rights of the, 139
- Childbirth
- births and birth rate, 89, 91, 93, 102–105, 107
- infant mortality, 186–187
- parental leave, 317
- Children and youth, generally, 163–167
- health, 186–188
- play centres, 216
- support, 158, 160, 602
- Child, Youth and Family Services, 42, 163–167
- Children, Office of the Commissioner for, 149
- Children's Health Camps, 186
- Chiropractors, 174
- Choral Federation, NZ, 286–287
- Chronology, NZ, ca, 1300–2001, 18–23
- Churches,
- Religious affiliation of population
- Cinema, 290
- Cities and district councils,
- Local government; Urban areas
- Citizens
- Advice Bureaux (CAB), 164
- Initiated Referenda, 36
- Citizenship, 119–121
- Civil aviation, 494–498
- Civil Aviation Authority (CAA), 494–495
- Civil defence, 42–43, 199–200
- Civil jurisdiction of courts, 240–241
- Claims process (Māori), 127–128
- Clark, Helen, 31
- Classification, film and literature, 290–291, 292
- Clays, 464–465
- Climate, 3–6, 359–360, 370–371
- Closer Defence Relations (CDR) with Australia, 78
- Closer Economic Relations (CER), 66
- Clothing, 570–571
- Coaching, 300
- Coal, 363, 461–462
- Coat of arms, NZ, 59
- Commerce, 263, 514–522
- Commerce Commission, 515–516
- Commerce, Ministry of,
- Ministry of Economic Development
- Commercial list (high court), 236
- Commission on Sustainable Development (CSD), UN, 361
- Commissioner
- for Children, 149
- for the Environment, Parliamentary, 53, 55
- Commodities
- exported, 534–535
- imported, 542–543
- Common law, 238
- Commonwealth, 75
- Commonwealth of Independent States, relations with, 68
- Communicable disease, 181
- Communications
- future directions, 262–263, 268
- internet, 259, 261–264, 337
- Community
- boards, 58
- Defence Force assistance to, 81–82
- education, 229–230
- law centres, 240
- playcentres, 216
- playgroups, 210
- work (sentences), 250
- Community Employment Group, 338
- Community Probation Service, 249–251
- Companies, 514–515
- insolvency, 522
- legislation, 515, 516–517
- takeovers, 518
- taxation, 598
- Compensation, accident, 198–199
- Computers, 146, 206, 338, 519
- Congress, Māori, 131
- Conservation Authority, NZ, 380
- Conservation Corps, 141
- Conservation, Department of, 43, 375
- Conservation organisations, 381
- Consolidated accounts of the nation, 388–390
- Construction industry,
- Building and construction
- Consulates and diplomatic posts, NZ, 65
- Consumer affairs, 510–511
- Consumer Affairs, Ministry of, 43, 511–512
- Consumer Guarantees Act 1993, 510–511
- Consumers' Institute, 512–513
- Consumers price index (CPI), 565–576
- food prices, 568, 569
- groups, 566, 568, 572–573
- indexation of contracts, 566–567
- international comparisons, 575–576
- price movements, 567–574
- retail prices, 574–575
- uses, 567
- Contaminated sites, 369
- Continuing education, 230
- Contracts, indexation of, 566–567
- Controller and Auditor-General, 50
- Convergence of communications, 262–263, 268
- Convictions, 242–247
- Cook, James, 16
- Cook Strait inter-island services, 492
- Copyright, 292, 293
- Coroner's Court, 237–238
- Corrections, 248–256
- Department of, 43–44
- Correspondence School, The, 219
- Corruption Index, 515
- Cost of living,
- Consumers price index
- Cot deaths, 188
- Council for Educational Research, NZ, 212
- Council of Trade Unions, NZ, 318
- Courier services, 506
- Court of appeal, 236
- Courts
- civil jurisdiction, 240–241
- commercial list, 236
- Department for, 44
- hierarchy, 235–239
- judges listed, 236
- specialist, 237–238
- technology in, 237
- CPI,
- Consumers price index
- Creative NZ, 277, 278, 294–295
- Credit sales and services, 529, 585
- Crime
- convictions, 242–247
- detection technology, 254
- prevention, 249
- proceeds of, 253
- victim support, 247–248
- Crime Prevention Unit, 249
- Criminal Investigations Branch, 259
- CRIs,
- Crown Research Institutes
- Crop and Food Research Ltd, Institute for, 350
- Crown and governor-general, 26
- Crown Company Monitoring Advisory Unit (CCMAU), 49–50
- Crown debt
- (Central government finance), 606–607
- Crown entities, 49
- Crown Law Office, 241–242
- Crown Research Institutes, 349–351
- Crown-owned lands, 375
- CSD,
- Commission on Sustainable Development; UN
- Cultural sites, protection of, 279–280
- Culture and Heritage, Ministry for, 44, 292–293
- Currency credit rating, 607
- Current account, national, 397–398
- Curriculum Framework, NZ, 220
- Customary fishing regulations, 443–444
- Customs, 532, 600
- Customs Service, NZ, 44, 532–533
- Cyberwaka Enterprises, 338
- CYFS,
- Department of Child, Youth and Family Services
D
- Daily Board, NZ, 421
- Dairy industry, 420–422, 536
- Fonterra, 421, 517
- Dame Silvia Cartwright, 27
- Dance, 288
- Data, law enforcement, 244
- Death
- causes of, 10, 188–191, 194–197, 496
- rates, 107–108
- Debt
- national, 402–404
- public, 605–607
- Deer farming, 413–414
- Defence
- exercises, 81
- expenditure, 82
- policy, 78
- Defence Force, 45
- community assistance, 81–82
- locations in NZ (map), 84
- NZ Army, 84–85
- overseas activities, 79–81
- peace commitments, 79–81
- Royal NZ Air Force, 85–86
- Royal NZ Navy, 83–84
- Defence, Ministry of, 44
- Deficits and surpluses, national, 400–401
- Degrees awarded, 205, 225–226
- Demography
- Māori, 125–127
- Pacific peoples, 113, 134–135
- Asian, 137–139
- Denmark, 163
- Dentists and dental services, 173, 175, 176, 187–188
- Department for Courts
- (Courts), 44
- Department, Inland Revenue, 46
- Department of Child, Youth and Family Services (CYFS), 42, 163–167
- Department of Conservation, 43, 375
- Department of Corrections, 43–44
- Department of Internal Affairs, 42–43, 46
- BDM Registry, 107
- Department of Labour, 46
- Department of Prime Minister and Cabinet, 48
- Deportation, 125
- Designs, industrial, 354
- Detention, penal, 253–254
- Developing countries, relations with, 69–72
- Development Assistance Programme, 69–70
- Dietitians, 174
- ‘Digital divide’, 73
- Diplomatic representation overseas (map), 65
- Direct taxation, 603–604
- Disabilities, 183, 300
- Disability Commissioner, 184
- Disabled persons,
- Disabilities
- Disaster relief, 71
- Discovery of NZ by Europeans, 16
- Disease, 181, 203, 191
- Disputes tribunals, 238
- Distance education, 225, 231
- District courts, 237
- District health boards, 170–171
- District planning, 366
- Diversity, social, 115–125
- Divorce, 148, 150
- DNA profiling, 246
- Doctors, 173, 175
- Dogs, police, 257
- Domestic violence, 243
- Drama, 288
- Drinking water, 178
- Driver licences, 505–506
- Driving offences, 246, 507
- Drugs and medicines, 179, 258–259
- Duties (tax), 599–600
- Dwellings
- (Housing), 142–144, 477–481, 485
E
- EAB,
- External Assessments Bureau
- Early Childhood Development (ECD), 209–210
- Early Childhood Education, 207–208, 209–211, 214, 215–218
- Earthquakes, 9–11, 523–524
- Eastern and Central Europe, relations with, 68
- East Timor, 81
- Economic Development, Ministry of, 45
- Economic research funding, 347
- Economy
- accounts, 386–396
- business statistics, 404
- debt, 402–404
- deficits and surpluses, 400–401
- fiscal indicators, 384–385
- gross domestic product, 390
- gross fixed capital formation, 394
- household sector, 392–394
- international accounts, 396–404
- monetary policy, 385–386
- outlook, 386
- public debt, 385
- recent developments, 383–384
- seasonal adjustments, 527–528
- Education
- administrative bodies, 209–213
- Career Services: Rapuara
- age groups, 92–93
- Career Services: Rapuara
- agencies, 209–212
- Career Services: Rapuara
- assessment of students, 218
- Career Services: Rapuara
- boards of trustees, 213
- Career Services: Rapuara
- care centres, 217
- Career Services: Rapuara
- Career Services: Rapuara, 229, 336–337
- Career Services: Rapuara
- choice, 218–219
- Career Services: Rapuara
- community, 229–230
- Career Services: Rapuara
- component of CPI, 573
- Career Services: Rapuara
- compulsory, 214–215
- Career Services: Rapuara
- computers, 206
- Career Services: Rapuara
- Correspondence School, The, 219
- Career Services: Rapuara
- curriculum, 206–207, 219–220
- Career Services: Rapuara
- dance, 288
- Career Services: Rapuara
- drama, 288
- Career Services: Rapuara
- developing countries, 71
- Career Services: Rapuara
- distance, 225, 231
- Career Services: Rapuara
- early childhood, 207–208, 209–211, 215–218
- Career Services: Rapuara
- English language, 335
- Career Services: Rapuara
- enrolments, 217, 223–224, 232–233
- Career Services: Rapuara
- Equivalent Full-Time Student (EFTS)
- Career Services: Rapuara
- funding, 215
- Career Services: Rapuara
- expenditure, 214
- Career Services: Rapuara
- forestry, 436
- Career Services: Rapuara
- funding, 214–215
- Career Services: Rapuara
- home based, 217, 219
- Career Services: Rapuara
- industry training, 229, 331–338
- Career Services: Rapuara
- information studies and teacher
- Career Services: Rapuara
- librarianship, 222
- Career Services: Rapuara
- information technology, 206
- Career Services: Rapuara
- integrated schools, 219
- Career Services: Rapuara
- international students, 221–222
- Career Services: Rapuara
- kindergartens, 216
- Career Services: Rapuara
- kura kaupapa Māori, 219
- Career Services: Rapuara
- library, 222, 284
- Career Services: Rapuara
- Māori, 211, 213, 214, 216, 230–231–337
- Career Services: Rapuara
- National Certificate of Educational Achievement, 221
- Career Services: Rapuara
- National Qualifications Framework, 220–221
- Career Services: Rapuara
- NZ Qualifications Authority, 211
- Career Services: Rapuara
- on-line, 206, 264
- Career Services: Rapuara
- Pacific peoples, 210
- Career Services: Rapuara
- playcentres, 216
- Career Services: Rapuara
- polytechnics, 223–224
- Career Services: Rapuara
- preschool, 207–208, 209–211, 214, 215–218
- Career Services: Rapuara
- primary, 208, 218–220
- Career Services: Rapuara
- private training establishments (PTEs), 229
- Career Services: Rapuara
- public expenditure on, 214–215
- Career Services: Rapuara
- qualifications framework, 220–221, 225–227
- Career Services: Rapuara
- Rapuara,
- Career Services: Rapuara
- Rural Education Activities Programme (REAP), 222
- seafarers, 493
- secondary, 208, 218–223
- Skill New Zealand, 229, 331–336
- special, 210–211, 219, 228–229
- statistics, 231–233
- student support, 227–228
- teacher librarians, 222
- Teacher Registration Board, 211–212
- teacher training, 228–229
- teaching resources, 222–223
- teaching staff, 231
- tertiary, 208–209, 215, 223–230
- training, 331–338, 436
- universities, 220, 223, 225, 230
- vocational qualifications, 225–227
- wānanga, 223
- Education Review Office, 45, 211
- Educational Research, NZ Council for (NZCER), 212
- Eels, 449
- EEZ,
- Exclusive Economic Zone
- Eggs, 424
- Elections
- Electoral Act 1993, 28
- electoral boundaries, 38, 56–57
- local, 59
- Māori option, 131
- MMP, 28, 32
- parliamentary, 37–40
- political parties, 39
- results, 29, 40
- system, 27, 32
- technology, 34
- voting, 37–38, 39
- Electorates, parliamentary, 35–37, 38
- Electricity, 451, 457–458
- Electronic commerce, 263–264, 585
- El Nino and La Nina, 3, 5
- Embassies and consulates, NZ, 65
- Emergency and disaster relief overseas, 71
- Emergency management, 199–201
- Emigration, 108–110
- Employment
- assistance measures, 337
- by ANZSIC, 405
- entitlements, 315–317
- forestry, 436
- full-time and part-time, 323–325, 405–406
- holidays, 316–317
- hours and times of work, 324–325
- labour force, 320–323
- labour market organisations, 321
- legislation, 313–315
- manufacturing, 472–473
- Māori, 337
- minimum entitlements, 315–317
- occupational structure, 327–328
- OECD comparisons, 332
- on-line jobs service, 337
- public sector, 40
- salary and wage rates, 342
- status in, 326
- structure, 326–328
- training opportunities, 331–338
- travel to, 505
- Employment Court, 237
- Employment-related education and training, 331–338
- Employment Relations Act 2000, 313–315
- Employment Relations Authority, 314–315
- Employment Tribunal, 238
- Endangered species, 358, 359
- Energy
- efficiency, 453
- environmental impact, 362–363
- monopolies, 452
- raw materials, 457–462
- renewable, 462–463
- supply and demand, 451–455
- English language training, 335
- Enumeration of population, 96
- Environment
- air quality, 359
- and energy, 362–363
- and MFAT, 364
- and tourism, 310
- and transport, 499
- Antarctica, 368
- biodiversity, 357–359
- climate change, 3–4, 359–360, 370–371
- contamination, 369
- global issues, 370–371
- government department coordination, 364–365
- management of, 364–371
- Ministry for the, 45, 368–370
- ozone depletion, 6, 360
- planning, 365–366
- policies, 365
- research funding, 347–348
- Resource Management Act 1991, 365–366, 368–369
- sustainable management, 364–371
- United Nations, 361, 364, 370–371
- water and soil management, 367–369
- Environment Court, 237
- Environment, Parliamentary Commissioner for the, 53, 55
- Environmental Risk Management Authority (ERMA), 365
- Equal Employment Opportunities Trust (EEO), 45, 318
- Equivalent Full-Time Student (EFTS) funding, 215
- Erebus disaster, 498
- ERO,
- Education Review Office
- ESR,
- Institute of Environmental Science and Research Ltd
- Ethics, health and disability, 171
- Ethnic Councils, NZ Federation of, 140
- Ethnic groups,
- (Māori), 94–95, 112–113, 115–117
- European countries, 67–68, 556
- Events, NZ chronology of, 18–23
- Examinations, 220–221
- Exchange rate, 589–590
- Excise duties, 599–600
- Exclusive Economic Zone, 442
- Executive government, 35–36
- Exercise, 299
- Ex-overseas cars, registration, 503
- Expenditure
- ACC, 199
- benefits and pensions, 158
- education, 214
- gross domestic product, 392
- health, 177
- household, 392–394
- intelligence and security, 88
- tourist, 308
- Exports and imports, 533–545
- agricultural (various), 416–430
- awards, 534–535
- commodities, 533–535, 541–543
- dairy, 421–422
- fish, 538
- flowers, 426
- forestry products, 440–441
- fruit, nuts and vegetables, 539
- goods and services, 395–396
- horticultural, 426
- machinery, 540–541, 542–543
- meat, 416–417
- mineral fuels, 554
- seafood, 446–447
- plastics, 545
- trade indexes, 560–564
- vehicles, 544
- wine, 428
- wool, 418–419
- External Assessments Bureau (EAB), 87–88
- External migration, 108–110
- External national account, 389
F
- Fair trading legislation, 510, 516–517
- Family
- courts, 237
- expenditure, 145
- health, 184–185
- legislation, 151
- planning, 184–185
- structures, 147–150
- violence prevention, 165
- whānau agreements, 164
- Family Planning Association, 184
- Family Start, 187, 209
- Fanning,
- Agriculture; Livestock Farmland, 408
- FASTER system, 519
- Federation of Ethnic Councils, NZ, 140
- Ferries, inter-island, 492
- Fertility, 94, 102–105, 112
- Festival of Pacific Arts, 278
- Fieldays, agricultural, 418
- Film,
- (Censorship), 288–290, 291
- Finance, government, 591–597
- Financial account, national, 399
- Financial institutions, 585
- Financial system, 583
- Fingerprints, 259
- Fire protection, 200–201
- Fire Service, NZ, 200
- First Flag of New Zealand, 60
- Fiscal economic policy and indicators, 384–385
- Fish and Game Council, NZ, 380
- Fish, crustaceans and molluscs, 538–539
- Fisheries
- allowable catches (TAC; TACC), 442–443
- Commission, Treaty of Waitangi, 444
- control of resources, 444–445, 448
- management, 442, 445
- Ministry of, 45–46
- regulations, 443–444
- stock surveys, 443
- Te Ohu Kai Moana, 444–445
- vessels, registered, 445
- Fishing
- customary regulations, 443–445
- recreational, 302
- Fitness and active leisure, 297–304
- Flag, 59, 60
- Flowers, 426
- Fluoridation, 188
- Fonterra, 421
- Food
- banks, 156
- commodities
- exports,
- commodities
- prices, 568–569
- research, 350
- safety and quality, 181–182
- Food Assurance Authority, 411
- Foot and mouth disease, 417
- Footwear, 474
- Foreign Affairs and Trade, Ministry of, 46, 63, 364
- Foreign exchange rates, 589–590
- Foreign relationships, 63–72
- Forest and Bird Protection Society, Royal, 369
- Forest Research, 349
- Forestry, 433–441
- employment in, 436
- exports, 440, 537–538
- planting and production, 437
- products, 439–440
- research, 349
- Forests
- conservation and protection, 378, 380
- funds, 380
- indigenous, 433–435
- ownership, 435–437
- parks, 378
- resources, 433–435
- Former Yugoslavia, 80
- Foundation for Research, Science and Technology, 348
- Fraud Office, Serious, 48, 517–518
- Freedom of the press, 272
- Fringe benefit tax, 599
- FRST,
- Foundation for Research, Science and Technology
- Fruit, 428–430, 539–540
- Fuels, 456, 457–463
- Full-time work, 323–325
G
- Gallantry and bravery awards, 26
- Galleries, art, 279
- Gambling and gaining, 304–306, Gas, 456, 460–461
- Gateway – Te Tomokanga, 336
- GDP,
- Gross domestic product
- Gender,
- Sex/gender
- General Assembly,
- Parliament
- General elections, 37–40
- Genetic modification, 350
- Geographical features, NZ, 6–12
- Geological & Nuclear Sciences, Institute of (GNS), 351
- Geology,
- Minerals; Rock types
- Gift duty, 600
- Globalisation, 76
- Global environmental issues, 370–371
- Gluckman, Peter, 353
- GNI,
- Gross national income
- GNS,
- Institute of Geological & Nuclear Sciences
- Gold, 363, 464, 465
- Goods and services tax (GST), 599
- Government
- activities 1984–1990s, 3–4
- as of October, 2001,36
- Cabinet and Executive Council 2002, 35–36
- departments see also (State sector), 41–49
- Executive, 35–36
- finance, 591–597
- housing agencies, 479–481
- insurance activities, 523
- intelligence, 87–88
- local and regional councils, 54–55
- scientific research funding, 346
- securities market, 588
- superannuation, 525
- territorial authorities, 55
- Government Communications Security Bureau, 87
- Governor-general, 26–27
- Governors,
- Vice-Regal representatives
- Graduates, tertiary, 224, 226
- Grain, 426–427
- Grape growing and wine production, 430
- Graphics, TV, 471
- Greece, 162
- Greenhouse gases, 456
- Green prescriptions, 299
- Greenshell mussels, 538
- Greenstone, 465
- Gross domestic product (GDP), 387, 390–392
- Gross fixed capital formation, 394
- Gross national income, 387
- GST,
- Goods and services tax
H
- Haywood, Allison, 354
- Hazardous substances, 366–367
- Health
- advisory committees, 171–172
- AIDS, 181
- alcohol consumption, 179–180
- and climate, 4
- benefits, 175–177
- boards and councils, 170–171
- children's, 186–187
- dental, 173, 187–188
- Disability Support, 183–184
- disease control, 181
- district health boards, 170–171
- drinking water, 178
- drug control and misuse, 179–181
- ethics, 171
- expenditure, 172, 177
- family, 184, 187
- food safety, 181–182
- hazard information, 200
- hospitals, 191
- immunisation, 187
- information gathering, 192
- legislative review, 177–178
- Management Unit, Residual, 171
- Māori, 184–185
- mental, 182–183, 192
- occupational, 201–203
- older people, 182
- price index, 572–573
- pharmaceutical benefits, 176
- professionals, 173–175
- regulation of health professionals, 173–175
- services for older people, 182
- smoking, 180–181
- subsidies, 175–177
- system, snapshot facts, 169
- technicians and technologists, 174–175
- voluntary organisations, 182
- women's, 185–186
- workforce advisory committee, 171
- Health and Disability Commissioner, 184
- Health Information Service, NZ, 191–192
- Health, Ministry of, 169–170
- Health Research Council, 172, 348
- Health Sponsorship Council, 172
- He Oranga Poutama, 299
- Heritage, historical, 278–281
- Hierarchy of courts, 235–238
- High court, 236
- Higher Salaries Commission, 238
- High temperature superconductivity, 457
- Highway patrol, 257
- Highways, expenditure, 502
- Hillary Commission for Sport, Fitness and Leisure, 297–300
- Historic Places Trust, NZ, 279–280
- History, oral, 282–283
- HIV (human immunodeficiency virus), 181
- Hocken Library, 283
- Holidays, public, 316–317
- Home detention, 250–251
- Home ownership and loans, 480–482
- Honey production, 424–425
- Honours system, 26
- Horse racing, 304
- Horticulture
- (Crops), 426–430
- HortResearch, 350
- Hospitals, 176, 191
- Hotels and other accommodation, 307
- House of Representatives, 28–30, 32–34
- Hours of work, 324–325
- Household sector, national accounts, 392–394
- Households, 142–146
- amenities, 146
- computers in, 146
- income and expenditure, 144–145, 340–341, 392–394
- operating costs, 570
- Pacific peoples, 134–137
- spending, 145
- transport, 144
- Housing
- assistance, 482–483
- building authorisations and consents, 484–487
- costs, 478
- energy efficiency, 453
- government agencies, 479–481
- home ownership, 144, 480
- loans and mortgages, 481–483
- prices, 478, 568–569
- sales, 477
- Housing, Ministry of, 46, 480–481
- Housing New Zealand Corporation, 479–480
- Housing New Zealand Ltd, 480
- Human rights, 52–53, 72, 139–142, 238
- Human Rights Commission, 139
- Human Rights Review Tribunal, 238
- Hunting and shooting, 302
- Hydrogen energy storing, 455
- Hydrographic survey, 83
- Hydrography, 372
I
- Ilmenite, 464
- Immigration, 16, 122–125
- Immunisation, 187
- Import indexes, 560–564
- Imports,
- Exports and imports
- Imprisonment,
- Prisons and prison inmates
- Imputation credits, 598
- Income, 315–316, 338–343
- benefits and support, 155–158
- household, 145, 392–393
- inmate, 256
- judges, 238
- MPs, 32
- national accounts, 387–389
- tax, 598
- Incorporated societies, 295, 516
- Independent Biotechnology Advisory Council (IBAC), 345
- Indexes, 560–564
- building and construction price, 486
- capital goods price, 579–580
- corruption, 515
- farm expenses price, 410–411
- labour cost, 342
- producers price, 576–579
- Indirect taxation, 604
- Industrial Research Ltd, 351, 457
- Industry, see also Manufacturing accidents, fatal, 202
- designs, 354
- manufacturing groups, 475
- structure of the labour force, 326
- Inflation
- (Consumers price index), 565
- Information gathering, 162, 192
- Information studies, 222,
- Information technology, 73, 76, 206, 261–264, 338, 379, 434
- Infrastructure Auckland, 58
- Infringement Bureau, Police, 259
- Injuries, 191
- Inland Revenue Department, 46, 597–603
- Inmates, prison, 252–256
- Input-output analysis, national accounts, 390
- Insolvency, 520–522
- Inspector-General, Intelligence and Security, 87
- Institute for Crop & Food Research, 350
- Institute of Architects, NZ, 486
- Institute of Environmental Science and Research Ltd (ESR), 351
- Institute of Geological & Nuclear Sciences Ltd (GNS), 351
- Insurance
- ACC, 198–199
- National Provident Fund, 525
- statistics, 525–526
- Insurance and Savings Ombudsman, 524
- Intellectual Property Office of NZ, 353
- Intellectual property rights, 354, 427
- Intelligence and Security, Inspector General of, 87
- Interest rates,
- Monetary policy, Mortgages
- Inter-island shipping, 492
- Internal Affairs, Department of, 46
- Internal migration, 98
- International
- accounts, 396–404
- accreditation, 355
- agricultural policies, 408, 410
- airline services, 495–496, 497
- assets and liabilities, 402–404
- assistance, 69–72
- comparisons
- consumer prices and CPI, 575–576
- electricity prices, 458
- farming, 408
- life expectancy, 106
- motor accident deaths, 195
- OECD, employment, 332
- currency credit rating, 607
- defence relationships, 78–79
- environment issues, 370–371
- investment, 401–402
- organisations, participation, 72–76
- sport, 298, 300–301
- taxation, 601–602
- International Accreditation NZ, 355
- International Civil Aviation Organisation (ICAO), 494–495
- International investment, by country, 401–402
- International investment position (IPP), 399–400
- International Labour Organisation, 321
- International Policy Group, MAF, 410
- International Whaling Commission, 379
- Internet, 43, 128, 259, 261–264, 297, 423
- census results, 89
- Investment, international in NZ, 401
- Iron, 464
- Islands, outlying, 6
- Iwi (map), 130
J
- Japan, 553–554
- Jersey & Guernsey, 162
- Job Bank, 337
- Job Search, Student, 334
- Judges and judiciary, 236,238
- Judicial Committee of the Privy Council, 235–236
- Justice
- convictions, 242–247
- Legal Services Agency, 239–240
- restorative, 249
- sentencing, 247, 250–256
- services, youth, 165–166
- Justice, Ministry of, 46
- Justices of the Peace, 236
K
- Kaitiaki Māori, Te, 375
- Kaitohutohu Kaupapa Rawa, 49
- Kākāō, recovery plan, 358
- Kanohi ki te kanohi, 211
- Karori Wildlife Sanctuary, 358
- Kaupapa Mātauranga mō te Iwi Māori, Te, 213
- Kindergartens, 216
- Kiwibank Ltd, 581
- Kiwifruit, 430
- Knowledge Wave, 220, 346
- Knowledge research funding, 346
- Kōhanga reo, 132, 216
- Kōkiri centres, 132
- Kōkiri, Te Puni, 47, 129
- Komihana Tikanga Tangata, 139
- Kooti Whenua Māori, Te, 374
- Kura kaupapa Māori, 219
L
- La Nina, 5
- Laboratory technologists (medical), 175
- Labour cost index, 342
- Labour Day, 317
- Labour, Department of, 46–47, 313
- Labour force
- costs, 342–343
- definition, 320
- employment status, 326
- full-time, 321–322
- hours of work, 324–325
- industry structure, 326
- international organisations, 321
- occupation structure, 327–328
- OECD comparisons, 332
- participation rate, 323
- women, 322–323
- Labour market organisations, 321
- Labour Market Policy Group, 313
- Labour relations, 313–318
- Employment Relations Authority, 314
- strikes and lockouts, 318–320
- Lahars, 12
- Lakes, 7
- Lamb,
- Sheep and sheepmeat
- Land
- acquisition by overseas parties, 373–374
- area of NZ, 6
- contaminated, 369
- controls on acquisition, 373–374
- Crown-owned, 375
- local authority rating, 376
- Māori, 374–375
- recreational activities, 302–304, 376–379
- registration of ownership, 372–373
- rural sales, 373
- surveying, 372
- transport, 500–507
- use, 357, 366
- valuation, 376
- Landcorp Farming (Landcorp), 375
- Land Information NZ (LINZ), 47, 83, 371–373, 375
- Land Transport Safety Authority (LTSA), 505–507
- Landcare Research NZ, 350–351
- Landfills, 369
- Landonline, 379
- Landscape, 8–9
- Language, 119, 138,216,230
- Latin America, relations with, 67
- Latitude and longitude, 6
- Law Commission, 239
- Law enforcement, 256
- Laws, 33, 43, 151,483–484
- Layout designs, 354
- Leap seconds, 13
- Learning Media Ltd, 211
- Leave and holidays, 316–317
- Legal Deposit Office (books), 282
- Legal Services Agency, 239–240
- Legislation, 33, 119, 139, 151, 238–239, 516–517
- Legislative procedure, 30
- Leisure, 300–304
- Libraries, 222, 281–284
- Licensing
- copyright, 293
- liquor, 514
- motor vehicles, 502–504
- Life expectancy, 105–106
- Life insurance, 524
- Limestone, 465
- Limited Service Volunteer Scheme, 81
- Limits, fish catch, 442
- LINZ,
- Land Information NZ
- Liquidation of companies, 522
- Liquor,
- Alcohol
- Literature awards, 284–285
- Livestock, 412–414
- Living standards, 146
- Loans, housing, 481–482
- Local authorities
- Infrastructure Auckland, 58
- rating and valuation, 376
- special purpose, 58
- Local government, 54–59
- boundaries (maps), 56, 57
- finance, 607–608
- populations, 100–101
- sports and leisure, 300
- territorial authorities, 55
- Local Government Commission, 59
- Lockouts, 320
- Lord of the Rings, The, 291
- Loss prevention, 524
- Lotteries, 304–306
- Lottery Grants Board, NZ, 306
M
- M3 financial institutions, 584
- MAF,
- Ministry of Agriculture and Forestry
- MacDiarmid, Alan, 345
- Machinery, 540–541, 542–543
- Magazines, 271–272
- Mail services, 273–276
- Malaghan Institute of Medical Research, 172, 173
- Manatū Aorere, 46
- Mana Tohu Mātauranga o Aotearoa, 211
- Manatū Kaihokohoko, 43, 511–512
- Manatū Kaupapa Waonga, 44
- Māori
- age distribution, 125–126
- age structure, 112–113
- broadcasting, 265, 266
- claims on forests, 436
- culture, 277–278
- demography, 125–127
- electoral option, 131
- employment and training for, 337, 338
- fertility transition, 112
- fisheries and fishing, 443–445
- geographical distribution, 126
- history and society, 15–17
- iwi locations (map), 130
- land, 374–375
- language, 119, 132–134,216,230
- population, 15, 16, 112–113, 125–127
- social structure, 15
- te reo, 132–134
- tourism, 309
- treaty settlements, 128
- tribal developments, 130–132
- urban migration, 112
- Waitangi Tribunal, 127–128
- wardens, 131–132
- websites, 128
- Māori Appellate Court, 237
- Māori Congress, 131
- Māori Council, NZ, 130–131
- Māori Development, Ministry of, 47, 129
- Māori education, 210, 211, 213, 214, 230–231
- early childhood, 210,216
- kōhanga reo, 216
- language, 216, 230
- wānanga, 223
- Māori Education Trust, 213
- Māori health, 184–185
- Māori Land Court, 237, 374–375
- Māori Literature Awards, 285
- Māori population, 115, 125–127
- Māori television service, 268
- Māori Trustee, 130, 375
- Māori Women's Welfare League, 132
- Mapping, 372
- Marine
- accidents and safety, 493–494
- environment, 361–362
- pollution, 494
- reserves and parks, 379
- Maritime Safety Authority, 493–494
- Marriage, 147–150
- age at, 149, 150
- divorce, 148, 150
- legislation, 151
- Massey University, 225
- Masters (high court), 236
- Maternity services, 176
- McKinnon, Don, 75
- Meat, 414–417, 536–537
- Meat NZ, 415–416
- MED,
- Ministry of Economic Development
- Medical
- professionals, 173–175
- technologists, 174, 175
- Medicines and drugs, control of, 179
- Members of Parliament, 32–34
- Mental health, 182–183, 192
- Mental Health Foundation, 182
- Merchandise trade, balance of, 533
- Metals, 464
- Meteorology,
- Climate
- MetService, 3
- MFAT,
- Ministry of Foreign Affairs and Trade
- Middle East, relations with, 68
- Midwives, 173
- Migration
- internal, 98
- external, 108–110
- Pacific peoples, 136
- Military
- Defence
- Milk and milk products,
- Dairy industry
- Mineral fuels, 544
- Minerals, 363, 367, 463–466
- Minimum wage, 315–316
- Mining, 461–462, 463–466
- Ministers of the Crown, 36
- Ministry for Culture and Heritage, 44, 292–293
- Ministry for the Environment, 45, 368–370
- Ministry of Agriculture and Forestry, 42, 410, 411
- Ministry of Civil Defence and Emergency Management, 42–43, 199–200
- Ministry of Commerce,
- Ministry of Economic Development
- Ministry of Consumer Affairs, 43, 511–512
- Ministry of Defence, 44, 82
- Ministry of Economic Development, 45, 264, 451
- Ministry of Education, 45, 209
- Ministry of Fisheries, 45–46
- Ministry of Foreign Affairs and Trade, 46, 63, 65, 86, 364
- Ministry of Health, 169–170
- Ministry of Housing, 46, 480–481
- Ministry of Justice, 46, 244
- Ministry of Māori Development (Te Puni Kōkiri), 47, 129
- Ministry of Pacific Island Affairs, 47, 136
- Ministry of Research, Science and Technology (MoRST), 48, 345
- Ministry of Social Development, 48, 153, 154
- Ministry of Tourism, 310
- Ministry of Transport, 49
- Ministry of Women's Affairs, 49
- Ministry of Youth Affairs, 49
- MMP (mixed member proportional representation), 32
- Mobile radios, 475
- Monetary policy, 385, 587
- Money, 586–587, 589
- Monopolies, 452
- Moore, Mike, 74
- Moriori, 125
- Mortality, 105–108
- Mortgages and housing loans, 480–482
- Motor Vehicle Security Register, 504
- Motor vehicles, 144, 474–475, 501–507, 544, 577
- Mountaineering and tramping, 303
- Mountains, 7
- Movable public holidays, 316
- Movies and film
- (Censorship), 288–290
- MPs,
- Members of Parliament
- Multilateral assistance, MFAT, 72
- Museums, 85, 257, 278–279
- Music, 285–287
- Mussels, 538
- Mutual Assistance Programme, 78–79
N
- Narcotics,
- Drugs and medicines
- National accounts, 386–390
- input-output analysis, 390
- National Advisory Committee on Health and Disability, 171
- National anthems, 60
- National Certificate of Educational Achievement, 221
- National cervical screening programme, 185
- National Collective of Rape Crisis Groups, 245
- National Council of Women of NZ, 142
- National Drug Intelligence Bureau, 258
- National Drug Policy, 179
- National Energy Efficiency and Conservation Strategy, 453
- National fieldays, agricultural, 418
- National Institute of Water and Atmospheric Research Ltd (NIWA), 351
- National Library of NZ, 47, 281–283
- National net debt, 402
- National parks, list of, 378
- National Qualifications Framework, 207, 220
- National Provident Fund, 47, 525
- National Youth Orchestra, 285
- Native plants and animals, 13
- Natural disaster insurance, 523–524
- Natural gas, 460–461
- Nature reserves, 378–379
- Navy, Royal NZ, 83
- Netherlands, The, 162
- New Capital Market, 520
- New organisms, 350, 366–367
- Newspapers, 138, 271, 272
- Ngā kai o te moana kaupapa tiakina, 445
- Ngā Kaitaunaki Kōhungahunga, 209–210
- Ngā Pirihimana o Aotearoa, 48
- Ngā Pou Taunaha o Aotearoa, 373
- Ngā Taonga Kōrero, 280
- NIWA,
- National Institute of Water and Atmospheric Research Ltd
- No. 75 Squadron, 86
- No Exceptions (sports policy), 300
- Non-departmental public bodies, 49–54
- Non-resident withholding tax (NRWT), 601
- Non-wage labour costs, 343
- North Africa, relations with, 68
- North Island, 7, 56, 97, 472
- Numbers, rounding, 95
- Nurses, 173, 176
- Nuts, 539
- NZ Academy of Sport, 301–302
- NZ Aids Foundation, 181
- NZ and United Nations, 72–73
- NZ Army, 84–85
- NZ Bill of Rights Act 1990, 241
- NZ Cadet Forces, 81
- NZ Cartoon Archive, 281
- NZ Choral Federation, 286–287
- NZ coat of arms, 59
- NZ Conservation Authority, 380
- NZ Council for Educational Research, 212
- NZ Council of Social Services, 153
- NZ Council of Trade Unions (CTU), 318
- NZ Curriculum Framework, 219–220
- NZ Customs Service, 44, 491, 532–533
- NZ Dairy Board, 421
- NZ Debt Management Office, 605
- NZ Defence Force, 45, 78–86
- NZ Disability Strategy, 183
- NZ Drama School, 288
- NZ Electricity Market, 458
- NZ Film Archive, 290
- NZ Film Commission, 288
- NZ financial system, 583
- NZ Fire Service, 200
- NZ Fire Service Commission, 200
- NZ Fish and Game Council, 380
- NZ flag, 59
- First Flag of NZ, 60
- NZ gallantry and bravery awards, 26
- NZ Geographic Board, 373
- NZ Government, October 2001, 36
- NZ Health Information Service, 191–192
- NZ Historic Places Trust, 279–280, 381
- NZ Institute of Architects, 486
- NZ Institute of Economic Research, 583
- NZ Lotteries Commission, 305–306
- NZ Lottery Grants Board, 306
- NZ Māori Council, 130
- NZ Meat Board, 415
- NZ national anthems, 60
- NZ Official Development Assistance, 69–72
- NZ Olympic Committee, 298
- NZ On Air, 265
- NZ Order of Merit, 26
- NZ Parole Board, 254
- NZ Patent Office,
- Intellectual Property Office of NZ
- NZ Police, 48, 256–259
- NZ Post Ltd, 273–274, 276
- NZ Press Council, 272
- NZ Qualifications Authority (NZQA), 211
- NZ Railways, see Tranz Rail
- NZ Royal Honours System, 26
- NZ School of Dance, 288
- NZ Security Intelligence Service, 87
- NZ Society of Authors (PEN NZ), 284
- NZ Sports Foundation, 297
- NZ Standard Time, 13
- NZ Stock Exchange, 519–520
- NZ Symphony Orchestra, 285
- NZ System of National Accounts (NZSNA), 387
- NZ territories, 76–77
- NZ Tourism Strategy, 311
- NZ Tourism Industry Association, 311
- NZ Trade Development Board (Trade NZ), 531–532
- NZ Venture Investment Fund, 349
- NZ Wool Board, 418–419
- NZ, Australia Closer Economic Relations Trade Agreement, 66
- NZ Youth Orchestra, 285
O
- Obesity, 177
- Observatory, Carter, 352
- Occupational
- disease notifications, 203
- therapists, 174
- Occupational Safety and Health Service (OSH), 201–203
- Occupations, 327–328
- Offences, 242–247
- Office of Film and Literature Classification, 290–291
- Office of the Commissioner for Children, 149
- Office of the Parliamentary Commissioner for the Environment, 53, 55
- Office of the Race Relations Commissioner, 139–140
- Office of Treaty Settlements, 47, 128
- Official cash rate (OCR), 587
- Official Development Assistance, NZ, 69–72
- to non-government organisations, 71–72
- Official information, 50–51
- Oil, 362, 458–460
- Oktobor, 288
- Older people, health services, 182
- Olives, 430
- Olympics, 298
- Ombudsmen, 51, 524, 586
- ONZ,
- Order of NZ
- Open Polytechnic of NZ, 223–224, 231
- Optometrists and dispensing opticians, 174
- Oral History Centre, 282
- Oranga Poutama, He (sport development), 299
- Order of Merit, NZ, 26
- Order of NZ, 25
- Organisation for Economic Cooperation and Development, 75–76, 321, 332, 408, 410, 411
- Organochlorines, 366
- OSH,
- Occupational Safety and Health Service
- Outdoor leisure, 302–304
- Outlying islands, 6
- Overseas
- assistance, 69–72
- cargo, loaded and unloaded, 557–560
- diplomatic representation, 65
- international students, 221–222
- mail services, 274–275
- ownership of NZ land, 373–374
- reciprocal social security agreements, 162–163
- shipping lines, 491–492
- students, 221–222
- Overseas trade indexes, 560–564
- Ozone depletion, 6, 360
P
- PACER, 64
- Pacific arts, 278
- Pacific countries, relations with, 63
- Pacific Early Childhood Education, 217
- Pacific Island Affairs, Ministry of, 47, 136–137
- Pacific Islands Forum, 64
- Pacific peoples
- early childhood development, 210
- demography, 113, 134–135
- immigration, 136
- radio, 135
- Paper production, 439, 441
- Parental leave, 317
- Parents As First Teachers (PAFT), 216–217
- Parks and reserves, 376–379
- Parliament
- broadcasting of, 35
- Buildings, 480
- executive government, 35
- financial scrutiny, 593–594
- Government, October 2001, 36
- House of Representatives, 28, 32–34
- Legislative procedure, 30
- Library, 283
- members of, 32–34
- political parties in, 28, 29
- premiers and prime ministers, 34–35
- proceedings, 31
- salaries and allowances of MPs, 31, 32
- scrutiny of public finances, 593–594
- select committees, 30
- sessions, 30, 31
- Speakers, 29
- standing orders, 28
- system of, 35
- tradition, 27
- Parliamentary Commissioner for the Environment, 53, 55
- Parliamentary Library, 283
- Parliamentary Service, 30–31
- Parole, 250, 254
- Parties, political, 28, 29
- Partnerships, commercial, 515
- Part-time work, 324
- Passports and visas, 123–124
- Patents, trademarks and designs, 353–354
- PAYE (pay as you earn) income tax, 598
- Peace commitments overseas, 79–81
- Pears,
- Pipfruit
- PEN NZ Inc, 284
- Penal institutions, 252–253
- Pensions, military
- (Benefits, Superannuation), 161–162
- Performing arts, 285–288
- Petrol and petroleum, 458–460
- mineral fuels, 544
- PHARMAC, 176
- Pharmaceutical benefits, 176
- Pharmacists, 174
- Photography, aerial, 372
- Physical activity, 170
- Physiotherapists, 174
- Pigs, 422–423
- Pipfruit, 428–429
- Planning, district and regional, 365–366
- Plants, native and introduced, 13
- Plant variety rights, 427
- Plastic imports, 545
- Playcentres, 216
- Playgroups, 210
- Podiatrists, 174
- Police, 48, 256–259
- Police Complaints Authority, 256
- Police Infringement Bureau, 259
- Political parties, 28–29, 39, 40
- Pollution, 369, 494
- Polynesians,
- Pacific peoples
- Polytechnics, 223
- Population
- 1858–2001, 90
- age-sex structure, 110–111
- alternative growth scenarios, 93
- Asians, 137–139
- citizenship, 119–121
- components of change, 102–110
- country of birth, 117–118
- enumeration, 90, 96
- ethnic composition, 94–95, 112–113, 115–118
- fertility, 94, 112–113
- geographical distribution, 97–101
- growth, 89–96
- local government areas, 100–101
- longevity, 105–108
- Māori, 112–113, 125–127
- marital status of, 147–148
- measuring of, 90
- median age, 110–111
- migration, 98, 108–110, 112
- mortality, 105–108
- North and South Island regions, 97
- Pacific peoples, 113, 134–135
- projections, 91–96
- refugees, 113
- regional changes, 95
- religious affiliation, 118
- resident, 91
- urban and rural, 98–101
- urbanisation, 99
- Pork, 422–423
- Portability arrangement, superannuation, 163
- Ports (maps), 558–559
- Post Enumeration Survey, 96
- Postage, 273–276
- Pou Here Taonga, 279
- Poultry and eggs, 423–424
- Premiers and prime ministers, 34–35
- Prescription subsidies, 176
- Press Council, 272
- Press freedom, 272
- Price indexes
- capital goods price index, 579–580
- consumers price index, 565–576
- export and import price indexes, 561
- farm expenses price index, 410–411
- producers price index, 576–579
- Prices, 561, 565–580
- Primary schools, 208, 218–219
- Prime minister, 31
- Prime Minister and the Cabinet, Department of the, 48
- Prime ministers and premiers, 34–35
- Prime Television, 269
- Prisons and prison inmates, 248, 252–256
- Privacy Commissioner, 51–52
- Private training, 229
- Privy council, 235–236
- Probation Service, Community, 249
- Proceeds of crime, 253
- Producers price index, 576–579
- Promotion of science and technology, 349
- Property law, 151
- Property offences, 244
- Protected Natural Areas Programme, 380
- Psychologists, 174
- Public
- bodies, non-departmental, 49–54
- holidays, 316–317
- libraries, 281–284
- walkways, 303
- Public Advisory Committee (law), 240
- Public Advisory Committee on Disarmament, 86
- Public debt, 385
- Public finance,
- Central government finance
- Public health legislation, 177–178
- Public lands,
- Forest parks; Reserves and parks
- Public Prisons Service, 252–256
- Public service
- (Government departments), 41–42
- Public Trust Office, 48, 53
- Publishing, 230, 282, 285
- Pūkenga Aotearoa, 229, 331–336
- Pulp and paper, 439, 441
- Puni Kōkiri, Te, 47, 129
- Push Play, 302
Q
- Qualifications, school, 220–221
- Qualifications Authority, NZ, 211
- Quarantine, 439
- Queen Elizabeth II National Trust, 380
- Queen's Chain, 367
- Queen's Service Order, 26
- Quotable Value NZ, 48
R
- Race Relations Commissioner, 139–140
- Racing and betting, 304–305
- Radiation protection, 178
- Radio, 269–271
- Network of NZ Ltd, 271
- New Zealand, 270–271
- New Zealand International, 135
- Railways, 498–500
- Rainfall, 1–3
- Rape Crisis Groups, 245
- Rapuara, 229, 336–337
- Rebates (tax), 598
- Receivership of companies, 522
- Recording Industry Association of NZ (RIANZ), 286
- Recreation and sport, 297–304, 378, 379, 573
- Referenda, 36
- Refuge, Women's 165
- Refugee and Migrant Service, 124
- Refugees, 113, 116, 122, 124–125
- Regional councils, 54, 101
- Regional planning, 365–366
- Registration
- banks, 583–585
- companies, 515
- motor vehicles, 502–504
- land ownership, 373
- Rekohu, 125
- Religious affiliation of population, 118
- Removal from NZ, 125
- Republic of Ireland, 162
- Research
- agencies, 349–353
- agricultural, 350
- Antarctic, 368
- astronomy, 352
- atmospheric, 351
- crop and food 350
- Crown institutes, 349–351
- earthquake, 10
- economic, 347, 583
- energy, 456–457
- environmental, 347–348
- food, 350
- funding and investment, 346–349
- geological, 10, 351
- industrial, 351
- knowledge, 346
- landcare, 350
- medical, 172
- nuclear, 351
- snapshots, 355
- social, 348
- universities, 349
- water, 351
- Research, Science and Technology, Foundation for (FRST), 348
- Research, Science and Technology, Ministry of (MoRST), 48, 345
- Reserve Bank of NZ, 385–386, 581–582
- Reserves and parks, 378–379
- Resident population, 91
- Resident taxation, 598–601
- Residual Health Management Unit, 171
- Resource management, 362, 364–369
- Restorative justice, 249
- Retail prices, CPI, 574–575
- Retail trade and services
- credit sales, 529
- shop trading hours, 513
- trade survey, 526
- Retirement Commission, 154
- Revenue, government, 603–604
- RIANZ,
- Recording Industry Association of New Zealand
- Rights of the Child, UN Convention on the, 139
- Rivers, 7, 368
- Road Safety Trust, 502
- Roads, generally, 500–507
- accidents and deaths, 193–195
- offences on, 246
- safety, 194, 502, 505–507
- taxation for, 599, 600
- Transfund NZ, 500
- Transit NZ, 501
- Rock types, 8
- Roopu Wahine Māori Toko i Te Ora, Te, (Māori Women's Welfare League), 132
- Ross Dependency, 77
- Rounding of numbers, 95
- Royal Forest and Bird Protection Society, 369
- Royal honours, 26
- Royal NZ Air Force (RNZAF), 85–86
- Royal NZ Ballet, 287
- Royal NZ Navy (RNZN), 83–84
- Royal Society of NZ, 348
- Ruapehu, 11–12
- Rural Education Activities Programme (REAP), 222
- Russia, relations with, 68
S
- Safety
- belts, 506
- fire, 200–201
- food, 181–182
- marine, 493–494
- occupational, 201–203
- rail, 499
- road, 194, 505–507
- water, 195–196
- Sailing, 310
- Salaries,
- Income
- Sale of liquor, 513–514
- Sales, retail, 526–529
- Salt, 465
- Saving, household, 393
- Savings Ombudsman, Insurance and, 524
- School Certificate, 220–221
- School Dental Service, 187
- Schools
- boards of trustees, 213
- choice, 218–219
- compulsory schooling, 214–215
- curriculum, 206–207
- funding, 214–215
- home-based schooling, 219
- independent, 219
- information technology, 205–206
- integrated, 219
- kura kaupapa Māori, 219
- leavers, 222
- levels of, 218
- national qualifications, 220–221
- primary and secondary, 208, 218–223
- property, 215
- student numbers, 232
- teaching staff, 215
- The Correspondence School, 219
- transport, 215
- Science and scientific services
- (Research)
- Carter Observatory, 352
- Cawthron Institute, 352
- Crown research institutes, 349–351
- funding, 346, 348–349
- government agencies, 345
- research associations, 353
- universities and polytechnics, 352–353
- Science and technology, promotion of, 349
- Seafarer qualifications, 493
- Seafood
- (Fishing; Fisheries), exports and imports, 446–447, 538–539
- Seafood Industry Council, 447–448
- Seaports, 558–559
- Search and rescue, 82, 257
- Seasonal adjustment of retail sales, 527–528
- Seatbelts, 506
- Secondary schools, 208, 218–223
- Secondary Tertiary Alignment Resource (STAR), 336
- Securities, government, 588
- Securities Commission, 518–519
- Security Intelligence Service, NZ (NZSIS), 87
- Seismic activity, 8–11
- Select committees, 46th Parliament, 30
- Senior citizens,
- Older people
- Sentencing, 247–248, 250–256
- Serious Fraud Office, 48, 517–518
- Sex/gender
- age of population, 110–111
- census, 110–111
- equal pay, 318
- income differences, 340–341
- tertiary enrolments and graduates, 224
- work, 322–328
- income, 338–340
- Sex offences, 243
- Sharemarket,
- Stock Exchange
- Sheep and sheepmeat, 412–413, 417, 418–119
- Shipping and ships, 445, 491–194
- Shooting and hunting, 302
- Shop trading hours, 513
- Sickness benefit,
- Benefits and pensions
- SIS,
- NZ Security Intelligence Service
- Skiing, 302
- Skill Enhancement, 334
- Skill New Zealand, 229, 331–336
- SKY Television, 269
- Sleep survey, 174
- Smoking, tobacco, 180–181
- Snowboarding, 302
- Social Development, Ministry of, 48
- Social policy, 154
- Social research funding, 348
- Social security agreements, 162–163
- Social services, 153–158, 167
- Citizens Advice Bureau (CAB), 164
- Social welfare, 153–168
- Society of Authors, NZ (PEN NZ), 284
- SOI,
- Southern Oscillation Index
- Soil, 8, 9, 357, 363
- Solar energy, 463
- Solicitor-General,
- Crown Law Office
- Solicitors, duty, 240
- Sound Archives (Ngā Taonga Kōrero), 280
- Southern Ocean Whale Sanctuary, 379
- Southern Oscillation Index (SOI), 5
- South Island, 6–7, 57, 97, 473
- South Pacific, 63–65, 70–72, 371
- South Pacific Regional Trade and Economic Cooperation Agreement, 64
- Sovereigns of NZ, 25
- SPARTECA,
- South Pacific Regional Trade and Economic Cooperation Agreement
- Speakers of the House of Representatives, 29
- Special education, 210
- Special portability arrangement (benefits), 163
- Special purpose local authorities, 58
- Specialist courts, 237–238
- Species, native and introduced, 13
- Speed limits, 507
- Sport,
- funding, 297–300
- junior, 299
- NZ Academy of, 301
- Olympic Games, 298
- people with disabilities, 300
- popular, 301
- technology, 300
- Sport, Fitness and Leisure, Hillary Commission for, 297–300
- Sport and Recreation NZ, 298
- SportsMark, 300
- Stamps, postage, 275
- Standard of living indicators, 146
- Standard Time, NZ, 13
- Standards NZ, 356
- Standing orders, House of Representatives, 28
- State forest parks, 378
- State Services Commission, 40–42, 48
- State-owned enterprises, 49
- Statistics New Zealand, 48–49
- Statutes, 33, 43, 238
- Stock Exchange, 519–521
- Stock feed, 426
- Stoppages (work), 318–320
- Student Job Search, 334
- Student loans, 227, 602
- Students
- allowances, 227
- assessment of, 218
- international, 221–222
- loans, 227, 602
- Māori, 214
- numbers enrolled, 232–233
- school leavers, 222
- support, 227
- tertiary, 223–229
- StudyLink, 227
- Sub-Saharan Africa, relations with, 68–69
- Subordinate legislation, 239
- Subsidies, health, 175–177
- Sudden Infant Death Syndrome (SIDS), 188
- Suicide, 142, 183, Sunshine, 2, 3
- Superannuation, 160–163, 525
- Superconductive ceramics, 457
- Supervision, probationary, 250
- Survey Board of NZ, 372
- Surveying,
- (Land Information NZ), 372–373
- Sustainable development and management, 364
- Silvia Cartwright, Dame, 26
- Symphony Orchestra, NZ (NZSO), 285
T
- TAB,
- Totalisator Agency Board
- Tait Electronics, 475
- Takahē, 359
- Takeovers Panel, 518
- Tangiwai disaster, 500
- Tariffs, 469–471, 532
- Taupo volcanic zone, 11
- Taxation review authorities, 605
- Taxes and taxation, generally
- individuals, 598
- review authorities, 605
- toll roads, 599
- social assistance, 602
- Taxi industry, 507
- Teacher Registration Board, 211–212
- Teachers and teaching
- (Education), 228
- Technology,
- and globalisation, 76
- closed-circuit television, 254
- courier services, 506
- courts, use in, 237
- crime data, 244, 246, 259
- employment opportunities, 337
- land information, 379
- sports telecast, 471
- stockmarket, 519
- UN policy making, 73
- Te Hakituatahi o Aotearoa, 60
- Te Kaitiaki Māori, 375
- Te Kaunihera Māori, 130–131
- Te Kaupapa Mātauranga mō te Iwi Māori, 213
- Te kōhanga reo, 216
- Te Komihana O ngā Tari Kāwanatanga, 48
- Te Komihana Tirotiro Aitua Waka, 499
- Telarc Ltd, 354–355
- Telecom Corporation of NZ Ltd, 268
- Telecommunications, 266–268
- Telecommunications Users' Association of New Zealand (TUANZ), 264
- Television, 268–269
- Television New Zealand Ltd, 268
- TelstraClear, 268
- Te Manatū Ahuwhenua, Ngaherehere, 42, 410, 411
- Te Manatū mō te Taiao, 45
- Te Manatū Pūtaiao, 48
- Te Manatū Taonga, 44
- Te Manatū Ture, 46
- Te Manatū Waka, 49
- Temperatures,
- (Weather; Climate change), 2–3
- Te Minitatanga mō ngā Wāhine, 49
- Te Ohu Kai Moana, 444, 445
- Te Ope Kaatua O Aotearoa, 45
- Te Papa Atawhai, 43
- Te Papa Tongarewa (Museum of NZ), 278, 279
- Te Poari Kairēhita Kaiako, 211
- Te Pou Taki Kōrero, 211
- Te Puna Mātauranga o Aotearoa, 47, 281
- Te Puna Whaiora, 186
- Te Puni Kōkiri, 47
- Te Rākau Whakamarumaru, 42, 199–200
- Terms of trade indexes, 561
- Te reo Māori, 119, 132–134, 216, 230
- Te Reo Whakapuaki Irirangi, 265
- Te Roopu Wahine Māori Toko 1 Te Ora, 132
- Territorial authorities, 55
- Territories, NZ, 76–77
- Tertiary Education Advisory Commission (TEAC), 208
- Te Rūnanga o Aotearoa mō te Rangahau i te Mātauranga, 212
- Te Tāhuhu o te Mātauranga, 45, 209
- Te Tari Arotake Mātauranga, 45, 211
- Te Tari Āwhina I te Tamati, tae atu ki te Whānau, 42, 163–167
- Te Tari Hara Tāwere, 48, 517–518
- Te Tari Kooti, 44
- Te Tari Mahi, 46, 313, 320–321
- Te Tari Taake, 46
- Te Tari Taiohi, 49
- Te Tari Taiwhenua, 46
- Te Tari Tatau, 48
- Te Tautiaki i ngā tini a Tangaroa, 45
- Te Tiriti O Waitangi, 19,25, 127
- Te Tomokanga, 336
- Te Whakakotahitanga o ngā iwi o Aotearoa, 131
- Textiles, 471
- The Correspondence School, 219
- The Open Polytechnic, 223–225, 231
- Timber, 437–441, 537–538
- Time, 13
- Time Use Survey, 141, 148
- Tobacco, 180–181, 572
- Tokelau, 76
- Toll roads, 599
- Topdressing, 412
- Topography, 372
- Totalisator Agency Board (TAB), 269, 304–305
- Tourism, 306–311
- accommodation, 307
- and environment, 310, 364
- effects of, 310, 364
- international, 307
- Māori, 309
- organisations, 310–311
- transport, 308, 310
- visitor expenditure, 308
- Tourism Industry Association, 311
- Tourism, Ministry of, 310
- Tourism New Zealand, 307, 310
- Tourism Strategy Group, 311
- Tractor registrations, 503
- Trade
- domestic,
- Retail trade and services
- PACER, 64
- Pacific region, 64
- services overseas, 532
- Trade and Economic Cooperation Agreement (Canada), 67
- Trade NZ, 531–532
- Trade weighted index (TWI), 590
- Trade marks, 354
- Traditional sites, protection of, 279–280
- Traffic, 193–195, 246, 507
- accidents, 193–195
- offences, 246, 507
- Training Opportunities programme, 333
- Tramping, 303
- Transfund NZ, 500
- Transit NZ, 501
- Transport
- and storage, 490
- CPI, 571
- household, 144
- tourist, 308, 310
- work-related, 505
- Transport Accident Investigation Commission, 499
- Transport safety,
- Land Transport Safety Authority
- Transport, Ministry of, 49
- Travel, 308, 491
- Treasury, The, 49
- Treaty of Waitangi, 19, 25, 127
- Fisheries Commission, 444
- Treaty Settlements, Office of, 47, 127, 128
- Tribal developments, Māori, 130–132
- Tribunals, 238
- Waitangi, 127–128, 238
- TUANZ,
- Telecommunications Users' Association of NZ
- Turnbull Library, 282
- TV3, 268
U
- UN,
- United Nations
- UN Commission on Sustainable Development, 361
- UN Framework Convention on Climate Change, 370–371
- UNCED (United Nations Conference on Environment and Development), 370
- Unemployment
- benefits,
- Benefits and pensions
- Unions, 314
- Unitary authorities, 58
- United Kingdom, 162, 238–239, 555
- United Nations, 72–73, 79–81, 139, 259, 364
- United States, 67
- Universal Postal Union (UPU), 274
- Universities, 223, 224
- continuing education, 230
- degrees completed, 205
- funding, 215, 349
- research, 352–353
- Urbanisation, 98–99
V
- Valuation of land, 376
- Valuer General,
- Quotable Value NZ
- Vegetables, 426–427
- Vegetation, 13
- Vehicles,
- Motor vehicles
- Vehicle Testing NZ, Ltd, 502
- Vice-regal representatives, 27
- Victim Support, 247–248
- Violent offences, convictions for, 243–244
- Visitors, overseas, 308–309
- Vital statistics, 107
- Vocational qualifications, 225–227
- Volcanoes, 11–12
- Volume indexes of overseas trade, 563–564
- Voluntary welfare organisations, 182
- Voting,
- elections
W
- Wages,
- Income
- Wahine storm, 492
- Waitangi, Treaty of, 19, 25, 127
- Waitangi Tribunal, 127–128, 238
- Walking, leisure, 303
- Wānanga, 223
- Wardens, Māori, 131–132
- War pensions, 161–162
- Waste and landfills, 369
- Water
- accidents, 195–196
- drinking, 178
- fluoridation, 188
- management, 367
- pollution, 369
- quality, 361, 367
- Queen's Chain, 367
- resources, 367–368
- Weather
- 2001, 5
- 2000, 6
- Weights and measures, 512
- Western Europe, relations with, 67–68
- Whale sanctuaries (map), 379
- Whiriwhiria, 154
- Wildlife, 13
- Wind, 1,3
- energy generation, 452, 463
- Wine, 428, 471
- Women
- employment, 322–324
- health of, 185–186
- in government, 29, 31, 37
- National Advisory Council on Employment of, 323
- National Council of, 142
- ratio of population, 110–111
- rights issues, 140–141
- work, 322–324
- Women's Affairs, Ministry of, 49
- Women's Refuge movement, 165
- Women's Welfare League, Māori, 132
- Wood
- (Forestry products; Timber), 434
- Wool, 418–419
- Wool Board, NZ, 418
- Work
- full-time and part-time, 323–325
- stoppages, 318–320
- travel to, 505
- Work and Income, 337
- Working holidays, 124
- World Bank, 75
- World Customs Organisation, 532
- World heritage areas, 377
- World Wide Web,
- Internet
- Writers, 284
Y
- Yachting (America's Cup), 310
- Youth
- aid, 258
- care and protection, 163–165
- courts, 237
- education service, 258
- justice services, 165–166
- rights issues, 141
- suicide, 142, 183
- training, 229, 333–334
- Youth Affairs, Ministry of, 49, 141
- Youth aid (police), 258
- Youth Development Strategy Aotearoa, 141
- Youth Education Service (police), 258
- Youth Orchestra, National, 285
- Youth Service Corps, 141
All the statistics in this volume are in metric (SI) units, except for ship tonnages (not cargo).
| Metric To Imperial | Metric Multiples | ||
|---|---|---|---|
| Length | |||
| 1 millimetre (mm) | = 0.04 inches (in.) | 1 centimetre (cm) | = 10 millimetres (mm) |
| 1 centimetre (cm) | = 0.39 inches (in.) | 1 metre (m) | = 100 centimetres (cm) |
| 1 metre (m) | =39.37 inches (in.) | 1 metre (m) | = 1 000 metres (m) |
| = 1.09 yards (yds) | |||
| 1 kilometre (km) | = 0.62 miles | ||
| Area | |||
| 1 square metre (m2) | = 10.76 square feet (sq. ft.) | 1 hectare (ha) | = 10 000 square metres (m2) |
| = 1.20 square yards (sq. yd) | 1 square kilometre (km2) | = 100 hectares (ha) | |
| 1 hectare (ha) | 2.47 acres | ||
| 1 square kilometre (km2) | = 247 acres | ||
| = 0.39 square miles | |||
| Volume and capacity | |||
| 1 cubic centimetre (cm3 | = 0.06 cubic inches (cu.in.) | 1 cubic metre (m3) | = million cubic centimetres (cc) |
| 1. cubic metre (m3) | = 35.31 cubic feet (cu. ft.) | 1 litre (l) | = 10 000 000 cubic |
| = 1.31 cubic yards | = 1 millimetres (ml) | 1 cubic centimeter (cc) | |
| 1 litre (l) | = 1.76 pints | 1 cubic metre (cm3) | = 1 000 litres (l) |
| = 0.22 gallons | |||
| Mass (weight) | |||
| 1 gram (g) | 0.04 ounces (oz) | ||
| 1 kilogram (kg) | = 2.20 pounds (lb) | 1 kilogram (kg) | = 1 000 gram (g) |
| 1 tonne (t) | = 2 204.62 pounds (lb) | 1 tonne (t) | = 1 000 kilograms (kg) |
| = 0.98 tons | |||
| Velocity | |||
| 1 kilometre per hour (km/h) | |||
| Pressure | |||
| 1 kilopascal (kPa) | = 0.15 pounds per square inch (psi) | 1 megapascal (MPa) | = 1 000 kilopascals (kPa) |
| 1 megapascal (MPa) | = 0.06 tons per square inch (tons psi) | ||
Temperature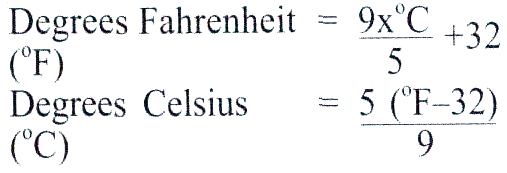 | |||
| Energy | |||
| 1 kilojoule (kJ) | = 0.95 British thermal units (Btu) | 1 megajoule (MJ) | 1 000 kilojoules (kJ) |
| 0.24 calories (cal) | 1 kilowatt hou(kWh) | = 3.6 megajoules (MJ) | |
| 1 gigajoule (GJ) | = 1 000 megajoules (MJ) | ||
| 1 terajoule (TJ) | = 1 000 gigajoules (GJ) | ||
| 1 petajoule (PJ) | = 1 million gigajoules (GJ) | ||
| Power | |||
| 1 kilowatt (kW) | = 1.34 UK horsepower | 1 kilowatt (kW) | = 1 000 watts |
| 1 megawatt (MW) | = 1 000 kilowatts (kW) | ||
| 1 gigawatt (GW) | = 1 000 megawatts (MW) | ||