
Acknowledgements
This publication was produced in the Information Services Division of the Department of Statistics.
Deputy Government Statistician: L. W. Cook.
Manager: K. W. Eddy.
Editor: R. W. White.
Assistant editors: J. H. Macdonald; E. Stone; I. R. Malcolm.
Maps and diagrams: P. J. McGrath; M. A. Metcalfe.
Cover design: A. J. Stewart.
Photograph editor: A. J. McCredie.
Proofreading: J. W. Hunt; M. S. Page.
Cover
Rita Angus, Sheds, Hawke's Bay 1965–66,
oil on hardboard 585 X 600 mm.
Private collection, Auckland.
Rita Angus (1908–70) was a New Zealand painter who tried through her landscapes to capture the distinctive colour and hard light of New Zealand.
NEW ZEALAND OFFICIAL YEARBOOK
CAT. NO. 01.001
ISSN 0078-0170
RECOMMENDED RETAIL PRICE $49.50
(INCL. GST)
Table of Contents
List of Tables
- 1.2. PRINCIPAL MOUNTAINS
- 1.3. PRINCIPAL RIVERS*
- 1.4. PRINCIPAL LAKES*
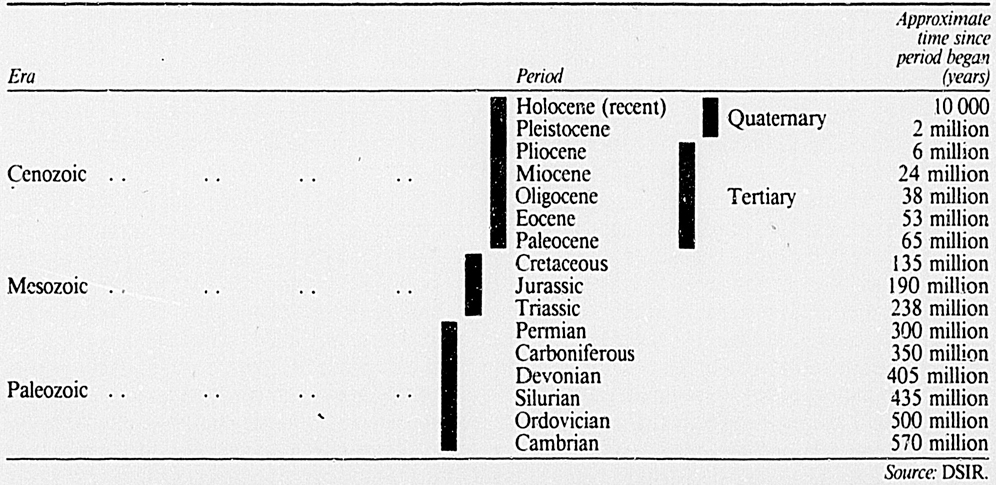
- 1.5. GEOLOGICAL TIMESCALE
- 4.2. DEFENCE EXPENDITURE
- 4.5. STATE OF THE NAVY
- 4.6. STRENGTH OF THE NAVY
- 4.7. STATE OF THE ARMY
- 4.8. STRENGTH OF THE ARMY
- 4.9. STATE OF THE RNZAF
- 5.2. POPULATION CHANGE
- 5.10. POPULATION OF CITIES
- 5.11. POPULATION OF BOROUGHS
- 5.12. POPULATION OF COUNTIES
- 5.13. POPULATION OF DISTRICTS
- 5.15. ARRIVALS IN NEW ZEALAND
- 5.20. BIRTHS
- 5.21. SEX OF CHILDREN BORN
- 5.26. EX-NUPTIAL BIRTHS
- 5.28. ADOPTIONS
- 5.29. STILLBIRTHS
- 5.32. DEATH RATES
- 5.33. AVERAGE AGE AT DEATH*
- 5.34. LIFE EXPECTANCY
- 6.2. TYPES OF DWELLINGS
- 6.9. HOUSEHOLD TRANSPORT
- 6.13. HOUSEHOLD AMENITIES
- 6.15. MARRIAGE RATES
- 6.18. DE FACTO RELATIONSHIPS*
- 6.24. CUSTODY ORDERS, 1986
- 6.26. RELIGIOUS PROFESSIONS*
- 6.42. TYPES OF SUBMISSIONS
- 7.23. CHILDREN AND YOUNG PERSONS UNDER THE CONTROL OF THE SOCIAL WELFARE
DEPARTMENT, 30 NOVEMBER 1986
- 8.16. PRIVATE HOSPITAL BEDS*
- 8.17. STAFF EMPLOYED BY HOSPITAL BOARDS AND IN HOSPITALS UNDER THE CONTROL
OF THE DEPARTMENT OF HEALTH
- 8.18. HOSPITAL BOARD BORROWING
- 8.24. PSYCHIATRIC AND INTELLECTUALLY HANDICAPPED PATIENTS: NUMBERS AND RATES
(PER 100 000 MEAN POPULATION)
- 8.35. DROWNINGS, 1987 P
- 9.7. PRIMARY SCHOOLS
- 9.9. SECONDARY SCHOOLS
- 9.10. STUDENT NUMBERS
- 9.11. TEACHING STAFF
- 9.19. UNIVERSITY STAFF, 1987*
- 9.20. UNIVERSITY STUDENTS
- 10.7. CRIMINAL TRIALS
- 10.10. APPEALS IN HIGH COURT AGAINST CONVICTIONS OR ORDERS AND/OR SENTENCES
IMPOSED IN DISTRICT COURTS
- 10.14. PENAL INSTITUTIONS*
- 11.4. MEDIA ADVERTISING, 1987*
- 11.7. RACE MEETINGS*
- 11.12. DOMESTIC TRAVEL DESTINATIONS
- 12.1. THE LABOUR FORCE*
- 12.3. HOURS OF WORK*
- 12.10. UNEMPLOYMENT 1951–86*
- 12.15. WEEKLY EARNINGS
- 12.19. PROFILE OF WORKERS' UNIONS
- 14.13. LAND USE TODAY
- 15.8. FERTILISER APPLICATION
- 15.12. FARMING INPUTS PRICE INDEX*
- 15.15. SHEEP CATEGORIES
- 15.16. SIZE OF SHEEP FLOCKS
- 15.17. CATTLE CATEGORIES
- 15.18. MEAT PRODUCTION
- 15.20. MEAT EXPORT PRODUCTION
- 15.21. MEAT BOARD LEVIES, 1987
- 15.22. LAMB GRADES
- 15.23. BEEF GRADING SYMBOLS
- 15.24. LONDON WHOLESALE IAMB PRICES
- 15.26. WOOL PRODUCTION*
- 15.27. WOOL SOLD AT AUCTION
- 15.32. DAIRY FACTORY PRODUCTION
- 15.33. TOWN MILK
- 15.34. DAIRY EXPORT EARNINGS
- 15.37. PIGS
- 15.38. POULTRY FLOCKS*
- 15.41. GRAIN AND PEAS, 1986*
- 15.42. AREAS PLANTED IN FRUIT
- 15.43. WINE STOCKS
- 15.44. WINE PRODUCTION AND SALES
- 16.5. ROUNDWOOD PRODUCTION
- 16.12. VOLUME OF TIMBER IMPORTS
- 16.13. VOLUME OF TIMBER EXPORTS
- 16.17. FISHERIES EXPORTS
- 17.9. ELECTRICITY SOURCES
- 17.11. ELECTRICITY MARKETS
- 17.12. POWER STATIONS 1987
- 17.14. NATURAL GAS SUPPLY
- 17.15. MINE AND QUARRY PRODUCTION
- 19.1. RESIDENTIAL PRICES
- 19.13. PERMITS FOR NEW DWELLINGS
- 19.14. WORK PUT IN PLACE
- 19.14a. WORK PUT IN PLACE
- 19.15. BUILDING MATERIAL PRODUCTION
- 20.17. SUMMARY OF AERIAL WORK
- 20.21. PUBLIC ROADING EXPENDITURE*
- 20.23. LICENSED MOTOR VEHICLES
- 20.28. TRAFFIC OFFENCES REPORTED*
- 20.31. OVERSEAS MAILS
- 20.33. TELEPHONE SERVICES
- 21.1. COMPANY REGISTRATIONS
- 21.2. BANKRUPTCIES
- 21.3. OCCUPATIONS OF BANKRUPTS
- 21.5. COMPANY INSOLVENCIES
- 21.21. RETAIL TRADE SURVEY: SALES*
- 21.22. RETAIL TRADE SURVEY: STOCKS
- 21.24. HIRE-PURCHASE SURVEY*
- 21.25. VALUE OF CREDIT CARD SALES
- 22.3. TRADE WITH AUSTRALIA
- 22.8. EXPORT PRICE INDEX*
- 22.9. EXPORT PRICE INDEX*
- 22.10. IMPORT PRICE INDEX*
- 22.13. EXPORT VOLUME INDEX*
- 22.14. IMPORT VOLUME INDEX*
- 23.1. PRICE INDEXES SUMMARY*
- 24.7. FOREIGN EXCHANGE RATES*
- 25.10. RATES OF STAMP DUTY
- 25.11. RATES OF GIFT DUTY*
- 25.12. SUMMARY OF TAX REVENUE
- 25.13. RECEIPTS OF TAXATION
- 25.15. INCOME OF COMPANIES
- 25.19. INTEREST PAYMENTS
- 26.7. CAPITAL FINANCE
- 26.8. EXTERNAL TRANSACTIONS
- 26.12. INCREASE IN STOCKS
Table of Contents
The 93rd edition of the New Zealand Official Yearbook continues our tradition of providing an authoritative description of a country and its people in one volume.
Since 1893 the Yearbook has given New Zealand and overseas readers an Introduction to the nation's social, economic and cultural life and institutions. For specialist users, it is designed as a first point of reference, with relevant basic statistics and reference material, as well as directions to further sources of information.
Compilation of this edition of the Yearbook has gone on amid sweeping reforms in many areas of the New Zealand society and economy. The editors have made every effort to keep information on institutions and legislation current, with a cut-off date of September 1988. However, some statistical series are slower to reflect change, and there may be some minor inconsistencies between the text and tabular material.
Revision of the structure and presentation of the Yearbook has continued. Several chapters have been substantially revised and many subject areas have been augmented. The number and variety of graphics has also increased.
There is a strong focus on social issues; with special articles on the Maori language, immigration policy, and the Royal Commission on Social Policy (which reported during 1988).
This is the last edition of the Yearbook produced in the current format. Major changes are now being planned, both to further upgrade the publication, and to reflect New Zealand's 1990 celebrations.
The Department of Statistics can only publish the Yearbook with the help of contributions from many other government departments and official organisations. I would like to again thank all contributors, the Government Printing Office, and departmental editorial staff for their efforts.
S. Kuzmicich,Government StatisticianOctober 1988.
| 70 Symonds Street | Private Bag |
| AUCKLAND | Telephone (09) 31-055 |
| Aorangi House | PO Box 2922 |
| 85 Molesworth Street | Telephone (04) 729-119 |
| WELLINGTON | |
| MFL Building | Private Bag |
| 749 Colombo Street | Telephone (03) 793-700 |
| CHRISTCHURCH | |
| or | |
| Census of Population and Dwellings | Private Bag |
| Winchester House | Telephone (03) 791–716 |
| 64 Kilmore Street | |
| CHRISTCHURCH | |
| Norwich Union Building | Private Bag |
| Corner Bond and Rattray Streets | Telephone (024) 777-511 |
| DUNEDIN |
The Department of Statistics has an information desk at every office. In answer to a letter, visit, or telephone call, information officers can provide statistical information, or tell you more about the department's other services, including access to statistics on the INFOS computer data base.
Table of Contents
As a new reader of the New Zealand Official Yearbook you may be surprised at the range of information within its pages. But, like any other reference work, the Yearbook is only as effective as its information is accessible. The following notes are therefore included to familiarise you with the book.
During its long history the aims and functions of the New Zealand Official Yearbook have changed with the times. Today, its editors publish with two main purposes in mind. Firstly, it is a compendium of facts and figures on New Zealand. Secondly, it is an annual describing major changes in New Zealand's administrative framework for the year preceding publication.
The Yearbook does not usually contain the latest or most detailed statistics on particular topics, but it does tell its readers where the latest, or more detailed, figures or information are available.
There are two likely ways you will look for information.
If your question is general, for example “How is New Zealand governed?”, then you will probably refer firstly to the table of contents (beginning overleaf) which lists not only chapter headings but major sections within chapters. In approaching the book this way it is worth bearing in mind that the 26 chapters follow a ‘logical’ progression. The first few chapters describe the physical setting as well as New Zealand's history, system of government and international relations. A description of its people comes next, followed by social framework and institutions. Chapters 12–21 describe New Zealand's work-force and industries, while the final chapters of the book discuss the nation in broad economic terms.
Throughout the book cross references are made, usually by reference to numbered sections within chapters (which appear at the head of each right hand page).
If, on the other hand, your question is more specific, for example “How many people drown while boating each year?”, then the book is thoroughly indexed, and a brief note on the system used can be found at the beginning of the index.
Because the Yearbook covers such a broad range of subjects, few of its statistics are being published for the first time. Many statistics from government departments and other organisations have been published late in the year preceding publication.
For this edition the figures published are at least the latest available at 1 January 1988.
If the source of a particular table is other than the Department of Statistics, then it is noted at the base of the table. Tables are usually for the year ended 31 March, or for the calendar year. Most tables indicate the months in which the years end, and where a single year is indicated and no month is mentioned the figures can be assumed to be for the calendar year. Where two years are given together, e.g., 1986–87, and no month is mentioned, it can be assumed the figures are for the year ended 31 March.
The following symbols are used in all the tables:
Figures are often rounded-off to the nearest thousand or some convenient unit. Sometimes this rounding results in tables with totals which disagree slightly with the total of the individual items shown.
Statistics from the 1981 and 1986 Censuses of Population and Dwellings have been subject to a process of random rounding, whereby all cell values, including row and column totals, have been rounded. Individual figures will therefore not necessarily add up to the stated totals.
Weights and measures, and a glossary of statistical terms used, are given at the back of the book.
If you require general information on a topic, the ‘Further information’ section at the end of each chapter provides a brief list of official publications relevant to that chapter. The bibliography, Books about New Zealand, lists current books on New Zealand under subject headings. It is followed by a list of some of the publications of the Department of Statistics.
Contributing organisations are also listed in the order of appearance at the end of each chapter.
Major changes are planned for the next edition of the Yearbook, which will appear in 1990. The new book will be slimmer and reflect the celebrations in that year.
Your suggestions for the contents of it and subsequent Yearbooks are welcome. Send them to the Editor, New Zealand Official Yearbook, Department of Statistics, PO Box 2922, Wellington.
Maps and diagrams
| Location of earthquakes and volcanic activity | 8 |
| 1987 Electoral districts—North Island | 71 |
| 1987 Electoral districts—South Island | 72 |
| Age pyramid of population by sex 1971 and 1987 | 141 |
| Migration patterns between local government regions, 1976–81 | 144 |
| Rate of change in total population 1981–86 | 147 |
| External migration—excluding through passengers and crew | 156 |
| Vital statistics | 162 |
| Age of population—historical and projected | 165 |
| Percentage of workforce employed in community, social and personal services | 176 |
| Net population change—through permanent and long-term migration | 196 |
| Percentage of population other than European and Maori | 199 |
| Maori population | 209 |
| Maori tribal locations | 215 |
| Royal Commission on Social Policy—subject areas covered by submissions | 235 |
| Enrolment growth—up to secondary level | 351 |
| Teacher-pupil ratio in state schools | 354 |
| University degrees awarded—selected years, 1967–87 | 360 |
| Percentage of bachelor (incl. honours) degrees awarded to women in selected fields, 1977 and 1987 | 363 |
| Enrolment growth—tertiary | 366 |
| Hierarchy of courts | 375 |
| Labour force—historical and projected by working-age and sex | 433 |
| Unemployment—registered unemployed including vacation workers | 443 |
| Real disposable income indexes—full-time wage and salary earners | 450 |
| Work stoppages—all industries | 460 |
| Reallocation of public lands, 1987 | 496 |
| Percentage of workforce employed in agricultural contracting, hunting, forestry and fishing | 521 |
| Meat production—bone-in basis | 533 |
| Sawn timber production | 561 |
| Pulp and paper industry | 565 |
| Percentage of workforce employed in electricity, gas and water industry | 581 |
| Electricity generation | 587 |
| Coalfields | 593 |
| Metal, mining and prospecting; past and present | 595 |
| Non-metallic minerals | 597 |
| Percentage of workforce employed in mining and quarrying | 599 |
| Percentage of workforce employed in manufacturing | 608 |
| Building permits—new dwellings | 632 |
| Percentage of workforce employed in building and construction | 634 |
| Percentage of workforce employed in transport, storage and communication | 640 |
| Domestic air travel—passenger volumes, 1987 | 651 |
| Share prices—New Zealand Stock Exchange Gross Index | 687 |
| Retail trade | 701 |
| Percentage of workforce employed in financing, insurance and real estate | 702 |
| Percentage of workforce employed in wholesale/retail trade, restaurants and hotels | 705 |
| Volume of exports | 723 |
| Trans-Tasman trade balance | 726 |
| Consumers Price Index—all groups annual average | 745 |
| Consumers Price Index—percentage change by quarter | 747 |
| Key market rates—monthly averages | 769 |
| Trade weighted exchange rate index | 771 |
| Overseas debt—to selected countries | 795 |
| Index of total GDP—at constant prices | 820 |
Table of Contents
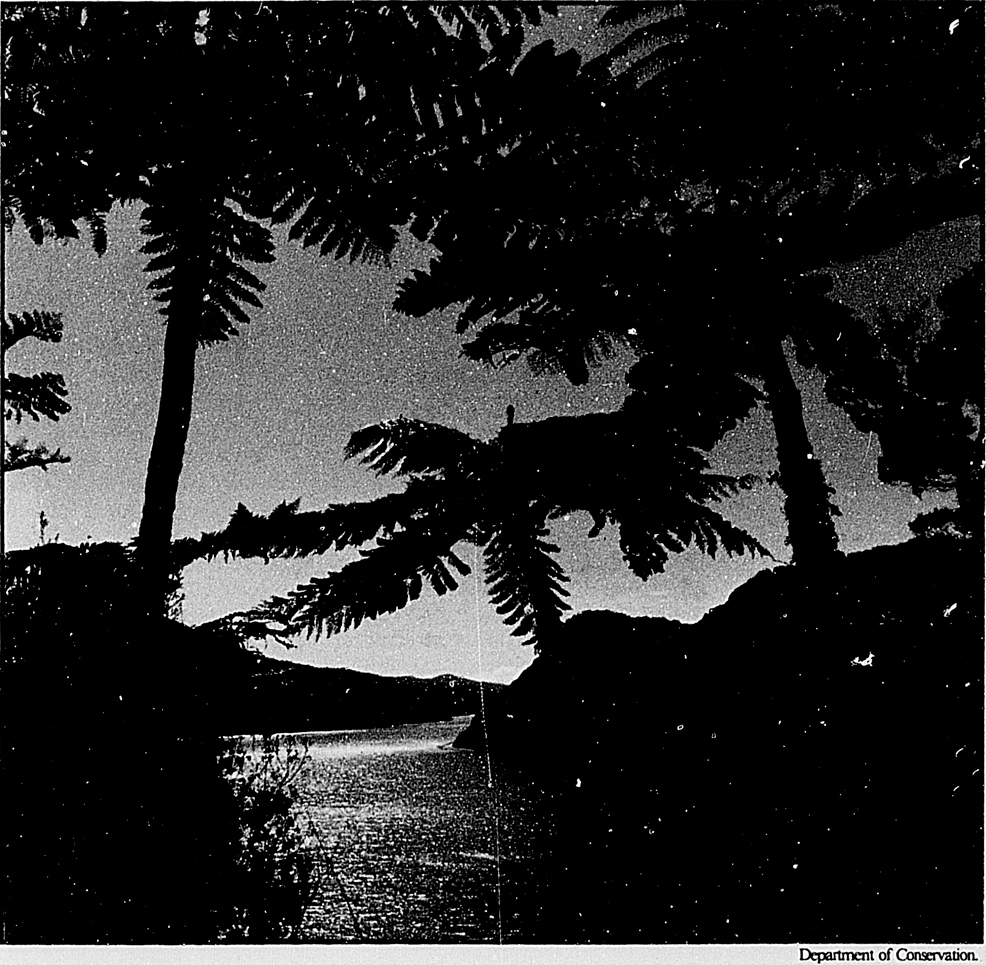
Marlborough Sounds.
New Zealand lies in the south-west Pacific Ocean and consists of two main, and a number of smaller islands, whose combined area of 268 000 square kilometres is similar to the size of Japan or the British Isles.
The main North and South Islands are separated by Cook Strait, which is relatively narrow. They lie on an axis running from north-east to south-west, except for the low-lying Northland peninsula. The administrative boundaries of New Zealand extend from 33 degrees to 53 degrees south latitude, and from 162 degrees east to 173 degrees west longitude. In addition to the main and nearby islands, New Zealand also includes the following small inhabited outlying islands: the Chatham Islands, 850 kilometres east of Christchurch; Raoul Island in the Kermadec Group, 930 kilometres north-east of the Bay of Islands; and Campbell Island, 590 kilometres south of Stewart Island. New Zealand also has jurisdiction over the territories of Tokelau and the Ross Dependency, which are described in chapter 4.
Table 1.1. LAND AREA OF NEW ZEALAND*
| Land area | Size |
|---|---|
* These figures were current at 1 April 1988, although new mapping techniques mean there are regular small adjustments. † Includes islands in territorial local authorities. ‡ Excluding islands in territorial local authorities. Source: Department of Survey and Land Information. | |
| sq. km. | |
| North Island† | 114,821 |
| South Island† | 149,463 |
| Offshore islands‡ | 833 |
| Stewart Island | 1,746 |
| Chatham Islands | 963 |
| Total | 267 844 |
New Zealand is more than 1600 kilometres long and 450 kilometres wide at its widest part, and has a long coastline for its area. The coast is very indented in places, providing many natural harbours.
New Zealand is also very mountainous, with less than a quarter of the land less than 200 metres above sea level. In the North Island the main ranges run generally south-west, parallel to the coast, from East Cape to Cook Strait, with further ranges and four volcanic peaks to the north-west. The South Island is much more mountainous than the North Island. A massive mountain chain, the Southern Alps, runs almost the length of the island. There are many outlying ranges to the Southern Alps in the north, and the south-west of the South Island. There are at least 223 named peaks higher than 2300 metres. There are also 360 glaciers in the Southern Alps. The largest are, on the east, the Tasman (length 29 kilometres), Murchison (17 kilometres), Mueller (13 kilometres), Godley (13 kilometres) and the Hooker (11 kilometres), and, on the west, the Fox (15 kilometres) and the Franz Josef (13 kilometres).
Table 1.2. PRINCIPAL MOUNTAINS
| Mountain or peak | Height |
|---|---|
* Since 1986 both the Maori and European names of this mountain have had official recognition. † Peaks over 3000 metres. Source: Department of Survey and Land Information. | |
| metres | |
| North Island— | |
| Ruapehu | 2,797 |
| Taranaki or Egmont* | 2,518 |
| Ngauruhoe | 2,290 |
| Tongariro | 1,968 |
| South Island†— | |
| Southern Alps— | |
| Cook | 3,764 |
| Tasman | 3,497 |
| Dampier | 3,440 |
| Silberhorn | 3,279 |
| Lendenfeldt | 3,201 |
| Mt Hicks (St David's Dome) | 3,183 |
| Torres | 3,163 |
| Teichelmann | 3,160 |
| Sefton | 3,157 |
| Malte Brun | 3,155 |
| Haast | 3,138 |
| Elie de Beaumont | 3,117 |
| Douglas | 3,085 |
| La Perouse | 3,079 |
| Heidinger | 3,066 |
| Minarets | 3,055 |
| Aspiring | 3,030 |
| Glacier Peak | 3,007 |
New Zealand's rivers are mainly swift and difficult to navigate. They are important as sources of hydro-electric power and many artificial lakes have been created as part of major hydro-electric schemes. New Zealand also has numerous natural lakes of great scenic beauty.
Table 1.3. PRINCIPAL RIVERS*
| River | Length |
|---|---|
* Over 150 kilometres in length from the mouth to the farthest point in the river system irrespective of name, including estimated courses through lakes. Source: Department of Survey and Land Information. | |
| km | |
| North Island— | |
| Flowing into the Pacific Ocean— | |
| Rangitaiki | 193 |
| Waihou | 175 |
| Mohaka | 172 |
| Ngaruroro | 154 |
| Flowing into the Tasman Sea— | |
| Waikato | 425 |
| Wanganui | 290 |
| Rangitikei | 241 |
| Manawatu | 182 |
| Whangaehu | 161 |
| Mokau | 158 |
| South Island— | |
| Flowing into Cook Strait– | |
| Wairau | 169 |
| Flowing into the Pacific Ocean— | |
| Clutha | 322 |
| Taieri | 288 |
| Clarence | 209 |
| Waitaki | 209 |
| Waiau | 169 |
| Waimakariri | 161 |
| Flowing into Foveaux Strait— | |
| Mataura | 240 |
| Waiau | 217 |
| Oreti | 203 |
| Flowing into the Tasman Sea— | |
| Buller | 177 |
Table 1.4. PRINCIPAL LAKES*
| Lake | Area |
|---|---|
* Over 20 square kilometres in area. Source: Department of Survey and Land Information. | |
| sq. km | |
| North Island— | |
| Taupo | 606 |
| Rotorua | 80 |
| Wairarapa | 80 |
| Waikaremoana | 54 |
| Tarawera | 36 |
| Rotoiti | 34 |
| South Island— | |
| Te Anau | 344 |
| Wakatipu | 293 |
| Wanaka | 193 |
| Ellesmere | 181 |
| Pukaki | 169 |
| Manapouri | 142 |
| Hawea | 141 |
| Tekapo | 88 |
| Benmore (artificial) | 75 |
| Hauroko | 71 |
| Ohau | 61 |
| Poteriteri | 47 |
| Brunner | 39 |
| Coleridge | 36 |
| Monowai | 31 |
| Aviemore (artificial) | 29 |
| Rotoroa | 23 |
| Mahinerangi (artificial) | 21 |
New Zealand is in an area of the world characterised by active volcanoes and frequent earthquakes. The ‘ring of fire’, as this area is known, forms a belt that surrounds the Pacific Ocean and is the surface expression of a series of boundaries between the plates that make up the earth's crust. Plate tectonics is a theory used to explain the fundamental geological features of the earth. According to the theory the crust of the earth is made up of a series of plates, rather like a jigsaw puzzle. Although these surface plates are rigid, the rocks of the underlying layer of the earth, its upper mantle, are partially molten. This provides the convection mechanism for movement of the overlying plates. Over millions of years these plates have moved in relation to each other, colliding together, pulling apart, or sometimes sliding past each other. The boundary between the Indian-Australian plate and the Pacific plate runs through New Zealand, and the processes resulting from their collision have had a profound effect on New Zealand's geology. When two plates collide, one is pushed beneath the other in a process known as subduction. Zones of subduction are defined by two deep sea trenches to the north and south of New Zealand, which are connected by the Alpine Fault. The size, shape and geology of New Zealand reflects the long process of construction and deformation along this plate boundary.
The interplay of earth movements and erosion has created the sedimentary rocks that cover almost three-quarters of New Zealand. Erosion of land produced sand, mud, gravel and other debris which was carried out to sea, where it accumulated in great thicknesses to form rocks such as sandstone, mudstone, greywacke and conglomerate. The shells and skeletons of sea creatures also accumulated and formed thick layers of limestone. Most sedimentary rocks are formed in near horizontal layers called strata. Earth movements later raised the rocks above the sea to form land, and the strata were in many places tilted and folded by pressure. Seas advanced and retreated over the New Zealand area many times and the sedimentary rocks represent almost every geological period since the Cambrian (see time scale). Their age is revealed by the fossils they contain or may be determined by various radiometric techniques.
As well as the sedimentary rocks of various ages, New Zealand incorporates in its complex structure metamorphic rocks (schist, gneiss and marble), and intrusive igneous rocks (granite, gabbro, diorite and serpentine). Many of these metamorphic and intrusive igneous rocks are hundreds of millions of years old.
Intrusive rocks are generally considered to have entered the outer crust in a molten state, often during periods of mountain building. Some may, however, result from the intense metamorphism (melting) of pre-existing sediments. Intrusive rocks contain large crystals and have a coarse-grained texture.
Metamorphic rocks are formed when previously existing rocks are subjected to high temperatures and pressures while buried deep within the earth's crust. During metamorphism new minerals and structures develop within a rock due to the great temperatures and pressures. Such metamorphism often takes place during relatively short periods of mountain building.
Volcanic rocks (basalt, andesite, rhyolite and ignimbrite), are the products of many volcanic eruptions that have characterised New Zealand's geological history. The most recognisable volcanoes in New Zealand now occur in the North Island, where a number are active. They include those in Tongariro National Park, White Island and Mount Tarawera. Others such as Mount Taranaki (or Egmont), and Rangitoto may be considered dormant at present although they are still regarded as significant hazards. Sporadic episodes of volcanic activity have also occurred in the South Island with Timaru, Lyttelton, Oamaru and Dunedin all having basaltic volcanoes less than 13 million years old.
The oldest rocks in New Zealand are found in Nelson, Westland and Fiordland. They were formed in the Paleozoic era about 570 million years ago, but some in Westland may be older. They include thick sedimentary rocks which suggest that to yield the great volume of sediments a large landmass existed nearby at that time, although so far little has been deduced about its shape or position.
The history of the later part of the Paleozoic era, and the Mesozoic era, is rather better understood. For a vast span of time from the Carboniferous period, probably until the early Cretaceous period, an extensive depositional basin occupied the New Zealand region. At first, during much of the late Paleozoic, huge quantities of submarine lava and volcanic ash were included in the materials that accumulated. In the later Permian and Mesozoic times sediments were mainly sand and mud, probably derived from some landmass west of present New Zealand. These rocks have been compacted into hard greywacke (a type of sandstone), and argillite (hard, dark mudstone).
In the early Cretaceous period one of the main mountain-building episodes in New Zealand's history took place. Although basinal sedimentation continued through the Cretaceous period in eastern New Zealand, elsewhere this basin was compressed, and the sediments were intensely crumpled, broken and raised above the sea, probably forming a large, mountainous landmass. Some of the geoclinal sediments, now exposed over much of Otago, alpine Westland, and parts of the Marlborough Sounds, were metamorphosed into schist and gneiss by high temperatures and the tremendous deforming pressures to which the geocline was subjected. This intense folding of the strata occurred approximately 100 million years ago in the mid-Cretaceous period. Slowly the mountains were eroded and gradually a land of low relief was produced. The sea gradually advanced over the eroded stumps of the Mesozoic mountains, beginning its transgression earlier in some areas than in others. In the early Cretaceous period the land became submerged in the region of present Northland and the eastern margins of the North and South Islands, and thick deposits of mudstone and sandstone accumulated in some of these areas. At the close of the Mesozoic era, and in the very early Tertiary era, the land became so reduced in size that little sediment was produced and only comparatively thin deposits of bentonitic and sulphurous muds, and fine, white foraminiferal limestone accumulated. During this time, New Zealand's main coal deposits accumulated in swamps on the surface of the old land. These became buried by marine deposits as the sea continued its transgression in the Eocene period. By the Oligocene period most of the land was submerged and in shallow waters free of land sediments, thick deposits of shell and foraminiferal limestone accumulated. Scattered remnants of this Oligocene limestone are used for most of New Zealand's cement and agricultural lime.
After the Oligocene submergence, earth movements became more vigorous; many ridges rose from the sea as islands, and sank or were worn down again; sea basins formed and were rapidly filled with sediments. New Zealand's late Tertiary environment has been described by Sir Charles Fleming (Tuatara, June 1962) as follows: “The pattern of folds, belts and troughs that developed was on a finer scale than in the Mesozoic… the land moved up and down as a series of narrow, short, interfingering or branching folds …. We can think of Tertiary New Zealand as an archipelago … a kind of writhing of part of the mobile Pacific margin seems to have gone on.” The thick deposits of soft grey sandstone and mudstone that now make up large areas of the North Island and some parts of the South Island, are the deposits that accumulated in the many sea basins that developed in the later Tertiary.
Late in the Cenozoic era, in the Pliocene and Pleistocene periods between 6 million and 1 million years ago, another great episode of mountain building took place. Earth movements became intense, and slowly pushed up the Southern Alps and New Zealand's other main mountain chains. It was during this period that the general size and shape of the present islands of New Zealand was determined. Much of the movement during this mountain-building period (the Kaikoura Orogeny) took the form of displacement of blocks of the earth's crust along fractures called faults. The total movement of blocks adjacent to major faults amounted to thousands of metres. It must have been achieved very slowly, probably by innumerable small movements, each less than a few metres. The blocks adjacent to ‘transcurrent’ faults moved both vertically and laterally along the faults. The New Zealand landscape today in some regions shows well-preserved, tilted fault blocks bounded by fault scarps (steep faces hundreds or even thousands of metres high). From Milford Sound to Cook Strait, an almost unbroken depression, formed by river valleys and low saddles on the intervening ridges, marks the line of New Zealand's Alpine Fault. Contrasting rock types occur on either side of the fault. This is illustrated by the 480 kilometre separation of Permian igneous rocks, which occur in Nelson and western Otago. Fault movements continue to the present day and have accompanied several major earthquakes of the past century. Many minor but revealing landscape features, such as scarplets or offset ridges, or streams, show where the movement has been occurring over recent centuries.
Erosion has transformed the landscape during this time, carving detailed patterns of peaks, ridges, valleys and gorges. The deposition of debris has built up alluvial plains, shingle fans and other construction forms. At the coast, waves have eaten back the headlands and built beaches, spits and bars. The late Pleistocene glaciers carved the fiords of Fiordland and the valleys occupied by most of the South Island lakes; there were also small glaciers on Ruapehu, where remnants survive, on Mount Taranaki and the Tararua Range. Sea-level changes accompanied the formation and later melting of global glacial ice, affecting the erosion and deposition of the rivers. These changes were responsible for the formation of many prominent river terraces.
Volcanic activity over the past few million years has played an important part in shaping the landscape. Banks Peninsula, a twin volcanic dome in Canterbury, also achieved much of its growth then. The largest volcanic outpourings of late geological times in New Zealand has been in the region between Tongariro National Park and the Bay of Plenty coast; andesite lava, scoria, and ash were erupted in the Pleistocene period and later, to build the volcanoes, Ruapehu, Tongariro, and Ngauruhoe. More than 8000 cubic kilometres of molten rhyolitic magma was erupted in the form of ignimbrite pumice and rhyolite lava, building up the Volcanic Plateau, which is one of the largest and youngest accumulations of acid volcanic rocks in the world. Mount Taranaki is an andesitic stratovolcano, with the remnants of three other volcanic cones nearby; all are of Pleistocene age. In the Waikato there are eroded Pleistocene cones of andesitic composition associated with a number of alkaline eruptive centres. The largest is Pirongia, a basaltic andesite cone some 900 metres high. Auckland city and the area just south has been the scene of many eruptions of basalt lava and scoria in Pleistocene and Holocene times, and many small scoria cones can be seen there. Late Tertiary and Quaternary basaltic eruptions in North Auckland have built lava plateaus and many young cones. From these volcanic outpourings some valuable mineral resources have been derived. The ironsands mined on the west coast of the North Island are concentrations of magnetite and ilmenite, which have been eroded from volcanic rocks.
Compared with some other parts of the almost continuous belt of earthquake activity around the rim of the Pacific—such as Japan, Chile, and the Philippines—the level of seismic activity in New Zealand is moderate, although earthquakes are common. It may be roughly compared with that prevailing in California. A shock of Richter magnitude 6 or above occurs on the average about once a year, a shock of magnitude 7 or above once in 10 years, and a shock of about magnitude 8 perhaps once a century, but in historic times only one shock (the south-west Wairarapa earthquake in 1855) is known to have reached this magnitude.
Other natural disasters and accidents are together responsible for more casualties than earthquakes. The most serious seismic disasters in New Zealand have been the Hawke's Bay earthquake of 1931 in which 256 deaths occurred, and the Buller earthquake of 1929 in which there were 17 deaths. The total resulting from all other shocks since 1840 is less than 15 deaths. The last earthquake to cause deaths occurred at Inangahua in 1968, when three people died, while the most recent damaging earthquake was at Edgecumbe in the Bay of Plenty in March 1987.
The process of earthquake occurrence is understood in terms of a large volume of the earth's crust being subjected to strain by the relentless movement of the great plates of the earth's surface against each other. The strain eventually exceeds the strength of the rock, which ruptures. Energy is radiated outwards in the form of elastic waves, which can be felt at places near the origin, and detected by sensitive instruments at greater distances. In large shallow earthquakes the rupture may appear at the surface, forming or renewing movement on a geological fault. In regions where the majority of earthquakes are very shallow, such as California, there is a tendency for the earthquake origins to cluster near geological fault traces, but in regions of deeper activity, such as New Zealand, this is not so. There is little activity near the Alpine Fault, which stretches for some 500 kilometres from Milford Sound to Lake Rotoiti, and is considered one of the world's largest and most active faults.
Within New Zealand at least two separate systems of seismic activity can be distinguished. The Main Seismic Region covers the whole of the North Island except the Northland peninsula, and the part of the South Island north of a line passing roughly between Banks Peninsula and Cape Foulwind. The Southern, or Fiordland, Seismic Region includes southern Westland, western Southland, and western Otago. Less clearly defined activity covers the remainder of the two main islands, and extends eastwards from Banks Peninsula to include the Chatham Islands.
Shallow earthquakes, which are the most numerous, originate within the Earth's crust which in New Zealand has an average thickness of some 35 kilometres. These shocks are responsible for almost all damage to property, and are widely scattered throughout the country. In historically recent times, the Main and Fiordland Seismic Regions have been significantly more active than the rest of New Zealand, but neither the Central Seismic Region, which lies between them, nor the northern peninsula has been free from damaging shocks. The details of the present pattern are not necessarily unchanging, and could alter significantly after the occurrence of a major earthquake. Because of this, because of the broader geophysical setting, and because of the distance to which the effects of a large earthquake extend, it would be highly imprudent to treat any part of New Zealand as completely free from the risk of serious earthquake damage.
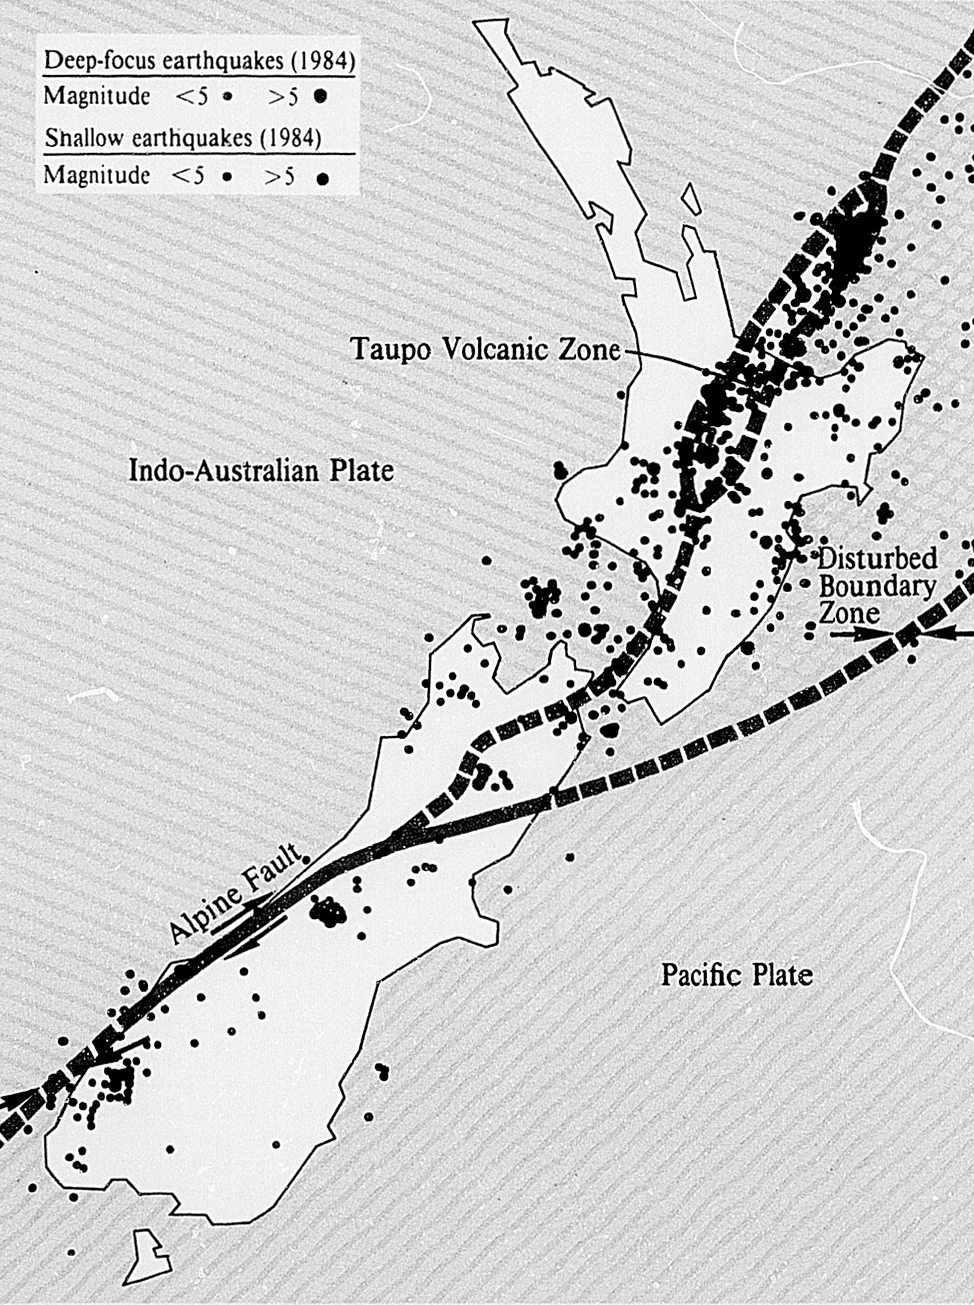
LOCATION OF EARTHQUAKES AND VOLCANIC ACTIVITY
Many active regions of the Earth have only shallow earthquakes, but in others shocks have been known to occur at depths as great as 700 kilometres below the surface. It is thought that these deep shocks originate within the edges of crustal plates that have been drawn down or thrust beneath their neighbours. Such deep events are common in both the Main and Fiordland Seismic Regions of New Zealand, but their relative positions with respect to the shallow activity and to other geophysical features are rough mirror images. This is believed to indicate that in the North Island the edge of the Pacific Plate lies below that of the Indian Plate, while in the south of the South Island the Pacific Plate is uppermost and the Indian Plate has been thrust beneath it.
The most important system of deep shocks in New Zealand lies in a well-defined zone beneath the Main Seismic Region, stretching from the Bay of Plenty to Nelson and Marlborough. The maximum depth of occurrence is about 400 kilometres at the northern end, and decreases evenly to a depth of about 200 kilometres before the southern boundary of the region is reached. Along the whole of the system, there is also a regular decrease in depth from west to east. In northern Taranaki, near the western limit of this activity, a small isolated group of shocks at a depth of about 600 kilometres has also been recorded. In the Central Seismic Region only shallow shocks are known. The maximum depth of earthquakes appears to be less than 150 kilometres in the Fiordland Region where the deep activity is more concentrated than in the north, lying close to Lakes Te Anau and Manapouri.
Both earthquakes and volcanoes are found in geophysically disturbed regions, but large earthquakes are rare, although small earthquakes usually accompany volcanic eruptions. Regions of active volcanism are also subject to periodic outbreaks of small earthquakes, all of similar magnitude, and very numerous, known as ‘earthquake swarms’. Although the number of shocks may cause alarm, it is unusual for even minor damage to result. There is not often a simultaneous volcanic outbreak, but swarms are rare in non-volcanic regions. In New Zealand they have occurred in the volcanic zone that includes Mount Ruapehu and White Island, the Coromandel Peninsula, parts of Northland, and Taranaki.
Earthquakes in 1987. The largest was the Edgecumbe earthquake on 2 March, with a magnitude of 6.3. The next most damaging was that four days later, in Pegasus Bay, which caused some damage in Christchurch and North Canterbury.
Many other earthquakes occurred at greater depths in the earth, and so were not dangerous. The largest of these was on 23 March, just north of Te Puke in the Bay of Plenty. It was of magnitude 6.0, but was 350 km deep and so was felt only slightly, but as far south as Wellington.
Each year analysis of earthquake data from a network of record stations is completed by the Seismological Observatory of the Department of Scientific and Industrial Research. This analysis allows scientists to pinpoint the location, intensity and depth of earthquakes—information that can be used to pick trends and in the theory of plate tectonics.
New Zealand lies in the mid-latitude zone of westerly winds, in the path of an irregular succession of anticyclones, which move eastwards every six to seven days. The centres of these anticyclones generally track across the North Island, more northerly paths being followed in spring, and southerly paths in autumn and winter. Anticyclones are areas of descending air, and settled weather, with little or no rain, which may bring clear skies, or low cloud and fog. Between the anticyclones are troughs of low pressure, which extend northwards from low pressure depressions moving eastwards far to the south of New Zealand. Within these troughs there are often cold fronts, oriented north-west to south-east, which produce one of the commonest types of weather sequence over the country: as the front approaches from the west, north-westerly winds become stronger and cloud increases, followed by a period of rain for several hours as the front passes over, and then a change to cold showery south-westerly winds.
The mountain chain extending the length of the country has a major effect on the climate of its various regions, and produces much sharper climatic contrasts from west to east, than from north to south. In some inland areas of the South Island, just east of the mountains, the climate is distinctly ‘continental’ in character, with large daily and seasonal temperature variations, despite the fact that no part of the country is more than 130 kilometres from the sea. Ophir in Central Otago has the greatest extreme temperature range of 55°c.
The prevailing wind direction is westerly, although in individual months easterlies may predominate, and north of Taranaki the general flow is south-westerly. In the North Island winds generally decrease for a period in the summer or early autumn, but in many parts of the South Island July and August are the least windy months. The blocking effect of the mountain ranges modifies the westerly wind pattern. Wind strength decreases on the western side, but increases through Cook Strait, Foveaux Strait, and about the Manawatu Gorge. Air is also forced upwards over the ranges, which results in a warm drying (föhn) wind in the lee areas to the east of both islands. Wellington averages 173 days a year with wind gusts greater than about 60km/h, compared with 30 for Rotorua, 31 for Timaru, and 35 for Nelson. Sea breezes are the predominant winds in summer in many coastal places, such as Canterbury, where the north-easterlies are almost as frequent as the predominant south-westerlies.
The distribution of rainfall is mainly controlled by mountain features, and the highest rainfalls occur where the mountains are exposed to the direct sweep of the westerly and north-westerly winds. The mean annual rainfall ranges from as little as 300 mm in a small area of Central Otago to over 8000 mm in the Southern Alps. The average for the whole country is high, but for the greater part lies between 600 mm and 1500 mm. The only areas with average rainfalls under 600 mm are found in the South Island to the east of the main ranges, and include most of Central and North Otago, and South Canterbury. In the North Island, the driest areas are central and southern Hawke's Bay, Wairarapa, and Manawatu, where the average rainfall is 700–1000 mm a year. Of the remainder, much valuable farm land, chiefly in northern Taranaki and Northland, has upwards of 1500 mm. Over a considerable area of both islands rainfall exceeds 2500 mm a year.
For a large part of the country the rainfall is spread evenly through the year. The greatest contrast is found in the north, where winter has almost twice as much rain as summer. However, the predominance of winter rainfall diminishes southwards: it is still discernible over the northern part of the South Island, but over the southern half, winter is the season with least rainfall, and a definite summer maximum is found inland due to the effect of convectional showers.
Rainfall is also influenced by seasonal variations in the strength of the westerly winds. Spring rainfall is increased west of, and in, the ranges as the westerlies rise to their maximum about October, with a complementary decrease of rainfall in the lee of the ranges. Areas which are exposed to the west and south-west experience much showery weather, and rain falls on roughly half the days of the year. Over most of the North Island there are at least 130 rain days a year (days with at least 1.0 mm of rain)—except to the east of the ranges where in places there are fewer than 110 rain days. Those areas of the South Island with annual rainfall under 600 mm generally have about 80 rain days a year. In the far south the frequency of rain increases sharply, rain days exceeding 200 a year in Stewart Island and Fiordland.
On the whole the seasonal rainfall does not vary greatly from year to year, its reliability in spring being particularly advantageous for agriculture. It is least reliable in late summer and autumn, when very dry conditions may develop east of the ranges, particularly in Hawke's Bay. The highest daily rainfall on record is 582 mm, which occurred at Rapid Creek (Hokitika), where the mean annual rainfall exceeds 6000 mm. Areas with a marked lower annual rainfall can be subject to very heavy daily falls: such areas are found in northern Hawke's Bay and north-eastern districts in the Auckland province. By contrast, in the Manawatu district, Otago, and Southland, daily falls reaching 80 mm are very rare.
Mean temperatures at sea level decrease steadily southwards from 15°C in the far north to 9°C in the south of the South Island. Temperatures also drop with altitude: by about 2°C per 300 metres. January and February, with approximately the same mean temperature, are the warmest months of the year, and July is the coldest. Highest temperatures are recorded east of the main ranges, where they exceed 30°C on a few afternoons in most summers. The extremes for New Zealand are 42°C which has been recorded in three places, at Awatere Valley (Marlborough), Christchurch, and Rangiora (Canterbury); and — 19°C at Ophir (Central Otago). The annual range of mean temperature (the difference between the mean temperature of the warmest and coldest months) is small. In Northland and in western districts of both islands it is about 8°C and for the remainder of the North Island and east coast districts of the South Island it is 9 to 10°C. Further inland the annual range exceeds 11°C in places, reaching a maximum of 14°C in Central Otago, where there is an approach to a ‘continental’ type of climate.
The sunniest places are near Blenheim, the Nelson-Motueka area, and Whakatane, where the average duration of bright sunshine exceeds 2350 hours a year. The rest of the Bay of Plenty and Napier are only slightly less sunny. A large portion of the country has at least 2000 hours, and even Westland, despite its high rainfall, has 1800 hours. Southland and coastal Otago, where sunshine drops sharply to about 1700 hours a year, lie on the northern fringe of a broad zone of increasing cloudiness. A pleasant feature of the New Zealand climate is the high proportion of sunshine during the winter months. Although there is a marked increase in cloudiness in the North Island in winter, there is little seasonal change in the South Island, except in Southland.
The number of severe hailstorms reported annually over the whole country averages nine, but this figure varies yearly from four to 20. Severe hailstorms occur widely throughout the country, but the areas most affected are Canterbury, the low country of central Hawke's Bay, and a small area south and west of Nelson. Most of the hailstones are small, but occasionally larger stones cause local damage to glasshouses and orchards. Thunderstorms are not numerous. Their frequency is greatest in the north and western side of the country, where thunder is heard on 15 to 20 days a year. On the east coast of the South Island the average is commonly less than five. Tornadoes show a similar pattern to thunderstorms, except that maximum frequency occurs in the Waikato and Bay of Plenty. An average of about 20 tornadoes and waterspouts is reported each year, but most of these are small.
Local variations in frostiness are considerable, even within quite small areas. For example, at Albert Park, Auckland, the screen minimum thermometer has registered below 0°C only once in 65 years, while further up the harbour at Whenuapai aerodrome there are on average eight screen frosts each year. Favourable sites in coastal areas of Northland are free of frost, although further inland light frosts occur frequently in the winter months. Excluding the uninhabited alpine areas, the coldest winter conditions are experienced in Central Otago, the Mackenzie Plains of inland Canterbury, and on the central plateau of the North Island, but even in these areas night temperatures of — 12°C are rarely recorded. Elsewhere in the North Island the winters are mild, and in both islands sheep and cattle remain in the open all year round.
The North Island has a small permanent snow field above 2500 metres on the central plateau, but the snow line rarely descends below 600 metres even for brief periods in winter. In the South Island snow falls on a few days each year in eastern coastal districts, where in some years it may lie for a day or two even at sea level, but in Westland it does not lie at sea level. The snow line on the Southern Alps is about 2000 metres in summer, being slightly lower on the western side where the Franz Josef and Fox Glaciers descend through heavy bush to within 300 metres of sea level. In inland Canterbury and Otago, where there are considerable areas of grazing lands above 300 metres, snowfalls are heavier and more persistent, and have caused serious sheep losses during severe winters. In that area, however, it is rare for the winter snow line to remain below 1000 metres for extended periods.
Humidity is commonly between 70 and 80 percent in coastal areas and about 10 percent lower inland. The daily variation is greater than the difference between summer and winter. Very low humidity (from 30 percent down to 5 percent) occurs at times in the lee of the Southern Alps, where the föhn wind (the Canterbury nor-wester) is often very marked. Cool south-westerlies are also at times very dry when they reach eastern districts. In Northland the humid mid-summer conditions are inclined to be oppressive, although temperatures rarely reach 30°C. Dull, humid spells are generally not prolonged anywhere, but their frequency shows a marked increase in the south.
Table 1.6. SUMMARY OF CLIMATE OBSERVATIONS TO 1980, RAINFALL, FROST AND SUNSHINE
| Station | Height | Rainfall | Screen frost† | Ground frost‡ | Bright sunshine | |
|---|---|---|---|---|---|---|
| Annual | Rain days* | |||||
* A rain day is one when 1.0 mm or more of rain was recorded. † A screen (or air) frost occurs when the temperature in the screen (at 1.3 metres above ground) falls below 0°C. ‡ A ground frost occurs when the grass minimum thermometer (25 mm above short grass) reads − 1.0°C or lower. Source: New Zealand Meteorological Service. | ||||||
| metres | mm | no. days | no. days | hours | ||
| Kaitaia Airport | 80 | 1,418 | 138 | 0 | 1.7 | 2,113 |
| Kerikeri | 73 | 1,682 | 135 | 1.0 | 24.9 | 2,004 |
| Dargaville | 20 | 1,248 | 149 | 5.0 | 16.8 | 1,956 |
| Auckland (Albert Park) | 49 | 1,185 | 140 | 0 | 4.2 | 2,102 |
| Tauranga Airport | 4 | 1,349 | 118 | 5.3 | 56.9 | 2,277 |
| Hamilton (Ruakura) | 40 | 1,201 | 131 | 25.5 | 71.8 | 2,006 |
| Rotorua Airport | 287 | 1,491 | 123 | 21.2 | 56.9 | .. |
| Gisborne Airport | 4 | 1,058 | 113 | 6.8 | 40.7 | 2,204 |
| Taupo | 376 | 1,178 | 122 | 37.1 | 71.4 | 2,021 |
| Taumarunui | 171 | 1,443 | 140 | 34.7 | 64.7 | 1,704 |
| New Plymouth Airport | 27 | 1,529 | 144 | 2.0 | 12.8 | 2,165 |
| Waiouru | 823 | 1,048 | 137 | 65.1 | 100.6 | .. |
| Napier | 2 | 824 | 95 | 8.8 | 38.6 | 2,245 |
| Wanganui | 22 | 906 | 115 | 3.5 | 10.7 | 2,087 |
| Palmerston North (DSIR) | 34 | 995 | 126 | 13.5 | 54.4 | 1,794 |
| Masterton (Waingawa) | 114 | 971 | 124 | 31.4 | 89.1 | 2,004 |
| Wellington (Kelburn) | 126 | 1,240 | 125 | 0 | 15.0 | 2,019 |
| Nelson Airport | 2 | 986 | 99 | 37.7 | 89.7 | 2,397 |
| Blenheim | 4 | 642 | 81 | 38.5 | 86.1 | 2,447 |
| Westport Airport | 2 | 2,192 | 168 | 1.0 | 39.3 | 1,925 |
| Hanmer Forest | 387 | 1,163 | 114 | 81.7 | 139.5 | 1,898 |
| Christchurch | 7 | 666 | 87 | 35.7 | 88.7 | 1,974 |
| Hokitika Airport | 39 | 2,783 | 168 | 16.0 | 56.4 | 1,846 |
| Lake Tekapo | 683 | 597 | 72 | 100.1 | 175.8 | 2,217 |
| Timaru | 17 | 587 | 81 | 37.9 | 87.8 | 1,869 |
| Queenstown | 329 | 805 | 92 | 50.3 | 140.7 | 1,921 |
| Alexandra | 141 | 343 | 65 | 86.2 | 154.0 | 2,064 |
| Dunedin (Musselburgh) | 2 | 784 | 120 | 9.7 | 77.7 | 1,676 |
| Gore | 72 | 836 | 136 | 43.7 | 100.2 | 1,698 |
| Invercargill Airport | 0 | 1,037 | 157 | 46.3 | 111.1 | 1,621 |
| Milford Sound | 3 | 6,267 | 182 | 28.5 | 56.1 | .. |
Table 1.7. SUMMARY OF CLIMATE OBSERVATIONS TO 1980, AIR TEMPERATURE
| Mean daily* | Daily maximum | Daily minimum | Annual extremes | |||||
|---|---|---|---|---|---|---|---|---|
| January | July | January | July | January | July | Max. | Min. | |
* The mean daily temperature is the average of the maximum and minimum temperature for a given day. Source: New Zealand Meteorological Service. | ||||||||
| degrees Celsius | ||||||||
| Kaitaia Airport | 19.3 | 11.7 | 23.8 | 15.2 | 14.8 | 8.1 | 30.5 | -0.5 |
| Kerikeri | 18.9 | 10.8 | 24.5 | 15.5 | 13.3 | 6.1 | 34.3 | -2.0 |
| Dargaville | 18.6 | 10.7 | 23.4 | 14.9 | 13.7 | 6.5 | 32.1 | -5.0 |
| Auckland (Albert Park) | 19.4 | 10.9 | 23.1 | 14.1 | 15.7 | 7.8 | 32.4 | -0.1 |
| Tauranga Airport | 18.5 | 9.3 | 23.6 | 14.1 | 13.3 | 4.5 | 33.3 | -5.3 |
| Hamilton (Ruakura) | 17.8 | 8.3 | 23.9 | 13.5 | 11.6 | 3.1 | 34.7 | -9.9 |
| Rotorua Airport | 17.6 | 7.5 | 22.8 | 11.9 | 12.4 | 3.0 | 29.8 | -5.7 |
| Gisborne Airport | 18.7 | 9.1 | 24.4 | 13.8 | 13.0 | 4.4 | 38.1 | -3.4 |
| Taupo | 17.3 | 6.5 | 23.5 | 11.0 | 11.0 | 1.9 | 33.0 | -6.3 |
| Taumarunui | 18.3 | 7.3 | 24.8 | 12.5 | 11.8 | 2.1 | 33.9 | -6.4 |
| New Plymouth Airport | 17.1 | 9.1 | 21.4 | 13.0 | 12.7 | 5.3 | 30.3 | -2.4 |
| Waiouru | 13.8 | 4.0 | 19.2 | 7.6 | 8.2 | 0.3 | 28.5 | -9.0 |
| Napier | 18.9 | 9.0 | 23.8 | 13.4 | 14.1 | 4.6 | 35.8 | -3.9 |
| Wanganui | 17.8 | 8.7 | 21.9 | 12.5 | 13.7 | 4.9 | 31.2 | -2.3 |
| Palmerston North (DSIR) | 17.3 | 8.0 | 21.9 | 11.9 | 12.8 | 4.0 | 31.7 | -6.0 |
| Masterton (Waingawa) | 17.3 | 7.1 | 23.7 | 11.8 | 10.8 | 2.4 | 35.2 | -6.9 |
| Wellington (Kelburn) | 16.4 | 8.2 | 20.0 | 10.9 | 12.8 | 5.5 | 31.1 | -1.9 |
| Nelson Airport | 17.2 | 6.5 | 21.9 | 11.9 | 12.5 | 1.1 | 36.3 | -6.6 |
| Blenheim | 17.8 | 7.0 | 23.6 | 12.4 | 12.0 | 1.5 | 36.0 | -8.8 |
| Westport Airport | 15.8 | 8.2 | 19.5 | 12.0 | 12.0 | 4.3 | 28.6 | -3.5 |
| Hanmer Forest | 15.6 | 3.9 | 22.2 | 9.2 | 9.0 | -1.3 | 37.1 | -13.2 |
| Christchurch | 16.6 | 5.9 | 21.5 | 10.3 | 11.6 | 1.4 | 41.6 | -7.1 |
| Hokitika Airport | 15.3 | 7.2 | 19.2 | 11.7 | 11.4 | 2.7 | 27.5 | -3.2 |
| Lake Tekapo | 14.8 | 1.6 | 21.3 | 6.0 | 8.3 | -2.8 | 33.3 | -15.6 |
| Timaru | 16.2 | 5.3 | 21.4 | 9.8 | 11.0 | 0.7 | 37.2 | -6.8 |
| Queenstown | 15.8 | 3.7 | 21.7 | 7.7 | 9.9 | -0.4 | 34.1 | -7.8 |
| Alexandra | 17.0 | 2.6 | 23.2 | 7.3 | 10.7 | -2.2 | 37.2 | -11.7 |
| Dunedin (Musselburgh) | 15.0 | 6.4 | 19.0 | 9.9 | 11.1 | 2.9 | 34.5 | -8.0 |
| Gore | 15.0 | 4.6 | 20.9 | 9.1 | 9.2 | 0.2 | 35.0 | -8.9 |
| Invercargill Airport | 13.7 | 5.1 | 18.4 | 9.4 | 8.9 | 0.8 | 32.2 | -7.4 |
| Milford Sound | 14.4 | 5.4 | 18.5 | 9.3 | 10.3 | 1.5 | 28.3 | -4.9 |
The vegetation and wildlife of New Zealand are the product of not only natural factors during tens of millions of years, but also human factors over the last 1000 years. The New Zealand landmass is a fragment of the ancient southern continent of Gondwanaland, which has been isolated for over 100 million years, allowing many ancient plants and animals to survive. Although New Zealand has undergone many physical and climatic changes, such as mountain building, volcanic activity, and glaciation, parts of the landmass have remained in continuous existence with part of their original complement of plants and animals.
New Zealand is now a very diverse land and changes from being almost subtropical (‘winterless’) in the north, to cool temperate, even subantarctic in the south, with a very wet, mild climate in the west, and a much drier, sometimes almost continental climate, in the east. A long and exceptionally diverse coastline, with many islands, produces habitats for coastal and lowland plants and animals, and there are extensive montane and alpine habitats as well. Geological variation has meant species have adapted to habitats based on soils derived from limestone, volcanic rock, serpentine, alluvial muds and gravels, and peat. Such diversity has led to New Zealand being classified into over 260 ecological districts, each with a distinct blend of topography, climate, vegetation, and wildlife.
Superimposed on natural diversity has been 1000 years of human activity; harvesting of naturally occurring species, introduction of species from elsewhere, and transformation of natural vegetation into farmland by fire, logging, and drainage. While approximately 80 percent of the land area was forested before humans arrived, only 23 percent remains forested, mainly in the mountainous hinterland.
The vegetation and wildlife of New Zealand today is made up of different bio-geographic elements. The Gondwanaland element, consists of ancient plants and animals: conifers such as kauri (Agathis australis), frogs (Leiopelma), reptiles like tuatara (Sphenodon punctatus), large ground snails (Powelliphanta), and flightless birds such as the kiwi (Apteryx spp.) and the now extinct moa (Dinothiformes). A tropical element includes the nikau palm, kie kie (Freycenetia), tree ferns, many northern forest trees, tropical snails (Placostylis), and earthworms. An Australian element includes many ferns, orchids, small seeded tree species like manuka (Leptospermum scoparium), insects, and birds (such as the nectar-feeding tui (Prosthemadera novaeseelandiae), parakeets, and many wetland birds). A Pacific element includes trees like pohutukawa (Metrosideros excelsa), numerous ferns, and migratory birds like the shining cuckoo (Chalcites lucidus). A subantarctic or circumpolar element includes beech (Nothofagus), which occurs also in South America and Southern Australia and was once present on Antarctica, and the world's largest assemblage of several characteristically southern bird groups such as penguins, albatrosses, and petrels. A South American element includes Fuchsia. A cosmopolitan mountain element entered New Zealand along the mountain and island chain from South-east Asia and includes plants such as buttercups, daisies, veronicas and gentians. A cultural element of recent human origin comes from all parts of the world (particularly Europe, North America, Australia and South Africa), and consists of trees, horticultural plants, weeds, mammals, birds, and many other groups.
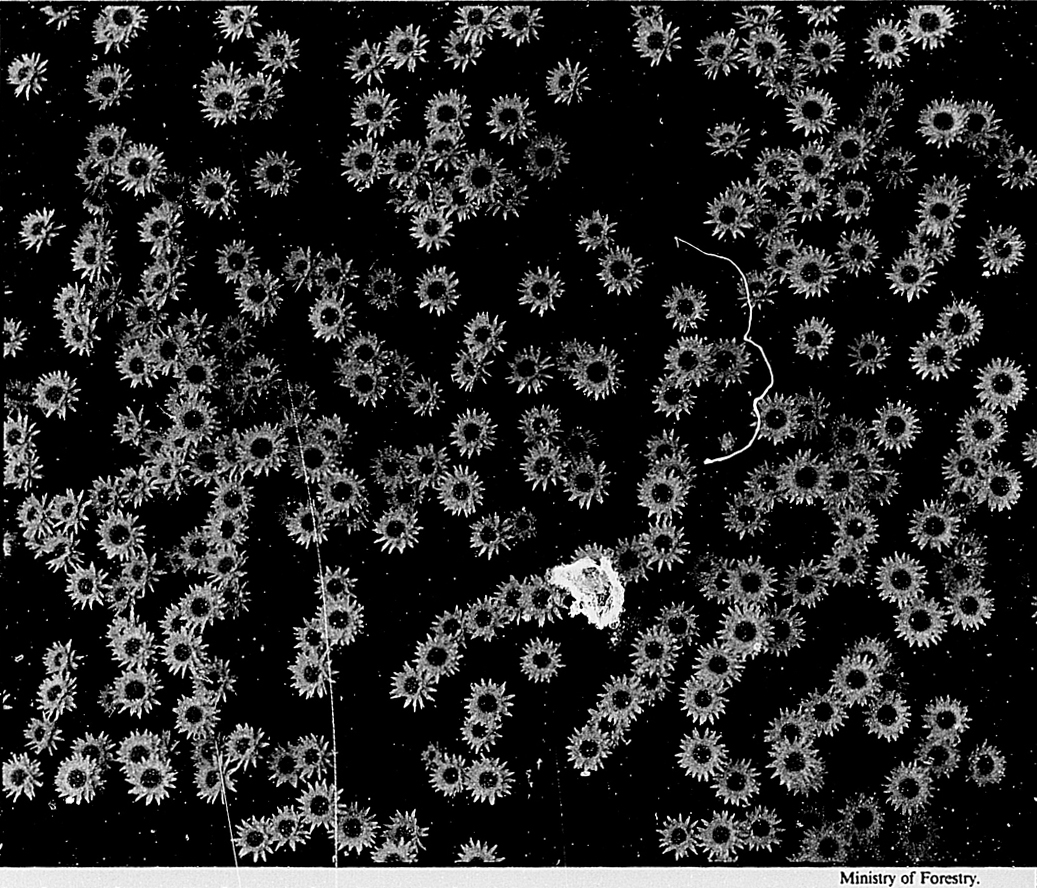
Everlasting daisies, North-west Nelson Forest Park.
Northern (subtropical), central (temperate), and southern (subantarctic) marine areas can also be recognised, each with characteristic species; for instance rock oyster, blue mussel and dredge oyster, respectively. Bull kelp is a notable southern species. Some very unusual marine animals occur, including black coral and ancient brachiopods in the southern fiords, and recently discovered sea daisies—starfish relatives which live on sunken wood at a depth of 1000 metres. The complex sea floor means that shore, continental shelf, and deep water species occur close together, resulting in diverse marine life.
Uniqueness is a feature of the natural life of New Zealand. Foremost is the absence, apart from two species of bat, of local land mammals, which had not evolved at the time New Zealand became separate. Many flightless birds and insects have evolved. The most remarkable birds were some 12 species of moa, forest and shrub browsers that took the place of large herbivores in other parts of the world. Moa became extinct during Maori times, but other flightless birds remain, including kiwi, kakapo (a nocturnal parrot—the largest in the world), and weka (a scavenging rail). Flightless insects are numerous, including many large beetles and cricket-like weta.
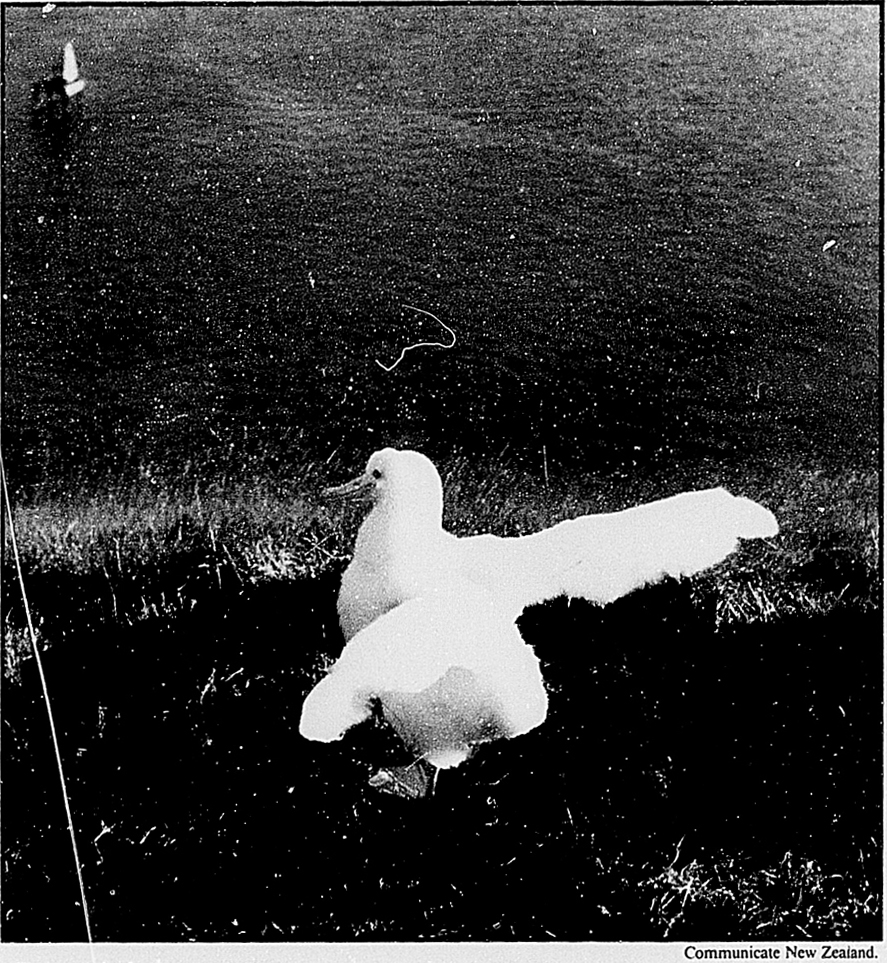
Albatross chick, Otago.
The absence of mammals also meant that birds became important as seed-dispersing agents, so that most forest plants bear small berries, including the giant conifers (podocarps), the smaller canopy trees, and even some forest-floor herbs. Some alpine plants produce berries, dispersed by the New Zealand pipit and the kea (mountain parrot). As a consequence of the great physical and climatic upheavals which New Zealand has undergone the forest has been influenced by extinction. Coconut palms once occurred in New Zealand, and fossil remains of kauri, now limited to the northern North Island, have been found south to Canterbury. Some tropical plant groups are represented by a single species, surviving only on protected islands, or in the far north. Some, like Tecomanthe are known from only a single plant in the wild.
The range of bird species is also very limited in comparison with other temperate land masses of similar size. The endemic family of wattle birds contains only four species. One of these, the huia, is now extinct and considerable natural extinction has occurred in the past. On the other hand, there has been great diversification among smaller life-forms, such as tiny forest-floor snails, spiders, aquatic caddis flies, lichens, mosses and liverworts. Of note is the diversity of alpine plants such as daisies (Celmisia, Senecio), veronica (Hebe), native carrot (Aciphylla) and buttercups. Many of these plants produce rosettes of large leaves, which seem to adapt the plants to cold, windy, subantarctic conditions in the relatively recently-formed high mountains. A second group of plants adapted to cold, windy conditions are cushion plants, some of which form remarkable mounds called ‘vegetable sheep’.
In the forest and along its margins divaricating shrubs occur with tangled and crisscrossed branches bearing tiny leaves. Sometimes these shrubs are the juvenile forms of tree species, but more often are the adult itself. Nowhere else in the world is this peculiar growth form so abundant. It may be an adaptation to browsing by the now extinct moa, or it may help plants to adapt to cold or dry conditions.
Although many New Zealand plants and animals occupy very specialised habitats, droughts, high winds, floods, and erosion mean that many species need to be highly adaptable. Accordingly, many insects, such as native bees, gather food from a wide variety of sources, and some forest species, like beech, regenerate best after the parent forest has been destroyed (by volcanic eruption for example).
However, the overwhelming character of the land-based wildlife is its dependence on forest, and its vulnerability to introduced predators such as rats. The forests and natural grasslands have also been severely modified by introduced browsers such as possums, deer and goats, and some introduced plants, like marram grass, have taken over the places where native species would normally grow.
A vast proportion of the native animals and plant species are found only in New Zealand. Virtually all insects, spiders and snails, and all earthworms are restricted to New Zealand, as are most birds and plants, most freshwater fish (27 species), and all reptiles (38 species).
Table 1.8 summarises the numbers of native and introduced species in New Zealand today, although many figures are approximate and may change after future scientific investigation.
Table 1.8. SELECTED GROUPS OF NATIVE AND INTRODUCED SPECIES
| Group | Number of species | Percentage endemic* | |
|---|---|---|---|
| Introduced | Native | ||
* Native species not found anywhere else. † Estimated. Source: Department of Conservation. | |||
| Marine algae (seaweeds) | 3 | 900† | 43 |
| Bryophytes— | |||
| Mosses | 15 | 485 | 28 |
| Liverworts | .. | 500 | .. |
| Ferns and allies | 20 | 163 | 41 |
| Conifers | 30 | 20 | 100 |
| Flowering plants | 1 700 | 1 813 | 84 |
| Earthworms | 40 | 178 | 100 |
| Landsnails/slugs | 12 | 520† | 99 |
| Spiders/harvestmen | 60 | 2 500† | 90 |
| Insects | 1 100 | 9 460 | 90 |
| Freshwater fish | 23† | 27 | 85 |
| Amphibia | 2 | 3 | 100 |
| Reptiles | 1 | 38 | 100 |
| Birds— | |||
| Land/freshwater | 33 | 65 | 57 |
| Mammals— | |||
| Marine | 1 | 34 | 6 |
| Land | 33 | 2 | 100 |
Forests. Apart from mountains above bush-line, swamps, coastal dunes, and some dry inland basins, most of New Zealand was originally forest-covered. The forests were reduced by a third by Maori clearance before European settlement, and a further third by European clearance over the last 150 years, so that now only 23 percent of New Zealand remains in native forest. Much occurs in mountainous areas, and most is now protected.
There is a wide range of natural forest types. Around the coast is a fragmented narrow band of plants with varying degrees of salt tolerance, (including mangroves, nikau palm and mostly tropical Pacific species, such as karaka and pohutukawa. Coastal forests are particularly important habitats for marine birds (for example various petrels and penguins), and offshore islands form refuges for tuatara, flightless, insects and snails. The characteristic New Zealand forest type is warm temperate evergreen rain forest. In the far north this is dominated by kauri and various broad-leved species, though little original forest remains. Swamp forest dominated by the podocarp kahikatea (Dacrycarpus dacrydioides) was once extensive, and remains prominent in the western South Island. Elsewhere the podocarps (rimu, totara, matai, and miro) are associated with a diverse range of broad-leaved evergreen tree species, ferns, vines and epiphytes, forming dense and complex multi-storeyed communities at low altitudes. The range of species gradually diminishes with both increasing altitude and increasing latitude. Evergreen beech forest is characteristic of the central and southern North Island and South Island, above 300 metres altitude. These montane forests have fewer species than lowland forests, and extensive areas may be dominated by a single tree species. The bush-line, usually of mountain or silver beech, is located generally between 1350 and 1500 metres.
A wide range of secondary forest types have developed since human arrival, notably kanuka forests east of the main divide, manuka and kanuka forests in northern New Zealand, and a range of broad-leaved tree and tree-fern forest types on abandoned farmland.
Cool moist climates produce an abundance of ferns in New Zealand forests, not only giant tree ferns, but also filmy ferns which clothe tree trunks, and ground ferns.
Shrublands. Natural shrublands are rare and usually occur where soil or water factors restrict forest development, such as the margins of coastal estuaries and other wetlands, and rocky bluffs. Immediately above the bushline, a narrow band of diverse shrubland often occurs, dominated by the heath Dracophyllum, shrub daisies, hebes, and alpine podocarps. The most extensive shrublands occur in the once-forested dryland of eastern New Zealand, where small-leaved sometimes spiny shrubs occur, notably matagouri (Discaria), tauhinu (Cassinia), and divaricating coprosmas. These shrublands are stages in the re-establishment of forest. Fernland, particularly bracken fern (Pteridium esculentum), once a staple Maori food, is very widespread throughout deforested New Zealand hill country. Like shrubland it serves as a nurse-bed for forest species.
Wetlands. A rise in sea-level inundated coastal valleys formed during the ice-age. This created extensive estuaries, rich in worms, molluscs and eelgrass, which are important habitats for marine birds, such as oyster-catchers and a refuge for migratory waders. In the north the estuaries support dense groves of low mangroves, while elsewhere there are extensive rush and sedge wetlands which are spawning grounds for whitebait or inanga (Galaxias spp.). The numerous rivers of New Zealand created extensive freshwater wetlands dominated by harakeke or flax (Phormium), raupo (Typha) and sedges. These have mostly been drained but are extensive in the western South Island. Numerous small swamps and lakes have been formed to the lee of sand dunes deposited along western coasts by prevailing westerly winds. Lakes, swamps and bogs made by glaciers are features of the South Island high country.
Dune lands. Coastal sand deposits were once colonised by the now threatened pingao (Desmochoenus spiralis), a sedge used for traditional Maori weavings. The areas have been stabilised by marram grass, lupins and pines, which have displaced native species, and so few remain in their natural state.
Grasslands. When Europeans arrived in the nineteenth century much of the eastern South Island was covered by short tussock grassland or silver tussock and fescue, which had become established after Maori fires removed forests. Before the Maori the only naturally occurring lowland tussock was in the dry interior of Central Otago. Pastoral farming and introduced grasses have now largely destroyed short tussock grassland. However, at higher altitudes, especially above the bush-line, extensive areas of natural tall snow tussock (Chionochloa spp.) occur.
Alpine vegetation. Large-leaved herbs, mat plants, and cushion plants occur throughout the tall tussocks, and in places dominate and form herb fields of great beauty in flower. Scree supports a range of specialised, often fleshy, drought-resistant plants. Alpine bluffs support a scattered cover of shrubs, herbs and cushion plants, adapted to extreme climate and sometimes possessing very strange form, such as the vegetable sheep (Raoulia spp, Haastia spp).
Introduced vegetation and wildlife. The New Zealand landscape is now dominated by introduced animals and plants. Over 1500 exotic plants grow wild, some (like rye-grass, browntop, gorse and sweet briar), over large areas. Although introduced plants have seldom colonised extensive areas of native vegetation, wild animals (deer, pigs, goats, possums, stoats and rats) are widespread, and some introduced birds, such as blackbirds, occur everywhere. Urban vegetation is largely exotic and domestic stock dominate agricultural areas throughout the lowlands.
Introduced plants and animals have greatly increased the diversity of species in New Zealand. However, their increase has been associated with a decrease in the area dominated by native species. Today a large number of native species are very rare and seldom seen. Some of these are ancient and stamp uniqueness on New Zealand as a living museum. Urgent measures are needed to ensure the healthy survival of this unique heritage of international importance.
One uniform time is kept throughout New Zealand. This is the time 12 hours ahead of Co-ordinated Universal Time, and is named New Zealand Standard Time (N.Z.S.T.). It is an atomic standard, and is maintained by the New Zealand Time Service of the Department of Scientific and Industrial Research (DSIR). One hour of daylight saving, named New Zealand Daylight Time, which is 13 hours ahead of Co-ordinated Universal Time, is observed from 2 a.m. (N.Z.S.T.) on the last Sunday in October, until 2 a.m. (N.Z.S.T.) on the first Sunday in March the next year. Time kept in the Chatham Islands is 45 minutes ahead of that kept in New Zealand.
1.1 New Zealand Geographic Board/DOSLI.
1.2 Department of Scientific and Industrial Research.
1.3 New Zealand Meteorological Service.
1.4 Department of Conservation.
1.5 Department of Internal Affairs.
New Zealand Atlas. Ward, I., ed. Government Printer, 1976.
Catalogue of Maps. Department of Survey and Land Information.
Gage, M. Legends in the Rocks—An Outline of New Zealand Geology. Whitcoulls, 1980.
Lillie, A. R. Strata and Structure in New Zealand. Tohunga Press, 1980.
Riddolls, P. M. New Zealand Geology—Containing Geological Maps of New Zealand 1:2 000 000. DSIR, Science Information Publishing Centre, 1987.
Searle, E. J. City of Volcanoes. 2nd edition. Longman Paul, 1981.
Smith, I. E. M., ed. Late Cenozoic Volcanism in New Zealand. Bulletin 23, Royal Society of New Zealand, 1986.
Soons, J.; Selby, M., eds. Landforms of New Zealand. Longman Paul, 1982.
Speden, I. G.; Keyes, I. W. Illustrations of New Zealand Fossils. DSIR Information Series 150, 1981.
Stevens, G. R. Lands in Collision: Discovering New Zealand's Past Geography. DSIR Information Series 161, 1985.
Stevens, G. R. New Zealand Adrift: The Theory of Continental Drift in a New Zealand Setting. A. H. and A. W. Reed, 1980.
Stevens, G. R. Rugged Landscape. A. H. and A. W. Reed, 1974.
Suggate, R. P.; Stevens, G. R.; Te Punga, M. T., eds. The Geology of New Zealand. 2 vols. Government Printer, 1978.
Thornton, J. Field Guide to New Zealand Geology. Reed Methuen, 1985.
Williams, G. J. Economic Geology of New Zealand. AusIMM Monograph Series 4, 1974.
An Encyclopedia of New Zealand. McLintock, A. H., ed. Vol. 1. Government Printer, 1966.
Johnson, K. F. Bibliography of New Zealand Meteorological Service Publications 1892–1985. New Zealand Meteorological Service, 1986.
New Zealand Atlas. Ward, I., ed. Government Printer, 1976.
The Meteorological Service publishes monthly summaries of:
Climate Observations (Misc. Pub. 109) and Rainfall Observations (Misc. Pub. 110) annually; Climate Observations which are updated every 10 years, e.g. 1980 (Misc. Pub. 177); Rainfall Normals (averages) for 30-year periods, e.g. 1951–1980 (Misc. Pub. 185); Sunshine Normals (averages) for 30-year periods, e.g. 1951–1980 (Misc. Pub. 186); and Temperature Normals (averages) for 30-year periods, e.g. 1951–1980 (Misc. Pub. 183). The service also produces regional climatologies (Misc. Pub. 115), maps and many other publications.
Enting, B.; Molloy, L. The Ancient Islands. Port Nicholson Press, 1982.
Kuschel, G., ed. Bio-geography and Ecology in New Zealand. W. Junk, 1975.
Salmon, J. J. The Native Trees of New Zealand. Reed Methuen, 1980.
Stevens, G. R. Lands in Collision: Discovering New Zealand's Past Geography. DSIR, 1985.
See also the bibliography, Books about New Zealand, at the back of this volume.
Table of Contents
Archaeology and oral tradition are the main sources for present-day knowledge of the origins and way of life of the early Polynesian inhabitants of the islands in the Pacific which became known as Aotearoa (literally ‘the land of the long white cloud’). Archaeology encompasses physical anthropology, linguistic evidence, and traditional accounts, as well as sophisticated examination of the tangible relics of human occupation. Oral traditions did not simply describe what happened. They also explained and justified past events, and were often the accounts of the victors in inter-tribal conflict. Both are of much value to historians, and also pose problems. Statements about New Zealand's Polynesian past must therefore remain tentative.
The ancestors of Aotearoa's earliest inhabitants are thought to have reached the Western Pacific some 4000 years ago, and gradually made their way along the Melanesian chain of islands. Long ocean journeys became possible for them with the introduction of the sail and the invention of the outrigger, which stabilised canoes in rough seas. They reached Fiji and Tonga by about 1000 B.C., and in this area many of the distinctive features of Polynesian social organisation and language developed. About 2000 years ago there was a further eastward movement to the Society, Marquesas, and Cook Islands, at the heart of the Polynesian triangle. Probably from this region, the most isolated parts of Polynesia were settled—New Zealand, Hawaii, and Easter Island. There has been much controversy as to the nature of, and reasons for, undertaking such long ocean voyages. Some would have been accidental, the result of canoes being blown off shore. At other times, refugees from defeated tribes or over-populated areas may well have set off into the unknown, confident that they were likely to make a safe landfall somewhere. Knowledge of stars, currents, bird migrations, and the signs of distant land was such that the possibility of controlled journeys over even thousands of kilometres cannot be discounted. The canoe or canoes which brought the first successful colonists to Aotearoa must have carried men and women, dogs, rats, vegetables for cultivation, and a variety of tools and ornaments for practical use and as models for those to be made subsequently. Such a well-equipped expedition is unlikely to have been completely accidental.
Polynesian people, known today as Maori, have lived in New Zealand since about the eighth century A.D. They came in one or more groups from the same general area of eastern Polynesia, known as Hawaiki. There are traditions of numerous voyages from Hawaiki, and of a number of famous canoes, whose occupants were the founders of tribal groupings which remain distinctive today. Some of these stories probably refer to migrations within New Zealand; a few to voyages elsewhere in Polynesia. After the initial period of settlement there were probably few or no continuing contacts with the outside world. Maori culture developed characteristics which reflected both its Polynesian roots and its new physical environment.
By the twelfth century settlements were scattered over most of the country. At first their inhabitants tried to reproduce a tropical Polynesian economy. Their ideal subsistence base was kumara (sweet potato) horticulture, supplemented by fishing, hunting, and plant gathering, but there was no typical form of subsistence. In the tropical Pacific the kumara is a perennial and can be propagated by direct transfer. Under New Zealand conditions it was necessary to store the crop over winter in sunken cellars and underground pits to provide tubers for winter consumption and seed tubers for spring planting. This adaptation of kumara cultivation was a great agricultural achievement. Gourds were also grown widely, and taro was important in a few favoured northern areas, while yam and paper mulberry cultivation was barely possible. Kumara would not grow in the southern part of Te Waipounamu (the South Island). Here people lived by hunting, fishing, and food gathering, and moved seasonally between areas with different resources.
In the early centuries of settlement the plains of Te Waipounamu, in particular, supported huge numbers of large flightless birds called moa. These provided an excellent food source, substituting for native land mammals, which were almost non-existent. Until moa numbers were seriously depleted, by hunting and by the destruction of the forest cover on which they depended for food, the eastern South Island seems to have been the most densely peopled part of New Zealand. The decline of the moa was probably accompanied by climatic changes which made horticulture more difficult and made the inhabitants more dependent on fish, shellfish, and marine mammals. After about 1400 the population of the South Island fell. In the most closely settled parts of Te Ika a Maui (the North Island), such as the Tamaki isthmus (now the site of Auckland), hunting and trapping declined rapidly, and fishing and shellfish gathering provided the main sources of protein. Here cultivations were more extensive and productive, and most people lived in settled communities, in which pa (earthwork forts) became increasingly common as the population grew, and competition for the most valuable land led to greater conflict.
Maori society comprised groups of varying size: whanau (extended families of perhaps 10 to 30 people), hapu (subscribes, with up to 500 members) and iwi (tribes). Membership of these groups was usually based on descent from a common ancestor. There were also waka, loose groupings of tribes whose claimed descent from people who had sailed on the same migratory canoe. Components of the system changed over time. Large whanau evolved into hapu, and large hapu came to be considered tribes, while other related branches declined. In everyday life hapu were probably the largest significant groups. They were the basis of the larger settlements and probably formed the normal fighting units in warfare. In response to major external threats, however, people would congregate at a few large pa setting aside quarrels to face the common tribal enemy. Settlement styles varied greatly, influenced by patterns of subsistence, climate, and the extent to which local relationships were peaceful or warlike. James Cook's 1769 expedition observed pa sizes ranging between three and 500 houses. People lived in dispersed hamlets, in large fortified pa and, in some areas, in isolated households. As with economic life, there was no single characteristic form of social organisation.
For most Maori life was fundamentally a communal experience, in which all aspects of living were inter-related. Economic and social activities were shared, and carried out on behalf of the whole community. Land, which was by far the most important form of property, belonged to the tribe as a whole, although smaller groups had traditional rights to use particular areas and resources. Kaumatua (elders) headed families. Communities were nominally—and to a significant degree, actually—ruled by rangatira (chiefs), whose positions were hereditary but had in practice to be reinforced by performance. Nor could rangatira ignore public opinion as expressed at tribal meetings by kaumatua. Chiefs and their possessions were to some extent tapu (sacred) and thereby protected against harm. Tapu also safeguarded cultivations and burial grounds, and functioned as an agency of social control more effective than any police force. Tapu was regulated by tohunga (priests or experts). Those of highest status interpreted the will of the gods and embodied tribal history and knowledge; lesser tohunga were specialists in such things as carving, tattooing, and canoe-building.
Tribal groups interacted through both trade and warfare. Regional specialities such as greenstone (jade) and titi (muttonbirds) were often transported long distances for bartering, probably at first mainly by ocean-going canoes. Knowledge also was transferred between tribes; Cook found at some landfalls that news of his coming had preceded him.
Making war was probably an important feature of life from the earliest times, although particular areas might be free of it for long periods. Competition for status and authority, and the desire for mana (prestige), motivated both individuals and whole tribes. Reasons for continuing conflicts were seldom absent: the importance of the concept of utu (the principle that acts should be repaid equally) meant that at least one party to a dispute usually felt justified in carrying it on. War was also a means of gaining control over land, which was valued for its fertility or its resources, such as stone for tool-making. But fighting was usually seasonal, fitting in with the cycles of subsistence, and conducted by small raiding parties carrying out sporadic attacks which produced few casualties. The construction of elaborate fortified pa in the seventeenth and eighteenth centuries suggests that warfare intensified in that period. Particularly in the warm, fertile northern part of Te Ika a Maui, where an increasing population made natural resources scarcer and more valuable. At times, economic pressures or military defeat displaced hapu or whole tribes into less desirable areas, whose occupants were in turn driven out or enslaved. But in many regions there was unbroken occupation by the same group of people over long periods.
Life in pre-European New Zealand has been seen by various writers as embodying ‘manly’ virtues, ideal communism, nature-centred spirituality, or healthy rural simplicity. It had elements of all these qualities, but it could also be ‘nasty, brutish and short’. Archaeological evidence suggests that the Maori were relatively tall and sturdy, free from infectious diseases, adequately fed, and fairly unlikely to die violently. But the average life span was only about 30 years, similar to that in most societies up to the twentieth century. Many adults suffered from arthritis brought on by constant physical labour, and from gum infections and tooth loss resulting from their diets.
By the late eighteenth century there were probably rather more than 100 000 ‘New Zealanders’, all but a few thousand of them living in the North Island. Fiercely protective of their social identities, they were deeply attached to the land which gave them physical and spiritual life. Their ways of living had evolved many local variations. They had no concepts of nationhood or race; as they began to encounter Europeans, they saw them as members of another, if stranger, rival tribe.
There is no convincing evidence to support ingenious theories that New Zealand was the landfall for one or several long-forgotten European voyagers before the 1640s. It seems clear that the first arrivals from overseas for several centuries were the members of a Dutch East India Company expedition commanded by Abel Tasman. He was sent in quest of the riches of the Great South Land which was supposed to balance the land mass of Eurasia in the Northern Hemisphere. On 13 December 1642 he sighted ‘a large, high-lying land’ which he named Staten Landt. It was the west coast of the South Island of the soon-to-be-renamed ‘Nieeuw Zeeland’. Tasman anchored a few days later, and lost four men when local Maori interpreted an exchange of trumpet fanfares as a prelude to battle. Sailing away up the west coast of the North Island, he did not again attempt to land, and so found none of the ‘treasures or matters of great profit’ which were the object of his voyage. Aotearoa was now represented by a jagged line on European maps, but Tasman's experience did not encourage explorers or fortune-seekers to follow in his wake.
Europeans did not return until 1769. This time those seeking the mythical southern continent were British, the expedition's ostensible purposes were scientific, and its leader was the great explorer James Cook. On his first visit he circumnavigated New Zealand; his published journal and the reports of the scientists and artists on board made it known to the outside world. He returned in 1773–74 and 1777. There were misunderstandings and violence: a Maori was killed at Cook's first landfall and, in 1773, 10 of his men were killed and eaten at Arapawa Island. But he persevered, finding most encounters characterised by mutual curiosity and eagerness to barter. His respect for the Maori as ‘noble savages’ excited European imaginations, and foreshadowed attitudes which were to be important later.
Other explorers soon followed, the Frenchman Jean de Surville only two months after Cook first arrived. Ill-treating the local inhabitants, he set the scene for the blunders which three years later led to the deaths of his countryman Marion du Fresne and some two dozen crew. Julien Crozet, du Fresne's second-in-command, massacred about 250 Maori in retaliation. Further expeditions under the Englishman Vancouver, the Frenchman D'Entrecasteaux, and the Italian Malaspina (leading a Spanish fleet) ensured that New Zealand was not again forgotten in Europe.
Two early British schemes to colonise New Zealand came to nothing. But soon after a penal colony was established at Port Jackson (now Sydney) in 1788, commercial exploitation of Aotearoa's resources became practicable. New Zealand became, in economic terms, an offshoot of New South Wales. In 1792 the first sealing vessel in New Zealand waters left a gang at Dusky Sound in Fiordland. Americans soon played a major role in sealing, which was mostly carried out in the far south, from Dusky Sound to Otago. It reached a peak in the first decade of the nineteenth century, after which over-exploitation brought a shift in the focus of activity to the newly-discovered sub-antarctic Campbell and Macquarie Islands.
Deep-sea whaling in New Zealand waters began in 1791, and remained important for about half a century, reaching a peak in the 1830s. Most whalers were American or British, although Australian, French, and Portuguese vessels were involved late in this period. Increasingly whaling vessels called at New Zealand harbours, notably the Bay of Islands, for rest, recreation, and replenishment of supplies. While whalers’ visits were usually brief, they became frequent enough to have a significant impact on local Maori communities. From 1829 bay whaling stations were established around the coasts of the South Island and the southern half of the North Island. These bases were usually quasi-permanent, and often became focal points for European settlement, as their activities included farming and trade.
Flax was seen as an important commodity from Cook's time. It was the intended economic basis for several abortive colonisation schemes. A boom in flax exports from the late 1820s proved to be short-lived, but it did result in more settlers joining the bay whalers and the already well-entrenched missionaries. Scraping flax was very laborious work, and the ropes and cordage made from it varied in quality. Timber was the next major primary product, with exports reaching a peak about 1840. Mills were opened around the richly-forested northern coasts, most notably around Hokianga Harbour, where a number of European timber millers settled, and a shipyard was established in 1826. Agricultural exports also increased. Potatoes (introduced by Cook or du Fresne) and pigs (landed at the orders of Governor King of New South Wales in the 1790s) were being traded with visiting ships by the early 1800s. From this time wheat and maize were cultivated by Bay of Islands Maori. By 1836 it was said that New Zealand was ‘becoming a perfect granary for New South Wales’. Missionaries had introduced horses and cattle in 1814, and later set up demonstration farms. Bay whalers and other traders also grew crops and ran stock. European enterprise developed side by side with such Maori adaptations as the rapid acceptance of the potato as a staple food.
New Zealand's first mission station was established at Rangihoua in the Bay of Islands in 1814, under the auspices of the Church of England's Church Missionary Society. The man most responsible for its formation was Samuel Marsden, senior chaplain to the New South Wales penal colony from 1800 until his death in 1838. An entrepreneur as well as a stern propagator of the faith, he was a successful breeder of sheep and cattle, pioneered grape growing in New South Wales, and owned mills and ships. Under his supervision the society's mission at first comprised men with practical skills, who were encouraged to engage in trade. Indeed they had no choice, as the first station was on a site too poor to support even subsistence agriculture. The community barely survived isolation, internal squabbles, and the uncertain patronage of local chiefs. Preaching the faith did not really begin until the determined Henry Williams arrived to set up a new station at Paihia in 1823. The establishment of a farm inland at Waimate in 1831 was followed late in the decade by expansion of Anglican missions southwards as far as the Waikato, Rotorua, and Gisborne, and (in 1839) to the coast north of Wellington. From 1827 Maori language translations of the Bible were made, and the teaching of reading and writing in Maori was emphasised. The Wesleyans had opened a mission in the Hokianga area in 1823, and also set up stations further south in the 1830s. A Roman Catholic Marist mission, led by Bishop Pompallier, began in Northland in 1838. From the mid-1830s many Maori converted to Christianity. Movements which blended Maori and Christian ideas also developed. An example was that of Te Atua Wera/Papahurihia in the Bay of Islands-Hokianga area. They were part of the adjustment of traditional social patterns to new realities.
It is difficult to assess what effect the presence of Europeans—around the coasts and venturing into the interior in the last few years before 1840—had on the indigenous inhabitants. It has been asserted that the Maori population declined by nearly 50 percent between 1770 and 1840; and, alternatively, that it was about the same in both years. Both sides put the 1840 figure at between 100 000 and 125 000. Differences of this scale over such a basic issue suggest how difficult it is to make firm statements about Maori society in the period. Areas such as the Bay of Islands and the Hokianga, where contact with Europeans was greatest, underwent changes in a few decades which had taken centuries to transform Europe. Maori society was resilient and able to adapt to the revolution in technology and ideas with which it was confronted. The European impact varied greatly. In the Bay of Islands there was an intermittent pakeha (non-Maori) presence from the 1790s, and permanent settlers from 1814; these numbered several hundred by 1839. In contrast, areas such as the Urewera mountains had not been visited by Europeans when British sovereignty was declared. Other regions had varying exposure to direct and indirect contact.
European diseases seem to have first reached epidemic proportions in the 1790s. The Maori initially had no immunity to them, and they were made more vulnerable by their communal lifestyle. Dysentery, diphtheria and influenza took many lives in the following decades. But some of the world's most lethal diseases, including yellow fever, typhus, and cholera, were not introduced, and by 1840 immunities to the more common types of sickness were beginning to develop. Some health problems resulting from pakeha presence were very localised—alcoholism and prostitution were confined to the few zones of intense contact. Other effects were widespread. European-introduced animals were both a source of food and rivals for scarce resources, while new plants such as potatoes and corn eventually became staples of Maori diet. The ability to purchase desired European goods depended on income-generating activities which often necessitated debilitating labour, such as raising commercial crops, felling and transporting timber, and stripping flax. Sometimes whanau or hapu moved to unhealthy lowland areas to be close to now-valued resources. New fashions in clothing, such as the wearing of European suits or blankets, regardless of their unsuitability in hot or wet weather, also increased susceptibility to sickness.
The nature of Maori warfare was altered by the introduction of muskets in the early 1800s. These were first used in small numbers as close-combat weapons of the traditional kind. By 1818 the Ngapuhi confederation—because of geography the pioneers of much social change in the period—discovered that the firing of many weapons at a distance created enough terror to enable the rout of an enemy to be completed by traditional means. From 1820, when their great chief Hongi Hika returned from a missionary-inspired visit to England with 300 muskets, Ngapuhi and their allies rampaged across the North Island on a series of expeditions which took many lives, settled old scores, and raised the mana of the victors to unprecedented heights. As muskets became widely available, other tribes took advantage of temporary leads in local arms races to attack their neighbours. By 1840 the balance of power was such that inter-tribal warfare had virtually ceased. One later effect of these campaigns was the migration of perhaps 30 000 people and, as a consequence, intractable disagreements about land rights in some areas.
Maori people were eager to adopt European goods and ideas: muskets, agricultural techniques, literacy, and Christianity were all enthusiastically embraced, and some (such as firearms) rapidly became necessities. Some Maori even travelled the world as crew members on European ships. But pakeha innovations were used in Maori ways for Maori purposes. If they did not serve these purposes they tended to be abandoned. The increased rate of conversions to Christianity just before 1840, for example, can be understood in terms of changes in Maori society, as well as seen as a consequence of more effective missionary activity. Social dislocation which resulted from inter-tribal fighting fed a need for spiritual explanation. But the new religion was also fashionable, and the mana which was granted to the literate brought many eager students to mission schools. Missionary teaching was a means to the end of gaining European knowledge. For Maori the most important function of a pakeha was to provide trade goods. Europeans lived in New Zealand on Maori terms, and in 1839 there were still only a few more than 1000 scattered over the whole country.
The vagueness of their instructions allowed early Governors of New South Wales to view New Zealand as a political as well as an economic ‘dependency’, and also to encourage plans for settlement. In 1804 Governor King ordered investigations into charges that brutalities had been inflicted on Maori by a ship's captain. This was the first of many attempts to regulate the behaviour of British subjects in New Zealand. In 1814 the Maori people were declared to be ‘under the protection of His Majesty’, and the missionary Thomas Kendall was appointed as a justice of the peace to maintain order in co-operation with local chiefs. He had no effective force at his disposal. Prisoners had to be sent to Sydney for trial. In 1817 Britain declared New Zealand to be outside its legal jurisdiction, although British subjects could be charged for serious crimes committed there. Schemes for colonisation continued, and in 1826 settlers selected by the first New Zealand Company arrived. While many went straight on to Sydney, some established themselves at the Hokianga. As trade and settlement increased, New Zealand moved further into the British sphere of influence. In 1832 James Busby was appointed British Resident at the Bay of Islands. He was a ‘watchdog without teeth’, having very few legal powers (he was not even a justice of the peace) and no reliable means of coercing British subjects. His authority rested on occasional visits by British warships. In 1837 one of three Europeans who had plundered the home of a Kororareka storekeeper was hanged in Sydney. British subjects fomenting disorder in New Zealand were clearly now subject, at least potentially, to legal retribution.
In May 1837 a combination of the remnants of the earlier New Zealand Company and others interested in profiting from Edward Gibbon Wakefield's ideas of transplanting the pre-industrial English class structure to the colonies formed what was soon to be named the New Zealand Company. An attempt at the ‘systematic colonisation’ of New Zealand was now imminent. Wakefield's vision was of the migration of integrated communities comprising all social strata from gentry to respectable working folk, while excluding the nobility and the very poor. The key to success was to set a ‘sufficient’ price for land. If land was too cheap it would be bought by both speculators and labourers, with ‘undesirable’ consequences; but the price was to be low enough to enable working class people to settle on the land after some years of thrift and honest toil, their purchases financing a fresh influx of labourers and ensuring continued economic growth. The eventual form of settlement owed little to this theory, but Wakefield's energy and the strength of his backers ensured that large-scale colonisation would take place. The company sent an expedition in 1839 to find a site for a colony. It acted in haste because the decision to annex New Zealand had already been made, and it wished to buy land before its dealings could be regulated by officials. Even before word reached England that any land had been bought, ships full of emigrants had departed, the first (the Tory) arriving at Port Nicholson (Wellington) on 22 January 1840.
British sovereignty over New Zealand was established in international law by New South Wales Governor Gipps’ proclamation on 14 January 1840 that his frontiers included New Zealand, and that Captain William Hobson was appointed his Lieutenant-Governor there. Hobson arrived at the Bay of Islands with a small entourage of officials on 24 January, and at Waitangi on 6 February 1840 he obtained from local Maori chiefs the first signatures to the ‘Treaty of Waitangi’. The significance of this document has been debated ever since. In its English-language original all rights and powers of sovereignty were ceded to Queen Victoria, while in return the possession of land, forests and fisheries was secured to the chiefs, with the Crown alone having the right to purchase land. The Queen extended her protection and all the rights and privileges of British subjects to the Maori people. The Maori-language version, hastily translated by the missionary Henry Williams, was couched in considerably vaguer terms, partly because of the difficulty of conveying European legal concepts. Maori signatories assented to the Queen taking over the rights of ‘kawanatanga’ (governorship). As their only example of the exercise of such authority was the ineffective James Busby, it is unlikely they understood the possible implications of their agreement. Over the next few months signatures to several differing versions of the treaty were collected around the country. Important tribes such as Ngati Maniapoto and Waikato did not regard it as a matter deserving serious consideration, and failed to sign; Ngapuhi were resented for their role as first signatories. To further complicate matters, on 21 May 1840, while signatures were still being sought, Hobson proclaimed British sovereignty over the North Island by virtue of the treaty, and over the South and Stewart Islands on the basis of Cook's discoveries. In 1841 New Zealand became a colony in its own right, and the capital followed a shift in the balance of European settlement from its first site at Russell in the Bay of Islands to the new town of Auckland on the Tamaki isthmus, which was both strategically located and surrounded by land ideal for farming.
New Zealand Company settlements were founded at Wellington in 1840, Wanganui and New Plymouth in 1841, and Nelson in 1842. By 1845 the company had brought about 9000 settlers to the country. In 1842 the main towns had non-Maori populations of 3800 in Wellington, 2900 in Auckland, 2500 in Nelson, 900 in New Plymouth, 650 in Russell and Hokianga combined (which shows how quickly this area was bypassed by settlers), and 200 in Akaroa, where colonists were landed by the French Nanto-Bordelaise Company in 1840. These European enclaves were ‘mere encampments on the fringe of Polynesia’; their very existence was dependent on the tolerance of local Maori. This could scarcely be relied on, as the New Zealand Company had bought land in such haste, and with such little regard for the communal nature of Maori land tenure, that war was at least threatened at each of their sites within a few years. In 1843 a number of Europeans were killed in the Wairau area when they illegally tried to arrest two Ngati Toa chiefs, Te Rauparaha and Te Rangihaeata, for resisting the survey of land that the chiefs denied having sold. Tribespeople led by these chiefs were involved in fighting in the hinterland of the Wellington settlement in 1846; again, Maori were opposing settler encroachment onto land that the Maori held was still theirs. There were several attacks on the town of Wanganui in 1847. In Taranaki the two races teetered on the brink of war for nearly 20 years. After two official investigations of the company's land purchase, the New Plymouth settlers were left to occupy a few thousand acres adjacent to the town. The scarcity of land suitable for agriculture blighted life within the towns. Uncertainty of tenure, and the mediocre quality of much of what was available, slowed sales and led to the acquisition of an increasing number of sections by absentee speculators (a problem which had impeded development in the New Zealand Company towns from the beginning). The resulting under-employment of Wakefield's ‘respectable’ labourers and artisans produced recurrent poverty and unrest. Only the later settlements of Otago and Canterbury could be considered successes. Otago was established in 1848 under the auspices of the New Zealand Company and in co-operation with the Free Church of Scotland. Canterbury followed in 1850, with the support of the Church of England. There were only 2000 Maori in the whole of the South Island, and land purchases there were not disputed at the time.
New Zealand's first Governors—Hobson and Robert FitzRoy—were hamstrung by their acute lack of resources. The British Colonial Office required its colonies to be self-supporting; they were expected to pay their way through customs revenue and land sales. But the New Zealand state was at first unable to obtain much land, despite its monopoly on purchases from the Maori. The latter were not eager to sell at less than a fair market price, which the state could not afford to offer them. The imposition of customs duties drove away traders and raised the price of imported goods. The administration, at times insolvent, survived on Maori goodwill and economic assistance, and minimal financial support from London. In 1844 FitzRoy abolished customs duties, imposed a property tax, and allowed limited direct land dealings between settlers and Maori. The practical effect of these measures was the loss of his only potential sources of substantial revenue. The measures were insufficient to conciliate the Ngapuhi chief Hone Heke, who was concerned at the decline of the Bay of Islands as a centre for European trade and settlement, and at the government's efforts to diminish chiefly authority by partially replacing it with its own. Heke's quarrel was with the state alone; he wanted to preserve the valuable Maori-European economic relationship. He allied himself with the resourceful chief Kawiti, who adapted traditional pa design to successfully withstand artillery bombardment and inflicted a serious defeat on British regular troops at Ohaeawai in mid-1845. Their combined forces had the better of a 10-month campaign which ended after an inconclusive engagement at Ruapekapeka in January 1846. Heke continued to be the most powerful man in the North until his death in 1850, and government influence there remained low. No punishment was imposed on the ‘rebels’.
FitzRoy was replaced during the Northern War by George Grey, who was to rule as Governor until 1853, and again (less autocratically) from 1861 to 1868. Backed, as his predecessors had not been, by adequate financial support from Britain, he was better equipped than they to mollify pakeha grievances about the slow growth of the colony. The European population had reached only 32 500 by 1854, when an elected General Assembly first met in Auckland. Demands for local self-government had nevertheless been voiced since 1840, when a New Zealand Company-appointed regime had ‘ruled’ for several months at Port Nicholson until Hobson declared it illegal. The ‘Wakefield’ settlements were led by well-educated gentry and middle-class families who expected to govern themselves. After Grey successfully argued against the implementation of an 1846 British Act conferring representative institutions, on the grounds that the state of race relations in the North necessitated his being in total control, constitutional associations in several centres agitated for elected assemblies.
The British Constitution Act of 1852 conferred a General Assembly with two chambers—an elected House of Representatives and a nominated Legislative Council—and divided the colony into six provinces (centred on the five Wakefield settlements and Auckland), each with an elected Provincial Council, and headed by a separately-elected Superintendent. The vote was granted to all pakeha men aged 21 or more who met minimal property-owning requirements. Maori were in practice nearly all disfranchised. The Provincial Councils were subordinate to the General Assembly, and were barred from legislating on a range of subjects, including customs duties, currency, the justice system, postal services, and marriage. The central settler government was competent to act in most areas, but ‘native’ policy remained in the hands of the Governor until 1864, and foreign policy was made by the British government. In areas of domestic policy the General Assembly was not completely its own master. The Governor was empowered to reserve New Zealand legislation for the Sovereign's assent, and the Sovereign could disallow legislation after the Governor had assented to it. Both these powers were used, although rarely. The United Kingdom Parliament also had the authority to pass legislation applying to New Zealand, even overriding New Zealand legislation. After considerable confusion, Parliament's right to appoint ministers (whose advice the Governor was normally obliged to take) was recognised and in 1856 Henry Sewell became Premier and formed the first responsible ministry.
Despite the comparatively wide franchise, for several decades only a minority of European males participated in electoral politics. The property test eliminated some, and many who were eligible did not register on the electoral rolls. Until 1879 polls in which fewer than half of those registered voted were common. Most people had more pressing concerns. A small group of men with sufficient leisure time to engage in politics easily dominated the scene; many were elected and re-elected unopposed. While there was a rapid turnover of MPs and ministries in the absence of any party organisation, there was considerable continuity in administration. A core of able men was essential for any ministry which was to last for long.
Most politicians put the interests of their own provinces before the colony's. Having been firmly established for several years before responsible central government came into effect, the provinces had taken over many key matters, including immigration, roading, land administration, policing, education, and hospitals. In 1856 their entitlement to land revenue and a share of customs duties was confirmed. In return they accepted responsibility for colonisation and development. Wide regional and local disparities resulted. The North Island provinces, particularly Auckland and Taranaki, had little land to sell and were always short of funds. Their South Island counterparts, especially Canterbury and Otago, had ample land and were to profit from economic booms which accompanied gold rushes in the 1860s, when they embarked on ambitious road, harbour, tunnelling, and immigration programmes. Wealthy provinces resented central government interference in their affairs, and southerners saw their revenues threatened by increased military expenditure in the North Island in the 1860s. Poor provinces looked to the capital for salvation from insolvency. Within each province the main towns were dominant, and little money reached outlying districts. This stimulated a desire for local autonomy which bore fruit in the creation of the new provinces of Hawke's Bay, Marlborough, Southland, and later Westland. Except for Hawke's Bay, they conspicuously failed to prosper, and their Lilliputian crises brought the whole system into disrepute. Nevertheless, European settlers identified strongly with their own communities, and the difficulty of communication between the areas they occupied made considerable regional autonomy essential.
In the 1840s the Maori were still preoccupied with their own concerns. Inter-hapu and inter-tribal competition was of paramount importance, and society remained fragmented. The very use of the word ‘Maori’, which implied the existence of a common race and culture, was mainly confined to pakeha until the 1850s. European innovations provided new ways to pursue traditional social and economic rivalries. Christianity offered literacy, a skill prized as a new basis for competition. Introduced foodstuffs such as potatoes and pigs, which could be raised in abundance with comparatively little effort, transformed the conspicuous production and ceremonial display of food—the yardstick shifted from quality to quantity. Maori participated vigorously in the colonial economy, exporting potatoes, wheat, and pigs throughout Australasia, and to the Californian goldfields. Maori farmers produced the bulk of New Zealand's exports to the Australian diggings. Horses, sheep, schooners, and flour mills were acquired as symbols of wealth as well as means to its creation. However, Maori agricultural production declined after an 1856 slump in the market in Victoria. European farmers had the advantage of individualised land tenure and, with access to credit, could make better use of technological innovations.
The first census of the Maori population in 1857–58 put the total at about 56 000, less than the pakeha population and only half of Dieffenbach's 1843 estimate. Both figures are doubtful, but the trend was clear. To the toll of diseases such as influenza, whooping cough, dysentery, and measles was added the effects of tuberculosis, bronchitis, and other respiratory tract infections, and low fertility caused by the previous generation's ill-health. High mortality rates contributed to the survival of belief in tapu and makutu (magic). The rituals of Christianity were widely adhered to, but for many Maori offered only partial explanations of an unsettled world.
As more European colonists arrived, questions of land ownership became more pressing. The traditional Maori practice was to reinforce claims to land by regularly using its resources. From this perspective, settlers who paid for land, built houses, and planted crops were generally accepted, but people who piled goods on the shore and disappeared were not taken seriously. From 1840 Maori people quickly became aware of the significance to the pakeha of the land deed itself, and the permanent nature of the alienation which followed its transfer. Yet they offered much land for sale over the next two decades. Many Maori were anxious to have settler communities in their midst as a guarantee of long-term progress. Land sales gave a unique opportunity to vindicate claims to customary title over rivals. The ceremony of payment was usually a vital part of the transaction, while the price paid was less important. Tensions between claimants often made sales acrimonious. Few chiefs obstructed sales on principle, just as few were committed to a policy of selling land. The goal was rather the advantage of one's own hapu.
Extensive land purchases by the Crown during Grey's first governorship were masterminded by his able lieutenant Donald McLean. Most of the South Island was bought for only £15,000, and 13 million hectares throughout New Zealand had been obtained by 1853 at a total cost of £50,000. McLean made huge purchases in the Manawatu, Wairarapa, and Hawke's Bay, while the boundaries of settlement advanced more slowly in the Auckland area. Maori tribes remained in control of a broad belt of territory stretching across the North Island from Taranaki to the Bay of Plenty and the East Coast. Grey's successor, Thomas Gore Browne, was unable to buy much land in this region, even when McLean resorted to secret deals and other underhand tactics in response to increasing settler pressure. Maori attempts to prevent land sales culminated in a pan-tribal movement, the Kingitanga, which in 1858 installed the venerable Waikato chief Te Wherowhero as King Potatau I. Its promoters hoped to end the chronic disputes by placing all Maori land under the King's mana and making its ownership subject to the decisions of his magistrates. But Maori society had no precedents for allegiance to a central judicial or administrative authority. Tribes of the Tainui confederation generally supported the King, but many others did not. The Kingitanga meant more to the chiefs, as a means of bolstering their mana—threatened by European-inspired individualism—than it did to their followers.
Grey hoped to gradually transform the Maori into brown-skinned pakeha, who would ultimately be absorbed by inter-marriage into a predominantly European population. Grey's policy would require radical changes in Maori lifestyle, which he encouraged in a variety of ways. He financed English-language education of Maori children, fostered Maori agriculture and commerce with gifts of ploughs, mills, seeds, and schooners, and employed Maori and pakeha on ostensibly equal terms in the police forces that he controlled. In his second term Grey established a scheme for local administration under which Maori runanga (assemblies) would gradually introduce European concepts of law. The purpose of these ‘new institutions’ illustrates Grey's overall aim: the ‘amalgamation of the races’ was to occur on pakeha terms. Britain had asserted since 1840 that its law applied throughout Aotearoa, but in 1860 much of the North Island was still effectively beyond government control. The war which now broke out had much to do with the contest for land, but it was also a struggle for authority over the people that the land sustained, and for mana.
Fighting began in Taranaki in March 1860, when British troops attempted to remove Te Atiawa tribespeople from land at Waitara which the Crown had allegedly bought, but which most of its claimants had refused to sell. Te Atiawa were soon reinforced by the Taranaki and Ngati Ruanui tribes, and later by Kingite forces from the Waikato region. In June, 350 Imperial troops were heavily defeated when they assaulted a pa at Puketakauere which contained both dummy and concealed defensive positions. For a year the civilian pakeha population remained virtually under siege in New Plymouth, while the British military vainly sought to engage the Maori in a decisive battle. Eventually the British embarked, under cover of a series of redoubts, on a laborious advance, which had achieved no tangible success by the time a truce was agreed in March 1861. Fewer than 1000 Maori warriors had not lost any territory to some 3500 opponents, and were also able to keep the considerable resources plundered from abandoned European properties.
With Grey's return in 1861 the focus shifted to the Waikato. Imperial troops were steadily augmented, a military road was constructed from Auckland to the Waikato River, and the heartland of Kingite power was invaded in July 1863. British forces eventually numbered 14 000 effective troops (more than were available for the defence of England) and were led by a highly competent staff under General Sir Duncan Cameron, but they had great difficulty pushing back Maori opponents who never numbered more than 2000 at one time. Given the inability of the Maori economy to sustain an army continuously in the field, and the many obstacles to effective inter-tribal military co-operation, the Kingite resistance was remarkably successful, but by mid-1864 the Waikato Basin had been occupied up to the Puniu River. The search for a decisive victory now led Cameron to Tauranga, where he was stunningly defeated in a frontal attack on a superbly-designed fortress at Gate Pa, but was able to partially avenge this reverse at Te Ranga a few weeks later.
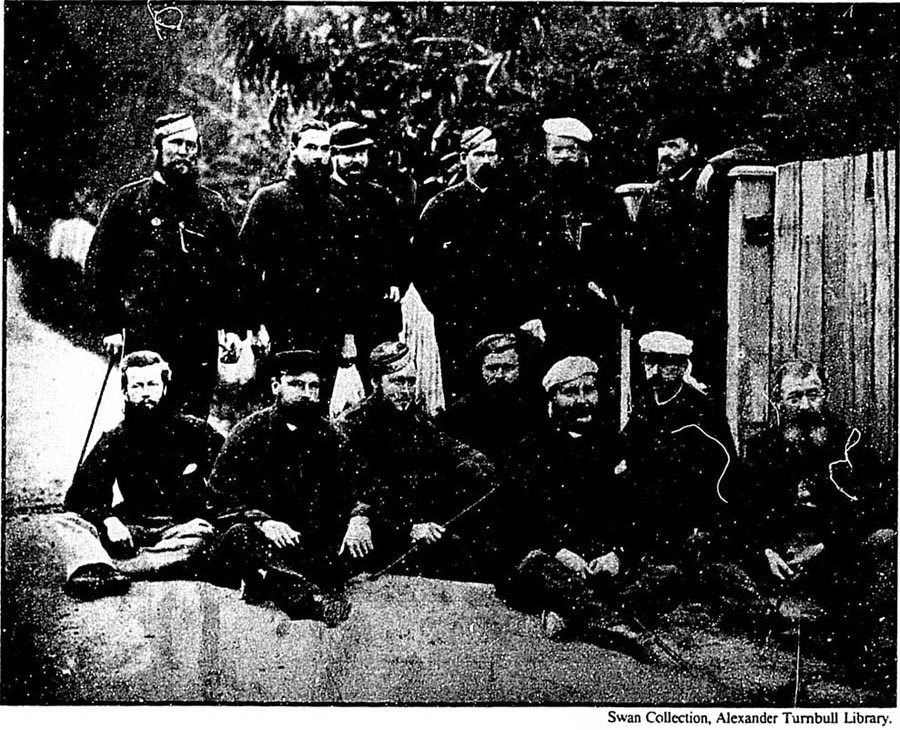
Armed constabulary officers, Waikaremoana Expedition 1869.
The territory occupied in the ‘Waikato War’, about 400 000 hectares, was confiscated by the colonial government, but fighting was far from over. Imperial troops campaigned on the west coast in 1865–66, while colonial units and allied kupapa (pro-government Maori) fought in the east. Both opposed adherents of the new religion of Pai Marire, which combined elements of traditional Maori beliefs, Christianity, and the innovations of its Taranaki prophet, Te Ua Haumene. In 1868, with Imperial forces now withdrawn from active service and ‘native’ policy firmly in the hands of the settler government, a grave crisis abruptly confronted pakeha New Zealand. Belated attempts to implement years-old land confiscations provoked a campaign by the Ngati Ruanui chief Titokowaru, who with a few hundred warriors repeatedly defeated much larger colonial forces until dissension among his followers brought his advance to an end. Simultaneously, the Rongowhakata prophet Te Kooti Rikirangi conducted a brilliant guerrilla campaign in the Poverty Bay area after escaping with some 160 prisoners of war from exile in the Chatham Islands. He proved far less adept than Titokowaru at pa construction and defence, however, and armed support for his cause dwindled until he was forced to seek sanctuary in Kingite territory early in 1872. The zone of effective Maori autonomy had now shrunk, but it still encompassed the ‘King Country’ in the central North Island, South Taranaki, and the Urewera district. Pakeha sovereignty was now an established fact, but it was by no means absolute.
The huge Grey/McLean land purchases were the basis for an expansion of European economic activity. The Canterbury settlement, whose social composition came closest to Wakefield's ideal, was for a few years the colony's best approximation to a concentrated agricultural community. Soon, however, it became the most important base for a rapidly expanding pastoral economy. From the late 1840s, sheep grazing spread across the open country along the east coasts of both islands. Australian ‘squatters’ sold surplus merinos to New Zealand colonists with capital, and from the early 1850s many crossed the Tasman themselves to take up cheap long-term grazing leases. Grey reduced the price of rural land in 1853, ostensibly to help small farmers. The main effect, however, was to allow runholders to consolidate their holdings. By the mid-1860s many had secure tenure. During this ‘golden age’ of pastoralism, overseas prices for wool rose steadily, and sheep numbers increased from 750 000 in 1855 to 10 million in 1870. Wool was king, and the pastoralist came in some ways to resemble Wakefield's rural gentleman, pre-eminent economically, socially, and politically in his domain. But the scale of pastoral farming was very different from the intensive agriculture Wakefield had envisaged. Much of the work (e.g., shearing) was seasonal and undertaken by itinerant labourers; station homesteads were often quite primitive, and usually far from neighbours. Transience and loneliness thus accompanied economic growth.
The quest for wealth from a second staple product—gold—brought more hardship and isolation in the 1860s, even as the population rose rapidly. Beginning in 1861, a series of gold rushes transformed Otago virtually overnight. The province's population increased fivefold (to 60 000) between 1861 and 1863. Then the main focus of activity shifted to the west coast of the South Island, where by 1867 there were 29 000 inhabitants in an area almost unoccupied three years earlier. Mining declined rather quickly in Otago, more slowly in Westland. From the 1880s expensive dredging techniques revived the industry in both regions. The ‘diggers’ had profited less than had merchants, bankers, and farmers. Farmers also benefited from the influx of British troops during the Waikato war. Briefly, their provisioning was one of the colony's main sources of income. Equally briefly, small mixed farms became profitable.
In the 1860s, while the European population of the North Island rose to 97 000, the South Island's European population increased to 159 000. Unequal growth brought political change in 1865, when the capital was moved south to Wellington and the South Island gained 13 additional parliamentary seats. Otago was transformed from an obscure Presbyterian outpost into the foremost commercial and industrial province, with a quarter of the colony's pakeha population producing one-third of its exports. Secondary industries, largest in Otago and Auckland, manufactured a wide range of products for local markets and by 1871 about 10 000 people were employed in manufacturing. The larger towns now contained groups of artisans and labourers with some capacity for combined action. In Dunedin the unemployed demanded relief work as boom turned to slump in the late 1860s.
The Otago-based businessman and politician Julius Vogel became Colonial Treasurer in 1869, and dominated political life until his departure for London in 1876 as Agent-General (a post which combined diplomacy and business promotion). When he took office the income-generating British troops had almost all left and the colony had just survived the severe military crisis of 1868–69. Dependence on world commodity prices had proved to be a mixed blessing, since receipts for wool and gold exports had slumped. The average wool price had fallen to 11 pence per pound in 1870 from 16 pence in 1860. Faced with the prospect of a serious depression, Vogel persuaded his cabinet colleagues to approve a programme of public borrowing to finance growth. Twenty million pounds were borrowed in a decade, mostly from Britain. The role of the state grew; there were four times as many civil servants in 1877 (some 7200) than a decade earlier. A large publicly-owned infrastructure of transport, communication, and other services was established. The 234 kilometres of public railways in 1873 became 1840 kilometres by 1880. One-third of public expenditure in the decade to 1881 went on roads and bridges, which had more practical effect than railways in improving communications in most areas. Also, 6500 kilometres of telegraph lines were built in the 1870s (their construction had begun for military reasons in the previous decade). Expensive harbour projects were undertaken around the country, and there was a boom in residential, business, and public building. Government spending in 1872 was said to be 13 times that of Canada on a per capita basis.
The 1870s was a decade of large-scale emigration from Europe. Most migrants went to America, a significant fraction to Australasia. The arrival in New Zealand within nine years of 115 000 government-assisted immigrants contributed to the near-doubling of the non-Maori population to 490 000 in 1880. Organised communities of Scandinavian, English and Irish came out under special settlement schemes. The first group were prominent in the clearing of the ‘Great Bush’ which covered much of the southern half of the North Island. This unremitting toil, like that of the railway and road builders, laid the foundations for much future development. The immediate result of Vogel's policies, however, was a substantial enlargement of New Zealand society without any corresponding strengthening of the economy. The colony had become more, rather than less dependent on Britain as a source of both capital and income. By 1881 more than 90 percent of export revenue came from the United Kingdom, whereas Australia had taken over half New Zealand's exports in the 1860s. Wool had regained the status of largest overseas earner from gold.
The development of a centralised colonial economy linked by modern communications had political implications. While the implementation of ‘Vogelism’ was much influenced by regional pressures, it transformed the balance of power between centre and provinces. Provincial governments, designed in part as agents of colonisation, were now proving superfluous in this role. In 1871 the central government took over sole responsibility for immigration and railway construction. Opposition to some of Vogel's policies by provincialists in the House led ultimately to the end of the provincial system in 1876, over the protests of wealthy Canterbury and Otago. A network of county councils now joined existing borough councils, road boards, and harbour boards as the units of local government. Regional education, hospital, and land boards soon followed.
A credit squeeze in 1878–79 ushered in some 15 years of economic stagnation, during which export and import prices, and wages all fell roughly in proportion. Burdened with the overseas debts incurred in the 1870s, New Zealand remained dependent on the ability of a depressed British working class to buy its primary products. The most promising development was the beginning of frozen meat exports with the voyage of the Dunedin to the United Kingdom in 1882. This trade grew slowly at first. While there were 21 freezing works in 1892, they were not working to capacity. By then, however, meat exports exceeded £1 million in value annually, second only to wool. Experimentation produced new breeds of sheep, which provided good quality mutton as well as wool, and were suited to the country's dryers pastures. In 1882 New Zealand's first dairy factory opened at Edendale in Southland. Exports of dairy produce also grew slowly, with banks reluctant to finance small farmers’ production of perishable butter and cheese. Mechanisation in processing was paralleled by technological innovations in farming itself. Horse-drawn reapers and binders began to replace men. Traction engines and mechanical threshing mills appeared in the 1880s, as a boom in wheat production saw exports peak at more than £1 million in 1883. Local manufacturers ingeniously adapted agricultural equipment to local needs. The introduction of shearing machines in the late 1880s further reduced the demand for rural labour.
Other products enjoyed fluctuating fortunes. Most important in Auckland ‘province’ (provincial identity long outlived the institutions themselves), timber processing became the country's largest manufacturing enterprise between 1875 and 1885. A substantial export trade in kauri timber was vulnerable to erratic prices, as was the ‘poor man's industry’ of extracting kauri-gum (resin) deposits. Coal was exported from Westland from the mid-1880s. Urban manufacturing continued to grow until about 1886, after which the availability of cheap imports brought a decade of decline. By 1886 the number of industrial workers, including those making handicrafts, had reached 39 000. Most industries were small concerns serving local needs. In 1891 one-third of factory employees produced clothing and textiles, while a fifth made building materials, and another fifth food, drink, and tobacco products. Local manufacturers received some protection in 1888, when the Atkinson ministry imposed a 20 percent tariff on imported goods which competed with locally-made products. Not for the last time, a conservative government proved willing to use the power of the state for economic ends. The low-cost, low-wage conditions under which New Zealand industry operated were highlighted by the report of the 1890 Sweating Commission, which revealed exploitation of women and children in industry. The failure of the 1890 Maritime Strike by seamen, watersiders, miners, and railwaymen emphasised the relative weakness of urban labour in a mainly rural, export-dependent economy.
The wars of the 1860s had brought both unprecedented Maori unity and new divisions. Alliance with the pakeha had offered some tribes the opportunity to settle old scores. While some kupapa fought defensive actions on their own soil, others ranged across the North Island in a manner reminiscent of the large supra-tribal war parties of earlier in the century. Co-operation and resistance continued to be twin motifs of Maori response to the pakeha for several decades after overt warfare ended. On balance, it seems that in this period collaboration was the less successful means of preserving tribal autonomy.
Kupapa and ‘rebels’ both suffered from the land confiscations of the 1860s. Fertility and strategic location were more important considerations for the settler government than the owners’ part in rebellion. The operations of the Native Land Court, established under the Native Lands Act 1865, which permitted the leasing or purchase of land from Maori named in the court's certificates of title, efficiently parted the Maori from much of their remaining land. From 1873, the court operated under a system that was even more clearly weighted in favour of Maori wishing to sell land. In the 1880s land in the King Country itself—where King movement supporters had continued to live in effective independence—began to come before the court, and this paved the way for its purchase. Construction of the Auckland–Wellington railway through Ngati Maniapoto territory symbolised the end of an autonomous Maori zone. By 1892 less than one-sixth of the country remained in Maori ownership, and a quarter of that was leased to Europeans. Most Maori-owned land was rugged and bush-clad. Maori were now only 7 percent of the population; epidemics had reduced their numbers to 42 000 by 1896. Living in poor conditions—many in insanitary, makeshift camps—they grew scarcely enough for their own needs and relied increasingly on public works and seasonal work on European farms.
Yet Maori society remained resilient and adaptable. This was a time of intense political activity, of large tribal and supra-tribal meetings held in splendid new meeting-houses, and of negotiations with pakeha politicians. ‘Loyal’ Maori had been rewarded with four seats in the House of Representatives in 1867 and Maori MPs became increasingly skilled advocates of Maori rights. Ngati Kahungunu kupapa leaders organised a Repudiation movement to challenge the Hawke's Bay land sales of the 1860s. Kepa te Rangihiwinui, who had been one of the pakeha's main military allies, led an anti-land-sales group in Wanganui in the 1880s. In Te Waipounamu, the prophet Te Maiharoa led a heke (migration) of Ngai Tahu, which peacefully reoccupied tribal land in the Waitaki valley for two years, until evicted by armed police in 1879. In Taranaki, land proclaimed confiscated was left in Maori hands for more than a decade before pakeha settlers sought to occupy it. Here Te Whiti o Rongomai and Tohu Kakahi, based at Parihaka, led a movement of passive resistance which attracted wide support, and was only subdued in 1881 by a massive show of military force. The two leaders and many of their followers were temporarily exiled to the South Island. Maori spiritual values remained strong. King Tawhiao's Tariao (‘morning star’) faith recognised guardian spirits and ancestors, and drew on the teachings of Te Ua. Te Kooti proved ultimately more significant as founder of the comprehensive and sophisticated Ringatu faith than as a warrior. The mission-trained Te Whiti claimed God's special protection for the Maori and preached predestination.
While Maori people now participated in the pakeha economy, they generally did so in family groups rather than as isolated individuals. The Maori remained separated from pakeha life by language and culture, as well as by geography. While there was no rigid segregation, they were still a distinct ethnic and social group. In the context of nineteenth-century European expansion world wide, this was no small achievement.
Although 1890 came to be seen as a watershed year in New Zealand history, its significance was less apparent at the time. A general election resulted in a fragile majority for the loosely-organised team supporting Liberal leader John Ballance, who differed from Premier Harry Atkinson chiefly in proposing a graduated land tax which would encourage large landowners to reduce the size of their holdings and allow more small farmers on to the land. In Dunedin and Christchurch, increased awareness of political issues among wage-earners after the defeat of the Maritime Strike had electoral consequences, with the return of candidates sympathetic to labour. In rural electorates, by contrast, abstention from voting remained the most typical form of political activity. The abolition of plural voting had reduced the direct political power of those who owned property in several constituencies, but there was still a ‘country quota’ which gave rural voters 28 percent more strength than was justified by their share of the total population.
Ballance became assured of a viable majority in the House only after Atkinson alienated a number of members by stacking the Legislative Council with new appointees, in a bid to establish an unassailable majority there. The conservative ‘Continuous Ministry’ at last left office, leaving a legacy of constitutional controversy, which did much to unify the Liberal alliance. Ballance now sought to make his own appointments to the upper house. After two years’ argument the British Colonial Secretary instructed New Zealand's Governor to acquiesce. This ended the Governor's substantive role in politics. An Act set a seven-year term (as against tenure for life) for future legislative councillors and reduced the upper house to the effective status of a debating chamber. These events, together with the extension of the franchise to women in 1893—a result of the unwillingness of the new Liberal leader Richard John Seddon to alienate a powerful feminist-temperance alliance—gave New Zealand politics a markedly more democratic appearance.
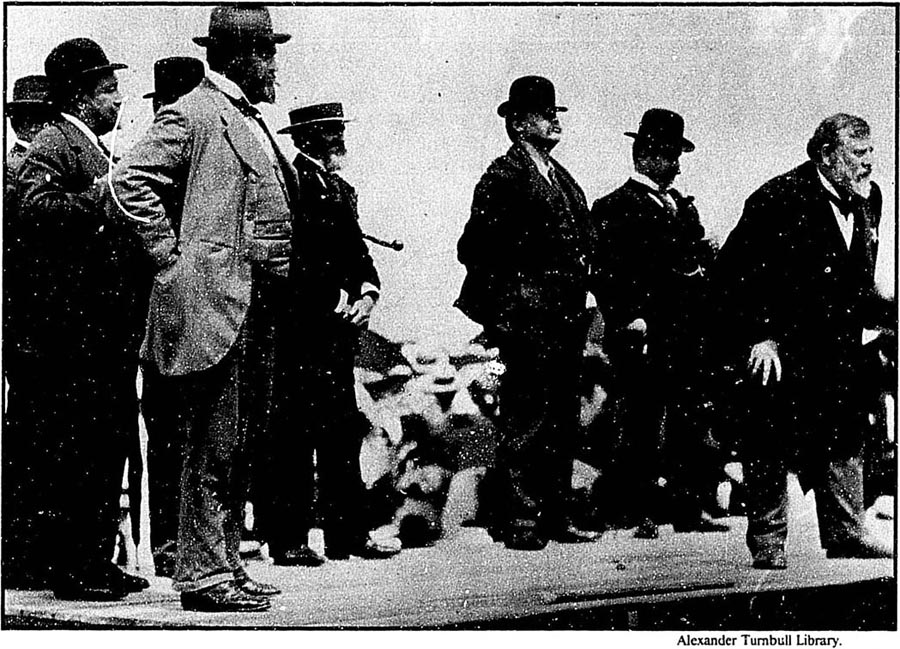
Premier Richard Seddon (right) addressing a rally near Greytown in the late 1890s.
Liberal legislation at first focused on land issues. The Land and Income Assessment Act 1891 imposed a modest, and modestly-graduated, tax on unimproved land values. This tax was a minimal imposition on prospering pastoralists, who sold up (when they did so) because rising land prices made it worthwhile. In 1892, Minister of Lands John McKenzie offered Crown lessees an optional 999-year lease without revaluation—this was freehold tenure in all but name. By 1907 more than 5000 Crown tenants had taken up some 1 million hectares under this tenure. These measures fostered Liberal support in the country-side, and in the 1893 election the party doubled its rural representation. Overall it now held 51 of the 74 European seats. The Advances to Settlers Act 1894 offered state loans to (non-Maori) settlers at reasonable interest rates. Its chief beneficiaries were not new ‘bush farmers’, but established farmers who could borrow to make improvements.
The success of these policies was much enhanced by a steady rise in export receipts after 1894. This income allowed the government to borrow for public works construction, land purchase, and loans to farmers, and enabled farmers to service their mortgages from increased earnings. By the end of the 1890s the full impact of refrigeration was bringing significant economic changes. In 1901 there were nearly 5000 dairy farmers, and by 1911—when they totalled one-third of all farmers—there were three times as many. The trend towards intensive farming was firmly established, as small-scale production became commercially viable. Before 1890 it took many sheep or a substantial herd of cattle to make a living; by 1900 a few hundred sheep or a handful of dairy cattle would suffice. Subsistence farming, widespread in the nineteenth century, now declined. Farming became a business, and increasingly a family business, as mechanisation brought a decline in the number of rural labourers. There were now three farm-produced export staples rather than one, although earnings from wool continued to be greater than those from meat or dairy products.
Townspeople profited from an expanding rural economy. Urban workers also benefited from legislation sponsored by the Liberals’ first Minister of Labour, William Pember Reeves. The Factories Act 1894 provided for regular inspection of factories, closely regulated the conditions of employment of women and children, and restricted the working week in most industries to 48 hours. The Industrial Conciliation and Arbitration Act 1894 set up a mechanism for peacefully settling industrial disputes, and in the process elevated unions to equal status with employers in the bargaining process. Disputes not resolved by negotiation were to be settled by a central Arbitration Court, whose decisions were binding. Registration of unions was voluntary, and direct collective bargaining remained an option. But the collapse of unionism after 1890 made the new system appear attractive, and most unions sought the recognition offered. Union membership soared from some 8000 in 1896 to 57 000 in 1910. Reeves was not present to witness this growth of the labour movement. In 1896, unable to win support from his colleagues for a new round of radical legislation, he became Agent-General in London. His departure left urban wage-earners without an effective voice in the government, which was now dominated by the populist improvisation of Seddon, McKenzie, and a latter-day Vogel, Colonial Treasurer Joseph Ward.
The Liberals created 12 new government departments, of which two were particularly notable. The Labour Department, initially set up in 1891 as the Bureau of Industries, was envisaged by its first Secretary, Edward Tregear, as a ‘benevolent bureaucracy’ which would act as a buffer between capital and labour. His staff, who numbered 83 full-timers and many part-time inspectors by 1908, administered Reeves’ legacy. The Department of Agriculture, also created in 1891, increasingly assumed important regulatory functions. Systematic grading and branding of export produce was carried out at major ports. Farm inspectors ensured hygienic milking and milk storage, and campaigns against pests and stock diseases were stepped up. The Journal of Agriculture was founded in 1910. In 1893 the government took over direct control of the railway system, and set about expanding it. The country had 3200 kilometres of line by 1896 and 4800 kilometres by 1914. The North Island main trunk line was completed in 1908. Railways opened up whole areas for settlement—notably the hinterland of Auckland ‘province’—by making practicable the movement of supplies and farm produce. Provision of railways and roads remained of vital importance in local and national politics, and not only for economic reasons. Improved communications did much to reduce the demoralising isolation of backblocks living.
Other government functions also expanded. In 1903 the state asserted its control of all future hydro-electric power generation, and in 1911 the first large power station was completed at Lake Coleridge in Canterbury. Old-age pensions were introduced in 1898 to assist the growing numbers of destitute elderly people. As immigration grew relatively less important and family size also fell—women who married in 1880 averaged 6.5 live births, compared with 2.4 for those married in 1923—the proportion of the aged in the population grew. Young people also benefited from the government's increased social role. The 1877 Education Act had set up a colony-wide system of primary education, through which four-fifths of the country's five to 15-year-olds were receiving instruction by 1891. After George Hogben became administrative head of the Education Department in 1899 the primary school service was much improved, the secondary system expanded, and technical education introduced. Activity in all these areas (and in others, such as health) required many more civil servants. In the past, government ministers had made most appointments, and controlled much of the day-to-day administration of ‘their’ departments. This became impractical as the functions of the bureaucracy grew more specialised. From 1912 appointment on merit, job classification, and standardised procedures were the norm. As in other Western economies at this time, private bureaucracies were also growing, and wage and salary earners made up an increasing proportion of the work-force.
By 1900 the Liberal Party had a mass organisation as well as strong leadership. The Liberal-Labour Federation united regional associations through a national council and annual conferences. For the first time ordinary people could become members of a political party. But, while the Liberals remained dominant in Parliament after Ward became Prime Minister on Seddon's death in 1906, social and economic forces gradually split the alliance between urban wage-earners and small-to-middling farmers which sustained them in power. As they became more established, small dairy and mixed farmers grew more critical of the government which had in many cases given them their start on the land. Demand for the freehold became a rallying cry. Free trade, unrestricted access to Maori land, and freedom from government regulation, and from the spectre of socialist trade unionism, were other demands. The New Zealand Farmers’ Union, launched in 1899, spread especially rapidly in newly-opened North Island districts. Its leadership soon comprised established as well as struggling farmers, and increasingly it supported the new Reform Party, led by William Ferguson Massey, which also gained the backing of protection-dependent urban businessmen after dropping free trade as party policy.
Meanwhile, urban workers grew disenchanted with the government as their share of the country's growing prosperity diminished after 1900. Real wages fell as the Arbitration Court delivered more miserly and belated award increases. In addition, up to 10 percent of the work-force continued to be intermittently or seasonally unemployed. Although this was much less than the one-third comparably affected in Edwardian England, rising national income was clearly being distributed unequally. Both the arbitration system and the political alliance which had produced it were called into question. Unionists and socialists formed a Socialist Party, a Federation of Miners, and (in 1909) a Federation of Labour, which urged member unions to refuse arbitration and take direct action to achieve radical goals. Many leading militants had come from Australia, where an Irish-dominated working-class culture had developed nationalist, anti-British characteristics. In the decades around 1900 there was much movement of labour between New Zealand and Australia as economic conditions fluctuated. Many sheep-shearing gangs followed a regular seasonal route through both countries. A few socialists came from the United States, where revolutionary organisations like the Industrial Workers of the World preached the overthrow of capitalism through the unification of workers into ‘one big union’ with the strength to confront the state.
Losing support at both ends of the political spectrum, the Liberals failed to gain a clear majority in the 1911 election, and in 1912 enough MPs crossed the floor of the House to bring down the government. Massey now led a Reform Party government which in effect offered a more efficient administration of the Liberals’ heritage. He moved first to defeat the challenge from the left. A 1912 dispute at the Waihi goldmine, over whether workers should accept arbitration under the 1894 Act, eventually ended in police-backed violence. In 1913 a ‘lock-out’ on the Wellington waterfront led to a general strike by watersiders, seamen, and coalminers. This was defeated after thousands of middle-class and farmer ‘special constables’, supporting the regular police and sustained by logistical backing from the military, fought with unionists on the streets of Auckland and Wellington. Clearly unable to overthrow the government by direct action, the militants turned to more conventional politics. A total of six ‘Social Democrat’ and Labour MPs were elected in 1914, and in 1916 a Labour Party was formed. If any one cause united Labour supporters behind their new party, it was opposition to military conscription, which was introduced in 1916, as New Zealand troops began to suffer the torments of the Western Front. The ‘Great War’ also marked the development of a sense of national identity in many New Zealanders. Since 1870, when dissatisfaction with Imperial troop withdrawals and declining prices on London markets had led to talk of secession and alliance with the United States, pakeha New Zealanders had taken for granted a position of loyal subordination within the British Empire. Remoteness from its centre was offset by the guarantee of security provided by the Royal Navy, and the facts of economic dependence. Throughout the period from 1875 until the Second World War, roughly 80 percent of New Zealand's exports were sold to the United Kingdom, and at least half its imports came from that country. Failure to join the Australian federation (created in 1901) was in large part an acknowledgment that New Zealand's most vital interests lay elsewhere. The ‘colony’ was officially renamed a ‘dominion’ in 1907, but this was seen as recognition of autonomy rather than full nationhood.
Wartime support for Britain modified attitudes of dependence. The 6500 volunteers who went to the South African War (1899–1902) saw themselves as superior mentally and physically to their British regular-force counterparts. The experience of the First World War—103 000 New Zealanders served abroad, and some 18 000 died, out of a total population of little more than a million—reinforced claims of military excellence. These were enhanced by the heroic assault on Chunuk Bair in August 1915, during the Gallipoli campaign; achievements at Passchendaele in October 1917; and the role of the New Zealand Division in helping stop the great German advance in the spring of 1918. Although Massey claimed (unconvincingly) that in signing the Treaty of Versailles he did not act as the agent of a sovereign state, many New Zealanders felt they had earned statehood. The country was now a minor colonial power in its own right, having annexed the Cook Islands in 1901 and bloodlessly conquered German Samoa in August 1914. Prowess at the ‘national sport’ of rugby football had also become a source of (mostly male) patriotic pride after an all-but-undefeated tour of the British Isles by a representative team in 1905–6.
War had widened domestic divisions. While farmers profited from the commandeer system, under which the British government guaranteed purchase of New Zealand's main exports, the cost of living rose in towns and cities, and by 1919 real wages were lower than at any time since the turn of the century. The Protestant Political Association, which claimed to have 200 000 members in 1919, vigorously opposed ‘Rum’, ‘Romanism’ (i.e., Roman Catholicism) and ‘Rebellion’ (i.e., the Labour Party). Massey won his first decisive electoral victory in 1919. Reform now had 46 seats to the Liberals’ 20 and Labour's eight. But the government had won only 36 percent of the vote, and Labour's share had reached 24 percent. Throughout the 1920s the existence of a three-party system was to lead to much greater fluctuations in seats won than in voting patterns.
Political instability reflected economic uncertainty. Soldiers had returned to promises of a ‘land fit for heroes to live in’—the state would put them on farms, or at least provide loans for this purpose. But government resettlement policies further fuelled a rise in land values initially sparked by wartime guarantees of markets. Between 1915 and 1925 some 40 percent of occupied land changed ownership, much of it for a great deal more than it was worth. Rural prosperity ended abruptly in 1921–22, when export prices fell sharply. In response, the government legislated. The Meat Export Control Act 1922 established a board to handle beef and mutton exports, and a 1923 Act regulated dairy exporting. Massey's successor as Reform Party leader and Prime Minister, J. Gordon Coates, was responsible for the Rural Advances Act 1926, which created a new section of the State Advances Department to grant rural first-mortgage loans, and also for the Rural Intermediate Credit Act 1927. Coates’ government implemented a substantial public works programme, building hydro-electric power stations, railways, and roads. It also introduced a child allowance in 1926. Once again, a purportedly conservative administration was expanding the state's economic role.
Urban wage-earners, whose incomes were cut during the 1921–22 slump, looked to Labour to protect their interests. Labour now had to modify its radicalism to expand its appeal. It could not hope to govern without rural votes, which were denied Labour so long as they were seen as advocates of land nationalisation. Meanwhile, dissatisfaction with Coates’ leadership grew among businessmen who resented his promotion of state activity, and farmers who had looked to him to break the bitter cycle of falling returns, fixed mortgage repayments, and increasing costs. The temporary beneficiaries of this disillusionment were the Liberals, who (renamed United and again led by the now ageing and ailing Ward) won more seats than either of their rivals in the 1928 election by opting for the old policy of borrowing for development. But, as export prices plummeted, depression deepened and borrowing proved impracticable. In 1930 United and Reform formed a coalition which comfortably won the 1931 election. This government moved to assist farmers through a 25 percent devaluation of the currency, a series of mortgage adjustment Acts, and lowered freight and interest rates. These measures did little to reduce growing support for radical monetary reform, which was advocated by the Douglas Credit movement and influenced Labour policy.
Giving priority to defending farmers’ incomes worsened conditions in the cities. Most wages and salaries were cut by 10 percent in both 1931 and 1932. Such savage deflation in an already contracting economy led to an eighth of the work-force being unemployed by 1933. Government determination that the jobless should earn the meagre relief provided under the 1930 Unemployment Act (which levied a special tax on all males aged over 20) resulted in labour-intensive make-work projects and the establishment of spartan camps for single men in isolated areas. Sporadic outbreaks of violent protest in the main cities in 1932 were blamed by Prime Minister George Forbes on a ‘lawless minority’ and Communist agitation. His response was the Public Safety Conservation Act, which empowered the government to proclaim a national emergency and assume Draconian powers when public order was thought to be endangered. ‘Disloyal’ public servants, including those who protested against wage cuts, could now be dismissed under the Finance Act 1932. Resentment of the government became widespread.
New Zealand's non-Maori population grew from 625 000 in 1891 to almost 1.5 million in 1936. This increase was uninterrupted, but slowed markedly in the 1930s as hard times led to fewer births and a net outflow of migrants. Until then immigration was continuous—there was a net inflow of some 200 000 between 1901 and 1928—but immigrants were a steadily diminishing proportion of the population. For this reason, and also because there was an even balance of the sexes among immigrants in later decades, the proportion of women to men increased. At the height of the gold rushes in the 1860s there had been only five pakeha women in the colony for every eight men. The ratio had reached nine to 10 by 1901, and 97 to 100 by 1936. As unmarried men grew relatively fewer, some of the characteristic problems of frontier societies—such as alcoholism, crime, and loneliness—became less prevalent. The transience (enforced by the ephemeral nature of much employment) which had seen a majority of income-earners changing localities several times each decade also gradually diminished. The rural frontier moved forward more slowly, and in the 1930s contracted, as many marginal back-country farms were abandoned.
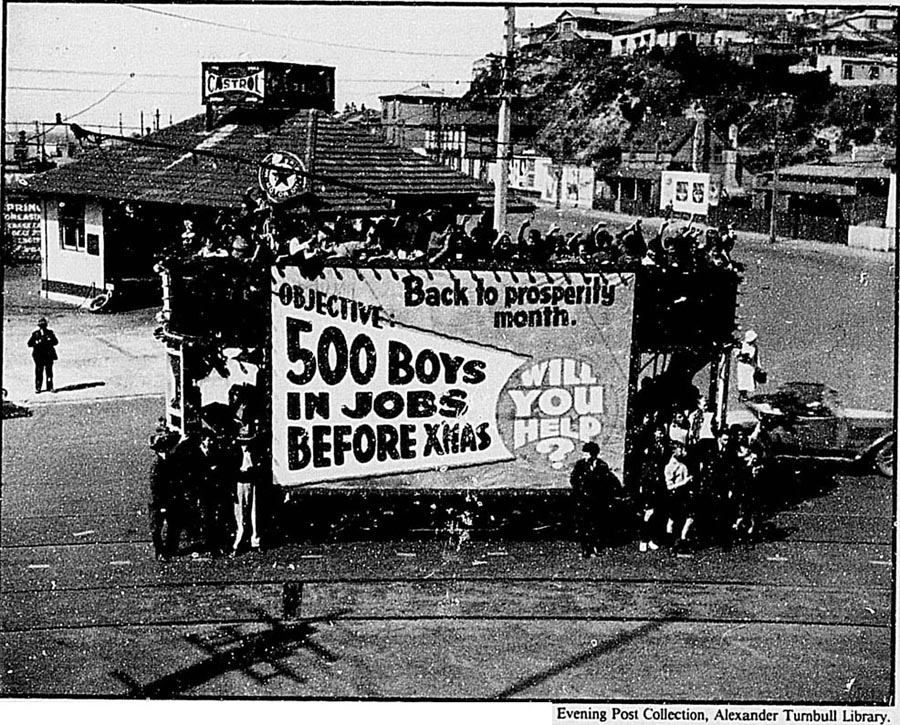
Youth employment promotion, Wellington 1932.
There was a gradual but persistent movement of population from rural to urban areas, although this was arrested in the 1930s by the growth of public works camps. In 1896, 29 percent of the non-Maori population lived in towns of more than 8000 people; by 1936 the figure was 49 percent. The opening-up of the North Island's farming hinterland before the First World War, and industrial development between the wars, saw its share of the population rise from half in 1900 to 65 percent in 1936. Non-Maori people were nearly all of northern European origin. Gold had attracted 5000 Chinese migrants by 1874, but discrimination and restrictions on immigration saw their numbers fall to little more than 2000 by 1916. About the same number of people of Yugoslav birth were living in New Zealand in 1911—most in the North Auckland peninsula. By 1936 some 1200 Indians were resident in the country.
Mechanisation brought substantial productivity increases in the primary sector, whose share of the total work-force fell from 42 percent in 1896 to 30 percent in 1926. Some primary industries declined in absolute terms, not merely relatively, as resources were concentrated on the three major export products. Kauri-gum production fell from a 1903 peak, the flax industry declined in the 1930s after fluctuating wildly, and gold and timber had ceased to be significant exports by 1914. Coal mining, which had expanded chiefly to provide fuel for the growing railway system, stagnated as railway construction slowed down. Urbanisation was paralleled by the growth and diversification of secondary industries. By the 1920s the manufacturing industry's share of the gross domestic product was only slightly less than that in Australia and the United States, despite New Zealand's relative lack of protective barriers. Industry was typically small-scale, mixed, and unsophisticated, and processed imported components. In the 1920s motor-vehicle assembly and metalworking expanded significantly. By 1926 some 45 percent of the work-force were employed in the tertiary sector (providing services and doing ‘white-collar’ work). New Zealand had become a predominantly urban, yet farming-dependent, nation. It remained Britain's outlying farm as it developed many of the social and demographic characteristics of an industrialised society.
Even after 1890, Maori resistance to pakeha dominance was occasionally physical. In 1895 Urewera Maori obstructed a survey until overawed by a military party. In 1898, 120 men of the regular army confronted followers of the Hokianga tohunga Hone Toia. Serious bloodshed in this ‘Dog Tax War’ was averted only by the timely intervention of the MP Hone Heke Rankin. In 1916 ‘the last shooting in the Anglo-Maori wars’ occurred when armed police fought a gun battle with followers of the Tuhoe leader Rua Kenana (founder of the Wairua Tapu religion), killing two of them. Increasingly, resistance took new forms. Petitioners sought the aid of the Crown in persuading the New Zealand Government to honour the terms of the Treaty of Waitangi, which now gained a status among Maori which many had not granted it in 1840. The King movement set up its own parliament (Kauhanganui) under a constitution promulgated in 1894. More significant—even though pakeha legislators refused to acknowledge it—was the rival Kotahitanga parliament, promoted chiefly by kupapa leaders, which met annually from 1892 to 1902.
Expansion of the ‘native schools’ system in the 1870s (there were 57 by 1879) laid the basis for an influx of gifted students into church boarding-schools such as Te Aute and St Stephen's Colleges in succeeding decades. A group of former Te Aute students took the Irish-Maori MP James Carroll as their mentor (he held a general electorate from 1893 to 1919, having earlier represented Eastern Maori). They called themselves the Young Maori Party and advocated the wholesale adoption of pakeha culture. ‘There is no alternative but to become a pakeha’, said Maui Pomare, who had become the first Maori Health Officer in 1900. Pomare and his assistant Te Rangihiroa (Peter Buck), who was Director of Maori Hygiene from 1920, worked for improvements in sanitation and living conditions. The Maori population rose from 45 500 in 1901 to 57 000 in 1921, due to a decline in the frequency of epidemics, the gradual acquisition of immunity to them, and an increase of numbers in the child-bearing age group. Life expectancy rose from around 25 years in 1890 to 35 in 1905. But Maori health was still comparatively poor. The death rate in the influenza pandemic of 1918 was seven times that for Europeans.
Although Carroll was Minister of Native Affairs, the Liberals transferred 1.2 million hectares of Maori land to pakeha ownership. Reform alienated a further 1.4 million hectares. ‘Maori landowners, rather than the squattocracy, were vanquished by the state's promotion of closer settlement.’ Improvements in Maori farming came through communal initiatives. In the 1890s the Ngati Porou tribe, who retained much land on the East Coast of the North Island, embarked on large-scale pastoralism. By the mid-1920s they owned a million sheep, as well as a dairy factory, a finance company, and a co-operative store. Apirana Ngata (himself a Ngati Porou) as Native Minister sponsored a 1929 Act which channelled state credit to Maori farmers through the Department of Native Affairs. By 1937, the 750 000 acres being developed under this scheme were supporting about 18 000 people, most of whom lived in communities on or near the land they were working. Ngata, although a member of the Young Maori Party, believed in fostering a communal rural lifestyle which continued Maori traditions.
While Maori in Parliament became skilful practitioners of taha pakeha (the European aspects of living), local leaders continued to have the most effective influence over Maori community life. None gained more stature than Te Puea Herangi, a member of the Waikato kahui ariki (paramount family), who came to prominence in the Kingitanga by leading a campaign against the conscription of Waikato Maori during the First World War. In 1921 she established a model pa at Ngaruawahia, and from the 1920s she was a figure of national importance for Maori. With her support, Ngata's land development schemes allowed Waikato communities to preserve their traditional way of life, while productively occupying their own lands.
Gordon Coates was the first pakeha politician to provide leadership on Maori issues. As Minister of Native Affairs between 1921 and 1928 he was determined to ‘remove the old grievances so that economic and social change could proceed’. Among many initiatives, he established the Sim Commission to investigate the Waikato and Taranaki land confiscations (its findings largely upheld Maori grievances), and also the Maori Purposes Fund to make grants for educational, social, and cultural activities. With Ngata as Native Minister from 1928 to 1934 the momentum of reform continued. But the leadership of these two politicians began to be challenged by the spiritual leader Tahupotiki Wiremu Ratana, who was an advocate for the interests of the ‘morehu’—detribalised, non-chiefly common people—to whom he offered a vision of spiritual and material betterment. His teachings seemed increasingly attractive as the Depression worsened. Maori are thought to have comprised some 40 percent of the jobless, and by 1933 three out of every four adult male Maori were registered as unemployed.
The Labour Party won power in the 1935 election, when it gained a total of 59 seats (counting a few sympathetic independent MPs) compared to the 19 retained by the Coalition government's candidates. In 1938 it was re-elected, with an increased share of the vote and 53 seats to the new National Party's 25. These successes inaugurated a 14-year tenure of office which, like the Liberal era of the 1890s, was to establish new patterns and set the terms of economic and political debate for the next 40 years. Like the Liberals, Labour benefited by being elected as the economy recovered from depression. And, as befell the Liberals, the administration of Labour's achievement was eventually to be taken over by its conservative political opponents.
Labour won office because it was seen to represent a genuine alternative to the orthodox economic policies which had entailed hardship for too many. In addition, although export prices and the general economy were recovering in 1935, dairy produce receipts were still low. Discontented dairy farmers, who approved Labour's promises of guaranteed prices and cheap credit, were decisive in turning the Coalition's defeat into a rout. Led by the former ‘Red Fed’ and Socialist Party militant Michael Joseph Savage, the Labour government moved to restore and direct the economy and introduce a comprehensive social welfare system.
Previous cuts in wages and conditions of employment were reversed, and the normal manufacturing working week was reduced to 40 hours. Pay rates for relief work were substantially increased. Unemployment fell to 38 000 in 1936, and continued economic growth combined with a large public works programme to leave only about 8000 on ‘sustenance and relief’ by December 1937. In 1936 full jurisdiction was restored to the Arbitration Court, and union membership was made compulsory for all workers subject to awards. The number of unionists rose in consequence from 103 000 in 1935 to 249 000 in 1938. The Agricultural Workers Act 1936 set a minimum pay rate for previously unprotected rural labourers, and required the provision of decent living conditions for them. By buying out private shareholding in the Reserve Bank (created by Coates in 1933 to give the state some control over monetary policy), the government assumed conclusively the power to use the ‘people's credit’. Finance issued by the Reserve Bank underwrote housing construction, public works, and guaranteed prices for dairy products. Cheap mortgages from the revitalised, government-controlled State Advances Corporation helped efficient but indebted farmers remain on the land.
During Labour's 14 years in power some 30 000 ‘state houses’ (government-owned, privately-built rental dwellings) were constructed. State Advances mortgages financed a further 19 000 houses built for private ownership in the same period. The two schemes together gave government assistance to two in every five houses built. Spreading state house suburbs whose inhabitants shared similar lifestyles came to symbolise an egalitarian ‘levelling upwards’ in the quality of New Zealand life. Educational reforms included the lowering of the school-entry age from six to five. The primary-level Proficiency examination was abolished and, after the leaving age was raised to 15, was effectively replaced by the new School Certificate. These changes required much greater spending on school construction and teachers’ salaries. The landmark Social Security Act of 1938 was intended not merely to provide a subsistence income but to meet the ‘normal needs’ of beneficiaries. Essentially free general medical care was introduced against the bitter opposition of doctors, who, ironically, were to be the group who benefited most from the new ‘welfare state’. Social security and public admiration for Savage were major factors in Labour's 1938 electoral triumph, which was blighted only by the recapture of some rural seats by a more united parliamentary opposition.
The government now looked forward to years of development, but was immediately reminded that New Zealand remained a small, dependent trading economy. Withdrawal of private capital combined with the expense of overseas-purchased machinery and supplies to reduce the country's sterling reserves from £29 million to £8 million in the six months before foreign exchange controls were introduced in December 1938. Minister of Finance Walter Nash won few concessions in months of negotiation with the British government and financiers. But bleak prospects were transformed by the outbreak of the Second World War. Britain rapidly agreed to bulk purchase arrangements at prices favourable to New Zealand for meat and dairy products, and later wool. Imports declined as European production was diverted to war purposes or made unobtainable by shipping difficulties. The exchange crisis was quickly succeeded by a healthy balance of payments surplus, which even allowed the repayment of some earlier loans.
As in the First World War, the country's major contribution to the Allied effort was the provision of food, which went mostly to Britain, and later to the Pacific theatre. While the war claimed some 12 000 New Zealand lives and saw 17 000 wounded, these were significantly lower casualties than the First World War inflicted on a society of half a million fewer people. Nevertheless, some 150 000 were serving in the armed forces when they were at their peak, and civilians were mobilised in support of the war effort. Prices and wages were tightly controlled, and the labour force was subject to direction into essential occupations. Secondary industry, already stimulated by economic expansion, public works, and import licensing, was now boosted by the need for greater self-sufficiency. A ‘hot-house growth of manufacturing’ resulted as many small, previously marginal ventures secured a disciplined labour force and guaranteed markets. The strongest growth occurred in Auckland, which was the largest focus for the urbanisation which had resumed with the end of the Depression. With so many men in the armed forces, women entered the work-force in large numbers. The proportion of Public Service clerical workers who were female rose from 5 percent in 1939 to 25 percent in 1947. By 1945 nearly 15 percent of married women under 30 were in full-time employment, a percentage which was not to decline after the war ended. From national necessity, many women entered rural and industrial occupations previously assumed to be ‘men's work’.
As with perceptions of women's role in society, assumptions about New Zealand's place in the world were irrevocably altered by the Second World War. The Balfour Report of 1926 recognised that Britain's dominions were de facto independent states. The Statute of Westminster of 1931 effectively relinquished the British parliament's power to make laws for the dominions. New Zealand was not to accept this formally until 1947. The Labour government, like its conservative predecessors, sought consultation with Britain rather than an independent foreign policy. In the late 1930s New Zealand's support for the League of Nations and collective security brought disagreement with the appeasement-minded British. In 1945 Prime Minister Peter Fraser was to be a leading advocate for the rights of the small nations represented in the new United Nations organisation. In the intervening years the limits of British power had been particularly brought home by the rapid capitulation to the Japanese in 1942 of the vaunted Singapore military base. The necessity of reliance on United States protection was underlined by the wartime presence of 100 000 American ‘GIs’ at New Zealand staging bases. Unlike Australia, New Zealand kept its best fighting troops in the Mediterranean theatre throughout the war. After participating in the unsuccessful defence of Greece and Crete in 1941, they endured the hardships of the North African desert and the slow, difficult advance through Italy. Although operating within the British command structure, New Zealand troops remained under New Zealand Government control. The war also stimulated a redirection of New Zealand trade. New Zealand's exports to non-British markets doubled to about 40 percent of all its exports in the decade after 1941, and were never to return to the levels of the previous half-century.
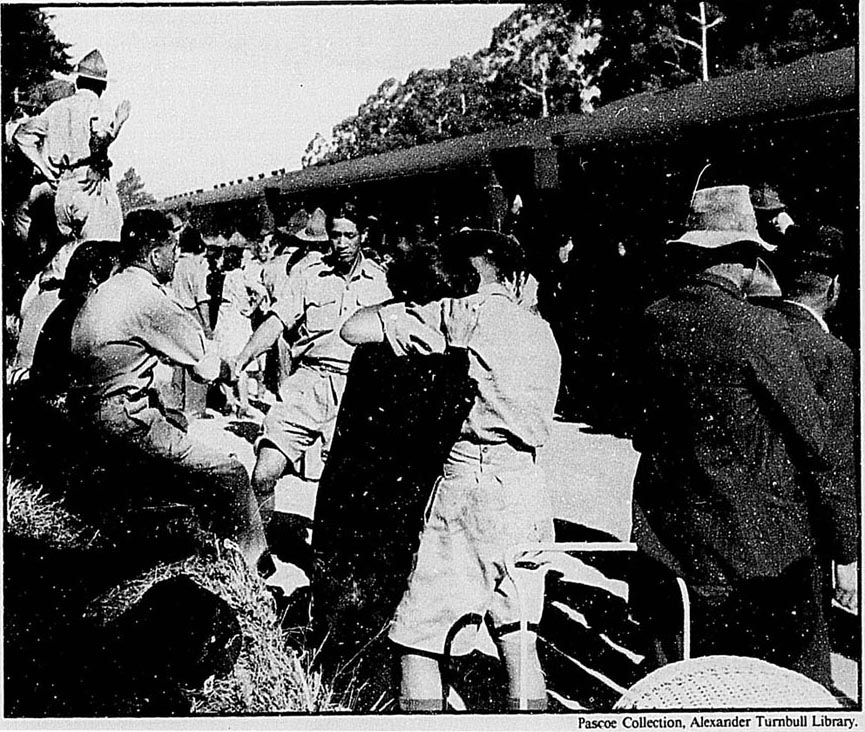
Maori Battalion reinforcements leave Rotorua, 1944.
While a multi-party War Cabinet made the major decisions, Labour's regular Cabinet continued its largely domestic business. Pragmatic politics counterpoised national sacrifice. The 1943 Servicemen's Settlement and Land Sales Act empowered the government to control prices in all land transactions, and to buy land suitable for subdivision. Farmers hoping to profit as before from a wartime rise in land values, and dissatisfied with the level of guaranteed prices, turned against the government. Despite its abolition of the country quota, Labour won a majority of only four seats in the 1946 election. In contrast with 1919, the reintegration of returning service personnel into the economy was impressively successful, backed as it was by full employment, enforced wartime savings, and guaranteed markets abroad. But the continuation of many wartime restrictions—symbolised by the 1948 Economic Stabilisation Act—was irksome. Maintaining supplies to impoverished Britain required continued rationing, electricity use was limited, and soaring marriage and birth rates outstripped house building.
The post-war National Party promised more efficient management of key Labour gains and greater personal freedom (such as the right of purchase for state house tenants). Led by Sidney Holland, National won the 1949 election. In 1951 it increased its majority in a rare snap election called to take advantage of the government's crushing termination of a major industrial dispute which had been precipitated by a breakdown in relations between water-front workers and their employers. The Labour Party, though clearly not laggards in their enthusiasm for the ‘Cold War’—they introduced peacetime compulsory military training in 1949—were outmanoeuvred by a government which consolidated its support around the popular themes of ‘law and order’, anti-communism, and curbing the unions. Labour's ambivalence towards the strikers reflected divisions within the union movement, inside which a militant Trade Union Congress had emerged in opposition to the cautious Federation of Labour.
National continued to present itself to the electorate as the party which would best defend the ‘national interest’ against divisive sectional concerns. Buoyed by continuing prosperity, it was interrupted in its self-stated role as the ‘natural party of government’ only by the one-term Labour administrations of 1957–60 and 1972–75. Both these periods saw adverse alterations in New Zealand's terms of trade. Both Labour cabinets made changes too rapidly for the liking of an electorate more comfortable with the ‘steady-does-it’ approach epitomised by (later Sir) Keith Holyoake's term as Prime Minister in the 1960s. In that decade political life sometimes seemed to dimly reflect the American scene; New Zealand troops fought in Vietnam, New Zealand youth rebelled against their parents’ staidness and complacency and the voices of New Zealand's indigenous inhabitants began to be heard by the wider society. Seen as more efficient at managing a mixed economy, the National Party retained power even in the troubled economic times between 1975 and 1984.
In the quarter-century after 1950, New Zealand for many at last lived up to Seddon's characterisation of it as ‘God's Own Country’. National wealth per head rose continuously, if at varying rates, until the ‘oil crisis’ of 1973 began a period of stagnation. Standards of living mirrored this ‘pervasive prosperity’. The proportion of houses owned rather than rented rose from 61 percent to 69 percent during the 1950s. Low-cost suburban bungalows of uniform style were furnished with a widening range of consumer durables. Electric stoves, refrigerators, and washing-machines, found in only about half of all houses in the 1940s, were nearly universal by the mid-1960s (as were radiograms and, eventually, television sets). New Zealanders had more choice in spending their increasing discretionary incomes. Although many men remained preoccupied with sport, home-centred leisure (gardening, reading, television watching) increased with suburbanisation. Car ownership and substantial expenditure on roading (secondary routes as well as showpiece motorways) brought unparalleled mobility to many. Passenger use of railways declined as air transport came to dominate long-distance personal travel.
The dream of creating a materialist Utopia in New Zealand was kept alive by the unprecedented continuation of full employment for 30 years after the Second World War, when for the first time there had been the possibility of a job for almost everyone who wanted one. More white-collar work balanced a continuing relative decline in rural employment. The proportion of the labour force employed in agriculture fell from about one-third in 1938 to an eighth in the early 1970s, while farming productivity rose at about 1 percent annually, as all aspects of farm management became more sophisticated. Capital improvements compensated for a diminishing labour force: tractor numbers increased tenfold from 1938 to the 1970s, and aircraft were widely used to spread fertiliser. By 1972 the number of farms had fallen by nearly a third from the post-war peak of 92 000 reached in 1955. The number of dairy farmers declined particularly dramatically, from nearly 40 000 in 1950 to about 17 000 in 1976. This reflected changes in the relative profitability of different types of farming, as well as a general exodus from the ranks of the small farmer. Meanwhile, male, blue-collar employment rose steadily, roughly in proportion to the overall growth of the labour force. By 1976 there were more than 400 000 blue-collar workers, 47 percent of the male work-force. Most rapid expansion came in white-collar employment, which occupied a quarter of working men in 1951, a third in 1971. The same proportions of all women aged over 15 were in paid employment in each of these years. In 1971, 62 percent of working women had white-collar jobs. Most women continued to work in jobs performed mostly by women. At the beginning of the century the majority of working women had been employed in one of nine major occupational groups: nurses, teachers, servants, domestics, drapers’ assistants, shop assistants, clerks, tailoresses, and farmers’ wives. These occupations remained female-intensive.
The goal of being one's own boss’ became less attainable; between 1951 and 1971 small proprietors fell from one-fifth to an eighth of the work-force. Small business operators, like small farmers, felt themselves vulnerable to growing pressure from larger rivals and increasing regulation. The resentments of these two groups were reflected in the support they gave the Social Credit party in the 1960s and 1970s (although this was too geographically diffuse for the party to gain more than token parliamentary representation). By the early 1970s about 40 percent of the work-force belonged to bureaucracies—organisations with specialised jobs structured in a hierarchy, and governed by formal rules and regulations. The public sector, with about 250 000 employees, had grown by 100 000 in 20 years although contrary to widespread popular belief, it had not increased its share of the work-force, or of national resources. Private bureaucracies now employed some 200 000 people. The growth of both sectors was closely linked to the expansion of post-primary education. Between 1945 and 1970 spending on education rose from 6 percent to 14 percent of government expenditure, and the number of secondary school students more than trebled. By 1971 one person in every three participated directly in the education system, as full-time student, teacher or administrator. Seven-eighths of all pupils attended state-run schools. Public education, like the state's housing policy, was based on an ethos which emphasised equality of access, social integration, and cultural uniformity. University students doubled in numbers in the 1960s, becoming 10 percent of the school-leaving age-group by the end of the decade.
The pakeha birth rate had fallen steadily from the 1880s to the mid-1930s, prompting fears of a near-stationary population. This at last came to pass in the late 1970s, but only after a period of unprecedented growth, from 1.7 million in 1945 to more than 3 million. One-third of the increase was due to immigration, at first from war-ravaged Europe, later from the Pacific Islands. Both Western Samoa and the Cook Islands gained effective independence in the 1960s, but their citizens retained rights of entry to New Zealand. By 1976, 61 000 Pacific Island Polynesians lived in New Zealand. The bulk of the population growth, however, came from natural increase—the postwar ‘baby boom’, which lasted until use of effective contraception became more widespread during the 1960s. By 1961 a third of New Zealanders were aged under 15. This generation put stress on the education system and then on the job market, and seemed likely to overload superannuation schemes and health resources as it aged. Other demographic trends were continued movements from country to town and from south to north. By 1976 only one-sixth of New Zealanders lived outside urban areas. In that year 73 percent of the population lived in the North Island. The Auckland conurbation alone had a quarter of the country's people and a third of those employed in manufacturing. Whereas the greatest number of Vogel-period immigrants had settled in Canterbury and Otago, the latest wave of European migrants went disproportionately to the cities of Auckland and Wellington, as did newly-arriving Pacific Islanders and Maori leaving rural areas.
New Zealand's modernising society became more complex, more distinctive, and less self-confident as a Maori cultural renaissance began to affect the cities, more than a century of migration from Europe diminished to a trickle, and the country finally lost its secure place as Britain's offshore farm. In the 1970s greatly-increased oil prices, and the global economy's inability to distribute the world's food production effectively, led to an apparently irreversible decline in the terms of New Zealand's trade with the outside world. Primary products—wood-pulp and paper as well as wool, meat, and dairy produce—continued to be export staples, but their share of total exports fell to 60 percent by 1975. In that year Britain (which had cut the symbolic umbilical cord by joining the protectionist European Economic Community) took only one-fifth of New Zealand's exports, and the country's four major markets (the others being Australia, the United States, and Japan) only three-fifths between them. An increasing variety of agricultural and manufactured products were sold in a growing range of markets. Primary produce sales were increasingly handled by centralised producer boards. The main focus of secondary industry was still the further processing of imported goods for local markets. Although import licensing was said to shelter inefficient industries, the average level of protection was not high by world standards. Nor is it clear that New Zealand output or standards of living have lagged nearly as far behind other developed countries as figures based on exchange-rate comparisons suggest. At worst, the country's economic performance has been an average one.
Much the same could be said in social terms. In New Zealand many features of Western social change have been experienced on a smaller scale. These have included the rise of youth culture (as both a new form of consumerism and a serious attempt to transform styles of living), the revitalisation of ethnic minorities, and the assertion by women of their right to participate fully in all aspects of economic and social life. Equal pay for equal work became a legal requirement in 1972, showing the extent of change since 1936, when the first minimum-wage legislation had set the female minimum rate at 47 percent of the male. But women remained over-represented in low-status occupations, and the twentieth-century idealisation of motherhood continued to be a potent source of guilt for mothers who, from necessity, took paid employment. As age, ethnic, and gender distinctions came to matter more, class divisions grew more subtle and apparently less important. Although extremes of wealth and poverty were rare, equality of income and status had been brought no closer by decades of formal equality of access to society's resources. And social consensus as to the desirability of relative equality and social security was being eroded by harsh economic realities and the diversification of individual aspirations.
The state of Maori health still caused concern in the 1930s. In 1938 the Maori death rate was 24 per 1000, compared with 10 for pakeha, and the infant mortality rate was 153 for each 1000 live births, as against 37 for non-Maori. In 1940, 36 percent of Maori people were said to live in houses unfit for habitation by minimum pakeha standards. Funding by the first Labour government of the Native Housing Act 1935 resulted in the construction of some 3000 houses by 1951. More systematic efforts to improve Maori health saw experts such as H. B. Turbott combine with community leaders like Te Puea to introduce health programmes. Effective control of diseases such as tuberculosis and typhoid, and falling infant mortality, led to a rise in Maori life expectancy from 46 years in 1925 to 58 in 1956. These factors, and a continuing high birth rate, saw the Maori population double in 30 years to reach 116 000 in 1951. In that year 57 percent of Maori people were aged under 21, compared with 35 percent of non-Maori. In 1955 the Maori birth rate was 44 per 1000, as against 25 for non-Maori. By 1966 half of all Maori were aged under 15. Continuing high fertility and improved health saw the Maori population reach 270 000 in 1976. Maori now comprised 9 percent of all New Zealanders.
Movement of Maori to the cities began during the Second World War, when manpower regulations and the work of the Maori War Effort Organisation opened up a variety of urban employment opportunities. In any case, farming could not have sustained the rapid increase in numbers. Eleven percent of Maori people had lived in urban areas in 1936. Forty years later, three-quarters of the Maori people were urbanised, and a fifth lived in Auckland, the Maori population of which doubled during the 1960s. Migration to the cities meant improved housing conditions, but most Maori could not afford to live outside areas offering low-cost accommodation. Urbanisation was reflected in employment data. While 40 percent of male Maori had worked in agriculture, forestry and fisheries in 1951, only 16 percent did so by 1971. The respective figures for blue-collar employment were 52 percent and 70 percent. Over the same period, the proportion of Maori women in service occupations fell from 42 percent to 23 percent, while the percentage in blue-collar work rose from 24 percent to 36 percent. By the late 1960s, Maori and Pacific Islanders in Auckland and Wellington formed a ‘new under-class’, most holding poorly-paid jobs which offered little security or prospects for advancement.
Maori education benefited from the first Labour government's introduction of free secondary education and a school-leaving age of 15. By 1953, while special Maori schools (directly administered by the Department of Education) were still numerous, 60 percent of Maori children attended ordinary state primary schools. By 1960 most Maori children went on to secondary school; but they did so on average at a later age, and left earlier with fewer qualifications than pakeha children. In 1960, 5 percent of Maori pupils gained School Certificate, compared with 30 percent of non-Maori of the same age. The state school system was still almost entirely monocultural. Educational under-achievement was both a cause and an effect of low occupational status.
From 1943, with the defeat of Apirana Ngata, the Ratana-Labour alliance held all four Maori parliamentary seats. Much of the discrimination against Maori workers was removed by the first Labour government, and Maori shared in the general expansion of economic activity and in social security provisions. The Maori Social and Economic Advancement Act 1945 set up tribal committees and executives concerned especially with welfare and marae administration. In 1947 the word ‘Maori’ replaced ‘Native’ in all official usage, an acknowledgment that Polynesian New Zealanders now more than before saw themselves as one people. National organisations such as the Maori Women's Welfare League (formed in 1951) and the Maori Council (established in 1962) helped strengthen the authority of a post-war generation of leaders. Many had served with distinction in the Maori Battalion in North Africa and Italy, or in essential industries. Returning servicemen were able to demand equality with more success than had their counterparts in the First World War Pioneer Battalion, who had received no rehabilitation assistance. Maori sporting ability (demonstrated particularly in rugby union and league) also earned respect from the wider community.
In the 1940s Ngata spoke of the need for a “continuous attempt to interpret the Maori point of view to the pakeha in power”. Te Puea argued that “unity of Maori and Pakeha can only grow from each sharing the worthwhile elements in the other's culture”. As urbanisation brought the two races together, discrimination and the lack of equal opportunity grew more visible. Maori were told they must adapt to the pakeha way of life; there was no equivalent pressure on pakeha. From the late 1960s groups such as Nga Tamatoa (‘the young warriors’) challenged the continuing loss of land, declining use of the Maori language, and what came to be called ‘institutional racism’ in pakeha-dominated society. A cultural resurgence which emphasised tribal identity, traditions, and protocol developed in parallel with a drive to establish urban marae. Under the third Labour government, multiculturalism replaced integration as official policy. Maoritanga (the experience and expression of Maoriness) had an officially recognised place in the future of Aotearoa.
c 800 Arrival of first Polynesian settlers in Aotearoa.
1642 European discovery by Abel Tasman.
1769 James Cook's first visit to New Zealand.
c 1790 First severe epidemic among Maori population.
1792 First sealing gang left on New Zealand coast at Dusky Sound.
1806 First pakeha women arrive in New Zealand.
1814 Arrival of Rev. Samuel Marsden, and establishment of Anglican mission station.
1820 Hongi's visit to England.
1826 Attempt at European settlement under Captain Herd.
1831 Tory Channel whaling station established.
1833 James Busby appointed British Resident at Bay of Islands.
1839 Governor of New South Wales authorised to annex New Zealand Preliminary expedition of New Zealand Company under Colonel Wakefield to Port Nicholson.
1840 Arrival of New Zealand Company's settlers at Port Nicholson. New Zealand annexed, Captain Hobson arrives as Lieutenant-Governor, and Treaty of Waitangi signed. Settlement formed at Akaroa.
1841 New Zealand proclaimed independent of New South Wales. Arrival of New Plymouth and Wanganui settlers.
1842 Settlement founded at Nelson.
1843 Affray at Wairau.
1845 ‘Northern War’.
1846 Fighting near Wellington. New Zealand divided into two provinces, New Munster and New Ulster. Exploration of West Coast by Thomas Brunner party begins.
1848 Otago settlement founded.
1850 Canterbury settlement founded.
1852 Constitution Act passed by Imperial Parliament, granting representative institutions to New Zealand, and dividing country into six provinces.
1854 Opening at Auckland of first session of General Assembly.
1855 First members elected to the House of Representatives under system of responsible government. Severe earthquake on both sides of Cook Strait.
1856 Appointment of first ministry under system of responsible government.
1858 Te Wherowhero (Potatau) becomes Maori King.
1860 ‘Taranaki War’.
1861 Bank of New Zealand incorporated. Gold discovery at Gabriel's Gully, Otago.
1862 First electric telegraph line opened—Christchurch to Lyttelton.
1863 Commencement of ‘Waikato War’. Wreck of HMS Orpheus on Manukau Bar. First railway in New Zealand opened.
1864 Hostilities in Waikato end. Discovery of gold on West Coast.
1865 Seat of Government transferred to Wellington.
1866 Cook Strait submarine telegraph cable laid.
1867 Opening of Thames goldfield Lyttelton railway tunnel completed. Four Maori seats provided in House of Representatives. Armed constabulary established.
1869 Government Life Insurance Office founded.
1870 Last pitched battles of ‘New Zealand Wars’. First rugby match in New Zealand. Commencement of San Francisco mail service. Inauguration of Vogel public works policy.
1873 Establishment of New Zealand Shipping Co.
1876 New Zealand-Australia cable. Provinces abolished.
1877 Education Act passed, providing for free, compulsory education.
1878 Completion of the Christchurch-Invercargill railway.
1879 Triennial Parliaments Act passed. Adult male suffrage introduced. Kaitangata coal mine explosion. Annual property tax introduced.
1881 Parihaka community forcibly broken up. Wreck of s.s. Tararua, with loss of 130 lives.
1882 First shipment of frozen meat from New Zealand.
1883 Direct steamer link established between New Zealand and Britain.
1884 Construction of King Country section of North Island main trunk railway begins.
1886 Tarawera eruption and destruction of Pink and White Terraces.
1887 First national park created.
1888 Birth of writer Katherine Mansfield.
1890 Great maritime strike. First election on one-man-one-vote basis; Liberal government elected.
1891 Land and Income Assessment Act passed.
1893 Franchise extended to women. Liquor licensing poll introduced. Elizabeth Yates elected Mayor of Onehunga.
1894 Industrial Conciliation and Arbitration Act passed. Government Advances to Settlers Act passed. Wreck of s.s. Wairarapa. First ascent of Mt Cook/Aorangi.
1896 Brunner Mine explosion. Abolition of non-residential or property qualification to vote. National Council of Women founded.
1898 Old-age Pensions Act passed.
1899 New Zealand army contingent sent to South African War.
1901 Cook and other Pacific Islands annexed.
1902 Pacific cable opened.
1903 Richard Pearse achieves semi-controlled flight near Timaru. State Insurance Office founded.
1906 Death of Premier Seddon.
1907 New Zealand given name of Dominion.
1908 North Island main trunk railway opened. Ernest Rutherford awarded Nobel Prize in Chemistry.
1909 S.s. Penguin wrecked in Cook Strait, with loss of 75 lives. Battle cruiser presented by New Zealand to Imperial Government. System of compulsory military training introduced.
1911 Wireless telegraphy installed in New Zealand. Widows’ Pensions Act passed. First poll on national prohibition taken.
1912 Civil service placed under control of Public Service Commissioner. Waihi strike. Reform ministry formed.
1913 Extensive strikes with confrontations in Auckland and Wellington.
1914 First World War begins. German Samoa occupied. New Zealand Expeditionary force despatched.
1915 Gallipoli campaign.
1916 New Zealand Division transferred to Western Front. Battle of the Somme. Conscription introduced Lake Coleridge electricity supply scheme opened.
1918 End of First World War. Great influenza epidemic kills 8000 New Zealanders.
1919 Women eligible for Parliament. New Zealand represented at Peace Conference by Prime Minister.
1920 First aeroplane flight over Cook Strait. League of Nations mandate to administer Western Samoa.
1921 New Zealand Division of Royal Navy established.
1922 Meat export trade placed under control of a board.
1923 Death of writer Katherine Mansfield. Opening of Otira Tunnel. Ross Dependency proclaimed. Dairy Produce Export Control Act passed.
1924 Direct radio communication with England.
1925 Death of Prime Minister Massey.
1926 Department of Scientific and Industrial Research founded.
1928 First flight across Tasman Sea. United government elected.
1929 Severe earthquake in Murchison-Karamea district.
1930 Legislation provides for relief of unemployment.
1931 Hawke's Bay earthquake. General reduction of 10 percent in wages and salaries. Mortgagors’ relief legislation passed.
1932 Reductions in old-age and other pensions, in salaries of state employees, and in rentals, interest rates and other fixed charges. Sporadic rioting in main centres. Ottawa Conference.
1933 Elizabeth McCombs becomes first woman M.P.
1934 First trans-Tasman airmail. Reserve Bank incorporated.
1935 First Labour government elected.
1936 Inauguration of inter-island trunk air services. Reserve Bank nationalised. System of basic prices for butter and cheese introduced. 40-hour week introduced.
1937 Royal New Zealand Air Force established.
1938 Social Security Act passed. Introduction of import control.
1939 Second World War begins. HMS Achilles takes part in Battle of the River Plate.
1940 Death of Savage. 2nd NZEF despatched and sees action in Greece, Crete and North Africa.
1941 War with Japan begins.
1942 Complete mobilisation. Rationing introduced Mobilisation of women for essential work. Battle of El Alamein.
1943 New Zealand Division serves in Italy.
1945 War in Europe ends (8 May). War in Pacific ends (15 August). National Airways Corporation founded.
1946 Family benefit of £1 per week made universal as from 1 April. Bank of New Zealand nationalised.
1947 Statute of Westminster adopted by New Zealand Parliament.
1949 Referendum agrees to compulsory military training. National government elected.
1950 Legislative Council Abolition Act passed. Naval and ground forces sent to Korean War. Wool boom.
1951 Prolonged waterfront dispute. United States, Australia, and New Zealand signed ANZUS Treaty. Maori Women's Welfare League established.
1952 New Zealand troops sent to Malaya.
1953 Railway disaster at Tangiwai. First tour by reigning monarch.
1954 New Zealand signs South-east Asia Collective Defence Treaty.
1955 Pulp and paper mill at Kawerau opened. Rimutaka rail tunnel opened.
1956 Roxburgh and Whakamaru power stations in operation.
1957 Scott Base established in Ross Dependency. Last hanging in New Zealand. Labour government elected.
1958 PAYE taxation introduced.
1959 Auckland Harbour Bridge opened. Antarctic Treaty signed.
1960 Regular television programmes began in Auckland. National government elected. Government Service Equal Pay Act passed.
1961 New Zealand joined IMF.
1962 Cook Strait rail-ferry service commenced with Aramoana. Western Samoa becomes independent.
1964 Cook Strait power cables laid. Oil refinery opened at Whangarei.
1965 Limited free trade agreement negotiated with Australia. Cook Islands became self-governing. Combat force sent to Vietnam.
1966 National Library of New Zealand created.
1967 Decimal currency introduced. Referendum extends hotel hours.
1968 T.e.v. Wahine founders in Wellington Harbour.
1969 Vote extended to 20-year-olds.
1970 Natural gas from Kapuni supplied to Auckland.
1971 Negotiations by Britain with members of European Economic Community secure New Zealand's butter and cheese exports to the United Kingdom. Bluff aluminium smelter in commercial operation. Generators installed at Manapouri hydroelectric station. Metric conversion for weights and measures.
1972 Labour government elected.
1973 Britain joins European Economic Community. Colour television introduced. First step of Equal Pay Act in effect. First United Women's Convention.
1974 Death of Prime Minister Norman Kirk. Commonwealth Games, Christchurch.
1975 National government elected. Waitangi Tribunal established.
1976 Cuts in subsidies on electricity, rail charges, and Post Office charges. Subsidies on bread, eggs, butter, and flour abolished. New Zealand's sporting links with South Africa resulted in walk-out at Olympic Games in Montreal.
1977 National superannuation scheme begins. New Zealand signs Gleneagles agreement on sporting contacts with South Africa. 200-mile exclusive economic zone established.
1978 National government re-elected.
1979 First stage of Maui gasfield development completed. Severe landslip at Abbotsford. Air New Zealand crash on Mount Erebus.
1980 Expansion of Marsden Point oil refinery. New methanol plant and expansion of New Zealand Steel Ltd plant approved. Saturday retail trading legalised.
1981 Butter deal concluded with EEC. Controversial tour of New Zealand by South African rugby team. National government re-elected.
1982 Contract for Motunui synthetic fuel plant signed. Twelve-month wage, price, and rent freeze imposed. Ammonia-urea plant at Kapuni commenced production. Kohanga reo (language nurseries) established to encourage revival of Maori.
1983 Signing of Closer Economic Relations Agreement with Australia. New Zealand's triple A international credit rating reduced by Standard and Poor's Corporation. Wage-Price Freeze extended until 1984. Regulations limiting interest rates on first mortgages. Phased deregulation of land transport introduced, and abolition of restrictions against competition with Railways Corporation.
1984 Price freeze lifted. The Labour Party wins snap General Election. Government devalues the New Zealand dollar by 20 percent and re-imposes price freeze. Interest rate restrictions are lifted. Economic summit conference. Maori summit conference. Budget introduces Family Care and tax surcharge on national superannuation, and lifts price freeze. Wage guidelines introduced. Queen Street riot, Auckland. New Zealand ratifies the United Nations Convention on the Elimination of All Forms of Discrimination Against Women.
1985 United States request for visit by USS Buchanan declined. New Zealand dollar floated. University Entrance examinations abolished. All Black rugby tour of South Africa cancelled. Greenpeace protest vessel Rainbow Warrior bombed and sunk by French agents.
1986 (Feb) Soviet cruise ship Mikhail Lermontov sinks in Marlborough Sounds. (Mar) Government announces cuts in wholesale tax in preparation for goods and services tax. (Apr) Unofficial tour of South Africa by rebel New Zealand rugby players. Protest march on Parliament by farmers. (Jun) Property qualifications for voting in local body elections abolished. Trustee savings banks announce merger. (Jul) United Nations Secretary-General rules that the French agents jailed in New Zealand for their part in the sinking of the Rainbow Warrior will be detained for three years on the island of Hao; France to make an unqualified formal apology to New Zealand and pay about $13 million in compensation. Homosexual Law Reform Bill passed. Notice given that School Certificate to be abolished and replaced with internal assessment within four years. (Sep) Tasman pulp and paper mill at Kawerau reopens. (Oct) Goods and services tax (GST) comes into effect. (Nov) First visit by Pope.
1987 (Feb) Ansett Airlines begins services on New Zealand domestic routes. United States ends special arrangement that allowed New Zealand to buy military equipment at wholesale rates. (Mar) Flooding in Southland. Bay of Plenty earthquake causes widespread damage. (Apr) Soviet diplomat expelled. (May) Air New Zealand 747 hijacked at Nadi Airport. (Jun) Non-nuclear legislation becomes law. Petrocorp shares issued. Commission of enquiry ordered into cervical cancer research programme at National Women's Hospital. First Budget surplus in 35 years announced. Court of Appeal ruling that Maori land claims would not be affected by transfer of assets to new state-owned enterprises. (Jul) $1.5 billion modernisation programme for Navy announced. (Aug) First lotto draw. General Election returns Labour government. Third television channel licence granted. (Oct) NZ Post announces closure of 432 branch post offices. Council of Trade Unions formed. Sharemarket crash. (Nov) Australian Prime Minister Hawke visits. (Dec) New Zealand's first heart transplant performed. Waitangi Tribunal given power to decide which Crown land has Maori claimants. State Sector Bill introduced to Parliament. Economic package introduces, among other things, major tax reforms.
2.1–2.4 Historical Publications Branch, Department of Internal Affairs.
2.5 Department of Statistics.
Table of Contents
New Zealand is a monarchy with a parliamentary government. The Crown is vested in the same person as the British Crown and Queen Elizabeth II has the title Queen of New Zealand.
Although an independent state today, New Zealand's constitutional history can be traced back to 1840 when by the Treaty of Waitangi the Maori people exchanged their sovereignty for the guarantees of the treaty and New Zealand became a British colony.
A constitution is concerned with the establishment and composition of the legislative, executive, and judicial organs of government, their powers and duties, and the relationship between these organs. In New Zealand, the constitution is not contained in a single document that can be referred to as ‘the Constitution’, although the Constitution Act 1986 brought together in one statute the most important statutory constitutional provisions. Some United Kingdom statutes, constitutional conventions, and case law add to the body of New Zealand constitutional law.
A feature of constitutional documents in some countries is that their provisions are safeguarded by requiring a special procedure to amend them. Only two New Zealand constitutional statutes have a requirement of this nature. They are the Electoral Act 1956 and the Constitution Act 1986. Some sections of the Electoral Act 1956 require a 75 percent majority in Parliament to change them, or a majority of votes cast at a referendum. However, the 75 percent requirement could itself be removed by a simple majority in Parliament. In this sense, the protection is political rather than legal. One of the entrenched, or protected, sections in the Electoral Act 1956 was transferred to the Constitution Act 1986, where it retains the protection previously provided.
Important sources of constitutional law include, the Constitution Act 1986, which replaced the Constitution Act 1852 (the 1986 Act is discussed in more detail below); the U.K. Habeas Corpus Act 1679, and Bill of Rights 1689, which respectively protect the individual against arbitrary detention, and define some of the relative powers of the Crown and Parliament; the Electoral Act 1956, which provides procedures for Parliamentary elections; and the Letters Patent 1983, which set out the Governor-General's powers.
The Governor-General is the representative of the Sovereign in New Zealand and exercises the royal powers derived from statute and the general law (prerogative powers). The Governor-General possesses only those prerogative powers delegated in the Letters Patent, and the courts may decide on the limits of them. Almost all of the Governor-General's powers are now statutory, and this has the effect of abridging any of the prerogative powers that cover the same ground. The Sovereign appoints the Governor-General on the Prime Minister's recommendation, normally for a term of five years.
The Governor-General's main constitutional function is to arrange for the leader of the majority party in Parliament to form a government. By constitutional convention and the Letters Patent, the Governor-General is required to follow the advice of ministers. By convention the Governor-General can in extraordinary circumstances reject advice if he or she believes that a government is intending to act unconstitutionally—known as the reserve power. The extent of these powers in New Zealand is unclear, and events in Australia in 1975 demonstrated how controversial the use of the reserve powers can be.
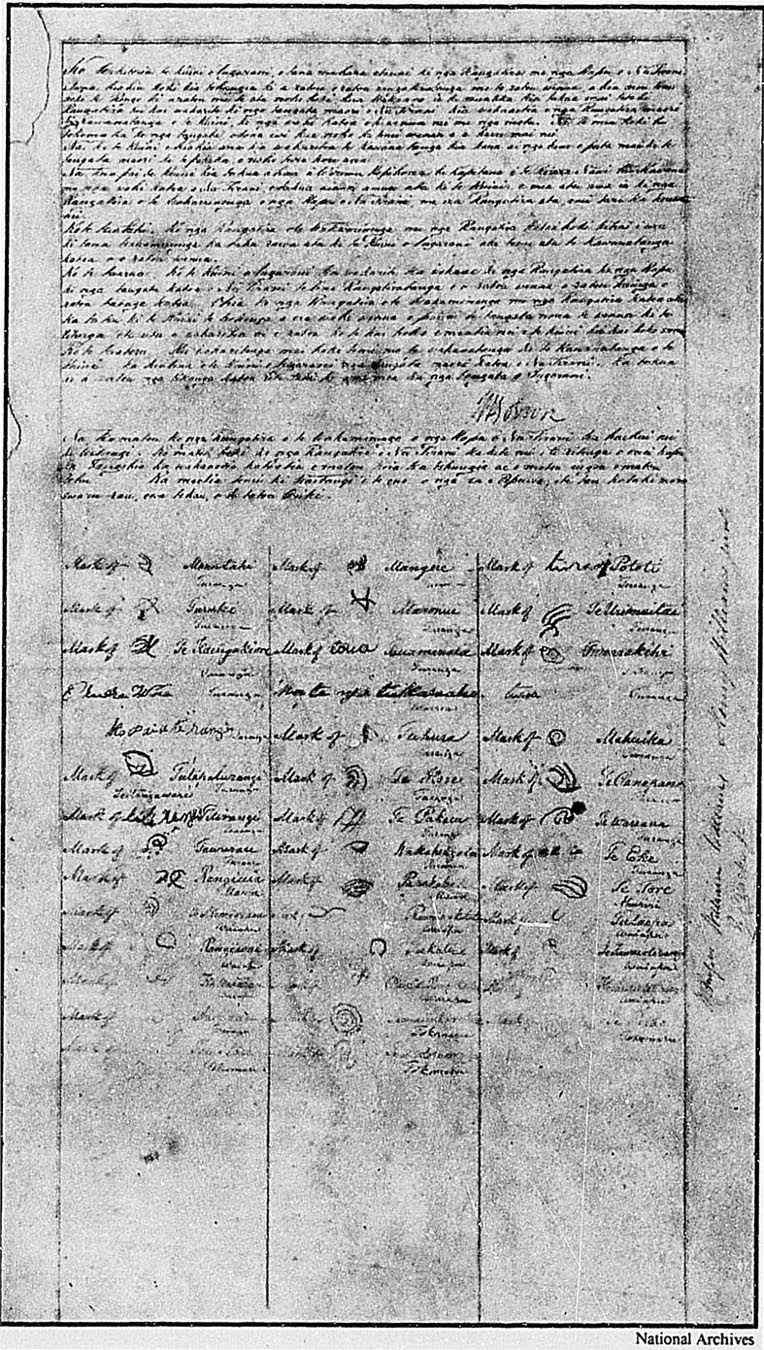
Section of the Treaty of Waitangi.
A feature of New Zealand's constitution is that, although it is a monarchy in form, it operates democratically because of a long political tradition of parliamentary government and a network of constitutional principles. This tradition developed during the course of British history, and was transferred to New Zealand. Some principles have legal status, and some exist as constitutional conventions.
The Crown is still the formal legal repository of much power. The Crown is part of Parliament, and the Governor-General's assent is required before bills can become law. Government administration is formally carried out by the Crown through its ministers and state servants. However, the Crown must act according to its ministers’ wishes, and they, in turn, must retain parliamentary support. The Government cannot act effectively without Parliament, because it cannot raise or spend money without parliamentary approval, and for most categories of expenditure this approval takes the form of an annual vote of funds to the Government. Parliament therefore has to be assembled regularly and has the opportunity to hold the Government to account. Under the modern two-party system, however, the Government effectively controls proceedings in Parliament and cases of Government members voting with the Opposition are very uncommon.
Judges are also appointed by the Crown, and there is a strong tradition of independence for judges and various mechanisms to protect it.
Events immediately after the July 1984 general election highlighted a need for constitutional reform. Difficulties experienced by the incoming government, in taking what was considered urgent action, revealed uncertainties in the rules for the handing over of power from an outgoing to an incoming government.
An officials committee was set up to examine and report on the rules for the handing over of power and to carry out a general reorganisation of statutory constitutional provisions. The committee's recommendations included a draft bill which eventually led to the Constitution Act 1986.
The Act, which came into effect on 1 January 1987, clarifies the rules relating to the handover of power and brings together in one Act the most important statutory constitutional provisions. It deals with the principal components of New Zealand's constitutional arrangements: the Sovereign, the executive, the legislature and the judiciary.
Part I of the Act concerns the Sovereign. It contains the essence of the Royal Titles Act 1974 and replaces the Royal Powers Act 1983. It deals with the Sovereign as the Head of State of New Zealand and expressly recognises the role of the Governor-General. Part I also deals with the exercise of royal powers by either the Sovereign or the Governor-General, and with the legal effects of a death of the Sovereign (the demise of the Crown).
Part II deals with the Executive. It restates the rule that no person may be a minister of the Crown or member of the Executive Council unless that person is a member of Parliament. However, due to the uncertainties in applying this rule created by the events of 1984, an exception was provided. A non-member of Parliament may now be appointed as a minister or member of the Executive Council if that person was a candidate at the general election immediately before appointment. However, if within 40 days that person does not become a member of Parliament he or she must vacate office.
There is a further exception which re-enacts, with some amendment, a provision authorising ministers of an outgoing government to continue to hold office for 28 days after ceasing to be members of Parliament. Part II also deals with the power of ministers to act for other ministers, and the appointment and powers of parliamentary under-secretaries.
Part III of the Act concerns the law-making body, the legislature: what it does and how it is to do it. The Act confirms the existing power of the New Zealand Parliament to make laws. The Act declares that the Parliament of New Zealand “continues to have full power to make laws”. It also removes the residual power of the United Kingdom Parliament to make laws for New Zealand which is now inappropriate given New Zealand's independent status. To this end the Act also repealed the Statute of Westminster 1931 (in relation to New Zealand) and other linked legislation. Under the Statute of Westminster the United Kingdom Parliament could make law for New Zealand Parliament.
The Act also alters the composition of Parliament to consist of the Sovereign in right of New Zealand, rather than, as previously, the Governor-General, and the House of Representatives. The new description is more appropriate to New Zealand's independent constitutional status. This part also deals with matters such as the election and term of the Speaker, the royal assent to bills, and the procedure for the summoning, proroguing, and dissolution of Parliament. The Act also requires Parliament to meet not later than six weeks after the date fixed for the return of the writs from the election. This embodies the important constitutional principle that Parliaments should meet frequently, as set out in the Bill of Rights 1689.
There remain a number of United Kingdom Acts (referred to as ‘Imperial Acts’) which are in force as part of the law of New Zealand. Some are historic constitutional Acts, such as the Magna Carta, the Habeus Corpus Act 1679, and the Bill of Rights 1689. Other Imperial Acts covering a wide range of subject matter also remain in effect in New Zealand.
For some time it has been proposed to enact legislation clarifying the effect of these Imperial laws in New Zealand. Those still important and relevant would be retained, while those which are obsolete would be repealed in relation to New Zealand. This, together with the Constitution Act 1986, would simplify access to statutory constitutional law.
In Part IV of the Act are found some of the important constitutional rules governing the judiciary, their tenure, and salaries. The Act also empowers the Sovereign, or the Governor-General, to remove High Court judges and sets out how, and on what grounds, they can be removed. The Constitution Act 1986 made some changes to the law on these matters. It enabled the Governor-General in Council to remove judges and abolished the power of suspension. It also clarified uncertainties about the method and grounds for removal.
In summary, although the Constitution Act 1986 is not and does not purport to be a ‘written’ constitution in the technical sense, it contains most of the provisions found in written constitutions of unitary (i.e., non-federal) countries. However, as mentioned above, only one of its provisions is specially protected. Nor does it include one feature of a number of written constitutions of other countries, namely, a statement of fundamental human rights, such as freedom of religion, speech, and assembly. This was the subject of a White Paper on a Bill of Rights for New Zealand, which was tabled in the House of Representatives in 1985. The paper contained a draft bill which would protect fundamental civil and political rights. If the bill is adopted legislation which was inconsistent with the rights in the bill would, when successfully challenged in court, be of no effect.
The officials committee commented that its report and draft bill dealt “only with what might be called the European side of our constitutional law”. The committee noted that what might be termed the Maori side of New Zealand law formed part of the subject matter of the draft bill contained in the White Paper on a Bill of Rights for New Zealand. That bill would incorporate the Treaty of Waitangi of 1840 into a bill of rights.
At the heart of the parliamentary system lies the power to make laws that is vested by the Constitution Act 1986 in the Parliament of New Zealand, which consists of the Sovereign in right of New Zealand (normally represented by the Governor-General) and an elected House of Representatives.
The principal functions of Parliament are to enact laws, supervise the Government's administration, vote supply, provide a government, and redress grievances by way of petition.
The Constitution Act 1986 forbids the House to allocate public funds for any purpose unless first recommended by the Crown. Although the reasons for this provision are historical, it is also used by governments to defeat legislation brought forward by individual members which ministers are unwilling to support or adopt. On the other hand, the law forbids the Crown to tax citizens without express parliamentary approval.
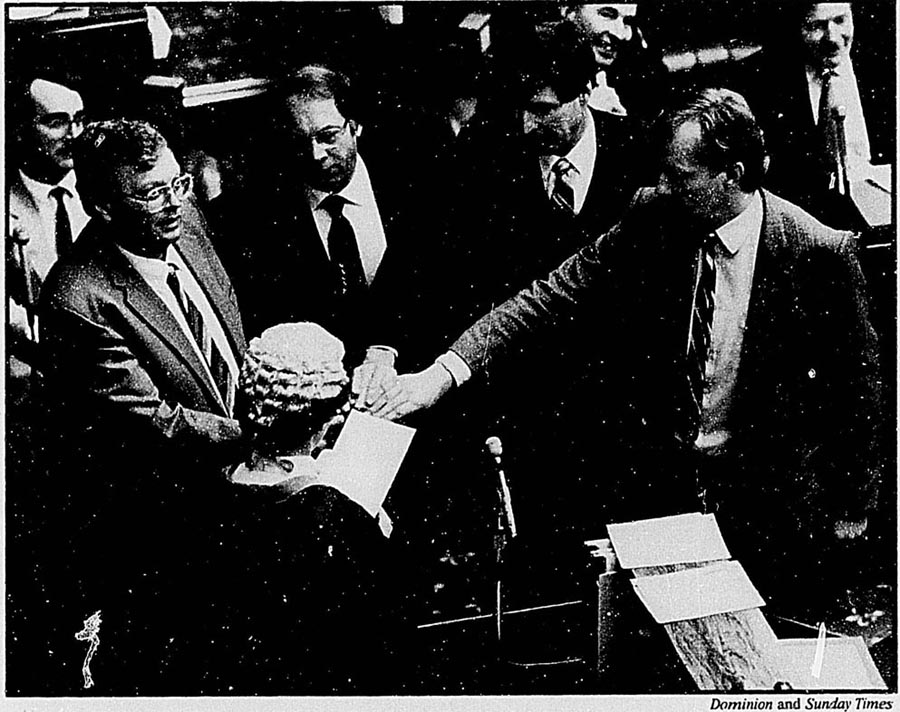
Swearing in members of Parliament.
Constitutional law includes the law and custom of Parliament, itself derived from a variety of sources. The Bill of Rights 1689 saves any proceeding in Parliament from being questioned in any forum, other than the House itself, and the Legislature Act 1908 provides that the powers, privileges, rights, and immunities of the House (and its committees and members) are those possessed by the British House of Commons on 1 January 1865. One aspect of the powers of the House is the ability to make rules for the conduct of its business. Most of these are contained in the Standing Orders, although some are made on a sessional, and others on an ad hoc basis. The traditional three readings given to a bill are part of Standing Orders, but it is open to the House to alter or suspend its rules at any time. The House has retained the right to punish breaches of its privileges, whether by members or citizens, from which there is no appeal (although the courts could be asked to decide whether the privilege claimed is one recognised by law).
Perhaps the most important privilege of the House is that of freedom of speech, guaranteed by the Bill of Rights 1689, and claimed by the Speaker upon confirmation in office by the Governor-General.
The House meets as Parliament in answer to a summons from the Governor-General. Sessions of Parliament are marked by a formal opening when the Government's legislative programme is described in the Speech from the Throne, read by the Governor-General in the absence of the Sovereign, and a closing prorogation by proclamation. Unless the House, by resolution made under the authority of the Constitution Act 1986, carries forward business to the next session, all business before the House or prorogation lapses. Parliament is either dissolved by the Governor-General or expires after three years, and another general election is held.
Because control of the House's business lies with the Government, many of the rules and customs of the House are designed to ensure that members are given a full opportunity to debate any aspect of government proposals. A central figure in Parliament is the Speaker, who is elected to act as an impartial chairman when the House is in session. The Speaker controls debates and the conduct of members, and ensures the Standing Orders are complied with. The Speaker is assisted by permanent officials, headed by the Clerk of the House, who is charged with the administration of the House and the provision of advice on parliamentary law and custom.
As the name suggests, it is the job of the opposition party with the highest number of seats to oppose the Government. Its role is to present itself to the people as an alternative government. It will attack government policy and attempt to demonstrate inefficiency, and government or departmental mismanagement. The party system means it is unlikely that the Opposition could bring down a government by a no-confidence vote—there is no instance of a successful no-confidence vote in the history of the New Zealand Parliament since 1928.
In modern times Parliament has been characterised by having two large, dominant parties, with the majority party forming the Government and the minority party forming the Opposition. In recent years, however, members of a third party have been elected to Parliament, and from time to time members have left one of the parties and have continued to sit as independent members. Because of the growth of a largely two-party system and the importance that the parties have assumed within the political framework, the party caucus (a meeting of each party's members of Parliament in closed session at regular intervals, once a week when Parliament is in session) is a primary means of developing policies and tactics. Caucus committees of the parties travel around the country frequently, investigating issues of interest or concern to them. Although the existence of the caucuses and their committees is not recognised by the law, indirect recognition has been given. For example, travelling allowances are payable to members when travelling as members of a caucus committee.
Proposed laws are placed before the House in the form of draft laws known as ‘bills’. There are three types of bill: public bills, which deal with the most important subjects of a public and general nature (most public bills are introduced by the Government); local bills, which are promoted by local authorities to give themselves special powers or validate unlawful action they may take; and private bills, which are promoted by private individuals or companies also to give themselves special powers.
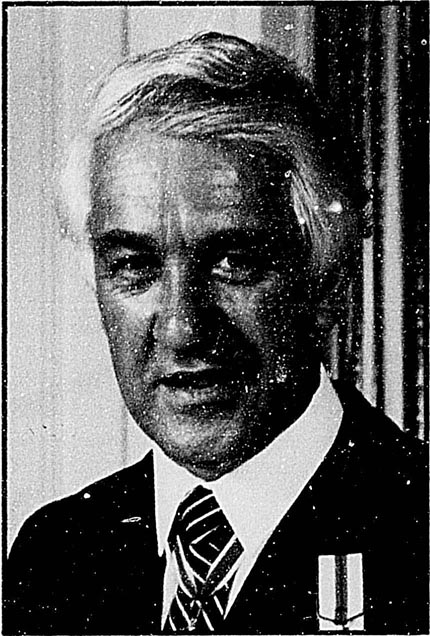
His Excellency the Governor-General, the Most Reverend Sir Paul Reeves.
Prime Minister, Rt. Hon. David Lange.

The Speaker, Hon. Kerry Burke.
Leader of the Opposition, Hon. J. B. Bolger.
The procedure for passing a public bill in Parliament is for it to receive a first reading, which is a formal introductory stage. This will have a maximum debating time of two hours, although often no debate occurs. Almost all bills are then sent to a select committee. Detailed scrutiny of legislation and facets of executive activity, e.g., expenditure of public money, is carried out by select committees which consist of a small number of members, and report their findings and recommendations to the House. Since 1980 all Government bills stand referred to a select committee unless they are certified by the Speaker as ‘money bills’ (or are particularly urgent). The procedure is intended to enable the public and interested bodies to make submissions, in the expectation that better laws will result. Following its deliberations the select committee will report the bill back with any proposed amendments. On the second reading the formal debate will occur on the substance of the bill. Following this the bill is considered by the whole House ‘in committee’, when the Committee of the whole House considers the bill clause by clause. This may involve considerable debating time. The entire bill is considered in this way and formally reported back to the House for its third reading, with any amendments that have been agreed. Debate may also take place on the bill's third reading, after which it is forwarded to the Governor-General for his approval. On receiving the Royal Assent the bill becomes an Act and part of the law of New Zealand.
The various stages of the bill do not always follow any set time pattern. Weeks or even months can elapse between readings. Bills normally have explanatory notes on the front, which detail the contents. These do not appear on the Act. Local and private bills pass through similar stages to those for a public bill, however in these two types of bills the person or body promoting the bill must also advertise the bill before it can be introduced.
The New Zealand Parliament is now in its forty-second session, which was called following the general election of 15 August 1987. In line with Government policy, Parliament will sit continuously, with short breaks, until the next election is called.
During the parliamentary session of 1987, 201 public Acts were passed. Other aspects of parliamentary activity are summarised in the following tables, and a list of public Acts in force and their administering departments can be found at the end of section 3.3, State sector.
Table 3.1. PARLIAMENTARY SESSIONS
| Parliament | Period of session | |
|---|---|---|
| Source: Clerk of the House of Representatives. | ||
| Thirty-ninth |  | 17 May 1979–14 December 1979 15 May 1980–12 December 1980 20 May 1981–23 October 1981 |
| Fortieth |  | 7 April 1982–17 December 1982 7 April 1983–16 December 1983 31 May 1984–14 June 1984 |
| Forty-first |  | 15 August 1984–12 December 1985 26 February 1986–21 July 1987 |
| Forty-second |  | 16 September 1987— |
Table 3.2. SUMMARY OF PARLIAMENTARY PROCEEDINGS
| 1984–85* | 1986–87† | |
|---|---|---|
*First session, Forty-first Parliament. †Second session, Forty-first Parliament. Source: Clerk of the House of Representatives. | ||
| Sitting days | 157 | 135 |
| Public bills introduced by Government | 139 | 107 |
| Public bills referred to select committees | 101 | 83 |
Parliamentary Service. Established in 1985 to replace the Legislative Department, the Parliamentary Service provides administrative and support services to the members of Parliament and the House of Representatives.
The Parliamentary Service is not a department of the Executive Government and is not responsible to a minister. It is controlled by the Parliamentary Service Commission which consists of the Speaker of the House of Representatives as chairperson, and six members, three of whom are members of the Government and three of the Opposition.
Among the services provided by the Parliamentary Service are:
Parliamentary Library—to provide library, information and research facilities to members of Parliament;
Hansard—to provide an official record of the proceedings of the House of Representatives.
Security, secretarial, messenger and other services needed for the day-to-day running of Parliament; and
Personnel, finance and administrative services to members of Parliament and other agencies operating within Parliament House including the Clerk's Office, the parliamentary party research offices, the Parliamentary Counsel Office, and Bellamy's.
Salaries and allowances of parliamentarians. These are set out in table 3.3 below. An electorate allowance is also paid at a rate dependent on the nature of each member's electorate, e.g., urban, rural, or semi-rural, and ranges from $7,500 to $17,000. A day allowance of $40 is payable where indicated for each day on which a member attends a sitting of Parliament or a committee, and a night allowance of $50 for each night a member requires overnight accommodation away from home by reason of such attendance. In addition to the allowances in the table, a once-only setting-up allowance is paid towards the purchase of a motor vehicle to members elected for the first time. The amount paid varies between $6,750 and $15,300 depending on the nature of the member's electorate.
Table 3.3. PARLIAMENTARY AND MINISTERIAL SALARIES AND ALLOWANCES
| Annual salary or allowance payable from 1 April 1988 | |
|---|---|
| Source: Clerk of the House of Representatives. | |
| Salaries— | $ |
| Members of the Executive— | |
| Prime Minister | 141,500 |
| Deputy Prime Minister | 110,800 |
| Minister of the Crown | 98,800 |
| Minister of the Crown without portfolio | 80,000 |
| Parliamentary under-secretary | 77,100 |
| Officers of the House of Representatives— | |
| Speaker | 91,600 |
| Chairman of Committees | 78,900 |
| Deputy Chairman of Committees | 59,100 |
| Leader and Deputy of the Opposition— | |
| Leader of the Opposition | 98,800 |
| Deputy Leader of the Opposition | 77,100 |
| Whips— | |
| Chief Government Whip | 68,000 |
| Chief Opposition Whip | 68,000 |
| Junior Government Whip | 63,800 |
| Junior Opposition Whip | 63,800 |
| Members of Parliament— | |
| Member of Parliament | 54,200 |
| Allowances— | |
| Prime Minister | 23,400 |
| Deputy Prime Minister | 10,200 |
| Minister of the Crown | 9,600 |
| Minister of the Crown without portfolio | 7,500 |
| Parliamentary under-secretary | 7,500 |
| Minister of Foreign Affairs (additional) | 6,000 |
| Speaker | 4,800 |
| (additional allowance as Speaker, plus electorate allowance abated by one-third of the appropriate rate, and day allowance) | 7,800 |
| Chairman of Committees | 4,800 |
| (additional allowance as Chairman plus electorate allowance abated by one-third of the appropriate rate, and day allowance) | 4,500 |
| Deputy Chairman of Committees | 4,800 |
| (additional allowance as Deputy Chairman, and day allowance) | 500 |
| Leader of the Opposition (plus house and travelling allowances) | 9,600 |
| Deputy Leader of the Opposition | 4,800 |
| (plus additional allowance as deputy and electorate, night, and day allowances at appropriate rates) | 3,750 |
| Members (plus electorate, day, and night allowances at appropriate rates) | 4,800 |
Members of Parliament. Table 3.4 shows the percentage of women members of Parliament, and members of various ages elected in the 1987 general election compared to the voting population.
Table 3.5 lists members of the House of Representatives at the end of August 1988. Provisional results of the 1987 general election were printed in the last edition of the Yearbook, and final results in the Report of the General Election (Parl. paper E.9). However, it should be noted that both of these lists do not include the result of an electoral petition which saw the Government member for Wairarapa replaced by a National Party candidate during 1988.
Table 3.4. PARLIAMENTARY REPRESENTATION
| Percentage of total members of Parliament | Percentage of total voting-age population* | |
|---|---|---|
*As at 30 September 1984. Source: Clerk of the House of Representatives. | ||
| Women | 14.4 | 51.0 |
| Age groups— | ||
| 18–29 years | 2.1 | 30.0 |
| 30–39 | 24.7 | 21.1 |
| 40–49 | 42.3 | 15.2 |
| 50–59 | 25.8 | 13.0 |
| 60 years and over | 5.2 | 20.7 |
Table 3.5. HOUSE OF REPRESENTATIVES, FORTY-SECOND PARLIAMENT
| Prime Minister—Rt. Hon. David Lange. | |||
|---|---|---|---|
| Leader of the Opposition—Hon. J. B. Bolger | |||
| Speaker—Hon. Kerry Burke. | |||
| Chairman of Committees—J. J. Terris. | |||
| Clerk of the House—D. G. McGee. | |||
| Member of Parliament* | Year of birth | Previous occupation | Electoral district |
* Names are given in the form in which individual members prefer to be addressed. † Government member. Source: Clerk of the House of Representatives. | |||
| Anderson, Robert | 1936 | Farmer | Kaimai |
| Anderton, J. P$1† | 1938 | Company director | Sydenham |
| Angus, D. A. | 1938 | Freezing company stock buyer | Wallace |
| Austin, Margaret† | 1933 | Teacher | Yaldhurst |
| Banks, John | 1946 | Restaurateur | Whangarei |
| Bassett, Hon. Dr Michael† | 1938 | Lecturer | Te Atatu |
| Birch, Hon. W. F. | 1934 | Consultant surveyor-engineer | Maramarua |
| Bolger, Hon. J. B. | 1935 | Farmer | King Country |
| Braybrooke, G. B$1† | 1935 | Sales manager | Napier |
| Burdon, P. R. | 1939 | Company director | Fendalton |
| Burke, Hon. Kerry† | 1942 | Teacher | West Coast |
| Butcher, Hon. David† | 1948 | Research officer | Hastings |
| Carter, John | 1950 | Local government officer | Bay of Islands |
| Caygill, Hon. David† | 1948 | Barrister and solicitor | St Albans |
| Clark, Hon. Helen† | 1950 | Lecturer | Mt Albert |
| Cooper, Hon. Warren | 1933 | Motelier | Otago |
| Creech, W. B. | 1946 | Accountant | Wairarapa |
| Cullen, Hon. Dr M$1† | 1945 | Lecturer | St Kilda |
| Davies, Sonja† | 1923 | Vice-president of Federation of Labour | Pencarrow |
| de Cleene, Hon. Trevor† | 1933 | Barrister and solicitor | Palmerston North |
| Dillon, Bill† | 1933 | Barrister and solicitor | Hamilton East |
| Douglas, Hon. R. O$1† | 1937 | Company secretary | Manurewa |
| Dunne, P. F$1† | 1954 | Deputy chief executive officer | Ohariu |
| Duynhoven, Harry† | 1955 | Teacher | New Plymouth |
| East, Paul | 1946 | Barrister and solicitor | Rotorua |
| Elder, Jack† | 1949 | Teacher | West Auckland |
| Falloon, Hon. J. H. | 1942 | Farm management consultant | Pahiatua |
| Fraser, Anne† | 1954 | Teacher | East Cape |
| Gair, Hon. G. F. | 1926 | Personal assistant to general manager, Air New Zealand | North Shore |
| Gerard, R. J. | 1937 | Farmer | Rangiora |
| Gerbic, F. M$1† | 1932 | Industrial conciliator | Onehunga |
| Goff, Hon. P. B$1† | 1953 | Lecturer | Roskill |
| Graham, D. A. M. | 1942 | Barrister and solicitor | Remuera |
| Grant, Jeff | 1958 | Farmer | Awarua |
| Gray, R. M. | 1931 | Farmer | Clutha |
| Gregory, Dr B$1† | 1937 | Doctor of medicine | Northern Maori |
| Hunt, Hon. Jonathan† | 1938 | Teacher | New Lynn |
| Jeffries, Hon. W. P$1† | 1945 | Barrister and solicitor | Heretaunga |
| Keall, Judy† | 1942 | Teacher | Glenfield |
| Kelly, Graham† | 1941 | Trade unionist | Porirua |
| Kidd, Doug | 1941 | Barrister and solicitor | Marlborough |
| King, Annette† | 1947 | Dental tutor | Horowhenua |
| Kirk, Jenny† | 1945 | Journalist | Birkenhead |
| Kyd, Warren | 1939 | Barrister and solicitor | Clevedon |
| Lange, Rt. Hon. David† | 1942 | Barrister and solicitor | Mangere |
| Lee, G. E. | 1935 | Company director | Coromandel |
| Luxton, John | 1946 | Farmer | Matamata |
| McClay, R. N. | 1945 | Teacher | Waikaremoana |
| McCully, Murray | 1953 | Public relations consultant | East Coast Bays |
| McKinnon, D. C. | 1939 | Real estate agent | Albany |
| McLean, I. | 1935 | Farmer | Tarawera |
| McTigue, M. P. | 1940 | Farmer | Timaru |
| Mallard, Trevor† | 1954 | Teacher | Hamilton West |
| Marshall, Hon. Russell† | 1936 | Minister and teacher | Wanganui |
| Marshall, Denis | 1943 | Farmer and company director | Rangitikei |
| Matthewson, Clive† | 1944 | Civil engineer | Dunedin West |
| Maxwell, Ralph† | 1934 | Teacher | Titirangi |
| Maxwell, R. F. H. | 1941 | Farmer | Taranaki |
| Meurant, Ross | 1947 | Police inspector | Hobson |
| Moore, Hon. Mike† | 1949 | Freezing worker | Christchurch North |
| Moyle, Hon. Colin† | 1929 | Teacher/farmer | Otara |
| Muldoon, Rt. Hon. Sir Robert, G.C.M.G., C.H. | 1921 | Accountant | Tamaki |
| Munro, R. J. S. | 1946 | Barrister and solicitor | Invercargill |
| Neilson, Hon. Peter† | 1954 | Civil servant | Miramar |
| Northey, Richard† | 1945 | Advisory officer | Eden |
| O'Regan, Katherine | 1946 | Farmer | Waipa |
| Palmer, Rt. Hon. Geoffrey† | 1942 | Lecturer | Christchurch Central |
| Peters, W. R. | 1945 | Barrister and solicitor | Tauranga |
| Prebble, Hon. Richard† | 1948 | Barrister and solicitor | Auckland Central |
| Richardson, Ruth | 1950 | Legal adviser/farmer | Selwyn |
| Robertson, H. V. Ross† | 1949 | Industrial engineer | Papatoetoe |
| Robinson, Dave† | 1951 | Probation officer | Manawatu |
| Rodger, Hon. Stan† | 1940 | M.O.W.D. employee | Dunedin North |
| Scott, Noel† | 1929 | Education administrator | Tongariro |
| Shields, Hon. Margaret† | 1941 | Research worker | Kapiti |
| Shipley, Jenny | 1952 | Farmer | Ashburton |
| Shirley, K. L$1† | 1950 | Scientist | Tasman |
| Simpson, Dr Peter† | 1942 | Lecturer | Lyttelton |
| Smith, Dr Lockwood | 1948 | Managing director | Kaipara |
| Storey, W. R. | 1936 | President of Federated Farmers | Waikato |
| Sutherland, Larry† | 1951 | Trade unionist | Avon |
| Sutton, J. R$1† | 1941 | Farmer | Waitaki |
| Sutton, Dr Bill† | 1944 | Scientist | Hawke's Bay |
| Tapsell, Hon. Dr Peter M.B.E$1† | 1930 | Doctor of medicine | Eastern Maori |
| Tennet, Elizabeth† | Trade unionist | Island Bay | |
| Terris, J. J$1† | 1939 | Broadcaster | Western Hutt |
| Tirikatene-Sullivan, Hon. Mrs T. W. M$1† | 1932 | Political scientist | Southern Maori |
| Tizard, Rt. Hon. R. J$1† | 1924 | Teacher | Panmure |
| Upton, S. D. | 1958 | Student/teacher | Raglan |
| Wallbank, A. R$1† | 1937 | Farmer | Gisborne |
| Wellington, Hon. M. L. | 1940 | Teacher | Papakura |
| Wetere, Hon. K. T$1† | 1935 | Farmer | Western Maori |
| Wilde, Hon. Fran† | 1948 | Journalist | Wellington Central |
| Williamson, Maurice | 1951 | Planning analyst | Pakuranga |
| Woollaston, Hon. P. T. E$1† | 1944 | Teacher | Nelson |
| Young, T. J$1† | 1925 | General superintendent of New Zealand Alliance | Eastern Hutt |
| Young. Hon. V. S. | 1929 | Farmer | Waitotara |
The executive government of New Zealand is carried out on behalf of the Sovereign by the ministers of the Crown, who make up the members of the Cabinet and the Executive Council, and control the state services. Ministers are responsible to Parliament for their official actions by constitutional convention, and are required to be members of Parliament by the Constitution Act 1986.
After a general election the Governor-General invites the leader of the majority party in the House of Representatives to accept office as Prime Minister, and form a government. On the new Prime Minister's advice the Governor-General appoints a number of members of Parliament as ministers, generally with responsibilities for various areas of government administration (portfolios). The Governor-General may also appoint parliamentary under-secretaries, who are not ministers and not members of the Executive Council, to assist ministers.
Cabinet and the Executive Council. The Cabinet and the Executive Council have separate functions. All members of Cabinet are members of the Executive Council, as are the ministers not in the Cabinet.
The Executive Council is a formal body with formal functions, whereas the Cabinet is an informal body with deliberative functions; the Executive Council tenders advice to the Governor-General on the basis of policy formulated in the Cabinet. The council is established under Clause VII of the Letters Patent and is the main legal vehicle for promulgating government decisions that will form part of the law, such as statutory regulations, which are made by Order-in-Council.
The Cabinet is in effect the highest council of government. In it the government of the day decides on administrative and legislative proposals and policies, and co-ordinates the work of ministers. The Cabinet has a system of subcommittees with authority to make decisions on various subjects, whose members are the ministers concerned. There are standing Cabinet committees at present on the following subjects: development and marketing; domestic and external security; honours, appointments and travel; legislation; management and state employment; policy; social equity; state-owned enterprises; and transport and communications.
The proceedings of the Cabinet are informal and confidential, which encourages consensus decisions. By constitutional convention the Cabinet accepts collective responsibility for its decisions, which ensures that ministers will have the support of the Government as a whole in Parliament for their legislative and other proposals. The Cabinet Office provides services for the Cabinet and its committees. The secretary of that office is also the Clerk of the Executive Council.
Table 3.6. NEW ZEALAND GOVERNMENT, AT 7 SEPTEMBER 1988
| Source: Cabinet Office. |
|---|
| Governor-General |
| His Excellency The Most Reverend Sir Paul Reeves, G.C.M.G., G.C.V.O. |
| Official Secretary: Paul Canham |
| Executive Council |
| Membership of the Executive Council comprises all ministers with the Governor-General presiding. The Clerk of the Executive Council is Marie Shroff. |
| The Cabinet |
| Rt. Hon. David Lange, Prime Minister, Minister of Education. |
| Rt. Hon. Geoffrey Palmer, Deputy Prime Minister, Attorney-General, Minister of Justice, Minister for the Environment. |
| Hon. Mike Moore, Deputy Minister of Finance, Minister of External Relations and Trade. |
| Hon. R. O. Douglas, Minister of Finance. |
| Hon. Richard Prebble, Minister for State-owned Enterprises, Postmaster-General, Minister of Pacific Island Affairs, Minister of Works and Development. |
| Hon. K. T. Wetere, Minister of Maori Affairs. |
| Hon. David Caygill, Minister of Health, Deputy Minister of Finance. |
| Hon. Russell Marshall, Minister of Foreign Affairs, Minister for Disarmament and Arms Control. |
| Hon. Dr M. E. R. Bassett, Minister of Internal Affairs, Minister of Local Government, Minister of Civil Defence, Minister of Arts and Culture. |
| Hon. Jonathan Hunt, Minister of State, Leader of the House, Minister of Tourism. |
| Rt. Hon. R. J. Tizard, Minister of Defence, Minister of Science and Technology. |
| Hon. Colin Moyle, Minister of Agriculture, Minister of Fisheries. |
| Hon. Stan Rodger, Minister of Labour, Minister of State Services, Minister of Immigration. |
| Hon. P. B. Goff, Minister of Employment, Minister of Youth Affairs, Associate Minister of Education. |
| Hon. Margaret Shields, Minister of Women's Affairs, Minister of Consumer Affairs, Minister of Statistics. |
| Hon. Peter Tapsell, M.B.E. Minister of Police, Minister of Forestry, Minister of Lands, Minister of Recreation and Sport. |
| Hon. Helen Clark, Minister of Housing, Minister of Conservation. |
| Hon. Dr M. J. Cullen, Minister of Social Welfare, Associate Minister of Health. |
| Hon. W. P. Jeffries, Minister of Transport, Minister of Civil Aviation and Meteorological Services. |
| Hon. D. J. Butcher, Minister of Energy, Minister of Regional Development, Minister of Commerce. |
| Ministers not in Cabinet |
| Hon. T. A. de Cleene, Minister of Revenue, Minister of Customs. |
| Hon. Fran Wilde, Associate Minister of Foreign Affairs, Associate Minister of Housing, Associate Minister of Conservation. |
| Hon. P. T. E. Woolaston, Minister Assisting the Deputy Prime Minister, Associate Minister of Justice, Associate Minister for the Environment. |
| Hon. P. Neilson, Associate Minister of Finance, Associate Minister for State-owned Enterprises. |
| Parliamentary under-secretaries |
| P. F. Dunne, Parliamentary Under-Secretary for Health, and Trade and Industry. |
| F. Gerbic, Parliamentary Under-Secretary for Transport, Civil Aviation and Meteorological Services, and Immigration. |
| A. F. King, Parliamentary Under-Secretary for Employment, Youth Affairs, Tourism, and Social Welfare. |
| R. Maxwell, Parliamentary Under-Secretary for Agriculture, and Fisheries. |
| Other responsibilities |
| Ministers with other vote or statutory responsibilities are indicated below. Statutory titles are shown in italics. |
| Rt. Hon. D. R. Lange, Minister in Charge of the New Zealand Security Intelligence Service. |
| Rt. Hon. G. W. R. Palmer, Audit Department. |
| Hon. M. K. Moore, Minister in Charge of Publicity. |
| Hon. R. W. Prebble, Air New Zealand, Airways Corporation of New Zealand Ltd, Minister of Broadcasting, Coal Corporation of New Zealand Ltd, Electricity Corporation of New Zealand Ltd, Government Computing Service, Government Life Insurance Corporation, Government Printing Office, Government Property Services Lid, Land Corporation Ltd, New Zealand Forestry Corporation Ltd, New Zealand Post Ltd, Post Office Bank Ltd, Minister in Charge of Public Trust Office, Minister of Railways, Rural Banking and Finance Corporation, Shipping Corporation of New Zealand Ltd, State Insurance Office, Telecom Corporation of New Zealand Ltd, Works and Development Services Corporation. |
| Hon. D. F. Caygill, Member, New Zealand Planning Council. |
| Hon. P. Tapsell, Minister of Survey and Land Information, Minister in Charge of Valuation Department. |
| Hon. Dr. M. J. Cullen, Minister in Charge of War Pensions. |
Persons 18 years and over have the right to vote in parliamentary elections. Enrolment as an elector is compulsory, but voting is not. To qualify for enrolment persons must (i) be at least 18 years old; (ii) be New Zealand citizens or permanent residents; (iii) have lived continuously in New Zealand for at least a year at some time; and (iv) have last lived continuously for one month in the electorate they are to be enrolled in. Maoris, including persons of Maori descent, may choose to enrol for either a Maori or general electorate, but may make the choice only at certain times. The electoral rolls are maintained by New Zealand Post.
The conduct of polls is the responsibility of the Department of Justice, and is controlled by a returning officer in each electorate, who arranges voting facilities and staff, conducts the election, supervises counting of votes, and declares the result. Generally only persons whose names are validly enrolled before an election are qualified to vote. General elections and by-elections are held on Saturdays, and polling booths are open from 9 a.m. to 7 p.m. Most electors cast their votes at polling booths in their electorates on election day, but they may vote as special voters at booths outside their electorate. Special votes may also be cast before election day at issuing offices or at home because of sickness, travel, or similar reasons. Provision is also made for voting overseas.
Voting is by secret ballot. Ballot papers list the surnames of candidates for the electorate concerned, and electors indicate their choice by striking out the names of every other candidate. A preliminary count of ordinary votes is available for each electorate on election night, and final results are normally available a fortnight later, once special and overseas votes have been received and counted. The candidate with the most votes is elected member of Parliament for the electorate concerned.
The boundaries of electorates are revised every five years after the Census of Population and Dwellings, and the new boundaries come into effect at the expiry of the parliamentary term during which the revision is finalised. The Department of Statistics supplies figures for revision purposes on the general electoral population. This is defined as the total electoral population except: (a) the Maori electoral population (This is the number of adult Maoris enrolled in the four Maori electorates, adjusted to include children. Maoris have been defined since 1980 as persons of the Maori race of New Zealand including any of their descendants.); and (b) some temporary residents of various kinds.
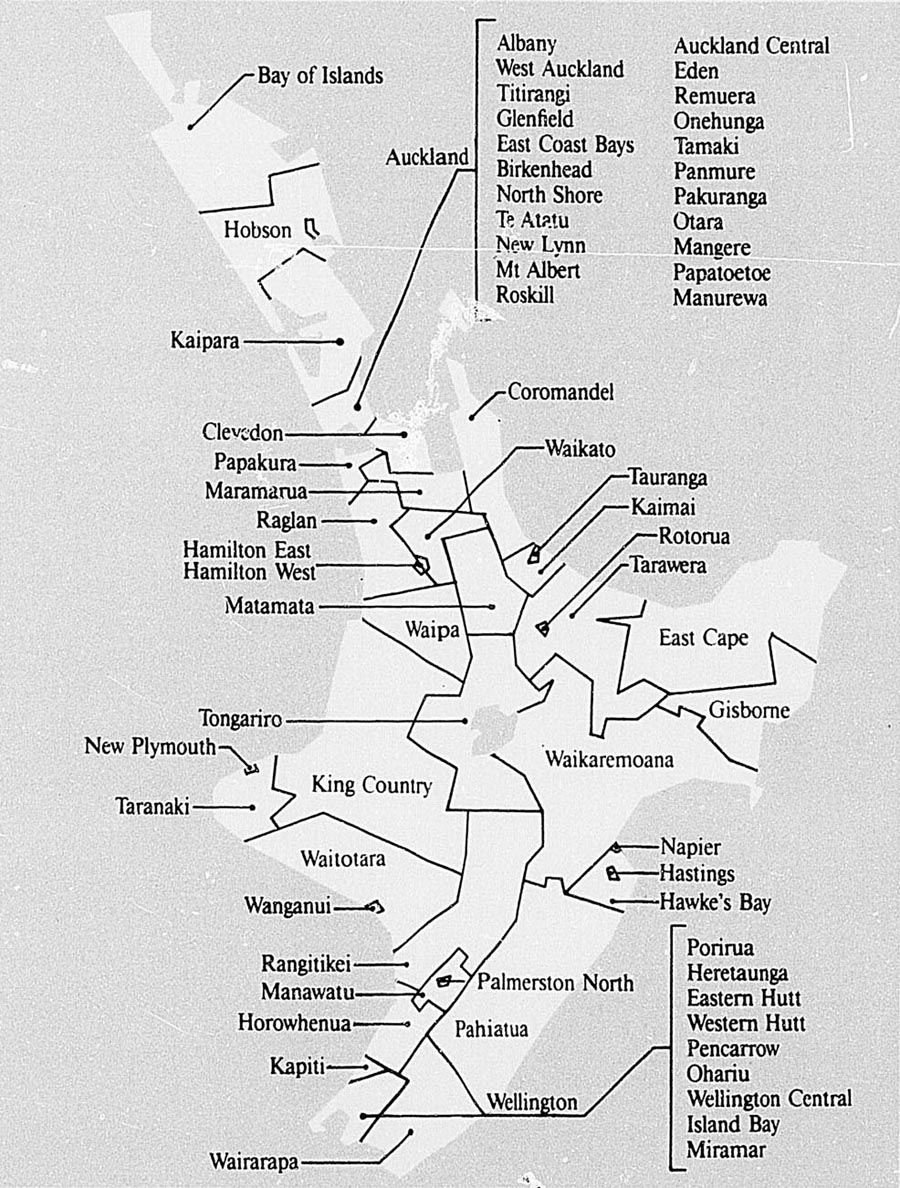
1987 ELECTORAL DISTRICTS — NORTH ISLAND
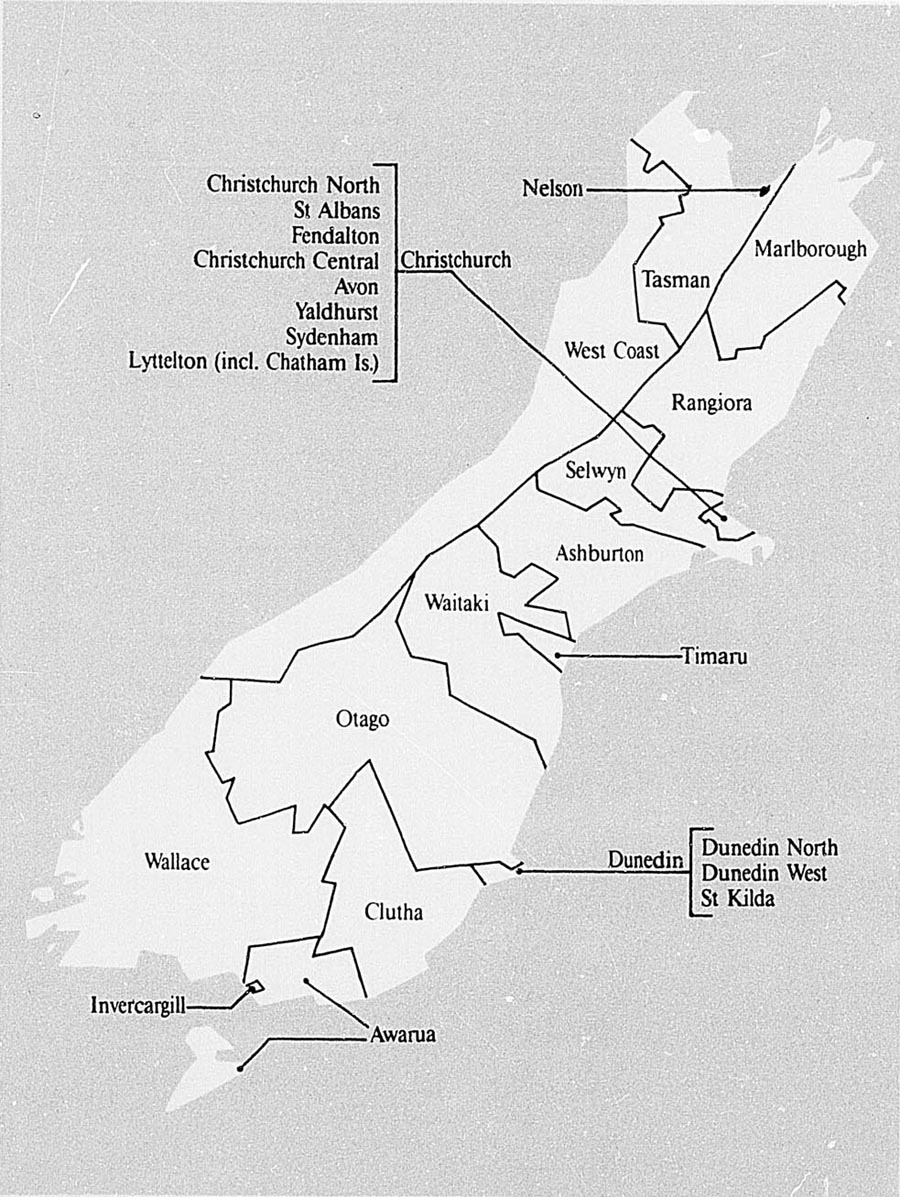
1987 ELECTORAL DISTRICTS — SOUTH ISLAND
The Representation Commission is responsible for defining the boundaries of electorates based on the population census. The commission has eight members. Five are officials, the Surveyor-General, the Government Statistician, the Chief Electoral Officer, and until 1987 the Director-General of the Post Office, and the Chairman of the Local Government Commission (the latter cannot vote). Two members are nominated by the House of Representatives to represent the Government and Opposition respectively, and the final member is appointed to chair the commission on the nomination of the other members. The appointments of the unofficial members lapse at the next census.
The number of general electorates is based on a formula that allocates 25 electorates to the South Island. The general electoral population of the South Island is divided by 25, and the population quota for each South Island electorate is divided into the general electoral population of the North Island to give the number of electorates required in the North Island. In addition there is a fixed number of four Maori electorates. Once the provisional electoral boundaries have been settled, maps of the proposals are drawn, and boundary details published in the New Zealand Gazette. Objections may be lodged within one month of publication. They are then published, and there are a further two weeks for lodging counter-objections. The objections and counter-objections are considered by the Representation Commission, which makes a final decision on the boundaries that define the new electoral districts.
General election results. A triennial general election of members of Parliament was held on 15 August 1987. The previous election was held on 14 July 1984. The total number of electors on the master roll for the 1987 election was 2 114 656. A total of 1 883 394 votes were cast; representing 89.06 percent of electors on the master roll.
Table 3.7. GENERAL ELECTION RESULTS
| Number of MPs | |||||||||
|---|---|---|---|---|---|---|---|---|---|
| Political party | 1966 | 1969 | 1972 | 1975 | 1978 | 1981 | 1984 | 1987* | |
*Includes result of electoral petition which was upheld and saw Wairarapa seat pass from Labour to National in July 1988. Source: Department of Justice. | |||||||||
| Democrats | 1 | - | - | - | 1 | 2 | 2 | - | |
| Labour | 35 | 39 | 55 | 32 | 40 | 43 | 56 | 57 | |
| National | 44 | 45 | 32 | 55 | 51 | 47 | 37 | 40 | |
| Total | 80 | 84 | 87 | 87 | 92 | 92 | 95 | 97 | |
Table 3.8. GENERAL ELECTIONS—VOTES FOR POLITICAL PARTIES
| Valid votes | Percentage of total valid votes | |||||||
|---|---|---|---|---|---|---|---|---|
| Political party | 1978 | 1981 | 1984 | 1987 | 1978 | 1981 | 1984 | 1987 |
*Excludes special votes disallowed. Source: Department of Justice. | ||||||||
| Democrats | 274,756 | 372,056 | 147,162 | 105,095 | 16.07 | 20.65 | 7.63 | 5.74 |
| Labour | 691,076 | 702,630 | 829,154 | 878,526 | 40.41 | 39.01 | 42.98 | 47.96 |
| Mana Motuhake | 8,332 | 5,989 | 9,789 | 0.46 | 0.31 | 0.53 | ||
| National | 680,991 | 698,508 | 692,494 | 806,348 | 39.82 | 38.78 | 35.89 | 44.02 |
| New Zealand Party | 236,385 | 5,306 | 12.25 | 0.29 | ||||
| Others | 63,350 | 19,777 | 18,017 | 26,838 | 3.70 | 1.10 | 0.94 | 1.46 |
| Total valid votes | 1,710,173 | 1,801,303 | 1,929,201 | 1,831,902 | 100.00 | 100.00 | 100.00 | 100.00 |
| Informal votes* | 11,270 | 8,998 | 7,565 | 11,185 | ||||
| Totals | 1,721,443 | 1,810,301 | 1,936,766 | 1,843,087 | ||||
Table 3.9. SEATS CONTESTED BY POLITICAL PARTIES, 1987 GENERAL ELECTION
| Political party | Seats Contested |
|---|---|
*All those contesting one seat only. Source: Department of Justice | |
| Labour | 97 |
| National | 97 |
| Democrats | 97 |
| New Zealand Party | 31 |
| McGillicuddy Serious | 19 |
| Wizard | 14 |
| Independent | 15 |
| Values | 10 |
| Mana Motuhake | 7 |
| Imperial British Conservative | 3 |
| Independent Labour | 3 |
| Breakfast | 2 |
| Labour Independent | 2 |
| Socialist Action League | 2 |
| Other* | 25 |
| Total | 424 |
National licensing poll. The licensing poll held in conjunction with the 1987 General Election was the twentieth at which the three options—national continuance, state purchase and control, and national prohibition (without compensation)—were submitted to the electors.
Table 3.10. RESULTS OF NATIONAL LICENSING POLLS
| Voting issue | 1972 | 1975 | 1978 | 1981 | 1984 | 1987 |
|---|---|---|---|---|---|---|
| Source: Department of Justice. | ||||||
| For national continuance | 931,778 | 1,094,445 | 1,053,268 | 1,124,258 | 1,319,518 | 1,212,989 |
| For state purchase and control | 244,003 | 235,374 | 252,154 | 247,217 | 222,049 | 217,290 |
| For national prohibition | 203,791 | 250,640 | 374,194 | 384,780 | 352,949 | 372,364 |
The Commissions of Inquiry Act 1908, provides that the Governor-General may by Order-in-Council, appoint any person or persons to be a commission to inquire into and report upon any question arising out of, or concerning: (a) the administration of the Government; (b) the working of any existing law; (c) the necessity or expediency of any legislation; (d) the conduct of any officer in the service of the Crown; (e) any disaster or accident (whether due to natural causes or otherwise) in which members of the public were killed, injured, or were or might have been exposed to risk of death or injury; and (f) any other matter of public importance.
A royal commission is appointed by the Governor-General pursuant to the Letters Patent, but in other respects derives its powers from the Commissions of Inquiry Act 1908. Royal commissions are generally regarded as having greater prestige. A committee of inquiry may be set up by a minister to investigate some matter, but such a committee normally has no statutory basis although there are ancillary powers in some instances.
Amendments to the legislation in 1979 and 1980 confer new rights upon any person if he or she is a party to the inquiry or satisfies the commission that he or she has an interest in the inquiry apart from any interest in common with the public. Usually the terms of reference for a commission are quite specific. While there is frequently a final term of reference which appears to include everything else, this term of reference must be considered in context. It does not confer the right on almost anyone to become a party or participant in the inquiry.
The Department of Internal Affairs administers the Commissions of Inquiry Act 1908 and provides basic services to commissions. These inquiries are not part of the justice system, nor are they part of the conventional administrative bureaucracy. The department retains important constitutional responsibilities, and is held responsible to ensure that complete independence and impartiality of the investigations is maintained.
Commissions of inquiry must report to the Governor-General, who in turn refers the findings and report to his or her ministers. It is frequently the custom for the report to be published.
The state sector is responsible for putting the policies of the Government into effect. It comprises government departments, the education, health and defence services, and statutory organisations (quangos). The state sector made up just over 22 percent of the estimated labour force at 31 March, 1987, although this figure has since fallen in the wake of public sector reforms described below.
Until recently several government departments and other government-owned organisations combined trading and regulatory or policy functions. This was seen as an impediment to organisations fulfilling either of these roles, and a major thrust of recent public sector reform has been clarification of the distinction between public service departments with regulatory, social and other functions on the one hand, and trading enterprises owned by government, on the other. A significant stage in this process was the establishment of several state-owned enterprises from former government departments or divisions of departments from 1 April 1987. These were:
Airways Corporation of New Zealand Limited;
Coal Corporation of New Zealand Limited;
Electricity Corporation of New Zealand Limited;
Government Life Insurance Corporation;
Government Property Services Limited;
Land Corporation Limited;
New Zealand Forestry Corporation Limited;
New Zealand Post Limited;
Post Office Bank Limited; and
Telecom Corporation of New Zealand Limited.
Other state-owned enterprises already in existence, such as Air New Zealand Limited, and the Shipping Corporation of New Zealand Limited, also came under the provisions of the State Owned Enterprises Act 1986.
The process has continued, and the Works and Development Services Corporation and Government Computing Service Limited were established in 1988, with other new state-owned enterprises likely to follow. An overview of the State Owned Enterprises Act 1986, and the formation of these organisations is given in the last edition of the Yearbook. In this edition the activities of the various state-owned enterprises are described in the relevant chapters, e.g., New Zealand Railways Corporation, New Zealand Post Limited, and Telecom Corporation of New Zealand are described in chapter 20, Transport and communications.
The specialised government services, i.e., the armed forces, police, health, and education, are also described in the relevant chapters.
Government departments are the main instruments for giving effect to government policy when Parliament has passed the necessary legislation. They may, and often do, work with and through local authorities, statutory boards and government-sponsored organisations operating under various degrees of government control. A change of government does not necessarily affect the number of general functions of government departments, although a radical change in policy may be accompanied by some organisational change. Each year departments are required to produce an annual report for parliamentary and public scrutiny. At 31 March 1988 the number of staff employed in the public service was 60 940, compared with 72 417 the year before and 89 105 at 31 March 1986.
Reform of the state sector, as distinct from the state-owned enterprises described above, continued during 1988 and is another major element of Government's policy to improve the efficiency of the public sector. Forecast 1987–88 total net government expenditure amounted to 38.8 percent of gross domestic product, meaning significant benefits are available from even relatively small improvements in state sector efficiency.
The State Sector Act 1988, which became law on 1 April 1988, replaced the State Services Act 1962 and the State Services Conditions of Employment Act 1977 (which set common conditions of employment for all departments). The new legislation provides senior Public Service management with increased flexibility, but this is linked to greater accountability.
The Act aligned the Public Service with the private sector by bringing it under the provisions of the Labour Relations Act 1987 (see section 12.4, Labour relations). It redefined the role of the State Services Commission (see below) and reshaped senior levels of the Public Service, with new appointment provisions for senior executives.
Heads of departments, previously known as ‘permanent heads’, are now known as ‘chief executives’, although they may retain specific designations required by departmental legislation. A Senior Executive Service has been established to provide a core of key senior managers. Members of this service may number up to 500. Both chief executives and members of the Senior Executive Service are engaged on contract for a maximum term of five years. The State Services Commission provides training and development opportunities for the Senior Executive Service.
Within departments the broader personnel functions formerly discharged by the State Services Commission are now the responsibility of each chief executive. The Act also removes the preference which formerly existed for Public Service applicants for departmental vacancies.
Operating under the State Sector Act 1988, the State Services Commission retains a review capacity and thus serves as a source of advice to the Government on the performance of the Public Service. With the former emphasis on centralised controls diminished, the commission is expected to concentrate on the provision of specialist advice and support to departments in the personnel and industrial relations fields.
The State Sector Act 1988 provides for a State Services Commission of up to four persons (appointed by the Governor-General in Council), and for a department of state known as the Office of the State Services Commission. Although the two bodies are technically distinct, the Chief Commissioner is also the Chief Executive of The Office of the State Services Commission. The principle functions of the commission are:
To review the machinery of government, including the allocation of functions to and between departments, the desirability or need for the creation of new departments and the amalgamation or abolition of existing departments, and the co-ordination of the activities of departments;
To review the efficiency, effectiveness and economy of each department, including the discharge of the chief executive of his or her functions;
To negotiate conditions of employment of employees in the Public Service;
To promote, develop and monitor in each department personnel policies and standards of personnel administration, and equal employment opportunities policies and programmes;
To advise departments on management systems, structures and organisations;
To advise and assist departments on, and assist with, the training and career development of staff; and
Other functions in connection with the administration and management of the Public Service as directed by the Prime Minister.
Equal employment opportunities. The State Services Commission has the overall responsibility for the promotion and monitoring of equal employment opportunity policies, programmes and practices within the Public Service.
A network has been set up to facilitate the co-ordination between the commission and departments at central and regional levels. In every government department, the senior management responsible for the promotion, development, and co-ordination of equal employment opportunity policy reports progress achieved in accordance with the policy. Each department is required to develop a plan which outlines specific action to be taken.
The commission promulgates positive action programmes which target the most employment-disadvantaged groups in the Public Service. Regular seminars and workshops are organised on equal employment principles and strategies for departmental managers, equal employment opportunities liaison officers, and training staff.
Table 3.11. CHIEF EXECUTIVES OF GOVERNMENT DEPARTMENTS*
| Department | Title | Name |
|---|---|---|
| * As at 1 September 1988. | ||
| Agriculture and Fisheries, Ministry of | Director-General | M. L. Cameron |
| Audit | Controller and Auditor-General | B. H. C. Tyler |
| Conservation | Director-General | D. K. McDowell |
| Crown Law | Solicitor-General | D. P. Neazor |
| Customs | Comptroller | M. W. Taylor |
| Defence, Ministry of | Secretary | D. B. G. McLean |
| Education | Director-General | R. Ballard |
| Energy, Ministry of | Secretary | B. V. Walker |
| Environment, Ministry for the | Secretary | R. W. G. Blakeley |
| Foreign Affairs, Ministry of | Secretary | M. Norrish |
| Forestry, Ministry of | Secretary | T. R. Cutler (acting) |
| Government Printing Office | Government Printer | V. R. Ward |
| Health | Director-General | G. C. Salmond |
| Housing Corporation | Director-General | D. G. P. Cattanach (acting) |
| Inland Revenue | Commissioner | J. Simcock |
| Internal Affairs | Secretary | P. W. Boag |
| Justice | Secretary | D. Oughton |
| Labour | Secretary | C. J. McKenzie |
| Maori Affairs | Secretary and Maori Trustee | T. M. Reedy |
| Police | Commissioner | M. T. Churches |
| Prime Minister's Office | Director | J. T. Henderson |
| Public Trust Office | Public Trustee | W. B. R. Hawkins |
| Rural Banking and Finance Corporation | General Manager | R. J. Chappell |
| Scientific and Industrial Research | Director-General | A. J. Ellis |
| Social Welfare | Director-General | J. W. Grant |
| State Insurance Office | General Manager | J. F. Stirton |
| State Services Commission | Chief Commissioner | D. K. Hunn |
| Statistics | Government Statistician | S. S. R. Kuzmicich |
| Survey and Land Information | Director-General/Surveyor General | W. N. Hawkey |
| Tourist and Publicity | General Manager | W. N. Plimmer |
| Trade and Industry | Secretary | E. A. Woodfield (acting) |
| Transport, Ministry of | Secretary | M. C. Bazley |
| Treasury | Secretary | G. C. Scott |
| Valuation New Zealand | Valuer-General | H. F. McDonald |
| Women's Affairs, Ministry of | Chief Executive | J. E. Aitken |
The functions of central government are under a continual process of review. The following account of departments was correct at the time of going to press (September 1988), but it should be pointed out that at that time organisational changes were being considered and were likely to be implemented during 1989, particularly in the areas of any remaining trading activities by departments (such as the Government Printing Office and the Rural Banking and Finance Corporation), and in the wake of the creation of new Ministries of Commerce, and External Relations and Trade, with the reorganisation of departments that will result. Change was also expected in the administration of education.
The ministry implements the Government's policies and programmes to derive maximum benefit to the nation from farming, horticulture, and fishing. Its programmes aim to improve: productivity, through research, advisory and management services; protection, by monitoring animals, fish and plants and preventing the introduction of exotic pets and diseases; and quality assurance, by assuring overseas agencies that primary produce meets agreed standards. The ministry also provides policy advice to the Government. Where feasible, costs are recovered by charging for services. See chapter 15, Agriculture and chapter 16, Forestry and fishing.
The department is responsible for the management of much of New Zealand's natural lands and water, as well as historic places and wildlife. In addition to managing national parks and reserves, farm and forest parks, the public aspects of harbours and foreshores, marine reserves, and unallocated Crown lands, the department is also the Government's advocate in conservation issues. See chapter 14, Land and environment.
The Crown Law Office is the legal adviser to, and provides counsel in court for, the Government and ministers in matters affecting the Crown and government departments. The Solicitor-General, who heads the office, performs most of the statutory and ex-officio duties of the Attorney-General and is entrusted by statute with various specific rights, duties and functions. The range of the Crown Law Office's legal work corresponds with the activities of the Government itself.
The Customs Department is a statutory agency responsible for giving advice to the Government on the development and administration of border control, indirect taxation, and for tariff-related policies.
The department's roles under the Customs Acts and other enabling legislation are: (a) to administer the Customs Tariff and customs procedures consistent with the Government's economic, industrial assistance and trade policy objectives and international obligations; (b) to ensure import/export transactions comply with government trade and revenue objectives as expressed in customs legislation, particularly in the fields of valuation, preference, dumping and countervailing. (c) to protect New Zealand's borders by exercising required control over the import and export of goods; (d) to administer the passage and transit of international passengers in relation to the Government's immigration, emigration and quarantine requirements; and (e) to protect, collect and account for customs and excise duties, and GST and other revenue charges. See chapter 22, Overseas trade.
The functions of the ministry include providing the resources required to enable defence headquarters to undertake the central command, control, management, and administration of the defence forces. See section 4.5, Defence.
The primary objective of the department is to ensure that suitable education programmes, facilities, staffing, and services are readily available for: pre-school children; children of compulsory school age (6–15 years); for children who by choice start school at the age of 5 years; for pupils over the age of 15 who stay on at school; for suitably qualified school-leavers who seek education and training at teachers colleges or polytechnics; and for adults wishing to continue their education, whether for vocational or non-vocational purposes. See chapter 9, Education.
The Ministry of Energy advises the Government on the formulation, implementation, co-ordination, and continuing review of energy policies for New Zealand. In carrying out this function the ministry must take into account energy sources and resources; exploration, assessment, research and development; production, supply, and distribution; consumption and conservation; needs of industry, commerce, transport, and domestic users; needs of regions; international responsibilities; environmental and social issues; organisational and administrative methods; and future patterns, changes, problems, and the need for planning. The ministry also has regulatory functions, and a Gas and Geothermal Trading Group is maintained as a separate trading arm to manage specific Crown interests in the petroleum and geothermal sectors. See chapter 17, Minerals and energy.
The ministry advises Government on all forms of environmental administration. This includes: policies for influencing the management of natural and physical resources and ecosystems, so as to achieve the objectives of the Environment Act 1986; possible consequences for the environment of proposed developments by either the private or public sector, particularly any developments not adequately covered by legislative or other environmental assessment requirements; and ways of providing effective public participation in environmental planning and policy formulation.
To carry out its role, the ministry gathers information and may conduct and commission research necessary for formulating advice to Government. It also provides Government, its agencies, and other public authorities, with advice on: the application, operation, and effectiveness of legislation relevant to achieving the objectives of the Environment Act; procedures for assessing and monitoring environmental impacts; pollution control and the management of pollutants; identification and likelihood of natural hazards, and the reduction of their effects; and the control of hazardous substances, during the management of their manufacture, storage, transport, and disposal.
As well, the ministry facilitates and encourages resolution of conflicts relating to policies and proposals which may affect the environment. It also provides and disseminates information on environmental policies.
Besides the Environment Act 1986, the ministry administers the Town and Country Planning Act 1977, the Water and Soil Conservation Act 1967, and the Soil Conservation and Rivers Control Act 1941.
The Ministry of Foreign Affairs assists the Government in the conduct of all its foreign relations and administers the network of diplomatic and consular posts overseas. See chapter 4, International relations and defence.
In September 1988 the formation of a new Ministry of External Relations and Trade was announced. It will include the existing ministry and a trade policy division from the Department of Trade and Industry and come into being on 1 December 1988.
The ministry is responsible for providing forestry sector services and policy advice to the Government. Its mission is to ‘promote the national interest through forestry, including wood based industries’. Its functions include research, advice on forestry policy to the Government, advisory services, collection of statistics, and training. Other responsibilities of a regulatory nature include quarantine and forest disease control, and timber inspection and grading.
The mission of the Government Printing Office is primarily to meet the needs of Parliament and the Government in their printing, publishing, and information processing requirements, including the marketing of legislation. This must be reconciled with commercial viability in the provision of services of: printing, publishing, stationery, information processing, and forms storage and distribution to other government departments and agencies, the wider public sector, and the private sector where there is a market.
The principal functions of the Department of Health are: (a) to administer all public Acts relating to the promotion or conservation of human health; (b) to advise local authorities in matters relating to environmental health; (c) to prevent, limit, and suppress communicable and other diseases; (d) to promote or carry out research and investigation in public health fields and in the prevention and treatment of disease; (e) to carry out inspections of factories in relation to matters concerning the public health and the prevention or treatment of disease, and to carry out all such inspections as may be required or authorised by any Act; (f) to publish reports, information, and advice concerning public health; (g) to organise and control medical, dental, and nursing services, so far as such services are paid for out of public moneys; (h) generally to take all such steps as may be desirable to secure the preparation, effective carrying out, and co-ordination of measures conducive to public health; and (i) to provide advisory information and processing services to hospital boards and various health agencies. See chapter 8, Health and safety.
The corporation is the primary government agency for providing subsidised housing assistance and is the Government's principal advisor on housing issues. Its major activities are the provision of rental housing and housing finance for low- and modest-income earners. It also provides home improvement loans, mortgage guarantees and refinance/‘second chance’ lending. Other activities include the purchase, development and sale of land; construction and sale of houses; management of its rental housing stock; loans and subsidies for housing for the elderly; and assistance for urban renewal and redevelopment.
The corporation administers the Homestart Scheme, which provides deposit-gap assistance for first home purchase. A programme for lending on multiply-owned Maori land uses the house rather than the land as security.
A number of lending activities are administered by the corporation either on an agency basis or in its own right. These include: loans to state servants on transfer; rehabilitation concessions to ex-service personnel; subsidies for hostel accommodation for young people; and loans for hotel and motel accommodation, private schools and medical centres.
The corporation also administers the Residential Tenancies Act 1986. It provides information on tenancy law for landlords and tenants, provides a tenancy mediation service and acts as an office for the Tenancy Tribunal. See chapter 19, Housing and construction.
The main function of the Inland Revenue Department is to assess and collect various taxes and duties. The principal tax is income tax, which is collected in part by pay-as-you-earn (PAYE) deductions from salaries and wages, in part by the payment of provisional tax during the year of derivation of income, and in part by an end-of-year assessment. Of the other revenues collected the most significant are goods and services tax, stamp duty, estate and gift duties, land tax, fringe benefit tax, and totalisator duty. The department also collects accident compensation levies on behalf of the Accident Compensation Corporation. See chapter 25, Public sector finance.
The department has a variety of responsibilities related to New Zealand's national identity, cultural heritage and community wellbeing. It works to the Prime Minister, Deputy Prime Minister and seven Cabinet portfolios (actually four cabinet ministers); Arts and Culture, Civil Defence, Internal Affairs, Local Government, Pacific Island Affairs, Recreation and Sport, and Youth Affairs. Services are provided in the following five main areas:
Constitutional services—The department provides constitutional services to central government and citizens, including: issuing passports and granting New Zealand citizenship; protection of national emblems, flags and names; arranging some documentation of Parliament and elections as required by constitution; ministerial services; administering commissions of inquiry; and reception of distinguished visitors.
Local government services—The department provides the main link between central and local government and is responsible for: local government legislation, research and reviews; the Local Government Commission; and related functions.
Cultural heritage and community development services—The department works to promote national and cultural identity, enhance wellbeing and preserve the people's heritage. This involves responsibility for a wide range of activities including: the 1990 Commission, Historical Publications Branch and the Dictionary of New Zealand Biography; Film and Video recording censorship; control of gaming, racing and lotteries; the Museum of New Zealand Planning Committee; the Ministry of Civil Defence; and the National Archives.
Government agency and statutory body services—The department provides financial and/or administrative services to organisations such as the Pacific Island Affairs Unit; the Board of Trustees of the National Art Gallery, Museum and War Memorial; the Hillary Commission for Recreation and Sport; and a number of others.
Commercial services—The department provides a translation service for government departments and exporters; the Government Cleaning Service operates on a commercial basis; and National Archives provides records management consultancy on a cost-recovery basis.
Many of the functions of the department are described in the relevant chapters of this book.
The department's functions may be classified broadly under the following headings: administration of courts; registration of patents, land transactions, births, deaths and marriages; control of prisoners, probationers and parolees; law reform; commercial affairs (including administration of the Companies Act); electoral work; and administrative work for the many authorities and tribunals. The tribunals, authorities, and committees serviced by the department help administer Acts, or advise the Government. The Department of Justice is responsible for the administration of about 160 Acts of Parliament.
The principal responsibilities of the Department of labour are to promote full employment through the provision of an employment and vocational guidance service; to ensure through the work of its field staff that workers are employed under safe and healthy working conditions; to assist and promote good industrial relations; and to collect and publish relevant information. In addition, it administers a range of statutes; among the most important are the Labour Relations Act 1987, the Factories and Commercial Premises Act 1981, the Construction Act 1959, and Acts dealing with weights and measures, apprenticeship, training, immigration, dangerous goods, and explosives.
A division of the department, the New Zealand Immigration Service, is responsible for the administration of the Immigration Act 1987.
An interim Department of Lands was established to continue and complete the disestablishment work of the former Department of Lands and Survey and to administer legislation, functions and land unallocated to the newly formed state-owned enterprises and government departments at 1 April 1987. The department is required to investigate and report to the Government on policy, legislative and administrative changes needed to provide an ultimate permanent home for the remaining functions and for Crown land not allocated.
The department exists to deliver government services to the Maori people. Its statutory obligations are those defined in the Maori Affairs Act 1953. The department also has a responsibility to advise the Government of the nature, effectiveness and efficiency with which these services are administered.
The fundamental role of the Department of Maori Affairs is to promote the development of Maori people in order that they may contribute fully to New Zealand's social, cultural, and economic life, and to foster the transmission of Maori cultural values deemed important to the identity of New Zealand as a nation. See section 6.4, Maori population.
The mission of the police is protecting life and property; preventing crime; maintaining the peace; detecting offenders by assisting and working together with the community and other agencies; and maintaining a police organisation capable of providing a high quality of service. See section 10.4, Police.
The Prime Minister's Office provides services in support of the Prime Minister as head and co-ordinator of Government. The staff of the Office of the Prime Minister provides the normal ministerial services. A press office is responsible for news media and public information relating to the Prime Minister and the general coordination of ministerial publicity. An advisory group advises the Prime Minister on policy matters referred to it.
The Public Trust Office provides a wide range of services as trustee, executor, manager, and attorney. It also acts as sinking fund or depreciation fund commissioner for many local authorities when so appointed, and additionally holds other funds on their behalf. It is also required to provide a number of statutory services irrespective of whether these are remunerative.
The corporation has the principal function of making loans to farming and other primary industries and related service industries. See section 24.1, Financial institutions.
The department's role is to advance, maintain, and apply scientific and technical knowledge for the benefit of New Zealand's social and economic development. DSIR research is described in chapter 13, Science and technology.
The principal functions of the Department of Social Welfare are (a) to administer the Department of Social Welfare Act 1971, the Children and Young Persons Act 1974, Parts I and III of the Social Security Act 1964, and to provide for the effective administration and servicing of the War Pensions Act 1954, the Rehabilitation Act 1941, and the Disabled Persons Community Welfare Act 1975; (b) to advise the minister on the development of social-welfare policies; (c) to provide such social-welfare services as the minister may from time to time direct; (d) to provide for the training of persons to undertake social-welfare activities; (e) to maintain close liaison with and encourage co-operation and co-ordination among any organisations and individuals engaged in social-welfare activities; and (f) to undertake and promote research into aspects of social welfare. See chapter 7, Social welfare.
The State Insurance Office transacts all classes of fire, accident, and marine insurance. Its function is to maintain a competitive insurance service. It also administers the Export Guarantee Office, which provides credit insurance for exporters.
The main functions of the department are: (a) to provide a statistical service relevant to the needs of governmental and community users, covering economic; demographic, and social activity; (b) to advise the Minister of Statistics on statistical policy matters; (c) to define and promote standard concepts, procedures, definitions, and classifications for use in official statistics; (d) to examine proposals by government departments for commencing or commissioning new statistical surveys, and to prepare submissions to the Minister of Statistics for approval or otherwise; (e) to review the collection, compilation, analyses, abstraction, and publication of official statistics produced in both the department and other government departments; and (f) to maintain liaison with international organisations or agencies requiring or making use of New Zealand official statistics.
The department is the principal government (civil and military) survey and mapping, and land information agency. Its work includes control surveys as the basis for cadastral surveys and basic topographic mapping, land title surveys, investigations into the status of Crown land and Maori land, large scale topographical surveys for engineering and management purposes, land development servicing, fixing of marine and air navigation aids, aerodrome obstruction surveys, earth deformation studies, environmental planning of land, and a graphic support for the electoral system.
The main Acts administered by the department are the Survey Act 1986, the New Zealand Geographic Board Act 1946, and the Crown Grants Act 1908. Proposals for the Reserves and Other Lands Disposal Bill are also collated by the department each year. See also section 14.1, Land resources and ownership.
The main functions of the New Zealand Tourist and Publicity Department are to promote travel to, within, and beyond New Zealand; to develop domestic tourism and stimulate off-season travel; to promote New Zealand overseas in the interests of tourism industry development; to administer schemes for financial assistance for the provision of accommodation and other tourist facilities and for expanding private sector marketing overseas; to undertake research into overseas tourism markets and into domestic tourism; to operate and sell tours and to provide a complete travel service to assist overseas travel agents; and to provide film and video production, processing, sales and consultancy services through the National Film Unit and supply visual image material and services through Communicate New Zealand. It also provides research services for the New Zealand Tourism Council, an advisory body reporting and making recommendations to the Minister of Tourism on all aspects of tourism. See also section 11.6, Tourism.
In its corporate plan, the department is committed “to promote in accordance with the Government's policies an environment within New Zealand and overseas that encourages the growth of internationally competitive, efficient, and market oriented business that will contribute to New Zealand's economic development and the welfare of its people.” The department provides business policy advice to the Government and supplies comprehensive, authoritative and timely business information. These tasks are performed in six operating divisions: Business Operations; Business Environment; Business Competition and Corporate Affairs; International Trade Relations; the New Zealand Trade Commission (which includes a network of trade commissioners overseas) and Communications Division (which includes the Radio Frequency Service). Corporate services and support services for the whole department are provided by another division. Also included in the department is the Ministry of Consumer Affairs, which operates as a separate division reporting to the Minister of Consumer Affairs. In addition, the department services the portfolio of the Minister of Regional Development.
In September 1988 it was announced that the Department of Trade and Industry would shed the New Zealand Trade Commission and the International Trade Relations Division and some other functions before becoming the Ministry of Commerce from 1 December 1988.
The ministry is responsible for providing the Government with the information and advice necessary for the development and implementation of strategies to ensure a safe, effective and economic transport system.
The ministry achieves this through four main divisions: Road Transport, Marine, Civil Aviation, and the Meteorological Service.
The Meteorological Service is responsible for providing information and advice to all sections of the community on the atmosphere, environment, weather, climatic conditions, and pollution of the air. It also promotes meteorological research and atmospheric science, and advises the Government on meteorological matters.
In addition to these operating divisions, the ministry has policy, economics, finance, and corporate services divisions. During 1988 a major reorganisation of the ministry was announced. It was being implemented at the time of going to press.
The principal functions of Treasury are to: provide the Government with independent economic and financial advice; implement the Government's economic and financial policies; control and account for the receipt and payment of government finances; and to provide financial information on the operations of the Government.
The Treasury assists informed public discussion of economic and financial matters, subject to the discretion required by its constitutional position, and administers responsibilities such as the Government Superannuation Fund and the coinage. It also includes the Government Actuary's Office. Until recently the National Provident Fund was administered by the Treasury.
The major activity of the department is to prepare valuation rolls for all districts in New Zealand, to keep these rolls up to date with changes in property holdings, ownership, occupancy, and development, and to revise the values at not more than five-yearly intervals. Between the five-yearly general revaluations current market values of individual properties are assessed as required. Values set by the department are used by other authorities to levy rates, land tax, estate, stamp and gift duties, and also by most government departments and agencies involved in land transactions. The department does research work on real estate markets and compiles section and house price indexes. It provides an advisory service to local authorities on all matters relating to rating. The department's extensive property record system is used to furnish data for land use, town planning and similar surveys both to local authorities and other public sector organisations. See section 14.1, Land resources and ownership.
This change-oriented ministry ensures that the interests of women are considered by decision-makers in all economic, legislative and social policy areas. The ministry has the following functions: (a) advising the Minister of Women's Affairs on the implications of the Government's policies, and public sector plans and expenditure programmes in terms of their differential impact on women; (b) monitoring and initiating legislation and regulations in order to promote equality of opportunity for women; (c) advising the Minister of Women's Affairs of suitable nominees for the appointment of women to statutory bodies and other quasi-governmental bodies; and (d) advising the Minister of Women's Affairs on any matter relevant to the implementation of the Government's manifesto where this has implications for, or explicitly refers to women.
In addition to the state service organisations there is a multitude of advisory bodies, statutory corporations, companies, councils, commissions, committees, tribunals and other organisations loosely connected to the Government.
They are popularly known as quangos (quasi-autonomous non-government organisations) and include: (a) some public corporations; (b) agricultural marketing boards; and (c) other non-departmental public bodies such as: (i) bodies with executive, administrative, regulatory, or commercial functions; (ii) bodies whose role is to advise ministers or departments; and (iii) tribunals and other judicial bodies.
These types of organisations have been established for various reasons such as: independence from political control and direct ministerial responsibility; freedom from departmental procedures and controls; impartiality in carrying out regulatory functions; participation of non-departmental personnel in advisory and decision-making functions; and representation of special interests in administration. The Government conducted a review of quangos in 1986, and subsequently terminated a number of them.
Most quangos are listed in the Register of Statutory and Allied Organisations issued by the Cabinet Office.
The Planning Council provides a focus for better information and consultation on the key medium-term issues in New Zealand's development. It was set up in 1977 as a result of recommendations by a Task Force on Economic and Social Planning which aimed to produce a more relevant planning framework for New Zealand. Original 1982 legislation provided the basis for the council to be independent of the Government in its choice of work and in publishing its reports. The New Zealand Planning Act 1982 confirmed this independence and defined the council's main task as being to monitor and report on trends, prospects, issues, and options in relation to social, economic and cultural development. An amendment passed in 1987 added environmental development to the council's sphere of operation. This amendment also gave the council the status of body corporate and made several changes which enhance the independence of the Planning Council. As well as reporting directly to the Government and working with government departments, the council uses published reports to foster understanding and discussion of issues among private organisations and the public generally.
The council itself has 12 members, including two co-opted members, drawn from different disciplines and areas of interest. The membership therefore reflects wide experience in many fields rather than representing particular sectional interests. A minister of the Crown nominated by the Prime Minister is a member of the council in an ex-officio capacity. There is also a full-time multi-disciplinary secretariat of around 17 people.
The council's work is built around a set of expert monitoring and support groups. An Economic Monitoring Group (EMG), building on the role of the earlier Monetary and Economic Council, analyses and stimulates discussion on issues of continuing concern in management of the economy. The role of the Population Monitoring Group (PMG) is to identify important population issues, monitor trends, and examine their implications for planning and policy-making. The Social Monitoring Group (SMG) was set up jointly by the Planning Council and the former Social Advisory Council early in 1984. Its role is to document trends relevant to social development in New Zealand, exploring their implications and significance and to comment on the social implications of economic policies. In 1986, the council established the Income Distribution Group to monitor aspects of income and wealth distribution in New Zealand and to explore the information base available to do this, with the aim of improving its usefulness. Similar expert groups are brought together to support council's work in other areas such as Maori development, sectoral patterns of economic activity, employment issues, and environmental resource management.
During 1987 the New Zealand Planning Council published the following reports: NZPC Monitoring Report series—Tracking Down the Deficit (EMG Report No. 8); Care and Control—The Role of Institutions in New Zealand (SMG Report No. 2); Planning Papers—No. 29 Maori Land; NZPC Series—No. 23 Social Policy Options; and Other Publications Series—The 1981/82 Government Budget and Household Income Distribution; and New Zealand After Nuclear War.
The Controller and Auditor-General is an officer of the Crown appointed by the Governor-General under the Public Finance Act 1977. Much like the judiciary, he or she is independent of the executive government and can only be removed from office by the Governor-General upon an address from the House of Representatives. There is also a Deputy Controller and Auditor-General, whose mode of appointment and tenure of office are the same. The Controller and Auditor-General, and persons acting under delegation from him or her, are collectively called the ‘Audit Office’. No minister is in any way responsible for the carrying out or exercise by the Audit Office of its functions, duties and powers.
The constitutionary important role of the Audit Office is to act as a monitor on behalf of Parliament, and take part in the procedures laid down in the Public Finance Act 1977 to control issues of money out of the Public Account. The Audit Office has to be satisfied that all issues from the Public Account to meet the Government's expenditure requirements are within the appropriations and other authorities granted by Parliament. This role is crucial to the ability of Parliament to control the supply of funds to the Crown, and in certain circumstances the Audit Office may prevent the issue of money from the Public Account.
The Audit Office audits the financial statements of government departments, local authorities, and most government-controlled corporations, boards and companies. As auditor of organisations in the public sector the Audit Office plays a key part in the process of accountability by those organisations, and accordingly it has a range of responsibilities much more extensive than that accepted by auditors whose role is confined to the traditional financial audit. In addition to carrying out audits leading to the expression of an opinion on financial statements, the Audit Office conducts periodic reviews of financial control systems and of selected programmes or operations to ascertain whether resources have been applied effectively and efficiently in a manner consistent with the policies of the governing bodies.
The Audit Office also places considerable emphasis on reporting the results of its work. The most visible result of that emphasis is the reports tabled in Parliament each year, which deal with issues ranging from those arising from particular audits to matters concerning financial management and administration in the public sector.
To enable it to carry out its functions, the Audit Office has a number of powers. These include rights of access to the books, accounts, and property of its clients, and the right to require persons to supply information, or deliver up books and accounts in their possession or under their control.
The Controller and Auditor-General has no general power of sanction to remedy shortcomings discovered during an audit. The principal recourse is to report to the management of the organisation either by letter or in the formal audit opinion on financial statements, to a minister, or to Parliament and its select committees. If there is a deficiency or loss of public money or stores, the Controller and Auditor-General has the power to surcharge the persons responsible to recover the amount involved. This power is rarely used.
The Official Information Act 1982 gives effect to the principle that information shall be made available unless there is good reason for withholding it. It establishes a flexible mechanism, capable of contributing to and being responsive to changing attitudes and circumstances, and leading to increased availability of information. The purposes of the Act are: (a) to increase progressively the availability of official information to the people of New Zealand to facilitate their more effective participation in the making and administration of laws and policies; and to promote the accountability of ministers and officials, and thereby enhance respect for the law and promote the good government of New Zealand; (b) to provide for proper access by each person to official information relating to that person; and (c) to protect official information to the extent consistent with the public interest and the preservation of personal privacy.
With the exception of the Parliamentary Service, the Act covers all government departments—but it does not include courts, tribunals (in relation to their judicial functions), or some other judicial bodies. The Act also covers state-owned enterprises, education and health authorities, and a range of statutory bodies.
In addition, statutory boards and all local authorities are now covered by official information legislative requirements, either in the form of the Official Information Act 1982 or the Local Government Official Information and Meetings Act 1987.
The Acts provide special rights of access to personal information, which means any official information held about an identifiable person. A ‘person’ is defined as including a sole corporation and a body of persons, whether corporate or unincorporate. Where it is necessary to make a distinction between a human being, and other entities legally described as ‘persons’, the former is referred to as a ‘natural person’.
In legislating for increased openness in the release and dissemination of information, Parliament recognised that there may be good reasons for withholding some information. The criteria which may justify not releasing information are set down in sections 6 and 7 of the Official Information Act 1982 and cover information which, if released, would be likely to prejudice: (a) the security, defence, or international relations of New Zealand; (b) the entrusting of information to the Government of New Zealand on a basis of confidence by the government or a government agency of another country, or any international organisation; (c) the maintenance of law and order; (d) the safety of any person; (e) the economic interests of New Zealand; and (f) the security or defence of the Cook Islands, Tokelau, Niue, or the Ross Dependency. Section 9 sets out other good reasons for withholding official information, unless in the circumstances of the particular case the withholding of that information is outweighed by other considerations which render it desirable in the public interest to make that information available.
Requests for information do not have to be made in any prescribed form. They may be made by telephone, in person, or in writing. Requests should however provide sufficient detail to allow the relevant material or documents to be identified. Sometimes applicants will need assistance with this task and the Act makes the provision of reasonable assistance a duty. Information guides concerning access to personal and official information are available. Organisations covered by the Act are required to respond to requests within specified time limits.
To assist the lodging of requests, reference can be made to the Directory of Official Information, published every two years and available at public libraries and Citizens’ Advice Bureaus. This gives a complete list of organisations covered by the Act, their structure and function, a general description of all kinds of documents held; a list of all manuals, and similar types of documents which contain policies, principles, rules, or guidelines, in accordance with which decisions are made; and how to obtain access to information, including details of contact officers.
The Ombudsman can review a decision to refuse information. There is no charge and the investigation is private. The Ombudsman's formal recommendations are binding unless overridden by a minister in accordance with a formal procedure. That procedure requires that where a minister declines to accept an ombudsman's recommendation, the decision, the grounds for it, and (except on the grounds of national security), the source and purport of any advice on which it was based are to be published in the New Zealand Gazette. If an ombudsman concludes that any complaint made under the Act cannot be sustained, he or she will explain the reasons to the complainant.
The position of Parliamentary Commissioner for Investigations (Ombudsman) was created in 1962. Until 1968 the principal function of the Ombudsman was to enquire into complaints relating to administrative decisions of government departments and related organisations. In 1968 the jurisdiction was extended to hospital boards and education boards. Under the Ombudsmen Act 1975 the jurisdiction was further extended to all local authorities. Under the 1975 Act, provision was made for the appointment of a Chief Ombudsman and one or more other ombudsmen, whose appointments could be permanent or temporary.
Complaints to the Ombudsmen must be made in writing, and investigations are conducted in private. An ombudsman may decide not to investigate a complaint where there appears to be an alternative administrative avenue of redress available to the complainant; where the complaint relates to a matter which has been within the complainant's knowledge for more than 12 months; where the complaint is trivial; or where the complainant has not a sufficient personal interest in the subject-matter of the complaint. The Ombudsmen have no authority to investigate certain complaints, for example, complaints against private companies and individuals, decisions of judges, complaints directed at ministerial decisions, or at the full council or board of a local organisation. However, an ombudsman may investigate recommendations made to a minister by any government department, organisation or employee, or to a full council by any committee, sub-committee, officer, employee, or member. An ombudsman may not investigate a complaint where the complainant has a statutory right of appeal on the merits of the case to a court or statutory tribunal, unless there are special circumstances why it would not be reasonable to expect that person to have exercised the right of appeal.
Where an ombudsman forms the opinion that a complaint can be sustained, he or she reports his or her opinion to the government department or government organisation concerned with any recommendation that he or she may make for remedial action. A copy of the report is also made available to the responsible minister. In the case of a local organisation, the ombudsman reports the opinion to that organisation and makes a copy of his report available to the mayor or chairperson.
The Ombudsmen have also assumed certain responsibilities under the Official Information Act 1982 and Local Government Official Information and Meetings Act 1987. On receipt of a written complaint an ombudsman has a responsibility to investigate any decision made on a request for information: for example, a refusal of the whole or part of the request; or a decision on what charge is to be made for providing the information. An ombudsman may also investigate undue delays in responding to requests.
Table 3.12. COMPLAINTS TO THE OMBUDSMEN, 1987*
| Action on complaint | Ombudsmen Act 1975 | Official Information Act 1982 |
|---|---|---|
*Year ended 31 March. Source: Office of the Ombudsmen. | ||
| Declined, no jurisdiction | 235 | 7 |
| Declined or discontinued section 17 | 388 | 72 |
| Resolved in course of investigation | 168 | 181 |
| Resolved informally | 47 | 11 |
| Sustained, recommendation made | 34 | 10 |
| Sustained, no recommendation made | 59 | 2 |
| Not sustained | 358 | 66 |
| Formal investigation not undertaken, explanation, advice, or assistance given | 460 | 61 |
| Still under investigation as at 31 March | 398 | 80 |
| Total | 2,147 | 490 |
Table 3.13 lists the public Acts of general application in New Zealand, and administering departments at 1 January 1988. The list does not refer to amending, appropriation, finance or other Acts containing miscellaneous provisions for local government and other areas.
For a complete list of Acts and regulations in force see Tables of Acts and Statutory Regulations in Force, issued annually by the Government Printing Office.
It should also be noted that state sector reorganisation during 1988 means that the administering departments for some Acts have changed, or are the process of changing.
Table 3.13. PUBLIC ACTS IN FORCE, 1 JANUARY 1988
| Act | Administering department |
|---|---|
| Source: Parliamentary Service | |
| Accident Compensation Act 1982 | Accident Compensation Corporation |
| Acts Interpretation Act 1924 | Justice |
| Administration Act 1969 | Justice |
| Admiralty Act 1973 | Justice |
| Adoption Act 1955 | Justice |
| Adult Adoption Information Act 1985 | Justice |
| Adult Education Act 1963 | Education |
| Age of Majority Act 1970 | Justice |
| Aged and Infirm Persons Protection Act 1912 | Justice |
| Agricultural and Pastoral Societies Act 1908 | Agriculture and Fisheries |
| Agricultural Pesticides Act 1983 | Agriculture and Fisheries |
| Agricultural Pests Destruction Act 1967 | Agriculture and Fisheries |
| Agricultural Workers Act 1977 | Labour |
| Agriculture (Emergency Powers) Act 1934 | Agriculture and Fisheries |
| Agriculture (Emergency Regulations Confirmation) Acts | Agriculture and Fisheries |
| Air Services Licensing Act 1983 | Transport |
| Aircrew Industrial Tribunal Act 1971 | Labour |
| Airport Authorities Act 1966 | Transport |
| Alcoholic Liquor Advisory Council Act 1976 | Justice |
| Alcoholism and Drug Addiction Act 1966 | Health |
| Animal Remedies Act 1967 | Agriculture and Fisheries |
| Animals Act 1967 | Agriculture and Fisheries |
| Animals Protection Act 1960 | Agriculture and Fisheries |
| Antarctic Marine Living Resources Act 1981 | Foreign Affairs |
| Antarctica Act 1960 | Foreign Affairs |
| Antiquities Act 1975 | Internal Affairs |
| Anzac Day Act 1966 | Internal Affairs |
| Apiaries Act 1969 | Agriculture and Fisheries |
| Apple and Pear Marketing Act 1971 | Agriculture and Fisheries |
| Apprenticeship Act 1983 | Labour |
| Arbitration Act 1908 | Justice |
| Arbitration Clauses (Protocol) and the Arbitration (Foreign Awards) Act 1933 | Justice |
| Arbitration (Foreign Agreements and Awards) Act 1982 | Justice |
| Arbitration (International Investments Disputes) Act 1979 | Justice |
| Architects Act 1963 | Internal Affairs |
| Archives Act 1957 | Internal Affairs |
| Area Health Boards Act 1983 | Health |
| Armed Forces Canteens Act 1948 | Defence |
| Armed Forces Discipline Act 1971 | Defence |
| Arms Act 1983 | Police |
| Atomic Energy Act 1945 | Energy |
| Auckland Airport Act 1987 | Transport |
| Auctioneers Act 1928 | Justice |
| Aviation Crimes Act 1972 | Justice |
| Bank of New Zealand Act 1979 | Treasury |
| Banking Act 1982 | Reserve Bank |
| Beer Act 1977 | Customs |
| Berryfruit Levy Act 1967 | Agriculture and Fisheries |
| Bills of Exchange Act 1908 | Justice |
| Births and Deaths Registration Act 1951 | Justice |
| Boilers, Lifts, and Cranes Act 1950 | Transport |
| Boxing and Wrestling Act 1981 | Internal Affairs |
| Broadcasting Act 1976 | Broadcasting Corporation |
| Building Research Levy Act 1969 | Scientific and Industrial Research |
| Building Societies Act 1965 | Treasury |
| Burial and Cremation Act 1964 | Health |
| Bush Workers Act 1945 | Labour |
| Bylaws Act 1910 | Internal Affairs |
| Canterbury Provincial Buildings Vesting Act 1928 | Conservation |
| Carriage by Air Act 1967 | Transport |
| Carriage of Goods Act 1979 | Justice |
| Charitable Trusts Act 1957 | Justice |
| Chateau Companies Act 1977 | Justice |
| Chattels Transfer Act 1924 | Justice |
| Cheques Act 1960 | Justice |
| Children and Young Persons Act 1974 | Social Welfare |
| Children's Health Camps Act 1972 | Health |
| Chiropractors Act 1982 | Health |
| Citizenship Act 1977 | Internal Affairs |
| Citizenship (Western Samoa) Act 1982 | Internal Affairs |
| Civil Aviation Act 1964 | Transport |
| Civil Defence Act 1983 | Internal Affairs |
| Civil List Act 1979 | Prime Minister's |
| Clean Air Act 1972 | Health Works and |
| Clerks of Works Act 1944 | Development |
| Coal Mines Act 1979 | Energy |
| Commerce Act 1986 | Trade and Industry |
| Commissions of Inquiry Act 1908 | Internal Affairs |
| Commonwealth Countries Act 1977 | Foreign Affairs |
| Commonwealth Games Symbol Protection Act 1974 | Internal Affairs |
| Companies Act 1955 | Justice |
| Companies (Bondholders Incorporation) Act 1934–35 | Justice |
| Companies Special Investigation Act 1958 | Justice |
| Conservation Act 1987 | Conservation |
| Constitution Act 1986 | Justice |
| Construction Act 1959 | Labour |
| Consular Privileges and Immunities Act 1971 | Foreign Affairs |
| Consumer Council Act 1966 | Trade and Industry |
| Continental Shelf Act 1964 | Foreign Affairs |
| Contraception, Sterilisation, and Abortion Act 1977 | Justice |
| Contracts Enforcement Act 1956 | Justice |
| Contracts (Privity) Act 1982 | Justice |
| Contractual Mistakes Act 1977 | Justice |
| Contractual Remedies Act 1979 | Justice |
| Contributory Negligence Act 1947 | Justice |
| Cook Islands Act 1915 | Foreign Affairs |
| Cook Islands Constitution Act 1964 | Foreign Affairs |
| Co-operative Companies Act 1956 | Justice |
| Co-operative Dairy Companies Act 1949 | Justice |
| Co-operative Forestry Companies Act 1978 | Justice |
| Co-operative Freezing Companies Act 1960 | Justice |
| Copyright Act 1962 | Justice |
| Cornish Companies Management Act 1974 | Justice |
| Coroners Act 1951 | Justice |
| Costs In Criminal Cases Act 1967 | Justice |
| Counties Insurance Empowering Act 1941 | Internal Affairs |
| Courts Martial Appeals Act 1953 | Defence |
| Credit Contracts Act 1981 | Justice |
| Crimes Act 1961 | Justice |
| Crimes (Internationally Protected Persons and Hostages) Act 1980 | Justice |
| Criminal Justice Act 1985 | Justice |
| Crown Grants Act 1908 | Survey and Land Information |
| Crown Proceedings Act 1950 | Justice |
| Customs Act 1966 | Customs |
| Customs Law Act 1908 | Customs |
| Customs Orders Confirmation Act 1987 | Customs |
| Dairy Board Act 1961 | Agriculture and Fisheries |
| Dairy Industry Act 1952 | Agriculture and Fisheries |
| Dangerous Goods Act 1974 | Labour |
| Deaths By Accidents Compensation Act 1952 | Justice |
| Decimal Currency Act 1964 | Treasury |
| Declaratory Judgments Act 1908 | Justice |
| Deeds Registration Act 1908 | Justice |
| Defamation Act 1954 | Justice |
| Defence Act 1971 | Defence |
| Dental Act 1963 | Health |
| Department of Social Welfare Act 1971 | Social Welfare |
| Designs Act 1953 | Justice |
| Development Finance Corporation of New Zealand Act 1986 | Trade and Industry |
| Dietitians Act 1950 | Health |
| Diplomatic Privileges and Immunities Act 1968 | Foreign Affairs |
| Disabled Persons Community Welfare Act 1975 | Social Welfare |
| Disabled Persons Employment Promotion Act 1960 | Labour |
| Distillation Act 1971 | Customs |
| Distress and Replevin Act 1908 | Justice |
| District Courts Act 1947 | Justice |
| District Railways Act 1908 | Works and Development |
| Dog Control and Hydatids Act 1982 | Internal Affairs and Agriculture and Fisheries |
| Domestic Actions Act 1975 | Justice |
| Domestic Protection Act 1982 | Justice |
| Domicile Act 1976 | Justice |
| Door To Door Sales Act 1967 | Trade and Industry |
| Earthquake and War Damage Act 1944 | Earthquake and War Damage Commission |
| Education Act 1964 | Education |
| Education Lands Act 1949 | Education |
| Electoral Act 1956 | Justice |
| Electric Linemen Act 1959 | Energy |
| Electric Power Boards Act 1925 | Energy |
| Electrical Registration Act 1979 | Energy |
| Electricity Supply Association Act 1930 | Energy |
| Electricity Act 1968 | Energy |
| Electricity Operators Act 1987 | Energy |
| Emergency Forces Rehabilitation Act 1953 | Social Welfare |
| Enemy Property Act 1951 | Public Trust |
| Energy Resources Levy Act 1976 | Energy |
| Engineering Associates Act 1961 | Works and Development |
| Engineers Registration Act 1924 | Works and Development |
| English Laws Act 1908 | Justice |
| Environment Act 1986 | Environment |
| Equal Pay Act 1972 | Labour |
| Estate and Gift Duties Act 1968 | Inland Revenue |
| Evidence Act 1908 | Justice |
| Explosives Act 1957 | Labour State Insurance |
| Export Guarantee Act 1964 | Office |
| Extradition Act 1965 | Justice |
| Factories and Commercial Premises Act 1981 | Labour |
| Fair Trading Act 1986 | Trade and Industry |
| Family Benefits (Home Ownership) Act 1964 | Social Welfare |
| Family Courts Act 1980 | Justice |
| Family Proceedings Act 1980 | Justice |
| Family Protection Act 1955 | Justice |
| Farm Ownership Savings Act 1974 | Rural Banking and Finance Corporation |
| Fees and Travelling Allowances Act 1951 | Treasury |
| Fencing Act 1978 | Justice |
| Fencing of Swimming Pools Act 1987 | Internal Affairs |
| Fertilisers Act 1960 | Agriculture and Fisheries |
| Films Act 1983 | Internal Affairs |
| Fire Service Act 1975 | Internal Affairs |
| Fish Royalties Act 1985 | Agriculture and Fisheries/Conservation |
| Fisheries Act 1983 | Agriculture and Fisheries/Conservation |
| Fishing Industry Board Act 1963 | Agriculture and Fisheries |
| Fishing Vessel Ownership Savings Act 1977 | Rural Banking and Finance Corporation |
| Flags, Emblems, and Names Protection Act 1981 | Internal Affairs |
| Food Act 1981 | Health |
| Foreign Affairs and Overseas Service Act 1983 | Foreign Affairs |
| Forest and Rural Fires Act 1977 | Ministry of Forestry |
| Forestry Encouragement Act 1962 | Ministry of Forestry |
| Forestry Rights Registration Act 1983 | Ministry of Forestry |
| Forests Act 1949 | Ministry of Forestry |
| Franklin-Manukau Pest Destruction Act 1971 | Agriculture and Fisheries |
| Friendly Societies and Credit Unions Act 1982 | Treasury |
| Frustrated Contracts Act 1944 | Justice |
| Fugitive Offenders Act 1881 (U.K.) | Justice |
| Gaming and Lotteries Act 1977 | Internal Affairs |
| Gaming Duties Act 1971 | Inland Revenue |
| Gas Act 1982 | Energy |
| General Agreement on Tariffs and Trade Act 1948 | Customs |
| Geneva Conventions Act 1958 | Foreign Affairs |
| Geothermal Energy Act 1953 | Energy |
| Goods and Services Tax Act 1985 | Inland Revenue |
| Government Life Insurance Corporation Act 1987 | Government Life Insurance Corporation |
| Government Service Equal Pay Act 1960 | State Services Commission |
| Government Superannuation Fund Act 1956 | Treasury |
| Guardianship Act 1968 | Justice |
| Harbours Act 1950 | Transport |
| Hauraki Gulf Maritime Park Act 1967 | Conservation |
| Health Act 1956 | Health |
| Health Benefits (Reciprocity with Australia) Act 1986 | Health |
| Health Benefits (Reciprocity with the United Kingdom) Act 1982 | Health |
| Health Service Personnel Act 1983 | Health |
| Heavy Engineering Research Levy Act 1978 | Scientific and Industrial Research |
| Higher Salaries Commission Act 1977 | Labour |
| Hire Purchase Act 1971 | Justice |
| Historic Places Act 1980 | Conservation |
| Hive Levy Act 1978 | Agriculture and Fisheries |
| Holidays Act 1981 | Labour |
| Home Ownership Savings Act 1974 | Housing Corporation |
| Homosexual Law Reform Act 1986 | Justice |
| Hospitals Act 1957 | Health |
| Hotel Association of New Zealand Act 1969 | Justice |
| Housing Act 1955 | Housing Corporation |
| Housing Corporation Act 1974 | Housing Corporation |
| Hovercraft Act 1971 | Transport |
| Human Rights Commission Act 1977 | Justice |
| Human Tissues Act 1964 | Health |
| Hunter Gift for the Settlement of Discharged Soldiers Act 1921 | Lands |
| Illegal Contracts Act 1970 | Justice |
| Immigration Act 1987 | Labour |
| Impounding Act 1955 | Internal Affairs |
| Imprisonment for Debt Limitation Act 1908 | Justice |
| Income Tax Act 1976 | Inland Revenue |
| Income Tax (Annual) Acts | Inland Revenue |
| Incorporated Societies Act 1908 | Justice |
| Indecent Publications Act 1963 | Justice |
| Industrial and Provident Societies Act 1908 | Justice |
| Industrial Design Act 1966 | Trade and Industry |
| Industrial and Provident Societies Act 1908 | Trade and Industry |
| Industrial Training Levies Act 1978 | Labour |
| Infants Act 1908 | Justice |
| Inferior Courts Procedure Act 1909 | Justice |
| Inland Revenue Department Act 1974 | Inland Revenue |
| Innkeepers Act 1962 | Justice |
| Insolvency Act 1967 | Justice |
| Insurance Companies’ Deposits Act 1953 | Justice |
| Insurance Law Reform Act 1977 | Justice |
| Insurance Law Reform Act 1985 | Justice |
| International Air Services Licensing Act 1947 | Transport |
| Internal Energy Agreement Act 1976 | Energy |
| International Finance Agreements Act 1961 | Treasury |
| International Terrorism (Emergency Powers) Act 1987 | Prime Minister's |
| Iron and Steel Industry Act 1959 | Energy |
| Joint Council for Local Authorities Services Act 1977 | Internal Affairs |
| Joint Family Homes Act 1964 | Justice |
| Judicature Act 1908 | Justice |
| Juries Act 1981 | Justice |
| Justices of the Peace Act 1957 | Justice |
| Kapiti Island Public Reserves Act 1897 | Conservation |
| Kermadec Islands Act 1887 | Foreign Affairs |
| Kitchener Memorial Scholarship Trust Act 1941 | Education |
| Labour Department Act 1954 | Labour |
| Labour Relations Act 1987 | Labour |
| Lake Waikaremoana Act 1971 | Maori Affairs |
| Lake Wanaka Preservation Act 1973 | Conservation |
| Land Act 1948 | Survey and Land Information |
| Land Drainage Act 1908 | Internal Affairs |
| Land Settlement, Promotion, and Land Acquisition Act 1952 | Lands |
| Land Tax Act 1976 | Inland Revenue |
| Land Transfer Act 1952 | Justice |
| Land Transfer (Hawke's Bay) Act 1931 | Justice |
| Land Valuation Proceedings Act 1948 | Justice |
| Law Commission Act 1985 | Justice |
| Law Practitioners Act 1982 | Justice |
| Law Reform Act 1936 | Justice |
| Law Reform Act 1944 | Justice |
| Law Reform (Testamentary Promises) Act 1949 | Justice |
| Layby Sales Act 1971 | Justice |
| Legal Aid Act 1969 | Justice |
| Legislative Council Abolition Act 1950 | Legislative |
| Legislature Act 1908 | Legislative |
| Libraries and Mechanics’ Institutes Act 1908 | Internal Affairs |
| Licensing Act 1908 | Justice |
| Licensing Trusts Act 1949 | Justice |
| Life Insurance Act 1908 | Justice |
| Limitation Act 1950 | Justice |
| Lincoln College Act 1961 | Education |
| Litter Act 1979 | Internal Affairs |
| Local Authorities (Employment Protection) Act 1963 | Internal Affairs |
| Local Authorities Loans Act 1956 | Treasury |
| Local Authorities (Members’ Interests) Act 1968 | Internal Affairs |
| Local Elections and Polls Act 1976 | Internal Affairs |
| Local Government Act 1974 | Internal Affairs |
| Local Government Official Information and Meetings Act 1987 | Internal Affairs |
| Local Railways Act 1914 | Works and Development |
| Machinery Act 1950 | Labour |
| Manapouri - Te Anau Development Act 1963 | Energy |
| Maori Affairs Act 1953 | Maori Affairs |
| Maori Community Development Act 1962 | Maori Affairs |
| Maori Education Foundation Act 1961 | Education |
| Maori Housing Act 1935 | Maori Affairs |
| Maori Language Act 1987 | Maori Affairs |
| Maori Purposes Acts 1931–1985 | Maori Affairs |
| Maori Purposes Funds Act 1934–35 | Maori Affairs |
| Maori Reserved Land Act 1955 | Maori Affairs |
| Maori Soldiers Trust Act 1957 | Maori Affairs |
| Maori Trust Boards Act 1955 | Maori Affairs |
| Maori Trustee Act 1953 | Maori Affairs |
| Maori Vested Lands Administration Act 1954 | Maori Affairs |
| Margarine Act 1908 | Agriculture and Fisheries |
| Marine and Power Engineers’ Institute Industrial Disputes Act 1974 | Labour |
| Marine Farming Act 1971 | Agriculture and Fisheries |
| Marine Insurance Act 1908 | Justice |
| Marine Mammals Protection Act 1978 | Conservation |
| Marine Pollution Act 1974 | Transport |
| Marine Reserves Act 1971 | Conservation |
| Marketing Act 1936 | Agriculture and Fisheries |
| Marriage Act 1955 | Justice |
| Massage Parlours Act 1978 | Justice University Grants |
| Massey University Act 1963 | Committee |
| Masterton Licensing Trust Act 1947 | Justice |
| Maternal Mortality Research Act 1968 | Health |
| Matrimonial Property Act 1976 | Justice |
| Meat Act 1981 | Agriculture and Fisheries |
| Meat Export Control Act 1921–22 | Agriculture and Fisheries |
| Meat Export Prices Act 1976 | Agriculture and Fisheries |
| Medical and Dental Auxiliaries Act 1966 | Health |
| Medical Practitioners Act 1968 | Health |
| Medical Research Council Act 1950 | Health |
| Medicines Act 1981 | Health |
| Mental Health Act 1969 | Health |
| Mercantile Law Act 1908 | Justice |
| Military Decorations and Distinctive Badges Act 1918 | Defence |
| Military Manoeuvres Act 1915 | Defence |
| Milk Act 1967 | Agriculture and Fisheries |
| Minimum Wage Act 1983 | Labour |
| Mining Act 1971 | Energy |
| Mining Tenures Registration Act 1962 | Justice |
| Ministry of Agriculture and Fisheries Act 1953 | Agriculture and Fisheries |
| Ministry of Energy Act 1977 | Energy |
| Ministry of Transport Act 1968 | Transport |
| Minors’ Contracts Act 1969 | Justice |
| Misuse of Drugs Act 1975 | Health |
| Misuse of Drugs Amendment Act 1978 Pt. II | Health |
| Mortgagors and Lessees Rehabilitation Act 1936 | Justice |
| Motor Spirits Distribution Act 1953 | Trade and Industry |
| Motor Spirits (Regulation of Prices) Act 1933 | Energy |
| Motor-Vehicle Dealers Act 1975 | Justice |
| Mount Egmont Vesting Act 1978 | Conservation |
| Municipal Association Act 1939 | Internal Affairs |
| Municipal Insurance Act 1960 | Internal Affairs |
| Music Teachers Act 1981 | Education |
| Mutual Insurance Act 1955 | Justice |
| National Art Gallery, Museum, and War Memorial Act 1972 | Internal Affairs |
| National Expenditure Adjustment Act 1932 | Treasury |
| National Library Act 1965 | Education |
| National Parks Act 1980 | Conservation |
| National Provident Fund Act 1950 | Treasury |
| National Research Advisory Council Act 1963 | State Services Commission |
| National Roads Act 1953 | Works and Development |
| Native Plants Protection Act 1934 | Conservation |
| Nature Conservation Council Act 1962 | Conservation |
| Naval and Victualling Stores Act 1908 | Defence |
| New Zealand Boundaries Act 1863 (U.K.) | Internal Affairs |
| New Zealand Council for Educational Research Act 1972 | Education |
| New Zealand Council for Postgraduate Medical Education Act 1978 | Health |
| New Zealand Council of Law Reporting Act 1938 | Justice |
| New Zealand Export-Import Corporation Act 1974 | Trade and Industry |
| New Zealand Film Commission Act 1978 | Internal Affairs |
| New Zealand Geographic Board Act 1946 | Survey and Land Information |
| New Zealand Government Property Corporation Act 1953 | Foreign Affairs |
| New Zealand Horticulture Export Authority Act 1987 | Agriculture and Fisheries |
| New Zealand Library Association Act 1939 | Education |
| New Zealand Maori Arts and Crafts Institute Act 1963 | Tourist and Publicity |
| New Zealand Market Development Board Act 1986 | Trade and Industry |
| New Zealand Nuclear Free Zone, Disarmament, and Arms Control Act 1987 | Foreign Affairs |
| New Zealand Planning Act 1982 | New Zealand Planning Council |
| New Zealand Ports Authority Act 1968 | Transport New Zealand |
| New Zealand Railways Corporation Act 1981 | Railways Corporation |
| New Zealand Register of Osteopaths Incorporated Act 1978 | Health |
| New Zealand Security Intelligence Service Act 1969 | New Zealand Security Intelligence Service |
| New Zealand Society of Accountants Act 1958 | Treasury |
| New Zealand Walkways Act 1975 | Conservation |
| Newspapers and Printers Act 1955 | Justice |
| Ngarimu V.C. and 28th (Maori) Battalion Memorial Scholarship Fund Act 1945 | Education |
| Niue Act 1966 | Foreign Affairs |
| Niue Constitution Act 1974 | Foreign Affairs |
| Noise Control Act 1982 | Health |
| Noxious Plants Act 1978 | Agriculture and Fisheries |
| Nurses Act 1977 | Health |
| Oaths and Declarations Act 1957 | Justice |
| Occupational Therapy Act 1949 | Health |
| Occupiers Liability Act 1962 | Justice |
| Offenders Legal Aid Act 1954 | Justice |
| Official Appointments and Documents Act 1919 | Internal Affairs |
| Official Information Act 1982 | Justice |
| Ombudsmen Act 1975 | Justice |
| Optometrists and Dispensing Opticians Act 1976 | Health |
| Orakei Block (Vesting and Use) Act 1978 | Lands |
| Orchard Levy Act 1953 | Agriculture and Fisheries |
| Overseas Investment Act 1973 | Reserve Bank |
| Pacific Islands Polynesian Education Foundation Act 1972 | Education |
| Parental Leave and Employment Protection Act 1987 | Labour |
| Parliamentary Service Act 1985 | Parliamentary Service |
| Partnership Act 1908 | Justice |
| Passports Act 1980 | Internal Affairs |
| Patents Act 1953 | Justice |
| Patriotic and Canteen Funds Act 1947 | Internal Affairs |
| Pawnbrokers Act 1908 | Justice |
| Penal Institutions Act 1954 | Justice |
| Perpetuities Act 1964 | Justice |
| Pesticides Act 1979 | Agriculture and Fisheries |
| Petroleum Act 1937 | Energy |
| Petroleum Demand Restraint Act 1981 | Energy |
| Pharmacy Act 1970 | Health |
| Phosphate Commission of New Zealand Act 1981 | Agriculture and Fisheries |
| Physiotherapy Act 1949 | Health |
| Plant Varieties Act 1973 | Agriculture and Fisheries |
| Plant Variety Rights Act 1987 | Agriculture and Fisheries |
| Plants Act 1970 | Agriculture and Fisheries |
| Plumbers, Gasfitters, and Drainlayers Act 1976 | Health |
| Police Act 1958 | Police |
| Political Disabilities Removal Act 1960 | Justice |
| Pork Industry Board Act 1982 | Agriculture and Fisheries |
| Post Office Bank Act 1987 | Treasury |
| Postal Services Act 1987 | Trade and Industry |
| Potato Industry Act 1977 | Agriculture and Fisheries |
| Poultry Act 1968 | Agriculture and Fisheries |
| Poultry Board Act 1980 | Agriculture and Fisheries |
| Primary Products Marketing Act 1953 | Agriculture and Fisheries |
| Primary Products Marketing Regulations Confirmation Act 1985 | Agriculture and Fisheries |
| Private Investigators and Security Guards Act 1974 | Justice |
| Private Savings Banks Act 1983 | Reserve Bank |
| Private Schools Conditional Integration Act 1975 | Education |
| Property Law Act 1952 | Justice |
| Psychologists Act 1981 | Health |
| Public Authorities (Party Wall) Empowering Act 1919 | Internal Affairs |
| Public Bodies’ Contracts Act 1959 | Internal Affairs |
| Public Bodies’ Leases Act 1969 | Internal Affairs |
| Public Contracts Act 1908 | Internal Affairs |
| Public Finance Act 1977 | Treasury |
| Public Service Investment Society Management Act (No. 2) 1979 | Justice |
| Public Trust Office Act 1957 | Public Trust |
| Public Works Act 1981 | Works and Development |
| Quantity Surveyors Act 1968 | Works and Development |
| Quarries and Tunnels Act 1982 | Energy |
| Queen Elizabeth The Second Arts Council of New Zealand Act 1974 | Internal Affairs |
| Queen Elizabeth The Second National Trust Act 1977 | Conservation |
| Queen Elizabeth The Second Postgraduate Fellowship of New Zealand Act 1963 | Education |
| Queen Elizabeth The Second Technicians Study Award Act 1970 | Education |
| Queenstown Reserves Vesting and Empowering Act 1971 | Conservation |
| Race Relations Act 1971 | Justice |
| Racing Act 1971 | Internal Affairs |
| Radiation Protection Act 1965 | Health |
| Rangitaiki Land Drainage Act 1956 | Internal Affairs |
| Rates Rebate Act 1973 | Internal Affairs |
| Rating Act 1967 | Internal Affairs |
| Real Estate Agents Act 1976 | Justice |
| Reciprocal Enforcement of Judgments Act 1934 | Justice |
| Recreation and Sport Act 1987 | Internal Affairs |
| Regulations Act 1936 | Justice |
| Rehabilitation Act 1941 | Social Welfare |
| Reserve Bank of New Zealand Act 1964 | Reserve Bank |
| Reserves Act 1977 | Conservation |
| Residential Tenancies Act 1986 | Housing Corporation |
| River Boards Act 1908 | Internal Affairs |
| Road User Charges Act 1977 | Works and Development |
| Royal New Zealand Foundation for the Blind Act 1963 | Education |
| Royal New Zealand Institute of Horticulture Act 1953 | Agriculture and Fisheries |
| Royal Society of New Zealand Act 1965 | Scientific and Industrial Research |
| Royal Titles Act 1974 | Internal Affairs |
| Rural Banking and Finance Corporation Act 1974 | Rural Banking and Finance Corporation |
| Rural Intermediate Credit Act 1927 | Rural Banking and Finance Corporation |
| Sale of Goods Act 1908 | Justice |
| Sale of Liquor Act 1962 | Justice |
| Sand Drift Act 1908 | Conservation |
| Scientific and Industrial Research Act 1974 | Scientific and Industrial Research |
| Sea Carriage of Goods Act 1940 | Transport |
| Seal of New Zealand Act 1977 | Internal Affairs |
| Seamen's Union Funds Act 1971 | Labour |
| Secondhand Dealers Act 1963 | Justice |
| Secret Commissions Act 1910 | Justice |
| Securities Act 1978 | Justice |
| Securities Transfer Act 1977 | Justice |
| Sharebrokers Act 1908 | Justice |
| Sharemilking Agreements Act 1937 | Labour |
| Shearers Act 1962 | Labour |
| Shipping Act 1987 | Transport |
| Shipping and Seamen Act 1952 | Transport |
| Shipping Corporation of New Zealand Act 1973 | Transport |
| Shop Trading Hours Act 1977 | Labour |
| Simultaneous Deaths Act 1958 | Justice |
| Small Claims Tribunals Act 1976 | Justice |
| Social Security Act 1964—Part 1 | Social Welfare |
| Social Security Act 1964—Part 2 | Health |
| Social Security (Reciprocity with Australia) Act 1987 | Social Welfare |
| Social Security (Reciprocity with the United Kingdom) Act 1983 | Social Welfare |
| Soil Conservation and Rivers Control Act 1941 | Works and Development |
| Southland Electric Power Supply Act 1936 | Energy |
| Sovereign's Birthday Observance Act 1952 | Internal Affairs |
| Stamp and Cheque Duties Act 1971 | Inland Revenue |
| Standards Act 1965 | Trade and Industry |
| State Advances Corporation Act 1965 | Housing Corporation State Insurance |
| State Insurance Act 1963 | Office State Services |
| State Services Act 1962 | Commission |
| State Services Conditions of Employment Act 1977 | State Services Commission |
| State Owned Enterprises Act 1986 | Treasury |
| Statistics Act 1975 | Statistics |
| Status of Children Act 1969 | Justice |
| Statutues Drafting and Compilation Act 1920 | Parliamentary Counsel Office |
| Statutory Land Charges Registration Act 1928 | Justice |
| Stewart Island Reserves Empowering Act 1976 | Conservation |
| Stock Foods Act 1946 | Agriculture and Fisheries |
| Submarine Cables and Pipelines Protection Act 1966 | Transport |
| Summary Offences Act 1981 | Justice |
| Summary Proceedings Act 1957 | Justice |
| Superannuation Schemes Act 1976 | Treasury Survey and Land |
| Survey Act 1986 | Information |
| Swamp Drainage Act 1915 | Lands |
| Synthetic Fuels Plant (Effluent Disposal) Empowering Act 1983 | Energy |
| Taranaki Harbour Act 1965 | Transport |
| Taranaki Scholarships Trusts Board Act 1957 | Education |
| Taratahi Agricultural Training Centre (Wairarapa) Act 1969 | Agriculture and Fisheries |
| Tarawera Forest Act 1967 | Maori Affairs |
| Tauranga Moana Maori Trust Board Act 1981 | Maori Affairs |
| Taxation Acts Repeal Act 1986 | Inland Revenue |
| Te Runanga O Ngati Porou Act 1987 | Maori Affairs |
| Technicians Training Act 1967 | Labour |
| Telecommunications Act 1987 | Trade and Industry |
| Temporary Safeguard Authorities Act 1987 | Trade and Industry |
| Territorial Sea and Exclusive Economic Zone Act 1977 | Foreign Affairs |
| Testing Laboratory Registration Act 1972 | Scientific and Industrial Research |
| Time Act 1974 | Internal Affairs |
| Tobacco Growing Industry Repeal Act 1987 | Trade and Industry |
| Tokelau Act 1948 | Foreign Affairs |
| Tokelau (Territorial Sea and Exclusive Economic Zone) Act 1977 | Foreign Affairs |
| Tourist and Health Resorts Control Act 1908 | Tourist and Publicity |
| Tourist and Publicity Department Act 1963 | Tourist and Publicity |
| Tourist Hotel Corporation Act 1974 | Tourist Hotel Corporation |
| Town and Country Planning Act 1977 | Works and Development |
| Toxic Substances Act 1979 | Health |
| Trade and Industry Act 1956 | Trade and Industry |
| Trade Marks Act 1953 | Justice |
| Trade Unions Act 1908 | Labour |
| Trades Certification Act 1966 | Education |
| Tramways Act 1908 | Works and Development |
| Transport Act 1962 | Transport |
| Transport (Vehicle and Driver Registration and Licensing) Act 1986 | Transport |
| Treaty of Waitangi Act 1975 | Maori Affairs |
| Tresspass Act 1980 | Justice |
| Trustee Act 1956 | Justice |
| Trustee Banks Act 1983 | Reserve Bank |
| Trustee Companies Act 1967 | Justice |
| Trustee Companies Management Act 1975 | Justice |
| Tuberculosis Act 1948 | Health |
| Unclaimed Money Act 1971 | Reserve Bank |
| Union Representatives Education Leave Act 1986 | Labour |
| Unit Titles Act 1972 | Justice |
| Unit Trusts Act 1960 | Justice |
| United Nations Act 1946 | Foreign Affairs |
| United Nations (Police) Act 1964 | Police |
| Universities Act 1961 | University Grants Committee |
| University of Albany Act 1972 | University Grants Committee |
| University of Auckland Act 1961 | University Grants Committee |
| University of Canterbury Act 1961 | University Grants Committee |
| University of Otago Amendment Act 1961 | University Grants Committee |
| University of Waikato Act 1963 | University Grants Committee |
| Unsolicited Goods and Services Act 1975 | Justice |
| Urban Transport Act 1980 | Transport |
| Valuation of Land Act 1951 | Valuation |
| Valuers Act 1948 | Valuation |
| Vegetables Levy Act 1957 | Agriculture and Fisheries |
| Veterinary Services Act 1946 | Agriculture and Fisheries |
| Veterinary Surgeons Act 1956 | Agriculture and Fisheries |
| Victims of Offences Act 1987 | Justice |
| Victoria University of Wellington Act 1961 | University Grants Committee |
| Video Recordings Act 1987 | Internal Affairs |
| Visiting Forces Act 1939 | Foreign Affairs |
| Vocational Awards Act 1979 | Education |
| Vocational Training Council Act 1982 | Labour |
| Volunteers Employment Protection Act 1973 | Labour |
| Wages Protection Act 1983 | Labour |
| Waikato Valley Authority Act 1956 | Works and Development |
| Waitangi Day Act 1976 | Internal Affairs |
| Waitangi Endowment Act 1932–33 | Conservation |
| Waitangi National Trust Board Act 1932 | Conservation |
| Wanganui Computer Centre Act 1976 | State Services Commission |
| War Funds Act 1915 | Internal Affairs |
| War Pensions Act 1954 | Social Welfare |
| Water and Soil Conservation Act 1967 | Works and Development |
| Waterfront Industry Commission Act 1976 | Labour |
| Weights and Measures Act 1987 | Labour |
| Western Samoa Act 1961 | Foreign Affairs |
| Westport Harbour Act 1920 | Transport |
| Wheat Producers Levy Act 1987 | Agriculture and Fisheries |
| Wheat Research Levy Act 1974 | Scientific and Industrial Research |
| Wild Animal Control Act 1977 | Conservation |
| Wildlife Act 1953 | Conservation |
| Wills Act 1837 (U.K.) | Justice |
| Wine Makers Act 1981 | Justice |
| Wine Makers Levy Act 1976 | Agriculture and Fisheries |
| Winston Churchill Memorial Trust Act 1965 | Internal Affairs |
| Wool Industry Act 1977 | Agriculture and Fisheries |
| Wool Testing Authority Act 1964 | Agriculture and Fisheries |
| Workers Compensation Act 1956 | Labour |
New Zealand has a separate system of local government, made up of many local authorities. It is mainly independent of the central executive government. However, it has a subordinate role in the constitution because the powers of local authorities are conferred on them by Parliament, and do not originate in the authorities themselves. Local authorities fall into four categories: territorial authorities, special purpose authorities, regional authorities, and community councils.
Local government in general is characterised by six principles:
Every local authority is created by Act of Parliament (either by a special or local statute or, more commonly, general legislation);
Every local authority has its powers defined in the Act under which it is established, and under other general local government legislation;
Each local authority has a specific district in which it operates;
Every local authority is controlled by its own council;
All local authorities, except for hospital boards and area health boards, rely on one or more of the following sources of funding: local taxes on land (rates); levies on other local authorities; and/or charges derived from trading utilities under their control. (Hospital boards and area health boards are totally funded by central government); and
All local authorities can determine their own expenditure priorities, and are free to set their own overall levels of expenditure except for hospital boards and area health boards.
Local government in New Zealand is not involved in the funding, administration or management of education, social welfare, police, or urban fire services. Except for a few specified urban areas, it is not involved in traffic control and enforcement. These services are either the responsibility of central government, or specialised agencies closely associated with central government. For example, urban fire services are provided by the New Zealand Fire Service Commission, and education is provided through various bodies funded by central government.
The emphasis in local government is on local accountability to electors. This precludes central government from becoming directly involved in local government decision-making, although in the case of catchment authorities nasella tussock boards and pest destruction boards, there is some central government involvement through representation on each authority or board. It also means that the decisions of local authorities cannot be reviewed or overturned by central government. Although hospital boards and area health boards are funded from central government, they have always been locally responsible for meeting the health needs of their districts.
Although central government is unable to review decisions made by local authorities, they are subject to other types of review. There is provision for the Ombudsmen to investigate cases of maladministration in local government. There is also provision for the Controller and Auditor-General to investigate financial misconduct or conflict of interest on the part of local government officers or elected members. Such investigations can result in automatic forfeiture of office and/or prosecution under the Local Authorities (Members Interests) Act 1968 or the Local Government Act 1974. There is further scope for review of local government decisions in a limited number of areas by appeal to various judicial tribunals or to the District Court. The Planning Tribunal is the appeal body on land-use planning and related issues.
Local authorities are subject to the general power of judicial review of the High Court. The Administrative Division of the High Court has jurisdiction to consider appeals from the Planning Tribunal on points of law. In addition the Administrative Division has general jurisdiction to review the exercise of any statutory power by any local authority. Under the Bylaws Act 1910 the Administrative Division of the High Court can quash or amend local authority bylaws on the grounds that they are ultra vires the local authority, or repugnant to the laws of New Zealand, or unreasonable.
The ability of a local authority to incur debts is also subject to control. All local authorities were subject to loan-raising controls which are exercised by the Local Authorities Loans Board. Since 1986, many local authorities and categories of loans have been exempted by central government on the recommendation of the board. Local authority finance is described in section 25.4.
The provisions of the Local Government Official Information and Meetings Act 1987 parallel closely those of the Official Information Act 1982 (see above section). Local authorities are required to supply official information on request, subject to certain safeguards, and give proper access to any person to official information relating to them. The Act is intended to promote more open conduct of local authority meetings and protect official information consistent with the public interest and personal privacy. All local authorities are covered by some form of official information legislation with this new Act.
Government announced a complete and comprehensive review of local government as part of its economic statement released on 17 December 1987. The review will cover the functions, structure, funding, organisation and accountability of local government. Organisations subject to review include not only regional and territorial authorities but also special purpose authorities and other sub-national organisations such as district roads councils.
The first phase of the review is now complete. The broad policy to govern the reform has been determined and the Local Government Act 1974 amended to require the Local Government Commission to give priority to the preparation of reorganisation schemes to establish, for all of New Zealand, by 1 July 1989, a new system of local government.
Significant features of the policy are:
There will be two principal types of local authorities—
Directly elected regional councils with a major role in resource management functions.
Directly elected district councils carrying out functions at a more local level.
Special purpose authorities will exist only in a very limited range of circumstances.
There will be provision in future legislation for clear separation between regulatory and service delivery functions, and between trading and other activities.
The review is expected to be complete by 1 July 1989 so that new local authorities may be established at the local authority elections due in October 1989.
Bearing in mind that all aspects of local government will be considered in the above review, the following is a description of the system of local government in existence until the 1989 elections.
Territorial authorities in New Zealand are directly elected, general purpose authorities with responsibilities for roading, water supply, sewage disposal, rubbish disposal, parks and reserves, libraries, community development, land subdivision, land-use planning, pensioner housing, health and building inspection, urban passenger transport, parking meter enforcement, and civil defence. The present system of territorial government in New Zealand has evolved since the abolition of provincial government in 1876, when a system was established of locally-elected general purpose territorial local authorities funded from local taxes on land (rates). Municipalities were provided for in urban areas, including 36 municipalities already in existence, which had been incorporated under earlier legislation. The remainder of the North and South Islands, and Stewart Island, was divided into counties, although in sparsely settled counties councils were not established immediately. The last of these counties to come under the control of a county council was Fiord County when it was included in Wallace County in 1981.
Since then county councils have been established for the Chatham Islands, Great Barrier Island, and Waiheke and nearby islands. New Zealand has been covered by 217 elected territorial authorities as from 31 December 1987, which leaves only some small, uninhabited, offshore islands outside territorial authority boundaries.
Territorial government includes five types of councils: borough, city, district, county and town councils; all constituted under the Local Government Act 1974.
Borough councils look after the needs of urban areas. Until 1978, there had to be a population of at least 1500 with an average density of at least one person per 4000 square metres before a borough could be constituted, but this requirement no longer applies. The number of borough councils has decreased from 146 in 1955 to 89 as at 31 December 1987.
In legal terms, a city is a borough which has a population of more than 20 000 and has been designated a city by Proclamation. The number of city councils has increased from 15 in 1955 to 27 in 1987. Every borough and city council has a mayor, who is elected by the residents. The legal powers of mayors are no greater than the powers of council members apart from presiding at all council meetings.
County councils look after the needs of rural areas. They have a chairperson, who is elected by council members every three years. There were 80 county councils as at 31 December 1987.
Many territorial authorities are not entirely urban or rural and the district council type of authority was introduced in recognition of the fact. There were 20 district councils as at 31 December 1987.
A district council can be formed either by Local Government Commission schemes when boroughs, counties or cities merge; or when borough or county councils decide to become a district council.
Some district councils have a chairperson, who is elected by council members every three years, while other district councils have a mayor, who is elected by residents every three years in the same way as mayors of borough or city councils are elected. The Governor-General can designate a district under a district council as a city if he thinks the area is predominantly urban and has a population of no fewer than 20 000.
Town councils look after the needs of areas which have some urban residents but not enough to justify forming a borough. Town councils have a chairperson elected by council members every three years. Legally, it has not been possible to form new town councils since 1978 and only one, Hikurangi Town Council, remains.
Various purpose local authorities have been established to carry out specific tasks thought to be beyond the capacity of territorial authorities. Special purpose authorities are charged with only one major function. The boundaries of special purpose authorities often have little relationship to the districts of territorial authorities in the same area and usually include all or part of a number of territorial authority districts. Sometimes territorial authorities undertake the same functions as special purpose authorities.
The more important special purpose authorities are those administering harbours, hospital services, retail distribution of electricity, soil conservation and rivers control (including management and allocation of water resources). Other special purpose authorities are involved in water supply, urban drainage and transport, pest destruction, nassella tussock control, land drainage, and, in some areas, the liquor and hotel trade. Territorial authorities also function as harbour boards in seven cases, as pest destruction boards in 30 cases, and as electric power supply authorities in 24 cases.
Most special purpose authorities are directly elected, although a minority are indirectly elected as their members are representatives from other local authorities. Apart from catchment authorities, pest destruction, and nassella tussock boards, there are no government representatives on any local authorities.
The major categories of special purpose local authorities and the number involved in each category are hospital boards and area health boards (30); electric power boards (including one energy or electric power and gas board) (38); harbour boards (15); and catchment authorities (including the Waikato Valley Authority) (18). These categories of special purpose authorities are found throughout New Zealand. Electric power boards and harbour boards are all directly elected local authorities. Of the 18 catchment authorities, 13 are directly elected catchment boards (although with some government representation, not exceeding one-third of the membership of any catchment board); four are catchment commissions, with the majority of their members appointed to represent constituent territorial authorities, and a minority of their members appointed to represent central government; and the remaining one is the Waikato Valley Authority, which is also appointed. Catchment authorities are responsible for soil conservation and rivers control (including management and allocation of water resources).
There are various minor categories of special purpose authorities, which are found only in some parts of New Zealand. These include 28 elected licensing trusts (see section 21.1, Controls on trading.); 53 elected pest destruction boards; 2 elected and 2 indirectly elected urban drainage boards: 23 elected (rural) land drainage boards; 6 elected river boards (2 of which are also land drainage boards); 2 elected charitable lands trusts; 1 elected transport board, and 1 elected rural water supply board.
In 1963 the Auckland Regional Authority was established as a directly elected regional council to carry out a range of regional functions in the Auckland metropolitan area and adjoining rural districts. The functions of the authority include urban public passenger transport, regional planning, regional parks and reserves, regional urban water supply, regional drainage, regional refuse collection and disposal, regional roads, community development, regional civil defence, assistance to beach patrol and rescue services, and the regional orchestra. The Auckland Regional Authority is also the catchment authority for its region.
The Wellington Regional Council, established in 1980, carries out catchment authority responsibilities in its region and is responsible for regional planning, civil defence, parks and reserves, urban water supply, forestry and urban public passenger transport planning. A Northland Regional Council was established in March 1987.
From 1977 to 1983, united councils were established in 20 regions. They were seen as providing a form of regional government for regions not warranting the expense of a regional council. Particular features of united councils, which distinguish them from regional councils are: (a) the members are appointed by the territorial authorities of the region, not elected; (b) the finance of the united council is by levy on the territorial authorities, not by rates; and (c) a united council must have the prior consent of the majority of territorial authorities in its region (weighted by capital value, population and area) before it can take on any new function.
Most united councils have their staff seconded to them by one of the territorial authorities of the region, which is known as ‘the administering authority’. Regional councils employ their own staff and resources.
Every united or regional council has three mandatory functions: regional planning, regional civil defence and petrol rationing planning. A united or regional council may also undertake functions relating to regional reserves, forestry, roading, and community services, with qualifications in some cases. A united or regional council may, in certain circumstances, undertake the functions of any territorial authority, or (where a special purpose authority or the appropriate minister of the Crown concurs) the functions of that special purpose authority. A united or regional council is empowered to undertake, exclusively, any new regional function which is not undertaken by any other local authority in the region and may also enter into an agreement with a constituent authority to undertake any function of that authority where, in the opinion of either party, that function would be more effectively and economically undertaken by the regional body. Finally, united and regional councils may enter into agreements with the Crown whereby they may exercise any function or provide any service for the Crown.
The regions of the 22 united councils and regional councils cover all the country, except for Great Barrier Island County, which is not yet included in any region, and the Chatham Islands County, which is not part of a region because of its isolation.
Legally, community councils rank lower than territorial authorities but can be established within the districts of territorial authorities. Since 1976 community councils can be established in either: (a) an urban area within the rural part of a territorial authority district which is mainly urban in character; (b) an urban area within a territorial authority district which is mainly rural in character; or (c) the whole of the area of one or more offshore islands which are a part of a territorial authority district.
These provisions are mainly the same as earlier provisions for county towns and county boroughs and most communities are former county towns or boroughs. However, a number of towns in rural areas do not have community status because, usually, they are large enough for their interests not to be overlooked by their territorial authority. Every community has either a district community council or a community council of no fewer than five, or more than 12 members, elected by residents for a three-year term.
Community councils are not represented directly on their parent territorial authorities. They derive their powers by discretionary delegation from their parent authorities, except for powers dealing with finance, staff and planning. The general purpose of community councils is to co-ordinate and express the views of the community on any matter of concern to it and to undertake, encourage and co-ordinate activities for their general wellbeing. Community councils are entitled to have one of their members attend meetings of their territorial authorities with speaking rights on community issues. There were 121 community councils as at 31 December 1987.
District community councils. District community councils may be established only for communities with populations of no fewer than 1500 and are represented directly on their parent territorial authorities. District community councils can exercise all the powers and functions of their parent authorities, except for certain reserved powers dealing with finance, staff and planning. There were 15 district community councils as at 31 December 1987.
Local authorities get their powers from governing statutes. The Local Government Act 1974 is the main statute for territorial authorities, regional authorities and community councils. Special purpose authorities come under other statutes.
Several statutes apply to all local authorities, e.g., the Local Authorities (Members Interests) Act 1968, and the Local Authorities Loans Act 1956. Other statutes apply to territorial, regional and various other types of local authorities, e.g. the Rating Act 1967, the Local Elections and Polls Act 1976, the Public Bodies Leases Act 1969, the Town and Country Planning Act 1977, the Public Works Act 1981, the Reserves Act 1977, the Health Act 1956, the Local Authorities (Employment Protection) Act 1963, the Joint Council for Local Authorities Services Act 1977, and the Local Government Official Information and Meetings Act 1987.
Local authorities’ powers to levy local taxes on land (rates) are dealt with in section 25.4, Local government finance. Local authorities can make bylaws within limits defined in their governing Acts. Special purpose authorities’ bylaws must be approved by the Minister of Local Government. Territorial authorities and regional councils do not have to get approval from the minister if their bylaws have been made solely under the Local Government Act 1974, except for fire bylaws.
Local authorities can promote bylaws about matters affecting areas within their jurisdiction which they are not empowered to deal with already. These bylaws are of two main types: transient and permanent. Usually, transient non-contentious bylaws which deal with one-off matters, e.g., permitting the sale of a parcel of land, are included in a section of the annual Local Legislation Act. Bylaws seeking permanent or major additional powers must be presented to Parliament in a local bill. The bill becomes an Act when Parliament has approved and enacted it.
Local government elections are held on the second Saturday in October every third year. General elections will be held again in 1989 (except for the Auckland Regional Authority's triennial election, held in 1988). All territorial authorities conduct their own elections at the same time as conducting elections for the special purpose authorities and regional and community councils for their districts.
Each territorial authority must use its electoral roll for regional, community and district community council elections and for the election of all special purpose authorities other than land drainage boards, river boards and pest destruction boards.
Where a territorial authority has a population of less than 70 000, it must choose every three years, whether the whole district is to be one electorate; or whether the district should be separate electorates (known as ‘wards’ in cities and boroughs, and ‘ridings’ in counties); or if the elections could be held with some members elected from the district as a whole, and others from separate wards or ridings. The council has sole responsibility for determining the number of wards or ridings, and the area, population and representation of each. But where a territorial authority has a population of 70 000 or more, it must hold its elections on a ward basis as determined by the Local Government Commission.
The districts of regional councils and most special purpose authorities are divided into separate electorates, which usually coincide with territorial authority boundaries. The electorates of regional councils and special purpose authorities are determined on the bases specified in the various Acts of Parliament under which these authorities are constituted. The Local Government Amendment Act (No. 2) 1986 determined that the Auckland Regional Authority's electorates should coincide with the parliamentary electorates in the region.
Any territorial authority may decide whether an election is to be conducted by attendance at a polling booth or by post. If the election is at a polling booth, the authority may decide to conduct it over a period of not more than 11 consecutive days instead of on a single day.
The method of casting a vote is similar to parliamentary elections. The names of candidates are printed on the ballot paper and the elector must indicate on the paper the candidates for whom he or she wishes to vote. The number of candidates chosen must not exceed the number of positions shown on the ballot paper. An elector may not allocate more than one vote for any candidate, nor is there any provision for an elector to indicate a preference for any candidate.
With the passing of the Local Government Amendment Act 1986 the franchise for local government electors was changed significantly.
A local government elector must be a parliamentary elector with an address in the relevant territorial authority district. Territorial authorities are still responsible for compiling their own electoral rolls, but the data for these rolls now must be taken from the computerised parliamentary electoral data base and any person who is a parliamentary elector is automatically a local government elector for the same address. The effect has been to do away with ratepayer voting, with exceptions, and with the requirement that people often had to enrol separately for local government and parliamentary elections.
The franchise provisions outlined above apply to territorial authorities, community and district community councils, regional councils, and all special purpose authorities, except pest destruction, land drainage, and river boards where the ratepayer franchise remains.
Since the Local Government Amendment Act 1986 a parliamentary elector anywhere in New Zealand may stand for election for any local authority, although he or she cannot stand for election in more than one constituency of the same district. The only exceptions are pest destruction, land drainage and river boards, and licensing trusts where eligibility is still restricted to electors of the authority's district. Vacancies in the elected membership of the council of the local authority may be filled either by election or appointment depending on the Act under which the local authority is constituted. In the case of a territorial authority or a regional council, a petition by 5 percent of the electors is sufficient to require a by-election. Extraordinary vacancies on the Auckland Regional Authority must be filled by election. In the case of most special purpose authorities any vacancy in membership is filled by appointment by the relevant territorial authorities.
The number of women members of local authorities has increased steadily over recent years. Since the 1986 local government elections, 15 of 127 mayoralties are held by women. Women hold the following numbers and percentages of total membership of city, borough, county, district and town councils: city councils 114 (30 percent); borough councils 177 (22 percent); county councils 85 (11 percent); district councils 26 (14 percent); and town districts 5 (25 percent).
Remuneration for mayors, chairpersons, and members of regional territorial authorities and special purpose authorities is governed by the Local Government Act 1974. Most boards and councils pay their mayor or chairperson an annual allowance, while other members are paid a combination of daily meeting allowance and an annual allowance.
The Higher Salaries Commission is responsible for determining the maxima or actual annual allowances for mayors and chairpersons of the major regional and territorial authorities and for chairpersons of one authority in each class of special purpose authority. The Minister of Local Government's responsibility is to then, acting with consent of the appropriate minister, determine the annual allowances and daily remuneration rate for mayors, chairpersons and members of the remaining local authorities. All remuneration rates determined by the minister are maxima so it is up to the discretion of the council or board to decide the actual remuneration rate with the prescribed limits.
The Local Government Commission comprises six members appointed by the Minister of Local Government. The commission's general functions are to review the structure of local government to ensure that it is most appropriate for the needs of individual districts.
The commission may prepare reorganisation schemes for the union of local authority districts, the constitution or abolition of a district, the alteration of boundaries, or the transfer of functions from one local authority to another.
Since the current commission came into office on 1 April 1985, 17 final reorganisation schemes for the union of territorial authority districts and the constitution of new districts have been issued and one has been issued for the constitution of a regional council.
Table 3.14. REORGANISATION SCHEMES ISSUED BY LOCAL GOVERNMENT COMMISSION
| Source: Local Government Commission. | |||
|---|---|---|---|
| 1986 | North Taranaki District | Dannevirke District | |
| Rangiora District | Woodville District | ||
| Tamaki City | Waimate Plains District | ||
| Wairoa District | 1988 | Northland Regional Council | |
| Eltham District | Manawatu District | ||
| Inglewood District | Waimarino District | ||
| Patea District | Wanganui County | ||
| Queenstown-Lakes District | Taupo District | ||
| Bruce District | Carterton District | ||
| 1987 | Patea District | Masterton District | |
The Local Government Commission has a major role in the implementation of the review described near the beginning of this section. Following consideration by the Government of the findings of the Officials Co-ordinating Committee on Local Government, the Local Government Amendment Act (No. 3) 1988 was enacted.
It charges the commission with carrying out substantial reorganisation of local government throughout New Zealand by 1 July 1989, so that changes can be in place in time for the local authority elections in October. The Act also sets out principles to be observed by the commission in reorganising local government and provides a new set of procedures for the commission to operate under. All local authorities other than electric power boards, area health boards and hospital boards are within the commission's jurisdiction for the purposes of the review.
Under the Flags, Emblems, and Names Protection Act 1981 the flag, previously known as the New Zealand ensign, was declared to be the national flag of New Zealand. It is the symbol of the realm, Government and people of New Zealand. The basis of the New Zealand flag is the Union Flag (Jack) in the upper left quarter, and on a blue ground to the right the Southern Cross is represented by four five-pointed red stars with white borders.
The New Zealand coat of arms was pictured and described as a frontispiece in the 1969 and earlier issues of the Yearbook. It appears on the title page and the spine of this volume. The coat of arms is protected under the Flags, Emblems, and Names Protection Act 1981, and its lawful use is confined to official purposes.
God Defend New Zealand, the words written by Thomas Bracken and the music composed by John J. Woods, was first performed in public in 1876. In 1940, the Crown acquired the copyright as part of New Zealand's centennial celebrations, and it was adopted formally as the New Zealand national hymn. In 1977 it was announced that, with the Queen's consent, the Government had decided that the national anthems of New Zealand be the traditional anthem, God Save the Queen, and God Defend New Zealand, both being of equal status as national anthems appropriate to the occasion.
In 1979 the Minister of Internal Affairs published a specially-commissioned arrangement of God Defend New Zealand more suited to general or massed singing than the original score, which lent itself best to solo or choral singing. The new arrangement was published as a supplement to the New Zealand Gazette dated 31 May 1979.
Table 3.15. ENGLISH AND MAORI TEXTS OF THE NEW ZEALAND ANTHEM
| GOD DEFEND NEW ZEALAND | AOTEAROA |
|---|---|
| 1. God of nations at Thy feet In the bonds of love we meet. Hear our voices, we entreat, God defend our free land. Guard Pacific's triple star From the shafts of strife and war, Make her praises heard afar, God defend New Zealand. | 1. E Ihoa Atua O nga Iwi! Matoura, Ata whaka rongona; Me aroha noa. Kia hua ko te pai; Kia tau to atawhai; Manaakitia mai Aotearoa. |
| 2. Men of ev'ry creed and race Gather here before Thy face, Asking Thee to bless this place, God defend our free land. From dissension, envy, hate, And corruption guard our state, Make our country good and great, God defend New Zealand. | 2. Ona mano tangata Kiri whero, kiri ma, Iwi Maori Pakeha, Repeke katoa, Nei ka tono ko nga he Mau e whakaahu ke, Kia ora marire Aotearoa. |
| 3. Peace, not war, shall be our boast, But, should foes assail our coast, Make us then a mighty host, God defend our free land. Lord of battles in Thy might, Put our enemies to flight, Let our cause be just and right, God defend New Zealand. | 3. Tona mana kia tu! Tona kaha kia u; Tona rongo hei paku Ki te ao katoa Aua rawa nga whawhai, Nga tutu a tata mai; Kia tupu nui ai Aotearoa. |
| 4. Let our love for Thee increase, May Thy blessings never cease, Give us plenty, give us peace, God defend our free land. From dishonour and from shame Guard our country's spotless name, Crown her with immortal fame, God defend New Zealand. | 4. Waiho tona takiwa Ko te ao marama; Kia whiti tona ra Taiawhio noa. Ko te hae me te ngangau Meinga kia kore kau; Waiho i te rongo mau Aotearoa. |
| 5. May our mountains ever be Freedom's ramparts on the sea, Make us faithful unto Thee, God defend our free land. Guide her in the nations’ van, Preaching love and truth to man, Working out Thy glorious plan. God defend New Zealand. | 5. Tona pai me toitu; Tika rawa, pono pu; Tona noho, tana tu; Iwi no Ihoa. Kaua mona whakama; Kia hau te ingoa; Kia tu hei tauira; Aotearoa. |
3.1 Department of Justice.
3.2 Clerk of the House of Representatives; Parliamentary Service; Cabinet Office; Department of Justice; Department of Internal Affairs.
3.3 State Services Commission; Department of Statistics; Government departments as listed; New Zealand Planning Council; Audit Office; Office of the Ombudsmen; Parliamentary Service.
3.4 Department of Internal Affairs; Local Government Commission.
Constitutional Reform: Reports of an Officials Committee. Department of Justice, 1986.
Introduction to New Zealand Legal System. Mulholland, R. D., Butterworths, 6th ed., 1985.
New Zealand: The Development of its Laws and Constitution. Robson, J. L. and others. Stevens, 2nd ed., 1967.
The New Zealand Constitution. Scott, K. J., Oxford, Clarendon Press, 1962.
A Checklist: New Zealand Royal Commissions, Commissions and Committees of Inquiry, 1864–1981. New Zealand Library Association, 1982.
New Zealand Parliamentary Record 1840–1984. Wilson, J. O., Government Printer, 1985.
Parliamentary Bulletin. Government Printer (weekly when Parliament is in session).
Parliamentary Practice in New Zealand. McGee, D. G., Government Printer, 1985.
Report of the Department of Internal Affairs (Parl. paper G. 7).
Report of the General Election 1987 and the Timaru By-election 1985 (Parl. paper E. 9).
Report of the Licensing Polls 1987 (Parl. paper E. 9B, 1987).
Report of the Royal Commission on the Electoral System; Towards a Better Democracy. Government Printer, 1986.
Royal Commissions and Commissions of Inquiry. Government Printer, 1974.
Standing Orders of the House of Representatives. Government Printer, 1986.
The Upper House in Colonial New Zealand. McLintock, A. H. and Wood, G. A. Government Printer, 1987.
Who's Who in the New Zealand Parliament. Parliamentary Service, 1987.
Directory of Official Information. State Services Commission (biennial).
Eighth Compendium of Case Notes of the Ombudsmen. Office of the Ombudsmen, 1987.
Register of Statutory and Allied Organisations. Cabinet Office (annual).
Report of the Controller and Auditor-General (Parl. paper B. 1, [Part III]).
Report of the Ombudsmen (Parl. paper A. 3).
Report of the New Zealand Planning Council (Parl paper D. 9).
Report of the State Services Commission (Parl. paper G. 3).
Tables of New Zealand Acts and Ordinances and Statutory Regulations in Force. Government Printer (annual).
All government departments and statutory organisations publish annual reports in the parliamentary paper series.
Local Authority Election Statistics. Department of Internal Affairs, 1985.
Report of the Department of Internal Affairs (Parl. paper G. 7).
Report of the Local Government Commission (Parl. paper G. 9).
Statement on Reform of Local and Regional Government by Minister of Local Government. Local Government Commission, 1988.
Synopsis of Submissions on Reform of Local Government. Department of Internal Affairs, 1988.
Table of Contents
An independent New Zealand foreign policy dates from 1935. In 1943 the Government established a career foreign affairs service, and began to station its own diplomatic representatives overseas. The first expansion came in the 1950s with recognition that New Zealand's security was bound up with South-east Asia, and diplomatic relations were established with five Asian countries. In the 1960s diplomatic posts were set up in Western Europe, as Britain negotiated its entry to the European Community. At the same time in the South Pacific, a number of posts were opened. In the 1970s and early 1980s the search for new trading opportunities led to strengthening posts in Asia and the Pacific, and opening embassies in the Middle East, Latin America and China. Posts were re-opened in the Soviet Union and India. In 1986 a post was opened in Zimbabwe, and in 1987, one in Vanuatu. In addition to the 50 diplomatic and consular posts, multiple accreditation allows some New Zealand representatives to cover other countries from their bases.
In the 1960s there was a dramatic emergence of new nations in the South Pacific. New Zealand led this development in its own territories.
Western Samoa became an independent state in 1962. The Cook Islands became a self-governing state in free association with New Zealand in 1965, and Niue in 1974. The Cook Islands and Niue governments have full legislative and executive competence. The constitutional relationship provides for the exercise by New Zealand of certain responsibilities for defence and external relations. This does not confer any rights of control. Cook Islanders and Niueans are New Zealand citizens. The relationship between the Cook Islands and New Zealand was elaborated in 1973 as ‘one of partnership, freely entered into and freely maintained’. The Cook Islands or Niue can end the ‘free association’ status in favour of complete independence at any time. The Cook Islands and Niue can conduct their own external relations and enter into international agreements. Their capacity is limited only by the extent to which the governments of other states will deal with them. In practice, the Cook Islands and Niue have participated on an equal basis with sovereign states in the South Pacific. Tokelau is described in section 4.4, New Zealand territories.
There are now diplomatic missions in most of the independent countries of the South Pacific and regular contacts with those countries on a range of bilateral and regional issues. Eighty percent of bilateral development assistance is directed to the South Pacific.
The region (not including Australia) is of growing importance to New Zealand, with exports of $382 million in 1986–87. Fiji and Papua New Guinea are the most important markets. Imports, amounting to about $94 million, came principally from Christmas Island, Nauru, Fiji and Papua New Guinea. New Zealand has taken special measures to foster Pacific Island exports to these countries and New Zealand investment in the region. A regional trade agreement, SPARTECA, provides unrestricted duty-free access to New Zealand (and Australia) on a non-reciprocal basis for most of the products exported by island countries. The Pacific Islands Industrial Development Scheme (PIIDS) provides financial assistance and incentives for New Zealand companies developing approved manufacturing operations in selected Pacific countries. Its objective is to foster economic development and employment opportunities there.
There is close co-operation with the South Pacific on defence matters. New Zealand has mutual assistance programmes with a number of South Pacific countries which have armed forces and the New Zealand armed forces undertake joint exercises in various parts of the region. They also assist with maritime surveillance (a task of great importance to countries with vast exclusive economic zones), provide immediate help after natural disasters such as cyclones, and undertake civil development projects in isolated areas.
New Zealand has also helped build up regional co-operation in the South Pacific. A major step in this direction was the creation of the South Pacific Forum in 1971. Since then meetings have been held annually, recently at Apia in 1987 and Nuku'alofa in 1988. The forum provides an opportunity for states to discuss common problems, exchange views, consider priorities, and plan programmes for mutual and regional benefit. The topics considered include regional trade, shipping, civil aviation, telecommunications, education, the law of the sea, fishing, disaster relief, nuclear testing and decolonisation.
The forum has established the South Pacific Bureau for Economic Co-operation (SPEC), which advises members on ways of promoting regional trade and free trade among island members and encourages collaboration in areas such as regional transport which will assist the economic development of the island members. Its headquarters are in Suva. It has also set up the South Pacific Forum Fisheries Agency to facilitate the rational utilisation and conservation of the region's marine resources. Its headquarters are in Honiara.
The Cook Islands, Fiji, Kiribati, Nauru, New Zealand, Papua New Guinea, Tonga and Western Samoa established the Pacific Forum Line (PFL) in 1977. The Solomon Islands and Tuvalu joined later, and Australia and Niue have made financial contributions. This shipping line is based at Apia, and charters three vessels, the Forum New Zealand, the Forum Samoa and the Fua Kavenga, owned by New Zealand, Western Samoa, and Tonga. Together with other governments in the region, New Zealand has made additional contributions since the PFL began operations in 1978. Although the line initially incurred heavy financial losses, in 1985 it achieved a trading profit for the first time and has continued to operate profitably. (See section 20.1, Shipping.)
The South Pacific Commission is primarily a technical assistance organisation, and has accomplished much in promoting the economic and social welfare of the South Pacific peoples as well as in helping to build a sense of regional identity. Its annual budget is mainly funded from proportional contributions by member governments.
A diplomatic office was established in Australia in 1943, and in 1944 the Australia-New Zealand Agreement (known also as the ANZAC Pact or the Canberra Pact) was signed. In 1983, the two countries concluded the Australia-New Zealand Closer Economic Relations Trade Agreement (ANZCERTA or CER for short). It will bring about complete free trade in goods no later than 1995 and provides for the progressive removal of obstacles to the flow of services and investment between the two countries.
In matters of foreign policy, defence and economics, regular and increasingly frequent bilateral meetings take place with a minimum of formality covering almost all government activity. New Zealand ministers participate in a wide range of regular meetings between and with Australian federal and state ministers. There is free movement of people under the Trans-Tasman Travel Arrangement. Australia is a major trading partner for New Zealand, which is in turn Australia's largest single market for manufactured exports. In defence, the Anzac partners continue to co-operate closely in training programmes, exercises and the acquisition of equipment and other supplies. The Australia-New Zealand Foundation sponsors research projects and publications, as well as cultural exchanges.
New Zealand has a direct interest in the maintenance of peace and the growth of prosperity in Asia. A pattern of regular economic consultations with the main Asian trading partners has been developed and bilateral economic agreements have been signed. About a third of New Zealand's export receipts come from Asia. Political contacts with countries of the area have been developed including diplomatic representation, high-level exchanges of visits and regular bilateral consultations.
New Zealand is closely associated with the Association of South-east Asian Nations (ASEAN), and has initiated a number of joint projects with ASEAN for development and trade co-operation. The massive outflow of refugees from Vietnam and Kampuchea, and the political uncertainties stemming from the continued presence in Kampuchea of Vietnamese forces have posed difficult problems for the countries of the region, and New Zealand has kept in close touch with the ASEAN countries over these developments.
Cultural interchange with the countries of Asia has increased steadily. Professional bodies, sporting associations, cultural groups and universities today have links with similar organisations in Asia. The development of air links and the growth of tourism have also helped to bring a wider range of contacts.
The relationship with Japan, its largest export market in 1987, is one of the most important and beneficial that New Zealand has. The elements are varied—trade, fishing and a growing range of cultural, educational, sporting and personal ties. The conditions for a developing trading relationship are ideal, for the two countries are located in different hemispheres, their economies are complementary, and each has in abundance some things that the other needs. New Zealand continues to seek improved access for some commodities, including dairy products and beef. Meanwhile, there is also steady growth in the extent and cordiality of relations with the People's Republic of China. China is both an important export market and a major regional power with a leading role in Asia.
United States. Since 1941 close consultations have been held with the United States on many bilateral questions and international issues. Basic similarities in political philosophy and social and economic processes have encouraged the development of close governmental relations, supported by increasing contacts, both official and non-official, across a broad range of activities.
This relationship finds expression in political, economic and cultural fields. New Zealand, the United States and Australia are allied under the ANZUS Treaty, although in practical terms the treaty is currently inoperative, due to the suspension by the United States of its security obligations to New Zealand as a consequence of New Zealand's anti-nuclear policy. The United States is New Zealand's single most important market. Programmes for scientific and technical co-operation, and academic and cultural exchanges maintain an awareness of New Zealand in the United States and promote the interchange of ideas and experience. The two countries work closely in Antarctic scientific research and operate a joint logistics pool for their Antarctic programmes.
New Zealand and Canada have traditionally enjoyed a close and easy relationship. Since 1942, there have been ministerial and official exchanges in many fields and both countries take a close interest in developments in the Pacific Basin.
The Trade and Economic Co-operation Agreement, which came into effect in 1982, is intended to encourage economic co-operation. In addition to consultations on trade and economic issues, the agreement calls for increased co-operation in investment, joint ventures and technology transfer.
In 1972 the Government opened diplomatic missions in Chile and Peru, primarily to support an expanding trade in dairy products. By cross-accreditation, diplomatic relations have since been established with Brazil, Ecuador, Colombia, Venezuela and Argentina. An embassy was opened in Mexico City in 1983.
A 1986 trade mission to Peru, Chile, Brazil, Venezuela and Mexico strengthened economic ties and the flow of exports to the region expanded markedly in 1986–87, in particular lamb and dairy products to Peru, and dairy products to Brazil. Chile has become an important destination for New Zealand overseas investment. Since 1974 the High Commissioner in Ottawa has been cross-accredited to Trinidad and Tobago, Jamaica, Barbados and Guyana.
Developments in Western Europe exert a strong influence on New Zealand life. The importance of the European Community as a market for agricultural exports and as a competitor in world markets for meat and dairy products has highlighted the economic aspects of the relationship. The EC is New Zealand's largest export market and trading partner. Although New Zealand exports have diversified considerably since Britain joined the EC, the Community remains a key market for sheepmeat and butter. New Zealand exports in a range of non-traditional products also show encouraging growth. Community imports into New Zealand are substantial and growing.
The range of other contacts with the individual countries of Western Europe is steadily expanding. New Zealand has consultative links with the Community on a range of political and economic issues. New Zealand and Western Europe co-operate closely on international issues and exchange information through multilateral organisations such as the United Nations and the OECD.
New Zealand has developed stable working relationships with the Soviet Union and the countries of Eastern Europe. Trading and economic concerns dominate. The Soviet Union has become a significant market for primary commodities, particularly meat and dairy products, but trade with Eastern Europe since the late 1970s has not fulfilled earlier hopes and remains small although it is expanding. For the Soviet Union the fisheries resources of New Zealand's 200-mile zone are an additional source of economic interest. (A fisheries agreement was signed in 1978.)
Political relations with the Soviet Union were interrupted in 1979 by that country's intervention in Afghanistan, but were subsequently normalised with the return of ambassadorial representation in Wellington and Moscow in 1984. The embassy in Vienna is accredited to five East European countries—Poland, Hungary, Romania, Czechoslovakia and the German Democratic Republic—and the embassy in Rome to Yugoslavia.
Involvement in the Middle East has increased markedly within the past decade. For more than 30 years New Zealand has watched the Arab-Israeli conflict with concern, if from a distance. Recognising the implications for world peace, this country has contributed personnel to United Nations truce observation teams. Since 1982 it has also supplied a small contingent to the Sinai peace-keeping force. New Zealand has consistently upheld the rights of the Palestinian people to self-determination and, equally consistently, Israel's right to exist.
Since 1973, when Middle East members of the Organisation of Petroleum Exporting Countries (OPEC) emerged as a major economic force in the world, the area has become increasingly important for this country. The wealth of the Gulf region has created new markets for export. The region absorbs a high proportion of New Zealand's sheepmeat exports.
Egypt and Israel have embassies in Wellington, while Iran, Iraq, Lebanon, and Saudi Arabia have cross-accreditation from Canberra, and Oman and Qatar from Tokyo. New Zealand opened resident missions in Iran and Iraq in 1975, and in 1977 established a consulate-general in Bahrain which was upgraded to an embassy in 1984 when an embassy in Riyadh was also established. The pattern of representation is rounded out by the cross-accreditation of the Ambassador in Riyadh to Egypt, Qatar and Oman, the Ambassador in Paris to Algeria, the Ambassador in The Hague to Israel, the Ambassador in Bahrain to Kuwait and the United Arab Emirates and the Ambassador in Baghdad to Jordan.
Relations with Africa have been given new emphasis and new dimensions since the 1984 General Election. The South African Consulate-General in Wellington was closed; the Government announced a policy which barred South African sports teams and individual representatives from competing in New Zealand, and sought to discourage contacts in South Africa or other countries. At the United Nations, New Zealand has co-sponsored wide-ranging resolutions on international action against apartheid. In conformity with the Accord on Southern Africa agreed to at Nassau by Commonwealth heads of government, the Government in November 1985 introduced certain measures against trade with South Africa. In August 1986, after the failure of the Commonwealth Eminent Persons Group to persuade the South African Government to enter into negotiations directed at bringing about political change, the Government adopted a further set of measures recommended by Commonwealth leaders.
In 1986 New Zealand's first resident diplomatic mission in Africa was established in Harare, Zimbabwe, with cross-accreditation to Botswana, Kenya, Tanzania and Zambia. This step implemented an undertaking made by the Prime Minister on his official visit to Africa a year before. The High Commissioner in London was accredited to Nigeria.
New Zealand has joined the international donor community in responding to the emergency relief and rehabilitation needs of African countries. The Government contributed through a range of international and voluntary agencies. The community has also responded generously to international relief appeals.
New Zealand contributes to technical co-operation projects in African countries through bilateral assistance and by contributions to Commonwealth and other multilateral programmes, including those sponsored by the Southern Africa Development Co-ordination Committee.
Total trade with African countries amounts to only a modest percentage of New Zealand's global trade. The major New Zealand exports are dairy products, fish, wool, textiles and non-electrical machinery. The main imports from Africa are cocoa, coffee, sisal and tobacco.
The New Zealand Government decided in 1986 to adopt a target for official development assistance (ODA) of 0.51 percent of gross national product (GNP) by 1990–91. In the 1986 calendar year ODA disbursements amounted to $143.7 million, compared with $108.7 million in 1985. New Zealand's volume of aid in 1985 and 1986 averaged 0.27 percent of GNP, compared with the average ratio of 0.35 percent recorded by the nations belonging to the OECD's Development Assistance Committee (which has 18 members including New Zealand, with volumes ranging between 1.11 percent given by Norway to 0.23 percent from the United States). As a longer-term goal, New Zealand also adopted the United Nation target ratio of 0.7 percent of aid volume to GNP.
In 1986–87 New Zealand's total official development assistance was $148.5 million. New Zealand's expenditure under the official development assistance programme. Of this, $118.5 million was disbursed through the Ministry of Foreign Affairs. This was about $21.5 million over the previous year's total. The balance was made up of efforts by other government departments, contributions to international financial organisations and a portion of the administrative costs of the Ministry of Foreign Affairs and the Overseas Service. New Zealand increased its contributions to multilateral organisations from $15 million in 1985–86 to $21 million, to reverse a decline in real terms of such funding in recent years. The United Nations Development Programme, as a prime co-ordinator of multilateral assistance, received the main increase. In the bilateral category, expenditure increased by $14 million from $69 million in 1985–86 to $83 million. Overall bilateral disbursements amounted to 70 percent of official development assistance expenditure. South Pacific countries received 79 percent of the bilateral expenditure. The main recipients were the Cook Islands ($14.3 million), Niue ($7.5 million), Western Samoa ($7.2 million), Tuvalu ($6.8 million), Fiji ($6.5 million), and Tonga ($5.2 million). Tokelau received $3.6 million, Papua New Guinea $3.4 million, Kiribati $3.1 million, Solomon Islands $3.0 million, and Vanuatu $2.4 million. The Federated States of Micronesia, New Caledonia, Palau and the Marshall Islands received smaller amounts (from $5,000 to $66,000). Countries in Southeast Asia received 12 percent of bilateral expenditure. Of the 15 recipients in Asia, New Zealand's main partners were Indonesia ($4.1 million), the Philippines ($1.5 million) and Thailand ($1.5 million).
Table 4.1. OFFICIAL DEVELOPMENT ASSISTANCE PROGRAMME EXPENDITURE, 1986–87
*Funded from Vote Foreign Affairs only. Source: Ministry of Foreign Affairs. | |
|---|---|
| Bilateral assistance— | $(000) |
| South Pacific | 68,160 |
| Asia | 9,868 |
| Africa | 1,617 |
| South America and Central America | 621 |
| Other (NZ study and training institutes, voluntary agencies, information, etc.) | 3,088 |
| Total bilateral | 83,354 |
| Multilateral assistance— | |
| South Pacific institutions | 2,747 |
| Development finance institutions | 7,173 |
| Commonwealth programmes | 1,238 |
| United Nations institutions | 6,572 |
| African relief and rehabilitation | 1,998 |
| Other contributions | 1,157 |
| Total multilateral | 20,885 |
| South Pacific shipping | 11,864 |
| Administration | 2,442 |
| Total | 118,545 |
The official development assistance programme involves the skills and experience of hundreds of New Zealanders, as well as capital and technical support. Through the bilateral (country-to-country) programmes, New Zealand responds to the development priorities established by developing countries. Development projects are the main form of assistance. New Zealand supports hundreds of projects and often commits expertise and/or material and capital resources for several years ahead. The main purpose of bilateral assistance is to promote the economic and social development of the partner countries and to raise living standards. Emphasis is placed on increasing productivity through livestock and pasture improvement programmes, assistance with crops, and the development of forestry, fisheries and energy resources.
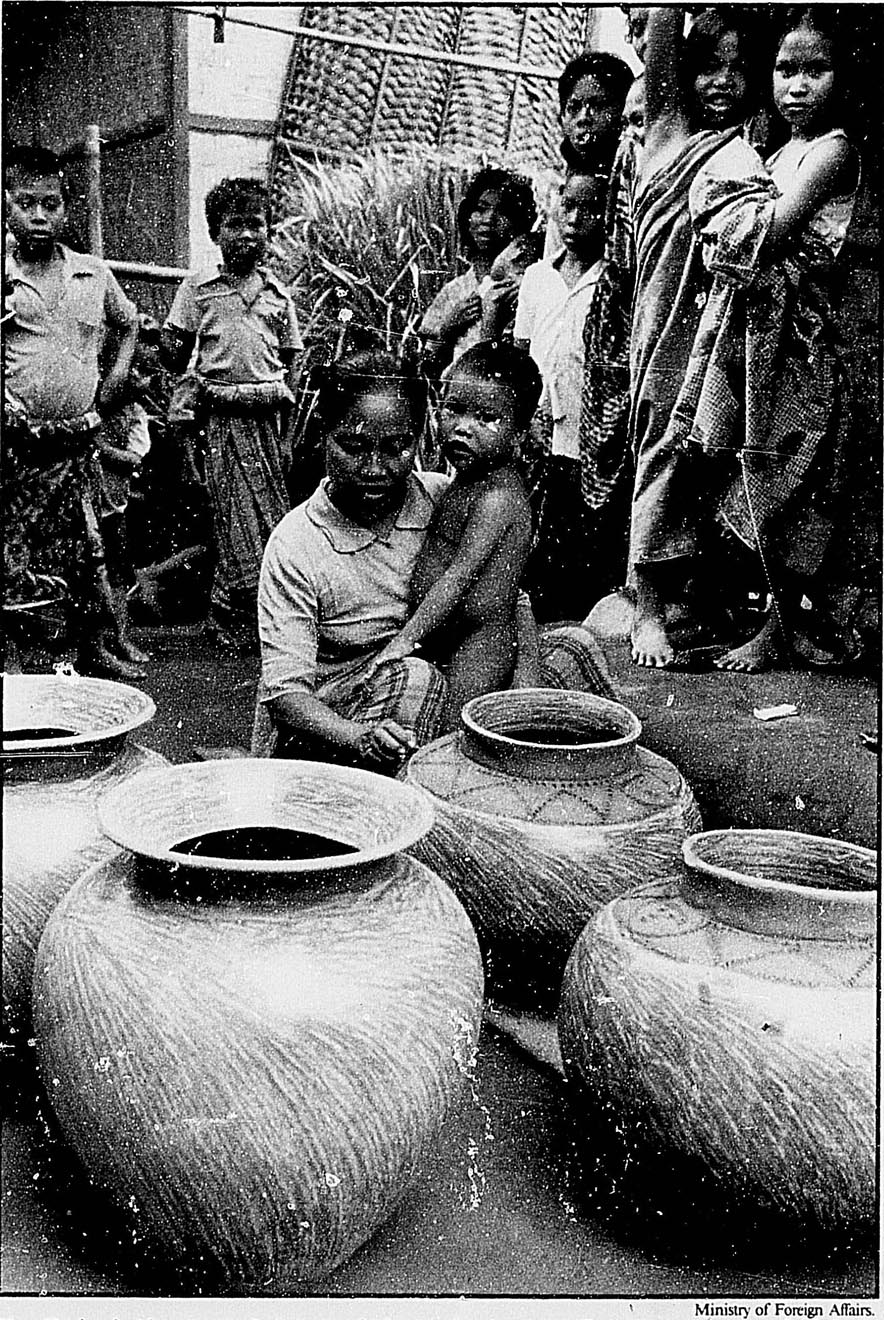
New Zealand aid project in Indonesia which aimed to improve village pottery to a standard that can be sold abroad.
The Ministry of Foreign Affairs maintains a register of potential advisers from New Zealand's private and public sectors who are willing to be assigned to overseas projects. At any time there are usually about 40 advisers on two-year assignments overseas, with many more on shorter visits. Advisers usually train local counterparts, some of whom consolidate their training with visits to New Zealand. The ministry also employs agents from the private and public sectors to manage projects overseas.
Education and training are a vital feature of the development programme. On-the-job training is an essential part of most projects supported by New Zealand. In addition study and training opportunities are provided for students from about 40 developing countries. Government sponsors about 670 students and trainees from overseas to attend secondary schools, tertiary institutions and special practical courses in New Zealand. (Only students from some Pacific Island states are eligible for sponsored secondary schooling.) New Zealand also supports the education of about 210 students and trainees at institutions in other countries. Development funds also support three New Zealand organisations that attract students from developing countries: the Seed Technology Centre at Massey University; the English Language Institute at Victoria University; and the Geothermal Institute at Auckland University. New Zealand supplies 4 percent of the University of the South Pacific's annual budget and gives grants to various Commonwealth training programmes.
Multilateral assistance extends New Zealand's capacity to deliver support to areas of need. International relief and development institutions such as the Asian Development Bank, the International Development Association, the United Nations Development Programme, World Food Programme, UNICEF, and other United Nations agencies channel assistance to regions where New Zealand does not have diplomatic representation. This avenue enables New Zealand to help victims of famine, drought, conflict and other crises. New Zealand promotes development of the South Pacific region as a whole with contributions to the South Pacific Bureau for Economic Co-operation, the Forum Fisheries Agency and the South Pacific Commission.
Voluntary agency support is an increasingly significant feature of New Zealand's development co-operation. Many New Zealand voluntary agencies are active in small village-level projects overseas. Government support of such agencies has increased in recent years, particularly through assistance to Volunteer Service Abroad, the Voluntary Agency Support Scheme, and the Development Education Fund (which began in 1986–87).
New Zealand was a founding member of the United Nations organisation in 1945 and successive governments have strongly supported it as a major instrument for maintaining peace and security, developing friendly relations among countries, encouraging international co-operation aimed at solving economic and social problems, and promoting respect for human rights. Over the years the range and complexity of functions of the United Nations and its specialised agencies have steadily grown. New Zealand concentrates on areas where it can play a useful role in matters directly affecting its interests.
In pursuit of its anti-nuclear commitment, New Zealand has continued to press for progress on a wide range of arms control and disarmament issues. New Zealand was pleased by the progress in superpower relations achieved in 1987 with the signing of an INF (intermediate-range nuclear forces) agreement. New Zealand's views on disarmament and arms control were presented at a number of forums including the Conference on Disarmament in Geneva, where its representative made statements calling for a ban on all nuclear testing and the conclusion of a treaty banning the development, production and stockpiling of chemical weapons. New Zealand took part in the International Conference on the Relationship between Disarmament and Development which was held in New York in September 1987, and co-sponsored a number of arms control and disarmament resolutions at the 1987 session of the General Assembly. New Zealand took the lead in 1988 with a resolution calling for a comprehensive test ban and this resolution received considerable support in the General Assembly. At the regional level, New Zealand has been a strong supporter of the South Pacific Nuclear Free Zone Treaty (SPNFZ), which it ratified on 13 November 1986. The treaty came into force on 11 December of the same year. Eleven South Pacific Forum members have signed the treaty to date.
At the national level, the New Zealand Nuclear Free Zone Disarmament and Arms Control Act came into force on 8 June 1987. The Act bans nuclear weapons from New Zealand, implements New Zealand's responsibilities under SPNFZ and incorporates into New Zealand law a number of other existing arms control agreements, such as the Non Proliferation Treaty.
New Zealand army officers served with the United Nations Truce Supervisory Operation in 1987, and financial contributions were made to the various peacekeeping operations (see section 4.5, Defence).
New Zealand has continued to participate in humanitarian relief work, for example, working closely with the UN High Commissioner for Refugees (UNHCR) particularly to resettle Indo-Chinese refugees. The Government also contributed $500,000 to UNHCR in 1987–88 and made another grant of $100,000 for Mozambican refugees in Zambia and $25,000 for assistance to returning refugees in Sri Lanka. In 1986 $250,000 was paid as a voluntary contribution to the Relief and Works Agency for Palestine Refugees in the Near East (UNRWA) and $1 million was given to the World Food Programme, plus a special grant of $500,000 for its programme of assistance to Mozambique. There has been an annual grant of $1 million to the UN Children's Fund (UNICEF), plus a special grant in 1986 of $500,000 for its African operations.
In addition to its contributions to the humanitarian relief work of the UN and its agencies, New Zealand's voluntary contribution to the International Red Cross (ICRC) was increased to $175,000. An additional $75,000 was contributed for the ICRC's emergency programmes, and $50,000 (to the New Zealand Red Cross Society) to assist Afghan refugees in Pakistan.
Human rights issues, including the eradication of discrimination against women and the removal of all forms of racism and racial discrimination, remain an important concern. During 1987 New Zealand's seventh periodic report on this subject was examined by the UN Committee on the Elimination of All Forms of Racial Discrimination. In the same year New Zealand increased its contribution (to $28,000) to the United Nations fund for the rehabilitation of torture victims. New Zealand continued to support balanced resolutions at the Commission on Human Rights and at the UN General Assembly designed to set relevant new standards to protect human rights or to encourage nations to uphold the principles of the UN human rights instruments.
New Zealand also plays a full part in all aspects of international economic and development activity, not only in the UN agencies but also in the annual meetings of the IBRD (World Bank) and the IMF, and in Commonwealth and regional groupings that seek to stabilise international trade and finance. New Zealand continues to emphasise the special requirements of the South Pacific island countries, some of which are not represented at the UN. New Zealand contributed substantially ($3.5 million in 1987–88) to the UN Development Programme (UNDP) and is on the Governing Council of UNDP from January 1986 to December 1988.
The delegation to the 42nd session of the General Assembly, in 1987, was led by the Minister of Foreign Affairs, the Hon. Russell Marshall. In his speech in the general debate he placed special emphasis on the need for the international community to work for an urgent reduction in nuclear weapons. He also spoke about New Caledonia, the struggle against apartheid, the UN's work in codifying universal human rights, New Zealand's interest in becoming more involved in UN peace-keeping activities, measures against international terrorism, the Antarctic treaty system, the revitalisation of the UN by functional reform, and other matters. Subsequent debate centred on recent events. These included global economic issues, racism and apartheid, the Middle East, refugees, arms control and disarmament, humanitarian relief for Africa, human rights, and the UN's financial crisis. New Zealand contributed by either co-sponsoring or supporting proposals intended to remove the potential for armed conflict, eliminate international tension, create fair and just economic and political systems, facilitate decolonisation and provide humanitarian relief and development assistance to the needy.
The UN system encompasses 16 autonomous organisations, known as the specialised agencies, and a large number of additional bodies with their own secretariats, budgets and operations. Among the largest of these is the Food and Agricultural Organisation (FAO) which aims to raise levels of nutrition and global living standards, to promote agriculture and food security, and to expand the world economy. Similarly the World Health Organisation (WHO) seeks ‘the attainment by all peoples of the highest possible level of health’, the International Labour Organisation (ILO) seeks to improve working and living conditions and the UN Educational, Scientific and Cultural Organisation (UNESCO) seeks to increase international co-operation through education, science and culture.
Four agencies participate in efforts to promote the international flow of capital for productive purposes and facilitate the economic development of less developed countries. These are the International Bank for Reconstruction and Development (IBRD, or the World Bank), the International Monetary Fund (IMF), the International Finance Corporation (IFC) and the International Development Association (IDA).
Other UN special agencies of which New Zealand is a member, are concerned with civil aviation (ICAO), agricultural development (IFAD), maritime safety (IMO), telecommunications (ITU), postal services (UPU), patents and trademarks (WIPO), and climate and weather (WMO) and industrial development (UNIDO).
Contributions to the UN budget are based on members’ capacity to pay. In 1987 New Zealand's assessed contribution rate was set at 0.24 percent of the regular budget, resulting in dues of $3,030,479.
Along with many other countries, New Zealand has been concerned at the rapidly rising costs of running the United Nations and related bodies. Moreover, the failure of certain members to either pay their dues on time, or in full, coupled with administrative inefficiencies has led to a serious financial crisis. New Zealand supported the establishment of a group of experts to deal with this situation and has sought to ensure that the group's recommendations for financial and administrative reform can be implemented. Contributions to the budgets of specialised agencies are also fixed according to a scale of assessment agreed by the membership as a whole.
The GATT was established in 1948 to provide rules for international trade and a forum for the settlement of trade problems. New Zealand was one of the original 23 signatories, and there are now 94 members.
The main objective is the reduction of trade barriers and other protectionist measures which distort international competition. Seven rounds of multilateral trade negotiations have been conducted under GATT auspices and have achieved a progressive reduction in tariffs and a refinement of the rules for international trade. In 1986 member countries agreed to embark on an eighth round of negotiations and New Zealand's priority is to ensure that trade in agricultural products, which has never been fully integrated into the GATT system, is brought under effective rules and disciplines (for both barriers and subsidies). The Cairns Group of agricultural trade liberalisers, of which New Zealand is a member, has become a strong proponent of this. Other major issues include the negotiation of rules for trade in services and improved rules and disciplines for dispute settlement and trade in intellectual property. The Uruguay (eighth) Round is expected to last four years.
In addition to the specialised agencies, many UN organisations help to seek solutions to international problems through diverse economic, development, humanitarian and technical activities. The International Atomic Energy Agency (IAEA) established ‘under the aegis of the United Nations’, supports peaceful uses of nuclear energy, while several bodies encourage economic development (UNDP, UNCTAD, IFAD), and others address issues as diverse and necessary as environmental protection, tourist promotion, drug abuse and population planning. Humanitarian concerns include the health and welfare of children (UNICEF), assistance to refugees (UNHCR and UNRWA) and the elimination of racism and of discrimination against women. Contributions are usually voluntary, and table 4.1 (above), includes New Zealand's contributions for 1986–87.
The World Bank group is comprised of the International Bank for Reconstruction and Development (IBRD), the International Development Association (IDA) and the International Finance Corporation (IFC). The common objective of these institutions is to help raise standards of living in developing countries by channelling financial resources from developed countries to them. The IBRD's lending operations are directed towards developing countries at more advanced stages of economic and social development, whereas the IDA provides loans of a highly concessional nature to the poorest of the developing nations. The IFC promotes growth in the private sector of developing countries by lending or investing in business enterprises without government guarantees.
New Zealand joined the IBRD in 1961. It has subscribed to a total of 4061 shares in the bank, which is about 0.5 percent of the total capital. The shares have a total par value of US$489.9 million, although over 90 percent of this amount has not been called-up but, together with the uncalled subscriptions of other member countries, acts as a guarantee for the IBRD's borrowing in the financial markets.
New Zealand joined the IDA in 1975, having earlier made a voluntary contribution of $5 million to the association. Since becoming a member, New Zealand has committed a further $54.8 million to IDA through having participated in its fourth, fifth, sixth, seventh and eighth replenishments of funds and its fiscal year 1984 account. New Zealand owns 923 fully-paid shares in the IFC, which have a total par value of US$1.6 million.
The Asian Development Bank's (ADB's) principal function is to promote and finance the economic and social advancement of its 28 developing member countries in the Asia-Pacific region. It has 32 member countries in the Asia-Pacific area and 15 member countries in Europe and North America. The ADB's financial structure is similar to that of the World Bank.
New Zealand first took up shares in the ADB when it was established in 1966. The country currently holds 27 170 shares, which make up about 2 percent of the bank's total share capital.
New Zealand also makes contributions to the ADB's Asian Development Fund (ADF) and Technical Assistance Special Fund (TASF). The ADF is the bank's facility for lending to its poorest developing member countries, to which New Zealand contributed a total of approximately US$17.3 million up to the end of 1987. New Zealand has granted a total of US$1,096,000 to the TASF since 1969, with the most recent contribution of $75,000 being in the 1986–87 financial year.
The 48 members and two ‘special members’ of the Commonwealth include countries in the six continents and the five oceans of the world. The South Pacific region is represented by Tonga, Western Samoa, Papua New Guinea, Solomon Islands, Kiribati, Vanuatu, Australia and New Zealand. (Fiji's membership lapsed in October 1987.). Nauru and Tuvalu have special membership status. The Cook Islands and Niue are not eligible for full membership because of their continuing constitutional association with New Zealand. In consequence they do not attend Commonwealth heads of government meetings, but are entitled to participate in Commonwealth meetings dealing with those subjects for which their governments are responsible.
A permanent Commonwealth Secretariat is the main agency for multilateral communication between governments. The secretariat promotes consultation, disseminates information on matters of common concern, organises meetings and conferences, and coordinates a wide range of other activities.
Heads of government meet every second year. The most recent meeting was held in Vancouver in 1987. Heads of government of the Asia-Pacific region have also met since 1978, most recently in Port Moresby in 1984. Commonwealth finance ministers meet annually, and ministers of agriculture, labour, health, education and other portfolios also meet at varying intervals.
The Commonwealth's principal official development assistance programmes are financed by the Commonwealth Fund for Technical Co-operation, to which New Zealand contributed $1 million in 1987–88. New Zealand also takes part in the Commonwealth Scholarship and Fellowship Plan, contributing about $750,000 in 1987–88. Contributions are made to a range of other intergovernmental Commonwealth co-operative programmes, including, in 1987, $250,000 to the Commonwealth fund for Mozambique and $50,000 for Commonwealth co-operation on distance education, and to agencies, including the Commonwealth Youth Programme, the Commonwealth Science Council, the Commonwealth Agricultural Bureaus and the Asia-Pacific regional working groups. In the non-governmental area, New Zealand's main contribution is to the Commonwealth Foundation, established to promote close links in the professions throughout the Commonwealth.
The Paris-based OECD aims to foster intergovernmental co-operation amongst its 24 members on matters relating to economic and social policy. The majority of its members are the large industrialised countries of the world and New Zealand joined in 1973 with the intention of voicing its opinions in OECD forums, which were of increasing importance in international decision-making.
New Zealand has concentrated on economic, agricultural, trade and energy consultations in the OECD, but has also been involved in education, labour affairs, shipping and environment work. The OECD exchanges, analyses and disseminates a wide variety of information, including the OECD forecasts (Economic Outlook) and reports on individual countries. The New Zealand economy is periodically subjected to a thorough review within the OECD system. Its aid policy is reviewed regularly by the OECD's Development Assistance Committee.
An example of the benefits of OECD membership is current work on protectionism in agricultural trade, initiated by New Zealand, with the aim of quantifying levels of agricultural protectionism and finding ways of reducing it. This work is particularly relevant to the current Uruguay Round of multilateral trade negotiations.
New Zealand is also a member of the International Energy Agency (IEA), an autonomous body within the OECD framework. The IEA carries out a comprehensive programme of energy co-operation among 19 countries and works to promote co-operation between energy producing and consuming countries.
Since New Zealand rejoined this commission in 1976, it has played an active role among the conservationist member nations. In June 1985 the New Zealand Whaling Commissioner, Mr I. L. G. Stewart, was elected Chairman of the IWC for a three-year term. In 1988 the fortieth annual meeting of the IWC took place in Auckland.
The Ministry of Foreign Affairs has the primary responsibility for advising and assisting the Government on its relations with the outside world. This includes advising foreign governments of New Zealand's policies and keeping the Government informed of overseas developments affecting New Zealand's interests. Policy formulation is undertaken in relation to the country's economic, trade, political and security needs, and recommendations to the Government are prepared in close association with other government departments.
Other functions include the administration of the official programme of aid to developing countries, and responsibility for all official New Zealand information and publicity activities overseas other than those relating specifically to trade promotion or tourism.
The ministry is the agency through which other governments and their representatives in New Zealand communicate with the Government. It also undertakes foreign affairs and defence functions for the Cook Islands and Niue after consultation with their respective heads of government. It administers Tokelau.
In addition, it is responsible for operating and administering the network of diplomatic and consular posts listed below. These posts represent and pursue New Zealand's interests overseas through a variety of ways, including participation in international negotiations, the gathering of information, and the promotion of a favourable New Zealand image. The posts perform services overseas on behalf of all government departments and give assistance to New Zealanders overseas, whether travelling in official or private capacities, and are responsible for the overseas issue of passports and visas.
In September 1988 it was announced that a new Ministry of External Relations and Trade will be formed from 1 December 1988. It will incorporate the Ministry of Foreign Affairs (disestablished as such) and the International Trade Relation Division of the Department of Trade and Industry (also disestablished).
For further information on the overseas posts listed below, refer to the publication New Zealand Representatives Overseas, on sale at Government Bookshops.
Australia—High Commission, Commonwealth Avenue, Canberra, A.C.T. 2600.
Consulate, Standard Chartered Bank Building (8th Floor), 26 Flinders Street, Adelaide, (G.P.O. Box 1744) South Australia 5001.
Consulate-General, Watkins Place Building, 288 Edward Street, Brisbane, (G.P.O. Box 62) Qld. 4001.
New Zealand Tourist and Publicity Office, Brisbane, (as for Consulate-General).
Consulate-General, 330 Collins Street, Melbourne, (G.P.O. Box 2136 T) Vic. 3001.
New Zealand Tourist and Publicity Department Office, 270 Flinders Street, Melbourne, (G.P.O. Box 2136 T) Vic. 3001.
Consulate, 16 St. George's Terrace (10th floor), Perth, (G.P.O. Box X2227) W.A. 6001.
Consulate-General, State Bank Centre (25th floor), 52 Martin Place, Sydney, (G.P.O. Box 365) N.S.W. 2001.
New Zealand Tourist and Publicity Department Office, AMEV-UDC House, 84 Pitt Street, Sydney, (G.P.O. Box 614) N.S.W. 2000.
Austria—Embassy, Lugeck 1, Vienna 1 (P.O. Box 1471, A-1011 Vienna).
Bahrain—Embassy, Manama Centre Building (1st floor), Government Road, Manama (P.O. Box 5881).
Bangladesh—High Commissioner resident in New Delhi (see under India).
Barbados—High Commissioner resident in Ottawa (see under Canada).
Belgium—Embassy, Boulevard du Regent 47–48, 1000 Brussels.
Botswana—High Commissioner resident in Harare.
Brazil—Ambassador resident in Santiago (see under Chile). Consulate, Rua Hungria 888–6, CEP 01455, Sao Paulo.
Britain—High Commission, New Zealand House, Haymarket, London SW 1Y 4TQ.
Brunei—High Commissioner resident in Kuala Lumpur (see under Malaysia).
Burma—Ambassador resident in Bangkok (see under Thailand).
Canada—High Commission, Metropolitan House (Suite 801), 99 Bank Street, Ottawa, Ontario K1P 6G3. Consulate, Suite 1260–701, West Georgia Street, I.B.M. Tower, Vancouver, (P.O. Box 10071, Pacific Centre) B.C. V7Y 1B6.
Chile—Embassy, Avenida Isidora Goyenechea 3516, Las Condes, Santiago (Casilla 112, Correo).
China—Embassy, Ritan Dongerjie No. 1, Chaoyang District, Peking.
Colombia—Ambassador resident in Lima (see under Peru).
Cook Islands—New Zealand Representative, 1st Floor, Philatelic Bureau Building, Takuvaine Road, Avarua, (P.O. Box 21) Rarotonga.
Cyprus—High Commissioner resident in Athens (see under Greece).
Czechoslovakia—Ambassador resident in Vienna (see under Austria).
Denmark—Ambassador resident in Brussels (see under Belgium).
Ecuador—Ambassador resident in Lima (see under Peru).
Egypt—Ambassador resident in Riyadh (see under Saudi Arabia).
European Communities—Ambassador resident in Brussels (see under Belgium).
Fiji—Embassy, Reserve Bank of Fiji Building, Pratt Street (P.O. Box 1378), Suva.
Finland—Ambassador resident in Moscow (see under U.S.S.R.).
Food and Agriculture Organisation (FAO)—See under United Nations.
France—Embassy, 7 ter, rue Leonard de Vinci, 75116 Paris. Consulate-General, 4 Boulevard Vauban, (BP 2219) Noumea, New Caledonia. New Zealand Consulate, c/o Air New Zealand Ltd, Vaima Centre, (BP 73) Papeete, Tahiti, French Polynesia.
German Democratic Republic—Ambassador resident in Vienna (see under Austria).
Germany, Federal Republic of—Embassy, Bonn-Center, H1 902, Bundeskanzlerplatz, 5300 Bonn. New Zealand Tourist and Publicity Department Office, Kaiserhofstrasse 7, 6000 Frankfurt/Main.
Greece—Embassy, An. Tsoha 15–17, Ambelokipi, 115 21 Athens.
Guyana—High Commissioner resident in Ottawa (see under Canada).
Holy See—Ambassador resident in Paris (see under France).
Hong Kong—High Commission 3414 Connaught Centre, Connaught Road (G.P.O. Box 2790), Hong Kong.
Hungary—Ambassador resident in Vienna (see under Austria).
India—High Commission, 25 Golf Links, New Delhi, 110003.
Indonesia—Embassy, Jalan Diponegoro No. 41, Menteng, (P.O. Box 2439 JKT) Jakarta.
Iran—Embassy, Avenue Mirza-ye-Shirazi, Shahid Ali-ye-Mirza, Hassani St, No. 29 (P.O. Box 11365–436), Tehran.
Iraq—Embassy, 2D/19 Zuwiyah 2, Jadriyah (near Baghdad University), (P.O. Box 2350, Alwiyah), Baghdad.
Ireland—Ambassador resident in London (see under Britain).
Israel—Ambassador resident in The Hague (see under Netherlands).
Italy—Embassy, Via Zara 28, Rome 00198.
Jamaica—High Commissioner resident in Ottawa (see under Canada).
Japan—Embassy, 20–40 Kamiyama-cho, Shibuya-ku, Tokyo 150.
Consulate-General, Daiwabank Semba Building 9F, 4–21 Minamisemba 4-chome, Minamiku, Osaka 542.
Jordan—Ambassador resident in Baghdad (see under Iraq).
Kenya—High Commissioner resident in Harare (see under Zimbabwe).
Kiribati—High Commissioner resident in Suva (see under Fiji).
Korea, Republic of—Embassy, Kyobo Building, 1 Chongno 1-ga, Chongno-gu, (G.P.O. Box 1059), Seoul.
Laos—Ambassador resident in Bangkok (see under Thailand).
Luxembourg—Ambassador resident in Brussels (see under Belgium).
Macau—Commissioner resident in Hong Kong.
Malaysia—High Commission, 193 Jalan Tun Razak, (P.O. Box 12003), Kuala Lumpur 50764.
Maldives—High Commissioner resident in Singapore.
Mauritius—Consulate, 29 Edgar Aubert Street, (P.O. Box 687) Port Louis.
Mexico—Embassy, Homero 229 Piso 8, 11570 Mexico D.F.
Nauru—High Commissioner resident in Suva (see under Fiji).
Nepal—High Commissioner resident in New Delhi (see under India).
Netherlands—Embassy, Mauritskade 25, 2514 HD The Hague.
New Caledonia—See under France.
Nigeria—High Commissioner resident in London (see under Britain).
Niue—New Zealand Representative, Tapeu, Alofi (P.O. Box 78), Niue.
Norway—Ambassador resident in The Hague (see under Netherlands).
Oman—Ambassador resident in Riyadh (see under Saudi Arabia).
OECD—N.Z. Permanent Delegation is located at the Embassy in Paris (see under France).
Pakistan—Ambassador resident in Tehran (see under Iran).
Papua New Guinea—High Commission, Waigani (P.O. Box 1144, Boroko) Port Moresby.
Peru—Embassy, Avenida Salaverry 3006, San Isidro, (Casilla 5587, Lima 100) Lima 27.
Philippines—Embassy, Gammon Centre, 3rd Floor, 126 Alfaro Street, Salcedo Village, Makati (Box 2208, Makati Central P.O.) Metro Manila.
Poland—Ambassador resident in Vienna (see under Austria).
Qatar—Ambassador resident in Riyadh (see under Saudi Arabia).
Portugal—Ambassador resident in Rome (see under Italy).
Romania—Ambassador resident in Vienna (see under Austria).
Saudi Arabia—Embassy, Al Hamidi Commercial Centre, Sitteen Street, (P.O. Box 94397), Riyadh 11693.
Singapore—High Commission, 13 Nassim Road, Singapore 1025.
Solomon Islands—High Commission, Soltel House, Mendana Avenue (P.O. Box 697), Honiara.
Spain—Ambassador resident in Paris (see under France).
Sri Lanka—High Commissioner resident in Singapore.
Sweden—Ambassador resident in The Hague (see under Netherlands).
Switzerland—Ambassador resident in Bonn (see under Germany, Federal Republic of). Consulate-General, 28A Chemin du Petit-Saconnex, CH-1209 Geneva (P.O. Box 334, CH-1211 Geneva 19).
Tahiti—See under France.
Tanzania—High Commissioner resident in Harare (see under Zimbabwe).
Thailand—Embassy, 93 Wireless Road (P.O. Box 2719), Bangkok 5.
Tokelau—Office for Tokelau Affairs, Savalalo Street, (P.O. Box 865) Apia, Western Samoa.
Tonga—High Commission, Corner Taufa'ahau and Salote Roads, (P.O. Box 830) Nuku'alofa.
Trinidad and Tobago—High Commission resident in Ottawa (see under Canada). Consulate, Ansa Building, Endeavour Road, Uriah Butler Highway, Chaguanas, (P.O. Box 823) Port of Spain, Trinidad W.I.
Tuvalu—High Commissioner resident in Suva (see under Fiji).
Union of Soviet Socialist Republics—Embassy, 44 Ulitsa Vorovskovo, Moscow 121069.
United Kingdom—see Britain.
United Nations—Permanent Mission to the U.N. One U.N. Plaza, 25th Floor, New York, N.Y. 10017, U.S.A.
Permanent Mission, Geneva, located at Consulate-General in Geneva (see under Switzerland).
Permanent Mission, Vienna, located at Embassy in Vienna (see under Austria).
Permanent Delegation FAO, located at Embassy in Rome (see under Italy).
Permanent Delegation to UNESCO located at Embassy in Paris (see under France).
Permanent Delegation to U.N. Environment Programme (U.N.E.P.) located at Embassy in Athens.
United States—Embassy, 37 Observatory Circle N.W., Washington, D.C. 2008.
Consulate-General, Suite 1530, Tishman Building, 10960 Wilshire Boulevard, Los Angeles, Ca. 90024.
New Zealand Tourist and Publicity Department Central Reservations Office, Plaza La Reina, Suite 1270, 6033 West Century Boulevard, Los Angeles, Ca 90045.
Consulate-General, Suite 530, Rockefeller Center, 630 Fifth Avenue, New York, N.Y. 10111.
Trade Commission and Tourist and Publicity Department Office, Citicorp Center Suite 810, 1 Sansome Street, San Francisco, Ca 94104.
Vanuatu—High Commission Prouds Building, Kumul Highway, (P.O. Box 161) Port Vila.
Vatican—see Holy See
Venezuela—Ambassador resident in Lima (see under Peru).
Vietnam—Ambassador resident in Bangkok (see under Thailand).
Western Samoa—High Commission, Beach Road (F.O. Box 208), Apia.
Yugoslavia—Ambassador resident in Athens (see under Greece).
Zambia—High Commissioner resident in Harare (see under Zimbabwe).
Zimbabwe—High Commission, 6th floor, Batanai Gardens, 57 Stanley Avenue, (P.O. Box 5448), Harare.
For further information on the official overseas representation in New Zealand listed below refer to the publication Diplomatic List: Diplomatic and Consular Representatives in New Zealand on sale at Government Bookshops.
Argentina—Consul-General, Harbour View Building, 52 Quay Street, Auckland.
Australia—Australian High Commission, 72–78 Hobson Street, Wellington.
Consulate-General, 8th Floor, Union House, 32–38 Quay Street, Auckland.
Austria—Ambassador resident in Canberra.
Hon. Consul, Overseas Passenger Terminal, Herd Street, Wellington. Hon. Consul, 1 McColl Street, Auckland.
Bangladesh—High Commissioner resident in Canberra.
Belgium—Embassy of Belgium, Robert Jones House, 1–3 Willeston Street, Wellington. Hon. Consul, Penthouse, Fisher International Building, 18 Waterloo Quadrant, Auckland. Hon. Consul, 56A Clyde Road, Christchurch.
Brazil—Ambassador resident in Canberra.
Hon. Consul, 8 Commerce Street, Auckland.
Britain—British High Commission, Reserve Bank Building, 2 The Terrace, Wellington. Consulate-General, Norwich Union Building, Queen Street, Auckland.
Hon. Consul, 5A Cranmer Square, Christchurch.
Brunei Darussalam—High Commissioner resident in Bandar Seri Begawan.
Burma—Ambassador resident in Canberra.
Canada—Canadian High Commission, ICI House, 67 Molesworth Street, Wellington. Vice-Consul (Commercial), Princes Court, 2 Princes Street, Auckland.
Chile—Embassy of the Republic of Chile, Robert Jones House, 1–3 Willeston Street, Wellington.
Hon. Consul, 21–39 Jellicoe Road, Panmure, Auckland.
Hon. Consul, 96 Oxford Terrace, Christchurch.
China—Embassy of the People's Republic of China, 2–6 Glenmore Street, Wellington.
Colombia—Ambassador resident in Jakarta.
Cook Islands—Office of the Cook Islands Representative, 61 Kanpur Road, Broadmeadows, Wellington.
Consular Office of the Cook Islands, 330 Parnell Rd, Parnell, Auckland.
Costa Rica—Hon. Consul-General, 50 Lunn Avenue, Mt Wellington, Auckland.
Cyprus—High Commissioner resident in Canberra.
Czechoslovakia—Embassy of the Czechoslovak Socialist Republic, 12 Anne Street, Wellington.
Denmark—Ambassador resident in Canberra.
Hon. Consul-General, 105–109 The Terrace, Wellington.
Hon. Consul-General, Equiticorp Building, 73 Symonds Street, Auckland.
Hon. Consul, 35A Wairarapa Terrace, Christchurch.
Hon. Consul, 18 Danube Street, Vauxhall, Dunedin.
Ecuador—Ambassador resident in Tokyo.
Hon. Consul, Wool House, 10 Brandon Street, Wellington.
Egypt—Embassy of the Arab Republic of Egypt, Dalmuir House, 114 The Terrace, Wellington.
El Salvador—Hon. Consul, 24 Seccombes Road, Epsom, Auckland.
European Communities—Head of Delegation resident in Canberra.
Fiji—Embassy of the Republic of Fiji, Robert Jones House, 1–3 Willeston Street, Wellington.
Finland—Ambassador resident in Canberra.
Hon. Consul-General, 25–33 Victoria Street, Wellington.
Hon. Consul, 20 Dilworth Avenue, Remuera, Auckland.
Hon. Consul, Durham Courts, 16 Wordsworth Street, Sydenham, Christchurch.
Hon. Consul, MFL Building, 11 Bond Street, Dunedin.
France—Embassy of France, Robert Jones House, 1–3 Willeston Street, Wellington.
Hon. Consul, corner of Princes Street and Eden Crescent, Auckland.
Consul (Commercial), Wyndham Towers, Wyndham Street, Auckland.
Hon. Consul, c/o Teachers College, Christchurch.
Hon. Consul, c/o University of Otago, Dunedin.
German Democratic Republic—Ambassador resident in Canberra.
Germany, Federal Republic—Embassy of the Federal Republic of Germany, 90–92 Hobson Street, Wellington.
Hon. Consul, 17 Albert Street, Auckland.
Hon. Consul, 71 Cambridge Terrace, Christchurch.
Greece—Ambassador resident in Canberra.
Hon. Consul-General, Cumberland House, 237 Willis Street, Wellington.
Holy See—Apostolic Nunciature, 112 Queen's Drive, Lyall Bay, Wellington.
Hungary—Ambassador resident in Canberra.
Iceland—Hon. Consul-General, 88 Oriental Parade, Wellington.
India—Office of the High Commissioner for India, Princess Towers, 180 Molesworth Street, Wellington.
Indonesia— of the Republic of Indonesia, 70 Glen Road, Kelburn, Wellington.
Iran—Ambassador resident in Canberra.
Iraq—Ambassador resident in Canberra.
Ireland—Ambassador resident in Canberra.
Hon. Consul, Dingwall Building, 87 Queen Street, Auckland.
Israel—Embassy of Israel, Plimmer City Centre, Plimmer Steps, Wellington.
Italy—Embassy of Italy, 34 Grant Road, Wellington.
Hon. Consular Agent, Dingwall Building, 87–93 Queen Street, Auckland.
Hon. Consular Agent, 48 Seven Oaks Drive, Bryndwr, Christchurch.
Hon. Consular Agent, 14 Shandon Road, Waverley, Dunedin.
Japan—Embassy of Japan, Norwich Insurance House, 3–11 Hunter Street, Wellington.
Consulate-General of Japan, National Mutual Building, 37–45 Shortland Street, Auckland.
Consular Office of Japan, General Building, 77 Hereford Street, Christchurch.
Kiribati—High Commissioner resident in Tarawa.
Hon. Consul, 33 Great South Road, Otahuhu, Auckland.
Korea—Embassy of the Republic of Korea, Plimmer City Centre, Plimmer Steps, Wellington. Hon. Consul. Great Northern Centre, cnr Queen and Customs Streets, Auckland.
Hon. Consul, 126 Cashel Street, Christchurch.
Laos—Charge d' Affaires resident in Canberra.
Lebanon—Charge d' Affaires resident in Canberra.
Libya—Secretary of the People's Committee resident in Canberra.
Malaysia—High Commission of Malaysia, 10 Washington Avenue, Brooklyn, Wellington, Hon. Consul, 14 Hazeldean Road, Christchurch.
Mali—Ambassador resident in Beijing.
Mexico—Ambassador resident in Canberra.
Hon. Consul, 1–3 Arawa Street, Grafton, Auckland.
Hon. Consul, Tatra House, 96 Tory Street, Wellington.
Mongolia—Ambassador resident in Tokyo.
Nauru—Consulate-General, Samoa House, 283 Karangahape Road, Auckland.
Nepal—Ambassador resident in Tokyo.
Netherlands—Royal Netherlands Embassy, Investment Centre, cnr Ballance and Featherston Streets, Wellington.
Hon. Consul, Aetna House, 57 Symonds Street, Auckland.
Hon. Consul, Amsterdam House, 161–163 Kilmore Street, Christchurch.
Nigeria—High Commissioner resident in Canberra.
Niue—Consular Office, Samoa House, 283 Karangahape Road, Auckland.
Norway—Ambassador resident in Canberra.
Hon. Consul-General, Hamilton Chambers, 199–201 Lambton Quay, Wellington.
Hon. Consul, Westpac Security Building, 120 Albert Street, Auckland.
Hon. Consul, Scales House, 321 Manchester Street, Christchurch.
Hon. Consul, 365 Princes Street, Dunedin.
Oman—Ambassador resident in Tokyo.
Pakistan—Ambassador resident in Canberra.
Hon. Consul, Commerce Building, 14 Emily Place, Auckland.
Papua New Guinea—Papua New Guinea High Commission, Princess Towers, 180 Molesworth Street, Wellington.
Peru—Embassy of Peru, 35–37 Victoria Street, Wellington.
Hon. Consul, 45 Neilson Street, Onehunga, Auckland.
Philippines—Embassy of the Philippines, 50 Hobson Street, Wellington.
Hon. Consul-General, 93–97 Dominion Road, Mount Eden, Auckland 1.
Poland—Embassy of the Polish People's Republic, Apartment D, 196 The Terrace, Wellington.
Portugal—Ambassador resident in Canberra.
Hon. Consul, Southpac House, 1 Victoria Street, Wellington.
Hon. Consul, 117 Arney Road, Remuera, Auckland.
Hon. Consul, 29 Newington Avenue, Dunedin.
Qatar—Ambassador resident in Tokyo.
Romania—Embassy, 31 Doris Gordon Crescent, Crofton Downs, Wellington.
Saudi Arabia—Ambassador resident in Canberra.
Singapore—High Commission, 17 Kabul Street, Khandallah, Wellington.
Solomon Islands—High Commissioner resident in Honiara.
Spain—Ambassador resident in Canberra.
Hon. Consul, P.O. Box 71, Papakura, Auckland.
Hon. Consul, 148 Lichfield Street, Christchurch
Sri Lanka—High Commissioner resident in Canberra.
Consular of the Democratic Socialist Republic of Sri Lanka, Norwich Insurance House, 117 Queen Street, Auckland.
Sweden—Royal Swedish Embassy, Greenock House, 39 The Terrace, Wellington.
Hon. Consul, Emcom House, 75 Queen Street, Auckland.
Hon. Consul, 178 Cashel Street, Christchurch.
Hon. Consul, 40 Jetty Street, Dunedin.
Switzerland—Embassy of Switzerland, Panama House, 22–24 Panama Street, Wellington.
Hon. Consul, 48 Carr Road, Mount Roskill, Auckland.
Thailand—Royal Thai Embassy, 2 Cook Street, Karori, Wellington.
Tonga—Agents for Tonga, 655 Great South Road, Penrose, Auckland.
Turkey—Ambassador resident in Canberra.
Hon. Consul-General, 201 Symonds Street, Auckland.
Tuvalu—Hon. Consul, 33 Great South Road, Otahuhu, Auckland.
U.S.A.—Embassy of the United States of America, 29 Fitzherbert Terrace, Wellington.
Consulate-General, General Building, cnr Shortland and O'Connell Streets, Auckland.
Consular Agent, c/o Lawrence Anderson Buddle, P.O. Box 13250, Christchurch.
U.S.S.R.—Embassy of the Union of Soviet Socialist Republics, 57 Messines Road, Karori, Wellington.
Uruguay—Charge d'Affaires resident in Canberra.
Vanuatu—High Commissioner resident in Port Vila.
Venezuela—Ambassador resident in Canberra.
Vietnam—Ambassador resident in Canberra.
Western S—High Commission for Western Samoa, 1A Wesley Road, Kelburn, Wellington.
Consulate-General, Samoa House, 283 Karangahape Road, Auckland.
Yugoslavia—Embassy of the Socialist Federal Republic of Yugoslavia, 24 Hatton Street, Wellington.
Hon. Consul, A.M.P. Building, cnr Queen and Victoria Streets, Auckland.
Zambia—High Commissioner resident in Canberra.
A territory under New Zealand's administration, Tokelau is a scattered group of three atolls in the South Pacific with a total land area of about 12 square kilometres and a population of 1694 in 1986. Sovereignty was transferred from Britain, and Tokelau included within the boundaries of New Zealand, in 1948. Tokelau lies between Micronesia and Polynesia, but its inhabitants are Polynesian. They retain linguistic, family and cultural links with Western Samoa, although the culture of Tokelau is shaped by its atoll environment. Tokelauan is spoken, with English as a second language.
Administrative responsibility for Tokelau lies with the Administrator, Mr Neil Walter, Assistant Secretary of Foreign Affairs in Wellington. Many of his powers are delegated to the Official Secretary who heads the Office for Tokelau Affairs, based in Apia by agreement with Western Samoa. The Administrator reports annually to the New Zealand Parliament.
New Zealand is committed to helping Tokelau towards greater self-government and economic self-sufficiency. Invited missions from the UN Special Committee on Decolonisation visited Tokelau and were advised by the people that they did not, for the time being, wish to review the existing ties between New Zealand and the territory. A delegation from Tokelau visited New York in June 1987, and its message to the United Nations reflected the views expressed to earlier missions. New Zealand takes steps to ensure that the Tokelau Public Service meets Tokelau's administrative, social, economic and development requirements. The Public Service numbered 166 at 31 March 1987. Almost all public servants are Tokelauans.
New Zealand provided $3.8 million of budgetary aid in the year ended 31 March 1988. Tokelau also receives considerable assistance from various international agencies, the UN Development Programme being the largest donor. Western Samoa gives much practical assistance, particularly medical.
Tokelau has a separate legal system, and local government is conducted through representative institutions. The Faipule and Pulenuku are elected every three years by adult suffrage.
Tokelau's economy, largely subsistence, is based on fishing, crops and livestock, although the soil is barren and resists fertilisation. The territory's size, isolation and lack of land-based resources give little scope for economic development, although measures have been taken to redistribute available cash income. Each atoll has a small general hospital and a primary school.
The Ross Dependency consists of the land, permanent ice-shelf and islands of Antarctica between 160 degrees east and 150 degrees west. The land is almost all covered by ice, and is uninhabited except for people working on scientific research programmes. New Zealand has exercised jurisdiction over the territory since 1923, has maintained Antarctic Scientific Research Programme since 1957 and operates Scott Base on Ross Island as a permanent base, with a seasonal base at Lake Vanda in the Dry Valleys region. New Zealand is an original party to the Antarctic Treaty, which requires Antarctica to be used for peaceful purposes only and promotes international co-operation, freedom of scientific investigation, and exchange of information and scientific personnel. The 32 parties to the treaty meet regularly to consider questions within its framework.
The Governor-General as Commander-in-Chief is empowered to raise and maintain the Royal New Zealand Navy, the New Zealand Army, and the Royal New Zealand Air Force. These forces, together with civilian employees constitute the Ministry of Defence, which is responsible under the Minister of Defence for the central control of the whole field of national defence.
The Secretary of Defence is chief executive of the ministry and principal civilian adviser to the minister, responsible in particular for co-ordinating the business of the ministry as a whole, including long-term financial planning as well as supervision of defence expenditure.
The Chief of Defence Staff is principal military adviser to the minister, and convenor and chairperson of the Chiefs of Staff Committee. The Chief of Defence Staff carries out inspections of the services and reports to the minister.
The Defence Council is responsible for the administration and, through the officers appointed for the purpose, the command of the New Zealand armed forces. The Defence Council, with the minister as chairperson, includes the Secretary of Defence, the Chief of Defence Staff, and the Chiefs of Staff of the three services. The Secretary to the Treasury and the Secretary of Foreign Affairs are associate members. In addition, the council may from time to time co-opt officers of other government departments. Without limiting the duties of the Secretary of Defence or the Chief of Defence Staff, the Defence Council assists the minister in formulating defence policy or recommendations.
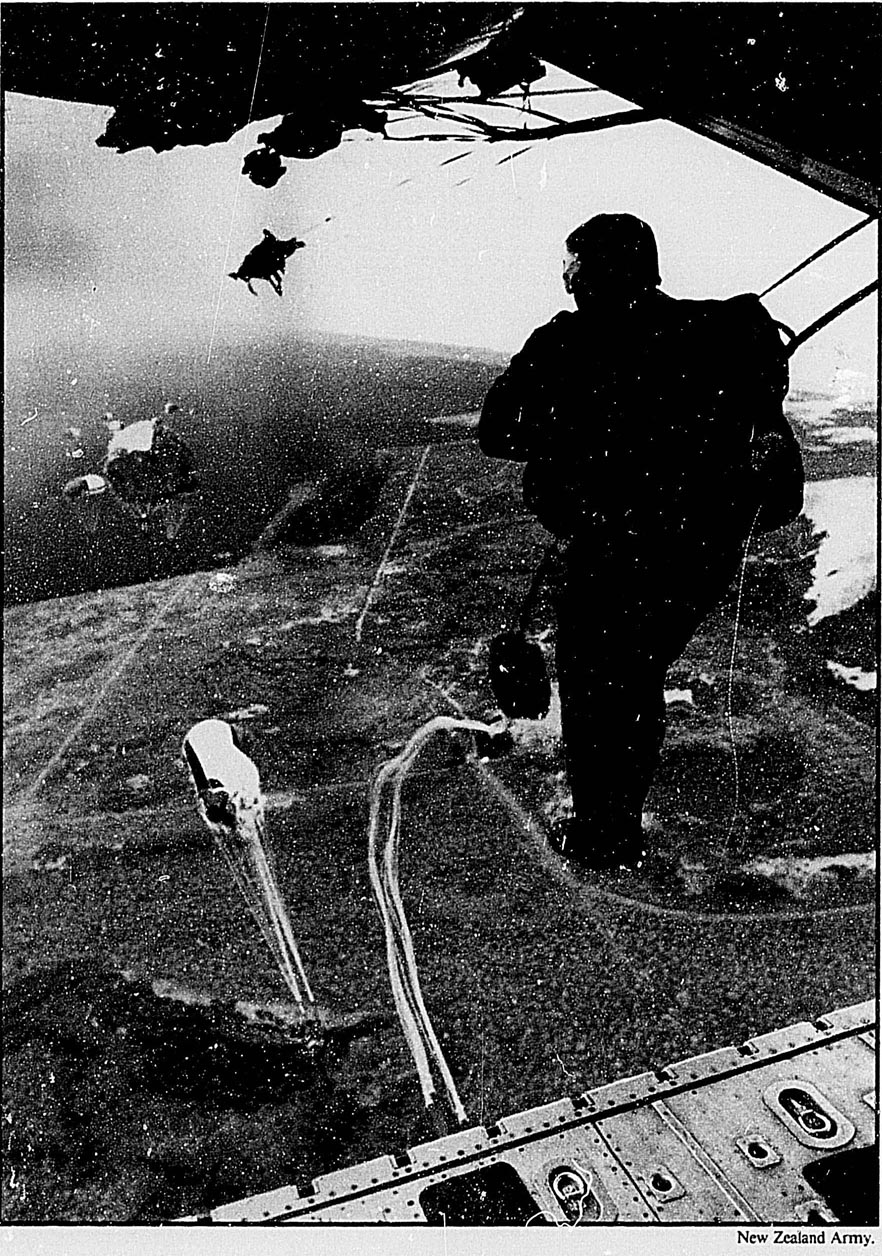
Combined RNZAF/NZ Army exercise.
The Government's comprehensive review of defence policy concluded with the release of a white paper, entitled Defence of New Zealand: Review of Defence Policy 1987. A feature of the review was the extensive consultation with the public, unprecedented in past defence reviews. The white paper highlights the need for greater defence self-reliance, the importance of closer defence co-operation with Australia, and the need to give practical effect to the greater emphasis on New Zealand's defence role in the South Pacific.
A resource management review of the Ministry of Defence was begun in 1988 to consider how best to achieve efficient and economical use of resources, in order to give New Zealand operationally effective and increasingly self-reliant armed forces. The review will be wide ranging, covering organisation, personnel, scientific and electronic data processing activities, equipment (including operational equipment, communications and reserve stocks), training, programme management, and cost recovery. It will also include rationalising real estate holdings. It will not, however, reopen the issues in the 1987 review of defence policy, nor will it cut across established force structures or command responsibilities.
The Defence Scientific Establishment at Devonport is the main research centre in the Ministry of Defence; its work relates mainly to the operation of defence equipment in New Zealand conditions. It specialises in the fields of metallurgy, underwater acoustics, mine warfare and systems engineering. The research ship HMNZS Tui is operated by the Navy to meet the requirements of the defence science programme.
To achieve current defence policy objectives, the armed forces have the following missions:
To preserve the security and integrity of New Zealand, its 200 mile Exclusive Economic Zone, and the island states (the Cook Islands, Niue and Tokelau) for which New Zealand has defence responsibilities.
To be able to mount an effective military response to any low level contingency within our areas of direct strategic concern. (This is the area which would have to be traversed if New Zealand was to be directly threatened by attack or invasion. It includes mainland Australia, and extends north through Papua New Guinea to Kiribati, east to the Cook Islands, and south to the Ross Dependency in Antarctica.)
To maintain an expansion base which would enable New Zealand to respond to higher level contingencies within our area of direct strategic concern.
To promote the security and stable development of the South Pacific by providing practical assistance in defence matters to the countries of the South Pacific region.
To maintain close defence co-operation with Australia, and in particular areas (such as defence procurement, logistic support, and co-ordination of defence activities in the South Pacific) to develop a closer defence relationship.
To continue to meet ANZUS obligations in conventional terms.
To maintain an ability to operate in New Zealand's southern maritime region, and provide logistic support to New Zealand activities in Antarctica.
To contribute to the maintenance of peace and stability in South-east Asia by continuing to maintain an active role in the Five Power Defence Arrangements and mutually beneficial military assistance, training and exchange programmes with the countries of the region.
To provide disaster relief assistance, resource protection, rescue and medical evacuation services to the community in New Zealand, and in the South Pacific.
To promote peace and international security through contributions to United Nations peacekeeping operations.
ANZUS. This security treaty between Australia, New Zealand and the United States came into force in 1952. Each party recognises that an armed attack in the Pacific on any of the parties would be dangerous to its own peace and safety and declares that it would act to meet the common danger in accordance with its constitutional processes. Because of the dispute between New Zealand and the United States over the introduction of nuclear weapons into New Zealand ports and over visits of nuclear-propelled vessels, the ANZUS Council has not met since 1984. The Government considers that New Zealand can best meet its ANZUS obligations, and make an effective contribution to Western security, by playing a constructive role in promoting the collective security of New Zealand's part of the world.
The basis of the Five Power Defence Arrangements is not a formal treaty but a statement in the communiqu$eA of the meeting of ministers of Britain, Malaysia, Singapore, Australia and New Zealand in 1971. The ministers declared, “that in the event of any form of armed attack externally organised or supported or the threat of such attack against Malaysia or Singapore, their governments would immediately consult together for the purpose of deciding what measures should be taken jointly or separately in relation to such attack or threat”. Under these arrangements Australia maintains an RAAF presence in Malaysia, while New Zealand has maintained a contingent in Singapore (known as New Zealand Force South-east Asia).
Australia, Britain, France, New Zealand, Pakistan, the Philippines, Thailand and the United States signed the South East Asia Collective Defence Treaty, or the Manila Treaty, in 1954. Although the South-east Asia Treaty Organisation (SEATO) established under the treaty was phased out in 1977, the treaty was not abrogated.
To facilitate exchanges on military matters, defence representatives are posted to New Zealand diplomatic missions in London, Canberra, Washington, Ottawa, and Jakarta and with the New Zealand Force South-east Asia (accredited to Singapore, Kuala Lumpur, Bangkok and Brunei). In addition, some members of these staffs are also accredited to other countries. The United Kingdom, Australia and Malaysia have service representatives attached to their respective High Commissions in Wellington and there are service attach$eAs on the staffs of the French, Indonesian, and United States embassies in Wellington. Several other countries have service attach$eAs accredited to, but not resident in, New Zealand.
In 1986 the Government announced that New Zealand Force South-east Asia would return to New Zealand by December 1989. During 1987 the Minister of Defence and officials’ working groups visited Singapore and Malaysia to confirm an agreed timetable for withdrawal. The sequence will be tied to the development of Linton Camp. A small administrative element will remain in Singapore to support bilateral exercises under the FPDA and the Mutual Assistance Programme, continued single service deployments and training attachments. An RNZAF officer will remain attached to the staff of the FPDA Integrated Air Defence System Headquarters at Butterworth, Malaysia.
New Zealand has four observers in the Middle East with the United Nations Truce Supervisory Organisation.
New Zealand is a contributor to the Multinational Force and Observers (MFO) in Sinai which was set up to verify compliance with the terms of the peace treaty between Egypt and Israel. New Zealand has contributed a 14-man Army training and advisory team on a rotational six month tour of duty since April 1986. An officer attached to the MFO Headquarters commands the team and a warrant officer administers the 12 soldier instructors.
ASEAN and South Pacific countries participate in New Zealand's Mutual Assistance Programme. The programme is a practical demonstration of New Zealand's commitment to regional security. It contributes to the effectiveness of the armed forces in New Zealand's South Pacific neighbourhood and in South-east Asia through training and advisory assistance; and by assisting in development projects utilising the armed forces engineering and trade skills. The range and scope of activities is determined by New Zealand's partners, who have widely different needs. The most common forms of assistance are the provision of formal courses or on-the-job training attachments in New Zealand, the deployment of training and technical teams overseas, the attachment of military instructors to other armed forces for periods of up to two years, and civic action projects in the engineering and medical fields.
From October to December 1987 RNZAF C130 Hercules made 14 return trips to McMurdo Sound, transporting 191 025 kg of freight and 437 passengers. All three services provided air cargo handlers at Harewood and McMurdo Sound during the summer season, and specialist personnel filled a number of roles at Scott Base. Eighteen Army Engineers assisted in the rebuilding programme at Scott Base and six RNZAF personnel assisted in maintenance of Butter Point Camp.
Two joint exercises were conducted in the South Pacific in 1987. Exercise Swift Venture, in June, involved the Army's 1st NZSAS Group and Navy elements operating in Tokelau for five days. In October, Exercise Tropic Venture involved a total of 245 Army and Air Force personnel in a combined tactical transport and communications exercise in Vanuatu.
The Navy is the sole authority for the production of nautical charts in New Zealand and operates a survey ship, HMNZS Monowai and two inshore survey craft, HMNZ ships Takapu and Tarapunga. The Hydrographic Office also provides tidal analysis data and predictions. During 1987 Monowai conducted surveys around the East Cape of the North Island and deployed twice to Fiji following the military coups there. Takapu and Tarapunga conducted mine countermeasure exercises at Lyttelton and Dunedin among other survey tasks.
The Navy's frigates are employed part-time and the four patrol craft are employed full-time on fishery protection patrols within New Zealand's 200-mile Exclusive Economic Zone. Surveillance flights of the zone are undertaken by RNZAF Orion, Andover and Friendship aircraft.
Both the Air Force and the Navy maintain a search and rescue capability, and both services have taken part in extensive sea and land searches in the past 12 months. During this period the Air Force flew 57 missions and rescued 40 people.
Cadet forces comprise the Sea Cadets, Air Training Corps and New Zealand Cadet Corps (previously known as the School Cadet Corps). They are community-based youth training groups aimed at teaching leadership, comradeship, self-confidence and good citizenship to young people between the ages of 13 and 18 years. The Cadet Forces are supported by the Navy League, Air Cadet League, Returned Servicemens’ Association, Army Association and schools. The Ministry of Defence assists only to the extent necessary to preserve the special military character of the organisation.
As at 31 December 1987, there were a total of 83 cadet units (17 sea cadet, 49 air training corps and 17 cadet corps units). Cadet Forces strength at the same date was 323 officers and 4051 cadets.
Other assistance provided to the community included co-operation with the police (field catering and helicopter support) and the Departments of Maori Affairs, Internal Affairs (including explosive ordnance disposal), Customs and Justice, and the Ministries of Civil Defence and Agriculture and Fisheries.
Five C130 Hercules relief flights were sent to the Cook Islands in the aftermath of tropical cyclone Sally in January 1987. Army and Navy personnel were also deployed to repair damaged buildings and raise a sunken barge.
After tropical cyclone Uma struck during February 1987, a P3K Orion undertook reconnaissance flights for the Vanuatu Government to determine the overall damage.
About 70 percent of Vote Defence was spent in New Zealand in 1986–87, mainly on salaries, capital works, servicing, and general operating costs. There is a policy to encourage greater logistic self-sufficiency, both within New Zealand and in conjunction with Australia.
Table 4.2. DEFENCE EXPENDITURE
| Year ended 31 March | |||||||
|---|---|---|---|---|---|---|---|
| Item | 1984 | 1985 | 1986 | 1987 | |||
| Source: Ministry of Defence. | |||||||
| $(million) | |||||||
| Personnel | 332.75 | 355.97 | 390.44 | 464.28 | |||
| Travel, transport, and communications | 26.31 | 28.78 | 31.13 | 37.76 | |||
| Maintenance, operation, upkeep, and rental | 48.30 | 54.28 | 66.65 | 89.26 | |||
| Materials and supplies | 139.15 | 150.60 | 185.91 | 184.19 | |||
| Services | 17.32 | 16.23 | 19.58 | 25.45 | |||
| Other operating expenditure | 4.93 | 6.19 | 5.91 | 7.87 | |||
| Grants, contributions, subsidies | 0.33 | 0.36 | 0.38 | 49.86 | |||
| Capital works | 18.47 | 16.67 | 22.15 | 37.13 | |||
| Capital equipment | 85.42 | 127.33 | 148.30 | 200.16 | |||
| Total | 672.98 | 756.41 | 870.45 | 1,095.96 | |||
Table 4.3. NUMBER OF DEFENCE PERSONNEL
| As at 31 March | Navy | Army | Air Force | Total | Civilians |
|---|---|---|---|---|---|
| Source: Ministry of Defence. | |||||
| 1983 | 2,857 | 5,590 | 4,409 | 12,856 | 3,284 |
| 1984 | 2,745 | 5,563 | 4,296 | 12,604 | 3,219 |
| 1985 | 2,687 | 5,431 | 4,306 | 12,424 | 3,097 |
| 1986 | 2,619 | 5,814 | 4,176 | 12,609 | 3,073 |
| 1987 | 2,626 | 5,899 | 4,195 | 12,720 | 2,673 |
Table 4.4. INTERNATIONAL COMPARISON OF DEFENCE EXPENDITURE
| Percentage of GDP | |||||
|---|---|---|---|---|---|
| 1981 | 1982 | 1983 | 1984 | 1985 | |
| Source: International Institute of Strategic Studies. | |||||
| Australia | 2.5 | 2.7 | 2.8 | 2.8 | 3.0 |
| Canada | 1.8 | 2.1 | 2.2 | 2.2 | 2.2 |
| India | 3.2 | 3.2 | 3.0 | 3.9 | 3.2 |
| New Zealand | 2.0 | 2.1 | 2.1 | 1.9 | 2.1 |
| Sweden | 3.1 | 3.3 | 3.1 | 2.9 | 3.0 |
| United Kingdom | 4.8 | 5.4 | 5.3 | 5.5 | 5.2 |
| United States of America | 5.7 | 6.9 | 6.4 | 6.9 | 6.9 |
The Chief of Naval Staff exercises command and control of the Royal New Zealand Navy and is assisted by the Naval Staff as well as the integrated staff of Defence Headquarters.
Table 4.5. STATE OF THE NAVY
*On loan from U.S. Navy. Source: Ministry of Defence. | ||
|---|---|---|
| Frigates (Leander class) | Wellington Southland Waikato Canterbury | 11th Frigate Squadron. |
| Survey ship | Monowai | |
| Research ship | Tui* | |
| Patrol craft | Hawea Taupo Rotoiti Pukaki | First New Zealand Patrol Craft Squadron. |
| Inshore survey craft | Takapu Tarapunga | |
| RNZNVR inshore patrol craft | Moa Kiwi Wakakura Hinau | |
| Diving tender | Manawanui | |
| Dockyard service craft | Arataki | |
A tanker constructed in South Korea was commissioned during 1988 under the name HMNZS Endeavour.
The naval base at Devonport, Auckland, consists of the office of the Commodore Auckland (the operational authority of the RNZN), HMNZS Philomel (the naval barracks and base support establishment), the Royal New Zealand Naval Hospital, the Naval Supply Depot, and the Dockyard. The dockyard is capable of refitting all units of the Navy. HMNZS Tamaki is the naval training establishment at Narrow Neck, Devonport, Auckland. The RNZN Armament Depot is situated at Kauri Point and the RNZN Hydrographic Office is at Takapuna. HMNZS Irirangi is the naval radio receiving and transmitting station at Waiouru. HMNZS Wakefield is the administrative unit for RNZN personnel in the Wellington area.
Table 4.6. STRENGTH OF THE NAVY
| At 31 March | ||||
|---|---|---|---|---|
| Category | 1984 | 1985 | 1986 | 1987 |
| Source: Ministry of Defence. | ||||
| Regular forces— | ||||
| Officers (male and female) | 404 | 396 | 366 | 286 |
| Ratings (male and female) | 2,341 | 2,291 | 2,253 | 1,976 |
| Total | 2 745 | 2 687 | 2 619 | 2 262 |
| Non-regular forces— | ||||
| Royal New Zealand Naval Reserve (officers) | 4 | 4 | 4 | 4 |
| Royal New Zealand Naval Volunteer Reserve (all ranks) | 439 | 462 | 475 | 447 |
| Royal New Zealand Navy Emergency List (officers) | 35 | 52 | 52 | 58 |
| Royal New Zealand Naval Fleet Reserve (ratings) | 772 | 712 | 762 | 794 |
| Total | 1 250 | 1 230 | 1 293 | 1 303 |
Royal New Zealand Naval Volunteer Reserve—There is a division of the Royal New Zealand Naval Volunteer Reserve in each of the four main centres where reservists are given basic naval training.
The Army comprises regular, territorial, and reserve elements and is structured to provide the following operational options:
A Ready Reaction Force based on an infantry battalion group consisting of Regular Force personnel.
An Integrated Expansion Force of brigade group size, made up of Regular and Territorial Force personnel.
A deployable Force Maintenance Group, comprising Regular and Territorial Force personnel.
A further expansion capability based on existing units which would be expanded when required.
The Chief of General Staff commands the Army, supported by the General Staff and the staff of Defence Headquarters. Command over New Zealand Army units is exercised as follows:
Headquarters Land Force Command is responsible for provision of the Ready Reaction Force, Integrated Expansion Force, Territorial Force manpower management, collective training and Army input into any deployed national headquarters.
Headquarters Support Command is responsible for provision of the Force Maintenance Group, individual training, force logistic support and base (home) support.
Table 4.7. STATE OF THE ARMY
| Major integrated units | |||
|---|---|---|---|
| Army units | Regular Force units | Regular and territorial units | Major weapons and armoured fighting vehicles |
| Source: Ministry of Defence. | |||
| Infantry battalions (1 in Singapore) | 2 | ||
| Armoured reconnaissance squadron | 1 | ||
| Field artillery battery | 1 | ||
| Infantry battalions | 6 | ||
| Artillery regiments | 2 | ||
| Armoured squadrons (1 reconnaissance, 1 armoured personnel-carrier, 1 Ready Reaction Force armoured element); | 3 | ||
| Engineer squadrons | 4 | ||
| Signals squadrons | 4 | ||
| SAS group | 1 | ||
| Transport squadrons | 3 | ||
| Composite transport squadrons | 5 | ||
| Field workshops | 4 | ||
| Base workshop | 1 | ||
| Supply companies | 3 | ||
| Base supply battalion | 1 | ||
| Medical battalions | 2 | ||
| Field hospital | 1 | ||
| Combat reconnaissance vehicles (tracked) | 26 | ||
| Ml 13 armoured personnel-carrier family of vehicles | 78 | ||
| 5.5 inch medium guns | 10 | ||
| 105 mm guns/howitzers | 52 | ||
| 106 mm recoilless rifles | 19 | ||
Table 4.8. STRENGTH OF THE ARMY
| Category | At 31 March | |||
|---|---|---|---|---|
| 1984 | 1985 | 1986 | 1987 | |
*Class A and class B reserves. Source: Ministry of Defence. | ||||
| Regular forces— | ||||
| Officers (male and female) | 802 | 778 | 824 | 831 |
| Other ranks (male and female) | 4,761 | 4,653 | 4,990 | 5,041 |
| Total | 5 563 | 5 431 | 5 814 | 5 872 |
| Non-regular forces— | ||||
| Territorial Force (all ranks) | 6,299 | 5,963 | 5,821 | 5,921 |
| Officers Reserve | 613 | 626 | 610 | 621 |
| Other ranks* | 1,130 | 1,263 | 1,259 | 1,547 |
| Total | 8 042 | 7 852 | 7 690 | 8 089 |
The RNZAF is structured to provide forces for maritime surveillance and reconnaissance, offensive air support and air transport in New Zealand's area of interest.
The Chief of Air Staff commands the Royal New Zealand Air Force and is supported by the Air Staff and the staff of Defence Headquarters.
The RNZAF in New Zealand is organised into two functional groups: Operations Group, with its headquarters at RNZAF Base Auckland, is responsible for all operational functions and operational flying training; Support Group, with its headquarters at RNZAF Base Wigram, is responsible for all recruitment, formal individual training (except advanced pilot training) and certain support functions such as supply and depot level maintenance. RNZAF Base Shelly Bay acts as the administrative and domestic base for all RNZAF personnel assigned to Wellington for duty in Air Staff and Defence Headquarters. Operational flying units are based at RNZAF Base Auckland, RNZAF Base Ohakea and a VIP flying unit at RNZAF Base Woodbourne. Flying training is conducted at RNZAF Base Wigram while ground training is carried out at RNZAF Bases Auckland, Woodbourne and Wigram. RNZAF Base Te Rapa is the RNZAF's stores depot. A museum and historical centre is located at Wigram.
The RNZAF also has personnel and helicopters serving with New Zealand Force South-east Asia.
Aircraft technical services are co-ordinated by Air Staff with specific levels of aircraft maintenance assigned to the bases and squadrons. The overhaul, repair and some manufacturing of aeronautical equipment is carried out at RNZAF Base Woodbourne. A proportion of repair and overhaul work is contracted to the private sector in New Zealand and overseas.
Table 4.9. STATE OF THE RNZAF
| Operational units role | Aircraft | Location |
|---|---|---|
| Source: Ministry of Defence. | ||
| Maritime | 6 Orions | RNZAF Base Auckland |
| Air transport | 2 Boeing 727s 7 Andovers 5 Hercules | |
| Helicopters | 11 Iroquois 3 Sioux 7 Wasps (operated by RNZN) 3 Iroquois are in Singapore | |
| Offensive air support | 22 Skyhawks | RNZAF Base Ohakea |
| Advanced flying training and attack transition training | 15 Strikemasters | |
| VIP transport | 3 Cessna 421 Cs | RNZAF Base Woodbourne |
| Flying training | 4 Air tourers 15 Air trainers 2 Sioux helicopters 3 Friendships | RNZAF Base Wigram |
Table 4.10. STRENGTH OF THE AIR FORCE
| Category | At 31 March | |||
|---|---|---|---|---|
| 1984 | 1985 | 1986 | 1987 | |
| Source: Ministry of Defence. | ||||
| Regular forces— | ||||
| Officers (male and female) | 744 | 730 | 717 | 731 |
| Airmen and airwomen | 3,552 | 3,576 | 3,459 | 3,464 |
| Total | 4 296 | 4 306 | 4 176 | 4 195 |
| Non-regular forces— | ||||
| Territorial Air Force | 204 | 213 | 224 | 216 |
| Active Reserve | 734 | 685 | 817 | 697 |
| General Reserve | 95 | 105 | 176 | 103 |
| Total | 1 033 | 1 003 | 1 217 | 1 016 |
The New Zealand Security Intelligence Service Act 1969 gives statutory recognition to the New Zealand Security Intelligence Service.
Subject to the control of the Minister in Charge of the Security Intelligence Service, the functions of the service are to obtain, correlate, and evaluate intelligence relevant to security; to advise ministers on security matters; and to inform the New Zealand Intelligence Council on any new area of potential espionage, sabotage, terrorism, or subversion. The Security Intelligence Service does not enforce security measures. Nor does it institute surveillance of any person or class of persons by reason only of his, her, or their involvement in lawful protest or dissent in respect of any matter affecting the constitution, laws, or government of New Zealand.
There is a Commissioner of Security Appeals, to whom complaints may be made in writing at the office of the High Court in Wellington.
During the year ended 31 March 1987, three interception warrants were issued for the ‘detection of activities prejudicial to security’ (section 4A (1) (a) (i) of the New Zealand Security Intelligence Service Act 1969). The average term of each warrant was five months and 10 days. The methods of interception used were listening devices and copying of documents.
4.1–4.4 Ministry of Foreign Affairs.
4.5 Ministry of Defence; New Zealand Security Intelligence Service.
Defence of New Zealand: Review of Defence Policy 1987. Government Printing Office, 1987.
Diplomatic List. Government Printing Office (twice-yearly).
Information Bulletins (including an annual bulletin on disarmament and arms control). Ministry of Foreign Affairs.
New Zealand Foreign Affairs Review. Ministry of Foreign Affairs (quarterly).
New Zealand Representatives Overseas. Government Printing Office (twice-yearly).
Report of the Ministry of Defence (Parl. paper G. 4).
Report of the Ministry of Foreign Affairs (Parl. paper A. 1).
Table of Contents
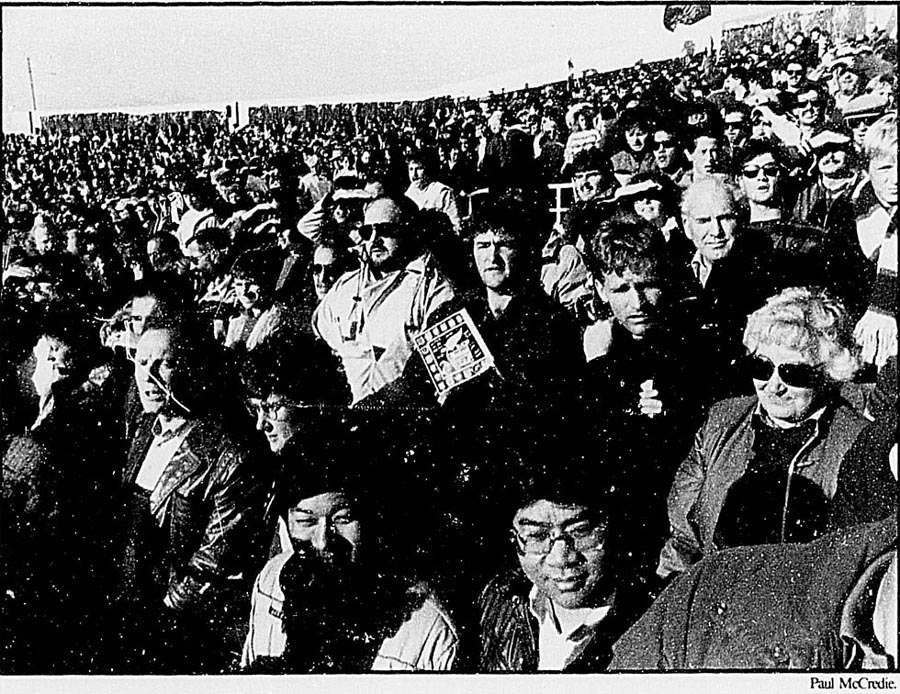
Rugby World Cup final. Auckland.
By world standards New Zealand's population is small, at approximately 3.3 million. The country's first million of population was reached in 1908; the second 44 years later, in 1952. After that a growth rate averaging roughly 2.0 percent per annum meant it took only 21 years to add the third million—the population grew from 2.02 million at 31 December 1952 to 3.02 million at 31 December 1973. In the 14 years since then, New Zealand's population has grown by barely one-third of a million, to reach an estimated 3.35 million at 31 December 1987.
These broad patterns, however, mask the substantial fluctuations in the intercensal rate of population growth, especially since the early 1960s (see table 5.1). New Zealand's population grew at an average rate of 2.11 percent per annum during 1961–66, 1.35 percent during 1966–71, 1.80 percent during 1971–76, but only 0.29 percent during 1976–81. The growth rate recovered to 0.82 percent during the latest interval 1981–86, but apart from the preceding intercensal period it was still well below that recorded for any intercensal period this century.
Table 5.1. POPULATION: CENSUS DATA AND ANNUAL ESTIMATE
| Total population* | Intercensal/annual increase | ||||
|---|---|---|---|---|---|
| Period | Males | Females | Total | Numerical | Percent |
*New Zealand armed forces overseas are excluded. | |||||
| At census date | |||||
| 18 April 1961 | 1,213,376 | 1,201,608 | 2,414,984 | 240,922 | 11.08 |
| 22 March 1966 | 1,343,743 | 1,333,176 | 2,676,919 | 261,935 | 10.85 |
| 23 March 1971 | 1,430,856 | 1,431,775 | 2,862,631 | 185,712 | 6.94 |
| 23 March 1976 | 1,562,042 | 1,567,341 | 3,129,383 | 266,752 | 9.32 |
| 24 March 1981 | 1,578,927 | 1,596,810 | 3,175,737 | 46,354 | 1.48 |
| 4 March 1986 | 1 638 356x | 1 668 728x | 3,307,084 | 131,347 | 4.14 |
| At 31 December | |||||
| 1987P | 3 349 200 | 32,500 | 0.98 | ||
Population growth has two main components: natural increase (or excess of births over deaths) and net migration (or excess of arrivals over departures). Table 5.2 indicates the relative contribution of the two factors to population change during 1979–87. Natural increase has accounted for over three-quarters of the growth in New Zealand's population during this century. However, the rate of natural increase has halved since the early 1960s–sliding from 1.8 percent in 1960–61 to 1.4 percent in 1969–70, and further to 6.2 percent in 1986–87. Two opposing factors have contributed to this slower natural growth regime, viz. a steep decline in fertility to below replacement level and a contemporary small rise in the number of deaths. The ageing of New Zealand people and the resultant increase in the number of deaths is expected to contract the natural increase component further.
Table 5.2. POPULATION CHANGE
| Population change due to | |||||||
|---|---|---|---|---|---|---|---|
| December year | Births | Deaths | Arrivals | Departures | Natural increase | Net migration*x | Total population change x |
*Excludes armed forces, through passengers and crews. | |||||||
| 1979 | 52,279 | 25,340 | 902,148 | 928,469 | 26,939 | -26 321 | 618 |
| 1980 | 50,542 | 26,676 | 982,094 | 993,736 | 23,866 | -11 642 | 12,224 |
| 1981 | 50,794 | 25,150 | 958,105 | 964,796 | 25,644 | -6 691 | 18,953 |
| 1982 | 49,938 | 25,532 | 914,257 | 903,480 | 24,406 | 10,777 | 35,183 |
| 1983 | 50,474 | 25,991 | 914,875 | 900,263 | 24,483 | 14,612 | 39,095 |
| 1984 | 51,636 | 25,378 | 986,937 | 983,052 | 26,258 | 3,885 | 30,143 |
| 1985 | 51,798 | 27,480 | 1,078,712 | 1,091,608 | 24,318 | -12 896 | 11,422 |
| 1986 | 52,824 | 27,045 | 1,256,116 | 1,267,571 | 25,779 | -11 455 | 14,324 |
| 1987P | 55,248 | 27,419 | 1,525,871 | 1,521,221 | 27,829 | 4,650 | 32,479 |
It is important to note though, that compared with some European countries New Zealand's rate of natural increase is still relatively high. In 1986, England and Wales, Norway, Scotland and Sweden all recorded natural increase rates of less than 0.2 percent, while in Austria, Denmark and West Germany deaths exceeded births.
In contrast with the transition in natural increase, the migration trends have been characteristically volatile. The external migration balance has fluctuated from a net immigration (excess of arrivals over departures) of 103 826 during the March years 1972–76 to a net emigration (excess of departures over arrivals) of 102 493 during the March years 1977–81, and back again to a net immigration of 2955 during the March years 1982–86. Net migration contributed one-third of the total population growth during 1971–76, but less than 3 percent during 1981–86, while during 1976–81 because of a net outflow, its contribution was negative. Latest figures indicate that swings in the migration balance have continued almost unabated, with pronounced effects on population growth rates.
Males and females. Large-scale changes in the dynamics of population growth have affected the population size and composition measurably. The sex structure of New Zealand's population, which had always contained slightly more males, has also changed. In 1971, for the first time, a census of population recorded a slight excess of females—1 430 856 males and 1 431 775 females, a ‘sex ratio’ of 999 males per 1000 females. By 31 March 1987, this ratio had dropped to 980 males per 1000 females. There are marked differences in the sex composition of the population of different parts of New Zealand. Females tend to outnumber males in urban areas and to be outnumbered in rural areas. One important reason is the generally better employment and educational opportunities for women and girls in the larger industrial and commercial centres.
Age structure. The age structure of a population is the result of past trends in fertility, mortality, and migration. In New Zealand, as in most Western nations, the peaks and troughs in fertility, especially the low birth rates of the Depression years and the post-war baby boom, have had major bearings on the age structure of the population this century. The main changes in the age structure of New Zealand's population during 1961–87 are summarised in table 5.3. The age-sex pyramid illustrates the shifts between 1971 and 1987.
Table 5.3. POPULATION AGE GROUPS
| Age group (years) | 1961 | 1976 | 1987* | 1961 | 1976 | 1987* |
|---|---|---|---|---|---|---|
| number | percent | |||||
*Estimated as at 31 March 1987. | ||||||
| Under 5 | 292,073 | 296,105 | 255,110 | 12.1 | 9.5 | 7.7 |
| 5-14 | 506,869 | 632,100 | 533,170 | 21.0 | 20.2 | 16.1 |
| 15-19 | 186,219 | 300,737 | 307,280 | 7.7 | 9.6 | 9.3 |
| 20-59 | 1,134,919 | 1,493,706 | 1,730,330 | 47.0 | 47.7 | 52.1 |
| 60-64 | 86,255 | 127,228 | 141,790 | 3.6 | 4.1 | 4.3 |
| 65 and over | 208,649 | 279,507 | 351,940 | 8.6 | 8.9 | 10.6 |
| Total | 2 414 984 | 3 129 383 | 3 319 600 | 100.0 | 100.0 | 100.0 |
The effect of low fertility and the ageing of the baby boom generations is clearly evident in the narrowing base and a slightly bulging mid-section of the pyramid. While 33.1 percent of the population was under 15 years of age in 1961, the figure had dropped to 23.7 percent in 1987. Moreover, in 1961 children under five and the retirement-age population (aged 60 years and over) made up about the same percentage (12 percent) of New Zealand population. At 31 March 1987, there were nearly twice as many people aged 60 years and over (493 730) as children under five years of age (255 110), and they accounted for 14.9 percent of the total New Zealand population. Among the elderly, the most rapidly increasing group is those aged 75 years and over. Their numbers increased by 73 percent from 79 350 in 1961 to 137 150 at 31 March 1987, and their proportion of the total New Zealand population rose from 3.3 percent to 4.1 percent over the same period. Another trend which has major socio-economic significance is the steady rise in the proportion of total population in the younger working ages, 20–44 years; from less than 32 percent in 1961 to 38 percent at 31 March 1987—a consequence of the post-World War II high birth numbers.
New Zealand's population, like those of other developed nations, is becoming steadily older. The median age—the age at which half the population is younger and half is older—has risen by 2.8 years in the last quarter century, from 27.3 years in 1961 to 30.1 years in 1987 and this continued ageing of the population has manifold implications for policy development and planning.
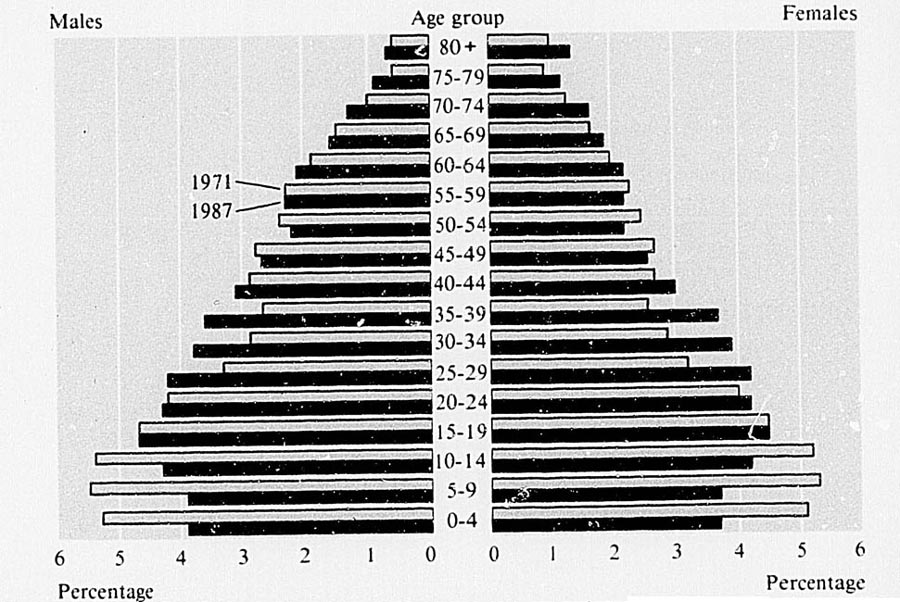
AGE PYRAMID OF POPULATION BY SEX, 1971 AND 1987
Population statistics are based primarily on the Census of Population and Dwellings, which is taken every five years by the Department of Statistics. The most recent Census of Population and Dwellings was taken on 4 March 1986. Post-censal population estimates are based on final counts from the latest census, adjusted in accordance with subsequent figures for births, deaths and migration. Population estimates for sub-national areas (e.g. boroughs, cities and counties) also take into account local economic development, building activity, primary school rolls, boundary changes and other factors leading to, or indicating, changes in population.
Population censuses, and other population statistics in New Zealand, are generally on a ‘de facto’ basis, that is they refer to the population physically present at the place of enumeration on census night. All references to New Zealand relate solely to geographic New Zealand.
The distribution of population, and changes to it, are important elements in social and economic planning. Many official publications provide benchmark information on the size and composition of sub-national populations. Detailed final statistics from the 1986 Census of Population and Dwellings have been published by the Department of Statistics in three parts. These are: Series A, Report 2, Local Authority Population and Dwelling Statistics;Series A, Report 3, Rural Population Statistics; and Series B, Report 25, Usually Resident Population. Before publication of the 1986 census subject-matter reports, a series of 22 Regional Statistics reports (Series B) were published, each giving final demographic, dwelling and other household statistics by local authority and area unit for each local government region.
Every year the Department of Statistics also derives population estimates (as at 31 March) for local authority areas (boroughs, cities, counties, etc.) and other non-administrative entities, and these are published in the Monthly Abstract of Statistics and Demographic Trends. Beginning in 1987, the department has also generated population estimates by sex and five-year age groups for local authority areas and ad hoc districts, to help planning and decision making in both the public and private sectors. The following sections describe principal trends in sub-national growth and in the geographic redistribution of population in New Zealand.
Beyond the national level, the broadest geographic division is between the North and South Islands, which are separated by the Cook Strait. In 1858, the North Island had a larger population than the South, but this was reversed at the next census, and the South Island was more populated at each census from 1861 to 1896. As the following table shows, the North Island was found to have more people in 1901, and since then its population has continued to grow at a greater rate than that of the South Island.
Many factors have contributed to this differential. The North Island has higher birth rate, lower mortality rate, and consequently, a higher rate of natural increase. Besides attracting the bulk of the overseas migrants, the North Island generally gains population from the South Island. Between the 1981 and 1986 censuses, the North Island's population increased by 5.1 percent compared with corresponding population growth in the South Island of 1.5 percent. As at 31 March 1987, the North Island had an estimated population of 2 455 500 (or 74.0 percent of the total New Zealand population) while the South Island had an estimated population of 864 100 (or 26.0 percent).
Table 5.4. POPULATION OF NORTH AND SOUTH ISLANDS
| Total population | Percentage of population | ||||
|---|---|---|---|---|---|
| Census year | North Island | South Island | Total | North Island | South Island |
| 1901 | 431,471 | 384,391 | 815,862 | 52.9 | 47.1 |
| 1911 | 610,599 | 447,713 | 1,058,312 | 57.7 | 42.3 |
| 1921 | 791,918 | 479,750 | 1,271,668 | 62.3 | 37.7 |
| 1936 | 1,018,038 | 555,774 | 1,573,812 | 64.7 | 35.3 |
| 1956 | 1,497,364 | 676,698 | 2,174,062 | 68.9 | 31.1 |
| 1966 | 1,893,326 | 783,593 | 2,676,919 | 70.7 | 29.3 |
| 1976 | 2,268,393 | 860,990 | 3,129,383 | 72.5 | 27.5 |
| 1981 | 2,322,989 | 852,748 | 3,175,737 | 73.1 | 26.9 |
| 1986 | 2,441,615 | 865,469 | 3,307,084 | 73.8 | 26.2 |
New Zealand has a mobile population, although regional population dynamics are much more complex, and therefore difficult to measure, than national demography. At the sub-national level, migration usually has a greater impact on the size, structure and geographical distribution of population than births and deaths. Because it affects both the community at origin and at destination as well as migrants themselves, internal migration also has wider social and economic implications.
Prior to 1971, no direct information on population movements within New Zealand was available except for whatever could be gleaned from small-scale local surveys. Population analysts relied mainly on demographic techniques to derive indirect estimates of net migration (both total and age-sex specific) for assessing mobility patterns. Because those estimates incorporated both the internal and external migration components and did not identify the in-migration and out-migration streams, their analytical potentials were rather limited. Since 1971, the Census of Population and Dwellings questionnaire has carried questions on the respondent's current place of residence and the place of residence at a prior date. This information provides an opportunity to determine the migration status of the respondent, by comparing his/her place of residence at the two given dates. Those whose current place of residence is different from that at the previous date are considered to be migrants. Although subject to some limitations, such an approach does provide useful data for analysing migration patterns and processes, and for studying characteristics of migrants.
Using the data collected at the 1976 and 1981 censuses, a recent Department of Statistics study analysed selected aspects of population movements in New Zealand during 1971–81. The study found that over 43 percent of New Zealanders changed their residence during the intercensal interval 1976–81. Much of this movement was local, such as moving houses within the same locality. However, a significant proportion involved movements across local authority and regional boundaries. A total of 78 369 people were found to have moved between the North Island and South Island, with 35 055 moved from the North to the South and 43 314 in the opposite direction. This resulted in a net gain to the North Island of 8259 people.
Population exchanges between the country's 22 local government regions exhibited a diversity of demographic patterns and experiences (see map). Like the North-South situation, most regional exchanges involved a two-way process. For every migration stream moving in one direction there was usually a well developed counter-stream moving in the opposite direction, so that the net gain/loss to any region was usually a small percentage of the gross interchange between the two regions involved. During 1976–81, in none of the 22 regions did net gain/loss reach 15 percent of total population exchanges (in- and out-migration combined). In at least eight regions, the figure was less than 5 percent.
A total of 371 205 people moved inter-regionally during 1976–81, that is a migration rate of 16.7 per 1000 mean population. Most migration occurred over short distances. Fifteen out of 22 regions received at least one-third of their in-migrants from, or sent their out-migrants to, the adjacent regions. The major flows over long distances were almost always between regions that contained major urban centres. In most cases population flows favoured regions to the north. Thus, Southland lost population to Otago, Otago lost to Canterbury, Canterbury lost to Wellington, and Wellington lost to Auckland. A great majority of the regions in the southern North Island also lost population to their northern neighbours.
Four North Island regions, viz., Northland, Auckland, Thames Valley and Bay of Plenty, together gained 26 424 people during 1976–81 (see table 5.5). The country's most populous region, Auckland, was the principal destination for inter-regional migrants. It alone gained 16 347 people with 70 percent of this gain being at the expense of four highly urbanised regions, Waikato, Wellington, Canterbury and Coastal-North Otago, reflecting the urban-to-urban character of population movements.
Conversely, the largest net exodus of population (9642) was from the Wellington region, which contains the country's capital and three other cities, Lower Hutt, Upper Hutt and Porirua. It is the second major destination of inter-regional migrants, but its position appears to be that of a redistribution centre: it gained population from all South Island regions, and lost to all North Island regions (except Wanganui and Wairarapa). The Canterbury region appears to perform a similar function in the South Island. However, its net gain from other South Island regions (except its northern neighbours, Marlborough and Nelson Bays), outweighed the net population loss to the North Island regions.
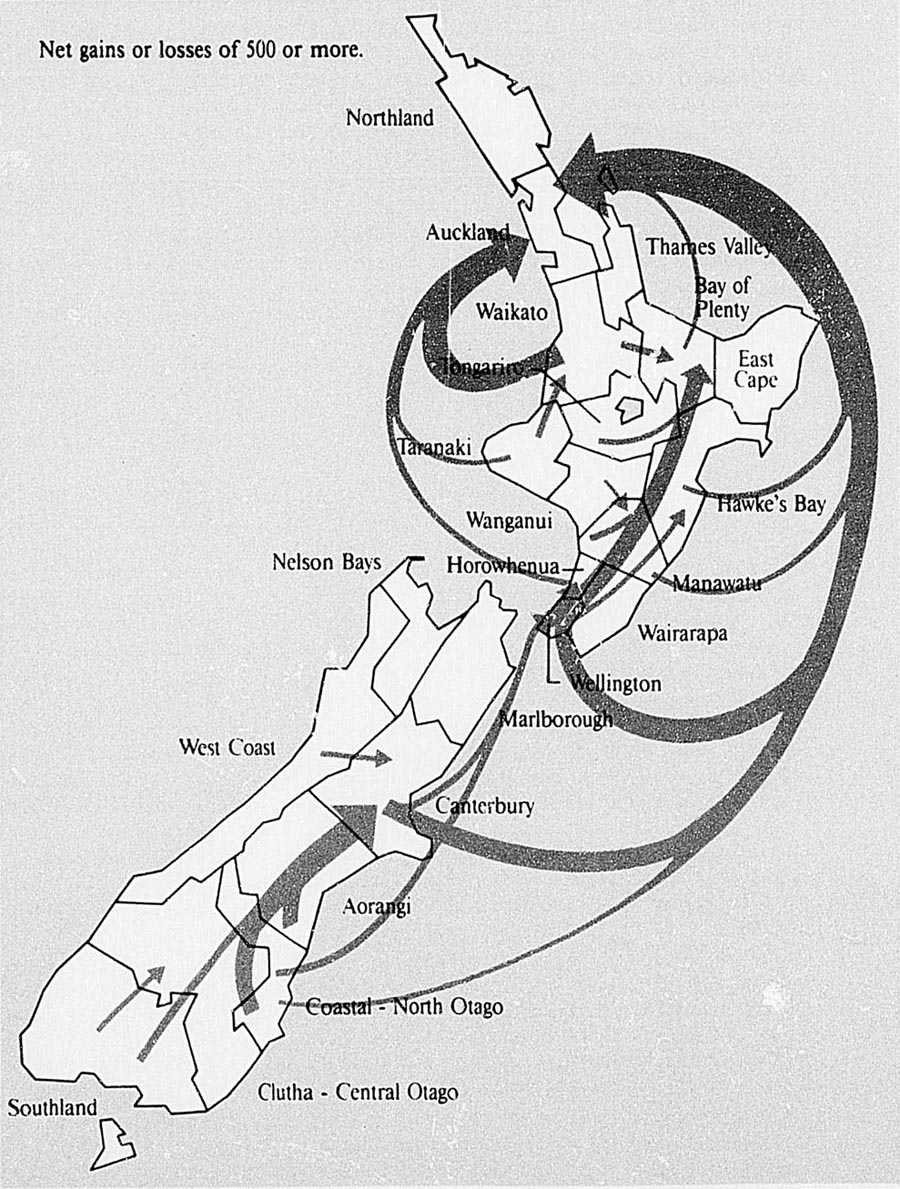
MIGRATION PATTERNS BETWEEN LOCAL GOVERNMENT REGIONS, 1976–81
The important feature of internal migration in New Zealand to emerge from the study was the slow drift of population northwards and to major urban centres. A turnaround in the traditional pattern was also observed during the early 1970s, with metropolitan areas losing population to the rural areas. While patterns in gross and net migration emerge, the underlying factors are much more difficult to determine, although economic circumstances generally play an important role in the decision to move as well as in the choice of destination.
Table 5.5. MIGRATION BETWEEN LOCAL GOVERNMENT REGIONS, 1976–1981
| Local government region | Usually resident population aged 5 years and over at 1981 census | In-migration (2) | Out-migration (3) | Gross migration (2)+(3)=(4) | Net migration (2)-(3)=(5) | Migration effectiveness ratio (5)/(4)X100 |
|---|---|---|---|---|---|---|
| Northland | 101,025 | 17,154 | 14,763 | 31,917 | 2,391 | 7.5 |
| Auckland | 760,719 | 65,454 | 49,107 | 114,561 | 16,347 | 14.3 |
| Thames Valley | 49,080 | 10,503 | 10,227 | 20,730 | 276 | 1.3 |
| Bay of Plenty | 154,821 | 29,496 | 22,086 | 51,582 | 7,410 | 14.4 |
| Waikato | 200,913 | 31,440 | 33,219 | 64,659 | -1 779 | -2.8 |
| Tongariro | 34,599 | 8,895 | 9,360 | 18,255 | -465 | -2.5 |
| East Cape | 48,462 | 6,975 | 8,247 | 15,222 | -1 272 | -8.4 |
| Hawke's Bay | 125,094 | 16,311 | 16,095 | 32,406 | 216 | 0.7 |
| Taranaki | 95,133 | 10,119 | 12,510 | 22,629 | -2 391 | -10.6 |
| Wanganui | 62,304 | 11,031 | 13,053 | 24,084 | -2 022 | -8.4 |
| Manawatu | 103,287 | 18,990 | 18,879 | 37,869 | 111 | 0.3 |
| Horowhenua | 45,789 | 9,879 | 8,808 | 18,687 | 1,077 | 5.7 |
| Wellington | 296,466 | 35,442 | 45,084 | 80,526 | -9 642 | -12.0 |
| Wairarapa | 35,841 | 5,226 | 7,350 | 12,576 | -2 124 | -16.9 |
| Nelson Bays | 59,784 | 9,552 | 7,866 | 17,418 | 1,686 | 9.7 |
| Marlborough | 32,397 | 6,273 | 5,913 | 12,186 | 366 | 3.0 |
| West Coast | 30,111 | 4,644 | 5,694 | 10,338 | -1 050 | -10.2 |
| Canterbury | 311,187 | 31,944 | 31,302 | 63,246 | 648 | 1.0 |
| Aorangi | 78,087 | 9,633 | 11,979 | 21,612 | -2 346 | -10.9 |
| Clutha-Central Otago | 38,631 | 8,421 | 7,812 | 16,233 | 609 | 3.8 |
| Coastal-North Otago | 126,513 | 14,514 | 18,936 | 33,450 | -4 422 | -13.2 |
| Southland | 97,335 | 9,378 | 12,960 | 22,338 | -3 582 | -16.0 |
Local government regions were constituted under the Local Government Act of 1974, and their mandatory functions are regional planning and civil defence. There are currently 22 regions (14 in the North Island), covering every territorial local authority area in New Zealand, except the counties Great Barrier Island and Chatham Islands. Demographically, the regions differ significantly in terms of their population size and composition, fertility levels, net migration patterns, as well as the degree of urbanisation. Some regions, notably East Cape, Wairarapa, West Coast and those in the southern part of the South Island, have a history of net outward migration and slow population growth. Conversely, regions comprising major urban centres have traditionally benefited from the general south to north, and rural to urban, drift of population.
Table 5.6 gives the total population of the 22 local government regions as enumerated at the 1981 and 1986 censuses and estimated at 31 March 1987. At the regional level, most population growth has been concentrated in the Northland, Auckland, Waikato, Bay of Plenty and Canterbury regions. With the exception of Canterbury, all these regions are located in the northern half of the North Island. The Auckland region alone grew by 70000 during 1981–87 and at 31 March 1987 it contained 897 400 people, i.e., 33 300 more than the whole of the South Island.
Table 5.6. POPULATION OF LOCAL GOVERNMENT REGIONS
| Local government region | Total population | Estimated population at 31 March 1987 | Percentage change 1981–87 | |
|---|---|---|---|---|
| 1981 census | 1986 census | |||
*Includes the populations of islands not within county, city or borough boundaries and people on board vessels in New Zealand waters. Also includes the populations of Great Barrier Island and Chatham Islands Counties. | ||||
| Auckland | 827,408 | 887,448 | 897,400 | 8.5 |
| Canterbury | 336,846 | 348,712 | 348,700 | 3.5 |
| Wellington | 323,162 | 328,163 | 326,900 | 1.2 |
| Waikato | 221,850 | 228,303 | 229,300 | 3.4 |
| Bay of Plenty | 172,480 | 187,462 | 189,600 | 9.9 |
| Hawke's Bay | 137,840 | 140,709 | 140,900 | 2.2 |
| Coastal-North Otago | 138,164 | 137,393 | 137,000 | -0.8 |
| Northland | 113,994 | 126,999 | 127,200 | 11.6 |
| Manawatu | 113,238 | 115,500 | 115,800 | 2.3 |
| Taranaki | 103,798 | 107,600 | 107,700 | 3.8 |
| Southland | 107,905 | 104,618 | 103,700 | -3.9 |
| Aorangi | 84,772 | 81,294 | 80,600 | -4.9 |
| Nelson Bays | 65,934 | 69,648 | 70,300 | 6.6 |
| Wanganui | 68,702 | 69,439 | 69,300 | 0.9 |
| Thames Valley | 54,343 | 58,665 | 59,300 | 9.1 |
| Horowhenua | 49,296 | 53,592 | 54,400 | 10.4 |
| East Cape | 53,295 | 53,968 | 53,700 | 0.8 |
| Clutha-Central Otago | 45,402 | 48,771 | 49,000 | 7.9 |
| Tongariro | 40,089 | 40,793 | 41,000 | 2.3 |
| Wairarapa | 39,689 | 39,608 | 39,600 | -0.2 |
| Marlborough | 37,557 | 38,225 | 37,800 | 0.6 |
| West Coast | 34,178 | 34,942 | 35,100 | 2.7 |
| Total, local government regions | 3,169,942 | 3,301,852 | 3,314,300 | 4.6 |
| Remainder* | 5,795 | 5,232 | 5,300 | -8.5 |
| Total, New Zealand | 3 175 737 | 3 307 084 | 3 319 600 | 4.5 |
‘Urban areas’ are statistical concepts covering areas of unified community, economic and social interests. In addition to the central city or borough, urban areas include neighbouring boroughs and town districts, and parts of counties which are regarded as suburban to the centre of population. Minor adjustments of main urban area boundaries have been made because of peripheral population growth in some of these areas since the boundaries were fixed at the 1971 census.
The population criterion for a ‘main urban area’ is 30 000 or more, although Timaru is classified as a main urban area because it displays the other characteristics of such an area. At 31 March 1987 there were 17 main urban areas, with the two largest urban centres—Auckland and Wellington—being subdivided into four zones (see table 5.7). Before 1981 these zones were classified independently as ‘main urban areas’.
The intercensal rate of growth of the 17 main urban areas for 1981–86 was 4.2 percent, or approximately three times greater than that recorded for the 1976–81 period. The wide range of intercensal change experienced by the main urban areas reflects their different demographic, economic and social characteristics.
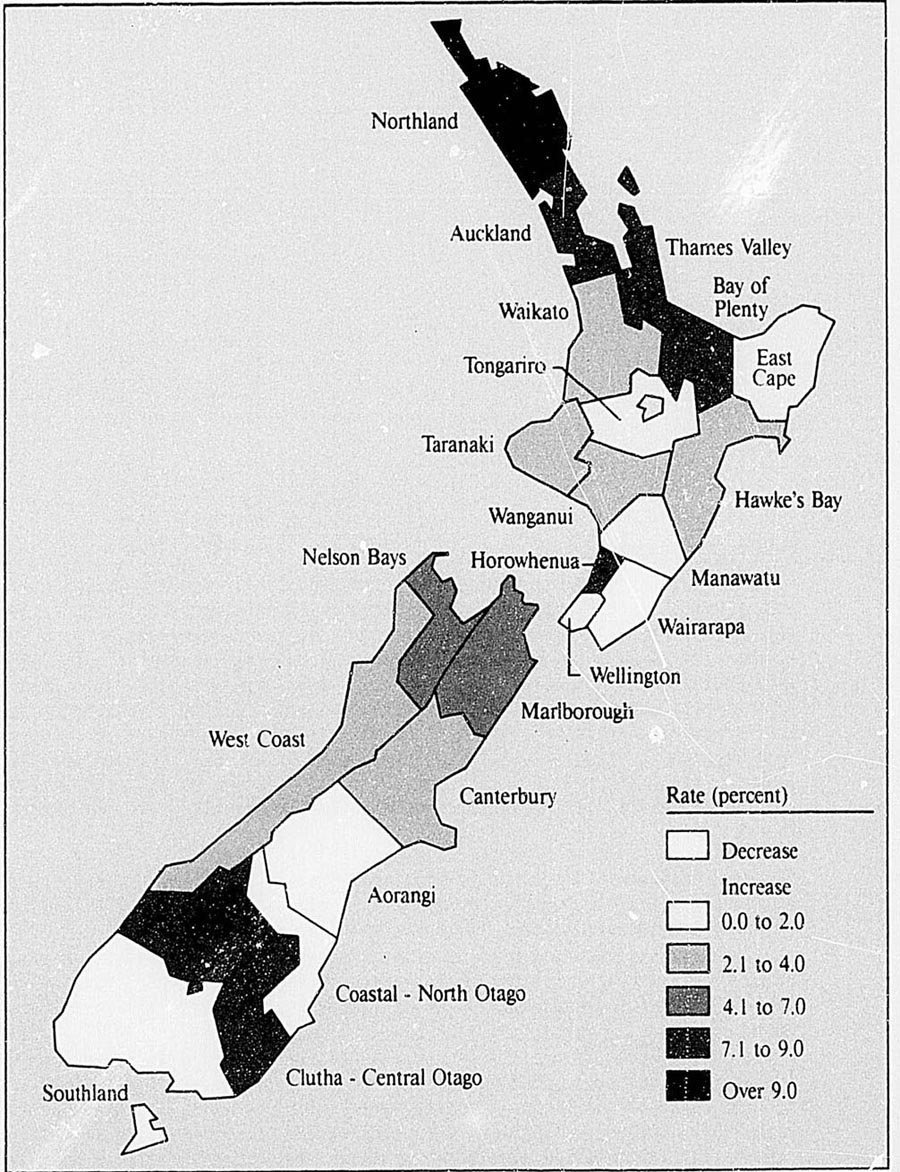
RATE OF CHANGE IN TOTAL POPULATION 1981–1986
Table 5.7. POPULATION OF MAIN URBAN AREAS
| Main urban area | Total population | Estimated population at 31 March 1987 | Percentage change 1981–87 | |
|---|---|---|---|---|
| 1981 census | 1986 census | |||
| Auckland | 769,558 | 820,754 | 829,200 | 7.8 |
| Northern Auckland Zone | 149,321 | 162,614 | 164,400 | 10.1 |
| Western Auckland Zone | 116,407 | 125,282 | 127,600 | 9.6 |
| Central Auckland Zone | 275,914 | 285,097 | 285,400 | 3.4 |
| Southern Auckland Zone | 227,916 | 247,761 | 251800 | 10.5 |
| Wellington | 321,004 | 325,697 | 324,400 | 1.1 |
| Upper Hutt Valley Zone | 36,525 | 36,046 | 35,900 | -1.7 |
| Lower Hutt Valley Zone | 94,732 | 94,877 | 94,600 | -0.1 |
| Porirua Basin Zone | 54,653 | 57,863 | 58,500 | 7.0 |
| Wellington City Zone | 135,094 | 136,911 | 135,400 | 0.2 |
| Christchurch | 289,959 | 299,373 | 299,400 | 3.3 |
| Dunedin | 107,445 | 106,864 | 106,600 | -0.8 |
| Hamilton | 97,907 | 101,814 | 102,600 | 4.8 |
| Palmerston North | 66,691 | 67,405 | 67,500 | 1.2 |
| Tauranga | 53,097 | 59,435 | 60,500 | 13.9 |
| Hastings | 52,563 | 54,909 | 55,200 | 5.0 |
| Invercargill | 53,868 | 52,807 | 52,400 | -2.7 |
| Rotorua | 48,314 | 52,001 | 52,200 | 8.0 |
| Napier | 51,330 | 52,151 | 52,100 | 1.5 |
| New Plymouth | 44,095 | 47,384 | 47,400 | 7.5 |
| Nelson | 43,121 | 44,593 | 44,900 | 4.1 |
| Whangarei | 40,212 | 44,043 | 43,600 | 8.4 |
| Wanganui | 39,595 | 40,758 | 40,900 | 3.3 |
| Gisborne | 32,062 | 32,238 | 32,000 | -0.2 |
| Timaru | 29,225 | 28,621 | 28,500 | -2.5 |
| Total, main urban areas | 2 140 046 | 2 230 847 | 2 239 400 | 4.6 |
Those areas with ‘young’ population age structures and a significant New Zealand Maori and/or Pacific Island Polynesian content in their populations tended to be the fastest growing during the 1981–86 intercensal period. Most of these main areas are located in the northern half of the North Island. Also contributing to population increase in the high-growth areas are the greater economic opportunities existing in them and/or their special importance as tourist centres (Rotorua) and retirement areas (Tauranga). While the Auckland main urban area recorded the largest numeric increase (51 196) between the 1981 and 1986 censuses, Tauranga recorded the highest percentage increase (11.9 percent). The impact of energy projects in Northland and Taranaki could also be seen in the growth recorded in Whangarei (9.5 percent) and New Plymouth (7.5 percent) during the intercensal period.
The criteria for secondary urban areas are similar to those for main urban areas, except that their populations should be between 10 000 and 29 999. Fourteen secondary urban areas have been defined (see table 5.8)
The total population of secondary urban areas is increasing, but not as rapidly as main urban areas. The intercensal rate of growth of secondary urban areas was 2.5 percent for 1981–86, which was approximately twice the rate recorded for the 1976–81 intercensal period.
There was a wide range of percentage changes in the populations of these areas during the 1981–86 intercensai period reflecting their different demographic composition and location. Servicing centres for the farming community tended to lose population because of the rural economic downturn. Other secondary urban areas increased their populations due to their close vicinity to main urban areas, growth in tourism, and the development of intensive horticulture, other primary, and some manufacturing industries. Kapiti, Taupo, and Levin experienced significant rates of population increase, whereas Tokoroa, Greymouth, and Gore experienced an increase in the rate of decline in their populations.
Table 5.8. POPULATION OF SECONDARY URBAN AREAS
| Secondary urban area | Total population | Estimated population at 31 March 1987 | Percentage change 1981–87 | |
|---|---|---|---|---|
| 1981 census | 1986 census | |||
| Kapiti | 20,083 | 23,203 | 23,900 | 19.0 |
| Blenheim | 22,104 | 22,681 | 22,700 | 2.7 |
| Masterton | 20,422 | 20,145 | 20,100 | -1.6 |
| Levin | 18,070 | 18,962 | 19,050 | 5.4 |
| Tokoroa | 19,333 | 18,193 | 17,950 | -7.2 |
| Taupo | 15,356 | 17,458 | 17,700 | 15.3 |
| Whakatane | 15,159 | 15,954 | 16,150 | 6.5 |
| Ashburton | 15,303 | 15,229 | 15,200 | -0.7 |
| Oamaru | 14,664 | 14,247 | 14,150 | -3.5 |
| Pukekohe | 13,292 | 13,823 | 13,900 | 4.6 |
| Feilding | 12,203 | 12,802 | 12,900 | 5.7 |
| Hawera | 11,344 | 11,375 | 11,350 | 0.1 |
| Greymouth | 11,604 | 11,261 | 11,200 | -3.5 |
| Gore | 12,061 | 11,249 | 11,100 | -8.0 |
| Total, secondary urban areas | 220 998 | 226 582 | 227 200 | 2.8 |
These consist of all centres with a population of more than 1000 which are not already classified as part of a main or secondary urban area. They include communities, district communities, town districts, townships, and the urban divisions of districts. With the exception of ‘townships’, the other areas have administrative functions and are defined in the next section. The population of all minor urban areas increased from 296 805 at the 1981 census to 311 332 at the 1986 census, a growth of 4.9 percent, compared with 3.2 percent during the 1976–81 intercensal period.
The rural areas of New Zealand are those which are not specifically designated as urban. They include centres of less than 1000 population plus administrative county territory where this is not included in a main, secondary or minor urban area. Extra-county islands are included in the rural population.
New Zealand's rural population increased by 4.2 percent between the 1981 and 1986 censuses, a significantly higher growth than the 1.6 percent experienced during the 1976–81 intercensal period and indicating that the trend towards rural population, which first appeared between 1976 and 1981, is continuing.
Table 5.9. URBAN-RURAL POPULATION
| Area type | Total population | Estimated population at 31 March 1987* | Percentage change 1981–87 | |
|---|---|---|---|---|
| 1981 census | 1986 census | |||
*While estimates are given at 31 March 1987, they relate to local authority boundaries existing at 1 April 1987. | ||||
| Main urban areas | 2,140,046 | 2,230,847 | 2,239,400 | 4.6 |
| Secondary urban areas | 220,998 | 226,582 | 227,200 | 2.8 |
| Minor urban areas | 296,805 | 311,332 | 312,500 | 5.3 |
| Total, urban areas | 2 657 849 | 2 768 761 | 2 779 100 | 4.6 |
| Rural areas | 513,542 | 534,950 | 537,100 | 4.6 |
| Shipboard | 4,346 | 3,373 | 3,370 | |
| Total, New Zealand | 3 175 737 | 3 307 084 | 3 319 600 | 4.5 |
Local authorities include cities, boroughs, counties, districts, and town districts. These are legally and geographically defined administrative territories whose status is decided upon from population size and other criteria. Current definitions are given in section 3.4, Local government.
In terms of percentage changes during the intercensal period 1981–86, the populations of individual areas within the various categories of local authorities showed a wide variation. Whether a local authority increased or declined between the 1981 and 1986 censuses was dependent on its location, its demographic composition, and economic situation.
Generally, those cities experiencing high population growth were in the northern half of the North Island for the reasons given previously. Cities showing intercensal declines in population were, for the most part, those with net internal outward migration caused by narrow economic bases. Also, the cities which have traditionally formed the central business districts of the largest urban areas experienced little or no growth.
A territorial local authority with a population of 20 000 may proclaim itself a city.
Table 5.10. POPULATION OF CITIES
| City | Total population | Estimated population at 31 March 1987* | Percentage change 1981–87 | |
|---|---|---|---|---|
| 1981 census | 1986 census | |||
*Relate to local authority boundaries existing at 1 April 1987. | ||||
| Manukau | 159,362 | 177,248 | 181,000 | 13.6 |
| Christchurch | 164,739 | 168,200 | 167,700 | 1.8 |
| Auckland | 144,963 | 149,046 | 148,400 | 2.4 |
| Wellington | 135,688 | 137,495 | 136,000 | 0.2 |
| Waitemata | 87,452 | 96,365 | 98,500 | 12.6 |
| Hamilton | 91,109 | 94,511 | 95,300 | 4.6 |
| Dunedin | 77,176 | 76,964 | 76,800 | -0.5 |
| Takapuna | 65,353 | 69,419 | 70,000 | 7.1 |
| Lower Hutt | 63,245 | 63,862 | 63,700 | 0.7 |
| Palmerston North | 60,105 | 60,503 | 60,600 | 0.8 |
| Napier | 48,725 | 49,428 | 49,400 | 1.4 |
| Invercargill | 49,446 | 48,197 | 47,800 | -3.3 |
| New Plymouth | 41,812 | 44,464 | 44,500 | 6.4 |
| Porirua | 41,104 | 43,213 | 43,600 | 6.1 |
| Tauranga | 37,114 | 41,621 | 42,400 | 14.2 |
| Whangarei | 36,550 | 40,179 | 39,800 | 8.9 |
| Wanganui | 37,012 | 38,084 | 38,200 | 3.2 |
| Hastings | 36,083 | 37,658 | 37,900 | 5.0 |
| Nelson | 33,304 | 34,274 | 34,500 | 3.6 |
| Tamaki | 29,826 | 31,399 | 31,700 | 6.3 |
| East Coast Bays | 28,357 | 31,325 | 31,600 | 11.4 |
| Upper Hutt | 31,405 | 31,130 | 31,000 | -1.3 |
| Gisborne | 29,986 | 30,020 | 29,800 | -0.6 |
| Mt Albert | 26,462 | 27,579 | 27,800 | 5.1 |
| Timaru | 28,412 | 27,757 | 27,700 | -2.5 |
| Papakura | 22,473 | 23,357 | 23,600 | 5.0 |
| Birkenhead | 21,324 | 22,582 | 22,800 | 6.9 |
| Papatoetoe | 21,700 | 21,883 | 21,900 | 0.9 |
| Total, cities | 1 650 287 | 1 717 763 | 1 723 300 | 4.4 |
Similar comments to those on population changes in cities apply to boroughs. Population change is related to demographic factors, location, and the major economic role of boroughs e.g., the servicing of farming areas, tourist centres, or retirement areas.
Table 5.11. POPULATION OF BOROUGHS
| Borough | Total population | Estimated population at 31 March 1987* | Percentage change 1981–87 | |
|---|---|---|---|---|
| 1981 census | 1986 census | |||
*Relate to local authority boundaries existing at 1 April 1987. | ||||
| Mt Roskill | 33,577 | 35,158 | 35,400 | 5.4 |
| Mt Eden | 18,305 | 18,877 | 19,000 | 3.8 |
| Masterton | 18,785 | 18,511 | 18,450 | -1.8 |
| Blenheim | 17,849 | 18,308 | 18,400 | 3.1 |
| Kapiti | 15,423 | 17,357 | 17,800 | 15.4 |
| Tokoroa | 18,713 | 17,628 | 17,400 | -7.0 |
| Onehunga | 15,386 | 16,097 | 16,200 | 5.3 |
| Taupo | 13,936 | 15,873 | 16,100 | 15.5 |
| Levin | 14,652 | 15,368 | 15,450 | 5.4 |
| Ashburton | 14,151 | 14,030 | 14,000 | -1.1 |
| Howick | 13,866 | 13,891 | 13,900 | 0.2 |
| Oamaru | 13,043 | 12,652 | 12,550 | -3.8 |
| Mt Maunganui | 11,391 | 12,375 | 12,450 | 9.3 |
| Tawa | 12,216 | 12,251 | 12,300 | 0.7 |
| Feilding | 11,522 | 12,116 | 12,200 | 5.9 |
| One Tree Hill | 11,078 | 11,165 | 11,200 | 1.1 |
| Devonport | 10,410 | 10,543 | 10,550 | 1.3 |
| New Lynn | 10,445 | 10,498 | 10,500 | 0.5 |
| Cambridge | 8,514 | 10,145 | 10,350 | 21.6 |
| Northcote | 10,061 | 10,282 | 10,300 | 2.4 |
| Glen Eden | 9,406 | 9,679 | 9,730 | 3.4 |
| Pukekohe | 9,070 | 9,398 | 9,430 | 4.0 |
| Havelock North | 8,507 | 9,036 | 9,070 | 6.6 |
| Mosgiel | 9,264 | 9,063 | 9,040 | -2.4 |
| Gore | 9,185 | 8,594 | 8,490 | -7.6 |
| Petone | 8,113 | 8,216 | 8,220 | 1.3 |
| Kawerau | 8,593 | 8,311 | 8,210 | -4.5 |
| Te Awamutu | 7,922 | 8,096 | 8,140 | 2.8 |
| Greymouth | 8,103 | 7,624 | 7,530 | -7.1 |
| Richmond | 6,847 | 7,204 | 7,280 | 6.3 |
| Riccarton | 6,650 | 7,226 | 7,230 | 8.7 |
| Huntly | 6,534 | 6,750 | 6,800 | 4.1 |
| Henderson | 6,645 | 6,644 | 6,600 | -0.7 |
| Green Island | 6,899 | 6,576 | 6,530 | -5.3 |
| Taumarunui | 6,541 | 6,387 | 6,390 | -2.3 |
| St. Kilda | 6,147 | 6,201 | 6,200 | 0.9 |
| Dannevirke | 5,663 | 5,873 | 5,900 | 4.2 |
| Matamata | 5,266 | 5,701 | 5,760 | 9.4 |
| Ellerslie | 5,404 | 5,681 | 5,730 | 6.0 |
| Stratford | 5,518 | 5,528 | 5,540 | 0.4 |
| Morrinsville | 5,080 | 5,281 | 5,320 | 4.7 |
| Kaiapol | 4,931 | 5,234 | 5,290 | 7.3 |
| Te Puke | 4,583 | 5,112 | 5,200 | 13.5 |
| Motueka | 4,693 | 5,052 | 5,130 | 9.3 |
| Marton | 4,858 | 5,059 | 5,080 | 4.6 |
| Kaitaia | 4,737 | 5,011 | 5,070 | 7.0 |
| Alexandra | 4,348 | 4,842 | 4,940 | 13.6 |
| Dargaville | 4,747 | 4,859 | 4,880 | 2.8 |
| Westport | 4,686 | 4,660 | 4,660 | -0.6 |
| Ngaruawahia | 4,435 | 4,639 | 4,590 | 3.5 |
| Eastbourne | 4,561 | 4,494 | 4,500 | -1.3 |
| Otaki | 4,301 | 4,407 | 4,410 | 2.5 |
| Waiuku | 3,654 | 4,357 | 4,360 | 19.3 |
| Putaruru | 4,222 | 4,197 | 4,190 | -0.8 |
| Balclutha | 4,495 | 4,227 | 4,170 | -7.2 |
| Picton | 3,633 | 4,129 | 4,160 | 14.5 |
| Temuka | 3,771 | 3,919 | 3,940 | 4.5 |
| Carterton | 3,971 | 3,902 | 3,900 | -1.8 |
| Kaikohe | 3,663 | 3,799 | 3,830 | 4.6 |
| Waihi | 3,538 | 3,679 | 3,680 | 4.0 |
| Paeroa | 3,702 | 3,661 | 3,670 | -0.9 |
| Cromwell | 2,364 | 3,536 | 3,670 | 55.2 |
| Te Aroha | 3,418 | 3,510 | 3,540 | 3.6 |
| Hokitika | 3,414 | 3,427 | 3,420 | 0.2 |
| Waimate | 3,393 | 3,250 | 3,240 | -4.5 |
| Lyttelton | 3,184 | 3,200 | 3,190 | 0.2 |
| Port Chalmers | 2,917 | 2,871 | 2,870 | -1.6 |
| Foxton | 2,719 | 2,729 | 2,730 | 0.4 |
| Pahiatua | 2,599 | 2,681 | 2,690 | 3.5 |
| Featherston | 2,458 | 2,516 | 2,540 | 3.3 |
| Bluff | 2,720 | 2,537 | 2,490 | -8.5 |
| Murupara | 3,063 | 2,566 | 2,470 | -19.4 |
| Taihape | 2,586 | 2,472 | 2,420 | -6.4 |
| Tuakau | 1,982 | 2,195 | 2,230 | 12.5 |
| Geraldine | 2,128 | 2,143 | 2,140 | 0.6 |
| Winton | 2,035 | 2,082 | 2,090 | 2.7 |
| Mataura | 2,345 | 2,102 | 2,060 | -12.2 |
| Greytown | 1,797 | 1,888 | 1,900 | 5.7 |
| Woodville | 1,647 | 1,582 | 1,570 | -4.7 |
| Ohakune | 1,481 | 1,496 | 1,500 | 1.3 |
| Martinborough | 1,347 | 1,379 | 1,390 | 3.2 |
| Helensville | 1,360 | 1,347 | 1,340 | -1.5 |
| Runanga | 1,264 | 1,337 | 1,340 | 6.0 |
| Raetihi | 1,247 | 1,323 | 1,340 | 7.5 |
| Newmarket | 1,211 | 1,097 | 1,080 | -10.8 |
| Arrowtown | 540 | 953 | 1,010 | 87.0 |
| Tapanui | 1,042 | 924 | 900 | -13.6 |
| Roxburgh | 758 | 721 | 710 | -6.3 |
| Lawrence | 600 | 552 | 550 | -8.3 |
| Naseby | 152 | 133 | 140 | -7.9 |
| Total, boroughs | 587 710 | 603 982 | 605 700 | 3.1 |
A county is a legally and geographically defined area which excludes any town districts, boroughs or cities that are located within the overall geographic area.
The high growth counties tend to be situated either on the peripherals of main or secondary urban areas, more especially in the northern part of the North Island. Alternatively, they can be achieving economic progress through the introduction of horticulture of other primary industries, and the expansion of tourism.
Table 5.12. POPULATION OF COUNTIES
| Administrative county | Total population | Estimated population at 31 March 1987* | Percentage change 1981–87 | |
|---|---|---|---|---|
| 1981 census | 1986 census | |||
*Relate to local authority boundaries existing at 1 April 1987. † At the 1981 Census of Population and Dwellings, 1385 Army personnel were temporarily based in Marlborough County on Armed Forces exercises. A large number of these persons were from Burnham Military Camp (Malvern County). | ||||
| Rodney | 35,696 | 43,976 | 45,700 | 28.0 |
| Paparua | 31,836 | 33,406 | 33,700 | 5.9 |
| Hutt | 26,830 | 27,502 | 27,700 | 3.2 |
| Tauranga | 21,572 | 26,018 | 26,900 | 24.7 |
| Southland | 26,785 | 25,724 | 25,500 | -4.8 |
| Franklin | 18,902 | 21,249 | 21,600 | 14.3 |
| Whangarei | 16,997 | 20,765 | 20,900 | 23.0 |
| Hawke's Bay | 20,302 | 20,731 | 20,800 | 2.5 |
| Bay of Islands | 18,961 | 20,745 | 20,600 | 8.6 |
| Waimea | 16,878 | 18,471 | 18,750 | 11.1 |
| Waikato | 16,821 | 17,223 | 17,300 | 2.8 |
| Waipa | 15,950 | 16,669 | 16,800 | 5.3 |
| Horowhenua | 14,920 | 16,460 | 16,750 | 12.3 |
| Wallace | 14,789 | 14,840 | 14,750 | -0.3 |
| Rangitikei | 13,951 | 13,494 | 13,300 | -4.7 |
| Matamata | 12,338 | 12,575 | 12,600 | 2.1 |
| Taupo | 13,631 | 12,480 | 12,600 | -7.6 |
| Silverpeaks | 12,262 | 12,545 | 12,550 | 2.3 |
| Marlborough† | 12,489 | 12,161 | 11,600 | -7.1 |
| Ashburton | 10,774 | 10,825 | 10,800 | 0.2 |
| Raglan | 9,776 | 10,363 | 10,500 | 7.4 |
| Mangonui | 8,485 | 9,920 | 10,200 | 20.2 |
| Piako | 10,332 | 10,137 | 10,100 | -2.2 |
| Strathallan | 9,371 | 9,520 | 9,520 | 1.6 |
| Heathcote | 8,778 | 9,320 | 9,400 | 7.1 |
| Ellesmere | 8,676 | 8,994 | 9,050 | 4.3 |
| Waitaki | 8,739 | 8,862 | 8,870 | 1.5 |
| Cook | 8,398 | 8,249 | 8,210 | -2.2 |
| Manawatu | 6,710 | 7,409 | 7,570 | 12.8 |
| Otamatea | 6,371 | 6,805 | 6,840 | 7.4 |
| Hurunui | 6,559 | 6,539 | 6,520 | -0.6 |
| Kairanga | 6,385 | 6,468 | 6,460 | 1.2 |
| Malvern | 6,242 | 6,600 | 6,230 | -0.2 |
| Westland | 5,750 | 6,091 | 6,140 | 6.8 |
| Oroua | 5,485 | 5,960 | 6,040 | 10.1 |
| Taumarunui | 5,981 | 6,053 | 5,960 | -0.4 |
| Ohinemuri | 4,941 | 5,579 | 5,700 | 15.4 |
| Hokianga | 4,626 | 5,568 | 5,700 | 23.2 |
| Hobson | 5,317 | 5,491 | 5,520 | 3.8 |
| Grey | 4,955 | 5,349 | 5,460 | 10.2 |
| Waiheke | 3,678 | 5,111 | 5,410 | 47.1 |
| Egrnont | 5,340 | 5,183 | 5,120 | -4.1 |
| Hauraki Plains | 5,157 | 5,102 | 5,100 | -1.1 |
| Vincent | 4,293 | 4,992 | 5,060 | 17.9 |
| Clutha | 5,597 | 5,061 | 4,960 | -11.4 |
| Waimate | 5,069 | 4,984 | 4,940 | -2.5 |
| Golden Bay | 4,212 | 4,647 | 4,740 | 12.5 |
| Waiapu | 4,687 | 4,628 | 4,580 | -2.3 |
| Stratford | 4,641 | 4,558 | 4,560 | -1.7 |
| Mackenzie | 7,703 | 4,866 | 4,380 | -43.1 |
| Dannevirke | 4,385 | 4,315 | 4,280 | -2.4 |
| Buller | 3,788 | 4,146 | 4,210 | 11.1 |
| Masterton | 4,099 | 4,066 | 4,050 | -1.2 |
| Kaikoura | 3,586 | 3,627 | 3,650 | 1.8 |
| Tuapeka | 3,845 | 3,588 | 3,510 | -8.7 |
| Amuri | 3,060 | 3,252 | 3,270 | 6.9 |
| Eyre | 3,260 | 3,218 | 3,220 | -1.2 |
| Waitotara | 2,909 | 3,032 | 3,070 | 5.5 |
| Wanganui | 3,205 | 3,046 | 3,020 | -5.8 |
| Featherston | 2,848 | 2,964 | 2,970 | 4.3 |
| Waikohu | 2,960 | 2,861 | 2,820 | -4.7 |
| Whangaroa | 2,243 | 2,523 | 2,570 | 14.6 |
| Wairarapa South | 2,477 | 2,434 | 2,430 | -1.9 |
| Clifton | 2,146 | 2,393 | 2,430 | 13.2 |
| Inangahua | 2,218 | 2,308 | 2,320 | 4.6 |
| Maniototo | 2,430 | 2,248 | 2,180 | -10.3 |
| Akaroa | 1,783 | 2,010 | 2,060 | 15.5 |
| Pahiatua | 2,119 | 2,009 | 1,980 | -6.6 |
| Eketahuna | 1,907 | 1,948 | 1,970 | 3.3 |
| Oxford | 1,771 | 1,912 | 1,940 | 9.5 |
| Waimate West | 1,944 | 1,862 | 1,840 | -5.3 |
| Waihemo | 1,717 | 1,659 | 1,650 | -3.9 |
| Kiwitea | 1,707 | 1,600 | 1,570 | -8.0 |
| Waimarino | 1,453 | 1,433 | 1,430 | -1.6 |
| Cheviot | 1,514 | 1,384 | 1,360 | -10.2 |
| Woodville | 1,314 | 1,285 | 1,300 | -1.1 |
| Mount Herbert | 1,036 | 1,145 | 1,170 | 12.9 |
| Pohangina | 878 | 970 | 980 | 11.6 |
| Great Barrier Island | 572 | 858 | 910 | 59.1 |
| Chatham Islands | 751 | 775 | 780 | 3.9 |
| Wairewa | 638 | 656 | 660 | 3.4 |
| Stewart Island | 660 | 542 | 540 | -10.0 |
| Total, counties | 636 101 | 668 337 | 671 900 | 5.6 |
A district is a territorial local authority that is neither wholly urban nor wholly rural and has been re-designated by the Local Government Commission as a district. By 31 March 1987, 17 districts had been constituted.
Districts are to varying degrees both urban and rural in nature, and this tended to have a marked influence on their intercensal population changes both positive and negative during 1981–86. Those that form part of, or are in close proximity to, main or secondary urban areas, have generally achieved significant positive growth during the intercensal period, e.g., Rotorua, Waimairi and Rangiora. In contrast, those of a more rural nature, such as Hawera, Waitomo and Waipawa have undergone population decline or small increases over the period.
Table 5.13. POPULATION OF DISTRICTS
| District | Total population | Estimated population at 31 March 1987* | Percentage change 1981–87 | |
|---|---|---|---|---|
| 1981 census | 1986 census | |||
*Relate to local authority boundaries existing at 1 April 1987. | ||||
| Waimairi | 70,413 | 73,282 | 73,500 | 4.4 |
| Rotorua | 58,540 | 62,930 | 63,300 | 8.1 |
| Urban | 47,975 | 51,602 | 51,800 | 8.0 |
| Rural | 10,565 | 11,328 | 11,450 | 8.4 |
| Whakatane | 27,624 | 28,529 | 28,700 | 3.9 |
| Thames-Coromandel | 18,175 | 21,716 | 22,200 | 22.1 |
| Coromandel | 5,526 | 7,216 | 7,420 | 34.3 |
| Thames | 12,649 | 14,500 | 14,800 | 17.0 |
| North Taranaki | 12,444 | 13,948 | 14,200 | 14.1 |
| Rangiora | 11,776 | 13,134 | 13,350 | 13.4 |
| Hawera | 12,884 | 12 | 12,750 | -1.0 |
| Queenstown-Lakes | 8,389 | 10,669 | 10,950 | 30.5 |
| Wairoa | 11,238 | 10,680 | 10,600 | -5.7 |
| Waitomo | 10,892 | 10,524 | 10,450 | -4.1 |
| Urban | 4,795 | 4,787 | 4,770 | -0.5 |
| Rural | 6,097 | 5,737 | 5,660 | -7.2 |
| Otorohanga | 9,358 | 9,282 | 9,250 | -1.2 |
| Waipukurau | 7,905 | 7,927 | 7,900 | -0.1 |
| Opotiki | 7,264 | 8,210 | 8,380 | 15.4 |
| Inglewood | 5,583 | 6,233 | 6,300 | 12.8 |
| Bruce | 6,549 | 6,325 | 6,280 | -4.1 |
| Waipawa | 5,080 | 5,249 | 5,280 | 3.9 |
| Eltham | 4,901 | 4,857 | 4,860 | -0.8 |
| Patea | 5,593 | 4,761 | 4,610 | -17.6 |
| Total, districts | 294 608 | 311 053 | 312 800 | 6.2 |
The last year in which New Zealand's population increased through external migration was 1984.
Total migration figures (excluding only movements of armed forces) are shown in tables 5.15 and 5.16 ‘Long-term’ indicates arrivals or departures for an intended stay of 12 months or more. Conversely, ‘short-term’ refers to less than 12 months. A minus sign in migration tables denotes an excess of departures over arrivals.
Table 5.15. ARRIVALS IN NEW ZEALAND
| Short-term movements | ||||
|---|---|---|---|---|
| Year ended 31 March | Long-term (including permanent) arrivals | N.Z. residents returning | Temporary visitors arriving | All passenger arrivals |
| 1983 | 45,854 | 381,951 | 487,658 | 915,463 |
| 1984 | 40,705 | 363,722 | 518,441 | 922,868 |
| 1985 | 36,243 | 383,974 | 596,995 | 1,017,212 |
| 1986 | 35,982 | 386,871 | 689,073 | 1,111,926 |
| 1987 | 44,360 | 514,160 | 763,209 | 1,321,729 |
Table 5.16. DEPARTURES FROM NEW ZEALAND
| Short-term movements | ||||
|---|---|---|---|---|
| Year ended 31 March | Long-term (including permanent) arrivals | N.Z. residents returning | Temporary visitors arriving | All passenger departures |
| 1983 | 42,674 | 373,193 | 484,154 | 900,021 |
| 1984 | 34,147 | 361,662 | 516,502 | 912,311 |
| 1985 | 44,327 | 382,316 | 590,352 | 1,016,995 |
| 1986 | 57,595 | 389,937 | 682,912 | 1,130,444 |
| 1987 | 58,629 | 514,978 | 743,765 | 1,317,372 |
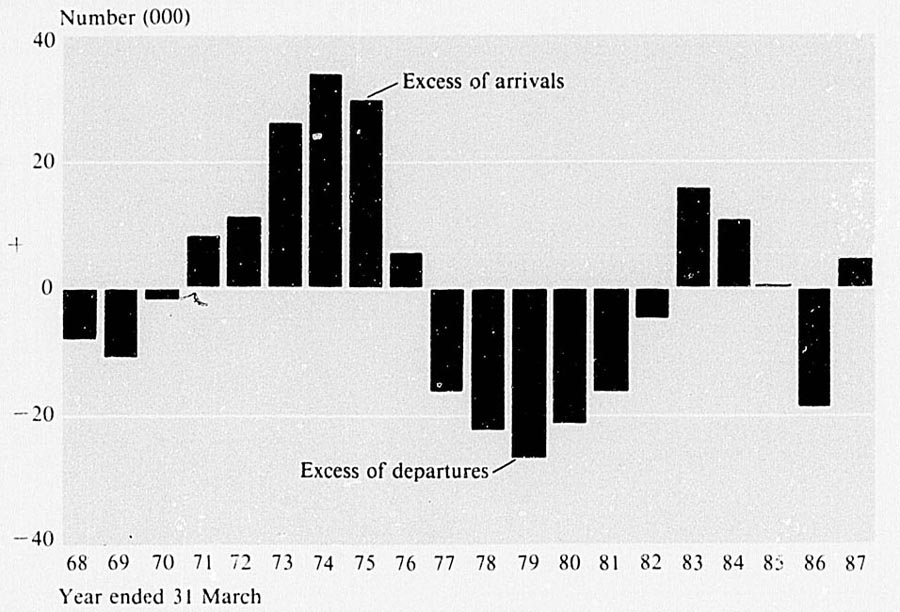
EXTERNAL MIGRATION
Table 5.17. SEX OF PERSONS ARRIVING AND DEPARTING
| Year ended 31 March | Arrivals | Departures | Excess of arrivals over departures | ||||
|---|---|---|---|---|---|---|---|
| Males | Females | Total | Males | Females | Total | ||
| 1983 | 486,896 | 428,567 | 915,463 | 478,186 | 421,835 | 900,021 | 15,442 |
| 1984 | 488,066 | 434,802 | 922,868 | 483,292 | 429,019 | 912,311 | 10,557 |
| 1985 | 538,749 | 478,463 | 1017,212 | 539,201 | 477,794 | 1016,995 | 217 |
| 1986 | 591,900 | 520,026 | 1,111,926 | 599,841 | 530,603 | 1,130,444 | -18 518 |
| 1987 | 694,446 | 627,283 | 1,321,729 | 693,482 | 623,890 | 1,317,372 | 4,357 |
Table 5.18. LONG-TERM ARRIVALS AND DEPARTURES
| Long-term (including permanent) arrivals | Long-term (including permanent) departures | |||||||
|---|---|---|---|---|---|---|---|---|
| Year ended 31 March | Permanent arrivals | Long-term | Permanent and long-term arrivals (immigrants) | Permanent departures of New Zealand residents | Long-term | Permanent and long-term departures (emigrants) | ||
| N.Z. residents returning | Long-term visitors | N.Z. residents departing | Long-term visitors departing | |||||
| 1983 | 12,595 | 27,105 | 6,154 | 45,854 | 12,314 | 26,197 | 4,163 | 42,674 |
| 1984 | 10,029 | 24,320 | 6,356 | 40,705 | 9,182 | 20,916 | 4,049 | 34,147 |
| 1985 | 9,707 | 20,222 | 6,314 | 36,243 | 12,120 | 28,003 | 4,204 | 44,327 |
| 1986 | 10,169 | 19,368 | 6,445 | 35,982 | 16,526 | 35,998 | 5,071 | 57,595 |
| 1987 | 13,802 | 21,910 | 8,648 | 44,360 | 17,945 | 36,588 | 4,096 | 58,629 |
Long-term migration. Table 5.18 gives an analysis of long-term (including permanent) arrivals and departures for March years. ‘Long-term arrivals’ are defined as residents returning after an absence of, or visitors intending to stay, 12 months or more. ‘Long-term departures’ are defined as residents intending to stay away for, or visitors leaving after a stay of, 12 months or more. In the year ended March 1987 there was a net loss of 14 269 from permanent and long-term migration. The main area of change was in the number of arrivals, which increased by 8378 or 23.3 percent over the corresponding figures for the previous year.
See also the special article, New Zealand's immigration policy in the following chapter.
Table 5.19. AGE AND SEX OF LONG-TERM MIGRANTS, 1986–87
| Age, in years | Permanent and long-term arrivals | Permanent and long-term departures | Excess of arrivals over departures | ||||
|---|---|---|---|---|---|---|---|
| Males | Females | Total | Males | Females | Total | ||
| Under 15 | 4,713 | 4,436 | 9,149 | 4,900 | 4,534 | 9,434 | -285 |
| 15-19 | 1,671 | 1,829 | 3,500 | 2,577 | 3,570 | 6,147 | -2 647 |
| 20-24 | 3,599 | 4,294 | 7,893 | 9,102 | 8,576 | 17,678 | -9 785 |
| 25-44 | 10,572 | 9,368 | 19,940 | 11,494 | 9,023 | 20,517 | -577 |
| 45 and over | 1,980 | 1,898 | 3,878 | 2,490 | 2,363 | 4,853 | -975 |
| Total | 22 535 | 21825 | 44 360 | 30 563 | 28 066 | 58 629 | -14 269 |
The law on registration of births is contained in the Births and Deaths Registration Act 1951. A birth is normally registered at the office of the registrar nearest the place of birth. Birth statistics are compiled by the Department of Statistics from the Registrar-General's records, and the births covered by a year's statistics are those registered during the year. The figures do not include stillbirths, except where multiple births are discussed. A special classification of stillbirths is given later in this subsection.
There is provision for births not registered in the ordinary way to be recorded at a later date in a special register kept by the Registrar-General. Such cases include elderly people requiring evidence of age for social-welfare purposes.
Table 5.20 shows the numbers of births and selected fertility indexes. Late registrations have been excluded from the figures. The crude birth rate fell in the early 1960s, and in the later 1960s appeared to stabilise at 22 to 23 births per 1000 of mean population. During the 1970s the crude birth rate continued to decline, and following a period of stability in the late 1970s, fell again.
A more refined cross-sectional measure called the ‘total fertility rate’ is also shown in the table. This is the average number of births a woman would have during her reproductive life. if she was exposed to the fertility rates characteristic of various child bearing age-groups. The total fertility rate has fallen below the intrinsic replacement level since 1979 and in recent years has been stable at a rate just above 1.9 births per woman. The total fertility rate at which any population replaces itself, under certain conditions, is approximately 2.10 births per woman.
The reproduction indexes shown in table 5.20 are based on the fact that the future size of a population is related to the number of female children born to women in the reproductive age groups at any given time. The gross reproduction rate is based on the average number of girls that will be born to a woman during her reproductive life, given the prevailing age-specific fertility rates. The net rate takes into account prevailing mortality rates. A net reproduction rate of 1.0 indicates zero population growth if the population is closed to migration, and its age-sex structure has long-term stability.
The numbers of boys and girls born during the years 1982-86 are given in table 5.21. In each year more boys than girls are born, a disparity in births that is outweighed by the higher death rates of males at all age levels. The death rate per 1000 live births for babies under 12 months of age in 1986 was 12.50 for boys and 9.87 for girls. Per 1000 mean population the death rate for children of from one to four years of age was 0.86 for boys and 0.48 for girls; for children aged five to 14 years it was 0.34 for boys and 0.26 for girls; and the pattern repeated itself for each age group through adolescence and adult life.
In 1986 there were 553 confinements resulting in all live multiple births, including nine cases of triplets and one case of quadruplets. There were also 10 cases where one of the twins was stillborn and one case where one triplet was stillborn.
Information on the relative ages of parents of nuptial living children whose births were registered in 1986 is shown in table 5.22. Late registrations of births under section 14 of the Births and Deaths Registration Act 1951 are excluded.
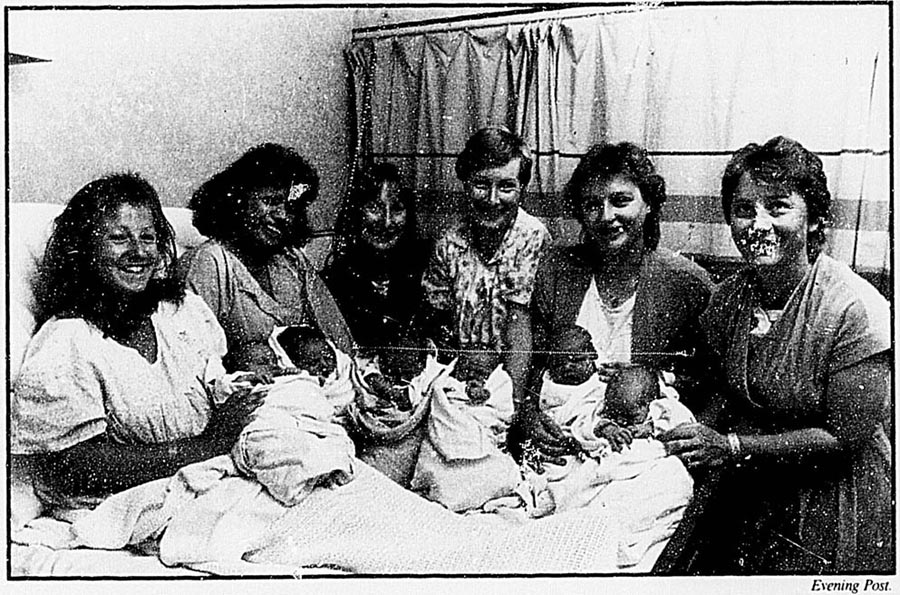
New Year's Day babies and mothers, Wellington.
Table 5.22. BIRTHS: AGES OF PARENTS, 1986
| Age of mother | Age of father, in years | ||||||||||
|---|---|---|---|---|---|---|---|---|---|---|---|
| Under 20 | 20-24 | 25-29 | 30-34 | 35-39 | 40-44 | 45-49 | 50-54 | 55-64 | 65 and over | Total cases | |
| total births registered | |||||||||||
| Under 20 | 93 | 400 | 118 | 23 | 6 | 3 | - | - | - | - | 643 |
| 20-24 | 46 | 3,060 | 4,521 | 950 | 237 | 53 | 23 | 5 | 8 | - | 8,903 |
| 25-29 | 4 | 660 | 8,060 | 6,148 | 1,171 | 254 | 73 | 27 | 16 | 3 | 16,416 |
| 30-34 | - | 70 | 966 | 4,917 | 2,721 | 489 | 116 | 35 | 23 | 2 | 9,339 |
| 35-39 | - | 12 | 93 | 451 | 1,214 | 522 | 144 | 43 | 20 | 1 | 2,500 |
| 40-44 | - | - | 14 | 21 | 53 | 131 | 70 | 21 | 14 | 1 | 325 |
| 45 and over | - | - | 2 | - | 1 | 3 | 9 | 1 | 1 | - | 17 |
| Total | 143 | 4 202 | 13 774 | 12 510 | 5 403 | 1 455 | 435 | 132 | 82 | 7 | 38 143 |
Table 5.23. BIRTHS: PREVIOUS CHILDREN OF MOTHERS, 1986*
| Age of mother | Average issue | 0 | 1 | 2 | 3 | 4 | 5 | 6-9 | 10 and over | Total nuptial cases |
|---|---|---|---|---|---|---|---|---|---|---|
*Live births. | ||||||||||
| number of mothers | ||||||||||
| Under 20 | 1.23 | 509 | 122 | 12 | - | - | - | - | - | 643 |
| 20-24 | 1.64 | 4,681 | 3,104 | 911 | 179 | 25 | 3 | - | - | 8,903 |
| 25-29 | 2.00 | 6,160 | 5,975 | 3,042 | 915 | 251 | 61 | 12 | - | 16,416 |
| 30-34 | 2.45 | 2,292 | 3,098 | 2,415 | 980 | 348 | 134 | 70 | 2 | 9,339 |
| 35-39 | 2.89 | 567 | 623 | 574 | 361 | 200 | 87 | 84 | 4 | 2,500 |
| 40-44 | 3.92 | 59 | 63 | 40 | 47 | 35 | 36 | 40 | 5 | 325 |
| 45 and over | 4.18 | 2 | 2 | 4 | 2 | 2 | 1 | 4 | - | 17 |
| Total | 2.09 | 14 270 | 12 987 | 6 998 | 2 484 | 861 | 322 | 210 | 11 | 38 143 |
Statistics of nuptial first confinements show that, during the last five years, the percentages of first confinements during the first year and first two years after marriage have stabilised at a lower level than that prevailing earlier.
The average ages of women at the birth of their first child were as follows: 1966, 23.45; 1976, 23.87; 1984, 25.74; 1985, 25.96; and 1986, 26.28. These figures refer to nuptial births only.
Table 5.24. BIRTHS: FIRST CONFINEMENTS
| Year | Total nuptial cases | Total nuptial first cases | Percentage of first cases to total cases | First
cases within 1 year after marriage | First
cases within 2 years after marriage | ||
|---|---|---|---|---|---|---|---|
| Number | Percentage to total first cases | Number | Percentage to total first cases | ||||
| 1982 | 38,147 | 14,370 | 37.67 | 3,512 | 24.44 | 6,532 | 45.46 |
| 1983 | 38,071 | 14,538 | 38.19 | 3,525 | 24.25 | 6,599 | 45.39 |
| 1984 | 38,623 | 14,466 | 37.45 | 3,350 | 23.16 | 6,425 | 44.41 |
| 1985 | 38,445 | 14,633 | 38.06 | 3,239 | 22.13 | 6,346 | 43.37 |
| 1986 | 38,143 | 14,270 | 37.41 | 3,265 | 22.88 | 6,269 | 43.93 |
Table 5.25. BIRTHS: AGE OF MOTHER AT FIRST CONFINEMENT
| Age of woman | Percentage of total first confinements | ||||
|---|---|---|---|---|---|
| 1936* | 1956* | 1976 | 1985 | 1986 | |
*European births only. | |||||
| Under 20 | 7.91 | 10.62 | 14.13 | 3.72 | 3.57 |
| 20-24 | 38.22 | 47.47 | 46.51 | 35.51 | 32.80 |
| 25-29 | 35.08 | 27.11 | 30.21 | 42.38 | 43.17 |
| 30-34 | 13.67 | 10.03 | 7.04 | 14.61 | 16.06 |
| 35-39 | 4.22 | 3.72 | 1.76 | 3.49 | 3.97 |
| 40-44 | 0.81 | 0.99 | 0.35 | 0.28 | 0.41 |
| 45 and over | 0.09 | 0.06 | 0.01 | 0.01 | 0.02 |
| Total | 100.00 | 100.00 | 100.00 | 100.00 | 100.00 |
The numbers of ex-nuptial births registered during each of the last six years are given in table 5.26. The ex-nuptial birth rate relates ex-nuptial births to the number of women not married, aged 15–49 years. It is a more relevant measure than the previously published percentage of ex-nuptial births to total births. Ex-nuptial births include children born to women living in de facto relationships.
In 1986 the total number of ex-nuptial confinements resulting in live births was 14 115. Of these 13 993 cases were single births, 120 cases were twins, and two cases of triplets. There were two cases of twins where one child was stillborn. The total number of ex-nuptial live births was 14 237.
From table 5.27, it can be seen that of the 14 115 mothers, 3834 or 27.16 percent were under 20 years of age.
Table 5.28, which relates to cases handled by the Department of Social Welfare, shows the number and status of children adopted over the last five years ended 31 March. In 1986, 61 percent of the children adopted were ex-nuptial births. Of these children born out of wedlock, 45 percent were aged less than one year at the time of placement for adoption.
Table 5.28. ADOPTIONS
| Status of children adopted | 1982 | 1983 | 1984 | 1985 | 1986 |
|---|---|---|---|---|---|
*These are cases where, because one of the applicants is the child's natural parent, a social worker's report has not been called for. | |||||
| Ex-nuptial | 909 | 946 | 869 | 732 | 635 |
| Nuptial | 345 | 356 | 340 | 314 | 233 |
| Not known* | 328 | 242 | 251 | 212 | 170 |
| Total | 1 582 | 1 544 | 1 460 | 1 258 | 1 038 |
Stillbirths. Although it is compulsory to register a stillborn child as a type of birth, no entry is made in the register of deaths. A stillborn child is defined as one ‘which has issued from its mother after the expiration of the 28th week of pregnancy and which was not alive at the time of such issue’. Stillbirths are not included (either as births or as deaths) in the various numbers and rates shown in this subsection or in that on deaths.
The death rate (which usually means the crude death rate, i.e., the number of deaths per 1000 of total mean population) is less subject to fluctuation than the birth rate. In the absence of wars, epidemics, and other large-scale disasters, it changes slowly. The crude death rate was 9.31 in 1936, and 50 years later in 1986, it was 8.25. In between, it reached a peak of 11.05 in 1942, during the Second World War, and a low point of 7.80 in 1984. In contrast, the birth rate (18.03 in 1936 and 16.11 in 1986) was as high as 27.64 in 1947 and is now below even the low level of the 1930s.
Under normal conditions the most important factor affecting the crude death rate is the age structure of the population, which changes slowly. An ageing population will tend to have a high death rate, while a young one will have a low one, provided that infant mortality is not abnormally high.
Table 5.32 gives a time series for rates of death per 1000 of mean population by age groups. Health measures in New Zealand have achieved an immense saving of young life and a prolongation of life.
Major causes of deaths are given in section 8.2, Public health.
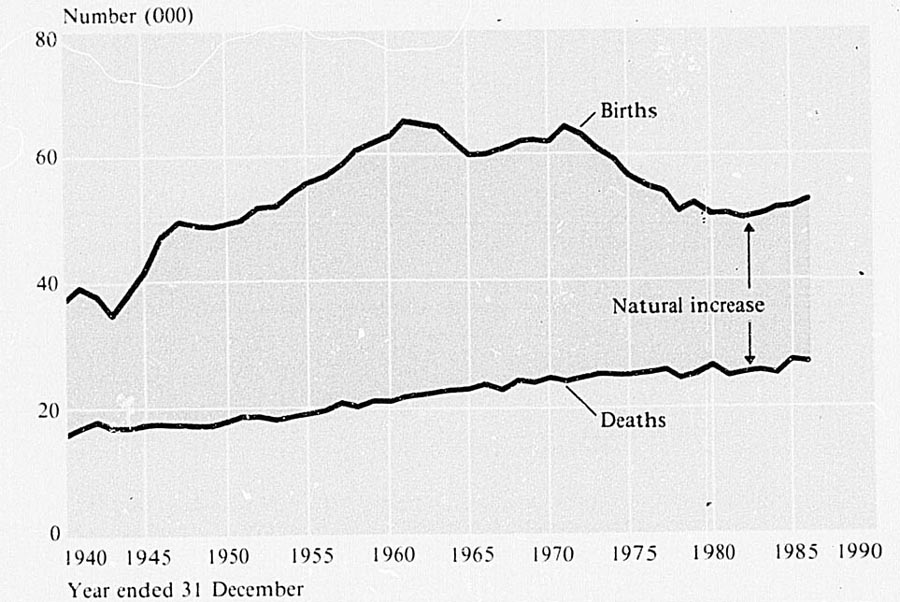
VITAL STATISTICS
Table 5.30. DEATHS AND NATURAL INCREASE OF POPULATION
| Year | Total population | Rates per
1000 mean population | |||
|---|---|---|---|---|---|
| Births | Deaths | Natural increase | Crude death rate | Natural increase | |
| 1982 | 49,938 | 25,532 | 24,406 | 8.03x | 7.67 |
| 1983 | 50,474 | 25,991 | 24,483 | 8.07x | 7.60x |
| 1984 | 51,636 | 25,378 | 26,258 | 7.80x | 8.07x |
| 1985 | 51,798 | 27,480 | 24,318 | 8.40x | 7.43x |
| 1986 | 52,824 | 27,045 | 25,779 | 8.25 | 7.86 |
Table 5.31. AGES AT DEATH REGISTERED IN 1986
| Age | Males | Females | Total | Age | Males | Females | Total |
|---|---|---|---|---|---|---|---|
*Excludes adjustments by the National Health Statistics Centre as a result of analysis and collation of registration forms and death certificates. | |||||||
| Under 1* | 336 | 256 | 592 | 55-59 | 888 | 553 | 1,441 |
| 1- 4 | 88 | 47 | 135 | 60-64 | 1,409 | 793 | 2,202 |
| 5- 9 | 28 | 37 | 65 | 65-69 | 1,696 | 1,066 | 2,762 |
| 10-14 | 65 | 32 | 97 | 70-74 | 2,257 | 1,524 | 3,781 |
| 15-19 | 236 | 76 | 312 | 75-79 | 2,249 | 1,985 | 4,234 |
| 20-24 | 269 | 82 | 351 | 80-84 | 1,742 | 2,059 | 3,801 |
| 25-29 | 214 | 79 | 293 | 85-89 | 1,016 | 1,600 | 2,616 |
| 30-34 | 180 | 102 | 282 | 90-94 | 375 | 1,004 | 1,379 |
| 35-39 | 226 | 122 | 348 | 95-99 | 105 | 359 | 464 |
| 40-44 | 236 | 155 | 391 | 100 and over | 13 | 52 | 65 |
| 45-49 | 330 | 217 | 547 | ||||
| 50-54 | 572 | 315 | 887 | Total | 14 530 | 12 515 | 27 045 |
Table 5.32. DEATH RATES
| Year | Under 1* | 1-4 | 5-14 | 15-24 | 25-34 | 35-44 | 45-54 | 55-64 | 65-74 | 75 and over |
|---|---|---|---|---|---|---|---|---|---|---|
*Per 1000 live births. † Non-Maori figures only as Maori at ages not available for these years. | ||||||||||
| rates per 1000 of mean population in each age group | ||||||||||
| Males | ||||||||||
| 1901† | 78.60 | 6.81 | 1.89 | 3.52 | 3.97 | 6.16 | 11.94 | 23.12 | 50.59 | 141.67 |
| 1921† | 53.10 | 4.78 | 1.85 | 2.44 | 3.56 | 5.55 | 9.61 | 19.96 | 46.17 | 128.60 |
| 1941 | 43.65 | 4.39 | 1.36 | 2.53 | 2.93 | 3.95 | 9.20 | 21.13 | 47.44 | 140.27 |
| 1961 | 25.86 | 1.34 | 0.49 | 1.28 | 1.47 | 2.68 | 7.39 | 19.65 | 47.33 | 126.31 |
| 1981 | 13.01 | 0.95 | 0.35 | 1.53 | 1.35 | 2.26 | 6.57 | 17.30 | 43.39x | 114.11x |
| 1984 | 13.29 | 0.81 | 0.34 | 1.43x | 1.37 | 2.05 | 5.74x | 16.21x | 41.19x | 111.80x |
| 1985 | 12.09 | 0.54 | 0.36 | 1.54x | 1.38 | 1.94x | 5.86x | 16.75x | 42.20x | 120.09x |
| 1986 | 12.50 | 0.86 | 0.34 | 1.70 | 1.52 | 2.12 | 5.71 | 16.10 | 41.80 | 112.00 |
| Females | ||||||||||
| 1901† | 63.87 | 5.50 | 1.64 | 3.58 | 4.72 | 6.70 | 10.62 | 19.44 | 43.32 | 127.98 |
| 1921† | 42.31 | 4.49 | 1.31 | 2.34 | 3.38 | 4.46 | 8.00 | 14.88 | 36.81 | 120.23 |
| 1941 | 37.75 | 3.84 | 1.20 | 1.94 | 2.44 | 3.50 | 6.90 | 15.04 | 38.60 | 118.92 |
| 1961 | 19.50 | 1.16 | 0.35 | 0.53 | 0.87 | 1.95 | 4.59 | 11.22 | 29.89 | 104.74 |
| 1981 | 10.22 | 0.64 | 0.23 | 0.67 | 0.64 | 1.51 | 3.94 | 9.19 | 23.73 | 84.67 |
| 1984 | 9.74 | 0.37 | 0.22 | 0.55 | 0.66 | 1.23 | 3.70 | 8.93 | 22.67 | 79.76 |
| 1985 | 9.47 | 0.58 | 0.29 | 0.57 | 0.69 | 1.39 | 3.85 | 9.44 | 23.44 | 89.59x |
| 1986 | 9.87 | 0.48 | 0.26 | 0.55 | 0.69 | 1.27 | 3.43 | 9.39 | 22.40 | 84.00 |
| Both sexes | ||||||||||
| 1901† | 71.40 | 6.17 | 1.77 | 3.55 | 4.33 | 6.40 | 11.37 | 21.63 | 47.87 | 135.71 |
| 1921† | 47.82 | 4.64 | 1.58 | 2.39 | 3.47 | 5.10 | 8.85 | 17.59 | 41.90 | 124.84 |
| 1941 | 39.81 | 4.12 | 1.28 | 2.22 | 2.67 | 3.72 | 8.02 | 18.16 | 43.04 | 129.15 |
| 1961 | 22.76 | 1.25 | 0.42 | 0.91 | 1.18 | 2.31 | 6.00 | 15.41 | 37.67 | 114.01 |
| 1981 | 11.65 | 0.80 | 0.29 | 1.11 | 0.99 | 1.89 | 5.29 | 13.15x | 32.67 | 95.41x |
| 1984 | 11.36 | 0.60 | 0.28 | 1.00 | 1.01 | 1.64 | 4.74x | 12.52x | 31.01x | 91.47x |
| 1985 | 10.81 | 0.56 | 0.33x | 1.06 | 1.03 | 1.66 | 4.87x | 13.06x | 31.86x | 100.69x |
| 1986 | 11.21 | 0.68 | 0.30 | 1.13 | 1.10 | 1.69 | 4.58 | 12.72 | 31.12 | 94.19 |
Table 5.33. AVERAGE AGE AT DEATH*
| Year | Males | Females | Year | Males | Females |
|---|---|---|---|---|---|
*Arithmetic mean. | |||||
| age (years) | age (years) | ||||
| 1901 | 41.64 | 37.68 | 1971 | 64.75 | 70.04 |
| 1921 | 48.45 | 46.97 | 1985 | 66.43 | 72.76 |
| 1941 | 58.65 | 59.60 | 1986 | 65.90 | 72.56 |
| 1961 | 63.80 | 67.32 | |||
Deaths must be registered by funeral directors within three days after burial. The law on burial and cremation is in the Burial and Cremation Act 1974. The registration by local authorities of funeral directors and mortuaries operated by them is provided for in the Health (Burial) Regulations 1946. Local authorities are charged with ensuring that adequate provision exists for the disposal of the dead. Cremation, which is increasingly used, may be carried out if the deceased is not known to have left any written direction to the contrary.
During the years 1984–86 the average life expectancy of New Zealand males was 71.0 years, compared with 77.3 years for females. As shown in table 5.34, life expectancies for both sexes have gradually increased over the past 35 years, with those of females increasing more.
Table 5.34. LIFE EXPECTANCY
| Year | Life expectancy at birth (years) | |
|---|---|---|
| Males | Females | |
| 1950–52 | 67.2 | 71.3 |
| 1960–62 | 68.4 | 73.8 |
| 1970–72 | 68.6 | 74.6 |
| 1980–82 | 70.4 | 76.4 |
| 1984–86 | 71.0 | 77.3 |
The publications New Zealand Life Tables and 1984–86 Abridged Life Tables contain detailed information on life expectancy at various ages.
Table 5.35. LIFE EXPECTANCY IN SELECTED COUNTRIES
| Country | Year | Life expectancy at birth (years) | |
|---|---|---|---|
| Males | Females | ||
| Australia | 1985 | 72.3 | 78.8 |
| Canada | 1980–82 | 71.9 | 78.9 |
| Denmark | 1984–85 | 71.6 | 77.5 |
| England and Wales | 1982–84 | 71.6 | 77.4 |
| France | 1983 | 70.4 | 78.5 |
| Japan | 1984 | 74.5 | 80.2 |
| Netherlands | 1985 | 73.1 | 79.7 |
| New Zealand | 1984–86 | 71.0 | 77.3 |
| Sweden | 1985 | 73.8 | 79.7 |
| United States | 1985 | 71.2 | 78.2 |
As an indication of the likely future population in New Zealand, a series of the 1985-base projections is presented in the following graph to show projected changes in total population and age distribution, together with historical populations for comparison. The projection variant adopted here assumes that the population will experience medium fertility and medium short-term migration with a net gain of 5000 persons annually in the long-term.
According to the projections the total population of New Zealand will increase from 3.3 million in the year 1985 to about 3.9 million by 2021, at an average annual growth rate of 0.5 percent. Natural increase will constitute the major part of the growth, although its effect will decrease in the later years. Births will increase in the short term from 51 000 in 1986 to 52 000 in 1994, before declining gradually to 44 000 by 2021, while deaths will increase steadily from 26 000 in 1986 to 43 000 by 2021.
The age distribution of the population is projected to undergo significant changes in the future. There will be progressively fewer young people, but more in the main working and elderly age groups, as illustrated by the shaded areas in the diagram. Over the period from 1986 to 2021, the population in the 0–14 years age group will decrease from 791 000 (24.0 percent of the total population) to 651 000 (16.9 percent). The population in the main working age group, 15–59 years, will increase from 2 017 000 (61.2 percent) to 2 379 000 (62.6 percent) by the year 2014, and will then decline gradually to 2 336 000 (60.6 percent) by 2021.
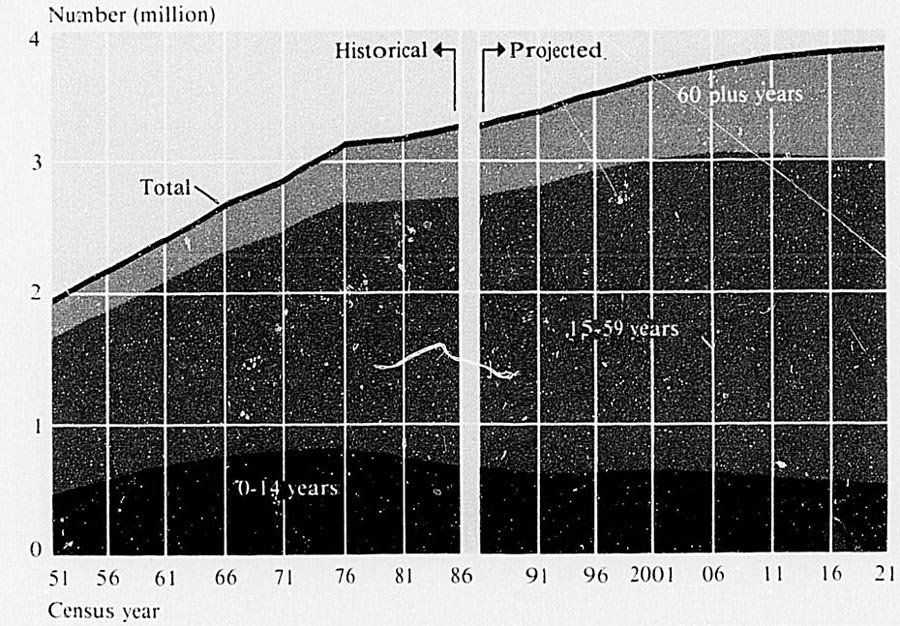
AGE OF POPULATION—historical and projected
The elderly population, aged 60 years and over, will increase from 490 000 (14.9 percent) to 866 000 (22.5 percent), as the average age of the population increases. By 2021 half of the population will be over the age of 41.2 years, compared to the median of 29.4 years in 1985.
These projections are not predictions but measures based on specified assumptions about future fertility, mortality, and migration. Because of uncertainty surrounding these variables, the projections should be treated only as an indication of future population change.
Ages and Marital Status. Census Publication, Series C, Report 3. Department of Statistics.
1987 Electorate Profiles. Census Publication, Series B, Report 27. Department of Statistics.
Labour Force—Part 1. Census Publication, Series C, Report 4. Department of Statistics.
Local Authority Population and Dwelling Statistics. Census Publication, Series A, Report 2. Department of Statistics.
National Summary. Census Publication, Series C, Report 2. Department of Statistics.
Regional Statistics. Census Publication, Series B, Reports 2–23. Department of Statistics. (Reports for each local government region.)
Regional Summary. Census Publication, Series B, Report 24. Department of Statistics.
Rural Population Statistics. Census Publication, Series A, Report 3. Department of Statistics.
Usually Resident Population. Census Publication. Series B, Report 25. Department of Statistics.
Dwellings. Census Publication, Series C, Report 11. Department of Statistics.
A full list of 1986 Census of Population and Dwellings publications can be found in the list of Department of Statistics publications at the back of this volume.
Demographic Profiles. Department of Statistics, 1986.
Demographic Trends. Department of Statistics (annual).
External Migration Statistics. Department of Statistics (annual).
Fetal and Infant Deaths. National Health Statistics Centre (annual).
Hospital and Selected Morbidity Data. National Health Statistics Centre (annual).
Inter-regional Migration in New Zealand, 1971–1981. Department of Statistics, 1986.
Maps of Statistical Boundaries. Department of Statistics. (Map series), 1986.
Monthly Abstract of Statistics. Department of Statistics.
New Zealand Life Tables 1980–82. Department of Statistics. 1986.
New Zealand Population Projections 1983–2016. Department of Statistics, 1984.
New Zealand Sub-national Population Projections 1986–2006. Department of Statistics, 1985.
Overseas Travel Statistics. Department of Statistics (quarterly and annual).
Profile of Women: A Statistical Comparison of Females and Males in New Zealand 1945–84. Department of Statistics, 1985.
Trends and Patterns in New Zealand Fertility, 1912–1983. Department of Statistics, 1986.
Vital Statistics. Department of Statistics (annual).
Table of Contents
There was a total of 1 078 005 private households living in permanent dwellings in New Zealand at the Census of Population and Dwellings held on 4 March 1986. This shows an increase of 74 892, or 7.5 percent, in the total number of private households during the 1981–86 intercensal period.
Table 6.1 describes the number of households by type counted at the 1986 census. Because the basis for deriving statistics of household composition was changed from ‘census night’ in 1981 to ‘usual composition’ in 1986, no comparable figures are available from the earlier census. A ‘one-family-only’ household consists of a husband and/or wife with or without unmarried children of any age who are living at home. Amounting to 68.7 percent of all private households in New Zealand at the 1986 census, one-family-only households continue to be predominant.
‘One-person’ households are easily the next most common type, comprising 18.6 percent of all private households.
Table 6.1. USUAL HOUSEHOLD COMPOSITION, 1986 CENSUS
| Type | Number* | Percentage of total |
|---|---|---|
*Excludes households where the occupier is an overseas resident, is aged under 15 years, or where the household is composed entirely of visitors. | ||
| One family only | 734,262 | 68.7 |
| One family plus other persons | 56,172 | 5.3 |
| Two families (with or without other persons) | 15,129 | 1.4 |
| Three or more families (with or without other persons) | 1,140 | 0.1 |
| Non-family households | 63,579 | 5.9 |
| One-person households | 199,164 | 18.6 |
| Total | 1 069 446 | 100.0 |
The total number of dwellings occupied on the night of the Census of Population and Dwellings increased from 1 011 882 in 1981 to 1 095 747 in 1986, a rise of 83 865, or 8.3 percent. This percentage increase was much more than that of the total New Zealand population, leading to a reduction in the average number of persons per occupied dwelling. In 1986 the average number of occupants per permanent private dwelling was 2.9, compared with 3.0 five years earlier.
Because of a change in the ‘type of dwelling’ categories used for the 1981 and 1986 censuses, only abridged statistics on types of dwellings are given in table 6.2.
Table 6.2. TYPES OF DWELLINGS
| Type | Number of dwellings | 1986
census number of occupants | ||
|---|---|---|---|---|
| 1981 census | 1986 census | Aggregate* | Average* | |
*Total New Zealand census night population including those whose usual place of residence is overseas. † Sum of two houses or flats joined together or three or more flats (houses) joined together. ‡ Includes mobile or temporary dwellings within a motor camp. | ||||
| Occupied dwellings— | ||||
| Permanent private dwellings— | ||||
| Separate house | 793,599 | 862,341 | 2,682,729 | 3.1 |
| Two houses or flats joined together | 197 889† | 103,338 | 215,418 | 2.1 |
| Three or more flats (houses) joined together | 90,984 | 165,183 | 1.8 | |
| Flat/house attached to business or shop | 7,830 | 8,190 | 22,446 | 2.7 |
| Bach, crib, hut (not in a work camp) | 3,789 | 5,949 | 12,285 | 2.1 |
| Not specified | - | 7,209 | 18,051 | 2.5 |
| Total, permanent private dwellings | 1 003 107 | 1 078 005 | 3 116 112 | 2.9 |
| Temporary private dwellings | 2,379 | 10 596‡ | 22,893 | 2.2 |
| Non-private dwellings | 6,396 | 7,149 | 168,081 | 23.5 |
| Total, occupied dwellings | 1 011 882 | 1 095 747 | 3 307 083 | 3.0 |
| Unoccupied dwellings— | ||||
| Occupants temporarily away | 30,225 | 31,128 | ... | ... |
| Empty habitable dwellings (to let, for sale, etc.) | 28,698 | 35,454 | ... | ... |
| Holiday residences | 38,193 | 40,950 | ... | ... |
| Total, unoccupied dwellings | 97 113 | 107 535 | ... | ... |
| Dwellings being built | 6,834 | 10,440 | ... | ... |
Table 6.3 shows the number and distribution of occupied permanent private dwellings by number of occupants on census night in 1981 and 1986. Changes in distribution of dwellings by numbers of occupants are a result of demographic, social and economic trends.
Intercensal increases in both the number and percentage of dwellings with one occupant reflect demographic shifts in the population towards increasing numbers of ‘not married’ persons at the ages where living alone is most common. However, not all the increases can be explained by demographic shifts within the population and reflect changes in the attitudes and choices of New Zealanders.
These trends, together with the growing incidence of de facto relationships, solo parents and childless marriages help explain the comparable increases in the number and percentage of dwellings with two or three occupants and the reduced (or negative) growth in dwellings with four or more occupants.
Table 6.3. NUMBER OF OCCUPANTS OF PERMANENT PRIVATE DWELLINGS
| Number of occupants | 1981 census | 1986 census | Intercensal percentage change | ||
|---|---|---|---|---|---|
| Dwellings | Percentage | Dwellings | Percentage | ||
| 1 | 184,992 | 18.4 | 209 460x | 19.4 | 13.2 |
| 2 | 293 004x | 29.2 | 329 262x | 30.5 | 12.4* |
| 3 | 164,640 | 16.4 | 184 365x | 17.1 | 12.0 |
| 4 | 181,707 | 18.1 | 190,833 | 17.7 | 5.0 |
| 5 | 105,945 | 10.6 | 100,848 | 9.4 | -4.8 |
| 6 | 44,019 | 4.4 | 38,361 | 3.6 | -12.9 |
| 7 or more | 28,803 | 2.9 | 24 867x | 2.3 | -12.7 |
| Total, occupied | 1 003 113 | 100.0 | 1 078 005 | 100.0 | 7.5 |
A comparison of the 1981 and 1986 census data shows two dominant trends in relation to changes in the tenure of private dwellings. These can be seen in table 6.4
Occupied private dwellings owned without a mortgage increased by 18.1 percent during the intercensal period to reach 339,420 in 1986. This category increased its share of total dwellings from 28.8 percent to 31.8 percent. There was also an increase (of 5.4 percent) in the number of occupied dwellings owned with mortgage during this period although the share of total dwellings with this tenure status fell from 42.4 percent in 1981 to 41.9 percent in 1986.
Table 6.4. TENURE OF DWELLINGS AND CATEGORY OF LANDLORD
| Tenure and category of landlord | 1981 census | 1986 census | Intercensal percentage change | ||
|---|---|---|---|---|---|
| Permanent private dwellings | Percentage of total specified | Permanent private dwellings | Percentage of total specified | ||
| Owned— | |||||
| With mortgage | 423,459 | 42.4 | 446,253 | 41.9 | 5.4 |
| Without mortgage | 287,343 | 28.8 | 339,420 | 31.8 | 18.1 |
| Rented or leased from— | |||||
| Private person/company | 143,136 | 14.4 | 148,806 | 13.9 | 4.0 |
| Housing Corporation | 57,072 | 5.7 | 56,088 | 5.3 | -1.7 |
| Other government departments | 21,801 | 2.2 | 17,739 | 1.7 | -18.6 |
| Local authority | 19,095 | 1.9 | 16,524 | 1.5 | -13.5 |
| Landlord not specified | 12,285 | 1.2 | 10,731 | 1.0 | -12.6 |
| Total, rented or leased | 253,389 | 25.4 | 249,894 | 23.4 | -1.4 |
| Provided free | 33,528 | 3.4 | 30,585 | 2.9 | -8.8 |
| Not specified | 5,388 | 11,853 | 120.0 | ||
| Total permanent private dwellings | 1 003 113 | 100.0 | 1 078 005 | 100.0 | 7.5 |
In contrast to the growth in self-owned permanent private occupied dwellings, there was a 1.4 percent decline in the number of rented or leased dwellings during 1981–86.
The overall fall in the rented and leased dwelling stock can be attributed to reduced servicing of the rental housing market by the Housing Corporation, other government departments, and local authorities.
Dwellings rented or leased from private persons and companies increased by 4.0 percent during the 1981–86 intercensal period.
There was a total of 69 477 households in permanent private New Zealand Maori dwellings at the 1986 Census of Population and Dwellings. The corresponding figure for households living in permanent private Pacific Island Polynesian dwellings was 19 962.
In each case the dwellings are defined in terms of the ethnic origin of the dwelling ‘occupier’ and are based on the number of occupiers of ‘solely New Zealand Maori’ or ‘solely Pacific Island Polynesian’ origin. As a consequence the 1986 census gives a conservative estimate of the numbers of such dwellings (and by definition households). Occupied permanent private dwellings should ideally be defined in terms of the ethnic origin of the majority of household members.
In the case of New Zealand Maori this problem is compounded by the fact that the preferred definition of a ‘Maori’ is ‘a person of Maori origin or descent’ and includes those both of solely Maori origin and mixed origin including Maori.
No direct comparison of either New Zealand Maori or Pacific Island Polynesian households or dwellings between the 1981 and 1986 censuses is possible because of an amended 1986 census question on ethnic origin which abolished fractions of origin. The Department of Statistics will be deriving a new series of tabulations which enable comparison between 1981 and 1986 data on the ethnic characteristics of households and dwellings and these will be available for the next edition of the Yearbook.
Table 6.5 below shows the usual composition of New Zealand Maori and Pacific Island Polynesian households by type at the 1986 census. The outstanding feature of this table is that the percentage distribution of Pacific Island Polynesian households is more weighted towards the categories ‘one family plus other persons’ and ‘two or more families with or without other persons’. Of all Pacific Island Polynesian households, 33.0 percent are in the above categories compared to 21.3 percent of New Zealand Maori households.
Table 6.5. USUAL COMPOSITION OF MAORI AND POLYNESIAN HOUSEHOLDS, 1986 CENSUS*
| Household type | New Zealand Maori | Pacific Island Polynesian | ||
|---|---|---|---|---|
| Number† | Percentage of total | Number† | Percentage of total | |
*Private households occupying permanent dwellings where the ‘occupier’ is a person of ‘solely New Zealand Maori origin’ or ‘solely Pacific Island Polynesian origin’. † Excludes households where the occupier is aged less than 15 years, where the occupier is temporarily resident in the dwelling or where the household is composed entirely of visitors | ||||
| One family only | 43,950 | 63.3 | 11,469 | 57.5 |
| One family plus other persons | 9,585 | 13.8 | 4,407 | 22.1 |
| Two families (with or without other persons) | 4,587 | 6.6 | 1,902 | 9.5 |
| Three or more families (with or without other persons) | 609 | 0.9 | 285 | 1.4 |
| Non-family households | 3,975 | 5.7 | 837 | 4.2 |
| One-person households | 6,771 | 9.7 | 1,062 | 5.3 |
| Total | 69 477 | 100.0 | 19 962 | 100.0 |
An indication of the types of dwellings occupied by the Maori and Pacific Island Polynesian population is given in table 6.6. New Zealand Maoris show a greater tendency to live in separate houses than Pacific Island Polynesians. The reverse is true for two and three houses or flats joined together.
Table 6.6. TYPES OF MAORI AND POLYNESIAN DWELLINGS, 1986 CENSUS*
| Type | New Zealand Maori | Pacific Island Polynesian | ||
|---|---|---|---|---|
| Number | Percentage of total† | Number | Percentage of total† | |
*Permanent dwellings without households where the ‘occupier’ is a person of ‘solely New Zealand Maori origin’ or ‘solely Pacific Island Polynesian origin’. † Calculated in terms of specified cases. | ||||
| Occupied permanent private dwellings— | ||||
| Separate house | 54,624 | 78.1 | 13,860 | 68.9 |
| Two houses or flats joined together | 6,534 | 9.3 | 2,526 | 12.5 |
| Three or more flats (houses) joined together | 6,864 | 9.8 | 3,528 | 17.5 |
| Flat/house attached to business or shop | 546 | 0.8 | 186 | 0.9 |
| Bach, crib, hut (not in work camp) | 708 | 1.0 | 24 | 0.1 |
| Not specified | 678 | 114 | ||
| Total | 69 957 | 100.0 | 20 224 | 100.0 |
The distribution of New Zealand Maori and Pacific Island Polynesian dwellings by number of occupants at the 1986 census (see table 6.7) reinforces the patterns evident in the usual composition of households by type for these two ethnic groups. Whereas 47.3 percent of Maori dwellings have three or fewer occupants, only 30.0 percent of Pacific Island Polynesian dwellings do.
This is explained by the lower average family size of Maori and tendency for Pacific Island Polynesian dwellings to contain more than one family or families with extra persons.
Table 6.7. NUMBER OF OCCUPANTS OF MAORI AND POLYNESIAN DWELLINGS, 1986 CENSUS*
| Number of occupants† | New Zealand Maori | Pacific Island Polynesian | ||
|---|---|---|---|---|
| Dwellings | Percentage of total | Dwellings | Percentage of total | |
*Permanent dwellings with households where the ‘occupier’ is a person of ‘solely New Zealand Maori origin’ or ‘solely Pacific Island Polynesian origin’. † Refers to the number of people residing in a permanent private dwelling on census night. | ||||
| One | 7,266 | 10.4 | 1,110 | 5.5 |
| Two | 12,909 | 18.5 | 2,211 | 10.9 |
| Three | 12,897 | 18.4 | 2,760 | 13.6 |
| Four | 13,512 | 19.3 | 3,369 | 16.6 |
| Five | 9,987 | 14.3 | 3,375 | 16.7 |
| Six | 6,129 | 8.8 | 2,823 | 13.9 |
| Seven or more | 7,257 | 10.4 | 4,599 | 22.7 |
| Total | 69 957 | 100.0 | 20 244 | 100.0 |
Patterns of tenure (and category of landlord) shown in 1986 census data reflect the household income and demographic structures of Maori and Pacific Island Polynesian ethnic groups, and table 6.8 shows that Pacific Island Polynesians are more dependent on rented or leased housing than Maori, who in turn are almost twice as dependent on rental housing as the general population (see table 6.4).
For occupier-owned housing, 46.9 percent of Maori dwellings, compared with 42.4 percent of Pacific Island Polynesian dwellings, were owned with or without a mortgage.
Table 6.8. TENURE OF MAORI AND POLYNESIAN DWELLINGS AND CATEGORY OF LANDLORD, 1986 CENSUS*
| Tenure and category of landlord | New Zealand Maori | Pacific Island Polynesian | ||||
|---|---|---|---|---|---|---|
| Permanent private dwellings | Percentage of total† | Average number of occupants‡ | Permanent private dwellings | Percentage of total† | Average number of occupants‡ | |
*Permanent dwellings where the ‘occupier’ is a person of ‘solely New Zealand Maori origin’ or ‘solely Pacific Island Polynesian origin’. † Calculated in terms of specified cases. ‡ Refers to the average number of people residing in a permanent private dwelling on census night. | ||||||
| Owned— | ||||||
| With mortgage | 22,362 | 32.5 | 4.4 | 7,236 | 36.2 | 5.7 |
| Without mortgage | 9,939 | 14.4 | 3.6 | 1,242 | 6.2 | 4.7 |
| Rented or leased from— | ||||||
| Private person/company | 14,439 | 21.0 | 4,284 | 21.4 | ||
| Housing Corporation | 12,708 | 18.5 | 5,397 | 27.0 | ||
| Other government departments | 3,000 | 4.4 | 321 | 1.6 | ||
| Local authority | 1,269 | 1.8 | 393 | 2.0 | ||
| Landlord not specified | 2,346 | 3.4 | 831 | 4.2 | ||
| Total, rented or leased | 33,768 | 49.0 | 3.6 | 11,226 | 56.2 | 4.5 |
| Provided free | 2,784 | 4.0 | 3.7 | 270 | 1.4 | 4.6 |
| Not specified | 1,101 | 3.3 | 270 | 4.4 | ||
| Total | 69 957 | 100.0 | 3.9 | 20 224 | 100.0 | 4.9 |
At the 1986 Census of Population and Dwellings, 913 113 households had the use of one or more motor vehicles for private transport. This shows an increase of 80 256 over the number of private households (832 857) with the use of vehicles at the 1981 census.
Based on those households specifying their vehicle numbers, the proportion of private households with one or more motor vehicles remained relatively static at 87.6 percent. Private households without a motor vehicle increased from 12.4 percent to 13.3 percent during the intercensal period, while there was a related decline in the percentage of one-vehicle households.
A small rise in the share of households with two vehicles—from 28.0 percent at the 1981 census to 28.5 percent at the 1986 census—is consistent with a decrease in the percentage of households with access to three or more vehicles during the period.
Table 6.9. HOUSEHOLD TRANSPORT
| Number of motor vehicles* | 1981 census | 1986 census | Intercensal percentage change | ||
|---|---|---|---|---|---|
| Households | Percentage of total† | Households x | Percentage of total† | ||
*Includes cars, station-wagons, vans, trucks, and other vehicles used on public roads. Business vehicles if available for private use are also included. † Calculated on specified cases only. | |||||
| 0 | 118,356 | 12.4 | 140,295 | 13.3 | 18.5 |
| 1 | 476,583 | 50.1 | 519,795 | 49.3 | 9.1 |
| 2 | 266,562 | 28.0 | 300,774 | 28.5 | 12.8 |
| 3 | 64,431 | 6.8 | 69,183 | 6.6 | 7.4 |
| 4 | 17,556 | 1.8 | 17,238 | 1.6 | —1.8 |
| 5 or more | 7,725 | 0.8 | 6,126 | 0.6 | -20.7 |
| Not specified | 51,897 | 24,597 | -52.6 | ||
| Total | 1 003 113 | 100.0 | 1 078 005 | 100.0 | 7.5 |
The New Zealand Household Expenditure and Income Survey is conducted continuously by the Department of Statistics and the results are presented on a March-year basis. It provides statistics on the expenditure patterns and income levels of private households and information on the social and demographic characteristics of households.
A sample of approximately 4500 private households is randomly selected for the survey every third year, to provide data for the revision of the Consumers Price Index (see section 25.1, Consumer prices), and a smaller sample of approximately 3500 private households is selected in other years. In the 1986–87 year, 3501 private households (comprising 9865 persons) participated in the survey, each household containing an average of 2.82 persons. Questionnaires administered to each household include a household questionnaire, an expenditure questionnaire and income questionnaires. In all cases, information as reported or recorded by household members is processed without adjustment for under-reporting of income and expenditure. Overseas experience suggests that expenditure on tobacco and alcohol, meals away from home, and food items such as ice cream and confectionery, tend to be under-reported in household surveys. Other data sources indicate that a similar situation occurs in the New Zealand survey.
In the following tables the aggregate survey income/expenditure has been averaged over all households in the survey, rather than over only those households which reported income/expenditure. This averaging procedure has the effect of reducing some average income/expenditure statistics to a level below that which would normally be expected (e.g., expenditure on rent).
Table 6.10. INCOME DISTRIBUTION OF SURVEYED HOUSEHOLDS, 1986–87
| Annual income | Approximate equivalent weekly income | Number of households | Average weekly income per household |
|---|---|---|---|
*Including nil and loss. | |||
| $ | $ | $ | |
| Under 9,000* | Under 173 | 332 | 106.32 |
| 9,000–13,999 | 173 and under 268 | 395 | 224.33 |
| 14,000–17,999 | 268 and under 345 | 342 | 304.95 |
| 18,000–21,999 | 345 and under 422 | 331 | 385.41 |
| 22,000–26,999 | 422 and under 518 | 345 | 469.20 |
| 27,000–31,999 | 518 and under 614 | 334 | 564.07 |
| 32,000–37,999 | 614 and under 729 | 354 | 671.10 |
| 38,000–44,999 | 729 and under 863 | 361 | 792.63 |
| 45,000–56,999 | 863 and under 1,093 | 365 | 963.82 |
| 57,000 or over | 1,093 or over | 342 | 1,558.62 |
| Total | 3 501 | 604.00 | |
Table 6.11. AVERAGE WEEKLY EXPENDITURE FOR SELECTED FAMILY TYPES, 1986–87
| Expenditure group | Couple | Couple with 1 child | Couple with 2 children | Couple with 3 or more children | Solo parent with child(ren) | Non-family house-holds | Extended family households | All house- holds |
|---|---|---|---|---|---|---|---|---|
| $ | ||||||||
| Food | 67.14 | 91.03 | 102.53 | 119.67 | 67.84 | 48.28 | 117.12 | 78.63 |
| Housing | 103.61 | 122.72 | 121.01 | 103.30 | 83.35 | 79.58 | 103.47 | 100.65 |
| Household operation | 68.03 | 73.95 | 76.69 | 76.43 | 54.59 | 44.64 | 82.01 | 64.57 |
| Apparel | 22.05 | 28.73 | 39.10 | 40.21 | 23.63 | 14.94 | 37.25 | 26.48 |
| Transportation | 83.48 | 90.88 | 84.90 | 98.87 | 62.75 | 57.66 | 110.35 | 79.20 |
| Other goods | 47.89 | 65.69 | 61.65 | 76.77 | 40.98 | 36.76 | 79.81 | 53.23 |
| Other services | 58.38 | 71.36 | 86.35 | 89.59 | 46.10 | 43.98 | 78.45 | 63.95 |
| Total expenditure | 450.58 | 544.37 | 572.23 | 604.83 | 379.24 | 325.84 | 608.47 | 466.72 |
| Total households | 858 | 370 | 559 | 389 | 270 | 897 | 158 | 3 501 |
Table 6.12. AVERAGE WEEKLY HOUSEHOLD EXPENDITURE, 1986–87
| Expenditure group and subgroup | Average weekly household expenditure* | Percentage of total expenditure |
|---|---|---|
*Averages have been rounded to the nearest 5 cents. | ||
| $ | percent | |
| Food— | ||
| Fruit | 6.10 | 1.3 |
| Vegetables | 6.55 | 1.4 |
| Meat | 10.85 | 2.3 |
| Poultry | 2.20 | 0.5 |
| Fish | 1.70 | 0.4 |
| Farm products, fats, oils | 10.05 | 2.2 |
| Cereals, cereal products | 10.25 | 2.2 |
| Sweet products, spreads, beverages | 9.10 | 2.0 |
| Other foodstuffs | 5.45 | 1.2 |
| Food consumed in eating places, takeaway foods | 16.40 | 3.5 |
| Total, food | 78.65 | 16.8 |
| Housing— | ||
| Rent | 16.70 | 3.6 |
| Net capital outlay and related expenses | 14.15 | 3.0 |
| Mortgage payments | 32.00 | 6.9 |
| Payments to local authorities | 8.60 | 1.8 |
| Property maintenance goods | 12.80 | 2.7 |
| Property maintenance services | 16.30 | 3.5 |
| Housing expenses not elsewhere classified | 0.10 | 0.0 |
| Total, housing | 100.65 | 21.6 |
| Household operation— | ||
| Domestic fuel and power | 12.15 | 2.6 |
| Home appliances | 17.25 | 3.7 |
| Household equipment and utensils | 3.20 | 0.7 |
| Furniture | 7.65 | 1.6 |
| Furnishings | 1.60 | 0.3 |
| Floor coverings | 2.95 | 0.6 |
| Household textiles | 3.85 | 0.8 |
| Household supplies | 5.05 | 1.1 |
| Household services | 10.85 | 2.3 |
| Total, household operation | 64.55 | 13.8 |
| Apparel— | ||
| Men's clothing | 5.25 | 1.1 |
| Women's clothing | 8.45 | 1.8 |
| Children's clothing | 3.10 | 0.7 |
| Clothing not otherwise classifiable | 1.35 | 0.3 |
| Clothing supplies and services | 2.60 | 0.6 |
| Men's footwear | 1.70 | 0.4 |
| Women's footwear | 2.30 | 0.5 |
| Children's footwear | 0.90 | 0.2 |
| Footwear not otherwise classifiable | 0.60 | 0.1 |
| Footwear supplies and services | 0.25 | 0.1 |
| Total, apparel | 26.50 | 5.7 |
| Transportation— | ||
| Public transport in N.Z. | 4.75 | 1.0 |
| Overseas travel | 13.50 | 2.9 |
| Purchase of road vehicles | 27.50 | 5.9 |
| Vehicle ownership expenses | 31.05 | 6.7 |
| Private transport costs n.e.c. | 2.45 | 0.5 |
| Total, transportation | 79.20 | 17.0 |
| Other goods— | ||
| Tobacco products | 6.05 | 1.3 |
| Alcohol | 13.65 | 2.9 |
| Medical goods | 1.65 | 0.4 |
| Toiletries and cosmetics | 3.50 | 0.8 |
| Personal goods | 4.25 | 0.9 |
| Pets, racehorses and livestock | 4.25 | 0.9 |
| Publications, stationery and office-type equipment | 7.30 | 1.6 |
| Leisure and recreational goods | 8.95 | 1.9 |
| Recreational vehicles | 2.35 | 0.5 |
| Goods n.e.c. | 1.25 | 0.3 |
| Total, other goods | 53.25 | 11.4 |
| Other services— | ||
| Health services | 6.25 | 1.3 |
| Personal services | 2.90 | 0.6 |
| Educational and tuitional services | 2.70 | 0.6 |
| Accommodation services | 2.80 | 0.6 |
| Financial, insurance and legal services | 12.10 | 2.6 |
| Vocational services | 1.20 | 0.3 |
| Leisure services | 6.10 | 1.3 |
| Services n.e.c. | 1.95 | 0.4 |
| Expenditure n.e.c. | 12.25 | 2.6 |
| Contributions to savings | 15.65 | 3.4 |
| Total, other services | 63.95 | 13.7 |
| Total net expenditure | 466.70 | 100.0 |
| Number of households | 3 501 | |
Table 6.13. HOUSEHOLD AMENITIES
| Amenity in dwelling | Percentage of all surveyed households* | |
|---|---|---|
| 1985–86 | 1986–87 | |
*Household Expenditure and Income Survey. | ||
| Electric range or wall oven | 93.8 | 94.7 |
| Gas, coal or oil-fired range | 9.8 | 9.0 |
| Microwave oven | 16.1 | 25.6 |
| Telephone | 94.4 | 95.1 |
| Clothes-washing machine | 96.6 | 96.1 |
| Clothes dryer | 53.5 | 54.3 |
| Separate refrigerator | 37.7 | 37.1 |
| Refrigerator/freezer combination | 67.2 | 69.0 |
| Separate deep-freeze unit | 58.8 | 59.6 |
| Dish-washing machine | 15.3 | 16.7 |
| Colour television (owned) | 75.0 | 76.7 |
| Monochrome television (owned) | 20.8 | 17.2 |
| Colour television (rented) | 16.5 | 16.0 |
| No television | 4.6 | 5.3 |
| Video recorder (owned) | 19.4 | 28.8 |
| Video recorder (rented) | 1.3 | 1.4 |
| Home computer (mains operated, with keyboard) | 6.7 | 8.6 |
| Portable electric heater | 87.4 | 86.3 |
| Electric heater fixed in place | 32.3 | 35.2 |
| Portable gas heater | 2.3 | 2.7 |
| Gas heater fixed in place | 6.5 | 6.9 |
| Open fire | 39.1 | 38.4 |
| Slow-combustion fire | 28.0 | 29.5 |
| Portable kerosene heater | 8.5 | 7.8 |
| Wet-back fire of any kind | 22.4 | 22.5 |
| Central heating of any kind | 5.6 | 6.0 |
| Solar water heating | 0.6 | .. |
| Spa pool | .. | 3.6 |
| Electric sewing machine | .. | 73.0 |
Relative standards of living cannot be compared by taking per-head incomes or expenditure alone. Environmental and other factors are increasingly recognised as components of the quality of life, a much less easily measured concept. In assessing standards of living, consideration is now given to the development of social indicators in parallel with purely economic terms of measurement. These include health and personal safety; equality of educational opportunity; employment and quality of working life; leisure satisfaction; social-welfare provisions; social opportunity and quality; social, cultural, and communication capabilities; housing and community facilities; and the physical environment.
Methods of measurement of these factors are being recommended on an international basis. In these wider terms of reference New Zealand's position is appreciably improved.
Some comparative indicators related to standards of living are set out in table 6.14.
Table 6.14. INDICATORS OF STANDARDS OF LIVING
| Item | New Zealand | United States | Canada | Australia | United Kingdom | Sweden | Japan |
|---|---|---|---|---|---|---|---|
*1980 † 1982 ‡ 1983 § 1984 ¶ 1985. Sources: OECD Economics Survey of New Zealand, May 1987; UNESCO Statistical Yearbook, 1987. | |||||||
| Population density (per km2) 1985 | 12 | 26 | 3 | 2 | 231 | 19 | 324 |
| GDP per capita ($US)—1985 | 6,722 | 16,494 | 13,635 | 9,847 | 7,943 | 12,006 | 10,977 |
| Private consumption per capita ($US)—1984 | 4,041 | 10,214 | 8,484 | 6,742 | 6,535 | 5,821 | 6,751 |
| Passenger cars per 1000 inhabitants—1984 | 455¶ | 473 | 421† | 312‡ | 377¶ | 221‡ | |
| Telephones per 1000 inhabitants—1984 | 646¶ | 650 | 664‡ | 540‡ | 521 | 890‡ | 535‡ |
| Television sets per 1000 inhabitants—1984 | 291¶ | 621* | 471* | .. | 336 | 390¶ | 250* |
| Doctors per 1000 inhabitants—1984 | 2.4¶ | 2.3‡ | 1.8† | .. | 0.5‡ | 2.5¶ | 1.3† |
| Infant mortality (per 1000 live births)—1985 | 10.8 | 10.6§ | 9.1‡ | 9.2§ | 9.4 | 6.8 | 5.9§ |
| Public education expenditure as percentage of GNP | 4.4 | 6.8‡ | 7.4 | 6.5 | 5.2 | 8.1 | 5.6‡ |
| Employment by sector (percentage): | |||||||
| Agriculture | 11.1 | 3.1 | 5.2 | 6.2 | 2.6 | 4.8 | 8.8 |
| Industry | 32.4 | 28.0 | 25.5 | 27.7 | 32.4 | 29.9 | 34.9 |
| Services | 56.5 | 68.9 | 69.3 | 66.1 | 65.0 | 65.3 | 56.3 |
| Wages and prices (average annual change over 5 years to 1986): | |||||||
| Wages | 10.3§ | 4.0 | 5.5 | 7.7 | 9.1 | 8.0 | 3.9 |
| Prices | 11.6 | 3.8 | 5.8 | 8.2 | 5.5 | 7.4 | 1.8 |
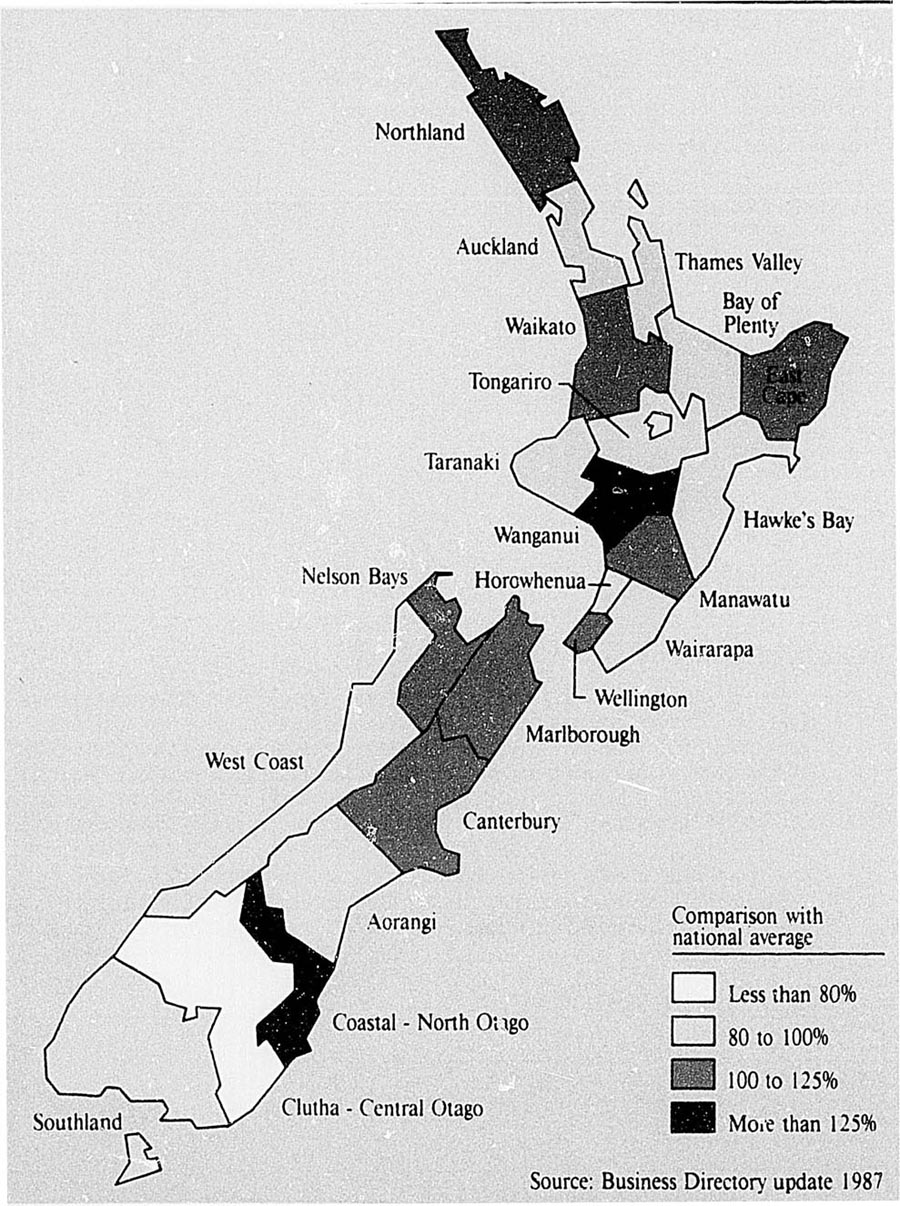
Percentage of workforce employed in
COMMUNITY SOCIAL AND PERSONAL SERVICES
Marriage may be solemnised either by a celebrant or before a registrar of marriages. A licence must be obtained from a registrar before a marriage by a celebrant can be solemnised, and notice must be given by one of the parties. Marriage celebrants may be nominated members of approved (including non-religious) organisations or justices of the peace. People under 20 years of age, not being widowed, require the consent of parents or guardian. In case of refusal the consent of a District Court judge may be sought.
The minimum age for marriage is 16 years. No marriage is deemed to be void, however, by reason only of an infringement of the minimum age.
Since 1952 every marriage to which a Maori is a party has been subject to the same law as if each of the parties was a non-Maori.
Table 6.15. MARRIAGE RATES
| December year | Number of marriages | Marriage rate | |
|---|---|---|---|
| Crude* | General† | ||
*Per 1000 mean population. † Per 1000 mean not-married population aged 16 years and over. | |||
| 1982 | 25,537 | 8.03 | 30.08 |
| 1983 | 24,678 | 7.66 | 27.79 |
| 1984 | 25,272 | 7.77 | 27.47 |
| 1985 | 24,657 | 7.54 | 26.03 |
| 1986 | 24,037 | 7.33 | 25.28 |
Table 6.16 shows the usually resident New Zealand male and female populations by marital status and age group at the 1986 Census of Population and Dwellings. The numbers ‘never married’ and ‘married’ in each age group reflect the long-term changes that have taken place in the average age at marriage, the marriage rate, and the age-sex distribution of the population.
Age-specific marriage rates have, in turn, been affected by the increasing numbers of persons in each age group living in stable ‘de facto’ relationships. General improvements in life expectancy and earlier increases in divorce rates have had a continuing impact on the numbers in the ‘widowed’ and ‘divorced’ categories at all ages.
The outcome of these changes during the 1981–86 intercensal period is more evident in table 6.17, which shows the numbers of males and females in each marital status category and the percentage distribution of the population by marital status at the 1981 and 1986 censuses. There was a considerable increase in the percentages of both males and females ‘never married’ between the 1981 and 1986 censuses. In contrast the corresponding percentages for the ‘married’ group showed a compensating decline. Also evident are percentage increases in the numbers ‘separated’, ‘widowed’ and ‘divorced’ during the period.
Table 6.16. MARITAL STATUS BY AGE GROUP, 1986 CENSUS*
| Age group (years) | Never married | Married | Separated | Widowed | Divorced | Not specified | Total |
|---|---|---|---|---|---|---|---|
*Usually resident New Zealand population. Includes persons remarried. | |||||||
| Males: | |||||||
| 15–19 | 146,360 | 654 | 150 | 42 | 51 | 5,658 | 152,928 |
| 20–24 | 118,740 | 20,136 | 1,716 | 81 | 300 | 2,079 | 143,052 |
| 25–34 | 82,083 | 149,091 | 12,375 | 396 | 7,584 | 3,261 | 254,787 |
| 35–44 | 20,184 | 166,392 | 12,651 | 948 | 13,047 | 2,625 | 215,856 |
| 45–54 | 10,659 | 124,329 | 7,611 | 2,166 | 9,780 | 2,232 | 156,771 |
| 55–64 | 10,149 | 114,519 | 4,455 | 5,778 | 7,266 | 1,629 | 143,799 |
| 65–74 | 5,787 | 73,083 | 1,851 | 9,486 | 3,069 | 1,083 | 94,365 |
| 75 and over | 2,907 | 30,360 | 618 | 12,903 | 948 | 1,098 | 48,831 |
| Total | 396 879 | 678 564 | 41 427 | 31 800 | 42 054 | 19 671 | 1 210 389 |
| Females: | |||||||
| 15–19 | 140,151 | 2,229 | 267 | 18 | 36 | 4,467 | 147,168 |
| 20–24 | 90,687 | 42,174 | 4,338 | 147 | 783 | 1,716 | 139,845 |
| 25–34 | 52,887 | 171,996 | 16,863 | 1,239 | 12,402 | 2,898 | 258,285 |
| 35–44 | 12,720 | 165,426 | 14,145 | 3,444 | 17,526 | 2,352 | 215,601 |
| 45–54 | 6,552 | 118,968 | 6,921 | 8,202 | 11,376 | 1,893 | 153,915 |
| 55–64 | 6,996 | 101,247 | 3,639 | 23,193 | 7,485 | 1,617 | 144,183 |
| 65–74 | 7,209 | 59,181 | 1,524 | 42,603 | 3,768 | 1,347 | 115,638 |
| 75 and over | 7,431 | 18,603 | 432 | 53,670 | 1,425 | 1,716 | 83,277 |
| Total | 324 633 | 679 824 | 48 132 | 132 513 | 54 798 | 18 006 | 1 257 909 |
Table 6.17. DISTRIBUTION OF POPULATION BY MARITAL STATUS*
| Marital status | 1981 census | 1986 census | Intercensal increase or decrease (-) | |||
|---|---|---|---|---|---|---|
| Number | Percentage distribution† | Number | Percentage distribution† | Number | Percentage | |
*Usually resident New Zealand population aged 15 years and over. † Percentages are calculated on specified cases only. ‡ Includes persons remarried. | ||||||
| Males: | ||||||
| Never married | 346,470 | 31.3 | 396,879 | 33.3 | 50,409 | 14.5 |
| Married‡ | 668,688 | 60.4 | 678,561 | 57.0 | 9,873 | 1.5 |
| Separated | 35,745 | 3.2 | 41,424 | 3.5 | 5,679 | 15.9 |
| Widowed | 29,796 | 2.7 | 31,800 | 2.7 | 2,004 | 6.7 |
| Divorced | 26,055 | 2.4 | 42,054 | 3.5 | 15,999 | 61.4 |
| Not specified | 23,586 | ... | 19,671 | ... | -3 915 | -16.6 |
| Total | 1 130 341 | 100.0 | 1 210 389 | 100.0 | 80 049 | 7.1 |
| Females: | ||||||
| Never married | 271,875 | 23.8 | 324,633 | 26.2 | 52,758 | 19.4 |
| Married‡ | 670,221 | 58.6 | 679,827 | 54.8 | 9,606 | 1.4 |
| Separated | 42,405 | 3.7 | 48,132 | 3.9 | 5,727 | 13.5 |
| Widowed | 125,460 | 11.0 | 132,513 | 10.7 | 7,053 | 5.6 |
| Divorced | 33,708 | 2.9 | 54,798 | 4.4 | 21,090 | 62.3 |
| Not specified | 22,695 | ... | 18,006 | ... | -4 689 | -20.7 |
| Total | 1 166 364 | 100.0 | 1 257 912 | 100.0 | 91 548 | 7.8 |
Table 6.18 shows the male and female populations living in de facto relationships by age group, irrespective of their marital status.
When the living arrangements of the population are studied, i.e., persons are classified as living together as husband and wife or living alone, a more stable trend emerges with reference to the 1981–86 intercensal period which reflects changing attitudes to traditional marriage. The population ‘living together as husband and wife’ consists of those in the ‘married’ category plus those in stable ‘de facto’ relationships but excluding ‘married’ persons and those persons whose marital status is ‘not specified’.
During the 1981–86 intercensal period the percentage of males living in a ‘husband and wife’ relationship declined slightly from 62.5 percent at the 1981 census to 61.7 percent at the 1986 census. There was a corresponding trend for females.
Table 6.18. DE FACTO RELATIONSHIPS*
| Age group (years) | 1981 census† | 1986 census† | Intercensal increase or decrease (-) | |||
|---|---|---|---|---|---|---|
| Number | Percentage distribution | Number | Percentage distribution | Number | Percentage | |
*Usually resident New Zealand population. † Includes persons in the ‘married’ and ‘not specified’ marital status categories. | ||||||
| Males: | ||||||
| 15–19 | 2,517 | 5.7 | 1,899 | 3.3 | -618 | -24.6 |
| 20–24 | 11,511 | 26.2 | 13,125 | 22.8 | 1,614 | 14.0 |
| 25–34 | 16,404 | 37.3 | 22,305 | 38.8 | 5,901 | 36.0 |
| 35–44 | 7,803 | 17.7 | 11,671 | 20.1 | 3,768 | 48.3 |
| 45–54 | 3,873 | 8.8 | 5,388 | 9.4 | 1,515 | 39.1 |
| 55–64 | 1,455 | 3.3 | 2,445 | 4.2 | 990 | 68.0 |
| 65–74 | 372 | 0.8 | 642 | 1.1 | 270 | 72.6 |
| 75 and over | 81 | 0.2 | 171 | 0.3 | 90 | 111.1 |
| Total | 44 019 | 100.0 | 57 549 | 100.0 | 13 530 | 30.7 |
| Females: | ||||||
| 15–19 | 6,762 | 15.4 | 5,796 | 10.1 | -966 | -14.3 |
| 20–24 | 13,377 | 30.4 | 16,773 | 29.2 | 3,396 | 25.4 |
| 25–34 | 14,082 | 32.0 | 19,821 | 34.5 | 5,739 | 40.8 |
| 35–44 | 6,276 | 14.3 | 9,552 | 16.6 | 3,276 | 52.2 |
| 45–54 | 2,400 | 5.5 | 3,801 | 6.6 | 1,401 | 58.4 |
| 55–64 | 789 | 1.8 | 1,230 | 2.1 | 441 | 55.9 |
| 65–74 | 201 | 0.5 | 402 | 0.7 | 201 | 100.0 |
| 75 and over | 51 | 0.1 | 108 | 0.2 | 57 | 111.8 |
| Total | 43 941 | 100.0 | 57 480 | 100.0 | 13 539 | 30.8 |
Until recently, the proportion of minors among persons marrying had been increasing over a fairly long period, but it is now declining slightly. In 1971 the age of majority was lowered from 21 to 20 years of age. In 1986, one bride in every 13 was under 20 years of age. Bridegrooms were usually older than their brides; only one in every 75 was under 20 years of age. Of the persons married in 1986, 2167 or 4.5 percent were under 20 years of age; 18 289 or 38.0 percent were returned as 20–24 years; 12 953 or 26.9 percent as 25–29 years; 8735 or 18.2 percent as 30–39 years; and 5930 or 12.3 percent as 40 years of age and over.
Table 6.19. AGES OF PERSONS MARRIED, 1986
| Age of bridegroom, in years | Age of bride, in years | Total bridegrooms | ||||||
|---|---|---|---|---|---|---|---|---|
| Under 20 | 20–24 | 25–29 | 30–34 | 35–39 | 40–44 | 45 and over | ||
| Under 20 | 187 | 121 | 10 | 1 | 2 | - | - | 321 |
| 20–24 | 1,256 | 5,466 | 812 | 133 | 35 | 12 | - | 7,714 |
| 25–29 | 316 | 3,816 | 2,615 | 456 | 121 | 39 | 12 | 7,375 |
| 30–34 | 59 | 826 | 1,341 | 709 | 239 | 62 | 17 | 3,253 |
| 35–39 | 16 | 247 | 552 | 516 | 389 | 135 | 39 | 1,894 |
| 40–44 | 8 | 54 | 161 | 245 | 283 | 208 | 115 | 1,074 |
| 45 and over | 4 | 45 | 87 | 152 | 307 | 388 | 1,423 | 2,406 |
| Total brides | 1 846 | 10 575 | 5 578 | 2 212 | 1 376 | 844 | 1 606 | 24 037 |
Table 6.20 gives the average age (arithmetic mean) at marriage for the five years to 1986, but these figures do not correspond with the modal, or most popular, age. The modal age for brides in 1986 was 22 years. In the case of bridegrooms the most popular age has varied, and for recent years it has been 21 to 24; in 1986 it was 24 years.
A national network of marriage guidance counsellors is funded largely through a grant from central government.
Marriage Guidance New Zealand is the name of the service. Its aim is to promote the development of positive relationships between partners and within their families. This is achieved through both an education service and direct counselling of couples and families.
The education service operates through over 220 trained tutors in human relationships. These tutors help individuals and couples to identify their feelings, values and needs and to practise new ways of behaviour; either working in groups or through the use of public media. In 1987 tutors led 629 courses involving 12 084 people. These included couples, people recently separated or widowed, school children and their parents, and various community and professional groups.
Counselling services involved 8876 cases and 31 501 interviews handled by 413 counsellors. Many cases were by referral from either community organisations, the Family Court, or the Department of Social Welfare.
Marriage Guidance New Zealand operates in over 60 locations through 29 local councils, each of which have an executive, and education and counselling committees to oversee services. There is also a national office in Wellington which provides a range of support services and co-ordinates the training of counsellors and tutors.
There is only one ground on which an order dissolving a marriage can be made—that is, that the marriage has broken down irreconcilably. The Family Proceedings Act 1980, which provides the legal framework for the dissolution of marriage, also makes provision for orders declaring a marriage void and for declarations of presumption of death. To establish that the marriage has broken down irreconcilably, the parties must be living apart, and have been doing so for the previous two years.
Since 1981 applications for dissolution of marriage have been made to Family Courts, which are less formal and have more simplified procedures than other courts. The following are the main pieces of legislation in the area:
This Act provides for the just division of the matrimonial property between the spouses when their marriage ends by separation or dissolution.
This Act aims to mitigate the effects of domestic violence by providing for non-molestation orders, non-violence orders, and emergency occupation and tenancy orders.
This Act requires custody applications to be heard in a Family Court and requires the judge to appoint a lawyer to represent children's interests. The concept is emphasised that the more suitable parent is to be given custody of a child or children irrespective of the sex of the parent or age of the children. An offence of wilfully hindering access to children is created by the Act and the court is given power to require medical, psychiatric, or psychological reports on children. The Act also gives to Family Courts a power to call witnesses.
This Act contains a scheme known as the Liable Parent Contribution Scheme which aims to provide a fair and uniform method of deciding the contributions a liable parent must make to support his or her children if the other parent is receiving a domestic purposes benefit.
Table 6.21. DISSOLUTION ORDERS AND DECREES ABSOLUTE GRANTED
| Ground or evidence presented | 1984 | 1985 | 1986 |
|---|---|---|---|
| Applications filed for dissolution of marriage | 9,381 | 8,687 | 9,143 |
| Evidence of irreconcilable breakdown— | |||
| Separation order | 1,244 | 1,026 | 770 |
| Written separation agreement | 4,628 | 4,009 | 4,171 |
| Verbal separation agreement | 1,993 | 2,188 | 2,419 |
| Lived apart, no agreement or order | 1,244 | 1,326 | 1,370 |
| Total, irreconcilable breakdown | 9 109 | 8 549 | 8 730 |
| Other dissolution orders | 12 | 10 | 7 |
| Total, dissolution orders | 9 121 | 8 559 | 8 737 |
| Grounds for divorce decrees— | |||
| Adultery | 9 | 12 | - |
| Desertion | 1 | - | - |
| Separation by agreement | 19 | 19 | 11 |
| Separation by court order | 11 | 10 | 4 |
| Having lived apart for 4 years or more | 12 | 7 | 1 |
| Non-consummation | 1 | - | - |
| Other | - | - | - |
| Total, decrees absolute | 53 | 48 | 16 |
| Total, all dissolution orders and decrees absolute | 9 174 | 8 607 | 8 753 |
Table 6.22. DURATION OF DISSOLVED MARRIAGES, 1986*
| Duration of marriage (in years)† | Age (in years) at marriage | |||||||
|---|---|---|---|---|---|---|---|---|
| Under 20 | 20–24 | 25–29 | 30–34 | 35–39 | 40–44 | 45 and over (including not stated) | Total | |
*Excludes 16 divorce proceedings carried over from previous legislation. † At time of dissolutions granted in 1986, calculated from month and year of marriage to month and year of order. For earlier years, duration was calculated from year of marriage to year of order. | ||||||||
| Husbands (all petitions and applications) | ||||||||
| Under 5 | 49 | 425 | 287 | 130 | 74 | 52 | 89 | 1,106 |
| 5–9 | 187 | 1,123 | 475 | 224 | 95 | 57 | 119 | 2,280 |
| 10–14 | 206 | 994 | 352 | 142 | 50 | 39 | 68 | 1,851 |
| 15–19 | 165 | 899 | 263 | 80 | 51 | 29 | 17 | 1,504 |
| 20 and over | 145 | 1,166 | 479 | 116 | 44 | 20 | 26 | 1,996 |
| Total | 752 | 4 607 | 1 856 | 692 | 314 | 197 | 319 | 8 737 |
| Wives (all petitions and applications) | ||||||||
| Under 5 | 209 | 502 | 164 | 91 | 59 | 26 | 55 | 1,106 |
| 5–9 | 699 | 988 | 279 | 142 | 70 | 31 | 71 | 2,280 |
| 10–14 | 705 | 757 | 217 | 78 | 41 | 21 | 32 | 1,851 |
| 15–19 | 632 | 685 | 117 | 33 | 18 | 6 | 13 | 1,504 |
| 20 and over | 673 | 1,058 | 176 | 46 | 21 | 8 | 14 | 1,996 |
| Total | 2 918 | 3 990 | 953 | 390 | 209 | 92 | 185 | 8 737 |
Table 6.23. APPLICATIONS AND ORDERS UNDER FAMILY PROCEEDINGS, GUARDIANSHIP AND DOMESTIC PROTECTION ACTS
| 1985 | 1986 | |||
|---|---|---|---|---|
| Applications | Orders | Applications | Orders | |
*Includes definition of access for which the original undefined access provisions may not have been the subject of court orders. | ||||
| Married parties | ||||
| Separation | 1,780 | 497 | 1,474 | 325 |
| Maintenance | 1,882 | 528 | 1,601 | 431 |
| Custody | 3,089 | 1,282 | 2,989 | 1,097 |
| Access* | 737 | 773 | 688 | 705 |
| Non-violence | 987 | 324 | 1,031 | 370 |
| Non-molestation | 1,633 | 432 | 1,668 | 470 |
| Occupancy of home | 1,618 | 419 | 1,423 | 370 |
| Non-married parties | ||||
| Paternity | 1,361 | 701 | 1,199 | 569 |
| Maintenance | 1,053 | 230 | 878 | 209 |
| Custody | 1,673 | 708 | 1,689 | 718 |
| Access* | 245 | 251 | 242 | 284 |
| Non-violence | 577 | 207 | 672 | 293 |
| Non-molestation | 760 | 253 | 919 | 341 |
| Occupancy of home | 284 | 86 | 324 | 131 |
Table 6.24. CUSTODY ORDERS, 1986
| Type of party | Number of children involved | Total | ||||||
|---|---|---|---|---|---|---|---|---|
| 1 | 2 | 3 | 4 | 5 | 6 | 7 or more | ||
*Joint, divided, other party. | ||||||||
| Married— | ||||||||
| Custody to mother | 247 | 322 | 152 | 48 | 12 | 2 | 1 | 784 |
| Custody to father | 71 | 60 | 19 | 6 | - | - | - | 156 |
| Custody, other* | 43 | 60 | 35 | 15 | 2 | 2 | - | 157 |
| Total orders | 361 | 442 | 206 | 69 | 14 | 4 | 1 | 1 097 |
| Total children | 361 | 884 | 618 | 276 | 70 | 24 | 7 | 2 240 |
| Non-married— | ||||||||
| Custody to mother | 428 | 91 | 17 | 6 | 1 | 1 | - | 544 |
| Custody to father | 50 | 10 | 4 | - | - | - | - | 64 |
| Custody, other* | 81 | 22 | 6 | 1 | - | - | - | 110 |
| Total orders | 559 | 123 | 27 | 7 | 1 | 1 | - | 718 |
| Total children | 559 | 246 | 81 | 28 | 5 | 6 | - | 925 |
An Act was passed by Parliament in 1977 to establish a Human Rights Commission and to promote the advancement of human rights in New Zealand in general accordance with the United Nations International Covenant on Human Rights.
The Human Rights Commission has the general functions of promoting, encouraging, and co-ordinating programmes and activities in the field of human rights, and the specific functions of investigating alleged breaches of the wide-ranging provisions against discrimination on grounds of sex, marital status, or religious or ethical beliefs set out in part II of the Act. Part II also makes unlawful any discrimination on grounds of colour, race, or ethnic or national origin in a number of areas not already covered by the Race Relations Act 1971. The commission is made up of the Chief Human Rights Commissioner (the chairperson), the Chief Ombudsman, the Race Relations Conciliator, the Proceedings Commissioner, and up to three others appointed by the Governor-General on the recommendation of the Minister of Justice.
An Equal Opportunities Tribunal was constituted under the same Act. Its function is to adjudicate in civil proceedings brought by the commission alleging discriminatory practice under part II of the Act. The tribunal consists of a chairperson, who must be a barrister or solicitor of the High Court, and two other persons appointed by the chairperson for the purposes of each hearing from a panel maintained by the Minister of Justice.
The Race Relations Act 1971 affirms and promotes racial equality in New Zealand and implements the International Convention on the Elimination of All Forms of Racial Discrimination. Discrimination is unlawful on the grounds of colour, race, or ethnic or national origins in: (a) access by the public to places, vehicles, and facilities; (b) provision of goods and services; (c) employment (including employment of independent contractors); and (d) land, housing, and other accommodation. It is also unlawful to publish or display any advertisement or notice which indicates an intention to commit a breach of any of these provisions. The Act also makes it an offence to incite racial disharmony. A breach of any of the provisions may be the subject of an investigation by the Office of the Race Relations Conciliator.
A major role for the office of the conciliator is in the field of education, and in resolving situations where there has been misunderstanding due to different racial backgrounds or concepts on the part of the parties. Potential racial incidents can often be avoided by education and conciliation. This extension of the conciliator's duties from an area confined to complaints and investigation of racial discrimination to one where discrimination may not have occurred, but where racial misunderstanding exists, is in keeping with the aims of the Act of affirming and promoting racial equality in New Zealand.
There are race relations offices in Auckland, Wellington, and Christchurch.
A Ministry of Women's Affairs was created in 1985. It is the primary agent working for women's equality and bases its work on the Government's women's policy, in co-operation with other government departments. All departments have the responsibility of carrying out the parts of the policy which relate to them, e.g., in health, education, and justice.
The Ministry of Women's Affairs policy unit and Te Ohu Whakatupu (Maori Women's Secretariat) have established formal liaison with all government departments in order to ensure consultation in the policy making processes. In 1987 they also devised a checklist which government departments can use in policy making, in order to ensure that women's interests and needs are taken into account. The following account gives some examples of work carried out on women's issues in 1987:
The Women's Advisory Committee on Education began a study to co-ordinate information on women and education in New Zealand. Positive steps were taken to encourage secondary school girls to take up science education and careers, e.g., the Women into Science and Education programme. The Department of Education is developing curriculum materials for girls and young women in science education as part of the current science review.
The Department of Scientific and Industrial Research awarded 11 study grants of $3,000 p.a. for three years to women undergraduates studying physics and engineering at university, with the aim of encouraging women into non-traditional scientific careers. Maori and Pacific Island women are also eligible to apply for awards specifically for Maori and Pacific Island people.
A major review of Nga Kohanga Reo (Maori language-nest programme) was begun. Implementation of the recommendations of the Working Party on Childcare Training began with the progressive integration of training for kindergarten teachers and early childhood workers. The number of childcare facilities continued to increase, particularly the development of centres in small country towns. By the end of 1987 grants had been given by the State Services Commission to 12 groups of public servants to establish childcare centres.
Projects undertaken by women in the community were supported by the Ministry of Women's Affairs Project Fund. With an annual budget of $50,000, the fund allotted 76 grants in 1987.
The Women's Resource Network, an information and skills-sharing scheme, co-funded by the Ministry of Women's Affairs and the McKenzie Foundation, expanded its activities in Northland and began work on the West Coast of the South Island. Te Ohu Whakatupu established Putea Pounamu, a pilot project for sharing of skills among Maori women. Putea Pounamu focuses on small special projects by Maori women and aims to develop community resources.
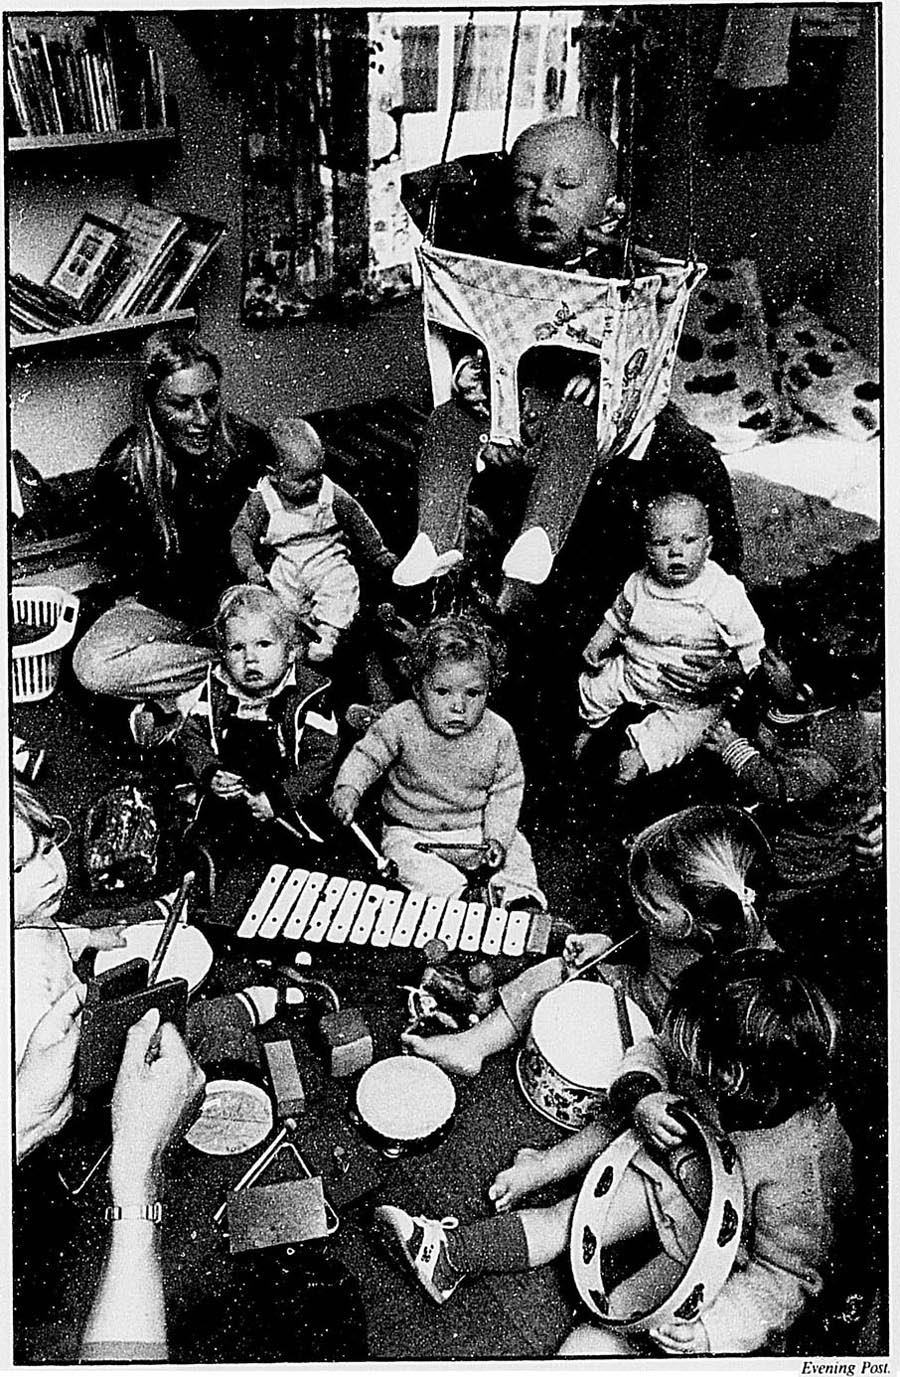
Creche, Victoria University of Wellington.
Various sectors of the women's community were recognised by the ministry in 1987 with special consultation meetings—women with disabilities, Pacific Island women and lesbians.
Corporatisation of government departments affected some communities considerably and advisers were employed in four regions to assess the social impacts of these changes on women. Networking among rural women was supported by the ministry's financing of a magazine for women in agriculture. In an effort to ensure that rural women and housebound women had an opportunity for input into policy making, the Ministry of Women's Affairs and the Royal Commission on Social Policy jointly organised a three-day ‘freephone’ in September. Women's views on how New Zealand society could be made more fair and just were recorded as official submissions to the Royal Commission.
The Ministry of Women's Affairs had extensive liaison with women throughout the community, through hui, correspondence, regional visits and informal meetings. Ongoing contact with Maori women was a basic activity of Te Ohu Whakatupu.
The ministry began work on compiling a data bank of the skills and expertise of women throughout the country, to assist the ministry in its policy and consultation work and to link women and women's groups.
Dissemination of information to women in the community was a major activity of the Ministry of Women's Affairs. Its publication programme included a quarterly newsletter and a series of pamphlets, Every Woman's Guide to the System.
The creation of nine state-owned enterprises on 1 April 1987 had considerable impact on the lives of women as employees of the new corporations, since a number of important conditions of work for women were renegotiated, e.g., flexible working hours, childcare leave, permanent part-time work, etc. Not all corporations retained the levels of advantage which women employees had previously enjoyed as public servants.
The Parental Leave and Employment Protection Act came into force on 1 October 1987. This provides equal opportunity for both men and women to take unpaid leave at the time of birth or adoption of a child. Reports were also completed on the first two stages of a three-stage equal pay study to determine ways to bring about equal pay for work of equal value. Guidelines were developed by the State Services Commission to recognise the value of domestic and community work experience of job applicants. See also chapter 12, Employment.
The Ministry of Women's Affairs maintains liaison with a Department of Health advisory group on women's health and the Women's Health Committee of the Board of Health. An advisory committee on intra-uterine contraceptive devices was set up in 1987 and an interdepartmental committee monitors new birth technologies.
Screening programmes for cervical cancer were a priority area for the Ministry of Women's Affairs in 1987. The need for programmes which are affordable, accessible and culturally appropriate—with priority to low-paid women and Maori women—is an important women's health issue. Three pilot schemes, two for Maori women and one for low-paid women, are to receive funding of $ 100,000 per year for the next three years. Amendments to regulations to allow people other than doctors to take cervical smears are proposed, and the Ministry of Women's Affairs is continuing to consult with the Cancer Society and the Department of Health in this area. The ministry was represented at the hearings of the Committee of Inquiry into Allegations Concerning the Treatment of Cervical Cancer at National Women's Hospital, established in June 1987. A detailed submission was made, regarding patients’ rights and informed consent to treatment, the monitoring of medical research programmes, and the need for effective cervical screening programmes.
The Housing Corporation followed up its calls for submissions from women with a report Women's Views on Housing. Arising from this, the corporation abolished a rule which prevented people who had owned property in the last five years from applying for its rental houses.
Te Ohu Whakatupu, the Maori Women's Secretariat within the Ministry of Women's Affairs, works to ensure that the specific needs and values of Maori women are considered in the context of their tangata whenua status and the principles of the Treaty of Waitangi. Members of the secretariat operate from a whanau, hapu and iwi and, as such, are accountable back to these groups.
Te Ohu Whakatupu focuses on the structural barriers which exist for Maori women in all areas of their lives. In addition to work in areas such as health and housing, particular emphasis is placed on land use and resources, promoting the participation of Maori women in decision-making in the use of land and natural resources. Te Ohu Whakatupu is working to identify the percentage of Maori women who are owners and shareholders of Maori land, and to encourage Maori women to be more active in the roles of advisers, managers and administrators of the whenua.
At the 1986 Census of Population and Dwellings the number of New Zealand residents identifying with a prominent religious profession showed an increase from those recorded in the 1981 census, in most cases. The exceptions were Anglicans, Christian n.e.s., Brethren, the Salvation Army and ‘other specified religions’, which showed a decline in support during the 1981–86 intercensal period. In the case of Anglicans, Brethren and the Salvation Army this was a continuation of the trend first evident in the intercensal period 1976–81.
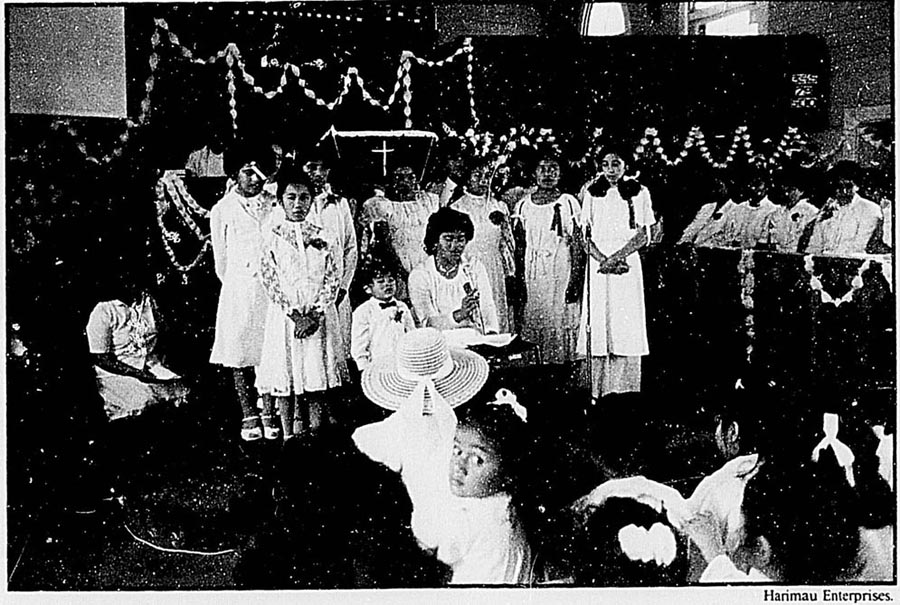
‘White Sunday’ service, Petone.
Persons reporting themselves as having no religion increased more than threefold, while those not specifying any religion or objecting to provide the requested information were nearly halved between the 1981 census and the 1986 census. As shown in table 6.26, this was apparently the result of New Zealanders reclassifying themselves as having ‘no religion’, rather than exercising their right to object or failing to specify a religious profession.
Perhaps the most significant fact to emerge from the table is the long-term decline in the percentage of the resident population identifying with the four traditional major religions: Anglican. Presbyterian, Roman Catholic and Methodist. From 69.1 percent at the 1976 census, the share of the population in these categories fell to 63.3 percent at the 1986 census.
Table 6.26. RELIGIOUS PROFESSIONS*
| Religious profession | Number | Percentage | ||||
|---|---|---|---|---|---|---|
| 1976x | 1981x | 1986 | 1976 | 1981 | 1986 | |
*Usually resident New Zealand population. † Major religious professions within the Associated Pentecostal Churches. ‡ Includes some cases of facetious answers and also those which were not specified in sufficient detail to allow precise classification. § This is the only census question carrying a statutory right to object to providing the information sought. | ||||||
| Anglican (Church of England) | 908,415 | 807,135 | 791,847 | 29.6 | 26.6 | 24.7 |
| Presbyterian | 564,735 | 521,040 | 587,517 | 18.4 | 17.1 | 18.3 |
| Roman Catholic (incl. catholic undefined) | 475,452 | 452,871 | 496,158 | 15.5 | 14.9 | 15.5 |
| Methodist | 171,816 | 147,192 | 153,243 | 5.6 | 4.8 | 4.8 |
| Baptist | 49,059 | 49,536 | 67,935 | 1.6 | 1.6 | 2.1 |
| Christian n.e.s. | 51,963 | 100,815 | 42,351 | 1.7 | 3.3 | 1.3 |
| Ratana | 35,079 | 35,763 | 39,729 | 1.1 | 1.2 | 1.2 |
| Mormon (Latter Day Saints) | 35,958 | 37,431 | 37,146 | 1.2 | 1.2 | 1.2 |
| Brethren | 24,351 | 24,213 | 19,710 | 0.8 | 0.8 | 0.6 |
| Salvation Army | 21,951 | 20,406 | 16,821 | 0.7 | 0.7 | 0.5 |
| Jehovah's Witness | 13,338 | 13,689 | 16,377 | 0.4 | 0.5 | 0.5 |
| Pentecostal n.e.s.† | 4,830 | 6,369 | 15,717 | 0.2 | 0.2 | 0.5 |
| Assemblies of God | 5,547 | 12,465 | 14,352 | 0.2 | 0.4 | 0.4 |
| Seventh Day Adventist | 11,877 | 11,427 | 12,015 | 0.4 | 0.4 | 0.4 |
| Other specified‡ | 158,136 | 164,058 | 115,572 | 5.2 | 5.4 | 3.6 |
| No religion | 100,398 | 166,014 | 533,766 | 3.3 | 5.5 | 16.7 |
| Object§ | 434,898 | 468,573 | 244,731 | 14.2 | 15.4 | 7.6 |
| Not specified | 35,460 | 104,310 | 58,686 | ... | ... | ... |
| Total | 3 103 263 | 3 143 307 | 3 263 283 | 100.0 | 100.0 | 100.0 |
Before the 1986 census, questions on the ethnic origins of the population asked respondents to describe their descent using fractions. For the 1986 census, and in line with practice in other countries, the use of fractions was dropped and a new system of classification adopted. In addition, a related priority convention for deriving ethnic origins where a person had equal fractions of two origins (used in the 1981 and earlier censuses) has been eliminated as far as possible. To allow comparison between the 1986 and earlier censuses, considerable reprocessing of earlier census data has been needed.
In response to requests from the census users, the Department of Statistics has produced a series of ethnic definitions to assist users to classify persons of ‘one origin’ and ‘mixed origin’. Statistics based on the definitions have been derived to ensure the greatest possible comparability of 1986 census data on ethnic origin with that from previous censuses.
To meet the varying present day requirements, two optional definitions have been adopted for each major ethnic origin category. ‘One ethnic origin’, which is the series derived on a group affiliation concept based on cultural and ancestral criteria, is regarded as more relevant to current needs by most ethnic groups. The populations derived using this concept give census time-series numbers which, although generally smaller than those previously based on the relevant ‘half or more’ or ‘more than half’ origin definitions, show stable trends.
‘Ethnic origin or descent’, which is closely comparable with previous census statistics on a descent basis, provides populations with a common biological (or ancestral) background, and, with the exception of New Zealand Maori groups, is considered by most users to be of less relevance to present requirements.
Table 6.27 compares the population of major ethnic groups at the 1981 and 1986 censuses in terms of the new classification adopted.
Table 6.27. ETHNIC ORIGINS OF POPULATION
| Ethnic origin | 1981 census | 1986 census | Intercensal percentage change | ||
|---|---|---|---|---|---|
| Number | Percentage of total | Number | Percentage of total | ||
*Includes other ethnic origins not elsewhere counted. † Comprises combinations of the Pacific Island Polynesian ethnic origins specified in the ‘one ethnic origin’ category. ‡ Includes all other two ethnic origin combinations not elsewhere counted. § Persons of New Zealand Maori or Pacific Island Polynesian origin are obtained from the one, two and three ethnic origin categories and include those of mixed New Zealand Maori–Pacific Island Polynesian origin in both cases. | |||||
| One ethnic origin— | |||||
| European | 2,590,716 | 83.4 | 2,651,376 | 82.2 | 2.3 |
| New Zealand Maori | 273,630 | 8.8 | 295,317 | 9.2 | 7.9 |
| Pacific Island Polynesian— | |||||
| Samoan | 35,895 | 1.2 | 50,199 | 1.6 | 39.8 |
| Cook Island Maori | 19,971 | 0.6 | 23,973 | 0.7 | 20.0 |
| Niuean | 7,107 | 0.2 | 8,472 | 0.3 | 19.2 |
| Tongan | 5,682 | 0.2 | 9,225 | 0.3 | 62.4 |
| Tokolauan | 2,049 | 0.1 | 2,316 | 0.1 | 13.0 |
| Other Pacific Island Polynesian | 2,994 | 0.1 | 474 | – | -84.2 |
| Total, Pacific Island Polynesian | 73,695 | 2.4 | 94,656 | 2.9 | 28.4 |
| Chinese | 16,653 | 0.5 | 19,506 | 0.6 | 17.1 |
| Indian | 9,954 | 0.3 | 12,126 | 0.4 | 21.8 |
| Other* | 6,987 | 0.2 | 14,487 | 0.4 | 107.3 |
| Total, one ethnic origin | 2 971 638 | 95.7 | 3 087 465 | 95.7 | 3.9 |
| Two ethnic origins— | |||||
| European-New Zealand Maori | 105,849 | 3.4 | 94,884 | 2.9 | -10.4 |
| European–Pacific Island Polynesian | 11,898 | 0.4 | 14,796 | 0.5 | 24.4 |
| European–other ethnic origins | 6,162 | 0.2 | 8,055 | 0.2 | 30.7 |
| New Zealand Maori–Pacific Island Polynesian | 4,242 | 0.1 | 6,090 | 0.2 | 43.6 |
| New Zealand Maori–other ethnic origin | 1,212 | – | 1,659 | 0.1 | 36.9 |
| Mixed Pacific Island Polynesian† | 2,430 | 0.1 | 2,634 | 0.1 | 8.4 |
| Pacific Island Polynesian–other ethnic origins | 801 | – | 1,209 | – | 50.9 |
| Other combinations of two ethnic origins‡ | 765 | – | 723 | – | -5.5 |
| Total, two ethnic origins | 133 359 | 4.3 | 130 047 | 4.0 | -2.5 |
| Three ethnic origins | 1 698 | 0.1 | 9 210 | 0.3 | 442.4 |
| Not specified | 36,612 | ... | 36,561 | ... | -0.1 |
| Total | 3 143 307 | 100.0 | 3 263 283 | 100.0 | 3.8 |
| Persons of New Zealand Maori origin§ | 384,933 | 12.4 | 404,778 | 12.5 | 5.2 |
| Persons of Pacific Island Polynesian origin§ | 93,066 | 3.0 | 125,850 | 3.9 | 35.2 |
All the largest ‘one ethnic origin’ groups in the New Zealand population experienced growth during the 1981–86 intercensal period. Increases ranged from 2.3 percent for European to 107.3 percent for the ‘other’ category. Pacific Island Polynesians achieved a high growth rate of 28.4 percent, while New Zealand Maori increased by 7.9 percent. The ‘European’ group's share of the population decreased from 83.4 percent at the 1981 census to 82.2 percent at the 1986 census. This was offset by increases in the proportion of the population in ‘Pacific Island Polynesian’ and ‘New Zealand Maori’ categories during the intercensal period.
An interesting trend in the mixed-origin population was the 10.4 percent decline in the ‘European–New Zealand Maori’ category during the 1981–86 intercensal period.
Changes in the size of populations belonging to the different ethnic origin categories and in their shares of the total population over the 1981–86 intercensal period reflect the different levels of natural increase, the size and directions of external migration flows, intermarriage between ethnic groups, and inter-ethnic mobility.
Table 6.28 gives a comparison of the age structure of New Zealand's major ethnic groups.
Some historical data on the ethnic composition of the population can be found in the special article, New Zealand's immigration policy, following.
Table 6.28. COMPARISON OF AGE STRUCTURE OF MAJOR ETHNIC GROUPS 1986 CENSUS*
| Age group (years) | Percentage of population in age group | |||||
|---|---|---|---|---|---|---|
| European† | New Zealand Maori‡ | Pacific Island Polynesian† | Chinese† | Indian† | Other§ | |
*Usually resident New Zealand population. † Persons of single ethnic origin. ‡ Persons of origin or descent. § Includes persons of ‘other’ single ethnic origin, and persons of two and three ethnic origins (except where one origin is New Zealand Maori). | ||||||
| 0–4 | 6.5 | 13.3 | 11.4 | 7.4 | 9.2 | 15.2 |
| 5–14 | 15.1 | 25.7 | 22.4 | 13.5 | 15.4 | 27.5 |
| 15–19 | 8.6 | 12.2 | 10.5 | 9.2 | 9.3 | 11.5 |
| 20–24 | 8.2 | 11.0 | 10.3 | 12.8 | 12.4 | 10.2 |
| 25–34 | 15.5 | 15.7 | 19.6 | 21.3 | 24.1 | 16.3 |
| 35–44 | 13.9 | 9.4 | 13.3 | 14.0 | 14.9 | 9.6 |
| 45–54 | 10.1 | 6.6 | 7.1 | 10.4 | 8.2 | 5.0 |
| 55–59 | 5.1 | 2.3 | 2.2 | 3.4 | 2.3 | 1.6 |
| 60–64 | 4.8 | 1.6 | 1.5 | 2.5 | 1.6 | 1.2 |
| 65–79 | 9.9 | 2.0 | 1.7 | 4.1 | 2.3 | 1.5 |
| 80 and over | 2.3 | 0.3 | 0.2 | 1.4 | 0.3 | 0.3 |
| Total | 100.0 | 100.0 | 100.0 | 100.0 | 100.0 | 100.0 |
Since 1945 the percentage of the resident population born in New Zealand has remained almost stable. At the 1981 and 1986 censuses, 85.6 percent and 85.1 percent, respectively, of the population was New Zealand born, as can be seen in table 6.29.
The small intercensal decline in the percentage of New Zealand-born is a consequence of the rise in natural increase (live births less deaths) recorded which was more than offset by the substantial net inflow of overseas-born migrants—especially Pacific Island Polynesian during the period.
Also evident is the reduced importance of the United Kingdom and Ireland as a source of new settlers.
Table 6.29. COUNTRY OF BIRTH OF POPULATION*
| Country of birth | 1981 census | 1986 census | Percentage intercensal change | ||
|---|---|---|---|---|---|
| Number | Percentage of specified cases | Number | Percentage of specified cases | ||
*Usually resident New Zealand population. † Persons who did not specify a country of birth. | |||||
| New Zealand | 2,679,054 | 85.6 | 2,759,178 | 85.1 | 3.0 |
| Australia | 43,809 | 1.4 | 47,208 | 1.5 | 7.8 |
| Pacific Islands | 57,999 | 1.9 | 72,963 | 2.3 | 25.8 |
| United Kingdom and Ireland | 257,589 | 8.2 | 255,762 | 7.9 | -0.7 |
| Canada | 5,508 | 0.2 | 6,411 | 0.2 | 16.4 |
| Netherlands | 21,204 | 0.7 | 24,486 | 0.8 | 15.5 |
| United States of America | 6,108 | 0.2 | 7,362 | 0.2 | 20.5 |
| India | 6,018 | 0.2 | 6,570 | 0.2 | 9.2 |
| China | 4,176 | 0.1 | 4,944 | 0.2 | 18.4 |
| South Africa | 3,999 | 0.1 | 4,320 | 0.1 | 8.0 |
| Other | 44,529 | 1.4 | 52,524 | 1.6 | 18.0 |
| Not specified† | 13,314 | ... | 21,555 | ... | 61.9 |
| Total | 3 143 307 | 100.0 | 3 263 283 | 100.0 | 3.8 |
Table 6.30 shows the overseas-born population by years of usual residence at the 1981 and 1986 censuses.
The intercensal decline in some categories is mainly the result of emigration.
Table 6.30. PERSONS BORN OVERSEAS BY YEARS OF RESIDENCE IN NEW ZEALAND
| Years of residence | 1981 census | 1986 census | Percentage intercensal change | ||
|---|---|---|---|---|---|
| Number born overseas* | Percentage of specified cases | Number born overseas* | Percentage of specified cases | ||
*Usually resident New Zealand population. † Includes persons who specified an overseas birthplace but who did not specify a duration of residence in New Zealand. ‡ Excludes persons who specified a duration of residence in New Zealand but who did not specify an overseas birthplace. | |||||
| 0–4 | 57,354 | 13.3 | 66,168 | 14.6 | 15.4 |
| 5–9 | 88,119 | 20.4 | 45,054 | 10.0 | -48.9 |
| 10–14 | 51,831 | 12.0 | 84,339 | 18.6 | 62.7 |
| 15–19 | 53,619 | 12.4 | 47,331 | 10.5 | -11.7 |
| 20 and over | 180,561 | 41.8 | 210,240 | 46.4 | 16.4 |
| Not specified† | 32,766 | ... | 29,871 | ... | -8.8 |
| Total‡ | 464 253 | 100.0 | 482 553 | 100.0 | 3.9 |
The current legislation of New Zealand citizenship is the Citizenship Act 1977, and the Citizenship (Western Samoa) Act 1982 together with the Citizenship Regulations 1978.
Under the Citizenship Act 1977, New Zealand citizenship may be acquired in the following ways: by birth in New Zealand; by descent (i.e., birth outside New Zealand); or by grant of citizenship.
Citizens under the British Nationality and New Zealand Citizenship Act 1948 (whether by birth, descent, naturalisation, registration or under transitional provisions) at 31 December 1977, retain their status under the 1977 Act. This Act also introduced citizenship by descent through the female line, and citizenship by recognition of adoption and paternity.
For people (other than spouses of New Zealand citizens or those under 18 years) who want New Zealand citizenship, the eligibility criteria are that they must:
(a) Have resided in New Zealand for the three years immediately preceding the date of application;
(b) Be entitled in the terms of the Immigration Act 1987 to reside in New Zealand permanently;
(c) Be of full capacity;
(d) Be of good character;
(e) Have sufficient knowledge of the English language and of the responsibilities and privileges attaching to New Zealand citizenship; and
(f) Intend to continue to reside in New Zealand or to enter or continue Crown service under the New Zealand Government, or service in the employment of a person, company, society, or other body of persons resident or established in New Zealand.
Citizenship can be granted also to those who marry New Zealand citizens, and to their children. Sometimes, citizenship can be granted in cases of hardship, statelessness or where the relevant parent was a citizen by descent only.
The Citizenship (Western Samoa) Act 1982 provides primarily for the grant of citizenship to any person who can establish that he or she is a Western Samoan citizen or that he or she comes within the specified degrees of association with Western Samoa; and who either:
(i) Was in New Zealand at any time on 14 September 1982; or
(ii) Lawfully entered New Zealand on or after 15 September 1982 and is entitled to reside in New Zealand permanently in terms of the Immigration Act 1987.
Adults who acquire New Zealand citizenship by grant may be asked to swear allegiance to the Queen of New Zealand. Commonwealth citizens (British subjects) whose country recognises Queen Elizabeth II as head of state are asked to take the oath on the application form. Other persons holding citizenship of a country which does not give this recognition are conditionally approved as New Zealand citizens, and are required to swear allegiance at a private or public ceremony to make the grant effective. Apart from this, the Citizenship Act treats citizens of countries other than Commonwealth on exactly the same basis as citizens of Commonwealth countries.
New Zealand citizens can have their citizenship taken away if they:
Choose a foreign nationality by any formal act other than by marriage;
Have acted in a manner which is contrary to the interests of New Zealand;
Choose to exercise any of the privileges or perform any of the duties of another nationality or citizenship which is contrary to the interests of New Zealand; or
Have obtained citizenship by fraud, false representation, mistake, or wilful concealment of relevant information.
Sometimes people can renounce New Zealand citizenship, e.g., when required to by countries like the United States of America, which won't accept dual citizenship. However, New Zealand citizenship must be renounced formally. This is because the New Zealand Government insists that New Zealand citizens should not become stateless during changes of citizenship. To protect citizens, government requires proof of citizenship in another country before giving approval to renounce New Zealand citizenship.
Applications received for the year ended 31 March 1987, totalled 12 137 compared with 11 572 during the previous year, and 12 716 persons were granted citizenship.
New Zealand is a country of immigration. The Maori people established themselves as the tangata whenua (people of the land) after historic voyages of migration from countries in the Pacific. Large scale immigration from European countries, particularly the United Kingdom, over the last 200 years changed the ethnic balance and altered the cultural base of New Zealand. This in turn has been modified by more recent migratory movements from the South Pacific and immigration from countries on the Pacific rim. Immigration has moulded our national characteristics as a Pacific country. (Burke, 1986 Review.)
The first settlers in New Zealand, the Maori, arrived in a succession of voyages between about 750 and 1350 AD from islands in the ‘Polynesian Triangle’ bounded by Hawaii in the north, the Marquesas in the east and New Zealand in the south. To this day most Maori trace their genealogy and tribal affiliation back to one or other of the great canoes which figured in those legendary journeys. While Maori occupation extended throughout the country, most settled in the more temperate North Island, a pattern still evident today.
At the time European contact with New Zealand began in the late 18th century the Maori are believed to have numbered in excess of 100 000 and the country's population and cultural heritage was wholly Polynesian. Sporadic but increasing European penetration occurred from the 1780s as British, French, American and Australia-based explorers, sealers, whalers and traders, and then missionaries pursued their enterprises. By 1839 the non-Maori population numbered around 1000.
In the unregulated frontier decades of the early 1800s ‘immigration policy’ was essentially a localised and pragmatic matter. The Maori inhabitants of New Zealand accepted, rejected or tolerated early European arrivals according to the local chiefs’ perception of the benefits the newcomers might bring by way of trade, tools and weapons. In an early expression of the principle of occupational selection, which was to become a consistent theme in New Zealand immigration policy, the great Ngapuhi chief and warrior Hongi Hika tried in 1822 to encourage the settlement at Keri Keri of British missionary George Clarke not because of his evangelical qualifications but because Clarke had previous training as a gunsmith.
The missionaries themselves would almost certainly have liked to have operated an immigration policy which prevented the arrival of people they saw as bringing un-Christian and contaminating influences to bear on the Maori population, but this was a vain and unenforceable hope.
The 1830s saw the development of a considered immigration policy of a sort, albeit one originating outside New Zealand. This was the commercially inspired scheme for ‘systematic colonisation’ promoted in the United Kingdom by Wakefield and his backers in the New Zealand Company. On the basis of theories abut selling colonial land at a ‘sufficient price’ to balance labour and capital requirements, combined with the selection of a cross-section of worthy colonists, the company promoted its schemes to investors and prospective migrants throughout the United Kingdom with salesmanship which, to say the least, understated the practical problems of establishing viable settlement in the New Zealand of that day.
Knowledge that the British Government had decided to negotiate sovereignty over New Zealand with the Maori inhabitants and to pre-empt the right to purchase land—the key ingredient in much of the speculative investment in its venture—led the company to push ahead with ill-prepared settlements in Wellington (1840), and later in Wanganui, New Plymouth and Nelson. The migrants in those ventures were almost invariably disappointed and many left New Zealand or were forced to survive quite outside the company framework. While the settlements struggled on, the company itself was largely discredited and it ceased to operate after 1850. Wakefield's theories had, however, inspired others and ‘systematic colonisation’, with a denominational bias in the selection of migrants, was responsible for the founding of Presbyterian Otago and Anglican Canterbury.
Alongside these Wakefieldian efforts other initiatives to promote settlement proceeded. A few hundred Scottish migrants were brought out in 1842; 90 boys from Parkhurst Prison arrived and several hundred discharged British soldiers were recruited to establish garrison settlements. Furthermore, the six provincial governments set up under the 1852 Constitution themselves took a hand in settlement promotion using land sales revenue to assist with fares and later promising ‘free farms’ of 40 acres. Equally important in the inflow, however, was the movement of individuals, families and small groups outside any organised framework, whose migration was motivated by personal perceptions of commercial and other opportunities particularly in the Auckland area.
Between the late 1830s and the late 1850s a pronounced shift in balance towards European cultural domination took place. On the one hand this reflected the volume of European migration but on the other it was a consequence of a substantial decline in and cultural dislocation of the Maori population. Epidemics of European diseases, to which they had no natural immunity, changed patterns and places of living in response to commercial demands and intertribal warfare (in which firearms produced casualties on an unprecedented scale) all combined to reduce the Maori population to around 60 000 in 1858.
With the development of the goldfields in the South Island in the 1860s there was a massive influx of migrants from Australia (mainly of British origin) which served not only to reinforce European cultural domination but also to shift the population distribution balance away from the North Island. This random flood of self-financed and motivated migration entirely swamped earlier governmental efforts to promote settlement. In 1863, for example, some 35 000 people arrived (mostly from Australia), which exceeded the entire European population of New Zealand in 1854.
Within a few years, however, the transient nature of the gold influx became apparent as many miners left New Zealand in the late 1860s and economic stagnation ensued. This situation led to New Zealand's first immigration legislation and an explicit and carefully structured government policy initiative to promote settlement of the country.
Julius Vogel's Immigration and Public Works Act of 1870 allocated £1,500,000 to provide free or assisted passage to migrants who were either nominated by relatives, friends or prospective employers in New Zealand, or alternatively, selected by a New Zealand agent-general established in London. Active recruitment efforts were undertaken throughout the United Kingdom, as well as in Germany and Scandinavia, for migrants who complied with certain age criteria and who had specified occupations or skills such as navvies, shepherds, mechanics and domestic servants. Vogel's programme was ambitious and effective but relatively short-lived. Sixty-three thousand migrants from Europe were assisted between 1873 and 1876 but by the middle of the decade the New Zealand economy was entering recession and the provision of assisted passages was limited in 1875 and then cut altogether in 1879.
From around this period the regulation of immigration, or rather of certain types of migrant, became a concern for government. For most of its history to date movement into New Zealand had been essentially unregulated and it was the country's insular and isolated geographic situation which acted as a practical limitation upon migrant flows. With the progressive development of cheaper, more frequent and reliable shipping connections between New Zealand and Australia, Europe, and Asia and the Pacific the moat became a highway.
The first non-European community to make use of this new ease of access was the Chinese. From the late 1860s significant numbers of Chinese began to come to New Zealand, often via Australia, to work on the goldfields of the South Island. From about 1200 in 1869 their numbers grew to 5000, almost entirely males, in 1881.
This latter date, recession and unabashed 19th century racism had combined to produce such extensive public concern about the economic and cultural impact of Asian migration that an Act was passed imposing a tax of £25 upon every Chinese person landing in the country. Subsequently, when it seemed likely that prospective Chinese settlers who were being refused entry to Australia would come on to New Zealand, legislation in 1888 provided that no vessel should bring more than one Chinese passenger per 100 tons, and in 1896 the Seddon Government raised the Chinese poll tax to £100.
The xenophobia explicit in these regulatory moves was to shape New Zealand attitudes to immigration and immigrants for decades to come. At this distance in time its origins appear to lie in a potent combination of concern to see that personal aspirations and hard won improvements in working conditions should not be undercut by cheap and pliant labour; Anglo-Celtic ethnocentricity and a shared Australasian obsession about the ambitions of the ‘Asiatic hordes’, and a strong sense of the ‘civilising’ mission of British imperialists.
While this ethnic bias was expressed in particularly virulent terms towards Asians, it was extended also to other non-British migrant sources. The arrival in the 1880s of immigrants from the Dalmation Coast of the Austro-Hungarian Empire, who were to constitute an important element in the diversification of the New Zealand population, was almost as reprehensible to Premier Seddon as Chinese migration. The Kauri Gum Industry Act of 1898 created gumfield reserves in which aliens (i.e., non-British citizens) could dig only after becoming naturalised British subjects—a measure which Seddon acknowledged as an attempt to stem the flow of Dalmatian migrants.
These public and political attitudes, which were mirrored on each side of the Tasman Sea, were codified in New Zealand in the Immigration Restriction Act of 1899 after earlier attempts failed to gain royal assent on the advice of the British Government. That Act provided that, except so far as permitted by executive discretion, no person other than one of British (including Irish) birth and parentage should be allowed to land unless they wrote and signed an application in a European language.
In subsequent years this legislation was elaborated (in 1908, 1910, 1920 and 1923) to reflect constitutional developments in the British Empire and dominion status, wartime alliances, and loopholes evident from the growing variety and volume of international travel. The essential principle of the legislation was that of free entry for persons of exclusively British and Irish birth and descent, while the entry of all other types of migrant (as distinct from temporary visitors) was subject to the discretion of the Minister of Customs. Prior application and approval and an oath of allegiance to the Crown on arrival were required.

Wharf shed, Wellington 1900s.
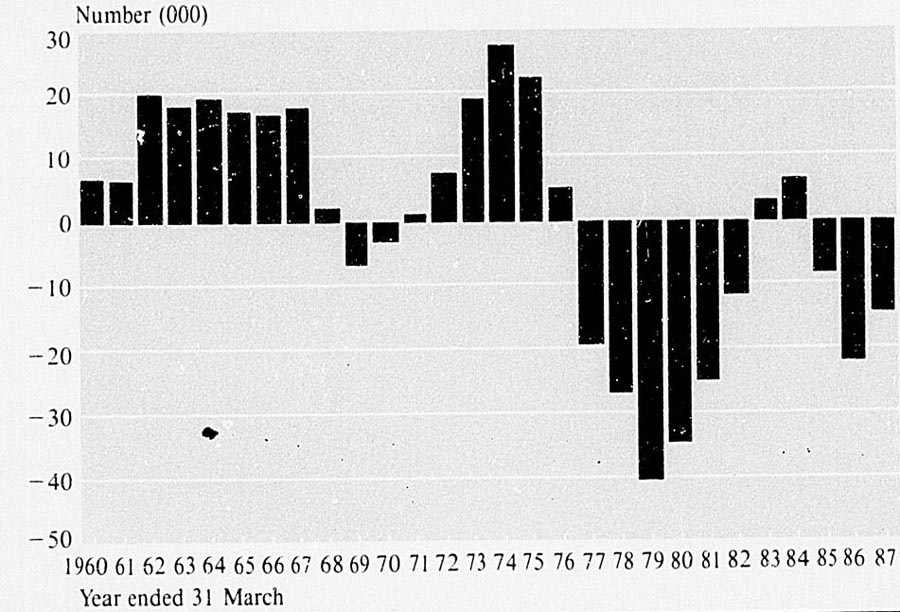
NET POPULATION CHANGE—through permanent and long-term migration
These principles, and the mechanisms of permits, visas, exemptions, prohibitions and deportation by which they were given effect, were in due course further consolidated and codified in the Immigration Act 1964. This Act vested discretionary power in the Minister of Immigration (rather than Customs) and provided the legal framework within which the government of the day could effectively exclude, restrict or facilitate the migration of certain nationals or categories of migrant as it saw fit.
Inward migration between 1910 and 1945 followed an irregular course reflecting fluctuating economic conditions, agricultural expansion in the North Island, the Depression of the early 1930s, and wartime disruption. The predominantly British character of the inflow was leavened a little by a modest trickle of fiancées or spouses joining minority groups already established, the arrival of some settlers from India, initially to work on drainage schemes, and in the 1930s by the acceptance of small numbers of European refugees from fascism.
The latter were the precursors of a much more significant and diverse flow in the years after World War II of about 5000 refugees and displaced persons from continental Europe under the auspices of the International Refugee Organisation. These elements were reinforced by over 1100 Hungarian refugees accepted between 1956 and 1959 and subsequently, from the mid-1970s, the refugee stream was broadened still further with the resettlement in co-operation with the UNHCR of people from Chile, Uganda, Iran and substantial flows from Vietnam, Laos and Kampuchea.
Acceptance of refugees and displaced people from Europe was indicative of a more positive political and public approach to immigration in the post-Second World War years, albeit one which was considerably more cautious than the ‘populate or perish’ programme adopted in Australia. The Dominion Population Committee appointed in 1945 advocated immigration, preferably from the British Isles, only so far as it was needed to fill gaps in industrial labour demand which could not be met by locally-born people. After some efforts to recruit specific skills, the government in 1947 introduced a free and assisted passage scheme to encourage immigrants from the United Kingdom. Free passage was granted to suitably qualified former British armed forces personnel and assisted passages to single migrants between 20 and 35 years old in selected industries who contracted to work for two years in approved jobs in New Zealand.
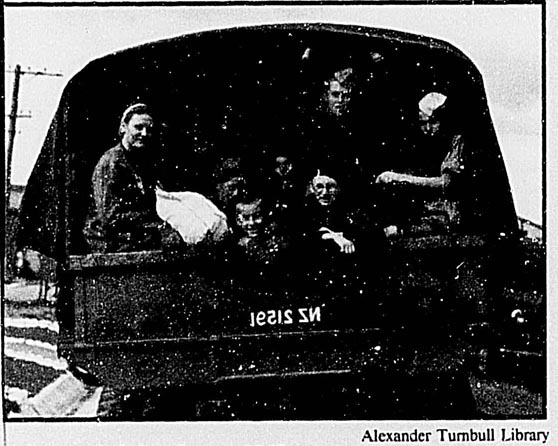
Polish refugees, 1945.
Continuing acute labour supply problems saw the programme further expanded by the newly elected National government in 1950. Free passages were extended to married tradesmen with children in the building and construction industries, along with a nomination scheme for married as well as single migrants and a raising of the age limit to 45. More significantly, a bilateral immigration agreement was negotiated with the Netherlands Government with assistance provisions which saw the number of Dutch migrants rise from 50 in 1950–51 to over 2700 in 1952–53. The total migrant inflow of 29 000 in that latter year was the highest annual intake recorded in the 20th century to that date.
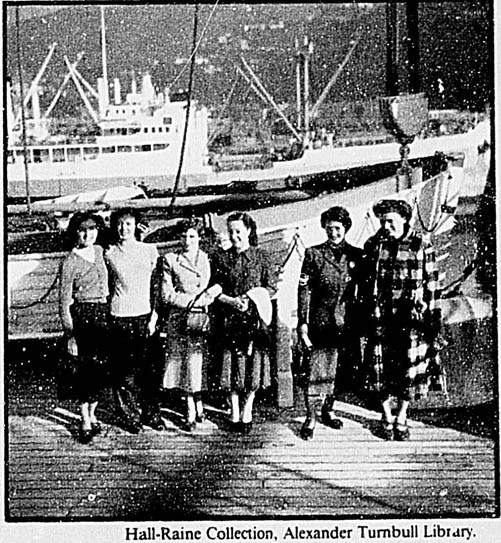
British immigrants on the Atlantis, 1951.
Immigration flows throughout the rest of the 1950s and the 1960s were characterised by erratic peaks and troughs reflecting booms and slumps in commodity prices, changed economic conditions in Europe as reconstruction proceeded, and short-term ad hoc adjustments by governments to New Zealand's immigration programme and procedures. The Suez crisis and other ‘push’ factors contributed to a peak of some 18 000 persons in 1957–58 (including 264 occupational specialists recruited from Denmark, Germany, Switzerland and Austria), notwithstanding a 1956 Immigration Advisory Council recommendation that to reduce inflation and pressure on overseas funds the targets for assisted and net immigration should be cut to 5000 and 10 000 respectively. Assisted immigration was reduced in 1958, suspended in respect of migrants from continental Europe in 1959 and replaced in 1960 by a more modest cost sharing arrangement with employee applicable only to United Kingdom migrants.
The composition of migrant inflows generally, as distinct from assisted immigrants, continued to diversify in the early and mid-1960s and British Isles born persons no longer comprised over half of the permanent and long-term arrivals.
Of particular long-term significance was the growth in migration from the South Pacific Islands (including the Cook Islands and Niue whose inhabitants are New Zealand citizens).
In an echo of the historic voyages which first populated this country, Polynesians in increasing numbers moved to New Zealand to take up employment opportunities absent in the Pacific Islands. Amongst these arrivals was a significant number of Fijian citizens of Indian descent who provided cultural reinforcement for the existing Indian community in New Zealand. Although much of the movement from the Pacific Islands was ostensibly short-term and related to temporary worker schemes, many participants acquired resident status with the result that there was a net gain of over 23 000 in the Pacific Island born population between the censuses of 1971 and 1976. That trend has re-appeared since 1981 after a hiatus of some years in the mid-1970s.
The highly erratic character of the immigration flows and policy was graphically demonstrated between 1970 and 1974. In the wake of the 1967–68 recession and the lagged emigration of workers to Australia and elsewhere, booming export prices and an acute labour shortage generated a consensus on the need for more immigration. The government in February 1970 abolished the ceiling on the United Kingdom subsidised immigration scheme, reduced the prospective immigrant's contribution to £10 and the employer's share to 25 percent of the fare, and removed the requirement for specific occupational skills. Later in the year the scheme was extended to Belgium, France, Italy, the Netherlands, Switzerland, West Germany and the United States and a publicity programme was mounted to advertise New Zealand as a country of immigration.
These measures, together with ‘push’ factors encouraging emigration from the United Kingdom, produced a record influx of 70 000 permanent and long-term immigrants in 1973–74 at the very time the boom had subsided. The resulting pressures on housing and schools and other services produced a rapid turnaround in public and political attitude to immigration and the Labour Government elected in 1972 embarked on a major review of immigration policy in June 1973. The outcome, in April 1974, was a series of controls which ended the previously unrestricted access of British migrants and required prospective permanent residents from the United Kingdom to obtain an entry permit prior to travel on the same basis as that imposed on nationals of other countries. Assisted passage schemes were terminated in 1975.
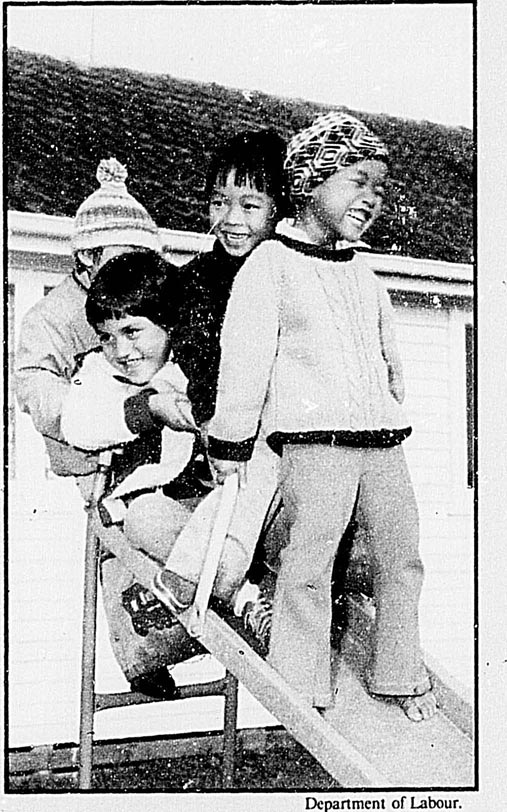
Refugee children from South-east Asia, 1970s.
In the following decade inward migration proceeded at modest levels. Outside the quota arrangements existing with the Netherlands and Western Samoa and the longstanding freedom of travel for Australians and New Zealanders across the Tasman, permanent migration to New Zealand operated within tightly drawn guidelines for entry on occupational or family relationship grounds. A relatively liberal approach was nevertheless taken in respect of refugee resettlement, with provision for acceptance of some 650 Indo-Chinese refugees annually, as well as a small quota for other nationals.
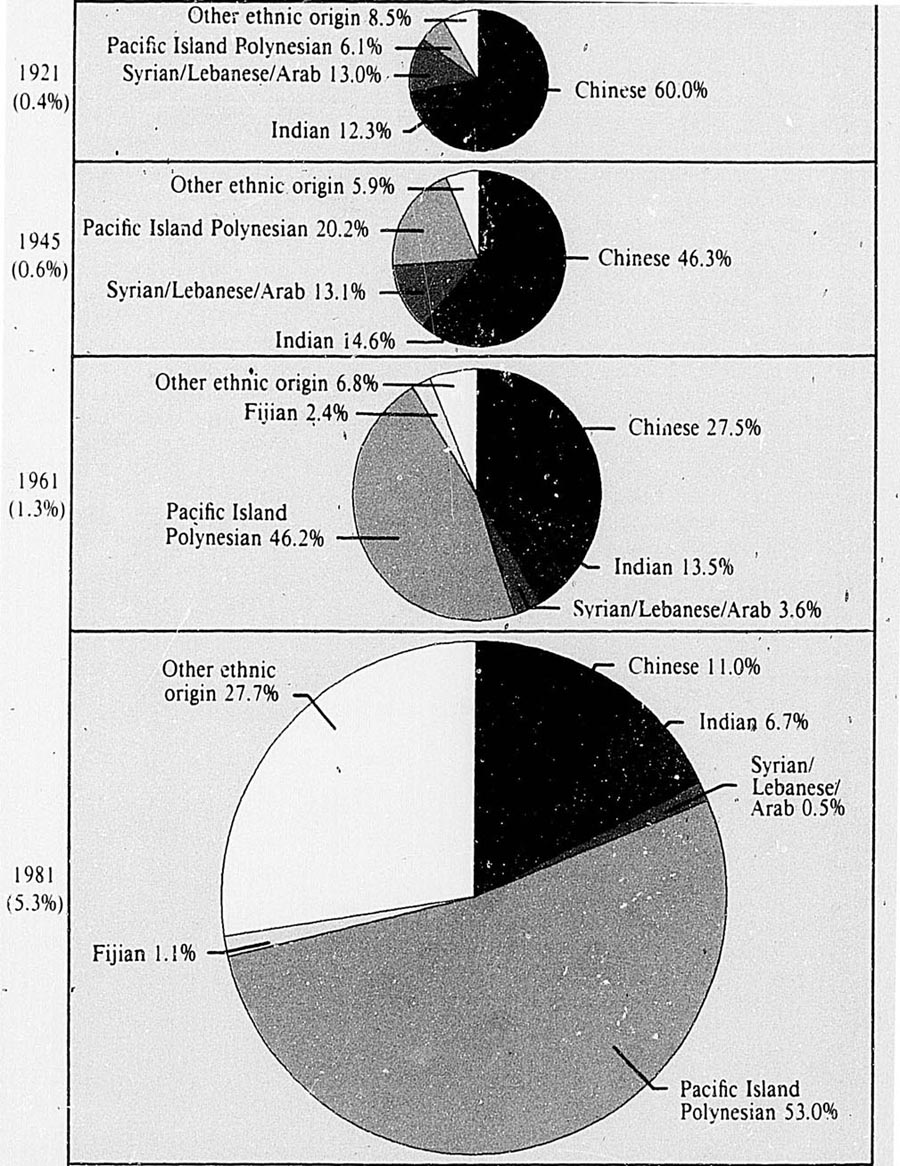
PERCENTAGE OF POPULATION OTHER THAN EUROPEAN AND MAORI
Between 1840 and 1986 immigration added over 780 000 people to New Zealand's population, accounting for almost a quarter of the country's total population growth. Much of the contribution of net immigration to population growth occurred during the early years of European colonisation, and since World War II it has been a relatively small component of New Zealand's population growth. On 1986 census figures there are around 483 000 persons resident in New Zealand who were born overseas, or about 14.8 percent of the total population. Of the overseas born, 53.0 percent came from the United Kingdom and Ireland, 9.7 percent from Australia, 7.0 percent from Samoa, 5 percent from the Netherlands and 3.2 percent from the Cook Islands. It should be noted, however, that while net immigration accounted directly for less than 16 percent of population growth since 1950, the role of new settlers has been considerably more important in demographic and cultural terms than this percentage would suggest. Immigration has served to counteract high levels of emigration, particularly since the mid-1970s, and the net outflow of 100 000 people between 1976 and 1986 could have been double that number without new permanent arrivals.
The Government elected in 1984 was pledged to review New Zealand's immigration law and policy and began this process soon after it took office. In doing so it adopted a ‘twin-track’ approach which preserved the distinction between, on the one hand, legislation and regulations as the legal framework within which policy is carried out, and on the other hand the content and qualitative aspects of immigration policy itself. How many come to New Zealand and under what conditions is considered to be a matter for the executive to decide in the light of policy adopted by the government of the day, whereas immigration law sets out the legal basis on which a person may be in New Zealand, the forms and procedures to be followed and the powers of the Minister of Immigration and officials in administering and enforcing immigration rules.
Table 6.31. SUMMARY OF PERMANENT AND LONG-TERM MIGRATION
| Year ended 31 March | Permanent and long-term arrivals (immigrants) | Permanent and long-term departures (emigrants) | Net permanent and long-term migrants |
|---|---|---|---|
| 1922 | 13,845 | 2,150 | 11,695 |
| 1925 | 15,704 | 1,946 | 13,758 |
| 1930 | 6,917 | 2,449 | 4,468 |
| 1935 | 1,579 | 3,592 | -2 013 |
| 1940 | 7,315 | 3,129 | 4,186 |
| 1945 | 1,704 | 2,392 | -688 |
| 1950 | 17,701 | 6,886 | 10,815 |
| 1955 | 19,453 | 9,012 | 10,441 |
| 1960 | 20,294 | 13,420 | 6,874 |
| 1961 | 21,424 | 14,848 | 6,576 |
| 1962 | 32,769 | 12,691 | 20,078 |
| 1963 | 32,589 | 14,454 | 18,135 |
| 1964 | 34,234 | 14,903 | 19,331 |
| 1965 | 35,446 | 18,159 | 17,287 |
| 1966 | 35,299 | 18,589 | 16,710 |
| 1967 | 38,999 | 21,128 | 17,871 |
| 1968 | 30,660 | 28,472 | 2,188 |
| 1969 | 23,225 | 29,803 | -6 578 |
| 1970 | 26,825 | 29,822 | -2 997 |
| 1971 | 39,377 | 38,165 | 1,212 |
| 1972 | 45,099 | 37,546 | 7,553 |
| 1973 | 54,651 | 35,483 | 19,168 |
| 1974 | 69,815 | 42,338 | 27,477 |
| 1975 | 65,900 | 43,461 | 22,439 |
| 1976 | 48,460 | 43,160 | 5,300 |
| 1977 | 37,020 | 56,092 | -19 072 |
| 1978 | 36,972 | 63,680 | -26 708 |
| 1979 | 40,808 | 81,008 | -40 200 |
| 1980 | 41,607 | 76,024 | -34 417 |
| 1981 | 44,965 | 69,790 | -24 825 |
| 1982 | 45,292 | 56,774 | -11 482 |
| 1983 | 45,854 | 42,674 | 3,180 |
| 1984 | 40,705 | 34,147 | 6,558 |
| 1985 | 36,243 | 44,327 | -8 084 |
| 1986 | 35,982 | 57,595 | -21 813 |
| 1987 | 44,360 | 58,629 | -14 269 |
Table 6.32. ORIGIN AND DESTINATION OF LONG-TERM AND PERMANENT MIGRANTS
| Year ended 31 March | Australia* | United Kingdom† | United States | Western Samoa* | Cook Islands and Niue* | Canada | Oceania | Europe | Asia | All other countries‡ | Total |
|---|---|---|---|---|---|---|---|---|---|---|---|
*Included in ‘Oceania’. † Included in ‘Europe’. ‡ Includes unspecified. | |||||||||||
| Permanent and long-term migrants arriving by country of last residence | |||||||||||
| 1983 | 16,078 | 10,599 | 2,407 | 1,069 | 731 | 1,048 | 21,322 | 13,641 | 3,582 | 3,854 | 45,854 |
| 1984 | 15,771 | 7,617 | 2,123 | 1,062 | 559 | 972 | 21,034 | 9,882 | 3,923 | 2,771 | 40,705 |
| 1985 | 12,537 | 6,611 | 2,011 | 1,514 | 602 | 848 | 18,222 | 8,484 | 4,156 | 2,522 | 36,243 |
| 1986 | 10,657 | 8,128 | 2,021 | 1,458 | 620 | 952 | 15,913 | 10,163 | 4,112 | 2,821 | 35,982 |
| 1987 | 13,388 | 11,334 | 2,435 | 1,752 | 905 | 1,308 | 19,259 | 13,573 | 5,024 | 2,761 | 44,360 |
| Permanent and long-term migrants departing by country of next residence | |||||||||||
| 1983 | 23,096 | 6,311 | 2,007 | 685 | 583 | 671 | 27,010 | 7,613 | 2,609 | 2,764 | 42,674 |
| 1984 | 14,097 | 7,812 | 1,842 | 584 | 533 | 550 | 17,670 | 9,117 | 2,314 | 2,654 | 34,147 |
| 1985 | 21,964 | 9,216 | 1,859 | 658 | 476 | 603 | 26,098 | 10,532 | 2,220 | 3,015 | 44,327 |
| 1986 | 33,235 | 10,012 | 2,108 | 718 | 498 | 704 | 37,599 | 11,423 | 2,373 | 3,388 | 57,595 |
| 1987 | 34,320 | 10,302 | 1,949 | 626 | 613 | 769 | 38,412 | 11,766 | 2,389 | 3,344 | 58,629 |
In tackling law reform the Government recognised, as had its predecessor, that the 1964 Immigration Act, with its antecedents in the 1908 and 1920 legislation, was out of date and ineffective in a number of ways. Legislation designed to deal with a comparatively small number of travellers who could afford to come to New Zealand and who arrived by sea with an entry permit system administered at the port of arrival, could no longer cope with the volume and variety of modern travel. More flexible arrangements were required to control and vary as appropriate the terms on which people are admitted to New Zealand.
The solution adopted was to focus on a system of permits to ‘be in’ New Zealand, rather than permits to ‘enter’ New Zealand. The change clarifies and simplifies the determination of a person's immigration status and does away with the highly technical legal argument which has sometimes arisen in the past from the time or manner of an individual's entry to New Zealand. It also provides the minister and immigration officials with much greater flexibility to vary, renew or extend permits as appropriate to the circumstances. The new legislation also addressed the distinction between New Zealand citizens and non-citizens by emphasising the right of New Zealand citizens to be in New Zealand at any time. By contrast people not New Zealand citizens either have to have an appropriate permit or qualify for an exemption from that requirement in order to be lawfully in New Zealand.
The other major new element in what was to become the Immigration Act 1987 lay in its treatment of persons who breach immigration law. Under the 1964 Act persons in breach of the law were prosecuted for a criminal offence and if convicted were liable for deportation. The consequence was creation of a criminal record and severe barriers to future travel, not only to New Zealand but to other countries as well.
The new legislation aims at a more humanitarian approach which strikes a better balance between long-term adverse effects on an individual and the need for firm action to ensure those unlawfully in New Zealand leave the country. Accordingly, provision is made for dealing with breaches of immigration law as a civil rather than a criminal matter and a clear distinction is drawn between ‘deportation’ and ‘removal’ from New Zealand and the consequences of each. Deportation is restricted in its application to persons involved in very serious matters, such as criminal activities or terrorism, who are permanently prohibited from returning to New Zealand. People found to be unlawfully in New Zealand are subject to the less harsh action of ‘removal’ from the country, and after a period of five years may again be eligible to obtain another permit to be in New Zealand.
More generally, the 1987 Act seeks to establish a balance between effective enforcement of immigration law and protection of individual rights. Various provisions are intended to ensure that immigration decisions are taken in accordance with the principles of natural justice and fairness, that immigrants and visitors have the opportunity for legal issues to be examined in the courts, and that humanitarian considerations are appropriately taken into account. Certain specified powers are conferred upon immigration officers to require the production of documents and to inspect accommodation and employment records. However, these do not extend to a general power of search or entry and the power of arrest continues to be confined to sworn police officers only.
Consistent with the Government's broader policy stance that in general costs should be recovered for products and services provided to specific user groups, the Act provides for fees and charges to be levied for immigration transactions. Subsequent to the passage of the Act fees for a range of visas and permits and other services were fixed by regulation and these are subject to periodic review.
In undertaking the review of immigration policy the Government proceeded from the basis that, for reasons of national security and economic and social considerations, controls over immigration to New Zealand needed to be retained. But, while maintaining the broad structure of immigration arrangements, the Government established some broad policy objectives and principles. These in turn led to some significant changes in the practical operation of various rules and requirements.
These objectives and principles included explicit reference to the role of immigration in enriching the multicultural social fabric of New Zealand society; provision for visitors and the reunion of New Zealand citizens and residents with their close relatives overseas; upholding New Zealand's international obligations and humanitarian traditions in respect of refugees; and the selection of new immigrants (outside longstanding bilateral preferential access arrangements with Australia, the Netherlands and Western Samoa) on personal merit without discrimination on grounds of race, national or ethnic origin, colour, sex or marital status, religion or ethical belief.
Immigrants are now selected on the basis of personal merit rather than national or ethnic origin. This is a significant departure from the bias in favour of the British and West Europeans which had shaped New Zealand migrant flows for almost a century. The change reflects a new public opinion that discrimination related to the accident of birth is no longer acceptable and an acknowledgement that diversity would enrich rather than weaken New Zealand society. There is also widespread recognition of the vitality contributed to Australian economic and cultural life by that country's acceptance of migrants from a wide range of sources.
In practical terms, the adoption of a non-discriminatory approach involved the abandonment of the so-called ‘traditional source’ preference for nationals of the United Kingdom and Western Europe, Canada and the United States. New Zealand employers recruiting abroad can now select prospective migrants solely on the basis of their personal merits, qualifications and availability. In consequence, applications from nationals from South Pacific countries, which had not been classified as ‘traditional sources’, along with those from other developing countries, are assessed on an equal basis. As a corollary to this change private overseas students who complete their qualifications in New Zealand and comply with occupational migration criteria may obtain residence status without having first to demonstrate that their skills are not in demand in their home country.
Other significant changes introduced by the review relate to migration on the basis of occupational skills. Included here is the regular review, in consultation with central employer, manufacturer and trade union organisations, of the Occupational Priority List of skills for which demand is such that employers may recruit abroad without further clearance from the immigration authorities. Also, the guideline that a prospective migrant should have no more than four children was abandoned in favour of a more flexible and rational income test to ensure that a family can secure adequate accommodation without government assistance.
Elsewhere in the ‘economic’ stream of migration, there are increased opportunities for business immigration. The focus has been changed from the selection of specific proposals submitted by prospective migrants to an assessment of the people involved and whether they have a demonstrated record of proven business ability. Against the background of the wider restructuring and deregulation undertaken by the Government, the view was taken that it was inappropriate to seek to channel investment into certain ‘preferred’ sectors and entrepreneurs should be able to apply their resources where they identified the best opportunities for growth and profit.
‘Social’ immigration—the reunion with the family in New Zealand of close relatives overseas—is an important element in migration, given that nearly 500 000 residents of New Zealand were born overseas and the way in which chain migration can operate. In this area the Government decided to make more flexible the stringent guidelines laid down in 1974 and to adopt a more humane approach in which eligibility is determined according to where the ‘centre of gravity’ of the family lies. In addition, a new avenue for migration to New Zealand was established through provision for a New Zealand resident to sponsor the entry of a close relative for whom a job offer is secured which will utilise that relative's ‘worthwhile skill’.
The third broad category of permanent migration to New Zealand is humanitarian and refugee entry. In this area the review signalled the Government's intention to introduce legislation to clarify and improve procedures for determining the refugee status of persons seeking asylum in New Zealand. Because the issues involved are very different from those examined in the course of normal immigration applications and there are formal international obligations to be met this will be covered by separate legislation. More generally in this context, the Government's review canvassed the issues associated with the acceptance by New Zealand of refugees in co-operation with UNHCR and national voluntary agencies. It endorsed New Zealand's commitment to such a programme and subsequently the Government approved an ongoing rolling annual intake of 800 refugees and funded a reception centre in Auckland and programmes of assistance on arrival.
Other sections of the review addressed issues relating to various categories of people coming temporarily to New Zealand, including visitors engaging in employment, students and work scheme participants from Pacific Island states. Of greater significance to total temporary and long-term migratory movement in and out of New Zealand, however, was the review's reaffirmation of the special relationship with Australia and the importance of the Trans-Tasman Travel Arrangement (TTTA).
Under the arrangement and some regulatory provisions put in place after passage of the 1987 Act, Australian citizens and permanent residents may freely enter New Zealand without prior authority and reside here indefinitely.
For their part New Zealand citizens are exempt from the Australian visa regime and may freely enter and reside indefinitely in Australia. This freedom of travel between the two countries, which has existed since the earliest days of European settlement, was seen by the review to be of fundamental importance as Closer Economic Relations and other links between the trans-Tasman partners have been progressively developed.
Since the early 1970s exchanges of migrants across the Tasman have dominated external migration trends. In the last decade about one-third of immigrants to New Zealand have come from Australia, in comparison with one-fifth from the United Kingdom. Conversely, over half of all people departing from New Zealand have gone to Australia, and New Zealanders living there now total some 200 000, the fourth largest overseas-born population group.
It is still too soon to drawn definitive conclusions about the impact of policy changes introduced in the 1986 review. This is because of both the time lag in the immigration process and the effect of other variables such as labour market demand and external political events.
Since 1986 events such as the Chernobyl nuclear accident, civil disorder and coups in Sri Lanka and Fiji, and international publicity about New Zealand's nuclear free and economic restructuring policies have generated a high level of interest in migration to New Zealand. Together with the expanded eligibility rules, this has resulted in a near doubling in the number of residence permits granted annually. Within this number there have been noticeable percentage increases, albeit from a small base, in permits granted to nationals of some countries other than the so-called ‘traditional sources’ of the past. These trends may, however, be skewed in that they also reflect the impact of ‘regularisation’ programmes operating at the time of introduction and implementation of the new immigration legislation. ‘Regularisation’ saw the granting of residence, outside normal selection criteria, to some persons already in New Zealand whose immigration status was unlawful or uncertain.
It remains to be seen over the longer term to what extent this more diverse range of migrant sources becomes an established pattern. In the area of business immigration, however, a dramatic growth has already become apparent. By comparison with some 200 approved cases in seven years under pre-1986 policy, around 500 business immigrant applications have been approved in 18 months under the new guidelines. Successful applicants have come from over 20 countries but particular interest has been shown by people from Fiji, Malaysia, Hong Kong and Taiwan.
In tabling the 1986 Review of Immigration Policy in Parliament the then minister noted that the process of review must be a continuing one so that immigration policy takes account of changes within New Zealand and in this country's relations with the wider world. Looking ahead to 1990 and beyond it is possible to identify several areas for attention.
At the administrative level there is the implementation of the major restructuring of the Department of Labour and the establishment within the new corporate structure of a largely autonomous New Zealand Immigration Service responsible for service to clients both within New Zealand and overseas.
On the legal side there will be a testing of the practical operation of the new legislation, particularly in relation to its compliance and removal provisions, which will in all probability involve challenge and interpretation in the courts.
In policy terms there is a broad range of issues identified by the review, the Royal Commission on Social Policy and others relating to the place of migrant groups in a bicultural and multicultural New Zealand society and to their special post-arrival needs (e.g., English as a second language programmes). More specifically there are the policy implications to be considered of the recently published Institute of Policy Studies report International Migration and the New Zealand Economy—A Long Run Perspective. That report, which is based on extensive computer modelling of various levels of immigration suggests that in the restructured and deregulated New Zealand economy of the 1980s the concerns about adverse inflation, foreign exchange, employment and other impacts which shaped immigration policy in the 1960s and 1970s no longer hold true. It concludes that a sustained net immigration inflow of around 15 000 people annually through to the year 2001 would support rather than detract from current economic goals.
New Zealand's immigration policy is designed to encourage the entry of people whose skills are in demand in New Zealand, while protecting domestic employment opportunities for New Zealand citizens and residents. At the same time, considerable emphasis is placed on humanitarian considerations such as the reunion of families, and the provision of settlement opportunities for refugees. The greatest possible facilitation of tourist travel is also aimed at.
All travellers, including New Zealand citizens, who arrive in New Zealand are required to produce a valid passport or some other acceptable recognised travel document. Members of the armed forces of any country (and crew of craft transporting such members) are exempt from this requirement if they are in New Zealand with the consent of the Government of New Zealand, and provided they carry military identification documents.
Except for New Zealand citizens and certain other categories of travellers specified under the Immigration Act 1987, all persons entering New Zealand are required to obtain permits to be in New Zealand. Anyone intending residence or to work or study or undergo medical treatment in New Zealand should seek a visa before setting out on their journey.
Visitor permits for people wishing to make tourist or business visits to New Zealand are generally granted for an initial period of three months and may be extended up to 12 months. Visitors from a number of countries do not require visas provided the purpose of entry is for tourism, for business, or to visit family and friends, and the traveller has out ward tickets and adequate means of support.
Residence and other permits are deemed to expire when the holders leave New Zealand. Non-New Zealand citizens who have been granted residence and who wish to preserve this status on return from overseas travel should therefore obtain a Returning Resident's Visa. These are normally current for a period of four years (and may be replaced) and entitle the holder to leave and return to New Zealand on any number of occasions while the visa remains valid.
Australian citizens travelling on Australian passports do not require visas, are exempt from New Zealand permit requirements (but not from other provisions of the Immigration Act), and may stay indefinitely in New Zealand. Australian residents with current Australian resident return visas do not require visas to come to New Zealand and are granted residence permits on arrival.
Applications for residence on occupational grounds are considered in the light of the current demand in the New Zealand labour market for particular skills or qualifications. Skill shortages are identified by national surveys of job vacancies and consultation with central employer, manufacturer and union organisations. The Occupational Priority List identifies those skills for which employers may recruit qualified migrants overseas. Applicants whose skills are not on the list may also be approved provided certain extra conditions are met by the applicant and prospective employer. A firm job offer from a New Zealand employer in a field appropriate to the applicant's skills and qualifications is required in all cases.
In general the main applicant for residence on occupational grounds must be aged under 46 and all family members must meet normal health and character requirements. If married with dependent children applicants are subject to an income test to ensure they can obtain adequate accommodation without government assistance. An interview to assess the settlement prospects and English language capacity of the principal applicant and spouse is normally required.
Applicants under the business immigration policy are assessed on their potential contribution to New Zealand, with account being taken of previous demonstrated business record and skills, investment capital available (in addition to funds required for personal establishment in New Zealand) and intended business activities. Applicants are expected to become genuine residents contributing fully to the New Zealand community. The main applicant and family need to satisfy standard health, character and interview requirements.
Spouses of New Zealand citizens or residents are eligible to be granted residence subject to the immigration authorities being satisfied that the relationship is a bona fide one.
Parents with no dependent children are eligible to be reunited with their adult children who are citizens or residents of New Zealand, if they have no children in their home country; or more children in New Zealand than in any other single country; or where they have an equal number of children in New Zealand and in the home country.
Unmarried dependent children (under 17 years of age) are eligible if they have no children of their own and they were declared in their parent's application for residence in New Zealand. Adult children, brothers and sisters are eligible if they are single, without children and alone in their home country.
Adult children, brothers and sisters (whether or not married or with children) can be formally sponsored for settlement in New Zealand by a brother, sister or parent, who has been a lawful resident of New Zealand for three years. To be eligible, the overseas relative must be under 46 years of age, have a worthwhile skill with appropriate training and the required number of years of relevant work experience, and have a firm offer of a job relevant to his or her qualifications.
All family reunion applicants must meet health and character requirements. In addition, adult children, brothers and sisters sponsored on the basis of a worthwhile skill (and all members of their families over 12 years of age) must have adequate English language skills.
Scope exists for the Minister of Immigration to consider residence applications which would not qualify in terms of normal occupational criteria from people who have distinguished themselves in the arts or sciences, or in public or cultural life overseas, or who have been actively involved in promoting or protecting New Zealand's interests overseas.
Under a longstanding bilateral agreement up to 1000 occupational migrants from the Netherlands may be accepted annually, subject to standard age, health and character requirements, but with employment and accommodation aspects guaranteed by the Netherlands Emigration Service.
A longstanding arrangement (dating from the 1960s) provides that up to 1100 Western Samoan citizens (including dependants) may be accepted for residence each year subject to a guarantee of employment without specific skill requirements and to standard age, health and character requirements.
The admission and settlement of refugees who come within the mandate of the United Nations High Commissioner for Refugees operates under an annual intake of up to 800 persons subject to the availability of community sponsorship. Allocation of settlement places within this intake is determined by the Minister of Immigration in consultation with the Minister of Foreign Affairs and other agencies, and selection takes into account the humanitarian circumstances of each case and any previous association or links with New Zealand.
People who wish to work in New Zealand on a temporary basis (usually up to three years) may be issued visas to travel for that purpose. This facility may be used by people on exchange programmes, people with finite work contracts, people coming from overseas to honour service contracts on equipment, and in similar cases. Visitors who wish to work while in New Zealand, whether for a New Zealand employer or on behalf of an overseas company, must apply for a work permit; otherwise visitors are prohibited from working here. This requirement does not, however, affect Australian citizens who wish to work while in New Zealand, nor does it affect people born in the Cook Islands, Niue or Tokelau who are New Zealand citizens and therefore have unrestricted right to be in New Zealand.
New Zealand has special work permit schemes in operation for citizens of Tonga, Western Samoa, Kiribati and Tuvalu under which selected workers may undertake employment in response to specific job offers from New Zealand employers. Appropriate arrangements are required on the part of employers and/or nominating governments to ensure the financial and other welfare and accommodation of participants.
Visas may be issued to overseas students to undertake approved courses of study, provided they make prior application and meet a number of requirements (including producing evidence of the availability of the necessary funds for their maintenance and return home when their course is completed). Students from developing nations in the South Pacific and South-east Asia currently have preference in the allocation of available places.
The Immigration Act 1987 makes provision for the removal of people who are unlawfully in New Zealand. People who are removed from New Zealand are not eligible to return for a period of five years starting from the date of departure from New Zealand. The Act also provides for the right of appeal through two channels: appeals to the High Court on questions of fact and law, and to the Minister of Immigration on humanitarian grounds that it would be unjust or unduly harsh and would not be contrary to public interest for that person to be removed. Any appeal must be lodged within 21 days after service of the removal warrant.
The Immigration Act 1987 provides for the deportation of persons threatening national security; suspected terrorists; and criminal offenders. A deportation order remains in force from the date on which it is served until the person named in the order leaves New Zealand, unless it has been quashed or revoked under the provisions of the Act. A deportee is not permitted to return to New Zealand at any time or for any purpose without special permission from the Minister of Immigration. A right of appeal to both the High Court and the Deportation Review Tribunal exists for persons ordered to be deported for criminal offences. All appeals against deportation orders must be lodged within 21 days after the day on which the order is served on the person named in the order.
Immigration legislation and policy is administered by the New Zealand Immigration Service of the Department of Labour. The service comprises a General Manager's Office in Wellington (P.O. Box 4130) and regional or branch offices in Auckland, Manukau, Hamilton, Palmerston North, Wellington, Christchurch and Dunedin. Officers also operate under delegated authority in New Zealand's diplomatic and consular missions overseas.
Further information about immigration policy and/or application forms and details of fees and charges may be obtained from New Zealand diplomatic or consular representatives (see section 4.3) or at any of the above places.
Statistics on the New Zealand Maori population from the 1986 census are based on the ‘origin or descent’ concept (see ‘Ethnicity’ in preceding section) and are closely comparable with previous census statistics. This definition was adopted as the best option for analysing Maori population growth and distribution. It was also considered more relevant to the present-day requirements of users in that it is referred to in legislation pertaining to New Zealand Maori and used to measure the Maori electoral population. Persons who described themselves as belonging to one, two or three ethnic categories, one of which is ‘New Zealand Maori’, are defined as belonging to the ‘origin or descent’ category.
Table 6.33 below compares the Maori population usually resident in New Zealand at the 1981 and 1986 censuses by age group.
When the intercensal change is analysed on a consistent age group basis, i.e., the age groups 0–4 years, etc., at the 1981 census, are compared with the 5–9 years age groups, etc., at the 1986 census, the contribution made by net external migration and natural increase to New Zealand Maori population growth can be seen.
Table 6.33. NEW ZEALAND MAORI POPULATION BY AGE GROUP*
| Age group (years) | 1981 census | 1986 census | Intercensal change (percent) | ||
|---|---|---|---|---|---|
| Number | Percentage | Number | Percentage | ||
*Persons of Maori origin or descent usually resident in New Zealand. | |||||
| 0-4 | 53,469 | 13.9 | 53,760 | 13.3 | 0.4 |
| 5-9 | 55,176 | 14.3 | 51,060 | 12.6 | -7.4 |
| 10-14 | 54,378 | 14.1 | 52,932 | 13.1 | -2.7 |
| 15-17 | 30,234 | 7.9 | 30,858 | 7.6 | 2.0 |
| 18-19 | 19,812 | 5.1 | 18,561 | 4.6 | -6.4 |
| 20-24 | 39,633 | 10.3 | 44,400 | 11.0 | 12.0 |
| 25-29 | 29,316 | 7.6 | 36,117 | 8.9 | 23.1 |
| 30-34 | 23,553 | 6.1 | 27,258 | 6.7 | 15.6 |
| 35-39 | 17,673 | 4.6 | 21,762 | 5.4 | 23.1 |
| 40-44 | 16,221 | 4.2 | 16,389 | 4.0 | 1.0 |
| 45-49 | 13,047 | 3.4 | 14,907 | 3.7 | 14.2 |
| 50-54 | 10,617 | 2.8 | 11,787 | 2.9 | 11.0 |
| 55-59 | 7,722 | 2.0 | 9,225 | 2.3 | 19.5 |
| 60-64 | 5,469 | 1.4 | 6,345 | 1.6 | 16.0 |
| 65-69 | 3,981 | 1.0 | 4,020 | 1.0 | 1.1 |
| 70-74 | 2,484 | 0.6 | 2,703 | 0.7 | 8.9 |
| 75-79 | 1,260 | 0.3 | 1,521 | 0.4 | 21.0 |
| 80 and over | 891 | 0.2 | 1,164 | 0.3 | 30.2 |
| Total | 384 933 | 100.0 | 404 775 | 100.0 | 5.1 |
At the 1986 census the New Zealand Maori population was significantly younger in age structure than the total population. This youthfulness is demonstrated by the fact that 39.0 percent of Maori were under 15 years of age, compared with 24.4 percent of the total population. In contrast, only 3.9 percent of Maori were 60 years of age and over at that time, the corresponding figure for the total population being 14.7 percent.
These differences reflect both the higher historical fertility (in terms of birth numbers) and mortality levels of the Maori population relative to the total population. The impact of the levels and directions of net external migration on the age structures of the two populations has been much less.
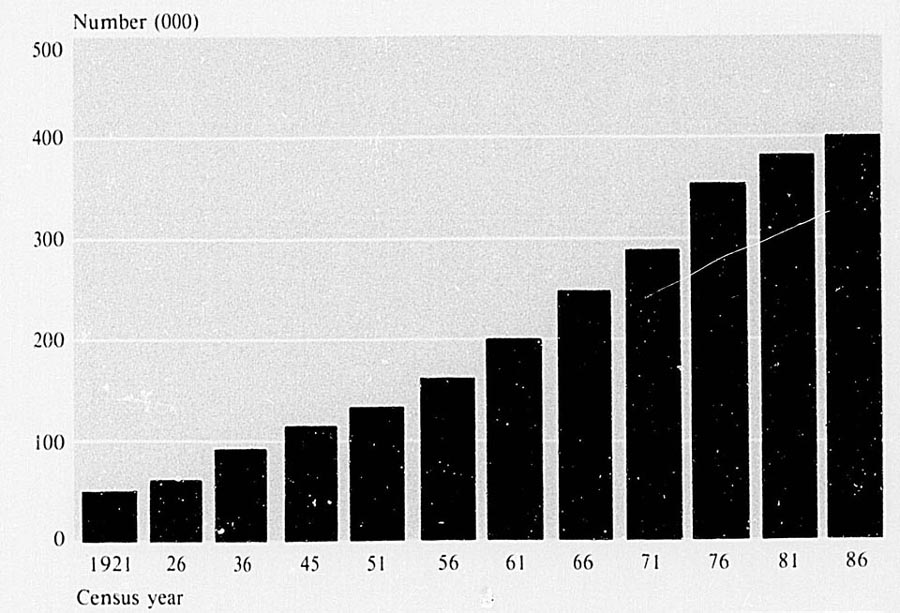
MAORI POPULATION
The decline in the New Zealand Maori populations in all age groups (except the 0–4 years age group) at the 1986 census relative to the adjacent younger age group at the 1981 census, indicates a net external emigration of Maoris during the intercensal period. At the older age groups the impact of mortality has also influenced this decrease. Maori birth numbers during this period have remained stable, as can be seen from the 1981 and 1986 census populations in the 0–4 age group.
Changes in the distribution by local government region of the usually resident New Zealand Maori population between the 1981 and 1986 censuses are shown in table 6.34. Maori continue to be concentrated in the North Island regions (where 89.1 percent live) and more especially in the northern local government regions—Northland, Auckland, Bay of Plenty and Waikato. However, the proportion of the Maori population in the North Island regions declined slightly, from 89.6 percent at the 1981 census to 89.1 percent at the 1986 census.
The South Island's share of the Maori population accordingly showed a slight increase, from 10.1 percent to 10.4 percent, during the intercensal period. Canterbury, the only local government region in the South Island with a significant level of Maori settlement, received the bulk of this increased share and contained 4.2 percent of the Maori population at the 1986 census.
Redistribution of the New Zealand Maori population during the 1981–86 intercensal period is the result of variations in the relative levels of natural increase (births less deaths) in the local government regions and the impact of both internal and external migration flows. The South Island has received small net gains in its Maori population through net internal migration.
Table 6.34. NEW ZEALAND MAORI POPULATION BY LOCAL GOVERNMENT REGION*
| Local government region | 1981 census | 1986 census | Intercensal change (percent) | ||
|---|---|---|---|---|---|
| Number | Percentage | Number | Percentage | ||
*Persons of Maori origin or descent usually resident in New Zealand. † Includes population of Great Barrier Island County. Chatham Islands County, extra-county islands, and shipping. | |||||
| North Island— | |||||
| Northland | 28,671 | 7.4 | 30,675 | 7.6 | 7.0 |
| Auckland | 93,522 | 24.3 | 98,763 | 24.4 | 5.6 |
| Thames Valley | 6,234 | 1.6 | 6,222 | 1.5 | -0.2 |
| Bay of Plenty | 43,377 | 11.3 | 44,574 | 11.0 | 2.8 |
| Waikato | 38,682 | 10.0 | 40,281 | 10.0 | 4.1 |
| Tongariro | 11,868 | 3.1 | 11,388 | 2.8 | -4.0 |
| East Cape | 20,115 | 5.2 | 20,664 | 5.1 | 2.7 |
| Hawke's Bay | 26,247 | 6.8 | 27,318 | 6.7 | 4.1 |
| Taranaki | 11,676 | 3.0 | 12,210 | 3.0 | 4.6 |
| Wanganui | 12,177 | 3.2 | 12,546 | 3.1 | 3.0 |
| Manawatu | 10,863 | 2.8 | 11,706 | 2.9 | 7.8 |
| Horowhenua | 5,511 | 1.4 | 5,913 | 1.5 | 7.3 |
| Wellington | 31,482 | 8.2 | 33,570 | 8.3 | 6.6 |
| Wairarapa | 4,623 | 1.2 | 4,713 | 1.2 | 1.9 |
| Total, North Island | 345 048 | 89.6 | 360 543 | 89.1 | 4.5 |
| South Island— | |||||
| Nelson Bays | 2,736 | 0.7 | 2,913 | 0.7 | 6.5 |
| Marlborough | 2,508 | 0.7 | 2,634 | 0.6 | 5.0 |
| West Coast | 1,581 | 0.4 | 1,827 | 0.4 | 15.6 |
| Canterbury | 15,264 | 4.0 | 16,884 | 4.2 | 10.6 |
| Aorangi | 2,901 | 0.8 | 2,595 | 0.6 | -10.5 |
| Clutha-Central Otago | 1,719 | 0.4 | 2,097 | 0.5 | 22.0 |
| Coastal-North Otago | 4,191 | 1.1 | 4,749 | 1.2 | 13.3 |
| Southland | 8,124 | 2.1 | 8,583 | 2.1 | 5.6 |
| Total, South Island | 39 024 | 10.1 | 42 282 | 10.4 | 8.3 |
| Extra-county islands and shipping† | 858 | 0.2 | 1,965 | 0.4 | 129.0 |
| Total, New Zealand | 384 933 | 100.0 | 404 775 | 100.0 | 5.2 |
The earliest reliable statistics on the Maori population show a predominance of males. In 1881 there were 81.1 females per 100 males and the gap has progressively closed until in 1976, there were 98.9 females to every 100 males. At the 1986 census, for the first time, females outnumbered males. There were 201 129 males and 202 056 females in the total Maori population, representing a sex ratio of 100.5 females to every 100 males.
Maoris have a substantially higher rate of natural increase than non-Maoris, due largely to a higher birth rate, which in turn is due mainly to the more youthful age structure. Table 6.35 shows demographic indexes based on those of half or more New Zealand Maori descent.
The Maori fertility rate has undergone a rapid and significant decline in the last 25 years, falling from an estimated 6.18 births per woman in 1962 to 2.21 births per woman in 1985. As a consequence, the gap between Maori and non-Maori average family size, as implied by total fertility rate, has narrowed over the years. In 1962 the difference between the Maori and non-Maori total fertility rates was 2.0 births per woman; by 1985 this had narrowed to 0.5 births per woman. However, unlike their non-Maori counterparts, Maori women are still reproducing above the ‘replacement level’ and have an earlier childbearing pattern. In 1985 the median age at childbearing was 23.3 years for Maori women and 26.9 years for non-Maori women.
Table 6.35. MAORI DEMOGRAPHIC INDEXES
| Year | Live births | Deaths | Rate of natural increase*‡ | Reproduction rates | ||||
|---|---|---|---|---|---|---|---|---|
| Number | Crude birth rate* | Total fertility rate† | Number | Crude death rate* | Gross | Net | ||
*Per 1000 of mean population. † Average number of births a woman would have during her reproductive life if she was exposed to the fertility rates characteristic of various childbearing age-groups. ‡ Excess of births over deaths. | ||||||||
| 1982 | 6,216 | 21.97 | 2.28 | 1,318 | 4.66 | 17.31 | 1.09 | 1.05 |
| 1983 | 6,271 | 21.90 | 2.24 | 1,326 | 4.63 | 17.27 | 1.07 | 1.03 |
| 1984 | 6,745 | 23.07 | 2.35 | 1,263 | 4.36 | 18.91 | 1.14 | 1.10 |
| 1985 | 6,469 | 22.07 | 2.21 | 1,272 | 4.34 | 17.73 | 1.08 | 1.04 |
| 1986P | 6,513 | 22.01 | 2.16 | 1,225 | 4.14 | 17.87 | 1.04 | 1.00 |
| 1987P | 6,912 | 23.33 | 2.29 | 1,205 | 4.03 | 19.30 | 1.11 | 1.07 |
In 1985, the average life expectancy of Maori males was 67.4 years, compared with 71.3 years for Maori females while for non-Maoris, life expectancies were 71.2 years for males and 77.1 years for females. Therefore, Maori females were expected to outlive Maori males by nearly four years, and non-Maori females were expected to outlive non-Maori males by nearly six years. Over the past 35 years, Maoris have recorded much greater gains in life expectancies than have non-Maoris, as shown in table 6.36. In spite of these gains, however, the life expectancy for Maori males is still almost four years lower than that for non-Maori males and the life expectancy for Maori females is nearly six years lower than that for non-Maori females.
The Treaty of Waitangi, which sets out the basis for a harmonious bicultural society, has recently been brought to the forefront of debate on race relations (see section 3.1, Constitution). The role of the Department of Maori Affairs has also been under careful consideration by both the Government and the Maori community, and this issue has served as a focus for a wide-ranging assessment of relations between the two signatories to the treaty.
The Treaty of Waitangi has always been recognised within Maori society as an affirmation of rights and highly valued as a taonga, a sacred pact, entered into by the ancestors of today's New Zealanders. It has moved from obscurity through various levels of importance and now occupies an important position in relation to much of the Government's activities.
The landmark 1987 Court of Appeal case, New Zealand Maori Council v the Crown (see section 14.1, Land resources and ownership), saw the special relationship between the Maori people and the Crown as one of an ongoing partnership, requiring the partners to act reasonably and with the utmost good faith towards each other.
This tribunal considers claims from any Maori who considers he or she or any group of Maori of which he or she is a member, is prejudiced by any Act, policy or practice by or on behalf of the Crown which is inconsistent with the principles of the Treaty of Waitangi. The tribunal is made up of a chairperson and six members appointed by the Governor-General. The chairperson is the Chief Judge of the Maori Land Court, and four of the tribunal members must be Maori.
The 1987 Court of Appeal decision focused much attention on the treaty and the functions and powers of the Waitangi Tribunal. In the same year the tribunal also reported and made recommendations to Government on the Ngati Paoa and Orakei claims. Both findings recommended the re-establishment of the tribes on their ancestral land.
During 1988 the tribunal considered an extensive claim by Ngai Tahu in the South Island and a fisheries claim brought by the Muriwhenua incorporation of the Far North.
The Department of Maori Affairs operates a range of community development programmes designed to give effect to the philosophy of tu tangata: to stand tall, to stand up for oneself. By meeting Maori needs on Maori terms the department promotes the development of the Maori community and the mobilisation of the people's own resources: their human talent, traditional institutions and cultural values.
A unique management style has been developed to achieve these goals. Instead of following the conventional relationship between a bureaucracy and its client group, the Department of Maori Affairs has made a commitment to let the community take the lead in deciding policy and priorities. The department's job is to use its resources to support community initiatives.
In June 1987 the Minister of Maori Affairs announced the introduction of an improved delivery system for government resources based on the tribal authorities. This initiative, known as Tuku Rangatiratanga, or devolution, advocates the decentralisation of decision making to local Maori agencies and is a focal point of continuing discussion on the identification of the best methods to deliver government resources to the Maori people.
On 9 April 1988, the Minister of Maori Affairs launched a discussion paper entitled He Tirohanga Rangapu—Partnership Perspectives. This paper suggested a range of options for reforming the existing relationship between central government and the Maori people. The main points involved were: the phasing down of the Department of Maori Affairs and the transfer of its functions to other departments; the establishment of a new ministry of Maori policy; and a commitment from the Government to utilise the new structures to strengthen and empower iwi authorities, to increase Maori participation in the political process and to, ultimately, work to achieve a greater social and economic parity between Maori and pakeha.
Written submissions were called for from interested parties, and an executive consultant programme followed, taking the Minister of Maori Affairs and senior officials to over 55 hui around the country in seven weeks. This allowed for an important sounding of Maori opinion on issues related to the green paper and reaffirmed the consultation process as one of primary importance in government's dealings with Maori people.
Below are some of the current programmes organised by the Department of Maori Affairs:
A kohanga reo is a whanau/family group where a deliberate effort is made to create a Maori cultural environment, in which Maori language values and customs are naturally acquired by pre-school children from their kaumatua (elders). Through the example of the whanau, the children learn aroha (love, compassion), manaakitanga (caring, hospitality), and whanaungatanga (family responsibilities), and are taught traditional knowledge, crafts and customs, all through the medium of Maori language. Successful kohanga reo naturally become centres of community interest and activity, and provide a forum for the revival of traditions and the sharing of information and knowledge throughout the Maori community.
The kohanga reo movement has demonstrated how Maori culture could be maintained and developed in modern society and has been the springboard for other community education and development programmes.
is a scheme whereby young Maori people at risk of offending are directed to the care of members of their whanau, hapu or iwi. In return for the commitment of the Maori community, the Government provides some assistance with boarding costs and housing loans if necessary. Funds have also been allocated to help reinforce family networks which underpin this programme.
This is a scheme to increase employment opportunities for young Maori people by matching individuals who are known to be unemployed with organisations which are found to have jobs or training opportunities, and creating employment opportunities in areas of Maori investment or economic growth.
are primarily basic skills centres set up with financial assistance from Maori Affairs, and run by independent executive management committees. Many operate from a marae base while others, particularly in major urban areas, have set up their headquarters in various buildings suitable for their needs.
Most kokiri centres are recognised or are in the process of gaining recognition as ACCESS/Maori ACCESS training providers. Other community programmes can also operate out of kokiri centres, such as kohanga reo, maatu whangai and health programmes. Some centres have fully-appointed health centres operating as part of the complex.
Marae are traditional centres of Maori tribal life, the venue for major social, political and ceremonial activity. The Department of Maori Affairs subsidises money raised by marae committees to renovate and maintain marae, and to provide necessary facilities they can serve their communities effectively.
Maori input to government employment and training policies is co-ordinated by a housing and employment division of the Department of Maori Affairs. Initiatives are further described in chapter 12, Employment.
Assistance is provided to Maori and Pacific Island students participating in pre-apprenticeship and vocational courses. On the completion of courses, efforts are made to place students in full-time employment. Support is also provided to Maori students undertaking university studies. Maori and Pacific Island youth are also placed directly with employers for a period of training, Wages are subsidised for one year, and at the end of this period of training the trainee is taken onto the employer's staff or is found similar work with another firm.
Funding allocated by the government to the ACCESS programme is delivered through the tribal system comprised of tribal and regional authorities.
MANA Enterprises is the name of another programme designed to broaden the economic base through the creation of Maori enterprises and the expansion of existing Maori businesses so employment opportunities can be created for Maori people. The mechanism for achieving this aim is an enterprise-funding scheme, for which policies are established at a national level by the Board of Maori Affairs, but which is administered at a local level by 26 tribal/regional authorities.
A recent trend has been the increased willingness of the Government to channel communications and resources through tribal organisations to the ‘flax roots’ of Maoridom. Runanga or trust boards have a key role to play in the implementation of the Maori Enterprise Development Scheme and maatua whangai, the development of a comprehensive Maori fisheries policy by the Ministry of Agriculture and Fisheries, the administration of Maori language boards and cultural wananga, and other activities.
Tribal structures are ideally placed to represent the whole range of Maori opinion, and because they operate in a Maori framework, they can harness the enthusiasm and commitment of the group more effectively. As this strategy is pursued, the Government will undoubtedly benefit from improved liaison with the Maori community.
There are also major benefits for Maori people. Tribal identity and pride are enhanced and there is even greater incentive for Maori people to participate in tribal affairs. Traditional institutions and networks have been revitalised and new runanga and trust boards have been established in areas where they did not exist. This strong tribal infrastructure is a key element in the emerging biculturalism in New Zealand, Maori economic development, and the adaptation of traditional strengths to meet contemporary needs, which are features of Maori society today.
A range of community services tailored to meet the specific needs of the Maori people are overseen by the Department of Maori Affairs.
The Maori Community Services Programme, as these services are collectively known, has as its legislative basis the Maori Community Development Act 1962, the Maori Affairs Act 1953 and the Maori Purposes Fund Act 1934–35. The primary functions of community services in terms of the legislation are to advise and assist the Maori people in respect of their general welfare and, in particular, in respect of health, housing, education, vocational training and employment.
However, the very nature of the responsibilities of the various Maori community workers (particularly those employed by the department) working with and alongside communities and Maori organisations involves them in the broad spectrum of community life and a wide range of peripheral concerns of Maori communities.
Another new dimension to this community work will come with the implementation of the Department of Maori Affairs’ policy of devolution of responsibility and empowerment to the tangata whenua (Maori people). Community services workers, because of their established links with communities and Maori organisations, will provide an important means of supporting and advising the people in developing new structures.
Statutory Maori organisations working alongside and partially resourced by the Department of Maori Affairs are:
The New Zealand Maori Council; District Maori Councils; Maori executive committees and Maori communities;
Maori wardens;
Honorary community officer; and
Marae trustees.
Additionally, there are a number of ad hoc voluntary organisations initiated at community level and providing services in areas of social concern including: health; drug, alcohol and solvent abuse; criminal rehabilitation; family violence; skills training; and employment and education. These organisations include the Maori Women's Welfare League, Maatua Whangai, Te Kohanga Reo Whanau and Kokiri management committees. The Department of Maori Affairs works closely with these organisations, and financial support is provided by the department in some cases.
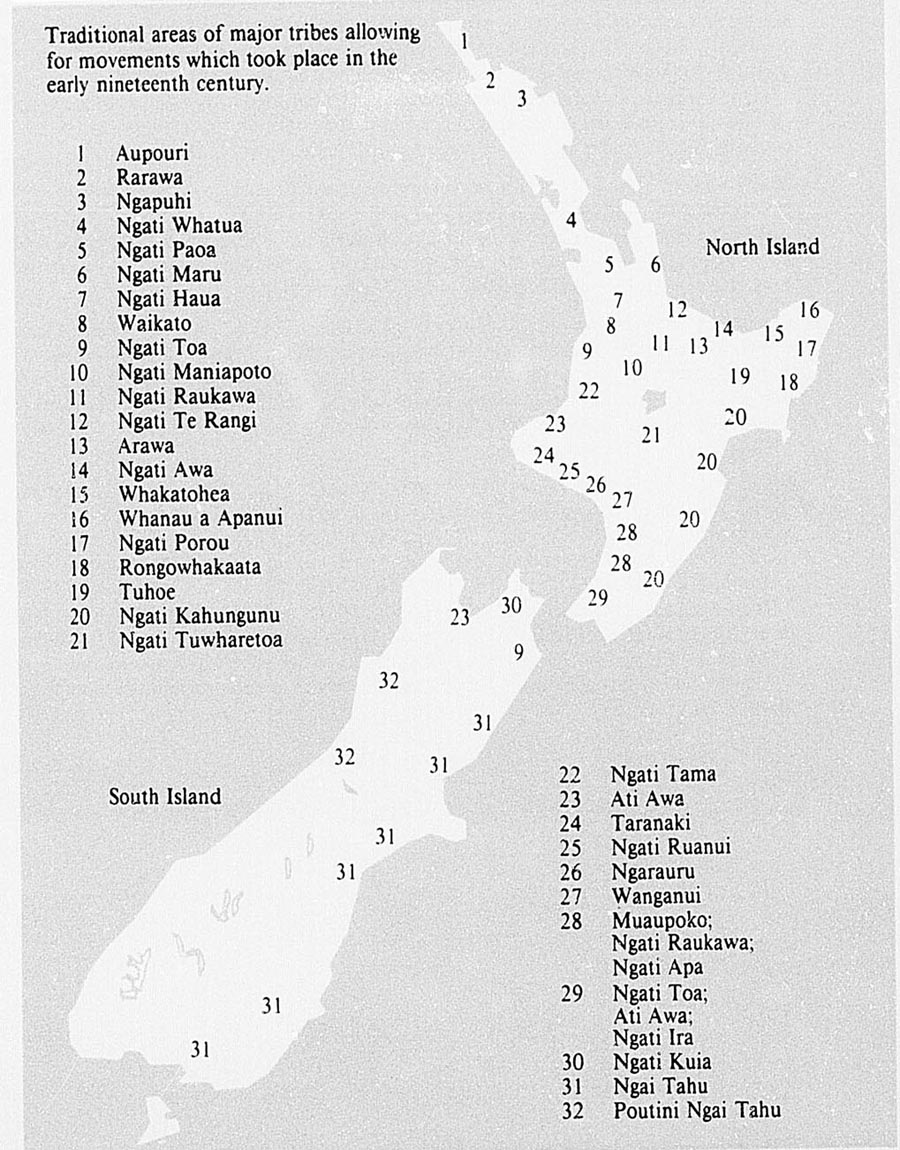
MAORI TRIBAL LOCATIONS
The activities of the New Zealand Maori Council embrace almost every facet of Maori life including social, economic, and cultural matters and the maintenance of good race relations.
District Maori Councils have the same aims and functions as the national body and are additionally responsible for the nomination and the renomination of Maori wardens for the Ministry of Maori Affairs approval and for screening applications for marae subsidies in their regions. Each council is represented on the New Zealand Maori Council.
Maori executive committees represent defined sub-tribal areas within district Maori council boundaries and are responsible for the same functions as the national and district councils. Each executive committee is represented on the District Maori Council.
These voluntary workers provide, among other things, liaison between police, the courts and the Maori people.
Recently there has been recognition that, with escalating social problems, there is a need for a high degree of expertise and training, and courses are being organised to meet this need. There were 1451 wardens nationally at 31 March 1988.
Community officers employed by the Department of Maori Affairs carry out different functions from traditional social workers in that they address the requirements of communities as a whole or community groups, with little involvement in individual casework. Their task has been and continues to be one of support and involvement in community initiatives and to provide a positive link between the Department of Maori Affairs and its client communities.
The league is a national Maori organisation, its members spread throughout all regions. The league has emerged as an important link within Maoridom. Its purpose is to enable its members to play an effective part in the cultural, social, educational and economic development of Maori people, and the people of New Zealand.
The league has always been in the forefront of efforts towards the social advancement of the Maori people. An example was a recent health survey conducted by Maori themselves to determine the Maori woman's perception of her own health and the health of her family. The report provided a base for positive health action programmes to improve Maori health.
Maori* is the foundation language of New Zealand, the ancestral language of the tangata whenua and one of the taonga guaranteed protection under the Treaty of Waitangi. It also provides this country with a unique language identity in the rest of the world, as this is the only place where Maori is spoken widely. In more tangible terms, the Maori language is a powerful social force for the reconstruction of a damaged and deteriorated self-image among Maori youth, a vehicle of contribution to society, and therefore a means of regaining dignity. Finally, human freedom is dependent at all levels on choice and diversity; linguistic pluralism can be nothing other than a guardian of individual freedom and identity against the forces of conformism.
Although detailed statistics are not yet available, it is estimated that some 50 000 New Zealanders, almost all of Maori descent, are fluent speakers of Maori, while perhaps a further 100 000 understand the language. While such a figure exceeds the numbers of native speakers of many other indigenous languages in the South Pacific and elsewhere, the picture is far less reassuring when one considers the age profile of Maori speakers: about 40 percent are aged 55 and above, whilst approximately the same percentage are between 35 and 54 years of age. It is equally alarming that there are probably 10 000 fewer fluent speakers of Maori today than just 10 years ago.
In terms of absolute numbers, Auckland has the lion's share of Maori speakers, accounting for almost a third of North Island figures. But areas of concentration are also to be found in the secondary urban centres and rural communities of Northland, Waikato, Bay of Plenty and East Cape.
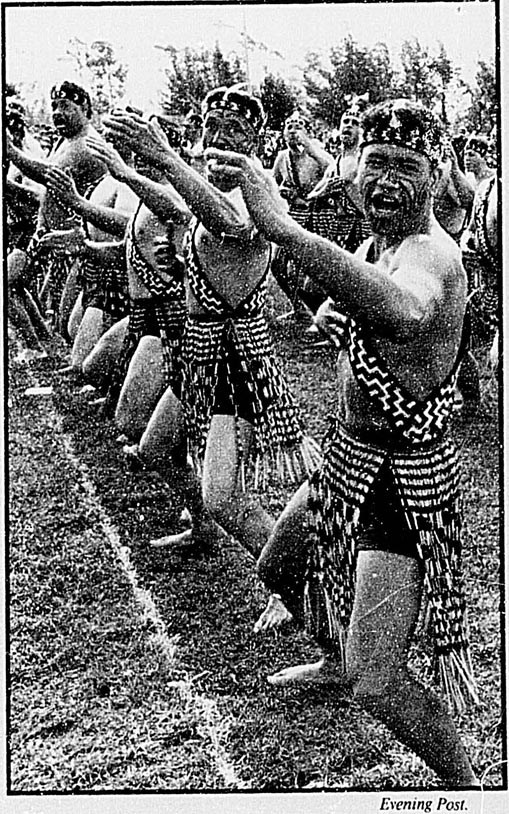
Haka
* The Maori Language Commission advocates the use of the macron over vowels (a, e, i, o, u), to indicate the vowel is pronounced long, and the convention is used in this article. A difference in vowel length reflects a difference in meaning, e.g., he means ‘a, an, some’, whilst he means ‘wrong’.
New Zealand Maori is most closely related to languages such as Cook Islands Maori, Tahitian and Hawai'ian, and forms with them a language grouping known by linguists as Eastern Polynesian. It is more distantly related to other languages of Polynesia, such as Samoan and Tongan, and can eventually be linked with the languages of Melanesia, Indonesia, the Philippines, Taiwan and Madagascar.
Evidence for language groupings comes in part from shared vocabulary items. Allowing for regular sound correspondences, which are the result of historically divergent sound changes (e.g., Maori ng corresponds to Hawai'ian n, r to l, t to k, wh to h, and k to the glottal stop, written as an apostrophe), the few examples in table 6.37 give a hint of the vocabulary common to a wide range of Polynesian languages.
The language came to Aotearoa with the Polynesian migrations of some 1000 years ago, which most likely began somewhere in the area now known as French Polynesia. Since then, the language has developed independently of other Polynesian tongues to become the Maori of today.
In more recent times, following the arrival of the pakeha, English (and to a much lesser extent other languages) have had some influence on Maori, especially in the area of vocabulary. Thus from English were borrowed such items as hoiho ‘horse’, kura ‘school’, motuka ‘car’, and taone ‘town’, from French came miere ‘honey’ (from ‘miel’) and wiwi ‘French’ (from ‘oui oui’), whilst the word pikiwhara ‘big’ (from ‘bigfela’) probably came from some version of South Seas Jargon, the name given to the pidgin-type lingua franca used throughout the South Pacific, principally in the latter half of last century, by sailors, merchants and other itinerant groups.
Linguistic ingenuity shown by the Maori is apparent in the adaptation of words already extant in the language which were given an additional meaning to coincide with a similar sounding English word. Some examples are given in table 6.38.
Table 6.37. COMPARISON OF VOCABULARY ITEMS FROM PACIFIC LANGUAGES
| NZ Maori | Cook Is. Maori | Hawai'ian | Samoan | Tongan | English gloss |
|---|---|---|---|---|---|
Source: Maori Language Commission. | |||||
| hoa | 'oa | hoa | soa | hoa | ‘friend’ |
| ingoa | ingoa | inoa | igoa | hingoa | ‘name’ |
| kai | kai | 'ai | 'ai | kai | ‘food’ |
| noho | no'o | noho | nofo | nofo | ‘sit’ |
| rima | rima | lima | lima | nima | ‘five’ |
| tangata | tangata | kanaka | tagata | tangata | ‘man’ |
| wahine | va'ine | wahine | fafine | fefine | ‘woman’ |
| wai | vai | wai | vai | vai | ‘water’ |
| whare | 'are | hale | fale | fale | ‘house’ |
| whenua | 'enua | honua | fanua | fonua | ‘land’ |
Table 6.38. POST-EUROPEAN ADAPTATION OF EXTANT MAORI WORDS
| Extant Maori word | Original meaning | New meaning |
|---|---|---|
Source: Maori Language Commission. | ||
| huka | ‘snow, frost’ | ‘sugar’ |
| kapa | ‘line, row’ | ‘penny’ (copper) |
| pouaka | ‘post with receptacle for cherished possessions’ | ‘box’ |
| pukapuka | ‘lungs’ | ‘book’ |
Another influence of English on Maori was felt in the form of extending the meaning of an existing word to include new, yet related, concepts. This is especially apparent in the language of spirituality, where Christian values heavily modified the meanings of certain words, for example, hara ‘infringement’ has taken on the sense of ‘sin’, inoi ‘request’ now means ‘pray’ and muru ‘confiscate’ now also carries the meaning of ‘forgive, remove guilt’. On a more practical level, waka ‘canoe’ has come to mean ‘car, means of transport’, wharewananga ‘school of lore for high-born males’ now means ‘university’, while whare takiura ‘school of esoteric lore’ means ‘tertiary education institution other than university’.
It is to be noted that Maori possessed no written code before the arrival of Pakeha missionaries, who saw in literacy a means of proselytising. The first document printed in Maori, a lesson book, dates from 1815.
Fortunately, those who developed the writing system were good linguists—their legacy is a system founded on scientific principles, according to which one sound unit corresponds to a single symbol (which in the case of ng and wh is a digraph). The only shortcoming was the failure to systematically mark the vowel length. The Maori Language Commission endorses the call for marking of vowel length as an integral part of the written code.
The Maori were eager to learn to read and write and it has been suggested that early on in the cohabitation of Maori and pakeha, the former had the higher rate of literacy in their respective languages.
Structure—Looking at the internal structure of Maori, we see a phonological (or sound) system consisting of just five vowels (each can be either short or long, the long vowel being marked with a macron) and 10 consonants (h, k, m, n, ng, p, r, t, w, wh), which are arranged into syllables of either a single vowel, a consonant plus a vowel or a consonant plus two vowels (i.e., a diphthong).
At the morphological (or word structure) level, Maori makes frequent use of reduplication (e.g., whero ‘red’, wherowhero ‘somewhat red’) along with a small number of prefixes (e.g., maori ‘usual’, whakamaori ‘translate’, kaiwhakamaori ‘translator’) and suffixes (e.g., kite ‘see’, kitea ‘be seen’, kitenga ‘seeing’) to form other words.
Whereas many European languages use suffixes to indicate such notions as plurality of nouns (e.g., road, roads) and verb tenses (e.g., love, loved, loving), Maori expresses these nuances in the third level of grammar, namely in syntax, where pre-posed function words convey a wide variety of information (e.g., te kotiro ‘the girl’, nga kotiro ‘the girls’; i waiata ‘sang’, kua waiata ‘have sung’). In Maori, the basic word order at the syntactic (or sentence structure) level can be stated as verb-subject-object. Thus, ‘I'll see you’ is rendered into Maori by ka kite au i a koe (literally, ‘shall see I you’). Maori is also noticeable for its frequent use of the passive construction, where English would often use an active. So, for ‘I have eaten the apple’, we find kua kainga e au te aporo (literally, ‘has been eaten by me the apple’).
Little systematic study has been done on dialectal variation within Maori. The most obvious differences are to be heard in intonation patterns, vocabulary (e.g., mahunga, [Northland] matenga ‘head’; kaore, [Bay of Plenty] karekau, [Northland] Kihai, [Tuhoe] e he ‘not’), morphology (e.g., au ahau, [Ngati Porou] awau ‘I’), phonology (e.g., pohiri, [Waikato] powhiri ‘invitation’; tipuna [Waikato] tupuna ‘ancestor’), and phonetics (e.g., mahana, [Taranaki, Whanganui] ma'ana ‘warm’; rangi, [South Island] raki ‘sky’; whakaaro, [Whanganui] wakaaro, [Northland] hakaaro ‘think’; pango, [Tuhoe] pano, ‘black’). Some syntactic variation does exist (e.g., kaore e taea e koe, [Ngati Porou] kaore e taea i a koe ‘you can't do it’), but is not as well understood as the preceding phenomena. Dialectal differences are in no way important enough to impede mutual comprehension between Maori speakers of different tribal backgrounds.
The last bastion against the continued encroachment of English into Maori institutions is the marae, that area where the Maori celebrates the rites of passage in a very Maori way. To encapsulate the notion of ‘marae’, no words are more appropriate than those of the late John Te Rangianiwaniwa Rangihau, who first spoke them in 1973, at a meeting attended by the then Minister of Maori Affairs, Matiu Rata, in Ruatoki:
Marae are places of refuge for our people, and
provide facilities to enable us to continue with
our own way of life and within the total structure
of our terms and values. We need a
marae for a host of reasons,
that we may rise tall in oratory,
that we may weep for our dead,
that we may pray to God,
that we may house our guests,
that we may have our meetings,
that we may have our weddings,
that we may have our reunions,
that we may sing,
that we may dance,
that we may learn our history, and then know
that richness of life and the proud heritage
which is truly ours.
The marae is the only place where the Maori language is essential. All the formalities of the marae—karanga (traditional call of welcome), powhiri (formal welcome), maioha (call of response from visitors), poroporoaki (formal speech of farewell), whaikorero (formal speech-making) and waiata (traditional chant sung at conclusion of formal speech)—are in Maori, although some marae, in a spirit of aroha, permit the use of English.
Whaikorero—The act of oratory, which reached such heights in Polynesia, is one that only the skilled and the learned can truly master. It requires a knowledge of tribal history, mythology, proverbs and song; skills which are not easily acquired in a short time but from a period of observation and attendance of hui throughout the country. As so very few of the population at large have access to this kind of information, much of what the orators say is meaningless to the younger listeners.
It is not surprising that the young do not have access to this form of language, because it is the young who do most of the work that ensures the comfort of the guest on the marae. Because of their preoccupation with these chores they are never party to the learned exchanges which take place on the marae. To be considered eligible to sit on the marae, one must have served an apprenticeship, as it were, doing the more menial chores. Eventually one graduates to the marae, and generally this is in early-to late-middle age or even older. One may sit and observe but keep a respectful silence because of the other prohibitions such as a son not speaking in the presence of his father, his father's or his mother's brothers, or his older brothers, the sons of his father's older brothers or the sons of his mother's older brothers this holds even in relation to the tupapaku, or body, at a tangihanga). While this prohibition is no longer strictly observed in some tribal areas, in others it is still adhered to. Under these conditions, it is not surprising that some people do not make their maiden speech until they have reached their sixties, but they have nevertheless acquired a great wealth of information from the period of observation.
Maori boarding schools, state schools which have active Maori groups, speech competitions, such as the Pei Te Hurinui Jones, have all, in their way, accelerated the progress of orators who, in the more formal marae context, would not be permitted to make a public utterance. It is interesting to note that despite many of these younger people having mastered but the rudiments of the art, there is acceptance that the marae has a different set of criteria.
Karanga—Whaikorero is, in most tribes, the prerogative of the male, just as the karanga, in all tribes, belongs to the female. In Ngati Porou and Ngati Kahungunu, women were permitted to whaikorero but only under certain conditions—in the main, they were women of rank.
Women must karanga before the men can whaikorero, that is, it is the voice of the women which ritually clears the way for the men to be able to speak. The karanga is more than a call, it is that part of the ceremony of welcome whereby the women give vent to their feeling; it can be said to be their form of whaikorero. Women who are well versed in the art can bring a tingle to the spine and a tear to the eye. Like the whaikorero men, the women must be versed in the history of the tribe, whakatauki, and mythological allusion, in order to know how to couch the words being called, for those women among the manuhiri are listening to find how best to respond. All the information needed by guests on tribe, locale and other matters can be conveyed in the karanga of the women. Like all the arts, language is essential
The schools mentioned in the description of whaikorero above also teach the art of waiata and karanga. The prohibitions which apply to the orator also apply to the women who karanga, the only difference being that where it was the male relationship that was the source of the prohibition above, in the case of women it is the female relationship.
There is concern that the audience that fully comprehends the whaikorero and karanga with its thrust and parry, its innuendo, its subtlety and nuances, is dwindling by the year. The language of the marae with its imagery and allusion is available to a select few, the majority of whom are well into middle age or even older. This does not augur well for the more specialised and ritualistic aspects of language. So what can be done?
Tribes that have recognised the danger have taken initiatives to see that their young are initially familiar with their own traditions. Tribal wananga, where kawa, waiata and whaikorero are taught, are held on a regular basis throughout the country. In some ways, these will help, but the essential ingredient is language, for without it, none of the marae rituals will endure or have meaning to a generation who is speaking Maori less and less.
The Maori dance and song arts can be divided into four main categories, waiata (traditional chant and contemporary compositions that are traditional in style), haka (the posture dance often erroneously considered to be a war dance and the exclusive domain of the male), poi (a dance employing a light ball with a short or long string attached to it, swung and twirled rhythmically to the accompaniment of a song), and waiata-a-ringa (the contemporary action song).
Waiata—These are chants performed in the traditional style—always in unison and unaccompanied by any musical instrument. Each tribe has its own repertoire, with many of its chants composed centuries ago. There are a great number of these chants, with their number being added to by the contemporary compositions being performed in the traditional style. The themes of the contemporary chant are quite different from those handed down through generations, but just like traditional waiata, they relate events of importance to the generation concerned.
While many tribes do have a repertoire of chants peculiar to them, there are many chants which have become common property. This has happened where the chant concerned has an attractive air or because the lyric of the chant expresses the sentiments of a tribe so well that it is taken over by others. It is considered a mark of flattery for a tribe to want to sing another's chants.
To the unfamiliar listener, traditional Maori chant sounds tuneless, dull and monotonous but, in fact, each one has its own distinctive air. Despite this, traditional chant is enjoying a revival among the young, an interesting development when one considers how accustomed most are to hearing contemporary western airs and rhythms.
While these contemporary rhythms are beginning to have an influence on the way the younger generation performs traditional chant there is still a great deal that has remained unchanged in terms of tempo and performance. There is at the same time a school of thought that believes that for the chant to survive, consideration should be given to adapting the rhythm and the air to make them more appealing to the young. This is unlikely to happen in the near future, as the field is still dominated by conservatives who feel that the chant ought to be performed in the way the composer intended.
What is more difficult for the young to pick up are the half and quarter notes more easily discernible by experienced listeners, who were accustomed to hearing these chants being sung by the experts of their day and age. Consequently there is a tendency for the younger generations to render the notes full tones rather than the more correct quarter and half tones. Despite this, many of the young are serious in the desire to master the subtlety and nuance of traditional chant.
Of all the Maori performing arts, the chant is the least choreographed, for there are no set movements as with the poi, the haka and the waiata-a-ringa. In the chant, the performer emphasises words or phrases with appropriate gestures when the mood takes him or her. It would be unusual to see all the members of a group performing the same movement at the same point in the chant, and if that were the case it would be likely that the meaning of the chant would be lost to the performer.
The chant will continue to survive while etiquette demands that such chants be performed at the end of a formal speech. Once that is no longer the case, the less demanding action song, a hymn or one of the many popular songs may take the place of the traditional chant. In some tribal areas, this change has already occurred.
Haka—There is a proverb which says: “E tu i te tu a Tane-rore, e haka i te haka a Tane-rore, kaua i te tu, i te haka a te keretao” (Adopt the stance of, and dance like, Tane-rore, not be limp like a puppet.). This is an admonition to the male dancer, urging him to adopt a graceful, but masculine, stance rather than a soft, gentle one. His hands should always be strong in all the actions executed and yet should continue to quiver to show that, in the dance, Tane-rore is still acknowledged.
Today the haka is often regarded as the exclusive domain of the male, and, quite erroneously, as a war dance. Any haka performed with weapons is called a peruperu, whakatu waewae, tutu ngarahu or puohotau. These latter haka are performed mainly on ceremonial occasions and are generally haka of welcome. Many are traditional in that they have been handed down for centuries, but the haka taparahi is enjoying a popularity unequalled before. It is used as a vehicle for protest, praise and congratulation, just as it was in former times, and is very popular with wider audiences.
It should be noted that there are haka in which women have the prominent part, as exemplified by the women of the East Coast and their haka powhiri.
Poi—Just as the haka is considered to be essentially the domain of the male, so the poi is the domain of the female. Its sole function is to provide an accompaniment to the chant or modern type of song and to allow women a chance to exhibit their beauty. Some tribes have said that it was once the domain of the male, but this seems to have only been the case among the tribes of the eastern seaboard. The tribes of the west coast of the North Island use the poi not only for entertainment but also for all the rites of passage such as the welcoming of guests, the celebration of important events and the farewelling of the dead.
Over the years, the poi has become more and more ‘busy’ as the composers try to create new and more difficult and original figures. It is an item that enjoys great popularity. The two tribal areas that have dominated the poi, with very different styles, are Te Arawa and those of Taranaki and Whanganui.
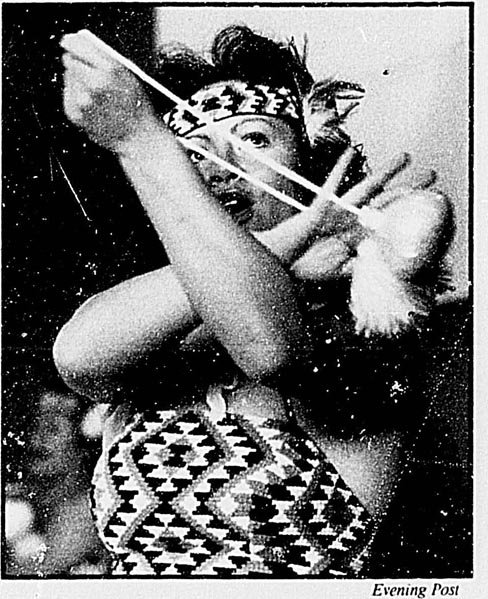
Poi.
Waiata-a-ringa—This is the most recent development in Maori dance and was given form early this century by one of Aotearoa's most famous sons, Sir Apirana Ngata. Waiata-a-ringa came into being at a time when Maoridom was at its lowest ebb and was considered to be one way in which self-esteem and self-worth could be re-established.
Waiata-a-ringa used traditional movements, evolved new ones and were performed to many tunes borrowed from Tin Pan Alley. Composers justified this on the grounds that the tunes were immediately recognisable to the young and would therefore make them more eager to learn and to involve themselves in the new dance form. Since its inception, waiata-a-ringa has enjoyed great popularity with a wider audience.
The ‘golden age’ of waiata-a-ringa was the period from World War I to the end of World War II. Many songs were composed to farewell the soldiers who went to battle, to pray for their wellbeing while at war, to encourage them in their efforts, to welcome those who returned, and to mourn for those who did not. Today the action song, like the haka, is being used as a vehicle for protest and praise, as well as other occasions considered important by the composer. The function of the action song is to convey through the actions the meaning of the words.
Some critics feel that, since the end of World War II, the action song has been on the decline in terms of its lyrical beauty. Many of the songs composed during World War I are still very popular, although many of those being performed at present have been composed within the last 10 to 20 years.
Competition—For many years competition in song and dance has played a part in the retention of arts. There are tribal, regional and national competitions. Just as there are people who enjoy competition, there are opponents who say it is to the ultimate detriment of the arts.
Whatever the opinion expressed, competitions are popular with the people at large and receive great support. As a result, however, teams are becoming more and more regimented, and thereby losing their passion and excitement—essentials of the Maori dance arts, and the very emotions they should also arouse in an audience. If the wana (passion) and ihi (excitement) are missing, the group is considered mediocre. This has happened in some dances in competitions, when failure to use language in performances has meant a loss of vitality.
The Aotearoa Maori Festival of Arts was instituted in 1972 as the New Zealand Polynesian Festival. Originally it was held annually, but has since become biennial. It was conceived as a measure to raise the standard of performance, to encourage groups to revive and learn the traditional chants of their own tribal areas and to actively discourage the use of tunes from Tin Pan Alley. This aim has been substantially achieved but the negative aspect has been the standardisation of performance, the concentration on costume and the relegation of language and lyric to a position of secondary importance.
Tourism—A strong influence on the state of dance is the impact of tourism. Many groups feel that they must adapt their performance to suit the tourist, and their costumes to look appealing.
However, what is attractive to one culture might not be so to another, and many tourists would prefer to see what the Maori audience sees, with all the appropriate information given by someone capable of doing so, to enable the audience to enjoy the performance. Not all forms of song or dance, of any culture, are immediately attractive to the ear or the eye of the uninitiated. Dance arts could seek to make tourists better informed so that they will appreciate what standards and ideals there are.
The song and dance arts are on the rise, but the use of language is on the decline, although there are many among the conservatives who brook no departure from the conventions observed over the centuries.
kohanga reo—The most visible and widely felt manifestation of the resurgence of interest in the Maori language is without a doubt the kohanga reo, or language nest. The first kohanga reo was set up in 1981; by the end of 1987, just six years later, there were 522 established throughout the country, catering for over 11 000 children. This network of early childhood education centres was developed as one answer to the drastic decline in the numbers of Maori-speaking youngsters growing up in New Zealand.
The basic policy of kohanga reo is to impart traditional Maori values and knowledge to preschoolers using Maori as the only language of instruction. A lack of resources, both human and physical, means that this ideal of a monolingual learning environment is not always realised—fluent speakers no longer abound, while in many cases, the salaries on offer to teaching staff are insufficient to attract personnel with a thorough knowledge of the language and of childhood development (with special reference to language acquisition), and the required teaching skills.
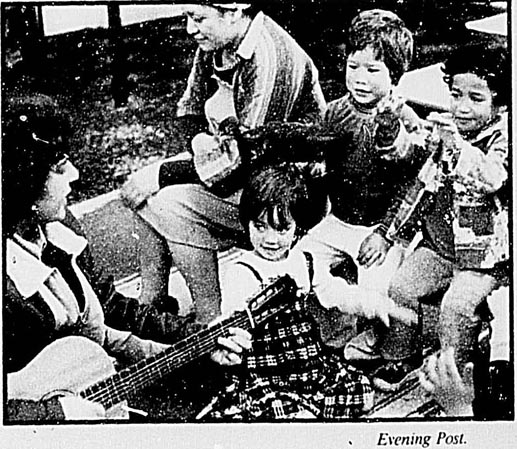
Kohanga reo, Hutt Valley
Despite these shortcomings, kohanga reo offers an essential link in bridging the intergenerational rupture that has occurred in the passing down of native language skills, and is receiving strong support from the community as a whole for the promise it holds.
On 29 April 1986, the Waitangi Tribunal handed down its findings relating to te reo Maori, which included several recommendations to the Government covering the use of Maori in Courts of Law, government departments, local authorities, other public bodies, in education and in broadcasting.
Although calls had been made over a number of years for legislation to recognise the status of the Maori language in New Zealand, it was the tribunal's finding that finally prompted the drafting of the Maori Language Bill, which was later enacted as the Maori Language Act 1987.
The Act did not implement all of the tribunal's numerous recommendations. Nevertheless it does contain three important provisions:
It declares Maori to be an official language of New Zealand;
It confers upon a wide range of participants the right to speak Maori in certain legal proceedings; and
It establishes the Maori Language Commission (te Taura Whiri i te Reo Maori) and defines its functions and powers.
It is ironic that Maori is in fact the only language in New Zealand that has received explicit official status in legislation. English, which dominates indisputably the linguistic landscape of this country, is de facto the language of officialdom. Indeed, awarding an official status to a language appears to do little more than confer upon it a symbolic value. This is not to say, however, that it is without indirect effect. In a social climate already more disposed to recognise Maori values, it invites all New Zealanders to consider what the rightful place of the language is in contemporary society.
The only language right specifically legislated for concerns the courts of law. The Act states that “in any legal proceedings, the following persons (i.e., any member of the court, any party or witness, any counsel, etc.) may speak Maori, whether or not they are able to understand or communicate in English or any other language”. When a Maori speaker chooses to exercise this right, the onus is on the presiding officer to ensure that a competent interpreter is on hand to translate. The law confers neither the right to be addressed in Maori nor to have one's testimony recorded in Maori.
The functions of te Taura Whiri i te Reo Maori (Maori Language Commission) are fourfold:
To promote the Maori language amongst New Zealanders in general, but more particularly in those communities where its use is strongest; to encourage and assist government departments and other public institutions in the development of Maori language services; and to liaise with existing Maori language organisations with a view to co-ordinated action;
To formulate and implement policy which will enhance the position of Maori as the language of the tangata whenua of Aotearoa, and give effect to the objectives of the preceding item;
To carry out research into matters related to the promotion of Maori. (Sound policy decisions require good background research. Areas to be looked at include the establishment of a computerised database of new Maori terminology and a study of contemporary Maori grammar.); and
To assess the competence of candidates wishing to act as interpreters and translators in the courts, and to issue certificates to the successful candidates.
The commission consists of a full-time commissioner and four other members who meet once a month. Under the commission proper is a permanent secretariat, which carries out corporate services, undertakes research and implements policy decided upon by commission members.
The Maori Language Commission has already established policies and broad objectives in several key social areas and some of these are summarised below.
If the Maori Language Commission is to promote the use of Maori over the widest possible range of public situations (private situations remain, naturally beyond the commission's brief), public institutions will need to be encouraged to offer full services in Maori. Even if a voluntary approach to such services succeeds, it may be that future amendments to the Maori Language Act will confirm the right to speak Maori (and to have it used in reply) in a much broader range of situations than is presently the case.
Encouraging the establishment of Maori language services means pointing out the moral obligations imposed by the Treaty of Waitangi—the accord by virtue of which the tangata whenua agreed to a partnership with the pakeha and the benefits of a diverse society, where individuals and groups feel that their identity is respected and their specificity catered for.
Some people have expressed fear that the promotion of the Maori language is equivalent to requiring them or their children to become personally proficient in Maori. In reply it may be pointed out that institutional bilingualism is not individual bilingualism. Bilingual institutions will offer services in both Maori and English and will be staffed by personnel who, as individuals, may be bilingual or monolingual. In such institutions, the ability to speak Maori (or effectively, to be bilingual in Maori and English) must be recognised and rewarded as a valued skill.
As well as promoting services in Maori, the Maori Language Commission will encourage people to use these services. Sociolinguistic behaviour is to a large extent the result of habit, moulded by attitude; habits are difficult to break and attitudes slow to change. Initially, many Maori speakers will feel embarrassment at demanding services in Maori, simply because that has not been the standard practice. If the cycle ‘no-demand-therefore-no-supply’ is to be broken, Maori will have to take it upon themselves to create the demand. This clientele will expect from the authorities concerned a willingness to advertise the availability of services in Maori and an openness to approaches in Maori, but it will nevertheless require a certain courage to demand these services, especially in an over-the-counter situation.
For a variety of reasons that include the limitation of human resources, the experimental nature of any policy, and the demographic reality of the country, Maori language services will at first probably be concentrated in areas where they are more likely to be called upon. Taking 1986 census figures as a guideline, it can be seen that Maori, who nationally make up 12.4 percent of the total population, exceed this percentage in seven local government regions and several urban areas. These are listed in table 6.39.
Table 6.39. AREAS OF CONCENTRATED MAORI POPULATION, 1986 CENSUS
| Maori as percentage of population | |
|---|---|
| Local government region | |
| Over 33 | East Cape |
| 25–33 | Tongariro |
| 20–24.9 | Bay of Plenty, Northland |
| 12.5–19.9 | Hawke's Bay, Waikato, Wanganui |
| Main urban areas | |
| 25–33 | Gisborne, Rotorua |
| 15–24.9 | Hastings, Porirua Basin, Whangarei, Southern Auckland |
| Secondary urban areas | |
| 25–33 | Tokoroa, Whakatane |
| 15–24.9 | Taupo, Pukekohe |
One of the most important services that can be offered is that of having available at any given time someone competent to deal with a Maori-speaking client, whether it be over the counter, on the telephone or by correspondence (written or electronic). An important point to be remembered here, and one that was noted by the Waitangi Tribunal and taken up in the Maori Language Act, is that ideally any New Zealander should feel able, as the client, to use either English or Maori, irrespective of his or her knowledge of the other language. Here, the ‘right to use’ a language includes the right to be addressed in that language in return.
An essential ingredient of these ‘immediate’ services (as opposed to ‘deferred’ services) is good will. The availability of such services will need to be well publicised, and the client will be invited, by way of prominently displayed notices perhaps, to employ the language of his or her choice. The service will in turn need to be dispensed willingly and promptly.
‘Deferred’ services include material printed in Maori, such as signs, information pamphlets, forms. This type of service is the easier to offer, since it consists of one-off products, but it may be considered secondary to the more important task of ensuring a face-to-face service in Maori.
In an enlightened democracy (one where, although government is by the majority, that majority nevertheless recognises the right of minorities to be different) media coverage reflects the diverse make-up of its society. Maori in New Zealand have ‘special’ minority status as tangata whenua.
At present, there is a daily television news programme in Maori (Te Karere), while weekly programmes include current affairs (Koha), a discussion forum (Te Kupenga) and cultural events (Te Waka Huia). The Maori Language Commission advocates an increase in the time allotted to Maori television/radio to a level more proportionate with the Maori population in the general population, with some prime-time viewing/listening hours. Maori media should in turn be controlled by Maori and designed for Maori consumption (not precluding pakeha participation).
While television has the advantage of being the medium most often used by the consumer, it has the disadvantage of being highly centralised. Local radio has greater potential as a means of reaching people in Maori.
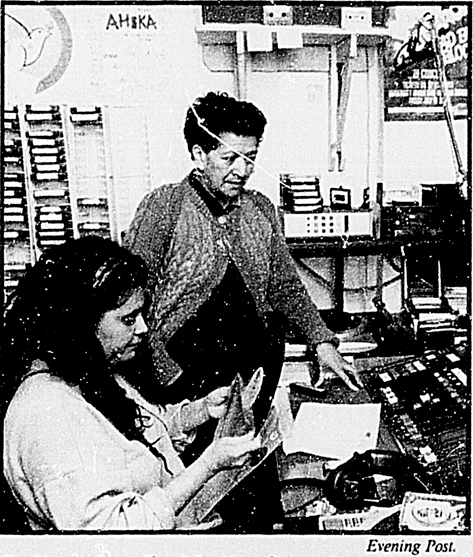
Te Upoko te Ika Maori radio station.
Where kohanga reo have managed to produce youngsters fluent in the Maori language, good work is often undone simply because there are so few primary schools in which these children can continue to receive instruction in Maori. The Maori Language Commission has endorsed the call for the establishment of exclusively Maori-medium schools, for it believes that only in this way will the language be retained. For there to be success, the teachers will have to be appropriately trained, and must banish English in all teaching situations, from kohanga reo to university and beyond.
The Picot report (Report of the Taskforce to Review Education Administration, 1988, para. 7.7.5) recommends a mechanism that allows minority groups, unable to have their values reflected in existing structures, to withdraw and set up their own institutions, funded by the state.
Teachers who are fluent enough to be of use in the classroom need to speak Maori at all times. However, prior to being sent to the schools, they will need to be trained, so that they can carry out their role with competence and confidence. A problem that has occurred in the past with fluent speakers in the schools is that they were not adequately trained, and not given support in the classroom or appropriate recognition. If these deficiencies were to be rectified, the situation would be vastly improved. If not, the language will perish.
An additional problem faced by these teachers is the dearth of educational and other material published in Maori.
Language is central to the cultural identity of both the individual and the community to which he or she belongs. Not only does a language express the realities of a particular group, but it also marks one's membership of that group, both from within (since the language is shared) and without (since it highlights one's difference).
If a language is lost, the cultural identity of the group is considerably weakened, which in turn alters the very nature of the society of which that group is part. In light of this, it may be considered important to retain, and promote, the Maori language, in order, amongst other things, to develop a diverse and harmonious society.
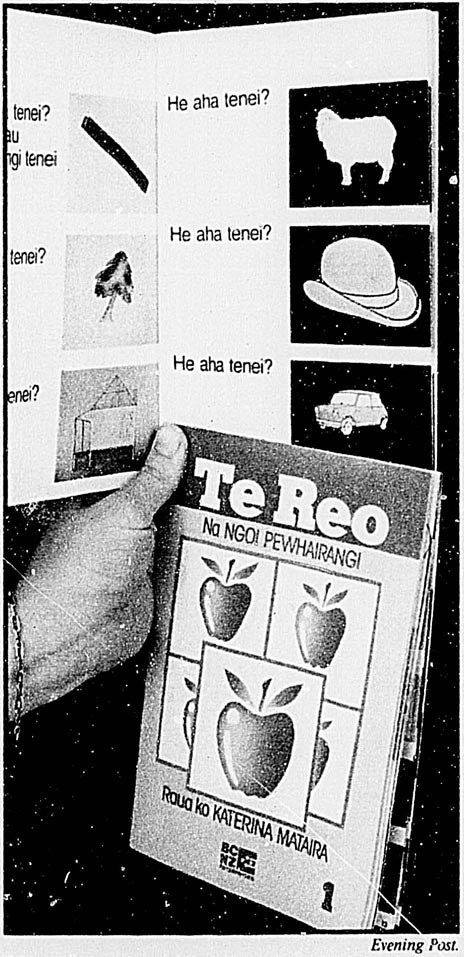
Maori language primer.
Ko te reo te ha, te mauri o te Maoritanga. (Language is the very life-breath of being Maori.)
The 1986 census provides the most accurate and complete data on New Zealand's Pacific Island Polynesian population. The following tables use a ‘sole origin’ series, which is derived on a group affiliation concept based on cultural and ancestral criteria, and allows comparison between the 1981 and 1986 census data. This population includes the categories of Samoan, Cook Island Maori, Niuean, Tokelauan, and Other Pacific Island Polynesian e.g., Hawaiian, Tahitian. Persons who specified themselves as belonging to one, two or three island categories within the Pacific Island Polynesian group are defined as ‘Solely Pacific Island Polynesian’.
Table 6.40 compares the Pacific Island Polynesian populations at the 1981 and 1986 censuses on an age-group basis.
When intercensal population growth is analysed on a consistent age-group basis, i.e., the age-group 0–4 years at the 1981 census is compared with the 5–9 years group at the 1986 census, etc., a major contribution made by net immigration to the increase in the Pacific Island Polynesian population during the period is evident.
In addition, the high growth of 21 441 (28.2 percent) in the resident Pacific Island Polynesian population during the 1981–86 intercensal period is partly a result of significant natural increase (births less deaths) for this ethnic group.
Table 6.40. PACIFIC ISLAND POLYNESIAN POPULATION BY AGE GROUP*
| Age group (years) | 1981 census† | 1986 census† | Intercensal change (percent) | ||
|---|---|---|---|---|---|
| Number | Percentage | Number | Percentage | ||
*Persons of solely Pacific Island Polynesian origin usually resident in New Zealand. † Includes combinations of two and three Pacific Island Polynesian ethnic groups specified in the ‘one ethnic origin’ category. | |||||
| 0–4 | 10,686 | 14.1 | 11,118 | 11.4 | 4.0 |
| 5–9 | 9,930 | 13.1 | 11,184 | 11.5 | 12.6 |
| 10–14 | 8,658 | 11.4 | 10,590 | 10.9 | 22.3 |
| 15–17 | 4,437 | 5.8 | 6,165 | 6.3 | 38.9 |
| 18–19 | 2,844 | 3.7 | 4,077 | 4.2 | 43.4 |
| 20–24 | 7,299 | 9.6 | 9,996 | 10.3 | 37.0 |
| 25–29 | 8,235 | 10.8 | 9,792 | 10.1 | 18.9 |
| 30–34 | 7,263 | 9.6 | 9,252 | 9.5 | 27.4 |
| 35–39 | 5,016 | 6.6 | 7,683 | 7.9 | 53.2 |
| 40–44 | 3,975 | 5.2 | 5,262 | 5.4 | 32.4 |
| 45–49 | 2,577 | 3.4 | 4,122 | 4.2 | 60.0 |
| 50–54 | 1,854 | 2.4 | 2,754 | 2.8 | 48.5 |
| 55–59 | 1,209 | 1.6 | 2,106 | 2.2 | 74.2 |
| 60–64 | 852 | 1.1 | 1,416 | 1.5 | 66.2 |
| 65–69 | 549 | 0.7 | 879 | 0.9 | 60.1 |
| 70–74 | 315 | 0.4 | 507 | 0.5 | 61.0 |
| 75–79 | 156 | 0.2 | 267 | 0.3 | 71.2 |
| 80 and over | 93 | 0.1 | 204 | 0.2 | 119.4 |
| Total | 75 966 | 100.0 | 97 407 | 100.0 | 28.2 |
At the 1986 Census of Population and Dwellings the Pacific Island Polynesian population was considerably younger in age structure than the total usually resident New Zealand population. This is shown by the fact that 33.8 percent of Pacific Island Polynesians were under 15 years of age, compared with 24.4. percent of the total population. In contrast, only 3.4 percent of Pacific Island Polynesians were 60 years of age and over at that time, the corresponding figure for the total population being 14.7 percent.
The Pacific Island Polynesian population has a different age structure from that of the New Zealand Maori population. This is mainly the result of consistently high external net migration levels, especially for the younger working-age groups (15–24 years) during the past 20 years. It has created a Pacific Island Polynesian population which is more concentrated in the middle working-age range (25–44 years) than is the case for Maoris. Pacific Island Polynesian births in New Zealand have only shown a significant increase in the past decade, the result of the growth in the population of reproductive age.
The distribution of the Pacific Island Polynesian population by local government region is shown in table 6.41. All local government regions except Marl-borough and Aorangi experienced growth in their Pacific Island Polynesian populations between the 1981 and 1986 censuses. In terms of numbers, the Auckland local government regions experienced the greatest increase (15 819), or 73.8 percent of the national increase of 21 441 during the intercensal period.
Table 6.41. PACIFIC ISLAND POLYNESIAN POPULATION BY LOCAL GOVERNMENT REGION*
| Local government region | 1981 census | 1986 census | Intercensal change (percent) | ||
|---|---|---|---|---|---|
| Number | Percentage | Number | Percentage | ||
*Persons of solely Pacific Island Polynesian origin usually resident in New Zealand. † Includes Great Barrier Island County, Chatham Islands County, extra-county islands and shipping. | |||||
| North Island— | |||||
| Northland | 309 | 0.4 | 411 | 0.4 | 33.0 |
| Auckland | 50,613 | 66.6 | 66,432 | 68.2 | 31.2 |
| Thames Valley | 81 | 0.1 | 102 | 0.1 | 25.9 |
| Bay of Plenty | 1,023 | 1.3 | 1,254 | 1.3 | 22.6 |
| Waikato | 2,901 | 3.8 | 3,378 | 3.5 | 16.4 |
| Tongariro | 291 | 0.4 | 336 | 0.3 | 15.5 |
| East Cape | 162 | 0.2 | 195 | 0.2 | 20.4 |
| Hawke's Bay | 1,209 | 1.6 | 1,497 | 1.5 | 23.8 |
| Taranaki | 168 | 0.2 | 189 | 0.2 | 12.5 |
| Wanganui | 315 | 0.4 | 396 | 0.4 | 25.7 |
| Manawatu | 525 | 0.7 | 762 | 0.8 | 45.1 |
| Horowhenua | 180 | 0.2 | 333 | 0.3 | 85.0 |
| Wellington | 13,692 | 18.0 | 16,326 | 16.8 | 19.2 |
| Wairarapa | 234 | 0.3 | 255 | 0.3 | 9.0 |
| Total North Island | 71 703 | 94.4 | 91 866 | 94.3 | 28.1 |
| South Island— | |||||
| Nelson Bays | 102 | 0.1 | 138 | 0.1 | 35.3 |
| Marlborough | 57 | 0.1 | 42 | - | -26.3 |
| West Coast | 36 | - | 39 | - | 8.3 |
| Canterbury | 2,193 | 2.9 | 3,027 | 3.1 | 38.0 |
| Aorangi | 99 | 0.1 | 96 | 0.1 | -3.0 |
| Clutha-Central Otago | 57 | 0.1 | 93 | 0.1 | 63.2 |
| Coastal-North Otago | 882 | 1.2 | 1,128 | 1.2 | 27.9 |
| Southland | 816 | 1.1 | 942 | 1.0 | 15.4 |
| Total, South Island | 4 242 | 5.6 | 5 505 | 5.7 | 29.8 |
| Extra-county islands and shipping† | 15 | - | 36 | - | 140.0 |
| Total, New Zealand | 75 966 | 100.0 | 97 407 | 100.0 | 28.2 |
A Ministry of Pacific Island Affairs has existed since 1985. It has the aim of encouraging Pacific Island people to contribute fully to New Zealand's social, cultural and economic life, while recognising and reflecting Pacific Island cultural values and aspirations.
More specifically, it works to close gaps in the areas of education, employment, health and housing that exist between New Zealanders of Pacific Island Polynesian origin and other ethnic groups. The ministry also works to foster the transmission of cultural values important to the identity of the various Pacific Island people and of New Zealand as a whole.
It works through the three main administrative mechanisms described below, each of which is in turn linked to the community.
This 12-member council is made up of representatives of each of the six main Pacific Island communities in New Zealand. Its functions include advising and making recommendations to the minister, and promoting the dissemination of information to and from Pacific Island people in New Zealand. The council meets regularly to consider a wide range of matters, including immigration legislation and policy, employment and training, and education issues.
This small group also advises the Minister of Pacific Island Affairs, while providing administrative back-up and co-ordination of the above council and other programmes. The unit establishes and maintains liaison with and between Pacific Island communities in New Zealand and government agencies; monitors, reports on and promotes issues related to the communities;and is developing a resource base (including a directory, appointments file, and events diary) on Pacific Island matters.
A separate department of state was not established for the Pacific Island affairs portfolio. Autonomy for the unit is provided in that it is directly responsible for tendering policy advice to the minister. Administrative support is provided by the Department of Internal Affairs.
See section 12.2, Unemployment.
A Royal Commission on Social Policy was proposed in the 1984 Labour Party Election Manifesto. The commission was established by warrant in October 1986, with the appointment of five commissioners—Sir Ivor Richardson (Chairman), Ann Ballin, Marion Bruce, Mason Durie, and Rosslyn Noonan. A sixth commissioner, Len Cook, was added in October 1987. The first round table meeting did not eventuate until February 1987, when the commissioners began their task. They were required to report back by 30 September 1988.
This royal commission was remarkable in many ways, but two major aspects of its work will ensure its continuing importance as a watershed in New Zealand public policy. Firstly the broad scope of its terms of reference had not been attempted by any similar commission of enquiry either in New Zealand or other like countries, secondly the extent to which the six commissioners sought both expert and lay opinion from the community and the innovative ways they did so gave new meaning to the process of public consultation.
The two main tasks of the commission were to see how New Zealand today measures up as a fair and just society and to recommend improvements where society falls short of these ideals. To carry out these tasks, the commissioners were enjoined to consult widely, in a way that showed regard for the dignity of individuals, of Maori and other ethnic groups and for the modes of communication to which they are accustomed, to adopt procedures which encourage people to participate, to draw on the findings of reviews, task forces and committees of enquiry, to make use of local and overseas studies, research and reports, and to conduct and contract research work as might be necessary or appropriate.
In the terms of reference of the commission these aims were stated as:
To enquire into the extent to which existing instruments of policy meet the needs of New Zealanders, and report on what fundamental or significant reformation or changes are necessary or desirable in existing policies, administration, institutions or systems to secure a more fair humanitarian, consistent, efficient, and economical social policy which will meet the changed and changing needs of New Zealand and achieve a more just society.
The commissioners used the list of standards and foundations (see box) laid down in their terms of reference to judge how fair and just New Zealand society is.
The extent of the enquiry was unprecedented, the nearest parallels being the 1974–77 Australian Royal Commission on Human Relationships, and the 1977 British Royal Commission on the Distribution of Income and Wealth.
Even then, the New Zealand enquiry was far more extensive, as the Australian commission's terms of reference, although extensive, were confined to the family, social, educational, legal and sexual aspects of male and female relationships. The Australian commission had fewer public hearings, commissioned fewer research papers and received 1638 submissions, compared with more than 6000 submissions to the New Zealand commission. Likewise, the British royal commission was more or less permanent with a wide brief to investigate the distribution of wealth and income in that society and to make recommendations for policy changes to make for a more equitable distribution. The British royal commission, established by a Labour administration was a casualty of the change to a Conservative government after it had begun a long-term monitoring programme but published only three interim reports.
From the outset, it was recognised that during the period of the Royal Commission on Social Policy's life, the machinery of government could not stand still. Just as the commissioners began their work, the Government announced that it would set up a task force to undertake a wide-ranging review of the entire health sector, and other task forces to review various aspects of the education sector. These announcements were followed by the establishment of a number of administrative reviews of departments whose work lay at the heart of social policy, in particular Social Welfare, Maori Affairs, Housing, and Education. Arrangements had to be made to ensure continuing liaison with those involved in the various reviews.
It was agreed that there would be a minimum of formalities in the consultation process. Those making oral submissions would not be sworn in and, because it was not an adversarial inquiry, there was no need for legal representation. Few restrictions would be placed on submissions, which could be handwritten, taped or made orally by telephone, on radio talkback, or at a meeting.
To stimulate community participation, a guide to the commission's terms of reference and four discussion booklets (on The Treaty of Waitangi, Work, Wealth and Income and Public Private and Voluntary Provision of Social Services) were produced and distributed freely. The discussion booklet on the Treaty of Waitangi and social policy (published in Maori and English language editions) was in particular demand, with over 18 000 copies distributed.
To widen the consultation process as much as possible, a consultative fund was set up and allocated almost $435,000 to assist 120 applicants to prepare their submissions. The fund was targeted at individuals and groups which might otherwise remain untapped through their lack of funds to pay for this sort of activity. In addition, the commissioners made two extensive tours outside Wellington, each of about two months’ duration, to hear the views of ordinary New Zealanders from as far afield as Bluff, Hokitika, Kaitaia and Tikitiki, and more than 40 other communities in between. More than 4000 people attended meetings and hearings during the first round in May and June, and another 3000 during the second round in October and November 1987. Imaginative use was also made of radio and television, both as advertising media and through interviews and talkback programmes as a means for gathering submissions, especially from isolated or housebound people who would have had difficulty in attending public meetings or hearings. In association with the Ministry of Women's Affairs, a ‘freephone’ was implemented which elicited over 800 submissions from women throughout the country.
In the event, over 6000 submissions were received from individuals and couples, tribal groups, trade unions, voluntary, church and private sector groups, and from all levels of government. They represented the views, values and hopes of hundreds of thousands of New Zealanders. All submissions were analysed, abstracted and transferred to a computer-based classification and retrieval system to which the public now have access through the National Library's Kiwinet system.
Table 6.42. TYPES OF SUBMISSIONS
| Number | Percentage | |
|---|---|---|
Source: April Report. | ||
| Written | 3,890 | 65 |
| Freephone | 811 | 14 |
| Taped | 3 | – |
| Oral | 775 | 13 |
| Written and oral | 258 | 4 |
| Written and freephone | 168 | 3 |
| Unspecified | 63 | 1 |
| Total | 5 968 | 100 |
Table 6.43. SUBMISSIONS BY TYPE OF ORGANISATION
| Number | Percentage | |
|---|---|---|
Source: April Report. | ||
| Individual | 4,116 | 68.90 |
| Informal group | 307 | 5.10 |
| Voluntary group | 702 | 11.80 |
| Government department | 81 | 1.40 |
| Private sector | 34 | 0.60 |
| State-owned enterprise | 2 | 0.03 |
| Local authority | 126 | 2.10 |
| Trade union | 218 | 3.70 |
| Religious group | 83 | 1.40 |
| Other | 148 | 2.50 |
| Not specified | 151 | 2.50 |
| Total | 5 968 | 100.00 |
Table 6.44. SUBMISSIONS BY LOCAL GOVERNMENT REGION
| Local government | Number | Percentage | Population (% from 1986 census) |
|---|---|---|---|
| Source: April Report. | |||
| Northland | 344 | 5.8 | 3.8 |
| Auckland | 1,179 | 19.8 | 26.9 |
| Thames Valley | 90 | 1.5 | 1.8 |
| Bay of Plenty | 308 | 5.2 | 5.7 |
| Waikato | 359 | 6.0 | 6.9 |
| Tongariro | 43 | 0.7 | 1.2 |
| East Cape | 110 | 1.8 | 1.6 |
| Hawke's Bay | 269 | 4.5 | 4.3 |
| Taranaki | 180 | 3.0 | 3.3 |
| Wanganui | 111 | 1.9 | 2.1 |
| Manawatu | 197 | 3.3 | 3.5 |
| Horowhenua | 89 | 1.5 | 1.6 |
| Wellington | 1,077 | 18.0 | 9.9 |
| Wairarapa | 58 | 0.9 | 1.2 |
| Nelson Bays | 169 | 2.8 | 2.1 |
| Marlborough | 74 | 1.2 | 1.2 |
| West Coast | 43 | 0.7 | 1.1 |
| Canterbury | 483 | 8.1 | 10.6 |
| Aorangi | 72 | 1.2 | 2.5 |
| Clutha-Central Otago | 27 | 0.5 | 1.5 |
| Coastal-North Otago | 244 | 4.1 | 4.2 |
| Southland | 147 | 2.5 | 3.2 |
| Islands and overseas | 7 | 0.1 | ... |
| Not specified | 288 | 4.8 | ... |
| Total | 5 968 | 100.0 | 100.0 |
In addition to the consultations, the commissioners contracted the Department of Statistics to undertake a public attitudes and values survey. This was to find out whether the public thought New Zealand was a fair and just society, what were the public's social policy preferences and the values underlying those preferences, and whether differences in social policy experience and preference existed between different age, ethnic and occupation groups. It was also intended to compare the submissions with the public survey to see if there were any self-selected biases in the submissions. For the survey sample, the department used a sub-sample of the Household Labour Force Survey, where characteristics of households were already known. The survey was weighted to give sufficient responses from Maori and Pacific Island Polynesians for comparative purposes.
Originally, the research and review programme was based on a small nucleus of research staff, who were required to maintain liaison with research groups in government departments, universities and elsewhere. Their work involved analysing existing information, identifying gaps (and commissioning necessary work to fill them), carrying on research projects of their own, arranging research seminars and preparing briefing papers for the commissioners, besides orchestrating what was beginning to take shape as a research programme of major proportions. By the middle of 1987 it became apparent that they could not be expected to sustain the full range of tasks assigned to them. As a result, the commissioners decided on a definitive research work programme of formidable dimensions in late September.
The research work programme did not follow the obvious path of a sequential study of the major functional areas of social policy (health, housing, justice, etc.) but rather selected general subject areas that could be studied to yield conclusions and principles that could be applied to the functional areas themselves. These general study areas (there were 14 of them) included: the standards and foundations of social policy; work; income maintenance and taxation; women; the Treaty of Waitangi; social wellbeing; the funding of social provision; inter-relationship between social and economic policy; policy management; and processes and systems of delivery of social provision.
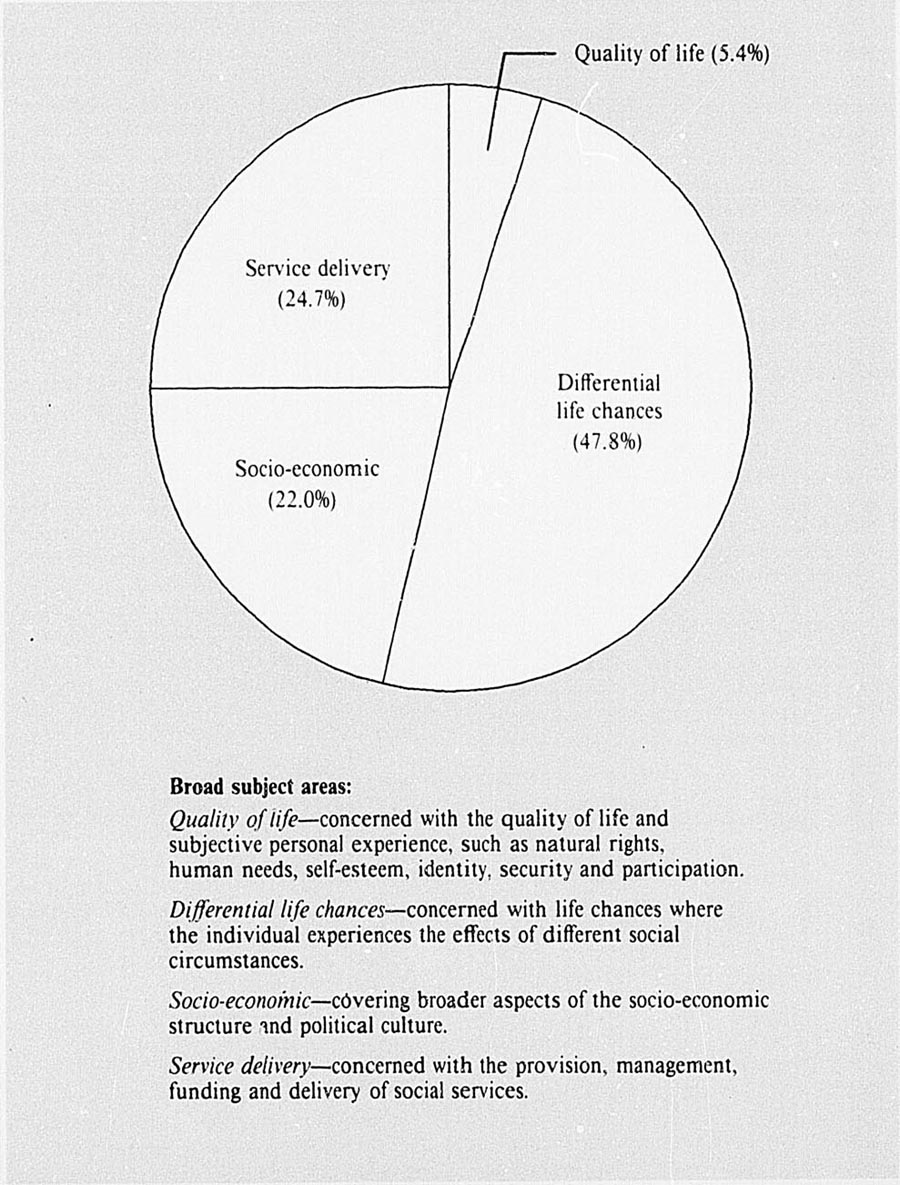
ROYAL COMMISSION ON SOCIAL POLICY
—subject areas covered by
submissions
The plan was that each of these major phases would be managed by contracted researchers selected for the depth of their knowledge and experience of the topic, who would prepare summary briefs, reviews, and background research papers for the commissioners to analyse and examine for a week at a time. Each phase would be thoroughly covered over a lengthy review period, beginning in December 1987 and continuing on until early the following April.
Following the policy phases, further work would be done to integrate the draft conclusions and recommendations with analytical work being done in each of the 17 functional areas and special topics requiring special attention. Special summary papers, and people qualified to write them were called for on health, education, housing, justice, personal social services, energy, environment, transport, mass communications, equality of the races, consumer affairs, the family, and the perspectives of special sub-populations in the community such as the aged, disabled, Pacific Island Polynesians and unemployed.
By the end of April 1988, the Royal Commissioners succeeded in laying down a series of draft papers containing their preliminary thinking on the complete range of social policy issues.
The next step would be to air those views, to consider the public response to them, refine them accordingly and prepare a final report by the end of September. This greatly expanded research and review programme got underway in the final quarter of 1987 but it was to be much modified as a result of government policy changes announced in the last weeks of the year.
Early in December, there were press reports of the Government's intention to establish more task forces to report directly to the Cabinet Social Equity Committee. On 17 December, Government released a major economic package which included explicit statements of policy affecting taxation, income maintenance and superannuation, and confirmed the establishment of 17 task forces (‘officials committees’) which would report to the Cabinet Social Equity Committee.
The commission had examined the income maintenance and taxation phase of its work only the week before with a view to releasing working papers with tentative conclusions by February 1988. To the commissioners it seemed that Government would pre-empt the work of the commission in the crucial areas of income maintenance and taxation and significantly affect other areas of its enquiry. The commissioners announced that they would reconsider their position in mid-January.
On 18 January 1988, the chairman announced that the commission would present a first report to the Governor-General on 30 April. Spurred on by the Government's economic statement of a month earlier, the commission stated that, as it had a wealth of material from submissions, its research programme and the attitudinal survey, it should be taken into account in charting social policy. In the commission's view, it was imperative to make a report based on that material, as quickly as possible. This announcement meant a rapid acceleration of the commission's work, a curtailment of the time earmarked for further discussion and testing, and a severe curtailment of the three months set aside for the final integration and production of the report. The April Report could not be the finished document the commissioners had in mind for 30 September, but the challenge presented by the new target date was accepted. In the event, the commissioners produced the working paper on income maintenance and taxation in early March, followed by the four-volume April Report (Volume III was in two parts), a further series of 20 occasional papers in May, and a summary report in June. Although they had left the way open for a further and final report in September, in the end they did not pursue that option.
In the April Report, the Royal Commission on Social Policy states that the overriding aim of social policy should be social wellbeing; a condition which exists when all members of the community have a reasonable expectation of achieving a healthy and happy life. The work of the commission reflected New Zealand's increasingly bicultural approach to social issues; an approach which tries to balance Maori and other Polynesian views which emphasise community rights and obligations with those of Anglo-Celtic and other Western cultures which are underpinned by the important notion of individual rights and freedoms. In Maori practice, people's rights, needs or the idea of their individual wellbeing cannot be separated from the rights associated with group membership. The commissioners argued that in New Zealand these approaches are necessarily complementary.
Below is a summary of the commission's recommendation in the broader areas of social policy. In the section following, recommendations in the more specific functional areas are summarised, while another final section entitled ‘Special perspectives’ gives some of the commissioners’ recommendations concerning minority groups.
Although the principles of the Treaty of Waitangi were listed in the terms of reference as a foundation of New Zealand society, the treaty does not have a secure place in New Zealand's constitutional practices and statutes. Inequalities between Maori and non-Maori New Zealanders in work, education, incomes, health, and home ownership reflect a lack of regard for the treaty in the development of social policies. In the same way, the commission argued that widespread dispossession of land would not have occurred if economic policies had been required to conform with the treaty. The commissioners held that the treaty should be central to New Zealand society; part of the matrix from which all social and economic policy should come. They recommended that the treaty should be made part of the New Zealand constitution so that its values and principles are embedded in New Zealand society. The commissioners concluded that three principles of the treaty have widespread relevance to social policy and its objectives, these are partnership, protection and participation.
The original partners to the treaty were the Crown and over 500 chiefs representing many, but not all, tribes. Today the partners are not so distinct. In general they are the state and its agencies on the one hand, and Maori authorities, representing members of all the tribes (whether original signatories or not) on the other. For regional and local matters, the partners should be the relevant regional or local body and the local tribes. Although the treaty is about partnership between two main groups, it lays the foundation for many cultures by providing the legitimate basis for the presence of all New Zealanders, of whatever ethnic origin, and it clarifies the unique position of Maori in New Zealand as tangata whenua.
The commissioners stated that the treaty is timeless. Not only must the past be considered in the light of its principles, but also the future, as those same principles should underlie future economic and social wellbeing. The treaty also requires respect for cultural values in the development of policies and the provision of services. Further, the treaty always speaks, being relevant to all policies and services and cannot be confined to particular matters only. There were nine specific recommendations made concerning the Treaty of Waitangi, including:
The treaty's constitutional entrenchment, which should proceed with due speed and in accord with the principle of partnership;
Application of greater resources to the Waitangi Tribunal and more active involvement by government in making sure that its findings were given effect;
The establishment of a ‘treaty commission’ which would give emphasis to the pro-active provisions of the treaty, auditing existing and proposed legislation and the policies and practices of state agencies;
All education agencies should initiate programmes about the meaning of the treaty in New Zealand society past, present and future;
Well resourced iwi (tribal) authorities should be encouraged to promote Maori development and self-sufficiency; devolution of government functions to these iwi authorities should proceed in an orderly and clearly developed partnership only when there has been sufficient preparation at tribal level; and
Partnership between the state and its agencies on one hand, and Maori authorities representing tribal members on the other, should be accompanied by a reorganisation of the machinery of government so that it will be more efficient, more useful and better able and willing to respond to the needs of Maori development.
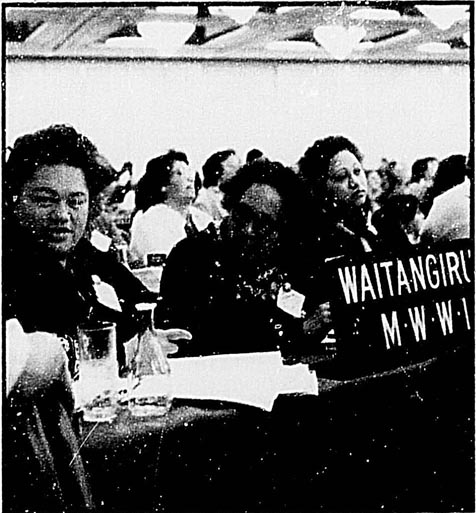
Maori society develops its own policies, and the royal commission applauded and encouraged this complex process. The 1984 Hui Taumata (the Maori Economic Summit Conference) prescribed a decade of Maori development and identified several key issues, including the need for Maori to take active and initiating roles in order that the high levels of negative funding in health, education, justice, labour and welfare might be made unnecessary by the creation of a positive economy with greater Maori control over Maori resources. It was a challenge accepted by many groups and organisations and comprehensive strategies relating to social, cultural and economic development were the subject of many submissions to the commission. These strategies should aim to enhance the environment (te ao turoa), Maori's place of security and self awareness (turangawaewae), the bonds of kinship (whanaungatanga), and cultural heritage (taonga tuku iho).
Three major issues arose from the many Maori submissions and constituted a broadly accepted Maori view of their own development needs. Appropriate Maori development anticipates:
High levels of Maori participation in Maori society and in the wider community;
Self-determination (one of the major themes arising from marae hearings), requiring that Maori people develop their own policies, some of which will impact on other regional and national agendas; and
All policies taking cognizance of the principles and objectives of Maori development.
While the terms of reference state that the equality of women and men is one of the foundations of New Zealand society, the commission found that in practice there is no real equality between men and women in politics, business, paid and unpaid work, family life or community activities. This is despite the massive contribution made by women to community life. In the many submissions made by women, they showed a need for:
More power and choice in their lives;
Recognition for unpaid work;
Social structures which help in combining paid and unpaid work;
Acknowledgement of the high cost to carers of the caring work they do; and
Financial independence.
There are three major disadvantaging factors affecting the position of New Zealand women, they are:
Women carry an unequal share of responsibility for one essential aspect of social wellbeing—on caring for those who are necessarily dependent on others.
There are patterns of male behaviour which are clearly harmful to women in particular and to society in general.
There is a lack of participation by women in public and private decision-making and resource allocation.
Maori women are further disadvantaged. Their economic and social wellbeing has been undermined by the loss of land and the weakening of whanau, hapu and iwi structures, consequences of failure to recognise and implement the principles of the Treaty of Waitangi.
The High Cost of Caring—Today most women are primarily members of the paid work-force who take time out for child-bearing, child rearing and other caring work. Even when they are not classed as being members of the paid work-force (when they are financially dependent on another person or on a benefit) they are usually still economically active because they are doing unwaged work in the household and often in the community as well. This unwaged work is not an optional extra, because society needs it so other activities can take place, especially the bearing and nurturing of the next generation. The special feature of this type of work is that it involves constant, long-term responsibility for another person with little dependable or affordable relief, and is often accompanied by a sense of social isolation.
In paid work, women overall are disadvantaged by the kind of work they do, and the lack of choices and options their work involves. They are concentrated in lower-paid jobs with little career structure, training or advancement. Their paid work is circumscribed in their unpaid work responsibilities, and while in their unpaid occupations they acquire a wide range of valuable skills and experience, these often go unrecognised in the labour market.
Because of the difficulty of combining paid and unpaid work, unpartnered women doing caring work are likely to be financially dependent on the state. (In 1986, 81 percent of solo parents were women, two-thirds of them were not in paid employment or were in waged work for less than 20 hours per week.)
Male behaviour—The royal commissioners concluded that central to women's concerns for social wellbeing is the need for each person to have as far as possible, genuine autonomy, equality of status and a reasonable measure of control over how they are treated. This need is most acute in health, sexuality and personal safety.
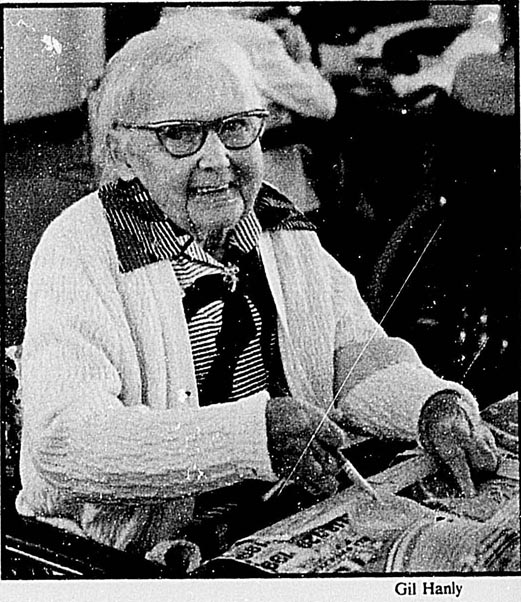
Gil Hanly
In heterosexual relationships the common expectation has been for women to be responsible for controlling their own and men's sexual behaviour, yet they are also expected to be passive and submissive in contrast to the active aggressive behaviour expected of men. Such stereotypical images are portrayed and reinforced not only by pornography, but also in a vast range of materials across all media.
Male violence against women is linked with women's disadvantaged economic position in general and their financial dependence on a male partner in particular. Because of a strong belief in family privacy, the true nature and extent of this violence (whether it is rape, domestic violence or incest) has only recently begun to be publicly acknowledged and investigated.
Participation—Women have little choice or influence in the major decisions that affect them. Gender should not be the determining factor in whether a person becomes involved in community life, unions, local or central government. In particular, unpaid caring responsibilities in the home should not exclude anyone from taking part in other areas. Full participation means that women would share equally with men in decision making and other political processes as well as in employment and in family and community life.
The general issues for women are even more stark for those with disabilities. For the disabled, securing paid work and achieving financial independence are doubly difficult, while for those responsible for the care of disabled people the lack of appropriate support is even more acute and constraining than for those caring for the non-disabled.
The commission concluded that most people have little understanding of the needs of the disabled. Education to increase public awareness, and affirmative action programmes in employment and housing and individually assessed income support measures are amongst major policy changes required to improve the position of those with disabilities.
Other recommendations from the April Report which are of particular importance to women include:
Waged work should no longer be so rigidly structured that it ignores the importance of unwaged work. (This will require increased provision of parental leave for childbirth and childcare, domestic leave for men and women, more flexible working hours, and greater protection of the rights of part-time workers.);
Unwaged work should be more adequately measured so that its contribution to social wellbeing is more publicly acknowledged and taken into account in social policy;
Women should be given genuine choices and opportunities to develop their capabilities and to meet their needs and the needs of those in their care. (This would require that some unpaid work is paid through a carer's allowance, integrated into education and retraining opportunities and the provision of flexible, affordable relieving care.);
Legislation to provide equal pay for work of equal value, and affirmative action policies in employment and community affairs;
Society as a whole must pay more attention to changing those patterns of male behaviour which are clearly harmful to women in particular and society in general; and
Continued action by the state on behalf of women to bring about the above and other changes.
From the outset, the commissioners were made aware of the interdependence of economic and social policy, how they are regarded as complementary means of enhancing wellbeing and how a narrow focus on one or the other will lead to a distortion of reality.
The commissioners recommended that neither should be developed in isolation from the other, rather that policy should be integrated and co-ordinated with a more humane balance between economic and social policy considerations than has occurred in the past. This would mean assessing all the main public and private benefits and costs arising from a policy shift (such as a change in taxation policy), the provision of information to both policy-makers and the public, the encouragement of informed debate and opportunity for the community to take part, the setting up of effective monitoring and feedback systems, and the development of structures and methods for policy development within government which would draw on the insights and evidence of a wider range of disciplines than in the past.
The key role of the state as the ultimate expression of collective responsibility was emphasised by the commission. The commission defined ‘the state’ as all state agencies developed under statute and receiving funds, including central government, regional and local authorities, area health and hospital boards, university councils, and state-owned enterprises.
The April Report argued that, while it was true that only the state can ensure a standard of living high enough for everyone to play their full part in the community, genuine opportunity for everyone to develop their full potential and a fair distribution of the wealth and resources of the nation, there were a number of changes need in policy making and delivery.
Amongst the most needed changes are those to reflect the partnership concept of the Treaty of Waitangi. These changes would allow for more participation and greater representation from the whole community, the devolution of power, responsibility and resources so that those most affected by decisions share in making them and carrying them out, and more open accessible information and procedures which would include continuing monitoring and assessment of the state's activities.
The commissioners found no firm evidence that the state's role in social and economic policy saps people of initiative and a desire for independence. Such changes as proposed would instead encourage partnership, and let more people share power and decision making and enhance their chances to show initiative and exercise choice in their own destinies.
Many people told the commission that there was a need for greater community participation in decisions. Giving people a chance to have a say if they wish was seen as an essential part of a sound democracy, but equally importantly the people who influence decisions should truly represent the community. Both of these factors are underpinned by transparency—it should be clear to people in the community what policies are, and how, when and where decisions that affect them are made. Further, people affected by decisions that change their lives should have the right to influence the direction of those decisions and be informed of the policy and resource issues involved.
Families, communities, tribes, religious and voluntary organisations, and the private sector must be recognised as partners with the state in the development of policy as well as the delivery of services.
Community participation is a form of power sharing. It requires the transfer of responsibility, authority and resources from an arm of government to less-centralised bodies, so that functions can be carried out in a relevant, responsible and cost effective way. Effective power-sharing needs to recognise that there are basic differences in Maori and tauiwi approaches to decision-making. While the criteria of participation, representativeness and transparency apply to Maori society as they do to others, there needs to be different understandings and applications of these themes to ensure that Maori participation can be on terms compatible with Maori values.
Education about community participation is essential for official, elected representatives and the public itself, participation cannot succeed unless there are government structures designed to encourage it as part of the policy process.
Further, policy and service provision suffers from lack of co-ordination at central, regional and local level. At present the formal integration of social policy happens only at Cabinet level and to a very limited extent within Treasury. The commission propose a permanent group be set up with the specific task to coordinate social policy in an informed and expert manner. Such a co-ordinating group would require enhanced assessment and monitoring tools to measure the effectiveness of policies and service provision, not just in terms of volume but also quality, social goals and social impact. They suggested a range of possible options which could be pursued.
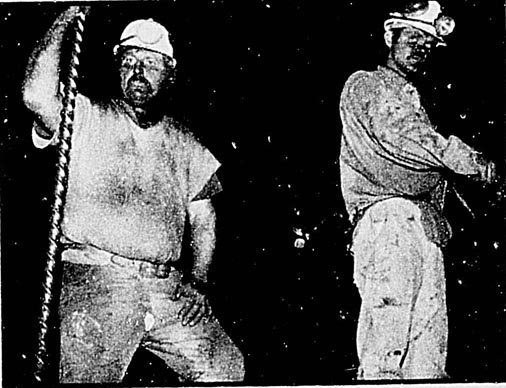
Work, both paid and unpaid is central to the wellbeing of New Zealanders. How it is distributed, the conditions under which it is performed and the significance attached to it have an impact on every other aspect of social policy. This was a recurrent theme in submissions from the general public and specialist groups and was reinforced by a research programme that drew on extensive overseas material, consultations and discussion with expert groups and a number of specially commissioned papers.
Current economic policy to improve the performance of the New Zealand economy in the face of high inflation, low productivity growth and a reducing standard of living has concentrated on reducing inflation—with the short- and medium-term cost of increased unemployment.
The commission argued that there are compelling social and economic reasons for applying alternative fiscal policies to reduce inflation which would have less impact on employment and would share the adjustment costs more evenly across the society.
More flexible wage policies (which would give employers greater freedom to vary wages by reducing pay rates in some regions and some occupations) were among the many suggestions made to improve the distribution of work. The commission found many reasons to doubt the effectiveness of such policies as a means of solving labour market problems. They affirmed that workers have the right to a sustaining wage, and that the labour market as a means for equitable income distribution has no substitute. The evidence available to the commissioners led them to conclude that abolishing the minimum wage and applying other ‘flexible’ wage policies would not have a significant effect on creating work or reducing unemployment.
The commission reached the view that full employment ought to have equal consideration with low inflation and economic growth as key objectives of all policy, but even within a framework of economic policies which gives primacy to full employment, there will still be a need for active labour market policies to provide sustainable economic growth alongside employment growth.
They recommended that a number of policy changes to enhance employment should be followed, including:
Government commitment to achieving and maintaining full employment and not to use high unemployment or increased levels of unemployment to obtain other policy objectives;
A social contract where wage bargaining takes place in a structure which enables wage settlements to be reached which are appropriate to the economy; and
A mix of active labour market policies which will have an immediate impact on the availability if paid work be continued into the long term.
Active labour market policies envisaged by the commission include training assistance, skill development, mobility grants, vocational guidance, job vacancy information and placement services, community initiatives to generate jobs, and employment creation programmes (funded at least in part by the state). While New Zealand has a tradition of such policies and programmes, the amount spent on them has declined by 25 percent since 1985, while the amount spent on unemployment benefits has risen. The commission proposed that more money be spent on positive rather than negative responses to unemployment.
In addition, the commission recommended that more attention be paid to eliminating inequalities between men and women through implementing ‘comparable worth’ and equal opportunity policies outlined in the above section on women, as well as equal opportunity policies to reduce or eliminate other inequalities which affect employment for some Maori and Pacific Island Polynesian people, those with disabilities, homosexual men and women, and the aged.
Originally the commissioners proposed to produce working drafts of their major conclusions from March to May 1988 which would then be open to public scrutiny and comment before being amended and incorporated into the final report. As a result of the accelerated work timetable, the only papers released before the April Report were those relating to income maintenance and taxation. They appeared in February, in an attempt to influence the Government's announced intention to make major taxation and benefit reforms.
Although fair distribution of wealth is one of the standards of a fair society, merely redistributing income is not enough. It must be seen in relation to access to and funding of housing, education, health and other social services; the quality of access to these services contributes to wellbeing.
To most New Zealanders, the key to a just society is wide employment opportunity. The system of income maintenance and taxation which evolved in an era of full employment is unable to cope with long periods of economic downturn and high and persisting unemployment over more than a decade. Nonetheless, New Zealanders generally accept that the state is the only effective manager of the risk all people face of not being able to support themselves when age, caring duties, sickness, injury or unemployment take them out of the workforce.
The April Report argues that what is needed to ensure greater fairness is a combined labour market and income maintenance policy aimed to widen job opportunities. The commissioners set out the objectives, principles and eligibility criteria for all forms of social provision, including income maintenance, which had evolved from their careful study of New Zealand history, society and values. The major objectives are:
To ensure that all have access to a sufficient share of income and other resources to allow them to participate in society with a measure of certainty and security and a sense of achievement and fulfillment;
To relieve immediate need arising through unforeseen circumstances; and
To ensure the wellbeing and healthy development of all children.
The principles of individual and community responsibility, dignity, cultural diversity and equality of treatment together revolve around the need for the income maintenance system to conform to criteria of equity, efficiency and simplicity. At present those who have had an accident get earnings-related compensation, whereas family benefit is universal and most other benefits, such as unemployment or superannuation, are targeted.
Arguments for more clearly targeted benefits—in contrast to universal application—were considered at length by the commissioners. Targeting is said to provide maximum assistance to the poor at least cost, thereby providing better value for expenditure. Those favouring universal benefits argue that a system aimed only to assist the poor helps to perpetuate existing inequalities by reinforcing differences between the poor and the rest of society, while at the same time locking the poor into a cycle of impoverishment by its system of benefit abatement. In the long-run targeting can generate resistance from taxpayers unwilling to support a system perceived as rewarding the improvident. The commissioners favoured universalism wherever possible because it reflects the interdependence that characterises community membership and fosters social cohesion. The commissioners stated that the existing variation in deciding ‘who should get support and how much’ is fair when seen in the context of the life-cycle, with help provided for all at some stage in their lives. Indirectly all have the assurance of knowing that assistance is there when it is needed.
The ways in which taxes are raised and spent are social policy concerns and should be considered against standard criteria of efficiency and fairness. Any exclusion from the comprehensive tax base, and any concessions, preferences or subsidies need to be justified applying those standards. In the light of this and all evidence the commissioners concluded that in terms of fairness and efficiency, the argument that capital gains be taxed was overwhelming.
Specific recommendations made by the commission for reforms to the social security system include:
The present base levels of benefits should be maintained and regularly adjusted, with income-tested benefits standardised and the system as a whole simplified.
The individual adult, not the couple, should become the unit of assessment for income maintenance. However, because of the considerable unshared costs of living alone, a ‘living alone’ supplement should be paid to all adults who do not share their household accommodation with other adults.
The age of entry to the work-force should be raised progressively to 18. This would require more investment in post-compulsory education and training. A youth allowance should also be paid as an incentive to people (15–18 years) to stay in education or training. At 18, this should be followed by a standard taxable, but not income-tested, grant.
The family benefit as a universal allowance should be retained but increased and indexed for inflation. There should be a merging of the domestic purposes benefit and widow's benefit, then renamed the ‘carer's allowance’, a name which would better reflect its role. As economic conditions allow, the family benefit and the carer's allowance should become the means of delivering income support for families, replacing family support and guaranteed minimum family income.
In respect of accident compensation and its relationship to other forms of income maintenance for people incapacitated by causes other than accidental, the commissioners argued that there should be no difference in the support offered to the sick, the disabled and the injured. At present the injured receive relatively generous income-related benefits if they are in paid work, there is no justification for the stark difference between them and the disabled (who get lower levels of income-related support) or the sick (who get an even lower standard maintenance payment). The difference in levels of support is further exacerbated by the injured having priority access to medical services, a situation which the commissioners would have revoked.
Although the commissioners acknowledge that it would not be financially possible to treat accident and illness victims the same immediately, they propose a three-stage approach to reducing the gap between them. Their aims are to ensure that the disabled, whether inside or outside accident compensation, should enjoy parallel disability allowances, and that an extended scheme for the support of the chronically sick and disabled should have the same broad structure as accident compensation.
Many people questioned whether the existing national superannuation scheme was still affordable, given the long-run economic depression and predicted ageing of the population.
There is little doubt that a generally held expectation of entry into the work force at 15 or 16 years and retirement at age 60 is wasteful in social, economic and human terms. It generates a disenchanted underclass at one end and is matched by the premature loss of many active and experienced people from the work-force at the other. The commissioners recommended the goal of pushing work-force entry to about age 18 mentioned above and an exit about the mid-60s.
Income maintenance policies would then better support the development of an effective, trained and adaptable work-force and recognise the capacities of those in their 60s to continue to participate in work, whether paid or unpaid. The commission in turn recommends that a two-tier national superannuation system should be phased in between 1995 to 2007. This would have an income-tested benefit paid at age 65, with a universal component from age 68.
While there is likely to be an increasingly important role for the private sector in facilitating retirement incomes, the greatest contribution government can make is to provide a stable environment in which individuals are able and are encouraged to make their own retirement provisions. Many New Zealanders, especially from the lower income groups, will not have realistic opportunities during their working life to provide even a small income for themselves and their dependants after their retirement. If the people of New Zealand are to enjoy certainty and security in later life, they must be able to plan for their retirement, assured of what state-provided support will be.
If the economic position of the elderly is not to be seriously undermined in the future, the question of private savings opportunities must be given careful consideration before any changes are made to the existing system of national superannuation. The commissioners strongly urged a political consensus and early bipartisan action on changes to national superannuation.
Funding—Decisions about who funds and provides services essential to social wellbeing are important aspects of social policy. New Zealand is a mixed economy with all sectors producing goods and services: the state, the private sector, co-operatives, community support networks, families, tribal groups and household units. While government may provide some goods and services directly (e.g., public hospitals) in other cases it may work within a market framework to increase consumer purchasing power by adjusting prices and incomes through subsidies, tax and benefits.
Following extensive consultation, the royal commission concluded that the Government must continue to be involved in the funding and provision of social services. Only the state can guarantee an equitable distribution of services and can ensure the best use of resources.
New Zealand's social programmes are funded through taxation, private funding, various forms of insurance, voluntary organisations and family and community networks. While the private and voluntary sectors are important, government is the dominant funder and provider, spending an estimated $14 billion on social services, education and health. These account for almost three-fifths of the state's total expenditure, mainly funded from taxation, but partly through a deficit.
Deficit financing creates public debt to be serviced by future taxpayers, or where funding is made by increasing the money supply, the cost is shifted into the future through inflation.
While New Zealanders tend to think of themselves as heavily taxed in comparison with the other 22 OECD countries, this is not so. Using 1985 figures, New Zealand tax receipts as a share of GDP are amongst the lowest, with only five countries having a lower proportion. There is little international evidence to show that any particular level of government expenditure as a proportion of GDP has been detrimental to economic performance, while more conclusive evidence exists to show that high levels of government involvement produce greater equalities of outcome.
Some services can be better provided directly, others by redistributing the money which would be spent on social services in the form of income supplements, so that consumers may make their own choices in health, education, housing and other areas. The present system is mixed, with some cash transfers (such as welfare benefits) and some direct provision (such as education and health care).
The commission believes it essential that some social services continue to be provided directly—these include certain health, education, early childhood and housing services. Each of these is fundamental to a social structure which gives all its members a reasonable opportunity to live fulfilling, enjoyable lives. The commissioners stated that all people have the right to a certain minimum standard of health care, housing and education, providing the cash equivalent is no guarantee that this standard will be met.
Provision—The providers of social services are the state, personal and family resources, voluntary, religious and community organisations, the private sector and Maori iwi delivery systems. The commission supported the central role of the state in provision—to keep an overview, and ensure that resources are distributed equitably and used efficiently—but felt other channels must be encouraged through various forms of partnership with the state. The state, in working in partnership with other sectors, should ensure that sufficient resources are provided so that everyone can enjoy an acceptable level of wellbeing. The state's role involves the direct provision of some services, the allocation of resources, the setting of standards regulating professional and community practice, and overall planning, co-ordination and monitoring.
Voluntary and other non-state organisations extend the services provided by the state, often in an innovative and experimental way and by working in particular areas of sensitivity and need. They have been most often associated with provision in the area of personal or social welfare services. Too great a reliance on voluntary organisations has in the past led to many needy groups not being adequately serviced because there is no commitment to respond to all claimants of help, to all classes of claim, or to provide a right of redress for poor or reduced service.
Church-based groups have traditionally been prominent in taking on responsibility for caring for ‘unpopular’ groups such as alcoholics, who have been neglected or avoided by other organisations. An altruist tradition has helped to give religious organisations wide appreciation and support, although the support they give may be biased towards members of their own religious group to the detriment of others amongst the needy.
Voluntary and religious-based agencies have to respond to changes in funding environments, to changes in the availability of voluntary or low-paid labour, and to increasing expectations of clients themselves to have a greater hand in the management of their own affairs. In some areas the state should contract out by providing agencies with money for the task—requesting accountability and ensuring that the services are delivered.
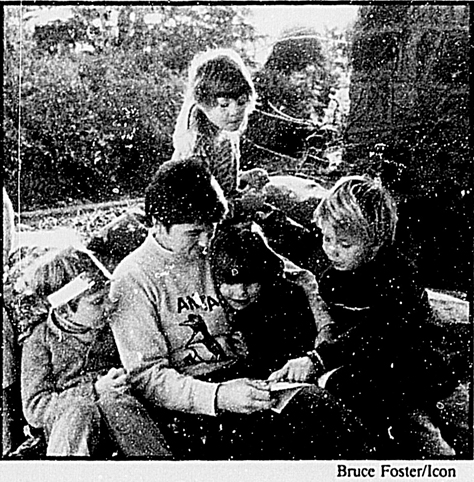
The restoration and growth of Maori delivery systems is promising, and warrants greater state support. Especially since about 1980, a greater interest in tribal structures and systems has developed with a recognition of the future role that tribes might have. The rise to prominence of iwi development is not just a comment on other existing provisions and their poor outcomes for Maori people, but also a comment on the underlying strength of iwi structures which, despite assimilation policies and widespread urbanisation, remain fundamental to Maori social organisation and identity. The extent of iwi delivery is untested—in partnership with government it has had only limited operational success—but there is considerable interest in tribal provision of education, some health services, housing, justice, and the mass media.
Iwi delivery is an evolving process, requiring partnership with local and central government; opportunities to strengthen practical links between iwi members who live in different parts of the country; consideration of accountability both to government for funds received and to consumers for services given; clear understanding of authority, decision making and funding; and mutual trust. Iwi development requires a commitment from government at all levels to adhere to the principles of partnership, protection and participation which are embodied in the Treaty of Waitangi.
The Royal Commission on Social Policy began by accepting that public participation in policy making was necessary in the creation of an efficient democracy. It recognised that enhanced participation is a complex matter and a goal not easily achieved, but sought ways of developing public participation while recognising four principles:
Participation is a value held by most theorists of democratic government.
In any society only a few people are active participants and they are unrepresentative of the population as a whole.
Public participation may not necessarily be a force for change, but may be conservative or even reactionary.
Administrative agencies use participation for their own ends.
As noted earlier, participatory democracy has three major elements. They are:
Participation (whereby people have an opportunity to have a genuine say if they so wish);
Transparency (whereby people are told how, when, and where decisions are being made, and who is making them); and
Representativeness (whereby it is ensured that the people who influence the decisions are representative of the community).
To achieve the goal of effective public participation in decision making, consultation should firstly lay the options for the policy before the affected members of the public. Next, public views should be actively sought and considered before the decision is made. Finally, the public should receive feedback on any decision and why it was made.
Achieving these criteria for effective public participation in decision making will require substantial education, not only of officials and elected representatives but also of the public, in how to participate effectively. The commission further concluded that appropriate means must be developed which will ensure genuine public participation and monitor its effectiveness. The following principles were recommended:
The structures of government should be designed to maximise and encourage participation.
Public participation should be part of the regular decision making process of government.
Participation in decision making is time consuming and has implications for the speed of decision making.
Participation can take many forms—an interested and active listener is participating, so is someone who attends a meeting and although given a real opportunity to speak, declines to take it and says nothing.
Participation should not be compulsory—whether or not one exercises one's right to voice should be a free choice.
Transparency of policy decisions has always been a particular difficulty, few people wanting to have a voice in policy actually know how, when and on what basis decisions are made. Access to such information is vital for appropriate public participation. Every individual and community affected by decisions taken directly or indirectly to achieve changes has the right to know of those decisions in terms of when, where and how they are being taken. This right is concomitant with the rights to be informed of the policy and resource issues involved in taking those decisions, and to influence the direction of those decisions.
The Official Information Act 1982 safeguards and enforces the public's right to information, and the public's opportunity to challenge the quality of the information given to it. For the provisions of the Act to be upheld, the public must be adequately informed about where they may obtain the information.
The commission focused special attention on election manifestos as an example of the issues of transparency. There are limits to the electoral choice of the New Zealand public, who need to know what those who seek elected office stand for. As a consequence, there is immense public responsibility on political parties to document their policies, priorities and underlying values and principles adequately—before election day. It is only when the known intentions of the elected are on public record that the voice of the electorate can have effective value and later assessment be made of the elected, their promises and their achievements.
The representativeness or otherwise of both elected members and the bureaucracy of central, regional and local government has been raised as an issue for many years. Few women and fewer Maori hold positions above middle management level and this undoubtedly has consequences for the values and perspectives held by decision makers, let alone the consequences for those groups who feel that they are marginal participants in decision making throughout the community. At present, Maori participation in decision-making bodies depends on election through the democratic process or appointment by the Government or other authorities, neither of which are considered appropriate to Maori procedural methods. Of particular concern to Maori making submissions to the royal commission was the practice of appointing individual advisers or representatives without prior consultation with Maori authorities.
Non-representativeness does not only apply to Maori interests. The April Report noted that many who made submissions to it spoke of the under- and over-representation of particular groups in the community, and it endorsed the statement from the Department of Internal Affairs which noted the narrow stratum of society from which candidates for election to local authorities come, quite often representing the dominant power elites of commerce, agriculture (in rural areas) and the professions. The result is that councils favour conservatism and resistance to the adoption of measures likely to increase the wellbeing of the communities’ diverse membership.
The social impact of policies—Regular evaluation of social policies is just as important as their initial formulation and implementation. The Royal Commission on Social Policy identified nine principles which need to be adhered to if the social impact of policies is to be assayed properly. They are:
All the significant values and goals associated with both policy formulation and programme delivery should be identified.
Monitoring information should be available for public scrutiny to provide feedback adequate for the modification of policy and policy goals.
The community should participate in the setting of policy goals and objectives.
All forms of activity that have expressed or implicit community endorsement should be monitored.
The performance of individual public institutions or programmes must be assessed in the context of both the emerging needs of a changing society and the demands of an internationally healthy market economy.
The goals and objectives of Maori development should be recognised by relevant official statistics and they should acknowledge definitions of wellbeing and spirituality of distinct relevance to Maori.
Effective monitoring should be timely, planned, of known quality, relevant, economical and, where required, ongoing. It should bring together a variety of information, measures and judgements.
Where any professional judgement is made about an individual in the course of assessing and monitoring policies, then that judgement should be made known to the individual before any resulting action is taken.
Access to information essential to democratic processes should be acknowledged as a public good.
Besides the above general recommendations based on the underlying principles of social policy, the April Report produced numerous additional recommendations which were more specific to the functional social policy areas. Some are noted below, but lack of space precludes a complete coverage.
Many New Zealanders do not enjoy their basic right to good health. Some ill health is due to individual actions such as smoking or other substance abuse, but social, cultural, environmental, industrial, and other factors outside individual control also play their part. To some extent the inequalities have been recognised and are being addressed. Undoubtedly, health policy is in transition, with the Department of Health in the process of becoming a policy ministry and its service functions devolved to new area health boards.
Funding of health is partly from the state (which is the main provider of secondary care including hospitals) and partly from private sources. (The state ‘tops up’ the mainly-private primary care, including general practitioner services.) In practice this has meant an increasing proportion of public funds goes to public hospitals and pharmaceuticals, and correspondingly less to other health care.
The keys to change outlined by the commissioners were:
A shift in the emphasis towards health maintenance and away from the treatment of disease and illness;
Better use of health resources through more effective planning, improved management, more relevant information systems, and greater attention to quality control within public hospitals;
Improved co-ordination and integration between the various providers of health services—between central government and local health authorities, primary and secondary health care, voluntary and statutory provision, institution and community, public and private, mental and physical health, and health and other social services such as housing and education;
Fairer allocation of limited funds, so that rationing can be spread across society and not fall too heavily on those who cannot afford to pay extra for private services and
Increased recognition of the important role of choice and convenience which private services provide for those who can afford them. Their provision should not undermine the services offered by the state.
The commissioners stated that good health for all New Zealanders requires the active participation of consumers in health policy and health services. At clinical and administrative levels the voice of the consumer is often heard only when dissatisfaction becomes intolerable or happens to match political expediency. Women, as the main consumers and providers of health care, are poorly represented at decision-making levels in the health system.
Given the lower levels of Maori health, better and more appropriate provision of health services and care for Maori people is a priority for all health service agencies. Legislation should guarantee Maori participation in health policy formation and service delivery.
The commissioners also expressed their opposition to the large regional health authorities envisaged by the Hospital and Related Services Task Force. It was felt they would centralise control and reduce opportunities for community participation in planning and decision making.
There is widespread public awareness of the impact of education on individual life chances and social wellbeing, as well as on the community as a whole. The latter is especially so when the poor educational achievement of many sections of the community is translated into wasted potential for the enrichment of the wider society. From the submissions and from the public opinion survey (mentioned above), it was clear that education is widely seen as a necessary pre-condition for participation in work, personal relationships, community life and leisure. And, while it cannot be expected to overcome poor housing, bad health, unemployment or discrimination, most New Zealanders believe that education should enhance life and social wellbeing rather than entrench existing inequalities.
Like health services, the New Zealand education sector is in transition. The themes of participation and partnership are as relevant to education as they are to health, and the commissioners indicated support of measures at both national and local levels which would incorporate different perspectives into decision making and to foster a co-operative, participatory approach.
In Maori education, which has to be recognised as a national priority area, the commission recommends urgent changes in policies to enable Maori communities to make their own decisions on education, and to clarify the essence of Maori education which will validate tangata whenua knowledge, values and institutions. Policies are needed which will reverse the present system of failure for Maori people in formal education; ensure that Maori people have and retain full possession of their language and tikanga (customs); and to provide genuine opportunities for all people in New Zealand to develop knowledge and understanding of the Maori world.
There is no question that most New Zealanders see the state as the main funder of education, although there is much debate; firstly, on how public funds should be spent, whether they should go to the users (parents and children) or to the providers, and secondly, to what extent the state should be a direct provider of services as well as a funder.
The Royal Commission on Social Policy rejected the concept of any form of voucher entitlements for education, because the evidence points to even more unequal access and greater differences in the quality of outcomes than at present.
Stemming the erosion of access to education and quality of services in rural areas will require more imaginative solutions than at present, and a realisation that a degree of subsidy from urban to rural and isolated areas will be necessary if equity is to be achieved.
The commission also recommends priority being given to good quality early childhood care and education, not just for the benefits this will bestow on children, but for the greater equity and wellbeing of parents (especially mothers) it will engender.
Until we learn that there are some areas of human activity which are too important to be left to the decision of those with economic power but no social responsibility, the problem of homelessness will remain with us. (From the National Housing Commission's submission.)
Many thousands of New Zealand households with children (the National Housing Commission estimated early in 1988 at least 20 000) have serious housing needs. There are thousands of others without children who are also in dire need.
Home ownership is especially valued by New Zealanders but with the cost of buying a house being high in relation to income, low and single income households and beneficiaries are most disadvantaged, while the lack of adequate, affordable, rental accommodation generates greater market pressure and social distress.
The commissioners recommended housing policies to ensure all New Zealanders have a right to adequate, safe housing which, along with education and health, are seen as fundamental civil and human rights, and also urged a continuing role for the state in the direct provision of subsidised housing.
Further, they recommended that Government make a financial commitment to eliminate homelessness over a set period and to ensure that it is not allowed to develop again. At the end of the set period, the state should accept a statutory responsibility to house the homeless.
In more general terms, to provide adequate housing for all New Zealanders, the commissioners recommend:
The development of a series of forward plans aimed at identifying and monitoring housing needs, achievements and associated goals;
Better co-ordination of community, consumer, industry and statutory housing interests, and integration with other aspects of social policy;
Community responsive programmes to meet the special needs of women, Pacific Island Polynesian, other ethnic minorities, the aged, and the disabled; and
Programmes to ensure improved housing of Maori people, which will involve joint and co-operative ventures with the Housing Corporation, the Department of Maori Affairs and iwi (tribal) authorities.
The basic principles underlying the system of justice are that it should be accessible and affordable to all citizens; protect the rights of minorities and the disadvantaged; its decisions enforceable; independent of direct political control; and provide a system of punishment that is humane, consistent and proportionate to the offence.
The commission concluded that New Zealand's system has not managed to observe all these principles. There is a widespread perception that it is complex, alien and remote from the lives of ordinary people; there is a perceived ethnocentric bias in its procedures and outcomes, and a feeling that the system fails to provide adequate service or adequate redress to significant sections of the public; and therefore fails to regulate efficient and effective relationships between citizens.
Inequalities resulting from the matrimonial property law are of particular concern. This is because the outcome of an equal sharing of matrimonial property (especially if it involves the equal division of the family home and chattels) does not take into account the inequality of the sharing of responsibilities. Where children are involved, the partner who has had prime responsibility for their care rarely leaves the marriage on equal career terms.
Property reallocation after marriage breakdown should attempt to achieve equality of result between husband and wife. This will generally involve an element of compensation for the spouse who has sacrificed economic advancement in the interests of the marriage and the children, and to protect the living standards of the children who will be adversely affected unless their housing is secure.
The commissioners recommend more flexibility in both civil and criminal proceedings, and urge early consideration to changes in many aspects of sentencing, punishment and police powers and the plight of victims of offending.
Some aspects of the legal protection of human rights were considered in other sections of the April Report, for instance the commissioners urge amendment to the Human Rights Commission Act 1977 to outlaw discrimination on grounds of disability, sexual orientation or age; and the enactment of a Bill of Rights in which the Treaty of Waitangi is included, as well as entrenchment of the treaty in its entirety as a constitutional document.
The importance of energy to social policy was highlighted in the April Report. The main reasons for this are that: energy is crucial to meeting certain basic needs (warmth, mobility, food); the production and distribution of most forms of energy have major impacts on the environment; large energy projects require major capital investment with associated debt and often last a long time (thereby having major, long-term social and economic consequences); and finally, energy is an essential input to production, affecting employment prospects and enhancing the wealth of the community.
Economic rents arise from the difference between what consumers pay for energy and the cheapest existing source of supply. The economic rent is often very large because of the monopolistic nature of production and distribution and the zero value given to natural resources until they are processed. It is generally not apparent who gains this economic rent, the consumer (in the form of lower prices) the wider community (in the form of taxes) or whether it is captured by the producer (in the form of profit).
The commission recommends that in the interests of present and future generations of New Zealanders, energy decisions must form part of social policy.
Further, the commission commented on the frailty of existing processes to protect the public interest and urges public participation in energy decisions by application of the principles enunciated in the section ‘Policy development, assessment and monitoring’ above.
The commissioners argued that central to social wellbeing and the pursuit of personal, social and economic activities is the reasonable availability of adequate, accessible and affordable transport. The right to transportation and the assumption that people can choose where they live and have a basic level of service in that locality despite the inequities resulting from the unequal cost of providing those services, imply a continuing need for subsidies from the wider community. At present, depopulation of rural areas has left many of them with little available public transport, while sprawling urban development with bus, train and car present problems of accessibility, traffic congestion and pollution. Further, costs of both public and private transport limit accessibility and the choice of low-income people and other special groups to pursue personal, social and economic activities. Transport policies should reflect the rational use of community resources and the commission recommends policies to resolve the following transport dilemmas:
Access to community and other services is more difficult for rural than urban dwellers. These difficulties are threatening community viability and the quality of life;
Where reasonable levels of access are provided, there remain significant sections of the population unable, for a number of reasons, to use services;
There are attitudinal and structural constraints limiting the responsiveness of the current system of transport to community needs; and
While resources are limited, measures can still be taken to improve allocations and processes.
Exposure to the print and broadcast media is a major means by which New Zealanders experience and understand their society. Present mass media policies within New Zealand are fuelled by offshore changes in technology and investment and consequential industry, state and public attitudes towards these changes. The so called ‘communications revolution’ of all mass communications, and the ramifications of this phenomenon at its extreme, poses a threat to national identity through the easy substitution of overseas-generated values and expectations for local ones. Coupled with a move to widespread deregulation, these two issues raise major concerns about the degree of diversity available in different media arrangements, and the equality of access available to different social groups.
The commissioners expressed particular concern at the way in which journalists and others in the media had contributed to the maintenance of a strongly monocultural policy in the presentation of information and comment to New Zealanders. Their influence has been of such strength that the media has assisted the suppression of Maori language and culture, failing to acknowledge the historic partnership embodied in the Treaty of Waitangi. The commission's commitment to a partnership between Maori and pakeha should be no less important to such a powerful influence as the media.
The rapid urbanisation of Maori people, and past policies aimed at their assimilation, have posed a significant threat to the survival of Maori language and culture and has contributed to a loss of Maori identity and therefore of New Zealand's unique national identity. The commission recommends urgent action to stem this engulfing tide. It also recommends that broadcasting services work with Maori broadcasting interests in a well-planned devolution of power to achieve more equal policies and enable the media to play a more useful role in positive Maori development.
The commissioners stated that there should be a continuing role for the state in maintaining regulation, accountability and representation in support of the wider public interest, in particular the interests of those sections of the public identified as being under represented in decision making.
Their terms of reference required the commissioners to consider the perspectives of many groups in New Zealand society, either ethnic minority groups, groups with specific economic or social disadvantage (such as the unemployed or the disabled) or groups on the margins of national life, such as youth or the aged. Some recommendations, not already covered, which arose from this perspective work are presented here.
Policies are needed which will actively support and sustain the different ethnic groups within the community. Such policies should have the following goals:
To ensure that members of all ethnic groups share fairly the economic, cultural and social resources of New Zealand;
To ensure the maintenance of the languages and cultural identity of ethnic minorities;
To enable minority groups to make a full contribution to New Zealand's economic, social and political life;
To make effective provision for all new migrants to have ‘English as a second language’ courses available;
To develop an immigration policy which reflects New Zealand's place in the wider Pacific, more particularly as one of the island nations of the South Pacific; and
To eradicate all forms of racism, which are barriers to achieve these goals.
More specifically, for Pacific Island Polynesian people, employment policies are needed which will provide opportunities for co-operative, culturally appropriate, collective approaches to work.
If the promise of greater opportunity in New Zealand is to be realised for migrants from Pacific islands, there is an urgent need for improved and appropriate housing and education provision, including vernacular language teaching. Such teaching will be essential for the survival of some Pacific languages as well as for the wellbeing of the students concerned.
The Royal Commission on Social Policy strongly endorsed the final submission of the Pacific women's group which suggested that within the principles of the Treaty of Waitangi, a future partnership can be forged:
... we as Pacific people seek a partnership with Maori and pakeha for the betterment of our society. We believe that we have a legitimate claim to partnership with the Maori because of our common ancestry; with the pakeha because of New Zealand involvement in the colonisation of the Pacific on behalf of the Crown; with New Zealand because of our shared geographical resources of the Pacific as reflected in the establishment of the South Pacific Forum.
Nearly half a million New Zealanders suffer some form of disability—physical, sensory, psychiatric or developmental—of varying degrees of severity; they are a diverse group with many different needs. Usually the disability is treated as a medical concern and is seen as a problem, and the disabled person deemed incapable of self-support. People with disabilities experience discrimination in employment, education and housing.
Without the same opportunities as others to engage in appropriate and satisfying employment, to live independently and to be involved in the community, people with disabilities cannot achieve dignity, self respect, material and social wellbeing. Policies to improve the well-being of the disabled involve strengthening the legal sanctions against discrimination, and, as mentioned above, the amendment to the Human Rights Commission Act 1977 to outlaw discrimination affecting people with disabilities.
Resources for the disabled should be offered in culturally appropriate ways. Maori people with disabilities should get a fair share of resources which are provided with a heightened awareness of Maori views of health, especially mental health.
There should be better education programmes about disability to improve the position of the disabled.
The commission supports the efforts of people with disabilities to claim their full rights of citizenship, community participation and contribution, but the rest of the community must make it easier for them to do this and to develop themselves through education and employment.
Youth should take an active part in society and should share decision making when policies are developed. The April Report stated that there should be an ongoing role for the National Youth Council in policy, and its methods of consultation were recommended as a way of ensuring that youth participate. As well, the commission sought a central role for the proposed ministry of youth in bringing together policy, and the need for policies to be developed by youth—not simply for youth.
Youth submissions which sought the right to enter the paid work-force and be self-supporting were endorsed by the commission, which recommends the adoption of an integrated youth programme to provide education, training or employment opportunities for all young people between the ages of 15 and 21, along with the income-support measures (youth allowance) proposed earlier.
Policies which are developed for the elderly are based on a variety of attitudes towards them. The commission considered eight different, and often overlapping, perspectives on the aged, and concluded that an appropriate balance of the different perspectives is important. Each perspective, whether it be based on dependency, the need for medical care, empowerment, or continuity and integration, raises particular concerns, but there are also strong and positive aspects of ageing such as the unique and invaluable role of kui and koroheke in policy development.
In the section, ‘Income maintenance and taxation’ (above), recommendations on national superannuation were proposed which would give older people a sense of purpose and continuity and a clear guarantee of what will be the Government's contribution to their support in their declining years. Likewise, policies on community participation do not preclude the participation of the elderly in policy making, especially where policies will directly affect them, and where their accumulated experience is an important ingredient.
Other policy recommendations for the elderly revolved around the need for the national policy on ageing, with objectives in line with the standards of a fair society, and the establishment of a commission on ageing which would sit for five years and be charged with setting up a national policy on ageing and the elderly.
One of the final reflections of the commissioners was that their's was not merely a report to the Government, but a report to all New Zealanders, especially those who were involved in preparing and presenting submissions, and who participated in some way in the formulation of the commission's report. The usefulness of the April Report, the earlier discussion booklets and working papers, and the later occasional papers will rest on how the New Zealand community at large will use this work for the betterment of all New Zealanders in the search for a future that is just and fair.
6.1 Department of Statistics.
6.2 Department of Statistics; Marriage Guidance New Zealand; Department of Justice.
6.3 Human Rights Commission; Office of the Race Relations Conciliator; Ministry of Women's Affairs; Department of Statistics; Department of Internal Affairs. Department of Labour.
6.4 Department of Statistics; Department of Maori Affairs. Maori Language Commission.
6.5 Department of Statistics; Department of Internal Affairs. Royal Commission on Social Policy.
Report of the Department of Justice (Parl. paper E5).
Vital Statistics. Department of Statistics (annual).
External Migration Statistics. Department of Statistics (annual).
Immigration: Occupational Priority List. Department of Labour (six-monthly).
International Migration and the New Zealand Economy—A Long Run Perspective. Institute of Policy Studies, 1988.
New Zealand and International Migration—a Digest and Bibliography No. 1. Department of Sociology, Massey University, 1986.
The Population of New Zealand—Interdisciplinary Perspectives. ed., R.J. Warwick Neville and C James O'Neill, Longman Paul, 1979.
Report of the Department of Internal Affairs (Parl. paper G. 7).
Report of the Department of Labour (Parl. paper G.1).
Review of Immigration Policy, 1986 (Parl. paper G.42).
Report of the Human Rights Commission and the Race Relations Conciliator (Parl. paper E.6).
Demographic Trends. Department of Statistics (annual).
New Zealand Population Projections 1983–2016. Department of Statistics (1986).
Report of the Department of Maori Affairs (Parl. paper E.13)
Vital Statistics. Department of Statistics (annual).
Report of the Department of Internal Affairs (Parl. paper G. 7).
Royal Commission on Social Policy, 1988, The April Report,
Volume I: New Zealand Today.
Volume II: Future Directions.
Volume III: Future Directions: Associated Papers Pt. 1.
Volume III: Future Directions: Associated Papers Pt. 2.
Volume IV: Social Perspectives.
Towards a Fair and Just Society, 1988. (The summary report), Wellington.
A Guide to the Terms of Reference, 1987.
Discussion Booklets, 1987,
Number 1. The Treaty of Waitangi and Social Policy.
Number 2. Work, its Nature, Role and Value in New Zealand.
Number 3. Public, Private and Voluntary Provision of Social Services.
Number 4. Wealth and Income in New Zealand.
Submission Abstracts, 1988.
Royal Commission on Human Relationships, 1977, Final Report, (in five volumes), Australian Government Publishing Service, Canberra.
Table of Contents
New Zealand's social welfare system dates back to 1898 with the introduction of the first old age pension. New Zealand was considered by many to be the “social laboratory of the world” with its far-reaching policies, and the concept of state-supported or state-subsidised social welfare was indeed an innovative one. Today, the same principles as envisaged by the Liberal government of the late 1890s—to give the greatest help to those in greatest need—are firmly entrenched in the social welfare system.
While pensions such as for widows and miners were introduced during World War I, New Zealand, despite the far-sighted approach of its early leaders, did not have a comprehensive social security scheme until the passing of the Social Security Act 1938. This Act, considered today as the landmark of social welfare in New Zealand, was aimed at safeguarding all New Zealanders from disabilities arising from age, sickness, widowhood, orphanhood, unemployment or other exceptional circumstances. These aims have not altered.
In fact, major developments since 1938 have considerably extended the help those with personal, family or financial difficulties can receive from the state. Significant examples include; a new benefit, the domestic purposes benefit introduced in 1973 for one-parent families (separated and divorced people with dependent children, unmarried mothers, wives of prisoners, etc.); in 1974, disability allowances for people incurring additional expenses because of a disability; and in 1977, the universal superannuation benefit and age benefit, abolished and replaced by national superannuation payable at the age of 60 regardless of financial circumstances.
Unlike most overseas social security schemes the New Zealand scheme is a non-contributory one, that is to say that wage and salary earners are not required to pay regular contributions to a Social Security Fund. Instead, benefits are financed from general taxation. The advantage of this is that persons who are unable to pay contributions, such as housewives or invalids, are covered to the same extent as wage and salary earners.
Eligibility for benefits is based on residency in New Zealand. The residence test varies from 10 years for national superannuation and invalids benefits, to 12 months for sickness and unemployment benefits. Except national superannuation, miners’ and family benefits, benefits are paid on the basis of financial need, subject to an income test.
The Department of Social Welfare was formed in 1972 from an amalgamation of the Social Security Department and the Child Welfare Division of the Department of Education.
Its functions are:
To administer effectively social security benefits, war pensions and related programmes.
To provide appropriate and effective social work and other social services for communities, families and individuals.
To provide advice to the Government on the development and impact of social policy.
In addition to the department's income maintenance and social work programmes, it has a responsibility to promote and support welfare programmes run by voluntary welfare organisations such as church agencies, the Society for the Intellectually Handicapped, the New Zealand Crippled Childrens’ Society, Men for Non-violence and many others. Government support and encouragement for these programmes has substantially increased in the past few years as the department seeks to involve the community more in the responsibility for social welfare.
This community acceptance is being typified in recent moves by the department to decentralise its services to a regional and local district level, making it more accountable to the clientele it serves. These moves follow a ministerial committee report on a Maori perspective for the department, Puao-te-Ata-tu (DayBreak) in 1986, which urged more community involvement in the department's decision making and has led to the following statement of intent:
“Our commitment is to maintain a department which is effective and flexible in operation, ethical and sensitive to the needs of clientele and staff, and which provides services which are culturally appropriate.”
This commitment has recently been demonstrated with the creation of a new Social Welfare Commission comprising five community members and four principal officers of the department. The commission has a policy making function and will take advice from about 50 district executive committees around the country in ways to improve the department's programmes and services. These district executive committees are principally made up of community representatives.
The New Zealand social welfare system provides for a range of assistance as follows:
Cash benefits—As of right for those eligible by category, residence and income, paid at flat standard rates (plus allowance for dependants) without regard to taxes paid.
Emergency and special benefits—For those who need help but who are not, for any reason, eligible for standard benefits.
Accommodation benefits—Available to beneficiaries who have limited income and assets and who pay relatively high accommodation costs. A similar scheme also exists for non-beneficiaries.
Medical and pharmaceutical benefits—For all members of the community; free public (and subsidised private) hospital care.
Universally applied benefits—(With no means test) for dependent children, and for those over 60 years of age.
Social-welfare cash benefits are listed in table 7.1. The rates of invalids’, widows’, domestic purposes, sickness and unemployment benefits have been adjusted every six months, at April and October, to take account of increases in the cost of living as measured by the Consumers Price Index. National superannuation, also previously increased every April and October, has been adjusted in terms of the average after-tax ordinary-time weekly wage. In the 1988 Budget it was announced that with falling rates of inflation these benefits would be adjusted annually in future.
Table 7.1. CASH BENEFITS: WEEKLY RATES*
| Benefit | Weekly rate from April 1988 |
|---|---|
* Since October 1986 all benefits have been subject to taxation. Rates shown are net. † Includes those widowed or divorced. ‡ National superannuation is not subject to an income test but is taxable. Rates shown are net. Source: Department of Social Welfare. | |
| Invalids’ and sickness— | $ |
| Unmarried†— | |
| 18 and over | 151.48 |
| Under 18 without dependants | 122.57 |
| Married— | |
| Husband or wife separately | 126.23 |
| Spouse included | 252.46 |
| Widows’ | 151.48 |
| Domestic purposes— | |
| Solo parent or ‘woman alone’ | 151.48 |
| Caring for sick or infirm— | |
| Unmarried and 18 or over | 151.48 |
| Unmarried and under 18 | 122.57 |
| Married | 126.23 |
| Unemployment— | |
| Unmarried person— | |
| 20 years and over | 134.02 |
| Under 20 years without dependants | 108.63 |
| Spouse included | 201.80 |
| Any of the above benefits with dependent children | |
| Solo parent and one child | 244.84 |
| Each subsequent child | 16.00 |
| Married couple with one child | 268.88 |
| Each subsequent child | 16.00 |
| Miners’— | |
| Unmarried person | 151.48 |
| Married man (wife included) | 252.46 |
| Miner's widow | 151.48 |
| Orphan's | 74.70 |
| Family— | |
| Each dependent child | 6.00 |
| Accommodation benefit—Available to beneficiaries with limited incomes and assets to assist them with accommodation costs | |
| Emergency and special benefits—According to circumstances | |
| National superannuation‡— | |
| Married person | 130.18 |
| Single person | 156.18 |
| Married couple | 260.36 |
National superannuation, for persons aged 60 or over is subject to a residence test and is taxable, but is not subject to an income test unless payment is claimed for an unqualified spouse. No special contributions are required, as national superannuation is financed from ordinary government revenue. National superannuitants may be liable for a tax surcharge on superannuitants’ ‘other income’ above certain limits.
The after-tax rates of national superannuation represent 80 percent of the average ordinary-time weekly wage after tax.
Subject to an income test this benefit is payable to women whose legal husbands have died. The benefit is subject to various conditions but widowed mothers of dependant children are in general eligible, as well as some widows whose children have grown up and other widows without children and aged over 50. The number of widows’ benefits in force at 31 March 1987 was 13 019.
Persons who qualify for domestic purposes benefit are:
(a) A woman with a dependent child or children, who is living apart from, has lost the support of, or is inadequately maintained by her husband, or who is divorced from her husband, or whose husband is a prisoner;
(b) An unmarried mother of one or more dependent children;
(c) A father of one or more dependent children who has lost his wife by death, divorce or some other cause;
(d) A woman without dependent children who comes within the definition of ‘a woman alone’, (which is a woman who is at least 50 years old, has never been married or who has lost the support of her husband, and who has cared for dependent children or for incapacitated relatives); or
(e) A person required to give full-time care and attention at home to a person who would otherwise have been admitted to hospital.
In the case of both a solo parent and a woman alone, de facto marriages are considered as marriages. To qualify as a solo parent, the applicant has to establish in law the identity of the other parent of his or her child. The number of domestic purposes benefits in force at 31 March 1987 was 69 146.
A benefit is payable in the case of a child under 16 years of age who was born in New Zealand or whose last surviving parent was ordinarily resident in New Zealand for three years before death. An orphans’ benefit is also paid in those cases where a child's parent dies, and the other parent cannot be found, or reasonably expected to care for the orphan. The benefit is paid to the person caring for the orphan.
The number of benefits in force at 31 March 1987 was 496 in respect of 581 children.
The rate of the benefit is $6 a week for each child, until he or she reaches 15 years, or, if a full-time school pupil, until the end of the year in which 18 years is reached.
A family benefit or portion of a family benefit may be paid in a lump sum in advance for a period of up to 52 weeks for the first child, a child who has started the first year of intermediate or secondary education, or a child for whom it is intended to purchase a child restraint for a car. These advances may also be made for all children of multiple births.
The total number of benefits in force at 31 March 1987 was 884 438, compared with corresponding figures of 904 493 at 31 March 1986.
The Family Benefits (Home Ownership) Act 1964 was repealed from 1 October 1986, and its provisions replaced by Housing Corporation assistance through the ‘Homestart’ scheme.
Family Support replaced child supplements paid to beneficiaries. It is paid at the maximum rates of $36 a week for the first child and $16 a week for each subsequent child. Where there are two parents, both the benefit and Family Support are paid equally to both parents.
National superannuitants apply for Family Support in the same way as wage and salary earners (see section 25.2, Taxation).
An invalid's benefit is payable to people aged 15 years or over who are either totally blind or are permanently and severely restricted in their capacity for work as the result of an accident or by reason of illness or of any congenital defect.
In working out the income of blind persons no account is taken of their personal earnings. In addition, the benefit of totally blind persons may, within certain limits, be increased by up to 25 percent of their personal earnings. The personal earnings of severely disabled beneficiaries may also be disregarded in whole or in part in calculating their benefits. At 31 March 1987 there were 23 087 invalids’ benefits being paid.
A miner's benefit is payable to any person who, while working as a miner in New Zealand, contracted pneumoconiosis or any other occupational disease and is as a result permanently and seriously incapacitated for work, provided that compensation for the same disability is not being received. There were only 10 miners’ benefits being paid at 31 March 1987.
Applicants for unemployment benefits must show that they are unemployed; that they are capable of undertaking and are willing to undertake suitable work; that they have taken reasonable steps to obtain suitable employment; and that they have resided continuously in New Zealand for at least 12 months at any time. People are not entitled to an unemployment benefit if they are full-time students, or if not employed because of a strike, either individually, or by fellow members of their union at the same place of employment.
An unemployment benefit is not payable for the first seven days of any period of unemployment (following the expiry of wages or salary, including holiday pay) for applicants with dependants, and the first 14 days for single people, except in special circumstances.
A further waiting period of up to six weeks is imposed on those people who earned $250 per week above the average ordinary-time wage before applying for the benefit.
Payment of the unemployment benefit may also be delayed for up to six weeks, if the applicant has voluntarily become unemployed without good and sufficient reason; or has lost his or her employment because of any misconduct as a worker; or has refused to accept an offer of suitable employment; or has refused to undertake suitable job training; or has failed to take reasonable steps to obtain suitable work.
The benefit is payable so long as the beneficiary is unemployed or until he or she becomes eligible to receive another type of benefit, such as national superannuation.
If a beneficiary is not receiving a benefit in respect of a spouse, an allowance may be paid for any person who has the care of his or her home.
Emergency benefits may be granted on grounds of hardship to those who do not qualify for the ordinary unemployment benefit. The average duration of unemployment benefits (not including emergency benefits) which ceased during the year ended 31 March 1986 was 18.5 weeks (18.4 weeks for men and 18.7 weeks for women).
Table 7.3. UNEMPLOYMENT BENEFITS AND EMERGENCY UNEMPLOYMENT BENEFITS, 1987*
| Unemployment | Emergency unemployment | |||||
|---|---|---|---|---|---|---|
| Males | Females | Total | Males | Females | Total | |
* Year ended 31 March. † Numbers obtained from a monthly count of benefits in force. Source: Department of Social Welfare. | ||||||
| Benefits granted | 91,544 | 40,172 | 131,716 | 3,882 | 3,422 | 7,304 |
| Applications declined | 21,703 | 10,360 | 32,063 | 1,900 | 1,760 | 3,660 |
| Benefits in force at 31 March 1987 | 41,606 | 17,051 | 58,657 | 3,113 | 2,152 | 5,265 |
| Average number in force during year† | 36,863 | 16,042 | 52,905 | 3,003 | 2,225 | 5,228 |
A person over the age of 15 years who is incapacitated for work through sickness or accident, and as a result suffers a loss of salary, wages or other earnings, may apply for a sickness benefit.
The number of persons granted a sickness benefit was 25 824 in 1985–86 and 22 368 in 1986–87.
Table 7.4. SICKNESS BENEFITS CEASED, 1987*
| Period on benefit (weeks) | Number of benefits | ||
|---|---|---|---|
| Males | Females | Total | |
* Year ended 31 March. Source: Department of Social Welfare. | |||
| Up to 5 | 2,009 | 1,363 | 3,372 |
| 5-8 | 1,310 | 1,025 | 2,335 |
| 9-12 | 855 | 802 | 1,657 |
| 13-25 | 2,042 | 2,485 | 4,527 |
| 26-38 | 1,410 | 1,605 | 3,015 |
| 39-51 | 921 | 802 | 1,723 |
| 52-77 | 1,132 | 813 | 1,945 |
| 78-103 | 533 | 319 | 852 |
| 104 and over | 889 | 454 | 1,343 |
| Total | 11 101 | 9 668 | 20 769 |
An emergency benefit may be granted on the grounds of hardship to any person who by reason of age, physical or mental disability, or any other reason is unable to earn a sufficient livelihood for herself or himself and those dependent on her or him and is ineligible for any other monetary benefit other than family benefit.
Accommodation benefit is for people whose income and cash assets are limited and who are paying accommodation costs in excess of a certain amount. The maximum amount of accommodation benefit is $40 a week for both married couples and single people.
A disability allowance of up to $30 a week is payable for people with disabilities receiving an income-tested benefit, or for those whose income is such that they could qualify for an income-tested benefit. The allowance can also be paid for the disabled spouse or child of such a person. The purpose of the allowance is to meet special expenses arising from the person's disability, such as transport costs, special diet, domestic help or medicines not on the free list.
A non-taxable allowance of $22 a week is payable to the parents of seriously physically or mentally handicapped children other than those already being cared for in full-time residential institutions.
Special benefit is for people whose income, after taking into account financial circumstances, and commitments, is insufficient to meet their essential needs. Anyone can apply.
A rest-home scheme operates in approved districts to help meet fees for elderly people who, on account of frailty, are no longer able to live by themselves or in their existing environment. The scheme is also available for social cases whose main requirement is accommodation.
A home-help scheme helps those who are unable to meet the cost of necessary help in the home. Financial assistance is also available to engage a Karitane nurse in suitable cases of multiple births (i.e., triplets or more) or where there are twins and at least one other child under school age.
An advance may be made to beneficiaries or pensioners owning their own home for essential repairs and maintenance, to install essential services or to install essential appliances, such as heating.
A telephone rental concession equal to one half of the rental is available to income-tested beneficiaries and pensioners where the duration of benefit is likely to be more than 26 weeks. Recipients of unemployment benefit are not eligible.
The training incentive allowance is available to certain beneficiaries to help meet costs associated with attending recognised occupational or work-related courses which provide specific work skills. Payments of up to $17 a week are available to widows, invalids and domestic purposes beneficiaries.
This allowance is available to those who have been receiving an income-tested benefit for 12 months or more and find a full-time job. It ensures that they are at least $20 a week better off working, than they would have been on a benefit and may be paid for up to 13 weeks.
Married or unmarried applicants with no dependent children receive a benefit at the current rate for the first 13 weeks of hospitalisation. The benefit is then reduced to $17.
Entitlement to a benefit of more than $17 per week following the initial 13 weeks is dependent on the beneficiary's financial and personal circumstances, his or her needs and mental condition. The benefit rate is not affected for applicants with dependent children.
Benefits are paid for a period of four weeks following the death of beneficiaries, to dependants who are not entitled to lump sum payments under the Accident Compensation Act 1982.
Dependants of any person who dies are eligible to receive a single payment of $1,260 subject to their share of the net value of the deceased's estate being less than $10,0000, and an income test.
A further $630 is paid for each dependent child. If the deceased was a national superannuitant or social-security beneficiary, any amount paid after the date of death by way of ‘continuation of benefit after the death of beneficiaries’ will be deducted from the lump sum of $1,200.
In cases of deceased without dependants, a single payment of up to $600 may be paid to meet any funeral expenses which are not able to be paid from the deceased's estate before the payment of any other debts with the exception of estate administration fees.
Following the death of a dependent child for whom family benefit was payable, a single payment of $600 may be paid to the parents or guardians subject to a means test.
The basic income exemptions at the end of 1987 were:
Widows’, invalids’ and domestic purposes benefits, $2,600 a year for those without children and $3,120 a year for those with children.
Sickness, and unemployment benefits, $50 a week for those without children and $60 a week for those with children.
Orphans’ benefit. $260 a year.
National superannuation is taxable and is paid to qualified persons, regardless of income. If the inclusion of a non-qualified spouse is sought, an income test applies. The income exemption in this case is $2,600 a year for those without children and $3,120 a year for those with children.
Family and miners’ benefits are paid regardless of the financial circumstances of the beneficiary.
Invalids’, widows’ and domestic purposes benefits are reduced by 30c for every complete $1 a year of gross income over the appropriate income exemption and up to $4,160 a year, then 70c for every $1 a year.
Sickness and unemployment benefits are reduced by 30c for every $1 over $50 a week (for those without children) and $60 a week (for those with children) up to $80 a week, then 70c for every $1 a week of income.
Orphans’ benefits are reduced by $1 for every complete $1 of income over $260 a year.
The total number of social-welfare cash benefits in force at 31 March 1986 was 1 255 356, and these are described by category in table 7.5.
Table 7.5. CASH BENEFITS IN FORCE
| Class of benefit | At 31 March | ||||
|---|---|---|---|---|---|
| 1983 | 1984 | 1985 | 1986 | 1987 | |
Source: Department of Social Welfare. | |||||
| number | |||||
| National superannuation | 441,789 | 451,128 | 459,813 | 465,079 | 473,401 |
| Widows’ | 14,125 | 13,921 | 13,557 | 13,304 | 13,019 |
| Domestic purposes | 48,121 | 53,144 | 56,548 | 62,570 | 69,146 |
| Orphans’ | 362 | 384 | 365 | 364 | 496 |
| Family | 460 798x | 460 382x | 455 961x | 455 330x | 450,072 |
| Family Care | ... | ... | 164,776 | 115,971 | 115,971 |
| Invalids’ | 18,757 | 20,187 | 21,464 | 21,993 | 23,087 |
| Miners’ | 16 | 13 | 11 | 10 | 10 |
| Unemployment | 50,744 | 50,136 | 38,419 | 42,405 | 63,922 |
| Sickness | 7,669 | 9,452 | 9,627 | 9,517 | 11,116 |
| Total | 1 042 381x | 1 058 747x | 1 220 541x | 1 186 543x | 1 220 240 |
In addition to the disability allowance and the handicapped child's allowance provided for under the Social Security Act, a number of services and payments are available under the Disabled Persons Community Welfare Act 1975. Assistance provided under the Act is either directed towards community agencies providing services for disabled people or to disabled individuals directly.
Building subsidy—Voluntary organisations providing daycare centres, sheltered employment workshops or residential care for people with disabilities can claim an 80 percent subsidy on the construction, purchase, upgrading, maintenance or rental of an appropriate building.
Capitation subsidy—To assist organisations meet the ongoing costs of disabled children in residential care by a payment based on numbers of children in residence. $102.53 per week per child is payable.
Disabled Persons’ Services Programme—To promote and assist voluntary welfare organisations operating services of counselling, advice, information and support for disabled people and their families, salary grants are made for field workers, co-ordinators and volunteer workers. Annual grants are for up to $9,000 for full-time workers and volunteer co-ordinators and $4,000 for volunteers.
Salary subsidy—Approved organisations qualify for a 75 percent salary subsidy for supervisory staff involved in the training, sheltered employment or day care of disabled persons.
Attendant Care Scheme—This scheme provides wages for personal assistants to enable the seriously physically handicapped to live in their own home rather than in residential care. Section 30—Disabled Persons Community Welfare Act—The Act provides for a small fund for special projects for the disabled not covered elsewhere.
In addition to the above, the New Zealand Society for the Intellectually Handicapped is funded on a national basis for various aspects of services provided, as is the Association for the Deaf for field officers and interpreters in the main centres, and the Foundation for the Blind hostel staff. Assistance to community services under the Disabled Persons Community Welfare Act during 1986–87 is listed below.
Table 7.6. ASSISTANCE FOR SERVICES FOR THE DISABLED, 1987*
| Programme | Expenditure |
|---|---|
* Year ended 31 March. | |
| $ | |
| Salary subsidy for workshops and day-care facilities | 4,533 |
| Building subsidy for workshops, day-care and residential facilities | 1,547,342 |
| Disabled Persons Services Programme | 1,501,000 |
| Capitation subsidy for disabled children in care | 246,000 |
| Attendant Care Scheme | 307,075 |
| National Foundation for the Deaf | 257,443 |
| Royal New Zealand Foundation for the Blind—hostel staff | 365,228 |
| New Zealand Society for Intellectually Handicapped | 27,127,000 |
| Disabled Persons Assembly | 88,000 |
| Disabled Persons Community Welfare Act—Section 30 Fund | 10,000 |
| Total | 31,453,621 |
Alternative care—The Department of Social Welfare will meet reasonable costs of alternative care of a seriously disabled child for four weeks in every year to relieve parents of the constant burden of caring. The cost of alternative care for disabled persons other than children may be met if it is justified by the circumstances of the case. During the year ended 31 March 1987, applications for 7738 children and 8853 adults were granted at a value of $5 million.
Medical expenses—Travel and accommodation expenses are available to seriously disabled people required to travel for (i) an appointment with a Department of Social Welfare officer and, or (ii) to undergo a course of medical treatment which has been approved by hospital board specialist, and, or (iii) to undergo an educational, vocational and, or psychological assessment. If the person is unable to travel alone and requires an attendant, the attendant's reasonable travel and accommodation costs will also be met.
The total expenditure for medical expenses for the year ended 31 March 1987 amounted to $360,000.
Loans for home alterations—Suspensory and interest-free loans are available for alterations to homes to accommodate a wheelchair, to provide handrails or to change plumbing and other fittings to meet the person's disability. During the year ended 31 March 1987, 2937 loans were approved to the value of $3,180,000.
Disability aids—Seriously disabled people may be assisted towards the cost of walking frames, prosthetic appliances or aids. Any aid must directly assist the disabled person's mobility. Total expenditure for the supply of disability aids for the year ended 31 March 1987 amounted to $1,049,000.
Suspensory loans for motor vehicles—Suspensory loans may be granted to seriously disabled persons to assist in the purchase of a motor vehicle where such a vehicle is necessary to enable that person to obtain or retain employment or undergo training for suitable work.
The loans are also available to disabled people carrying out voluntary work for recognised community-based organisations. During the year ended 31 March 1987, a total of 162 car loans were approved at a total cost of $1,212,000.
Self-employment—Since December 1982 financial assistance has been available to disabled people to enable them to become self-employed. In the period up to 31 March 1987, 36 applications were granted to the value of $88,000.
Driving assessment centres—From October 1982, financial assistance was available to disabled people and people assisting them, to attend driving assessment centres. The scheme is mainly intended for those whose conditions would preclude them from driving a normal car without modification. In the year to 31 March 1987, 14 applications were granted.
Rehabilitation allowance—People undergoing short-term retraining or assessment may receive a rehabilitation allowance of $17 a week, which is payable without means test and in addition to the normal entitlement to a social security benefit. Financial assistance may also be granted towards travelling and accommodation expenses where they are required to reside away from home.
Expenses for work-related training and education—A seriously disabled person (not eligible for a training incentive allowance) may be assisted with costs while undertaking tertiary education or specific employment-related courses which provide special work skills and better equips them for employment.
Table 7.7. PAYMENTS UNDER THE SOCIAL SECURITY ACT
| Item | 1982–83 | 1983–84 | 1984–85 | 1985–86 | 1986–87 |
|---|---|---|---|---|---|
* Benefit on death prior to 28 September 1982. † These figures were obtained by multiplying by 52 the amount paid in the week to 31 March. ‡ Includes maternity benefits relating to private hospital treatment. § Excludes group practice loans. | Includes private hospital loans and grants to Royal N.Z. Plunket Society towards operating costs. ¶ Includes dental, laboratory, physiotherapy, diagnostic imaging, artificial aids and miscellaneous benefits. Sources: Department of Health, Department of Social Welfare. | |||||
| $(000) | |||||
| Cash benefits— | |||||
| National superannuation | 2,418,930 | 2,526,031 | 2,743,512 | 3,341,211 | 3,650,165 |
| Widows’ | 73,954 | 71,295 | 78,495 | 89,338 | 94,732 |
| Domestic purposes | 333,617 | 380.836 | 460,385 | 603,878 | 709,568 |
| Orphans’ | 1,114 | 1,186 | 1,004 | 1,281 | 1,700 |
| Family | 293,044 | 289,689 | 284,167 | 281,957 | 273,248 |
| Family Care | 60,460 | 165,387 | 68,969 | ||
| Invalids’ | 79,074 | 87,410 | 105,724 | 133,287 | 159,823 |
| Miners’ | 95 | 78 | 72 | 76 | 74 |
| Unemployment | 195,218 | 315,849 | 274,689 | 290,462 | 459,685 |
| Sickness | 52,355 | 62,212 | 72,550 | 91,762 | 124,292 |
| Payment after death* | 2,796 | 3,784 | 3,495 | 3,493 | 4,988 |
| Advances for repairs to homes | 404 | 869 | 1,029 | 1,339 | 1,601 |
| Disability allowance† | 4,502 | 5,443 | 7,814 | 11,788 | 22,751 |
| Handicapped child allowance | 3,594 | 4,415 | 4,905 | 6,371 | 7,819 |
| Accommodation benefit† | 21,612 | 31,599 | 41,583 | 57,949 | 100,798 |
| Special benefit† | 415 | 810 | 2,036 | 4,495 | 6,403 |
| Telephone rental concession | 1,519 | 2,872 | 4,604 | 4,822 | 6,253 |
| Total cash benefits | 3,482,243 | 3,784,378 | 4,146,524 | 5,088,896 | 5,692,869 |
| Health benefits— | |||||
| Maternity‡ | 11,260 | 11,217 | 11,253 | 20,352x | 30,543 |
| Medical§ | 54,901 | 56,500x | 56,825 | 74,619x | 92,178 |
| Hospital| | 44,970 | 46,288 | 49,215 | 51,154x | 53,776 |
| Pharmaceutical | 196,098 | 220,644 | 254,843 | 346,287 | 439,601 |
| Supplementary¶ | 41,170 | 42,711 | 47,142 | 56,111x | 67,554 |
| Total medical benefits | 348,399 | 377,360 | 419,278 | 548,523x | 683,652 |
There is reciprocity between New Zealand and the Commonwealth of Australia in relation to a wide range of benefits. For the purpose of any application for a benefit (except the New Zealand miners’ benefit) residence in Australia or birth in Australia is regarded as residence or birth in this country. Since 1987, orphans’ and domestic purposes benefits have been included in the reciprocity arrangements.
Applicants for invalids’ or widows’ benefits must be qualified on residential grounds to receive the corresponding pensions under the Social Services Act (Australia) as if their residence in New Zealand had been residence in Australia. No man is entitled to receive national superannuation unless he has attained the age of 65 years. All applicants are required to establish that they would have been able to qualify on income grounds for an Australian age pension had they remained in Australia. The Act also provides that blindness or permanent incapacity for work occurring in Australia be treated as if it had occurred in New Zealand.
Reciprocal benefits in force in New Zealand at 31 March 1987 comprised 610 national superannuation benefits; 14 widows’ benefits; and 54 invalids’ benefits; a total of 678 compared with 700 a year earlier. At the time of going to press the agreement between New Zealand and Australia on reciprocal social security had just been renegotiated.
The Social Security (Reciprocity with United Kingdom) Act 1983 provides for reciprocity in a comprehensive range of benefits between New Zealand and the United Kingdom. The general principle of the convention is that people migrating from one country to the other will be taken into the social-security scheme of the receiving country and paid benefits by the receiving country under the laws and conditions applicable to other residents of that country. No man applying for national superannuation under the convention is entitled to receive payment unless he has attained the age of 65. The qualifying age for women is 60 years.
Reciprocal benefits in force in New Zealand at 31 March 1987 comprised 11 732 national superannuation benefits; 25 widows’ benefits; 1 orphan's benefit and 94 invalids’ benefits; a total of 11 852 compared with 12 203 a year earlier.
In the United Kingdom the convention applies to former residents of New Zealand who claim retirement pensions, widows’ pensions, widowed mothers’ and guardians’ allowances, family allowances, and sickness and unemployment benefits under the National Insurance Act.
The qualifying age for retirement pensions under the National Insurance Act is 60 years for women and 65 years for men. Although a man may have been getting national superannuation when he left New Zealand, he is not entitled to a retirement pension in the United Kingdom unless he is 65 years of age.
In 1983, revenue sections were established in 28 of the Department of Social Welfare's district offices with responsibility for the work associated with money due for maintenance, liable-parent contributions and overpaid benefits and pensions.
The Family Court can make, register, confirm, vary or cancel maintenance orders and agreements. The Department of Social Welfare is responsible for the collection and enforcement of maintenance payable under maintenance orders and registered agreements in terms of the Family Proceedings Act 1980.
The number of current maintenance orders and registered agreements continues to decline following the introduction of the Liable Parent Contribution Scheme; from 47 000 in March 1981 to 30 524 in March 1987. The amount due for enforceable orders and agreements is $27.3 million and receipts for the year totalled $13.5 million, a collection rate of 49.5 percent. Of this amount $5.3 million was lodged to the Consolidated Account, representing maintenance for those with a domestic purposes benefit granted before 1981.
This scheme, introduced in 1981, is a system for assessing and obtaining contributions from the non-custodial parent toward the cost of paying a domestic purposes benefit to the person caring for the children. The formula for assessing the contribution is contained in the schedules to the Social Security Act.
The pattern of reimbursement for the cost of domestic purposes benefits (maintenance orders only in 1981, maintenance orders plus liable-parent contribution from 1982) is set out below.
Table 7.8. REIMBURSEMENT FOR DOMESTIC PURPOSES BENEFIT
| Year ended 31 March | DPB expenditure | Maintenance and liable parent receipts in respect of beneficiaries | Rate of recovery | Net expenditure |
|---|---|---|---|---|
Source: Department of Social Welfare. | ||||
| $(million) | $(million) | percent | $(million) | |
| 1983 | 333.6 | 23.4 | 7.0 | 310.2 |
| 1984 | 380.8 | 30.3 | 8.0 | 350.5 |
| 1985 | 460.4 | 30.9 | 6.7 | 429.5 |
| 1986 | 603.9 | 33.5 | 5.5 | 570.4 |
| 1987 | 709.6 | 37.3 | 5.3 | 672.3 |
The war pensions programme is the result of New Zealand's participation in two world wars during which many thousands of New Zealanders served in the armed forces.
The programme applies to those who served in both world wars and to those who served in Korea and South-east Asia. It also includes the obligations under the charter of United Nations and service within the Regular Force prior to 1 April 1974.
The authority for paying war pensions lies with the War Pensions Board, an independent body appointed by the Minister in Charge of War Pensions. The administration of the War Pensions Act 1954, however, is the responsibility of the Secretary for War Pensions who acts under the general direction and control of the minister. Appeals in individual cases are heard by the War Pensions Appeal Board.
The number of appeals the War Pensions Appeal Board dealt with in 1986–87 was 208, of which 105 were upheld.
Concession interest rate housing loans and interest free furniture loans are available to some ex-service people to assist their return to civilian life. These loans are available through the Housing Corporation of New Zealand. Limited preference in farm ballots is also available to ex-service people with a farming background.
Special provisions also exist to ensure that rehabilitation assistance is available to all ex-servicepeople whose rehabilitation may at any time be interrupted or become necessary as a result of a disability caused or aggravated as a result of service. Expenditure in this area for the year ended 31 March 1987 totalled $64,000.
Total expenditure on the war pensions programme for the year ending 31 March 1988 was $114.5 million.
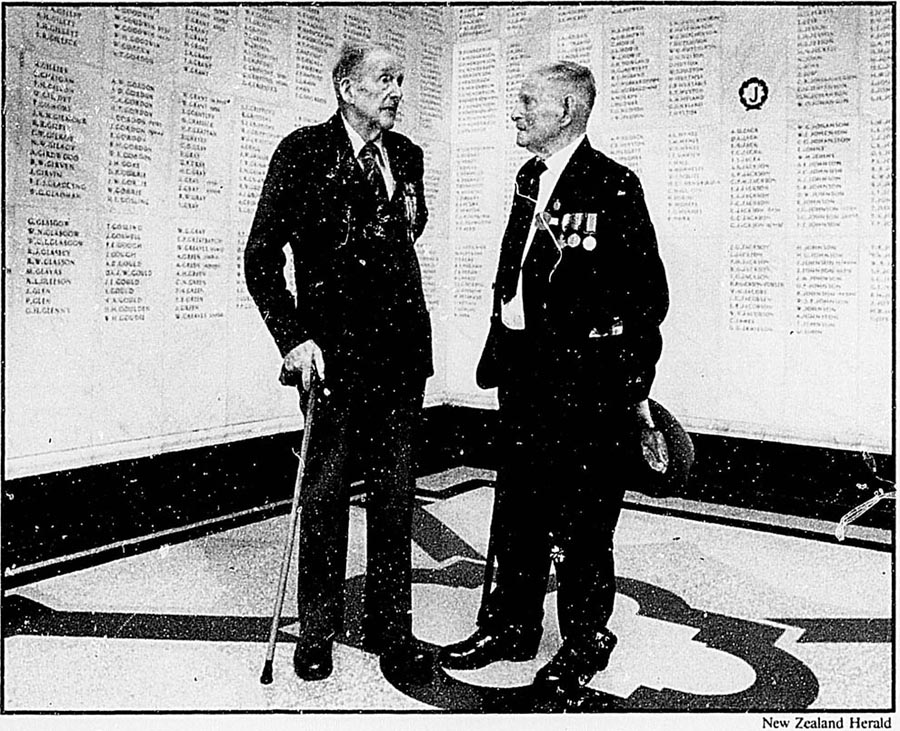
Anzac Day, Auckland.
Table 7.9. RATES OF WAR PENSIONS AND ALLOWANCES
| Pension | Weekly rate April 1988 |
|---|---|
* Adjusted annually at 1 April in relation to movements in the Consumers Price Index. † Subject to an income test and from 1 October 1986, subject to taxation. ‡ Since 1986, pensioners with children have received Family Support of $36 a week for the first child and $16 a week for each subsequent child, paid by the Inland Revenue Department. Payment for the first child is included in the above rates. Source: Department of Social Welfare | |
| $ | |
| Disablement pension*— | |
| Total disablement | 114.28 |
| Special additional pension for blindness or serious disablement | 65.57 |
| Economic pension†— | |
| Unmarried person | 151.48 |
| Married person | 252.46 |
| Wife's pension‡ | 116.44 |
| War widow's pension— | |
| Basic pension* | 84.31 |
| Economic pension† | 151.48 |
| Mother's allowance— | |
| One dependent child | 93.46 |
| Each subsequent child | 16.00 |
| Orphan's pension | 75.75 |
| Child's pension | 6.00 |
| Widowed mother's pension (totally dependent)— | |
| Basic pension* | 84.31 |
| Economic pension† | 149.23 |
| Widowed mother's pension (partly dependent)— | |
| Basic pension* | 4.00 |
| Economic pension† | 149.23 |
| War service pension and war veteran's allowance‡— | |
| Unmarried | 151.48 |
| Married male | 126.23 |
| Married female | 126.23 |
| Age supplement (each) | 1.50 |
| Gratuity (veteran's widow) | 253.79 |
| Dependent children (replacing the rates shown where there are dependent children)‡— | |
| Solo parent and one child | 244.94 |
| Each subsequent child | 16.00 |
| Married couple and one child | 268.88 |
| Each subsequent child | 16.00 |
Table 7.10. PENSIONS BY CLASS AND WAR OR SERVICE TYPE, 1987*
| War or type of service | Disablement pensions | Dependants of
disabled ex-members | Dependants of deceased servicemen | ||
|---|---|---|---|---|---|
| Widows | Parents and others | Total | |||
* 31 March. Source: Department of Social Welfare. | |||||
| First World War (1914–18) | 389 | 5 | 1,071 | 0 | 1,465 |
| Second World War (1939–45) | 18,881 | 42 | 3,063 | 26 | 22,012 |
| Korean Force | 345 | 1 | 13 | 0 | 359 |
| Vietnam Force | 351 | 1 | 1 | 0 | 353 |
| Peacetime forces | 1,679 | 1 | 57 | 4 | 1,74 |
| Other | 61 | 0 | 7 | 1 | 69 |
| Total in force | 21 706 | 50 | 4 212 | 31 | 25 999 |
Information on social welfare payments received by the population aged 15 years and over usually resident in New Zealand was obtained at the 1986 Census of Population and Dwellings.
Respondents were required to specify the nature of payments, benefits and pensions received during the year ended 4 March 1986.
A total of 1 096 932 New Zealand residents, 44.4 percent of the population in the specified age group, indicated that they were in receipt of at least one social welfare payment during the year prior to the 1986 census. This figure comprised 327 675 males (or 27.1 percent of the male population) and 769 257 females (61.2 percent of the female population). These statistics reflect the larger numbers and wider range of social welfare benefits, pensions and other payments which are normally made to women, e.g., family benefit and family care, widow's benefit and national superannuation. They are products of the age-sex structures of the population and the eligibility of persons to receive payments in terms of age, number of children and household income, marital status and living arrangements, and employment status.
Table 7.12 shows the individual social welfare payments made to the resident New Zealand population aged 15 years and over. Because of the basis on which this table has been produced, the numbers of the various types of social welfare payments are higher, with the exception of family care and unemployment benefit figures.
By far the largest social welfare categories, based on numbers of payments made, were national superannuation (34.4 percent of total payments) and family benefit (34.2 percent of total payments).
However, in terms of social welfare expenditure the most significant categories are national superannuation and the domestic purposes benefit, despite the latter being only 4.8 percent of total payments.
The costs of national superannuation have been increasing because of the growth in the population of retirement age (60 years and over), the result of longer life expectancy. Expenditure in the domestic purposes benefit is increasing because of the growing number of one-parent families.
Table 7.11. POPULATION RECEIVING SOCIAL WELFARE PAYMENTS BY AGE GROUP, 1986 CENSUS*
| Social welfare payment† | Age group (years) | Total | ||||
|---|---|---|---|---|---|---|
| 15–19 | 20–24 | 25–59 | 60–64 | 65 and over | ||
* Population resident in New Zealand aged 15 years and over. † Refers to payments received during the 12 months prior to the 1986 census. ‡ Includes family care, unemployment benefit, war pension, miners’ widows’ benefit, orphans’ benefit, death benefit, assistance for disabled persons’ pension, disability allowance, childcare subsidy, and accommodation allowance. § Persons receiving family care and unemployment benefit are obtained from the one, two and three social welfare payments received categories. | ||||||
| One payment— | ||||||
| Family benefit— | ||||||
| Male | 4,212 | 513 | 18,369 | 63 | 60 | 23,214 |
| Female | 5,460 | 8,160 | 212,721 | 165 | 138 | 226,641 |
| National superannuation— | ||||||
| Male | - | - | 1,008 | 55,008 | 124,839 | 180,861 |
| Female | 3 | 9 | 10,233 | 62,574 | 185,031 | 257,850 |
| Domestic purposes benefit— | ||||||
| Male | 78 | 156 | 1,368 | 48 | 75 | 1,722 |
| Female | 810 | 2,910 | 10,947 | 201 | 114 | 14,988 |
| Sickness or invalids’ benefit— | ||||||
| Male | 2,118 | 3,477 | 18,447 | 720 | 414 | 25,179 |
| Female | 2,298 | 2,961 | 10,527 | 342 | 408 | 16,536 |
| Widows’ benefit— | ||||||
| Female | 6 | 18 | 7,968 | 1,335 | 1,626 | 10,959 |
| Other‡— | ||||||
| Male | 12,879 | 15,732 | 30,192 | 786 | 2,910 | 62,493 |
| Female | 12,843 | 10,029 | 12,648 | 615 | 2,730 | 38,865 |
| Two payments— | ||||||
| Family benefit and family care— | ||||||
| Male | 333 | 498 | 9,897 | 12 | 9 | 10,743 |
| Female | 1,047 | 12,315 | 123,801 | 24 | 36 | 137,220 |
| Other combinations— | ||||||
| Male | 645 | 1,182 | 5,016 | 4,236 | 10,827 | 21,912 |
| Female | 2,895 | 8,889 | 37,377 | 2,382 | 4,584 | 56,130 |
| Three or more payments— | ||||||
| Male | 36 | 165 | 1,140 | 84 | 129 | 1,551 |
| Female | 759 | 2,121 | 6,831 | 189 | 162 | 10,068 |
| Total population receiving payments— | ||||||
| Male | 20,301 | 21,723 | 85,437 | 60,957 | 139,263 | 327,675 |
| Female | 26,121 | 47,412 | 438,068 | 67,827 | 194,829 | 769,257 |
| No payments received— | ||||||
| Male | 121,818 | 115,902 | 572,304 | 6,306 | 2,760 | 819,087 |
| Female | 110,664 | 89,100 | 253,296 | 2,760 | 2,451 | 458,277 |
| Not specified— | ||||||
| Male | 10,812 | 5,421 | 45,678 | 549 | 1,176 | 63,630 |
| Female | 10,389 | 3,333 | 14,628 | 402 | 1,635 | 30,381 |
| Total— | ||||||
| Male | 152 928 | 143 052 | 703 404 | 67 815 | 143 196 | 1 210 389 |
| Female | 147 171 | 139 842 | 700 992 | 70 995 | 198 915 | 1 257 912 |
| Persons receiving family care§— | ||||||
| Male | 501 | 780 | 13,362 | 183 | 102 | 14,922 |
| Female | 1,404 | 14,244 | 133,875 | 180 | 138 | 149,841 |
| Persons receiving unemployment benefit§— | ||||||
| Male | 13,194 | 16,587 | 28,770 | 399 | 153 | 59,106 |
| Female | 13,941 | 11,022 | 10,062 | 165 | 141 | 35,328 |
Table 7.12. INDIVIDUAL NUMBER OF SOCIAL WELFARE PAYMENTS MADE TO POPULATION, 1986 CENSUS*
| Social welfare payments | Number† | Percentage of total payments | ||
|---|---|---|---|---|
| Male | Female | Total | ||
* Population resident in New Zealand aged 15 years and over. † Refers to payments received during the 12 months prior to the 1986 census. ‡ Includes miners’/miners’ widow's benefit, orphan's benefit, death benefit, assistance for disabled persons’ pension, disability allowance, childcare subsidy, accommodation allowance. § Individual social welfare payments made (excluding cases of not specified). | ||||
| Family benefit | 38,742 | 420,036 | 458,778 | 34.2 |
| Family care | 14,922 | 149,841 | 164,763 | 12.3 |
| National superannuation | 196,101 | 265,863 | 461,964 | 34.4 |
| Domestic purposes benefit | 4,434 | 59,561 | 63,995 | 4.8 |
| Unemployment benefit | 59,106 | 35,328 | 94,434 | 7.0 |
| Sickness or invalids’ benefit | 29,430 | 22,806 | 52,236 | 3.9 |
| Widow's benefit | - | 16,248 | 16,248 | 1.2 |
| War pension | 17,871 | 5,478 | 23,349 | 1.7 |
| Other payments‡ | 1,935 | 5,049 | 6,984 | 0.5 |
| Total§ | 362 541 | 980 210 | 1 342 751 | 100.0 |
The Department of Health administers Part II of the Social Security Act 1964. It deals with medical and related benefits, applies to all New Zealand residents and provides for medical, pharmaceutical, hospital, maternity and other benefits. This section describes these benefits, while chapter 8, Health and safety, describes New Zealand's hospitals and health system.
The Department of Health pays a medical benefit to doctors that covers at least part of the cost of their services to patients. The benefit applies to most treatment outside hospitals, such as visits to general practitioners or consultations with specialists. Doctors claim the benefit direct from the department and bill patients for the remainder of their fees. The standard benefit for adult patients is $1.35 for visits during normal hours. This rises to $4.40 for services at night, or on weekends or holidays. For social welfare beneficiaries, pensioners and dependants, and some patients defined as ‘chronically ill’, the benefit ranges from $3.30 to $7.65. For children (up to 16 years) the benefit ranges from $11.20 to $17.75. This also applies to children over 16 who are still eligible for family benefit. The benefit is $22.00 for everybody for first visits to some kinds of specialist (psychiatrists, paediatricians, neurologists, radiotherapists and specialist physicians). For first visits to all other types of specialist the benefit for children is $ 11.00, and for other patients, $5.45. For subsequent visits the benefit drops to $1.35. For later visits by social welfare beneficiaries, pensioners and dependants, and ‘chronically ill’ patients, the benefit is $3.30. For children the benefit for later visits is $5.20.
Medical benefits do not apply to certain services, namely, maternity cases (which are covered by maternity benefits described later), examinations for medical certificates, and extraction of teeth by medical practitioners (although anaesthetics for this are included).
There is also an incentive bonus for general practitioners in some rural areas. There is an immunisation benefit of $7.65. This should cover the full cost of doctors’ vaccinations, and there should not be an extra charge.
New Zealand residents are entitled, at little or no cost to themselves, to medicines, drugs, approved appliances and materials which are included in the drug tariff, and prescribed by medical practitioners or dentists.
The number of prescriptions passed for payment in the year ended 31 March 1987 totalled 30.98 million or 9.3 per head of population. The average cost per prescription was $13.48 and the cost per head of population for the year $125.79.
New Zealand residents receive free treatment in public hospitals, and part of their costs are met for private hospitals (and other approved institutions). In the second case, the rates from 1 August 1987 are $31.00 a day for maternity patients and $27.75 for geriatric, hospice, and disabled patients. Outpatients at public hospitals also receive free treatment, and there is provision for free supply of a range of medical aids and appliances. There is a geriatric hospital special assistance scheme for geriatric patients in private hospitals who need hospital care but cannot be placed in public hospital beds. The patients must contribute to the cost.
Treatment of patients in public psychiatric hospitals is also free, and there are hospital benefits available for treatment in approved private psychiatric hospitals.
Maternity benefits cover antenatal and post-natal advice and treatment by medical practitioners, and the services of doctors and nurses at confinements in maternity hospitals or elsewhere. Recognised specialists may make a charge on the patient over and above the benefit. Licensed private maternity hospitals are entitled to receive fees of $31.00 in respect of the day of birth of the child and for each of the succeeding 14 days.
There is a health benefit for most X-rays on a doctor's recommendation. They are free if done in a public hospital, and the benefit covers part of a private radiographer's fee. Dental X-rays and X-rays for medical certificates, life insurance, etc., are not eligible. There are also benefits covering most laboratory diagnostic services, etc.
There is a benefit available for physiotherapy recommended by a doctor, usually an eight week course of treatment, but with some illnesses treatment can continue for six months, and doctors can recommend extensions of treatment. The standard benefit is $1.10 per treatment with a higher rate of $1.65 for beneficiaries and dependants. For group patients the benefit is 45 cents per patient.
Home nursing is free when provided by a registered nurse or midwife employed by the department, a hospital board or an approved organisation. There are subsidies available to associations that provide domestic help in appropriate cases to old people or families with young children. Hospital boards also provide home-aid as part of a range of services to reduce the need for hospital or residential-home care.
Dental treatment is free for people under 16, or under 18 if still at school or otherwise dependent. Dentists under contract provide the treatment, and there is a set scale of fees which are paid by the department. Public hospitals also have dental departments which provide a free service to patients.
There are specific benefits available in various circumstances for a range of artificial aids. These include breast prostheses, contact lenses, hearing aids, wheelchairs, artificial eyes, and wigs. Specific conditions apply in each type of case as to the suitability of the aid and the necessity for it. The benefits generally contribute to the initial cost and replacements.
Table 7.13. EXPENDITURE ON HEALTH BENEFITS
| Item | 1984–85 | 1985–86 | 1986–87 |
|---|---|---|---|
Source: Department of Health. | |||
| $(000) | |||
| Maternity benefits— | |||
| Medical practitioners’ fees | 10,594 | 19,413 | 28,970 |
| Medical practitioners’ motor vehicle allowance | 365 | 567 | 1,110 |
| Obstetric nurses’ fees | 72 | 104 | 179 |
| Obstetric nurses’ motor vehicle allowance | 60 | 100 | 136 |
| 11,091 | 20,184 | 30,395 | |
| Medical benefits— | |||
| General medical services | 34,078 | 46,860 | 58,460 |
| GMS motor vehicle allowance | 195 | 195 | 224 |
| Specialist medical services | 4,763 | 4,871 | 5,158 |
| Rural practice bonus and other incentives | 751 | 1,080 | 1,274 |
| Immunisation benefit | 895 | 1,446 | 2,013 |
| 40,682 | 54,452 | 67,129 | |
| Hospital benefits— | |||
| Treatment in private hospitals—maternity benefits | 162 | 169 | 148 |
| Treatment in private hospitals—medical and surgical | 6,479 | 6,314 | 6,323 |
| Treatment in private hospitals—geriatric benefit | 39,546 | 41,090 | 43,255 |
| Treatment in private hospitals—long-stay benefit | 802 | 637 | 632 |
| Treatment in approved institutions | 2,388 | 3,112 | 3,565 |
| 49,377 | 51,322 | 53,923 | |
| Pharmaceutical benefits— | |||
| Medicines ordered by: | |||
| Medical practitioners— | |||
| Prescriptions and practitioners supply orders | 247,771 | 335,810 | 426,270 |
| Others | 2.090 | 3,530 | 4,137 |
| Dentists— | |||
| Prescriptions and practitioners supply orders | 743 | 921 | 1,144 |
| Other | 81 | 108 | 112 |
| Private hospitals and other institutions— | |||
| Bulk supply orders | 2,837 | 3,965 | 5,400 |
| Other | 1,320 | 1,953 | 2,535 |
| 254,842 | 346,287 | 439,598 | |
| Supplementary benefits— | |||
| Dental services | 7,886 | 8,617 | 9,565 |
| Laboratory services | 33,362 | 40,611 | 50,720 |
| Artificial aids | 412 | 444 | 493 |
| Physiotherapy services | 2,196 | 2,678 | 2,745 |
| Radiological services | 2,987 | 3,417 | 3,489 |
| Breast prostheses | 190 | 220 | 318 |
| Hair-pieces | 75 | 118 | 225 |
| Miscellaneous | 35 | 5 | - |
| 47,143 | 56,110 | 67,555 | |
| Medical subsidies— | |||
| Practice nurses | 14,078 | 17,748 | 21,768 |
| Special sessional scheme | 21 | 36 | 189 |
| Health centres-practice nurses and managers | 779 | 780 | 1,184 |
| 14,878 | 18,564 | 23,141 | |
| Medical related benefits— | |||
| Private geriatric hospitals | 681 | 969 | 1,150 |
| Ashburn Hall | 122 | 142 | 246 |
| Industrial medical officers | 253 | 285 | 293 |
| Services to universities, teachers colleges, technical institutes etc. | 210 | 207 | 219 |
| 1,266 | 1,603 | 1,908 | |
| Total | 419,279 | 548,524 | 683,652 |
Government assistance is offered to religious and voluntary organisations and local authorities providing housing, accommodation and other services for elderly people and those with special needs. Under this partnership with government, the social service agencies of major religious bodies, as well as other welfare organisations, have established additional accommodation for the aged, frail, and sick who need residential care in either an old people's home or a geriatric hospital. Where it is not possible to meet the needs of elderly people either through these agencies or through private facilities, the provision of residential care for the aged becomes a hospital board responsibility. At 31 March 1987 religious and welfare or private organisations provided 20 544 home and hospital beds for the elderly. Hospital boards and area health boards maintain 753 old people's home beds, and 2866 long-stay hospital beds for the elderly.
Other important measures to help elderly people to remain in their homes as long as possible are receiving increased attention; for example, the provision of district nursing services, home aid, meals-on-wheels, laundry services and occupational therapy. In addition, many religious and welfare homes are now providing day-care for those who do not want full accommodation in an old people's home. In general the services are provided by hospital/area health boards with voluntary organisations and old people's welfare councils assisting in various ways. The importance of old people's clubs and social centres, with an adequate range of services, is also receiving increasing recognition. Government lottery funds are being used to assist in providing suitable premises and helping welfare councils with administrative costs.
Since 1981 religious or welfare organisations providing accommodation for old people may be granted the entire approved building cost up to maximum subsidies of $21,000 per bed for old people's homes and $25,000 for geriatric hospital beds. The policy also provides an 80 percent subsidy towards the cost of approved improvements to, and upgrading of, existing accommodation and 100 percent for fire-protection work as required by the local authority. Since 1982, subsidies have been provided towards the capital cost of day-care centres for the elderly. The policy is administered by the Department of Health.
During the year 1986–87, subsidies of $1,531,949 were approved. From April 1950 to 31 March 1987 subsidies totalling $89,760,858 have been approved, and buildings erected as a result will accommodate 9279 old people.
Over the years voluntary welfare organisations have made valuable contributions to important aspects of public health. In many cases they are encouraged and assisted in their work by grants from public funds. Among these organisations are the Royal N.Z. Plunket Society, the Children's Health Camps Board, the New Zealand Red Cross Society, the St John's Ambulance Association, the New Zealand Crippled Children's Society, the Hearing Association, the Royal New Zealand Foundation for the Blind, the Family Planning Association, the Neurological Foundation, the Rehabilitation League, the Laura Fergusson Trust for Disabled Persons, the New Zealand Society for the Intellectually Handicapped, the Cancer Society and the National Heart Foundation.
For many years central government, local authorities, and increasing numbers of private employers have operated superannuation schemes to enable employees to provide for their retirement in addition to the benefits provided under social security schemes. More than one-third of all New Zealand taxpayers contribute to superannuation schemes, making provision for retirement income. Many of these contributors belong to schemes into which the employer pays a subsidy, and the two largest organisations are state-run.
The Government Superannuation Fund in its present form was established in 1948, amalgamating funds which had been in existence since the early 1900s. Its revenues consist of members’ contributions, subsidies from the Consolidated Account and trading departments and other bodies, and interest earned on investments. The National Provident Fund was established as a superannuation scheme for the general public in 1911. It also provides superannuation for the employees of local authorities and other approved bodies as well as private companies, and maintains an investment pool in which local bodies may invest their surplus funds.
Private superannuation schemes are mentioned in section 21.3, Insurance.
The Government Superannuation Fund administers six superannuation schemes: the general scheme to which employees in government service may elect to contribute if they are not provided for by one of the sub-schemes and five sub-schemes for specialised occupational groups: armed forces, police, prison service, members of Parliament and judges.
Membership of the optional general scheme costs 6.5 percent of basic salary. Employees of the Cook Islands, Niue and Tokelau public service and locally recruited staff of the New Zealand High Commission in London are compulsory contributors to the general scheme.
Membership of the appropriate sub-scheme is compulsory for employees of the armed forces (contribution rate 7.5 percent of salary), prisons service (contribution rate 8.5 percent of salary), members of Parliament (contribution rate 11 percent of an ordinary member's salary) and Judges of the High Court, Labour Court, Compensation Court, Maori Land Court or District Court and the Solicitor-General (contribution rate 7, 7.5, or 8 percent of salary depending on age at appointment). Masters of the High Court may elect to contribute to the Judge's sub-scheme.
Retirement benefit—Members who have 10 or more years contributory service on ceasing government service qualify for a fully inflation-adjusted retiring allowance payable for life from age 50 years or later. The allowance is calculated by multiplying the length of contributory service by the member's final average earnings by a pension factor based on age at retirement or commencement of payment. Up to a quarter of the annual allowance may be surrendered for a tax-free lump sum of 10 times the amount surrendered.
Medically unfit benefit—A member who becomes medically unfit and ceases service is entitled to a retiring allowance based on the length of contributory service, the member's final average earnings and a pension factor of 1.5 percent (i.e., the factor normally applicable on retirement at 60 years of age).
Death benefit—The spouse of a member who dies before retirement has the choice of either a tax-free lump sum equivalent to the greater of one year's salary or the cash benefit available on resignation; or an annual allowance of half the retiring allowance which would have been paid to the contributor at the date of death or up to 80 percent of the lump sum which the contributor would have received, and a reduced annual allowance. Where the member dies without leaving a spouse, the contributions plus interest are paid to the estate. The spouse of a member who dies after retirement is entitled to an allowance of half the retiring allowance being paid at the date of death. If the spouse is under age 61 years, up to a quarter of the spouse's allowance may be surrendered for a tax-free lump sum of 10 times the amount surrendered. A surviving child or children under the age of 16, or under age 18 years if they are receiving full-time education, are each entitled to an allowance of $1,545.10. Both the child's and the spouse's allowance are fully inflation-adjusted annually in line with the movement in the Consumers Price Index.
Mortgage finance—Contributors with at least one year's membership may apply for mortgage finance, which is available to enable members to build or purchase a home for their own immediate use; build an addition or carry out renovations; or refinance an existing mortgage or purchase a subsequent home. Members may borrow up to 90 percent of the valuation of the property. Generally repayments must be serviced by not more than 30 percent of gross income. Terms of up to 25 years for a first mortgage and 10 years for a second mortgage are available.
Contributions as security for a loan—Superannuation contributions may be used as security to obtain a loan from another person or organisation. This is known as granting a charge over the contributions.
Retirement and medically unfit benefit—Members are entitled to a retiring allowance on ceasing service with at least 20 years contributory service or on medical retirement. Up to a quarter of the annual allowance may be surrendered for a lump sum calculated by multiplying the sum by an age-related factor ranging from 17.5 at age 40 years to 10 at age 50 years or over. A member is able to defer receiving an allowance until age 55 or 60 in return for a lump sum equivalent to the value of the pension to either of these points; the factors are age-related, e.g., a 40-year old deferring payment to age 55 receives a lump sum of 12 times the allowance, or 16 times the allowance if deferral is to age 60 years.
Death benefit—Where the member dies without leaving a spouse, a lump sum of at least one year's salary is paid to the estate. The benefits payable to a member's surviving spouse and children are the same as those payable under the general scheme provision. Where a retired member dies before the age to which payment of an allowance has been deferred, the spouse's allowance does not commence until that date.
Mortgage finance and contributions as security—These provisions of the general scheme are available to members of the armed forces.
Retirement and medically unfit benefit—In general, members aged 50 years or over with at least 10 years actual contributory service or members medically unfit for duty are entitled to a retiring allowance. The actual length of contributory service is increased for the purposes of calculating the allowance. The increase is dependent on the member's date of commencement and age at retirement. The increased service cannot exceed 40 years unless the member has more than 40 years actual contributory service. Up to a quarter of the allowance can be surrendered for a tax-free lump sum of 10 times the amount surrendered.
Death benefit—The benefits payable under the general scheme apply.
Mortgage finance and contributions as security—These provisions apply to members of the Police. However, applications for mortgage finance will only be accepted from officers who have received confirmation of permanent appointment and the member must have at least 20 percent equity in the property to be financed.
Retirement and medically unfit benefit—Members are entitled to a retiring allowance on ceasing service at age 50 years or over with at least eight years actual contributory service, or on medical retirement. Every four years actual prisons service contributory service counts as five years in calculating the allowance, with the proviso that service cannot exceed 40 years unless the actual contributory service exceeds 40 years.
Death benefit, mortgage finance and contributions as security—The general scheme provisions apply.
Retirement benefit—A member of Parliament who retires after less than nine years is entitled to a payment amounting to twice the contributions made to the scheme. A member who retires after nine or more years service is entitled to a retiring allowance of 1/24th of the salary payable from time to time to an ordinary member for each complete year of service as a member, not exceeding 16 years, plus one 1/100th of this salary for each year of service in excess of 16 years service. The allowance is payable from age 45 years. A member who ceases service prior to age 45 years, may elect to surrender up to a quarter of the allowance for a cash payment payable immediately; and/or to elect to defer receiving a retiring allowance until age 55 or 60 years in return for a lump sum payable on retirement. Up to a quarter of the retiring allowance may be surrendered for a tax-free lump sum of 10 times the amount surrendered.
Death benefit—Where a member dies without leaving a spouse an amount equal to twice the contributions made will be paid. Where the member is survived by a spouse, a lump sum is payable of at least one year's salary for an ordinary member, or a spouse's allowance of half the allowance payable had the member retired at the date of death. The child allowance available under the general scheme provisions is payable to each surviving child.
Medically unfit benefit, mortgage finance and contributions as security—If a member retires medically unfit, an allowance is payable only if the member has qualified on the basis of age and length of service. The mortgage finance provisions are not available to members. The general provision on security for loans applies.
Retirement and medically unfit benefit—Members are entitled to a retiring allowance on ceasing service at age 50 years with at least 10 years service, on ceasing service having attained age 68 years, or on ceasing service because of medical unfitness. The allowance is based on a proportion of the salary at cessation of service for each year of judicial service. The fraction varies from 1/33rd to 1/24th depending on the date of appointment.
Death benefits, mortgage finance, and contributions as security—The death benefits payable under the general scheme apply. A member need not have one year's contributory service before applying for mortgage finance. The general provisions on security for loans apply.
The Government Superannuation Fund is administered by a board comprising the Minister of Finance as statutory chairperson, the Secretary to the Treasury as deputy chairperson, the Chairman of the State Services Commission, the General Manager of the Railways Corporation, the Director-General of Education, the Commissioner of Police, a representative of the boards of New Zealand Post Ltd, Post Office Bank Ltd, and Telecom Corporation of New Zealand Ltd, five members appointed on the nomination of various employee organisations, plus one on the nomination of the Minister of Defence.
As at 31 March 1987 there were 84 301 contributors to the Government Superannuation Fund and they paid $154,126,000 into it during the year. At the same time there were 39 917 beneficiaries who were entitled to $305,836,252 a year.
Total assets at 31 March 1987, which amounted to $1,685,885,000 included investments in government stock of $1,559,530,000 and $34,476,000 in members’ mortgages. The average effective interest earning of the fund was 15.19 percent for the year.
Table 7.14. GOVERNMENT SUPERANNUATION FUND ALLOWANCES, AT 31 MARCH 1987
| Qualification for allowance | Number | Annual amount |
|---|---|---|
Source: Treasury. | ||
| $(000) | ||
| Retired for age or length of service | 27,255 | 255,009 |
| Medically unfit | 1,465 | 10,192 |
| Spouses | 10,376 | 40,444 |
| Children | 821 | 191 |
| Total allowances | 39 917 | 305,836 |
Table 7.15. CONTRIBUTORS TO GOVERNMENT SUPERANNUATION FUND, AT 31 MARCH 1987
| Branch of service | Number | Percentage of total |
|---|---|---|
Source: Treasury. | ||
| Armed services | 12,731 | 15.10 |
| Education service | 18,880 | 22.40 |
| Police | 5,113 | 6.07 |
| Post Office | 12,675 | 15.04 |
| Prison officers | 1,284 | 1.52 |
| Railways | 5,584 | 6.62 |
| Public Service | 23,944 | 28.40 |
| Other employers | 4,090 | 4.85 |
| Total | 84 301 | 100.00 |
Table 7.16. GOVERNMENT SUPERANNUATION FUND: SUMMARY
| Year ended 31 March | Number of contributors | Annual contributions * | Interest received from investments | Subsidy from government trading departments and others | Annual value of allowances | Accumulated fund at 31 March |
|---|---|---|---|---|---|---|
* Includes transfers from National Provident Fund but not contributions of members of Parliament. Source: Treasury. | ||||||
| $(000) | ||||||
| 1985 | 108,269 | 122,750 | 122,527 | 207,660 | 214,184 | 1,253,455 |
| 1986 | 89,433 | 135,366 | 164,336 | 271,560x | 259,880 | 1,414,614 |
| 1987 | 84,301 | 154,126 | 218,884 | 313,559 | 305,836 | 1,685,855 |
Up until 30 November 1987 the National Provident Fund was administered by the Treasury, but on that date a separate organisation—the National Provident Fund Department—was formed. The fund is to become a financial mutual organisation outside the Public Service in 1988.
The fund provides services in four separate areas:
(a) Personal schemes—National Provident Fund pension schemes have catered for the general public on an individual basis, sometimes with encouragement from their employer or as members of a group, since 1911.
(b) Defined benefit schemes—These schemes cover employees of all local bodies, quasi-government and other approved organisations, firefighters and nurses.
(c) National schemes—Four employer-subsidised schemes are available, one for ships’ officers, one for the meat industry and the other two for any employees of companies, firms, government departments, or local authorities willing to become contributing employers.
(d) Local Authorities Investment Pool—This ancillary activity enables local authorities to invest surplus funds at interest.
The state guarantees the benefits payable under all schemes. There are some elements of state subsidy in the public fund and local authority schemes, and a guarantee of minimum-interest earnings in the national schemes. The National Provident Fund is under the control of a board comprising the Minister of Finance as statutory chairperson, the Secretary to the Treasury, the Director-General of Health, the Valuer-General, the superintendent of the fund, and up to three other members appointed by the Governor-General.
The first scheme of the fund, the Level Premium Scheme, available from 1911 but now closed to new members, enabled contributors to purchase a pre-determined weekly pension from 60 years of age by paying fixed regular contributions according to age on joining. For the first $20 per week a state subsidy of 25 percent was built into the contribution rates and after five years’ membership contributors qualified for incapacity, widows’, and dependent children's allowances.
The Annual Single Premium Scheme, which was available to individuals and the self-employed from 1958 to 1979, accepted contributions of any amount from members at any time. The contributions paid during each year were applied at the end of that year towards the purchase of a pension from age 60 years according to the contributor's age at the time. Only the first $1,000 contributed each year attracted the state subsidy. There was also a widow's benefit available.
These two schemes, along with the Post 60 Scheme introduced in 1965, were phased out in favour of the Cash Accumulation Scheme introduced in 1975.
This scheme is widely used by individuals. It enables them to select their own contributions and to choose their own date of retirement on superannuation. It is based on a cash accumulation principle and is highly regarded as the ultimate retirement benefit since it reflects the significance of changing interest rates and the impact of inflation. This scheme now provides the vehicle for superannuation previously provided by the Annual Single Premium, Level Premium, and Post 60 Schemes. Both lump-sum and pension Cash Accumulation Schemes are available.
This scheme was introduced in 1975. It allows an existing contributor to one of the fund's schemes to increase the estate or spouse benefit otherwise provided in the scheme by paying an extra stipulated contribution. Most of the fund's schemes limit the benefit payable in the event of the contributor's death to a level no greater than the equity in the fund. This usually means that in the earlier years of a contributor's membership, the estate or spouse benefit could be much less than a person would require. The Additional benefit Plan satisfies this need by providing in some cases a benefit of up to three times the amount of a contributor's salary.
An employer-subsidised pension scheme was introduced in 1964 for farm workers, and in 1969 was expanded and made available to other employee organisations. The schemes provide for the holding of credits during periods of non-employment, and for portability with other superannuation funds. Special variations exist for ships’ officers and employees of the meat industry. This year a lump sum version of the national scheme was introduced and has proven popular with many employees in local authorities.
The National Provident Fund continues to provide superannuation giving defined benefits for local authorities, employees of quasi-government organisations, and charitable and religious institutions. All local authorities are deemed contributors to the fund on behalf of their permanent employees who, qualified by age, elect to become contributing employees. Other approved bodies are accepted under similar conditions by completing a special agreement with the board. This scheme is available for use by firefighters, nurses, harbourmasters and harbour board pilots, and aircrew employees of Air New Zealand. Contributory service is transferable between these schemes and with the Government Superannuation Fund.
The Local Authorities Investment Pool is an avenue for short-term investment by local authorities and other approved bodies of surplus loan moneys and reserve funds. For the year ended 31 March 1987, when the pool stood at $223.4 million, the interest credited amounted to $35.7 million.
Table 7.17. NATIONAL PROVIDENT FUND: COMPARATIVE SURVEY
| Item | Unit | Year ended 31 March | ||
|---|---|---|---|---|
| 1985 | 1986 | 1987 | ||
* The National Provident Fund has been gradually meeting a proportion of its administration costs and since 1986 has met the total cost. Source: National Provident Fund. | ||||
| New contributors during year | No. | 9,403 | 8,510 | 10,081 |
| Total contributors at end of year | No. | 119,862 | 116,323 | 118,610 |
| Local authority scheme— | ||||
| Contributors | No. | 10,720 | 10,318 | 10,071 |
| Contributions | $(000) | 51,749 | 57,021 | 71,666 |
| Public Fund— | ||||
| Contributors | No. | 109,142 | 106,005 | 108,539 |
| Contributions | $(000) | 67,122 | 73,177 | 93,952 |
| Pensions and allowances at end of year | No. | 17,007 | 17,783 | 18,311 |
| Income— | ||||
| Contributions | $(000) | 118,871 | 130,198 | 165,619 |
| Interest | $(000) | 176,637 | 236,821 | 297,444 |
| Government subsidy | $(000) | 9,588 | 10,020 | 11,101 |
| Total income | $(000) | 305,095 | 377,039 | 474,164 |
| Outgoings— | ||||
| Pensions and allowances | $(000) | 54,385 | 56,803 | 76,157 |
| Other benefits | $(000) | 32,834 | 58,246 | 54,774 |
| Administration costs* | $(000) | 636 | 2,356 | 6,000 |
| Total outgoings | $(000) | 87,856 | 117,404 | 136,931 |
| Investment pool at end of period | $(000) | 347,638x | 275,258 | 223,413 |
| Funds at end of period (after tax) | $(000) | 1,527,758x | 1,786,673 | 2,122,043 |
| Earning rate of fund (after tax) | % | 13.27 | 15.39 | 16.13 |
The Department of Social Welfare aims to provide a social-work service that is culturally sensitive for individuals, families and communities facing social and economic difficulties, with particular emphasis on the care and control of children, the social and financial independence of disadvantaged and disabled persons, and the promotion of suitable and adequate support networks. It also aims to provide assistance to approved private and voluntary organisations with activities following the objectives of the Children and Young Persons Act 1974 and the Disabled Persons Community Welfare Act 1975. It maintains a team of social workers and other staff who provide a general, individual and family-welfare counselling and guidance service for all age groups as well as undertaking general field inquiry work and residential care for children and young people.
Advisory, and funding support is available to a wide range of community organisations providing support, counseling, care and rehabilitation for children, families and disabled persons. Financial assistance is provided to help meet operating costs for a variety of voluntary welfare services—through the range of funding programmes noted below. Limited support for capital and establishment costs is also available. (Programmes for disability-related services are listed earlier in this chapter.)
Specific programmes providing financial assistance are as follows:
To assist families with costs of day-care for pre-school children. Entitlement is determined by an income assessment, but special provisions apply for approved welfare cases. A subsidy of up to $23.00 a week per child can be paid.
A subsidy is available for up to two-thirds of the cost of the constructions, purchase, upgrading and maintenance of residential facilities for children.
Voluntary welfare organisations providing support, information and counselling for children and families in the community may receive salary grants for field workers and co-ordinators of volunteers, and administration grants towards volunteer costs. The maximum salary grant is $9,000 per annum per staff member and the maximum administration grant $4,000.
A subsidy of $73.24 per week per child is payable to help welfare organisations meet the on-going costs of providing residential care for children.
Supervised living programmes are encouraged for ‘at risk’ young people. Grants help to meet house-parent/co-ordinator, establishment and operating costs. House-parent/co-ordinator/supervisor grants can be up to $12,000, establishment grants up to $5,000, and up to $10,000 are paid towards operating costs.
There is joint involvement with the Housing Corporation to allocate emergency houses for homeless families, women's refuges and adolescents at risk. In addition, there is provision for financial assistance for the co-ordinators carrying out support work for families in emergency housing, with grants of $1,000 per house per annum.
Financial support is provided via the Home Budgeting Advisory Council to support budgeting services in the community. The department employs budget liaison workers to assist local volunteer services, and provides travel allowances and reimbursement expenses for volunteers.
Financial support is provided to the National Collective of Women's Refuges to distribute to 46 approved refuges providing emergency accommodation and ongoing support for women and children who are victims of domestic violence or abuse.
To promote and support services for victims of rape and sexual abuse and their families, annual grants are paid to assist counselling/support workers and volunteers as well as operating costs and administrative costs for a national collective, Te Kakano O te Whanau.
Community organisations offering telephone-based counselling and support for individuals and families may receive annual grants of up to $4,120 towards operating costs. Establishment grants of $1,000 are also available for new services.
Financial assistance is given to residential social rehabilitation programmes for people with drug/alcohol addiction, emotional or psychiatric disorders, repeated offending or related difficulties. Annual grants can be made to meet budgeted deficits once residents’ incomes from benefits are taken into account.
To enable lump-sum grants to be made to voluntary welfare organisations towards initiatives outside the scope of other subsidy programmes or in cases of financial difficulty.
In addition to the programmes outlined above, special grants are made to national bodies for the co-ordination of voluntary welfare services; Citizens advice bureaus, the Marriage Guidance Council, Youthlink Trust, Glenburn Special School and the community-based alcohol treatment programmes operated by the Salvation Army and the Presbyterian Support Services Association.
From October 1986 a number of new programmes have provided additional assistance to voluntary welfare organisations:
(a) A staff salary subsidy for religious and welfare homes for the aged.
(b) Adolescent summer activities grants.
(c) Transport grants.
(d) The National Committee for the Prevention of Family Violence.
(e) Grants for programmes to assist the prevention of family violence aimed principally at violent men.
Table 7.18. FUNDING FOR COMMUNITY WELFARE SERVICES, 1987*
| Programme | Expenditure |
|---|---|
* Year ended 31 March. Source: Department of Social Welfare. | |
| $ | |
| Childcare subsidy | 3.651,000 |
| Building subsidy for residential facilities for children | 319,058 |
| Family Services Programme | 1,999,360 |
| Capitation subsidy—children in residential care | 3,365,000 |
| Adolescent Living Skills Programme | 1,018,462 |
| Emergency Housing Co-ordinators Programme | 79,000 |
| Youthlink Adolescent Crisis Assessment Centre (Auckland) | 82,000 |
| Glenburn Special School (Auckland) | 390,000 |
| Home budget advisory services | 50,000 |
| Budgeting Services Support Programme | 256,000 |
| Womens Refuge National Funding Programme | 1,282,000 |
| Rape and Sexual Abuse Services Programme | 606,827 |
| Telephone Counselling Services Programme | 162,000 |
| Social Rehabilitation Subsidy Programme | 775,000 |
| Community-based alcohol treatment funding | 352,000 |
| Co-ordination of voluntary welfare services | 103,000 |
| Community volunteers | 57,000 |
| Citizens advice bureaus | 41,000 |
| Contingency fund | 300,000 |
| Total | 14,888,707 |
As at 31 March 1987, social-work staff employed by the Department of Social Welfare included 735 social workers and 575 residential social workers. Casework duties include preventive work; investigations and reporting for the Children and Young Persons Courts; supervision of children in their own homes; foster homes, institutions, and work placements; adoption work; the licensing of foster parents as defined in the Act; reporting to courts on matrimonial proceedings affecting custody of children; and the inspection of children's homes run by voluntary organisations and examination of requests made by them for financial subsidies. Social workers receive assistance from about 2000 social welfare volunteers from the community. These people give their time and talents to become involved, under the close supervision of the department, in giving support and assistance to individuals or families.
Residential-care facilities include long-term training centres for difficult and delinquent children, short-term facilities providing assessment, emergency, and temporary care for older children, and ‘family homes’ and ‘group homes’ which provide care for children of all ages either on a short-term or long-term basis. After a review of its residential services during 1986, the department has indicated its commitment to moving towards the community care of children and young persons rather than relying to the extent that it has on institutional care. It is in the process of developing a policy of reallocating a significant proportion of resources from institutional to community care.
Social workers undertake a wide variety of miscellaneous investigations and inquiries concerning the welfare of children. Concern for individual children may be expressed by neighbours, police, teachers, employers, doctors, solicitors and so on, or by parents themselves who are seeking advice and guidance. In some cases there will be a quick response to assistance but social workers may provide preventive oversight and guidance over several months or even two or three years if needed. Financial help can be given in special cases. In a relatively small number of cases preventive help is not sufficient and court action results.
Placements in adoption homes are made by social workers for children for whom placements have not been made by private persons and other organisations.
Under the Adoption Act 1955 a social worker must give prior approval to the placement for adoption of a child or young person under 20 years of age, or alternatively, the applicants must apply for an interim order of adoption from the Family Court. The court is required to obtain a social worker's report on such a placement before granting an order. A waiting period of at least six months is normally required, during which the placement is supervised by a social worker, before a final order can be made.
The smaller proportion of children being offered for adoption reflects a changing pattern in society, with an increase in the proportion of single parents undertaking the sole care of children. It is no longer possible for all people who wish to adopt to actually receive a child.
The Adult Adoption Information Act 1985 allows adopted adults to apply for and receive copies of their original birth certificates through the Registrar-General and also allows the birth parents of adopted adults access to information about their birth child through the Department of Social Welfare.
Both adopted adults and birth parents may place a veto preventing the access of information directly related to themselves. The vetoes last for 10 years and are renewable.
Inspecting children's homes operated by private organisations and administering schemes of government financial assistance to these homes is another important social welfare function. Financial assistance for each child in care and subsidies of up to two-thirds of expenditure for extension or replacement of buildings, or additions to facilities, can be available. A similar capital subsidy is available for private organisations to help in providing accommodation for unmarried mothers and their children.
Regulations for the registration and licensing of childcare centres (for example, day nurseries and creches), and policy and advisory support were transferred from the Department of Social Welfare to the Department of Education.
The Children and Young Persons Act 1974 introduced substantial changes in the procedures under which the department carries out its functions in relation to juvenile offending and other problems concerning the welfare of children.
The Act provides for young offenders to be dealt with through care, protection, and control proceedings rather than through criminal prosecutions and for children to be dealt with by children's boards rather than by courts.
Under the provisions of the Children and Young Persons Act 1974, a legal distinction is made between children (defined in the Act as persons under the age of 14 years) and young persons (defined as persons aged 14 years but less than 17 years).
Where a young person comes to notice for offending, the matter may be dealt with by the Youth Aid Section of the New Zealand Police by way of consultation between the police and a social worker.
Children's boards deal with children corning to official notice either for offending or because they are considered to be in need of care, protection, or control.
The Youth Aid Section and children's boards can deal with cases in several ways. These include warnings by the board or Youth Aid Section, supervision by a social worker or youth aid officer, counselling of the child or young person, and counselling of the parents or guardian.
Both the children's boards and the Youth Aid Section have the option of referring any matter to a Children and Young Persons Court.
A comprehensive revision of the Children and Young Persons Act 1974 was completed during 1986 and a Bill is expected to become law during 1988. It proposes major changes to the present Act, including—
A separation of jurisdictions whereby matters relating to the protection and care of children and young persons will be heard in the Family Court, while offending by young persons between 14 and 17 years old will be dealt with in a new ‘youth court’ acting as a separate division of District Courts.
The placing of a duty or obligation on certain categories of people who come in contact with children and young persons to report actual or suspected ill-treatment or neglect of children and young persons.
The establishment of multi-disciplinary child protection teams throughout the country to deal with suspected or actual reported cases of child abuse and neglect.
Provision for time-limited, planned, and specific orders to be made wherever possible with built-in reviews.
Table 7.19. CHILDREN'S AND YOUNG PERSONS’ CASES COMING TO NOTICE
| Year | Youth aid cases not referred to court or children's boards | Children's board cases not referred to court | Court appearances | Total number | Percentage change on previous year |
|---|---|---|---|---|---|
Source: Department of Social Welfare. | |||||
| 1982 | 2,113 | 2,763 | 12,858 | 17,734 | +1.2 |
| 1983 | 1,781 | 2,110 | 12,169 | 16,060 | -9.4 |
| 1984 | 1,817 | 2,154 | 12,233 | 16,204 | +0.9 |
| 1985 | 1,752 | 1,783 | 11,265 | 14,800 | -8.7 |
| 1986 | 1,426 | 1,263 | 11,759 | 14,448 | -2.4 |
These were established by the Children and Young Persons Act 1974.
All offences except murder or manslaughter and minor traffic offences committed by those under 17 years of age are dealt with in Children and Young Persons Courts, the procedure and rules of which differ widely from those of the ordinary courts.
Unless no other suitable room is available, sittings of the Children and Young Persons Court are not held in a courtroom. Proceedings are not open to the public, and no report of them may be published except with the consent of the presiding judge.
When a child or young person is in need of care, protection or control, the matter is dealt with by way of complaint. This category includes offending by children under 14 years, except where a child over the age of 10 years is charged with murder or manslaughter.
When a young person is brought before a Children and Young Persons Court and charged with any offence, it is not necessary to record a conviction even if the charge is proved. The court has power, without recording a conviction, to impose a penalty or make an order as if a conviction has been recorded.
In the tables which follow, ‘distinct cases’ relate to court appearances, the most serious or most heavily penalised of the charges against each person at one court hearing being selected as the distinct case.
Table 7.20. CHILDREN AND YOUNG PERSONS COURT APPEARANCES BY TYPE OF COMPLAINT AND DECISION
| Type of complaint* | 1985 | 1986 | ||||
|---|---|---|---|---|---|---|
| Males | Females | Total | Males | Females | Total | |
* Excludes complaints dismissed, withdrawn or struck out. † Includes failure to exercise parental duty. ‡ Includes offending by children. § Includes orders to come up for sentence if called upon and referrals to children's boards or District Courts. Source: Department of Social Welfare. | ||||||
| Neglect or ill treatment† | 218 | 264 | 482 | 215 | 253 | 468 |
| Beyond control‡ | 462 | 271 | 733 | 428 | 261 | 689 |
| Truancy | 53 | 47 | 100 | 40 | 35 | 74 |
| Breach of supervision order | 36 | 23 | 59 | 27 | 15 | 42 |
| Total | 769 | 605 | 1 374 | 710 | 564 | 1 274 |
| Court decision— | ||||||
| Admonished and/or
discharged Admonished and returned to care or supervision | } 168 | 103 | 271 | 137 | 78 | 215 |
| Supervision order | 365 | 270 | 635 | 338 | 291 | 629 |
| Committed to care of Department of Social Welfare | 196 | 208 | 404 | 195 | 180 | 375 |
| Others§ | 40 | 24 | 64 | 40 | 15 | 55 |
| Total | 769 | 605 | 1 374 | 710 | 564 | 1 274 |
Table 7.21. CHILDREN AND YOUNG PERSONS COURT OFFENCE CASES
| Type of offence | 1983 | 1984 | 1935 |
|---|---|---|---|
* Includes interfering with vehicle. † Includes forgery and uttering. ‡ Includes traffic offences and offences against decency. | |||
| Total charges | |||
| Sexual offences | 72 | 110 | 84 |
| Violent offences | 944 | 1,232 | 1,193 |
| Other offences against the person | 291 | 311 | 324 |
| Burglary, and breaking and entering | 6,224 | 5,755 | 5,696 |
| Theft, receiving, and fraud | 6,096 | 6,251 | 6,375 |
| Unlawful conversion* | 4,142 | 3,646 | 1,925 |
| Wilful damage and arson | 864 | 1,083 | 1,065 |
| Other offences against property† | 158 | 199 | 259 |
| Offences against good order‡ | 2,643 | 2,743 | 2,787 |
| Other offences | 1,780 | 1,962 | 2,154 |
| Total | 23 214 | 23 292 | 23 862 |
| Distinct cases | |||
| Sexual offences | 48 | 71 | 59 |
| Violent offences | 654 | 830 | 972 |
| Other offences against the person | 214 | 211 | 221 |
| Burglary, and breaking and entering | 2,380 | 2,294 | 2,903 |
| Theft, receiving, and fraud | 2,989 | 3,062 | 3,005 |
| Unlawful conversion of vehicles* | 1,638 | 1,616 | 1,556 |
| Wilful damage and arson | 485 | 596 | 476 |
| Other offences against property† | 69 | 80 | 65 |
| Offences against good order‡ | 1,629 | 1,705 | 1,551 |
| Other offences | 1,187 | 1,294 | 1,317 |
| Total | 11 293 | 11 759 | 12 125 |
Table 7.22. CHILDREN AND YOUNG PERSONS COURT APPEARANCES FOR OFFENDING: DECISIONS MADE
| Decision | Total charges | Distinct cases | ||||
|---|---|---|---|---|---|---|
| 1983 | 1984 | 1985 | 1983 | 1984 | 1985 | |
* Includes periodic detention. † Includes probation, ordered to come up for sentence, convicted and discharged, and community service. | ||||||
| Dismissed or withdrawn | 2,230 | 2,331 | 2,150 | 1,218 | 1,320 | 1,239 |
| Admonished and/or discharged | 4,232 | 4,658 | 4,393 | 2,494 | 2,554 | 2,437 |
| Committed to care of Department of Social Welfare | 674 | 472 | 574 | 197 | 141 | 176 |
| Placed under supervision | 4,673 | 4,342 | 5,226 | 1,923 | 1,782 | 2,148 |
| Committed to an institution* | 4,245 | 3,712 | 3,313 | 1,327 | 1,210 | 1,068 |
| Fined | 3,129 | 3,420 | 3,618 | 2,363 | 2,581 | 2,773 |
| Otherwise dealt with† | 4,031 | 4,357 | 4,588 | 1,771 | 2,171 | 2,284 |
| Total cases, offending | 23 214 | 23 292 | 23 862 | 11 293 | 11 759 | 12 125 |
| Males | 19,704 | 19,898 | 19,914 | 9,372 | 9,725 | 9,838 |
| Females | 3,510 | 3,394 | 3,948 | 1,921 | 2,034 | 2,287 |
There are a number of ways in which children come into the department's care. The majority are placed under the guardianship of the Director-General by order of the Children and Young Persons Court because the court considers that either a child is in need of care and protection or a child's behaviour is so difficult or disturbed that he or she cannot be effectively managed in the home situation. In addition to those under guardianship, there are a number of children placed in the department's care by agreement with the parents under the provisions of section 11 of the Children and Young Persons Act 1974. Parents seeking the department's help in this way do so for a variety of reasons, such as their own serious ill health, family break-up and other pressures within the family, or their desire to seek special care for a disturbed or difficult youngster. The department also provides temporary care for a number of children because a court has ordered that they be remanded for a short period in the department's custody, usually for assessment and consideration of their long-term needs pending a final court decision.
The care and oversight of children in the department's care is one of the major responsibilities of the department's social workers. On the Director-General's behalf they are responsible for arranging placements for children in care and maintaining oversight of them.
At 30 November 1986, a total of 5630 children and young persons were under the care and control of the department. The reasons for their being placed were as follows:
| Placed under guardianship of the Director-General by court order | 3 955 |
| Under control by virtue of an agreement with parents | 1,040 |
| On court remand, postponement, warrant, etc. | 635 |
| Total | 5 630 |
Children and young persons may come into care at any time from soon after birth to age 16. (Guardianship orders under the Children and Young Persons Act 1974 are not made in respect of young people over the age of 16 years.) Discharge from care is automatic at 20 years of age but in practice, and depending on their circumstances, most are discharged with the approval of the Director-General at a much earlier age. Many return, after a period away from home, to the care of parents or members of their extended family and are discharged as soon as the Director-General is assured that they no longer need assistance.
The majority of children and young persons in care are cared for in the community and in 1985, 62.3 percent were living in foster homes, departmental family homes, in boarding schools or in the homes of relatives and friends, 13.3 percent were with their own parents as a trial to possible discharge; 9.6 percent were at work.
A number of young people, especially those in older age groups, come into care because of their inability to cope with community expectations. This is often manifested in offending against the law. With help and guidance, some settle in the community but some have to be admitted to the department's various institutions, usually after assessment and trial in boys’ and girls’ homes. A proportion go on to institutions under the control of the Department of Justice. In all, 11.9 percent of the wards in care are in institutions.
Table 7.23. CHILDREN AND YOUNG PERSONS UNDER THE CONTROL OF THE SOCIAL WELFARE DEPARTMENT, 30 NOVEMBER 1986
| Number | Percentage | |
|---|---|---|
Source: Department of Social Welfare. | ||
| Reasons for being placed in care— | ||
| Children placed under guardianship of the Director-General by court order | 3,955 | 70.2 |
| Children under control by agreement with parents | 1,040 | 18.5 |
| Children on court remand, postponements, warrant etc. | 635 | 11.3 |
| Total | 5 630 | 100.0 |
| Placement of children— | ||
| In foster homes | 2,515 | 44.7 |
| Placed with parents for trial period | 782 | 13.9 |
| Living with and supported by relatives | 103 | 1.8 |
| In employment (excluding those with relatives, etc.) | 462 | 8.2 |
| In residential colleges | 246 | 4.4 |
| Receiving tertiary education | 14 | 0.3 |
| In Department of Social Welfare short-term institutions | 259 | 4.6 |
| In Department of Social Welfare family homes | 699 | 12.4 |
| In private institutions | 169 | 3.0 |
| In Department of Education special schools | 49 | 0.9 |
| In hospitals | 13 | 0.2 |
| In psychiatric hospitals | 35 | 0.6 |
| On probation | 8 | 0.1 |
| In Department of Social Welfare extended-care institutions | 249 | 4.4 |
| In youth prison or corrective training centres | 10 | 0.2 |
| In police custody | 1 | 0.6 |
| Absent without leave | 16 | 0.3 |
| Total | 5 630 | 100.0 |
7.1 Department of Social Welfare; Department of Statistics.
7.2 Department of Health.
7.3 Treasury; National Provident Fund.
7.4 Department of Social Welfare; Department of Statistics.
The April Report. 5 vols. Royal Commission on Social Policy, 1988.
Benefits, Taxes and the 1985 Budget. Department of Social Welfare.
A Guide to Children and Young Persons Legislation. Department of Social Welfare, 1986.
Justice Statistics. Department of Statistics (annual).
Report of the Department of Social Welfare (Parl, paper E. 12).
Report on the Government Superannuation Fund (Parl. paper B. 20).
Report of the National Provident Fund Board (Parl. paper B. 19).
Table of Contents
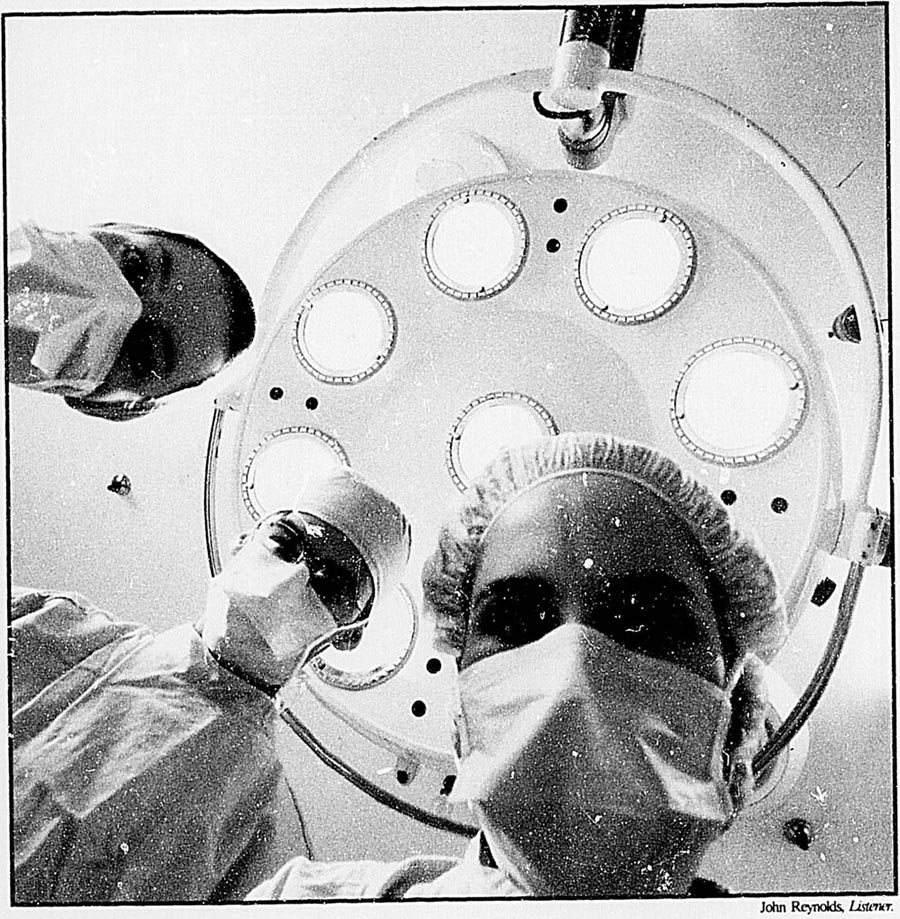
The New Zealand health system can be divided into public, private and voluntary sectors which interact in providing and funding health care.
The public sector provides free treatment at hospitals for immediate and major medical problems, including maternity and geriatric care and free dental treatment for those under 18 years of age. It is the responsibility of the Department of Health and its health development units, hospital boards and area health boards, other government departments, and territorial local authorities (which have some public health functions). Training for health professionals is also funded by the state.
Private sector health care includes general practitioners, dentists, pharmacists, physiotherapists, specialists and private hospitals, although the state provides a number of subsidies to those services. There are also the less orthodox techniques such as chiropractic, naturopathic, and ‘alternative’ and traditional healing. It also incorporates any private company or organisation which provides some type of health service to its members or employees. For example some firms employ occupational health nurses to perform duties directed toward prevention of occupational illness and injury.
A feature of private sector health care has been the rapid steady growth that has occurred in private health insurance over the last 10 years, to help finance surgical and medical care in private hospitals and to reimburse patients’ costs of consultations with general practitioners and specialists. Health insurance is provided by non-profit friendly societies and private insurance companies. The largest of these is the Southern Cross Medical Care Society, which provides cover to nearly 30 percent of New Zealanders. Through the Southern Cross Hospital Trust Board it also operates nine hospitals in various parts of the country. Other insurers include the NZ Medicare Society, the Healthcare Fund, the Group Health Co-operative, the Medic Aid Fund Society and Union Medical Benefits.
The voluntary sector is extensive and diverse. Large-scale organisations include the Plunket Society, Family Planning Society, the Salvation Army and St John Ambulance. Many are organised nationally or even internationally, e.g., Red Cross, Barnados. Some of these larger voluntary organisations—such as the Homes of Compassion, Crippled Children's Society, Society for the Intellectually Handicapped (IHC)—run hospitals, day-care centres, hostels and sheltered workshops. There is also a wide range of organisations catering for the sufferers of specific diseases or disabilities and/or supporting those caring for them—such as the Royal New Zealand Foundation for the Blind, the Multiple Sclerosis Society and the Diabetes Association. Some provide not only services but also research and educational programmes, e.g., the Cancer Society. Preventive work is especially important at the local level, and programmes such as care and craft classes for the elderly, stress and weight reduction classes, smoking cessation courses, and new mother support groups all help to promote health and the avoidance of both mental and physical problems.
All three sectors provide care at the primary and secondary levels. Primary care is the first level of health services, where users have direct access to providers without a need for referral. General practitioners and dentists are perhaps the most well known of primary health carers, although the category can also include physiotherapists, chiropractors as well as alternative healers. Secondary care is the second level of services—those available from the hospital system and from specialist practitioners.
The public sector meets over 80 percent of the total cost of health care and subsidises health care provided by general practitioners and specialists in private practice. Nearly all private hospitals are government subsidised and are subject to the same legislation and controls as public hospitals.
International context. In most OECD countries health systems are financed largely by the public sector through taxation, special levies or a combination of the two. New Zealand is somewhat different in that—apart from Accident Compensation Corporation funding for some services (see section 8.4)—its health expenditure comes from general taxation. There is no specific tax for health spending or a comprehensive social insurance scheme.
A consistent pattern in health expenditure is for wealthy countries to spend more per capita on health care than poor countries. Within this context New Zealand spends less per head (in relation to GDP) than comparable countries and has a relatively low rate of growth in health care expenditure compared with other OECD countries.
Table 8.1. EXPENDITURE ON HEALTH CARE IN SELECTED OECD COUNTRIES
| Health costs (1984)* | Percentage of population covered by public programmes (1983) | Percentage of total costs covered by public expenditure (1983) | |||||||
|---|---|---|---|---|---|---|---|---|---|
| Country | Expenditure on health as % of GDP | Public expenditure as % of GDP | Public expenditure as % of total health expenditure | Hospital services | Ambulatory services† | Drugs | Hospital services | Ambulatory services† | Drugs |
*1984 figures provisional only. † Ambulatory care = outpatient and day patient, and care given by the general practitioner at practice premises. ‡ Some of these OECD figures are at variance with other New Zealand-sourced figures of total health expenditure. However, for consistency in this table. OECD figures are used. § Excludes medical examinations, maternity care, vaccinations, glasses, etc. Source: OECD (1985) Measuring health care 1960–83: expenditure, costs and performance. | |||||||||
| New Zealand‡ | 5.6 | 4.4 | 79 | 100 | 100 | 100 | 93 | 47 | 65 |
| Australia | 7.8 | 6.6 | 85 | 100 | 100 | 100 | 100 | 85 | 72 |
| Canada | 8.4 | 6.2 | 74 | 100 | 100 | 33 | 91 | 72 | – |
| United States | 10.7 | 4.4 | 41 | 40 | 25 | 10 | 54 | 56 | 90 |
| United Kingdom | 5.9 | 5.3 | 90 | 100 | 100 | 100 | 99 | 88 | 93 |
| Japan | 6.6§ | 4.8 | 73 | 100 | 100 | 100 | 89 | 90 | 89 |
| Germany | 8.1 | 6.4 | 79 | 95 | 92 | 92 | 79 | 84 | 70 |
| France | 9.1 | 6.5 | 71 | 100 | 99 | 99 | 92 | 58 | 75 |
| Netherlands | 8.6 | 6.8 | 79 | 88 | 76 | 76 | 88 | 66 | 63 |
| Belgium | 6.2 | 5.7 | 92 | 98 | 93 | 80 | 68 | 50 | 50 |
| Denmark | 6.3 | 5.3 | 84 | 100 | 100 | 100 | 100 | – | 62 |
| Sweden | 9.4 | 8.6 | 92 | 100 | 100 | 100 | 100 | 91 | 70 |
The health sector has recently been under considerable scrutiny, a number of reviews were completed during 1988 which, taken in conjunction with the 1986 Health Benefits Review, are likely to have a major impact on health sector systems and structures. These included—the Royal Commission on Social Policy; the Commission of Inquiry into National Women's Hospital; the Commission of Inquiry into Discharge of Psychiatric Patients; the Law Commission Review of Accident Compensation; and the Taskforce on Hospital and Related Services.
It is expected that health services will continue to be largely publicly funded and provided, and that particular emphasis will be placed on improving administration and increasing the focus on primary health care, especially prevention.
At the time of going to print the following were the main administrative organisations within the health sector:
For the past decade there have been continuing efforts to integrate and co-ordinate health care in the public, private and voluntary sectors. To this end, the Area Health Boards Act 1983 provides for the integration of public health agencies (hospital boards and Department of Health district offices) to form area health boards, which are established on the request of hospital boards and on the recommendation of the Minister of Health. There is provision for two or more hospital boards to join together to form an area health board.
Area health boards have been established in Northland, Wanganui and Nelson since 1985.
In 1987 the Taranaki Area Health Board was established, and it is expected that the move to area health boards will be complete by the end of 1990.
The private and voluntary sectors can become involved in health planning by participation in service development groups and community committees.
General and psychiatric hospitals are controlled by locally elected hospital boards and area health boards. A hospital board of eight to 14 members is elected every three years for each hospital district. It is the duty of every hospital board to provide, maintain and staff such institutions, hospital accommodation, and medical, nursing and other services as the Minister of Health considers necessary.
The Director-General of Health is authorised to visit and inspect hospitals and to appoint assistant inspectors, and is required to report to Parliament through the Minister of Health on the administration of the Hospitals Act 1957.
Hospital boards are required to operate their own ambulance services unless they enter into some arrangement with a subsidised voluntary agency. The Order of St John and organisations such as the Wellington Free Ambulance perform valuable services in this way.
As well as being the main source of funding for public sector health care, the Department of Health has a major co-ordinating role in most health services. In the policy area, it consults with over 100 regulatory and policy boards, committees, councils and other organisations concerned with health. It also liaises with professional and other associations, voluntary health and welfare agencies, the universities and other government departments.
Public health services in the Department of Health are organised to reflect two distinct areas: environmental factors affecting health; and the promotion of personal good health in the community. The health protection programme covers environmental health, quarantine, occupational health and toxicology, radiation protection and the quality of food. There are also programmes which give emphasis to: disease prevention and better personal health through services for women and children, the elderly, and those with disabilities; mental health; health education; and dental health.
The objectives of health education programmes are to increase understanding of the value of health and to equip the public with knowledge and skills they can use to solve health problems.
Within its public-health nursing service, the department employs about 500 qualified nurses. Their work includes supervising the health of babies and small children, taking part in child health (including health education) programmes not under Plunket nursing services, providing a service to small industries and people in ‘at risk’ occupations, taking part in disease control programmes, and assisting the elderly and people with mental health problems.
The health responsibilities for women, children and families include services for women during childbearing and while raising children; medical and nursing supervision of infants, pre-school and school children; the inspection of schools and childcare centres; and the immunisation of infants against poliomyelitis and other diseases.
The programmes for elderly, disabled and handicapped people, and in the mental health area, concentrate on special needs and attempt to equip people to cope with life in the wider society.
The department maintains a school dental service staffed by dental nurses and directed by dentists, which provides dental care and health education for all pre-school, primary and intermediate school children. Beyond this, private dentists provide free treatment for teenagers until 16 years or, if they remain at secondary school, until 18 years.
At the local level, in each health district and area health board the medical officer of health, who is a medical practitioner with special qualifications in community medicine, is the adviser to all local authorities in his or her district. In some cases the medical officer of health's approval is needed before a local authority can take action to fulfil its public health function, while in others he or she is the first line of appeal against its decisions. Medical officers of health are required to keep the Director-General of Health and the Board of Health informed of local authority deficiencies in their responsibilities under the Health Act 1956.
Diseases which are scheduled in the Act must be notified by doctors and hospitals to the medical officer of health, who is responsible for control measures. Within this area the local authority health inspector is subject to the officer's direct supervision and control.
New Zealand's quarantine arrangements for both aircraft and ships comply with obligations under the international health regulations. Medical officers of health administer this service with the broad objective of controlling communicable and chronic diseases and keeping New Zealand free of quarantinable diseases.
The public health and other functions of the Department of Health are described in more detail in section 8.2.
Local authorities. The public health functions of local authorities are defined by statute and regulation. Elected local authorities must appoint a sufficient number of health inspectors qualified under the Health Inspectors Qualifications Regulations 1975. Where a local authority is too small to need a separate full-time inspector, the Health Act permits two or more authorities to combine to share the cost. In some smaller, sparsely-populated districts where a local authority does not employ its own inspector, the Department of Health or area health boards do the work and the authority pays for it. Nationally, only 25 percent of health protection officers are employed by the department and area health boards.
Other administrative organisations. Two other bodies, the Board of Health and the Health Services Personnel Commission, were disestablished from 1 April 1988. The former was an advisory body which co-ordinated the study of different aspects of the health service and advised the Minister of Health on policy issues. Its 11 standing advisory committees are to be replaced by a range of new advisory groups which will be established to study issues as they arise.
The Health Service Personnel Commission had been established by the Health Service Personnel Act 1983 as a central employing authority for the public sector health service. It set employment conditions and personnel practices and policies and fixed pay rates. The State Sector Act 1988 repealed the Act and disestablished the commission. It also transferred many of the responsibilities as employers to individual hospital boards and area health boards, which are responsible for their own personnel and industrial relations functions. In addition the Act established a co-ordinating role for the State Services Commission, which becomes the arbitrator of pay and conditions for occupational groups within the public sector health service.
Health services and medical benefits (under the Social Security Act 1964) are funded from general taxation through the Department of Health, which distributes funds to area health boards, hospital boards, and the wide range of practitioners, administrative organisations and others providing services to the public.
Over recent years governments have introduced a number of measures to curb health spending, while maintaining services. Hospital funding, which makes up nearly two-thirds of health expenditure, has come in for particular attention and since a population-based method of funding hospital boards was implemented in 1983 financial restraint has been applied to those boards shown by the funding formula to be advantaged. The funds recovered from these boards are available for redistribution to boards shown to be disadvantaged and submitting acceptable service development plans.
Policy for the 1986–87 financial year called for the continuation of restraints on financially advantaged boards and again these funds were available to disadvantaged boards. The total allocation for grants to hospital boards for 1986–87 was increased by 0.8 percent to maintain services.
Service planning guidelines have also been developed to help hospital and area health boards to make the best use of resources and to encourage equitable access to services. The guidelines relate the levels of health services to catchment population: local (up to 30 000); district (30 000 to 250 000); regional (over 250 000); and national. These population groupings have been adjusted to meet the specific needs of a particular population.
Hospital/area health board service planning guidelines have been published for the following areas: paediatrics; services for the elderly; obstetrics and neo-natal services; renal dialysis and transplantation; alcohol and drug services; and oral health. Guidelines for child adolescent and family mental health; mental health; cancer services; neurosurgery; diabetes mellitus; orthotics; cardiology; general surgery; general medicine; gynaecology; accident and emergency services; neurology; ophthalmology; burns and plastic surgery units; and respiratory medicine, are in various stages of completion and will be finalised by March 1989.
The implementation of the funding formula and the development of service planning guidelines were accompanied by a request from the Minister of Health for each hospital board to submit a comprehensive service development plan and these are now being implemented.
Table 8.2. EXPENDITURE OF THE DEPARTMENT OF HEALTH
| Programme | 1983–84 | 1984–85 | 1985–86 | 1986–87 |
|---|---|---|---|---|
*Includes medical research and area health boards from 1985–86. †Mostly grants to hospital boards, but includes some welfare services and benefits. ‡Excluding hospital and dental benefits, but including administrative costs. Source: Department of Health. | ||||
| $(000) | ||||
| Administrative services* | 22,917 | 23,459 | 98,872 | 215,231 |
| Data processing | 12,673 | 11,263 | 22,981 | 23,652 |
| Hospital services† | 1,343,155 | 1,409,059 | 1,585,119 | 1,951,728 |
| Medical and pharmaceutical services‡ | 332,308 | 372,050 | 500,931 | 636,205 |
| Public health and environmental protection | 6,255 | 6,269 | 5,793 | 7,356 |
| Health protection | 25,213 | 25,334 | 21,019 | 28,922 |
| Health promotion | 31,338 | 32,296 | 40,744 | 54,427 |
| Dental services | 34,032 | 34,563 | 37,017 | 43,611 |
| Total | 1,807,891 | 1,924,293 | 2,312,476 | 2,961,132 |
| Less, departmental receipts | 2,964 | 2,996 | 3,461 | 3,819 |
| Net expenditure | 1,804,927 | 1,911,297 | 2,309,015 | 2,957,313 |
The health service work-force is made up of a large number of professions and occupations. Some require lengthy tertiary education with controlled entry to the profession, and others have no formal training requirements. Determining the numbers and kinds of workers necessary to meet New Zealand's health service requirements is a responsibility of the Department of Health. The section is concerned with maintaining work-force data profiles for the different groups, work-force planning, dealing with production issues such as intakes into basic training/education programmes, recruitment and retention and immigration issues.
The department is also concerned with professional and occupational legislation. It works with registration bodies and with the Department of Education to monitor and develop courses for health professionals.
The department also maintains a work-force consultancy group which is composed of health professionals such as nurses, doctors, physiotherapists, speech/language therapists, occupational therapists, social workers, dietitians, and others who provide professional advice to the department and other organisations within the health service.
Following are the major registration councils and boards for health service professionals:
The Medical Council of New Zealand, constituted under the Medical Practitioners Act 1968, consists of the Director-General of Health, the deans of the faculties of medicine in the Universities of Otago and Auckland, eight registered medical practitioners appointed on a representative basis and one layperson.
The council deals with all applications for registration as medical practitioners under the Act. Until an applicant is able to satisfy the council that he or she has obtained 12 months experience as a house officer or has obtained comparable experience, registration is on a conditional basis. Those registered conditionally may only practise in an approved hospital. Responsible to the council is a medical education committee which supervises the training of those conditionally registered. The number of medical practitioners on the register at 30 June 1987 was 8794, with 6390 holding annual practising certificates. The Medical Council also has disciplinary powers, with a right of appeal to the High Court.
The Dental Council was constituted under the Dental Act 1963. It examines and approves the qualifications of applicants for registration as dentists, and exercises discipline over registered dentists.
The number of dentists on the register at 31 October 1987 was 1815. Those holding annual practising certificates numbered 1238 at 31 May 1987. A Registration Board for Dental Technicians was constituted in 1968 and the number of registered dental technicians holding annual licences as at 31 March 1987 was 236.
The Nursing Council of New Zealand is constituted under the Nurses Act 1977 and Nurses Regulations 1986. Its primary function is the registration and enrolment of nurses. The council sets minimum standards for registration; makes recommendations on programmes leading to registration and enrolment; conducts examinations; approves schools of nursing (subject to ministerial concurrence); issues annual practising certificates; and exercises disciplinary powers. It also maintains a register of nurses with the following categories—comprehensive, general, general and obstetric, psychiatric, psychopaedic, enrolled nurses, and midwives.
In the year ended 31 March 1987, 42 661 nurses held annual practising certificates.
Most nurses are now trained in three-year technical institute courses which lead to registration as a comprehensive nurse. Some institutes also conduct midwifery courses. Hospital board schools offer one-year programmes leading to enrolment and five conduct one or another of the three-year programmes which lead to registration as a general and obstetric, psychiatric, or psychopaedic nurse. All but three of the registration programmes have taken their last group of students.
Post-basic education for nurses ranges from regular in-service and short clinical courses to diploma courses at technical institutes and at Massey University and degree-level courses at Massey and Victoria Universities.
The Department of Health is also responsible under the Nurses Act for the provision of a qualified nursing workforce. It is involved in overall planning to meet demand for nurses in the health sector and prepares policies and guidelines to assist the chief nurses of hospital and area health boards.
The Psychologists Board is constituted under the Psychologists Act 1981. The board is concerned with the registration and conduct of persons engaged in psychology. At 31 December 1987 there were 884 registered psychologists.
The New Zealand Physiotherapy Board is constituted under the Physiotherapy Act 1949. The board examines and registers candidates for physiotherapy practice, issues special licences and regulates the conduct of those registered under the Act.
The training period for physiotherapists is three years. Full-time training is conducted at the Auckland Technical Institute, and at Otago Polytechnic. All students are required to pass the State Examination in Physiotherapy to qualify for registration.
At 31 December 1987 there was a total of 4244 physiotherapists on the register, with 1502 holding current annual practising certificates.
The Occupational Therapy Board is constituted under the Occupational Therapy Act 1949. The board is concerned with the registration and conduct of those practising occupational therapy.
The Central Institute of Technology, Heretaunga, conducts the three-year training course and clinical experience is gained at hospitals. Students who successfully complete the course are awarded a diploma in occupational therapy and then registered. At 31 December 1987 there were 1179 registered occupational therapists, with 702 licensed to practise.
The Dietitians Board, constituted under the Dietitians Act 1950, is concerned with the training, examination and registration of people practising dietetics.
The training period for a dietitian is, in the case of the holder of a degree of Bachelor of Home Science conferred by the University of Otago or of the holder of a Diploma in Home Science of the University of Otago, 12 months in a hospital training school. In the year to 31 December 1987 there were 749 registered dietitians. Annual practising certificates were issued to 288 dietitians.
The Opticians Board constituted under the Optometrists and Dispensing Opticians Act 1976, is concerned with the registration and conduct of registered optometrists and registered dispensing opticians.
As at 31 December 1987, there were 397 registered optometrists and 62 registered dispensing opticians. There were 17 new optometrist registrations during 1987.
The Medical and Dental Auxiliaries Act 1966 provided for the constitution of a Podiatrists Board. The board's functions include promoting high standards of education and conduct among the profession, disciplining registered podiatrists and conducting special examinations. The board also deals with all applications for registration under the Act.
There are approximately 329 registered podiatrists, with 200 practising. Many of those work only part-time. Following government policy, a number of hospital boards are establishing community-oriented podiatry services, principally intended for the elderly.
The Chiropractic Board is constituted under the Chiropractors Act 1982, and is concerned with the registration and conduct of practising chiropractors.
There is no training available in New Zealand. The principal criteria for colleges applying to the New Zealand Chiropractic Board for approval are documentary evidence that the college has been accredited by the federal appointed professional accrediting agency in the United States of America, or those accrediting agencies having reciprocity with that agency. There were 332 registered chiropractors at 31 December 1987, 124 of whom were licensed to practise.
The 13-member Plumbers, Gasfitters, and Drainlayers Board is concerned with the registration of people working in these trades. It issues annual licences to tradespeople; limited certificates; and for certain specialised work, certificates of exemption in gasfitting and plumbing. It is also responsible for disciplinary action against tradespeople holding various levels of registration or limited certificates if it is established their work is unsatisfactory or they have failed to meet legal responsibilities.
Drainlaying may be carried out only by registered drainlayers. Gasfitting may be carried out only by licensed gasfitters and holders of limited certificates (working in the employment, or under the supervision of, licensed gasfitters or persons holding certificates of exemption in gasfitting).
Except in specially exempted areas, all sanitary plumbing defined in the Plumbers, Gasfitters, and Drainlayers Act 1976 can be performed only by craftspeople and registered plumbers and holders of limited certificates (working in the employment or under the supervision of craft plumbers), or by persons holding a certificate of exemption.
Specifications, work standards and materials in plumbing work are prescribed in the provisions of the Drainage and Plumbing Regulations enacted under the Health Act 1956.
The Pharmacy Act 1970 requires that pharmacies in New Zealand are always supervised and controlled by a registered pharmacist. At the end of December 1987 there were 3403 pharmacists.
All registered pharmacists, except those who have conscientious objection to membership, automatically become members of the Pharmaceutical Society of New Zealand. The society is managed by a 12-member council. Its role is to administer the Pharmacy Act and to protect and to promote the interests of both the profession and the public.
The present system for pharmacy education requires a minimum of three years’ attendance at the School of Pharmacy, Central Institute of Technology, Heretaunga, at which the diploma in pharmacy is obtained. There is also a four-year degree course in pharmacy at the University of Otago. Graduates from both courses gain a year's practical experience before becoming eligible for registration as pharmacists.
Any pharmacist (or company in which not less than 75 percent of the share capital is owned by a pharmacist or pharmacists) may establish one pharmacy. Unqualified persons or companies in which less than 75 percent of the share capital is pharmacist-owned must get the consent of the Pharmacy Authority set up under the Act before commencing business; and in all cases the establishment of more than one pharmacy under the same ownership, or the holding of an interest in more than one pharmacy by any person, is subject to the consent of the authority. All pharmacies must be registered with the society.
At the end of December 1987 there were 1114 community pharmacies in New Zealand employing over 2000 pharmacists. A further 250 to 300 pharmacists were working in hospitals, government departments and the pharmaceutical industry.
The Medical Radiation Technologists’ Board is constituted under the Medical and Dental Auxiliaries Act 1966. The board is concerned with the registration, education and conduct of those practising with medical radiation technology. It has representation from the New Zealand Society of Radiographers and Medical Radiation Technologists Inc., the New Zealand Branch of the Royal Australasian College of Radiologists, and the Departments of Health and Education.
There are five classes of medical radiation technology: diagnostic radiography; radionuclide imaging; therapeutic radiography; ultrasound imaging; and magnetic resonance imaging. As at 31 December 1987 there were 1648 registered practitioners with 975 annual licences issued and 107 new registrations during the year.
The Medical Laboratory Technologists’ Board is constituted under the Medical and Dental Auxiliaries Act 1966. The board is concerned with the training, examination, registration and conduct of those engaged in the practice of medical laboratory technology. It has representation from the New Zealand Institute of Medical Laboratory Technology (Inc.), the New Zealand Society of Pathologists Incorporated, and the Departments of Health and Education.
The training period is five years. The first three years are spent studying for the New Zealand Certificate in Science (Medical Science) and gaining specified laboratory experience. Thereafter, study and laboratory work continues towards the board's certificate and specialist-level examinations, which are offered in 10 disciplines. Only one subject and level may be attempted each year. On completion of two certificate-level subjects, or the certificate and specialist levels in one discipline, the trainee gains the Diploma in Medical Laboratory Technology and is eligible for registration by the board. University graduates with appropriate degrees may train for three years and be examined for limited registration in any disciplines.
At 31 December 1987 there were 1659 full registrations, with 920 licensed to practise.
A major function of territorial local authorities is the promotion and conservation of the public health within their districts. They appoint health inspectors to carry out regular inspections and abate any nuisances or conditions injurious to health. Specific responsibilities include the control of sanitary conditions (including overcrowding of housing) and the regulation of plumbing and drainage. There is also the control of offensive trades, environmental noise and air pollution control of small industries. The hygiene of premises, including restaurants, in which food is manufactured or sold, is another responsibility. Local authorities are also empowered to provide public water supplies, sewage disposal systems, refuse collection and disposal stormwater drainage, public conveniences, cemeteries, crematoria, swimming pools and other sanitary works.
The Department of Health also has responsibilities in public health. Its role is to support and advise local authorities in the performance of their statutory duties, to monitor environmental health conditions and to promote improvements where necessary. For these purposes, the department operates numerous programmes including health-protection services, periodic surveys of environmental health systems, air pollution control, financial incentives for other authorities, and staff training.
Health-protection services provided by the department include both national and international functions. They include the maintenance of food standards, quarantine, health education, communicable disease control, shellfish sanitation, and the carrying out of national surveys of water supplies, food premises and refuse disposal sites. The department assists Wellington Polytechnic with the basic training of health inspectors employed by local authorities and conducts specialist and refresher courses for them. In the case of some smaller local authorities the necessary inspections are made by departmental officers on behalf of the authority.
Financial incentives in the form of grants and subsidies towards the capital cost of water supply, solid waste management and fluoridation systems are provided for local and regional authorities by the Department of Health. These have been available since 1969 in various forms and have been particularly successful in improving environmental health. Emphasis is now being given to disposal of hazardous wastes.
Industrial air pollution is controlled under the Clean Air Act 1972 through a system of licensing processes known to emit air pollutants, and a requirement to meet the best practicable means for containment. The Department of Health is responsible for licensing 350 major industrial processes, and local authorities control about 1000 smaller processes. All licensed premises are monitored to ensure they conform to the requirement for containment by meeting their licence conditions. Air is also monitored regularly near most population centres.
Clean air zones, which have been established for Christchurch City and surrounding urban areas, are made under the Clean Air Act when pollution is severe enough to require special controls on the emission of air pollutants. In Christchurch there is a particular problem with domestic coal smoke, and the Act provides for control of domestic heating appliances and the granting of financial assistance for electrical space and water heating to reduce domestic smoke emissions from coal burning.
The Medicines Act 1981 and the Medicines Regulations 1984 provide controls over therapeutic substances.
New medicines and related products require the approval of the Minister of Health before they can be marketed. Consent is only given when satisfactory evidence of the safety, effectiveness and quality of the product has been provided.
A medicine is defined as any substance or article, other than a medical device, which is intended wholly or principally for administration to humans for a therapeutic purpose or which is a pregnancy test. Any food, cosmetic or dentifrice (tooth powder or paste) which is claimed to be effective for a therapeutic purpose is considered to be a related product.
Any material change in a medicine or a related product has to be notified to the Director-General of Health and the changed product must not be distributed until 90 days have elapsed from the notification or until the Director-General signifies consent.
Medicines are classified as either prescription medicines, restricted medicines (for sale by a pharmacist personally), as ‘pharmacy only medicines’, or are considered safe for general sale. The legislation controls the advertising and labelling of medicines, related products and methods of treatment; the standards of manufacture, package and storage of medicines, related products and cosmetics; and the prescribing and dispensing of medicines.
Licences are required for manufacturers and others dealing with medicines. Any refusal of a licence can be appealed to the Medicines Review Committee, which may also enquire into an objection to any committee's recommendation that the Minister of Health refuse to consent to the distribution of a new medicine.
A wide range of narcotic and other drugs are strictly controlled by the Misuse of Drugs Act 1975. It is a serious offence to obtain, manufacture, possess, consume, supply or offer to supply controlled drugs unless authorised under the Act.
Controlled drugs are divided into three classes. The heavier penalties are for offences involving drugs in class A, which include heroin, lysergide and cocaine. Classes B and C contain many drugs which are used for medical and scientific purposes such as morphine, pethidine and codeine. Cannabis plants, as well as its fruit and seeds, and the recently manufactured ‘designer drugs’ are included in class C.
Illegal dealing in any class of controlled drug is subject to heavy penalties varying from lengthy terms of imprisonment through to fines.
To curb drug abuse, the Departments of Health and Customs, and the Police have maintained the National Drug Intelligence Bureau since 1972.
The Food Act 1981 provides for the analysis of any articles of food or drink for sale and for the inspection of places where food is sold. There are stringent measures to prevent the adulteration of food and provide for the inspection of places where food is manufactured or packed. Regulations lay down minimum standards for many classes of food, control additives of all kinds and deal with the labelling of food packages. Control is also established over all utensils and appliances coming into contact with food. Regular sampling of foods is undertaken by departmental inspectors and the samples are analysed by the Department of Scientific and Industrial Research.
An important provision of the Act controls all kinds of publicity where a purchaser of any food would possibly be deceived about its properties—whether or not it is standardised by regulations.
A Food Standards Committee meets regularly to discuss the latest technical advances in food production and to make recommendations for amendments to the legislation.
The nutrition section of the Department of Health provides advice on nutrition and dietetics to hospitals, and welfare and other institutions. It is responsible for education programmes and provides a nutrition information service to the public, government departments and organisations concerned with the production and marketing of food. The nutrition section also carries out dietary research projects, usually in liaison with medical research teams.
The Department of Health's medical officers of health are responsible for occupational health within their own districts and they work in consultation with labour, management, the medical profession and other groups.
The Department of Labour (which is responsible for accident prevention, hours of work and employment conditions) informs the Department of Health of any health problems which factory inspectors may encounter. The Health Act 1956 gives to medical officers of health (or other authorised officers of the Department of Health) the same authority as inspectors of factories have under the health and welfare sections of the Factories and Commercial Premises Act 1981 (see section 8.6). The Department of Health also supplies information and advice on occupational health and related matters and approves respirators for use when abrasive blasting or when working with asbestos. The department arranges for medical examinations where these are available under the regulations and, in the case of the Lead Process Regulations, the medical officer of health may suspend workers when their blood lead level is unacceptably high.
A similar understanding has been established with the Waterfront Industry Commission and the Railways Corporation. There are occupational health laboratories in Auckland, Wellington and Christchurch which investigate work hazards. An occupational health task force consisting of specialist doctors, nurses and scientists reinforce the usual staff available to medical officers of health to examine particular occupational health problems occurring in districts. The task force also studies problems arising in industries found throughout the country and from such studies guidelines are published.
Notifiable occupational diseases are scheduled in the Health Act 1956 and details of diseases notified are published annually in the report of the Director-General of Health.
The Toxic Substances Act 1979 and the Toxic Substances Regulations 1983 control the advertising, distribution, use, labelling and packing of all poisons and toxic substances.
Manufacturers, importers and packers must notify the Director of the Division of Public Health before dealing with any toxic substance for a first time. This includes any toxic substance bearing a common name, chemical name or trade name which has not previously been distributed in New Zealand under that name.
The Department of Health provides technical advice to emergency services during incidents involving chemicals and to the Pesticides Board and the Animal Remedies Board when they are considering new formulations for New Zealand.
These are 24-hour services operated through the University of Otago's National Toxicology Group and the accident and emergency department of the Dunedin Public Hospital. The Poisons Information Centre provides information primarily to health professionals on acute poisoning situations. The Hazardous Chemicals Centre gives advice mainly to emergency services (particularly the NZ Fire Service) on hazardous chemicals emergencies.
The emergency telephone number for this service, (024) 740-999 is listed in telephone directories under the section ‘registered medical practitioners’.
An increasing number of specific health hazards are formally controlled: asbestos; lead processes; electroplating; spraypainting; sand-blasting (materials containing free silica used in blasting in factories are restricted); fumigation; aerial application of poisons (where, in conjunction with the Civil Aviation Division of the Ministry of Transport, a special rating is required by pilots); and agricultural chemicals. Occupational health guidelines have been issued for the monitoring of users of organophosphate pesticides. Other guidelines are to protect workers in the aluminium, spraypainting, lead and electroplating industries; and foundries and industries where formaldehyde and solvents are used.
Comparable guidelines are being prepared for those who use timber treatment chemicals.
The Department of Health encourages industry to develop preventive medical and nursing services and many industries employ an occupational health nurse. In some areas the department's occupational health centres serve as a base for a preventive service to small industries, and in others, visiting occupational health nursing services are provided.
The statutory requirements concerning first aid in factories are set out in the Factories and Commercial Premises Act 1981 and the Factories and Commercial Premises (First Aid) Regulations 1985. This legislation is administered by the Department of Labour. In businesses where more than 50 people are employed, the person responsible for first aid must be either a registered nurse or the holder of a first aid certificate.
The National Acoustics Centre assists with the early detection of deafness and the conservation of hearing. The centre conducts and promotes research into occupational and other forms of deafness. An advisory service is provided for those working with the deaf, and training is given to those responsible for testing groups for hearing loss. Investigations into environmental noise are also undertaken by regional noise engineers.
The National Radiation Laboratory provides the administrative and technical services required by the Radiation Protection Act 1965 and Regulations 1973. Prior approval must be obtained for the import or export of any radioactive material. Each owner of irradiating apparatus (source of X-rays) or radioactive material must ensure that they are used only under the control of a licensed person.
The laboratory provides the licensees with monitoring, advisory, calibration and other services which promote radiation safety. Trained officers regularly visit all places where sources of ionising radiation are used, and a service is available for measuring the exposures received by radiation workers.
The laboratory also maintains national standards for radiation dose measurement, advises on requirements for the transport and disposal of radioactive materials, and on hazards associated with the use of non-ionising radiation, and is responsible for monitoring a wide range of foodstuffs and environmental samples for radioactivity.
Mental health services in New Zealand are currently in a state of change, particularly with regard to a shift from hospital-based to community-based psychiatric care.
Hospital boards and community organisations are involved in setting up services in the community, such as hostels, community mental-health centres and activity/day-care centres. For community organisations, such activity is limited by a severe shortage of funds. Hospital/area health boards are encouraged by the Department of Health to support such groups locally from board funds.
There are currently 17 psychiatric units in general hospitals, an increase from 11 in 1974. Their development has widened and made easier access to treatment and support services and reduced the disruption to home- and work-life which could result from admission to a distant psychiatric hospital. Community mental health centres established by some hospital and area health boards contribute to the reduction in hospital admissions and provide a focus for the promotion of mental health and the prevention of ill health.
The health of families is promoted through co-operation between the Department of Health, other government departments, voluntary agencies, area health boards, hospital boards and health professionals. Women can receive free antenatal, perinatal and postnatal care from their general practitioners (through benefits set out in the Social Security Act 1964) or by attending antenatal clinics established in connection with public hospitals with maternity wards. Some women choose private obstetric care from a specialist.
Approximately 99 percent of confinements take place in hospital but domiciliary midwives, working with general practitioners, provide care for those women who choose to have their baby at home. For women living far away from the main centres of population, antenatal care is supplemented by public health nurses employed by the Department of Health or area health boards, or by district nurses. Antenatal classes, to prepare parents for their baby's arrival, are available at hospitals or from voluntary organisations.
All private maternity hospitals are licensed under the Hospitals Act 1957, and the Department of Health is responsible for ensuring that regulations regarding buildings, equipment and staff are observed.
Family planning advice can be obtained from general practitioners, private specialists, and from any one of the 40 clinics operated by the New Zealand Family Planning Association (Inc.) in various centres throughout the country. The Government provides a grant to meet the cost of salaries of doctors, nurses and clinical health assistants employed by the association in approved clinics.
The Government also provides a grant to the New Zealand Association of Natural Family Planning (Inc.) to meet the payment of the salary of the national medical co-ordinator, an initial one-week residential training course for up to 175 teachers each year, and an annual three-day training course for up to 250 teachers.
A number of hospital boards have established family planning clinics within their obstetrics and gynaecology departments to provide additional facilities for the public and training for doctors, medical students and nurses. Other boards are being encouraged to provide these facilities.
Women's health is a complex area, encompassing many issues and, while the field has traditionally been associated only with childbearing and reproduction, a consideration of women's health is no longer limited to these areas. Recent policy also recognises that specific groups of women, such as Maori women and elderly women, have particular health needs which should be catered for in health planning.
A women's health policy is being developed by the Department of Health. A number of pilot women's health centres have also been established. Women's health services are provided by hospital and area health boards, health professionals and a large variety of community and consumer groups. A National Advisory Committee on Women's Health provides advice and suggests priority areas to the Minister of Health and the department.
A comprehensive child health service that focuses on prevention is offered by area health boards, health development units of the Department of Health, and the Royal New Zealand Plunket Society. Examinations by family doctors are recommended at about six weeks of age and again at nine months, and whenever there is anxiety over acute or chronic illness or development. The Plunket Society provides the major proportion of preventive community health nursing services to infants and pre-school children although some supervision is undertaken by public health nurses. In addition to nursing services provided in the first year, developmental health checks are recommended at 18 months and three years. Hearing screening by impedance audiometry in the pre-school period is also recommended. When necessary children are referred to family doctors, or to medical officers or community paediatricians employed by the Department of Health.
A consultative service is provided to schools by public health nurses, with special emphasis on the health supervision of handicapped children, and with referral as necessary. All new entrants receive a health assessment and examination by the public health nurse, in which parent participation is encouraged. Hearing tests by pure tone audiometry are performed at school entry and in form one, and on request at other ages. Vision tests are performed at school entry, in form one and in form four.
Government supports the Children's Health Camps Board which maintains seven permanent camps for the short-stay placement of children convalescing after illness, for those whose physical health is unsatisfactory, and for those with minor behavioural or psychiatric problems. Referrals to the camps are made by public health nurses, while medical officers undertake general health supervision of the camps. The Department of Education maintains school classes in the camps, with emphasis on remedial teaching.
Immunisation is free and is usually performed by family doctors or their practice nurses, although some immunisations are given by public health nurses.
Table 8.4. RECOMMENDED IMMUNISATION SCHEDULE
| Age | Vaccine |
|---|---|
*Diphtheria, tetanus, whooping cough. †Diphtheria, tetanus. Source: Department of Health. | |
| Birth | Hepatitis B |
| 6 weeks | Triple (DPT)* Hepatitis B |
| 3 months | Triple (DPT)* Poliomyelitis Hepatitis B |
| 5 months | Triple (DPT)* Poliomyelitis |
| 15 months | Measles Hepatitis B |
| 18 months | Double (DT)† Poliomyelitis |
| 5 years | Poliomyelitis |
| Form 1 girls | Rubella |
| 15 years | Tetanus |
Hepatitis B immunisation (at birth, six weeks, three months and 15 months), previously only offered to infants born in high-incidence areas or to infants of carrier mothers, was extended to all infants in 1988. There was also a one-off campaign to immunise all preschool children against hepatitis B.
It is becoming widely recognised that to a large extent our health is a direct result of how we live, work, and interact with others and with our environment. In short, our health is a result of how we behave.
Health education programmes of the Department of Health cover topics such as immunisation, hearing protection, healthy lifestyle and sexually transmitted diseases, and promote positive health behaviour.
At a local level, education programmes are developed by health development units. Health education officers are involved in the planning, co-ordination and evaluation of these programmes and they also provide training on educational strategies for health personnel. Public health nurses, dental nurses, health protection, medical and dental officers all devote some of their time to health education with individuals, community groups and schools at the local level.
A health promotion programme (maintained by the Department of Health's Health Education Unit) develops national health education programmes. Those include health education publicity on television, radio and in the press. Technical resource kits and a range of health information publications are also produced, and these are available from health development units and area health boards. An audio-visual library has a collection of films and videos on a wide range of health topics. These are available on loan to health development units, area health boards, and other health-related agencies who participate in recognised health training programmes.
Health magazine is produced quarterly by the Policy and Communications Group of the Department of Health. It is issued free on request to the public and provides health information and publicises some of the department's work.
In New Zealand problem drinking is a major public health issue. Problem drinking covers not only those who are dependent on alcohol (and who are usually referred to as alcoholics) but also those who as a result of their drinking cause problems for themselves or others. These resulting problems may range from illness or accidents to financial problems, violence or family breakdown.
An indication of the prevalence of alcohol problems comes from a 1986 Christchurch study of persons aged 18–64 years. It was found that 19 percent had met criteria for alcohol abuse and/or alcohol dependence at some time in their lives. Assuming that Christchurch is similar in this respect to the rest of New Zealand, then more than 375 000 people in New Zealand have had psychiatrically classifiable alcohol abuse and/or alcohol dependence at some time in their lives. An additional 17 percent (more than 337 000 New Zealanders) were problem drinkers at some time in their lives.
Alcohol consumption for the year ended June 1987, in 750 ml bottles, was the equivalent of 213 bottles of beer, 26 bottles of wine and 7 bottles of spirits for every person aged 15 years and over. This was including those who do not drink, or rarely drink, alcoholic beverages. Consumption of alcohol per person 15 years and over increased by 21 percent during the 20 years from 1967–1987. Most of this change occurred between 10 and 20 years ago.
The Alcoholic Liquor Advisory Council (ALAC) continues to fund a multi-disciplinary alcohol research unit in association with the Medical Research Council and the University of Auckland School of Medicine, and also supports other independent research projects. The council has abstracted New Zealand alcohol research for publication. These abstracts will be available for on-line use through the National Library's ‘Index New Zealand’ computerised information system. An ALAC library and information resource centre provides pamphlets, posters, and films.
The majority of clients are dealt with on an outpatient basis. At alcohol and/or drug outpatient treatment agencies, more than 8000 new-to-agency outpatients were treated in 1986 and during this time over a thousand other people received help in dealing with someone else's alcohol and/or drug problem. In 1985, 2672 people were admitted or readmitted for inpatient alcohol treatment. Employee Assistance Programmes continue to be developed by ALAC, providing assistance not only for those in the workplace who have alcohol problems but also for any type of personal problem that affects work performance.
The Department of Education has developed a health syllabus with an alcohol education component which links with teaching resources previously developed by the department and the Alcoholic Liquor Advisory Council. A ‘Say When’ (health promotion) campaign has been conducted through television, radio, magazines, newspapers and community events. There is also an increased focus on tackling alcohol problems at a community level, and ALAC has assisted local agencies in five cities to employ community workers to promote moderation in the use of alcohol.
The council also provides to the Government, government departments and other agencies advice and statistical data, on control policies, treatment methods and facilities, and other alcohol-related matters.
New Zealand's dental health service combines a school dental service for children, dental benefits for adolescents, and private practice for adults. Major hospitals also provide dental services for inpatients and other special groups. Administratively, the country is divided into 13 dental districts and four area health boards. The skills of dentistry are taught at a school for dental nurses in Wellington and at the School of Dentistry, University of Otago.
This service works to maintain a high standard of dental health of pre-school and school children by treatment at six-monthly intervals, starting at the age of two-and-a-half and continuing through to the highest class at primary or intermediate school.
School dental nurses, after completing the two-year training course, are appointed to school dental clinics where children are given routine dental care. Clinics are visited regularly by the Principal Dental Officer and Supervising Dental Nurse, who assist dental nurses to maintain high standards. Another medium for continuing education is the School Dental Service Gazette which is published five times each year.
The dental care involves examination, disease prevention measures, fillings in deciduous (first) and permanent teeth, extraction of deciduous teeth and dental health education. Some children are referred to dentists for additional care which is beyond the scope of the school dental nurses. The cost of such care is usually met as a special dental benefit. Orthodontic treatment and some other specialist services are not provided as part of school dental service or dental benefit programmes but can be obtained privately.
During the year ended 31 March 1987, 922 school dental nurses provided dental care for 514 984 children. Indicators of the success of the service are the acceptance (71 percent of pre-school children aged two-and-a-half to five years, and 95 percent of primary school children are enrolled) and the improvement of dental health of children.
For children leaving the School Dental Service at the end of their primary schooling, the number of filled teeth was down to an average of 3.0 per child in 1987, and approximately 23.5 percent had no fillings at all in their permanent teeth.
Dental care for teenagers up to 16 years of age is provided by private dental practitioners as dental benefits under the Social Security Act, the dentist being paid on a fee-service basis. Children who remain at school after age 16 and qualify for the extended family benefit, or who are otherwise dependent upon parents for support, continue to receive dental benefits up to age 18. Treatment is aimed at conserving the natural teeth. There is free choice of dentists, and dentists have the right to decline patients. Private practitioners completed 324 127 treatments under the scheme during the year ended 31 March 1987.
Dental health education is an integral part of the School Dental Service and includes activities in the clinics and the classroom. Educational material is produced by the Department of Health for the School Dental Service and for general use in the community. Materials specifically for dentists are produced by the Dental Health Committee of the New Zealand Dental Association. The New Zealand Dental Health Foundation is also taking an active role in the promotion of dental health.
The dental unit of the Medical Research Council carries out research on a wide range of dental problems. Further research is undertaken by the School of Dentistry at the University of Otago, and there is also a research unit within the Dental Health Programme of the Department of Health.
Increasing emphasis has been given to the rehabilitation of people with disabilities over recent years.
Public hospitals provide a medical rehabilitation service, with co-operation from government and other agencies, and there are rehabilitation centres for the treatment of those who are severely disabled in Auckland, Palmerston North and Rotorua. For the rehabilitation of people suffering from spinal injuries, specialist spinal injury centres are provided at Auckland and Christchurch. Geriatric assessment and rehabilitation units have been established by a number of hospital boards. Rehabilitation activities are also carried out in the physical medicine departments of general hospitals, and in psychiatric and psychopaedic hospitals.
The Rehabilitation League is an agent of government in vocational rehabilitation. The main function of the league is to provide facilities for work assessment, work experience and work adjustment. Policy is decided by a national management committee, and district committees administer the centres which are established in Auckland, Wellington, Christchurch, Dunedin and Napier.
During 1987 the Department of Health established an Elderly, Disabled and Handicapped programme, which over the next three years will be working to:
Implement greater community care for the intellectually handicapped;
Improve home support schemes for the elderly and younger physically disabled;
Implement consumer-based funding for individuals, based on their need for care;
Promote quality assurance programmes for services in all sectors; and
Further develop health promotion programmes for the elderly, disabled and handicapped.
Assistance to the disabled is described in chapter 7, Social welfare.
National Health Institute. The institute is one of three science units of the Department of Health. It provides scientific support in microbiology and environmental chemistry for the department's health promotion, health protection and occupational health programmes. Its laboratories provide investigative, diagnostic and reference services for medical officers of health, hospitals, private laboratories and general practitioners. It also carries out surveillance and epidemiological studies for disease control and works internationally with the World Health Organisation and other national organisations active in disease surveillance.
An environmental chemistry section conducts studies on environmental and occupational health. The monitoring of food, water and the environment for micro-organisms of public health significance is carried out at the institute and at five regional laboratories.
The institute is the storage centre for the National Culture Collection of micro-organisms of medical or scientific importance and the National Serum Bank, a collection of sera historically representing the immune status of the population.
This unit is a service group within the Department of Health with research and evaluation functions. The unit carries out, advises on, and supports research on health and health services and publicises the findings. These studies are designed:
To improve the level of knowledge and understanding about health services, trends in health issues and the social and economic factors influencing health; and
To provide an informed base for decision makers.
Contact is maintained with university and medical researchers; hospital managers and board members; ward, clinic and office staff; and many others. The information is used to evaluate existing policies, to help in planning new policies and to increase understanding about health issues.
Current studies include: health promotion among the elderly; area health boards; AIDS; rural health services and needs; hospital waiting lists; health facts; complementary therapies; cot deaths; women's health issues; alcohol; and retirement.
Current evaluations include: diabetes services; asthma services: ‘Well Women’ clinics; the needle exchange scheme; and primary health care initiatives.
The Medical Research Council is the major organisation supporting medical research in New Zealand, and acts as the central co-ordinating body. The council was established in December 1937 as a committee of the Department of Health. It became incorporated by the Medical Research Council Act 1950 as a body independent of the Government and has remained so, though it is largely financed by a government grant. It can also receive bequests and donations.
The functions of the council are:
To initiate, foster and support medical research;
To give information, advice and assistance to those concerned with medical research; and
To collect and distribute scientific information, including publishing reports.
The council supports research in its own units (virus, dental and toxicology groups) and through project grants to research groups in universities and hospitals. It also awards scholarships, fellowships and travel grants to individuals, and assists with the staging of scientific meetings. In 1987 the council supported the equivalent of about 360 full-time research workers. The financial resources available to the council in 1987 were $13.6 million. Support is currently being provided in most fields of medicine.
Although applications in all research fields are considered, the council particularly welcomes applications from those equipped to undertake research or research training in medical or medico-social fields and disciplines where unique opportunities exist in New Zealand, such as Maori and Pacific Island Polynesian health and epidemiological research. Other fields of research sponsored include:
Health of the very young and the elderly;
Unintentional injury;
Women's health; and
Public health aspects of, for example, communicable diseases, mental health, primary health care, health education/promotion, health economics and health services delivery.
The council is responsible for maintaining a balance in the research supported throughout New Zealand and liaises closely with other medical research funding bodies. It also represents the medical research community on other bodies and has links with overseas research funding organisations.
The National Health Statistics Centre is responsible for the collection, analysis and distribution of information about the health status of New Zealanders and the use of health care resources. It works with organisations and institutions both within and outside New Zealand and is a forum for new ideas and techniques to improve health.
The World Health Organisation's International Classification of Diseases recommends basing classification of deaths by causes on the concept of the underlying cause. The certifier's statement largely determines the cause, but to obtain more accurate data reference is also made to all autopsy reports received, cancer case registrations, coroners’ reports and hospital case summaries.
Medical practitioners certified 81 percent of deaths registered in 1985, and 19 percent were certified by coroners. Of the deaths certified by doctors, 10 percent were subject to autopsy compared with 99 percent of deaths certified by coroners. Overall, 26 percent of all deaths had autopsies performed.
New Zealand adopted the ninth revision of the International Classification of Diseases in 19/9. As a result, care must be taken when comparing figures since 1979 with those for previous years.
Table 8.6. MAJOR CAUSES OF DEATH*
| Number of deaths | Rate per million of mean population | |||||
|---|---|---|---|---|---|---|
| Cause of death | 1983 | 1984 | 1985 | 1983 | 1984 | 1985 |
*Further details of causes of death are available from the National Health Statistics Centre. Source: National Health Statistics Centre. | ||||||
| Malignant neoplasm | 5,937 | 5,888 | 6,167 | 1,841 | 1,807 | 1,881 |
| Diabetes mellitus | 369 | 341 | 397 | 114 | 105 | 121 |
| Chronic rheumatic heart disease | 135 | 123 | 147 | 42 | 38 | 45 |
| Hypertensive disease | 264 | 254 | 277 | 82 | 78 | 84 |
| Ischaemic heart disease | 7,145 | 7,196 | 7,340 | 2,215 | 2,209 | 2,239 |
| Other forms of heart disease | 1,119 | 903 | 1,081 | 347 | 277 | 330 |
| Cerebrovascular disease | 2,937 | 2,811 | 2,883 | 911 | 863 | 879 |
| Disease of arteries, arterioles, and capillaries | 619 | 581 | 686 | 192 | 178 | 209 |
| Pneumonia | 1,275 | 1,063 | 1,399 | 395 | 326 | 427 |
| Bronchitis, emphysema, and asthma | 742 | 709 | 766 | 230 | 218 | 234 |
| Other diseases of respiratory system | 888x | 824x | 1,221 | 275x | 253x | 372 |
| Peptic ulcer | 162 | 176 | 229 | 50 | 54 | 70 |
| Cirrhosis of liver | 122 | 126 | 132 | 38 | 39 | 40 |
| Nephritis, nephrotic syndrome and nephrosis | 197 | 183 | 201 | 61 | 56 | 61 |
| Congenital anomalies | 226 | 212 | 216 | 70 | 65 | 66 |
| Birth injury, difficult labour, other anoxic and hypoxic conditions, and other causes of perinatal mortality | 168 | 129 | 134 | 52 | 40 | 41 |
| All other diseases | 2,022 | 2,093 | 2,283 | 627 | 642 | 696 |
| Motor vehicle accidents | 647 | 710 | 747 | 201 | 218 | 228 |
| All other accidents | 600 | 610 | 731 | 186 | 187 | 223 |
| Suicide and self-inflicted injury | 352 | 389 | 338 | 109 | 119 | 103 |
| All other external causes | 81 | 62 | 109 | 25 | 19 | 33 |
| Total, all causes of death | 26 007 | 25 383 | 27 484 | 8 063 | 7 790 | 8 382 |
Ischaemic heart disease, malignant neoplasms (cancer), and cerebrovascular disease were again the leading causes of death in 1985 (the latest year for which data are available) and collectively accounted for approximately 60 percent of all deaths: ischaemic heart disease accounted for 27 percent of deaths, malignant neoplasms for 22 percent, and cerebrovascular disease for approximately 10 percent.
Further statistics on causes of death can be found in section 8.4, Accidents. For general health statistics see section 8.3, Hospitals.
In New Zealand in 1985 nearly one death in four was caused by cancer. The cancer crude death rate has increased over the latest seven years for which figures are available, from 171.7 per 100 000 population in 1979 to 180.7 in 1984, and 188.1 in 1985.
A detailed report on cancer mortality and morbidity in New Zealand is published annually by the National Health Statistics Centre. It covers mortality from cancer and surveys all cases reported to the National Cancer Registry.
Ninety-three percent of deaths from cancer during 1985 were at 45 years of age or above, and 63 percent were at 65 years of age or above. The lungs continue to be the major site in male deaths from cancer and 6 percent of all male deaths in 1985 were caused by lung cancer. The breasts are the major cancer site in females and accounted for 4 percent of all female deaths.
Table 8.7. DEATHS FROM CANCER, 1985
| Males | Females | |||||
|---|---|---|---|---|---|---|
| Age groups, in years | Numbers | Rate per 100,000 of population at ages given | Percentage of total deaths at ages given | Numbers | Rate per 100,000 of population at ages given | Percentage of total deaths at ages given |
| Source: National Health Statistics Centre. | ||||||
| Under 5 | 8 | 6.2 | 2.1 | 8 | 6.5 | 2.7 |
| 5–14 | 13 | 4.6 | 12.9 | 16 | 5.9 | 20.3 |
| 15–24 | 18 | 5.9 | 3.8 | 17 | 5.8 | 10.2 |
| 25–44 | 154 | 32.7 | 20.1 | 192 | 40.6 | 40.5 |
| 45–64 | 1,010 | 338.5 | 30.7 | 863 | 291.4 | 44.3 |
| 65 and over | 2,115 | 1 506.9 | 22.2 | 1,753 | 894.4 | 17.6 |
| All ages | 3 318 | 203.9 | 22.8 | 2 849 | 172.5 | 22.0 |
Table 8.8. DEATHS FROM CANCER AT SELECTED SITES
| Numbers | Rates per million mean population | ||||||
|---|---|---|---|---|---|---|---|
| Site | Sex | 1983 | 1984 | 1985 | 1983 | 1984 | 1985 |
| Source: National Health Statistics Centre. | |||||||
| Buccal cavity and pharynx | M | 64 | 69 | 74 | 40 | 43 | 45 |
| F | 24 | 33 | 33 | 15 | 20 | 20 | |
| Oesophagus | M | 77 | 75 | 101 | 48 | 46 | 62 |
| F | 55 | 46 | 52 | 34 | 28 | 31 | |
| Stomach | M | 195 | 200 | 206 | 122 | 124 | 127 |
| F | 156 | 119 | 119 | 96 | 73 | 72 | |
| Large intestine | M | 296 | 294 | 302 | 185 | 182 | 186 |
| F | 360 | 325 | 338 | 222 | 198 | 205 | |
| Rectum | M | 147 | 177 | 180 | 92 | 109 | 111 |
| F | 112 | 119 | 116 | 69 | 73 | 70 | |
| Bronchus, trachea, and lung | M | 948 | 975 | 866 | 591 | 602 | 532 |
| F | 291 | 307 | 331 | 179 | 187 | 200 | |
| Breast | M | 4 | 2 | 1 | 2 | 1 | 1 |
| F | 537 | 504 | 565 | 331 | 307 | 342 | |
| Cervix uteri | F | 90 | 98 | 97 | 55 | 60 | 59 |
| Corpus uteri | F | 57 | 51 | 47 | 35 | 31 | 28 |
| Ovary, fallopian tube, and broad ligament | F | 164 | 150 | 153 | 101 | 91 | 93 |
| Prostate | M | 325 | 335 | 351 | 203 | 207 | 216 |
| Bladder and other urinary organs | M | 160 | 164 | 181 | 100 | 101 | 111 |
| F | 80 | 67 | 103 | 49 | 41 | 62 | |
| Skin, all forms | M | 98 | 115 | 127 | 61 | 71 | 78 |
| F | 60 | 86 | 74 | 37 | 52 | 45 | |
| Brain | M | 96 | 86 | 95 | 60 | 53 | 58 |
| F | 60 | 83 | 76 | 37 | 51 | 46 | |
| Lymphosarcoma and reticulum-cell sarcoma | M | 31 | 27 | 30 | 19 | 17 | 18 |
| F | 31 | 21 | 24 | 19 | 13 | 15 | |
| Leukaemia | M | 122 | 108 | 103 | 76 | 67 | 63 |
| F | 102 | 78 | 100 | 63 | 48 | 61 | |
| All other and unspecified sites | M | 603 | 610 | 723 | 376 | 377 | 444 |
| F | 592 | 564 | 591 | 365 | 344 | 358 | |
| Total cancer deaths | M | 3 166 | 3 237 | 3 318 | 1 975 | 2 000 | 2 039 |
| F | 2 771 | 2 651 | 2 849 | 1 708 | 1 616 | 1 725 | |
An infant death is defined as a live-born infant dying before the first year of life is completed. A neonatal death is defined as the death of a live-born infant before the 28th day of life; a post-neonatal death as the death of a live-born infant between the 28th day and the first year of life. Perinatal deaths consist of stillbirths and deaths in the first week of life. The late foetal death (stillbirths) and the perinatal mortality rate are calculated per 1000 total births (stillbirths plus live births), while the death rate for neonatal and infant death is calculated per 1000 live births.
Table 8.9. MAORI AND NON-MAORI PERINATAL MORTALITY RATES, 1985*
| Maori | Non-Maori | Total population | ||||
|---|---|---|---|---|---|---|
| Category of death | No. | Rate | No. | Rate | No. | Rate |
*Per 1000 total births (stillbirths plus live births). Source: National Health Statistics Centre. | ||||||
| Late foetal | 28 | 4.3 | 234 | 5.1 | 262 | 5.0 |
| Early neonatal | 26 | 4.0 | 174 | 3.8 | 200 | 3.9 |
| Perinatal | 54 | 8.3 | 408 | 9.0 | 462 | 8.9 |
| Neonatal | 33 | 5.1 | 210 | 4.6 | 243 | 4.7 |
| Post-neonatal | 67 | 10.4 | 254 | 5.6 | 321 | 6.2 |
| Infant | 100 | 15.5 | 464 | 10.2 | 564 | 10.9 |
Table 8.10. INFANT MORTALITY RATES FOR SELECTED COUNTRIES*
| Age of child | ||||||
|---|---|---|---|---|---|---|
| Country | Year | Under 1 year | Under 1 day | 1-7 days | 7-28 days | 28 days to 1 year |
* Per 1000 live births. † Later years not available. Sources: World Health Statistics Annual 1986; Deaths. Australian Bureau of Statistics 1985; Childhood Mortality Statistics, England and Wales 1985. | ||||||
| Australia | 1985 | 9.9 | 3.2 | 1.7 | 1.2 | 3.7 |
| Denmark | 1984† | 7.7 | 2.2 | 1.7 | 0.8 | 3.0 |
| England and Wales | 1985 | 9.4 | 2.5 | 1.9 | 1.0 | 4.0 |
| Netherlands | 1984† | 8.9 | 2.0 | 2.1 | 1.0 | 3.8 |
| Norway | 1984† | 8.3 | 2.3 | 1.5 | 0.6 | 3.9 |
| Sweden | 1984† | 6.4 | 1.4 | 1.9 | 0.8 | 2.3 |
| New Zealand | 1985 | 10.9 | 2.4 | 1.4 | 0.8 | 6.2 |
The principal causes of infant mortality are shown in table 8.11. The cause of death has been selected according to the main disease affecting the neonate with a specific code for sudden infant death syndrome.
Table 8.11. PRINCIPAL CAUSES OF INFANT MORTALITY FOR MAORI AND NON-MAORI, 1985
| Maori | Non-Maori | Total population | ||||
|---|---|---|---|---|---|---|
| Cause of death | Number of deaths | Rate per 1000 live births | Number of deaths | Rate per 1000 live births | Number of deaths | Rate per 1000 live births |
*Excludes 25 sudden infant deaths (3 Maori and 22 non-Maori) where another condition was also present at time of death and, in accordance with WHO ICD coding rules, death was classified to that other condition. Source: National Health Statistics Centre. | ||||||
| Infectious and parasitic diseases | 2 | 0.3 | 14 | 0.3 | 16 | 0.3 |
| Malignant neoplasm | - | - | 1 | 1 | ||
| Diseases of the nervous system | 3 | 0.5 | 12 | 0.3 | 15 | 0.3 |
| Diseases of the circulatory system | 1 | 0.2 | 1 | 2 | ||
| Diseases of the respiratory system | 10 | 1.5 | 33 | 0.7 | 43 | 0.8 |
| Diseases of the digestive system | 1 | 0.2 | 3 | 0.1 | 4 | 0.1 |
| Congenital anomalies | 11 | 1.7 | 119 | 2.6 | 130 | 2.5 |
| Perinatal causes— | ||||||
| Birth injury | 5 | 0.1 | 5 | 0.1 | ||
| Hyaline membrane disease | 8 | 1.2 | 25 | 0.6 | 33 | 0.6 |
| Other anoxic and hypoxic conditions | 1 | 0.2 | 15 | 0.3 | 16 | 0.3 |
| Immaturity | 5 | 0.8 | 22 | 0.5 | 27 | 0.5 |
| Other perinatal causes | 6 | 0.9 | 47 | 1.0 | 53 | 1.0 |
| Sudden infant death syndrome* | 48 | 7.4 | 145 | 3.2 | 193 | 3.7 |
| Accidents, poisonings, and violence (external causes) | 4 | 0.6 | 11 | 0.2 | 15 | 0.3 |
| Remainder (all other causes) | - | - | 11 | 0.2 | 11 | 0.2 |
| Total, all infant deaths under one year | 100 | 15.5 | 464 | 10.2 | 564 | 10.9 |
The New Zealand Maternal Mortality Research Amendment Act of 1979 defines a maternal death as:
A death that occurs during pregnancy or within three months of the conclusion of a pregnancy; or
A death of a woman who at the time of her death was suffering from chorionepithelioma or hydatidiform mole.
This definition is for national use only and covers a wider range of cases than the maternal mortality definition recommended by the World Health Organisation. Maternal deaths from complications of pregnancy, childbirth and the puerperium numbered eight in 1985, with a rate of 1.5 per 10 000 live births.
Maternal deaths occurring during pregnancy or within three months of delivery, but not due to complications of pregnancy or childbirth of the puerperium numbered seven in 1985 with a rate of 1.4 per 10 000 live births.
Abortion is permitted by New Zealand law in certain circumstances. The main conditions required are that the gestation of the pregnancy is not more than 20 weeks and that continuation of the pregnancy would result in serious danger (not being danger normally associated with childbirth) to the life, or to the physical or mental health of the woman or girl; or that there is a substantial risk that the child, if born, would be so physically or mentally abnormal as to be seriously handicapped. The Crimes Act 1961 (as amended) sets out when an abortion would be unlawful.
The Contraception, Sterilisation and Abortion Act 1977 sets out the referral procedure where a woman seeks an abortion. It also sets out the requirements when a case is determined. If, after consideration of a case, two specially appointed consultants both believe that the provisions of the law can be met, an authorising certificate is issued.
To supervise the workings of the abortion law a three-member committee, known as the Abortion Supervisory Committee, was established under the Act.
New Zealand's abortion law is kept under review by the committee, which also licenses institutions for the performance of abortions, appoints certifying consultants to consider cases, and liaises with all those providing facilities, both public and private.
Counselling advisers also monitor counselling services for women seeking advice about their pregnancy and keep the committee informed on related issues.
Table 8.12. ABORTIONS ACCORDING TO AGE GROUP
| 1984 | 1985 | 1986 | ||||
|---|---|---|---|---|---|---|
| Age group | Percentage | Number | Percentage | Number | Percentage | Number |
| Source: Abortion Supervisory Committee. | ||||||
| 11 | 0.78 | .. | .. | |||
| 12 | 2 | 0.01 | 1 | .. | ||
| 13 | 6 | 0.11 | 8 | 0.06 | 5 | |
| 14 | 49 | 0.80 | 57 | 0.63 | 51 | |
| 15 | 23.79 | 169 | 1.98 | 141 | 1.89 | 152 |
| 16 | 298 | 3.96 | 282 | 3.80 | 306 | |
| 17 | 363 | 4.98 | 355 | 4.82 | 388 | |
| 18 | 434 | 6.12 | 436 | 5.65 | 455 | |
| 19 | 467 | 6.27 | 447 | 5.98 | 482 | |
| 20–24 | 30.60 | 2,226 | 30.46 | 2,172 | 30.30 | 2,441 |
| 25–29 | 20.76 | 1,510 | 21.26 | 1,516 | 21.80 | 1,756 |
| 30–34 | 13.65 | 993 | 13.52 | 964 | 13.89 | 1,119 |
| 35–39 | 8.00 | 582 | 8.20 | 585 | 8.71 | 702 |
| 40–44 | 2.17 | 158 | 2.22 | 158 | 2.17 | 175 |
| 45 and over | 0.25 | 18 | 0.11 | 8 | 0.30 | 24 |
| Total | 100.00 | 7 275 | 100.00 | 7 130 | 100.00 | 8 056 |
Table 8.13. GROUNDS ON WHICH ABORTIONS WERE AUTHORISED
| Grounds | 1984 | 1985 | 1986 |
|---|---|---|---|
| Source: Abortion Supervisory Committee. | |||
| Serious danger to physical health | 29 | 20 | 22 |
| Serious danger to mental health | 6,965 | 6,901 | 7,839 |
| Combination of serious danger to physical and mental health | 174 | 110 | 101 |
| Substantial risk of abnormal child | 50 | 42 | 36 |
| Incest | 3 | 3 | 3 |
| Offence under s. 131 Crimes Act | 1 | .. | .. |
| Mother severely subnormal | 1 | 3 | 2 |
| Serious danger to mental health and risk of abnormal child | 42 | 40 | 42 |
| Serious danger to physical and mental health and substantial risk of abnormal child | 4 | 2 | .. |
| Serious danger to mental health and offence under s. 131 Crimes Act | 4 | 3 | 2 |
| Serious danger to mental health and woman severely subnormal | 2 | 2 | .. |
| Other multiple grounds | - | 4 | 9 |
| Total | 7 275 | 7 130 | 8 056 |
| Factors taken into account: | |||
| The age of the woman | 1,082 | 736 | 761 |
| Alleged rape | 68 | 54 | 82 |
| Combination of the age of woman and alleged rape | 10 | 2 | 11 |
Table 8.14. ABORTION RATES AND RATIOS: NEW ZEALAND AND OTHER LOW FERTILITY COUNTRIES
| Rate per 1000 | Ratio per 1000 | ||||
|---|---|---|---|---|---|
| Country* | Year | Total population | Women 15–44 | Births | Births plus abortions |
*With the exception of New Zealand, Sweden, England and Wales data have been obtained from the Alan Guttmacher Institute. Source: Abortion Supervisory Committee. | |||||
| New Zealand | 1984 | 2.2 | 9.6 | 140 | 123 |
| 1985 | 2.2 | 9.3 | 139 | 122 | |
| 1986P | 2.5 | 10.5 | 148 | 129 | |
| Australia P | 1984 | 3.5 | 15.2 | 227 | 185 |
| Canada | 1984 | 2.5 | 10.2 | 165 | 142 |
| England and Wales P | 1985 | 2.8 | 13.1 | 214 | 176 |
| France | 1984 | 3.2 | 14.9 | 233 | 189 |
| German Federal Republic | 1984 | 1.4 | 6.4 | 149 | 129 |
| Japan | 1983 | 4.8 | 21.5 | 373 | 272 |
| Netherlands (residents only) | 1984 | 1.3 | 5.6 | 107 | 97 |
| Singapore | 1983 | 7.6 | 28.1 | 471 | 320 |
| Sweden | 1985 | 3.7 | 17.7 | 313 | 239 |
| United States | 1983 | 6.5 | 27.4 | 416 | 294 |
New Zealand's public hospitals and hospital-based services are provided and maintained by democratically elected hospital boards and area health boards. The responsibilities of these boards, the Department of Health and the Minister of Health are set out in the Hospitals Act 1957 and the Area Health Boards Act 1983. The provision of private hospitals is also encouraged.
The role of the Department of Health is to advise the minister on, or determine in respect of boards, the extent and standard of hospital and allied services, the building requirements to provide these services, the numbers and levels of the main groups of professional staff to be employed, the appropriate annual financial grants, and the measure of financial assistance to be given to private hospitals (including loan finance). The department also licenses and supervises private hospitals, inspects the work of all hospitals, and compiles financial and statistical data about them. There are 25 hospital boards, four area health boards and 173 private hospitals.
Hospital treatment in public hospitals is free. Private hospitals, which provide about one-fifth of the available beds, receive partial payment from the state for treatment of certain categories of patient; additional fees may be claimed from the patients. Hospital and home nursing services involve the Department of Health in establishing and helping to maintain minimum standards of nursing service in institutions such as general hospitals and homes for the aged; in advising, inspecting and reporting on such services in hospitals; and advising the Minister of Health on nursing.
Advisory boards, committees and councils also help prepare health policies and programmes and, in certain cases, to administer government policies or programmes. Such agencies enable the minister and the Department of Health to draw on expert advice and wide experience. They also ensure that non-departmental people with up-to-date knowledge, experience, and responsibility in particular areas of health play a worthwhile part in health administration. A partnership of this kind is particularly important in the case of public hospitals and is recognised by a requirement of the Hospitals Act that the Minister of Health may not act in certain public hospital matters without a recommendation from the Hospitals Advisory Council.
At 31 March 1987 there were 171 public hospitals providing 24 488 beds throughout New Zealand. If the beds in licensed private hospitals are included, the number of general beds per 1000 of population is 6.1.
A total of 448 033 inpatient and long-stay admissions to public hospitals was recorded for the year ended 31 March 1987. This figure, which included people in surgical, medical, maternity, and psychiatric beds and non-hospital beds in old people's homes, was equivalent to 13.5 percent of the population. The 1984–85 figure was 442 129, and the 1985–86 figure was 428 661.
Outpatient and daypatient attendances (excluding X-ray, laboratory and pharmacy diagnostic services) at public hospitals totalled 4 370 685 and 352 313 respectively for the year ended 31 March 1987, compared with 4 214 177 and 324 009 for the previous year.
As at 31 March 1987 there were 50 804 names on waiting lists for admission to public hospitals. This compares with 50 454 on waiting lists at 31 March 1986.
Table 8.15. BEDS IN PUBLIC INSTITUTIONS, 1987*
| Beds available | Average number of occupied beds per day | |||
|---|---|---|---|---|
| Type of bed | Number | Proportion per 1000 of population | Number | Proportion per 1000 of population |
*Year ended 31 March. Source: National Health Statistics Centre. | ||||
| General | 14,078 | 4.2 | 10,730 | 3.2 |
| Maternity | 2,054 | 0.6 | 1,141 | 0.3 |
| Psychiatric and intellectually handicapped | 7,548 | 2.3 | 6,357 | 1.9 |
| Total hospital beds | 23 680 | 7.1 | 18 228 | 5.5 |
| Non-hospital beds | 808 | 0.2 | 789 | 0.2 |
| Total | 24 488 | 7.4 | 19 017 | 5.7 |
At 31 March 1987 the 173 licensed private hospitals provided a total of 6157 beds.
Table 8.16. PRIVATE HOSPITAL BEDS*
| Number of hospitals | Licensed beds | |||||
|---|---|---|---|---|---|---|
| Type of hospital | 1985 | 1986 | 1987 | 1985 | 1986 | 1987 |
* As at 31 March. Source: National Health Statistics Centre. | ||||||
| Maternity | 3 | 1 | 1 | 19 | 3 | 3 |
| Medical and surgical | 17 | 16 | 25 | 641 | 624 | 906 |
| Medical, surgical and/or geriatric | 153 | 150 | 146 | 5,119 | 5,313 | 5,146 |
| Maternity, medical, and surgical | 1 | 1 | 1 | 102 | 102 | 102 |
| Psychiatric/geriatric | 1 | - | - | 37 | - | - |
| Total | 175 | 168 | 173 | 5 918 | 6 042 | 6 157 |
Table 8.17. STAFF EMPLOYED BY HOSPITAL BOARDS AND IN HOSPITALS UNDER THE CONTROL OF THE DEPARTMENT OF HEALTH
| As at 31 March* | ||||
|---|---|---|---|---|
| Category of staff | 1984 | 1985 | 1986 | 1987 |
*All figures based on full-time equivalents. Source: National Health Statistics Centre. | ||||
| Medical | 2 632.0 | 2 588.3 | 2 733.4 | 3 023.3 |
| Dietitians | 142.9 | 150.5 | 146.5 | 143.0 |
| Laboratory technologists | 549.8 | 576.8 | 613.5 | 609.6 |
| Occupational therapists | 423.7 | 406.6 | 411.6 | 426.1 |
| Physiotherapists | 520.6 | 525.2 | 500.3 | 502.3 |
| Radiographers | 496.8 | 537.6 | 537.4 | 542.9 |
| Hospital scientific officers | 86.3 | 103.1 | 99.5 | 100.6 |
| Social workers | 497.3 | 518.8 | 526.1 | 535.7 |
| Other staff (professional and technical) | 2 862.0 | 2 859.8 | 2 940.7 | 3 022.0 |
| Nursing staff (qualified) | 15 578.7 | 16 103.4 | 16 385.6 | 17 391.3 |
| Nursing staff (unqualified) | 3 664.1 | 3 439.0 | 3 486.1 | 3 414.8 |
| Nursing students | 3 389.8 | 2 626.6 | 2 027.6 | 1 622.9 |
| Students, other | 663.3 | 629.8 | 606.2 | 582.9 |
| Administration and clerical staff | 5 711.6 | 5 737.7 | 5 903.3 | 6 098.7 |
| Other | 11 605.3 | 11 509.4 | 11 356.6 | 11 180.5 |
| Total | 48 824.2 | 48 312.6 | 48 274.4 | 49 196.6 |
Hospital board expenditure is controlled by the Minister of Health. Funding for public hospital maintenance is allocated to the individual hospital boards on the basis of allocations made in the previous year, adjusted to take account of known increases in salary and wage rates and prices. Additional grants are made, when necessary, for general wage increases which may be approved after the basic allocation has been made. In general, major works are financed by loans raised by hospital boards, interest and principal repayments being met by government grants. Recent adjustments to hospital and area health board financing are described in section 8.1, Organisation of health services.
Table 8.18. HOSPITAL BOARD BORROWING
| Year | Amount uplifted | Repayment* | Balance owing |
|---|---|---|---|
* Includes payments from sinking funds. Source: Department of Health. | |||
| $(000) | |||
| 1982–83 | 54,114 | 40,233 | 486,014 |
| 1983–84 | 66,116 | 37,497 | 513,057 |
| 1984–85 | 66,460 | 46,401 | 535,628 |
| 1985–86 | 47,119 | 65,781 | 519,023 |
| 1986–87 | 38,376 | 78,604 | 477,977 |
Table 8.19. GRANTS TO HOSPITAL/AREA HEALTH BOARDS
| Grants to hospital boards | 1983–84 | 1984–85 | 1985–86 | 1986–87 |
|---|---|---|---|---|
| Source: Department of Health. | ||||
| Grants allocated directly | $(000) | |||
| Operating grants— | ||||
| Salaries and wages | 911,797 | 916,024 | 948,445 | 1,273,498 |
| Other | 250,859 | 277,296 | 319,337 | 392,206 |
| Subtotal | 1,162,656 | 1,193,320 | 1,267,782 | 1,665,704 |
| $(000) | ||||
| Supplementary grants | ||||
| Reserve for salary and wage increases | 1,507 | 22,174 | 180,256 | 208,002 |
| Loans—Repayments and payments into | ||||
| sinking fund | 40,905 | 50,305 | 56,158 | 73,579 |
| —Net interest | 52,159 | 56,220 | 51,670 | 57,638 |
| Community care— | ||||
| Health centres | 57 | 422 | 57 | 24 |
| Equipment for national and regional specially services | 1,595 | 1,399 | 5,307 | 3,497 |
| Geriatric hospital patient assistance | 14,783 | 17,236 | 22,726 | 41,785 |
| Subtotal | 111,006 | 147,756 | 316,174 | 384,525 |
| Total | 1,273,662 | 1,341,076 | 1,583,956 | 2,050,229 |
Detailed statistical information is supplied to the Department of Health about all patients discharged from, or dying in, public hospitals in New Zealand.
Table 8.21 shows the principal diseases and injuries treated in public hospitals in 1986, together with average days stay and conditions as a percentage of total cases. The disease headings are the 50 disease group categories of the International Classification of Diseases.
Hospital returns show each disease for which the patient was treated while in hospital, but the classification for statistical purposes has been made on the basis of the principal condition for which the patient was admitted, regardless of what other unrelated diseases may have been present or developed during the stay in hospital.
The average length of stay in public hospitals in 1986 was 10.1 days. Among sufferers from specified diseases, the longest average stays were made by those with psychoses and cerebrovascular disease (both 60 days) followed by patients with other diseases of the nervous system (33 days).
Table 8.20. AGE AND SEX OF PATIENTS IN PUBLIC HOSPITALS. 1986
| Age group | Males | Females | Total |
|---|---|---|---|
| Source: National Health Statistics Centre. | |||
| 0–4 | 26,475 | 19,340 | 45,815 |
| 5–9 | 9,344 | 6,433 | 15,777 |
| 10–14 | 7,996 | 6,442 | 14,438 |
| 15–19 | 10,748 | 18,398 | 29,146 |
| 20–24 | 10,506 | 36,344 | 46,850 |
| 25–29 | 8,506 | 43,307 | 51,813 |
| 30–34 | 7,094 | 27,447 | 34,541 |
| 35–39 | 6,664 | 15,077 | 21,741 |
| 40–44 | 6,238 | 8,824 | 15,062 |
| 45–49 | 6,485 | 7,570 | 14,055 |
| 50–54 | 7,358 | 7,331 | 14,689 |
| 55–59 | 10,030 | 7,79 | 17,821 |
| 60–64 | 11,523 | 8,707 | 20,230 |
| 65–69 | 11,822 | 9,812 | 21,634 |
| 70–74 | 12,010 | 10,985 | 22,995 |
| 75–79 | 10,344 | 10,631 | 20,975 |
| 80–84 | 6,258 | 8,284 | 14,542 |
| 85 and over | 3,707 | 7,287 | 10,994 |
| Total | 173 108 | 260 010 | 433 118 |
Table 8.21. DISEASES AND CONDITIONS TREATED IN PUBLIC HOSPITALS (INCLUDING READMISSIONS) DURING 1986
| Diagnostic group | Total discharges or deaths in public hospitals | Percentage of all cases | Average stay (days) |
|---|---|---|---|
* Carcinoma-in-situ, and malignant neoplasm of lymphatic and heamatopoietic tissue. † Neoplasms of uncertain behaviour and neoplasms of unspecified nature. ‡ Includes diseases of veins and lymphatics. Source: National Health Statistics Centre. | |||
| Infectious and parasitic diseases (except tuberculosis) | 8,488 | 2.0 | 6.2 |
| Tuberculosis | 321 | 0.1 | 14.7 |
| Malignant neoplasms* | 24,855 | 5.7 | 12.3 |
| Benign neoplasms† | 4,571 | 1.1 | 6.9 |
| Disorders of thyroid gland | 507 | 0.1 | 8.1 |
| Diabetes mellitus | 3,062 | 0.7 | 20.4 |
| Other endocrine, nutritional, metabolic and immunity disorders | 1,820 | 0.4 | 13.1 |
| Diseases of blood and blood-forming organs | 2,596 | 0.6 | 8.2 |
| Psychoses | 4,332 | 1.0 | 60.2 |
| Other mental disorders | 5,300 | 1.2 | 17.3 |
| Disorders of the eye and adnexa | 6,431 | 1.5 | 5.6 |
| Diseases of ear and mastoid process | 4,486 | 1.0 | 3.5 |
| Other diseases of the nervous system | 6,459 | 1.5 | 33.2 |
| Acute rheumatic fever and chronic rheumatic heart disease | 722 | 0.2 | 16.3 |
| Ischaemic heart disease | 15,022 | 3.5 | 10.4 |
| Hypertensive disease and other forms of heart disease | 10,235 | 2.4 | 13.2 |
| Cerebrovascular disease | 7,395 | 1.7 | 60.2 |
| Diseases of arteries, arterioles and capillaries | 3,751 | 0.9 | 16.6 |
| Other diseases of circulatory system‡ | 5,326 | 1.2 | 7.6 |
| Acute respiratory infections and influenza | 5,873 | 1.4 | 3.7 |
| Pneumonia | 5,004 | 1.2 | 21.9 |
| Chronic obstructive pulmonary disease and allied conditions | 17,466 | 4.0 | 6.5 |
| Chronic disease of tonsils and adnoids | 3,484 | 0.8 | 2.7 |
| Other diseases of respiratory system | 5,080 | 1.2 | 6.8 |
| Diseases of oral cavity, salivary glands and jaws | 2,689 | 0.6 | 2.1 |
| Diseases of oesophagus, stomach and duodenum | 4,618 | 1.1 | 7.2 |
| Appendicitis | 4,342 | 1.0 | 5.2 |
| Hernia of abdominal cavity | 4,243 | 1.0 | 5.0 |
| Non-infective enteritis and colitis and other diseases of intestines and peritoneum | 6,755 | 1.6 | 9.2 |
| Other diseases of digestive system | 5,730 | 1.3 | 10.0 |
| Diseases of urinary system | 6,816 | 1.6 | 8.7 |
| Diseases of male genital organs | 3,985 | 0.9 | 6.0 |
| Diseases of breast and inflammatory disease of female pelvic organs | 4,255 | 1.0 | 3.5 |
| Other disorders of female genital tract | 10,982 | 2.5 | 4.1 |
| Complications of pregnancy, childbirth and the puerperium (except abortion) | 66,434 | 15.3 | 5.9 |
| Pregnancy with abortive outcome | 8,084 | 1.9 | 2.1 |
| Diseases of skin and subcutaneous tissue | 6,097 | 1.4 | 9.1 |
| Arthropathies and related disorders, dorsopathies and rheumatism except rheumatic fever | 13,627 | 3.1 | 13.2 |
| Osteopathies, chondropathies and acquired musculoskeletal deformities | 2,369 | 0.5 | 16.3 |
| Congenital anomalies | 6,252 | 1.4 | 8.5 |
| Certain conditions originating in the perinatal period | 8,521 | 2.0 | 10.2 |
| Symptoms, signs and ill-defined conditions | 23,722 | 5.5 | 7.5 |
| Fractures | 18,769 | 4.3 | 14.6 |
| Dislocations, sprains and strains of joints and adjacent muscles | 2,596 | 0.6 | 5.2 |
| Intracranial injury (except skull fracture) | 7,462 | 1.7 | 3.3 |
| Laceration and open wound | 6,974 | 1.6 | 5.1 |
| Burns | 1,348 | 0.3 | 12.9 |
| Poisoning by drugs, medicaments and non-medicinal substances | 4,011 | 0.9 | 3.2 |
| Other injuries and adverse effects, and late effects of injuries | 14,194 | 3.3 | 9.4 |
| Special admissions without current complaint or reported diagnosis and for elective procedures | 35,657 | 8.2 | 6.7 |
| All conditions | 433 118 | 100.0 | 10.1 |
During 1986 the two largest categories of accidents came under the headings ‘accidental falls’ and ‘other accidents’ (which includes, for instance, accidents caused by cutting and piercing instruments, machinery, falling objects, fire and hot objects. Victims of accidental falls also had the longest aggregate stay in hospital. This was because of the long period spent in hospital by elderly people who have sustained fractures of the femur in falls. More than one in four patients had been injured in a fall of some kind.
Motor-vehicle traffic accidents were the fourth largest group and had the second largest aggregate stay.
Table 8.22. ACCIDENT CASES TREATED AS INPATIENTS IN PUBLIC HOSPITALS (INCLUDING READMISSIONS), 1986
| Type of accident | Total cases | Percentage of all accident cases | Average stay (days) | Aggregate stay (days) | Aggregate stay as percentage of total |
|---|---|---|---|---|---|
| Source: National Health Statistics Centre. | |||||
| Transport— | |||||
| Railway | 35 | 0.1 | 11.6 | 406 | 0.1 |
| Motor vehicle traffic | 10,544 | 17.6 | 10.6 | 112,126 | 18.1 |
| Motor vehicle non-traffic | 734 | 1.2 | 7.6 | 5,543 | 0.9 |
| Other road vehicles | 2,190 | 3.7 | 4.5 | 9,748 | 1.6 |
| Water | 197 | 0.3 | 5.0 | 982 | 0.2 |
| Air | 99 | 0.2 | 13.1 | 1,299 | 0.2 |
| Vehicle accidents not elsewhere classifiable | 9 | 8.1 | 73 | ||
| Subtotal, transport | 13 808 | 23.1 | 9.4 | 130 177 | 21.0 |
| Non-transport— | |||||
| Accidental poisoning | 1,208 | 2.0 | 1.9 | 2,271 | 0.4 |
| Accidental falls | 14,690 | 24.6 | 15.7 | 230,082 | 37.1 |
| Surgical and medical complications and misadventures | 6,699 | 11.2 | 13.9 | 93,014 | 15.0 |
| Late effects of accidental injury | 3,579 | 6.0 | 14.8 | 53,139 | 8.6 |
| Adverse effects of drugs, medicaments, and biological substances | 1,414 | 2.4 | 10.1 | 14,250 | 2.3 |
| Suicide and self inflicted injury | 2,753 | 4.6 | 4.9 | 13,403 | 2.2 |
| Homicide and injury purposely inflicted by other persons | 2,423 | 4.1 | 3.7 | 8,986 | 1.4 |
| Legal intervention | 11 | 5.5 | 60 | ||
| Injury undetermined whether accidentally or purposely inflicted | 310 | 0.5 | 3.6 | 1,122 | 0.2 |
| Injury resulting from operations of war | 5 | 17.0 | 85 | ||
| Other accidents | 12,853 | 21.5 | 5.7 | 73,415 | 11.8 |
| Subtotal, non-transport | 45 945 | 76.9 | 10.7 | 489 827 | 79.0 |
| Total | 59 753 | 100.0 | 10.4 | 620 004 | 100.0 |
A high percentage of non-transport accidents, especially those involving young children and elderly people, occur at home. Domestic accidents in 1986 are included by type of accident in the previous section, but they are not separated out from accidents sustained elsewhere. Table 8.23 shows the number of patients discharged from, or dying in, public hospitals after treatment for injuries from accidents at home. It includes only inpatients in public hospitals, not the large numbers of home accident cases treated in outpatient departments, doctor's surgeries, and at home.
Table 8.23. INPATIENTS IN PUBLIC HOSPITALS AFTER ACCIDENTS AT HOME, 1986
| Cause of accident | Total patients | Aggregate stay (days) |
|---|---|---|
*Not comparable with 1985 figures which were incorrectly coded. Source: National Health Statistics Centre. | ||
| Accidental poisoning by— | ||
| Drugs and medicaments | 594 | 1,026 |
| Petroleum products and other solvents | 119 | 177 |
| Agricultural and horticultural preparations other than plant foods or fertilisers | 73 | 96 |
| Noxious foodstuffs and poisonous plants | 43 | 51 |
| Other solid and liquid substances* | 153 | 360 |
| Gases and vapours | 15 | 53 |
| Accidental falls | 6,197 | 102,825 |
| Struck by falling objects | 103 | 894 |
| Accidents caused by cutting and piercing instruments | 1,599 | 6,033 |
| Accidental burns | 854 | 12,540 |
| Accidents caused by foreign bodies | 628 | 1,171 |
| All other and unspecified accidents | 1,625 | 9,697 |
| Total | 12 003 | 134 923 |
For further accident statistics, see section 8.4, Accidents.
Psychiatric hospitals and hospitals for the intellectually handicapped (except Lake Alice Hospital, Marton, which provides for security patients from throughout the country) are controlled by hospital and area health boards. The Mental Health Act 1969 transferred control from the Department of Health to boards from 1 April 1972. Since 1978 the funding of these hospitals has been fully integrated with that of public hospitals and separate data relating to the funding of psychiatric hospitals and hospitals for the intellectually handicapped are not available.
A detailed report, Mental Health Data, is published annually by the National Health Statistics Centre. It contains administrative and clinical data about first admissions and readmissions (including replacements from leave), discharges, and deaths for all inpatients under psychiatric care. The report also presents information about psychiatric disorders in terms of age and sex, place of residence, ethnicity and length of stay.
Table 8.24. PSYCHIATRIC AND INTELLECTUALLY HANDICAPPED PATIENTS: NUMBERS AND RATES (PER 100 000 MEAN POPULATION)
| Patients in psychiatric hospitals and hospitals for the intellectually handicapped | Patients in psychiatric units of public hospitals | |||||||
|---|---|---|---|---|---|---|---|---|
| Year | Average number resident | Rate | Average number on leave* | Rate | Average number total | Rate | Average number resident | Rate |
*Refers only to committed and special patients. Source: National Health Statistics Centre. | ||||||||
| 1982 | 7,129 | 224.0 | 2,353 | 73.9 | 9,482 | 297.9 | 279 | 8.8 |
| 1983 | 6,927 | 214.5 | 2,246 | 69.5 | 9,173 | 284.0 | 296 | 9.2 |
| 1984 | 6,715 | 205.6 | 2,062 | 63.3 | 8,777 | 269.4 | 299 | 9.2 |
| 1985 | 6,463 | 197.1 | 2,019 | 61.6 | 8,482 | 258.7 | 297 | 9.1 |
| 1986 | 6,170 | 188.2 | 1,837 | 56.0 | 8,007 | 244.2 | 299 | 9.1 |
Table 8.25. RATES OF FIRST ADMISSION TO PSYCHIATRIC HOSPITALS (PER 100 000 MEAN POPULATION)
| Year | Ages | Total all ages | ||||||
|---|---|---|---|---|---|---|---|---|
| 0–9 | 10–19 | 20–29 | 50–39 | 40–49 | 50–59 | 60 and over | ||
| Source: National Health Statistics Centre. | ||||||||
| 1982— | ||||||||
| Maori | 28 | 166 | 441 | 326 | 203 | 146 | 178 | 204 |
| Non-Maori | 19 | 104 | 227 | 162 | 154 | 141 | 194 | 143 |
| 1983— | ||||||||
| Maori | 17 | 168 | 411 | 324 | 145 | 162 | 145 | 194 |
| Non-Maori | 19 | 102 | 211 | 162 | 140 | 122 | 193 | 136 |
| 1984— | ||||||||
| Maori | 16 | 168 | 433 | 320 | 190 | 90 | 115 | 199 |
| Non-Maori | 23 | 90 | 205 | 147 | 136 | 119 | 146 | 124 |
| 1985— | ||||||||
| Maori | 12 | 192 | 493 | 318 | 224 | 109 | 102 | 222 |
| Non-Maori | 17 | 110 | 206 | 149 | 118 | 102 | 150 | 125 |
| 1986— | ||||||||
| Maori | 9 | 216 | 533 | 244 | 128 | 62 | 122 | 220 |
| Non-Maori | 15 | 109 | 228 | 163 | 117 | 98 | 146 | 129 |
The total number for all admissions to psychiatric care during 1986 was 14 448. This total was made up of 4487 first admissions, and 9961 readmissions. Included in the readmission figure were 1412 patients replaced from leave. This last category applies only to people who may not discharge themselves, for example, special and committed patients.
The average number of occupied beds in psychiatric hospitals and hospitals for the intellectually handicapped in 1986 was about 1.8 per 1000 of population. This is the lowest figure recorded since 1877. The downward trend reflects advances in treatment and, in more recent years, the provision of alternative forms of care.
During 1986, 85 percent of first admissions and 71 percent of readmissions were on an informal (voluntary) basis.
Ail informal patients are discharged outright when they leave their hospital or unit. Committed patients may also be discharged outright or they may be given ‘discharge on leave’ which means that they are still legally committed and under the authority of the hospital. There is a further statistical category ‘discharged not committed’ which is equivalent to an outright discharge in that the patient is no longer legally under the authority of the hospital. The phrase simply indicates that although the patient entered hospital on a remand or three-week basis, it was not found necessary to keep him or her for a longer period as a committed patient.
During 1986 there were 14 560 discharges from psychiatric hospitals and hospitals for the intellectually handicapped, psychiatric units of public hospitals and institutions treating alcoholism and drug addiction. Of these, 8464 were discharged from psychiatric hospitals, 427 from hospitals for the intellectually handicapped, 4537 from public hospital psychiatric units, and 1132 from institutions licensed under the Alcoholism and Drug Addiction Act 1966.
Approximately six out of every 10 patients leaving hospital in 1986 had a stay of less than 30 days.
Table 8.26. DISCHARGES FROM PSYCHIATRIC HOSPITALS, 1986
| Outright | Leave | Not committed | ||||
|---|---|---|---|---|---|---|
| Diagnosis | Number | Mean stay (days) | Number | Mean stay (days) | Mean | Mean stay (days) |
| Source: National Health Statistics Centre. | ||||||
| Senile and pre-senile organic psychotic | ||||||
| conditions | 205 | 193 | 71 | 236 | - | - |
| Alcoholic psychoses | 53 | 244 | 14 | 424 | 1 | 1 |
| Drug psychoses | 77 | 19 | 18 | 79 | 2 | 13 |
| Other organic psychotic conditions | 91 | 79 | 27 | 205 | - | - |
| Schizophrenic psychoses | 1,668 | 204 | 1,053 | 185 | 25 | 17 |
| Affective psychoses | 1,966 | 50 | 501 | 102 | 3 | 12 |
| Paranoid states | 116 | 47 | 59 | 102 | ||
| Other psychoses | 322 | 40 | 102 | 171 | ||
| Neurotic depression and other depressive disorders | 1,585 | 43 | 81 | 117 | 3 | 25 |
| Other neurotic disorders | 262 | 25 | 4 | 33 | 1 | 14 |
| Alcohol dependence or abuse | 2,638 | 52 | 138 | 173 | 7 | 15 |
| Drug dependence or abuse | 507 | 29 | 23 | 41 | 9 | 11 |
| Other personality disorders | 837 | 60 | 133 | 105 | 37 | 11 |
| Stress and adjustment reactions | 652 | 30 | 20 | 77 | 1 | 8 |
| Non-psychotic disorders of childhood and adolescence | 25 | 689 | 1 | 57 | ||
| Non-psychotic mental disorders following brain damage | 24 | 143 | 11 | 421 | - | - |
| Conditions associated with physical disorders | 13 | 27 | 1 | 39 | ||
| Mental retardation | 607 | 871 | 170 | 935 | 2 | 8 |
| No psychiatric diagnosis | 273 | 19 | 32 | 1,501 | 89 | 14 |
| Total | 11 921 | 115 | 2 459 | 228 | 180 | 14 |
During 1986 the two leading short-list diagnostic reasons for entering inpatient care for all admissions were schizophrenic psychoses, and alcohol dependence and abuse.
Table 8.27. PSYCHIATRIC HOSPITAL DIAGNOSES, 1986
| Diagnosis | Totals | First admissions | Readmissions | Replacements from leave |
|---|---|---|---|---|
| Source: National Health Statistics Centre. | ||||
| Senile and pre-senile organic psychotic conditions | 403 | 278 | 101 | 24 |
| Alcoholic psychoses | 176 | 38 | 130 | 8 |
| Drug psychoses | 110 | 50 | 55 | 5 |
| Other organic psychotic conditions | 131 | 43 | 73 | 15 |
| Schizophrenic psychoses | 2,595 | 307 | 1,668 | 620 |
| Affective psychoses | 2,387 | 445 | 1,623 | 319 |
| Paranoid states | 187 | 57 | 103 | 27 |
| Other psychoses | 418 | 157 | 207 | 54 |
| Neurotic depression and other depressive disorders | 1,666 | 712 | 901 | 53 |
| Other neurotic disorders | 278 | 108 | 167 | 3 |
| Alcohol dependence or abuse | 2,504 | 936 | 1,543 | 25 |
| Drug dependence or abuse | 657 | 293 | 357 | 7 |
| Other personality disorders | 935 | 318 | 549 | 74 |
| Stress and adjustment reactions | 639 | 386 | 244 | 9 |
| Non-psychotic disorders of childhood and adolescence | 15 | 13 | 2 | - |
| Non-psychotic mental disorders following brain damage | 48 | 19 | 20 | 9 |
| Conditions associated with physical disorders | 10 | 5 | 5 | - |
| Mental retardation | 689 | 81 | 465 | 143 |
| No psychiatric diagnoses | 600 | 241 | 342 | 17 |
| Total, all cases | 14 448 | 4 487 | 8 549 | 1 412 |
Virtually all individuals resident in or visiting New Zealand are covered by a comprehensive system of accident prevention, treatment and compensation as set out in the Accident Compensation Act 1972.
The Act's three main objectives are: to promote safety in every walk of life; to promote the concept of prompt and effective rehabilitation of all people injured by accident so as to restore them to the fullest physical, mental, social, vocational, and economic usefulness of which they are capable; and to provide prompt, fair and reasonable compensation so that every accident victim will be treated according to his or her real needs.
The corporation is responsible for the administration of the Accident Compensation Act and is controlled by a board of directors with up to eight members, six of whom are appointed by the Governor-General on the recommendation of the Minister of Labour. It has a head office in Wellington, with regional and district offices throughout New Zealand and its main functions are described below:
Safety—The corporation's role is to encourage the prevention of personal injury by accident (including occupational disease) and where accidents do occur to minimise their effects. It is intended that ultimately organisations and individuals be largely self-sufficient in accident prevention.
The corporation offers advice and guidance in accident reduction and supports accident prevention research. It also conducts campaigns on specific hazards, supported by a range of accident prevention publications and resource materials. Corporation accident prevention consultants are available at a community level to assist with accident prevention activities.
Rehabilitation—The overall aim of rehabilitation is to assist injured persons to reach their maximum potential, freed as far as possible from the consequences of their accident. The corporation employs rehabilitation co-ordinators, who are located at all its offices, to help injured persons identify their needs, and to plan and co-ordinate individual rehabilitation programmes. They also liaise with hospitals, rehabilitation agencies, government departments and employer and employee organisations to assist injured persons. The corporation also arranges any special equipment and co-ordinates housing, workplace and car modifications.
The corporation provides financial assistance to promote rehabilitation and also plays an important role in stimulating, supporting and fostering additional rehabilitation facilities.
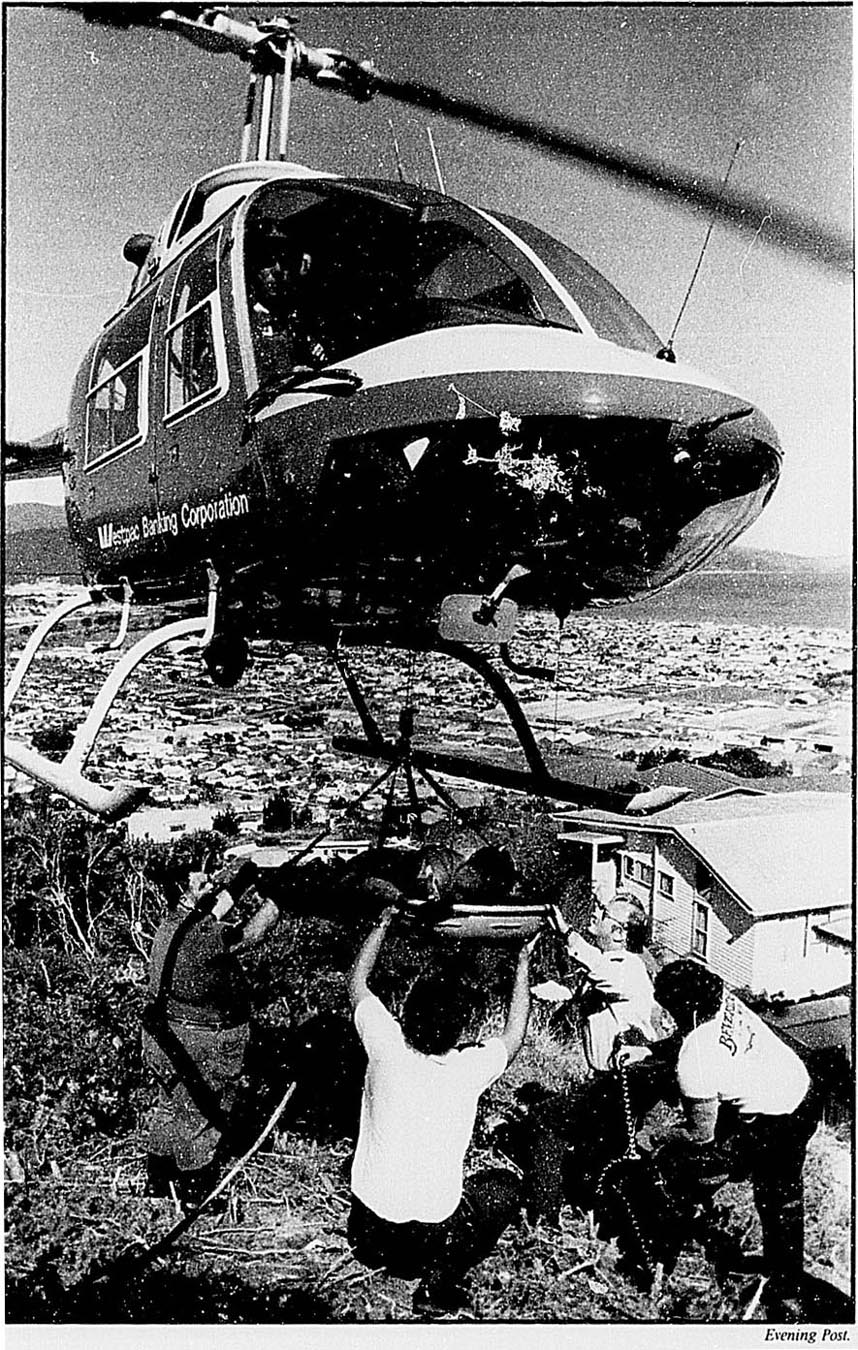
Evening Post.
Accident victim lifted clear from scene, Wellington.
Compensation—Compensation is paid to injured persons to allow financial security in overcoming their incapacity. For earners the scheme provides compensation for loss of earnings at the rate of 80 percent of normal average earnings. No payment is made by the corporation for the first week following the accident, but in the case of a work accident an employer is generally required to pay an employee 80 percent of his or her normal rate of pay for this period. Self-employed persons also qualify for compensation for loss of earnings at the rate of 80 percent of normal average earnings after the first week.
There is a wide range of benefits including compensation for medical and hospital expenses and the cost of transport for medical treatment. Lump-sum payments made for permanent loss or impairment of bodily function and loss of capacity to enjoy life. In the event of a fatal accident the corporation will pay reasonable funeral expense costs and earnings-related compensation to dependants.
Further information on benefits is available from any corporation office.
Table 8.28. ACCIDENT COMPENSATION CLAIMS RECEIVED
| Year ended 31 March | |||||
|---|---|---|---|---|---|
| Claims* | 1983 | 1984 | 1985 | 1986 | 1987 |
*Not all claims result in compensation being paid—particularly those made to protect the claimant's entitlement to compensation for any future incapacity. Source: Accident Compensation Corporation. | |||||
| Earners’ Account | 107,433 | 108,572 | 114,066 | 114,928 | 112,752 |
| Motor vehicle account | 12,481 | 16,572 | 16,962 | 17,199 | 18,302 |
| Supplementary account | 24,601 | 28,127 | 28,078 | 28,453 | 20,243 |
| Total claims | 144 515 | 153 271 | 159 106 | 150 580 | 151 297 |
Accident compensation is a form of compulsory insurance where the community as a whole accepts responsibility for the accidents which inevitably will afflict a proportion of its members. The community pays in three ways:
Levies on vehicle owners to pay for motor vehicle accidents. (These are collected through the New Zealand Post as agent for the corporation when motor vehicles are registered.);
Levies on employers (including the Crown) and on self-employed persons to pay for other accidents to earners. (These are collected through the Inland Revenue Department as agent for the corporation.); and
General taxation, which pays for other claims through the Consolidated Account.
Table 8.29 shows income from levies, compensation payments and administrative costs for the year ended 31 March 1987.
Table 8.29. ACCIDENT COMPENSATION COSTS AND ADMINISTRATION COSTS*
| Earners’ account | Motor vehicle account | Supplementary account | ||||
|---|---|---|---|---|---|---|
| Item | 1986 | 1987 | 1986 | 1987 | 1986 | 1987 |
*Years ended 31 March. Source: Accident Compensation Corporation. | ||||||
| Income— | $(000) | |||||
| Gross levy revenue | 173,132 | 201,327 | 41,455 | 103,645 | - | - |
| Investment income | 50,529 | 29,617 | 17,295 | 17,380 | - | - |
| Other | - | - | - | - | 60,117 | 71,405 |
| Total income | 223,661 | 230,944 | 58,710 | 121,025 | 60,117 | 71,405 |
| Expenditure— | ||||||
| Earnings-related compensation—injured | 155,172 | 202,835 | 34,162 | 44,655 | 266 | - |
| Earnings—related compensation-dependants | 14,981 | 16,434 | 13,259 | 15,143 | - | - |
| Dependants’ allowances and funeral expenses | 1,168 | 1,176 | 1,837 | 2,190 | 469 | 578 |
| Non-economic loss (i.e., lump sums) | 53,268 | 76,397 | 22,078 | 27,830 | 12,800 | 18,417 |
| Medical treatment | 30,080 | 34,700 | 8,000 | 8,887 | 33,129 | 36,046 |
| Hospital treatment | 10,904 | 14,710 | 1,671 | 2,143 | 3,361 | 4,102 |
| Dental treatment | 2,182 | 2,981 | 434 | 546 | 1,268 | 1,680 |
| Conveyance for medical attention | 3,223 | 3,292 | 2,092 | 1,979 | 1,707 | 1,592 |
| Rehabilitation | 955 | 1,728 | 935 | 1,182 | 316 | 568 |
| Other | 1,656 | 1,159 | 3,111 | 4,950 | 2,161 | 3,143 |
| Total compensation and medical expenditure | 273,589 | 355,412 | 87,578 | 109,505 | 55,476 | 66,126 |
| Financial grants | 719 | 1,220 | 271 | 234 | 364 | 547 |
| Levy revenue collection fee | 5,118 | 5,731 | 1,371 | 1,468 | - | - |
| General fund transfer | 19,979 | 25,415 | 5,738 | 7,887 | 4,277 | 4,732 |
| Total expenditure | 299,405 | 387,778 | 94,958 | 119,094 | 60,117 | 71,405 |
The Accident Compensation Corporation collects a number of statistics on compensated claims. Compensated claims largely exclude injuries causing less than eight days incapacity (for which the corporation is not required to pay compensation) and claims for medical treatment only (for which the doctor is normally reimbursed directly). The corporation welcomes enquiries for statistical information and specific enquiries should be directed to the Chief Accountant at the corporation's head office in Wellington. Where more than summary statistics are required a charge will normally be made for the information provided.
Statistics showing the type and location of accidents causing injury can be found later in this section, while statistics for accidental injuries treated in public hospitals appear in section 8.3, Hospitals.
Motor vehicle accidents involving death or personal injury are required by law to be reported to the Road Transport Division of the Ministry of Transport or to the police. During the year ended 31 December 1986, there were 13 383 reported accidents resulting in 767 fatalities, and injuries to 18 758 other people.
Table 8.30. ROAD ACCIDENT CASUALTIES BY TYPE, 1986
| Classification of accidents | Fatal | Injury | Total |
|---|---|---|---|
| Source: Ministry of Transport. | |||
| Overtaking | 58 | 695 | 753 |
| Head on (not overtaking) | 143 | 1,557 | 1,700 |
| Lost control or ran off road on straight | 79 | 1,901 | 1,980 |
| Lost control or ran off road while cornering | 226 | 3,808 | 4,034 |
| Collision with obstruction | 19 | 999 | 1,018 |
| Rear end | 16 | 1,063 | 1,079 |
| At intersections or driveways— | |||
| Vehicles moving in same direction, one turning | 14 | 1,334 | 1,348 |
| Vehicles crossing paths, not turning | 34 | 1,799 | 1,833 |
| Vehicles crossing paths, one turning | 13 | 1,319 | 1,332 |
| Vehicles merging | 4 | 349 | 353 |
| Vehicles moving in opposite directions, one turning right | 25 | 1,620 | 1,645 |
| Vehicles manoeuvring | 15 | 868 | 883 |
| Pedestrian crossing road | 86 | 1,151 | 1,237 |
| Pedestrian—other | 25 | 182 | 207 |
| Miscellaneous | 10 | 113 | 123 |
| Total | 767 | 18 758 | 19 525 |
Table 8.31. AGE OF PERSONS KILLED AND INJURED IN MOTOR ACCIDENTS
| Killed* | Injured | |||||
|---|---|---|---|---|---|---|
| Age groups (years) | 1984 | 1985 | 1986 | 1984 | 1985 | 1986 |
* Killed immediately or died within 30 days of accident. Source: Ministry of Transport. | ||||||
| Under 5 | 22 | 17 | 25 | 313 | 277 | 391 |
| 5–9 | 16 | 24 | 19 | 571 | 565 | 535 |
| 10–14 | 26 | 16 | 25 | 862 | 910 | 881 |
| 15–19 | 149 | 152 | 151 | 4,706 | 5,048 | 5,056 |
| 20–24 | 138 | 135 | 149 | 3,582 | 3,865 | 3,773 |
| 25–29 | 65 | 97 | 79 | 1,689 | 1,904 | 1,808 |
| 30–34 | 35 | 48 | 53 | 1,001 | 1,115 | 1,185 |
| 35–39 | 30 | 32 | 50 | 701 | 786 | 868 |
| 40–44 | 29 | 31 | 26 | 509 | 586 | 642 |
| 45–49 | 15 | 25 | 30 | 437 | 480 | 462 |
| 50–54 | 25 | 14 | 23 | 404 | 456 | 445 |
| 55–59 | 17 | 31 | 24 | 385 | 396 | 437 |
| 60–64 | 15 | 25 | 19 | 326 | 359 | 360 |
| 65–69 | 30 | 19 | 20 | 229 | 291 | 307 |
| 70 and over | 49 | 63 | 46 | 537 | 590 | 576 |
| Unknown age | 7 | 18 | 28 | 1,013 | 1,155 | 1,032 |
| Total | 668 | 747 | 767 | 17 265 | 18 783 | 18 758 |
Table 8.32. ROAD USERS KILLED AND INJURED IN MOTOR ACCIDENTS, 1986
| Type of casualty | Killed | Injured | Total |
|---|---|---|---|
| Source: Ministry of Transport. | |||
| Driver of— | |||
| Car | 252 | 6,498 | 6,750 |
| Rental car | 5 | 85 | 90 |
| Taxi | - | 38 | 38 |
| Van | 18 | 706 | 724 |
| Truck | 5 | 147 | 152 |
| Articulated truck | 4 | 36 | 46 |
| Bus | 1 | 12 | 13 |
| Other, including unknown | 3 | 11 | 14 |
| Motorcyclist | 107 | 3,146 | 3,253 |
| Passenger | 218 | 5,354 | 5,572 |
| Pillion rider | 20 | 430 | 450 |
| Cyclist | 22 | 1,012 | 1,034 |
| Pedestrian | 112 | 1,264 | 1,376 |
| Other, including unknown | - | 19 | 19 |
| Total | 767 | 18 758 | 19 525 |
Table 8.33. ROAD ACCIDENT CASUALTIES AND RATES
| December year | Persons killed | Killed per 10 000 vehicles on road | Persons injured | Injured per 10 000 vehicles on road | Casualties (killed and injured) per 10 000 vehicles |
|---|---|---|---|---|---|
| Source: Ministry of Transport. | |||||
| 1982 | 674 | 3.6 | 16,068 | 85.3 | 88.9 |
| 1983 | 644 | 3.4 | 16,241 | 84.7 | 88.1 |
| 1984 | 668 | 3.4 | 17 478x | 87.7x | 91.1x |
| 1985 | 747 | 3.7 | 18,783 | 94.1 | 97.8 |
| 1986 | 767 | 3.7 | 18,758 | 89.5 | 93.2 |
Traffic on roads is controlled by the Ministry of Transport, except for five cities and boroughs where it is controlled by local authorities. The ministry is also responsible for traffic on motorways. In national emergencies or major disasters, all traffic control comes under its supervision. For further information see section 22.4, Road transport.
Publicity directed towards road safety is carried out through the press, radio, television, and by means of posters and other advertising. Special road safety campaigns and traffic improvement courses are held from time to time.
The main emphasis in schools and teachers’ colleges centres around integrating traffic education into school programmes. Traffic education units are co-operatively planned and implemented. Traffic instructors, teachers and the community also work together to plan and implement traffic education interventions that are based on the special social and traffic needs of the community.
The New Zealand Defensive Driving Trust also provides a safety course for licensed drivers.
Advice on road safety policy is given to the Government by a permanent parliamentary select committee, by the Road Traffic Safety Research Council, and by a number of other bodies, including 24 local road safety committees.
Under the Accident Compensation Act 1972 a motor vehicle scheme provides cover for everyone in respect of personal injury caused by motor accidents. There is a Motor Vehicle Fund financed by premiums paid with the annual motor vehicle licence fee. See ‘Accident compensation’ above.
Table 8.35. DROWNINGS, 1987 P
| Age in years | |||||||||||
|---|---|---|---|---|---|---|---|---|---|---|---|
| Location | Under 5 | 5–10 | 11–15 | 16–20 | 21–30 | 11–40 | 41–50 | 51–60 | Over 60 | Age not known | Total |
| Source: New Zealand Water Safety Council. | |||||||||||
| Boating | - | - | 6 | 5 | 11 | 9 | 4 | 2 | 4 | - | 41 |
| Washed off rocks | - | - | - | 1 | - | - | - | - | - | - | 1 |
| Harbours | - | - | - | 1 | 1 | 3 | - | 2 | 4 | - | 11 |
| Household (bath/bucket) | - | - | - | - | - | - | -1 | - | - | - | 1 |
| Lakes, dams, and ponds | - | - | - | 3 | 1 | - | 1 | - | 1 | - | 6 |
| Pools | 4 | - | - | - | 1 | 1 | - | - | - | - | 6 |
| Rivers, streams, and other running waters | 2 | 2 | 1 | 6 | 12 | 4 | 7 | 6 | 2 | - | 42 |
| Scuba diving and snorkelling | - | - | 1 | 1 | 4 | 1 | 1 | - | - | - | 8 |
| Seas and beaches | 1 | 2 | - | 1 | 4 | 4 | 2 | 1 | 3 | 1 | 19 |
| Sludge pond, drains, etc. | 1 | - | - | 2 | - | - | - | - | - | - | 3 |
| Total | 8 | 4 | 8 | 20 | 34 | 22 | 15 | 12 | 14 | 1 | 138 |
| Drowned as the result of a motor vehicle accident | 20 | ||||||||||
| Drowned as a result of floods | 4 | ||||||||||
| Drowned as a result of a rafting accident: | |||||||||||
| Private | 1 | ||||||||||
| Commercial | - | ||||||||||
| (Figures included in above table.) | |||||||||||
Accidents, poisonings and violence caused approximately 8 percent of total deaths in each of the years 1976 to 1980, 7 percent in 1981 and 1982, 6 percent in 1983 and 7 percent in 1984 and 1985.
Table 8.36. DEATHS FROM EXTERNAL CAUSES*
| Number of deaths | Rate per million of mean population | |||||
|---|---|---|---|---|---|---|
| Causes of death | 1983 | 1984 | 1985 | 1983 | 1984 | 1985 |
* Registered during calendar year. † Includes falls aboard ship and from horseback. ‡ Includes drowning from water transport. Source: National Health Statistics Centre. | ||||||
| Motor vehicle accidents | 647 | 710 | 747 | 201 | 218 | 228 |
| Other transport accidents† | 31 | 59 | 42 | 10 | 18 | 13 |
| Accidental poisoning | 24 | 16 | 16 | 7 | 5 | 5 |
| Accidental falls | 240 | 255 | 319 | 74 | 78 | 97 |
| Accidents caused by machinery | 26 | 26 | 31 | 8 | 8 | 9 |
| Accidents caused by fire and explosion of combustible material | 26 | 29 | 40 | 8 | 9 | 12 |
| Accidents caused by firearms | 5 | 7 | 8 | 2 | 2 | 2 |
| Accidental drowning and submersion‡ | 135 | 86 | 133 | 42 | 26 | 41 |
| Suicide and self-inflicted injury | 352 | 389 | 338 | 109 | 119 | 103 |
| Homicide | 51 | 38 | 66 | 16 | 12 | 20 |
| All other external causes | 143 | 156 | 185 | 44 | 48 | 56 |
| Total deaths from accidents, poisoning, or violence | 1 680 | 1 771 | 1 925 | 521 | 543 | 587 |
Table 8.37. DEATHS FROM LEADING EXTERNAL CAUSES BY SEX AND AGE, 1985*
| Age group (in years) | Motor vehicle accidents | Accidental drownings | Accidental poisonings | Accidental falls | ||||
|---|---|---|---|---|---|---|---|---|
| M | F | M | F | M | F | M | F | |
| * Registered during calendar year. | ||||||||
| Under 15 | 33 | 32 | 21 | 8 | 1 | 2 | 4 | - |
| 15–24 | 224 | 70 | 29 | 2 | 6 | - | 8 | 1 |
| 25–34 | 107 | 37 | 18 | 2 | 2 | - | 6 | - |
| 35–44 | 45 | 20 | 14 | 2 | - | 2 | 5 | 2 |
| 45–54 | 25 | 12 | 9 | 2 | - | 1 | 2 | 2 |
| 55–64 | 31 | 23 | 14 | - | - | - | 7 | 3 |
| 65–74 | 25 | 21 | 5 | 2 | 1 | - | 7 | 14 |
| 75 and over | 26 | 16 | 5 | - | 1 | - | 78 | 180 |
| All ages | 516 | 231 | 115 | 18 | 11 | 5 | 117 | 202 |
| Age group (in years) | Suicide and self-inflicted injury | Homicide | All accidents, poisonings, and violence† | |||
|---|---|---|---|---|---|---|
| M | F | M | F | M | F | |
† Includes causes other than those shown in table. Source: National Health Statistics Centre. | ||||||
| Under 15 | 2 | 3 | 1 | 1 | 87 | 70 |
| 15–24 | 60 | 15 | 17 | 5 | 393 | 102 |
| 25–34 | 51 | 13 | 7 | 8 | 225 | 66 |
| 35–44 | 30 | 12 | 7 | 5 | 135 | 46 |
| 45–54 | 34 | 10 | 3 | 2 | 92 | 34 |
| 55–64 | 26 | 15 | 2 | 1 | 106 | 49 |
| 65–74 | 34 | 11 | 1 | 3 | 91 | 63 |
| 75 and over | 18 | 4 | 2 | 1 | 141 | 225 |
| All ages | 255 | 83 | 40 | 26 | 1 270 | 655 |
There were 319 deaths due to accidental falls in 1985. This is one accident area in which the total female mortality rate exceeds that for males, although there is an excess of male deaths over female deaths between the ages of 15 and 64 years. At 65 years of age and above, the higher life expectancy of females ensures that more elderly women than elderly men are exposed to the risk of fatal falls.
In 1985, 41 percent of fatal accidental falls occurred at home. Falls are the chief cause of death in domestic accidents, particularly for the aged and infirm.
Accidents occurring at home and in residential institutions (rest homes, hospitals, etc.) accounted for 63 percent of all fatal non-transport accidents in 1985.
Table 8.38. SITES OF FATAL NON-TRANSPORT ACCIDENTS*
| Number of accidents | Rate per million of mean population | |||||
|---|---|---|---|---|---|---|
| Place of occurrence | 1983* | 1984* | 1985 | 1983* | 1984* | 1985 |
*Excludes surgical and medical misadventure, late effects of accidental injury. † Revised to no longer include undetermined whether purposely or accidentally inflicted injury. Source: National Health Statistics Centre. | ||||||
| Home (including home premises and vicinity and any non-institutional place of residence) | 207 | 200 | 237 | 64 | 61 | 72 |
| Farm (including buildings and land under cultivation, but excluding farm and home premises) | 20 | 26 | 25 | 6 | 8 | 8 |
| Mine and quarry | 1 | 4 | 7 | – | 1 | 2 |
| Industrial places and premises | 22 | 24 | 36 | 7 | 7 | 11 |
| Places for recreation and sport | 4 | 7 | 8 | 1 | 2 | 2 |
| Street and highway | 15 | 17 | 11 | 5 | 5 | 3 |
| Public building (building used by the general public or a particular group of the public) | 7 | 6 | 3 | 2 | 2 | 1 |
| Residential institution (homes, hospitals, etc.) | 113 | 106 | 149 | 35 | 33 | 45 |
| Other specified places | 85 | 74 | 102 | 26 | 23 | 31 |
| Place not specified | 28 | 29 | 38 | 9 | 9 | 12 |
| Total | 502 | 493 | 616 | 153 | 151 | 188 |
Mortality rates among children aged one to four years in New Zealand are disappointingly high. In 1985 New Zealand's age-specific mortality rate for children aged one to four was 55.6 per 100 000 compared with 22.9 per 100 000 in Sweden (1984), 42.4 per 100 000 in England and Wales (1984), and 48.4 per 100 000 in Australia (1984). Various explanations have been attempted, but the fact remains that New Zealand pre-schoolers are at a higher risk of accidental death than pre-schoolers in many other countries with similar standards of living.
Table 8.39. DEATHS OF PRE-SCHOOL CHILDREN FROM ACCIDENTS AND VIOLENCE, 1985
| Causes of death | Sex | Age (in years) | ||||
|---|---|---|---|---|---|---|
| 1 | 2 | 3 | 4 | Total | ||
| Source: National Health Statistics Centre. | ||||||
| Drowning | M | 1 | 3 | 4 | 1 | 9 |
| F | 2 | 2 | 1 | - | 5 | |
| Motor vehicle accidents | M | 6 | 2 | 1 | - | 9 |
| F | 3 | 3 | 1 | 2 | 9 | |
| Homicide | M | - | - | - | - | - |
| F | - | - | - | - | - | |
| All other external causes | M | 2 | 4 | 2 | - | 8 |
| F | 4 | 2 | - | 1 | 7 | |
| Subtotal, male | 9 | 9 | 7 | 1 | 26 | |
| Subtotal, female | 9 | 7 | 2 | 3 | 21 | |
| Total | 18 | 16 | 9 | 4 | 47 | |
The phrase ‘civil defence’ describes the planning and organisation of the measures necessary for public safety during emergencies (except for those emergencies dealt with by the normal emergency services). Communities have an obligation to take the steps necessary to prevent/reduce loss of life or distress by using their own resources and drawing on volunteers, although the Ministry of Civil Defence will help local authorities to meet their obligations and co-ordinate government planning. A declaration of a state of ‘civil defence emergency’ grants special powers to: territorial local authorities and the civil defence controllers appointed by them; the police; and the ministry's director and commissioners.
The Ministry of Civil Defence was established in 1959 as an integral part of the Department of Internal Affairs. The current concept of civil defence dates from December 1983 when the most recent Civil Defence Act came into force.
Every territorial local authority has an obligation to prepare a civil defence plan, to set up a civil defence organisation, and to appoint a local controller of civil defence for the purpose of dealing with a disaster in its district should the use of civil defence measures be warranted. Neighbouring territorial authorities may unite for civil defence purposes and prepare a combined district civil defence plan, to set up a combined civil defence organisation, and to appoint a controller of civil defence. At 31 December 1987 there were 120 local and combined district civil defence organisations, and 22 regional organisations.
Every regional or united council has an obligation to prepare a civil defence plan, to appoint a regional controller of civil defence, and to set up the organisation necessary for dealing with a disaster in its region if the task is beyond the capability of any one particular local or combined district civil defence organisation.
The ministry appoints a commissioner of civil defence for each civil defence region. Most commissioners have several civil defence regions in their charge, which, for administrative convenience, are grouped into four civil defence zones:
| Northern Zone | Northland, Auckland, Waikato, Thames Valley, Bay of Plenty, Tongariro. |
| Central Zone | East Cape, Hawke's Bay, Wairarapa, Taranaki, Wanganui, Manawatu, Horowhenua. |
| Wellington Zone | Wellington region. |
| Southern Zone | South Island and Chatham Islands. |
The four commissioners exercise powers and functions under the general direction of the Director of Civil Defence in Wellington. The National Civil Defence Committee—comprising the permanent heads of 14 government departments most closely involved in disaster-relief measures, together with the Chief of Defence Staff and the chairperson of the Fire Service Commission—has a responsibility to advise and assist the minister and the Director of Civil Defence in the planning and implementation of civil defence measures. Representatives appointed by members of this committee form advisory groups at Auckland, Palmerston North and Christchurch to provide a similar service for civil defence commissioners.
A National Civil Defence Operational Headquarters is established in the sub-basement of the executive wing of Parliament Buildings. It is kept ready for use but is activated only when required. In a disaster it provides the means for co-ordinating the use of all governmental and non-governmental resources and, where necessary, for the control of the overall civil defence effort where there are demands which cannot be met by a regional or united council and the appropriate civil defence commissioner.
Each commissioner has an established operational headquarters (Auckland, Palmerston North, Wellington and Christchurch) to enable him or her to meet operational responsibilities in each civil defence region in the zone.
All property insured in New Zealand for damage against fire is also covered by a compulsory earthquake and war damage scheme.
The Earthquake and War Damage Act 1944 is administered by a commission, which is chaired by the Minister of Finance. Under the Act all property insured against fire is deemed to be insured to the extent of the indemnity value against earthquake and war damage. Premiums at the rate of 5c for each $100 of insurance cover are collected by the insurance companies and paid into the Earthquake and War Damage Fund (less commission of 2.5 percent).
Advances may be made from the Consolidated Account if at any time the amount in the Earthquake and War Damage Fund is not sufficient to meet the claims made.
‘Earthquake damage’ is defined as damage occurring as the direct result of earthquake or of fire caused by earthquake. In 1950 the scheme was extended to provide some protection against storm and flood of an abnormal or widespread nature. In 1954 the definition of disaster damage was extended to include volcanic eruption, and authority was given to the commission to accept insurance against landslip on a voluntary basis. Landslip cover became automatic in 1970. Finance is provided by crediting 10 percent of the premiums compulsorily collected under the Act to a special Disaster Fund. Also, since 1967 the commission has had power to underwrite geothermal activity insurance on a voluntary basis.
Since 1984 the commission has not been liable for damage through storm and flood and since June 1984 a limited form of land cover has been available.
Full details of cover provided are included in the Earthquake and War Damage Regulations 1984, the Earthquake and War Damage Amendment Act 1983, and the Earthquake and War Damage (Land Cover) Regulations 1984 Amendment No. 1.
In the 1988 Budget it was announced that the Earthquake and War Damage Commission would be restructured. This restructuring will be accompanied by a number of other changes in the provision of earthquake insurance by both the government and private sectors. For the year ended 31 March 1987 a total of 6813 claims were received. This compared with 747 for the previous year. The breakdown of claims was: earthquake, 6566; disaster, 8; landslip, 67; and land, 172. Respective figures for the previous year were 200; 27; 159 and 361.
Earthquake claims—As a result of seismic activity, 6566 claims amounting to $125,468,614 were registered.
Disaster claims—Claims totalled eight, with payments amounting to $75,805.
Landslip claims—A total of 67 claims for this year resulted in payments of $92,564.
Land claims—A total of 172 claims for this year resulted in payments of $41,455.
Fire-fighting services are organised nationally as the New Zealand Fire Service.
The commission is the national administrative body which deals through the commanders of regions, areas and districts. There are three permanent commissioners, one (the chairperson) with a special knowledge of administration, while the other two have senior operational experience in the fire service. The Secretary for Internal Affairs is also represented. The commission owned 1340 vehicles and 617 buildings at 31 March 1987.
There are six administrative regions based in Auckland, Hamilton, Palmerston North, Wellington, Christchurch and Dunedin. Their primary task is to co-ordinate their operational units to work in close-knit organisation.
The fire regions are divided into fire areas, of which there are 20 in all. They are responsible for developing the firefighting resources of their areas and for the training and operational efficiency of the brigades in districts within them.
Every united urban fire district, urban fire district and secondary urban fire district which existed immediately prior to the commencement of the Fire Service Act 1975, was declared a fire district under the new Act. There has been some adjustment of fire districts since 1976. As at 1 January 1988 they numbered 269.
Nineteen of the 269 fire districts are served mainly by permanent firefighters, augmented by more than 1000 volunteers. The remaining 250 fire districts are staffed by volunteer firefighters who are an essential part of the New Zealand Fire Service. During 1987 there were 2598 employees and 7854 volunteer firefighters and fire police officers. Several women are now employed as operational firefighters, and facilities for women are provided at all permanently staffed fire stations.
Approximately four-fifths (81 percent) of the cost of maintaining the New Zealand Fire Service is met by the insurance industry through a levy on policies, with the remainder being met by government. For the year ended March 1987 contributions from insurance companies totalled $98,150,000, while the Government contributed $23,023,000.
The Fire Service Act requires the Fire Service Commission to take an active and co-ordinating role in the promotion of fire safety. Giving effect to this is a Fire Safety Division at national headquarters, with fire safety departments in each of the fire districts served by permanent firefighters providing a nationwide fire safety survey and advisory service.
Fifty-three people died as a result of property fires during 1986, the same number as in 1985 and compared with 41 in 1984. In 1985 the most common suspected causes of fires resulting in fatalities were careless disposal of smoking materials and ‘falling asleep’ while smoking in bed (both causing seven deaths), seven people also died in fires resulting from aircraft crashes and twelve deaths resulted from fires of which the cause was unknown.
Fire insurance is described in section 21.3 Insurance.
Table 8.40. INCIDENTS ATTENDED BY FIRE BRIGADES
| Incidents | 1985 | 1986 |
|---|---|---|
| * An exposure fire is where a fire originating in one property spreads to another property. Because exposure fires are included in property call details, but refer to one incident only, they are subtracted from total fire incidents to reflect a clear total number of incidents attended to by the New Zealand Fire Service. | ||
| Fires— | ||
| Structure fires | 4,756 | 4,710 |
| Vehicle fires | 2,830 | 3,065 |
| Other property fires | 1,510 | 1,389 |
| Oven fires | 633 | 640 |
| Chimney fires | 1,990 | 1,751 |
| Rubbish fires | 4,176 | 4,029 |
| Tree, grass, and scrub fires | 4,282 | 3,296 |
| Other fires | 208 | 186 |
| 20,385 | 19,066 | |
| Less, exposure fires* | 177 | 160 |
| Total, fire incidents | 20 208 | 18 906 |
| Non-fire incidents— | ||
| Flammable liquid spills (under 30 litres) | 2,105 | 2,046 |
| Flammable liquid spills (over 30 litres) | 146 | 1,197 |
| Overpressure or rupture (no fire) | 62 | 41 |
| Emergency medical calls (assistance to other agencies) | 356 | 336 |
| Rescues (vehicle extrication, etc.) | 1,290 | 1,475 |
| Chemical, hazardous substances | 1,945 | 593 |
| Special services (pump out, lock in/out, etc.) | 2,894 | 3,431 |
| Support/stabilising action, etc. | 534 | 2,260 |
| Total, non-fires | 9 332 | 11 379 |
| Total good intent calls (no action required at scene) | 4 946 | 4 808 |
| False alarms— | ||
| Malicious | 1,927 | 1,864 |
| Defective apparatus or installation | 6,347 | 6,904 |
| Accidental | 3,862 | 3,769 |
| Total, false alarms | 12 136 | 12 537 |
| Total, unreported incidents | 405 | ... |
| Total, incidents attended | 47 027 | 47 630 |
The responsibility for administration of occupational safety and health legislation is shared among the Department of Labour, Ministry of Transport, Ministry of Energy, and Department of Health. The Accident Compensation Corporation also has an important responsibility, as outlined earlier in this chapter.
An Advisory Council for Occupational Safety and Health has been established to coordinate policy development on occupational safety, health and welfare matters and ensure that unnecessary overlapping of the functions of the five government agencies is avoided. As well as those agencies, the council membership includes representatives of the Council of Trade Unions, the Employers’ Federation, the Manufacturers’ Federation, and the State Services Commission (representing state-sector employers).
The department is responsible for a wide range of legislation which relates to the safety, health and welfare of the workforce in industrial, commercial, agricultural, bush and construction undertakings. The principal statutes it administers are set out below. The department aims to promote and maintain safe and healthy working conditions in undertakings by carrying out regular inspections, investigating accidents and complaints, giving advice to employers, supervisors and workers, and publishing safety and health pamphlets, guides and codes of practice.
At 31 March 1988 the department employed in its district offices 159 inspectors of factories, 46 construction safety inspectors, 15 bush inspectors, and 24 explosives and dangerous goods inspectors. These inspectors have extensive powers to enforce compliance with the legislation, although compliance is usually achieved through the co-operation of employers and workers.
The Factories and Commercial Premises Act 1981 applies to undertakings which include places such as bakehouses, cinemas, commercial depots, factories, hotels, laundries, laboratories, mailrooms, offices, restaurants, shops, stores, theatres, telegraph and telex offices, and warehouses. The Act also covers places where motor vehicles are repaired, serviced or tested, and places where food is prepared, or cooked and sold. Regulations have been made under the Act prescribing rules for work with asbestos, abrasive blasting, electroplating, lead, noxious substances and spray coating, and for the provision of first aid facilities.
The Agricultural Workers Act 1977 requires employers to instruct agricultural workers in the dangers likely to arise at work and the required precautions, to provide first aid facilities and protective clothing or equipment as appropriate, and to prevent exposure to harmful noise.
The Bush Workers Act 1945 provides for the safety and protection of persons employed in felling, pruning and thinning of trees, and extends to all logging operations, transportation (including sawn timbers and waste products) other than on a public road or government railway, the construction and maintenance of roads and bridges and the shifting of any plant used in logging and related operations. The minimum standards are set out in the Safety Code for Bush Undertakings issued by the department in consultation with the industry.
The Machinery Act 1950 with certain exceptions, applies to all industrial machinery. It places an obligation on the owners of machines to securely fence moving and dangerous parts. The Act also covers amusement devices, which require a certificate from a registered engineer that the device is mechanically and structurally safe for the purpose intended. The Act also requires the testing and certification of tractor safety frames used in agricultural operations.
The Construction Act 1959 covers a wide variety of work including new construction, maintenance, and demolition of buildings, roads, harbour works, railways, canals, bridges, dams, pipelines, earthworks, and the like. Certificates of competency are issued, after examination, to scaffolders, safety supervisors and construction blasters. Registers of qualified construction divers, crane operators and construction riggers are maintained.
The Dangerous Goods Act 1974 and the Explosives Act 1957 are the main legislation providing for the safety of workers and the public in relation to potentially dangerous substances. The Dangerous Goods Act is concerned with the packing, marking, handling, carriage, storage and use of certain flammable and oxidising materials and certain compressed, liquified, dissolved and other gases. The Explosives Act is concerned with the sale, storage, carriage, use and disposal of the different types of explosives. In most areas local authorities administer the Dangerous Goods Act, subject to the direction of the Chief Inspector.
For further information on industrial inspection see section 12.4, Labour relations.
Ministry of Transport:Safety of ships—A substantial portion of the Shipping and Seamen Act 1952, administered by the Ministry of Transport, is concerned with the safety of ships and those who sail in them. This Act contains the necessary authority for implementing the provisions of the international conventions of which New Zealand is a signatory. These conventions deal principally with ships engaged on international voyages, but the Act also contains provisions for the safety of all other commercial ships plying New Zealand coastal and inland waters.
Aircraft—The Civil Aviation Division of the Ministry of Transport is responsible for promoting safety in all elements of private and commercial aviation including sporting activities such as parachuting and gliding.
Boilers, lifts, and cranes—The Marine Division of the Ministry of Transport carries out inspections of boilers, lifts and power cranes as required by the Boilers, Lifts and Cranes Act 1950. In the calendar year 1986 there were 32 294 inspections of boilers and unfired pressure vessels, 7517 inspections of lifts, and 4460 inspections of cranes. In 1986, 46 accident investigations were carried out under the Act, with 18 people suffering injuries and two fatalities.
There are a number of Acts which cover the occupational safety and health of workers in specific areas of the energy field. These Acts are administered and enforced by the ministry's Non-trading Division.
Five Acts allow for the appointment of inspectors by the Ministry of Energy.
The Quarries and Tunnels Act 1982 and the Mining Act 1971 are administered and enforced by a mines, quarries and tunnels inspectorate.
The Coal Mines Act 1979 is administered and enforced by a coal mines inspectorate which consists of three sections: coal mines inspectors, engineering inspectors and mines rescue.
The Petroleum Act 1937 covers safety in activities associated with the prospecting, extraction and transporting by pipeline of petroleum and high-pressure gas. A petroleum inspectorate oversees exploration and production wells and pipelines to ensure safety standards are met.
The Geothermal Energy Act 1953 covers the exploration, development and use of geothermal energy—as well as setting health and safety standards.
Other legislation sets safety standards for workers and the public in electricity reticulation: the Electrical Registration Act 1979, the Electric Linemen Act 1959, the Electrical Supply Regulations 1976 and the Electrical Wiring Regulations 1976. Inspection is often carried out by officers of electrical supply authorities.
The Gas Act 1982, with regulations and codes of practice, covers safety in the reticulation and use of gases, including lpg. Gas installation inspectors are employed by supplying authorities.
The Department of Health operates three occupational health centres: in industrial areas in the Auckland, Hutt Valley, Christchurch and Dunedin health development units.
For further information on the Department of Health's involvement in occupational safety and health, see section 8.2, Public health.
8.1 Department of Health; Nursing Council of New Zealand; Plumbers, Gasfitters and Drainlayers Board; Pharmaceutical Society of New Zealand.
8.2 Department of Health; Alcoholic Liquor Advisory Council; Medical Research Council; National Health Statistics Centre; Abortion Supervisory Committee.
8.3 Department of Health; National Health Statistics Centre.
8.4 Accident Compensation Corporation; Ministry of Transport; Water Safety Council; National Health Statistics Centre.
8.5 Department of Internal Affairs; Earthquake and War Damage Commission; New Zealand Fire Service Commission; Department of Labour; Ministry of Transport; Ministry of Energy.
Annual Report and Statement of Accounts. Pharmaceutical Society of New Zealand.
Cancer Data. National Health Statistics Centre, Department of Health (annual).
Commission of Inquiry into Discharge of Psychiatric Patients, 1988.
Commission of Inquiry into Cancer Treatment at National Women's Hospital, 1988.
Families Care: Dependent Persons and their Caregivers. Department of Health, 1987.
Hospital and Selected Morbidity Data. National Health Statistics Centre, Department of Health (annual).
Hospital Management Data. National Health Statistics Centre, Department of Health (annual).
Long-term Hospital Care for Physically Disabled Adults. Department of Health, 1987.
Medicine Distribution—A Guide for Importers, Manufacturers, Distributors and Suppliers of Medicines, Medical Devices and Related Products. Department of Health, 1987.
Mental Health Data. National Health Statistics Centre, Department of Health (annual).
Mortality and Demographic Data. National Health Statistics Centre, Department of Health (annual).
New Zealand Alcohol Consumption Statistics. Alcoholic Liquor Advisory Council (annual).
New Zealand Alcohol/Drug Outpatient Statistics. Alcoholic Liquor Advisory Council (annual).
New Zealand Alcohol—Related Social Research Abstracts, Vol. 1. Alcoholic Liquor Advisory Council, 1987.
The Public Health: Report of the Department of Health (Parl. paper E. 10).
Report of the Abortion Supervisory Committee (Parl. paper E. 28).
Report of the Alcoholic Liquor Advisory Council (Parl. paper E. 26).
Unshackling the Hospitals: Report of the Hospital and Related Services Taskforce, 1988.
Women's Health in New Zealand: A Statistical Overview, 1968–1983. Department of Health, 1987.
The Accident Compensation Scheme: Interim Report on Aspects of Funding. Law Commission, 1987.
Diseases Arising from Occupation. Department of Health, 1984.
Monthly Abstract of Statistics. Department of Statistics.
Motor Accidents in New Zealand. Ministry of Transport (annual).
Report of the Accident Compensation Corporation (Parl. paper E. 19).
Report of the Advisory Council on Occupational Safety and Health (Parl. paper G. 41).
Report of the Department of Labour (Parl. paper G. 1).
Report of the Earthquake and War Damage Commission (Parl. paper B. 11).
Report of the Ministry of Transport (Parl. paper F. 5).
Report of the National Poisons and Hazardous Chemicals Information Centre. National Toxicology Group (annual).
Report of the New Zealand Fire Service Commission (Parl. paper G. 8).
Table of Contents
Each educational institution in New Zealand has a governing board or council. Schools also have a controlling authority such as an education board, or regional office of the Department of Education which oversee day-to-day administration. These bodies are set up under the Education Act 1964 and are controlled by the Department of Education.
The Department of Education is the central controlling authority and policy-making body accountable to the Minister of Education. Ten education boards and three regional department offices administer the policies.
The department advises the Minister of Education on policy and development. It also ensures that early childhood centres, schools, teachers colleges and polytechnics are built and equipped when and where required, and that teachers are recruited and trained. Checks and standards are maintained in all schools (both state and private), teachers colleges and polytechnics by the department, which also assesses the efficiency of teachers. An important function of the department is to conduct curriculum revision and development, and to recommend curriculum changes to the minister.
The control and management of state primary schools is the responsibility of 10 education boards. State secondary schools are controlled by local secondary school boards. These boards are the employing authorities of the teachers. They disburse grants received from the Department of Education for the maintenance of schools and the building of new schools, and for equipment and teaching materials. Teachers colleges and polytechnics are controlled by councils appointed by the Minister of Education.
The Department of Education administers the Correspondence School and state special schools. It maintains an inspectorate, supervises the staffing of schools, and conducts the School Certificate examination and Sixth Form Certificate assessment. All state and registered private schools are visited by inspectors who provide assistance and guidance to teachers on educational matters.
The Department of Education maintains contact with non-formal adult and community education organisations as well as the University Grants Committee.
Members of education boards are elected by members of school committees on a ward system, and provision is made for the appointment of a teacher to each board who represents all teachers employed by the board.
Each state primary school controlled by an education board has its school committee elected by the parents of pupils and by adults resident in the school district. The committee is a statutory body charged with the management of property and funds on behalf of the board.
School committees provide an essential function in the care of school buildings, grounds, and equipment. In addition, many committees take a keen interest in the general activities of the school and provide, along with voluntary parent-teacher associations, a focal point for local opinion on educational matters.
Secondary schools are controlled and administered by their own boards of governors. Boards controlling secondary schools are made up of representatives of the parents of pupils, members of the education board of the district, representatives from local community groups and organisations, and teacher representatives. In some metropolitan areas, groups of secondary schools have been linked together for administrative purposes under secondary school councils. Each school, however, retains its own board of governors, which has a large measure of autonomy in the control and management of its own school.
These schools comply with defined standards of accommodation and teaching as a prerequisite for compulsory registration. Finance and other assistance is provided by the state, including a 20.5 percent subsidy of teacher salaries. Government requirements are met before new private schools can be built, and, after a transitional period, new teacher entrants to private schools must possess certain minimum qualifications.
In 1975, the Private Schools Conditional Integration Act was passed to allow for the voluntary integration of private schools into the state system.
Private schools, whether integrated or not, are subject to the provisions of the Education Act 1964. Integrated schools operate under the same system of control and management as state primary and secondary schools. Non-integrated private schools are controlled by school committees and boards of trustees who are the proprietors.
Polytechnics, including the Technical Correspondence Institute, are controlled by councils. Members represent business, industry, local authorities, universities, women's and ethnic groups, as well as education and community interests.
Teachers college councils include representatives from education boards, the Department of Education, universities, and teacher organisations.
Each university is established under its own Act of Parliament. All matters relating to management are the responsibility of the council of the institution, which represents the interests of staff, students and the community.
The Curriculum Committee, established under the Universities Act 1961, is responsible for approving course regulations and for maintaining the equivalence of courses for degree and other qualifications.
The Universities Entrance Board maintains a common educational standard for admission to the universities. The board sets conditions of examinations for university bursaries and entrance scholarships.
The Carnegie Corporation of New York was instrumental in founding the New Zealand Council for Educational Research in 1933. Since 1945 the council has been supported by state funds, contributions from educational bodies, philanthropic foundations, business organisations, and its own trading operations. It has remained, however, under independent control as originally provided for in the New Zealand Council for Educational Research Act 1945.
The council has concentrated its research on New Zealand and its main publications, more than 100 research monographs and numerous shorter studies in education, include critical surveys of major policy issues in New Zealand education, and accounts of outstanding experiments in school practice. The council is also involved in the publication of two periodicals; the New Zealand Journal for Educational Studies, and a special research information package for teachers called Set.Set has, since 1980, been published jointly with the Australian Council for Educational Research.
The New Zealand Council for Educational Research is the main source of overseas and locally standardised educational and psychological tests used by universities, government agencies, hospitals, business firms, and schools. Progressive Achievement Tests, established by the council are used extensively in schools throughout New Zealand.
The council employs permanent research staff and temporary research fellows or project assistants, and assists honorary research workers in other institutions such as universities, teachers colleges, and schools. Its current programme includes research into major projects related to families, and early childhood education, evaluation and assessment in primary and secondary schools, educational computing, children's written English, Maori language, and education, vocational education and adult learning, and services for children with special needs. Staff act as consultants and visit South-east Asia and the Pacific Islands. The council also acts as a clearing house for information on educational matters and maintain seven local institutes for educational research in Auckland, Wellington, Christchurch, Dunedin, Palmerston North, Hamilton, and Suva (Fiji).
The foundation was established in 1961 by Act of Parliament, to promote and encourage improved education for the Maori by providing financial assistance. The capital resources of the foundation are $4,700,000, which the Board of Trustees allocates. The money goes to grants for pre-school groups and the employment of a pre-school officer, sponsorship of four annual speech contests; grants to secondary school pupils, and to students attending university or other tertiary institutions of similar status; the provision of scholarships and fellowships for students undertaking undergraduate or postgraduate study in New Zealand and overseas; and grants to students undertaking research or study which will benefit the Maori people.
In the 1987 academic year the foundation distributed $1,225,000 in grants for pre-school education, secondary education, and to students attending tertiary institutions.
This foundation was established in 1972 to assist Pacific Island students who reside permanently in New Zealand. The aims and objectives of the foundation are similar in most respects to those of the Maori Education Foundation. In the 1987 academic year $70,000 was spent on grants.
The Department of Education meets the full cost of some early childhood services, such as pre-school classes in primary schools, and the early childhood programme of the Correspondence School. It also pays the salaries of community preschool workers and kindergarten teachers. The New Zealand Playcentre Federation, the New Zealand Childcare Association, and a number of other organisations also receive financial assistance for their field-based training programmes.
Kindergarten and playcentre buildings are subsidised by the Government on a $4: $1 basis—except for those in areas of special need, where full costs are met. The Department of Education pays administration and sessional grants to kindergartens and playcentres while sessional grants are also paid to non-profit-making pre-school groups. Childcare centres licensed under the Childcare Centre Regulations 1985 receive grants which take into account staff training costs. Establishment grants are also available on a limited basis to non-profit-making childcare centres. Family day-care is funded by grants to the organisations which administer the scheme.
The Department of Social Welfare provides funding for the Society for Intellectually Handicapped, and the Crippled Children's Society, and provides a childcare subsidy for families in need. Early-childhood Nga Kohanga Reo centres receive their funding from the Department of Maori Affairs.
Primary schools receive grants for general running costs, e.g., cleaning and sanitation, administration, class materials, maintenance of buildings and equipment, library books, free textbooks, special purposes, swimming pools and manual training. Grants are paid to education boards which then distribute them in accordance with the particular needs of their area. A basic equipment scheme provides grants to education boards to enable them to supply all schools with consumable items for arts and crafts, infant apparatus, new school accommodation and to upgrade, repair and replace equipment.
Similar assistance is given to secondary school boards, with regional offices of the Department of Education having oversight of the funds.
The University Grants Committee advises the Government on the needs of New Zealand for university education and research. It recommends grants to meet these needs, determines the allocation of the grants among universities and reviews the expenditure by the universities of money appropriated by Parliament. The University Grants Committee is responsible for the award of scholarships and, through its statutory subcommittee, the Research Committee, is responsible for the distribution of a government grant for research. The committee operates under the Universities Act 1961.
Apart from the income from students’ fees and the relatively small amounts available to some universities from endowments, block grants from government determine the income of the universities to meet their running costs for five-year periods. Under the block grant system, grants have been calculated and approved five years in advance to enable the universities to plan their activities in advance. They are block grants in the sense that they are not itemised. This has the effect of making the governing bodies—the university councils—not only responsible for arranging their budgets within their incomes, but also free to make their own decisions about the allocation of new expenditure among the many competing academic proposals which arise within the institutions. With these grants, the university councils have an obligation to determine the numbers of students to be admitted to any class or faculty in the university, except where restrictions to class sizes are involved. The concurrence of the University Grants Committee is required to reallocate, where appropriate, existing staffing or accommodation resources in response to changes in demand for courses.
Table 9.1 shows the net expenditure (actual expenditure less recoveries) from public funds on each branch or service of education for the years ended 31 March 1986 and 1987.
Table 9.1. EXPENDITURE ON EDUCATION
| Item | 1985–86 | 1986–87 | |
|---|---|---|---|
| Net expenditure | Net expenditure | Percentage of total | |
| Source: Department of Education. | |||
| $(000) | percent | ||
| Administration and general— | |||
| General administration | 24,350 | 38,863 | 1.5 |
| Examinations | 2,043 | 2,336 | 0.1 |
| Research | 1,862 | 2,347 | 0.1 |
| Subtotal | 28,255 | 43,546 | 1.7 |
| Pre-school education— | |||
| General administration | 1,076 | 2,143 | 0.1 |
| Free kindergartens | 24,474 | 36,852 | 1.4 |
| Playcentres | 2,151 | 2,646 | 0.1 |
| Other pre-school agencies | 375 | 450 | – |
| Childcare services | – | 5,675 | 0.2 |
| Subtotal | 28,076 | 47,766 | 1.8 |
| Education support services— | |||
| General administration | 2,822 | 4,313 | 0.2 |
| School inspection service | 7,420 | 10,934 | 0.4 |
| Advisory and guidance service | 22,864 | 29,199 | 1.1 |
| Curriculum development and resources | 8,247 | 11,523 | 0.4 |
| School transport | 60,707 | 67,023 | 2.6 |
| Recruitment of teachers | 789 | 673 | - |
| Subtotal | 102,849 | 123,665 | 4.8 |
| Operation of schools— | |||
| State primary schools | 613,232 | 756,065 | 29.1 |
| State secondary schools | 479,197 | 646,252 | 24.9 |
| Correspondence School | 14,621 | 20,382 | 0.8 |
| Integration of private schools | 78 | 11,320 | 0.4 |
| Assistance to private schools | 15,094 | 17,213 | 0.7 |
| Special education | 40,692 | 51,766 | 2.0 |
| School buildings | 79,587 | 96,516 | 3.7 |
| Subtotal | 124,501 | 159,954 | 61.6 |
| Teacher education— | |||
| General administration | 331 | 418 | - |
| Pre-service training | 35,147 | 46,805 | 1.8 |
| In-service training | 4,126 | 6,668 | 0.3 |
| Teachers college buildings | 1,044 | 5,352 | 0.2 |
| Subtotal | 40,648 | 59,243 | 2.3 |
| Senior technical and community education— | |||
| General administration | 1,424 | 2,503 | 0.1 |
| Technical institutes and community colleges | 131,868 | 183,251 | 7.1 |
| Assistance to students | 15,714 | 18,334 | 0.7 |
| Other continuing education agencies and programmes | 8,449 | 11,470 | 0.4 |
| Technical institute and community college buildings | 22,329 | 41,657 | 1.6 |
| Subtotal | 179,784 | 257,215 | 9.9 |
| University education— | |||
| Operation of universities | 277,807 | 325,043 | 12.5 |
| Assistance to students | 55,872 | 65,297 | 2.5 |
| University buildings | 27,303 | 33,653 | 1.3 |
| Subtotal | 360,982 | 423,993 | 16.3 |
| National Library— | |||
| Operation of National Library | 16,285 | 21,135 | 0.8 |
| National Library buildings | 10,875 | 19,107 | 0.7 |
| Subtotal | 27,160 | 40,242 | 1.6 |
| Total | 2,010,255 | 2,595,184 | 100.0 |
Table 9.2. EDUCATION EXPENDITURE RELATED TO GOVERNMENT EXPENDITURE AND POPULATION
| Year ended 31 March | Net education expenditure | Percentage of net government expenditure | Percentage of GDP | Expenditure per head of mean population | ||
|---|---|---|---|---|---|---|
| Current salaries | Buildings | Total | ||||
| Source: Department of Education. | ||||||
| $(million) | percent | percent | $ | |||
| 1983 | 1,520.0 | 118.8 | 1,638.8 | 12.9 | 5.1 | 513.38 |
| 1984 | 1,553.4 | 120.9 | 1,674.3 | 11.8 | 4.9 | 517.93 |
| 1985 | 1,607.2 | 121.4 | 1,728.6 | 11.3 | 4.5 | 531.17 |
| 1986 | 1,868.0 | 142.3 | 2,010.3 | 11.4 | 4.5 | 618.86 |
| 1987 | 2,392.8 | 202.4 | 2,595.2 | 12.4 | 5.1 | 781.78 |
The Department of Education provides technical advice to the Ministry of Foreign Affairs on education activities under New Zealand's Official Development Assistance Programme. This advice includes making visits to Pacific Island schools to prepare students for New Zealand examinations. In 1987, 161 such schools presented 11 650 candidates for School Certificate and 84 candidates in the Cook Islands and Niue were entered for Sixth Form Certificate. Usually, 30 New Zealand teachers are appointed to Pacific Island schools each year.
Together with the Ministry of Foreign Affairs, the Department of Labour and the University Grants Committee, the Department of Education provides advice to the Government on policy for the admission of private foreign students to New Zealand educational institutions.
The Department of Education administers a range of bilateral educational and cultural exchange activities. Each year, teacher exchanges are arranged between New Zealand, the United Kingdom and Australia. In 1987, seven New Zealand and Canadian teachers exchanged positions as part of the Ontario exchange scheme. A New Zealand-Japan exchange programme provides financial and administrative support for a wide range of activities for school teachers, artists and scholars. Other exchange activities include overseas in-service training for teachers of French and German and the Language Assistants Scheme for French, German and Spanish teachers.
New Zealand is a member of various intergovernmental organisations concerned with education. It participates in the education activities of the Commonwealth Secretariat, the South-east Asian Ministers of Education Organisation, and the Organisation for Economic Co-operation and Development. New Zealand participates in the work of the Education Committee of the OECD and is a member of the Centre for Educational Research and Innovation and the Programme on Educational Building. The New Zealand Minister of Education also participates in the meetings of the Australian Education Council.
In 1987, the Government appointed a task force to review education administration. The need for reform of the education system had been debated for some time, and the debate has continued following the release of the task force's recommendations.
After considering several hundred submissions from the public and other interested parties, the task force, appointed by the Minister of Education and chaired by Mr Brian Picot, presented its findings in May 1988 in the report, Administering for Excellence. It concluded that the present administrative structure for education, which has existed in New Zealand in much the same form for over a hundred years, is overcentralised, overly complex, and in need of extensive change.
The Picot report, as the task force's recommendations are widely known, proposed that any new administration for education should be based upon choice, giving a wide range of options to consumers and individual learning institutions (the schools), the needs of parents and the community; cultural sensitivity; equity; and good management practices so that those working in the system have detailed and clear objectives, control over resources, no overlapping lines of responsibility, and an understanding of the need to be accountable for the decisions they make.
These principles formed the basis for the proposed reforms and gave the Government a framework for setting its policy. Following 20 000 public responses to the Picot report, the Minister of Education released the Government's policy position, Tomorrow's Schools: The Reform of Education Administration in New Zealand. This report largely affirms the Picot proposals, although there have been some departures from the task force's recommendations. The Government's report focuses only on the changes to primary and secondary education. Two other working parties are considering early childhood care, tertiary education and ongoing adult training.
The most significant change in the delivery and administration of primary and secondary education will involve parents and the community running schools. Responsibility for the administration of the many primary and secondary schools currently controlled by 10 education boards and three regional offices of the department will be decentralised to boards of trustees of individual schools. Secondary school boards will also be reconstituted. Each board of trustees will be responsible for preparing a charter (a contract between the community, the school and the state) in consultation with the principal, the staff and the community.
Parent and community involvement is a special feature of this partnership. Community education forums will be set up where students, parents, managers, or education administrators will be able to air their views. After consultation at the local level the charter will be prepared. Its objective will be to define the purposes of the institution and intended outcomes, taking into account the particular interests of the students, the special skills and qualifications of the staff, and the resources of the community and its wishes.
Each charter's objectives must also reflect national guidelines as well as local needs. These will take into account equity and Maori issues, national curriculum objectives, and a code of ethics for boards of trustees and for principals, all of which are necessary to maintain and develop national standards of achievement.
The changes also provide for groups of parents representing at least 21 children to withdraw from existing arrangements and set up their own institution, provided they meet the national guidelines for education.
Boards of trustees will be accountable for meeting the objectives set out in their charter, and for expenditure made from bulk grants received from government to run institutions. Boards will be required to report to a national review and audit agency, which will in turn report directly to the Minister of Education.
The review and audit agency will have varied responsibilities. It will review institutions on a biennial basis, helping boards of trustees to meet objectives and review their performance. Its membership will have expertise in curriculum, financial and management support, and in the creation of equal employment opportunity and equal education opportunity. Representatives will include a local community representative and a principal co-opted from another institution. The agency will also be responsible for granting exemptions from enrolment and attendance at school, will monitor home-based schooling, and will make final decisions designating teachers of outstanding merit, on the recommendation of the principal and the board of the teacher's institution.
Education service centres will carry out the functions formerly the responsibility of education boards. These centres will supply administrative support and institutions will be free to use the centres or to buy-in services from elsewhere.
A ministry of education (rather than the present Department of Education) will advise the minister through a policy council and implement policies (but will take no part in the provision of services, as happens at present through the education boards). Such a ministry would be managed by a chief executive and have units for policy formation, implementation and property management.
Changes to the system of administration are proposed in all sectors and are due to be implemented by October 1989. An implementation unit and officials committee, established late in 1988, will investigate new structures, issues and operational requirements for implementation of the proposals in Tomorrow's Schools.
Most New Zealand children begin their formal education before primary school. Early childhood education is available to children under five years old through a wide range of services, most of which are administered by voluntary agencies with government assistance.
The Education Act 1964 provides for free and secular education in state primary and secondary schools and attendance is compulsory until the age of 15 years.
Primary school education is compulsory from six years of age, but it is common practice for children to start formal schooling at the age of five. If living in an isolated area, a child may be enrolled with the primary department of the Correspondence School. The final two years of the primary course, forms 1 and 2, may be taken at a full primary school, an intermediate school, an area school, or a form 1–7 school depending on where a child lives. On completing form 2, usually after eight years’ school attendance, a child normally enters form 3 of a secondary school, or alternatively form 3 in an area school.
Primary and secondary schools are required to be open for at least 400 half days and 380 half days, respectively, each year. The school year is divided into three terms, the first term commences in February, usually on the fifth Monday of the year (in secondary schools, the fifth Tuesday), the second term in May on the 21st Monday, with the third term commencing in September on the 37th Monday. These dates may vary where they coincide with statutory holidays.
Centres providing care for three of more children under seven years of age must be licensed by the Department of Education. Care may be provided by the day, or for part of the day, and for not more than eight consecutive days, whether for reward or not. There are three classes of licences for childcare establishments: full-day; sessional; and special-purpose. Each centre must have a trained supervisor and there are standards for the provision of food and space as well as safety and management.
Childcare centres are administered by a variety of groups including community and church groups, voluntary agencies and private commercial operators. The New Zealand Childcare Association, the New Zealand Licensed Childcare Centres Federation, the Associated Childcare Council and Barnado's are some of the many organisations involved. Childcare services are also provided in centres run by the Society for Intellectually Handicapped and the Crippled Children's Society. Family daycare schemes as well as nanny services provided in private homes form another type of childcare service.
Kohanga reo—Te Kohanga Reo is one of the major organisations involved in early childhood education. It was established by Maori to provide an educational environment in which children can learn Maori language and Maori cultural values. Kohanga reo are special-purpose childcare centres under the control of Te Kohanga Reo Trust (Inc.) and licences are approved by the trust. See section 6.4, Maori population.
Pacific Island pre-school care—Pacific Island communities run early childhood centres with an emphasis on language development, both in the mother tongue and in English; increasing parental knowledge in early childhood care and education, and assisting a child's transition into the formal education system. Home-based early childhood care and education programmes are linked to the centres and five home tutors based in Auckland, Tokoroa and Wellington carry out this work under the direction of a board of trustees.
The other main organisations involved in providing part-day sessional programmes are the New Zealand Free Kindergarten Union and the New Zealand Playcentre Federation. Part-day provision is also available through mobile pre-school units, pre-school classes in primary schools, hospital pre-school groups, family playgroups and small non-profit-making pre-school groups.
The curriculum of the primary and intermediate schools, as set out in the syllabuses, covers English (including oral and written language, reading, spelling and handwriting), mathematics, social studies, art and crafts, science, physical education, health education, and music. Maori language is taught in some schools, and there are 11 official bilingual state primary schools with many other state schools having established bilingual classes and groups. At intermediate level (forms 1 and 2), the curriculum includes workshop craft and home economics, which are available to both girls and boys. For some children at these levels the programme includes French language.
Reading recovery—There are programmes to reduce the incidence of reading failure among six-year-old children. Reading recovery programmes are established in some 1150 primary and area schools and involve about 15 percent of the six-year-old population.
The secondary curriculum is based, for the first two years (forms 3–4), on a common core consisting of English, social studies, general science, mathematics, music, arts and crafts, and physical education. Secondary schools are required to give all pupils a minimum number of units of instruction in the common core subjects. At form 5–7 levels, students may choose from a wide range of subjects. A variety of languages are taught at form 3 level and above and work is proceeding on a new syllabus in the Japanese language for forms 3–7. The Maori language is becoming more widely taught. In 1987 a total of 226 schools taught Maori at form 3 level or above compared with 217 schools in 1986. This figure includes secondary schools, area schools and form 1–7 schools.
In April 1987, The Curriculum Review, the Report of the Committee to Review the Curriculum for Schools was published. A draft of a national curriculum statement has been prepared, based on the report and sets out a framework for teaching and learning in primary and secondary schools. The draft statement is being used by a small number of schools to consult with their communities in reviewing their curricula. Other schools will use the report as the basis for their consultation.
Further reforms relating to the setting of the curriculum have been dealt with in the review of education administration and are addressed in the Government's report, Tomorrow's Schools; The Reform of Education Administration in New Zealand, mentioned above.
The School Certificate examination is conducted by the Department of Education and taken by most pupils at the end of three years of secondary education. Each candidate's course of study must include English, although the student is not required to sit the examination in that subject. A candidate may enter the examination in any number of subjects up to six and is credited with a grade for each subject. There are seven grades: A1 (highest), A2, B1, B2 (middle), C1, C2, and D (lowest).
Higher School Certificate is awarded after a five-year course, to pupils who have been accepted for entry to form 6 and have satisfactorily completed an advanced course of two years. It is also awarded to pupils who have obtained an A or B bursary qualification from the University Bursaries Examination.
Sixth Form Certificate is awarded, on a single-subject basis, to pupils who have satisfactorily completed a course of one year beyond School Certificate level. No more than six subjects can be taken. Grades are awarded on a 1 to 9 scale, grade 1 being the highest.
The University Bursaries Examination and the University Entrance Scholarship Examination, usually taken by secondary school pupils in form 7, are conducted by the Universities Entrance Board; they are competitive examinations for supplementary awards for study at a university.
Table 9.3. SCHOOL CERTIFICATE CANDIDATES*
| Year | New Zealand school candidates | Extra-mural candidates | Pacific Island school candidates | Total candidates | |||
|---|---|---|---|---|---|---|---|
| Number entered | Percentage of total | Number entered | Percentage of total | Number entered | Percentage of total | ||
*Based on number of candidates sitting examinations. All figures revised. Source: Department of Education. | |||||||
| 1982 | 57,654 | 80.5 | 4,071 | 5.7 | 9,912 | 13.8 | 71,637 |
| 1983 | 59,796 | 80.1 | 4,496 | 6.0 | 10,319 | 13.8 | 74,611 |
| 1984 | 58,309 | 80.7 | 3,940 | 6.8 | 9,999 | 13.8 | 72,248 |
| 1985 | 57,303 | 80.3 | 3,742 | 5.2 | 10,302 | 14.4 | 71,347 |
| 1986 | 58,834 | 79.9 | 3,173 | 4.3 | 11,605 | 15.8 | 73,612 |
Table 9.4. NUMBER OF SUBJECTS TAKEN BY SIXTH FORM CERTIFICATE STUDENTS
| Year | Number of subjects taken | |||||
|---|---|---|---|---|---|---|
| 6 | 5 | 4 | 3 | 2 | 1 | |
| Source: Department of Education. | ||||||
| percentage of total | ||||||
| 1983 | 9.0 | 68.5 | 9.3 | 2.5 | 3.1 | 7.7 |
| 1984 | 11.7 | 66.0 | 8.8 | 2.4 | 2.9 | 8.2 |
| 1985 | 14.5 | 63.8 | 8.4 | 2.5 | 3.1 | 7.6 |
| 1986 | 19.5 | 54.2 | 8.9 | 3.8 | 3.8 | 9.8 |
Table 9.5. ATTENDANCE AND ATTAINMENTS OF SECONDARY SCHOOL LEAVERS
| Years in attendance | Pupils | Attainments | Pupils | |||
|---|---|---|---|---|---|---|
| 1985 | 1986 | 1986 | ||||
* One or more subjects irrespective of grade awarded. Source: Department of Education. | ||||||
| no. | no. | percent | no. | percent | ||
| One | 686 | 765 | 1.3 | University Scholarship | 186 | 0.3 |
| Two | 5,065 | 4,793 | 8.2 | University Bursary | 6,110 | 10.5 |
| Three | 16,787 | 16,013 | 27.5 | Higher School Certificate | 4,904 | 8.4 |
| Four | 22,267 | 20,508 | 35.1 | Sixth Form Certificate* | 16,039 | 27.5 |
| Five | 15,894 | 15,787 | 27.0 | School Certificate | 15,796 | 27.1 |
| Six and over | 626 | 517 | 0.9 | No formal national academic qualification | 15,348 | 26.3 |
| Total | 61 325 | 58 383 | 100.0 | Total | 58 383 | 100.0 |
Table 9.6. ATTENDANCE AND ATTAINMENTS OF MAORI SCHOOL-LEAVERS
| Attainment | Years in attendance of school-leavers* during or at the end of 1986 | ||||||||||||||
|---|---|---|---|---|---|---|---|---|---|---|---|---|---|---|---|
| One | Two | Three | Four | Five | Six | Total | |||||||||
| M | F | M | F | M | F | M | F | M | F | M | F | M | F | Grand | |
*Does not include deceased or students leaving to attend another secondary school. † One or more subjects irrespective of grade awarded. Source: Department of Education. | |||||||||||||||
| University | |||||||||||||||
| Scholarship, | |||||||||||||||
| University | |||||||||||||||
| Bursary | 1 | 71 | 58 | 1 | 2 | 72 | 61 | 133 | |||||||
| Higher School | |||||||||||||||
| Certificate | 7 | 8 | 163 | 141 | 23 | 9 | 193 | 158 | 351 | ||||||
| Sixth Form | |||||||||||||||
| Certificate† | 1 | 378 | 474 | 233 | 270 | 22 | 23 | 633 | 768 | 1,401 | |||||
| School Certificate† | 542 | 587 | 445 | 524 | 61 | 43 | 3 | 2 | 1,051 | 1,156 | 2,207 | ||||
| No formal school qualifications | 156 | 130 | 944 | 841 | 1,055 | 992 | 248 | 282 | 20 | 23 | 2 | – | 2,425 | 2,268 | 4,693 |
| Total | 156 | 130 | 944 | 841 | 1 597 | 1 580 | 1 079 | 1 289 | 549 | 535 | 51 | 36 | 4 376 | 4 411 | 8 787 |
Table 9.7 sets out the number of schools providing education for children at the primary and intermediate (forms 1 and 2) level. The reduction in the number of state primary schools as indicated in this table can be attributed to the closure of a number of schools where rolls had fallen below nine pupils.
Table 9.7. PRIMARY SCHOOLS
| 1983 | 1984 | 1985 | 1986 | 1987 | |
|---|---|---|---|---|---|
* These schools also cater for students at secondary school ages. Source: Department of Education. | |||||
| State full primary schools | 1,142 | 1,135 | 1,129 | 1,127 | 1,118 |
| State contributing primary schools | 1,023 | 1,022 | 1,022 | 1,016 | 1,013 |
| Intermediate and attached intermediate schools | 170 | 169 | 169 | 169 | 167 |
| Private primary, intermediate and special schools | 61 | 61 | 66 | 69 | 76 |
| Composite private schools* | 21 | 28 | 29 | 27 | 27 |
| Departmental and Social Welfare special schools* | 25 | 25 | 26 | 24 | 23 |
| Special schools under board control* | 62 | 60 | 58 | 58 | 56 |
| Correspondence School* | 1 | 1 | 1 | 1 | 1 |
| Area schools* | 35 | 35 | 36 | 36 | 35 |
| State forms 1–7 schools* | 52 | 52 | 52 | 52 | 53 |
| Private forms 1–7 schools* | 6 | 6 | 6 | 6 | 6 |
Table 9.8. SIZES OF GENERAL CLASSES AT PRIMARY SCHOOLS
| Year | Number of pupils at 30 September* | ||||||||||||
|---|---|---|---|---|---|---|---|---|---|---|---|---|---|
| 0–19 | 20–24 | 25–29 | 30–34 | 35–39 | 40 and over | Total | |||||||
| Classes | % | Classes | % | Classes | % | Classes | % | Classes | % | Classes | % | ||
*Includes general classes at state full-contributing, intermediate, attached intermediate and area schools. In 1987 there were 703 special classes at state schools: 694 with 0–19 pupils, 9 with 20–24 pupils. Source: Department of Education. | |||||||||||||
| 1983 | 2,156 | 12.9 | 2,378 | 14.2 | 4,644 | 27.6 | 6,129 | 36.5 | 1,458 | 8.7 | 10 | 0.1 | 16,775 |
| 1984 | 2,170 | 13.2 | 2,384 | 14.5 | 4,472 | 27.2 | 5,966 | 36.3 | 1,408 | 8.6 | 15 | 0.1 | 16,415 |
| 1985 | 2,262 | 14.2 | 2,667 | 16.7 | 4,191 | 26.2 | 5,625 | 35.2 | 1,236 | 7.7 | 7 | - - | 15,988 |
| 1986 | 2,319 | 14.6 | 2,754 | 17.4 | 4,285 | 27.0 | 5,463 | 34.4 | 1,043 | 6.6 | 7 | - - | 15,871 |
| 1987 | 2,308 | 14.5 | 2,645 | 16.7 | 4,096 | 25.8 | 5,371 | 33.8 | 1,136 | 7.2 | – | - - | 15,556 |
Table 9.9 shows the number of schools providing secondary education. Figures exclude the secondary department of the Correspondence School.
At 1 July 1987, of the 314 state form 3–7 and form 1–7 secondary schools, 218 were co-educational, 46 for boys only and 50 for girls only. Most of the private schools are single-sex schools.
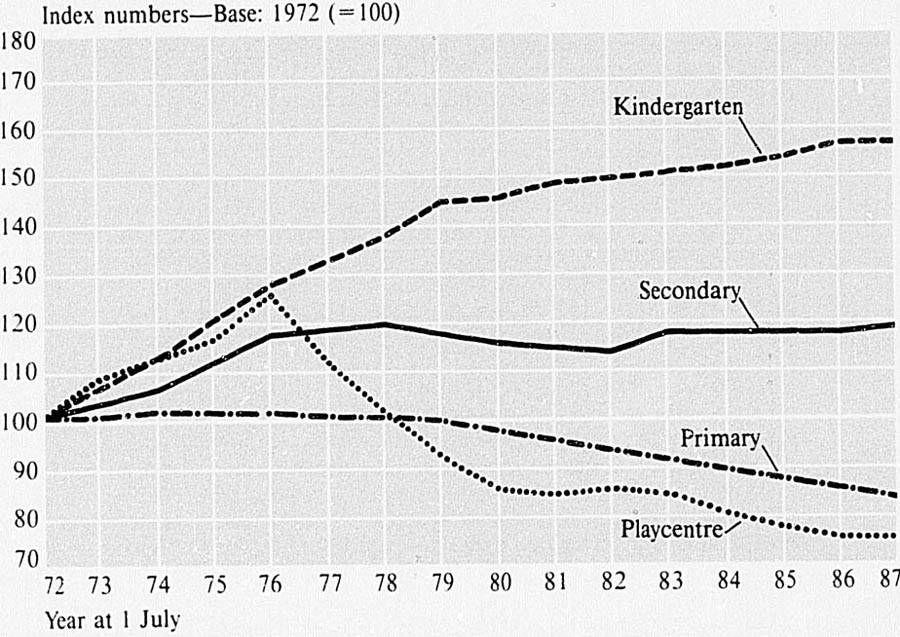
ENROLMENT GROWTH—up to secondary level
In order to give children in country districts the advantage of special equipment and more specialised teaching in larger schools, the consolidation of the smaller rural schools has been a feature of the last 30 years. Composite schools have been developed in recent years to bring together larger concentrations of children from form 1 and above. These are known as ‘form 1 to 7 schools’ and ‘area schools’.
The first form 1 to 7 school was opened in 1962 and by 1987 there were 59 (including six private) of these schools. This type of school developed from the secondary departments of district high schools, with the addition of form 1 and 2 pupils from neighbouring primary schools. They receive improved staffing, accommodation, and equipment in order to promote equality of educational opportunity for country children.
However, a large number of form 1 and 2 children remain in country districts which are too small to support a form 1–7 school. In these districts, area schools have been established. Area schools provide education from the infant stage to form 7 for all children in the immediate vicinity, and from form 1 upwards for children from contributing schools over a wider area. The first area school was opened in 1969 and at 1 July 1987 there were 35.
In 1987 there were 65 hostels for state secondary schools and 23 private schools provided hostel accommodation.
The Correspondence School provides courses for four major categories of students: pre-schoolers, full-time students obtaining all their education through the school; students enrolled in New Zealand primary or secondary schools but doing one or more subjects with the Correspondence School; adult part-time students who wish to continue their basic education; and teachers who wish to obtain additional qualifications at a tertiary level.
The school roll on 1 October 1987 was 20 692, made up of 507 pre-school; 777 primary; 696 special-needs section (pupils with significant educational handicaps); 1117 individual programme section (pupils needing remedial tuition); 1141 secondary; 5880 students at secondary schools; and 10 574 other part-time students.
The 1141 full-time secondary students were enrolled for a variety of reasons—268 because of isolation, 159 for medical reasons, 187 New Zealand children living overseas, 116 pregnant women, 62 in institutions, 65 school suspensions, 89 with school phobia and other psychological problems, and 73 adult full-time, 58 itinerant and 58 students who are also enrolled at other secondary schools.
For full-time students the school provides daily lessons by radio, club activities, a school magazine, periodic exhibitions of work, and parent and ex-pupil associations.
Personal contact between students and the school is strengthened by resident teachers based in major centres who visit families regularly. Visits are also made by teachers from the school. At the district level, school-day and school-week gatherings are held periodically. A residential school for invited pupils is conducted each year to provide children with an opportunity for social education by taking part in group activities. This schooling lasts for four weeks.
The total staff of the Correspondence School in 1987 was 527. Of this number, 350 were secondary teachers, 94 primary teachers (including those in special-needs and individual programme sections), 17 pre-school teachers, and 66 administrative staff.
Table 9.10. STUDENT NUMBERS
| Type of institution | At 1 July | ||
|---|---|---|---|
| 1985 | 1986 | 1987 | |
| Source: Department of Education. | |||
| Pre-school— | |||
| Non-profit-making groups | 3,041 | 3,879 | 3,612 |
| Playcentres | 14,923 | 14,509 | 14,412 |
| Kindergartens | 41,170 | 41,822 | 41,971 |
| Pre-school classes at primary schools | 1,044 | 1,052 | 983 |
| Correspondence School | 488 | 713 | 749 |
| 60,666 | 61,975 | 61,727 | |
| Primary (juniors to form 2)— | |||
| Primary schools | 352,954 | 344,907 | 340,631 |
| Intermediate schools and attached intermediate | 72,817 | 69,824 | 66,178 |
| Area and district high schools | 6,580 | 5,964 | 5,502 |
| Forms 1 and 2 at form 1 to 7 schools | 7,160 | 6,995 | 6,963 |
| Correspondence School | 1,599 | 1,606 | 1,696 |
| Departmental special schools | 224 | 201 | 259 |
| Department of Social Welfare schools | 40 | 46 | 39 |
| Royal New Zealand Foundation for the Blind | 61 | 68 | 93 |
| Private primary schools | 10,991 | 11,417 | 11,611 |
| 452,426 | 441,028 | 432,972 | |
| Secondary (form 3 to form 7)— | |||
| State form 3 to form 7 schools | 200,564 | 200,383 | 201,075 |
| Forms 3 to 7 at state form 1 to 7 schools | 13,954 | 13,917 | 14,664 |
| Area schools (form 3 to form 7) | 3,199 | 3,191 | 3,097 |
| Correspondence School | 1,053 | 1,109 | 1,190 |
| Departmental special schools | 370 | 330 | 214 |
| Department of Social Welfare schools | 296 | 266 | 214 |
| Private secondary schools | 11,534 | 11,816 | 11,853 |
| Total | 230 970 | 231 012 | 232 307 |
An estimated 31 889 Maori pupils were receiving secondary education at 1 July 1987. This number comprise 31 183 pupils attending state secondary schools and 706 pupils attending private secondary schools.
Table 9.11. TEACHING STAFF
| Institution | Positions (full-time equivalents) | Full-time staff 1987 | Total | ||
|---|---|---|---|---|---|
| 1986 | 1987 | Male | Female | ||
* All staff are part-time. † Includes teachers at full and contributing primary schools, intermediate schools, board schools, special schools, attached intermediates, teachers of special classes, special-needs teachers, primary teachers at correspondence school and reading recovery teachers. ‡ Includes advisers, psychologists, speech and reading teachers, and teachers not employed under staffing schedules such as visiting teachers, itinerant teachers, museum and zoo teachers, pool relief, physiotherapists, etc. § Includes all staff at form 1–7 schools. ¶ Includes staff at Department of Education, Social Welfare and Justice special schools. Source: Department of Education. | |||||
| Pre-school— | |||||
| Playcentres* | 246 | 245 | ... | ... | ... |
| Kindergartens | 1,305 | 1,336 | 16 | 1,302 | 1,318 |
| Primary— | |||||
| State† | 18,830 | 18,403 | 5,317 | 12,386 | 17,703 |
| Private | 336 | 348 | 121 | 192 | 313 |
| Supporting services‡ | 1,100 | 1,133 | 337 | 569 | 906 |
| Area schools | 578 | 544 | 285 | 251 | 536 |
| Composite private schools | 630 | 649 | 220 | 341 | 561 |
| Manual training | 692 | 691 | 323 | 351 | 674 |
| Secondary— | |||||
| State§ | 14,344 | 14,456 | 7,299 | 5,629 | 12,928 |
| Private | 433 | 449 | 306 | 98 | 404 |
| Departmental special schools¶ | 210 | 170 | 62 | 96 | 158 |
The ratios shown in the graph have been revised to reflect more accurately the number of pupils needed to generate each additional teacher. Previous ratios were generated by dividing the primary and secondary rolls at 1 July by the entitlement to staff in each branch. The revised primary ratio uses the 30 September roll divided by entitlement, while the secondary roll uses the 1 March roll divided by entitlement. Manual training teachers are now included with primary teachers for the purpose of calculating ratios. The introduction of a 1:20 ratio in junior classes at primary schools appears in the lower-primary ratios in 1985, 1986, and 1987. The introduction of extra secondary teachers in response to the report of a secondary staffing working party also shows up in the secondary ratios for 1985, 1986, and 1987.
A projection of roll numbers at 1 July, made in 1987 by the Department of Education and based on policies and trends at the time, is set out in table 9.12.
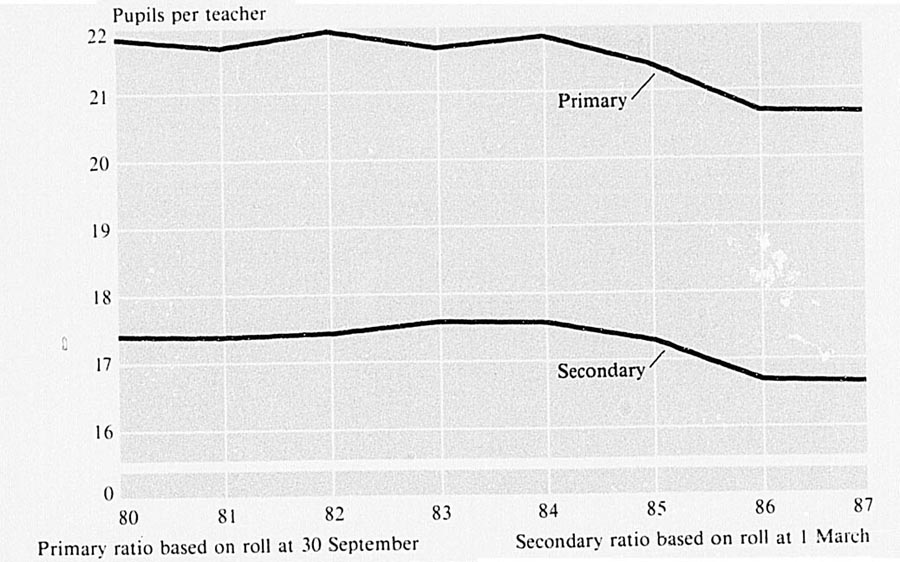
TEACHER-PUPIL RATIO IN STATE SCHOOLS
The value of school boarding and course bursaries is $1,485 a year. The number of pupils receiving boarding bursaries during 1987 was 3072 compared with 3155 the previous year. A total of 334 course bursaries were awarded in 1987, compared with 377 in 1986.
During the 1987 school year nearly 17 percent of the total school population received transport assistance. Most pupils used buses operated under contract to education boards or operated by the Department of Education.
The school transport service carried 107 832 students to and from school daily on 4920 separate transport services which covered over 50 million kilometres. A further 6555 children received private and public transport allowances. It is estimated that nearly $71 million will be spent on school transport in the 1988–89 financial year.
Whenever possible, children with physical or other disabilities are enrolled with other children at ordinary pre-school services and in ordinary classes at their local primary or secondary school. When necessary, buildings are modified, special equipment is provided, and ancillary staff are appointed to assist the teachers. Department of Education inspectors, psychologists, and other specialist advisers also help teachers develop suitable teaching programmes.
A comprehensive range of special education services has been developed for children whose special needs cannot be met in ordinary classes. Small part-time groups for pre-school children with disabilities are attached to selected kindergartens and playcentres. Education boards provide special classes, units and resource centres at primary schools or separate special schools for pupils with intellectual, hearing, sight and physical disabilities, and for children who need careful assessment of their teaching needs as they enter primary school.
The education boards administer special classes in hospitals, special schools in psychiatric hospitals, speech/language clinics and reading clinics, and employ teachers to assist children in ordinary classes who have a hearing disability or serious reading difficulties.
A network of special schools and classes is supported by four specialised guidance services which also assist children in ordinary classes: the Hearing Assessment and Guidance Service offers guidance to the parents and teachers of deaf children; the Visiting Teacher Service liaises between teachers and the parents of pupils whose progress at school may be hampered by home difficulties; Advisers on Children with Handicaps provide guidance and advice for parents and teachers of these children; and the Psychological Service provides a comprehensive diagnostic and advisory service for children who have learning or social difficulties by maintaining a close liaison with all primary and secondary school guidance staff and with all health, education, and welfare services for children. These four services assisted approximately 31 000 pre-school and school-age children in 1987.
The training of teachers is carried out at the Auckland College of Education and the Wellington College of Education and teachers colleges in Hamilton, Palmerston North, Christchurch and Dunedin. An outpost centre for a small number of secondary teacher trainees is located at Invercargill under the control of the Dunedin Teachers College.
From 1988 early childhood worker and teacher trainees have been able to take integrated three-year programmes at Dunedin and Palmerston North teachers colleges. Courses are being established progressively at other colleges while existing programmes are continuing in the interim. The Advanced Studies for Teachers Unit at Palmerston North Teachers College, and Massey University, offers advanced courses for all early childhood education workers and teachers.
The normal course of training for student-teachers (division A) is a period of three years at a teachers college followed by two years of satisfactory teaching in a state primary school. Courses may be shortened to two years for trainees who are university graduates or who are partway through degree courses or for mature trainees with relevant work experience.
Primary teacher trainees are encouraged to undertake university study. Those at teachers colleges in Hamilton, Palmerston North, Christchurch and Dunedin enrol for the Bachelor of Education offered by the universities in those centres. Trainees at Auckland and Wellington may gain cross-credits from their college courses towards degrees from Auckland or Victoria Universities.
The minimum academic entry qualification for primary teachers training for students under 20 years is Sixth Form Certificate with an acceptable grade in one subject. There is no academic requirement for student-teachers over 20 years old.
Students who wish to become speech/language therapists are selected after their first year of training at teachers training college. A new training programme leading to a four-year Bachelor of Education (Speech/Language Therapy) is being developed at Christchurch.
Postgraduate courses for teachers who wish to be trained as teachers of people with disabilities are available at Auckland, Palmerston North and Christchurch. Specialist post-graduate training courses for teachers of the deaf and visually impaired are located at Auckland and Christchurch.
There is also a postgraduate course for bilingual (Maori/English) teachers available at Hamilton Teachers College.
There are several course options for people wishing to train as secondary teachers. For graduates and those with other approved advanced qualifications there is a one-year course. Students with University Entrance may be accepted into division B which involves up to four years consecutive or concurrent study at either the Auckland College of Education or the Christchurch Teachers College. The study is at either the local university or polytechnic. At Hamilton, division B consists of an intermediate full-time university year followed by four years of professional study at both the teachers college and the University of Waikato.
Table 9.14. STUDENTS ATTENDING TEACHERS COLLEGES AT 1 JULY
| Type of course | 1983 | 1984 | 1985 | 1986 | 1987 | |||||
|---|---|---|---|---|---|---|---|---|---|---|
| M | F | M | F | M | F | M | F | M | F | |
* Includes speech/language and Pacific Island supplementary training students. Source: Department of Education. | ||||||||||
| Students at teachers colleges | ||||||||||
| Kindergarten— | ||||||||||
| Division E | 4 | 209 | 1 | 182 | 1 | 153 | 2 | 209 | 8 | 316 |
| Primary— | ||||||||||
| Division A* | 399 | 2,083 | 328 | 1,486 | 364 | 1,583 | 449 | 1,972 | 500 | 2,306 |
| Postgraduate courses | 19 | 38 | 11 | 43 | 14 | 45 | 27 | 60 | 8 | 72 |
| Secondary— | ||||||||||
| Division B | 97 | 234 | 74 | 137 | 86 | 89 | 54 | 87 | 41 | 88 |
| Division C | 133 | 210 | 136 | 197 | 165 | 203 | 282 | 320 | 343 | 319 |
| Other one-year courses | 3 | - | 6 | 4 | - | - | - | - | - | - |
| Total at teachers college by sex | 655 | 2 774 | 556 | 2 049 | 630 | 2 073 | 814 | 2 648 | 900 | 3 101 |
| Total at teachers college | 3 429 | 2 605 | 2 703 | 3 462 | 4 001 | |||||
| Students attending university or polytechnic full-time | ||||||||||
| Primary— | ||||||||||
| Division A | 38 | 181 | 30 | 189 | 36 | 100 | 11 | 44 | 12 | 68 |
| Secondary— | ||||||||||
| Division B | 252x | 347x | 153x | 240x | 108x | 211x | 118x | 246x | 120 | 255 |
| Total students full-time at university or polytechnic by sex | 290 | 528 | 183 | 429 | 144 | 311 | 129 | 290 | 132 | 323 |
| Total at university or polytechnic | 818 | 612 | 455 | 419 | 455 | |||||
A wide range of extramural professional education papers is offered to teachers. The majority of the papers are intended to provide credits towards diploma qualifications and service increments for certified teachers.
The Advanced Studies for Teachers Unit at Palmerston North Teachers College caters for the continuing education of teachers and other adult learners. It is a distance education teaching department within the college, with a core of permanent professional tutoring and administrative staff. Part-time tutoring of many of the courses is also done by teachers college staff throughout New Zealand.
Teachers colleges and the colleges of education offer a range of approved after-hours advanced study courses for teachers who wish to advance their professional qualifications. Upon successful completion of courses teachers may gain credit towards the Higher or Advanced Diploma of Teaching or a service increment.
Since they began in 1979, 13 rural education activities programmes have been established. They provide extra resources to certain relatively isolated and sparsely populated rural areas.
The resources offered include: pre-school staffing; guidance and visiting teachers; curriculum support for teachers through advisers or seconded teachers; an organiser to develop continuing education; additional staffing in rural secondary schools; and assistance to develop liaison between schools.
Each programme has a different emphasis depending on local needs. In one area emphasis in the support services is on providing advisers in music, Maori and Pacific Island education, and junior classes, together with support for teachers in area schools and smaller secondary schools in the district. While another district places emphasis on developing preschool services and the planning of co-ordinated programmes to be used by the main school and those contributing to it.
District management committees have been established as an integral part of the programmes. They comprise those with pre-school interests, teacher organisations, continuing education groups, school controlling authorities, service organisations, and other interested groups. As each committee represents the interests of its district, it takes a significant part in identifying local educational requirements and in co-ordinating the use of resources.
The districts in which REAPs have been set up are the Far North, eastern Bay of Plenty, East Coast, Central Plateau, central King Country, Taihape-Ruapehu, south Hawke's Bay, Wairarapa, Marlborough, Westport-Buller, West Coast, Central Otago, and Southland.
The Department of Education employs education officers (early childhood education), to give advice and guidance and monitor the standards of all early childhood groups. They also operate an equipment pool which all non-profit-making groups can use.
Teachers have the assistance of advisers in a variety of fields, including science, physical education, art and crafts, reading, mathematics, music, Maori language programmes, and English language programmes for Maori and Pacific Island Polynesian children. Itinerant advisers are also available to help teachers in small rural schools and teachers of infant classes. Specialist assistance in helping children with special needs is provided by psychologists, speech therapists, visiting teachers, advisers on deaf children, and through resource centres for people with disabilities.
In 1987, 1600 full-time equivalent teachers were employed by the state, either full-time or part-time, in the special education and guidance services. A total of 8849 children were enrolled in special classes and schools, and 6483 children at speech and reading clinics.
With the transfer of the former Broadcasts-to-Schools service from Radio New Zealand to the Department of Education late in 1979, there has been a change in emphasis from live broadcasts to the development of a tape-bank service to schools.
The production of pre-school, current events, and Correspondence School programmes is contracted to Radio New Zealand. The department has two studios in the Correspondence School complex in Wellington. These studios are used to produce a wide range of audio cassettes, as part of learning packages in support of many curriculum subjects and for the Correspondence School.
The unit develops resources in subjects which have a strong aural element, such as music, languages, and literature; reinforce early reading with read-along cassettes; develop the skills of attentive listening and creative image-making and stimulate interest and broaden understanding through documentary programmes.
The National Film Library was founded in 1942, and is the responsibility of the Department of Education. Educational films and videos are lent to financial members and distributed locally from branches in Auckland, Wellington and Christchurch. The Wellington office also offers a service to the Chatham Islands and to Western Samoa, Tokelau, Niue, Pitcairn, and the Cook Inlands.
Each year the library buys films and video recordings. Stocks have also been built up by valuable gifts from diplomatic missions, other government departments, and various organisations and commercial enterprises. The National Film Library now holds some of the diplomatic film libraries, which are supplemented by the embassies from time to time.
The library has approximately 33 000 prints of 7200 titles and 4500 copies of 500 video titles. In 1987 films and videos were issued to 3000 educational institutions and over 400 community organisations. The National Film Library also offers a record, cassette and compact disc loan service, a sample sheet music service and loan of the Claude Laurie Music Collection. These services are limited to educational institutions only.
The audio library holds more than 8300 discs, 15 000 audio cassettes and 60 compact discs.
Approximately 300 000 school children make visits to museums every year. Fifteen full-time and four part-time museum education officers, employed by the Department of Education, assist schools to utilise the educational resources of the museums. Museum education services now cater for students from pre-school to tertiary levels.
The School Publications Branch of the Department of Education publishes a wide range of titles for children, teachers and others with an interest in education. They are issued free to schools and other educational institutions, and most are available for purchase.
The School Journal, which has been published since 1907, is a miscellany of fiction and non-fiction of particular interest to New Zealand children. It has long been a major and popular resource for reading and teaching. Fifteen issues are published in four parts annually, catering for four broad levels in the primary school. The School Journal Story Library is a series of high-interest titles for less able readers. The Junior Journal is a magazine catering for children between the upper levels of Ready to Read and the Part I School Journal.
Booklets and kitsets are also published for children on particular curriculum topics.
A textbook programme includes the Ready to Read series, for teaching children to read, School Mathematics, a series for standards 1 to 4 and Beginning School Mathematics, a programme for junior classes.
The School Publications Branch is a major publisher of Maori language material. These include Te Wharekura and Te Tautoko for secondary schools, and He Purapura, a series for primary school children. Other publications include Te Rangatahi textbooks, and various guide books for teachers of Maori language and culture. Booklets in several Pacific Island languages are also being developed.
Publications for teachers include syllabuses, handbooks and other materials to support developments in all subjects of the curriculum. The Education Gazette, the department's fortnightly office circular to the education service, is also published by the branch.
There are six separate universities and a university college of agriculture. They are the University of Auckland, the University of Waikato (at Hamilton), Massey University (at Palmerston North), Victoria University of Wellington, the University of Canterbury (at Christchurch), the University of Otago (at Dunedin), and Lincoln College, a constituent agricultural college of the University of Canterbury.
All universities offer courses in the usual faculties of arts, science, and commerce, whilst law and music courses are available at Auckland, Victoria, Canterbury, and Otago. Most universities specialise in certain fields. The University of Otago provides courses in medicine, dentistry, surveying, home science, physical education, and pharmacy; the University of Canterbury in forestry, engineering and fine arts; Lincoln College in topics related to agriculture and horticulture; the University of Auckland in architecture, planning, engineering, medicine, optometry and fine arts; and Victoria University of Wellington in architecture, public administration, and social work. Massey University has courses in agriculture, horticulture, food technology, and veterinary science, as well as extramural tuition in a number of subjects for students throughout New Zealand. Joint courses leading to the degree of Bachelor of Education are available at Waikato, Massey, Canterbury, and Otago universities in association with the local teachers colleges.
Each university sets its own programme, and each university council sets the dates for terms. Typically, the university academic year runs from late February to early November each year.
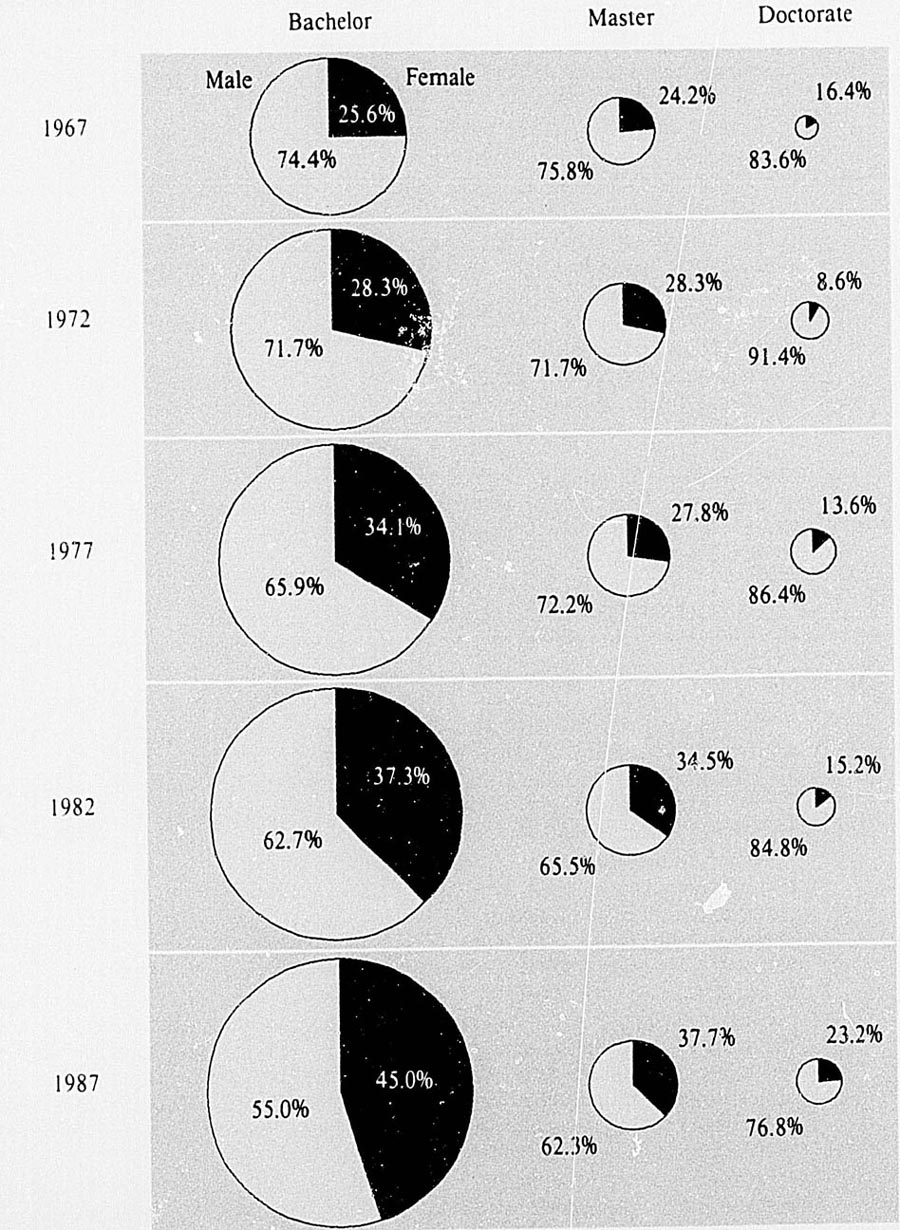
UNIVERSITY DEGREES AWARDED—selected years, 1967–87
Table 9.15. UNIVERSITY COURSES TAKEN BY INTERNAL STUDENTS, 1987
| Course* | Enrolled at 1 July | ||
|---|---|---|---|
| Males | Females | Total | |
* Includes degree, diploma and certificate courses. Source: Department of Education. | |||
| Agriculture | 1,240 | 332 | 1,572 |
| Architecture and building science | 612 | 240 | 852 |
| Arts and humanities | 4,993 | 9,609 | 14,602 |
| Commerce and business administration | 6,701 | 3,821 | 10,522 |
| Communications (incl. journalism, librarianship) | 43 | 76 | 119 |
| Dentistry | 147 | 86 | 233 |
| Divinity and theology | 112 | 55 | 167 |
| Education | 598 | 2,161 | 2,759 |
| Engineering | 2,435 | 192 | 2,627 |
| Fine arts | 135 | 191 | 326 |
| Forestry science | 143 | 22 | 165 |
| Home science | 3 | 256 | 259 |
| Horticulture | 381 | 249 | 630 |
| Law and jurisprudence | 2,416 | 2,201 | 4,617 |
| Medicine and health-related | 1,051 | 1,000 | 2,051 |
| Music | 215 | 314 | 529 |
| Optometry | 31 | 40 | 71 |
| Parks and recreation | 128 | 115 | 243 |
| Pharmacy | 61 | 106 | 167 |
| Physical education | 165 | 197 | 362 |
| Resource planning and management | 20 | 16 | 36 |
| Science | 4,929 | 2,718 | 7,647 |
| Social sciences | 575 | 1,073 | 1,648 |
| Social work | 81 | 313 | 394 |
| Surveying and town planning | 245 | 117 | 362 |
| Technology | 383 | 202 | 585 |
| Valuation and property management | 251 | 83 | 334 |
| Veterinary science | 216 | 229 | 445 |
| Other | 397 | 332 | 729 |
| Total | 28 707 | 26 346 | 55 053 |
| Adjustment for students enrolled in more than one course | 1,659 | 1,355 | 3,014 |
| Total | 27 048 | 24 991 | 52 039 |
Table 9.16. DEGREE GRADUATES FROM NEW ZEALAND UNIVERSITIES, 1987
| Degrees awarded | First degree | Post-graduate* |
|---|---|---|
* Excluding doctorates, of which there were 212 awarded in 1987. Source: Department of Education. | ||
| Agriculture | 207 | 34 |
| Architecture and building science | 111 | 10 |
| Arts | 1,772 | 430 |
| Commerce and business administration | 1,368 | 153 |
| Dentistry | 41 | 3 |
| Divinity and theology | 22 | 14 |
| Education | 255 | 41 |
| Engineering | 258 | 300 |
| Fine arts | 52 | 4 |
| Forestry science | 16 | 18 |
| Home science | 28 | 2 |
| Horticulture | 93 | 16 |
| Law and jurisprudence | 352 | 81 |
| Medicine (incl. human biology) | 340 | 8 |
| Mineral technology | 7 | 5 |
| Music | 54 | 17 |
| Optometry | 10 | - |
| Pharmacy | 19 | 5 |
| Physical education | 56 | - |
| Regional and resource planning | 7 | 22 |
| Science | 1,104 | 476 |
| Social sciences | 144 | 23 |
| Social work | 41 | 10 |
| Surveying | 22 | - |
| Technology | 27 | 36 |
| Town planning | 27 | - |
| Valuation and property management | 73 | - |
| Veterinary science | 55 | 11 |
| Total | 6 561 | 1 719 |
The most prestigious awards for those entering university are the University Junior Scholarships. These scholarships are tenable for three to five years, depending upon the minimum time in which the holder, studying full-time, could complete the recognised course taken under the scholarship. The University Junior Scholarship provides a scholarship allowance of $500 a year and is tenable with a tertiary study grant. These scholarships, together with privately-endowed scholarships, are awarded on the results of the Entrance Scholarships Examination conducted by the Universities Entrance Board.
Scholarships awarded during degree courses include senior scholarships from the individual universities and Lincoln College, and of a value to be determined by them. The various university institutions also have private scholarships for which their own students may compete. Scholarships awarded at the end of the university course are listed in full in the university calendars. Most of the post-graduate scholarships tenable in New Zealand, are awarded by the University Grants Committee for two-and-a-half years, but may be extended for six months in special circumstances. Post-doctoral scholarships are also awarded by the University Grants Committee.
A and B Bursaries of $200 and $100 a year are awarded to students who gain A or B passes in the University Bursaries Examination.
All these grants are subject to strict rules. A student who in any year does not pass a prescribed number of units or subjects at a stated level will have his/her grant suspended and it will not be reinstated unless in a subsequent year of study he/she is credited with the prescribed number of passes.
Students enrolled either part-time or full-time who have qualified for entrance to the university may be awarded 75 percent of their tuition fees.
Tertiary study grants are awarded to students enrolled in a full-time programme at tertiary level which is recognised for tertiary assistance grants purposes.
A tertiary study grant may be held simultaneously with a fees grant. In 1987 the basic grant was $41 a week.
Students receiving a tertiary study grant are also eligible for an accommodation grant of $37.50 a week, subject to certain conditions.
Students awarded a tertiary study grant may also apply for hardship and special hardship grants. A hardship grant is available only to students who have abnormally high costs in certain specified areas (recognised as not generally borne by the majority of students), and who, in addition, are able to demonstrate severe hardship. There is also provision for students with dependants, or students in some exceptional circumstances, to receive a special hardship grant of up to $58 a week. This is paid in addition to the study grant and, if applicable, the accommodation grant.
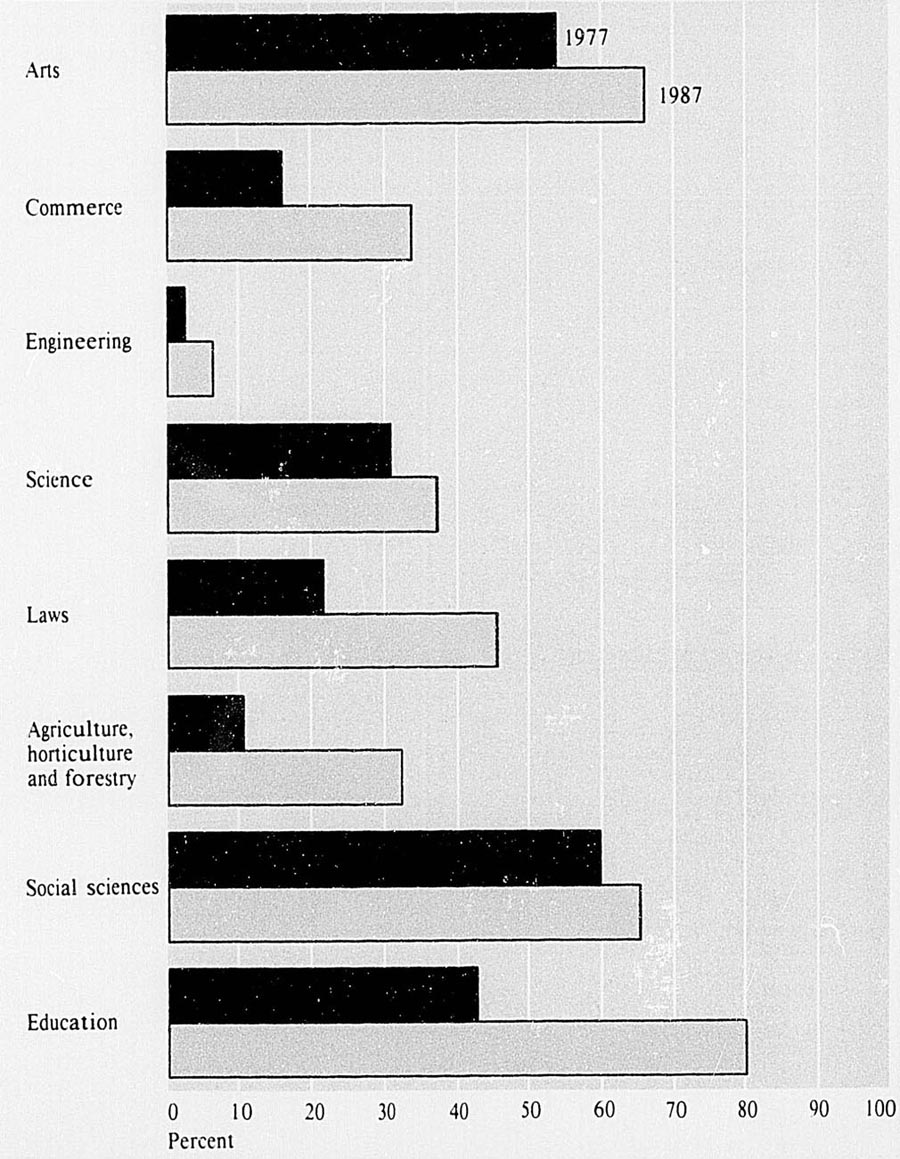
PERCENTAGE OF BACHELOR (INCL. HONOURS) DEGREES AWARDED TO WOMEN IN SELECTED FIELDS, 1977 AND 1987
The tertiary study grant is also tenable for full-time courses at technical institutes, teachers colleges and a small number of other state-funded institutes.
Further details of the amounts payable and other conditions for these grants and bursaries are available from university liaison officers and from the head office of the Department of Education.
Table 9.17. FORMS OF ASSISTANCE TO INTERNAL UNIVERSITY STUDENTS*
| Form of assistance | Awards at 1 July | |
|---|---|---|
| 1986 | 1987 | |
* Does not include overseas students. Students may receive more than one award. † Students are also included under the tertiary study grant category. Source: Department of Education. | ||
| Fees grants (full-time) | 642 | 153 |
| Fees grants (part-time) | 703 | 543 |
| Tertiary study grants (incl. fees grants) | 26,719 | 28,992 |
| Accommodation grants* | 17,353 | 18,795 |
| Hardship grants* | 115 | 127 |
| Special hardship grants* | 80 | 68 |
| A Bursaries* | 9,792 | 10,732 |
| B Bursaries* | 6,216 | 6,606 |
| Teachers’ university studentships | 111 | 82 |
| Secondary teacher studentships | 409 | 393 |
| Teachers bursaries | 9 | 51 |
| Teachers college students’ fees | 1,753 | 1,987 |
| Rehabilitation and war bursaries | 3 | 1 |
| All government study awards | 1,005 | 774 |
| Health bursaries | 1 | - |
| Maori and Polynesian scholarships | 54 | 67 |
| Tu Tangata management programme | 54 | 54 |
| Total | 65 019 | 69 425 |
Table 9.18. ASSISTED INTERNAL OVERSEAS STUDENTS AT NEW ZEALAND UNIVERSITIES, 1987
| Nature of assistance | At 1 July | ||
|---|---|---|---|
| Males | Females | Total | |
| Source: Department of Education. | |||
| Assisted by the New Zealand Government— | |||
| Official Development Assistance (Ministry of Foreign Affairs) | 336 | 148 | 484 |
| Commonwealth scholarships | 32 | 10 | 42 |
| Exchange students | 4 | 2 | 6 |
| Government departments (other than Ministry of Foreign Affairs) | 19 | 3 | 22 |
| University Grants Committee or university grant | 5 | 2 | 7 |
| United Nations development | 28 | 1 | 29 |
| Others | 9 | 4 | 13 |
| Subtotal | 433 | 170 | 603 |
| Other assistance from— | |||
| Fijian Government | 21 | 2 | 23 |
| Malaysian Government | 47 | 57 | 104 |
| Other government | 21 | 12 | 33 |
| Fulbright awards | 1 | 2 | 3 |
| Lee Foundation | 11 | 14 | 25 |
| Ford Foundation | 1 | 2 | 3 |
| Rotary | 5 | 5 | 10 |
| Other | 5 | 1 | 6 |
| Subtotal | 112 | 95 | 207 |
| Total, assisted internal overseas students | 545 | 265 | 810 |
Table 9.19. UNIVERSITY STAFF, 1987*
| Position | Full-time | Part-time | ||||
|---|---|---|---|---|---|---|
| Males | Females | Total | Males | Females | Total | |
* At 1 July. Source: Department of Education. | ||||||
| Filled teaching posts— | ||||||
| Professors | 332 | 15 | 347 | 57 | 1 | 58 |
| Associate professors | 362 | 36 | 398 | 34 | 4 | 38 |
| Senior lecturers | 1,226 | 145 | 1,371 | 413 | 62 | 475 |
| Lecturers | 441 | 207 | 648 | 30 | 44 | 74 |
| Assistant lecturers | 66 | 89 | 155 | 30 | 24 | 54 |
| Instructors and demonstrators (if engaged in teaching) | 69 | 45 | 114 | 1,358 | 718 | 2,076 |
| Total | 2 496 | 537 | 3 033 | 1 922 | 853 | 2 775 |
| Vacant teaching posts— | 184 | |||||
| Entitlement of academic staff = 3630 full-time equivalents | ||||||
| Non-teaching staff— | ||||||
| Administrative, clerical and typing | 161 | 788 | 949 | 11 | 276 | 287 |
| Technical | 756 | 309 | 1,065 | 37 | 136 | 173 |
| Data processing | 117 | 51 | 168 | 3 | 12 | 15 |
| Central administration | 138 | 140 | 278 | 8 | 57 | 65 |
| Library | 81 | 261 | 342 | 15 | 100 | 115 |
| Student welfare | 29 | 34 | 63 | 13 | 32 | 45 |
| Printing and binding | 58 | 48 | 106 | – | 9 | 9 |
| Other (grounds, trades and cleaners) | 434 | 50 | 484 | 191 | 418 | 609 |
| Total non-teaching staff | 1 774 | 1 681 | 3 455 | 278 | 1 040 | 1 318 |
Table 9.20. UNIVERSITY STUDENTS
| Year | Internal students | External students | Total | ||
|---|---|---|---|---|---|
| Males | Females | Males | Females | ||
| Source: Department of Education. | |||||
| 1983 | 25,600 | 20,870 | 3,795 | 6,248 | 56,513 |
| 1984 | 25,808 | 21,645 | 4,020 | 6,769 | 58,242 |
| 1985 | 25,664 | 22,135 | 4,583 | 7,486 | 59,868 |
| 1986 | 25,938 | 23,427 | 4,752 | 7,862 | 61,979 |
| 1987 | 27,048 | 24,991 | 5,634 | 8,762 | 66,435 |
At July 1987 there were 37 074 full-time university students and 14 965 part-time students as compared with 35 177 full-time students and 14 188 part-time students at 1 July 1986. Of this number, 14 396 students studied extra murally.
Table 9.21. UNIVERSITY ENROLMENTS, 1987*
| Enrolments | External students | ||||||||
|---|---|---|---|---|---|---|---|---|---|
| Internal students | |||||||||
| Sex | Full-time | Part-time | Total | At Massey University | At own university | Total | Total students | Overseas students included | |
* At 1 July. Source: Department of Education. | |||||||||
| Auckland | M | 5,459 | 1,802 | 7,261 | 40 | 14 | 54 | 7,315 | 356 |
| F | 3,904 | 2,420 | 6,324 | 80 | 4 | 84 | 6,408 | 212 | |
| Waikato | M | 1,519 | 595 | 2,114 | 15 | – | 15 | 2,129 | 105 |
| F | 1,489 | 1,363 | 2,852 | 29 | – | 29 | 2,881 | 87 | |
| Massey | M | 2,873 | 525 | 3,398 | 5,305 | – | 5,305 | 8,703 | 231 |
| F | 2,222 | 880 | 3,102 | 8,317 | – | 8,317 | 11,419 | 137 | |
| Victoria | M | 2,913 | 1,427 | 4,340 | 52 | 12 | 64 | 4,404 | 382 |
| F | 2,608 | 1,518 | 4,126 | 101 | 9 | 110 | 4,236 | 347 | |
| Canterbury | M | 3,680 | 944 | 4,624 | 31 | 1 | 32 | 4,656 | 375 |
| F | 2,372 | 1,508 | 3,880 | 60 | 3 | 63 | 3,943 | 196 | |
| Lincoln | M | 1,135 | 52 | 1,187 | 2 | – | 2 | 1,189 | 98 |
| F | 455 | 29 | 484 | 1 | – | 1 | 485 | 32 | |
| Otago | M | 3,383 | 741 | 4,124 | 30 | 132 | 162 | 4,286 | 121 |
| F | 3,062 | 1,161 | 4,223 | 54 | 104 | 158 | 4,381 | 97 | |
| All universities | M | 20,962 | 6,086 | 27,048 | 5,475 | 159 | 5,634 | 32,682 | 1,668 |
| F | 16,112 | 8,879 | 24,991 | 8,642 | 120 | 8,762 | 33,753 | 1,108 | |
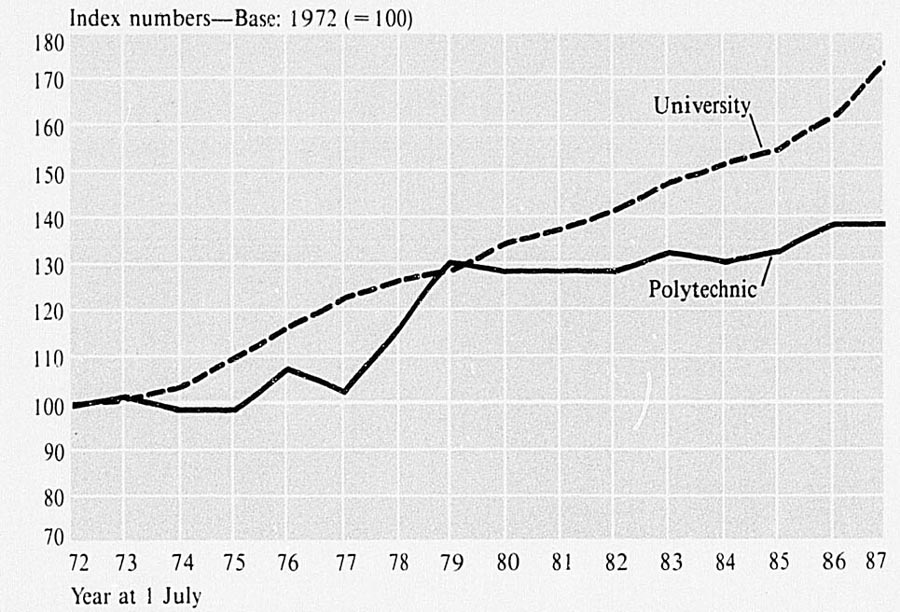
ENROLMENT GROWTH—tertiary
Table 9.22. OCCUPATIONS OF PART-TIME INTERNAL UNIVERSITY STUDENTS, 1987*
| Occupation | Males | Females | Total |
|---|---|---|---|
* At 1 July. Source: Department of Education. | |||
| No occupation other than study | 990 | 933 | 1,923 |
| University staff | 415 | 490 | 905 |
| Teacher | 325 | 680 | 1,005 |
| Teachers college student | 335 | 1,439 | 1,774 |
| Government employee | 1,059 | 1,193 | 2,252 |
| Local body employee | 225 | 228 | 453 |
| Private employment | 2,033 | 1,757 | 3,790 |
| Self-employed person | 321 | 421 | 742 |
| Houseperson or housekeeper | 110 | 1,295 | 1,405 |
| Full-time student at technical institute | 42 | 84 | 126 |
| Other | 231 | 359 | 590 |
| Total | 6 086 | 8 879 | 14 965 |
Table 9.23. RESIDENCES OF FULL-TIME INTERNAL UNIVERSITY STUDENTS, 1987*
| Type of residence | Auckland | Waikato | Massey | Victoria | Canterbury | Lincoln | Otago | All full-time internal students | Overseas students included | |||
|---|---|---|---|---|---|---|---|---|---|---|---|---|
| M | F | Total | M | F | ||||||||
* At 1 July. Source: Department of Education. | ||||||||||||
| Own home | 885 | 199 | 440 | 774 | 670 | 127 | 467 | 1,790 | 1,772 | 3,562 | 145 | 54 |
| Parents’ home | 4,371 | 513 | 320 | 2,040 | 1,856 | 150 | 696 | 6,016 | 3,930 | 9,946 | 37 | 20 |
| Hall of residence | 593 | 566 | 1,054 | 663 | 801 | 569 | 1,402 | 3,174 | 2,474 | 5,648 | 482 | 285 |
| Boarding | 676 | 255 | 315 | 302 | 339 | 39 | 107 | 1,220 | 813 | 2,033 | 162 | 146 |
| Shared flat or house | 2,743 | 1,378 | 2,779 | 1,688 | 2,386 | 705 | 3,670 | 8,425 | 6,924 | 15,349 | 631 | 480 |
| Other or not known | 95 | 97 | 187 | 54 | – | – | 103 | 337 | 199 | 536 | 41 | 33 |
| Total | 9 363 | 3 008 | 5 095 | 5 521 | 6 052 | 1 590 | 6 445 | 20 962 | 16 112 | 37 074 | 1 498 | 1 018 |
During the past 20–25 years vocational training has moved away from the secondary to the continuing education sector, with training formerly provided by technical high schools now provided by polytechnics.
Technical education is provided by a diverse range of institutions and covers an increasing number of subjects at various levels of specialisation. Below is a brief description of the main types of technical education in New Zealand and the institutions involved.
The polytechnics are; Northland, Auckland, Manukau, Carrington, Waikato, Bay of Plenty, Waiaraki, Taranaki, Wanganui, Manawatu, Tairawhiti, Hawke's Bay, Central Institute of Technology, Parumoana, Hutt Valley, Aoraki, Wellington, Nelson, Christ-church, Southland, Otago, and the New Zealand Technical Correspondence Institute. The Wairarapa Community Polytechnic and the West Coast Community Polytechnic were established in 1988.
The following tables show courses and enrolments at polytechnics.
Table 9.24. FULL-YEAR FULL-TIME ENROLMENTS AT POLYTECHNICS
| Full-time courses: full-year | At 1 July 1986 | At 1 July 1987 | ||||
|---|---|---|---|---|---|---|
| Males | Females | Total | Males | Females | Total | |
* Classified according to the UNESCO International Standard Classification of Education. Levels are graded from pre-school (level 0) to postgraduate (level 7), with level 9 describing out-of-school education without prerequisites. Source: Department of Education. | ||||||
| Level 2* | – | – | – | 5 | 7 | 12 |
| Level 3* | ||||||
| Agriculture, forestry and fisheries | 54 | 26 | 80 | 80 | 56 | 136 |
| Fine and applied arts | 27 | 33 | 60 | 21 | 40 | 61 |
| Commercial and business administration | 14 | 1,542 | 1,556 | 22 | 1,656 | 1,678 |
| Service trades | 133 | 232 | 365 | 149 | 315 | 464 |
| Mathematics and computer science | – | – | – | 6 | 3 | 9 |
| Medical science and health-related | 2 | 28 | 30 | 5 | 36 | 41 |
| Engineering | – | – | – | 29 | 6 | 35 |
| Trade, craft, and industrial programmes | 309 | 149 | 458 | 417 | 229 | 646 |
| General programmes | 6 | 12 | 18 | 19 | 46 | 65 |
| Subtotal | 545 | 2 022 | 2 567 | 753 | 2 394 | 3 147 |
| Level 5* | ||||||
| Agriculture, forestry and fisheries | – | – | – | 4 | 22 | 26 |
| Fine and applied arts | 90 | 160 | 250 | 135 | 152 | 287 |
| Commercial and business administration | 431 | 511 | 942 | 816 | 789 | 1,605 |
| Mass communication and documentation | 23 | 55 | 78 | 32 | 74 | 106 |
| Mathematics and computer science | 234 | 88 | 322 | 43 | 34 | 77 |
| Medical science and health-related | 388 | 3,726 | 4,114 | 439 | 4,229 | 4,668 |
| Engineering | 398 | 15 | 413 | 591 | 40 | 631 |
| Architecture and town planning | 142 | 47 | 189 | 92 | 31 | 123 |
| Trade, craft, and industrial programmes | 183 | 187 | 370 | 130 | 150 | 280 |
| Humanities, religion and theology | 7 | 19 | 26 | 2 | 22 | 24 |
| Service trades | 11 | 54 | 65 | 21 | 56 | 77 |
| Home economics, maintenance, and gardening | – | – | – | 4 | 9 | 13 |
| Natural science | 28 | 56 | 84 | 28 | 37 | 65 |
| Social and behavioural science | 9 | 14 | 23 | 9 | 15 | 24 |
| Subtotal | 1 944 | 4 932 | 6 876 | 2 346 | 5 660 | 8 006 |
| Total | 2 489 | 6 954 | 9 443 | 3 099 | 8 054 | 11 153 |
Table 9.25. FULL-YEAR PART-TIME ENROLMENTS IN TECHNICAL AND CONTINUING EDUCATION, 1987*
| Part-time courses | Males | Females | Total |
|---|---|---|---|
* As at 1 July. † See footnote, table 9.24. Source: Department of Education. | |||
| Level 2† | 1,078 | 3,465 | 4,543 |
| Level 3† | |||
| Authority for Advanced Vocational Awards | 1,234 | 128 | 1,362 |
| Trade Certificate | 16,064 | 2,689 | 18,753 |
| Other | 11,608 | 16,010 | 27,618 |
| Level 5† | |||
| Authority for Advanced Vocational Awards | 7,901 | 2,026 | 9,927 |
| Trade Certificate | 2,388 | 58 | 2,446 |
| Other | 8,813 | 6,082 | 14,895 |
| Level 9† | |||
| Non-vocational | 11,617 | 27,999 | 39,616 |
| Total | 60 703 | 58 457 | 119 160 |
The institute parallels the subjects of other technical institutes, and provides instruction in many subjects not taught elsewhere. A significant number of the apprentices who sit the annual Trades Certification Board examinations are directed to enrol at the institute.
The institute also prepares a large percentage of candidates for the Authority for Advanced Vocational Awards examinations in engineering, building, commerce, draughting, and science as well as for other professional and industrial examinations. Students studying for advanced trade, technician or professional qualifications comprise about two-thirds of the roll. The institute offers over 940 subjects, from hairdressing, plumbing, and agriculture to airline pilots’ licences and professional accountancy. To enrol at the institute students should be engaged in the vocation relevant to their course of study, so their correspondence studies are supported by practical experience. In some cases, laboratory work or practical instruction is required as part of the course. In such cases students attend block courses at the Central Institute of Technology or other institutes.
The institute was established in 1946 when 12 staff were employed. Today, the institute employs almost 500 full-time staff and boasts a student roll of about 33 000, making it the largest single educational institution in New Zealand. Writing, illustrating and printing all its own course materials, the institute teaches one-third of all vocational students enrolled at technical institutes. The council which controls the institute's activities is made up of representatives from national organisations such as the Employer's Federation and the Combined Trade Unions.
Located in Wellington, the institute mainly provides short-term ‘block courses’ for students from throughout the country, but also some special full-year, full-time courses on a national level such as pharmacy, podiatry and occupational therapy.
The Authority for Advanced Vocational Awards is responsible for the curriculum and examination of all three-stage Technicians’ Certificates and five-stage New Zealand Certificates. The Trade Certification Board is responsible for examination of apprentices sitting for either a Trade Certificate or Advanced Trade Certificate.
Technician courses—Both five-year New Zealand certificates and three-year technicians’ certificates are offered in the following areas:
New Zealand Certificate: Advertising, building, building inspection, commerce (office management), commerce (supply), manufacturing, customs, data processing, draughting (architecture), draughting (survey/town and country planning), engineering, fire technology, hotel and catering administration, forestry, land surveying, local-government administration, quantity surveying, science, and town planning.
Technicians’ Certificate: Automotive, civil, draughting, electrical, electronics, garage management, measurement control, mechanical, survey, telecommunications, waste water treatment, water treatment.
New Zealand Certificate courses are part-time and are undertaken by regular, intermittent periods of full-time classes (block courses), or by correspondence from the Technical Correspondence Institute supplemented in science and workshop subjects by short practical courses at an institute. In a few cases, study can be taken at full-time courses in a technical institute, but for the first two or three years only. All New Zealand Certificates require students to be suitably employed for three years with obligatory employment during the last two stages of the course.
Trade courses—Apprenticeship training accounts for a significant percentage of the enrolment load of polytechnics. Examination prescriptions for a full range of trade courses are prescribed by the New Zealand Trades Certification Board, which conducts assessments and examinations during apprenticeship, and usually an advanced trade certificate examination to be taken near the end of the apprenticeship. Up to 31 March 1988, this board issued 78 424 New Zealand Trade Certificates and 21 582 Advanced Trade Certificates.
Apprentices in almost all trades are obliged to spend at least three years in part-time vocational studies. However, the long-established pattern where apprentices attend evening theory classes and short block, or day-release, courses for practical training is changing.
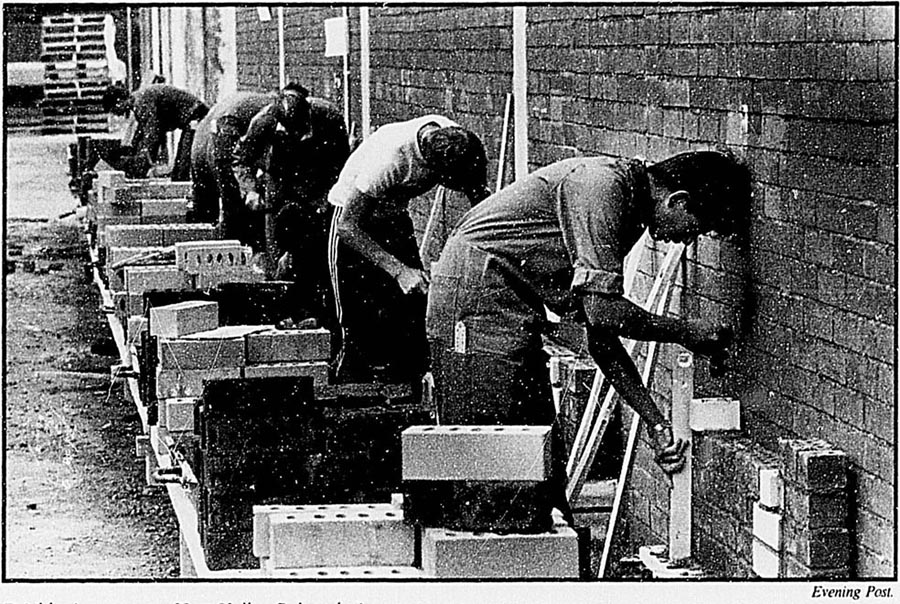
Evening Post.
Bricklaying contest, Hutt Valley Polytechnic.
A significant development in recent years has been the provision of transition education and training, usually in the form of the Department of Labour's ACCESS and School-leavers Training and Employment Preparation Schemes. In some polytechnics these programmes account for from one-quarter to one-third of the total polytechnic courses offered. In 1986 these transition courses were modified and combined to create the new Training Assistance Programmes. Since 1987, the ACCESS training package has replaced many of the programmes formerly run by the Department of Labour.
Polytechnics have developed transition courses independent of the Department of Labour schemes. An example is the Link programme, in which senior secondary school students undergo specialised vocational education and training while continuing with their studies. Foundation and employment rich courses have also been established.
In addition to the national trade and technician courses, there is a large number of courses available which have been organised regionally to meet local demands. These include courses in commerce, electronic data processing, journalism, and in industrial and commercial design and crafts. In addition, instruction is given on the examination syllabuses devised by independent organisations such as the New Zealand Society of Accountants, and the New Zealand Institute of Management.
The functions and powers of the National Council of Adult Education are set out in the Adult Education Act 1963. One of the council's most important functions is to take an overall view of the development of adult education in New Zealand. In practice the council seeks to encourage complementary activities and to provide—through a wide and growing range of institutions, agencies, and organisations—learning opportunities for members of the community in the post-compulsory phase of their learning.
The council advises the Director-General of Education and various organisations on adult education. It co-ordinates and conducts pilot projects and experiments, maintains a national library and documentation centre on adult education and publishes magazines and occasional papers.
All six universities and Lincoln College run centres for continuing education.
A typical centre for continuing education in a university has a director-in-charge and a staff of lecturers in a range of academic disciplines. In addition to teaching, the staff may plan and develop sections of the department's programme or have special responsibility for a geographical area and its programme. There are marked differences in their approaches and systems of organisation used. A large number of university academic staff are co-opted in order to supplement the activity of the full-time continuing education centre staff. The courses are conducted by various methods—lecture courses, study conferences, seminars, schools of varying lengths (both residential and non-residential), and correspondence courses. While most universities continue to offer the general public substantial extension programmes in the liberal studies area, there has been a significant increase in programmes designed for specialist groups, especially occupational. Some of these are national in scope.
Most organised adult education is done through day and evening classes at secondary schools. Since the revision of the School Certificate regulations to allow single subject passes, there has been some increase in adult classes leading to the School Certificate examination, but there is a very wide range of other examinable and non-examinable courses. An amendment to the Education Act in 1975 allowed adults to return full-time or part-time to secondary schools, in day classes. There followed for the next few years a rapid increase in the number of adult admissions to day classes. In 1987 there were 436 full-time and 2445 part-time adult students. This is in addition to the evening class programmes which cater for 156 000 enrolments annually.
The main agencies in the field of distance education are the Correspondence School (with over 10 000 adult students enrolled), the extramural studies of Massey University (over 12 000), and the Technical Correspondence Institute (33 000 enrolments in 1986).
Community centres, which opened experimentally some 40 years ago in Feilding, Christchurch, and Westport, were the forerunners of the school-based community learning centres. Generally the centres receive professional and ancillary staffing and an annual grant. In effect, 13 community learning centres have been established in association with primary and secondary schools.
Several schools which have developed large community programmes have been given lesser levels of support in the meantime. Other schools operate successful programmes within their own resources. All have developed community education programmes which aim at increasing the community involvement in continuing education by making a wider use of schools for expanded extension programmes and, by using the resources of the community, to enrich the programmes of pupils still at school.
The Community Action Programme in the Wairarapa region has now merged with the Wairarapa rural education activity programme. Together they provide a range of continuing education programmes to meet a wide variety of learning needs in the area. The Community Education Service in the Nelson region is at the Nelson Polytechnic and together they provide for the continuing educational needs of people in the Nelson area.
Many voluntary organisations make some provision for continuing education. For most of them, such as the Playcentres Federation, and the Country Women's Co-ordinating Committee, continuing education is only one aspect of their overall activities. However, several organisations, such as the New Zealand Workers’ Educational Association, have continuing education as their primary purpose.
New Zealand Workers’ Educational Association—This is an independent voluntary organisation which provides further educational opportunities for adults. District councils exist in Auckland, West Auckland, Waikato, New Plymouth, Kapiti Coast, Wellington, Canterbury, Otago, and Southland. Branches exist in Upper Hutt, Lower Hutt, and south-east Christ-church. District councils and branches run varied programmes, including seminars, courses, summer schools, public forums, and literacy programmes. Special courses are run for the elderly, the unemployed, and trade unions. The WEA Book Discussion Scheme has 149 groups throughout the country.
Workers’ Educational Association Trade Union Postal Education Service—This is an independent correspondence service. It is administered by representatives from the Federation of Labour's National Council of Adult Education, NZWEA and individual trade unions. It provides non-formal, low-cost correspondence programmes for members of affiliated trade unions and their families.
Country Women's Co-ordinating Committee—The committee is involved with international affairs through the Associated Country Women of the World and in particular the South Pacific area, giving financial and practical aid, and assistance with the training of women in the Pacific Islands.
9.1 Department of Education; New Zealand Council for Educational Research.
9.2–9.3 Department of Education.
Administering for Excellence: Report of the Task Force to Review Education Administration (1988).
Annual Research Report. Research and Statistics Division, Department of Education (annual).
Annual Report of the New Zealand Council for Educational Research.
Education Statistics of New Zealand. Department of Education (annual).
Educational Research Series. New Zealand Council for Educational Research.
New Zealand School Enrolment Projections 1987–1997. Department of Education, 1987.
New Zealand Teachers College Summary Statistics. Department of Education (annual).
Primary Staffing Survey. Research and Statistics Division, Department of Education (annual).
Profile of Full-year Full-time Technical and Continuing Education Students. Research and Statistics Division, Department of Education (annual).
Profile of New Entrants to Teachers College. Department of Education (annual).
Report of the Department of Education (Parl, paper E. 1)
Report of the Maori Education Foundation (Parl, paper E. 24)
Report of the Pacific Islands Polynesian Education Foundation (Parl. paper E. 21)
Reports of the University Grants Committee and University Institutions (Parl. paper E. 3).
School Certificate Examination Statistics. Department of Education (annual).
Secondary Staffing Survey. Research and Statistics Division, Department of Education (annual).
State Secondary Schools in New Zealand. Department of Education, 1986.
Tomorrow's Schools: The Reform of Education Administration in New Zealand. Minister of Education (1988).
Table of Contents
New Zealand has inherited a tradition of an independent judiciary, seen as a protection against unnecessary intrusion by the state in the lives of citizens. The Judicature Act 1908 and the Constitution Act 1986 contain a number of constitutionally significant provisions, designed to ensure judicial independence. High Court judges (including those who sit in the Court of Appeal) are appointed by the Governor-General. They have security of tenure and may not be removed from office except by the Sovereign or the Governor-General on grounds of misbehaviour or incapacity upon an address of the House of Representatives.
The salaries of judges are determined by the Higher Salaries Commission under the Higher Salaries Commission Act 1977. Salaries may not be diminished during a judge's commission. No person may be appointed a judge unless he or she has held a practising certificate as a barrister or solicitor for at least seven years. The retirement age is 68, although former judges may be re-appointed as acting judges for two years, or one year if the judge is 72 years of age when reappointed.
The District Courts Act 1947 provides for the appointment and tenure of District Court judges. They are appointed by the Governor-General, who may, if he or she thinks fit, remove a judge for inability or misbehaviour. The convention against arbitrary removal ensures the independence of District Court judges in the exercise of their judicial functions. The salaries of District Court judges are also determined by the Higher Salaries Commission. Qualifications for appointment are similar to those for High Court judges. The retirement age is 68. Retired judges may be appointed from time to time by the Governor-General as acting judges for a term not exceeding two years, or one year if the person has attained the age of 72.
The appointments, salaries, tenures, and retirement of judicial officers of specialist courts are those of High Court or District Court judges, depending on the ranking of the court in the hierarchy.
At the head of the hierarchy of courts of New Zealand is the Judicial Committee of the Privy Council. Below this is the Court of Appeal, followed by the High Court, and the District Courts. All courts exercise both criminal and civil jurisdiction.
The Judicial Committee of the Privy Council is the final appeal tribunal for New Zealand, although the Government announced in October 1987 that it would remove the right to appeal to the Privy Council within its current term, which ends in 1990. The judicial committee advises the Sovereign in the same way as it did when New Zealand was still a British colony. Most Commonwealth countries have abolished the right to appeal to the judicial committee. The right still exists in certain dependent territories (like Gibraltar and Hong Kong) and in the Bahamas, Barbados, Belize, Gambia, Jamaica, Mauritius, the Seychelles, Singapore, Trinidad and Tobago.
The judicial committee is not an English court, although its members are primarily eminent British judges. New Zealand judges have sat on the judicial committee in recent years. The judicial committee acts like a court, but it does not deliver a judgment. It submits its opinion on a case it has heard to the Sovereign. This is given effect by an Order-in-Council. By constitutional convention the Sovereign is required to make the necessary order.
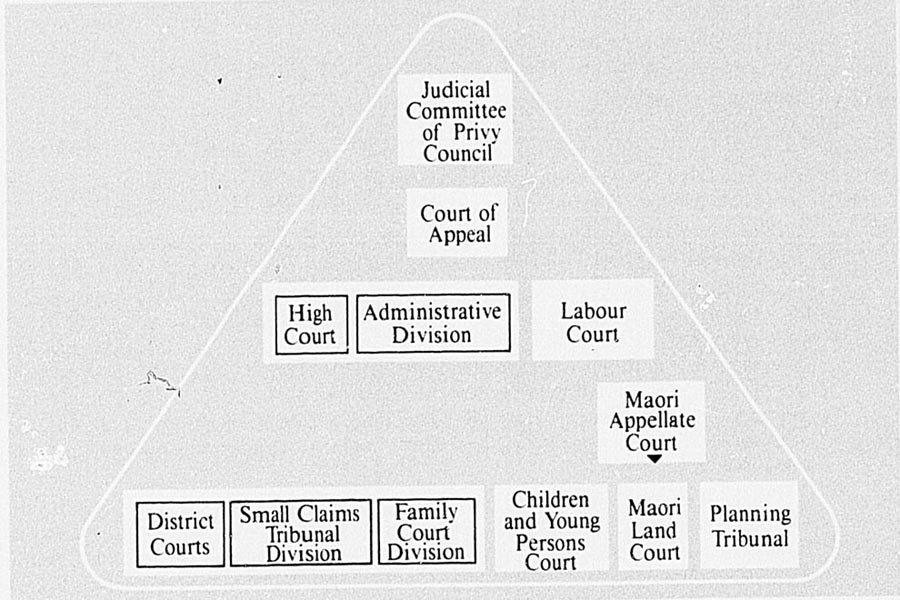
HIERARCHY OF COURTS
Appeals to the Privy Council may be brought by leave of the court appealed from, or by special leave of the Privy Council itself. Leave is granted as of right from any final judgment of the Court of Appeal, where the matter in dispute amounts to the value of $5,000 or more, or involves directly or indirectly some claim to property, or some civil right exceeding that value. The Privy Council has a discretionary power to grant special leave to appeal in criminal cases. Such leave is not commonly granted in criminal appeals from New Zealand.
The Court of Appeal is the highest appeal court in New Zealand. A Court of Appeal has existed since 1846. It is now constituted by the Judicature Amendment Act 1957.
The court consists of the Chief Justice, who is a member by virtue of his or her office as the head of the judiciary; a judge of the High Court appointed by the Governor-General as its President; and four other judges of the High Court appointed by the Governor-General as judges of the Court of Appeal. Additional judges of the High Court may be nominated by the Chief Justice to sit on the Court of Appeal. The judges of the Court of Appeal are also judges of the High Court. They have seniority over all other judges of that court except the Chief Justice or the acting Chief Justice.
The Court of Appeal exercises an appeal jurisdiction only. Its primary function is to settle the law of New Zealand and to reconcile conflicting decisions of the courts below. It hears and determines ordinary appeals from the High Court. Certain other proceedings in inferior courts may, by order of the High Court, be removed to the Court of Appeal.
The Court of Appeal may remit any proceedings pending before it to the High Court and all its judgments, decrees, and orders may be enforced by the High Court.
Criminal jurisdiction—The Court of Appeal hears appeals against convictions and sentences imposed in the High Court or District Courts. All appeals, except on a question of law, are by leave only. If it allows an appeal, the Court of Appeal may quash the conviction, vary the sentence, or order the case to be retried.
The decisions of the Court of Appeal are final except where an appeal lies to the Judicial Committee of the Privy Council.
The High Court (then the Supreme Court) was first created in 1841. It has all the jurisdiction which may be necessary for a court to administer the laws of New Zealand.
The High Court exercises jurisdiction in cases of major crimes, Admiralty rem proceedings, the more important civil claims, appeals from lower courts and tribunals, and reviews of administrative actions. The High Court also has inherent jurisdiction to punish for contempt of court. It consists of the Chief Justice and 31 other judges, as prescribed by the Judicature Act 1908. An additional judge or judges may be appointed, whenever the Governor-General deems it necessary by reason of the absence, or anticipated absence, of any of the judges on leave before retirement. The Governor-General may also, at any time during the illness or absence of any judge, or for any other temporary purpose, appoint any person (including a former judge) to be a temporary judge for a period of no more than two years in total.
All the judges of the High Court are stationed in Wellington, Auckland, or Christchurch. The High Court travels on circuit to Whangarei, Hamilton, Rotorua, Gisborne, Napier, New Plymouth, Wanganui, Palmerston North, Blenheim, Nelson, Greymouth, Timaru, Dunedin and Invercargill. There is a High Court office at Masterton, but the court does not sit there.
Administrative Division—This division, which was established in 1968, consists of up to six judges of the High Court who are assigned to the division by the Chief Justice. Lay persons may be appointed to sit as members of, or assessors with, the Administrative Division if any other Act makes provision for such appointments.
The Administrative Division has a mixed jurisdiction in administrative matters based on a variety of legislation and case law. In some areas it can consider appeals from administrative tribunals, and substitute its own decisions for those of the lower body. In other areas it has powers of judicial review, i.e., it can set aside decisions of administrative tribunals made in excess of their legal authority, or in breach of the rules of natural justice.
The division has jurisdiction to deal with (a) appeals which are to be heard and determined by it under any enactment (these are appeals from the decisions of a large number of administrative tribunals); (b) proceedings other than appeals which are referred to it by any other enactment (more than 30 Acts confer jurisdiction on the Administrative Division); and (c) applications for orders of certiorari, prohibition, or mandamus; declaratory judgments, orders, or injunctions; and applications for review under Part I of the Judicature Amendment Act 1972 which are referred to it from time to time by the Chief Justice. Applications for review may be made where any person has exercised, refused, or purported to exercise a statutory power or a statutory power of decision. The terms ‘statutory power’ and ‘statutory power of decision’ are defined in the Judicature Amendment Act 1972. There is no appeal on fact or law from the decision of the Administrative Division, unless provided in the statute conferring the right to appeal.
The Administrative Division of the High Court sits in Wellington only.
Table 10.1. JUDGES OF THE COURT OF APPEAL AND HIGH COURT*
*As at 1 January 1988. Includes Court of Appeal judges. | |
|---|---|
| Chief Justice: | Rt. Hon. Sir Ronald Davison, G.B.E., C.M.G. |
| Court of Appeal: | Rt. Hon. Sir Ronald Davison, G.B.E., C.M.G. (ex officio); Rt. Hon. Sir Robin Cooke, President, K.B.E.; Rt. Hon. Sir I. L. M. Richardson; Rt. Hon. Sir D. W. McMullin; Rt. Hon. E. J. Somers; Rt. Hon. M. E. Casey; Hon. G. E. Bisson. |
| High Court†: | Rt. Hon. Sir Ronald Davison, G.B.E., C.M.G.; Hon. J. P. Quilliam; Hon. M. F. Chilwell; Hon. R. I. Barker, Hon. J. F. Jeffries; Hon. J. B. Sinclair, Hon. A. D. Holland; Hon. T. M. Thorp; Hon. L. M. Greig; Hon. M. Hardie Boys; Hon. J. H. Wallace; Hon. J. T. Eichelbaum; Hon. D. L. Tompkins; Hon. P. G. Hillyer, Hon. R. G. Gallen; Hon. J. S. Henry; Hon. R. A. Heron; Hon. A. A. T. Ellis; Hon. N. W. Williamson; Hon. R. P. Smellie; Hon. R. E. Wylie; Hon. R. A. McGechan; Hon. J. A. Doogue; Hon. A. P. C. Tipping; Hon. N. C. Anderson; Hon. T. M. Gault; Hon. J. B. Robertson. |
Unlike the High Court, which is one court for New Zealand, District Courts are established as separate entities in various localities.
The District Courts are constituted under the District Courts Act 1947, which limits the number of District Court judges to 93. Judges are appointed by the Governor-General, who also appoints a Chief District Court Judge, who oversees the administration of the courts and also sits in court. District Courts have extensive civil and criminal jurisdiction. A number of District Court judges are specially warranted to preside over jury trials of criminal cases.
Justices of the Peace can sit as a District Court to hear a limited number of minor criminal charges which, if proven, attract a maximum fine of $500.
Family Court Divisions—Family Courts have been established since 1980 as divisions of the District Courts. The Governor-General appoints the Family Court judges, who are also judges of the District Court, and a Principal Family Court Judge.
Family Courts have jurisdiction to deal with dissolution of marriages, adoption, guardianship applications, domestic actions, matrimonial property, and similar matters. They may state a case on a point of law to the High Court or transfer complex proceedings to that court.
Small Claims Tribunals—Small Claims Tribunals were established in 1976 as divisions of the District Courts. The tribunals have jurisdiction to determine disputes up to a value of $1,000 based on contract, quasi-contract, or negligence in the use, care, or control of a motor vehicle. Every District Court, apart from the five courts with police registrars, has a Small Claims Tribunal. There are 30 part-time referees to service the 58 tribunals.
In New Zealand there are a number of courts with specialist functions.
This court is constituted under the Labour Relations Act 1987. It consists of the Chief Judge and four other judges. For certain types of cases, in particular personal grievances, demarcation disputes and some apprenticeship matters, there is also provision for the judge to appoint two panel members from a panel established by the Minister of Labour.
The judges of the court are appointed from time to time by the Governor-General. Qualifications for appointment, tenure, and retirement age are the same as those applying to High Court judges.
Broadly speaking, the Labour Court has jurisdiction to settle disputes in the industrial relations field, except disputes of interest which are handled by the Arbitration Commission.
The court may state a case for the Court of Appeal on any question of law (other than any question as to the construction of an award or collective agreement). Any person dissatisfied with any decision of the court (other than a decision on the construction of an award or collective agreement) as being erroneous in point of law, may appeal to the Court of Appeal by way of case stated for the opinion of that court on a point of law only.
These may be established by the Governor-General under the Children and Young Persons Act 1974. The jurisdiction of the courts is exercised by specially warranted District Court judges. The courts deal with every complaint under the Children and Young Persons Act relating to the care, protection, or control of a child or young person. The courts have criminal jurisdiction to deal with offences committed by children and young persons, except in cases of murder, manslaughter, and traffic offences not punishable by imprisonment. Appeals from decisions of the Children and Young Persons Court, and applications for review of guardianship and supervision orders may be brought to the High Court. The Children and Young Persons Act 1974 is currently under review.
These courts are constituted under the Maori Affairs Act 1953 and have jurisdiction to hear matters relating to Maori land. The Governor-General may from time to time appoint a Chief Judge and other judges of the court as may be required. The judges of the Maori Land Court are also judges of the appellate court. Three or more of the judges have power to act as the Maori Appellate Court. All judges hold office during the pleasure of the Governor-General and retire at age 68 (although a retired judge may be appointed as a temporary judge for up to 12 months).
The Maori Land Court or the appellate court may state a case for the opinion of the High Court on any point of law arising in proceedings before it. The decision of the High Court is subject to an appeal to the Court of Appeal. A case stated for the opinion of the High Court may be removed to the Court of Appeal for rehearing. The decision of the High Court or Court of Appeal, as the case may be, on any case stated is binding on the Maori Land Court and the Maori Appellate Court.
Constituted by the Town and Country Planning Act 1977, the Planning Tribunal is a court of record and has all the powers of a District Court in the exercise of its civil jurisdiction in respect of adding and substituting parties, summoning witnesses, administering oaths, hearing evidence, conducting proceedings, and maintaining order. The tribunal consists of not more than five District Court judges, each of whom must be a planning judge, and not more than 10 other persons. Every member is appointed for a period not exceeding five years by the Governor-General on the recommendation of the Minister of Justice, after consultation with the Minister for the Environment. From time to time the Governor-General appoints one of the planning judges to be the Principal Planning Judge of the Planning Tribunal.
The tribunal has jurisdiction to make decisions relating to the preparation, implementation, and administration of regional, district and maritime planning, and jurisdiction to hear appeals for water rights to Regional Water Boards, and to conduct enquiries into the compulsory taking of land, and prospecting rights under the Mining Act 1981. The tribunal may state a case on a point of law for the opinion of the High Court. A party to proceedings before the tribunal who is dissatisfied with any determination as being erroneous in point of law may appeal to the High Court by way of case stated for the opinion of the court on a point of law only. All appeals are heard by the Administrative Division of the High Court.
The law of New Zealand consists of the common law, statute law enacted by the New Zealand Parliament, a number of United Kingdom statutes which are still in force in New Zealand, regulations, by-laws, and other forms of subordinate legislation.
The common law is sometimes referred to as case law or judge-made law. It is based on general rules developed by the courts in England over centuries and became part of the law of New Zealand in 1840. Like any living law, the common law continues to develop. When applying the common law, New Zealand courts take into account common law principles developed in New Zealand and other parts of the Commonwealth, notably the United Kingdom, Australia, and Canada. The common law can be reversed or amended by statute law.
The Constitution Act 1986 contains the law-making power of Parliament. It replaces section 53 of the Constitution Act 1852 and states that the Parliament of New Zealand continues to have full power to make laws. Over the years that power has increased. Parliament now has full power to make laws having effect in, or in respect of, any part of New Zealand and laws having effect outside New Zealand. The extra-territorial law-making power is rarely exercised, except in relation to crimes committed aboard Commonwealth ships or aeroplanes or any ship or aircraft that arrives in New Zealand. There are no constitutional restrictions on the laws Parliament can enact.
A number of United Kingdom statutes are still in force in New Zealand. They are those passed before 1840 (when New Zealand first became a British colony) which were applicable to the circumstances of the colony at that date, and statutes passed between 1840 and 1947 which extended to New Zealand expressly or by necessary implication.
Many United Kingdom statutes have been repealed or replaced by enactments of the New Zealand Parliament. A few of particular constitutional significance remain: the Magna Carta of 1297, the Petition of Right 1627, the Bill of Rights 1689, and the Act of Settlement 1700.
In 1947 New Zealand adopted the Statute of Westminster of 1931. As a result the power of the United Kingdom Parliament to make laws for New Zealand could be exercised only at the request, and with the consent, of the New Zealand Parliament. The Constitution Act 1986 removed this residual power of the United Kingdom Parliament to make laws having effect in New Zealand. This had not happened since 1947.
A number of statutes empower the Governor-General to make regulations by Order-in-Council. Local authorities and a number of other bodies may make by-laws in accordance with the relevant statutes. The courts may examine regulations and by-laws and declare them invalid if they go beyond the limits prescribed by statute.
The High Court has original jurisdiction to hear and determine civil proceedings including:
Proceedings in contract and tort;
Equity;
Supervisory powers over inferior courts and tribunals;
Wills and administration of the estates of deceased persons;
Dissolution of partnerships and the taking of partnership accounts;
The sale and distribution of the proceeds of any property subject to a lien or charge;
Proceedings relating to mortgages, leases, sale, or partition of land, including specific performance of contract;
Execution of trusts, charitable or private;
Rectification, or setting aside, or cancellation of deeds or contracts;
Proceedings relating to the insolvency of persons and companies;
Family law (matrimonial property, and proceedings under the Family Protection Act, and Aged and Infirm Persons Protection Act);
Electoral petitions;
Admiralty; and
Absconding debtors.
The High Court also issues declaratory judgments and hears appeals from the District Courts and from a number of administrative tribunals.
Decisions on many civil proceedings in the High Court may be appealed to the Court of Appeal, which in 1986 heard 125 civil appeals (of which 42 were allowed).
Table 10.2. HIGH COURT CIVIL JURISDICTION
| Year | Number of actions commenced | cases tried | Judgment recorded (entered or in cases tried) | |||
|---|---|---|---|---|---|---|
| Amount of judgments | ||||||
| With jury | Without jury | Number | Amount claimed | |||
| $(000) | $(000) | |||||
| 1982 | 3,292 | 3 | 433 | 709 | 35,799 | 16,816 |
| 1983 | 3,525 | 12 | 421 | 668 | 19,778 | 11,383 |
| 1984 | 3,627 | 3 | 368 | 712 | 17,406 | 14,050 |
| 1985 | 4,051 | 6 | 411 | 700 | 17,252 | 13,930 |
| 1986 | 4,198 | 3 | 479 | 738 | 34, 155 | 32,315 |
District Courts have jurisdiction to hear proceedings founded on contract or tort and other civil claims (including equitable claims) where the amount of the debt, demand, or damage, or the value of the chattels claimed is no more than $12,000. In proceedings for the recovery of land the courts have jurisdiction if the rent payable (if any) does not exceed $6,000 a year or where the value of the land does not exceed $50,000. The District Courts may hear proceedings involving a claim exceeding $12,000 if the parties agree in writing that the court has jurisdiction to hear and determine the proceedings.
Table 10.3. DISTRICT COURTS CIVIL JURISDICTION
| Year | Plaints entered | Cases disposed of | Total amount for which judgment entered | ||
|---|---|---|---|---|---|
| Number | Total amount sued for | Number | Total amount claimed | ||
| $(000) | $(000) | $(000) | |||
| 1982 | 117,953 | 98,662 | 61,103 | 29, 427 | 34, 978 |
| 1983 | 125,565 | 107,143 | 63,480 | 49, 557 | 42, 520 |
| 1984 | 130,188 | 110,343 | 68,970 | 54,332 | 46,732 |
| 1985 | 129,737 | 121,651 | 67,151 | 53,088 | 45,247 |
| 1986 | 150,781 | 145,364 | 70,496 | 64,508 | 54,590 |
Every person between the ages of 20 and 65 years (inclusive) is eligible for jury service subject to the exceptions mentioned below. Those who because of their occupation are not appropriate to serve on a jury are ineligible, and a person may be excused if jury service would cause serious inconvenience or hardship, or if it is against a person's religious beliefs to serve on a jury.
The following persons are not qualified to serve on a jury in any court on any occasion: (a) anyone who, at any time, has been sentenced to imprisonment for life or for a term of three years or more, or to preventive detention; and (b) anyone who, at any time within the preceding five years, has been sentenced to imprisonment for a term of three months or more.
Automatically ineligible are: members of the Executive Council; members of Parliament; judges, members and commissioners of courts; visiting justices and members of the Prisons Parole Board; those exercising the summary jurisdiction of District Courts; barristers and solicitors holding current practising certificates; police officers and traffic officers; officers of the High Court or a District Court or the Department of Justice, officers of any penal institution or pre-release hostel or work centre, or probation officers; mentally disordered persons; and those who are incapable of serving because of blindness, deafness, or any other permanent physical infirmity.
The Legal Aid Act 1969 gave effect to the principle that no one should be prevented by lack of means from having their grievances heard and determined fairly by the courts. The aid is available for almost all civil proceedings other than dissolution of marriage. In order to receive legal aid the applicant must have a sufficiently meritorious case. Except in special cases of hardship, every aided person is required to make a contribution of $25 towards the cost of proceedings, and is also liable to make an additional contribution proportionate to his or her income and capital.
The Department of Social Welfare is responsible for investigating the resources of persons applying for legal aid; for assessing their ‘disposable income’ and ‘disposable capital’ within the statutory limits; and for reporting to district committees on the maximum contribution, if any, that applicants should be expected to pay towards the cost of the proceedings in respect of which legal aid is sought.
The Offenders Legal Aid Act 1954 provides that any person charged with or convicted of any offence may apply for legal aid. Whether or not the application is granted depends on the court's consideration of the means of the person charged or convicted and the gravity of the offence together with any other circumstances the court sees as relevant. If legal aid is granted the court appoints and pays counsel according to a scale of fees fixed by regulation.
Since the 1985–86 year police statistics of reported crime have been available on a March year basis, providing better integration of all information and statistics. This should be considered when comparing crime figures with earlier calendar-year figures.
For the year ended 31 March 1987, a total of 430 694 offences were reported to police, a decrease of 2.4 percent from the previous year. The clearance rate of 40.7 percent in 1986 improved to 42.2 percent in 1987. The number of violent offences remained virtually static during the year, increasing from 21 997 to 22 001.
During the year 59 murders were investigated. The number of robberies reported was 1345, an increase of 5.8 percent over the previous year. Aggravated robbery rose by 3.2 percent from 643 offences to 664. Non-aggravated robbery increased by 2.9 percent from 548 offences to 564 offences.
There were 519 reported sexual violations. (A 23 percent increase in the number of offences comparable with the 419 rape cases reported in 1986.) The clearance rate rose from 71.8 percent to 78 percent. Of reported offences, 44.7 percent were cleared ‘no offence’. The number of sexual offences dropped by 248 (7.5 percent), although that of sexual attacks increased by 126 (9 percent).
Non-cannabis drug offences increased by 42.2 percent to 1343 offences when compared with the previous year. Cannabis offences rose by 14.5 percent to 16 646 and the clearance rate rose by 1.4 points to 92 percent.
In total, reported drug and anti-social offences rose by 5.9 percent from 49 434 to 52 366, while the clearance rate remained stable at 93 percent.
Dishonesty offences reported, although they dropped in number by 4.6 percent, continued to account for the major proportion of all reported offences, 65.5 percent. Within this group, burglary offences decreased by 6.2 percent from 84 132 to 78 917. Car conversions increased from 56 607 to 56 752, theft decreased by 6.8 percent from 124 134 to 115 714 and fraud rose 1.4 percent from 27 672 to 28 080.
Property worth $271.7 million was reported stolen, of which $116.0 million, representing 42.7 percent, was recovered. The total number of motor vehicles reported stolen was 33 796 with a value of $126.7 million. During the year 24 170 were recovered (valued at $92.7 million), a recovery rate of 71.5 percent. Other property recovery rates were not as high, for example, $6.9 million worth of video equipment was reported stolen, of which just over $608,000 was recovered.
Of the 16 police districts, only six reported an increase in the number of reported offences during 1987.
Children (i.e., persons under 17 years of age) were responsible for 20.7 percent of cleared offences and 54.9 percent of all offenders were in the 20 years and under age group. Of all offenders 81.6 percent were male and 18.4 percent were female. In the offence category of dishonesty, 36.1 percent of cleared offences involved children and 63.3 percent of offenders in this category were aged 20 years and under.
The above comparisons of the numbers of offences reported in 1986–87 with the numbers for the preceding year do not correlate with those published in the last Yearbook. This is because the 1985–86 data used above was taken from police records at an earlier cut-off date than for the figures published in the last edition (which accordingly showed more offences).
District Court judges deal summarily with the majority of indictable offences. They have jurisdiction over all crimes against property and all but the most grave of other crimes, such as treason, homicide, unlawful sexual connection, and perjury. A District Court judge may, however, decline to deal with an offence summarily, and the accused is committed for trial in the High Court in the ordinary way. The accused person also has the right to claim jury trial if he or she is charged with any offence, indictable or summary, punishable by imprisonment for more than three months.
A defendant may be prosecuted at a court hearing for several charges of one or more offences, and in the following tables all are included in ‘total charges’, which exceed therefore the numbers of persons charged. The principal charge (i.e., that for which the heaviest sentence is imposed) for each person at each court appearance is selected to arrive at the ‘distinct case’ classification. As a person may appear before a court on more than one occasion during the year, the number of distinct cases will not necessarily correspond with the number of individual persons involved.
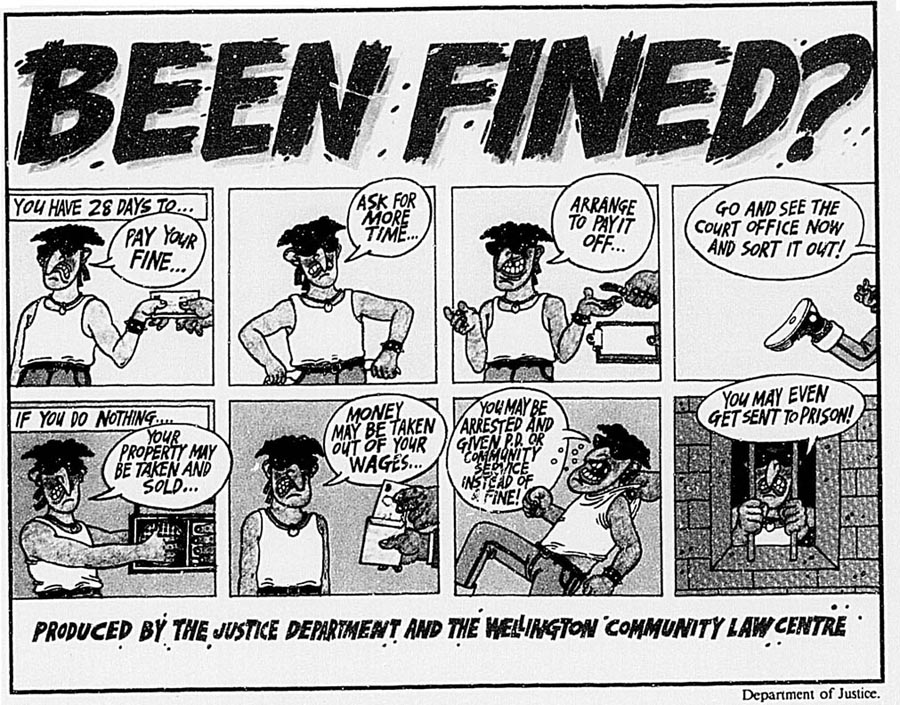
One of a series of posters reminding young adults of their rights.
Table 10.4. CONVICTIONS FOR OFFENCES TRIED SUMMARILY IN DISTRICT COURTS
| Type of offence | 1981 | 1982 | 1983 | 1984 | 1985 |
|---|---|---|---|---|---|
* Includes breaches of the Road User Charges Act 1977, careless driving and a number of minor traffic offences. † Counting only the principal offence in cases where a person was charged simultaneously with two or more offences. | |||||
| Offences involving violence or threats of violence | 5,180 | 5,907 | 5,703 | 6,222 | 6,293 |
| Sex offences | 386 | 455 | 402 | 473 | 499 |
| Other offences against the person | 2,773 | 2,813 | 2,876 | 3,271 | 3,499 |
| Unlawful taking of property (includes conversion of vehicles) | 22,182 | 26,417 | 27,550 | 26,980 | 27,579 |
| Fraud and false pretences | 8,885 | 10,265 | 11,427 | 12,457 | 12,138 |
| Wilful damage and trespass | 3,566 | 3,944 | 3,980 | 4,393 | 4,007 |
| Forgery, uttering, and currency offences | 1,615 | 1,536 | 1,452 | 1,343 | 1,104 |
| Drug offences | 5,941 | 7,984 | 7,464 | 9,233 | 10,357 |
| Offences against the administration of justice | 3,107 | 4,056 | 4,682 | 4,988 | 4,956 |
| Drunkenness and drunken driving offences | 21,212 | 20,555 | 22,974 | 24,261 | 23,194 |
| Other imprisonable traffic offences | 8,603 | 10,806 | 10,110 | 10,576 | 9,837 |
| Other offences against good order | 8,014 | 6,678 | 6,467 | 6,757 | 7,288 |
| Offences against decency | 310 | 348 | 366 | 372 | 376 |
| Offences against the Sale of Liquor Act | 8,266 | 9,098 | 6,579 | 6,243 | 7,180 |
| Other offences | 18,754 | 23,233 | 21,251 | 21,828 | 20,629 |
| Subtotal | 118,794 | 134,095 | 133,283 | 139,397 | 138,936 |
| Minor traffic offences* | 194,944 | 188,879 | 200,217 | 184,003 | 226,111 |
| Total | 313 738 | 322 974 | 333 500 | 323 400 | 365 047 |
| Distinct cases† | 245,404 | 242,380 | 250,567 | 240,539 | 277,842 |
Table 10.5. RESULTS OF DISTRICT COURT HEARINGS
| Result of hearing | 1983 | 1984 | 1985 |
|---|---|---|---|
| * Mainly for traffic offences which do not involve imprisonment. | |||
| Imprisonment | 5,734 | 6,423 | 5,100 |
| Corrective training | 776 | 688 | 606 |
| Community care | ... | ... | 318 |
| Periodic detention | 8,806 | 9,463 | 9,880 |
| Probation (under Criminal Justice Act) | 2,181 | 1,984 | 2,631 |
| Convicted and ordered to come up for sentence if required | 2,758 | 2,707 | 2,709 |
| Fined* | 151,551 | 147,894 | 171,797 |
| Convicted and discharged (or pay costs) | 4,499 | 4,134 | 4,076 |
| Community service | 1,778 | 1,740 | 2,029 |
| Orders made | 1,019 | 1,387 | 368 |
| Dismissed, withdrawn, or struck out | 23,449 | 27,648 | 27,362 |
| Discharged under section 42 of Criminal Justice Act | 2,255 | 2,107 | 2,268 |
| Total, distinct cases | 204 806 | 206 175 | 229 144 |
These form a large proportion of court prosecutions. The most frequent traffic offences dealt with are breaches of parking regulations and excessive speed. Parking infringements which result merely from overstaying a time limit are dealt with outside the criminal law, and some local authorities and the Ministry of Transport impose speeding infringement penalties. A summary of reported road traffic offences can be found in section 20.4, Road transport.
Table 10.6. TRAFFIC CONVICTIONS IN DISTRICT COURTS
| Offence | 1983 | 1984 | 1985 |
|---|---|---|---|
| * Includes breaches of heavy vehicle licensing and breaches of the Road User Charges Act 1977. Excludes warrant of fitness offences. | |||
| Reckless, dangerous, or careless use or driving of motor vehicle causing death | 122 | 131 | 111 |
| Reckless, dangerous, or careless use or driving of motor vehicle causing injury | 779 | 894 | 945 |
| Driving, or in charge of, motor vehicle under the influence of drink or drugs causing death | 30 | 37 | 23 |
| Driving, or in charge of, motor vehicle under the influence of drink or drugs causing injury | 89 | 77 | 63 |
| Failing to stop motor vehicle after accident involving bodily injury | 61 | 73 | 159 |
| Driving, or in charge of, motor or other vehicle under the influence of drink or drugs | 22,972 | 24,261 | 23,194 |
| Exceeding speed limits | 29,090 | 24,163 | 31,734 |
| Reckless, dangerous, careless, or inconsiderate use or driving of motor vehicle | 35,692 | 35,238 | 36,280 |
| Offences relating to the registration or licensing of motor vehicles* | 10,803 | 12,114 | 13,734 |
| Offences relating to driver's licence | 15,733 | 15,468 | 17,388 |
| Breaches of parking regulations | 83,349 | 75,325 | 93,049 |
| Other traffic offences | 35,713 | 32,319 | 43,763 |
| Total | 234 433 | 220 100 | 260 443 |
Until 1981, criminal trials were held only in the High Court. Since then District Court trial courts, located in 18 centres, have heard cases for all except the most serious of indictable offences, thus relieving the High Court of a heavy workload.
Criminal cases in the trial courts are of two classes: those actually tried in the trial courts; and those in which the accused person has pleaded guilty in the lower courts and been committed to the High Court or to a District Court trial court for sentence, or has been committed for trial and subsequently changed the plea to guilty.
The Court of Appeal hears appeals against convictions and sentences imposed in the High Court and in District Court trial courts. If it allows an appeal, the Court of Appeal may quash the conviction, vary the sentence, or order the case to be retried.
Table 10.7. CRIMINAL TRIALS
| Year | Tried in High Court | ||||||||
|---|---|---|---|---|---|---|---|---|---|
| Indictments and informations | Convictions | Sentences in cases of committal for sentence | Total sentences | ||||||
| M | F | M | F | M | F | M | F | Total | |
| Total counts and charges | |||||||||
| 1982 | 1,185 | 76 | 712 | 40 | 668 | 42 | 1,380 | 82 | 1,462 |
| 1983 | 847 | 81 | 519 | 52 | 592 | 50 | 1,111 | 102 | 1,213 |
| 1984 | 1,387 | 90 | 811 | 55 | 665 | 43 | 1,476 | 98 | 1,574 |
| 1985 | 1,486 | 84 | 743 | 51 | 782 | 60 | 1,525 | 111 | 1,636 |
| 1986 | 1,269 | 76 | 776 | 59 | 722 | 58 | 1,498 | 117 | 1,615 |
| Distinct persons | |||||||||
| 1982 | 413 | 46 | 324 | 31 | 225 | 19 | 549 | 50 | 599 |
| 1983 | 382 | 43 | 288 | 32 | 227 | 27 | 515 | 59 | 574 |
| 1984 | 550 | 45 | 426 | 33 | 236 | 24 | 662 | 57 | 719 |
| 1985 | 535 | 54 | 377 | 40 | 259 | 29 | 636 | 69 | 705 |
| 1986 | 589 | 42 | 424 | 36 | 304 | 39 | 728 | 75 | 803 |
| Year | Tried in District Court trial courts | ||||
|---|---|---|---|---|---|
| Total counts | Convictions | ||||
| M | F | M | F | Total | |
| Total counts and charges | |||||
| 1982 | 1,521 | 381 | 934 | 246 | 1,180 |
| 1983 | 2,247 | 388 | 1,461 | 280 | 1,741 |
| 1984 | 2,428 | 601 | 1,543 | 404 | 1,947 |
| 1985 | 2,465 | 469 | 1,368 | 296 | 1,664 |
| 1986 | 1,809 | 210 | 1,176 | 138 | 1,354 |
| Distinct persons | |||||
| 1982 | 712 | 130 | 506 | 98 | 604 |
| 1983 | 852 | 119 | 600 | 85 | 685 |
| 1984 | 930 | 126 | 621 | 73 | 694 |
| 1985 | 777 | 104 | 525 | 67 | 592 |
| 1986 | 732 | 79 | 506 | 55 | 561 |
Of the 1442 distinct persons indicted in all trial courts during 1986, 1021 were convicted and sentenced, 26 were still awaiting trial at the end of the year, 225 were acquitted, 5 were found insane, and the prosecution was not proceeded with in the remaining 165 cases.
Table 10.8. CRIMINAL TRIALS—SUMMARY OF OFFENCES
| Offence | 1982 | 1983 | 1984 | 1985 | 1986 |
|---|---|---|---|---|---|
* Includes persons charged with murder but convicted of manslaughter. † For 1986 includes sexual violation and unlawful sexual connection, Crimes Amendment Act effective 1 February 1986. | |||||
| High Court | Total counts and charges, convictions | ||||
| Offences against the person— | |||||
| Murder | 5 | 19 | 12 | 15 | 40 |
| Attempted murder | 4 | 1 | 12 | 5 | 12 |
| Manslaughter* | 36 | 27 | 22 | 24 | 20 |
| Rape and attempted rape | 102 | 88 | 137 | 120 | 154† |
| Other | 376 | 418 | 516 | 570 | 661 |
| Property and forgery offences | 567 | 358 | 383 | 465 | 422 |
| Drug offences | 249 | 195 | 361 | 315 | 208 |
| Other offences | 123 | 107 | 131 | 122 | 98 |
| Total, High Court | 1 462 | 1 213 | 1 574 | 1 636 | 1 615 |
| Distinct persons convicted | |||||
| Offences against the person— | |||||
| Murder | 5 | 18 | 10 | 14 | 36 |
| Attempted murder | 3 | 1 | 9 | 5 | 10 |
| Manslaughter* | 35 | 25 | 20 | 24 | 20 |
| Rape and attempted rape | 74 | 75 | 110 | 95 | 106 |
| Other | 218 | 248 | 294 | 308 | 376 |
| Property and forgery offences | 91 | 56 | 93 | 72 | 90 |
| Drug offences | 108 | 87 | 124 | 135 | 128 |
| Other offences | 65 | 64 | 59 | 52 | 37 |
| Total, High Court | 599 | 574 | 719 | 705 | 803 |
| District Court trial courts | Total counts, convictions | ||||
| Offences against the person | 212 | 239 | 246 | 233 | 217 |
| Property and forgery offences | 627 | 1,233 | 1,387 | 1,120 | 838 |
| Drug offences | 158 | 144 | 180 | 147 | 113 |
| Other offences | 183 | 125 | 134 | 164 | 146 |
| Total, District Court trial courts | 1 180 | 1 741 | 1 947 | 1 664 | 1 314 |
| Distinct persons convicted | |||||
| Offences against the person | 119 | 154 | 152 | 162 | 138 |
| Property and forgery offences | 254 | 372 | 367 | 301 | 282 |
| Drug offences | 105 | 88 | 115 | 77 | 82 |
| Other offences | 126 | 71 | 60 | 52 | 59 |
| Total, District Court trial courts | 604 | 685 | 694 | 592 | 561 |
Table 10.9. SENTENCES IMPOSED IN TRIAL COURTS, DISTINCT PERSONS
| Sentence | 1982 | 1983 | 1984 | 1985 | 1986 |
|---|---|---|---|---|---|
* Also includes persons committed into the care of the Department of Social Welfare. † Community care is a new penalty from 1 October 1985. | |||||
| Probation or community service* | 145 | 128 | 125 | 132 | 118 |
| Ordered to come up for sentence if required | 33 | 36 | 34 | 41 | 20 |
| Discharged | 12 | 11 | 6 | 9 | 9 |
| Fined | 180 | 182 | 137 | 135 | 118 |
| Imprisoned | 630 | 640 | 803 | 699 | 774 |
| Corrective training | 11 | 16 | 15 | 12 | 16 |
| Periodic detention | 185 | 244 | 290 | 262 | 272 |
| Community care† | ... | ... | ... | ... | 20 |
| Preventive detention | 1 | - | 1 | 1 | 4 |
| Detained in psychiatric hospital | 6 | 2 | 2 | 6 | 13 |
| Total | 1 203 | 1 259 | 1 413 | 1 297 | 1 364 |
On conviction for murder a mandatory sentence of life imprisonment is imposed. The death sentence for murder was abolished in 1961.
Table 10.10. APPEALS IN HIGH COURT AGAINST CONVICTIONS OR ORDERS AND/OR SENTENCES IMPOSED IN DISTRICT COURTS
| Year | Appeals heard | Allowed | Abandoned or withdrawn | Dismissed |
|---|---|---|---|---|
| 1982 | 1,728 | 617 | 296 | 815 |
| 1983 | 1,775 | 528 | 274 | 973 |
| 1984 | 1,892 | 636 | 278 | 978 |
| 1985 | 1,734 | 516 | 284 | 934 |
| 1986 | 1,739 | 592 | 289 | 858 |
Table 10.11. APPEALS IN COURT OF APPEAL AGAINST CONVICTIONS AND/OR SENTENCES IMPOSED IN TRIAL COURTS
| Year | Appeals lodged | Appeals heard* | ||
|---|---|---|---|---|
| Allowed | Refused | Total | ||
| * Appeals allowed and refused will not always add to the total given because of reserved decisions or cases adjourned. | ||||
| 1982 | 316 | 90 | 216 | 308 |
| 1983 | 291 | 67 | 196 | 264 |
| 1984 | 329 | 97 | 198 | 300 |
| 1985 | 316 | 65 | 227 | 290 |
| 1986 | 333 | 60 | 282 | 340 |
The District Courts dealt with 318 068 charges (excluding parking breaches) in 1985. Of these charges 47 081 or 14.8 percent were against females. This total includes 11 468 charges for property offences, mainly shoplifting, fraud, and false pretences, compared with 41 137 for males.
Table 10.12. CHARGES AGAINST MALES AND FEMALES IN DISTRICT COURTS, 1985
| Offence | Males | Females | ||
|---|---|---|---|---|
| Number | Percent | Number | Percent | |
| Offences against the person | 12,510 | 4.6 | 1,340 | 2.8 |
| Shoplifting | 2,227 | 0.8 | 3,782 | 8.0 |
| Fraud and false pretences | 9,274 | 3.4 | 3,865 | 8.2 |
| Other property offences | 29,636 | 10.9 | 3,821 | 8.1 |
| Drug offences | 10,091 | 3.7 | 1,655 | 3.5 |
| Offences against good order and decency | 8,584 | 3.2 | 854 | 1.8 |
| Traffic offences | 166,488 | 61.4 | 23,114 | 49.1 |
| Other offences | 32,177 | 11.9 | 8,650 | 18.4 |
| Total | 270,987 | 100.0 | 47,081 | 100.0 |
The Criminal Injuries Compensation Act 1963 introduced the first statutory scheme in the world for compensation by the state to those injured by crimes of violence and to the dependants of persons killed by such acts. The accident compensation scheme administered by the Accident Compensation Corporation now caters for all personal injury by accident in New Zealand, and thus covers the whole range of listed criminal injuries, including pregnancy by rape, and criminal infection with disease. This scheme is designed as a fund of first resort. See section 8.4, Accidents.
New Zealand's penal system has evolved to protect the community from offenders through both deference and reformation, with increasing emphasis on rehabilitation over recent decades.
The primary consideration is to ensure that those who are a serious danger to society by reason of the nature of their offences or character of their offending, are removed from the community. Apart from that, wherever possible, sanctions are imposed that do not involve imprisonment. Where prison or other forms of detention are necessary, the aim is to provide resources to assist offenders to live within the law. The interest of the community as well as of the offender is promoted by his/her successful resettlement on release.
The main sanctions available to the courts for dealing with offenders other than by imprisonment are fines, reparation, supervision, community service, periodic detention and community care.
Fines are by far the most common penalties imposed by the courts. For some minor offences a fine is the only sanction available. Part or all of a fine imposed may be awarded to a victim who suffered physical or emotional harm as a consequence of the offence being committed.
Where an offender is convicted of an offence which caused loss or damage to a person's property, or caused the victim emotional harm, the offender may be sentenced to make reparation. Reparation as a sentence was introduced in 1985.
Supervision replaced the former category of ‘release on probation’ in 1985. An offender may be sentenced to supervision for between six months and two years, and during that period must accept supervision by a probation officer and observe conditions relating to residence, employment, and association. Additional conditions may be imposed by the judge imposing the sentence.
During 1987, 6096 supervision orders were imposed and the number of people subject to the sentence as at 31 December 1987 was 5286.
This sentence requires an offender to provide unpaid service to a community organisation, such as a hospital or school. The minimum number of hours which can be imposed is 20 and the maximum is 200, and the sentence must be completed within a twelve month period. The consent of the offender must be obtained prior to imposition. It is also a sentence which is reliant upon the community providing suitable opportunities for the sentence to be discharged.
During 1987, 2503 community service orders were imposed and the number of people subject to that sentence as at 31 December 1987 was 1764.
Introduced initially as a sentence for males in 1963, periodic detention is now available to the courts in respect of both male and female offenders aged 15 years and over. The maximum length of the sentence is 12 months and during that period offenders are required to place themselves in the custody of the warden of a periodic detention centre for specified periods, the normal period of custody being nine hours each Saturday. While in custody the offender usually carries out tasks similar to those which meet the criteria for the sentence of community service.
During 1987, 15 699 periodic detention orders were imposed and the number of people subject to that sentence as at 31 December 1987 was 5547.
This sentence was introduced in 1985 and, like community service, requires the consent of the offender. The offender is required to undergo a programme which may involve attendance at medical, educational or rehabilitative facilities, or placement in the care of suitable community groups or persons. The sentence may comprise a residential component for a maximum of six months and otherwise cannot exceed 12 months.
During 1987, 938 orders for community care were imposed, and the number of people subject to that sentence as at 31 December 1987 was 450.
Although not sentences in the strict sense, various other means are available to the courts in dealing with offenders whose offences are not serious. They include conviction and discharge, where the effect is that the offender has a conviction recorded against him or her, but no sanction is imposed. Conviction coupled with an order that the offender come up for sentence if called upon within a specified period is another means. This is a suspension of punishment conditional upon good behaviour but is not subject to the positive conditions of supervision. Finally, a court, although it may find an offender guilty, may discharge him or her without conviction if it considers the offence to be of a trivial or technical character.
The sentences of detention which the courts may impose are:
Corrective training—the term fixed by statute being three months. The offender must be between 16 and 20 years of age, and he or she may be eligible for early release after serving two-thirds of the sentence. After release the offender is on probation for six months.
Imprisonment—for a stated period or for life. An offender sentenced to imprisonment for a fixed term may be eligible for release on parole after serving half of the sentence, or in some cases two-thirds.
Preventive detention—which means detention in prison for an indefinite term to be decided by the Parole Board, but in any event not less than seven years. This sentence may be imposed on conviction for certain sexual offences, if the offender has been convicted for a sexual offence on at least one previous occasion. The offender must be 25 years of age or over. After serving seven years of the sentence the offender may be released on parole for life. Preventive detention was restricted to sexual offenders by the Criminal Justice Amendment Act 1967. Hitherto, it had been available for persistent offenders in a number of other cases.
There is a policy of restricting the use of detention of offenders in an institution as far as practicable, consistent with the protection of the community from dangerous criminals.
There is also a prohibition against a sentence of detention (other than a sentence of periodic detention) being imposed on any person not legally represented at some time before conviction, unless he or she had the means to pay for legal representation but declined to employ a solicitor, or he or she was offered legal aid and refused it.
The Criminal Justice Act 1985 states that violent offenders are to be imprisoned except in special circumstances, while property offenders should not be imprisoned except in special circumstances.
Table 10.13. PERSONS PLACED ON SUPERVISION
| Year | Males | Females | Total |
|---|---|---|---|
* The Criminal Justice Act 1985 introduced the sentence of supervision, which replaces, and is a development of the sentence of probation. Source: Department of Justice. | |||
| 1982 | 8,816 | 1,536 | 10,352 |
| 1983 | 7,913 | 1,288 | 9,201 |
| 1984 | 5,145 | 1,245 | 6,390 |
| 1985* | 4,476 | 1,075 | 5,551 |
| 1986 | 4,199 | 1,131 | 5,330 |
New Zealand's penal institutions are listed in table 10.14. A sentence of corrective training applies to both males and females aged between 16 and 20 years. Any person serving a sentence of up to eight days may be detained at any police station, which is deemed to be a prison for that period.
Table 10.14. PENAL INSTITUTIONS*
| Category | Institution | Muster level |
|---|---|---|
* At 1 January 1988. † Regional prison. ‡ Includes Wanganui (City) Prison. § Included in other categories. ¶ Included in Arohata Women's Prison. Source: Department of Justice. | ||
| Maximum security | Auckland Maximum Security Prison | 210 |
| Medium security | Auckland Medium Security Prison | 164 |
| Christchurch Prison (Paparua) | 329 | |
| Christchurch Prison (Addington)† | 65 | |
| Invercargill Prison | 160 | |
| Mount Eden Prison | 354 | |
| Waikeria Prison | 480 | |
| Wanganui Prison | 213‡ | |
| Wellington Prison | 112 | |
| Minimum security | Dunedin Prison† | 55 |
| Manawatu Prison | 140 | |
| Napier Prison | 56 | |
| New Plymouth Prison† | 64 | |
| Ohura Prison | 60 | |
| Rangipo Prison Farm | 200 | |
| Rolleston Prison | 107 | |
| Tongariro Prison Farm | 90 | |
| Wanganui (City) Prison | 50 | |
| Wi Tako Prison† | 112 | |
| Male remand centres (Medium security) | Christchurch Prison (Addington) | § |
| Dunedin Prison | ||
| Invercargill Prison | ||
| Manawatu Prison | ||
| Mount Eden Prison | ||
| Napier Prison | ||
| New Plymouth Prison | ||
| Waikeria Prison | ||
| Wanganui Prison | ||
| Wellington Prison | ||
| Corrective training institutions | Arohata Corrective Training Institution¶ | ... |
| Tongariro Corrective Training Institution | 90 | |
| Female institutions and remand centres | Arohata Women's Prison | 85 |
| Christchurch Women's Prison | 52 | |
| Mount Eden Prison (Female division) | 24 | |
Table 10.15. PRISON POPULATION, RECEPTIONS, AND DISCHARGES, 1986
| Category | Males | Females | Total |
|---|---|---|---|
| Persons in prison at 1 January | 2,144 | 91 | 2,235 |
| Receptions during the year (including multiple receptions of the same person, but excluding transfers of sentenced prisoners) | 12,528 | 873 | 13,401 |
| Discharges during the year (including multiple discharges of the same person, but excluding transfers) | 11,806 | 857 | 12,663 |
| Persons in prison at 31 December | 2,578 | 112 | 2,690 |
| Daily average number of prisoners | 2,537 | 117 | 2,654 |
In table 10.15 not all prisoners received were actually undergoing sentence on conviction for criminal offences. Of the 13 401 receptions, 7318 referred to persons in the following categories: remanded in custody pending a court hearing, and later released after acquittal or on a successful application for bail; given a sentence not involving custodial detention; sent after sentence to an institution other than that in which they were remanded; or still on remand at the end of the year. In 1986, 97 debtors were also received for non-payment of civil debt, and four persons were transferred to psychiatric institutions.
Table 10.16. AGE AND OFFENCES OF PRISONERS RECEIVED, 1986
| Age, in years | Offences against the person | Driving under influence of drink or drugs | ||||||
|---|---|---|---|---|---|---|---|---|
| Sexual offences | Violent offences | Other | ||||||
| M | F | M | F | M | F | M | F | |
| Under 21 | 45 | - | 349 | 18 | 24 | - | 9 | - |
| 21–24 | 37 | - | 242 | 12 | 13 | 2 | 34 | 2 |
| 25–29 | 45 | - | 170 | 10 | 14 | - | 38 | - |
| 30–39 | 73 | 1 | 109 | 2 | 15 | 1 | 47 | 1 |
| 40–49 | 41 | - | 26 | - | 2 | - | 30 | - |
| 50 and over | 23 | - | 8 | - | - | - | 9 | - |
| Total | 264 | 1 | 904 | 42 | 68 | 3 | 167 | 3 |
| Burglary, theft and fraud* | Conversion, wilful damage, etc.† | Other offences | Total | Total prisoners, both sexes | |||||
|---|---|---|---|---|---|---|---|---|---|
| Age, in years | M | F | M | F | M | F | M | F | |
| Under 21 | 734 | 61 | 248 | 7 | 539 | 37 | 1,948 | 123 | 2,071 |
| 21–24 | 380 | 39 | 105 | 6 | 546 | 24 | 1,357 | 85 | 1,442 |
| 25–29 | 225 | 26 | 26 | 2 | 414 | 25 | 932 | 63 | 995 |
| 30–39 | 122 | 11 | 17 | - | 292 | 20 | 675 | 36 | 711 |
| 40–49 | 36 | 3 | 4 | - | 96 | 4 | 235 | 7 | 242 |
| 50 and over | 12 | - | 1 | - | 29 | 2 | 82 | 2 | 84 |
| Total | 1 509 | 140 | 401 | 15 | 1 916 | 112 | 5 229 | 316 | 5 545 |
| * Includes forgery and currency offences. | |||||||||
| † Includes all other property offences. | |||||||||
Table 10.17. AGE AND LENGTH OF SENTENCES OF PRISONERS RECEIVED, 1986
| Age, in years | Length of sentence | Total | |||||
|---|---|---|---|---|---|---|---|
| Under 1 month | 1–3 months | 3–12 months | 1–3 years | 3–5 years | 5 years and over† | ||
* Includes corrective training. † Includes 34 with life imprisonment. | |||||||
| 15 | - | 1 | 3 | 2 | - | 1 | 7 |
| 16 | - | 1 | 194 | 20 | 1 | 6 | 222 |
| 17 | 21 | 14 | 299 | 59 | 8 | 4 | 405 |
| 18 | 31 | 44 | 345 | 79 | 11 | 6 | 516 |
| 19 | 34 | 59 | 289 | 81 | 8 | 8 | 479 |
| 20 | 30 | 69 | 230 | 87 | 19 | 7 | 442 |
| 21–24 | 130 | 217 | 699 | 307 | 47 | 42 | 1,442 |
| 25–29 | 85 | 160 | 446 | 227 | 41 | 36 | 995 |
| 30–39 | 57 | 129 | 290 | 154 | 42 | 39 | 711 |
| 40–49 | 25 | 46 | 87 | 57 | 13 | 14 | 242 |
| 50–59 | 10 | 12 | 25 | 14 | 3 | 2 | 66 |
| 60 and over | 2 | 2 | 8 | 4 | 1 | 1 | 18 |
| Total | 425 | 754 | 2 915 | 1 091 | 194 | 166 | 5 545 |
Table 10.18. AGES OF CORRECTIVE TRAINING DETAINEES, 1986
| Sentenced to corrective training | Age, in years | Total | ||||
|---|---|---|---|---|---|---|
| 15 | 16 | 17 | 18 | 19 | ||
| * Includes two males shown as aged 20. | ||||||
| Males | 1 | 152 | 208 | 194 | 101* | 656 |
| Females | - | 14 | 20 | 13 | 14 | 61 |
The number of prisoners received to serve a sentence imposed during 1986 for criminal offences was 6044, but deducting multiple receptions of the same prisoner, the number of distinct persons was 5545, 5229 males and 316 females. The corresponding total for 1985 was 5562, involving 5144 distinct persons (4846 males and 298 females).
Ethnic origins of prisoners. Of the 5545 distinct inmates received into penal institutions in 1986, 2772 were Maori, 2483 European, 276 Pacific Island Polynesian and 14 were of other or non-stated ethnic origin.
To assist prison administration, classification committees operate in the main reception prisons (Mt Eden, Waikeria, Wanganui, Manawatu, Wellington, Christchurch, and Invercargill) and at Auckland Maximum and Auckland Medium Security Prisons. An important objective is to ensure that prisoners are held in humane conditions and in the minimum degree of security consistent with public safety. Wherever possible inmates are put to work on some form of constructive employment, whether it be industrial production in a secure institution, or food production on a prison farm. In addition, and particularly for the young offender, an attempt is made to teach some particular skills. A variety of evening activities have been introduced into the prisons, and training benefit is derived from these activities, whether they be recreational, educational, cultural, individual, or collective.
There are 26 full-time teachers serving in various penal institutions, with part-time teachers supplementing their work. Teachers seek to help inmates disadvantaged by lack of education, and inmates undertaking further education or technical courses, either by correspondence or in prison classes. Such courses may be at any level from illiteracy to study towards a university degree. The interest shown by inmates is encouraging, as often it gives them better social and employment skills, and aids resettlement. All institutions receive at regular intervals a supply of books from the National Library, and inmates are permitted free use of the library's request service.
Psychologists from the Department of Justice Psychological Service provide advice and evaluation for the penal division on policy planning, institution programme development and implementation, individual programme development and implementation, psychological treatment for individuals and groups, and in-service training for prison officers. Advice is given on the best way to provide continuing psychological services. A public or private psychological agency, private practitioner, or the department's own psychological service may be suggested. Where psychological work is undertaken for the penal division by another agency or individual, the department's psychological service gives them advice and assistance, and monitors and evaluates the service provided.
All inmates are credited with modest earnings based on a system of marks assessed according to diligence. A portion of the earnings may be spent in a prison canteen on tobacco, confectionery, and toilet necessities, and this provides an incentive to good work and conduct. At the same time the loss of this privilege is a useful disciplinary measure. The balance of the earnings is paid to the inmate upon his or her release to help meet financial commitments during the first few days of freedom. Inmates can also get a grant of up to $120 from the Department of Social Welfare on release.
An inmate charged with one of the less serious offences against discipline appears before the superintendent, who may impose a penalty at his or her discretion, or refer the case to a visiting justice or the court. A visiting justice may deal with all cases of offences against discipline and must deal with those which are outside the jurisdiction of the superintendent, unless it is thought they should be brought before the court. The justice's powers of punishment are wider than those of a superintendent.
Inmates may be released during the day for private employment. The selection of inmates for this privilege is made by the superintendent. The inmates are required to contribute part of their wages towards the cost of their maintenance in the institution, and part may also be withheld in satisfaction of outstanding fines or debts. The balance is made available to their dependants or is held until final release.
The step from custody to freedom is a difficult one for prisoners, many of whom require assistance, advice, and guidance. Offenders serving a sentence of corrective training or imprisonment for one year or more are under the supervision of a probation officer for six months on release. During any part of that period, also falling within the maximum period they could have been detained in an institution, they are subject to recall if their behaviour is unsatisfactory. Inmates serving sentences of imprisonment for life, or preventive detention are released to the supervision of a probation officer for the life of the offender, subject to similar conditions. The period of supervision has a dual purpose. It is for the protection of the community against further offending, and is at the same time an aid to the prisoner to re-establish himself or herself.
The introduction of long sentences designed to protect society against the hardened criminal created the need for a procedure to enable persons serving one of these sentences to be released as soon as they show that they are fit to be returned to society.
Two types of board consider parole cases. Persons sentenced to life terms of more than seven years, or preventive detention, have their cases considered by the parole board. Those sentenced to less than seven years appear before one of 17 district prisons boards.
The national administrative and operational control of the New Zealand Police is vested in the Commissioner who is responsible to the Government through the Minister of Police.
For operational purposes, New Zealand is divided into six police regions.
Region 1, containing Northland and Auckland, by virtue of its greater population, is controlled by an assistant commissioner. Other regions, because of their varying size, are commanded by officers ranging in rank from chief superintendent to deputy assistant commissioner.
Regional commanders are responsible for the general preservation of peace and order, for the prevention of offences, and for the detection of offenders in their areas of command.
Policing is maintained by a system of mobile patrols and foot ‘beats’ co-ordinated by a communications network.
The police have the responsibility for the enforcement of the criminal law, principally the Crimes Act and the Summary Offences Act, but also various other statutes such as the Arms Act, Sale of Liquor Act, Gaming and Lotteries Act, Misuse of Drugs Act, and Transport Act. The summary prosecution of criminal offences investigated by the police is undertaken in the District Court by trained police prosecutors. Police in country districts in some cases hold additional appointments such as registrars and bailiffs at District Courts, probation officers, and honorary fishery officers.
The effective strength of the police at 31 March 1987 was 5291 sworn personnel, including 307 policewomen, who have equal status and opportunity with their male counterparts. The department also employed 814 civilian staff.
These groups of specially trained and equipped officers are mobilised to deal with offenders with weapons. During 1986, armed offenders squads attended 210 incidents, compared with 177 in 1985.

Fingerprint technician examines an Auckland takeaway bar after a robbery.
A total of 181 members throughout the country now perform armed offenders squad duties on a part-time basis.
The anti-terrorist squad, made up of selected members of armed offenders squads, is provided with specialised training to enable it to deal with acts of terrorism. The squad exercises with highly trained police negotiators and other specialist police support staff.
Refresher courses are held frequently and training has also been carried out with Ministry of Defence personnel. Close liaison has been maintained with ministry staff to ensure effective co-ordination if needed.
There were 857 police-controlled search and rescue operations during 1986–87, compared with 817 in 1985–86. These operations also involved many thousands of voluntary hours by members of the Federated Mountain Clubs and the New Zealand Coast Guard Federation.
There are 43 police staff appointed to positions in a law-related education programme. Their task is to encourage teachers and police to co-operatively plan law-related themes suitable for use in classrooms. During 1987 a joint New Zealand Police/Education Department Abuse Prevention Programme was completed.
A comprehensive network of police dogs and handlers is maintained through-out New Zealand. During 1986 police dogs were deployed on 22 632 incidents. At 31 March 1987 there were 87 general purpose dogs, 7 narcotic detector dogs, and 3 explosive detector dogs.
First introduced in 1973, community constables have a wide brief within the areas that they work. They assess law-related problems and work to resolve them by enlisting community support—acting as a catalyst for community solutions to law related problems. They may work from police stations, their own offices in shopping centres or other locations, or from a kiosk, such as in the Cathedral Square in Christ-church. At 31 December 1987 there were 119 community constables spread over all six police regions.
A police/community crime prevention programme, which began in 1984, has grown steadily to 14 550 recognised neighbourhood support groups throughout New Zealand at 31 March 1987.
A similar programme for the rural community began in 1986 and there were 853 of these groups at 31 March 1987.
For the 1986 calendar year there were a total of 17 328 drug offences reported, of which 13 825 resulted in prosecutions, an increase over the previous year of 1559 prosecutions.
There were increases in seizures over 1985 in the following substances: cannabis oil (from 9.6 grams to 4 030.1 grams); heroin (from 684.05 grams to 1150.2 grams); opium (from .005 grams to 18.2 grams); and cocaine (from 32.1 grams to 4030.1 grams).
Decreases were recorded in the seizure of: cannabis leaf (from 339.29 kg to 326.2kg); cannabis plants (from 143131 to 110488 plants); lsd (from 9006.5 tabs to 8753 tabs); and morphine (from 17.7 grams to 16.2 grams).
The increase in cannabis oil seizures was related to the emergence of local production. Police also noted the emergence of cocaine as a major drug of concern, while the manufacture of illicit heroin and morphine in ‘homebake’ laboratories remains a problem.
Search without warrant powers were exercised in 743 cases, resulting in 605 seizures. There were 11 drug deaths recorded in 1986, four of which related to the abuse of heroin or morphine.
10.1 Department of Justice; Department of Labour; Department of Maori Affairs; Department of Statistics.
10.2 New Zealand Police; Department of Justice; Department of Statistics.
10.3 Department of Justice; Department of Statistics.
10.4 New Zealand Police.
Justice Statistics. Department of Statistics (annual).
Report of the Department of Justice (Parl. paper E. 5).
Report of the Legal Aid Board (Parl. paper E. 7).
Report of the Ministerial Committee of Enquiry into Violence. Department of Justice, 1987.
Report of the New Zealand Police (Parl. paper G. 6).
Report of the Parole Board (Parl. paper E. 5A).
Tables of New Zealand Acts and Ordinances and Statutory Regulations in Force. Government Printer (annual).
Table of Contents
In New Zealand, as in most other countries, both the Government and local authorities recognise the importance of the arts in the life of the community and provide increasing support. The traditional sources of assistance to the arts in New Zealand are: the Queen Elizabeth II Arts Council; the New Zealand Literary Fund; the New Zealand Historic Places Trust; the National Art Gallery and Museum; and the New Zealand Authors’ Fund, which compensates authors for the loss of royalties through having their books lent by libraries.
Profits from state-run lotteries are used extensively to assist art galleries, museums, and cultural organisations. The New Zealand Authors’ Fund, the literary fund and the lottery profits schemes are administered by the Department of Internal Affairs.
Another major contribution to cultural activity is the New Zealand Symphony Orchestra which is administered by the Broadcasting Corporation. Also, since 1974 the Ministry of Foreign Affairs has been involved in fostering the arts through its Cultural Exchange Programme. The programme's objective is to facilitate exchanges in all branches of the arts, and extend overseas knowledge of New Zealand's cultural achievements.
Table 11.1. GRANTS TO THE ARTS FROM GOVERNMENT, AND LOTTERY PROFITS, 1987–88*
| Group | Government assistance | Lottery grant |
|---|---|---|
Year ended 31 March. Source: Department of Internal Affairs. | ||
| $(000) | ||
| Queen Elizabeth II Arts Council | 7,509 | 5,150 |
| New Zealand Film Commission | 4,249 | 1,400 |
| New Zealand Film Archive | 105 | 100 |
| Special projects in the arts | - | 150 |
| Conservation of cultural property | 88 | 200 |
| New Zealand Literary Fund | 150 | 150 |
| National Art Gallery and Museum | 6,524 | 200 |
| New Zealand Historic Places Trust | 350 | 740 |
| New Zealand Authors’ Fund | 496 | - |
| Cultural Facilities Scheme | - | 500 |
| Art Galleries and Museum Scheme | 650 | |
| New Zealand Oral History Archive | 55 | - |
The Queen Elizabeth II Arts Council of New Zealand was formed in 1964 to promote the practice and appreciation of the arts. It provides financial assistance to individual artists and suitable incorporated, non-profit organisations. Essentially, activities which are professional in character and standard receive priority for financial support.
In 1974 the Queen Elizabeth II Arts Council Act was amended and the council was expanded to include three regional councils and a national network of community arts councils. A council for Maori and South Pacific arts was established in 1978. These new statutory provisions have led to the introduction of a range of programmes which complement the existing pattern of arts support. They include schemes designed to assist the arts at a community level (there are now 100 Community Arts Councils throughout New Zealand), to foster arts sponsorship, to provide travel assistance for artists, and to encourage and promote Maori and Pacific Island arts and bicultural traditions. For the year ended 31 March 1988 the council has received funds totalling $12.3 million, of which approximately $5.15 million was provided from New Zealand Lottery Board profits. Though the Arts Council supports six professional theatres, four regional orchestras, a modern dance company, a ballet company and a professional opera programme, the council is placing more emphasis on the organisations’ own ability to remain financially viable.
Individual artists and performers are assisted through programmes in their respective areas:
Crafts—The craft programme offers potters, ceramists, jewellers and other craft artists help with study, training, establishment grants, studio equipment, residencies, travel and time to devote to full-time work. It also offers assistance to the polytechnic-run craft education design courses—training potential tutors, bringing international practitioners to New Zealand to run workshops, as well as help with refresher courses and study time for craft artists. The council also works closely with the Crafts Council of New Zealand.
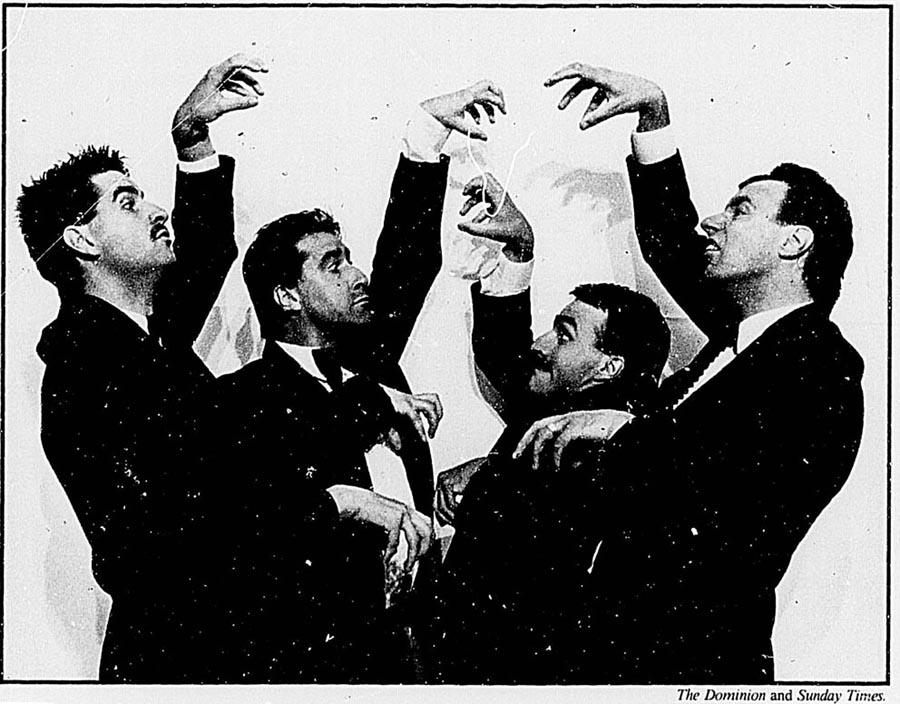
‘The Bouncers’, a co-operative of actors.
Dance—The dance programme offers training support through the New Zealand School of Dance, and offers assistance to choreographers through the Choreographic Commission. In addition, funding is available to dancers wishing to study overseas or in New Zealand, to develop dance projects, and for research and development.
Film and video—The council provides funds and advice to film and video makers on budgeting and preparing projects, script development, access to facilities and services, and marketing. The Creative Film and Video Fund, run jointly with the New Zealand Film Commission and Television New Zealand, funds projects for which no other funding is available, to one release print stage. Projects involving promotion, exhibition, research and training are also assisted.
Music—The music programme contributes to the training of young musicians and develops opportunities for professional musicians of all types through study grants, workshops, and masterclasses. Through support to the Music Federation of New Zealand, the council assists professional musicians to tour the country. The council also offers scholarships, encourages residencies, composers-in-schools and compositions, and assists with first-time recording.
Theatre—In addition to substantial support to the country's theatres, the council promotes and develops training through the New Zealand Drama School and the National Theatre Technicians Training Committee, and employment through support to smaller theatre, puppetry and mime companies. Grants for playwrights, commissioned plays, residencies, study, and bicultural programmes are also given.
Galleries—The Arts Council does not support art galleries directly, but assistance is given to visual artists to create and exhibit new work and to improve work environments. Assistance is also given to promote the work of New Zealand artists internationally, to encourage international exchanges, and to stimulate discussion on the theory and practise of the visual arts. Advice is given on the production of publications on visual arts, with residencies, marketing, artspaces, and the acquisition of New Zealand artworks.
Maori and South Pacific Arts—The Council for Maori and South Pacific Arts assists Maori and South Pacific artists and performers in the development of their arts. Assistance to Maori artists and performers comes through a Maori Arts Committee. Sub-committees support weaving and carving artists, as well as music, dance and drama performers. Its programmes also promote the Maori language, marae decoration, tutoring such performing arts as haka and poi and other community-based projects. The council also supports the artists and writers group Nga Puna Wainunga. The South Pacific Art Committee assists visual and language artists, and performers. It supports language teaching projects, costume and instrument-making, and traditional carving and canoe-building projects. Research, recording of or publications about Maori and South Pacific arts, and conservation projects are also supported.
In addition to the assistance given to artists in specific fields, the Arts Council is involved in regional and national tours of New Zealand artists with corporate sponsors. The practice and appreciation of the arts as an aspect of education is encouraged and developed through performers-in-schools and residencies schemes, in association with the Department of Education. Musicians, dancers, actors and writers are helped to tour schools in all parts of the country and take up residencies.
The New Zealand Symphony Orchestra is widely known for the high standard of its public concerts and its performances on radio and television. Distinguished guest conductors and celebrity artists from other countries, along with resident soloists and New Zealand choirs, appear regularly with the orchestra. As a national orchestra, it is funded by the Broadcasting Corporation. Its tour programme is one of the most extensive in the world, involving some 20 000 kilometres of internal travel annually. A minimum playing strength of 89 enables the orchestra to undertake the complete symphonic repertoire. As well as presenting nationwide concerts, the orchestra has toured overseas and made several commercial recordings. There is also a small training orchestra of string players, the Schola Musica, to give promising students orchestral experience. The New Zealand Symphony Orchestra also organises an annual season by the New Zealand Youth Orchestra.
The New Zealand Film Commission was established in November 1978. Its functions, powers, and duties are defined in the New Zealand Film Commission Act 1978. Administration expenditure is met by the Department of Internal Affairs. Each year, the Film Commission offers financial assistance to a considerable number of film projects, both for development and for production.
A major source of support for New Zealand literature and writing is the New Zealand Literary Fund, administered by the Department of Internal Affairs. The fund is designed to encourage the writing, publication, reading and study of New Zealand writing. Independently, or in association with other organisations, it finances a number of awards, fellowships and bursaries.
These include the ICI Writers’ Bursary, the Choysa Bursary for children's writers, the Queen Elizabeth II Arts Council/New Zealand Literary Fund Playwright's Award and fellowships at Victoria University, and the Universities of Auckland and Canterbury. Promotional programmes include the New Zealand Book Awards (funded jointly with the Queen Elizabeth II Arts Council), the Government Publishing Awards for the New Zealand Children's Book of the Year (sponsored by the Government Printing Office), and the New Zealand Book Council's Writers in Schools Scheme. Privately sponsored awards for writing are the James Wattie Book of the Year Award and the Bruce Mason Playwriting Award. The University of Otago offers fellowships in literature (Robert Burns Fellowship), painting and sculpture (Frances Hodgkins Fellowship), and music (Mozart Fellowship).
The New Zealand Authors’ Fund makes payments to writers as compensation for loss of royalties through library use of their books and is also administered by the Department of Internal Affairs.
Copyright comes into existence automatically upon the completion of any original literary, dramatic, musical, or artistic work, including photographs. No registration is necessary, nor is any other formality required for securing copyright protection. Copyright also exists in New Zealand for sound recordings, cinematograph films, broadcasts, and published editions (typography) of literary, dramatic, and musical works.
Copyright in literary, dramatic, musical, and artistic works (except photographs) continues until 50 years after the author's death, if the works are published in the author's lifetime, and until 50 years after publication or 75 years after death (whichever is shorter) if they are unpublished at the death of the author. Copyright of photographs, sound recordings, cinematograph films, and broadcasts continues until 50 years after the making, and in editions until 25 years after publication.
Copyright in New Zealand of literary, dramatic, musical, and artistic works and of cinematograph films extends to all countries which are parties to the International Convention for the Protection of Literary and Artistic Works (Berne Copyright Union) and to all countries which are parties to the Universal Copyright Convention. In some cases, sound recordings, broadcasts, and published editions are also protected overseas. New Zealand is a party to both conventions. Most countries have acceded to the one or both conventions. New Zealand has acceded to the Convention for the Protection of Producers of Phonograms Against Unauthorised Duplication of their Phonograms. The convention obliges each contracting state to protect the producers of phonograms (i.e., records, cassettes, and other-exclusively aural fixations of a performance or other sounds) against the unauthorised reproduction of their phonograms, and against the importation and distribution to the public of such unauthorised reproductions. In New Zealand certain disputes relating to performing rights of copyright works, sound recordings, or films may be determined by the Copyright Tribunal.
New Zealand has a variety of types of censorship designed to cover the different forms of communication. At various stages. Parliament has enacted legislation to encapsulate new technological developments in the media. Essentially, there are five major Acts which regulate censorship in New Zealand: The Films Act 1983; the Video Recordings Act 1987; the Indecent Publications Act 1963; the Broadcasting Act 1976; and the Customs Act 1966. These five Acts direct material to a number of authorities established specifically to maintain socially accepted standards of decency in different media. There are also many other forms of legal censorship in New Zealand. Numerous Acts, including the Human Rights Commission Act 1977, the Race Relations Act 1971 and the Contraception, Sterilisation and Abortion Act 1977, set standards on a range of other issues. Also, in the case of broadcasting, local productions are the responsibility of their producers, although overseas television programmes are monitored by a standards committee.
At the end of 1987, the Minister of Justice set up a committee of inquiry to inquire into and report on the production and distribution of pornographic material and to make recommendations on its evaluation and censorship.
Films and videos for public exhibition—All films and videos (except specially exempted categories) intended for public exhibition are classified, restricted or rejected by the Chief Censor of Films. (Videos intended for viewing in private residences are examined by the Video Recordings Authority, a separate statutory office.)
Under the Films Act 1983, the Chief Censor of Films must determine whether the exhibition of a film is likely to be “injurious to the public good” by considering the extent and degree to which, and the manner in which, it depicts or treats anti-social behaviour, sex, crime and violence.
Classifications used are:
G Approved for general exhibition:
GY Approved for general exhibition; recommended as more suitable for persons 13 years of age and over;
GA Approved for general exhibition; recommended as more suitable for adults;
R (age) Approved for exhibition only to persons of the age specified or over (usually R13, R16 or R18;
RP (age) Approved for exhibition only to persons of the age specified or over, and to any person under that age when accompanied by that person's parent or guardian (usually RP13 or RP16);
R* Approved for exhibition subject to any such restriction as the chief censor may specify.
Advertising material related to public exhibition also comes under the control of the chief censor and must be approved prior to use. Such advertising material must inform the public of the classification specified by the chief censor for the film or video.
Distributors dissatisfied with the Chief Censor of Films’ decision may appeal to the Film Censorship Board of Review.
The Office of the Film Censor is concerned only with the classification of films and videos. The policy and administration of the Films Act is the responsibility of the Department of Internal Affairs.
Video recordings—The Video Recordings Act 1987 established a system of determining the indecency or otherwise, and labelling, of video recordings for sale or hire. Videos intended for entertainment and available to the public are required to be rated and labelled to show the minimum age of viewers they are considered suitable for. Decisions on labelling are made by two authorities. A labelling body—made up of industry representatives and a member nominated by the Ministers of Consumer Affairs and Womens’ Affairs—determines the labelling of videos considered suitable for viewing by those under 18 years of age (about 80 percent of titles). Any other titles, which have usually been rated by New Zealand, Australian, or British film censors as suitable for viewing only by those of 18 years and older, are classified to determine their suitability for distribution or otherwise by a Video Recordings Authority. The authority's restrictions are enforceable against both the hirer and the individual hiring the video recording. Applicants unsatisfied with the authority's classification may apply to a board of review.
Indecent publications—The Indecent Publications Tribunal operates under the Indecent Publications Act 1963. It determines whether or not any book or sound recording submitted to it is indecent and decides on its classification. Publications can be referred to the tribunal by either the Comptroller of Customs or any person who has the leave of the Minister of Justice or the Chairman of the Tribunal. The tribunal consists of a chairman and four members, the chairman must have practised as a barrister or solicitor, and at least two of the members be qualified in the field of literature or education.
When classifying or determining the character of any book or sound recording the tribunal considers the effect of the publication as a whole, including its literary or artistic merit or the significance of its subject. Also considered is its likely audience, its price, and whether anyone is likely to be corrupted by it or others are likely to benefit from it. Another consideration is whether a work has an overall honest purpose or thread of thought. In 1987 the Indecent Publications Tribunal considered over 400 publications.
There are more than 200 public museums and art galleries in New Zealand. Many are relatively small collections oriented towards the history or fabric of a particular region or location. The larger museums, of which there are several, carry out research, print catalogues and research papers and maintain education programmes for visitors and others.
Most museums and art galleries are funded by local government, although the New Zealand Lottery Board provides subsidies for capital works schemes and provides salaries for liaison officers attached to the four metropolitan museums. It also helps support the Art Galleries and Museums Association of New Zealand, which promotes the development of the country's collections and its professional staff.
Nationally, the collections on view vary from place to place. In Auckland the large museum has a fine, recently refurbished Maori Hall and the Ngati Maru house ‘Hotonui’. The Auckland City Art Gallery holds a collection of Lindauer paintings, Frances Hodgkins’ paintings and collects contemporary New Zealand Art. The Museum of Transport and Technology collects and displays all aspects of technology in New Zealand, while a short distance away the North Otamatea Kauri and Pioneer Museum displays artifacts from the kauri-gum fields now gone.
The Waikato Museum of Art and History (Te Whare Taonga O Waikato) holds the treasures of the Tainui tribe and a collection of paintings by painter Margot Phillips. The Rotorua Museum and Art Gallery has a good contemporary New Zealand art collection (including much contemporary Maori art), while celebrating the days when it was a spa; the Govett-Brewster Art Gallery holds the collection of kinetic artist Len Lye and shows it each summer, while in Hawke's Bay the Museum and Arts Centre holds the treasures of the Ngati Kahungunu people. In Wanganui the Sargent Art Gallery has a collection of paintings by local artist Edith Collier. The Bishop Suter Art Gallery, in Nelson, has an extensive collection of contemporary art and works by well known 1930s artists.
Canterbury Museum holds a quantity of material from Antarctica and the South Island Maori (Kai Tahu). At Akaroa the Langlois-Eteveneaux House and Museum celebrates the French history of that area. In Dunedin the Otago Early Settlers Museum, Edwardian in style, depicts the lives of the early settlers, and the Dunedin Public Art Gallery has a large collection of eighteenth and nineteenth century water-colours, as well as a collection of paintings by Frances Hodgkins. In the south, the Southland Museum and Art Gallery reflects the area's local history.
The National Art Gallery, first opened in 1936, is a museum of fine arts which holds collections and shows exhibitions covering national and international culture. It is administered by the Board of Trustees of the National Art Gallery, the National Museum and the National War Memorial. The gallery is an educational institution devoted to preserving significant art works and, through these items, interpreting to the public the artistic development of New Zealand and the achievement of New Zealand's artists. Through its international holdings and the staging of exhibitions of works from a wide international spectrum, it allows the public to view world cultural history and developments. Beyond this traditional role, the National Art Gallery also serves as a cultural facility for the community and is a venue for performances, meetings, recitals, concerts, receptions, lectures, films and other related activities.
The National Museum was established in 1865, and its functions are to acquire, preserve and display collections of material related to New Zealand and the Pacific. The collections specialise in Maori and Pacific culture, colonial history, entomology, plants, birds, and marine animals. There is also a large specialist research library, and a photographic archive containing over 84 000 glass plate and other negatives. Research staff provide a servicing function for other government departments and the public in ethnological, biological and historical research (including antiquities). The museum publishes research results in National Museum Records, the National Museum Bulletin, and the National Museum Miscellaneous Series, as well as through other government publications. General booklets and brochures are also produced in connection with educational and display functions.
In 1987 the Cultural Conservation Advisory Council superseded the Interim Advisory Committee for the Conservation of Cultural Property. It advises the Minister of Arts and Culture on all cultural property conservation matters covering the specific areas of: paintings and works of art, ethnography, books and documents, films, photographs, machinery and textiles. The advisory council maintains a programme to support the training of conservators and the expansion of conservation services to public institutions and the community in general.
The New Zealand Historic Places Trust is empowered by statute to identify, protect, preserve and foster public interest in historic places. Historic places include old European and Maori buildings and monuments, historic sites, Maori traditional sites, and archaeological sites. The trust is governed by a board of trustees which includes representatives of various interested organisations and has the power to issue protection notices to prevent the demolition of, or damage to buildings classified ‘A’ or ‘B’ for their historical significance or architectural qualities. Professional staff work in the trust headquarters in Wellington and regional officers are employed in Auckland and Dunedin. The trust has curators at a number of its properties.
More than 21 000 members provide financial and practical support, and regional committees operate locally to advance the trust's aims. About 5000 nineteenth and early-twentieth century buildings have been classified by the trust, which has responsibility for a number of historic buildings and sites, some of which are open to the public. In addition, the trust administers properties owned by other organisations and a number of historic reserves. Technical advice and financial assistance may be given to private owners to assist in the preservation of both Maori and European historic buildings and sites. The trust also maintains a register of archaeological sites, and has the authority to investigate sites and prohibit unauthorised fossicking.
To stimulate public interest, the Historic Places Trust has marked many historic places with plaques and noticeboards. It also publishes leaflets, a quarterly magazine on historic places in New Zealand, and books, including two major works on historic buildings of the North and South Islands, and one on the archaeology of the Maori.
There are a number of legal provisions to protect items and sites of historical significance. The Antiquities Act 1975 includes provisions controlling the sale of Maori artifacts in New Zealand. Artifacts found after 1976 are deemed to be Crown property. There are export controls on a range of items of historical significance; Maori artifacts; chattels relating to the European discovery, settlement or development of New Zealand; written and printed matter; works of art, reproductions, prints, films and sound recordings; specimens of animals, plants and minerals; meteorites; remains of extinct fauna; and items of shipwreck.
The Historic Places Act 1980 deals with the protection of archaeological sites. It is necessary to obtain the consent of the New Zealand Historic Places Trust before damaging, destroying, or modifying any archaeological site, or undertaking a scientific archaeological investigation of any site.
The National Archives selects, preserves, and makes available state records of permanent value, drawn from various areas of government. These include Parliament, ministers of the Crown, government departments, the armed services, the courts, commissions of inquiry, and other agencies. Archives preserve evidence of the functions, policies, transactions and decisions of government which have affected New Zealanders. They provide information on events, great and small, which have influenced the course of New Zealand's development. To ensure their preservation, National Archives has statutory control over the disposal and destruction of public records. National Archives also advises and assists local authorities in preserving their archives, and provides records centres and records management consultancy on a cost recovery basis.
National Archives has its headquarters in Wellington and regional offices in Auckland and Christchurch. It holds an estimated 23 000 linear metres of written and typed documents, and in addition some 500 000 maps and plans, as well as a large number of photographs and pictures. The holdings constitute the largest source of unpublished information on a whole range of public and private activity in New Zealand—political, social, economic, scientific, military, technological and administrative. Important and interesting records from the nineteenth century include those of the New Zealand Company, the provincial governments, the colonial secretaries and the Governor. Records from this century include material from the numerous wartime agencies, records from the war zones and key policy and operational records of departments of state. There are also records from government reviews and planning (like the National Expenditure Commission, 1932, the National Development Conference, 1969–74) and of royal commissions and commissions of inquiry. Papers of famous politicians such as Richard John Seddon, Sir Walter Nash and Norman Kirk are held as well as those from a number of former cabinet ministers.
National Archives arranges and describes the archives and provides reading and reference services used by historians, geographers, economists, sociologists, scientists, students, lawyers, genealogists and public servants.
In 1982 the Dictionary of New Zealand Biography was adopted by the Government as an official project to commemorate the 150th anniversary of the Treaty of Waitangi in 1990. The dictionary's editor is Professor W. H. (Bill) Oliver, formerly head of Massey University's History Department, who commenced work in August 1983. His first staff commenced work in March 1984.
There are 20 staff in Wellington and 22 regional and specialist working parties, which research, compile basic information and propose dictionary entries. A network of consultants assists with Maori nominations and special interest areas.
The dictionary will be a compilation of scholarly essays about significant people from the past; not only national figures but those whose importance was regional, ethnic or social in character. The essays will give basic information and an assessment of an individual's place in New Zealand's history. Some 450–500 writers will contribute essays ranging in length from 500 to 4000 words.
The first two volumes will be published to coincide with commemorations in April 1990 and will cover the period from 1769 to 1869. Essays on Maori individuals will be published in both Maori and English.
The planned sequence of volumes will be:
| Volume | Year of publication | |
|---|---|---|
| I | Pre-1769 | - |
| II | 1769–1869 (English) | 1990 |
| III | 1769–1869 (Maori) | 1990 |
| IV | 1870—early 20th Century (English) | 1992 |
| V | 1870—early 20th Century (Maori) | 1992 |
| VI | Early to late 20th Century A-L (English) | 1994 |
| VII | Early to late 20th Century M-Z (English) | 1996 |
| VIII | Early to late 20th Century A-Z (Maori) | 1996 |
The biographical data on thousands of individuals, accumulated over the life of the dictionary and stored in a data base, will be an invaluable aid to researchers and scholars in the future.
New Zealanders’ use of books compares favourably with other English-speaking nations. There is a vigorous book publishing industry that caters not only for the local market but, particularly in the case of educational books, for an increasing number of overseas purchasers.
From the time of European settlement in New Zealand, literature, libraries and the accompanying concept of free access to information by individuals have been strong traditions. The importance of books to earlier settlers is manifest in the number of fine collections of historical New Zealand material.
New Zealanders enjoy reading. This can be seen in the distribution of libraries throughout the country, from very small school and community libraries to large library systems, and in the ability of a small population to maintain an active publishing industry.
The book market in New Zealand consists both of books produced by New Zealand publishers and books imported for sale in New Zealand. Most of the book publishing industry is made up of businesses which import as well as publish, although some are exclusively involved in one or other activity.
No thorough studies have been conducted of the book industry. However, industry sources estimate that the total value of books sold in New Zealand in the 1987 calendar year was about $350 million. This includes books sold through the book trade, those imported directly by institutions (libraries, etc.), and private imports. It is estimated that 34 percent of all books sold in New Zealand were published locally.
Each year books are published in New Zealand by more than 300 different publishers. An analysis of these publishers reveals that nearly two-thirds are informal publishers, i.e., local authorities, historic societies, private publications, government departments, etc. In fact there are only about 100 specialist importers or publishers of books. It is believed that they put out about three quarters of all new titles produced and account for in excess of 90 percent of sales.
The number of New Zealand titles published by commercial publishers increased by 123 percent between 1980 and 1986. Because of the inauguration of some major junior level educational programmes, the growth of educational titles was even greater, with a 150 percent increase. However, economic pressure on the industry meant that titles were kept in print for a shorter time (very low sellers were remaindered and doubtful titles were not reprinted), and so the number of titles in print declined by 28 percent between 1983 and 1986. Total sales in New Zealand increased by 106 percent in dollar terms between 1980 and 1986 but export sales increased 358 percent over the same period.
Because of increasing local printing costs and a desire to hold book prices down, there has been a strong movement towards printing New Zealand books overseas. By 1986 local printing for publishers had declined by 41 percent in volume terms over 1980 and overseas printing had increased by 364 percent. The average print run for an educational book increased by 12 percent to 4497 over the six years to 1986 but the average print run for a general book declined by 23 percent to 4804 over the same period.
Figures for children's book sales have only been kept for three years, but these show sales declined by 36 percent between 1984 and 1986. Only 18 publishers or distributors of children's books have been regularly surveyed. Their average annual sales of children's books was $291,000 in 1986. In total this represents 5.9 percent of book sales by value, with New Zealand children's books making up 19.2 percent of these.
Educational books are published or distributed by 28 publishers and represented 16.8 percent of all book sales by value in 1986. The same year New Zealand books made up 33 percent of all educational book sales within the country. However, export sales of locally published educational books are 35 percent greater than domestic sales and represent 72 percent of all export sales. Books for export make up 22.7 percent of all New Zealand publishing.
The book industry is largely concentrated in the northern area of New Zealand, specifically on the North Shore of Auckland. A survey of 61 major companies showed 48.9 percent of the total sales came from the 20 of those companies and 34.6 percent from 16 other companies in Auckland—this means 83.5 percent of the total output came from Auckland. The 13 companies in the sample are based in Wellington and account for a further 12.1 percent. The remaining 10 companies scattered throughout the country make up the remaining 4.4 percent.
A survey for the year ended March 1986 gave the profile of an average New Zealand publisher/book distributor shown in table 11.2.
Table 11.2. PROFILE OF AN AVERAGE NEW ZEALAND PUBLISHER/BOOK DISTRIBUTOR, YEAR ENDING MARCH 1986
| Item | |
|---|---|
| Source: Book Publishers Association of New Zealand. | |
| Number of titles produced during year | 33 |
| Including number of reprints | 14 |
| Titles in print | 65 |
| Export sales (based on exporters only) | $221,000 |
| Total sales | $1,640,000 |
| Average retail price of books, sold | $9.00 |
| Average sales of best-selling paperback | 18,600 |
| Average sales of best-selling hardback | 11,900 |
| Royalties paid to New Zealand authors | $81,371 |
| Staff | 15.6 |
| Sales by type of outlet: | percent |
| Booksellers | 66.2 |
| Other retailers | 18.2 |
| Direct to consumers (incl. libraries) | 13.7 |
| All other | 1.9 |
| Total | 100.0 |
During 1988 the industry was in a position of zero or negative growth. However, because of changing management practices, a reduction in enterprises by merger and liquidation, and a reduction in number of titles produced, the industry has remained profitable for most publishers. Booksellers, too, have managed to function effectively, although there has been an overall reduction in the number of bookshops in New Zealand in recent years.
The library needs of the majority of the population are met through public libraries provided by local authorities. In most centres the local authority maintains at least one public library. In the larger centres there is usually one central library and a number of suburban branches.
As at 31 March 1987, there were 260 public libraries in New Zealand, 75 of which were suburban branches. There were also over 400 specialist libraries in government departments, businesses and other organisations. In the education sector there is provision for a library or library room in every school, as well as those in the universities and other tertiary institutions.
In the year ended 31 March 1987 local authority libraries held a book stock of almost 7 million volumes and made over 25 million issues.
A comprehensive system of co-operation between libraries is overseen by a joint committee on interloan which is made up of representatives from the New Zealand Library Association and the National Library.
Since 1980 librarianship has been taught at two schools; Victoria University of Wellington and Wellington College of Education. In 1986 a teacher-librarian course was established at Wellington College of Education.
The National Library of New Zealand was set up by an Act of Parliament in 1965 to collect, preserve and make available recorded knowledge, particularly that relating to New Zealand; to supplement and further the work of other libraries in New Zealand; to enrich the cultural and economic life of New Zealand and to enrich its cultural interchanges with other nations.
The National Library's Maori name, Te Puna Matauranga o Aotearoa—the well or spring of knowledge—symbolises the library's functions of collecting and disseminating knowledge.
The National Library provides a service and a resource for the whole of New Zealand. It maintains vast collections of New Zealand printed material and sound recordings, as well as collections of material from throughout the world which are likely to be of interest to New Zealanders. These collections can be used directly by members of the public who visit the library, or they can be made available to other libraries for loan.
In addition, the library provides a range of advisory and support services with the aim of ensuring that every New Zealander has access to library materials.
While most of the library's 460 staff work in Wellington, it has also three regional centres; Auckland, Palmerston North, and Christchurch, and 13 district centres.
For administrative purposes the library is divided into six divisions: Alexander Turnbull Library (developing research and special collections); collection management (acquisition, cataloguing and conservation); New Zealand Bibliographic Network (computer services); reference and interloan services (managing information service and inter-library lending); regional services (outreach and consultancy); and corporate services (management support, administration, and building management).
In July 1987 the National Library occupied its first permanent home, after spending the first 21 years of its existence in scattered locations around Wellington. From its new building in Molesworth Street, Wellington, the library provides services directly to the public, and co-ordinates its services to libraries, schools, rural areas, and businesses throughout the country.
Members of the public are welcome to visit the National Library during its hours of opening. The National Library Gallery, together with a smaller gallery, the Turnbull Room, are of particular interest. Here items from the library's collections are exhibited, and exhibitions of materials from other institutions are hosted. There is also an auditorium, where concerts and lectures are held. Regular guided tours of the library are given.
The following services are available from the library in Wellington:
Information service—A free information service provides access to information in New Zealand and overseas books, serials, music, and a selection of overseas data bases. Inquiries may be made in person, by telephone, mail, telex or telefacsimile. The service offers:
Assistance with inquiries in a wide range of subjects, particularly social sciences and the humanities, from quick reference to in-depth research;
Subject specialists in: the literature of sociology and social services, commerce and statistics, children's literature, New Zealand studies, and music;
Access to any book, journal or sound recording in the general collections of the National Library. (Most items are stored in closed access areas and must be consulted in the library.); and
Streamlined access to a representative selection of New Zealand publications including up-to-date official publications.
The collections which can be accessed through the information service include 500 000 books, mainly in the social sciences and humanities; 6000 current journal titles and monographs-in-series in all subject areas including medicine, technology and pure science; 2 000 000 microfiche and microfilm; 4500 music scores; a small but rapidly expanding collection of sound recordings, mainly on compact disc; 90 000 children's books; all daily New Zealand newspapers and a selection of overseas newspapers.
Alexander Turnbull Library—This ‘library within a library’ is a national research collection specialising in documentary materials relating to New Zealand and the Pacific, John Milton and his times, English literature, early printed books, voyages of discovery and exploration, and the arts and crafts of the book. It is based on the collections of Alexander Horsburgh Turnbull, a wealthy Wellington merchant who died in 1918 and bequeathed to the nation some 55 000 volumes as well as manuscripts, paintings and sketches, which he had collected during his lifetime. The policy since 1918 has been to build on the strengths of the original collection.
The collections now include approximately 220 000 books; 7000 serial titles; 35 000 microforms; 22 500 maps; 600 000 photographic prints, negatives, albums and slides; 40 000 paintings, drawings and prints; 11 000 posters; 5000 discs, tapes and cassettes; 11 000 newspaper volumes; and 2911 shelf metres of manuscripts and private archives. These collections form an important part of the national heritage, and all possible measures are taken to ensure that they are preserved for the benefit of future generations. For this reason members of the public are encouraged whenever possible to use library materials held elsewhere before drawing on the Turnbull collections.
However, this caution aside, the collections are available for use by any member of the public who needs to consult a comprehensive collection that includes the whole range of printed and non-printed evidence on a subject, or to consult printed materials, documents or indexes not available elsewhere.
Dorothy Neal White Collection—This is a research collection of children's books published up to 1940. In it can be found examples of children's books with emphasis on material which would have been read by children living in New Zealand from the period of colonisation, and up to 1940. The collection is kept on open shelving in a special room and those with a special interest in children's books are welcome to browse through it.
The National Library also maintains the following outreach and consulting services which are available to the public throughout New Zealand:
Services to rural areas—The National Library augments rural library services by supplementing the resources of public libraries and developing library services where no other such provision is made. These activities are co-ordinated by the library's regional services division operating from Auckland, Hamilton, Palmerston North, Wellington and Christchurch. Public libraries outside the major metropolitan areas and operating a free service are eligible.
The National Library also helps local authorities to assess and plan their library services.
Early in 1987 a ministerial review of National Library's service to rural areas was completed. The review found that the services offered by the old Country Library Service which had been in operation since 1932, were no longer appropriate. Amongst the changes recommended was the phasing out of a ‘bookvan’ service and the development of other services more suited to the needs of rural people. These included: enhanced National Library assistance to borough libraries; the development of school and community libraries; a ‘books by mail’ programme for adults in remote areas and housebound adults who do not have access to outreach library services provided by local authorities; provision of books to rural kohanga reo; and a mobile library service to rural marae.
During 1987 pilot projects were conducted with kohanga reo in Northland, and a books by mail service in the lower half of the South Island. These projects were being assessed during 1988.
Services to schools—The School Library Service provides support services to New Zealand's more than 2500 schools. These services include:
Reference services providing access to extensive collections of material to stimulate and develop reading;
Access to information to support the primary and secondary curricula;
Advisory services to support library developments and management; and
Training courses for teacher-librarians, librarians, teachers and library assistants.
The service is operated from 14 district centres of the National Library. It is available to teachers, pupils and librarians whose training needs cannot be satisfied by the school library collection, or who need assistance with the development of library services.
Services to businesses—The library manages a nationwide information service for business and industry known as SATIS (Scientific and Technical Information Service). SATIS centres are located in the Auckland, Hamilton, and Christchurch public libraries, and in the National Library Building. SATIS charges its clients a membership fee in return for the services of specialist staff who provide up-to-date information tailored specifically to the client's needs. During the year ended March 1987 the service had 213 members.
Interlibrary loan—The National Library's interloan unit is a clearing-house for requests received from New Zealand and overseas libraries. The interloan system enables librarians anywhere in the country to locate and request for a client, a book or copy of an article from a journal that is held in another library. The unit processes approximately 100 000 requests each year.
Data bases—The library maintains two data bases. These are the New Zealand Bibliographic Network, which was set up in 1982, and Kiwinet, a development launched in February 1988.
The New Zealand Bibliographic Network (NZBN) is a comprehensive on-line library cataloguing and information retrieval system. The system locks in with all major New Zealand libraries, and with such institutions as the United States Library of Congress and the national libraries of Britain, Canada, Australia and Singapore. New records are added daily by New Zealand libraries, and are supplemented weekly by contributions from the western world's largest libraries. By the end of 1987 the equivalent of 3 500 000 catalogue cards were held in the system, with new records being added at the rate of 500 000 a year. One hundred and sixty New Zealand libraries, including public, university, government department and private company libraries participate in the network.
Kiwinet is the collective name for a series of on-line data bases, modelled on overseas services such as Australia's Ausinet or the United States Dialog. Eventually it will contain information on all aspects of New Zealand including business, commerce, the social sciences, arts, the humanities and the law. Currently three data bases are available: Kiwinet Find, an interlibrary loan tool that lists holdings of serials in New Zealand libraries; Index New Zealand, an index of journal articles, theses, reports, monographs, and conference papers published in or about New Zealand and the South Pacific (this data base has recently incorporated the printed index to New Zealand periodicals and the Social Science Research Index); and Newzindex, the activities of New Zealand industries and companies reported in the business press.
Known until 1987 as the General Assembly Library, this library provides library, information, research and reference services for Parliament as required by the Parliamentary Service Commission. The library's collections, which number over 500 000 volumes, are strongest in subjects relevant to members of Parliament for their legislative duties. These include economics, politics, public administration, law, social sciences and biography. The library has one of the largest collections in the country of books, pamphlets, periodicals and newspapers relating to New Zealand and several New Zealand daily newspapers are indexed.
The National Documents Collection comprises parliamentary papers and publications of overseas governments, mainly English-speaking, and of international organisations such as the United Nations, the OECD, and the European Community. It is available for public use.
Founded in 1907, the Hocken Library is a major collection of Pacific and New Zealand material. One of the collections in the University of Otago library system, the Hocken has a book stock of about 150 000, with a substantial collection of audiovisual material, especially paintings (including modern art). It places particular emphasis on collecting material from the South Island and contains many government, local government and business records.
New Zealand has two nationwide television networks and extensive commercial and non-commercial radio networks operated by a public statutory corporation, the Broadcasting Corporation of New Zealand (BCNZ). There is also radio coverage in more populated areas by privately-owned stations.
Radio and television are regulated under the Broadcasting Act of 1976 (with subsequent amendments), which is intended to keep broadcasting free of direct political control. The Minister of Broadcasting may give directives to the corporation and the Broadcasting Tribunal concerning the policy of the Government in respect of broadcasting. Privately-owned stations are generally members of the Independent Broadcasters’ Association (IBA).
In 1985, the Government established a royal commission to inquire into the institutions, operations, financing and control of New Zealand broadcasting and related telecommunications and to recommend any changes thought necessary to improve the ability of broadcasting to serve all New Zealanders. This commission reported to the Government at the end of 1986.
On 26 April 1988 the Minister of Broadcasting, the Hon. R. W. Prebble, announced major changes in broadcasting policy. Those changes are intended to introduce greater competition, efficiency and flexibility into broadcasting markets by allowing more open entry to the industry by new broadcasting and narrowcasting (e.g., cable television) services.
The Government has, however, maintained a commitment to the provision of high quality public broadcasting services, meeting defined social objectives. It is intended that these objectives will be met by the establishment of a new independent statutory ‘Broadcasting Commission’. The responsibilities of the commission will include securing the provision of specific levels of New Zealand content, Maori programming, minority interest programming, community information programmes and nationwide access to television and radio. The public funds administered by the commission will be available, on a competitive basis, to all broadcasters intending to provide appropriate public services.
The Broadcasting Corporation of New Zealand (BCNZ or Broadcasting) is a public corporation, responsible to Parliament through the Minister of Broadcasting. It operates a radio and television service, publishes the weekly magazine, New Zealand Listener and administers the New Zealand Symphony Orchestra. The board of the corporation consists of not fewer than seven and not more than nine members appointed by the Governor-General on the recommendation of the minister.
The corporation's function is to provide broadcasting services and to work towards developing, extending and improving the services for the public good. The minister may issue written directives on policy matters and any such directive must be gazetted and laid before Parliament. Specific programming, the gathering and presentation of news and current affairs, the editorial content of the New Zealand Listener and personnel matters are the responsibility of the BCNZ.
The corporation is also charged with providing a range of programmes catering in a balanced way for the varied interests of the community, while maintaining a New Zealand identity in its programmes, and respecting the privacy of the individual. It also works to avoid overlapping of programmes and programme types on its two television channels, and to promote and encourage artistic, cultural, and education development in the community.
The future structure of the Broadcasting Corporation of New Zealand has still to be finally decided, following the major changes in broadcasting policy announced by the Government in April 1988. The corporation is, however, to be given a commercial orientation similar to that of other state-owned enterprises. At the same time, the Government has indicated that it remains committed to public ownership of two television networks and at least two radio networks.
The BCNZ has two principal sources of revenue—the Public Broadcasting Fee (payable by people who own a television set), and radio and television advertising. Since 1975, the contribution of licence or Public Broadcasting Fees to total revenue has diminished, and at the end of the 1987 financial year it accounted for less than 17 percent of the total. From April 1987 the corporation has taken direct responsibility for the collection of the Public Broadcasting Fee, although the move away from New Zealand Post's (formerly the Post Office's) services as collecting agent has been gradual. The Public Broadcasting Fee is used to fund all non-commercial corporation activities, including the National Programme and Concert Programme radio networks, all Sunday broadcasting (when advertising is not shown), the net cost of maintaining the New Zealand Symphony Orchestra, and the extension of coverage to non-income-earning areas of small population. The corporation's New Zealand television programme production is also partially funded by the fee. Since September 1986, the annual fee (excluding GST) has been set at $65 for colour television receivers and $35 for black-and-white receivers. One licence fee covers all televisions in a household. There is no separate radio licence fee. The 1986 increase was the first since 1975. At the end of March 1987 a total of 914 689 licences were current, of which 856 471 were for colour receivers.
Table 11.3. BCNZ GROSS REVENUE FROM PUBLIC BROADCASTING FEES AND ADVERTISING
| Item | Year ended March | ||||
|---|---|---|---|---|---|
| 1983 | 1984 | 1985 | 1986 | 1987 | |
| $(000) | |||||
| Public broadcasting fees | 38,572 | 40,022 | 40,672 | 40,284 | 47,796 |
| Radio advertising | 40,462 | 42,485 | 46,857 | 53,694 | 59,951 |
| Television advertising | 114,617 | 120,792 | 148,288 | 184,341 | 224,158 |
| Total | 193,651 | 203,299 | 235,817 | 278,319 | 331,905 |
The Independent Broadcasting Association, based in Auckland, represents the public and private companies which run the independent radio stations. While the independent radio stations are regionally-based, there is national coverage of news and sports items through networking.
Television New Zealand, a service of the Broadcasting Corporation, transmits two national television networks in colour, using the PAL 625-line system. Television One is carried by seven high-powered and 442 medium- to low-powered transmitters and translators. Network Two is carried by seven high-powered and 287 medium- to low-powered transmitters and translators. Twenty-two of the transmitting stations are connected by the BCNZ microwave distribution system which, with intermediate stations, comprises a total of 46. Television One currently reaches 99.93 percent of the population, and Network Two 99.65 percent.
Programming—BCNZ programme objectives are to provide the complementary programming allowed by a unified two-channel system, provide scope for regional television, cater to minority and cultural interests, and, in general, realise the social, cultural and educational potential of television, as well as its entertainment potential. Television New Zealand accordingly presents two programme schedules, obtaining a consistent 50/50 audience split over the two networks. Production studios are sited in each of the four main centres, as are outside broadcast units which are deployed for live coverage of sport and programme production from towns and cities in both islands. Comprehensive film and tape facilities are installed in these centres, and electronic news gathering equipment is available.
New Zealand productions accounted for 3041.5 hours of programme transmission in the year ended March 1987 which was 28.65 percent of the total transmission over both channels. This content included drama, news and current affairs, light entertainment, religion, service programmes, documentaries, children's programmes and sport. The balance of programme output is purchased from overseas, mainly from Britain, the USA, and Australia. The use of satellite links permits same-day presentation of world news items and live telecasts of significant overseas events.
Teletext—Teletext is a free service provided by Television New Zealand. A range of general and special-interest news and information is transmitted encoded on a segment of the normal transmission not carrying a picture signal and is available to viewers with a set equipped with a built-in or add-on Teletext decoder. The service also provides programme sub-titles for viewers with impaired hearing. Teletext service began in February 1984 and some 70 000 or 7 percent of receivers operated in New Zealand made use of it in March 1988.
Radio New Zealand, a service of the BCNZ, provides programmes for 66 medium-wave broadcasting stations, 10 VHF FM stations (includes two repeaters in Wellington) and two shortwave transmitters, broadcasting on a number of assigned frequencies. In addition, Radio New Zealand assists with a number of stations which operate for only part of the year. Of the medium-wave stations, 40 broadcast advertising.
At 31 December 1987 there were 22 warrants for privately-owned radio stations, as well as several student-stations based on campuses. The student stations and eight other stations broadcast in FM, the remaining 14 broadcast in AM. A number of radio stations use relay stations to broadcast in several areas on one warrant.
Radio New Zealand has a policy of assisting, where resources permit, other broadcasters and communities to develop new radio services. One way in which this can be done is to take a shareholding in a private undertaking, and the first station to operate under such an arrangement was Radio Horowhenua, which began broadcasting in 1987.
National Radio—This is a nationwide network operated by Radio New Zealand. Originating normally from Wellington, it is transmitted 24 hours a day through 24 medium-wave transmitters. The network places a strong emphasis on in-depth coverage of news, current affairs and information.
The Concert Programme—This programme is operated by Radio New Zealand and is transmitted 19 hours a day through six FM (including one Wellington repeater) and four AM transmitters. The programmes broadcast include music, drama and discussions. During summer months, the AM transmitters are used for broadcasts of sporting events.
Commercial stations—Radio New Zealand has community (commercial) stations in 28 cities and towns, providing a range of information and entertainment programmes, and broadcasting 24 hours a day from AM and FM transmitters. In five centres, RNZ operates stations broadcasting contemporary music. Extra services are provided in some centres at holiday times, and Radio New Zealand also assists students at some high schools to run radio stations. Many stations link in a commercial network for national/international news, overnight and evening programming and special broadcasts.
Of the 22 private commercial stations, five are located in Auckland. Private stations broadcast a mixture of music, information and sport programmes.
Broadcasts from Parliament—When Parliament is in session, the Wellington-based AM transmitter, 2YA, broadcasts proceedings ‘live’ for the whole sitting time. In addition, 1YC in Auckland and 4YC in Dunedin broadcast Parliamentary proceedings from 2.30 p.m. to 5.30 p.m.
Access Radio—is provided in Wellington on the 2YB AM transmitter, and on local community stations. Access Radio allows non-professionals to make programmes in their sphere of interest with the assistance of RNZ staff.
Private non-commercial stations—There are two warrants for private non-commercial AM stations. Radio Rhema broadcasts from Christchurch, with relays at Wellington and Nelson, for 18 hours a day. In Dunedin, station 4XD broadcasts for 16 hours on Saturdays and Sundays and in the evenings on other days.
Shortwave Service—The External Services division of Radio New Zealand broadcasts the National Programme (including news and magazine programmes in Maori, Tongan, Samoan, Niuean and Cook Island Maori) to the South Pacific. One frequency beams to Australia and Melanesian countries, and another beams to South Pacific Islands. Radio New Zealand's Overseas Programme Unit supplements this with weekly dispatches of taped programmes (news, current affairs, talks and comment, including vernacular programmes).
Developments in radio—A Maori radio system is under development by Radio New Zealand, and other future developments include an expansion of Access Radio, with stations based in tertiary institutions; training partnerships; new small-community stations; and further commercial FM stations.
The Broadcasting Tribunal has three members, appointed by the Governor-General on the recommendation of the Minister of Broadcasting., It issues warrants to all broadcasters, who may not operate without them; these normally specify conditions about ownership, hours of transmission, advertising, location, transmission power and other technical matters. The tribunal is empowered to consider applications and grant warrants for additional radio stations, publicly- or privately-owned, and to renew, after reviewing performance if necessary, existing warrants. It has no authority over short-wave stations, nor may it grant a warrant for any television station additional to TV1 and Network 2 of the Television New Zealand service of the BCNZ without the express permission of the Minister of Broadcasting.
In 1984 the Government directed the tribunal to call for and consider applications for a television warrant for the development of a regionally-based private television network covering all New Zealand in competition with the Broadcasting Corporation of New Zealand. The hearing was completed in 1987, and a decision subsequently issued in favour of a private organisation, Televid-3 (TV3), which aims to begin transmission in 1989. The tribunal must have regard to government policy in respect of broadcasting, and must comply with written directions from the minister (no direction may be given which would derogate from the duty of the tribunal to act judicially). Any such direction must be subsequently gazetted and laid before Parliament.
The policy changes announced by the Government on 26 April 1988 will result in the eventual abolition of the Broadcasting Tribunal and removal of the present broadcasting warrant requirements.
Organisations broadcasting to the public are required by law to maintain standards of accuracy, impartiality, decency and good taste. To this effect, rules governing programmes and advertising are drawn up by industry representatives. The Broadcasting Corporation and the Independent Broadcasting Association are required to adopt the rules before they become effective.
Formal complaints from the public alleging breaches of the prescribed standards may be made as set out in the Broadcasting Act, and laid with either the Broadcasting Corporation or a private radio station. Complaints of unfair or unjust treatment or invasion of privacy in broadcast programmes are made to the Broadcasting Complaints Committee, established in 1982. All complaints must receive proper consideration, and complainants dissatisfied with the decisions of these bodies may refer for final determination to the Broadcasting Tribunal.
The allocation of radio frequencies for television and radio broadcasting is controlled by the New Zealand Radio Frequency Service of the Department of Trade and Industry. The Radio Frequency Service was transferred to the Department of Trade and Industry following the corporatisation of the New Zealand Post Office in April 1987.
The Government announced in April 1988 its intention to review the management and allocation of the radio frequency spectrum to take into account the intended liberalisation of the telecommunications and broadcasting markets. The review was expected to be completed by the end of 1988.
Taking into account the size of its population, New Zealand has a high number of daily newspapers. In the past there were more than 50 daily newspapers published in New Zealand but in recent years this number has dropped to 33. Of these, nine are morning newspapers and 24 are published in the evening. The paper with the largest circulation is the New Zealand Herald, published in Auckland and with an audited circulation of 243 000. Only one other newspaper, the Auckland Star, has a circulation of more than 100 000. The daily paper with the smallest circulation is the Hokitika Guardian with a circulation of 1200. Until 1987, the Wellington-based newspaper The Dominion was the only daily founded this century and still being published. But, in March 1987, the National Business Review stepped up from weekly to bi-weekly publication and, in May 1987, to daily publication five-days-a-week. On 8 August 1987 a new daily newspaper was launched when the Auckland Sun began publication. The newspaper lasted less than a year and was published for the last time on 13 July 1988.
A feature of the newspaper publishing industry since the end of the Second World War has been a series of mergers and take-overs which has led to concentration of the ownership of a number of papers in three major companies which have stock exchange listing. This contrasts with the pattern of ownership by members of a single family, or by a partnership, which was previously predominant. New Zealand News Limited publishes five dailies, Independent News Limited nine, and Wilson and Horton Limited four. Thus 18 of the country's 33 dailies are now published by three major groups. In circulation terms, the ‘big three’ represented about 80 percent of the aggregate daily newspaper circulation in New Zealand of 1 055 000 in 1987. Some independent publishers survive, including one stock exchange listed company and the few remaining family businesses.
Another feature of newspaper publishing in recent decades has been the steady growth of suburban newspapers, most of them delivered free to all households in their recognised circulation areas. The majority are weeklies; a few are bi-weekly or tri-weekly. Some are owned by the three big groups or by other daily newspaper publishers. Others are owned by individuals or small companies. The New Zealand Community Newspapers Association, to which most of these suburban ‘give-aways’ belong, has more than 70 members.
In 1987 (before the demise of the Auckland Sun) there were nine daily newspapers in the four main metropolitan areas, with a total circulation of approximately 780 000. In the smaller cities and provincial towns there were 25 daily newspapers, including one published five days a week. New Zealand also has about 140 other newspapers, of which most publish one to three times a week.
There were 540 magazines, journals, and newsletters that accept advertising. Of these, 83 specialised in agriculture, dairy products, farming, horticulture, fishing and forestry; 51 specialised in banking, finance, economics, commerce, data processing, local government, law, office equipment, and insurance; 50 specialised in architecture, building, construction, engineering, environment, real estate and transport; 33 specialised in medicine, dentistry, and health; 21 specialised in industry, manufacturing, refrigeration, printing, publishing, packaging, fuel and energy; and 33 were consumer oriented or of general interest.
The advertising industry in New Zealand, as in other western countries, is well developed. Advertising in the media is used by individuals, companies, government and many other organisations to sell goods and services and to inform the public.
Approximately 1500 people are employed in advertising agencies, and 3000 in advertising-related services. Advertising revenue also contributes to the employment of another 12 000 people in the publishing, radio and television industries.
There have been advertising agencies operating in New Zealand for nearly 100 years. At the end of March 1987 there were approximately 85 agencies, most of which (63) were New Zealand-owned and the remainder (22) affiliated to multinationals by total or partial ownership (these tend to be the larger agencies). The number of agencies with overseas interests has grown from 12 in 1983.
Total advertising expenditure (media and non-media) in New Zealand for the year ended March 1987 was $1,101 million. Of this, $771 million was spent on media advertising—television, radio, newspapers, magazines, direct mail, cinema and outdoor. The remaining $330 million came from non-media advertising, such as promotions, and expenditure on advertising production. Nearly 50 percent of expenditure on media advertising ($382 million) was made through advertising agencies, with agencies placing 96 percent of advertising on television, 80 percent in magazines, 30 percent on radio, 15 percent in newspapers, and 50 percent of advertising through other media.
Spending on media advertising comprised 1.46 percent of GDP during the year ended March 1987 and was approximately $235 per capita.
Table 11.4. MEDIA ADVERTISING, 1987*
| Media | Expenditure | Share |
|---|---|---|
* Year ended March. Source: Associated Accredited Advertising Agencies. | ||
| $(million) | percentage | |
| Newspapers | 316 | 41.0 |
| Television | 224 | 29.0 |
| Radio | 100 | 13.0 |
| Magazines | 74 | 9.5 |
| Direct mail, outdoor, cinema | 57 | 7.5 |
| All media advertising | 771 | 100.0 |
Table 11.5. ADVERTISING EXPENDITURE BY SELECTED INDUSTRIES, 1987*
| Industry group | Expenditure |
|---|---|
* Year ended March. Excludes radio advertising. Source: Association of Accredited Advertising Agencies. | |
| $(million) | |
| 1. Retail | 156 |
| 2. Foodstuffs | 74 |
| 3. Household | 72 |
| 4. Leisure/travel/entertainment | 60 |
| 5. Investment/finance/banking | 49 |
| 6. Automotive | 45 |
| 7. Political/community service | 41 |
| 8. Beverages | 39 |
| 9. Agricultural/industrial/office | 37 |
| 10. Toiletries/cosmetics | 27 |
The Association of Accredited Advertising Agencies of New Zealand is an incorporated body representing the interests of its members on issues affecting the advertising industry and agencies. There are 40 member agencies which collectively represent about 85 percent of agency billings in New Zealand.
The industry has two self-regulatory bodies; the Committee of Advertising Practice, and the Advertising Standards Council. The first body's function is to promulgate codes of practice and develop policies on advertising standards. The Advertising Standards Council's function is to adjudicate in cases where codes have been breached and to advise the committee on codes and public issues. The council also provides a means for members of the public to complain about particular instances of advertising. There is also an Association of New Zealand Advertisers.
Sport and recreation have played an important part in creating and shaping New Zealand's national image, both at home and abroad, and contribute much to the lifestyle New Zealanders treasure. In a country well endowed with natural assets and with a well developed income support system there is the potential for every New Zealander to participate in some form of recreation or sport and it is government policy to promote access to it for all New Zealanders.
Sport has been a predominant focus for cultural identity, and New Zealand is perhaps best known for the calibre of its international sportspeople. But other forms of recreation are equally as vital and as important within the nation's life. The 125 000-strong membership of the New Zealand Amateur Arts Assembly, which represents 23 national bodies and 1546 clubs and groups, attests to the importance of the amateur arts as a form of participatory recreation. Outdoor recreation is favoured by a relatively pristine environment, rich in scenic beauty. An extensive and varied park system which includes national, forest and maritime parks, historic and scenic reserves, walkways and a large number of local parks and reserves showcases the environment and provides a full spectrum of recreational opportunity. The country's national parks and reserves are described in section 14.3.
The 1974–75 New Zealand Recreation Survey, a baseline study of recreational involvement, identified five main activity types: ‘cultural pursuits’, ‘sporting activities’, ‘interest groups’, ‘home-based’ and ‘other recreational activities’. The category ‘cultural pursuits’ involved a total of 85 percent of the population. Within this category ‘hobbies’, ‘education-related’, and ‘arts-related’ activities each involved over half of the population. The category ‘sporting activities’ involved 86 percent of the population. Within this category ‘team sports’ involved 46 percent of the population; ‘individual/small group sports’ 57 percent of the population; and ‘active outdoor recreation’ 70 percent of the population. The category ‘interest groups’—community service, professional, social and political—involved a total of 36 percent of the population. The category ‘home-based’ activities involved 70 percent of the population, and the broad category ‘other recreational activities’ 84 percent of the population. Overall, reading, gardening, and listening to records were respectively the most popular forms of recreation.
A 1987 survey found that among the more physically active forms of recreation, gardening proved to be the most commonly performed activity, followed by walking for recreation, and swimming.
During 1988 a major survey of the way New Zealanders live was conducted on behalf of the Hillary Commission for Recreation and Sport.
Recreation and sport was first formally established as a Cabinet portfolio in 1973 with the establishment of the Ministry of Recreation and Sport and the Council for Recreation and Sport. In April 1987 the two bodies were superseded by a new independent statutory body, the Hillary Commission for Recreation and Sport. The commission initiates, supports and facilitates programmes and policies aimed at raising the quantity and quality of active participation in recreation and sport among all age groups of New Zealanders, both able-bodied and disabled, at all levels of competence.
The 11-member commission employs approximately 20 staff and contains two operational arms—SportsCorp and RecCorp. Sir Ronald Scott, the chairman of the 1974 Christchurch Commonwealth Games, is the commission's presiding member. It is funded from the New Zealand Lottery Board and government.
In the year ended 31 March 1988 the commission distributed $11.2 million to recreation and sport. This included $3.3 million to local authorities to fund local recreation and sport; $1.1 million to assist national recreation and sports organisations; $0.2 million for special one-off projects; $0.16 million in subsidies for local recreational advisers; $0.45 million for ‘Movin'On’, a ministerial programme directed at helping young people seen as being ‘at risk’; $2.5 million for the XIV Commonwealth Games; $0.45 million to the New Zealand Sports Foundation; $0.3 million for a proposed promotional programme; and $0.15 million for a nation-wide survey of lifestyles. In addition, the Hillary Commission has undertaken considerable public consultation and review of existing policies and programmes administered previously by the earlier ministry and New Zealand Council for Recreation and Sport.
A wide array of other government departments, corporations and statutory bodies are concerned with recreation. The Department of Conservation is, for example, a principal land manager in the sphere of outdoor recreation, whilst the Department of Internal Affairs administers a number of programmes to help local authorities and community organisations provide for the needs of young people.
New Zealand is party with other Commonwealth nations in the Commonwealth Youth Programme. Established in 1973, the Commonwealth Youth Programme is a six-point plan of practical action: operating regional youth development centres; administering youth bursaries and study fellowships; investigating applied research: developing youth information services; assisting local youth projects; and supporting youth programmes. In New Zealand the Commonwealth Youth Programme is administered by a national liaison committee, serviced by the Department of Internal Affairs and composed of representatives from the Department of Internal Affairs, the Ministry of Foreign Affairs, the Department of Education, the Department of Maori Affairs, the Pacific Island Affairs Unit, and the National Youth Council.
The provision of recreation and sport facilities such as libraries, community centres, parks and playing fields has long been an accepted part of the responsibilities of local and regional authorities. Many are now also becoming increasingly involved in programme management.
A pervasive volunteer spirit is one of the strengths of New Zealand recreation and sport. A 1981 survey showed 47 percent of the population as being members of a sporting or recreational club or society.
The leisure industry is known to be large and expanding, but is difficult to measure other than indirectly and partially.
A 1983 report published by the Department of Internal Affairs estimated that up to 21.6 percent of the average household's expenditure was spent on recreation-related items including alcohol, holiday expenses, food eaten out and takeaways. The 1987 Business Directory compiled by the Department of Statistics showed 17 655 New Zealanders as being employed within the category ‘recreation services’, a 5.5 percent increase over the 16 730 recorded a year earlier.
The 1983–84 Census of Manufacturing reveals information on the sales and other income generated by major industry groups. In the 1983–84 year the following were recorded: sporting and athletic goods, $30,056,000; toys and games, $31,327,000; and musical instruments, $2,677,000.
For many New Zealanders the successful New Zealand sportsman or woman represents the archetype of the battler succeeding against the odds. International sporting events in which New Zealand features have the power to arouse intense nationalistic fervour. New Zealanders have fared exceptionally well in the international arena despite the country's distance from the world's major venues and, until the early 1970s, a comparative lack of state or corporate funding. At the 1984 Los Angeles Olympics, for example, New Zealand achieved a greater medal ratio per head of population than any other nation competing, although this may have been due in part to the absence of many Eastern European nations.
Various reasons have been advanced for New Zealand's success. A small population may have helped produce an affinity between the national hero and weekend athlete, and, while a generally temperate climate has made it possible for athletes to train year round, there is sufficient variety of terrain and climate to foster a wide range of summer and winter pursuits.
Traditionally New Zealanders have excelled in rugby union, which has been regarded as the national sport, and track and field athletics. However, Sir Edmund Hillary, who with Sherpa Tenzing Norgay in 1953 was the first to climb Mount Everest, probably remains New Zealand's best internationally known sportsman. Over more recent years New Zealanders have had sustained international success in rowing, netball, squash, softball, cricket, yachting and other disciplines.
New Zealand's more conspicuous successes in 1987 included: winning the World 20m Yachting Championship and the Admiral's Cup; taking the inaugural Webb Ellis World Rugby Cup; winning the World Women's Netball Championship; Susan Devoy winning the World Women's Squash Championships, Philip Rush's record-breaking triple crossing of the English Channel, and Erin Baker's victory in the women's section of the Hawaiian Ironman Triathlon.
New Zealand's success at an elite level is founded on a broad base of mass participation and support. The New Zealand Assembly for Sport, which represents over 50 national associations, claims a collective membership of over 1.5 million.
A survey taken in March 1987 found 19 percent of the population had taken part in competitive activity in the last four weeks and that 35 percent of the New Zealand adult population were members of what were for the purposes of the survey defined as activity-related clubs.
The intensity of New Zealand's interest in sport is reflected in the over 10 000 hours of sports broadcasting allocated by Television New Zealand in 1987, which at 7.2 percent of total broadcasting time is one of the highest percentages in the world.

World squash champion, Susan Devoy (right) defends her title against a challenge from Lisa Opie at a match in Auckland during 1987
Though there has recently been concern that other interests may be depriving traditional team sports of their following, some sports and activities which are relative newcomers to the New Zealand scene—such as aerobics, indoor cricket, windsurfing and tenpin bowling—have experienced phenomenal growth, and other more traditional sports such as golf and cricket are thriving.
Table 11.6. PARTICIPATION IN MAJOR SPORTS, YEAR ENDING MARCH 1987*
| Sport | Participants† | Individual participants at all levels† | |||
|---|---|---|---|---|---|
| Competitive | Non-competitive | Males | Females | Total | |
* Figure based on a survey of 1200 households. † There is some overlap between competitive and non-competitive participants. Source: Accident Compensation Corporation. | |||||
| Badminton | 105,200 | 77,200 | 77,500 | 82,800 | 160,300 |
| Basketball | 85,900 | 53,400 | 71,200 | 55,800 | 127,000 |
| Bowls | |||||
| Indoor | 153,900 | 121,400 | 98,100 | 127,400 | 225,500 |
| Outdoor | 129,600 | 64,000 | 83,800 | 71,000 | 154,800 |
| Cricket | |||||
| Indoor | 114,600 | 232,900 | 222,100 | 80,200 | 302,300 |
| Outdoor | 161,900 | 105,600 | 224,700 | 42,200 | 266,900 |
| Golf | 227,400 | 285,400 | 248,800 | 162,300 | 411,100 |
| Hockey | 103,800 | 29,500 | 59,300 | 52,200 | 111,500 |
| Netball | 188,100 | 34,400 | 12,000 | 194,300 | 206,300 |
| Rugby | 146,800 | 47,000 | 157,800 | 13,900 | 171,700 |
| Rugby league | 7,500 | 8,600 | 14,400 | 1,700 | 16,100 |
| Sailing | 34,600 | 87,400 | 66,600 | 44,200 | 110,800 |
| Skiing | 6,800 | 93,200 | 49,800 | 47,300 | 97,100 |
| Soccer | |||||
| Indoor | 24,600 | 20,200 | 35,700 | 6,800 | 42,500 |
| Outdoor | 212,300 | 80,600 | 214,600 | 42,700 | 257,300 |
| Softball | 77,800 | 39,300 | 58,800 | 58,600 | 109,400 |
| Squash | 74,600 | 166,000 | 139,000 | 66,200 | 205,200 |
| Swimming | 207,400 | 606,800 | 333,000 | 402,000 | 735,000 |
| Tennis | 167,600 | 205,800 | 161,900 | 150,400 | 312,300 |
| Volleyball | 56,400 | 43,600 | 49,400 | 44,200 | 93,600 |
| Total | 2 286 800 | 2 402 300 | 2 370 500 | 1 746 200 | 4 116 700 |
The New Zealand Sports Foundation was formed in 1978 with the support and assistance of the private sector and the Government to meet the special needs of the country's top athletes. Sports Foundation funding has contributed to the recent success of many of New Zealand's athletes.
The New Zealand Olympic and Commonwealth Games Association oversees the administration, selection, development and funding of New Zealand's Olympic and Commonwealth Games teams.
A wide variety of fish abound around the coasts, in bays and harbours. In both the North and South Islands many streams, rivers, and lakes provide excellent rainbow and brown trout fishing.
Sizes of trout vary from district to district depending on environment, climate, food available, and the numbers of anglers. Average trout weights are as follows:
North Island—rainbow 1 kg and brown 2 1/4 kg in the Rotorua lakes; rainbow 2 1/4 kg and brown 2 kg in Lake Taupo; rainbow and brown 1 kg in river systems, 1–2 kg in acclimatisation society districts.
South Island—rainbow and brown 1–1 1/2 kg in lake systems; sea-run brown 2 1/4 kg in West Coast rivers; sea-run quinnat salmon 6 1/2 kg in the cast coast rivers; land-locked salmon 1–1 1/4 kg.
The warm waters off the east coast of the North Island provide some of the best surf, line, and spear fishing in the world. The main bases for line fishing from charter boats are at Whangaroa, Bay of Islands (Russell, Otehei Bay, and Waitangi), Tutukaka, Mercury Bay (Whitianga), and Tauranga (Mayor Island).
The most prized catches are broadbill, black marlin, striped marlin and blue marlin, while other types of big-game fish found in New Zealand waters are mainly tiger shark, hammer-head shark, mako shark, thresher shark, kingfish (yellow tail), and tuna. The best catches are usually made in February but fishing is good from December to April.
The principal game birds are duck, swan, pheasant, quail, geese, and chukor, but the sport is limited, the main season usually extending for about six weeks from early May.
There are fewer restrictions on stalking—no limit on the number of game animals that can be taken, no licence required, and the season is open all year round. However, commercial hunting operations have severely limited the numbers of some game animals (deer of several species, elk, chamois, and thar) that once abounded in the forest and alpine regions. Wild pigs, goats, and wallaby are still numerous in several areas. For tourists and inexperienced hunters, a guide is essential for hunting.
The skiing season in New Zealand extends from mid-July to late October in the North Island, and from June to late October in the South Island.
In the North Island the main skiing centre is Mount Ruapehu in the Tongariro National Park. The main ski-fields are Whakapapa and Turoa, smaller club fields exist at Tukino and also on Mount Egmont.
In the South Island the principal ski areas are Coronet Peak, Remarkables, Cardrona (Queenstown), Treble Cone (Wanaka), Mount Dobson, Mount Hutt, Tekapo, Ohau and Porter Heights. There are also several smaller club ski-fields and with the operation of ski-planes in the Mount Cook region and helicopters in many areas of the South Island, access to other very good skiing is available to experienced skiers. Heli-skiing is available in the Ben Ohau Ranges, the Harris Mountains, the Two Thumb Range, the Mount Cook area and at Mount Hutt, Twizel, the Remarkables and Fox Peak.
The nearness of mountains and forests to the main centres of population in New Zealand encourages tramping. In the Waitakere and Hunua Ranges near Auckland, the central ranges of the North Island; Taranaki, Tongariro, and Urewera National Parks; and throughout the extensive parks and protected natural areas of the South Island, there are tracks through beautiful scenery. There are many commercial guides in New Zealand, who can introduce people to the great outdoors and each year the New Zealand Tourist and Publicity Department publishes a list of guides for tramping and mountaineering as well as many other outdoor activities.
Since the New Zealand Walkway Commission was established in 1976, considerable emphasis has been placed on the development of walking tracks in both rural and urban areas throughout the country. These walking tracks vary in length from about half an hour's walk up to four or five days’ journey for the St James Walkway in North Canterbury. In addition to ‘walkways’, government agencies and local authorities throughout New Zealand develop and maintain both short and long tracks. Some of the more famous are the Milford and Routeburn Tracks in Fiordland, and the Heaphy Track in Nelson, which all take several days to travel.
Organised thoroughbred racing has been a feature of New Zealand life since the first European settlement. Race meetings were held to celebrate the first anniversaries of the Auckland, Wellington, Nelson, Otago and Canterbury settlements, and the racing clubs that were to follow were the first to be formed in the country. In the early 1890s formation began of a national body to control thoroughbred racing, known today as the New Zealand Racing Conference.
Harness, or standardbred, racing has also been organised since late last century. Today, many city and provincial clubs are co-ordinated by the New Zealand Harness Racing Conference.
There are thoroughbred and harness racing clubs in most cities and larger towns, as well as many smaller centres. The number of meetings held each year and the stakes offered vary widely—particularly between the larger city and the smaller provincial clubs, which may hold meetings as infrequently as once a year. There is also a strong horse-breeding industry, with annual yearling sales attracting an increasing number of overseas buyers, although, with few notable exceptions, New Zealand-bred horses have had their greatest successes in Australian feature races.
Bookmaking has been illegal in New Zealand since 1910 and both on-course and off-course betting is conducted through the Totalisator Agency Board, which has branches throughout the country. Turnover is taxed by central government and certain deductions are made to assist with stakes, amenities and the upkeep of clubs—the balance being the pool from which dividends are declared.
Greyhound racing has had a small following in New Zealand. Extension of TAB betting facilities to greyhound meetings in 1980 led to a steady increase in attendance and turnover.
The controlling body for racing policy is the New Zealand Racing Authority which was instituted by statute in 1971.
Table 11.7. RACE MEETINGS*
| Galloping | Trotting | Greyhounds | |||||
|---|---|---|---|---|---|---|---|
| 1986 | 1987 | 1986 | 1987 | 1986 | 1987 | ||
| * Full totalisator meetings only, for years ended July. | |||||||
| Racing days | 325 | 323 | 197 | 204 | 23 | 29 | |
| Races | 3,147 | 3,119 | 1,966 | 2,040 | 230 | 290 | |
| Stakes | $(000) | 19,815 | 25,818 | 10,637 | 13,770 | 88 | 190 |
| On-course turnover | $(000) | 112,394 | 125,916 | 70,667 | 78,120 | 1,037 | 1,401 |
| T.A.B. turnover | $(000) | 462,616 | 523,920 | 183,167 | 223,043 | 5,980 | 9,331 |
| Total dividends | $(000) | 452,739 | 512,301 | 199,796 | 237,306 | 5,475 | 8,378 |
Lotteries and raffles are popular both with participants and as a means of fund-raising for sports bodies and other organisations. Lotteries are organised by a central authority, with net profits distributed for purposes beneficial to the community. Housie remains the most popular of the licensed games of chance. A government policy of not permitting casino gambling has been reviewed twice in recent years, but without change.
The Gaming and Lotteries Act 1977 is the main piece of legislation in the area. Its basic principle is that gambling may not be conducted for private gain, but for minor forms of gambling it is not necessary to obtain licences or permits provided conditions laid down in the Act are met. Additional forms of gambling may be authorised if public demand for them becomes sufficient although there are some prohibitions in the public interest. Where large numbers of participants and substantial amounts of money could be involved, licences continue to be required.
The Act identifies, and provides for the control of, four forms of gambling: games of chance (such as housie); bookmaking and betting (other than betting on horse racing and greyhound racing); prize competitions (such as football pools); and lotteries (previously called raffles). Horse and greyhound racing is controlled through the Racing Act 1971 (see above).
Aside from gambling on horse races, lotteries account for the greatest amount of turnover. The New Zealand Lotteries Commission was established on 1 June 1987 to conduct all New Zealand lotteries defined by the Act. The current New Zealand lotteries are Lotto and the Golden Kiwi.
The net profits from Lotto and Golden Kiwi are paid by the New Zealand Lotteries Commission to the New Zealand Lottery Board for distribution to charities, the arts, sciences, recreation and sport. This funding is outlined in table 11.8.
The first weekly Lotto draw was held on 22 July 1987 with sales made through a network of 450 outlets nationwide. In the first 10 months sales of nearly $143 million were made with per capita spending on Lotto at approximately $1.67 per week, and the game played by over a million people each week.
Total sales for the year from these two lotteries reached a little over $162 million, and from this a profit of over $26 million was produced after payment of prizes, lottery duty, GST and expenses. Sales of Golden Kiwi lotteries for the 12 months to 31 March 1988 amounted to $75,995,880. The level of sales was maintained in the early part of the year but has been affected by the success of Lotto since August 1987.
Table 11.8. ALLOCATION OF LOTTERY PROFITS
| Recipient | 1985–86 | 1986–87 | 1987–88 |
|---|---|---|---|
| Source: Department of Internal Affairs. | |||
| $(000) | |||
| Welfare of Aged Persons Distribution Committee | 825 | 843 | 825 |
| Welfare Services Distribution Committee | 2,415 | 2,422 | 2,400 |
| Youth Services Distribution Committee | 850 | 852 | 850 |
| Medical Research Distribution Committee | 500 | 505 | 500 |
| Scientific Research Distribution Committee | 400 | 357 | 350 |
| General Purposes Distribution Committee | 9,899 | 9,222x | 7,917 |
| Queen Elizabeth II Arts Council | 3,500 | 3,709 | 5,150 |
| Minister of Internal Affairs (s. 93) | 1,178 | 650 | 650 |
| New Zealand Film Commission | 750 | 867 | 1,400 |
| Hillary Commission for Recreation and Sport | - | 500 | 1,000 |
| Total | 20,317 | 19,427x | 20,042 |
New Zealand's natural assets have made it possible to build an international image as one of the world's most beautiful countries. The national parks system and undeveloped areas, relatively unpolluted air and water, open spaces, and distinctive plants and animal life are all desirable to international visitors. The recent world-wide expansion of tourism, and changing visitor demands have, however, resulted in changes to what New Zealand offers as a destination. More travel-experienced visitors, coming from a wider range of countries have interests that now encompass skiing, tramping, walking, white-water rafting, and a variety of other activities.
Visitors today are more interested in finding out more about the distinctive features of not only the New Zealand countryside, but also way of life. The rural landscape and farm-life, the towns and the pace of life, art and craft activity, and the multicultural mix all contribute to New Zealand's distinctive appeal and are being used to promote New Zealand as a tourist destination.
Tourism has both a direct and indirect impact on the economy. International visitors, in particular, make the industry a relatively high user of labour, a high earner of foreign exchange and a relatively low user of imports. Tourism is also capital intensive.
Domestic visitors account for about half the expenditure on tourism, and nearly all this is spent on transport and accommodation. The combined value of domestic and international tourism has been estimated at $2,804 million for the year ended 31 March 1987, an increase of 60 percent over the previous year (although preliminary figures for the 1988 year show this growth has not continued).
The social consequences of tourism are largely beneficial, creating employment and stimulating a diversity of activities and facilities. The nature of New Zealand tourism encourages wide-ranging contact between residents and visitors, and this contact contributes to the current high acceptance of tourism by New Zealanders.
The largely unspoiled and unpolluted environment is a major attraction for visitors, and protection and wise management of resources ensures that tourism has a positive impact. Tourism also provides an alternative economic justification for protection of the environment.
Table 11.9. EXPENDITURE BY TOURISTS FROM SELECTED COUNTRIES, 1987*
| Country of residence | Total travel expenditure† | Mean expenditure per person | Mean expenditure per day |
|---|---|---|---|
* Year ended March 1987. † Excludes international airfares. Includes pre-paid, cash and credit card spending during respondents’ visit to New Zealand. Source. New Zealand Tourist and Publicity Department. | |||
| $ | $ | $ | |
| Australia | 338,643,783 | 1,373.79 | 73.56 |
| United States | 337,276,458 | 2,177.90 | 148.48 |
| Japan | 182,840,885 | 3,108.06 | 280.00 |
| UK | 105,451,135 | 2,198.50 | 43.11 |
| Canada | 62,379,415 | 1,941.89 | 89.55 |
| West Germany | 28,220,574 | 2,729.00 | 64.95 |
| Singapore | 25,464,549 | 2,238.64 | 162.82 |
| Other | 228,904,600 | 2,018.47 | 54.81 |
| All countries | 1,309,181,399 | 1,938.37 | 84.80 |
In recent years, there has been a marked trend toward more active, participatory holidays. Two elements contribute to this. Visitors want new experiences, and there is also a much greater diversity of things to do. The impetus for the development of new activities is provided by New Zealanders, both as domestic visitors and residents. As visitors now expect activities and amenities to complement New Zealand's scenic attractions, and are also looking for an insight into another culture and lifestyles, attractions and facilities developed primarily for the local or national community are increasingly used by visitors.
Some facilities have been developed specifically for tourism (whether international or domestic) including the following: souvenir shops; guided tours and sightseeing trips by all means of transport (including coach, taxi, jetboat, raft, plane); agricultural demonstrations (such as the Rotorua Agrodome and Queenstown Cattledrome); large-scale heritage and theme parks with entrance fees, such as the Museum of Transport and Technology (Auckland), Shantytown (Greymouth), Ferrymead Historic Park (Christchurch), and often a high degree of community involvement; duty-free shopping facilities; rides (such as Shotover River jet, helicopter flights, glacier excursions, steamer cruises, river rafting); guided hunting, fishing and tramping excursions; activities such as gold panning (Shantytown), 3-D maze (Wanaka); carving, glassblowing, greenstone jewellery demonstrations; hiring of gear for all types of outdoor recreation (including yacht charters, ski hire, fishing and hunting equipment, camping gear, horses, bikes, hang-gliding); information centres (especially in national parks or resorts areas); and guided walks (such as the Milford, Heaphy, and Routeburn walks).
A second category is dual-purpose facilities, either consciously developed for use by residents and visitors, or developed into tourism attractions, and includes the following: historic buildings and sites (including memorials, pa and battle sites, and notable buildings such as the Waitangi Treaty House); coffee shops, restaurants, bars, cabarets and nightclubs in non-resort areas; wildlife parks; reserves (such as the gannet sanctuary at Cape Kidnappers); recreation parks (such as Fantasyland in Hastings, Rainbow's End at Auckland), and small complexes with minigolf and bumper boats; local recreational facilities (such as canoeing on the River Avon, waterslides); horseriding, walkways and tracks (within urban green belts and in national parks, and forest parks and reserves); museums (regional, historical or theme); certain churches (in particular those of architectural or historical significance such as Old St Paul's, Wellington, First Church, Dunedin, St Paul's Memorial Church, Putiki); scenic drives in urban areas (marked for the benefit of residents and visitors); lookout towers or peaks (maintained by the local community); skifields and facilities; tramping huts and shelters; local industries which open to the public (but for which tourism is a sideline—often not charged for); airports, railway and bus stations, and marinas; local festivals and competitions (such as the Golden Shears (Masterton), the Cherry Blossom Festival (Alexandra), and the Round the Bays Run (Auckland)); casual buskers, street dancers, actors and other performers.
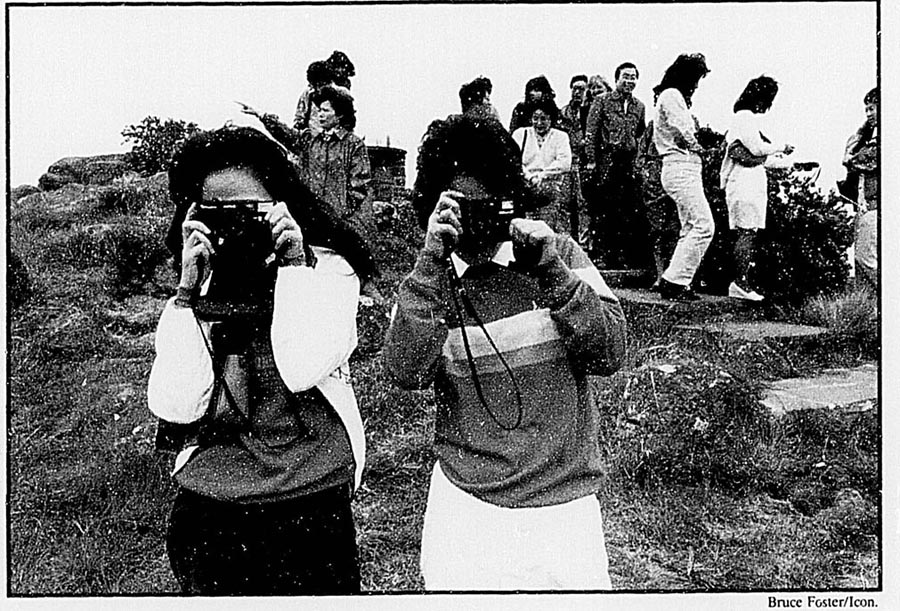
Japanese tourists, Christchurch.
Community facilities include the following: community centres (including meeting venues, hobby facilities and recreation areas); theatres, art galleries (including associated theatre companies, amateur dramatic groups); choirs, national, regional, and local orchestras, and dance companies; collectives (such as the arts centre in Christchurch); libraries, display centres for items/news of local interest; radio and television stations; movie theatres; churches and events organised by church groups; local parks and gardens; playgrounds, reserves, zoos; botanical gardens; racecourses (and associated refreshment and entertainment facilities); sports facilities including golf courses, public swimming pools, bowling alleys, sportsfields, and major sports stadiums such as Queen Elizabeth II Park and Mt Smart Stadium; shopping centres; university and other open educational institutions; youth, sports, cultural or hobby grounds and their facilities; organised sport; and marae.
Commercial accommodation has undergone several distinct stages of development, resulting in today's wide variety of facilities. It includes private hotels, guest houses, tavern/hotels, tourist flats, motels, camping grounds, motor lodges, international standard hotels, cabins, chalets, skiing/hunting/fishing lodges, and farm/home-hosting. Accommodation patterns vary greatly between regions, depending on local population, terrain and climate.
Of all the person nights spent in New Zealand by international visitors in the year ended March 1987, 18.3 percent were spent in a hotel/motel with restaurant and 9.1 were spent in a motel without restaurant.
New Zealand business travellers are the major domestic users of hotel accommodation of those surveyed with 51 percent of person nights.
The trend is towards international visitors using several types of accommodation with increases in the use of camping (4.2 percent), youth hostels (4.3 percent), and farm/home-stay facilities.
The use of private homes by international visitors accounts for 42.2 percent of total person nights, and campervans and caravans absorb 1.9 percent of all person nights.
Most forms of commercial accommodation, especially in smaller centres, are subject to very seasonal occupancy rates. Queenstown commercial occupancy rates varied from 27.4 percent in June 1986 to 86.0 percent in November 1986. Fiordland showed similar fluctuations with 9.9 percent in June 1986 and 73.7 in February 1987, and also the Bay of Islands, with 24.8 percent in June 1986 and 71.6 percent in February 1987. Overall occupancy rates for hotels and motels in New Zealand have been low by international standards, but are increasing. Other forms of accommodation such as home-hosting, campervans and hostels are attracting a larger proportion of visitors and there is an ample supply of medium- and lower-priced hotel and motel accommodation. Alternative forms are more actively promoted than in the past and the competition they provide has led to increased pressure on hotels and motels to form chains for marketing and forward reservations. Seasonal price variations are also becoming evident and the consumer is benefiting from the increased competition between and within the different forms of accommodation.
New Zealand has a highly developed public transport system, with scheduled air services to most areas and an extensive network of coach operations. Limited rail transport, passenger, and vehicular ferry services are also available. However, there is a trend for visitors to choose forms of transport offering greater flexibility, such as campervans. Rental cars are used at some stage by 28.2 percent of all visitors to New Zealand and several major rental car firms operate in New Zealand. The use of private cars by international visitors has increased over recent years.
In order of use, private car (24.9 percent); rental car (22.2 percent); and organised coach tour (17.2 percent) are the three most favoured means of internal transport for international visitors. Holiday/vacation visitors favour rental cars (25.6 percent) or organised coach tours (25.4 percent). Those visiting friends and relatives make much greater use of private cars (73.1 percent) compared to holiday visitors (9.2 percent). Business travellers prefer private cars (33.4 percent) and rental cars (26.7 percent) and also have the highest use for taxi travel (18.0 percent) than other visitors. Of those on working holidays 27.4 percent prefer to hitchhike. An increasing number of holiday visitors use campervans (10.2 percent) as their main transport type. Most visitors use several modes of transport.
More than 700 000 overseas visitors now arrive in New Zealand annually. Visitor arrival numbers grew by 10.8 percent in the year ended 31 March 1987, compared with 15.4 percent in the previous year. There has been a growing diversification of countries from which overseas visitors originate.
Table 11.10. NUMBERS OF INTERNATIONAL VISITORS
| Year ended 31 March | Holiday | Stay with friends and relatives | Business | Other* | Total† |
|---|---|---|---|---|---|
* Includes work or working holiday, formal education, stopover, and unspecified. † Excludes through passengers (defined as passengers who do not stay ashore in New Zealand). Source: New Zealand Tourist and Publicity Department. | |||||
| 1983 | 257,910 | 114,759 | 58,074 | 56,915 | 487,658 |
| 1984 | 285,845 | 116,793 | 61,250 | 54,553 | 518,441 |
| 1985 | 341,984 | 127,586 | 68,269 | 59,156 | 596,995 |
| 1986 | 404,032 | 140,481 | 74,661 | 69,899 | 689,073 |
| 1987 | 441,081 | 157,619 | 76,087 | 88,422 | 763,209 |
Table 11.11. COUNTRY OF ORIGIN OF INTERNATIONAL VISITORS
| Country | Year ended March | |
|---|---|---|
| 1986 | 1987 | |
| Source: New Zealand Tourist and Publicity Department. | ||
| Australia | 291,044 | 272,214 |
| U.S.A. | 133,902 | 163,390 |
| Japan | 52,204 | 66,404 |
| United Kingdom | 42,698 | 53,146 |
| Canada | 32,157 | 34,550 |
| Singapore | 8,448 | 15,329 |
| Germany, Fed. Rep. of | 10,956 | 13,182 |
| Western Samoa | 5,416 | 9,692 |
| Fiji | 5,756 | 8,158 |
| Tonga | 3,104 | 7,364 |
| Switzerland | 4,858 | 7,148 |
| Sweden | 3,512 | 6,451 |
| Hong Kong | 4,564 | 6,357 |
| Netherlands | 5,564 | 6,044 |
| Taiwan | 3,316 | 5,865 |
| Tahiti (French Polynesia) | 3,296 | 4,082 |
| Malaysia | 3,208 | 3,991 |
| Papua New Guinea | 3,953 | 3,566 |
| Cook Islands | 2,193 | 3,125 |
| New Caledonia | 3,623 | 2,947 |
| France | 2,517 | 2,821 |
| Indonesia | 2,137 | 2,715 |
| South Africa | 1,680 | 2,205 |
During 1986–87, New Zealanders made 13.2 million trips away from home which included at least one night away, and spent 53.9 million person nights away, a 10 percent decrease on the 14.6 million trips made during the previous year. New Zealanders regard holidays as part of their lifestyle. Relaxation, socialising, new experiences, nostalgia, visiting friends and relatives and participation in sports and other special events are all reasons for a holiday, and New Zealanders often travel for a combination of these reasons.
Table 11.12. DOMESTIC TRAVEL DESTINATIONS
| Local government region | Year ended March 1986 | Year ended March 1987 | ||
|---|---|---|---|---|
| Proportion | Visitors | Proportion | Visitors | |
| Source: New Zealand Tourist and Publicity Department. | ||||
| percent | no. | percent | no. | |
| Auckland | 14 | 2,465,000 | 16 | 2,463,000 |
| Bay of Plenty | 9 | 1,630,000 | 10 | 1,623,000 |
| Canterbury | 7 | 1,229,000 | 8 | 1,194,000 |
| Waikato | 7 | 1,175,000 | 7 | 1,071,000 |
| Northland | 6 | 1,108,000 | 7 | 1,069,000 |
| Wellington | 6 | 1,006,000 | 6 | 905,000 |
| Thames Valley | 4 | 795,000 | 5 | 715,000 |
| Tongariro | 5 | 845,000 | 4 | 685,000 |
| Hawke's Bay | 5 | 889,000 | 4 | 637,000 |
| Coastal/North Otago | 3 | 599,000 | 4 | 606,000 |
| Clutha/Central Otago | 4 | 749,000 | 4 | 565,000 |
| Manawatu | 4 | 709,000 | 3 | 534,000 |
| Nelson Bays | 3 | 468,000 | 3 | 521,000 |
| Wanganui | 2 | 402,000 | 3 | 504,000 |
| Aorangi (South Canterbury) | 3 | 474,000 | 3 | 440,000 |
| Taranaki | 3 | 608,000 | 3 | 406,000 |
| Marlborough | 2 | 411,000 | 3 | 397,000 |
| West Coast | 2 | 412,000 | 2 | 391,000 |
| Southland | 3 | 524,000 | 2 | 385,000 |
| Horowhenua | 2 | 341,000 | 2 | 254,000 |
| Wairarapa | 1 | 230,000 | 1 | 228,000 |
| East Cape | 2 | 391,000 | 1 | 206,000 |
The Tourist and Publicity Department is responsible for the co-ordinated promotion of New Zealand overseas as a tourism destination, and encourages and stimulates domestic tourism. A comprehensive travel service, and information and advisory services for the tourism industry are provided. Domestic offices are located at Auckland, Rotorua, Wellington, Christchurch, Dunedin, and Queenstown. International offices are located at Sydney, Melbourne, Brisbane, Perth, Adelaide, Singapore, Tokyo, Osaka, Frankfurt, London, New York, Los Angeles, San Francisco, Vancouver, Hong Kong and Buenos Aires. Through the National Film Unit and its publicity arm, Communicate New Zealand, the department also supplies general New Zealand publicity material, publications, films, photographs and displays for use within New Zealand and overseas to create a background knowledge of New Zealand.
Established in 1982, the council is a 12-member advisory body to the Government. It has an independent chairperson, with members drawn largely from the private tourism sector. A permanent subcommittee of the council, the Tourism Marketing Group, widens industry involvement in the review of marketing policies and initiatives. The secretariat is provided by the New Zealand Tourist and Publicity Department.
Established in 1984, the Tourist Industry Federation represents a wide range of national associations, industry members, and regional groups connected with the tourism industry. It serves as the united voice of the New Zealand tourism industry.
Until recently government has provided assistance for development of tourism accommodation in the form of depreciation allowances for taxation purposes, which applied to qualifying projects. These schemes were repealed from 1 April 1988 and projects approved before that date must be producing assessable income before April 1990. By then export marketing development incentives will also have been phased out. Other assistance is available under the Regional Promotion Assistance Scheme, and the Community and Public Sector Grants Scheme for the development and marketing of regionally-based tourism.
11.1 Department of Internal Affairs; Queen Elizabeth II Arts Council; National Library; Department of Justice.
11.2 Department of Internal Affairs; Department of Conservation.
11.3 Book Publishers Association of New Zealand; New Zealand Library Association; National Library of New Zealand.
11.4 Broadcasting Corporation of New Zealand; Department of Trade and Industry; Independent Broadcasters’ Association; Broadcasting Tribunal; New Zealand Press Council; Association of Accredited Advertising Agencies.
11.5 Hillary Commission for Recreation and Sport; New Zealand Tourist and Publicity Department; Department of Internal Affairs; New Zealand Lotteries Commission.
11.6 New Zealand Tourist and Publicity Department.
Museums, Historic Buildings and Galleries of New Zealand. New Zealand Tourist and Publicity Department, 1988.
Report of the Department of Internal Affairs (Parl. paper. G. 7).
Report of the New Zealand Film Commission (Parl. paper G. 19).
Report of the New Zealand Lottery Board (Parl. paper G. 7B).
Report of the Queen Elizabeth II Arts Council of New Zealand (Parl. paper G. 11).
Report of the New Zealand Historic Places Trust (Parl. paper G. 10).
Details on literature awards and grants can be obtained from the New Zealand Literary Fund c/- Department of Internal Affairs, Private Bag, Wellington.
Report of the Board of Trustees, National Art Gallery, National Museum, and National War Memorial (Parl. paper G. 12).
See the bibliography, Books about New Zealand, at the end of this volume. Report of the Trustees of the National Library of New Zealand (Parl. paper G. 13).
Report of the Broadcasting Corporation of New Zealand (Parl. paper F. 3).
Report of the Broadcasting Tribunal (Parl. paper F. 4).
Report of the Royal Commission of Inquiry into Broadcasting and Related Telecommunications in New Zealand. Government Printing Office, 1986.
Freshwater Catch. Ministry of Agriculture and Fisheries (quarterly).
New Zealand Recreation Survey. New Zealand Council for Recreation and Sport, 1977.
Report of the Department of Internal Affairs (Parl. paper G. 7).
Report of the New Zealand Council for Recreation and Sport (Parl. paper E. 20).
Report of the New Zealand Lottery Board (Parl. paper G. 7B).
Report of the Queen Elizabeth the Second National Trust (Parl. paper C. 2).
Growing Pains: Current Issues Facing New Zealand Tourism. New Zealand Tourism Council, 1987.
New Zealand Domestic Travel Study 1985–86: Accommodation Report. New Zealand Tourist and Publicity Department.
New Zealand International Visitors Survey. New Zealand Tourist and Publicity Department (annual).
Report of the New Zealand Tourist and Publicity Department (Parl. paper G. 25).
Report of the Tourist Hotel Corporation (Parl. paper G. 24).
A full list of research and other publications is available from the New Zealand Tourist and Publicity Department, Private Bag, Wellington.
Table of Contents
In general terms the labour force is the working population aged 15 years and over, including jobless people who are seeking work. The main source of labour-force data is the Department of Statistics, which collects information in two ways:
Through the Household Labour Force Survey (which produces labour-force information every three months, based on a sample of approximately 12 000 households); and
Through the five-yearly Census of Population and Dwellings (which collects information from everyone aged 15 years and over).
Final figures are given in the tables in this chapter based on data from the 1986 census whereas the previous edition used provisional data.
Another source of labour force data is the Department of Labour, which conducts a Quarterly Employment Survey (QES) to determine the number of jobs in various industries. Because this survey counts jobs rather than people, those holding two jobs are counted twice. The QES also omits the agricultural industry and some minor industries, as well as firms having only one employee. (From February 1989 the Quarterly Employment Survey will be conducted by the Department of Statistics.) The Department of Labour also produces other labour-force related statistics on such things as the number of job vacancies reported to it, the number of people in subsidised work, and the number of unemployed people registering with Employment New Zealand.
Official definitions of the labour force have changed as new sources of statistics have been developed, as labour market conditions have changed, and as different sources have attempted to standardise their definitions. One area of change concerns part-time workers. Until recently, both the Departments of Statistics and Labour excluded these people from their estimates of the labour force. With the launching of the Household Labour Force Survey (HLFS) in 1985, however, the Statistics Department, in accordance with International Labour Organisation (ILO) guidelines, began counting part-time workers in the labour force. The Statistics Department has also changed its definition of part-time work, from ‘less than 20 hours per week’ to ‘less than 30’, bringing it into line with the Department of Labour's definition. These changes apply not only to the Household Labour Force Survey but also to statistics from the 1986 census.
The current census and Household Labour Force Survey definitions of the labour force count all those who work for one hour or more per week for pay or profit (including unpaid family members working 15 hours or more per week in a family-owned enterprise) plus unemployed people who are ‘actively’ seeking work or are about to start a job.
Table 12.1. THE LABOUR FORCE*
| Quarter ended | Labour force | Not in labour force | Working-age population† | Labour force participation rate | Unemployment rate | |
|---|---|---|---|---|---|---|
| Employed | Unemployed | |||||
* Based on quarterly Household Labour Force Survey. † Civilian, non-institutionalised, usually resident New Zealand population aged 15 and over. | ||||||
| (000) | percent | |||||
| Male | ||||||
| December 1986 | 904.4x | 33.0x | 256.0x | 1 193.3x | 78.5x | 3.5x |
| March 1987 | 909.3 | 34.9 | 252.4 | 1 196.6 | 78.9 | 3.7 |
| June 1987 | 897.8 | 36.4 | 263.6 | 1 197.9 | 78.0 | 3.9 |
| September 1987 | 893.6 | 36.9 | 269.5 | 1 200.0 | 77.5 | 4.0 |
| December 1987 | 898.4 | 38.2 | 266.3 | 1 202.8 | 77.9 | 4.1 |
| Female | ||||||
| December 1986 | 651.9x | 30.2x | 563.6x | 1 245.7x | 54.8x | 4.4 |
| March 1987 | 648.8 | 32.1 | 568.2 | 1 249.0 | 54.5 | 4.7 |
| June 1987 | 652.6 | 29.8 | 568.1 | 1 250.5 | 54.6 | 4.4 |
| September 1987 | 649.8 | 26.4 | 577.2 | 1 253.4 | 54.0 | 3.9 |
| December 1987 | 666.0 | 28.8 | 561.0 | 1 255.8 | 55.3 | 4.1 |
| Total | ||||||
| December 1986 | 1 556.2x | 63.1x | 819.7x | 2 439.0x | 66.4x | 3.9x |
| March 1987 | 1 558.1 | 66.9 | 820.6 | 2 445.6 | 66.4 | 4.1 |
| June 1987 | 1 550.4 | 66.2 | 831.7 | 2 448.4 | 66.0 | 4.1 |
| September 1987 | 1 543.5 | 63.3 | 846.6 | 2 453.4 | 65.5 | 3.9 |
| December 1987 | 1 564.4 | 67.0 | 827.3 | 2 458.6 | 66.4 | 4.1 |
LABOUR FORCE—historical and projected by working-age and sex
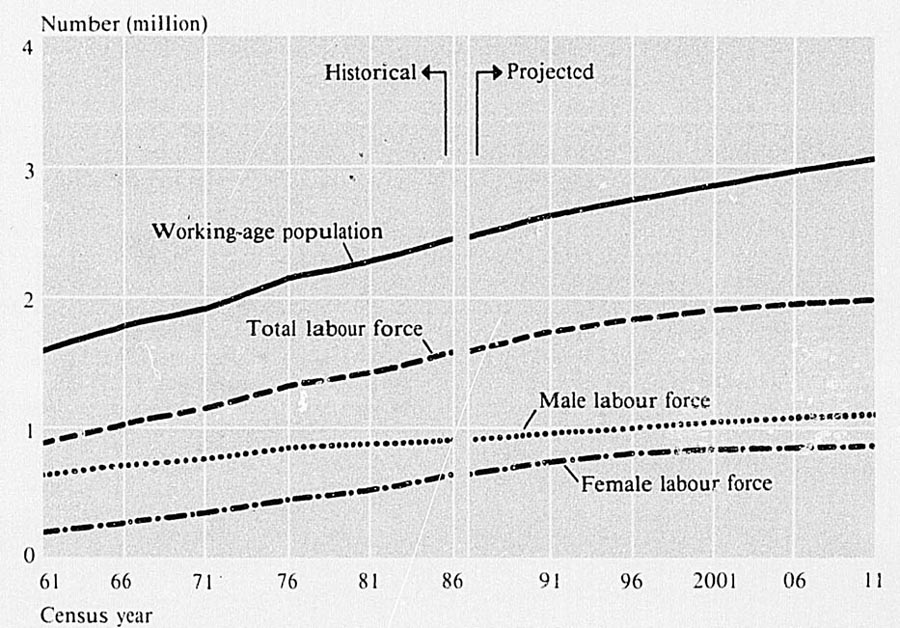
New Zealand's total labour force (both full-time and part-time) has grown steadily, from 914 712 persons at the 1961 census to 1 608 612 persons at the 1986 census—an increase of 693 900 or 75.9 percent, during the 25-year period. By comparison, the total New Zealand population of working age (15 years and over) increased more slowly, from 1 616 042 at the 1961 census to 2 468 301 at the 1986 census, a growth during the period of 852 529 or 52.7 percent.
The faster growth in the total labour force relative to the total population of working age is reflected in an increase in total labour-force participation from 56.6 percent to 65.2 percent during the 1961–86 intercensal period.
Labour force growth and changes in total labour-force participation levels have varied markedly between males and females between 1961 and 1986. The male labour force grew from 674 578 at the 1961 census to 938 613 at the 1986 census, an increase of 264 035 or 39.1 percent. There was an extremely high level of growth in the female labour force which grew from 240 134 to 670 002, an increase of 429 868 or 179.0 percent.
In contrast to male labour-force participation, which decreased slowly but steadily during the intercensal period 1961–86, female labour-force participation has increased rapidly. This has resulted in a marked change in the sex distribution within the labour force. At the 1961 census 73.7 percent of the total labour force were males but by the 1986 census this figure had fallen to 58.3 percent.
The size of the total labour force depends upon changes in the supply of and demand for labour. Some of the demographic, social and economic factors which impact on labour supply and demand are discussed later in this chapter.
In the graph above, the historical trends in the male, female and total labour force and in the working-age population over the intercensal period 1961–86 can be seen. The corresponding projections to the year 2011 provide an indication of the likely future labour force supply and working-age population.
According to these projections, New Zealand's total supply of labour is expected to grow by a further 392 000 to reach approximately 2 million by the year 2011. Both the male and female labour force are projected to increase steadily to reach 1 118 000 and 883 000 respectively, by that year. Most of the growth in the female labour force is projected to occur over the next 10 years when the participation rates of females are expected to increase moderately. In contrast, the number of males in the labour force will increase steadily because of an increasing male working-age population, although the participation of males will fall marginally.
By the year 2011, 73.9 percent of the male population and 56.5 percent of the female population aged 15 years and over will be in the labour force. This will represent a ratio of 126 males to 100 females in the labour force.
These projections were derived from the 1985-base New Zealand Population Projections series described in chapter 5, by applying projected age-sex specific labour-force participation rates to the projected population. Participation rates were generally assumed to decrease slightly for males and increase moderately for females during the period 1986–96 and thereafter to remain constant. It must be stressed that these are projections and not predictions. They measure the future labour force supply based on the specified assumptions, and should only be used as approximate guidelines.
Table 12.2 shows the full-time and part-time labour force at the 1986 Census of Population and Dwellings, by age group and sex. For that census the traditional coverage of employment-related questions was reintroduced (this had been changed for the 1981 census). Overseas visitors aged 15 years and over in the country on census night were again required to complete all the questions on the personal questionnaire.
Table 12.2. AGE AND SEX OF THE LABOUR FORCE, 1986 CENSUS*
| Age group (years) | Males | Females | ||||
|---|---|---|---|---|---|---|
| Full time in labour force | Part time in labour force | Full-time as percentage of total labour force | Full time in labour force | Part time in labour force | Full-time as percentage of total labour force | |
| * Population resident in New Zealand aged 15 and over. Data on work status have been subject to a process of random rounding. All figures including totals, have been rounded using simple random rounding to base three. Individual figures therefore will not necessarily sum to give the stated totals. | ||||||
| 15–19 | 81,543 | 17,811 | 82.1 | 67,785 | 21,489 | 75.9 |
| 20–24 | 122,448 | 7,305 | 94.4 | 90,063 | 13,884 | 86.6 |
| 25–29 | 120,876 | 5,115 | 95.9 | 61,155 | 23,178 | 72.5 |
| 30–34 | 112,158 | 4,242 | 96.4 | 46,266 | 32,262 | 58.9 |
| 35–39 | 111,603 | 3,789 | 96.7 | 52,479 | 34,950 | 60.0 |
| 40–44 | 89,424 | 2,922 | 96.8 | 47,280 | 25,443 | 65.0 |
| 45–49 | 76,992 | 2,802 | 96.5 | 40,701 | 19,965 | 67.1 |
| 50–54 | 65,751 | 2,781 | 95.9 | 29,238 | 15,153 | 65.9 |
| 55–59 | 62,538 | 3,654 | 94.5 | 20,118 | 11,475 | 63.7 |
| 60 and over | 33 678 | 11 166 | 75.1 | 8 820 | 8 301 | 51.5 |
| Total | 877 017 | 61 596 | 93.4 | 463 899 | 206 103 | 69.2 |
| Percentage of population | 72.5 | 5.1 | … | 36.9 | 16.4 | … |
Because of changes in definitions, 1986 census statistics on the full- and part-time labour force cannot be directly compared with similar series from the 1981 census. For the 1986 census the full-time labour force comprised those persons aged 15 years and over working 30 hours or more per week or those unemployed and seeking full-time work. Those persons aged 15 years and over working 1–29 hours per week or unemployed and seeking part-time work, formed the part-time labour force, whereas in the 1981 and earlier censuses the cut-off point between full-time and part-time was 20 hours per week.
There was a clear structural difference between the male and female participation rates in the total labour force at the 1986 census. The overall participation rate for the male population (aged 15 years and over) was much higher, 77.5 percent compared with 53.5 percent for females. Some of the reasons for this disparity are discussed in more detail in the following section.
The impact of education can be seen in the total participation rates for the 15–19, and to a lesser extent the 20–29 years, age groups where there are large numbers of students in the ‘not working’ category.
Participation rates for the total labour force then peak until the age group 35–39 years and remain steady until the age group 50–54 years. There the recent changes in retirement patterns—earlier retirement and redundancy—begin to take effect.
More women of all working ages in the full-time and part-time labour force show their changing role in society. New Zealand women are now living in a more career-oriented society than previous generations and, like men, work because of economic necessity. This is especially evident in the increases in the female labour force numbers and is also consistent with later marriage, more childless marriages and changes in the time patterns of commitment to child rearing. These trends, which are common to most developed countries, tend to be less advanced in New Zealand than in similar societies.
The total New Zealand female labour force at the 1986 Census of Population and Dwellings numbered 669 999, of which 463 899 were full-time workers and 206 100 part-time workers. At the 1981 census the corresponding total figure was 550 863.
Analysis of the work status of females resident in New Zealand aged 15 years and over show that there are 223 689 ‘married’ women in the full-time labour force compared with 182 496 ‘never married’ women. In the part-time labour force the figures contrast sharply, 148 269 women being ‘married’ and only 36 168 women ‘never married’, partly a reflection of the way women often fit their jobs round their family responsibilities. (By definition ‘married’ includes the ‘first marriage’ and ‘remarried’ categories.)
Of the 206 100 females in the part-time labour force, 54 897 are aged 45 years and over, with a large number of these being in the ‘married’ group. These figures indicate the return of many women to the work-force after raising children.
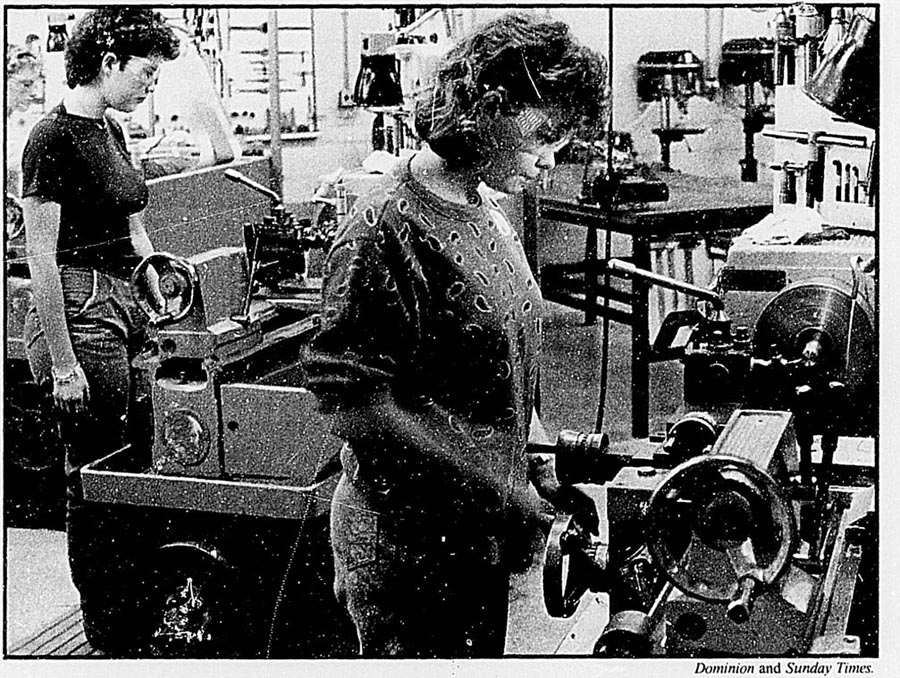
Fifth-formers try lathe work on a work experience course.
National Advisory Council on the Employment of Women (NACEW). The National Advisory Council on the Employment of Women is composed of a chairperson and 12 other members. The chairperson and six council members are appointed by the Minister of Employment for their knowledge and experience in women's employment matters. The remaining six members represent the major employee and employer organisations in the private and public sectors, and the Departments of Labour and Education.
The council's primary function is to advise the Minister of Employment on all matters relating to the employment of women: for example, equal opportunity for girls and women in employment and training, equal pay, parental leave, childcare and the social welfare system as it affects women.
A second function is to promote greater public knowledge and understanding of women's employment and its implications. Accordingly, the council has made submissions to bodies such as the Commission of Inquiry into Equal Pay, the Select Committee on the Parental Leave and Employment Protection Bill and the Royal Commission on Social Policy.
Thirdly, in co-operation with the Department of Labour, which provides secretarial assistance to NACEW, the council has published statistics and other material on women's employment issues; promoted research into the employment of women and related topics such as industrial childcare and equal pay; and promoted schemes to explore ways of assisting disadvantaged groups of women in the paid work-force.
The population resident in New Zealand and employed in the full-time labour force, i.e., working 30 hours or more per week, increased from 1 189 434 at the 1981 census to 1 278 192 at the 1986 census, a rise of 88 758 or 7.5 percent. By contrast, the table shows that those working 1–29 hours per week increased during the same period by 23 430 or 11.8 percent. Approximately comparable figures from the 1981 census have been derived by estimating the numbers actively engaged in both the full- and part-time labour force with hours of work ‘not specified’.
Between the 1981 and 1986 censuses the composition of the employed population changed quite dramatically according to both hours worked and the sex of those employed. The percentage of males employed in the total part-time labour force increased for all ‘hours worked’ categories during the intercensal period. This situation was reversed for employed males in the full-time labour force, with the exception of the 30–34 hours group. Analysis of the intercensal changes in the size of the male and female full- and part-time labour forces by hours worked, indicates the different structure. Much higher percentage rates of growth were experienced by males actively engaged part-time, relative to females. In the case of the full-time labour force, the male-female differentials in intercensal growth were reversed for all ‘hours worked’ groups. These structural changes reflect the supply of and demand for, labour according to hours worked. They are caused by complex factors which are both social and economic in nature.
Table 12.3. HOURS OF WORK*
| Hours worked per week | Males | Females | ||||
|---|---|---|---|---|---|---|
| 1981 census | 1986 census | Percentage intercensal change | 1981 census | 1986 census | Percentage intercensal change | |
* Population resident in New Zealand and gainfully employed in the labour force. † Excludes persons unemployed and seeking work. ‡Estimated. | ||||||
| Part-time labour force† | ||||||
| 1–4 | 2,862 | 2,943 | 2.8 | 11,139 | 10,677 | −4.1 |
| 5–9 | 6,672 | 11,034 | 65.4 | 24,804 | 27,519 | 10.9 |
| 10–14 | 5,400 | 8,340 | 54.4 | 27,504 | 29,688 | 7.9 |
| 15–19 | 3,804 | 7,305 | 92.0 | 28,353 | 31,518 | 11.2 |
| 20–24 | 7,767 | 11,118 | 43.1 | 42,483 | 44,286 | 4.2 |
| 25–29 | 3,891 | 5,613 | 44.3 | 25,509 | 26,175 | 2.6 |
| Not specified | 1 809‡ | 2 640 | 45.9 | 5 790‡ | 2 352 | -59.4 |
| Total, part-time | 32 205‡ | 48 996 | 52.1 | 165 582‡ | 172 221 | 4.0 |
| Full-time labour force† | ||||||
| 30–34 | 11,661 | 17,991 | 54.3 | 35,136 | 39,405 | 12.1 |
| 35–39 | 66,219 | 59,016 | −10.9 | 82,974 | 87,681 | 5.7 |
| 40–44 | 416,241 | 367,122 | −11.8 | 192,981 | 210,045 | 8.8 |
| 45–49 | 106,485 | 124,854 | 17.3 | 14,811 | 30,021 | 102.7 |
| 50–54 | 86,835 | 99,114 | 14.1 | 9,828 | 18,903 | 92.3 |
| 55–59 | 25,788 | 36,078 | 39.9 | 3,282 | 7,065 | 121.5 |
| 60–64 | 49,734 | 52,470 | 5.5 | 6,081 | 9,678 | 59.2 |
| 65–69 | 9,327 | 12,567 | 34.7 | 951 | 2,037 | 114.2 |
| 70–74 | 16,290 | 18,414 | 13.0 | 2,517 | 4,002 | 59.0 |
| 75 or more | 24,885 | 28,593 | 14.9 | 5,664 | 9,972 | 76.1 |
| Not specified | 16 476‡ | 25 110 | 52.4 | 5 286‡ | 18 054 | 241.5 |
| Total, full time | 829 929‡ | 841 329 | 1.4 | 359 505‡ | 436 863 | 21.5 |
| Total | 862 134 | 890 325 | 3.3 | 525 087 | 609 084 | 16.0 |
Analysis of trends in employment status during the intercensal period 1981–86 is not possible because the 1986 census used a new definition of employment status for the part-time labour force which made the categories common to both full-time and part-time work status.
A number of observations can be made from table 12.4, however. Firstly, there is the dominance of the males in the ‘employer of others in own business’ and ‘self employed and not employing others’ categories. At the 1986 census 20.7 percent of males were employed in these two categories, compared with 9.5 percent of females. In contrast, ‘wage or salary earners’ constituted 73.6 percent of the total male labour force, in comparison with females where the corresponding figure was 79.3 percent.
A higher proportion of women were ‘unpaid workers in family businesses’—2.0 percent compared with 0.5 percent of males. Also, females had a higher level of unemployment than males, a situation which is discussed in more detail in section 12.2, Unemployment.
Table 12.4. EMPLOYMENT STATUS OF THE LABOUR FORCE, 1986 CENSUS*
| Age group (years) | Employer of others in own business | Self-employed and not employing | Wage or salary earner | Unpaid in family business | Unemployed and seeking work | Not specified | Total |
|---|---|---|---|---|---|---|---|
| * Persons resident in New Zealand working one or more hours per week, plus persons unemployed and a seeking work. | |||||||
| Males | |||||||
| 15–19 | 231 | 792 | 79,323 | 540 | 18,204 | 264 | 99,357 |
| 20–24 | 1,842 | 6,108 | 110,787 | 354 | 10,287 | 378 | 129,753 |
| 25–29 | 6,672 | 13,302 | 99,675 | 312 | 5,529 | 504 | 125,991 |
| 30–34 | 11,883 | 15,963 | 84,225 | 348 | 3,417 | 567 | 116,403 |
| 35–39 | 15,375 | 17,121 | 79,449 | 390 | 2,505 | 555 | 115,395 |
| 40–44 | 13,740 | 14,037 | 61,914 | 357 | 1,818 | 477 | 92,346 |
| 45–49 | 11,517 | 12,105 | 53,970 | 330 | 1,494 | 378 | 79,794 |
| 50–54 | 8,709 | 10,035 | 47,607 | 351 | 1,500 | 333 | 68,532 |
| 55–59 | 7,365 | 9,660 | 46,584 | 357 | 1,917 | 312 | 66,189 |
| 60–64 | 3,930 | 5,550 | 17,574 | 561 | 948 | 186 | 28,746 |
| 65 and over | 2 670 | 5 007 | 6 864 | 678 | 663 | 219 | 16 104 |
| Total | 83 928 | 109 683 | 687 975 | 4 575 | 48 279 | 4 176 | 938 610 |
| Females | |||||||
| 15–19 | 159 | 267 | 69,438 | 294 | 18,936 | 180 | 89,274 |
| 20–24 | 801 | 1,908 | 89,658 | 612 | 10,743 | 225 | 103,944 |
| 25–29 | 2,382 | 4,260 | 67,848 | 1,638 | 7,917 | 282 | 84,327 |
| 30–34 | 3,978 | 6,006 | 59,109 | 2,316 | 6,777 | 342 | 78,528 |
| 35–39 | 5,106 | 7,011 | 66,783 | 2,454 | 5,628 | 447 | 87,429 |
| 40–44 | 4,458 | 5,688 | 56,661 | 1,848 | 3,714 | 357 | 72,726 |
| 45–49 | 3,543 | 4,602 | 47,916 | 1,467 | 2,856 | 279 | 60,663 |
| 50–54 | 2,355 | 3,480 | 35,211 | 1,056 | 2,088 | 198 | 44,388 |
| 55–59 | 1,503 | 2,595 | 25,071 | 828 | 1,431 | 165 | 31,593 |
| 60–64 | 672 | 1,197 | 8,388 | 540 | 501 | 93 | 11,394 |
| 65 and over | 444 | 987 | 3 435 | 432 | 321 | 111 | 5 724 |
| Total | 25 404 | 38 001 | 529 512 | 13 491 | 60 912 | 2 676 | 670 002 |
During 1981–86 the industrial structure of the New Zealand labour force showed a continuation of the long-term shift in employment away from selected secondary industries into some tertiary industries. This follows a trend that has become established throughout the developed countries of the West.
Table 12.5 which follows shows the employed population (both full-time and part-time) usually resident in New Zealand by industry major division, at the 1981 and 1986 censuses. The ‘manufacturing’ industry major division's share of the gainfully employed fell from 23.0 percent to 21.3 percent during the intercensal period. Within the secondary sector the other major divisions showed varying behaviour, ‘electricity, gas and water’ retained its share of employment while the building and construction industry increased its share of employment.
The tertiary sector increased its overall share of the employed population, from 58.4 percent at the 1981 census to 59.6 percent at the 1986 census. However, within this sector the ‘transport, storage, communication’ and ‘community, social’ major divisions experienced declines in their proportions of total employment. ‘Agriculture, hunting, forestry and fishing’, together with ‘mining and quarrying’ comprise the primary industrial sector which marginally increased its proportion of the employed population, from 11.2 percent to 11.3 percent.
There were wide variations both in the proportions of males and females and in full-time and part-time employees within each industry major group at the 1986 census.
Table 12.5. INDUSTRIAL STRUCTURE OF THE LABOUR FORCE*
| Industry major division | 1981 Census | 1986 Census | Percentage intercensal change | ||
|---|---|---|---|---|---|
| Number | Percentage distribution† | Number | Percentage distribution† | ||
* Persons resident in New Zealand gainfully employed for one or more hours per week. Excludes persons unemployed and seeking work. † Calculated from persons whose industry major group is adequately defined. | |||||
| Agriculture, hunting, forestry and fishing | 152,754 | 10.9 | 161,634 | 10.9 | 5.8 |
| Mining and quarrying | 4,731 | 0.3 | 5,997 | 0.4 | 26.8 |
| Manufacturing | 321,081 | 23.0 | 316,203 | 21.3 | −1.5 |
| Electricity, gas and water | 15,306 | 1.1 | 15,729 | 1.1 | 2.8 |
| Building and construction | 88,260 | 6.3 | 102,036 | 6.8 | 15.6 |
| Wholesale, retail, restaurant | 252,528 | 18.1 | 292,131 | 19.7 | 15.7 |
| Transport, storage communication | 110,733 | 7.9 | 110,976 | 7.5 | 0.2 |
| Finance, insurance, property | 97,233 | 7.0 | 122,946 | 8.3 | 26.4 |
| Community, social | 354,597 | 25.4 | 357,735 | 24.1 | 0.9 |
| Not adequately defined | 50 253 | … | 14 025 | … | −72.1 |
| Total | 1 447 479 | 100.0 | 1 499 421 | 100.0 | 3.6 |
The New Zealand Standard Classification of Occupations lists eight major occupational groups defined in terms of the work a person performs. As is the case in other developed countries in the West, New Zealand has experienced a continuation of the long-term growth in the number and proportion of the employed population in the ‘white collar’ category and a corresponding decline in the proportions working in manual occupations.
Between the 1981 and 1986 censuses the major groups within the sedentary sector—‘professional, technical’; ‘administrative, management’; ‘clerical’ and ‘service workers’—showed increases in their percentage shares of the gainfully employed population. Only ‘sales workers’ showed a decline in percentage distribution terms during the intercensal period. The fastest growing major group was that of ‘administrative, management’, which increased from 3.4 percent of the total at the 1981 census to 5.0 percent at the 1986 census (see table 12.6). In contrast, the major group of ‘production workers, transport, equipment operators and labourers’ experienced a fall in its share of the employed during 1981–86 from 33.6 percent to 30.9 percent. Also, agricultural and related occupations declined as a percentage of the employed.
Table 12.6. OCCUPATIONAL STRUCTURE OF THE LABOUR FORCE*
| Occupation major group | 1981 census | 1986 census | Percentage intercensal change | ||
|---|---|---|---|---|---|
| Number | Percentage distribution† | Number | Percentage distribution† | ||
* Persons aged 15 years and over resident in New Zealand working one or more hours per week. Excludes those unemployed and seeking work. Calculated on adequately defined cases only. | |||||
| Professional, technical | 203,511 | 14.6 | 224,934 | 15.1 | 10.5 |
| Administrative, management | 46,674 | 3.4 | 74,070 | 5.0 | 58.7 |
| Clerical | 235,854 | 16.9 | 262,113 | 17.6 | 11.1 |
| Sales workers | 147,378 | 10.6 | 152,130 | 10.2 | 3.2 |
| Service workers | 137,358 | 9.9 | 149,805 | 10.1 | 9.1 |
| Agricultural, animal husbandry and forestry workers, fishermen and hunters | 154 515 | 11.1 | 162 519 | 10.9 | 5.2 |
| Production workers, transport, equipment operators and labourers | 467 805 | 33.6 | 460 134 | 30.9 | −1.6 |
| Not adequately defined | 10 143 | … | 13 713 | … | 35.2 |
| Total | 1 403 238 | 100.0 | 1 499 421 | 100.0 | 6.9 |
There are large variations in the occupational distributions of the male and female employed populations at the 1986 census. These differences become even greater when employees are further classified by full-time and part-time status. Table 12.7 shows the employed population aged 15 years and over resident in New Zealand at the 1986 census, by the above variables.
Table 12.7. LABOUR FORCE BY OCCUPATION, WORK STATUS AND SEX, 1986 CENSUS*
| Occupation major group | Full-time† | Part-time‡ | Full-time as percentage of total | ||
|---|---|---|---|---|---|
| Number | Percentage of total§ | Number | Percentage of total§ | ||
* Population usually resident in New Zealand aged 15 years and over. †Persons working 30 or more hours per week. Excludes those unemployed and seeking full-time work. ‡Persons working 1–29 hours per week. Excludes those unemployed and seeking part-time work. §Calculated on adequately defined cases only. | |||||
| Professional, technical | |||||
| Male | 110,592 | 13.3 | 5,325 | 11.1 | 95.4 |
| Female | 79,881 | 18.3 | 29,136 | 17.0 | 73.3 |
| Administrative, management | |||||
| Male | 59,889 | 7.2 | 1,185 | 2.5 | 98.1 |
| Female | 10,377 | 2.4 | 2,622 | 1.5 | 79.8 |
| Clerical | |||||
| Male | 64,635 | 7.8 | 2,571 | 5.3 | 96,2 |
| Female | 151,005 | 34.8 | 43,905 | 25.6 | 77.5 |
| Sales workers | |||||
| Male | 74,313 | 8.9 | 6,471 | 13.5 | 92.0 |
| Female | 47,412 | 10.9 | 23,934 | 14.0 | 66.5 |
| Service workers | |||||
| Male | 49,623 | 6.0 | 5,640 | 11.7 | 89.8 |
| Female | 50,916 | 11.7 | 43,623 | 25.5 | 53.9 |
| Agricultural, animal husbandry and forestry workers, fishermen and hunters | |||||
| Male | 109,329 | 13.1 | 7,725 | 16.1 | 93.4 |
| Female | 30,702 | 7.1 | 14,760 | 8.6 | 67.5 |
| Production, transport equipment operators and labourers | |||||
| Male | 364,578 | 43.8 | 19,176 | 39.9 | 95.0 |
| Female | 63,177 | 14.6 | 13,203 | 7.7 | 82.7 |
| Not adequately defined | |||||
| Male | 8,376 | … | 900 | … | 90.3 |
| Female | 3 399 | … | 1 041 | … | 76.6 |
| Total male | 841 335 | 100.0 | 48 996 | 100.0 | 94.5 |
| Total female | 436 866 | 100.0 | 172 221 | 100.0 | 71.7 |
Apprenticeship. Each year around 8000 apprentices begin contracts in the 36 industries with organised trade training. Typically contracts last for 8000 or 9000 working hours (four or four-and-a-half years), although the trend is towards shorter training periods. Training is essentially carried out on the job, but is usually augmented by technical institute courses.
New Zealand apprenticeship committees, which are tripartite in constitution, are established for each industry. They ensure that training patterns and conditions of employment for apprentices are appropriate and allow apprentices to learn the trade skills needed in that industry. At the local level, a network of industry-based local committees exist to promote apprenticeship training and assist apprentices and employers with any difficulties that may arise.
Over recent years there have been a number of government initiatives to reform trade training. To assist industries with the reform process various financial incentives are offered. A number of full-time trade training courses have also been piloted in technical institutes. See also section 9.3, Tertiary and continuing education.
Table 12.8. APPRENTICESHIP CONTRACTS IN SELECTED INDUSTRIES*
| Industry | Contracts begun during year | Completed during year | Total in force |
|---|---|---|---|
* At 31 March 1987. Source: Department of Labour. | |||
| Carpentry | 927 | 629 | 3,340 |
| Electrical | 730 | 449 | 2,451 |
| Engineering | 719 | 708 | 3,037 |
| Hairdressing | 918 | 416 | 2,341 |
| Motor | 950 | 773 | 3,798 |
| Plumbing | 307 | 186 | 1,043 |
| Printing | 273 | 172 | 920 |
Vocational Training Council. The promotion of systematic training within New Zealand on a national basis is the responsibility of the Vocational Training Council (VTC). The council has members representing employer, employee, and educational groups. Two members represent the interests of women in the workforce and one represents the interests of Maori and Pacific Island people. The Vocational Training Council Act 1982 describes the council's function as to advise the Government, government departments, industry, commerce, agriculture, social welfare, and other interested organisations. The objectives of the council are to:
Co-ordinate industry training boards;
Identify the requirements for skills;
Conduct research on vocational training; and
Collect and disseminate information on vocational training and recent developments.
Recommendations may relate to improved training or facilities, co-ordination of training schemes, finance scholarships, research, inquiries and investigations, and information services.
The council is involved in the promotion of integrated training in most industries and local authorities. It encourages a systematic approach to training throughout the economy, linked to personal development. Representative industry training boards have been established for 29 industries. Boards include members from employer, employee, educational and other specialist groups. A major incentive has been an annual government grant to encourage the appointment of executive training officers to work for industry training boards, and 72 such positions have been established. Industry training boards examine existing training and assess the need for revised or new schemes within their particular industry.
The council has concerned itself with ‘back-up’ research and investigation and with promoting training programmes for particular groups within the community through advisory committees and researchers. Areas covered include: women and employment; apprenticeship and trade training; management and supervisory training; Polynesians in the workforce; and training in the field of information technology.
The council has specialist staff to assist industry with training needs, objectives for on-the-job training and training packages. The council also has regional advisers based in three centres.
There are three main sources of unemployment data in New Zealand:
The Department of Statistics' Household Labour Force Survey (which produces quarterly unemployment estimates based on a sample of around 12 000 households);
The Department of Statistics' five-yearly Census of Population and Dwellings (which asks everyone aged 15 years and over whether they are unemployed and seeking work); and
The Department of Labour unemployment register (which is a monthly listing of jobless people who have registered with Employment New Zealand in search of full-time work).
Unfortunately, although they all use the term ‘unemployment’, these measures do not always count the same people, as they have different scope, definitions and collection methods. Table 12.9 shows how the measures can differ—though these differences are not constant, as the number of registered unemployed fluctuates monthly, while the survey estimate is averaged over three months. This can sometimes result in the monthly registered unemployment rate exceeding the Household Labour Force Survey's quarterly average unemployment rate.
Table 12.9. VARYING UNEMPLOYMENT STATISTICS IN NEW ZEALAND
| Data source | Collection period | Number unemployed | Unemployment rate |
|---|---|---|---|
| * Estimate averaged over a three-month period. | |||
| percent | |||
| Census of Population and Dwellings | 4 March 1986 | 108,764 | 6.8 |
| Household Labour Force Survey | January–March 1986* | 67,600 | 4.2 |
| Registered as unemployed | 27 March 1986 | 54,180 | 4.1 |
The five-yearly census has the broadest definition of unemployment, counting everyone who said they were both unemployed and ‘actively’ seeking full-time or part-time work in the past four weeks. The Department of Labour on the other hand, has a very narrow scope, counting only those who want full-time work and have taken the step of registering with the department.
Between these two is the Household Labour Force Survey (HLFS), which provides an internationally-recognised measure of unemployment in New Zealand. Like its counterparts overseas, it follows International Labour Organisation (ILO) guidelines. It counts only those jobless who were available to start work in the previous week, and had ‘actively’ sought work in the past month, or were already waiting to start a job within the following four weeks.
UNEMPLOYMENT—registered unemployed including vacation workers
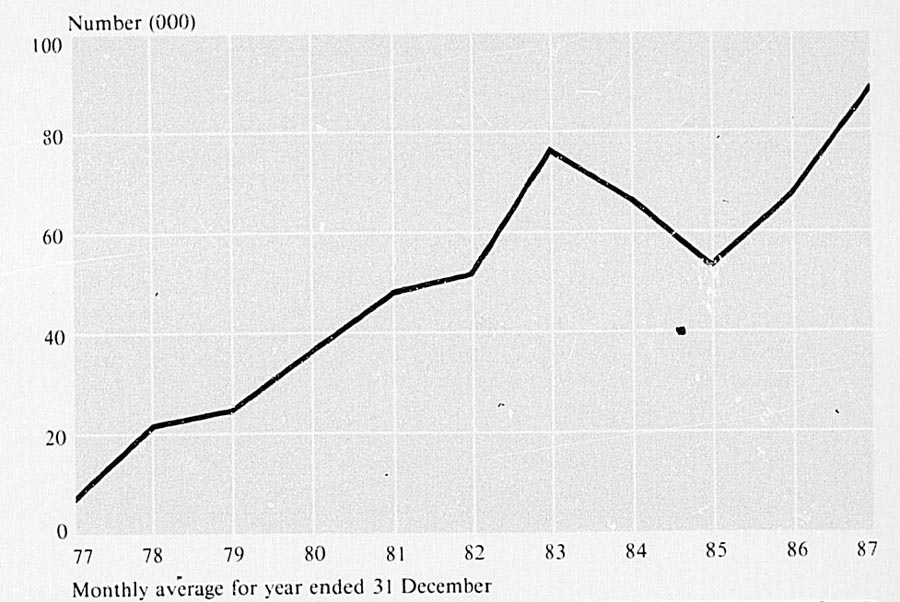
None of these measures give the complete picture of the numbers out of work and wanting a job. The Department of Labour for example, does not count jobless people who are unregistered or registered job-seekers who only want part-time work. Meanwhile, the census and the Household Labour Force Survey exclude jobless people who did not take ‘active’ steps to find work in the past month, that is, those who only looked at newspaper advertisements and those who had given up hope of finding work. In addition, the Household Labour Force Survey also excludes active job-seekers who said they could not have taken up work the previous week. (In March 1986, for example, its estimate excluded some 53 600 jobless people who wanted work, on the grounds that they were not actively job-hunting or were unavailable for work the previous week.)
A major disadvantage of the population census as an indicator of the trends in unemployment is that it provides data at five-yearly intervals only. Also, unemployment figures from successive censuses are not strictly comparable because of changes in definitions and coverage of the full- and part-time labour forces, and the working-age population.
Table 12.10 shows trends in the number of males and females employed and unemployed during the period 1951–86.
Table 12.10. UNEMPLOYMENT 1951–86*
| Census date | Unemployed and seeking work | Total labour force | ||
|---|---|---|---|---|
| Males | Female | Males | Female | |
* All persons aged 15 years and over in the total labour force or unemployed and seeking work. † All persons aged 15 years and over in the full-time labour force or unemployed and seeking full-time work (including persons whose usual residence is overseas). ‡ Persons resident in New Zealand aged 15 years and over in the total labour force or unemployed and seeking work (excluding persons whose usual residence is overseas). | ||||
| 1951† | 7,902 | 1,726 | 568,963 | 171,533 |
| 1956† | 5,558 | 2,378 | 622,758 | 194,094 |
| 1961† | 4,674 | 2,224 | 670,506 | 224,857 |
| 1966 | 5,125 | 3,982 | 745,595 | 280,444 |
| 1971 | 8,757 | 7,411 | 784,969 | 333,866 |
| 1976 | 14,392 | 11,945 | 865,098 | 407,235 |
| 1981‡ | 34,482 | 25,776 | 896,616 | 550,863 |
| 1986‡ | 48 279x | 60 912x | 938 610x | 670 002x |
At the 1986 Census of Population and Dwellings, and using the census definition of ‘unemployed’ (those stating they are unemployed and actively seeking full- or part-time work), a provisional total of 109 191 persons—comprising 48 279 males and 60 912 females—were unemployed. This number was 6.8 percent of the total labour force, while that for males was 5.1 percent and that for females 9.1 percent of the male and female labour forces respectively.
A breakdown by ethnic origin reveals that there were 25 386 New Zealand Maori unemployed, representing 14.9 percent of the Maori labour force.
The corresponding figure for Pacific Island Polynesians was 5334 (11.7 percent of the Pacific Island Polynesian labour force). Unemployed ‘Europeans and others’ numbered 77 817 or only 5.6 percent of this ethnic category of the labour force. Table 12.11 shows the numbers and percentages of unemployed in the labour force by major ethnic group and age. Both New Zealand Maori and Pacific Island Polynesians have proportionately much higher levels of unemployment, especially at the youngest ages. This problem is closely related to the educational qualifications in these ethnic groups.
Table 12.11. ETHNIC ORIGIN AND AGE OF THE UNEMPLOYED, 1986 CENSUS*
| Age group (years) | New Zealand Maori† | Pacific Island Polynesian‡ | European and other§ | Not specified | Total | |||||
|---|---|---|---|---|---|---|---|---|---|---|
| Number unemployed | Percentage | Number unemployed | Percentage | Number unemployed | Percentage | Number unemployed | Percentage | Number unemployed | Percentage | |
* Population resident in New Zealand aged 15 years and over. † Persons of single origin or descent. ‡ Persons of single ethnic origin. § Total population excluding New Zealand Maoris, Pacific Island Polynesians and ethnic origin ‘not specified’. | ||||||||||
| 15–17 | 6,144 | 36.9 | 963 | 38.5 | 18,255 | 24.4 | 114 | 23.9 | 25,476 | 27.0 |
| 18–19 | 3,090 | 21.9 | 612 | 19.5 | 7,902 | 10.4 | 60 | 11.9 | 11,664 | 12.4 |
| 20–24 | 6,021 | 18.1 | 1,002 | 12.7 | 13,887 | 7.3 | 120 | 9.8 | 21,030 | 9.0 |
| 25–34 | 5,886 | 12.5 | 1,467 | 10.0 | 16,131 | 4.7 | 156 | 7.7 | 23,640 | 5.8 |
| 35–44 | 2,394 | 7.9 | 735 | 7.0 | 10,455 | 3.2 | 81 | 5.3 | 13,665 | 3.7 |
| 45–54 | 1,296 | 6.5 | 411 | 8.8 | 6,180 | 2.7 | 51 | 3.8 | 7,938 | 3.1 |
| 55–59 | 357 | 6.6 | 105 | 9.1 | 2,850 | 3.1 | 36 | 5.5 | 3,348 | 3.4 |
| 60–64 | 114 | 6.8 | 30 | 7.9 | 1,293 | 3.4 | 12 | 4.0 | 1,449 | 3.6 |
| 65 and over | 81 | 12.0 | 21 | 28.4 | 861 | 4.1 | 21 | 7.6 | 984 | 4.5 |
| Total | 25 386 | 14.9 | 5 334 | 11.7 | 77 817 | 5.6 | 654 | 7.8 | 109 191 | 6.8 |
In table 12.12 males and females unemployed and seeking work and belonging to the population resident in New Zealand are classified by highest school qualification category (both in absolute terms and as percentages of the labour force). This table indicates that the level of unemployment as a percentage of the labour force is related to highest school qualification. Also, irrespective of educational qualification, the percentages of females in the labour force unemployed are higher than for males.
Table 12.12. EDUCATIONAL QUALIFICATIONS AND SEX OF THE UNEMPLOYED, 1986 CENSUS*
| Highest school qualification | Males | Females | Males as percentage of total unemployed | ||
|---|---|---|---|---|---|
| Number† | Percentage | Number† | Percentage | ||
* Population resident in New Zealand aged 15 years and over. † Persons unemployed and seeking work.‡ Includes still at school. § Includes New Zealand or overseas qualifications which could not be defined as belonging to one of the previous categories. | |||||
| No school qualifications† | 26,949 | 6.1 | 29,523 | 10.9 | 47.7 |
| School Certificate, 1 or 2 passes | 4,488 | 4.9 | 7,053 | 10.2 | 38.9 |
| School Certificate, 3 or more passes | 4,761 | 3.9 | 7,629 | 7.3 | 38.4 |
| Sixth Form Certificate, Endorsed School Certificate | 2,010 | 3.5 | 3,699 | 6.8 | 35.2 |
| University Entrance, Matriculation | 3,771 | 3.7 | 6,042 | 6.5 | 38.4 |
| Higher School Certificate, Higher Leaving Certificate | 1,839 | 3.5 | 2,214 | 7.2 | 45.4 |
| University Bursary, Scholarship | 3,258 | 7.1 | 2,937 | 11.1 | 52.6 |
| Other§ | 243 | 3.5 | 729 | 8.0 | 25.0 |
| Not specified | 960 | 5.9 | 1 089 | 9.6 | 46.9 |
| Total | 48 279 | 5.1 | 60 912 | 9.1 | 44.2 |
Over recent years the Government has adopted an employment strategy that aims to address unemployment in several ways: firstly, through broader economic policies to promote economic growth; secondly, through improvements in labour market flexibility; and thirdly, through the provision of assistance to unemployed people, particularly those who are most disadvantaged in the labour market. The Government's approach has been based on the premise that a growth in the number of jobs is most likely through a more responsive and growing economy, rather than the creation of jobs through subsidies.
New Zealand Employment. Known until 1 October 1988 as the Employment and Vocational Guidance Service, this division of the Department of Labour provides a vacancy listing and job-seeker referral service to employers, maintains a register of the unemployed, and provides occupational information, job vacancy information, and referral and placement assistance to job-seekers. Vocational guidance counsellors provide counselling and career information to people of all ages and backgrounds.
Employment and training programmes. The Department of Labour administers a number of programmes that offer training opportunities to the unemployed and assist disadvantaged job-seekers to obtain suitable employment.
Access training—The Access training and transition education programme is to provide training opportunities for unemployed people. It provides technical institute, community-based and work-based vocational training courses. Access is targeted at disadvantaged unemployed people in general, and at young school leavers and people with a history of unemployment in particular. Job-seekers do not need to be registered with the Department of Labour to be eligible.
Access is managed by a network of regional employment and access councils (REACS) which work to ensure that the training provided through the programme is matched to the needs of local labour markets. A separate but complementary Maori delivery system has been established which will provide approximately 20 percent of Access training.
Job Opportunities Scheme—The Job Opportunities Scheme is the primary employment assistance programme. It has four options. The most used option of the scheme provides a partial wage subsidy for six months to employers who employ a job-seeker who has been registered as unemployed for at least 10 weeks. A second option offers a higher level of financial assistance to employers who take on a more severely disadvantaged job-seeker. Two further options provide partial subsidies to unemployed people wishing to move towards self-sufficiency in employment by establishing their own business or group enterprise.
Group Employment Liaison Service—The Group Employment Liaison Service works with groups of disadvantaged unemployed people to help them liaise with government departments to make better use of employment and training programmes. A network of 25 fieldworkers has been established to provide this liaison and advisory service through the offices of the Department of Labour.
Small Co-operative Enterprises Scheme—The Department of Internal Affairs funds and operates this scheme, which provides advisory and financial assistance to disadvantaged people who are unemployed and wish to set up small-scale co-operative business ventures. Finance is available in the form of grants and loans for feasibility studies, working capital, equipment and the purchase of specialist skills.
Work Development Scheme—Also offered by the Department of Internal Affairs, this scheme provides advice, support and finance to community-based projects which are working to improve the skills and employment opportunities of disadvantaged young people.
Mobility assistance. To encourage the mobility of job-seekers, and in recognition of increasing differences in regional unemployment rates, a distance job search grant of up to $1,000 is available to qualifying registered unemployed job-seekers to help them investigate job opportunities, housing, schooling and other matters in a new location. A mobility grant of up to $2,000 is also available to qualifying job-seekers who are moving to take up a confirmed job offer, where a change of accommodation is involved.
MANA Enterprises—This scheme (formerly the Maori Enterprise Development Scheme) assists Maori individuals, organisations and communities to create long-term employment opportunities through the development of viable, unsubsidised Maori enterprises. Grants, loans and loan guarantees are available for enterprises which aim to strengthen the Maori economic base. MANA Enterprises is administered by the Board of Maori Affairs, and funds are distributed through a network of tribal and regional authorities.
The Pacific Island Employment Development Scheme—This scheme aims to strengthen the economic base of New Zealand's Pacific Island community and to improve employment opportunities for Pacific Islanders by assisting them to develop skills and establish viable business enterprises. Grants and loans are disbursed by the Pacific Island Employment Development Board.
Community Employment Investigation Scheme—Introduced in 1987, this scheme is designed to assist unemployed people in areas suffering from rapid and significant job loss to explore options for alternative employment within their region. Funding of up to 90 percent of costs is available to individuals and groups to investigate new employment and business proposals which would increase their chances of obtaining unsubsidised employment. The scheme was introduced initially in the Gisborne and Northland (excluding Whangarei) employment districts.
In table 12.13 the usually resident New Zealand labour force is described by income group and classified by employment status at the 1986 Census of Population and Dwellings. Comparable figures from the 1981 census cannot be provided for trend analysis because of the definitional changes relating to the labour force between the 1981 and 1986 censuses discussed above.
At the 1986 census the median income groups for males were higher than for females in all employment status groups and, consequently, for the total labour force. Although the differences between the male and female median income groups varied according to employment status, the median income group for males was $15,000–$20,000, one group higher than for females ($10,000–$15,000) in the total labour force.
Table 12.13. INCOME BY EMPLOYMENT STATUS, 1986 CENSUS*
| Income group and sex | Employer of others in own business | Self-employed and not employing others | Wage or salary earner | Unemployed and seeking work | Other† | Total |
|---|---|---|---|---|---|---|
* Population resident in New Zealand aged 15 years and over and working one or more hours per week or unemployed and seeking work. † Includes unpaid workers in family businesses. ‡ Includes nil or less. | ||||||
| $ | ||||||
| 2,500 or less‡ | ||||||
| Male | 2,505 | 5,508 | 14,640 | 14,016 | 2,202 | 38,880 |
| Female | 1,188 | 4,368 | 38,886 | 24,879 | 6,150 | 75,474 |
| 2,501–5,000 | ||||||
| Male | 1,107 | 3,579 | 10,611 | 7,524 | 414 | 23,232 |
| Female | 1,266 | 4,230 | 44,994 | 8,337 | 1,707 | 60,537 |
| 5,001–7,500 | ||||||
| Male | 2,400 | 6,867 | 23,370 | 9,471 | 822 | 42,930 |
| Female | 2,391 | 5,298 | 61,983 | 8,244 | 1,671 | 79,587 |
| 7,501–10,000 | ||||||
| Male | 3,927 | 10,167 | 44,610 | 4,866 | 732 | 64,299 |
| Female | 2,889 | 5,298 | 75,786 | 6,114 | 1,236 | 91,320 |
| 10,001–15,000 | ||||||
| Male | 11,643 | 24,009 | 144,906 | 5,766 | 1,383 | 187,716 |
| Female | 5,754 | 7,896 | 140,274 | 4,404 | 1,371 | 159,696 |
| 15,001–20,000 | ||||||
| Male | 12,318 | 20,451 | 159,831 | 1,386 | 900 | 194,886 |
| Female | 3,705 | 3,810 | 96,873 | 648 | 579 | 105,609 |
| 20,001–25,000 | ||||||
| Male | 11,154 | 13,530 | 122,112 | 528 | 552 | 147,870 |
| Female | 2,433 | 2,061 | 40,980 | 177 | 279 | 45,936 |
| 25,001–30,000 | ||||||
| Male | 8,970 | 8,247 | 78,420 | 258 | 357 | 96,252 |
| Female | 1,656 | 1,092 | 14,472 | 63 | 120 | 17,403 |
| 30,001–40,000 | ||||||
| Male | 10,752 | 6,906 | 56,919 | 180 | 321 | 75,078 |
| Female | 1,494 | 927 | 5,607 | 27 | 120 | 8,181 |
| 40,001 and over | ||||||
| Male | 16,326 | 5,844 | 22,617 | 78 | 315 | 45,174 |
| Female | 1,329 | 756 | 1,137 | 21 | 159 | 3,405 |
| Not specified | ||||||
| Male | 2,823 | 4,575 | 9,936 | 4,197 | 765 | 22,293 |
| Female | 1 293 | 2 262 | 8 520 | 7 995 | 2 775 | 22 848 |
| Total, males | 83 925 | 109 683 | 687 975 | 48 276 | 8 748 | 938 610 |
| Total, females | 25 401 | 38 004 | 529 515 | 60 915 | 16 167 | 670 002 |
These disparities in median income between males and females are also present in the statistics on income groups by work status, i.e., both full-time and part-time in the labour force. It is only in the ‘not working’ category that both sexes belong to the same median income group.
Table 12.14 shows the number of males and females at the 1986 census belonging to each income group in the three work status categories. Sex differentials by median income group in the labour force, both by employment and work status, are mainly caused by the different occupational and industry mixes of males and females. Equal pay legislation has helped to reduce the differences between the median incomes of those working in the same occupation or industry groups.
Table 12.14. INCOME BY WORK STATUS, 1986 CENSUS*
| Income group and sex | Full-time in labour force† | Part-time in labour force‡ | Not working | Total |
|---|---|---|---|---|
* Population resident in New Zealand aged 15 years and over. † Persons working 30 or more hours a week, plus persons unemployed and seeking full-time work. ‡ Persons working 1–29 hours, plus persons unemployed and seeking part-time work. §Includes nil or less. | ||||
| $ | ||||
| 2,500 or less§ | ||||
| Male | 24,807 | 14,070 | 50,538 | 89,418 |
| Female | 26,172 | 49,308 | 162,327 | 237,801 |
| 2,501–5,000 | ||||
| Male | 17,934 | 5,301 | 15,258 | 38,490 |
| Female | 21,375 | 39,165 | 38,784 | 99,324 |
| 5,001–7,500 | ||||
| Male | 36,777 | 6,150 | 83,712 | 126,642 |
| Female | 39,036 | 40,551 | 161,772 | 241,359 |
| 7,501–10,000 | ||||
| Male | 58,398 | 5,904 | 35,379 | 99,678 |
| Female | 62,613 | 28,710 | 79,308 | 170,631 |
| 10,001–15,000 | ||||
| Male | 176,673 | 11,040 | 35,892 | 223,608 |
| Female | 133,665 | 26,034 | 53,811 | 213,510 |
| 15,001–20,000 | ||||
| Male | 187,563 | 7,329 | 14,247 | 209,133 |
| Female | 98,172 | 7,440 | 12,972 | 118,587 |
| 20,001–25,000 | ||||
| Male | 143,604 | 4,269 | 6,750 | 154,623 |
| Female | 42,666 | 3,270 | 5,472 | 51,408 |
| 25,001–30,000 | ||||
| Male | 93,825 | 2,427 | 3,183 | 99,435 |
| Female | 15,954 | 1,449 | 2,382 | 19,788 |
| 30,001–40,000 | ||||
| Male | 73,557 | 1,521 | 2,412 | 77,484 |
| Female | 7,296 | 885 | 1,923 | 10,107 |
| 40,001 and over | ||||
| Male | 44,016 | 1,164 | 1,581 | 46,752 |
| Female | 2,832 | 570 | 1,242 | 4,650 |
| Not specified | ||||
| Male | 19,869 | 2,424 | 22,833 | 45,126 |
| Female | 14 118 | 8 727 | 67 905 | 90 750 |
| Total, males | 877 014 | 61 596 | 271 782 | 1 210 392 |
| Total, females | 463 899 | 206 103 | 587 910 | 1 257 909 |
The Department of Labour (Department of Statistics from February 1989) carries out an annual employment survey in February and quarterly sample surveys in May, August and November. For these surveys returns are required from all establishments in which at least two people are employed (on a full-time equivalent basis). This includes working proprietors. Government and local authority employment is included, but not farming, hunting, fishing, waterfront and seagoing work, or domestic service in private households. The armed forces are also excluded.
Table 12.15 shows the average weekly payout per person (covering males and females, adults and juveniles) derived from these surveys during recent years. Table 12.16 shows average hourly and weekly wage rates by sector.
Table 12.15. WEEKLY EARNINGS
| Date of survey | Weekly wage payout per person* | |
|---|---|---|
| Average total weekly earnings—all persons | Average ordinary time weekly earnings | |
* Including allowances and special payments (bonuses, penal and shift allowances, paid leave, and commission). Source: Department of Labour. | ||
| $ | $ | |
| 1985—Feb | 322.90 | 296.74 |
| May | 335.88 | 309.00 |
| Aug | 335.16 | 311.29 |
| Nov | 347.52 | 320.89 |
| 1986—Feb | 373.89 | 346.67 |
| May | 400.28 | 371.27 |
| Aug | 404.85 | 378.93 |
| Nov | 411.71 | 383.43 |
| 1987—Feb | 427.46 | 396.92 |
| May | 437.19 | 407.29 |
| Aug | 446.16 | 417.17 |
| Nov | 456.08 | 424.93 |
Table 12.16. AVERAGE HOURLY AND WEEKLY WAGE RATES, NOVEMBER 1987
| Private sector | Government sector | Government corporation sector | Local authority sector | All sectors | |
|---|---|---|---|---|---|
Source: Department of Labour. | |||||
| Hourly earnings— | $ | ||||
| Males | 11.70 | 14.02 | 17.25 | 14.70 | 12.60 |
| Females | 9.16 | 10.65 | 10.99 | 13.05 | 10.25 |
| All persons | 10.69 | 12.77 | 14.50 | 13.82 | 11.61 |
| Weekly earnings— | |||||
| Males | 431.78 | 542.50 | 667.07 | 559.01 | 470.80 |
| Females | 318.08 | 410.95 | 416.31 | 472.38 | 364.46 |
| All persons | 384.70 | 493.61 | 555.56 | 511.75 | 424.93 |
Real disposable income indexes and related series measure the impact of changes in incomes, taxation and consumer prices on the purchasing power of selected groups of individuals and households within the New Zealand population. They are therefore important economic indicators.
The real disposable income series are produced by the Department of Statistics. Information on individual incomes and other tax-related characteristics (e.g., number of dependent children) is obtained from a representative sample of New Zealand private households who participated in the department's Household Expenditure and Income Survey.
To calculate the series for any particular quarter, incomes, government benefits and tax-related expenditures are projected to equivalent current levels and the appropriate tax scales applied to estimate and deduct income tax liability. The net incomes are then adjusted for inflation as measured by the Consumers Price Index (CPI), giving a measure of changes in the purchasing power of the group concerned over time.
In addition to the overall real disposable income series, the following component series are published:
Average Gross Income Indexes—measuring the changing level of gross income from all sources.
Average Tax Rates—expressing total personal income tax liability as a proportion of total gross income.
These series are calculated for individual full-time wage and salary earners (defined as persons working at least 30 hours per week for wages and/or salaries as the principal source of income). Series are also calculated for the households of full-time wage and salary earners and for national superannuation payments.
For individual full-time wage and salary earners only, separate series are produced for the highest 20 percent of earners, the second highest 20 percent and so on down to the lowest 20 percent. Only series for the highest, middle and lowest income groups are shown in the following tables and graph. The estimated annual gross income ranges for the December 1987 quarter are specified below.
| Highest 20 percent | $33,700 and over |
| Second highest 20 percent | $26,300 and under $33,700 |
| Middle 20 percent | $20,800 and under $26,300 |
| Second lowest 20 percent | $15,700 and under $20,800 |
| Lowest 20 percent | below $15,700 |
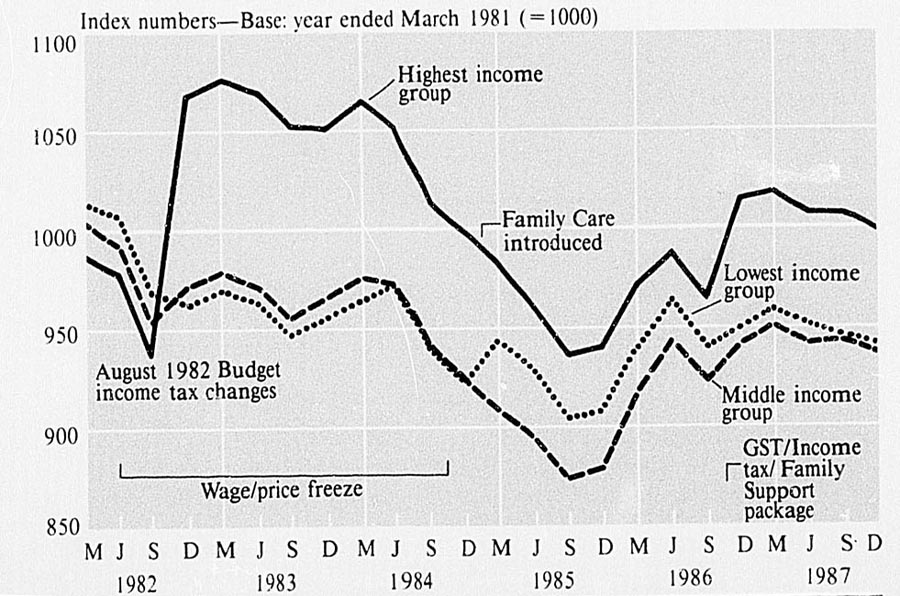
REAL DISPOSABLE INCOME INDEXES—full-time wage and salary earners
The income ranges relating to the five income groups vary from quarter to quarter. The individuals falling into each group may also change due to differing wage increases between industries and, occasionally, due to changes in government benefit schemes.
Trends in the Real Disposable Income Indexes for full-time wage and salary earners are illustrated in the graph and some significant economic events, which influenced the results, are marked.
The effects of the introduction of GST and the associated income taxation package, including the Family Support scheme, are reflected in the series for the first time in the December 1986 quarter. Family Care, a social welfare benefit, added to the income of recipients whilst Family Support, which replaced it, reduced income tax. As Family Support is divided equally between spouses, the series for individual full-time wage and salary earners do not reflect the full effects of the scheme on families.
Table 12.17. REAL DISPOSABLE INCOME INDEXES AND RELATED MEASURES FOR FULL-TIME WAGE AND SALARY EARNERS*
| Calendar quarter | Lowest 20 percent | Middle 20 percent | Highest 20 percent | All full-time wage and salary earners | ||||
|---|---|---|---|---|---|---|---|---|
| Index number | Percentage change from same quarter previous year | Index number | Percentage change from same quarter previous year | Index number | Percentage change from same quarter previous year | Index number | Percentage change from same quarter previous year | |
* Persons working 30 or more hours per week for wages and/or salaries as the principal source of income. Base: Year ended 31 March 1981 (=1000). † To calculate these indexes gross incomes are first adjusted for income tax liability and then for inflation as measured by the Consumers Price Index. The series therefore measure quarterly changes in the after-tax purchasing power of gross incomes. ‡ Measure the changing level of gross income from all sources. §For each group of taxpayers, total personal income tax liability is expressed as a proportion of total gross income from all sources. | ||||||||
| Real Disposable Income Indexes† | ||||||||
| 1984—Dec | 924 | −3.4 | 924 | −4.4 | 999 | −5.0 | 953 | −4.4 |
| 1985—Mar | 946 | −2.1 | 911 | −6.8 | 984 | −7.7 | 945 | −6.4 |
| Jun | 930 | −4.4 | 896 | −8.0 | 961 | −8.7 | 926 | −7.8 |
| Sep | 906 | −3.8 | 876 | −7.1 | 938 | −7.7 | 905 | −6.8 |
| Dec | 910 | −1.5 | 881 | −4.7 | 942 | −5.7 | 909 | −4.6 |
| 1986—Mar | 940 | −0.6 | 918 | 0.8 | 972 | −1.2 | 943 | −0.2 |
| Jun | 965 | 3.8 | 945 | 5.5 | 989 | 2.9 | 966 | 4.3 |
| Sep | 941 | 3.9 | 925 | 5.6 | 966 | 3.0 | 944 | 4.3 |
| Dec | 951x | 4.5x | 943 | 7.0 | 1015x | 7.7x | 970 | 6.7 |
| 1987—Mar | 960 | 2.1 | 952 | 3.7 | 1019 | 4.8 | 978 | 3.7 |
| Jun | 952 | −1.3 | 943 | −0.2 | 1008 | 1.9 | 969 | 0.3 |
| Sep | 947 | 0.6 | 944 | 2.1 | 1008 | 4.3 | 968 | 2.5 |
| Dec | 942 | −0.9 | 938 | −0.5 | 1000 | −1.5 | 962 | −0.8 |
| Average Gross Income Indexes‡ | ||||||||
| 1984—Dec | 1464 | 6.6 | 1458 | 5.7 | 1459 | 5.0 | 1460 | 5.6 |
| 1985—Mar | 1552 | 10.5 | 1526 | 8.1 | 1531 | 7.4 | 1532 | 8.0 |
| Jun | 1613 | 11.2 | 1591 | 10.3 | 1602 | 11.3 | 1599 | 10.7 |
| Sep | 1616 | 11.8 | 1599 | 11.3 | 1610 | 12.5 | 1606 | 11.8 |
| Dec | 1668 | 13.9 | 1655 | 13.5 | 1669 | 14.4 | 1663 | 13.9 |
| 1986—Mar | 1784 | 14.9 | 1781 | 16.7 | 1802 | 17.7 | 1790 | 16.8 |
| Jun | 1905 | 18.1 | 1895 | 19.1 | 1925 | 20.2 | 1909 | 19.4 |
| Sep | 1919 | 18.8 | 1918 | 19.9 | 1952 | 21.2 | 1932 | 20.3 |
| Dec | 1951 | 17.0 | 1955 | 18.1 | 1996x | 19.6x | 1970 | 18.5 |
| 1987—Mar | 2032 | 13.9 | 2030 | 14.0 | 2070 | 14.9 | 2046 | 14.3 |
| Jun | 2085 | 9.4 | 2083 | 9.9 | 2131 | 10.7 | 2103 | 10.2 |
| Sep | 2111 | 10.0 | 2122 | 10.6 | 2176 | 11.5 | 2140 | 10.8 |
| Dec | 2151 | 10.3 | 2159 | 10.4 | 2213 | 10.9 | 2179 | 10.6 |
| Average tax rates (percent) | ||||||||
| 1984—Dec | 16.4 | 24.3 | 31.5 | 26.4 | ||||
| 1985—Mar | 15.7 | 25.6 | 32.9 | 27.4 | ||||
| Average tax rates above and below this line relate to different data base samples and the series is therefore discontinuous at this point. | ||||||||
| 1985—Mar | 17.4 | 25.1 | 31.8 | 26.7 | ||||
| Jun | 17.9 | 25.7 | 33.2 | 27.6 | ||||
| Sep | 17.9 | 25.8 | 33.3 | 27.7 | ||||
| Dec | 18.3 | 26.2 | 34.0 | 28.2 | ||||
| 1986—Mar | 19.3 | 26.9 | 35.4 | 29.3 | ||||
| Jun | 20.3 | 27.4 | 36.8 | 30.2 | ||||
| Sep | 20.3 | 27.4 | 37.1 | 30.3 | ||||
| Dec | 13.7 | 20.9 | 29.6 | 23.6 | ||||
| 1987—Mar | 14.4 | 21.4 | 30.3 | 24.1 | ||||
| Average tax rates above and below this line relate to different data base samples and the series is therefore discontinuous at this point. | ||||||||
| 1987—Mar | 14.5 | 21.4 | 30.2 | 24.0 | ||||
| Jun | 14.6 | 21.6 | 30.7 | 24.3 | ||||
| Sep | 14.8 | 21.8 | 31.1 | 24.6 | ||||
| Dec | 15.1 | 22.0 | 31.4 | 24.9 | ||||
Prevailing Weekly Wage Rates Index. This index measures changes in ‘as paid’ wage and salary rates for full-time adult employees whose conditions of employment fall within the jurisdiction of the Arbitration Commission or other determining authorities. It is based on a quarterly survey of a representative sample of employers. Those pay rates actually being paid in the pay period in which the 15th day of the middle month of the quarter are surveyed. These may anticipate or follow award/agreement settlement and registration and may be at award or above-award levels. The index is not backdated for retrospective wage increases.
For the private sector, most managerial and many professional occupation groups are not included in the index because their remuneration rates are negotiated on an individual employee basis and are not subject to any award constraints. In the local authority and central government sectors persons employed at similar levels of skill and responsibility are generally included in the index although most senior executives, such as heads of departments and Cabinet ministers, are excluded. Across all sectors, separate indexes are available for specific industry and occupation groups. Industry groupings conform to the production groups of the New Zealand System of National Accounts, and the occupation groups to the New Zealand Standard Classification of Occupations. The representative sample of job descriptions and their index weights for some industries in the central government sector are being progressively revised to reflect the changes resulting from the restructing of government departments and the introduction of state-owned enterprises.
This index is suitable for, and extensively used in, labour-cost escalation clauses.
Nominal Weekly Wage Rates Index. This companion series measures changes in legal minimum or mandatory)' wages and salaries registered with the Arbitration Commission, or with other determining bodies, as at their legally effective dates.
The effects of awards and agreements are reflected in the Nominal Weekly Wage Rates Index for the first time when a copy of the relevant document has been received by the Department of Statistics. When an award change takes effect from a date in a quarter prior to the current quarter, all index numbers back to and including the effective quarter have to be revised. The backdating of changes in award rates is a very common practice, so considerable caution is required in the use of index numbers that have not been finalised, a process which generally takes up to two years.
Revision of the wage indexes. Both the Prevailing and Nominal Weekly Wages Rates Indexes were revised at the December 1985 quarter with a new expression base of 1000. The exercise included a thorough revision of the representative sample of job descriptions which comprise the regimen of the indexes (the list of occupations for which wage rates are surveyed). The ‘weight’, or relative importance, of each job description was determined using the latest available statistical data from a wide variety of sources.
Prior to this revision, part 1 of the indexes related to wage rates under the jurisdiction of the former Arbitration Court and part 2 to those under other determining authorities. As part of the revision, the coverage has been adjusted so that part 1 now reflects wage rate changes for the private and local authority sectors and part 2 those for the central government (state) sector. Only minor changes were needed to adjust the coverage to this new classification.
New series which measure wage-rate change in the private and local authority sectors separately are available from the December 1985 quarter.
Table 12.18. PREVAILING WEEKLY WAGE RATES INDEX* ALL (INDUSTRY OR OCCUPATION) GROUPS COMBINED
| Quarter | Part 1 analysis | Part 1† | Part 2† | Part 3 | |
|---|---|---|---|---|---|
| Private sector | Local authority sector | Private and local authority sectors combined | Government sector | All sectors combined | |
* Indexes measure changes in the level of prevailing (actual) rates of pay for full-time adult employees (those aged 20 years and over, working 30 or more hours per week). Base: December 1985 quarter (=1000). † Index movements for periods up to and including the December 1985 quarter are calculated from data relating to: Part 1: Wage and salary rates falling within the jurisdiction of the former Arbitration Court. Part 2: Wage and salary rates prescribed by other industrial tribunals or determining authorities. | |||||
| Indexes | |||||
| 1985—Dec | 1000 | 1000 | 1000 | 1000 | 1000 |
| 1986—Mar | 1098 | 1089 | 1098 | 1064 | 1085 |
| Jun | 1127 | 1114 | 1126 | 1115 | 1122 |
| Sep | 1135 | 1127 | 1134 | 1161 | 1145 |
| Dec | 1142 | 1141 | 1141 | 1162 | 1150 |
| 1987—Mar | 1192 | 1151 | 1189 | 1166 | 1180 |
| Jun | 1209 | 1193 | 1208 | 1204 | 1206 |
| Sep | 1218 | 1236 | 1220 | 1251 | 1231 |
| Percentage change from same quarter previous year | |||||
| 1985—Dec | - | - | 12.5 | 16.4 | 13.8 |
| 1986—Mar | - | - | 17.7 | 15.3 | 16.8 |
| Jun | - | - | 17.0 | 19.7 | 17.9 |
| Sep | - | - | 17.2 | 24.6 | 19.8 |
| Dec | 14.2 | 14.1 | 14,1 | 16.2 | 15.0 |
| 1987—Mar | 8.6 | 5.7 | 8.3 | 9.6 | 8.8 |
| Jun | 7.3 | 7.1 | 7.3 | 8.0 | 7.5 |
| Sep | 7.3 | 9.7 | 7.6 | 7.8 | 7.5 |
For over 90 years the rules underlying the fixing of wages and conditions of work in New Zealand have been embodied in legislation. The Industrial Conciliation and Arbitration Act of 1894 was the first such statutory machinery for labour relations. Its objectives were to minimise the incidence of strikes and develop a system for the negotiation of wages and working conditions for the majority of the work-force.
Subsequent legislation covering the private sector has tended to follow these objectives. However, separate legislation and pay-fixing procedures existed for the public sector.
Recently, New Zealand's industrial relations system has been revised, and the Labour Relations Act 1987 came into effect in August 1987. It replaced the Industrial Relations Act 1973. The new provisions are described below.
The Government's objective in the legislation is to encourage the development of effective union and employer organisations, which can operate independently of legislative support, and can negotiate relevant awards and agreements that will be adhered to. A number of strategies have been adopted to achieve this objective. They include establishing the principle that each worker's employment should be regulated by a single, comprehensive agreement, which is freely negotiated, administered and enforced by the parties. Legislation relating to unions has been reformed to remove unnecessary restrictions on union activities, strengthen democracy and accountability in unions, provide greater opportunity for changes in union coverage, and increase substantially the minimum size required for union registration. Better union and employer negotiations have also been encouraged by removing unnecessary restrictions on the freedom of unions and employers to negotiate, strengthening the wage-fixing process, and providing clearer definitions of lawful and unlawful strikes and lockouts.
Private sector. Over half a million workers in the private sector have their wages and conditions set by negotiations between unions and employers under a framework set out in the Labour Relations Act 1987. The main features of this system are:
The establishment of union coverage over workers doing particular work;
The recognition by workers of the right of a union to negotiate wages and conditions of employment for the workers it covers;
Definition of the coverage of negotiations (i.e., which workers and which employers will be bound by the outcome):
The establishment of procedures to be followed by unions and employers in resolving their differences; and
Definition of the legal status of any agreement negotiated, together with the means of enforcing it.
The 1987 Act consolidated all previous private sector industrial relations legislation under one statute and introduced substantial reforms. It was the culmination of a lengthy consultative process carried out by the Government during 1985–86.
In particular, union structures were changed to make them stronger and more effective, independent and efficient. Unions have been encouraged to provide more services to their members. Other measures increase the level of internal union democracy and the accountability of union officials to their members.
Other major reforms included:
Increasing the minimum size for unions (from 10 to 1000 members):
Creating opportunities (for the first time since the 1894 Act) for established union coverage to be challenged and changed as registered unions seek to extend their coverage;
Abolishing the requirement for unions to be in either the same or a related industry as a basis for registration or amalgamation;
Abolishing the formal recognition of unregistered societies of workers—these groups must now choose between seeking registration as a union in their own right, joining with an already existing union, or operating alone outside the system;
Returning to provisions for obtaining a compulsory union membership clause, i.e., unions and employers negotiate such a clause in conciliation. Failing agreement on inclusion, a ballot is held of workers covered by the award in question;
Improving arrangements for the negotiation of awards and agreements so that settlements reached are adhered to;
Making provision that where a new matter occurs during the currency of an award or agreement, the Labour Court may allow it to be negotiated over separately. (A new matter is one significantly affecting the terms and conditions of employment of workers and which arose after the settlement of the award or agreement and is not dealt with properly in the award or agreement);
Amalgamating the former Industrial Conciliation Service and the Industrial Mediation Service into one mediation service;
Splitting of the former Arbitration Court's responsibilities by creating two separate institutions, the Arbitration Commission and the Labour Court;
Widening the definition of a personal grievance to include discrimination, duress, and sexual harassment as well as unjustifiable dismissal;
Redefining unlawful industrial action and abolishing penalties in favour of civil actions for an injunction or damages to be taken in the new Labour Court; and
No longer involving the Department of Labour factory inspectorate in enforcement of wages and conditions of work. This is carried out by unions instead. Authorised union representatives have been given rights of inspection of time and wage records, and the ability to take actions for breaches of awards and agreements and take recovery actions in respect of workers. However, factory inspectors continue to enforce statutory provisions.
The labour relations system operates within an institutional framework prescribed by the 1987 Act. There are three major institutions:
The Mediation Service—This consists of 13 mediators located in the four main centres and is headed by a Chief Mediator. The chief function of a mediator is to assist the parties in dispute to resolve differences. Mediators frequently chair conciliation councils and disputes and grievance committees.
The Arbitration Commission—This is a five-member body with a prime responsibility in wage fixing. The commission is empowered to negotiate awards and agreements, to hear and determine unresolved disputes of interest referred to it for arbitration, and to help settle disputes of interest.
The Labour Court—The Labour Court has jurisdiction to hear and determine a wide variety of matters, which include hearing of appeals, determining demarcation disputes, exemptions from awards and agreements, validity of awards and agreements, determining personal grievances, determining disputes over the Act and to order compliance with the Act or awards or agreements. See also section 10.1, Legal system.
The system of negotiations in New Zealand is based on the registration of unions under the Labour Relations Act 1987. Although registration is voluntary, in practice the vast majority of unions register because the benefits associated with registration outweigh the limitations imposed by it. The main benefits of registration are summarised below.
Both exclusive coverage of the workers covered by its membership rule and exclusive rights to negotiate on behalf of those workers are assured. A union's coverage is reinforced by access to procedures for securing a union membership clause in the awards and agreements it negotiates with employers.
There is access to conciliation procedures for the negotiation of an award, procedures to which employers are required to be a party. This, together with the definition of its coverage, reinforces the union's right to negotiate. However, it is not inevitable that an award will be made, as this finally is a matter for negotiation in conciliation proceedings.
There is an ability to negotiate an award which fixes minimum wages and conditions of employment across an entire industry, i.e., it binds every worker and every employer in the industry to which it relates, including any employer or worker who enters the industry subsequent to the award being made. A single award can thus apply in thousands of workplaces.
There is access to procedures for peacefully resolving disputes over the negotiation of awards and agreements (interest disputes) and over the treatment of individual workers (personal grievances). The procedures are supported by the Mediation Service, the Arbitration Commission and the Labour Court; and
The awards and collective agreements negotiated by the union are enforceable under the Act, and continue to have legal effect beyond their expiry.
In return for the benefits of registration unions have to comply with certain minimum requirements relating to their internal management.
The Labour Relations Act 1987 also provides for the registration of employer organisations. Compared to worker unions, however, the consequences of registration are vastly different. In particular, an employer organisation does not have the sole right to represent employers in the negotiation of wages and conditions of employment, nor does it have access to procedures for securing compulsory membership.
The main role of an employer organisation is to co-ordinate an industry's approach to the negotiation of the major awards.
There are two main categories of persons who fall outside the coverage of the formal system. First, persons who are not ‘employers’ or ‘workers’ in terms of prescribed definitions. These include the self-employed (such as working proprietors and independent contractors). Second, workers who for one reason or another are not unionised, are excluded from the formal system. Included here are approximately 300000 wage and salary earners employed in professional, technical, managerial and administrative occupations, and workers who earn above a salary bar (i.e., too much to be covered by the relevant award or agreement).
Public sector. State pay fixing has undergone major reforms with the introduction of the State Sector Act 1988. It has adopted the Labour Relations Act 1987 as the principal legislation relating to pay fixing and setting of conditions of employment. These major reforms include: procedures for wage fixing; procedures for negotiating conditions of employment; personal grievances; union registration and coverage; and compliance orders.
The State Sector Act 1988 does differ in some areas. The chief executive is the employer of the staff in his/her department; industrial negotiations are, however, carried out by the State Services Commission as the employer party, in consultation with the chief executive. The Act provides the option of compulsory arbitration in return for an agreement not to strike or lock out over matters in dispute. Future negotiations in the public sector will be on the basis of departmental claims or reviews rather than occupational class claims. See also section 3.3, State sector.
Union membership. All workers employed in a private-sector job must belong to the union covering that job if the award or agreement includes a compulsory membership clause.
Whether union membership is compulsory or voluntary is in the first instance a negotiable matter. Unions and employers have the chance to agree on voluntary or compulsory union membership when an award or agreement is being negotiated. If they cannot agree, union members covered by the award agreement are able to decide the matter by secret ballot.
No worker has to belong to the union before applying for or starting a job, but all workers required to must join within 14 days of being asked. Employers may legally dismiss workers for not joining.
Union membership is voluntary for:
Apprentices, and is forbidden in some cases;
‘Youth workers’ (i.e., persons under 18 years of age) unless they are earning the adult rate; and
Those earning above a ‘salary bar’ (i.e., people who earn too much to be covered by the relevant award or agreement).
Provision exists for exemption from compulsory union membership on the ground of proven conscientious objection. Application for exemption to the Union Membership Exemption Tribunal costs $110 (incl. GST). If exemption is granted, it is valid for life unless revoked by the tribunal.
Profile of workers' unions. By international standards, membership in unions in New Zealand is high. Of 1.1 million workers, approximately 680000 or 62 percent belong to unions.
At the end of 1986 (the latest figures available) 489763 private sector workers belonged to one of the 277 private sector unions, and 190000 public sector workers were in one of the 27 public sector unions, which are known as service organisations.
Unions in the private sector are primarily based on the occupation of workers rather than on the industry in which they are employed. Some unions cover occupations which extend across a large number of industries (e.g., clerical workers, drivers), whereas others are industry-specific (e.g., meat workers, seamen). The structure has evolved in an ad hoc way, in that groups which were first to ‘stake their claim’ at the registrar's office ‘took home the prize’. The occupational orientation of unions is reflected in the structure of negotiations, with the result that a particular employer can be covered by a multitude of awards and agreements.
Table 12.19. PROFILE OF WORKERS' UNIONS
| At 31 December | 1985 | 1986 |
|---|---|---|
| Source: Department of Labour. | ||
| Private sector— | ||
| Number of unions registered | 233 | 227 |
| Total membership | 490206 | 489763 |
| Average size | 2103 | 2157 |
| Percentage with more than 5000 members | 13.3 | 13.7 |
| Percentage of total membership | 71.7 | 71.6 |
| Percentage with 1000–5000 | 20.2 | 22.5 |
| Percentage of total membership | 19.7 | 20.7 |
| Percentage with less than 1000 members | 66.5 | 60.4 |
| Percentage of total membership | 8.6 | 7.7 |
| Public sector— | ||
| Number of service organisations | 27 | 27 |
| Total membership | 187800 | 190000 |
| Average size | 6955 | 7037 |
On average, public sector organisations are larger than their private sector counterparts. Several of these (e.g., the Post Office Union and the Public Service Association) have virtually industry coverage, though others cover specific occupational classes within the state sector (e.g., police, nurses, teachers).
Two-thirds of unions do not fulfil the new minimum size requirement of 1000 members, and by the end of April 1989 they will have their registration cancelled if the required minimum size is not attained. Such unions have the opportunity in the meantime to increase their numbers either by amalgamation with others or through extension of their coverage.
Registration of unions. The registration process has been considerably simplified with the passing of the Labour Relations Act 1987. Essentially, any group of persons is free to associate for the purpose of seeking registration as a worker union. There is no longer a requirement that the group be engaged in the same industry or in related industries. Whether a community of interest exists is to be determined largely by the workers themselves.
The new minimum size requirement of 1000 members is applied in the following way. In the case of a union registered at the commencement date of the Act, where its membership falls below 1000 it will have a year to take remedial action before its registration is cancelled. In the case of an application for registration where the workers concerned have not previously been organised by an existing union, it may not be possible to immediately satisfy the main precondition. For this reason, provisional registration is available for two years to allow the new union time to recruit up to 1000 members. Where this is granted, the new union is unable to lose (actual or potential) members to, nor be able to gain members from, another union. Otherwise, provisional registration carries the same rights and obligations as full registration. The requirements for union amalgamations have also been liberalised. This allows unions with fewer than the required minimum of 1000 members to amalgamate to meet the new requirement.
Cancellation of registration. A union's registration may be cancelled for other reasons than failure to meet the new minimum size requirement. Cancellation will occur if the members vote to voluntarily cancel their union's registration; if a union becomes defunct; if it fails to furnish an annual return of officers and its membership; or if it fails to furnish its annual accounts and audit certificate.
Change in union coverage. Under the Labour Relations Act, registration still provides a union with the sole right to represent a particular category of workers, but this right is not now permanent. The Act enables union coverage to be changed by ballots of workers affected.
There are two balloting stages. First, the union extending its coverage must ballot its own members to seek their agreement. Second, following membership approval, a ballot is conducted by the registrar of unions of those workers affected by the transfer of coverage. A simple majority in favour of the change of coverage is required and if it is achieved the registrar of unions registers the altered coverage, and adjusts the coverage of the existing union(s) where there would otherwise be a clash of coverage.
Union fees. Government has set a maximum joining fee for private sector union membership at 10 percent of the last annual subscription but there is no limit to what unions may charge as annual fees. Annual subscriptions are normally set in terms of a union's rules in a variety of ways. Either the amount is:
Actually included in the rules;
Set in terms of a formula (usually based on a percentage of a representative award rate of wages);
Set by the union's executive; or
Set by majority decision of the membership.
Similar information on union fees for public sector unions is, however, not available. In future the Labour Relations Act will apply.
Central organisations of workers. Both private sector unions and public sector service organisations are represented by one union organisation, called the New Zealand Council of Trade Unions (NZCTU). This council represents and co-ordinates the interests and activities of private and public sector workers. It is the organisation which nominates representatives for all tripartite forums.
Employer organizations. Private sector— Many employers belong to one or more of the 215 registered employer organisations (as at 31 December 1986), most of which are represented at the national level by the New Zealand Employers' Federation. This organisation represents and co-ordinates the interests of employers in the private sector. As it represents most employers, it is the organisation which nominates representatives for all tripartite forums.
Public sector—With the introduction of the State Sector Act 1988 the chief executive officers of departments and other organisations are the employing authorities. No recognised committee or organisation currently exists to represent their interests. The State Services Commission does play a role as the chief negotiating party in consultation with chief executive officers.
Industrial relations legislation in New Zealand restricts the freedom to strike or lock out in several ways. This is in an attempt to minimise industrial action and its effect on industry and on the availability of goods and services. Industrial action is only lawful when a strike or lockout arises during a dispute of interest (i.e., a dispute over the procuring of an award or agreement).
In those instances where legislation provides for dispute resolution procedure, strikes and lockouts are unlawful.
Industrial action is unlawful when a dispute concerns:
A dispute of rights (i.e., a dispute over the operation, application or interpretation of an award or agreement);
A personal grievance;
Demarcation issues;
Union membership or change of union coverage: or
Cancellation of a union's registration.
A strike or lockout in an essential service is unlawful where the statutory period of notice is not given. (Essential services are defined and listed in a schedule to the Labour Relations Act.)
Statutory penalties are not now imposed in the event of unlawful industrial action. The primary remedy is now through a civil action for an injunction, or damages, or both. The Labour Court has sole jurisdiction to hear civil actions in respect of unlawful strikes and lockouts. Also, where normal procedures fail, or are likely to fail, to avert a strike or lockout, the Minister of Labour has power to call a conference of the parties involved or to appoint a committee of inquiry. Special powers are also given to the minister for resolving disputes in essential industries.
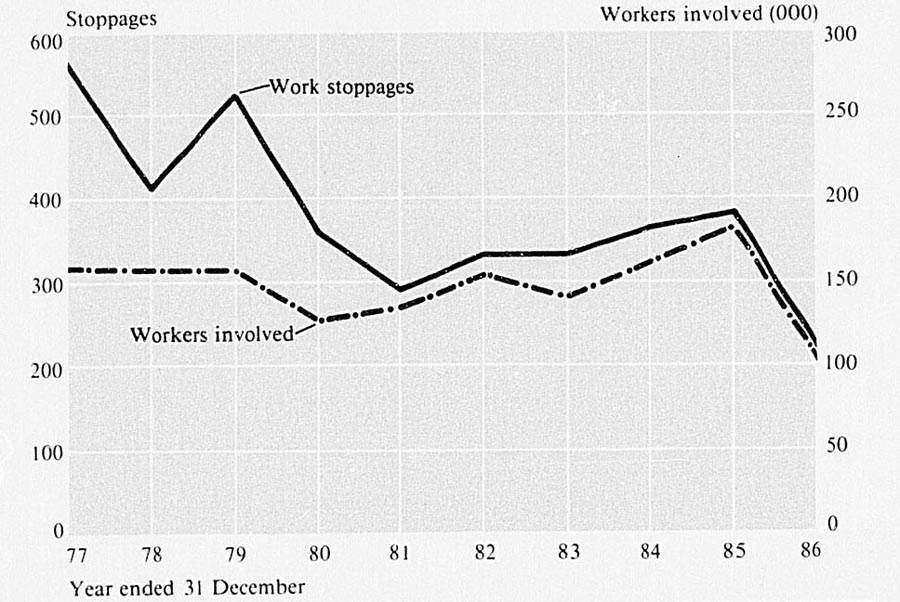
WORK STOPPAGES—all industries
For statistical purposes, work stoppages are defined not only as those disputes which result in a strike or lockout but also as disputes in which an organised ‘go slow’, refusal to work overtime, or methods of possible resistance are clearly manifested. This includes unauthorised stopwork meetings as well as unauthorised delays in resuming work after stopwork meetings.
The indicators used to measure work stoppage activity are the number of stoppages (measuring frequency), the duration of stoppages (measuring persistence), the number of workers involved (measuring extent), the number of working days lost (measuring economic impact) and the estimated loss in wages. Instances where several stoppages occur over the same issue are recorded as one stoppage and public sector stoppages are excluded.
Table 12.20. INDUSTRIAL DISTRIBUTION OF WORK STOPPAGES, 1986*
| Industry | Total number of stoppages | Average duration per stoppage (working days) | Number of workers involved | Working days lost† | Approximate loss in wages |
|---|---|---|---|---|---|
* Work stoppages not directly related to terms and conditions of employment or involving a demand being made of a third party have been included in the statistics. † During the actual period of the stoppages of work, no allowance is made for the fact that the work not performed at that time may have been carried out subsequently either wholly or in part. ‡Any stoppage which involved workers in more than one industry has been counted once in each respective industry (number and duration) but as a single stoppage in the total of all industries. | |||||
| $ | |||||
| Agriculture, forestry, hunting | 3 | 10.33 | 150 | 502 | $ 36,769 |
| Mining and quarrying | 9 | 6.44 | 2017 | 7895 | 876,237 |
| Meat export works | 12 | 9.58 | 43184 | 986780 | 93,743,927 |
| Other slaughtering, preparation preserving | 1 | 9.71 | 3862 | 20817 | 1,436,418 |
| Dairy products, fruit, vegetable, fish canning and preserving, vegetable, animal oils and fats | 17 | 7.41 | 4848 | 11316 | 757,362 |
| Grain milling, bakery products, sugar, confectionery, etc. | 9 | 4.28 | 370 | 1194 | 69,336 |
| Beverage industries, tobacco | 3 | 3.33 | 38 | 108 | 7,744 |
| Textiles, wearing apparel, leather | 13 | 3.88 | 1847 | 7603 | 446,780 |
| Wood, wood products | 4 | 9.25 | 343 | 3228 | 271,221 |
| Paper, paper products, printing and publishing | 7 | 10.79 | 2716 | 52980 | 5,154,326 |
| Chemical, petroleum and coal products | 16 | 9.69 | 962 | 7372 | 481,027 |
| Rubber, plastic products | 9 | 11.22 | 1523 | 22561 | 2,448.267 |
| Non-metallic mineral products | 17 | 5.44 | 1419 | 3083 | 277,326 |
| Basic metal industries | 4 | 5.25 | 298 | 476 | 34,514 |
| Metal products | 11 | 8.09 | 2339 | 8338 | 510,369 |
| Transport equipment | 13 | 8.88 | 6022 | 55036 | 3,116,189 |
| Other manufacturing | 2 | 1.50 | 48 | 50 | 2,820 |
| Electricity, gas and water | 1 | 5.00 | 86 | 430 | 35,000 |
| Building | 3 | 11.33 | 787 | 3569 | 186,619 |
| Construction other than buildings | 12 | 8.96 | 4070 | 55276 | 5,091,913 |
| Ancillary building and construction services | 1 | 6.00 | 8 | 56 | 2,922 |
| Wholesale trade | 13 | 6.81 | 1289 | 23056 | 874,361 |
| Retail trade | 3 | 1.50 | 553 | 567 | 36,739 |
| Restaurants, hotels | 6 | 8.58 | 1265 | 3110 | 141,657 |
| Land transport | 12 | 2.54 | 2002 | 2551 | 209,420 |
| Water transport | 23 | 2.80 | 4675 | 4480 | 395,090 |
| Air transport | 3 | 13.00 | 1116 | 11740 | 1,027,180 |
| Services allied to transport | 3 | 11.67 | 59 | 511 | 29,179 |
| Financing, insurance, real estate, etc. | 5 | 300 | 925 | 2258 | 158,569 |
| Community, social and persona! services | 26 | 9.88 | 3037 | 15971 | 745,506 |
| Several industries | 2 | 4.25 | 8775 | 16140 | 891,347 |
| Total‡ | 215 | 8.05 | 100633 | 1329054 | 119,496,134 |
Private sector. Pay fixing in the private sector can be viewed in terms of the following elements:
The national minimum wage, as established under the Minimum Wage Act 1983.
Minimum wages established by awards and agreements made under the Labour Relations Act which either:
establish minimum wages and conditions for various jobs on a national (or district) basis through awards; or
establish minimum wages and conditions for various jobs at the level of the individual enterprise through agreements (including composite agreements).
Paid rates established for particular jobs at the level of the individual enterprise by way of informal house agreements.
Arrangements reached between individual workers and their employers (mainly in small- to medium-sized enterprises).
Every year workers, unions and employers have the opportunity to renegotiate the wages and conditions in their specific industry or occupation, although negotiations need not occur annually, if the terms of awards and agreements are not for a year. This process is known as the ‘wage round’.
Before each wage round, the Tripartite Wage Conference is held to allow representatives from government, private and public sector unions and employers to meet and exchange information on the economy and government policies that will affect the forthcoming wage round. All three parties must be present.
Discussion is based on past trends and likely developments in the distribution of incomes, inflation, the competitiveness of New Zealand industry, government's fiscal and monetary policy and the minimum wage and government transfers.
At the end of the Tripartite Wage Conference the parties may unanimously recommend guidelines to the Arbitration Commission and others involved in fixing wages.
Wage rounds in recent years show a high degree of uniformity in wage increases between the various awards. The common pattern is for the wage round to effectively be set up by a handful of key awards which are negotiated early (e.g., drivers, metal trades, electrical workers), leaving little scope for higher settlements in those which follow. In the negotiations for the awards that follow, the pressure is often centred on some payment which is unique to the particular award and over which there is some negotiating leeway. Two factors which determine the level of settlement in the early key awards are: the increase in consumer prices immediately prior to the round, and the ability of employers to absorb wage increases.
Early settlements are usually transferred to other awards through a series of tight linkages, based on historical relativity. These linkages became particularly entrenched during a period of wage restraint in the 1970s when all wage increases had to be justified on relativity grounds. However, the changes brought in by the Labour Relations Act 1987 are designed to make such settlements more relevant to the industry or workplace to which they will apply.
Negotiations for an award can be initiated by either party to it, although this is usually the union. The Mediation Service arranges for a conciliation council to be formed. The decision of a council is binding on all parties to the award or agreement. If a settlement is not obtained by negotiations, it can be referred to the Arbitration Commission if both parties agree. The results of negotiations reached through either conciliation or arbitration are registered by the Arbitration Commission as an award and are enforceable on both parties.
Agreements—The Labour Relations Act 1987 lays down a procedure for negotiating and registering agreements. These agreements may cover an individual employing unit (or a group of units in a particular locality) and the workers engaged in a particular occupation. They are enforceable in the same way as awards, but are binding only on the signatories to the agreement.
The Labour Relations Act introduced quite different arrangements for the negotiation of agreements to those that existed under the Industrial Relations Act 1973.
Workers must now be covered by only one document, either an award or an agreement, but not by both. At the time of initiation of negotiations for an award, a union must, if it wishes to negotiate separate agreements as well, specify the names of employers with whom it wishes to negotiate separately. Such employers and their workers are then exempted from award coverage. If the parties reach an agreement it may be registered with the Arbitration Commission and become enforceable. If the parties fail to settle any issue, they may agree to that issue being determined by the commission.
At the date of enactment of the Labour Relations Act (1 August 1987), agreements in existence were registered under the earlier Industrial Relations Act. The ensuing wage round then determined which agreements would continue in force outside their respective parent award, and which agreements would be abandoned by the parties.
At the time of commencement, there was considerable variation in the nature of agreements. Some provided for a comprehensive code of employment and, where there was a parent award, superseded it in its entirety. Others simply superseded the award in a limited number of areas, usually wages and allowances. (The award would continue to set conditions of employment in the undertaking.) Still others contained a single clause, this often concerning a matter for which agreement could not be reached in award negotiations, and is subsequently pursued by the union on a company-by-company basis.
New matters—The Act provides new procedures for the treatment of what are known as ‘new matters’. A new matter is any that significantly affects the terms and conditions of workers which:
Has arisen as a result of action of an employer since the date on which the award or agreement was settled;
Is not dealt with in the award or agreement, or is dealt with only in the most general terms;
Is not a dispute over the operation or interpretation of the award or agreement (i.e., a dispute of rights); and
Does not relate to redundancy.
A union or employer party may consider during the tern: of an award or agreement that the existing document does not deal adequately with a new matter and that the parties should negotiate during the currency of the existing document.
The union or employer party concerned may apply to the Labour Court to determine whether a new matter exists. If the court so determines, then the matter may be resolved either under the procedures for the negotiation of an award or an agreement.
Composite agreements—An agreement between one or more employers in any undertaking (or group of undertakings) and a number of unions or associations representing the workers engaged within the undertaking (or group of undertakings) is known as a composite agreement. Such documents are entirely voluntary' and can rationalise bargaining, by reducing the number of separate agreements. Once registered, composite agreements are enforceable under the Act.
The Act also provides for the negotiation and registration of composite awards, which are registered by the Arbitration Commission. Composite awards are between two or more unions or associations and two or more employers or employers1 organisations.
Informal house agreements—The Labour Relations Act primarily provides for the fixing of minimum rates. In certain regions, pay rates for many occupations are substantially higher than award rates. This reflects such factors as high demand for labour, higher productivity, and union pressure. Informal house agreements tend to begin with wage rates and then often broaden to include such things as extra service pay, merit evaluation schemes, production or attendance bonuses, extra holidays, and extended rights for union delegates. They are not registered or enforceable under the Act.
While working conditions are often set in awards and agreements, certain other conditions are determined by statute. In some cases statutes set minimum standards which must be incorporated in awards and agreements.
Equal pay. The Equal Pay Act 1972 requires that all workers doing the same or similar work must be paid the same. All instruments fixing pay levels therefore must not discriminate on the basis of sex. Wage rates in private sector awards and collective agreements therefore apply to both men and women. In the public sector, such equal pay provision existed for some years before it was applied universally.
Although equal pay has existed for more than 15 years there is still a marked difference between the average weekly wages for men and for women ($470 and $364 respectively in November 1987). This is mainly due to women being predominantly employed in a narrow range of lower-paid occupations.
Minimum wage. The Minimum Wage Act 1983 authorises the determination of the national adult minimum wage and establishes the floor below which wages for workers cannot generally fall. It applies to workers 20 years and older and mainly protects the non-unionised sector, which is relatively small and encompasses such groups as private domestic workers and gardeners. Earlier practice was to fix it at a level slightly below that determined by the unionised sector for an unskilled adult, having regard also to the level of the unemployment benefit. In recent years the minimum wage attracted general wage increases only. The difference between the minimum wage and levels in the unionised sector then widened considerably. To address this, in 1985 the minimum wage was increased from $100 to $170 per week.
As from 2 February 1988 the minimum rate for all adult workers (male or female) became: $5,625 an hour if paid by hour or on piecework; $45 a day if paid by the day; and $225 a week in other cases.
Hours of work. The general rule is that hours of work are negotiated in every award or agreement, and in all cases do not exceed 40 hours per week. Exemptions are:
The parties to the award or agreement agree: or
The Arbitration Commission determines it would be impracticable to carry on efficiently if limited to 40 hours per week.
Public and annual holidays. All workers must receive nine statutory holidays, spread throughout the year. Two additional statutory holidays may be given if a normal working day occurs when these holidays are celebrated. All workers must receive pay for these holidays.
The following fixed public holidays are observed: Christmas Day (25 December), Boxing Day (26 December), New Year's Day (1 January), 2 January (or a day in lieu), New Zealand Day (6 February) and Anzac Day (25 April). Movable national public holidays are shown below.
Table 12.21. MOVABLE NATIONAL PUBLIC HOLIDAYS
| Holiday | 1989 | 1990 | 1991 | 1992 | 1993 |
|---|---|---|---|---|---|
| * The Queen's actual date of birth is 21 April 1926. | |||||
| Good Friday | 24 March | 15 April | 29 March | 17 April | 9 April |
| Easter Monday | 27 March | 18 April | 31 March | 20 April | 12 April |
| Queen's Birthday* | 5 June | 4 June | 3 June | 1 June | 7 June |
| Labour Day | 23 October | 22 October | 28 October | 26 October | 25 October |
Provincial anniversaries, or a day in lieu, are observed locally. The anniversary days are: Northland (29 January), Auckland (29 January), Taranaki (31 March), Hawke's Bay (1 November), Wellington (22 January), Marlborough (1 November), Nelson (1 February), Canterbury (16 December), Westland (1 December), Otago and Southland (23 March), and the Chatham Islands (30 November). When the anniversary falls on Friday, Saturday or Sunday it is observed next Monday, if on the other days it is observed the Monday before. The holiday may be taken on another day, such as a local show day, as in Taranaki where it is taken on the second Monday in March to avoid Easter.
All workers must also receive at least three weeks (15 working days) paid annual leave each year. This leave is not usually available to a new employee until one year's continuous service with the same employer has been completed. Shift workers often qualify for an extra week's leave. One week's extra annual leave is often allowed each year to those workers with a minimum of between five and 10 years completed service.
If an employee finishes up before completing a full year's service, he or she is entitled to 6 percent of their total gross wages for the period worked. This is holiday pay in lieu of paid annual leave.
Parental leave. The Parental Leave and Employment Protection Act 1987 allows parents to take parental leave within 12 months of a birth or the adoption of a child under five years.
The Act replaced the Maternity Leave and Employment Protection Act 1980 and extended its provisions in several key areas.
For the parent(s) of a new child who have worked for their employer(s) for at least 10 hours a week for the 12 months before confinement or adoption there are now three forms of unpaid parental leave available:
Maternity leave—A woman is entitled to up to 14 weeks maternity leave, of which up to six weeks may be taken before the birth or, if agreed by the employer, a period before the adoption of a child under five years.
Paternity leave—A man is entitled to two weeks paternity leave from the time of childbirth by his spouse or the adoption of the child.
Extended leave—One or both parents are entitled to a total of up to 12 months leave before the first birthday or anniversary of adoption of the new child. The entitlement may be shared between both parents, although any period taken as maternity leave is deducted from the total available. Paternity leave does not affect entitlement to other parental leave.
The 1987 Act duplicated most of the provisions of the Maternity Leave and Employment Protection Act 1980 with respect to re-employment rights, complaints procedures and termination of employment.
At the end of a period of extended parental leave, employees may return to their positions if their employers have been able to keep them open. Alternatively, they are entitled during the six months following parental leave to preference over other applicants for any positions which are vacant in the employer's enterprise and which are substantially similar to the position they held at the beginning of the parental leave. The Act also provides that it is unlawful to terminate the employment of a woman because of her pregnancy or her state of health during the pregnancy. There are complaint procedures for parents to use where they believe that any of the provisions of the Act have been contravened or their rights to parental leave have been affected to their disadvantage by an employer.
Termination of employment. The minimum number of days' notice required to be given to a worker is usually contained in the award or agreement. This can vary from award to award, but is generally one pay period (typically one week). If a worker does not receive adequate notice, or considers their dismissal unjustified, then he or she may have a case for a ‘personal grievance’ (see below).
Redundancy. There is no statutory entitlement to redundancy compensation for workers who have been made redundant. It is up to workers themselves or a union to negotiate a settlement with the employer concerned as each situation arises. Where settlements are reached, the payment usually takes the form of a number of weeks' pay for each year of service with that employer.'
There is now no limit on the amount of redundancy compensation that may be paid or received, nor on who is entitled to compensation. Any redundancy agreement registered by the Arbitration Commission may be enforced under the Act.
Occupational safety and health. To ensure that safety, health and welfare requirements set out in Acts of Parliament, regulations and codes of practice are met, factory inspectors are employed by the Department of Labour.
Trade unions also have powers of inspection to ensure that wage conditions set out in awards and agreements are being observed.
All commercial premises are inspected by the Department of Labour, including factories, shops, offices, hotels, restaurants, stores, warehouses, farms, orchards and government workshops. Factory inspectors also spend much of their time promoting safety and advising employers and employees on the many aspects of industrial safety, health and welfare.
High-risk industries are inspected at least annually. The remaining factories, shops, and other units are inspected less frequently, but at least every five years. Factory inspectors can order changes to unsafe plant or processes and, if the safety of individuals is threatened, can require immediate remedial action. Where breaches of safety legislation occur, by either employers or employees, remedial action is requested in writing and failure to comply can mean prosecution. All industrial accidents which result in a person being off work for more than 48 hours must be reported to the Department of Labour and serious accidents are investigated by factory inspectors.
By law all factories must be registered annually with the Department of Labour. A fee is payable and this depends on the number working in the factory.
For further information on specific Acts relating to health and safety refer to section 8.6, Occupational safety and health.
Rights disputes and personal grievances. Disputes can arise during the currency of awards and collective agreements over the individual or collective ‘rights’ of workers and are termed ‘disputes of rights’. The Labour Relations Act requires awards and collective agreements to contain effective machinery for the resolution of rights and personal grievances without stoppage of work. The parties have the freedom to negotiate their own procedures. The Act provides standard procedures which are automatically inserted in all awards and agreements. Parties to awards and agreements can improve upon the standard procedures if to the satisfaction of the Arbitration Commission.
The procedure for resolution of disputes of rights is based on the principal that the making of an award or the registering of an agreement establishes ‘rights’, the interpretation or application of which can be the subject of dispute between the parties.
The elements of the procedure are as follows:
Once a dispute arises, either party may invoke the procedure and cause a disputes committee to be set up, chaired by a neutral third party (almost invariably a mediator);
A decision can be made by a majority of the committee or, failing that, the chairperson can either arbitrate or refer the dispute to the Labour Court for arbitration. Thus, compulsory arbitration is provided in the case of unsettled disputes. (A disputes committee decision can be appealed to the Labour Court.);
Work is to continue uninterrupted while the dispute is being dealt with by the procedure. Strikes or lockouts over matters within the jurisdiction of the disputes committee are unlawful.
A right of recourse is provided under the Labour Relations Act 1987 to individuals who may have a grievance against their employer based on a claim that a dismissal (or other action) is unjustifiable. This now includes other unjustifiable or detrimental actions, such as sexual harassment, duress or discrimination.
All awards and agreements must contain an effective procedure for the settlement of personal grievances. This means access to a personal grievance procedure is now a benefit of union membership (except in certain limited circumstances) and it is not dependent on coverage by an award or agreement. The application of the procedure for setting personal grievances is not able to be frustrated by deliberate lack of co-operation on the part of anyone (e.g., a work stoppage).
The procedure is based on the following:
The decision to invoke the procedure, in the first instance, rests with the worker.
The grievance should be, wherever possible, rapidly resolved in the workplace without formality;
The decision whether or not to refer the dispute to a grievance committee, if still unresolved, rests with the union; and
Usually the grievance committee seeks a negotiated settlement, with arbitration as a last resort. The chairperson will attempt to steer the committee to an agreement. If there is no agreement the parties to the dispute can agree to let the chairperson make a decision, or the matter can be referred to the Labour Court for final resolution.
The primary remedy for a proven grievance is, where requested, reinstatement in a position no less advantageous to the worker. The remedy for a personal grievance is, however, determined by the circumstances of each case. It may also include payment of loss of wages and compensation. Also the remedy may include recommendations concerning future action (e.g., a system of warnings or a suitable disciplinary procedure prior to any future dismissal).
The personal grievance procedure is an alternative to, and not in addition to, any right to make a complaint under the Human Rights Commission Act 1977 or the Race Relations Act 1971 on the grounds of alleged discrimination.
12.1 Department of Statistics; Department of Internal Affairs; Department of Labour, Vocational Training Council.
12.2 Department of Statistics; Department of Labour: Department of Maori Affairs.
12.3 Department of Labour; Department of Statistics.
12.4 Department of Labour; Department of Statistics.
Census of Population and Dwellings 1986; Reports C4 and C5, Labour Force. Department of Statistics.
Census of Population and Dwellings 1986; Report C9, Incomes and Social Welfare Payments. Department of Statistics.
Incomes and Income Tax of Persons. Department of Statistics (annual).
Job Vacancy Survey. Department of Labour (six-monthly).
Labour and Employment Gazette. Department of Labour (quarterly, discontinued March 1987).
Monthly Employment Operations. Department of Labour.
New Zealand Household Expenditure and Income Survey. Department of Statistics (annual).
New Zealand Labour Force. Department of Statistics (quarterly).
New Zealand Standard Classification of Occupations. Department of Statistics, 1983.
New Zealand Standard Industrial Classification. Department of Statistics, 1983.
Report of the Department of Labour (Parl. paper G. 1).
Report of the Inland Revenue Department (Parl. paper B. 23).
Report of the Vocational Training Council. (Parl. paper C. 36).
Training Bulletin. Vocational Training Council (quarterly).
Wages and Earnings. Department of Statistics (annual).
Industrial Relations—A Framework for Review (2 vols.) and Summary of Submissions. Department of Labour, 1986.
A Guide to the Labour Relations Act 1987. Department of Labour, 1987.
Pay Fixing in the Stale Sector: A Review of Principles and Procedures in the Fixing of Pay and Associated Conditions in the New Zealand State Sector—October 1986. Hon. Stan Rodger, Minister of State Services.
Trends in Work Stoppages 1976–1985. Department of Labour (pamphlet).
Work Stoppages and Industrial Unions. Department of Statistics (annual).
Table of Contents
Scientific research in New Zealand is carried out by the research divisions of government departments, universities, joint government/industry-funded research associations, and private organisations, some of which receive government assistance. Decisions, on national scientific policies are made by the Minister of Science and Technology, the Cabinet Development and Marketing Committee, and the Cabinet, subject to Parliament's approval.
The Science and Technology Advisory Committee reports to the Government, through the Minister of Science and Technology, on matters such as the planning, promotion and coordination of scientific research and services in New Zealand, and the promotion of cooperation with public and private sectors and overseas agencies. The committee was established after the 1986 working party on science and technology, chaired by Sir David Beattie. It replaced the National Research Advisory Council which served a similar role from 1963 until it was abolished in 1986.
The committee's work programme includes the development of social, economic and industrial goals in science and technology, including recommending to the Government areas of national priority; developing a science and technology data base; the establishment of two new research foundations; following-up recommendations of the working party on science and technology; reviewing research and development in industry; and establishing task groups in public awareness and in science education/work skills. The committee is also responsible for reviewing the organisation and structure of science and technology in New Zealand, such as ensuring that finance and resources are effectively managed and that technological developments are marketed.
Its operations will be reviewed after three years.
The following tables show the amount expended on science in New Zealand and internationally, as well as OECD averages by sector.
Table 13.1. INTERNATIONAL COMPARISON OF RESEARCH EFFORT
| Country | Year | Expenditure as percentage of GDP |
|---|---|---|
| Source: Science and Technology Advisory Committee. | ||
| Australia | 1986 | 1.18 |
| Belgium | 1983 | 1.53 |
| Canada | 1986 | 1.36 |
| France | 1986 | 2.38 |
| Japan | 1985 | 2.81 |
| Netherlands | 1985 | 2.11 |
| New Zealand | 1987 | 1.09 |
| Norway | 1987 | 1.87 |
| United Kingdom | 1985 | 2.33 |
| United States | 1987 | 2.90 |
| West Germany | 1985 | 2.66 |
The Government is aiming to bring expenditure on research and development into line with the OECD average. This will involve more research being done and paid for by industry and a reduction in the amount of money government allocates for that purpose.
Table 13.2. EXPENDITURE ON SCIENCE BY SECTOR 1987*
| Sector | Gross expenditure | Percentage of total | Percentage of GDP | |
|---|---|---|---|---|
| New Zealand | OECD average | |||
* Year ended 31 March. Source: Science and Technology Advisory Committee. | ||||
| $(million) | ||||
| Government | 280 | 48 | 0.52 | 0.81 |
| Universities | 70 | 12 | 0.14 | |
| Industry | 230 | 40 | 0.43 | 0.80 |
| Total | 580 | 100.0 | 1.09 | 1.68 |
The majority of research in New Zealand is funded by government departments, of which about 70 percent is spent by the Department of Scientific and Industrial Research and the Ministry of Agriculture and Fisheries. Adding the Ministry of Forestry (the Forest Research Institute at Rotorua), the Ministry of Transport (the Meteorological Service), and funding in other sectors brings this figure to 90 percent of government research and development expenditure. A number of other departments do, however, undertake or sponsor research.
Table 13.3. GOVERNMENT RESEARCH AND DEVELOPMENT EXPENDITURE BY ACTIVITY*
| Activity | Year ended 31 December 1987 | |
|---|---|---|
* Does not include universities (as information is not readily available) or some overhead costs. Figures are very approximate estimates and excludes GST. † Includes agriculture, forestry and fishing, and biological resource-based production and processing. ‡ Includes chemical, plastics, non-metallic fabricated metals and miscellaneous manufacturing and processing. § Includes transport, tourism, trade and finance, communications and building. || Includes soil, water, energy; mineral and atmospheric. ¶ Includes advancement of knowledge, environment management, health and social and scientific services. * Includes defence, international relations and market intelligence. Source: Science and Technology Advisory Committee. | ||
| $(million) | percent | |
| Biological industries† | 130 | 53 |
| Other manufacturing industries‡ | 25 | 10 |
| Tertiary and service industries§ | 7 | 3 |
| Natural resources|| | 30 | 12 |
| Community interests¶ | 45 | 18 |
| Strategic interests** | 8 | 3 |
| Total | 245 | 99 |
The Department of Scientific and Industrial Research (DSIR) exists to initiate and implement scientific and industrial research to benefit New Zealand.
The department is split into four major groups, the Biological Industries Group, the Resources Group, the Industrial Group, and the Corporate Operations Group. The latter group does not conduct research and has an administrative function.
The work of the three science groups encompasses 20 separate activities involving approximately 100 programmes, each of which generate many specialist projects. Some of the major research projects conducted recently by the three groups are described below by subject areas.
Recent research activities of the DSIR's Biological Industries Group include:
Plant breeding. The New Zealand economy and future export performance will rely increasingly on product specialisation, and the Department of Scientific and Industrial Research is committed to a plant breeding programme. It also runs joint breeding programmes with some private sector organisations.
Programmes involve research of horticultural crops (fruit and vegetables) arable crops (cereals and pulses): pasture plants (forage legumes and grasses, crops and other plants); and plants for recreational purposes.
These programmes aim to breed cultivars with improved quality, yield, climatic adaptation and pest and disease resistance for local food and agricultural industries, processing industries and overseas markets.
Increasing interest in horticultural crops has resulted in breeding programmes being expanded. Breeding programmes have increased the number of fruit cultivars and improved others. Arable and pastoral research programmes are turning from traditional crops such as wheat, barley and peas, to high-value easily transported crops such as essential oils and herbs.
Some major research advances include improved kiwifruit and apple cultivars resulting in commercial markets for Gala apples and Hayward kiwifruit. New cultivars of boysenberry, feijoa and pepinos have also been released.
Among field crops, the DSIR-bred rua potato is now the major potato cultivar grown in New Zealand; field pea production is based on DSIR-bred cultivars which are resistant to major disease: lentil crops have been evaluated by the department and an industry has been established in Canterbury with export potential. DSIR-bred clover and prairie grass cultivars are now successfully grown in Europe and have been placed on the United Kingdom recommended herbage list. Cold tolerant and root-rot resistant maize lines not attained elsewhere in the world are bred and grown in New Zealand and DSIR-bred wheat cultivars constitute 90 percent of the New Zealand wheat crop.
Plant productivity. Research in this field is necessarily long-term, requiring strong international links, particularly in the case of field crops, although in some areas, e.g., pasture agronomy, and sub-tropical fruit crop management. New Zealand research is ahead of that in other countries.
Programmes include: plant nutrition and soil fertility: crop production and management; physical environment and biological systems; control of plant diseases, pests and weeds in agriculture and horticulture and physiology and nutrition of animals. Research involves the study of natural and artificial plant environments which will improve plants: management techniques and control procedures to minimise harmful pests and diseases and maximise beneficial ones; develop plant production to improve seasonal spread, quality, yield and processing characteristics; and improve nutrition for ruminant digestion and animal production. Available plant material is being evaluated for use in different environments. Studies of soils, nutrients, shelter conditions, light and temperature have improved the yield and quality of fruit crops and orchard growing and have allowed expansion of pasture cultivars into marginal soil types. Legume-based pasture systems such as all-grass wintering have improved seasonal feed supply options. An irrigation scheduling system is in use throughout New Zealand.
Inventories of all insect pests in the Pacific region have been prepared and resistant genes have been identified which can control disease in major crops.
At the same time, systems for continuous crop monitoring and applied disease control measures are being developed.
Biological science. The Department of Scientific and Industrial Research carries out long-term research on plants, animals, and micro-organisms, the communities they form and their interaction with the environment. Information from this research is in turn applied to plant breeding, food technology, biotechnology, and crop management.
Genetic manipulation techniques, such as isolating and cloning genes, have been developed which confer pathogen resistance on and between plants. Bacterial toxins have been identified as they affect plant resistance or susceptibility to disease.
Identification of the compounds responsible for the aroma and flavour of food products have improved understanding about changes which occur to these compounds during crop development, fruit ripening, storage, and processing.
Another area where there have been recent advances include the detection of a salivary protein in cattle which may provide the basis for diagnostic techniques for genetic susceptibility to bloat.
Information on New Zealand's indigenous plants has been extended to include taxonomic descriptions of pollens and seeds. These and other descriptions of flora, insects, and other terrestrial invertebrates are contained in the Flora of New Zealand and Fauna of New Zealand series.
Food and science technology. New Zealand's major emphasis on new markets and products, and improved quality and transport methods has created a demand for new scientific and technological information. Some knowledge is available from overseas but usually requires adapting to New Zealand conditions.
Programmes include the storage and transport of arable and horticultural crops and food and food science. These programmes study new and improved product developments, the composition, flavour, quality and nutritive aspects of food; the storage and processing of horticultural, and arable crops and fish; transportation methods to maximise quality; the market value of exports; and the development of promotion of New Zealand's food industries.
Progress in these areas has been rapid and reflects forecasts that in 10–15 years the value of horticultural exports will be from three to six times greater than in 1988 and those from fisheries will double. Significant recent developments have seen the commercialisation of kiwifruit wine for export; development of technology for transporting live fish to distant markets; new testing procedures for disinfestation of cherries (resulting in a fresh cherry export industry to Japan) and the development of technology for ripening kiwifruit earlier in the season.
Food processing and product development will occupy an increasing role in determining the requirements of consumers both in New Zealand and overseas. A food research and development centre has been established in Singapore to develop links with Asian markets.
For the future there are significant opportunities for product development of value-added products such as pasta and snack foods on world markets.
Biotechnology. Modern biotechnology has arisen from basic research on the molecular genetics of living organisms and recent research has expanded as commercial opportunities have been perceived.
Research programmes with major biotechnology inputs include plant cell physiology and genetics, and molecular genetics of micro-organisms with applications in the plant breeding and plant productivity areas.
Research in biotechnology is intended to produce plants, animals, and micro-organisms with new characteristics and enhanced economic value, and also to produce new products from biological materials for both national and international markets.
Progress in biotechnology over the last 10 years has been in areas of strategic research which impact on the nation's economy. For example, a system for introducing cloned foreign genes into white clover has established a base for the future genetic engineering of white clover. Similarly, during 1987 perennial ryegrass plants were obtained from tissue cultures which are highly resistant or immune to crown-rust, the main disease of this forage grass. The results are being used to breed improved rust-resistant cultivars of ryegrass. Gene manipulation systems also offer important opportunities for the future, both for micro-propagation and the production of ‘high health’ plants for export.
In crop breeding, new techniques in the application of molecular genetics, such as DNA probes for genetic transfer, have resulted in the identification and transfer of beneficial characteristics between plants of different species. DNA probes have been developed for the detection of a number of diseases caused by viruses and bacteria. Success in controlling virus disease in clover and lucerne will provide technologies for application against a wide range of diseases which molecular genetics may provide the only means of control.
Technologies for the molecular genetic studies of insects, including DNA probes, have been established. The DSIR has tissue culture cells for most insect cells in operation and over the next five years DNA probes will be produced for various plant pests which can be used for cloning and as carriers of useful proteins.
Research will also continue into micro-organisms of industrial importance such as yeasts in the food industry; soil micro-organisms in agriculture and horticulture; and organisms which produce fermentation products or enzymes for industrial production. Recent commercial applications in this area include a new process for the production of high quality yeast oil from whey, and the development of sulphated resins for the separation of proteins from whey.
In other research projects, monoclonal antibodies of possible commercial importance have been produced and have been used for screening salivary proteins in cattle. Slow release technology is being used to influence plant and animal production, such as hormone-induced increases in fibre production from pasture grazing animals.
The activities of the Resources Group include:
Ecological science. The aim of research in this area is to gain a greater understanding of natural and modified ecosystems in New Zealand in order to help with their wise management. This involves identifying the nature of New Zealand's indigenous flora and fauna and how introduced plants and animals affect them.
Research programmes include plant ecology and vegetation survey, ecology of native fauna and ecology of introduced fauna. Recent achievements include: the development of a national classification system for conducting vegetation surveys; and significant progress towards understanding animal ecology such as plant-herbivore (possums, goats) and predator-prey (cat, stoat, rat, mouse) interactions, to facilitate pest control.
Habitat surveys and research are conducted to facilitate the development of strategies for the preservation of endangered species, and control techniques for bird damage to agriculture and horticulture have also been developed.
Marine and freshwater science. New Zealand's oceanic interests range from the Pacific to Antarctica's Ross Sea, but marine studies are concentrated on the Exclusive Economic Zone (the fourth largest in the world) and New Zealand's natural and man-made freshwater lakes. Programmes include marine geoscience; physical oceanography; marine biology; ocean climate; and eutrophication of freshwaters.
In marine geoscience, shape, depth and sediment distribution maps have been produced for most of the Exclusive Economic Zone. Over the next 10 years these maps will be expanded and improved through data received from satellite and ship-based studies. Hydrocarbon potential has been assessed in three major sedimentary basins in the Ross Sea. Phosphate deposits have been found on the Chatham Rise, showing agricultural potential and commercial viability.
Important progress has been made on studies centred in the Cook Strait. The effect of tidal flows is eroding the strait and can move sediment as large as gravel. Oceanographic research has evaluated mean water circulation and its physical variability together with associated temperature and salinity distribution up to 1500kms offshore and the effect on plankton, distribution of fish, fish larvae, man-made structures, such as power cables between North and South Islands, and shipping. This research is presently concentrated on the West Coast of New Zealand and Cook Strait in order to gain a greater knowledge of the hoki fishery.
Other studies have shown the value of riparian vegetation in controlling nutrient enrichment in fresh waters.
Soil resources and fertility. A new national soil classification, based on the generic system, has been developed to meet modern needs for detailed soil information.
Special surveys have been undertaken to meet the demand for the assessment of soils for agriculture, forestry development, and irrigation, especially in relation to the expansion of horticultural crops.
Programmes include the characterisation of soil resources relevant to future land use, investigating soil processes for predicting changes in the properties of soils; the assessment of land use and productivity: and the interaction of soil, plants and animals.
Detailed soil surveys of the Cook Islands, Niue and Tonga have been completed and have resulted in the classification of soils for both pastoral and exotic forestry uses. Models have been developed to incorporate soil-climate-plant relationships in the prediction of land use, performance for the restoration of land after mining, and for showing the benefits of improving land by drainage and other methods. A system of land classification for irrigation has been developed to suit New Zealand conditions.
Soil organisms under investigation include earthworms, which have a beneficial role in evaluating nutrient cycling in soil, and nematodes which can adversely affect or stimulate plant growth by their activity on or near roots. The effect plant species have on soil biota has also been studied.
Earth and atmospheric science. Geological and geotechnical information is essential for engineering site investigations, for urban planning, mining and mineral exploration, and for assessing natural hazards such as earthquakes and volcanic eruptions. Programmes include studies into the engineering and physical characteristics of rocks and sedimentary deposits; the identification of mineral resources; natural hazard assessment and prediction; regional studies, including mapping and environmental studies; basic earth science; and atmospheric research.
A computer data base for minerals (metallic and non-metallic) is being set up and the information mapped.
Studies in the Central Volcanic Region have provided the basis for geothermal energy-development and criteria for ensuring the protection of science and tourist features in the region. Seismotectonic hazard assessments have been carried out for several major construction projects and a new technique for predicting earthquake energy in some localities has been developed.
The detection and estimation of the size of French nuclear test blasts at Mururoa Atoll is made using the DSIR seismograph in Rarotonga.
Regional studies have produced national coverage of small-scale geological and geophysical maps used for environmental and planning assessments. Data bases of these studies are being updated and made more accessible.
Major new studies in ozone depletion, atmospheric trace gases and ‘green-house’ gases are underway.
Energy resources and utilization. The DSIR's involvement in this area covers many of New Zealand's available energy resources. Study programmes include coal, geothermal activity, hydro-electric power and petroleum. All work is dependent on basic studies in earth science and perceived long-term needs, availability of resources and interest from outside the department. The department makes site assessments for outside agencies of energy resources from discovery to development. This involves the investigation, characterisation and documentation of the quantity, quality and the environment of these resources.
The department maintains a strategic energy research capability for use by government and other agencies in developmental and conversational issues in the energy field.
Other recent advances include the development of a national coal database: investigation into site geology for major power development projects; the development of alternative fuels; and assessments of Maui gas reserves.
The department's Industrial Group conducts research in the following major areas:
Applied and industrial chemistry. The growth and diversity of New Zealand's industrial base is important to ensure economic growth. Increased input into upgrading and manufacturing primary products and the establishment of new industries is essential. These might include, mineral industries, oil and gas-based industries (including plastics), computing (hardware and software), high technology ceramics based on local materials, and fine chemicals.
Recent studies include the processing of natural products including wastes: material processing, primarily to research methods of processing and upgrading of New Zealand's mineral and coal resources; chemical process development; materials science and technology, including research on the selection and correct use of materials in manufacturing to prevent failures which may result in lost production: and advanced instrumental techniques and technology to improve the utilisation of materials.
Work on the use of methanol as an automotive fuel has led to the development of a multi-fuel carburettor which enables the use of petrol, methanol, cng or lpg in a vehicle. As an alternative solution to the same problem of introducing alternative fuels on to the automotive fuel market, a phase-shifting fuel injection pump and fuel composition sensing system has been invented with widespread international interest.
The diversity of natural products in New Zealand has led to a wide range of processing options, and the extraction of enzymes from animal organs, mushroom essence from waste mushrooms and a range of oil seed extractions are all being investigated. Techniques have also been developed to improve the recovery of minerals such as alluvial gold and sulphur. A new industry in high technology plastics production may be set up in New Zealand as a result of investigations into the separation of durene from synthetic gasoline. There is greater scope for further chemical development in support of New Zealand's farming and horticultural industries with chemically induced biological control using pheromones, hormones, repellents, pesticides and other biologically active compounds.
Information and communication technology. New Zealand has become an information-based society. More people are employed to handle information than in agriculture and industrial work, although the potential for exploiting this field remains largely undeveloped in all but a few sectors. The DSIR works with other organisations to evaluate, adapt where necessary, and introduce new concepts and processes in information technology.
Programmes which have been selected to further New Zealand's development in this field include: networking of computers; remote sensing using satellites; image processing; integration of office automation and printing; and information data bases.
The department maintains its own computer network which enables the national and international communication of scientific analysis. It has also developed products, such as a new instrument to detect and measure electromagnetic radiation, and a new form of mounting for a tracking antenna using a computer model, which has attracted overseas interest for a joint development programme.
Developments in other areas include: reviewing data on ocean monitoring from the department's radiometer in space shuttle missions: developing a software product to produce high quality maps and graphics; and an antenna for satellite television signals, to be manufactured locally.
An earth resource satellite receiving station in New Zealand is expected to be in place to receive data from 1989. The department will be the technical consultant and contractor with responsibility for the station's operation, data archiving and processing.
Forensic science. These services are essential to the maintenance of law and order in New Zealand and the department's programmes in this area include: forensic biology, physical evidence; illicit drugs; and blood and alcohol testing.
Specific recent advances include the establishment of automated blood-alcohol laboratories to international standards, and the introduction of a medical examination kit used in police investigations.
Social science. Social science has an essential role in analysing relationships between science and technology and social, economic and industrial goals. The field of research is complex and requires a multi-disciplinary approach. The Social Science Unit within the DSIR analyses technological change in industry. It monitors the implications of industrial restructuring looking at the creation and loss of jobs and skills, labour force requirements, recruitment and training, and occupational health and safety. The unit also advises industry and other agencies on the social impact of particular technologies and their implementation in the workplace.
Specific programmes include research into industrial restructuring and flexible automation in manufacturing. The unit has been commissioned to advise on the design of research for a meat industry study, and is carrying out technology and social impact assessments required by the study. The unit has made similar assessments in telecommunications and computer technology. Other studies include: the social and economic implications of the expansion of the kiwifruit industry in the Bay of Plenty, with particular emphasis on future labour requirements; and an analysis of the transformation of office work in the Public Service, focusing on the occupations of typist and secretary. Studies have also been made on the change to computer-based production in newspaper publishing.
Electronics and electrical science. The DSIR provides centralised research and development resources to industry on a contract basis. It introduces new electronic technologies to New Zealand and disseminates these to the electronics and other industries. Electrical and electronic information, measurement and testing services are also provided to industry.
Programmes include: microelectronics (integrated circuit design and fabrication of micro-transducers, etc.); assembly techniques (thick film, printed circuits, etc.); applied electronics techniques (computer vision, speech synthesis and recognition, image processing equipment, etc.); industrial applications of electronics; calibration and testing services; and supporting services (training, instrument repair, technical advice and management).
Contract research and development is a growing aspect of the department's work, especially in areas such as product analysis, prototype development, quality assurance, production engineering and product testing. There is also an increasing demand for electronic equipment in many fields of agriculture and horticulture. The department has established weighing and grading automation in the freezing industry and the electronic stimulation of carcasses for enhanced tenderness, developed by the Meat Industry Research Association with assistance from the department and adopted by the freezing industry, has resulted in cost savings and product improvement.
Other developments during 1987 included the development of an animal grazing recorder to measure and identify chewing and ruminating patterns for animal grazing studies at Lincoln College and a fruit weight logger and a datalogger using thick film and silicon technology to record temperature history during shipments of chilled or frozen products for export.
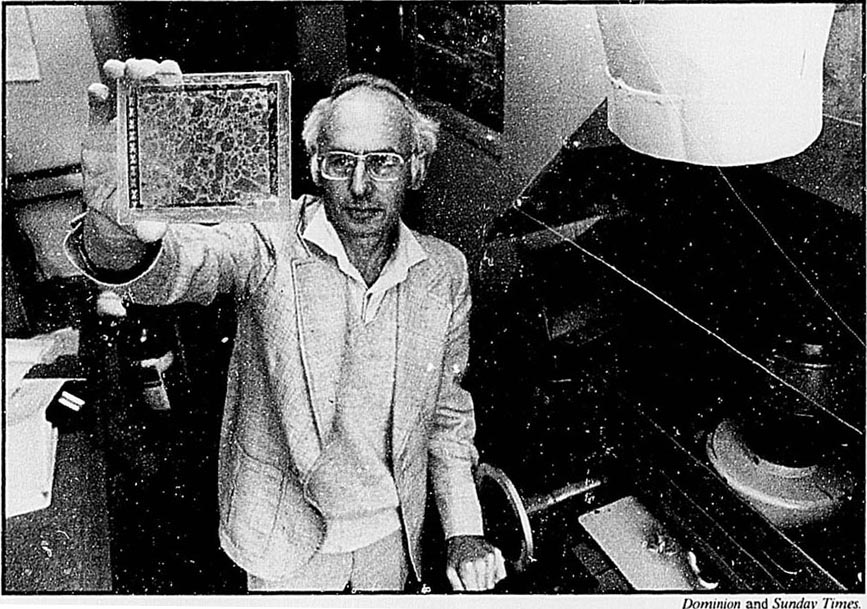
A DSIR scientist examines a concrete sample for faults.
Mechanical engineering and production technology. DSIR scientists and engineers assist industry to improve productivity and quality by helping to introduce new techniques and the provision of specialised research and services.
Programmes include: service work in calibration and industrial design; materials and structures; quality and management production systems; testing and servicing of products for manufacture and users; and engineering seismology.
The department provides a calibration service in length, mass, force, time, pressure, and temperatures.
In the engineering design field, work is aimed at assisting companies and individuals with innovative product ideas who do not have the range of facilities or expertise to develop the product.
In horticultural engineering, work has been done on establishing conditions for storage of produce and, more recently, in transport and handling and the causes of apple bruising during road transport. Work on industrial image processing has been applied to fruit grading machinery and gathering fruit size data to assist in the design of packaging.
Other design and development work includes: a controller for automatic doors; a recompression chamber at Princess Margaret Hospital; and a medical humidifier.
Industrial measurement developments include strain measurement in jet boats, pumps, presses, earthmovers and electric power utilities. Work ranges from the measurement of large imported plastics extrusion dies, which are used to produce export produce packaging, to the measurement of the back surfaces of locally produced and exported contact lenses.
Applied research on weldability and corrosion of stainless steel has been carried out. Work on strain analysis, fatigue, and residual stress has enabled demands from industry to be met. There have been investigations into: the cracking of continuous pulp digestors used in the pulp and paper industry; cracking and repair procedures in the Auckland Harbour Bridge: and the suitability of aluminium alloy survey pegs. Quality assurance work has been done for: suppliers of equipment for the New Zealand Armed Forces; a solid fuel heater manufacturer; an lpg cylinder manufacturer; a yachting component manufacturer; appliance manufacturers and many others.
Rotary pelting machines have been developed for New Zealand and Australian meatworks, and the department is currently working on high-pressure water jet technology which has application in industry for cutting a wide range of materials.
In engineering seismology, the department has developed special devices to dissipate the effect of earthquake tremor on bridges, and this technique has resulted in improved seismic designs for bridges.
Physical and mathematical science. The study of physics and mathematics provides the basis from which applied science grows. Programmes in this area of research include: maintenance of standards; materials science: classical physics: nuclear science and mathematics.
The DSIR has a statutory obligation to establish, maintain, and disseminate the physical standards for all measurements undertaken in New Zealand. Standards research ranges from feasibility and design to development and installation of new technology in manufacturing and engineering. Developments include the measurement of the density and compressibility of Kapuni and Maui gases for the Ministry of Energy (to check the accuracy of the formulae used to calculate quantities and hence the costs of cng) and the evaluation of electrostatic hazards in cng refuelling. Equipment has also been developed which enables line scales, such as surveying staves, precision rules and tapes, to be calibrated automatically and this work has attracted overseas interest.
The optical properties of the Antarctic sea ice have been studied and modelled. These properties have a profound effect on New Zealand's biosphere and global weather. Experiments on measuring and modelling elastic strain in Antarctica's sea ice from the passage of vehicles and aircraft have also been completed.
Strategic research in the materials science programme has involved collaboration with overseas laboratories and covers such topics as the mechanical properties of grass in relation to rumination; coal studies; and ceramics testing and research. Materials research includes a broad range of physical properties, techniques and materials such as metals and alloys, amorphous solids, liquids, biomaterials, semiconductors, and intermediates between solids and liquids (such as solid electrolytes). Some new exotic materials in modem technology which have been developed include ultra-tough ceramics and solid surface coatings for toughening and corrosion resistance. Computer programmes, the first of their kind, simulating ceramics and the transformations used to toughen them have also been developed.
Activities in classical physics, particularly in optics, include the formation of a company to manufacture optical components, and an eight-channel radiometer has been commercialised. The department has completed research on telescope mirrors, one of which is 1 meter in diameter, weighing 250 kg, making it the largest optical component to be made in New Zealand.
Studies have been made on the standards for environmental noise and the measurement of noise around airports. More recently the emphasis has changed to the control of noise by building design and controls for particular types of machinery. The earthquake response of structures is also being studied.
One of the major projects in the nuclear science programme has been the setting up of a new nuclear particle accelerator, and developing its use for dating milligram-sized carbon specimens up to 50000 years old. The same technique has been used in determining the origin of atmospheric methane, a topic of increasing importance in atmospheric pollution and climate change. The new accelerator is also used for isotope production in agricultural research, and in the development of a new technique for measuring the fat content of meat. It is also used for activating the surface of metal discs used in a sensitive, non-invasive technique for measuring corrosion inside industrial pressure vessels. A nuclear technique has been developed for measuring the distribution of fluorine in teeth, and is providing valuable new information in dental decay studies.
In its mathematics programme, statistical control methods, including sampling techniques, have assisted a large manufacturing company to reduce the number of defective items on one production line from up to 40 per day to fewer than one per week. This technique is being used in production planning to monitor and control kiwifruit quality. Similar models for production planning and quality assurance have been developed for the dairy industry to improve milk production.
Health and environmental science. The DSIR, in co-operation with the Department of Health, uses chemical analysis to ensure the safety and quality of foods, waters, and pharmaceuticals. It also does research to ensure the sensible protection of the environment is compatible with necessary development and use of resources. Research programmes include: food and water surveillance for trace elements, bacterial contamination, chemical additives, and pesticide residues; human nutrition and health; pharmaceutical quality and the environmental effects of land disposal of sewage and industrial effluents; impact of geothermal energy projects; and analysis of samples for metal and pesticide residues.
There has been no major identifiable hazard to public health or the environment of New Zealand in the history of the department's surveillance of food and water. Recently, high quality instrumentation capable of identifying contaminants of international concern have been acquired.
A water atlas, detailing chemical analysis of water supplies throughout New Zealand, has been established and is updated regularly.
Research involving applications of radiation chemistry and biology is done with universities in the fields of biochemistry and cancer research.
Table 13.4. DSIR GRANTS TO RESEARCH INSTITUTIONS, 1986–87
| Institution | Amount† |
|---|---|
* University contracts are funded from DSIR's operating funds. † All payments except those to overseas institutions include GST from 1 October 1986. ‡ Disestablished during 1986. Source: DSIR. | |
| $(000) | |
| Universities* | 187 |
| Research associations— | |
| Building Research Association | 1,041 |
| Coal Research Association | 500 |
| Concrete Research Association | 308 |
| Dairy Research Institute | 1,959 |
| Fertiliser Manufacturers' Research Association‡ | 200 |
| Heavy Engineering Research Association | 322 |
| Leather and Shoe Research Association | 348 |
| Logging Industry Research Association | 363 |
| Meat Industry Research institute | 1,969 |
| Research Institute Textile Services | 60 |
| Wool Research Organisation | 1,650 |
| New buildings for research associations | 592 |
| Overseas institutions— | |
| Commonwealth agricultural bureaus | 263 |
| Others | 270 |
| New Zealand institutions— | |
| Carter Observatory | 280 |
| Cawthron Institute | 662 |
| Royal Society of New Zealand | 403 |
| Testing Laboratory Registration Council | 300 |
| Other (incl. NZ/US agreement) | 36 |
| Total | 11,713 |
Almost all agricultural research within the Ministry' of Agriculture and Fisheries is carried out by the research and consultancy business research group, MAFTech. Fisheries research is conducted by the MAFFish business group.
Further information about the role of the ministry is contained in section 15.1.
Agricultural research is carried out by MAFTech at locations throughout the country. The goal of agricultural research is to help New Zealand's meat, fibre, dairy, arable and horticultural industries to identify and realise their export potential and increase the sustainable returns from farming. Increasing attention is being given to programmes related to harvesting, processing, and the marketing of products.
The following are the main areas of research:
Animal production and health. Research programmes are established to study the production and farming of many types of livestock including, sheep, cattle, deer, goats, possum, llama and alpaca, and rabbits. There are also research programmes for the study of animal behaviour, genetics, reproduction, nutrition, and diseases.
Animal production has been improved by genetic selection. Selection research is used to assess the genetic resources of livestock before developing breeding strategies to improve production and the quality of products for market. This can be achieved by selecting the best animals within a breed, or by crossing breeds. For example, the highly prolific Booroola merino sheep has been crossed with other breeds to increase lambing percentages. Similarly, the incidence of overfat lambs has been reduced by selecting rams whose progeny are fast growing but lean.
MAF recently imported the embryos of three sheep breeds from the northern hemisphere to introduce qualities such as high growth rate and leanness into the national flock through the stud breeding industry.
Animal diseases still cause large stock losses and are under continuous study. Animal disease control is studied at five animal health laboratories including the Central Animal Health Laboratory at Wallaceville in Upper Hutt.
In the North Island, facial eczema continues to be a problem. Sheep vary in their resistance to it, and can be genetically selected for this resistance. An enzyme has been identified as being produced by livers damaged by facial-eczema toxin. Concentrations of the enzyme can be related to liver damage, and used as the basis for selecting the tolerant sheep.
Significant research has recently been conducted into the emerging goat farming industry. A mortality study of goats has been conducted at the Wallaceville Research Centre which shows most deaths relate to management problems including cold stress/exposure, improper feeding, mismothering and premature births. Other major problem areas were microbial diseases, (pneumonia and yersiniosis), trace element deficiency, and internal parasites. Information from this study is being disseminated to farmers and veterinarians to help reduce losses from animal health problems.
Ten years' research on the distribution, density and productivity of rabbits on developed pastures is now assisting the Agricultural Pest Destruction Council and pest destruction boards to develop more cost-effective rabbit management policies.
Soil and plant nutrition. Research covers soil and plant chemistry, fertiliser and trace-element technology, soil and plant tissue testing techniques, fertiliser requirements, modelling, and growth substrates.
A comprehensive chemical soil-testing and fertiliser advisory service for farmers is provided by the division. A fertiliser recommendations bulletin is published for use by farm advisers. It includes many years of research information and produces models of nutrient cycling in New Zealand in order to predict nutrient requirements. Soil, crop, and stock types; rainfall; stocking density; the degree of pasture utilisation, and its carrying capacity are all taken into account, as well as the results of the soil tests. Collation of recommendations carried in the bulletin has been computerised.
The use of nitrogen-fixing legumes (such as white clover) reduces the need for nitrogen fertilisers on pasture. Some urea fertiliser is used to stimulate pasture growth at the beginning of the season or to speed recover)' from drought. Legumes get their nitrogen-fixing ability from rhizobia (bacteria which infect the roots of legumes). Research identifies the most efficient rhizobia strain for each legume species and ensures that each legume is infected with the right strain.
Fertiliser is becoming increasingly expensive. Concern over the falling quality of superphosphate fertilisers resulted in the adoption of citric-acid-soluble phosphate as a measure of agronomic effectiveness. Research emphasis is on investigating new types of fertiliser and more efficient ways of application.
Pasture and crop. Research includes plant species and cultivar evaluation, management, microbiology, and weed and pest control.
Pasture research is aimed at achieving the maximum pasture response from the minimum inputs of energy, labour, fertiliser, and capital. Maximum use is made of this production by matching animal requirements as closely as possible to pasture growth. (The calving of dairy cows, for instance, is timed to ensure that maximum milk production coincides with maximum pasture growth, minimising the need for expensive conserved fodder, such as hay or silage.)
New legume cultivars, adapted to certain conditions, may increase production without large applications of fertiliser (for example, ‘Grasslands Maku’ lotus will outproduce white clover on acidic, low-fertility soils). Scientists are evaluating new cultivars and species, and developing management techniques for them.
Insect pests cause large pasture and crop losses each year. Integrated pest management systems offer the most effective and economical control, and are being developed for the major pests. The procedures include relating pest numbers and stages of development to plant damage; monitoring changes in pest populations; identifying, selecting, and propagating plant species which are either pest tolerant or resistant (for example, lotus is resistant to grass grub); screening insecticides and identifying the most cost-effective dose levels; identifying and evaluating the significance of natural pathogens; and establishing the extent to which varying farm management procedures can contribute to control. Scientists are researching chemical, cultural, and management systems for controlling weeds—gorse, thistles, ragwort, and hawkweed as well as weeds affecting crops.
A six-year research project has shown that the sitona weevil is the probable cause of reduced lucerne yields in Canterbury. Lucerne is a popular drought-resistant crop, particularly in view of reduced returns from irrigated pasture. It grows well in shallow silt-loam soils, and is a valuable fodder in deer and lean lamb production. Research has identified an optimum time for insecticide application for this crop and this has increased economic returns.
Horticulture and viticulture. Research programmes evaluate cultivars, husbandry, and management, pest disease and weed control, soil and plant analyses, pollination, water requirements, harvesting methods and post-harvest physiology, orchard mechanisation and quality and marketing of crops including floricultural and nursery crops.
Current projects include developing small flowering and foliage pot plants for export, bare-rooted cymbidium orchids, and telopea, Limonium perigrinum and gentiana cultivars which are potential cut-flower crops with overseas markets.
Research into pesticides and other chemical residues on export horticultural crops is being undertaken in response to rigid regulations by importing nations. The organic chemistry section of the Ruakura Soil and Plant Research Station has developed successful spray programmes. The ministry is developing computer models of pesticide residue decay on kiwifruit which will allow growers and exporters to predict pesticide levels at harvest from specific spray programmes and to decide which spray programmes to adopt to meet the requirements of offshore markets. Similar approaches are also being developed for nashi, persimmon, berryfruit and other horticultural products.
Suitable analytical methods have been developed using a mass spectrometer to ensure that meat and meat products for export are free of organic compounds and environmental contaminants, such as the herbicide 2-4-5-T.
Irrigation. Winchmore Irrigation Research Station is investigating the large areas of potentially irrigable land in the South Island. Effective use of water is needed to achieve the most economic return on the investment. Programmed systems of cropping involve combinations of crops with different peak water requirements. Various crops are studied, as well as the efficiency of different methods of applying the water and the responses of different soil types to irrigation.
Energy. The ministry evaluates crops for ethanol and methane (biogas) production and maintains a centre for waste treatment and biogas technology. New techniques of both anaerobic digestion and biogas plant design and operation now offer the most efficient and cost-effective treatment of most solid wastes and wastewaters. These range from horticultural and meat processing wastes to dairy factory' whey. The centre has research contracts for waste treatment systems in New Zealand, and research is sponsored by local and overseas companies.
Other agricultural research. Other current studies in agricultural research by the Ministry of Agriculture and Fisheries include: aquatic weed control; beekeeping; forest farming; greenhouse design and construction; fencing; the development of agricultural and horticultural equipment; and the relevant application of electronics and robotics. The ministry is also involved in developing new products, production systems, means of harvesting, transport and marketing methods, and agricultural equipment.
Fisheries research. MAFFish has two national research centres. One, based at Greta Point in Wellington concentrates on marine fisheries research, while the other based in Christchurch specialises in freshwater fisheries research. The work of these national research centres is supported by regional fisheries research teams.
The major objective of the marine research section is to provide adequate information for reliable fish stock assessments. This is critical for optimum use and conservation of fisheries. All fisheries are dynamic. Research information needs to be continually updated to detect and adjust for changes in fish populations and to set accurate allowable catches under the quota management system (see section 16.3, Fisheries).
During 1987, increased research effort was directed at improving information on the major deepwater species, especially orange roughy and hoki. Research methods used included trawl surveys, acoustic estimates of biomass, catch sampling programmes and age validation techniques.
MAFFish is also providing research and developing consultancy services to meet the growing interest in aquaculture of species such as salmon, mussels and paua. Research in hatchery rearing methods for these species is producing excellent results and the MAFFish salmon hatchery at Glenariffe has been expanded. MAFFish researchers have developed techniques for culturing paua and these now are being tested on a commercial basis; the feasibility of a commercially funded hatchery programme for greenshell mussel spat is being investigated.
In freshwater, MAFFish research is also measuring the impact of developments such as power schemes on fish stocks and advising other authorities how to mitigate these.
The Ministry of Forestry undertakes and co-ordinates its forestry and forest-product research through the Forest Research Institute, which has three divisions at Rotorua and a fourth at Christchurch.
A research policy advisory group overviews management of the institute's resources and provides advice in the fight of international trends in forestry and forest product markets. The institute is the dominant New Zealand supplier of research and development to the forestry sector and also markets its research overseas. In 1988–89 the institute will earn more than 30 percent of its funding from commercial activities.
The work of the institute's four divisions is described below:
Forest management and resources. This division is responsible for research into exotic forest management, including soils, harvest planning, mensuration, economics and social science, and tree physiology. A comprehensive network of research trials in forests of the Forestry Corporation and private companies has been established throughout the country.
Forest health and improvement. This division undertakes research into tree breeding, nursery technology, forest establishment, entomology, pathology and indigenous forest management. A large research nursery exists within the institute's grounds at Rotorua and it is used in conjunction with the national network of research trials.
Wood technology. Research covers the properties and uses of wood and is concerned with a whole range of wood products and processing technologies.
Research areas include: wood structure and quality; wood chemistry; sawmilling; wood drying and preservation; timber engineering; biotechnology and product development. Pulp and paper research is carried out in the division by the Pulp and Paper Research Organisation of New Zealand which is funded jointly by government and industry.
Forestry Research Centre. Located in the grounds of the University of Canterbury in Christchurch, this division undertakes research into methods of protecting and restoring the soil, water, and other values of forests. It studies the ecology of mountain-land forests, the biology and control of introduced animals such as deer and possums, the effects of forestry on slope stability and erosion, and the use of revegetation for productive and protective purposes.
Industry, universities, and the Department of Scientific and Industrial Research also carry out research into many aspects of forestry and forest products.
Other government departments, universities, and agencies. In addition to the research work the Department of Scientific and Industrial Research in the social-science field, research in this area is also funded through the departments of Justice, Social Welfare. Education, Internal Affairs, Survey and Land Information and the Ministry of Forestry.
As New Zealand society faces the challenges of the future such as the introduction of new technology, the communications revolution, and changing employment and lifestyle patterns, there are greater demands for social-science research. It contributes to social impact assessment and the consideration of a human dimension in planning. The central disciplines of the social sciences include psychology, sociology, social anthropology, human geography, economics, social demography and political science. They are applied in fields such as social policy, education, social administration and criminology.
There are five main areas in which social scientific research is carried out in New Zealand: universities; research units in government departments and in some local government authorities; independent social research units which receive government funds, e.g. the New Zealand Council for Educational Research and the New Zealand Institute for Economic Research (Inc.); commercial market research firms, private research consultancies and research or analysis units within private enterprises; and voluntary agencies.
The bulk of university funding comes direct from the Department of Education but university research is also funded through the University Grants Committee. A number of government departments are, however, substantially increasing their contact with the universities by granting contracts for specific research programmes.
There are 10 industry research associations funded jointly by government and the industries they serve, and these were listed in table 13.4 (above).
Research and survey work in water and soil conservation management, formerly carried out by the Ministry of Works and Development, is now the responsibility of the DSIR. The DSIR operates three additional science centres; the water quality science centre in Hamilton, the hydrology centre in Christchurch, and the soil conservation centre in Palmerston North—whose 140 scientific and technical staff carry out applied research into many aspects of water and soil management. The Water Resources Survey was also transferred from the Ministry of Works and Development; its 100 technical staff are responsible for a nationwide programme of hydrological monitoring and data collection on freshwater environments.
The newly-established Works and Development Services Corporation now operates the Gracefield laboratory of the former ministry and continues to be active in research into and the investigation and design of river, harbour and coastal environments and structures. A number of additional functions of the ministry which related to water and soil management have been transferred to the Ministry for the Environment. These generally require application of existing knowledge to management issues, but there is a significant innovative content also, in areas such as development of guidelines for floodplan management.
New Zealand Institute of Economic Research. The New Zealand Institute of Economic Research was founded in 1958, following a recommendation from the 1956 Royal Commission on Money, Banking, and Credit Systems. It is an independent, non profit-making body with the primary objective of conducting research into economic problems affecting New Zealand. It is administered by a trust board consisting of 10 trustees elected by the subscribing members to the institute and five ex officio trustees including the Governor of the Reserve Bank, two university representatives and the Director. The institute is funded from membership subscriptions (mainly from the corporate sector), contracts and consultancy, and from grant income.
The institute is the largest group of economists in New Zealand outside the Public Service and the universities. Its research programme focuses on the economy in the short and medium term, economic growth, industry, energy and household economics. In addition it provides consulting and contract services.
The institute produces a variety of publications, including regular journals, research papers, discussion papers and working papers, and it contributes to the publications of other organisations.
Cawthron Institute. The only major endowed research organisation in New Zealand is the Cawthron Institute at Nelson, which was established in 1920 with a bequest of $pD250,000 under the will of Thomas Cawthron. As the value of the investment of the bequest has declined the institute has received increasing income from technical services earnings, and from a government grant which comprises about 41 percent of the institute's income.
The organisation of medical research is described in section 8.2, Public health.
The Patents Act 1953, the Trade Marks Act 1953, and the Designs Act 1953 are administered by the New Zealand Patent Office, a division of the Department of Justice. The main function of the Patent Office is to examine patent, trade mark, and design applications to ensure that only those which comply with the requirements of the relevant Act are granted (in the case of patents) or registered (in the case of trade marks and designs).
Patents are granted for a maximum period of 16 years, provided that the appropriate renewal fees are paid at three-yearly intervals. Trade marks may be kept on the register indefinitely as long as renewal fees are paid after an initial period of seven years, and every 14 years thereafter. Registration of designs is for an initial period of five years, with provision for two more five-year periods (giving a maximum of 15 years).
New Zealand is a party to the International Convention for the Protection of Industrial Property (the Paris Convention). Under this convention, each member state provides the Same protection to the inventions, trade marks, and registered designs of the nationals of other member states as it accords to those of its own nationals.
Details of patent, trade mark, and design applications and registrations are published in the monthly New Zealand Patent Office Journal. The total number of applications for the granting of letters patent, and for the registration of designs and trade marks during the financial year 1987–88 was 12260, which was 808 more than in the previous year.
Table 13.5. APPLICATIONS FOR PATENTS AND REGISTRATION OF TRADE MARKS AND DESIGNS
| Year ended March | Patents | Trade marks | Designs |
|---|---|---|---|
| 1984 | 3930 | 5478 | 702 |
| 1985 | 3932 | 5731 | 722 |
| 1986 | 4005 | 6612 | 648 |
| 1987 | 4183 | 6529 | 740 |
| 1988 | 4289 | 7285 | 686 |
Patents. The 4289 applications originated in the following countries: New Zealand 878; United States 1365; United Kingdom 477; Australia 381: West Germany 237; Switzerland 202; Japan 171; France 146; Netherlands 82; Canada 68; Italy 66; Sweden 53; Denmark 28; South Africa 20; Finland 18; and the balance of 97 from 22 other countries.
The technical content fell into the following categories: chemistry 2043; mechanical engineering 942; electrical engineering 417; home science and miscellaneous 410; building technology 283; and primary industries 194.
During the year 2321 applications proceeded to acceptance after search and examination and letters patent were sealed on 2073 applications. Thirty-one grants of patent were opposed and four applications for extension of term were filed. Twenty opposition proceedings reached finality and eight extension of term applications were resolved.
Trade marks. The 7285 applications for registration originated in the following countries: New Zealand 3052; United States 1367; Australia 808; United Kingdom 648: Japan 213; France 171; Italy 116; Switzerland 100; Sweden 69; Netherlands 62; Denmark 55; Canada 48; China 41; Hong Kong 36; Korea 27; Belgium 21; and the balance of 217 from 26 other countries.
During the year, 2030 applications were accepted, 2205 went to registration, and 3425 existing applications were renewed.
Designs. A total of 515 industrial designs were registered during 1987–88.
The New Zealand Industrial Design Council was established under the Industrial-Design Act 1966 to promote the development of industrial design with the object of improving the quality, efficiency, packaging, and appearance of goods produced in New Zealand.
The council provides a product development assessment service. This comprises a review of product design and quality management, and can lead to a product design award.
The council operates three award programmes:
Designmark. Applicant must have achieved a satisfactory level of design management expertise and quality assurance and control, and its product must have a satisfactory New Zealand manufacturing content, not be a copy, and comply with relevant standards and regulations.
New Zealand Design Award. Applicants must have contributed a high New Zealand design and manufacturing content to their product which must have been awarded a Designmark, show innovation, and demonstrate excellence in design.
Prince Philip Design Award for New Zealand Industrial Design. Each year between 40 and 50 recipients of a council award are invited to enter a specific product for assessment. Judging is by a specialist panel and on the basis of strict criteria set by Prince Philip who confirms the panel's decision before the winner is announced.
A corporate membership scheme gives industry the opportunity to invest in the council's work, while gaining free assessments and other benefits.
The Standards Act 1965 established the Standards Council as the governing body of the Standards Association of New Zealand. Its aims are to improve efficiency and stimulate development in industry and commerce by providing standards documents, which will also assist in promoting public and industrial welfare, health, and safety. The association administers the New Zealand Standard certification mark scheme, which encourages improved quality control in industry with consequent improvement in the quality of consumer goods.
It also provides a service known as ‘Technical Help to Exporters’ which provides assistance to manufacturers whose products need to comply with the standards and regulations of overseas markets. On 1 April 1987 SANZ became the New Zealand enquiry point for the GATT code on Technical Barriers to Trade, thereby providing additional assistance to exporters.
The council regards international standardisation as an important factor in facilitating trade. The association is the New Zealand member of the International Organisation for Standardisation, the International Electrotechnical Commission, and the Pacific Area Standards Congress.
The Standards Association's library holds full sets of New Zealand standards, international standards and the publications of the International Special Committee on Radio Interference. Library references also include the national standards of the United Kingdom, Australia, United States, Germany and many other countries. Copies of all standards, from whatever source, can be obtained from the association's sales service.
The Standards Association's information service provides comprehensive technical information on New Zealand, overseas and international standards. The association publishes new and revised New Zealand standards and amendments. Details of these and of other national and international standards activities are given in a monthly publication, Standards. A catalogue, published annually, lists all the standards in use in New Zealand.
The association depends on the subscriptions of members and on sales of standards for the greater portion of its income. Sales of publications exceeded $1.3 million in the 1986–87 year. Subscribing membership of the association totalled 1828 at 31 December 1987, while 40 companies and government agencies had voluntarily increased their subscriptions to levels qualifying for recognition as sustaining members.
13.1 Science and Technology Advisory Committee.
13.2 Department of Scientific and Industrial Research; Ministry of Agriculture and Fisheries; Ministry of Forestry; Science and Technology Advisory Committee; New Zealand Institute of Economic Research.
13.3 Department of Justice; New Zealand Industrial Design Council; Standards Association of New Zealand.
Agrisearch. MAFTech, Ministry of Agriculture and Fisheries, (quarterly).
Directory of New Zealand Design Expertise. New Zealand Industrial Design Council, 1985.
Forest Research Institute, Annual Report.
Key to Prosperity, Science and Technology: Report of the Ministerial Working Party, 1986.
Patent Office Journal. New Zealand Patent Office (monthly).
Report of the Department of Scientific and Industrial Research (Parl. paper G. 21).
Report of the Ministry of Forestry (Parl. paper C. 16).
Report of the Ministry of Agriculture and Fisheries (Parl. paper C. 5).
Research and Development in New Zealand: A Public Policy Framework. New Zealand Institute of Economic Research, 1987.
Standards. Standards Association of New Zealand (monthly).
Table of Contents
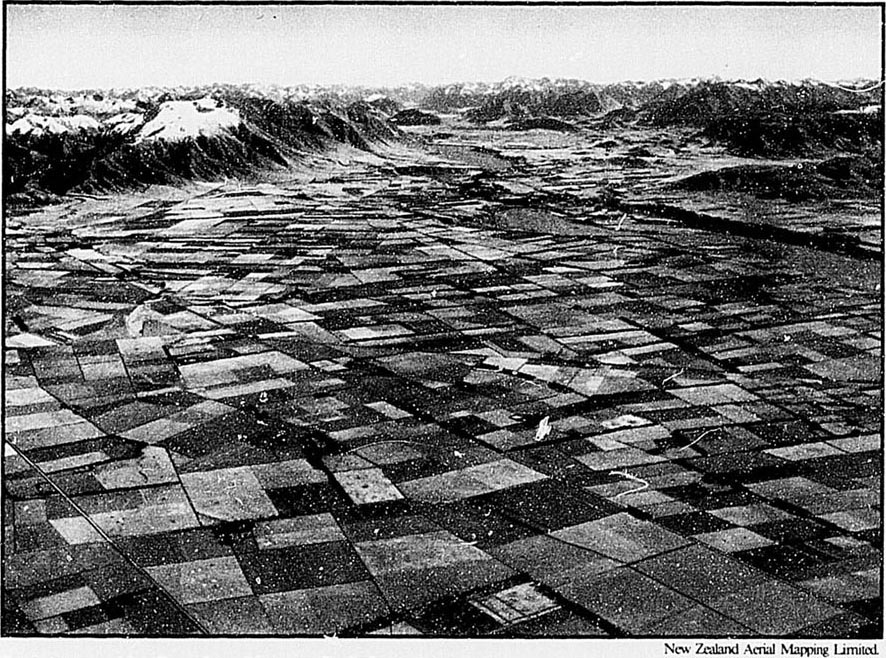
Looking across the Canterbury Plains to the Rakaia Gorge.
The Department of Survey and Land Information is the principal government civil and military survey, mapping and land information agency. It has a statutory responsibility to provide the cadastral and geodetic framework, and associated systems to support secure land tenure and property rights in New Zealand. The major functions of the department include the maintenance and extension of the survey control system; examination of all land title surveys; development of the digital cadastral data base; co-ordination of government aerial photography requirements; the publication of topographical, cadastral and special maps; the production of cadastral data in digital and paper formats; and investigations into the status of Crown land and Maori land.
Surveying. The survey control system, in the form of trigonometrical and other geographically located stations, provides the basis for effective integration of surveys executed by all sectors for land title definition, land development and utilisation, engineering and construction, communications, mapping production, scientific studies, and the location of marine and air navigation aids. Examination and approval by the department of all land title surveys ensures the security of tenure essential to development, and the maintenance of all survey records on a microfilm system provides for ready access and utilisation of data. The control of survey standards, maintenance of discipline, and training of professional surveyors is effected through the Survey Board, which is chaired by the Surveyor-General. The Department of Survey and Land Information also completes surveys for land title, land development, navigational purposes, earth deformation studies, administration of justice, land and environmental planning, draughting services related to local government administration, census and electoral activities, and mining applications, Computerisation of land records as the base of a national cadastral land information system began in all land districts by the end of 1988.
The practising surveyors in the private sector play a major role in surveys of private lands under the Land Transfer Act 1952, the planning and development of housing projects, and the execution, under contract, of some government surveys.
Aerial photography. Extensive use is made of aerial photography for photogrammetric mapping and in the annual provision of basic physical resource and planning data. A computer system to capture, edit and manipulate data from aerial photography was installed in June 1988. Photography is undertaken by private aerial survey firms under contract to the Department of Survey and Land Information, which maintains a comprehensive library of air photos for all national purposes and general public usage. The department now receives and holds multispectral imagery collected by earth-resources satellites for use in studies associated with land use and management, regional planning, and scientific research.
Mapping. Both the Imperial maps and the basic metric topographical and cadastral maps now under production provide a reliable inventory of physical resources and an up-to-date identification of land parcels and legal situations. They are in constant demand for planning, construction, development of land, extension of public and social services, protection of the environment, the general use and guidance of the public, administration of central and local government, and defence. Regularly updated street maps cover all significant urban areas. The Department of Survey and Land Information produces and publishes a wide range of other maps for various purposes including recreation, national parks, and miscellaneous and general maps of New Zealand, the Pacific, and Antarctica. As the government mapping agency, the department produces maps needed to service the activities of other departments, particularly aeronautical charts for military and civil use, meteorological maps and charts. Topographic and orthophoto mapping produced by photogrammetric methods for projects and special purposes is executed at larger scales to provide a base for investigation and design of energy, irrigation, forestry, and communications projects.
Maps are sold at the Department of Survey and Land Information, Heaphy House, Wellington, and at each district office. Bulk map supplies and a world reference library of maps are held at the Infomap Centre, Upper Hutt. In addition, a large number of retail agents have been appointed in New Zealand and overseas. All maps for sale are listed in the Catalogue of Maps published by the department. Maps for the New Zealand land inventory are being produced, with first priority being given to areas where land-use change can be anticipated. These maps are produced from authoritative data and are published to uniform standards and presentation. They show the physical and cultural data about land, and overlays can be prepared to assess physical suitability for different land uses.
Title to land in private ownership in New Zealand is a matter of public record. The keeping of these records is the function of the Land and Deeds Division of the Department of Justice.
Almost all privately-owned land in New Zealand is held under the land transfer system, presently embodied in the Land Transfer Act 1952. The principal features of the system are registration of title and guarantee of that title by the state.
Under the land transfer system, land and interests in land do not pass by the execution of an instrument of transfer but by the registration of that instrument. A person acquires a legal interest in land not by entering into an agreement to purchase the land, but by registering the instrument of transfer and by being recorded on the register as the owner. The certificate of title is the pivot on which the whole land transfer system turns. A certificate of title is issued under the hand and seal of the District Land Registrar (of which there are nine nationally, responsible for 12 district registries), which guarantees to the registered proprietor of the land described in that certificate his or her rights of use, occupation, and enjoyment, the extent and position of his or her boundaries, and specifies the nature of any encumbrances or interests affecting his or her land, such as mortgages or rights of way. Two copies of the certificate of title are issued; one copy forms the land transfer register, and the duplicate is held by the owner. This duplicate must be presented to the land registry office for noting whenever documents affecting the estate for which it was issued are submitted for registration. Any change in the registered proprietorship which occurs through transfer, death, or other devolution, and any new encumbrances to which the land is subject may be entered on the register by the registration of the appropriate documents.
Interests in, and charges against, land arising from many other statutes may be noted against the land transfer register. Successive governments have charged the Land and Deeds Division with duties of surveillance under the laws relating to the subdivision and aggregation of land, disposition of public reserves, anti-slumming requirements of local authorities, and many other aspects of land use and occupation. Certain leases and licences of Crown land may be registered under the provisions of the Land Transfer Act, and Maori land when vested in any person for a freehold estate comes automatically under the land transfer system.
Table 14.1. CERTIFICATES OF TITLE ISSUED
| Year ended 31 March | Total |
|---|---|
| Source: Department of Justice. | |
| 1982 | 36,472 |
| 1983 | 38,910 |
| 1984 | 39,913 |
| 1985 | 42,292 |
| 1986 | 44,818 |
| 1987 | 44,660 |
Control of land acquisition. Safeguards have been made for long-term planning in the use of land, whether publicly or privately owned, in order to ensure that it and its resources are used to the best advantage of the community as a whole. Legislation prevents, where there is an operative regional plan or district scheme, the acquisition by overseas interests of land of 4000 square metres or over designated or zoned as reserves for recreation or other purposes, and all islands or parts of islands within 150 kilometres of the mainland, and the Chatham Islands.
The legislation covers rural land and farmland of 2 hectares or over. Here a purchase may be approved if specified conditions, ensuring beneficial use of the land from a national viewpoint, or permanent future residence, are met. The Administrative Division of the High Court may approve a purchase where the purchaser or lessee is a person ordinarily resident in New Zealand. Where the purchaser or lessee is not a person ordinarily resident in New Zealand or is an overseas company, the court will not give consent unless it is satisfied that the land is not required for any reserve purpose and that the land is not an island or forms part of the Chatham Islands. In the case of farmland, the court must be assured that the purchaser or lessee intends to conduct experimental or research work on the land which will benefit agricultural industries in New Zealand or the community generally. If the land will be used for other than agriculture it must be demonstrated as being of greater advantage to the community. In the case of an individual wishing to farm he or she must show that they intend to reside permanently in New Zealand and farm the land exclusively for their own use and benefit and have the ability and means to do this.
These conditions are set out in the Land Settlement Promotion and Land Acquisition Act 1952, which authorises the Minister of Lands to take, in certain circumstances, any farmland that is suitable for settlement, and is, or when subdivided and developed will be, capable of substantially increased production. A second part of the Act deals with the control of sales and also leases (for three years or more) of farmland to prevent undue aggregation. The consent of the court is required unless the purchaser or lessee owns no farmland, has no interest in any estate or trust owning farmland, has not since the passing of the Act transferred any farmland to any person as trustee or created any trust in respect of farmland, and has entered into the transaction solely on his or her own behalf.
The Act also prevents the purchase of farmland, without the consent of the court, by a trustee for any person under the age of 17 years, or the purchase by a company or trustee for a company to be formed where the shareholders are fewer than 10 in number and any member of such company is under the age of 17 years (or where shares will be held in trust for any person under that age at the date of the transaction).
Table 14.2. LAND TRANSFERS REGISTERED
| Year ended 31 March | Total transfers | Total consideration | ||
|---|---|---|---|---|
| Number | Percentage change | Amount | Percentage change | |
| $(million) | ||||
| 1983 | 99356 | -26.7 | 5,712.1 | -13.1 |
| 1984 | 105584 | + 6.3 | 6,360.4 | +11.3 |
| 1985 | 113988 | + 8.0 | 7,813.0 | + 22.8 |
| 1986 | 127063 | + 11.5 | 10,128.9 | + 29.6 |
| 1987 | 140077 | + 10.2 | 13,448.6 | + 32.8 |
Table 14.3. CONSIDERATIONS FOR LAND TRANSFERS, 1987*
| Consideration group | Freehold | Leasehold | All transfers | ||||||
|---|---|---|---|---|---|---|---|---|---|
| No. | Total consideration | Average consideration | No. | Total consideration | Average consideration | No. | Total consideration | Average consideration | |
| * Year ended 31 March. | |||||||||
| $ | $(million) | $(000) | $(million) | $(000) | $(million) | $(000) | |||
| Under 2,000 | 1011 | 1.0 | 1.0 | 25 | -- | 1.0 | 1036 | 1.0 | 1.0 |
| 2,000–2,999 | 579 | 1.3 | 2.3 | 36 | -- | 2.4 | 615 | 1.4 | 2.3 |
| 3,000–3,999 | 577 | 1.9 | 3.3 | 65 | 0.2 | 3.5 | 642 | 2.1 | 3.3 |
| 4,000–7,999 | 3031 | 17.7 | 5.8 | 235 | 1.4 | 5.8 | 3266 | 19.0 | 5.8 |
| 8,000–9,999 | 1671 | 14.6 | 8.7 | 79 | 0.7 | 8.5 | 1750 | 15.3 | 8.7 |
| 10,000–14,999 | 4368 | 52.6 | 12.0 | 119 | 1.4 | 12.1 | 4487 | 54.0 | 12.0 |
| 15,000–19,999 | 4035 | 68.3 | 16.9 | 77 | 1.3 | 16.6 | 4112 | 69.6 | 16.9 |
| 20,000–49,999 | 26701 | 957.8 | 35.9 | 514 | 18.1 | 35.1 | 27215 | 975.8 | 35.9 |
| 50,000–149,999 | 80011 | 6,725.4 | 84.1 | 1338 | 112.4 | 84.0 | 81349 | 6,837.9 | 84.1 |
| 150,000–199,999 | 6418 | 1,082.6 | 168.7 | 161 | 27.6 | 171.7 | 6579 | 1,110.3 | 168.8 |
| 200,000 and over | 8838 | 4,271.1 | 483.3 | 188 | 91.1 | 484.4 | 9026 | 4,362.1 | 483.3 |
| Total, all groups | 137240 | 13,194.3 | 96.1 | 2837 | 254.3 | 89.6 | 140077 | 13,448.6 | 96.0 |
The division into freehold and leasehold demonstrates the relatively small percentage of land transfers involving leasehold property.
Table 14.4. LAND TRANSFERS BY AREA OF PROPERTY, 1987*
| Size group (hectares) | North Island | South Island | New Zealand | ||||||
|---|---|---|---|---|---|---|---|---|---|
| Number | Area | Total consideration | Number | Area | Total consideration | Number | Area | Total consideration | |
| * Year ended 31 March. | |||||||||
| hectares (000) $(million) | hectares (000) $(million) | hectares (000) $(million) | |||||||
| Under 2 | 100368 | 13.1 | 9,918.6 | 31054 | 3.6 | 2,112.4 | 131422 | 16.7 | 12,031.0 |
| 2 and under 6 | 2574 | 9.5 | 3544 | 819 | 3.0 | 84.8 | 3393 | 12.5 | 439.2 |
| 6 and under 11 | 943 | 7.5 | 201.9 | 399 | 3.3 | 46.3 | 1342 | 10.8 | 248.2 |
| 11 and under 20 | 591 | 9.0 | 91.9 | 234 | 3.5 | 24.3 | 825 | 12.4 | 116.2 |
| 20 and under 50 | 914 | 29.8 | 193.8 | 448 | 14.0 | 47.8 | 1362 | 43.8 | 241.5 |
| 50 and under 75 | 356 | 21.7 | 80.9 | 133 | 8.2 | 19.1 | 489 | 29.8 | 100.0 |
| 75 and under 100 | 194 | 16.6 | 37.2 | 97 | 8.4 | 13.0 | 291 | 25.0 | 50.2 |
| 100 and under 200 | 276 | 39.6 | 64.2 | 238 | 34.2 | 38.3 | 514 | 73.9 | 102.5 |
| 200 and over | 251 | 123.4 | 70.4 | 188 | 109.0 | 49.3 | 439 | 232.4 | 119.8 |
| Total | 106467 | 270.2 | 11,013.4 | 33610 | 187.2 | 2,435.2 | 140077 | 457.4 | 13,448.6 |
Table 14.4 includes both urban and rural land transfers. The majority of the urban transfers are in the ‘under 2 hectares’ size-group, which is 94 percent of the total. Besides normal residential properties, this size-group includes many business, commercial, and industrial properties, and blocks of flats.
Table 14.5. LAND TRANSFERS BY LAND REGISTRATION DISTRICTS
| Land registration district | 1985–86 | 1986–87 | ||||
|---|---|---|---|---|---|---|
| No. | Area | Total consideration | No. | Area | Total consideration | |
| * The urban areas of Auckland are in the North Auckland Land Registration District. | ||||||
| hectares (000) | $(million) | hectares (000) | $(million) | |||
| North Auckland* | 45562 | 104.5 | 4,593.4 | 55494 | 85.1 | 6,851.5 |
| South Auckland | 20074 | 88.6 | 1.406.1 | 20218 | 50.4 | 1,487.9 |
| Gisborne | 1127 | 15.0 | 77.9 | 1054 | 32.1 | 74.5 |
| Hawke's Bay | 4587 | 39.5 | 302.0 | 4473 | 26.7 | 312.9 |
| Taranaki | 3224 | 40.2 | 221.9 | 3012 | 22.3 | 203.3 |
| Wellington | 19748 | 60.7 | 1,446.9 | 22216 | 53.6 | 2,083.3 |
| Marlborough | 1585 | 21.1 | 97.4 | 1618 | 14.1 | 113.9 |
| Nelson | 3080 | 43.2 | 204.0 | 3153 | 25.6 | 243.7 |
| Westland | 811 | 5.6 | 31.1 | 833 | 9.5 | 39.4 |
| Canterbury | 16498 | 79.4 | 1,135.8 | 18032 | 66.2 | 1.373.5 |
| Otago | 6519 | 48.9 | 425.1 | 6745 | 44.2 | 486.3 |
| Southland | 3248 | 53.0 | 187.4 | 3229 | 27.6 | 178.4 |
| Total | 127063 | 599.7 | 10,128.9 | 140077 | 457.4 | 13,448.6 |
Figures of average consideration, and indeed all land transfer data, should be used with caution owing to the great diversity of property transactions covered by the figures. These transactions include, for example, sales of residential properties, farms and farmland, all classes of commercial, industrial, and business properties, sections, and parcels of land bought for such purposes as large-scale manufacturing, forestry, recreation, reserves, and later subdivision. Movements in prices of individual types of properties are given in section 19.2, House purchase and mortgage finance.
Recent figures for freehold open-market sales of farmland are shown in table 14.6. Family sales are excluded, as are leasehold sales and sales for uses other than primary production.
Table 14.6. MARKET SALES OF FREEHOLD FARMLAND
| Half year ended | No. of sales | Total sale price | Index number* | Percentage change from previous half year |
|---|---|---|---|---|
* Base (= 1000) half year ended June 1980. Source: Valuation New Zealand. | ||||
| $(million) | ||||
| Dec 1983 | 1386 | 268.2 | 2005 | +0.8 |
| Jun 1984 | 1579 | 353.4 | 2084 | + 3.9 |
| Dec 1984 | 1498 | 329.0 | 2095 | +0.5 |
| Jun 1985 | 1217 | 247.8 | 2137 | +2.0 |
| Dec 1985 | 1370 | 305.4 | 2090 | -2.2 |
| Jun 1986 | 882 | 166.8 | 2036 | -2.6 |
| Dec 1986 | 1046 | 185.5 | 2016 | -1.0 |
| Jun 1987 | 1269 | 285.6 | 1914 | -5.1 |
Before European settlement, all land was held by the various groups and tribes of the Maori people in accordance with their traditional customs and usage. The land remaining in this tenure is termed ‘Maori customary land’. By the Treaty of Waitangi, the right to purchase land from Maori was reserved to the Crown. Almost all of what had been Maori customary land was converted to other forms of title by one or other of the following processes: (a) purchase or other acquisition by the Crown (from whom the European colonists obtained land for farms, etc.); (b) the issue of a Crown grant to a Maori owner on the recommendation of the Maori Land Court: and (c) the issue of a freehold order by the Maori Land Court in favour of the Maori found entitled upon an investigation of title. (This process was used instead of process (b) after the introduction of the land transfer system into New Zealand.) Land in titles issued under the latter two processes became known as Maori freehold land. A Maori may buy or otherwise acquire land which is not Maori freehold land, i.e., general land, and for this reason there is an unknown but considerable amount of general land owned by Maoris in addition to their holdings of Maori freehold land. The area of Maori freehold land in New Zealand is 1305698 hectares. Maori freehold land is subject to the jurisdiction of the Maori Land Court pursuant to the Maori Affairs Act 1953 and some general land owned by Maori is subject to certain provisions of that Act.
Maori Land Court. The Maori Land Court's general function is to deal with problems peculiar to multiple ownership of Maori lands, including: the partitioning and combining of titles for better utilisation; the effecting of exchanges; directing meetings of owners, and confirming or disallowing resolutions passed by such meetings; confirming sales; and making other miscellaneous orders (including in certain cases, determining entitlement to, and vesting in persons entitled, the beneficial interests of deceased owners, in Maori freehold land). The Maori Land Court and Maori Appellate Court are further described in section 10.1, Legal system.
Maori land development and rural lending. One of the principal functions of the Board of Maori Affairs is to encourage the development and use of Maori land for the benefit of Maori owners. This is achieved through either the Department of Maori Affairs administering the land or loans to landowners themselves.
The Maori Affairs Act 1953 allows Maori landowners to vest the control of their land in the Department of Maori Affairs, which in turn carries out a development programme. The debt associated with the development is charged against the land, and is ultimately recovered from the farming operations before the land is returned to the owners' control and management. There are 438 trusts and incorporations, under which representatives of the owners are appointed by the Maori Land Court to manage the affairs of properties. The developments undertaken cover a diverse range of enterprises. As at 30 June 1987 there were 86 development schemes in operation covering an area of 111121 hectares, of which 69787 hectares was in grass, 215 hectares in horticultural development, and 2081 hectares in pine forests and plantations.
The Board of Maori Affairs also makes normal mortgage finance available to assist Maori farmers, trusts and incorporations, in the agricultural and horticultural areas. Substantial assistance has been given to Maori authorities for horticultural development in recent years.
Before the reorganisation of environmental administration which took place in 1987, two government departments administered the areas of public land owned by the Crown, covering approximately half the area of New Zealand. The former Department of Lands and Survey administered Crown land under the Land Act 1948, reserves under the Reserves Act 1977, and national parks under the National Parks Act 1980. The former New Zealand Forest Service administered extensive state forests under the Forests Act 1949. This system of public land administration had developed since the nineteenth century. The objectives of the departments concerned, and the purposes for which various categories of land were held, were mixed. For example, the Forest Service had commercial and conservation functions. It managed some planted and natural forests for timber production, while it held other natural forests in a protective role related to erosion and water resources. Some state forests also had recreational and other uses. Similarly, the Department of Lands and Survey administered sequestered areas for preservation and conservation, for example, as national parks and reserves, and it also managed large areas of Crown land for production.
Re-allocation of Crown land. One of the main aims of recent public sector reform (described in chapter 3, Government) has been to rationalise the commercial and other functions of public sector organisations, including their environmental functions. New agencies have been established and given non-conflicting objectives. As part of the reform, it has been necessary to re-allocate the extensive public landholdings to the new government departments and state-owned enterprises established on 1 April 1987. Although the re-allocation of land must be worked through in detail, the broad scheme of re-allocation is illustrated in the diagram below.
The State Owned Enterprises Act 1986 established nine new state-owned enterprises, four of which will have significant holdings of what is presently Crown land. These are Land Corporation, Forestry Corporation, and to a lesser extent Electricity Corporation and Coal Corporation.
The new Department of Conservation was also established in 1987 and its role is described in section 14.3, National parks and reserves. A Department of Lands was created as a temporary residual unit to deal with Crown land not already allocated to the new organisations.
Commercial state forests are to be purchased by the Forestry Corporation and the titles transferred. Non-commercial forests have been re-allocated to the Department of Conservation, as have reserves and national parks. Commercial Crown land is to be purchased by the Land Corporation, and the titles transferred.
The actual position is more complicated than this general scheme. For example, the Forestry Corporation is to acquire some pieces of Crown land, and the Land Corporation some areas of state forest. Molesworth Station and pastoral leases, including extensive areas of South Island high country, are to remain under Crown title, but be managed by the Land Corporation on the Government's behalf.
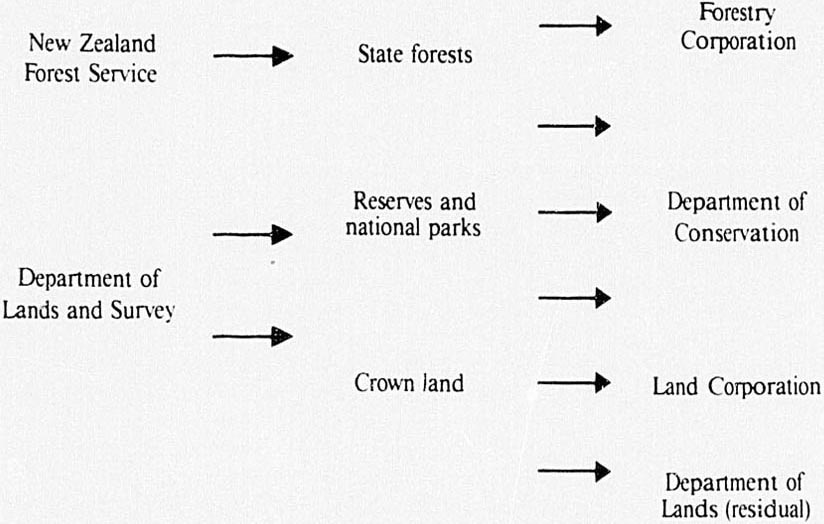
REALLOCATION OF PUBLIC LANDS, 1987
The allocation of these lands to the new organisations has been delayed for a number of reasons. For the Department of Conservation, continuing negotiations and problems with definition of boundaries have prevented the transfer of land by the time of going to press.
Concerns that transfers of Crown land to state-owned enterprises would prevent the subsequent return of lands in the event of successful claims before the Waitangi Tribunal led to an injunction being sought by the New Zealand Maori Council. In hearing the case the Court of Appeal declared that the transfer of assets to the state-owned enterprises would be unlawful, without the prior establishment of a system to consider if the transfers were consistent with the principles of the Treaty of Waitangi. The eventual result was the introduction into Parliament of the Treaty of Waitangi (State Enterprises) Bill and subsequent Act. The Act put in place a system of safeguards to apply after the transfer of assets to state enterprises. These safeguards include power for the Waitangi Tribunal to make a binding recommendation for the return to Maori ownership of any land transferred to slate enterprises under the State Owned Enterprises Act 1986. The Act also requires the Waitangi Tribunal to hear any claim relating to any such land as if it had not been so transferred and precludes state enterprises and their successors in title from being heard by the Waitangi Tribunal on claims relating to land transferred.
The settlement, and safeguards for Maori claimants contained in the Act allow for the transfers authorised by the State-Owned Enterprises Act 1986 to take place as soon as practicable.
Other land allocations, such as those to the Electricity and Coal Corporations, were at various stages in negotiation with Treasury through 1988.
Table 14.7. LAND AREAS TRANSFERRED TO STATE-OWNED ENTERPRISES, AS AT 31 MARCH 1988
| Category | Area (ha) | Percentage of total |
|---|---|---|
* Area for Westland Land District not yet available, these figures are indicative only. Source: Department of Survey and Land Information. | ||
| Total area of New Zealand | 26,800,000 | 100.00 |
| Department of Conservation | 7,000,000* | 26.10 |
| Land Corporation | 2,600,000 | 9.70 |
| Forestry Corporation | 76,9000* | 2.90 |
| Electricity Corporation | 59,000 | 0.20 |
| Coal Corporation | 10,000 | 0.03 |
| Unallocated Crown land | 40,0000 | 1.50 |
Records of unregistered lands of the Crown. Information on the status of and administrative responsibilities for lands of the Crown is a matter of public record. Where such lands are registered under the provisions of the Land Transfer Act 1952, current records of registered interests in that land are held by the Lands and Deeds Division of the Department of Justice. However, where such lands are unregistered the most comprehensive records available are held by the Department of Survey and Land Information.
Records relating to the new status and administration of unregistered lands of the Crown after the re-allocation described above are also held by the Department of Survey and Land Information. These records take the form of plans and schedules certified correct by Chief Surveyors pursuant to section 24 of the State Owned Enterprises Act 1986 and section 62 of the Conservation Act 1987. These plans and schedules will remain the prime records for these unregistered lands until they may be registered under the provisions of the Land Transfer Act 1952. Records for other unregistered lands of the Crown not allocated as a result of the environmental restructuring programme are also held by the Department of Survey and Land Information.
Land Corporation. The Land Corporation Limited (Landcorp) came into being on 1 April 1987 primarily to handle the Government's commercial farming and land management operations previously undertaken by the Department of Lands and Survey. The corporation has two main operating divisions: a farming division and a property division. These are supported by a corporate service division which incorporates finance, planning/marketing, and other activity.
The farming division is responsible for the corporation's farming operations involving some 2 million stock units on 170 properties spread throughout New Zealand. Among other projects, the corporation is involved in animal breeding schemes covering a range of animal species.
The property division is responsible for some 20000 leases, licences, mortgages and other financial instruments taken over from the Crown, for the administration of the South Island high country pastoral leases under a management agreement with the Crown, the development or sale of corporation lands, and the provision of professional consultancy services in both the rural and urban fields. The division also handles the sale of surplus government properties on behalf of government departments or other agencies (see below).
The corporation's head office is in Wellington. There are also nine branch offices and a network of sub-offices.
Disposal of Crown land. Until 31 March 1987 all Crown land was administered under the Land Act 1948. The Minister of Lands was charged with the administration of the Act. The central authority under the Land Act was the Land Settlement Board, which disposed of Crown land through the Department of Lands and Survey according to its classification, i.e., farm urban, commercial, industrial, and pastoral.
The administrative responsibility for the disposal of Crown land transferred to the Land Corporation from 1 April 1987 as a result of the environmental restructuring. The 1986–87 Yearbook contains a fuller description of the previous system of Crown land disposal. Data in the following table do not include transfers of land to the state-owned enterprises.
Table 14.8. CROWN LAND ALLOCATED 1987*
| Tenure | Number | Total area allocated | Purchase price or annual charges |
|---|---|---|---|
* Year ended 31 March. Source: Department of Lands. | |||
| hectares | $(000) | ||
| Freehold (cash sales) | 332 | 4481 | 14,995 |
| Renewable leases | 130 | 11143 | 262 |
| Pastoral leases and licences | |||
| Deferred payment licences | 111 | 10696 | 403 |
| Special leases (section 67 Land Act) | 8 | 557 | 7 |
| Licences to occupy | 142 | 1592 | 65 |
| Licences for removal of minerals | - | - | - |
| Leases of endowment and other lands | 32 | 84 | 22 |
| Total, 1987 | 755 | 28553 | 15754 |
| Total, 1986 | 768 | 55157 | 5,117 |
Table 14.9. LEASES AND LICENCES UNDER LAND ACT 1948, AT 31 MARCH 1987
| Tenure | Leases and licences | Area | Annual rent | Annual instalment* |
|---|---|---|---|---|
* Including improvement loading. † Licences are on a royalty basis only and areas and rents are not shown. Source: Department of Lands. | ||||
| No. | hectares | $(000) | $(000) | |
| Renewable leases | 4121 | 433952 | 4,125 | 53 |
| Pastoral leases and licences | 412 | 2855571 | 352 | 3 |
| Special leases | 731 | 99005 | 380 | 11 |
| Deferred payment licences | 9118 | 1128245 | - | 16,421 |
| Licences to occupy | 3478 | 100708 | 538 | - |
| Leases of endowment and other lands | 399 | 97281 | 279 | 126 |
| Licences for removal of minerals† | 18 | 4 | - | - |
| Total, 1987 | 1,8277 | 4714766 | 5,674 | 16,614 |
| Total, 1986 | 18997 | 4898081 | 5,538 | 14,627 |
Equitable land values are needed for: (a) levying land tax; (b) apportioning rating levies over contributing local authorities; (c) levying rates by local authorities; (d) lending money on mortgage by government departments and by trustees under the Trustee Act 1956; (e) assessing stamp, estate and gift duties; and (f) fixing prices for transfers of land to or from the Crown. Since the Government Valuation of Land Act 1896 a separate government department has been in existence to assess values of real estate for taxation and other central government purposes, and for local rating. The Valuation of Land Act 1951 and the Land Valuation Proceedings Act 1948 set the current guidelines for the department's operation.
The work of Valuation New Zealand, as the department is now known, is directed by the Valuer-General. The actual work of valuing is done by valuers under the supervision of district valuers. Valuers examine each property and estimate: (a) the capital value of the whole property (land and buildings plus other improvements); (b) the value of the land as if it were vacant; and (c) the value of the improvements (if any) upon the land. The estimated values should be neither above, nor below the fair selling values, in view of the many different purposes for which the values are used. Increased land values generally stem from public works, the successful working of other lands in the area, and the general prosperity and development of the country or locality. ‘Improvements’ on land are defined as items of work done or materials used on or for the benefit of the land which result in structural additions.
The valuation roll. A valuation roll is prepared for each district over which a territorial local authority sets rates. The roll shows the ownership, description and valuation of each property, including rates postponement and special rateable values where required. District valuation rolls are revised by the Valuer-General, usually at least every five years. Special valuations are made for particular purposes such as loans by government departments or trustees and the assessment of stamp, gift and estate duties. Valuation New Zealand operates an on-line enquiry system through which each of the 27 offices can instantly provide a printout showing information for any property in New Zealand.
When a district valuation roll is revised the Valuer-General, any local authority, or a property owner may object to any valuation. If only one property is revalued, the owner or any affected local authority may object. Objections can be taken to a land valuation tribunal, and ultimately objectors may turn to the Administrative Division of the High Court, which also hears claims for compensation under the Public Works Act 1981, and sets values under the Land Settlement Promotion and Land Acquisition Act 1952.
Rating valuations. By law, every local authority rating on the basis of either the capital value or land value, frames their valuation roll from the district valuation roll. A third major rating system is the annual (rental) value system, and the Valuer-General may be appointed to do these valuations. The annual value is defined as the rent at which a property would let from year to year, with certain reductions. These valuation rolls are prepared either annually or three-yearly.
Local authorities may grant applications for rates postponement for some residences in commercial and industrial zones, and for farmland in areas with urban development potential. Rates-postponement values are determined under the Valuation of Land Act 1951 or the Rating Act 1967. Special rateable values for non-conforming land in various zones are also made so these properties will not have a rating advantage.
The Rating Act 1967 also allows rating relief for farmland subject to rates levied by urban local authorities. The Act provides for an equitable adjustment of rates and levies between parts of a local authority if they are revalued at different times.
Table 14.11 shows the gross and net values on the valuation roll. Gross values include non-rateable property. Net values include all rateable property plus properties on which local authorities receive grants in lieu of rates.
Table 14.11. NATIONAL CAPITAL AND LAND VALUES. AS AT 31 MARCH 1987
| Type of local authority | Gross values | Net values | ||
|---|---|---|---|---|
| Capital value (land and improvements) | Land value* | Capital value (land and improvements) | Land value | |
* Included in previous column. Source: Valuation New Zealand. | ||||
| $(million) | ||||
| Counties and islands | 55,034.1 | 27,339.4 | 50,146.1 | 26,674.3 |
| Cities and boroughs | 77,898.2 | 24,579.5 | 72,326.5 | 23,541.6 |
| Town districts | 58.0 | 12.5 | 52.8 | 11.7 |
| Total | 132,990.4 | 51,931.4 | 122,525.3 | 50,227.6 |
Yearly revaluations of all properties in New Zealand are not made. However, using valuation equalisation, gross values for the whole country have been compiled in table 14.12. Comparing these figures with the gross values given in table 14.11 shows that valuation statistics tend to delay the appearance of current movements in the property market.
Table 14.12. NATIONAL GROSS EQUALISED CAPITAL VALUE, AS AT 31 MARCH 1987
| Type of local authority | Equalised capital value |
|---|---|
| Source: Valuation New Zealand. | |
| $(million) | |
| Counties and islands | 56,499.9 |
| Cities and boroughs | 114,896.8 |
| Town districts | 66.1 |
| Total | 171,462.8 |
Valuers Registration Board. The Valuers Act 1948 provides for the registration of land valuers and some control of their work. There is a registration board under the chairmanship of the Valuer-General, which issues certificates for registration to all valuers, and annual practising certificates to public valuers. The main objects of the Act are to secure a high standard of valuation work throughout the country and encourage competent valuers. Of the 1720 valuers registered as at 31 March 1987, 668 have taken out annual practising certificates for the current year. The majority of the remaining 1052 registered valuers are either employed in government departments, or do not make valuations for members of the public and thus are not required to hold annual practising certificates.
New Zealand occupies 26.9 million hectares. It is predominantly mountainous and hilly country and can be categorised in terms of slope and altitude. Over two-thirds (18.5 million hectares) slopes at greater than 12 degrees and nearly half at greater than 28 degrees. Approximately three-fifths of the country (16 million hectares) is over 300 metres above sea level, with one-fifth over 900 metres. It has been estimated that in pre-Polynesian times 78 percent of the total area (21 million hectares) was under forest cover, 14 percent was made up of the alpine zone, and the balance was drylands, lakes, and swamps. Polynesian and European settlement have seen a marked reduction of the original forest cover, by fire and conversion through the use of traditional and new development methods, to suit human needs.
Table 14.13. LAND USE TODAY
| Type of land | Area | Percentage of total area |
|---|---|---|
* These estimates are approximate only and at slight variance with those given in table 1.1, which gives a more accurate estimate of the total land area of Sew Zealand. Source: Ministry of Forestry. | ||
| hectares (million) | ||
| Total forested land | 7.2 | 26.8 |
| Pasture and arable land | 14.4 | 53.5 |
| Other land use | 4.9 | 18.2 |
| Minor islands | 0.1 | 0.4 |
| Lakes, rivers, etc. | 0.3 | 1.1 |
| Total area of New Zealand* | 26.9 | 100.0 |
Soil is a product of its environment: its composition depends on the parent ingredient, the climate, the length of time it has weathered, the topography, and the vegetation under which it has formed. The complex soil pattern of New Zealand is a result of the many different kinds of rock, and the various conditions under which the soils have formed. Climate varies from such extremes as the subtropical climate of North Auckland, the cold uplands of the alpine regions, and the semi-arid basins of Central Otago. The country's topography is equally varied, with 50 percent of the land classifiable as steep, 20 percent as moderately hilly, and only 30 percent as rolling or flat. The natural vegetation ranges from kauri forest to subalpine scrub, and from tussock grassland to broadleaf forest. Occasionally occurrences such as river floods on alluvial plains, sand drifts, or a volcanic ash eruption interrupt and alter the pattern of soil development.
Regional differences in New Zealand's soils result mainly from the effects of climate on topography. Soils weather more rapidly under high temperatures and become leached under heavy rainfall. Distinct soil gradations are found from west to east. These closely follow the isohyets (lines connecting places that receive the same amount of rain) on a climatic map.
Table 14.14. CLASSIFICATION OF NEW ZEALAND SOILS
| Region | Soils | Vegetation and land use |
|---|---|---|
| Source: DSIR. | ||
| North Auckland Peninsula and Auckland region | Large areas of infertile gumland soils formerly covered with kauri. Loams and clay from volcanic rocks. | Patchy land use. Exotic forests on sand country and remnant kauri forest on uplands. Intensive dairying on rolling lands around Kaipara Harbour. Whangarei, Kaikohe and Dargaville. Sheep and beef on hill country. |
| Bay of Plenty-Waikato-Thames-Hauraki Plains | Volcanic ash covers much of the area, giving rise to deep, yellow-brown loams with good physical properties. Peaty and gley soils with high ground water on Hauraki Plains and parts of Waikato Basin. | Intensively-farmed dairying region. Much of better dairying land in Bay of Plenty established in kiwifruit and subtropical horticulture. Maize cropping in Waikato Basin. |
| Volcanic Plateau | Pumice soils, lacking in some essential trace elements, but mostly deep, friable and highly suited to tree growth. | Important watershed with large areas protected as native forest. Extensive exotic forests. Topdressing of former scrub areas with trace elements has allowed widespread farming. |
| East Coast-Wairarapa | Yellow-brown earths. Significant areas of recent alluvial soils on Gisborne and Heretaunga Plains. Yellow-grey earths on rolling land south of Hawke's Bay. | Semi-extensive sheep fanning (wool and store sheep) on dry hill country. Intensive lamb production on flat to rolling plains. Market gardens and orchards near Gisborne, Napier, and Hastings. Important pip-fruit production. Vineyards. Pockets of dairying close to main ranges from Norsewood south. |
| Taranaki | Volcanic ring plain consists of yellow-brown loams, usually from deep volcanic ash, but stony in west. Soft-rock uplands in east Taranaki. | Distinct contrast between intensive dairying on ring plain, and severely eroded inland hill country, with many steep ridges covered in second-growth forest or dense gorse. |
| Manawatu-Horowhenua | Sand dunes and swampy hollows common along coast. Loess-covered terraces and river flats inland. Yellow-grey earths on drier terraces with sand soils near coast and organic and recent alluvial soils on lower plains. | Intensive sheep production and cropping on the terrace country; semi-intensive sheep and beef in hill country of Rangitikei. Exotic forestry on coastal sand country. |
| Marlborough Sounds-Nelson | Pockets of fertile, recent alluvial soils on Waimea and Motueka Plains. Large areas of steepland soils and stony soils on Moutere Gravels. | Intensive orcharding and market gardens. Exotic forests in Marlborough Sounds and Moutere Gravels. |
| Marlborough-Kaikoura Coast | Yellow-grey earths and yellow-brown earths with pockets of alluvial soils. | Intensive sheep farming and cropping on river terraces, semi-intensive sheep and beef on hill country. Vineyards in lower Wairau Valley. |
| West Coast | Extensive gley podzols and organic soils, with recent soils on alluvial flats. | Indigenous forestry declining; national parks and reserves; exotic forestry on hill country of north Westland. Dairying on river flats. |
| Canterbury | Very thick layer of gravel covered by variable thicknesses of fine material. Yellow-grey earths and associated stony soils. | Intensive cropping for cereals and fodder crops. Intensive sheep production, with widespread irrigation of pasture. |
| Otago | High-county yellow-brown earths on ranges, and semi-arid soils (often stony), in basins. | Extensive sheep and beef farming in uplands. Intensive orcharding in Central Otago basins, especially for stonefruit; irrigation necessary. Market gardening in lower Taieri. |
| Southland | Southland Plain mainly deposits of gravel and silt. Yellow-brown earths and recent alluvial soils. Yellow-grey earths inland in drier areas. | Semi-intensive sheep and beef farming in rolling areas inland, and intensive fattening on plains. Dairying on plains near Invercargill. |
New Zealand's principal planning legislation, the Town and Country Planning Act 1977, provides a process by which needs, opportunities, and issues relating to land and water use can be identified and appropriate objectives and policies formulated. Measures can then be embodied in regional, district, and maritime planning schemes. The purpose of planning is defined in the Town and Country Planning Act 1977 as being “the wise use and management of the resources, and the direction and control of the development of a region, district, or area in such a way as will most effectively promote and safeguard the health, safety, and convenience, and the economic, cultural, social, and general welfare, of the people and the amenities of every part of the region, district, or area”. Opportunities for public participation in town and country planning are broad and include any body or person representing some relevant aspect of the public interest. All public bodies, including the Crown, are required to adhere to the provisions of any approved regional planning scheme.
In the administration of district planning schemes, consideration must be given to specific matters of national importance. All Crown proposals which do not conform with the provisions of the relevant district scheme must be advertised and are subject to rights of objection and appeal. In considering appeals against any public work, the Planning Tribunal is required to consider whether the site is suitable for the proposed work, and the economic, social, and environmental effects of the proposal. In the case of Crown works, the Minister for the Environment can (as an alternative to an appeal) request the tribunal to conduct a public inquiry which must take into account the economic, social, and environmental effects of the proposal and any other related matters.
National planning. In the preparation, implementation, and administration of regional, district, and maritime planning schemes the following matters, which are declared to be of national importance, must be recognised and provided for: the conservation, protection, arid enhancement of the physical, cultural, and social environment; the wise use and management of New Zealand's resources; the preservation of the natural character of the coastal environment and the margins of lakes and rivers, and the protection of them from unnecessary subdivision and development; the avoidance of encroachment of urban development on, and the protection of, land having a high actual or potential value for the production of food; the prevention of scattered subdivision and urban development in rural areas; the avoidance of unnecessary expansion of urban areas into rural areas in or adjoining cities; and the relationship of the Maori people and their culture and traditions with their ancestral land.
Regional planning. Regional planning is concerned with establishing policies and programmes at all levels of government which reflect the needs and desires of the people of each region, and which are reconciled with the national interest and competing demands for national resources. Urban centres and rural areas cannot be planned in isolation from each other or from the nation as a whole.
Under the Town and Country Planning Act regional planning has four main features:
It is the responsibility of united and regional councils;
Regional planning schemes are to be approved by the Government before they come into operation;
Approved regional planning schemes must be adhered to by the Crown and every local and public authority; and
District and maritime planning schemes must conform with approved regional planning schemes. Matters to be dealt with in regional planning schemes embrace social, economic, and environmental policies. Reference is made for example to “natural resources and environment—the identification, preservation, and development of the regions' natural resources including water, soil, air and other natural systems, farmlands, forests, fisheries, minerals … and areas of value for the enjoyment of nature and the landscape”.
Under the Local Government Act 1974, regional or united councils were established for all regions of New Zealand, and all have regional planning responsibilities and powers under the Town and Country Planning Act 1977. The regional planning process offers a means by which local and central government, representing the regional communities and the national interest respectively, can reach agreement on development and welfare policies and priorities for the allocation of resources for each region. Agreement can be expressed in the regional planning scheme, and changes of policy can be worked out within the process of changing the scheme. In addition, under the Act, the Minister for the Environment may extend regional boundaries to include adjacent water areas and this provides for the planning of land and water to be brought together under the same administration.
District planning. Every district scheme under the Town and Country Planning Act 1977 is required to have as its general purpose the wise use and management of the resources of the district, and the direction and control of its development, in such a way as will most effectively promote and safeguard the economic, cultural, social, and general welfare of the people and the preservation of the amenities of the district. It must also recognise and provide for matters of national importance defined in the Act. Every city, borough, and county council or other authority responsible for the general administration of a district must provide and maintain a district scheme unless exempted by the Minister for the Environment. In particular, matters within district schemes include the preservation and conservation of the amenities of the district, and buildings, trees, bush, plants, landscapes, objects, or areas of architectural, historical, scientific, wildlife, visual, or other interest.
Councils have recognised the potential of the district planning scheme as an effective instrument for bringing about innovative change not only in land-use control but also in environmental management and local administration in general. The key to this is the emphasis placed on the scheme statement as a means of expressing policies which have been subjected to the formal approval procedures, including objection and appeal, that the Town and Country Planning Act provides.
A renewed concern for a more humane basis to planning has focused on the destruction of areas of natural beauty, the loss of historic areas of cities, and the destruction of neighbourhood communities as past errors which must not be repeated. With this in mind, a number of councils make provision for special character zones. These are zones which have a special character derived from the age, condition, or character of the buildings, general layout, or landscape features. In these zones the aim is to preserve the special character (using controls where necessary), for example, by encouraging new buildings designed in sympathy with the existing environment, and by more liberal approaches to the rehabilitation and use of existing properties.
In addition to these zones, a number of councils have adopted a variety of zones which cater for Maori-related uses on Maori land, the most prominent of these are the marae and papakainga zones. In the first instance, a zone is established which allows for the construction of the marae itself. The papakainga zone provides for residential development on Maori land which is generally in multiple ownership. These zones were created in order to balance the needs of Maori wishing to build on their ancestral land with other planning requirements.
Maritime planning. The need to plan for areas below mean high water mark, which are subject to increasing pressures from various demands, led to the introduction of maritime planning under the Town and Country Planning Act. The Act provides a statutory' procedure to establish maritime planning areas on the joint recommendation of the Minister for the Environment and the Ministers of Transport and Conservation; and to appoint maritime planning authorities. Four maritime planning areas cover the Waitemata, Manukau, and Wellington Harbours, and the Marlborough Sounds. In each case the respective harbour board has been appointed the maritime planning authority. If the maritime planning area is within harbour limits, the appropriate harbour board becomes the authority, unless it declines the appointment. The authority is required to set up a maritime planning committee with representation from the regional or united council, the regional water board, territorial local authorities, and the central government. Maritime planning schemes do not cover the whole of the coast, but only those areas where there are problems of conservation and management, or conflict between the use of the water and adjacent land areas.
This parliamentary office was established by the Environment Act 1986. The parliamentary commissioner continuously reviews the systems and agencies established by the Government to manage the allocation, use, and preservation of natural and physical resources. The objective is to ascertain that the system and agencies operate to improve the quality of the environment.
The Parliamentary Commissioner for the Environment also investigates the effectiveness of environmental planning and management carried out by public authorities and advises on ways of improving it. When any damage to the environment has occurred or might occur, the parliamentary commissioner may investigate and advise Parliament or the appropriate public authority on remedial action.
The Minister of Energy issues licences under the Coal Mines Act 1979 and the Mining Act 1971 for the exploration, prospecting, and mining of coal and minerals. Each licence issued generally contains conditions which restrict the working of the licence, cover rehabilitation requirements and protect the environment. Mineral exploitation on private land, as defined under the Mining Act 1971, may not in some cases require a licence under this Act. However, all gold and silver exploitation must be licensed. If a licence is not required, the operation may come under the Town and Country Planning Act 1977, and under the Quarries and Tunnels Act 1982 for safety requirements.
Problems of flood control have affected New Zealand communities at least since the beginning of European settlement. Wholesale clearing of forested land for pastoral and agricultural production has left a heritage of soil conservation problems, especially in geologically unstable areas. Administration of water and soil resources is achieved largely through the Water and Soil Conservation Act 1967, with protection against flooding and erosion control provided by the Soil Conservation and Rivers Control Act 1941. These Acts are administered by 20 catchment authorities throughout New Zealand, which are responsible to the Minister for the Environment. The minister is also advised on national water and soil policy by the Ministry for the Environment.
The management of water use, control of rivers, mitigation of erosion, assessment of coastal, landslip, and flooding hazards, and the protection of scenic and recreational waterways are achieved largely through these Acts by the work of these authorities. Some catchment authorities are directly elected by the people of the region while others are regional commissions of representatives of the local county and municipal councils. Both the regional structure, to administer these functions and the functions themselves were under review of the time of going to press.
Water resources. It has been estimated that New Zealand's consumption of water approaches 2000 million cubic metres per year. Households use 210 million cubic metres, industry 260 million cubic metres, livestock 350 million cubic metres, and irrigation 1100 million cubic metres per year. Approximately 87 percent of the population is supplied by public water-supply systems. The rest rely on an independent domestic supply (rainwater collecting, aquifer bores, etc.). Industry obtains about 33 percent of its requirements from public supply systems and 66 percent from its own sources. These figures do not include the use of water for hydro-electric generation which exceeds 100000 million cubic metres per year. Obviously, water flowing through hydro-station turbines can be used again, and on the Waikato River and its tributaries 10 state hydro stations, and a number owned by local authorities, use and reuse a flow which at Karapiro (the last station) is over 7000 million cubic metres per year. Thus the total irrigation, agricultural, industrial, and domestic water consumption could be supplied three times over by the Waikato River alone, at Karapiro. In terms of total water resources, the country has an estimated 300000 million cubic metres per year, although these are by no means evenly distributed. High mountains, especially in the South Island, create substantial rain-shadow areas. In a few areas, annual rainfalls of over 10000 mm have been measured, while in others as little as 340 mm may fall in a year.
In some parts of the country, including the Canterbury Plains, the Heretaunga Plains in Hawke's Bay, and the Waimea Plain near Nelson, underground water is an important resource. The cities of Christchurch, Lower Hutt, Napier, and Hastings draw at least some of their domestic and industrial supplies as well as irrigation water from such sources. Management of underground water, and its protection from contamination, is an increasing part of regional water board work in these areas.
Water allocation. By the Water and Soil Conservation Act 1967 all rights for the use of natural water were vested in the Crown. In general the management and administration of these rights was given to regional water boards to carry out on behalf of the Crown. Those wishing to use water for anything except domestic and stock purposes, or wishing to discharge wastes into natural waters, require a water right from a regional water board. The boards are thus able to ensure that available supplies are not overtaxed. Several boards have studied the total water resource in major catchments within their districts to assess the availability of the water resource and present and future demands on it.
In this process of water allocation planning, the public is given the opportunity to participate. The goal is the preparation of a water management plan for each region. This provides a framework within which a regional water board will operate when considering applications for rights to water. It also provides a guide to existing and prospective users of water, regarding the manner in which their rights to water may be reduced in limes of water shortage.
Maintenance of water quality also comes within the purview of regional water boards. Some waters of New Zealand have been classified. A classification fixes the minimum standards of water quality and provides a permissible range of water quality within which regional water boards must operate when controlling discharges of waste. Water rights may be restricted or suspended in order to maintain minimum standards of quality and, if a minimum flow in a river has been fixed, water rights may also be restricted or suspended to maintain that flow.
Water conservation orders may be placed on rivers, streams, or lakes. They may preserve wild and scenic characteristics of rivers and protect other natural features and instream uses of the country's natural water. Recreational, wildlife, fishery, scenic, or scientific interests can apply under these provisions for protection of water uses and the retention of natural conditions. Water conservation orders have so far been considered for the Motu, Ahuriri, Rakaia, Mataura and Rangitikei rivers, and Lake Wairarapa.
Irrigation. Irrigation was initially practised in New Zealand as a drought protection measure. It was not until the 1940s that the benefits of irrigation as a farm management tool were realised. Most of the earlier irrigation was concentrated in areas of Central Otago and South Canterbury. In both areas a high soil moisture deficit is experienced during summer, with hot drying winds. More recently, irrigation schemes have been promoted in North Canterbury and in Nelson and in parts of the North Island suitable for horticulture, particularly Northland and the Bay of Plenty.
Pastoral irrigation is predominant in the South Island and was traditionally centred around major rivers, drawing from them on a run-of-the-river basis. More recent schemes include storage for better water management for the needs of crops. In total, about 234000 hectares are now irrigated, by community- and government-supported schemes. Of this area. 218000 hectares are irrigated for pastoral purposes, mostly in the South Island, and 16000 hectares are irrigated for horticulture, almost entirely in the North Island. Since 1960 central government has supported 26 new irrigation schemes designed to irrigate approximately 73000 hectares. Of these, 13 schemes have been developed for pastoral and/or crop production, two for combined pastoral and horticultural development and nine are solely for horticultural development. Eight of the schemes are located in the North Island and all are for horticultural development. The 16 schemes which are located in the South Island are predominantly for pastoral and crop production, but there has been a changing emphasis to horticulture, and more recent schemes undertaken in the South Island have been for horticulture, or combined horticulture and pastoral use.
There are 20 older schemes in Canterbury and Central Otago, which have been operative for many years.
Private irrigation undertaken by individuals or groups of farmers has been practised over much of the country, often with the assistance of concessionary interest rates. Water for these schemes is generally drawn from underground sources, or pumped from rivers and drains, and applied by spray or trickle methods. Private flood-irrigation is limited to small gravity-supply schemes, which are comparatively few in number.
River control. The Soil Conservation and Rivers Control Act 1941 provides for the prevention of damage by erosion and the protection of property from damage by floods. River control projects carried out by catchment authorities often serve both these objectives. River training works are designed to give the river channel a stable alignment that will prevent bank erosion. Stopbanks are constructed to provide flood relief to low-lying and, mostly, highly-productive agricultural lands.
A catchment-wide approach to water and soil problems is encouraged. Comprehensive catchment control schemes embrace land retirement from grazing and protection planting of trees in the upper catchment; bank protection works in the middle reaches: and flood alleviation and drainage works in the lower reaches of a river. The Government allocated $39,746,000 for grants to catchment authorities for schemes to meet these purposes in the 1988–89 financial year.
Grants are given to schemes that are in the national interest, but which for some reason would not be implemented, or would only be carried out partially or inadequately without government incentives. Riverbank landowners, for example, may not be able to afford isolated bank protection works defending individual properties, whereas an integrated river control scheme bringing in a larger benefit area, and with a government contribution in recognition of the wider community benefits of such a scheme, would enable sufficient local funds to be raised.
Most major and many smaller rivers in New Zealand are now covered by control schemes for at least part of their length. As natural river systems change continually in response to variations in average rainfall and sediment supply, a sustained works programme is required on many rivers so that the standards of protection can be maintained. In urban areas the authority places emphasis on a policy of avoiding flood damage through planning measures such as flood-plain zoning and recommended minimum flow levels. This recognises that flood hazard partly is an artificial problem, which needs to be resolved not only by keeping water away from settlement but also by keeping settlement away from water.
Soil conservation. Changes in vegetation from land development have resulted in disturbed soil conditions in many parts of New Zealand. The protective, stabilising, and water-controlling combination of vigorous native vegetation, litter, and spongy soil has given-way to a shallow-rooted, less protective carpet of grass on a compacted impervious, and often exhausted soil. Natural erosion, caused by climatic factors (such as high-intensity rainfall and frost heave) combined with the geological instability of much of the country, has been aggravated by man-made effects. Soil erosion now occurs on more than 8 million hectares of hill country and mountain land, about one-third of the total area of New Zealand.
In the 1940s the Soil Conservation and Rivers Control Council began a number of measures to control soil erosion and to rehabilitate eroded catchments with the help of catchment authorities. Successful techniques that have been developed to control erosion include control of burning and animal pests, oversowing, topdressing, strict grazing control, soil conservation, fencing, stock-water ponds, gully control, contour ploughing, terraces, grassed waterways, and open and close tree planting. Grants at varying rates are available to farmers carrying out these control practices.
In the 1970s the New Zealand Land Resource Inventory' was completed for the main islands of New Zealand. This lists the physical factors of rock type, soil, slope, erosion and vegetation, and describes, in coded form, land parcels or units in terms of those combined factors. The inventory then identifies the land-use capability of each unit. Coverage at a scale of 1:63360 has been completed and 89000 land-management units have been mapped. The national coverage, coupled with its computer storage of both boundaries and codes, is a very effective and flexible physical base for soil conservation and general land use at regional through to local levels. Information on stock carrying capacity, fertiliser requirements, and potential for exotic forestry has been added to the inventory, and a national map series on erosion has been completed. A series of vegetation maps is in preparation.
Information from the inventory is also compiled at more detailed scales by catchment authorities for small catchments and individual farm properties, allowing soil conservators to recommend the best conservation practices, and management of particular areas of land to ensure sustained permanent production. A plan is formulated by a soil conservator and then discussed with the landowner concerned. The plan may then be adjusted to suit the landowner's ability to carry it out over several years.
Public concern for the environment has led to an increased awareness of pollution problems. Organisations have responded by involving the public in the decision-making processes and by amending legislation to provide the appropriate controls.
The problems of water pollution are being addressed by regional water boards through the Water and Soil Conservation Act 1967, and the Ministry of Agriculture and Fisheries, through the Fisheries Act, and the Department of Conservation, through the Wildlife Act, also have statutory powers to control water pollution; those of air pollution by the Department of Health under the provisions of the Clean Air Act 1972; and many local authorities have introduced bylaws to control noise in their areas.
Within the territorial sea and harbours, the Marine Pollution Act 1974 controls the discharge or dumping of oil or any other substance declared a pollutant. There is also a contingency plan for dealing with oil pollution in coastal waters and on the shore.
Pollution of rivers and lakes can be caused by soil erosion, farm run-off, industrial waste, or domestic sewage. The Water and Soil Conservation Act 1967 provides for the control of waste discharges through water rights. These include conditions ensuring that the discharge has had adequate treatment sufficient to protect the receiving waters. Diffuse forms of pollution like soil erosion and fertiliser run-off, require different approaches, such as through changing land use practices. Sewage and farm run-on add nutrients to the water, which in some lakes (e.g., Lakes Rotorua and Horowhenua) have caused excessive growth of weeds and algal blooms, to the detriment of water quality. Waste disposal from cities and the forestry' and meat industries are also major contributors to pollution. Urban solid-waste disposal is largely by the land-fill technique, and most major cities are establishing tip sites planned to last up to 50 or 100 years.
Organic chemical pesticides and herbicides are widely accepted as essential for efficient agriculture and horticulture. The use of such chemicals is controlled by the Agricultural Chemicals Board under the auspices of the Ministry' of Agriculture and Fisheries. The board controls the import of chemicals and has an approved list of proprietary herbicides and pesticides for use in different situations, such as in or near water. The board also gives guidance on the application of those chemicals.
Several divisions of the Department of Scientific and Industrial Research are concerned with monitoring pollution (see section 13.2, Research programmes.) A chemistry division conducts surveys of mercury contamination of fish and water arising from geothermal outflows. Nitrate concentration in ground waters and insecticides in water are measured, and checks are kept on heavy metals in foods. The Oceanographic Institute traces the biological effects of heated water discharges from thermal power stations. The Physics and Engineering Laboratory participates in the Earth's Resources Technology Satellite programme. The department also assists other industry-based organisations with projects to reduce pollution and increase the use of by-products which have in the past been wasted.
New Zealand's geography is, in general, favourable to the dispersal of air pollutants, although some areas, such as Christchurch, suffer from air pollution. The Clean Air Act 1972 established the principle of air pollution control on industry by the best practicable means. Provision was also made for the establishment of smokeless zones. A clean air zone has been established in Christchurch.
In January 1988 the Government announced a review of all the major laws concerned with the management of New Zealand's natural and physical resources. Included are the Town and Country Planning Act, the water and soil legislation, the minerals legislation, and the environmental assessment procedures. It has been widely acknowledged that the present resource management laws are inadequate. They are seen as too complex and legalistic, and often slow and costly. The aim of the reform is to produce integrated, workable, efficient and fair legislation.
The reform will question the relevance of all existing statutes and basic assumptions and its results will not to be prejudged. It is linked with the reform of regional and local government, and the review of coastal legislation. Wide public discussion and involvement is an essential part of the process and there is an open door policy on submissions, which means that although there are deadlines for particular phases of the reform, submissions received at any time will be used.
The reform has three phases. The first looked at the purposes, objectives and priorities for reform, and considered the role of government in resource management. Phase two will set out clear options for reform, and set priorities for preparing and reviewing legislation. Phase three will be concerned with the drafting of the new legislation which will be introduced to Parliament in August 1989.
A core group of officials and advisers, convened by the Ministry for the Environment, is responsible for managing the review, consulting interested parties, and keeping the public informed of progress. It reports directly to the Minister for the Environment and the Cabinet Committee on Reform of Local Government and Resource Management Statutes. This committee, which is chaired by the Minister for the Environment, will be primarily responsible for making policy recommendations to Cabinet.
The Department of Conservation administers all publicly-owned land in New Zealand that is protected for scenic, scientific, historic and cultural reasons, or set aside for recreational purposes. More than 5 million hectares—nearly 19 percent of the nation's total area—are under some form of protection.
There are 12 national parks, covering more than 2 million hectares, 21 forest parks, covering some 1.7 million hectares, and nearly 4000 reserves, including some 3000 hectares of protected private land, that have been set aside for scenic, scientific or ecological reasons. The department also has responsibility for the preservation and management of wildlife (as described in section 1.5, Vegetation and wildlife), wild and scenic rivers, the seashore and seabed to a distance of 12 nautical miles, lake shores and all navigable rivers.
Before April 1987, conservation responsibilities were divided among several government departments. The Department of Lands and Survey administered national parks and reserves, the New Zealand Forest Service was responsible for state forest parks, the New Zealand Wildlife Service was part of the Department of Internal Affairs, the Department of Agriculture and Fisheries was responsible for marine mammals, and the Transport Department administered certain aspects of the law relating to harbours, foreshores and lakes. The establishment of the Department of Conservation placed all these responsibilities under one administration.
For the Maori people the land of Aotearoa/New Zealand is part of their spiritual identity, an expression of their mana. According to legend, Rangi the sky father and Papa the earth mother were the first parents of the Maori people. The land and the people were one. Aotearoa is the land, the Maori are the people of the land, the tangata whenua.
It was the Maoris' strong sense of identity with their land that led to the creation of New Zealand's first national park. During the 1880s the Tuwharetoa people of the central North Island feared that their ancestral mountains, the imposing volcanic peaks of Tongariro, Ruapehu and Ngauruhoe, would be taken by European settlers.
Te Heuheu Tukino IV, paramount chief of Ngati Tuwharetoa, offered the mountain tops to the government as a gift to be held in trust for the people of New Zealand for all time.
The government accepted the mountains in 1887 and they became the nucleus of Tongariro National Park which was formally established by Act of Parliament seven years later. The centenary of the gift was celebrated during 1987–88 by commemorative events in all 12 national parks.
Representations by Taranaki settlers in the early 1890s resulted in another special Act establishing Egmont National Park. Farmers were anxious to see the forests on the mountain slopes preserved to safeguard the catchment and protect their land from excess run-off, but the park has since become an added benefit to the province as a year-round playground, offering such outdoor activities as tramping, climbing and skiing.
The Fiordland area, already famous for its spectacular lakes and fiords, was formally designated a public reserve in 1905 with a view to its later establishment as a third national park. Awakening public interest in New Zealand's natural scenery and a growing realisation of the scientific importance of the unique flora and fauna led to the passing of the Public Reserves, Domains and National Parks Act in i 928. This allowed the government to declare areas to be national parks without specific Acts of Parliament.
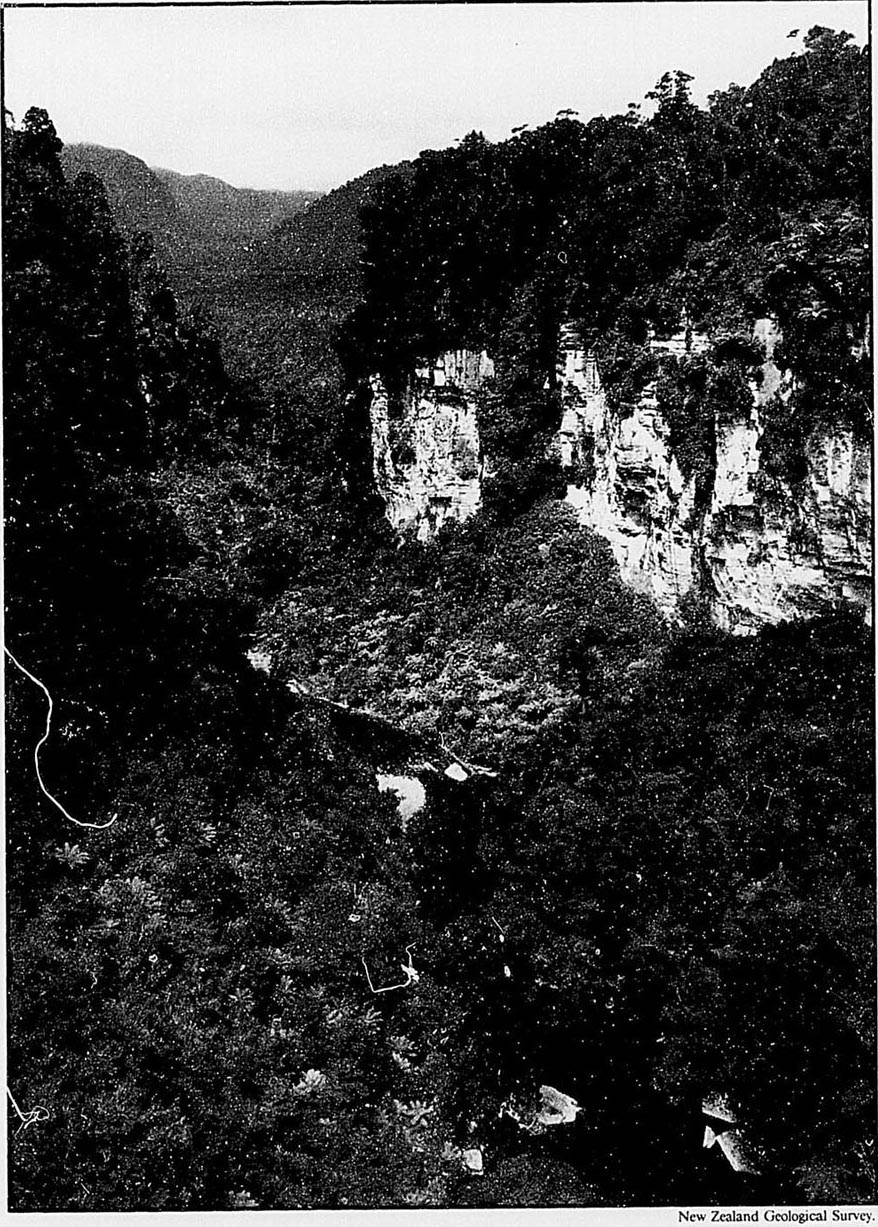
Pororari River, Paparoa National Park.
The following year saw the creation of Arthur's Pass National Park around the country's most spectacular alpine highway. Abel Tasman National Park was opened in 1942 to celebrate the 300th anniversary of the arrival of the first recorded European visitors to New Zealand. Fiordland National Park was formally established in 1952.
The National Parks Act 1952 consolidated the legislation covering the administration of the five existing national parks, defined the status and purpose of national parks, established the National Parks Authority for the formulation of policy and the allocation of finance, and set up separate park boards for the routine administration of each park. Five more national parks and three maritime parks were established under that Act.
Mount Cook National Park was established in 1953, Urewera National Park in 1954, Nelson Lakes National Park in 1956, Westland National Park in 1960 and Mount Aspiring National Park in 1964. Hauraki Gulf Maritime Park was established in 1967, Marlborough Sounds Maritime Park in 1972 and Bay of Islands Maritime and Historic Park in 1978. Each of the maritime parks incorporated a number of existing historic, scenic, recreation and nature reserves.
The 1952 Act was replaced by the National Parks Act 1980 which established the National Parks and Reserves Authority with similar policy-making and financial responsibilities to the earlier authority. Twelve regional national parks and reserves boards became responsible for policy making in national parks, maritime parks, and scenic, scientific and nature reserves throughout the country.
The Act provides for the establishment of national parks or reserves in areas where the scenery is of such distinctive quality, or the natural features or ecological systems so important scientifically that their preservation is in the national interest. The Act also provides for the public to have freedom of entry and access to the parks, though this is subject to such conditions and restrictions as are necessary for the preservation of native plants and animals or for the welfare of the parks in general. Access to specially protected areas constituted under the Act is by permit only.
The Act states that National Parks are to be maintained as far as possible in their natural state so that their value as soil, water and forest conservation areas is maintained. Native plants and animals are to be preserved and introduced plants and animals are to be removed if their presence is seen to conflict with the aims of the Act. Development in wilderness areas established under the Act is restricted to foot tracks and huts essential for wild animal control or scientific research. The Act allows the Department of Conservation to provide houses for park staff, accommodation houses and other buildings, hostels, huts, camping grounds, ski tows and similar facilities, parking areas, roading and tracks within the parks. Accommodation, transport and other services at entry points to the parks are provided by the department, other government agencies, voluntary organisations and private enterprise. Some services within the parks, such as guided walks and skiing instruction, are provided by private firms under concessions from the department.
The Whanganui National Park was opened in December 1986. It incorporates a number of scenic and nature reserves, some Crown land and former state forests around the middle reaches of the Wanganui River. The Paparoa National Park, on the West Coast of the South Island, was approved in principle in 1986 and opened as part of the national parks centennial celebrations in December 1987.
New Zealand's national parks are listed, from north to south, below.
Tongariro National Park. (78651 hectares, established 1887), was New Zealand's first national park. It includes the three active volcanoes, Ruapehu, Ngauruhoe and Tongariro.
Urewera National Park. (212675 hectares, established 1954), together with neighbouring Whirinaki Forest Park, is the largest remaining area of native forest in the North Island. Lake Waikaremoana is noted for its scenic shoreline.
Egmont National Park. (33543 hectares, established 1900), comprises all the land in a 9-kilometre radius of the Taranaki/Mount Egmont summit and some outlying areas to the north. The symmetrical cone of the dormant volcano is a provincial landmark.
Whanganui National Park. (74231 hectares, established 1986), borders the Wanganui River. It incorporates areas of Crown land, former State Forest and a number of former reserves. The river itself is not part of the park.
Abel Tasman National Park. (22541 hectares, established 1942), has numerous tidal inlets and beaches of golden sand along the shores of Tasman Bay. It is New Zealand's smallest national park.
Nelson Lakes National Park. (101753 hectares, established 1956), is a rugged, mountainous area in Nelson Province. It extends southwards from the forested shores of Lakes Rotoiti and Rotoroa to the Lewis Pass National Reserve.
Paparoa National Park. (27818 hectares, established 1987), is on the West Coast of the South Island between Westport and Greymouth. It includes the celebrated Pancake Rocks at Punakaiki.
Arthur's Pass National Park. (99270 hectares, established 1929), is a rugged and mountainous area straddling the main divide of the Southern Alps. It includes at least 30 peaks more than 1800 m in height.
Mount Cook and Westland National Parks. (69923 hectares, established 1953; 117547 hectares, established 1960), share a boundary along the alpine divide. Aoraki/Mount Cook (3764 m) and Mount Tasman (3497 m) are New Zealand's tallest peaks. The parks have together been declared a World Heritage Area because of their outstanding natural beauty and scientific importance.
Mount Aspiring National Park. (289657 hectares, established 1964), is a complex of impressively glaciated mountain scenery centred on Mount Aspiring (3036 m), which is New Zealand's highest peak outside Mount Cook National Park.
Fiordland National Park. (1251924 hectares, established 1952), is the largest national park in New Zealand and one of the largest in the world. The grandeur of its scenery, with its deep fiords, its lakes of glacial origin, its mountains and waterfalls, has earned it international recognition as a World Heritage Area.
The Department of Conservation administers 21 forest parks formerly administered by the New Zealand Forest Service. Their primary purpose, in most cases, is to protect the catchments of forested mountain ranges throughout the country, but they also provide a less restricted range of recreational activities than national parks and reserves, including tramping, camping, fishing, and shooting for a variety of game.
The following forest parks are among the most popular with recreational users:
Northland Forest Park—comprises the scattered remnants of the once-vast kauri forests that clothed the North Auckland peninsula in pre-European times. It includes the Waipoua Forest Sanctuary which preserves examples of these splendid trees.
Coromandel Forest Park—on the Coromandel Peninsula to the east of the Hauraki Gulf, is popular with Auckland people for weekend tramping, picnicking and other outdoor activities.
Tarawa Forest Park and Rimutaka Forest Park—both near Wellington, are heavily used by trampers, hunters, anglers and picnickers.
North-west Nelson Forest Park—is the largest forest park in the country. The Heaphy and Wangapeka walking tracks lead through the park to the West Coast.
Craigieburn Forest Park—adjacent to Arthur's Pass National Park, has three skifields and Lake Sumner Forest Park includes a number of walking trails and a recreational hunting area for red deer, chamois and pigs. Both parks are very popular with the people of Christchurch.
The Catlins Forest Park—south of Dunedin, is noted for its spectacular coastal scenery.
National reserves, such as the Lewis Pass National Reserve and the Subantarctic Islands National Reserves, protect areas of outstanding natural beauty or scientific or ecological importance. They are second only to national parks in the degree of protection they offer.
Other protected areas include scenic, nature, scientific, historic and recreation reserves, wildlife reserves, protected private land and land protected under various conservation and open space covenants.
There are more than 1200 scenic reserves with a total area in excess of 300000 hectares. They include areas of scenic interest such as native forests, limestone and glow-worm caves, thermal areas, coastal areas, lakes, rivers, waterfalls and scenic vantage points. The Waioeka and Tangarakau Gorges in the North Island, the Lewis Pass National Reserve, the Buller Gorge Reserves and Lake Kaniere in the South Island, and the South Cape Reserve in Stewart Island are among the better-known scenic reserves.
Nature reserves are established for the preservation of native plants and animals and generally consist of areas where rare plants are growing or which supply a suitable habitat for rare birds or other animals. Some of the 50-odd reserves in this category are on the mainland but most are on offshore or outlying islands. Nature reserves of particular public interest include Little Barrier Island in the Hauraki Gulf, the Cape Kidnappers gannet colony. Kapiti Island near Wellington, the white heron colony at Okarito in South Westland, and the royal albatross colony at Taiaroa Head near Dunedin.
The Snares Islands, Auckland Islands. Campbell Island. Antipodes Island and the Bounty Islands together form the Subantarctic Islands National Reserve. They are the major breeding places for several species of birds and animals, including the yellow-eyed penguin, the royal albatross and the Hooker's sealion. The threat of rats or other predatory animals accidentally being introduced to the islands has led the Department of Conservation to allow access by permit only. Previous experience has shown that one pregnant rat arriving on a previously rat-free island could lead to the extinction of a vulnerable species.
Scientific reserves are generally smaller areas reserved to protect examples of rare or endangered plants or animals for scientific research or education. Entry may be prohibited if this is considered necessary' to prevent disturbance.
Historic reserves include Maori rock drawings, the sites of prehistoric fortifications, the place of landfall of Abel Tasman, the landing places of Captain Cook, the sites of engagements during the New Zealand Wars, and buildings of historical importance. The Department of Conservation and the New Zealand Historic Places Trust co-operate closely in the investigation and administration of sites and buildings of historical or archaeological interest.
Recreation reserves include public domains, camping grounds and other public recreational areas administered by the Department of Conservation. Well-known examples include the Orewa Coastal Reserves. Auckland Domain. Ohope Beach, Queen Elizabeth Park (near Wellington), Momorangi Bay in the Marlborough Sounds, Kaiteriteri Beach in the Nelson district, and Hagley Park in Christchurch.
Wildlife reserves may be proclaimed over land of any tenure, prohibiting certain actions in respect of wildlife, but without affecting land ownership. There are three classes:
Wildlife sanctuaries preserve wildlife habitats from human or animal disturbance and protect wildlife species that are low in numbers or confined to sensitive habitats. The public may be partially or totally excluded.
Wildlife refuges provide havens for any class of wildlife. The public have freedom of access but firearms and domestic animals are prohibited.
Wildlife management reserves protect areas for the conservation and management of wildlife. The public has access for a variety of activities, including the hunting of game.
The Department of Conservation is responsible for fire protection in national parks and reserves, forest parks, unalienated Crown land and other state-owned areas, together with a 1500 metre fire safety margin adjoining all these lands.
In addition to administering areas which are already under some form of protection, the Department of Conservation is undertaking a series of regional surveys in its Protected Natural Areas Programme in order to discover representative examples of the wide variety of natural features, ecological areas and natural habitats that make New Zealand unique. A selection of these areas will be protected under either public or private ownership.
On its establishment the Department of Conservation took over the administrative support of a number of conservation authorities from the former Department of Lands and Survey. These included the National Parks and Reserves Authority, the New Zealand Walkway Commission, the Nature Conservation Council, the regional national parks and reserves boards and the district walkway committees.
National Parks and Reserves Authority. This authority was established by the National Parks Act 1980. It comprises a representative from each of the Royal Society of New Zealand, the Royal Forest and Bird Protection Society, Federated Mountain Clubs, and three persons appointed by the Minister of Conservation after consultation with the Minister of Tourism and the Minister of Local Government, and four members of the public with special knowledge of, or interest in, national parks and reserves appointed by the minister. Its functions include the preparation of policy, the approval of management plans for individual parks, advising the minister on priorities for expenditure in the parks and making and considering proposals for new national parks and the addition of land to existing parks.
New Zealand Walkway Commission. The commission was established by Act of Parliament in 1975 for the provision of walking tracks over public and private land to give the public safe, unimpeded foot access to the countryside. Between the commission's inception in 1976 and 31 March. 1988, a total of 138 walkways had been established with a combined length of more than 1200 kilometres.
Nature Conservation Council. The council was established to provide independent advice on ways of minimising the impact of development work of the natural environment, and protecting New Zealand's natural resources. It is involved in such issues as roading, reclamation, power schemes, mining proposals, the impact of tourist-related development on the natural environment, and the conservation of flora and fauna. Conservation New Zealand, which co-ordinated annual Conservation Week activities, was a technical subcommittee of the council.
National parks and reserves boards. There are 10 boards which administer the National Parks Act, 1980, and the appropriate parts of the Reserve Act, 1977, within the areas under their jurisdiction. Each board has 10 members appointed by the minister from people nominated by the general public. The board responsible for the area embracing Tongariro National Park includes the paramount chief of Ngati Tuwharetoa, a lineal descendent of Te Heuheu Tukino IV.
These authorities were reviewed during 1988 and considerable changes in their composition, responsibilities and administration were likely at the time of going to press.
The Department of Conservation supplies administrative support for the following independent trusts:
New Zealand Historic Places Trust is a non-profit organisation which exists to identify, record and preserve New Zealand's historic buildings and archaeological sites and to encourage public interest in the nation's past. The trust is described in more detail in section 11.2, The national collection.
Queen Elizabeth II National Trust. This trust was established in 1977 to encourage and promote the provision, protection and enhancement of open space for the benefit and enjoyment of the people of New Zealand. An important aspect of the trust's work is the promotion and negotiation of open space covenants. These are legal agreements between the trust and a landowner or leaseholder to protect special landscape features for a specified time or in perpetuity. They are almost always initiated by the landholder. Covenants so far negotiated include wetlands, lakes, coastline, tussock lands, tracts of rural landscape and forest remnants. The trust may also purchase land and accept bequests, donations or gifts of land. It now owns several valuable properties such as Holland Gardens in Taranaki, the Robert Houston Memorial Reserve in Waitomo and Tupare in Taranaki. Other activities include landscape awareness projects, demonstration farms, and the protection of wild and scenic rivers. The trust acts independently of the government as a statutory trustee.
14.1 Department of Survey and Land Information; Department of Justice; Department of Statistics; Valuation New Zealand; Department of Maori Affairs; Department of Lands; Land Corporation Limited.
14.2 Ministry of Forestry; Department of Scientific and Industrial Research; Ministry for the Environment.
14.3 Department of Conservation.
The Conveyancing Bulletin. Butterworths (eight times a year).
Report of the Department of Justice (Parl. paper E. 5).
Report of the Department of Lands (Parl. paper C. 1).
Report of the Department of Maori Affairs (Parl. paper E. 13).
Report of the Department of Survey and Land Information (Parl. paper C. 14).
Report of the Valuation Department (Parl. paper G. 26).
The Rural Real Estate Market in New Zealand. Valuation New Zealand (six-monthly).
The Urban Real Estate Market in New Zealand. Valuation New Zealand (six-monthly).
Catchment Control in New Zealand. National Water and Soil Conservation Authority, 1983.
Report of the Ministry for the Environment (Parl. paper C. 11).
Statistics of the Forests and Forest Industries of New Zealand. Ministry of Forestry (annual).
Report of the Department of Conservation (Parl. paper C. 13).
Report of the National Parks and Reserves Authority (Parl. paper C. 10).
Report of the National Water and Soil Conservation Authority (Parl. paper D. 2).
Report of the Nature Conservation Council (Parl. paper C. 4).
Report of the Queen Elizabeth the Second National Trust (Parl. paper C. 2).
The Government Printing Office also produces a number of publications on national parks and scenic reserves.
Table of Contents
Farming and horticulture are major industries, providing a high proportion of New Zealand's export earnings.
Traditionally farming has centred on sheep and cattle to produce sheepmeat, beef, wool, dairy produce and hides, although since the 1970s new types of livestock have included deer, goats and fur-bearing animals such as fitch.
Cereal crops are grown on a limited scale mainly for the home market.
Horticulture has always provided well for the home market, but since the 1970s horticultural produce has become an important export earner.
Land used for meat and wool farming is mainly hill country and rolling downs. The lowlands, and coastal plains support dairy, arable, and horticultural production. Recent increases in the use of coastal flat land for horticulture have been a major feature.
Over the last five years government policy has been to reduce assistance and remove most subsidies for the agricultural sector. Compared with other sectors, agriculture previously received high levels of assistance. Reasons for this were twofold. Firstly, prices for major agricultural products, particularly meat, had been weak for a number of years. Secondly, many domestic industries which provided the materials needed for agricultural production were heavily protected against competition from imports.
Since these subsidies were removed there has been a fall in farm incomes and rural land prices.
Table 15.1. TENURE OF OCCUPIED FARMLAND
| Year | Number of farms | Freehold land | Crown land | Leasehold land | Other land | Total land occupied |
|---|---|---|---|---|---|---|
| hectares (000) | ||||||
| 1982 | 73925 | 10820 | 8853 | 1340 | 250 | 21264 |
| 1983 | 75745 | 11017 | 8645 | 1387 | 218 | 21266 |
| 1984 | 76633 | 10922 | 8565 | 1485 | 252 | 21224 |
| 1985 | 78808 | 11096 | 8725 | 1427 | 129 | 21377 |
| 1986 | 79824 | 11077 | 8709 | 1397 | 147 | 21331 |
Table 15.2. FARMLAND USE BY LOCAL GOVERNMENT REGION, AS AT 30 JUNE 1986
| Number of farms | Grassland and Lucerne | Fruit vegetable and nursery | Crops | Plantations of exotic timber | Tussock and danthonia | Total area of farms* | |
|---|---|---|---|---|---|---|---|
| * Including other land on farms not classified above. | |||||||
| hectares (000) | |||||||
| Northland | 7140 | 682 | 5 | 1 | 95 | 14 | 1078 |
| Auckland and Great Barrier Island | 7699 | 291 | 11 | 1 | 34 | 5 | 412 |
| Waikato | 8699 | 860 | 5 | 9 | 99 | 5 | 1141 |
| Tongariro | 1361 | 339 | - | 2 | 137 | 5 | 924 |
| Thames Valley | 4110 | 236 | 1 | 2 | 23 | 1 | 403 |
| Bay of Plenty | 6372 | 290 | 16 | 6 | 237 | 1 | 820 |
| East Cape | 2156 | 577 | 7 | 5 | 79 | 17 | 1024 |
| Hawke's Bay | 3642 | 758 | 12 | 11 | 69 | 26 | 1139 |
| Taranaki | 4693 | 438 | 1 | 1 | 6 | 6 | 616 |
| Wanganui | 1970 | 511 | 2 | 13 | 31 | 11 | 718 |
| Manawatu | 3732 | 509 | 2 | 14 | 7 | 17 | 576 |
| Wairarapa | 1928 | 430 | 1 | 8 | 20 | 48 | 709 |
| Horowhenua | 996 | 57 | 3 | 2 | 5 | 4 | 80 |
| Wellington | 533 | 46 | - | - | 5 | 8 | 71 |
| North Island | 55031 | 6025 | 65 | 75 | 848 | 235 | 9711 |
| Marlborough | 1454 | 289 | 2 | 9 | 27 | 431 | 1143 |
| Nelson Bays | 2256 | 140 | 6 | 2 | 86 | 35 | 531 |
| West Coast | 1280 | 160 | - | - | 27 | 38 | 1798 |
| Canterbury | 5344 | 531 | 6 | 81 | 45 | 568 | 1576 |
| Aorangi and Chatham Islands | 4176 | 602 | 5 | 149 | 13 | 880 | 1777 |
| Coastal North Otago | 2237 | 256 | 2 | 27 | 15 | 614 | 956 |
| Clutha-Central Otago | 2825 | 660 | 2 | 30 | 53 | 1271 | 2273 |
| Southland | 5221 | 748 | 2 | 45 | 36 | 348 | 1565 |
| South Island | 24793 | 3386 | 25 | 343 | 302 | 4186 | 11620 |
| New Zealand | 79824 | 9411 | 90 | 418 | 1150 | 4421 | 21331 |
Table 15.3. LAND USAGE BY FARM TYPE, AS AT 30 JUNE 1986
| Farm type | Number of farms | Grassland and Lucerne | Fruit vegetable and nursery | Crops | Plantations of exotic trees | Tussock and danthonia | Total area of farms |
|---|---|---|---|---|---|---|---|
* Including other land not classified. †From 51 to 74 percent of gross income is derived from first-named activity and between 20 and 40 percent from second activity. ‡ More than 50 percent of gross income is derived from stated activity. § Two or more activities of roughly equal proportions. ||Includes flower growing, small-animal breeding, mushroom growing, tobacco and hop growing, beekeeping, research/educational farms, agricultural contracting, and farms not elsewhere classified. | |||||||
| hectares (000) | |||||||
| Dairy farming town supply* | 1026 | 90 | - | 2 | - | 1 | 98 |
| Dairy farming factory supply* | 13332 | 983 | 2 | 5 | 6 | 10 | 1079 |
| Sheep farming* | 17831 | 3455 | 3 | 103 | 43 | 2721 | 6818 |
| Beef farming* | 7864 | 515 | 1 | 2 | 8 | 229 | 911 |
| Pig farming* | 380 | 7 | - | 2 | - | 1 | 11 |
| Cropping* | 1468 | 40 | 2 | 77 | - | 2 | 127 |
| Dairy farming with sheep† | 308 | 36 | - | 1 | - | 3 | 45 |
| Dairy fanning with beef† | 786 | 94 | - | 1 | 1 | 2 | 109 |
| Dairy farming with other† | 567 | 52 | 1 | 2 | 1 | 1 | 63 |
| Sheep farming with dairy† | 203 | 29 | - | - | - | 1 | 33 |
| Sheep farming with beef† | 5828 | 2263 | 1 | 25 | 39 | 828 | 3554 |
| Sheep farming with cropping† | 1026 | 167 | 1 | 47 | 2 | 20 | 243 |
| Sheep farming with other† | 850 | 132 | 1 | 7 | 4 | 210 | 378 |
| Beef farming with dairy† | 269 | 17 | - | - | - | - | 19 |
| Beef farming with sheep† | 2184 | 458 | - | 2 | 20 | 59 | 656 |
| Beef farming with other† | 562 | 24 | 1 | 2 | 1 | 1 | 30 |
| Cropping with sheep† | 744 | 72 | 1 | 59 | 1 | 4 | 140 |
| Cropping with other† | 235 | 9 | 1 | 10 | - | - | 21 |
| Horse breeding, raising and training‡ | 1340 | 23 | - | 1 | - | - | 26 |
| Deer farming‡ | 1020 | 53 | - | 1 | 1 | 37 | 118 |
| Goat farming‡ | 773 | 25 | - | - | - | 5 | 35 |
| Mixed livestock§ | 2708 | 593 | 3 | 28 | 16 | 261 | 1021 |
| Poultry incl. broilers‡ | 426 | 5 | - | 1 | - | - | 7 |
| Vegetable growing‡ | 1821 | 16 | 20 | 2 | - | - | 42 |
| Citrus orchards‡ | 286 | 1 | 1 | - | - | - | 2 |
| Pipfruit orchards‡ | 821 | 3 | 8 | - | - | - | 12 |
| Stonefruit orchards‡ | 317 | 1 | 2 | - | - | - | 4 |
| Kiwifruit orchards‡ | 2392 | 11 | 17 | 1 | 1 | - | 36 |
| Berryfruit growing‡ | 402 | 3 | 2 | - | - | - | 6 |
| Grape growing‡ | 357 | 2 | 4 | 1 | - | - | 1 |
| Other fruit n.e.c.‡ | 647 | 3 | 5 | - | - | 1 | 11 |
| Plant nurseries‡ | 410 | 2 | 2 | - | 1 | - | 6 |
| Plantations‡ | 1090 | 16 | - | - | 998 | 3 | 3320 |
| Other farming|| | 2222 | 105 | 7 | 35 | 4 | 14 | 176 |
| Idle land | 7329 | 106 | - | - | - | 8 | 2164 |
| Total, all farm types | 79824 | 9411 | 90 | 418 | 1150 | 4421 | 21331 |
Table 15.4. FARM EMPLOYMENT, AS AT 30 JUNE 1986
| Farm type | Working owners, leaseholders, and sharemilkers | Unpaid members of family assisting on farm | Paid permanent employees | Casual workers | Salaries and wages paid to employees | |
|---|---|---|---|---|---|---|
| Full-time | Part-time | |||||
* Gross income of 75 percent or more is derived from stated activity. † From 51 to 74 percent of gross income is derived from first-named activity and between 20 and 40 percent from second activity. ‡ More than 50 percent of gross income is derived from stated activity. § Two or more activities of roughly equal proportions. || Includes pig fanning with other, small animal breeding, mushroom growing, tobacco and hop growing, beekeeping, research/educational farms, agricultural contracting, idle land and farms not elsewhere classified. | ||||||
| number | $(000) | |||||
| Dairy farming town supply* | 1,678 | 504 | 433 | 121 | 64 | 9,275 |
| Dairy farming factory supply* | 21,675 | 6,808 | 2,133 | 793 | 508 | 54,980 |
| Sheep farming* | 19,096 | 9,422 | 2,762 | 1,145 | 1,488 | 69,468 |
| Beef farming* | 7,283 | 3,051 | 379 | 229 | 126 | 9,441 |
| Pig farming* | 463 | 184 | 182 | 39 | 23 | 3,692 |
| Cropping* | 1,337 | 602 | 140 | 69 | 80 | 3,973 |
| Dairy farming with sheep† | 461 | 173 | 44 | 15 | 9 | 1,094 |
| Dairy farming with beef† | 1,275 | 413 | 209 | 68 | 36 | 5,117 |
| Dairy farming with other† | 1,022 | 311 | 198 | 51 | 85 | 5,045 |
| Sheep farming with dairy† | 227 | 143 | 30 | 6 | 4 | 701 |
| Sheep farming with beef† | 6,576 | 2,870 | 2,782 | 642 | 893 | 62,360 |
| Sheep farming with cropping† | 1,169 | 599 | 226 | 115 | 92 | 5,560 |
| Sheep farming with other† | 942 | 488 | 186 | 87 | 94 | 4,451 |
| Beef farming with dairy† | 356 | 144 | 23 | 3 | 1 | 437 |
| Beef farming with sheep† | 2,342 | 997 | 593 | 141 | 171 | 12,836 |
| Beef farming with other† | 585 | 319 | 36 | 20 | 32 | 930 |
| Cropping with sheep† | 889 | 427 | 180 | 78 | 88 | 4,334 |
| Cropping with other† | 254 | 127 | 50 | 16 | 38 | 1,775 |
| Horse breeding, raising and training‡ | 864 | 419 | 369 | 65 | 26 | 6,896 |
| Deer farming‡ | 1,020 | 571 | 124 | 38 | 40 | 3,206 |
| Goat farming‡ | 813 | 489 | 38 | 15 | 20 | 1,076 |
| Mixed livestock§ | 3,454 | 1,506 | 866 | 233 | 383 | 21,091 |
| Poultry incl. broilers‡ | 605 | 190 | 444 | 441 | 83 | 11,648 |
| Vegetable growing‡ | 2,408 | 886 | 706 | 360 | 1,037 | 22,088 |
| Citrus orchards‡ | 334 | 142 | 31 | 23 | 167 | 1,661 |
| Pipfruit orchards‡ | 1,099 | 303 | 597 | 196 | 682 | 25,900 |
| Stonefruit orchards‡ | 380 | 170 | 94 | 18 | 155 | 4,018 |
| Kiwifruit orchards‡ | 2,864 | 1,144 | 1,130 | 437 | 2,938 | 33,817 |
| Berryfruit growing‡ | 514 | 208 | 72 | 44 | 470 | 6,574 |
| Grape growing‡ | 384 | 130 | 227 | 89 | 601 | 6,637 |
| Other fruit n.e.c.‡ | 776 | 346 | 217 | 95 | 255 | 6,566 |
| Flower growing‡ | 373 | 125 | 82 | 86 | 36 | 2,586 |
| Plant nurseries‡ | 506 | 121 | 1,014 | 232 | 345 | 17,001 |
| Plantations‡ | 233 | 133 | 3,275 | 80 | 189 | 71.256 |
| Other farming|| | 2,396 | 1,215 | 769 | 321 | 654 | 20,602 |
| Total, all farm types | 86,653 | 35,680 | 20,650 | 6,411 | 11,913 | 518,091 |
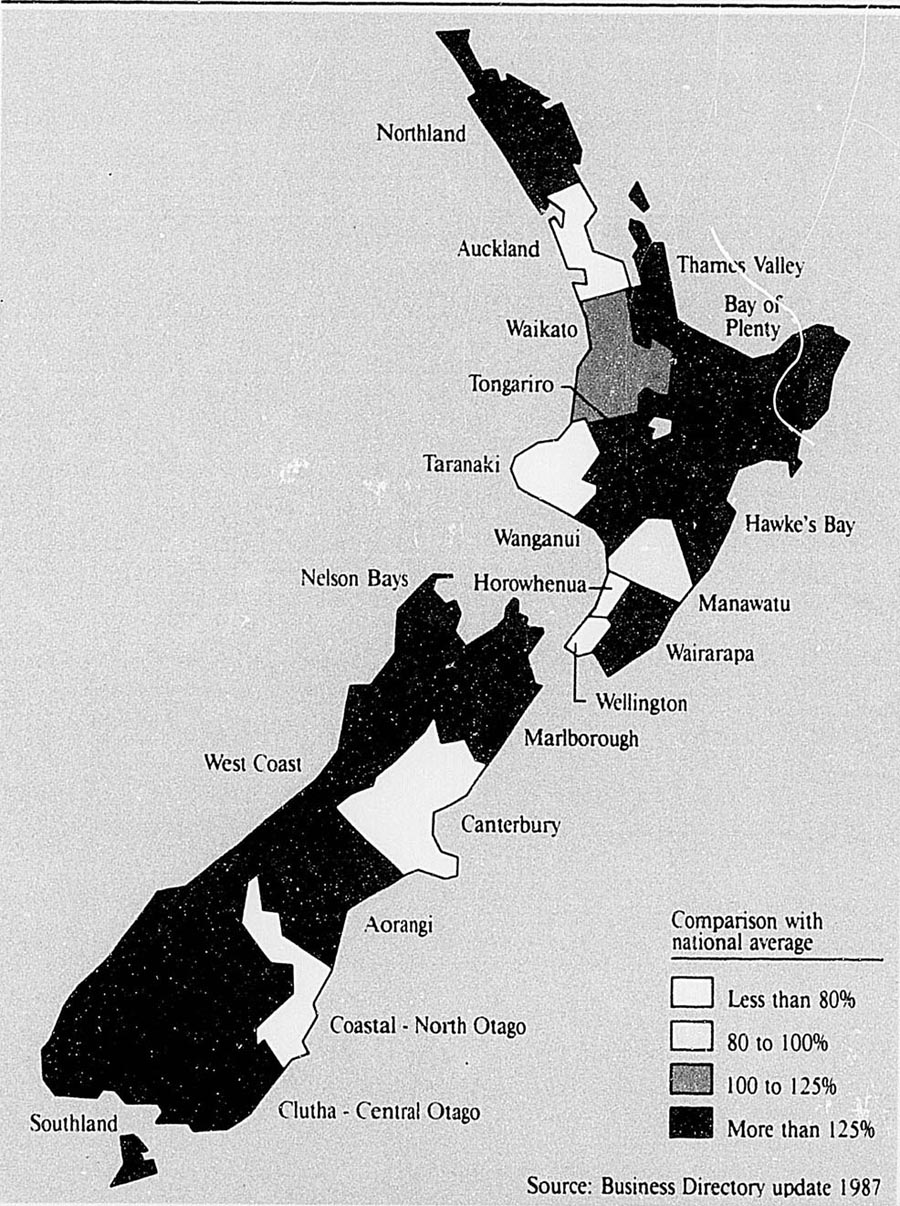
Percentage of workforce employed in
AGRICULTURAL CONTRACTING. HUNTING, FORESTRY AND
FISHING
Table 15.5. CAPITAL EXPENDITURE ON FARMS
| Item | Year ended June | |||
|---|---|---|---|---|
| 1983 | 1984 | 1985 | 1986 | |
| * Includes construction of permanent yards, airstrips, bridges, roading, and stock or dairy water-supply systems. | ||||
| $(000) | ||||
| Buildings | 278,562 | 284,401 | 256,144 | 235,769 |
| Construction* | 51,666 | 53,467 | 48,487 | 44,319 |
| Land development | 184,108 | 179,931 | 163,101 | 108,311 |
| Transport vehicles | 155,634 | 172,546 | 222,593 | 114,244 |
| Machinery | 171,001 | 189,799 | 221,732 | 110,119 |
| Working animals | 3,008 | 3,365 | 3,885 | 3,123 |
| Total | 843,979 | 883,509 | 915,942 | 615,886 |
Table 15.6. FARM MACHINERY, AS AT 30 JUNE 1986*
| Type of machine | Number in use |
|---|---|
| * Collected triennially. | |
| Agricultural tractors | 81,441 |
| Farm trucks | 44,433 |
| Bikes | 44,241 |
| Harvesters— | |
| Forage | 4,420 |
| Header | 3,328 |
| Grain augers | 6,703 |
| Cultivating equipment | 71,085 |
| Hay balers | 12,372 |
| Hay mowers and conditioners | 62,968 |
| Spraying machines | 30,517 |
| Electric fence units | 64,680 |
Most New Zealand soils have a seasonal moisture deficiency and many soils presently farmed under dry land conditions are capable of substantially increased production under irrigation.
The area and type of land irrigated during the year ended 30 June 1985 is analysed by local government region in table 15.7. No figures were collected for 1986.
Table 15.7. LAND IRRIGATED DURING YEAR ENDED 30 JUNE 1985*
| Local government region | Farms irrigated | Grassland and Lucerne | Fruit (incl. grapes) and vegetables | Other crops and land uses | Total |
|---|---|---|---|---|---|
| * 1986 figures were not collected. | |||||
| number | hectares | ||||
| Northland | 412 | 96 | 1,798 | 95 | 1,989 |
| Auckland (incl. Gt. Barrier Is.) | 603 | 653 | 2,331 | 106 | 3,090 |
| Waikato | 220 | 271 | 628 | 62 | 961 |
| Tongariro | 7 | 43 | 11 | ‥ | 54 |
| Thames Valley | 118 | 287 | 321 | 20 | 628 |
| Bay of Plenty | 1,130 | 485 | 4,799 | 97 | 5,381 |
| East Cape | 237 | 147 | 1,247 | 38 | 1,432 |
| Hawke's Bay | 661 | 2,451 | 4,864 | 1,014 | 8,329 |
| Taranaki | 70 | 52 | 219 | 18 | 289 |
| Wanganui | 60 | 174 | 180 | 14 | 368 |
| Manawatu | 107 | 1,482 | 410 | 105 | 1,997 |
| Wairarapa | 132 | 3,307 | 198 | 148 | 3,653 |
| Horowhenua | 113 | 511 | 486 | 41 | 1,038 |
| Wellington | 16 | 139 | 11 | 2 | 152 |
| North Island | 3,886 | 10,098 | 17,504 | 1,760 | 29,362 |
| Marlborough | 227 | 2,854 | 1,524 | 1,712 | 6,090 |
| Nelson Bays | 522 | 1,862 | 2,802 | 1,204 | 5,868 |
| West Coast | 4 | 1 | 2 | 1 | 4 |
| Canterbury | 1,007 | 31,912 | 2,216 | 17,958 | 52,086 |
| Aorangi (incl. Chatham Islands) | 981 | 64,398 | 900 | 37,631 | 102,929 |
| Coastal North Otago | 235 | 15,128 | 364 | 3,337 | 18,828 |
| Clutha-Central Otago | 513 | 3,8290 | 1,305 | 1,609 | 41,204 |
| Southland | 13 | 180 | 7 | 26 | 213 |
| South Island | 3,502 | 154,625 | 9,120 | 63,479 | 227,222 |
| New Zealand | 7,388 | 164,723 | 26,624 | 65,240 | 256,587 |
Further information on irrigation is included in section 14.2, Environmental and resource management.
Topdressing with artificial fertilisers has been an important factor in the intensification of grassland farming. Most New Zealand soils need fertilisers, especially phosphates, to maintain and increase production. Superphosphate has been produced in New Zealand since the 1880s, using rock phosphates from Nauru and Ocean Island; although Christmas Island is now an increasingly important source of supply. Over the years there has been a marked changeover from straight superphosphate as the principal fertiliser for grassland and crops—usual variants are serpentine superphosphate or aerial superphosphate, or a mixture of superphosphate with potash, additional sulphur or a trace element.
Over recent years production of superphosphate fertilisers has fallen, in line with reduced farm incomes (and therefore expenditure), and during the year ended 30 June 1986 totalled 1115000 tonnes Oust over half the amount produced the year before). Half the fertilised area is covered by aerial distribution, and about 30 percent of the quantity is distributed by aeroplanes from 8000 airstrips.
Lime is used to correct soil acidity and increase the availability of trace elements. In 1986, 644000 tonnes of lime were applied.
The Department of Statistics' Agriculture Production Account is a statistical series that provides a summary of the activities of all market-oriented establishments classified under agricultural and livestock production or agricultural services (major groups 111 and 112 of the New Zealand Standard Industrial Classification). All types of farms are included, together with agricultural services operated by contractors, such as topdressing, weed-spraying, harvesting, threshing, shearing, and scrub-cutting. Other services included are herd testing and artificial insemination. Farms operated as trading enterprises by the Department of Lands and Survey (now the Land Corporation Limited) and the Department of Maori Affairs are included.
The ‘account’ includes all income derived from the activities of the establishments covered, including their characteristic farming activities, and also their ‘other’ productive activities. However, investment income (such as dividends and interest) accruing to the proprietors of farming establishments is excluded.
Tables 15.9 and 15.10 show the consumption and production of major categories of products for the agricultural sector over the last five years.
Table 15.11 shows the index of the volume of agricultural production for the last five years. It should be noted that this index excludes inter-farm sales of animals, and the production of agricultural services, i.e., it relates only to ‘farm’ output of ‘land-based’ commodities. The index shows changes in the volume of production for 11 separate component product groups as well as for total farm production. The index has an expression base of the year ended June 1978 (= 1000).
Table 15.9. AGRICULTURE PRODUCTION ACCOUNT: ANALYSIS OF INTERMEDIATE CONSUMPTION
| Item | Year ended March | ||||
|---|---|---|---|---|---|
| 1982 | 1983 | 1984 | 1985x | 1986 | |
| $(million) | |||||
| Purchase of livestock | 554 | 547 | 753 | 856 | 641 |
| Feed and grazing | 180 | 219 | 219 | 254 | 247 |
| Animal health and breeding | 114 | 131 | 157 | 187 | 205 |
| Weed and pest control | 67 | 75 | 99 | 130 | 110 |
| Fertiliser, lime, and seeds | 406 | 429 | 460 | 620 | 473 |
| Fuel and power | 242 | 276x | 295 | 379 | 360 |
| Repairs and maintenance | 490 | 496x | 555 | 669 | 582 |
| Freight | 109 | 123x | 141 | 177 | 180 |
| Other (not elsewhere classified) | 693 | 784x | 899 | 1,066 | 1,043 |
| 2,855 | 3,080x | 3,577 | 4,338 | 3,839 | |
| Less, capitalised development | 103 | 105 | 91 | 89 | 55 |
| Total, intermediate consumption | 2,752 | 2,975x | 3,486 | 4,249 | 3,784 |
Table 15.10. GROSS AGRICULTURAL PRODUCTION
| Commodity | Year ended March | ||||
|---|---|---|---|---|---|
| 1982 | 1983 | 1984 | 1985x | 1986 | |
| n.e.c.—not elsewhere classified. | |||||
| $(million) | |||||
| Wool | 803 | 755 | 935 | 1,200 | 1,069 |
| Sheep | 585 | 499 | 518 | 642 | 400 |
| Cattle | 564 | 717 | 720 | 1,062 | 779 |
| Pigs | 80 | 86 | 89 | 102 | 104 |
| Dairy products | 1,020 | 1,183 | 1,198 | 1.457 | 1.529 |
| Poultry products | 124 | 146 | 143 | 163 | 176 |
| Crops and seeds | 279 | 267 | 286 | 326 | 349 |
| Fruit, nuts, and oilseeds | 183 | 213 | 238 | 352 | 434 |
| Vegetables | 225 | 225 | 274 | 225 | 266 |
| Other horticultural products | 127 | 145 | 174 | 176 | 173 |
| Agricultural services | 295 | 293 | 318 | 357 | 358 |
| Other products, n.e.c. | 60 | 83 | 94 | 123 | 146 |
| Value of change in livestock— | |||||
| Sheep | 60 | −72 | 60 | 7 | 112 |
| Cattle | −2 | −53 | 4 | 59 | 199 |
| Pigs | −1 | − | 3 | 4 | −6 |
| Deer | 32 | 38 | 90 | 116 | 133 |
| Goats | 2 | 6 | 12 | 18 | 68 |
| Sales of live animals | 563 | 558 | 743 | 837 | 611 |
| Gross output | 5,000 | 5,092 | 5,900 | 7,225 | 6,900 |
Table 15.11. INDEX OF VOLUME OF AGRICULTURAL PRODUCTION (JUNE 1978=1000)
| Commodity | Year ended June | ||||
|---|---|---|---|---|---|
| 1982 | 1983 | 1984 | 1985x | 1986 | |
| volume index numbers | |||||
| Wool | 1187 | 1183 | 1176 | 1200 | 1179 |
| Sheep | 1153 | 1270 | 1207 | 1313 | 1302 |
| Cattle | 1000 | 1045 | 872 | 996 | 955 |
| Pigs | 878 | 888 | 966 | 1079 | 1021 |
| Dairy products | 1088 | 1113 | 1230 | 1259 | 1318 |
| Poultry products | 1144 | 1229 | 1211 | 1293 | 1280 |
| Crops and seeds | 1003 | 1094 | 1266 | 1254 | 1352 |
| Fruit, nuts, and oilseeds | 1638 | 1532 | 1892 | 2325 | 3030 |
| Vegetables | 1034 | 1048 | 1060 | 1030 | 1024 |
| Other horticultural products | 1901 | 1852 | 2230 | 2033 | 1761 |
| Other farm products, n.e.c. | 2070 | 2543 | 2996 | 3232 | 4050 |
| Total, all farm products | 1147 | 1184 | 1218 | 1285 | 1319 |
A number of indexes showing the costs for goods and services incurred by agricultural producers are compiled by the Department of Statistics.
There are separate series available which measure production-related costs for: sheep and beef farming; dairy farming; mixed cropping; horticulture; pig, poultry and other farming; and agricultural contracting. Together they form a major component of the national Producers Price Index series.
The six agricultural sub-indexes are weighted and combined to produce an All Farming Inputs Price Index, shown in tables 15.12 and 15.13. These series can be compared to the discontinued Farm Costs Price Index.
A sub-index for expenditure on central and local government charges has been developed, with the series being available back to the December 1982 quarter, which ensures compatibility with the other expenditure sub-indexes of the Farming Inputs Price Index.
Table 15.12. FARMING INPUTS PRICE INDEX*
| Year | Quarter Sheep farming | Dairy farming | All farming (excl. livestock) | All farming (incl. livestock) |
|---|---|---|---|---|
| * Base: December quarter 1982 (= 1000) | ||||
| 1982—Dec | 1000 | 1000 | 1000 | 1000 |
| 1983—Mar | 1002 | 1002 | 1002 | 1002 |
| Jun | 1007 | 1008 | 1007 | 1012 |
| Sep | 1013 | 1020 | 1017 | 1028 |
| Dec | 1012 | 1023 | 1017 | 1033 |
| 1984—Mar | 1013 | 1023 | 1017 | 1049 |
| Jun | 1034 | 1046 | 1042 | 1086 |
| Sep | 1079 | 1092 | 1086 | 1131 |
| Dec | 1112 | 1118 | 1116 | 1160 |
| 1985—Mar | 1148 | 1153 | 1154 | 1206 |
| Jun | 1203 | 1210 | 1209 | 1261 |
| Sep | 1254 | 1258 | 1255 | 1303 |
| Dec | 1256 | 1263 | 1259 | 1299 |
| 1986—Mar | 1272 | 1279 | 1274 | 1283 |
| Jun | 1274 | 1294 | 1281 | 1249 |
| Sep | 1304 | 1305 | 1304 | 1241 |
| Dec | 1314 | 1316 | 1312 | 1250 |
| 1987—Mar | 1337 | 1337 | 1334 | 1260 |
| Jun | 1356 | 1360 | 1353 | 1295 |
| Sep | 1365 | 1377 | 1366 | 1322 |
Table 15.13. FARMING INPUTS PRICE INDEX—ALL FARMING*
| Expenditure group | Percentage of base expenditure | 1986 | 1987 | ||
|---|---|---|---|---|---|
| Dec. | Mar. | Jun. | Sep. | ||
| * Excludes wages, interest payments and government charges. Base: December quarter 1982 (= 1000) | |||||
| Administration | 3.86 | 1521 | 1571 | 1640 | 1681 |
| Animal health and breeding | 3.88 | 1256 | 1273 | 1280 | 1360 |
| Dairy shed expenses | 0.56 | 1370 | 1409 | 1471 | 1464 |
| Electricity | 1.89 | 1360 | 1360 | 1513 | 1513 |
| Feed, grazing, cultivating and harvesting | 8.20 | 1245 | 1246 | 1233 | 1242 |
| Fertiliser, lime and seeds | 1447 | 1338 | 1346 | 1355 | 1349 |
| Freight | 5.58 | 1251 | 1280 | 1334 | 1325 |
| Fuel and oil | 6.17 | 1042 | 1135 | 1135 | 1138 |
| Insurance | 0.88 | 1447 | 1451 | 1487 | 1503 |
| Packaging costs | 1.52 | 1229 | 1256 | 1270 | 1297 |
| Rent and hire | 1.75 | 1749 | 1755 | 1757 | 1839 |
| Repairs, maintenance and motor vehicle repairs | 17.76 | 1432 | 1455 | 1464 | 1477 |
| Sharemilking | 1.30 | 872 | 872 | 872 | 899 |
| Shearing | 5.65 | 1180 | 1180 | 1195 | 1213 |
| Weed and pest control | 3.49 | 1285 | 1313 | 1358 | 1381 |
| Livestock purchases | 23.04 | 1038 | 1010 | 1101 | 1174 |
| All groups excluding livestock | 76.96 | 1312 | 1334 | 1353 | 1366 |
| All groups including livestock | 100.00 | 1250 | 1260 | 1295 | 1322 |
For nearly a century government-funded advisory services have been available to New Zealand farmers. The country has been, and still is, a world leader in agricultural research and advisory services. This is both a cause and an effect of the importance of agriculture to the New Zealand economy and exports.
Scientific research in agriculture is described in chapter 13, Science and technology.
There is also a broad range of administrative and special interest organisations in the sector; a network of local, regional and national farmers' associations to advance the interests of the industry; growers' and livestock breeders' associations; produce marketing authorities; and others. Some of these are discussed in the following sections.
The Rural Banking and Finance Corporation plays an important part in financing farming operations, and is described in section 24.1, Financial institutions.
Ministry of Agriculture and Fisheries. The ministry is the main government agent in the agricultural sector. It advises government on policy, conducts research, and provides advisory and other services to industry. Its function is outlined in section 3.3, State sector.
During 1987 the Ministry of Agriculture and Fisheries was restructured. It now operates through four business groups: technology development and implementation (MAFTech): fisheries management research and conservation (MAFFish); quality management systems (MAFQual); and corporate services (MAFCorp). The activities of MAFTech are outlined in chapter 13, Science and technology, while those of MAFFish are described in section 16.3.
MAFQual is the business group most active in the agricultural sector. It provides a number of quality control systems and services seen by government as necessary to ensure a place for New Zealand produce in international markets. These include: border control; surveillance of plant and animal diseases and pests; negotiation of access to overseas markets; and certification of livestock and produce imports and exports. Below are the main MAFQual services:
Agriculture quarantine service—New Zealand's isolation has provided a natural barrier against many of the world's more serious agricultural pests and diseases. Any breach of this barrier is potentially devastating, and strict quarantine laws are in place to prevent this. These laws are enforced by uniformed officers who carry out inspections at seaports and airports.
Animal health services—Animal health is encouraged through veterinary surveillance and the provision of animal health laboratories. Animal health laboratories provide diagnostic services to monitor diseases present in New Zealand livestock. The information gained is used, among other things, to ensure access of livestock and produce to overseas markets and to negotiate export testing requirements, and as evidence of the country's freedom from particular diseases.
Dairy services—Monitoring of quality control systems in farm dairies, milk stations, dairy factories and product testing laboratories protects the domestic consumer and gives backing to the ministry's certification of export dairy' produce. Regular checks are made for potential sources of disease and for residues of veterinary drugs and agricultural chemicals.
Also provided are training systems for the dairy industry—covering food inspection and quality control.
Meat services—An inspection service is provided to the meat, game, farmed deer and export fish industries to ensure that quality standards and overseas market requirements are met. This involves ministry staff and virtually all meat and fish processing plants (which produced exports valued at more than $2.4 billion in 1986).
Plant services—The ministry has a long-established role in plant health and protection and also the certification of plant produce for export. A network of plant protection laboratories is established and the ministry's staff advise growers on horticultural systems, packhouse design, and treatment of crops after harvest.
Pastoral agriculture is practised throughout New Zealand, with beef cattle predominating in the Far North, dairying in Waikato and Taranaki, and sheep farming in the hills and in the south of the North Island. In the South Island, sheep farming is the main form of pastoral agriculture, with a sprinkling of beef cattle farmed in the high and hill country and wetter flat areas, and some dairying on the flat land of both coasts.
Livestock are rarely housed, but feeding of small quantities of supplements, such as hay and silage can occur, particularly in winter. Grass growth is seasonal, largely dependent on location and climatic fluctuations, but normally occurs for between eight and 12 months of the year. Stock are grazed in paddocks, often with moveable electric fencing, which allows rotation of grazing around the farm. Lambing and calving are carefully managed to take full advantage of spring grass growth.
Phosphatic fertilisers are used extensively on New Zealand's predominantly grass/clover pasture. Nitrogen fertilisers are used to a small degree.
Lines of development are influenced by overseas prices for farm products, including meat, wool, dairy products and, more recently, venison and goat fibre. While there is a time-lag associated with livestock breeding, livestock numbers indicate how farmers are responding to market trends. However, it must be remembered that climatic effects such as drought or floods can influence the general pattern.
Probably New Zealand's best known statistic is that it has more than 20 times as many sheep as people. Grasslands have been developed to the extent that the best sheep farms can carry up to 25 sheep per hectare throughout the year. The best dairy farms carry 3.5 cows per hectare throughout the year.
At 30 June 1982 the total sheep population was 70.3 million, and beef cattle numbers were around 4.9 million. The sheep population declined to around 67.5 million at June 1986, but the beef cattle population remained static at around 4.7 million.
Sheep breeds. The most popular sheep in New Zealand is the Romney, an English breed which is well suited to the wet conditions on many farms. A number of breeds which produce both meat and wool have been developed by New Zealand breeders during this century. There is also considerable regional variation in the types of sheep grazed—to meet different climates and topography. Data on sheep breeds (last collected in 1984) indicate that, of the 69.7 million sheep in New Zealand at the end of June 1984, 27.7 million (39.7 percent) were Romneys, 13.5 million (19.3 percent) were Coopworth, 10.6 million (15.3 percent) were Perendale, 3.8 million (5.5 percent) were Corriedale and 3.9 million (5.6 percent) were Merino and half breeds. Six million sheep were classified ‘unspecified’, as the farmers did not indicate their breed.
Deer. Deer farming has developed since the early 1970s to become an important livestock industry. As venison finds a ready overseas market, most of the meat produced is exported. Venison was first exported in the late 1950s from wild deer herds. The peak years for exports of feral venison were 1972 and 1973, when about 4000 tonnes was exported—principally to West Germany. Feral deer have gradually been removed from the backcountry by helicopter-borne venison hunters and by live capture of deer to stock deer farms. In recent years elk from Canada and deer from Europe have been imported. Currently there are about 3500 deer farms registered with the Department of Conservation and they hold over 400000 deer.
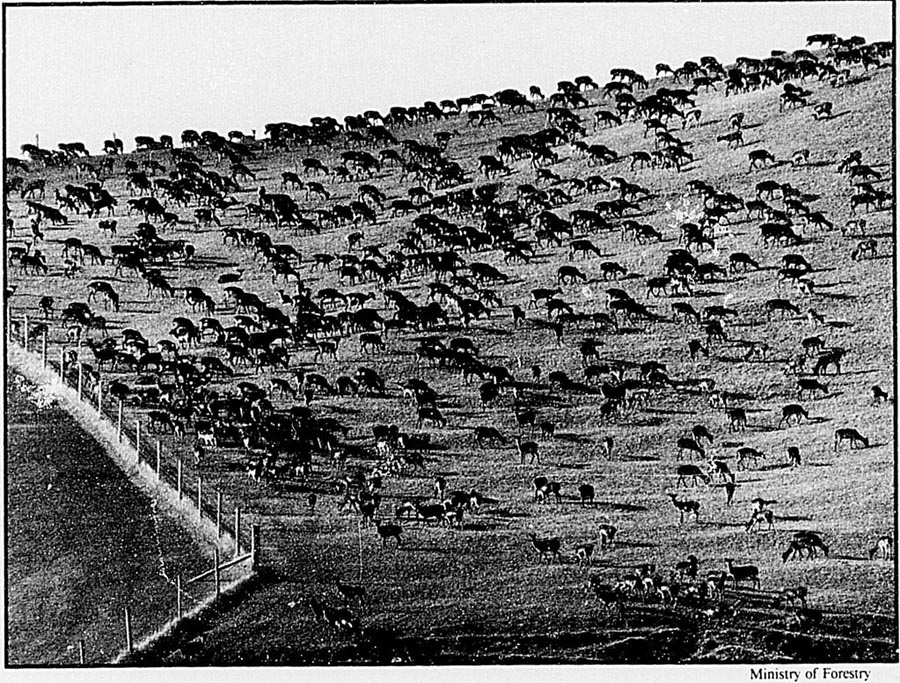
Fallow deer herd, Helensville.
The Department of Conservation must be notified of farms on which deer are to be held. Deer farming is generally permitted in most regions but some species may be farmed only in specified areas. The first deer farm licence was issued in March 1970, although deer were legally held and bred in captivity from 1962 onwards. Red, wapiti and fallow deer are the predominant farmed species. The large investment made in establishing the deer farming industry is only just beginning to realise its potential: 2809 tonnes of farm venison was exported in the year ended June 1987, compared with 2237 tonnes the previous year. The total value of exports from the deer industry for that year was $36.6 million and included velvet antlers ($10 million), and hides and leather ($1.2 million).
Goats. In the 1980s there has been a marked increase in the number of goats being farmed commercially in New Zealand for their milk, mohair, and meat production, as well as for weed control. At 30 June 1986 there were approximately 21000 does being milked and 233000 goats being farmed for mohair and cashgora. A further 458000 were being farmed in cross-breeding programmes for cashgora and cashmere production. In the year to June 1986, 87 tonnes of mohair, 11 tonnes of cashmere and 24 tonnes of cashgora were produced.
Table 15.14. DISTRIBUTION OF LIVESTOCK, AS AT 30 JUNE 1986
| Local government region | Dairy cattle | Beef cattle | Sheep | Pigs | Deer | Goats |
|---|---|---|---|---|---|---|
| (000) | ||||||
| Northland | 379 | 627 | 2050 | 11 | 4 | 59 |
| Auckland (incl. Gt Barrier Is.) | 239 | 265 | 965 | 55 | 31 | 54 |
| Waikato | 795 | 658 | 4,375 | 55 | 46 | 105 |
| Tongariro | 19 | 217 | 2,592 | 1 | 20 | 34 |
| Thames Valley | 453 | 126 | 549 | 24 | 6 | 18 |
| Bay of Plenty | 282 | 162 | 1,406 | 27 | 47 | 49 |
| East Cane | 35 | 385 | 2,935 | 4 | 11 | 27 |
| Hawke's Bay | 12 | 468 | 6,106 | 8 | 31 | 105 |
| Taranaki | 553 | 203 | 1,672 | 26 | 9 | 21 |
| Wanganui | 28 | 269 | 4,047 | 9 | 11 | 17 |
| Manawatu | 157 | 283 | 4,013 | 23 | 15 | 29 |
| Wairarapa | 73 | 193 | 3,437 | 17 | 6 | 31 |
| Horowhenua | 52 | 35 | 201 | 8 | 3 | 3 |
| Wellington | 5 | 11 | 226 | 6 | 1 | 10 |
| North Island | 3,083 | 3,901 | 34,575 | 273 | 243 | 562 |
| Marlborough | 25 | 90 | 1,690 | 20 | 9 | 14 |
| Nelson Bays | 46 | 59 | 837 | 9 | 11 | 20 |
| West Coast | 67 | 74 | 462 | 1 | 9 | 2 |
| Canterbury | 58 | 175 | 5,192 | 70 | 22 | 32 |
| Aorangi (incl. Chatham Is.) | 45 | 145 | 6,056 | 31 | 29 | 24 |
| Coastal North Otago | 26 | 80 | 2,575 | 14 | 5 | 16 |
| Clutha-Central Otago | 16 | 180 | 6,767 | 6 | 20 | 22 |
| Southland | 33 | 178 | 9,314 | 11 | 43 | 30 |
| South Island | 315 | 980 | 3,2894 | 162 | 149 | 161 |
| New Zealand | 3,398 | 4,881 | 67,470 | 435 | 392 | 723 |
Table 15.15. SHEEP CATEGORIES
| At 30 June | Rams | Wethers | Breeding ewes | Hoggets | Total | |
|---|---|---|---|---|---|---|
| Rams & wethers | Ewes | |||||
| (000) | ||||||
| 1982 | 964 | 1,388 | 51,560 | 2,869 | 13,520 | 70,301 |
| 1983 | 936 | 1,337 | 51,763 | 2,653 | 13,574 | 70,263 |
| 1984 | 907 | 1,340 | 51,875 | 2,471 | 13,146 | 69,739 |
| 1985 | 871 | 1,283 | 50,980 | 2,309 | 12,410 | 67,854 |
| 1986 | 831 | 1,375 | 49,367 | 3,554 | 12,342 | 67,470 |
Table 15.16. SIZE OF SHEEP FLOCKS
| Size of flock | 1982 | 1983 | 1984 | 1985 | 1986 |
|---|---|---|---|---|---|
| 1–99 | 10,214 | 10,039 | 9,390 | 9,828 | 10,622 |
| 100–199 | 2,724 | 2,628 | 2,468 | 2,530 | 2,708 |
| 200–499 | 4,066 | 4,103 | 3,988 | 4,089 | 3,969 |
| 500–999 | 3,699 | 3,736 | 3,662 | 3,631 | 3,685 |
| 1000–1499 | 3,397 | 3,398 | 3,360 | 3,390 | 3,295 |
| 1500–1999 | 3,492 | 3,479 | 3,376 | 3,359 | 3,300 |
| 2000–2499 | 3,469 | 3,372 | 3,330 | 3,238 | 3,214 |
| 2500–4999 | 7,428 | 7,443 | 7,308 | 7,179 | 6,984 |
| 5000–9999 | 2,170 | 2,152 | 2,161 | 2,033 | 2,056 |
| 10000 and over | 531 | 548 | 568 | 535 | 562 |
| Total flocks | 41,190 | 40,898 | 39,611 | 39,812 | 40,395 |
| Average flock size | 1,707 | 1,718 | 1,761 | 1,704 | 1,670 |
Table 15.17. CATTLE CATEGORIES
| Category | 1984 | 1985 | 1986 |
|---|---|---|---|
* Heifers not vet in milk, and cows not in milk during season but intended to be used again for dairying. † Includes ‘bobby’ calves. ‡ Includes cows culled from dairy herds (15560 in 1984, 18077 in 1985 and 33454 in 1986.) | |||
| Dairy stock— | |||
| Cows and heifers, two years old and over— | |||
| Cows in milk or calf | 216,5013 | 2,220,923 | 2,270,087 |
| Others* | 53,129 | 55,104 | 82,131 |
| Heifers— | |||
| One and under two years old | 502,977 | 525,427 | 532,306 |
| Under one year old | 471,411 | 452,098 | 458,954 |
| Bulls and bull calves intended for dairy' breeding | 50,537 | 51,987 | 52,234 |
| Total, dairy stock† | 3,245,524 | 3,308,030 | 3,398,291 |
| Beef stock— | |||
| Breeding cows and heifers, two years old and over | 1,341,617 | 1,352,167 | 1,371,605 |
| Cows, two years old and over, not used for breeding | 184,256 | 168,045 | 172,360 |
| Heifers— | |||
| One and under two years old | 485,840 | 471,232 | 503,361 |
| Under one year old | 523,783 | 538,714 | 556,188 |
| Steers, bulls of all ages, and other beef cattle | 1,979,509 | 2,064,885 | 2,243,863 |
| Total, beef stock‡ | 4,530,565 | 4,613,120 | 4,880,831 |
| Total cattle | 7,776,089 | 7,921,150 | 8,279,122 |
The lamb, beef and mutton produced on New Zealand farms is overwhelmingly destined for export markets. Increasingly, lamb and mutton are being exported as cuts and in boneless form—although most sheepmeat continues to be exported as carcasses. Beef and veal are almost entirely exported in boned-out form or as bone-in cuts.
Table 15.18. MEAT PRODUCTION
| Product | Year ended September | ||||
|---|---|---|---|---|---|
| 1983 | 1984 | 1985 | 1986 | 1987P | |
| Source: Ministry of Agriculture and Fisheries. | |||||
| tonnes (000) | |||||
| Beef | 492.9 | 418.9 | 472.4 | 451.6 | 547.6 |
| Veal | 19.2 | 14.5 | 14.3 | 16.0 | 14.1 |
| Mutton | 200.2 | 194.2 | 227.4 | 152.2 | 199.0 |
| Lamb | 480.1 | 473.4 | 500.9 | 465.0 | 407.3 |
| Pig meat | 39.7 | 42.9 | 47.7 | 47.6 | 44.5 |
| Total | 1232.1 | 1143.9 | 1262.7 | 1132.4 | 1212.5 |
Measured on a product weight basis, export meat production increased by 6 percent in the season ended September 1987. Lamb production decreased by 14 percent, mutton increased 55 percent and beef and veal increased 27 percent.
Lower returns from sheepmeat production contributed to the fall in export lamb production, whereas the increased level of beef and veal produced for export reflected cattle being held over from the previous season because of a six-week strike in freezing plants during February and March 1986.
The number of lambs slaughtered for export during the season ended June 1987 declined to 30.5 million, down 8 percent on the previous season's figure. Adult sheep slaughtering for export increased 49 percent, while beef export slaughterings increased 28 percent.
About two-thirds of all lambs tailed are killed during the season and over 90 percent of the lamb meat produced is exported. Meat consumption in New Zealand represents approximately 25 percent of total production.
Table 15.19. LIVESTOCK SLAUGHTER AT MEAT EXPORT WORKS AND ABATTOIRS*
| Animals | Year ended September | ||||
|---|---|---|---|---|---|
| 1983 | 1984 | 1985 | 1986x | 1987P | |
* Excludes killing on farms. Source: Ministry of Agriculture and Fisheries. | |||||
| head of stock (000) | |||||
| Lambs | 35995 | 34711 | 39963 | 34669 | 31657 |
| Sheep | 9234 | 8895 | 10756 | 6717 | 9296 |
| Adult cattle | 2156 | 1771 | 1982 | 1883 | 2315 |
| Calves and vealers | 963 | 826 | 836 | 952 | 862 |
| Pigs | 720 | 768 | 843 | 843 | 774 |
Table 15.20. MEAT EXPORT PRODUCTION
| Type of meat | Year ended September | ||||
|---|---|---|---|---|---|
| 1983 | 1984 | 1985 | 1986 | 1987P | |
| Source: Ministry of Agriculture and Fisheries. | |||||
| tonnes (000) shipping weight | |||||
| Lamb—carcasses | 366.7 | 343.8 | 350.8 | 298.8 | 231.9 |
| —cuts | 78.4 | 94.0 | 102.5 | 104.2x | 116.9 |
| Mutton—carcasses | 75.2 | 48.9 | 59.8 | 31.8 | 51.8 |
| —cuts | 31.7 | 38.2 | 42.8 | 25.4 | 36.9 |
| Beef—manufacturing | 173.1 | 141.0 | 174.3 | 165.5 | 201.9 |
| —other | 53.8 | 40.9 | 51.7 | 43.3 | 64.2 |
| Veal | 7.3 | 6.9 | 7.2 | 6.7 | 8.5 |
| Pig meat | — | — | — | — | — |
| Other meats | 0.1 | — | 0.1 | — | — |
| Variety meats | 53.9 | 50.7 | 56.9 | 44.7 | 51.2 |
| Inedible meat and offal | 19.0 | 17.3 | 18.5 | 17.1 | 17.7 |
| Total | 859.0 | 781.7 | 864.6 | 737.5x | 781.0 |
The main responsibilities of the New Zealand Meat Producers Board are: meat export licensing; the grading, storage, and shipment of meat; market research and information; negotiating access to markets; the promotion of New Zealand meat; and encouraging improvement in the quality of New Zealand meat.
The board is funded by means of a levy on stock, imposed as a per head charge and collected at the time of slaughter. Funds from the levy totalled $13.6 million in the year ended September 1987.
Table 15.21. MEAT BOARD LEVIES, 1987
| Class of meat | Cents per head* |
|---|---|
* Including GST. Source: NZ Meat Producers Board. | |
| Lambs | 26.4 |
| Other sheep and goats | 38.5 |
| Bobby calves (under 27 kg) | 13.2 |
| Vealers | 132 |
| Other adult cattle | 264 |
The board has engaged in most activities in the export trade in the interests of the producer, influencing meat marketing policy through the regulation of shipments, control over quality, and the development of markets through promotion.
In its market support role the board promotes the sale of meat on an international scale. To this end it has established in its major markets a network of market consultants assisting the board through its overseas offices, which are in London, New York and Tokyo.
Most meat produced in the world is supplied to domestic markets, and only about 8 percent of world output enters into international trade. Among the few countries with significant levels of exports are Australia, New Zealand, Argentina, the Netherlands, Denmark, and the Irish Republic. The principal importers are the countries of Western Europe (in particular, the United Kingdom), the United States, U.S.S.R., and Japan. It is significant, however, that although the European Community countries are substantial meat importers, much of the current trade now takes place between member countries of the Community as governed by the Common Agricultural Policy regulations.
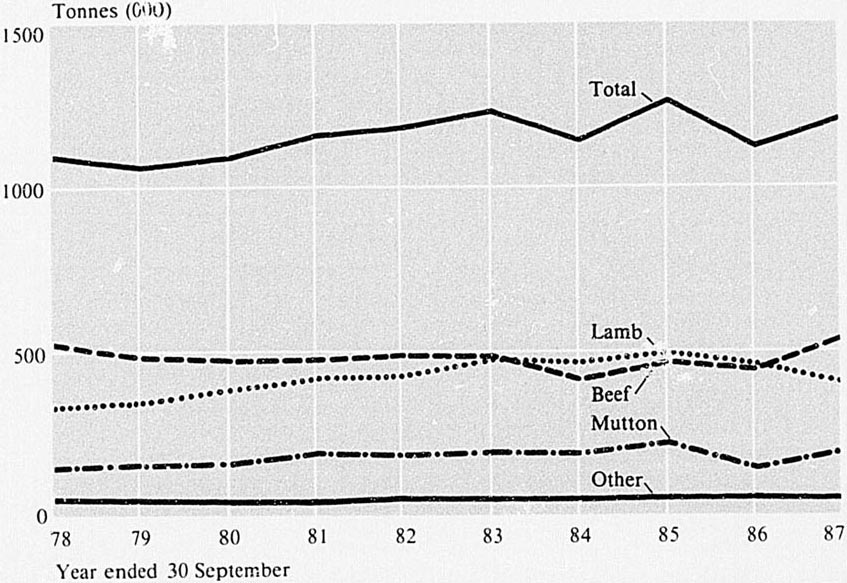
MEAT PRODUCTION—bone-in basis
The major markets for New Zealand meats are Iran and the United Kingdom for lamb; Japan, U.S.S.R. and the United Kingdom for mutton; and the USA and Canada for beef. These six markets accounted for 63 percent of New Zealand's total meat exports in 1986–87, down from 75 percent in 1985–86.
Other significant markets for New Zealand meat in the 1986–87 season were: for lamb—Peru 26193 tonnes, Greece 8524 tonnes, Saudi Arabia 9502 tonnes and West Germany 9493 tonnes; for mutton—Taiwan 2110 tonnes. West Germany 3004 tonnes and Saudi Arabia 1644 tonnes; for beef—Hong Kong 3627 tonnes, Taiwan 4018 tonnes and French Polynesia 3292 tonnes.
Sheepmeat. During 1986–87 lamb exports decreased by 5 percent, reflecting lower production. The main growth area for exports was the United Kingdom which rose from 98754 tonnes in 1985–86 to 110733 tonnes in 1986–87. At the same time Iran decreased by 11 percent to be a market of virtually the same size at 110732 tonnes. Other markets which showed significant increases in volumes during the year were Japan, Spain and Portugal. The most significant decline was in exports to the USA, which fell by 78 percent to 3260 tonnes.
Mutton exports in 1986–87 increased by 25 percent. The main factor contributing to this increase was a rise in exports to the U.S.S.R., the United Kingdom and the Middle East. Those to the U.S.S.R. increased to 26956 tonnes from 7892 tonnes in the previous season, although lamb sales declined steeply. Japan was New Zealand's second largest mutton market taking 26700 tonnes either directly or through South Korean processing operations. However, mutton shipments to Japan declined by 12 percent from the previous year. Mutton exports to the United Kingdom increased by 36 percent to 19378 tonnes.
Beef and veal. New Zealand's biggest market for beef and veal is the United States. In 1986–87 shipments totalled 214200 tonnes, an increase of 32 percent. The next largest market was Canada, with 24142 tonnes, up 24 percent.
Imports of beef into the USA are subject to ‘voluntary restraint’ agreements under a counter-cyclical meat import law. If ‘voluntary restraints’ are not agreed on by the supplying countries then quotas may be imposed. Under this system New Zealand, along with other suppliers, agrees to restrict the quantity of quota meat shipped for arrival in the USA during the calendar year to a negotiated tonnage if the global estimates of US imports exceeds a ‘trigger’ level. Restraints were required in 1987. Canada also operates a counter-cylical meat import law to control beef imports although greater discretionary powers are vested in the Canadian Government as to whether, and at what level, quotas are to be imposed.
A standard system of classifying grades of meat is used in New Zealand. Export meat is graded according to the type of animal, weight, age and fat content. The grades are established by the New Zealand Meat Producers Board.
Lamb—is a sheep of less than 12 months of age. Animals born in the New Zealand spring will be termed lambs until 30 September in the following year. The grades used for classifying lambs are given in table 15.22. Grade A, Y, and P carcasses can be exported with no trimming of excessive fat. Grade T and F carcasses are trimmed of excessive fat prior to export as cuts. Cutter grade carcasses (grade C) are not eligible for export in carcass form due to trimming or mutilation. Intact cuts from these carcasses may be exported. Grade M, the manufacturing grade, includes carcasses which are too thin for export, are damaged, or weigh less than 9 kilograms but are too fat for the A grade.
Table 15.22. LAMB GRADES
| Weight | Fat content | ||||||
|---|---|---|---|---|---|---|---|
| A | Y | P | T | F | C | M | |
| Source: New Zealand Meat Producers Board. | |||||||
| Almost devoid | Light | Medium | Heavy | Excessive | Mixed | Mixed | |
| Less than 9.0 kg | A | ||||||
| 9.0–12.5 kg | YL | PL | TL | FL | CL | ||
| 13.0–16.0 kg | YM | PM | TM | FM | CM | M | |
| 16.5–20.0 kg | YX | PX | TH | FH | CH | ||
| 20.5 kg and over | PH | ||||||
Hogget—is a young male sheep or maiden ewe not qualifying for the lamb grade and having no more than two permanent incisors in wear. Hogget carcasses graded HX have a light fat content and HL grade carcasses have a medium fat content. Manufacturing grade carcasses are classified as mutton.
Ram—is an adult uncastrated male sheep having more than two permanent incisors in wear. The grade R covers all weights of rams.
Mutton—includes both ewes and wethers with more than two permanent incisors in wear. A wether must not show any of the accessory male characteristics. Carcasses graded MM are almost devoid of external fat and include all weight ranges. Carcasses graded MX have a light fat content while ML grade carcasses have a medium fat content. The MX and ML grades are further classified by whether the weight is under or over 22 kilograms. For all weight ranges, MH grade carcasses have a heavy fat content. MF grade carcasses have an excessive fat content, and MP grade is used for sheepmeat destined for processing.
Steers, heifers, cows and bulls—As a basis for determining the fat-cover category into which beef carcasses fall, the depth of subcutaneous fat over the fourth quarter of the eye muscle and the 12th rib is measured. The measurements given in table 15.23 are used as a guide by graders when classifying beef. For P and L grades the class is further divided into L1 or P1 for carcasses which have a well-muscled hindquarter and L2 or G for carcasses which are weaker in the hindquarter.
Table 15.23. BEEF GRADING SYMBOLS
| Symbol | Fat thickness mm | Use | |
|---|---|---|---|
| Source: New Zealand Meat Producers Board. | |||
| M | up to 1 |  | Processing |
| L | 1–3 | Lean cuts or processing | |
| P | 4–12 | Prime export cuts | |
| G | 13–18 | Cuts after trimming | |
| T | 19–24 | Cuts after substantial | |
| E | over 24 | trimming | |
A steer is a male bovine castrated when young. A heifer is a female bovine which has no more than six permanent incisors, while cows have more than six permanent incisors. A bull is an entire bovine with masculine characteristics. Bull carcasses are classified only on weight. Beef weight ranges are measured in 25 kilogram units from 195.5 kilograms to 345 kilograms. The weight ranges for carcasses below 220 kilograms and above 270 kilograms varies with the type of carcass. Carcasses under 160 kilograms are graded M irrespective of the amount of fat.
Veal and bobby calves—Bobby veal carcasses are derived from milk-fed bovine calves generally under two weeks old. They are not subdivided into grades or weight ranges but only carcasses between 10 and 27 kilograms are eligible for export.
Vealer carcasses are derived from maiden female, castrated male, and entire males which are not showing masculine characteristics. The animals can be aged up to 14 months. The meat is finely textured and pinkish in colour, while the fat is white. Vealer carcasses weighing up to 60 kilograms are graded M. carcasses weighing between 60.5 kilograms and 115 kilograms are graded L, and those between 115.5 kilograms and 160 kilograms are graded P.
The Imported Meat Trade Association in the United Kingdom compiles weekly London wholesale meat prices, the basis of quotation being ‘ex-hooks to retailers at Smithfield Market’. In the absence of international standardised prices, the London wholesale prices in table 15.24 give the only indicative measure of world prices. Approximately 42 percent of the value of all New Zealand exports of frozen and chilled meat is generally accounted for by lamb.
Table 15.24. LONDON WHOLESALE IAMB PRICES
| End of last week in March | Lamb (new season's product) | ||||
|---|---|---|---|---|---|
| Prime grade | Y Grade | ||||
| 8 to 12.5 kg | 13 to 16 kg | 16.5 to 19.5 kg | 8 to 12.5 kg | 13 to 16 kg | |
* At 8 April 1983. † 9.0 kg-12.5 kg. ‡ 16.5kg to 20kg Source: New Zealand Meat Producers Board | |||||
| New pence per kilogram equivalent | |||||
| 1983 | 137.1 | 135.6 | 122.4 | 135.1* | 133.4* |
| 1984 | 142.6† | 141.1 | 131.6‡ | 140.0† | 140.0 |
| 1985 | 152.1† | 152.1 | 142.2† | 151.0† | 151.0 |
| 1986 | 145.5 | 147.7 | 143.3 | 141.5 | 144.4 |
| 1987 | 126.8 | 132.3 | 131.2 | 121.3 | 131.2 |
Schedule prices. On 1 April 1987 the meat operators in New Zealand ceased issuing a weekly indicative national schedule of buying prices. However, most meat operators publish their schedules of buying prices in newspapers and their company newsletters. Producers can sell their export meat on schedule, on a pool account system, on the hoof, or they can sell through a producer co-operative.
Overseas prices for beef improved during the 1986–87 season from those recorded for 1985–86. However, the appreciation of the New Zealand dollar reduced the extent to which improved market prices could be passed on to producers.
The New Zealand Meat Producers Board can issue its own schedule of meat export prices when exporters offer prices it considers to be too low. This involves the board not only in setting a schedule of prices but also in arranging for the marketing overseas of the various products.
The opening schedules for the last five seasons are given in table 15.25. The prices quoted for the years 1982–83 and 1983–84 are for dressed weights ‘on the hooks’ at freezing works. However, for 1984–85 and 1985–86 the schedule prices for lamb and mutton represent the Meat Board's advance payments plus any government supplement and are for dressed weights ‘ex-freezer’. The 1986–87 schedules are dressed weight ex-freezer prices offered by the meat exporters. The prices for lamb and mutton are for bare meat only, with an additional payment being made for the wool and pelt.
Table 15.25. OPENING NORTH ISLAND SCHEDULE PRICES
| Class of meat | 1982–83 | 1983–84 | 1984–85 | 1985–86 | 1986–87 |
|---|---|---|---|---|---|
* Prior to 1983–84 ML 22 kg and under. † Based on supplementary minimum price. Source: New Zealand Meat Producers Board. | |||||
| cents per kg | |||||
| Lamb— | |||||
| PL, 9.0–12.5 kg | 133.0 | 135.5 | 218.5 | 130.0 | 165.0 |
| PM, 13.0–16.0 kg | 148.0* | 148.5† | 202.5 | 142.0 | 165.0 |
| YL, 9.0–12.5 kg | 126.0 | 139.5 | 226.5 | 142.0 | 161.0 |
| Mutton— | |||||
| MX, 22 kg and under† | 50.0* | 50.5† | 105.5 | 52.5 | 74.0 |
| MM, all weights | 21.0 | 24.0 | 93.0 | 55.0 | 80.0 |
| Beef— | |||||
| PI—Steer, 245.5–270 kg | 147.5* | 184.5 | 240.0 | 185.0 | 197.5 |
| LI—Steer, 245.5–270 kg | 147.5 | 184.5 | 240.0 | 185.0 | 197.5 |
| M—Cow, 145.5 kg-170 kg | 126.0* | 132.0 | 196.0 | 161.0 | 173.0 |
| Bull, 220.5–245 kg | 147.5* | 178.5 | 244.0 | 210.0 | 208.0 |
New Zealand sheep are largely dual purpose meal/wool animals and their wool is predominantly coarse; 60 percent of the clip is greater than 33 microns in diameter. This contrasts sharply with Australian wool, of which over 90 percent is less than 28 microns. New Zealand is by far the largest supplier of coarse wools, contributing over 40 percent of the world total and five times as much as the U.S.S.R., the next significant supplier. When the quantity of coarse wool entering world trade is considered, New Zealand's share becomes even greater: over 70 percent of traded coarse wools are estimated to originate in New Zealand.
Slipe wools represent around 12 percent of total New Zealand wool production and are a by-product of the meat industry. They are produced by removing wool from the pelts of lambs and sheep during the fellmongering process. New Zealand is one of the largest producers of slipe wools in the world, with the U.K. being the main customer. Slipe wools, due to their softness, are particularly suitable for end uses such as Shetland knitwear, blankets and carpets.
The coarse nature of the New Zealand clip means much of it is used in products such as carpets, handknitting yams, and blankets; although uses to which New Zealand wool is put vary markedly from country to country. A good example is the production of handknitting yams in China where an unusually high proportion of quite coarse New Zealand wool is used.
Wool production. Although New Zealand's sheep flock ranks fourth in the world, the country's raw wool production is second only to Australia on a clean-mass basis. This is due to the high clip yields and lower quantities of grease and other contaminants in the wool.
Table 15.26. WOOL PRODUCTION*
| Season ended 30 June | Flock size | Yield/head | Total wool/production (greasy) | Average auction price (clean basis) |
|---|---|---|---|---|
* Wool quantities are measured at point of sale rather than at source, and are therefore not strictly measures of production. Source: New Zealand Wool Board. | ||||
| (million) | (kg) | tonnes (000) | cents/kg | |
| 1983 | 70.3 | 5.3 | 371 | 346.0 |
| 1984 | 70.3 | 5.2 | 364 | 397.2 |
| 1985 | 69.7x | 5.4 | 373 | 507.0 |
| 1986 | 67.9 | 5.3 | 358 | 463.3 |
| 1987 | 67.5 | 5.2 | 350 | 556.2 |
The New Zealand Wool Board was established to get the best possible long-term returns for New Zealand wool growers. To do this it promotes the use of New Zealand wool in existing or new markets; maintains a marketing system for New Zealand wool suited to the requirements of the world's textile industry; and encourages efficiencies in the preparation, handling, distribution, shipping, and selling of wool. It also promotes research into wool and sheep. As with other producer boards, it operates a minimum-price funding scheme.
The main sources of income for the board are: a levy on gross wool receipts ($77.4 million in the 1986–87 season) and interest on investments ($21.8 million for the 1986–87 season). The levy is set at 5½ percent.
Sales and marketing. Perhaps the board's biggest role is in the New Zealand marketing system and the operation of its market support schemes. It values all wool offered at auction and intervenes in the market according to its commercial judgement. In doing this it may buy wool. The board sells from the stockpile of bought-in wool, normally through the established wool trade in New Zealand. The wool is also valued for the purpose of ensuring a minimum return to growers (the minimum floor price). In the 1987–88 season the minimum average price was set at an average of 476 cents per kilogram, clean weight. When the sale price for a lot at auction falls below the appropriate minimum price and the board does not buy this wool, the difference is paid to the grower as a supplementary payment. Supplement is also paid on privately sold wool, provided the buyers display it under specified conditions for appraisal by the board.
The board's market-support operations are funded by its general capital and reserves, which totalled $ 185 million at 30 June 1987. Supplementary payments under the minimum prices scheme are funded by a minimum-price funding levy introduced in 1976. Currently the levy is 0.5 percent of gross proceeds from all shorn wool sold for the first time. Supplementary payments are made from a separate Minimum Wool Prices Funding Account administered by the board.
A wool auction sales committee, comprising representatives of the board, the New Zealand Woolbrokers Association, and the New Zealand Council of Wool Exporters draws up and supervises an annual roster of wool auctions.
The board grants licences to export wool. It also keeps a list of registered private buyers, registered wool exchange operators, and scourers. It is involved in the development of market innovations, such as the sale of woo) by sample, it is a negotiator of freight rates, and operates a number of wool stores for its own use. Board economists conduct a market intelligence service covering production, disposal, and market prices.
The board administers on behalf of government the Individual Grower Income Levy Retention Scheme. Under this scheme a proportion of the gross proceeds from the sale of wool is retained at the Reserve Bank when the adjusted weighted average sale price at auction exceeds a ‘trigger price’ set by the Minister of Agriculture (845 cents per kilogram, clean, 625 cents per kilogram, greasy, in the 1987–88 season). The proceeds so retained are credited to individual growers' accounts and are refundable to growers after five years, or in special circumstances as described in the regulations. Funds are held by the Reserve Bank. No money has been retained under this scheme for the past six seasons.
Research and development. The board provides a technical service to wool processors and textile manufacturers, both in New Zealand and overseas, and promotes wool textiles, on its own account and in co-operation with garment and carpet manufacturers and the retail trade throughout New Zealand. It also supports New Zealand-manufactured wool products in export markets.
The board provides around 50 percent of the revenue of the Wool Research Organisation of New Zealand (WRONZ). In 1986–87 the board's contribution was $2.4 million. Established in 1960 at Lincoln, Christchurch, the organisation has a professional staff of about 34. It conducts fundamental research on the wool fibre and applied research on scouring, processing, and performance of New Zealand wools. It is also developing the measurement of wool characteristics as an aid in marketing.
The board is also represented on the Wool Testing Authority. Wool testing is used by buyers and processors as a basis for trading. Certificates are provided for yield, vegetable matter, fibre diameter, moisture content, and colour.
The International Wool Secretariat offers technical and fashion advice in menswear, womenswear, and furnishing to manufacturers, administers the Woolmark and the Wool-blendmark (maintaining quality control in more than 15000 factories), and promotes wool through campaigns with manufacturers and retailers. Extensive research and development is also undertaken.
In the 1986–87 season the board's share of the budget of the International Wool Secretariat was $55.8 million. This was about 23 percent of secretariat funds. The secretariat is a partnership with Australia, South Africa and Uruguay. It has its headquarters in London and operates in almost all countries with a substantial consumer market.
The most common way of selling wool is by open auction in New Zealand: 65 percent was sold this way in 1986–87. The auction season runs from July to the following June. Sales are held at four centres around the country and they attract buyers representing all the main wool importing countries. Growers can also sell their wool to merchants privately in New Zealand (25 percent of sales in 1986–87).
The Wool Board's market-support policies help to steady the market in times of uncertainty.
In 1986–87 Wool Board stocks decreased from 19229 tonnes to 5584 tonnes during the season, and the average auction price was 19 percent above the previous season in actual dollars (3 percent in real terms), reflecting strong international demand for wool.
Table 15.27. WOOL SOLD AT AUCTION
| Season ended June | Greasy and scoured new season wool (clean equivalent) | Average clean price per kilogram | Total sale value | Average clean auction price (1986–87 cents) | Board average minimum price per kilogram (clean) |
|---|---|---|---|---|---|
| Source: New Zealand Wool Board. | |||||
| tonnes (000) | cents | $(million) | cents | cents | |
| 1983 | 187 | 346.0 | 647.5 | 535.2 | 339 |
| 1984 | 187 | 397.2 | 741.0 | 588.7 | 336 |
| 1985 | 186 | 507.0 | 941.9 | 673.3 | 424 |
| 1986 | 177 | 463.3 | 820.5 | 540.7 | 443 |
| 1987 | 160 | 555.0 | 888.0 | 557.0 | 443 |
Around 90 percent of the New Zealand clip is estimated to leave the country in a greasy, scoured, or slipe form. Over 60 percent of exports are now scoured, and exports of carded sliver and top are increasing annually. Of the 10 percent of the clip processed in New Zealand, roughly half is exported in product form.
It is important to distinguish between initial and final destinations of New Zealand wool exports. Initial destinations have changed substantially over the years, and there are sometimes very large changes from year to year. Export destinations for wool are shown in table 15.28. During 1985–86 the largest importers were the United Kingdom, China, Japan and the Soviet Union.
With the exception of China, final destinations of end-products made from New Zealand wool have in contrast been rather more stable. Much of the wool tends to be used in the same countries as it did years ago, even though the location of the early-stage processing may have changed. Countries such as the United States and West Germany use less raw wool but import made-up carpets from other countries.
Table 15.28. EXPORT DESTINATIONS OF NEW ZEALAND RAW WOOL
| Country | 1982–83 | 1983–84 | 1984–85 | 1985–86 | 1986–87 |
|---|---|---|---|---|---|
| Source: New Zealand Wool Board. | |||||
| tonnes clean equivalent (000) | |||||
| Japan | 30152 | 34128 | 36980 | 25115 | 25108 |
| United Kingdom | 34187 | 31532 | 36416 | 32012 | 29934 |
| Soviet Union | 26254 | 24675 | 17694 | 24847 | 25132 |
| France | 12914 | 20361 | 18495 | 8850 | 6846 |
| China | 31776 | 19730 | 35897 | 27307 | 48605 |
| United States | 8214 | 14946 | 12470 | 11704 | 13188 |
| West Germany | 12594 | 14626 | 15706 | 14377 | 13150 |
| Italy | 9134 | 12152 | 12517 | 10011 | 8263 |
| Netherlands | 18820 | 11485 | 10879 | 13676 | 13748 |
| Belgium | 10568 | 9865 | 18419 | 13802 | 14552 |
| Australia and Pacific Is | 8303 | 9514 | 11406 | 10929 | 10127 |
| Other | 75645 | 64844 | 51251 | 57173 | 60756 |
| Total exports | 278561 | 267858 | 278130 | 249803 | 269499 |
In recent wool seasons there has been a notable increase in purchases by New Zealand mills (by nearly 50 percent in the five years to 1986), resulting from a large increase in manufactured product exports. A downturn in 1986–87 reflected falling domestic consumption and manufactured exports.
Net domestic consumption of wool in New Zealand is among the highest in the world on a per-head basis. In 1987 this was estimated at 3.26 kg per head compared with 2.39 kg in Australia, 2.11 kg in West Germany, 1.54 kg in the U.K., and 0.67 kg in the U.S.
Because New Zealand wools are predominantly of coarse quality they are not so directly competitive with the output of other major producers. Table 15.29 shows the relative positions of the main exporting countries.
Table 15.29. MAIN EXPORTERS OF WOOL, 1986–87
| Country | Actual weight | Percent of total |
|---|---|---|
| Source: New Zealand Wool Board. | ||
| tonnes (000) | ||
| Australia | 713 | 52 |
| New Zealand | 306 | 22 |
| Argentina | 68 | 5 |
| South Africa | 38 | 3 |
| Uruguay | 39 | 3 |
| All others | 204 | 15 |
| Total | 1368 | 100 |
Wool product exports. The most important wool exports from New Zealand are floor coverings and yarns. After showing steady growth for several years, the value of floor coverings exported in 1987 decreased by 22 percent, to 3032475 square metres. Yam exports amounted to 7362 tonnes, a 14 percent increase on the previous year. Other wool-based export items include: raw and processed sheepskins, tops, wool waste, blankets, fabrics, knitwear and other clothing.
Earnings from total wool products fell slightly to $241 million in 1986–87. These exports are summarised in table 15.30.
Dairy products are a major source of export earnings for New Zealand, and, with the exception of milk and some dairy products for local consumption, the industry is geared heavily towards overseas markets.
There are four major product groupings manufactured from liquid whole milk by dairy factories in New Zealand: milkpowders such as skim milk powder (SMP), whole-milk powder (WMP), and buttermilk powder (BMP); cream products, such as butter, anhydrous milk fat (AMF), and ghee; cheese; and protein products such as lactose, and casein and caseinates.
Skim-milk powder is made from skim milk after the cream has been separated from the liquid whole milk. Whole-milk powder is manufactured directly from the liquid whole milk, without separating off the cream. Buttermilk powder is made from buttermilk, a by-product of the butter manufacturing process. Most of the butter produced is of a ‘sweet cream’ type, and AMF and ghee are further refinements of butter. The predominant cheese variety manufactured in New Zealand is cheddar. The final product grouping, milk proteins, are derived from the by-products of skim milk and also from the by-products of other dairy product manufacture such as cheese.
Table 15.31. MILK PRODUCTION AND UTILISATION OF MILKFAT*
| Product | 1982–83 | 1983–84 | 1984–85 | 1985–86x | 1986–87P |
|---|---|---|---|---|---|
* Year ended 31 May. † Includes milk fed to stock and waste, but excludes separation loss. Source: New Zealand Dairy Board. | |||||
| Production† | |||||
| Milk, litres (million) | 6708 | 7395 | 7647 | 7987 | 7073 |
| Milkfat, tonnes (000) | 316 | 352 | 362 | 378 | 334 |
| Liquid milk, cream, and ice cream, litres (million) | 482 | 488 | 493x | 482 | 461 |
| Utilisation of milkfat processed | tonnes (000) | ||||
| Butter | 209.9 | 241.1 | 247.7 | 256.0 | 206.0 |
| Cheese | 42.7 | 39.8 | 39.3 | 45.9 | 42.0 |
| Other whole-milk products | 37.8 | 42.9 | 45.4 | 47.6 | 52.7 |
| Total | 2903 | 323.8 | 332.4 | 349.5 | 300.7 |
Table 15.32. DAIRY FACTORY PRODUCTION
| Product | 1982–83 | 1983–84 | 1984–85 | 1985–86 | 1986–87P |
|---|---|---|---|---|---|
| Source: New Zealand Dairy Board | |||||
| tonnes (000) | |||||
| Creamery butter | 238.5 | 255.2 | 243.1 | 275.7 | 220.3 |
| Whey butter | 2.8 | 18 | 1.8 | 1.8 | 1.7 |
| Anhydrous milkfat (AMF) | 8.5 | 24.8 | 32.6 | 14.3 | 15.2 |
| Frozen cream | 6.1 | 8.0 | 6.3 | 6.4x | 6.5 |
| Cheese | 114.4 | 109.3 | 117.7 | 127.3 | 113.6 |
| Condensed and evaporated milk | 4.0 | 3.6 | 2.9 | 2.8 | 3.0 |
| Whole-milk powder | 101.6 | 111.8 | 120.1 | 152.8 | 156.0 |
| Infant food | 16.6 | 13.6 | 11.8 | 13.6x | 14.0 |
| Skim-milk powder | 164.6 | 219.1 | 217.0 | 186.7x | 139.2 |
| Buttermilk powder | 24.0 | 28.6 | 28.6 | 27.9 | 22.7 |
| Casein products | 65.2 | 63.1 | 64.2 | 75.4 | 61.5 |
| Lactose | 10.3 | 10.8 | 11.5 | 13.7 | 14.0 |
| Whey powders | 10.4 | 13.4 | 11.4 | 12.5 | 9.5 |
Table 15.33. TOWN MILK
| Year ended 31 August | Production | Quantity on which town milk price paid | Volume of town milk sales by milk stations to consumers | Price per litre paid to producers finest grade | Government subsidy per litre of town milk sales to consumer |
|---|---|---|---|---|---|
* Until 8 November 1984 as a result of the price freeze the price paid was 24.065. † Subsidy ceased 1 March 1985. Source: New Zealand Milk Board. | |||||
| litres (m) | litres (m) | litres (m) | cents | cents | |
| 1981 | 674.2 | 471.7 | 365.9 | 18.735 | 10.329 |
| 1982 | 663.0 | 437.1 | 357.8 | 22.959 | 8.137 |
| 1983 | 660.0 | 427.5 | 352.8 | 22.959 | 1.593 |
| 1984 | 679.6 | 427.6 | 350.4 | 24.041 | 3.510 |
| 1985 | 691.4x | 422.7 | 349.4 | 26.792* | 1.545† |
| 1986 | 673.9 | 421.6 | 339.3 | 27.290 | … |
| 1987 | 629.4 | 406.9 | 336.5 | 23.394 | … |
There are presently 24 co-operative dairy companies which operate around 50 dairy factories for the production of manufactured dairy products. Each company is governed by a board of directors who are elected by farmer suppliers. The co-operatives utilise funds supplied in the form of share capital by the farmers.
The companies produce all dairy products manufactured in New Zealand. On an annual basis the companies convert approximately 7 million tonnes of milk into approximately 800000 tonnes of dairy products, of which around 700000 tonnes is exported. The balance is consumed on the relatively small domestic market.
Milk for sale on the domestic market is usually produced by different farmers to those who supply dairy factories. Until 1988 the town milk industry, as it is known, was regulated by the New Zealand Milk Board. The board was abolished with the deregulation of the town milk industry from 1 April, 1988.
A three-member New Zealand Milk Authority has since been established with the main function of licensing milk processors, who are responsible for providing a home milk delivery service within a defined district.
Where the earlier Milk Board prescribed quantities and prices to processors and their suppliers, deregulation means the two groups are now free to negotiate terms themselves.
New Zealand Dairy Board. The board is the single organisation responsible for marketing and selling dairy produce manufactured for export. It links manufacturing and industry growth plans with export market requirements.
The board buys export dairy products from the co-operative manufacturing companies. It markets the goods overseas, and returns the proceeds to the companies, less marketing and administration costs. These monies are then passed to the dairy farmers.
The board exports around 700000 tonnes of manufactured dairy products to over 100 countries annually. About half this volume is exported to Europe. North America, and Japan. The other half is exported to the developing countries, in particular to South-east Asia, and to South and Central America.
The board sells products through its numerous offshore companies, and through local agents, or, in some cases, directly on a contract basis.
The international market for dairy products is characterised by its small size relative to total world milk production, with only about 5 percent of production entering international trade. Because of this the market is especially vulnerable to shifts in climatic, commercial, and political forces. Marginal production changes in the major producers can trigger massive shifts in supplies of, and prices for, products on the international market.
There are four major dairy exporters: the European Community: New Zealand: Australia; and Canada. These four supply about 80 percent of dairy products traded on the international market. Relatively smaller quantities are exported by the Nordic countries and from Eastern Europe.
Access to markets. For social and political reasons governments in many countries often assist farmers through price-support mechanisms. High domestic prices which are fixed with little regard to commercial reality in turn stimulate production but discourage consumption, thus creating surpluses. The disposal of these surpluses, by means of government export subsidies, undermines the stability and the value of the international dairy market.
The disposal of dairy surpluses by other countries creates real difficulties for New Zealand. For, although most countries are not dependent on dairy export earnings as a major source of foreign exchange, New Zealand is one of the few countries to which the dairy market is of particular significance. Moreover, New Zealand dairy production and exporting is unsubsidised.
Consequently New Zealand maintains a strong presence in international councils attempting to achieve a more stable balance between demand and supply in international dairy trade. The Government and the Dairy Board also work to ensure that existing lines of limited access to international markets are not compromised by moves to further restrict imports, particularly through the General Agreement on Tariffs and Trade (GATT), and the councils of Europe.
The late 1970s ‘Tokyo Round’ of GATT Multilateral Trade Negotiations (MTN) resulted in the negotiation of the International Dairy Arrangement to replace an OECD agreement on whole-milk powder and earlier GATT agreements on skim-milk powder and anhydrous milk fat. The new arrangement (signed by New Zealand in December 1979) extended the product coverage and provided for an annual review of minimum prices at which products can be traded internationally. It also established the International Dairy Products Council to monitor the international market situation and provide a forum for seeking solutions to problems in international dairy trade.
This round also saw New Zealand securing European Community agreement to import an annual quota of 9500 tonnes of New Zealand cheese. Compared with the 70000 tonnes of cheese which New Zealand exported to the Community prior to Britain's accession, the Tokyo Round quota is not large, but nonetheless has enabled New Zealand to continue marketing cheese throughout the Community.
At present the 95 contracting parties to the GATT are engaged in a new round of trade negotiations. The latest round was launched in Uruguay in 1986 (see section 22.1, Trade development). It is the first round of negotiations to include discussion on freeing up agricultural trade, which is characterised by import restrictions, and production and export subsidies. New Zealand is taking an active part in the debate regarding agricultural trade reform.
In addition to reduced cheese access into Europe since the 1970s, New Zealand has had to contend with reduced access to the UK butter market. The European Council of Agricultural Ministers determined that the volume of imports should fall from 83000 tonnes in 1984 to 74500 tonnes in 1988. Further access was negotiated during 1988, and an agreement was near at the time of going to press.
Composition of exports. New Zealand's diary product mix in any year is determined by a number of factors. These include the yield of various dairy products (or the particular volumes and groupings of products can be made from a certain quantity of milk), the requirements and state of the international market, and the capacity of the industry to manufacture various product combinations. In general, New Zealand dairy product manufacture and export (and indeed milk production itself) has shown considerable stability over the past 20 years, with the only exception being whole-milk powder, where production and exports have grown in recent years reflecting significant growth in the international market.
Export markets. The dairy industry has been working to diversify its markets for many years. Today, New Zealand's major markets vary for different products. Although Britain remains New Zealand's most valuable market for butter, the Soviet Union is also critically important, and the Middle East and North Africa have risen into prominence as markets for butter.
The primary markets for casein and cheese are the United States, Japan, and the European Community. New Zealand is the world's largest exporter of casein and caseinate products and is also moving forward in its range of other specialised milk protein products. These are highly specialised, high-cost products which are put to a myriad of uses, from automobile manufacture to meat processing and alcohol distillation. They are based on traditional casein manufacture and also derived from the processing of whey.
The most important milk-powder markets are in Central and South America and Southeast Asia, but there has also been growth in skim-milk powder exports to the Middle East. In these countries' the demand for powder products (and for AMF), is based on the need for re-combining powders to produce liquid milk for drinking.
Continued diversification of markets, however, is limited as the international dairy market free of trading restrictions is finite and relatively small (equivalent to 3 percent of total world milk production). Table 15.34 shows the changing directions of New Zealand's dairy export earnings in the period since 1970.
Table 15.34. DAIRY EXPORT EARNINGS
| Product | 1970 | 1975 | 1986 | |||
|---|---|---|---|---|---|---|
| United Kingdom | All markets | United Kingdom | All markets | United Kingdom | All markets | |
| Source: New Zealand Dairy Board. | ||||||
| $(million) | ||||||
| Butter | 104.0 | 113.2 | 121.0 | 146.8 | 249.1 | 470.1 |
| Cheese | 35.7 | 47.9 | 20.2 | 73.7 | 38.3 | 263.8 |
| Casein | 3.2 | 33.5 | 0.4 | 19.4 | 4.6 | 256.3 |
| Other dairy products | 8.8 | 47.8 | 151.6 | - | 702.8 | - |
| All dairy products | 151.7 | 242.5 | 141.6 | 391.5 | 292.0 | 1,692.5 |
Different systems of guaranteeing minimum prices for milk and cream used for export dairy products have been in place in New Zealand since 1936.
The system of fixing prices to suppliers is set out in the Dairy Board Act, which was amended during 1988 to take effect for the 1988–89 season (beginning June). The main change to the Act involved the abolition of the Dairy Products Prices Authority, which previously fixed prices paid to suppliers on the basis of (a) the milkfat and (b) the solids-non-fat value of milk at the start of each season.
Previously these base figures were combined with a range of accounting practices used by the Dairy Board to maintain reserves and a stable income to its suppliers with ministerial or government oversight through the authority. Price fixing is now the responsibility of the Dairy Board alone.
Other changes in the amended Act allow for the freeing up of the Diary Board's accounting and credit-raising practices and the removal of a requirement to hold accounts with the Reserve Bank.
Payment to suppliers made under the former system for the last five seasons are given in table 15.36. The earlier system of price-fixing was outlined in the last Yearbook.
Table 15.36. PRICES FOR MILKFAT AND SOLID-NON-FAT
| Season ended 31 May | Milkfat value | S.N.F. value | End of season distribution | Total whole milk value |
|---|---|---|---|---|
| Source: New Zealand Dairy Board. | ||||
| (cents per kilogram of milkfat) | ||||
| 1982–83 | 224 | 94 | 42.75 | 360.75 |
| 1983–84 | 240 | 100 | 10.00 | 350.00 |
| 1984–85 | 268 | 113 | 15.48 | 396.48 |
| 1985–86 | 275 | 125 | - | 400.00 |
| 1986–87 | 213 | 107 | - | 320.00 |
Pig numbers fell in the late 1960s as farmers began increasingly to supply whole milk to dairy factories instead of separating off the skim milk, which was frequently used to feed pigs. There was increased emphasis on grain-feeding, and a significant increase in pig numbers in the grain-producing areas of the South Island in the following years. More recently the numbers of pigs have shown a steady increase although they fell in 1986.
As at 30 June 1987, there were 378 poultry farmers licensed to run more than 100 birds. Farms comprising 100 birds or fewer are not required to have a licence.
Production of chicken meat during the year ended September 1987 totalled 22403 tonnes of fresh meat and 25354 tonnes of frozen meat.
Table 15.38. POULTRY FLOCKS*
| Flock size (birds) | 1985 | 1986 | 1987 | |||
|---|---|---|---|---|---|---|
| Number of runs | Number of birds | Number of runs | Number of birds | Number of runs | Number of birds | |
* At 30 June. Source: New Zealand Poultry-Board. | ||||||
| 101–1000 | 76 | 53,886 | 60 | 38,541 | 28 | 17,476 |
| 1001–5000 | 107 | 325,449 | 85 | 264,695 | 68 | 206,181 |
| Over 5000 | 257 | 2 845 939 | 233 | 2 702 560 | 224 | 2 781 244 |
| Total | 440 | 3 225 274 | 378 | 3 005 796 | 320 | 3 004 901 |
New Zealand Poultry Board. The functions of the New Zealand Poultry Board are: to promote, organise and develop the poultry industry; and to assist, foster, and promote efficiency in the production, marketing, and distribution of poultry and poultry products. The board has eight members, of whom three are appointed as representatives of government and five as representatives of poultry farmers.
Eggs. Poultry farms sell most of their eggs through egg wholesalers (formerly licensed egg marketing agents) and are therefore mainly responsible for supplying eggs to retail shops in the cities and larger towns.
Commercial poultry farms are distributed over both islands, but there are concentrations around Auckland, Tauranga, Christchurch, and Oamaru. The egg industry does not cater for overseas markets, though limited quantities of frozen egg pulp and dried powder surplus to local requirements are exported.
The rich pasture lands of New Zealand and some of its forest and bush areas are favourable for apiculture and produce high-grade honey. Although clover is still the principal type, a number of other New Zealand native honey sources have wide national and international consumer appeal. Honeydew honey, for example, which is produced from the beech forests of the northern half of the South Island.
In 1987 the total honey crop was assessed at 10091 tonnes, compared with the previous year's crop of 9471 tonnes, with an average production of 30 kilograms per hive. About 3000 tonnes are exported annually. Traditionally this has been in bulk form, but larger quantities of cut comb and of extracted retail-pack honey are now being exported as well. These exports were worth $6.8 million in 1987.
Beeswax from cappings amounted to 166 tonnes in 1987. The industry's other products include pollen, package bees and queen bees. Exports of queen bees and package bees were worth $600,000 in 1987 and this is expected to grow with continuing demand from Canada.
There is also a rapidly increasing demand for bees for crop pollination. More than 89000 colonies were transported in 1987 specifically for the purpose of orchard pollination (mainly for kiwifruit, berryfruit, apples, and stonefruit).
Fewer than 300 beekeepers completely depend on honey production and beekeeping for their livelihood. They are represented by the National Beekeepers Association of New Zealand, based in Wellington.
A hive levy, payable by all beekeepers producing honey for sale and who own 50 or more honey-producing hives, is administered by the association for the benefit of the industry generally. The rate of the levy is reviewed annually—and was 37.5 cents per hive in 1988.
Table 15.40. APIARIES AND HONEY PRODUCTION, 1987
| District | Beekeepers | Apiaries | Hives | Honey production |
|---|---|---|---|---|
| Source: Ministry of Agriculture and Fisheries. | ||||
| number | tonnes | |||
| Whangarei | 690 | 1927 | 19656 | 418 |
| Auckland | 1492 | 2848 | 23509 | 705 |
| Hamilton | 753 | 3041 | 45705 | 1506 |
| Tauranga | 790 | 3788 | 58423 | 1450 |
| Palmerston North | 1537 | 4082 | 40969 | 1012 |
| Nelson | 592 | 2260 | 26341 | 966 |
| Christchurch | 835 | 3782 | 47869 | 1070 |
| Oamaru | 390 | 3661 | 47710 | 1954 |
| Gore | 373 | 2231 | 30251 | 1011 |
| New Zealand | 7452 | 27620 | 340433 | 10091 |
Although pastoral farming is the major land use in New Zealand, in recent years there have been significant increases in the area planted in horticulture and other crops.
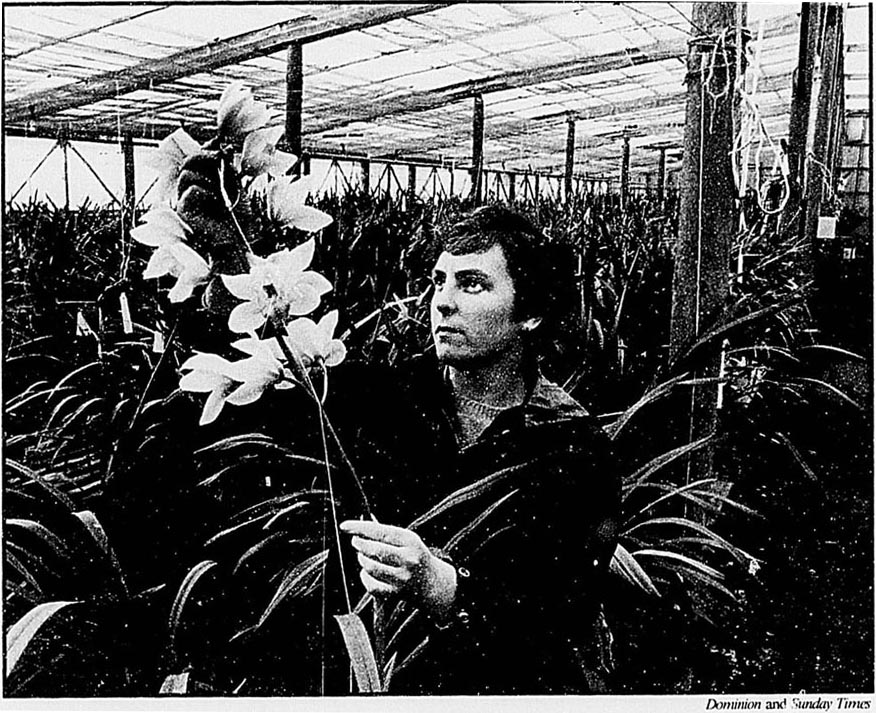
Cymbidium orchid growing, Hawera.
In traditional arable production regions such as Canterbury, Southland, Hawke's Bay, and Wanganui-Manawatu there have been increased arable plantings, particularly of malting barley for the export market. Plantings have also begun in other regions such as Wairarapa. Other crops include wheat (mainly for domestic use), herbage seeds and some herbs, and oilseed rape (for both domestic and export markets).
The most dramatic increases in horticulture have occurred in the Bay of Plenty with the development of kiwifruit production from the mid 1970s. However, in other areas which have traditionally grown horticultural crops—such as Northland, Hawke's Bay, Poverty Bay, Horowhenua, Nelson, Marlborough, and Otago—there have also been increased plantings and changes in crops planted.
Major crops for the export market include kiwifruit, pipfruit, summerfruit (stonefruit), berryfruit. Grapes are grown mainly for the domestic market and for wine production.
Stock feed. Animals can be grazed in open pasture for the full 12 months of the year, but the winter growth of grass, except in certain favoured localities, needs to be supplemented in order to keep stock in good condition during the colder months, and in some districts supplementary fodders are necessary in the drier summer months. Hay and silage crops are grown almost exclusively on the farms where they are consumed, though some districts specialise in the growing of certain other supplementary fodder crops. The bulk of the supplementary fodders, other than grass and clover, hay, and silage, is grown in the South Island, since the colder climate necessitates more extensive supplementary feeding than in the North Island.
The renewal and extension of pastures require the annual supply of very considerable quantities of grass seed. There is an appreciable export trade in some species of grass seeds.
Table 15.41. GRAIN AND PEAS, 1986*
| Crop | Area threshed | Yields | ||||
|---|---|---|---|---|---|---|
| North Island | South Island | Total | North Island | South Island | Total | |
| * Year ended June. | ||||||
| hectares | tonnes | |||||
| Wheat | 1817 | 79718 | 91535 | 48404 | 331310 | 379714 |
| Oats | 1267 | 14611 | 15878 | 4080 | 55829 | 59909 |
| Barley | 22737 | 115814 | 138551 | 87684 | 468511 | 556195 |
| Peas | 1314 | 25924 | 27238 | 3850 | 60679 | 64529 |
| Maize | 19412 | 95 | 19507 | 186918 | 798 | 187716 |
Wheat. New Zealand wheat is primarily grown for domestic human consumption or for use as stock feed. Control of the distribution of both imported and locally produced wheat was the responsibility of the New Zealand Wheat Board, which was also responsible for the distribution of flour and associated by-products.
During 1987 and 1988 the wheat industry was progressively deregulated and the wheat board abolished from April 1988. Growers and processors now negotiate quality standards and prices without any intermediate authority.
Most wheat is grown in the South Island in the Aorangi and Canterbury local government regions. In the year ended June 1986 these regions provided 69 percent of the total yield of 379714 tonnes. The main varieties planted were Oroua, Karamu, Rongotea and Takahe.
Barley. Most barley grown in New Zealand is used for the manufacture of stock feed and for malting. Production has increased steadily in recent years as growers have increasingly exported malting and feed-quality product to overseas markets. The main growing area is the middle and southern parts of the South Island. In 1985, 39 percent of the crop came from the Aorangi local government region. In the North Island the main growing regions are Wanganui and Manawatu, which between them provided nearly 10 percent of the total crop in 1985. The main varieties of barley planted are Triumph, Goldmarker and Kym.
Maize. Primarily grown in the eastern North Island, is used as poultry feed and increasingly as a supplementary feed for pigs and other livestock. In 1986 the Waikato local government region provided 32 percent of the crop, the Bay of Plenty and the East Cape 18 percent each.
Oats. Grown mainly for threshing and green feed, oats are also used to produce milled rolled-oats, oatmeal, and oaten foods. The main local government regions for oats are Aorangi and Southland, which provided 27 percent and 38 percent respectively of the 1986 crop of 59909 tonnes. The main variety planted is Mapua (Makura).
Field peas. Over 85 percent of peas are grown in the Canterbury and Aorangi local government regions in the South Island. The main varieties of field types are Blue Boiling and Maple.
Potatoes. The production of potatoes is usually adequate to meet home market requirements.
Potato yields have risen to such an extent that a population of 3.3 million is now supplied from the same area as were 1.75 million people 30 years earlier. Most of this increased production has been the result of research, the introduction of new varieties, and better farming practice.
Until recently the supply of a suitable quantity and quality of potatoes for the local market was the responsibility of the New Zealand Potato Board. From April 1988 the board was abolished and its assets and some of its functions transferred to the Vegetable and Potato Growers Federation.
Seed certification. The Ministry of Agriculture and Fisheries operates a seed certification scheme covering all the main herbage and arable species (and participates in the OECD seed scheme). The scheme is widely accepted both within New Zealand and overseas, with considerable exports of certified seed to EC countries, the Pacific Basin, and North and South America. Both government-funded and private breeders are actively engaged in the production of new and improved cultivars, which are subsequently multiplied through the certification scheme to the ultimate benefit of end users.
Plant selectors' rights. Breeders of a new and distinct plant variety may obtain a grant of Plant Selectors' Rights. Such a grant gives the breeders, for a specified number of years, exclusive selling rights for the variety, enabling them to recover costs, and perhaps make a profit. The scheme is administered by the Ministry of Agriculture and Fisheries. It encourages investment in plant breeding in New Zealand; encourages the introduction of improved overseas varieties and benefits farmers, horticultural growers, and home gardeners by giving them a wider choice of improved varieties. Rights may be obtained for varieties of all plants except fungi, algae, and bacteria. The New Zealand scheme complies with the Convention of the International Union for the Protection of New Varieties of Plants (UPOV).
In the year to June 1986, 266143 tonnes of fresh fruit at a value of $441.1 million was exported and a further $57.8 million was earned from processed fruit.
Table 15.42. AREAS PLANTED IN FRUIT
| Fruit | 1984 | 1985 | 1986 | Main districts |
|---|---|---|---|---|
| hectares | ||||
| Citrus— | ||||
| Grapefruit | 278 | 248 | 235 | Bay of Plenty |
| Lemons | 200 | 213 | 240 | Bay of Plenty |
| Mandarins | 298 | 318 | 301 | Bay of Plenty, Northland |
| Oranges | 772 | 771 | 809 | East Cape, Northland |
| Tangelos | 569 | 574 | 540 | Bay of Plenty, Northland |
| Pip fruit— | ||||
| Apples | 7024 | 7226 | 7818 | Hawke's Bay, Nelson |
| Pears | 660 | 611 | 634 | Hawke's Bay, Nelson |
| Stone fruit— | ||||
| Apricots | 670 | 750 | 778 | Otago |
| Nectarines | 948 | 1216 | 1261 | Hawke's Bay, Otago |
| Peaches | 1190 | 1295 | 1271 | Hawke's Bay, Auckland |
| Plums | 338 | 350 | 342 | Hawke's Bay, Auckland |
| Cherries | 175 | 176 | 190 | Marlborough |
| Berry fruit— | ||||
| Blackcurrants | 890 | 750 | 697 | Canterbury, Southland |
| Blueberries | 516 | 606 | 566 | South Auckland, Bay of Plenty |
| Boysenberries | 487 | 510 | 457 | Nelson, South Auckland, Bay of Plenty |
| Raspberries | 532 | 551 | 517 | Canterbury, Nelson |
| Strawberries | 364 | 378 | 327 | Auckland |
| Other brambles | 168 | 139 | 80 | South Auckland, Bay of Plenty |
| Subtropicals— | ||||
| Avocados | 1062 | 1217 | 1225 | Bay of Plenty, Northland |
| Feijoas | 258 | 317 | 267 | Bay of Plenty |
| Kiwifruit | 16013 | 17978 | 18316 | Bay of Plenty |
| Tamarillos | 396 | 441 | 434 | Northland, Bay of Plenty- |
| Passionfruit | 85 | 116 | 88 | Bay of Plenty |
| Grapes (outdoor) | 6007 | 5636 | 4774 | Gisborne, Hawke's Bay |
Grape growing and wine production. The estimated net area of the vineyards throughout New Zealand as at June 1986 was 4774 hectares, a significant decrease from 5636 hectares a year before. The main grape-growing areas are Gisborne, Hawke's Bay, Marlborough. Auckland, and Poverty Bay.
In table 15.44 the figures of wine production and sales are based on an annual census of New Zealand winemakers licensed under the Wine Makers Act 1981 and producing grape-wine during the current June year.
New wine put down during the 1986–87 season decreased from 43.0 million litres the previous year to 41.8 million litres, a decrease of 2.9 percent. Sales decreased 8.1 percent.
Table 15.43. WINE STOCKS
| Grape and fruit wine | Year ended June | ||
|---|---|---|---|
| 1985 | 1986 | 1987 | |
| * Differences between closing stocks one year and opening stocks the next are caused by changes in the number of licence-holders operating from year to year and differences notified by winemakers when preparing their figures. | |||
| litres(000) | |||
| Winery stocks at start of season* | 72101 | 85129 | 74194 |
| Production during season | 60289 | 43036 | 41786 |
| Disposals during season | 44135 | 52432 | 48179 |
| Winery stocks at end of season* | 86602 | 74085 | 66172 |
| Losses during season, samples, spillages, own-consumption, etc. | 1654 | 1650 | 1628 |
Table 15.44. WINE PRODUCTION AND SALES
| Grape wine | Year ended June | |||
|---|---|---|---|---|
| 1986 | 1987 | |||
* Included with winemakers' production from current vintage. † Combined for reasons of confidentiality. ‡ Includes all cocktails, liqueurs and wine-based products, 15 percent alcohol by volume and over. | ||||
| litres(000) | ||||
| Production— | ||||
| Wine produced from: | ||||
| (a) Opening stocks of unfermented grape juice |  | * |  | 3438† |
| (b) Unfermented grape juice purchased from licensed winemakers | ||||
| Additives used with: | ||||
| (a) Opening stocks of grape wine |  |  | ||
| (b) Grape wine bought in from licensed wine makers | ||||
| Winemakers' production from current vintage | ||||
| Table wine—White still | 27630 | 32236 | ||
| Red and rose still | 4081 | 3327 | ||
| Sparkling | 5 202- | 242† | ||
| Coolers (grape wine content only) | ||||
| Total table wine | 36913 | 35805 | ||
| Fortified wine‡ | 5479 | 1933 | ||
| Total production | 42391 | 41176 | ||
| Sales— | ||||
| Table wine—White still | 32336 | 28608 | ||
| Red and rose still | 3757 | 3530 | ||
| Sparkling | 7 844- | † | ||
| Coolers (grape wine content only) | ||||
| Total table wine | 43937 | 39755 | ||
| Fortified wine‡ | 7909 | 7840 | ||
| Total sales | 51846 | 47595 | ||
| Stocks at 30 June— | ||||
| Table | 59170 | 55026 | ||
| Fortified | 14262 | 10547 | ||
| Total | 73432 | 65573 | ||
Pipfruit (apples, pears, nashi). In recent years the apple orchard area in New Zealand has increased by an average of 5 percent per year. The total area planted in June 1986 was 7818 hectares with the Hawke's Bay, Nelson, Auckland, Canterbury, and Otago regions being the main production areas. The main varieties planted are Granny Smith, Red Delicious types, Gala, Royal Gala, Braeburn, Fuji and Cox's Orange. Production is increasing steadily, and in the 1986–87 season submissions to the NZ Apple and Pear Marketing Board were reported to be 293000 tonnes, of which 56 percent was exported fresh, 34 percent processed, and 10 percent sold fresh on the local market. When sales direct from the orchard to the consumer are included, total apple production for 1987 would have been about 320000 tonnes.
European pear plantings, after remaining static for some years, are beginning to increase. Packham's Triumph, Beurre Bosc, and Doyenne du Cornice are the main varieties being planted.
Nashi, a recently introduced Asian pear type from Japan, is rapidly increasingly in popularity. By June 1986, 450 hectares were estimated to have been planted. The main Nashi districts are Auckland, Waikato, Bay of Plenty Poverty Bay, Hawke's Bay, and Nelson. The main varieties are Hosui, Kosui, Nijisseiki, Shinseiki, and Shinsui.
Apple and European pear marketing is under the control of the New Zealand Apple and Pear Marketing Board. This organisation is the sole wholesaler and exporter of these fruits in New Zealand. Individual orchardists, however, have the right to sell fruit produced on their own properties direct to consumers in quantities of up to two bushels at a time.
Nashi marketing is well organised, with this fruit being exported through licensed exporters who have been authorised to use the nashi industry's trademark by the New Zealand Nashi Council.
Table 15.45. APPLES AND PEARS RECEIVED BY THE NEW ZEALAND APPLE AND PEAR MARKETING BOARD, 1986–87 SEASON*
| Variety | Hawke's Bay | Nelson | Other districts | Total |
|---|---|---|---|---|
* Ended 30 September. † 18.5 kg carton. Source: New Zealand Apple and Pear Marketing Board. | ||||
| (000 cartons†) | ||||
| Apples— | ||||
| Granny Smith | 3316.3 | 1627.3 | 804.9 | 5748.5 |
| Sturmer Pippin | 93.3 | 545.2 | 198.5 | 837.0 |
| Golden Delicious | 133.3 | 521.5 | 215.1 | 869.9 |
| Red Delicious | 2341.2 | 847.6 | 446.5 | 3635.3 |
| Cox's Orange Pippin | 345.5 | 735.1 | 192.3 | 1272.9 |
| Gala | 497.3 | 106.2 | 93.8 | 697.3 |
| Other | 1451.9 | 1057.6 | 524.1 | 3033.6 |
| Total apples | 8178.8 | 5440.5 | 2475.2 | 16094.5 |
| Pears— | ||||
| Packham's Triumph | 72.4 | 89.4 | 17.5 | 179.4 |
| Winter Cole | 73.9 | 29.5 | 14.1 | 117.5 |
| Winter Nelis | 67.4 | 11.3 | 32.1 | 110.8 |
| Other | 42.2 | 42.8 | 31.5 | 116.5 |
| Total pears | 255.9 | 173.1 | 95.2 | 524.2 |
Summer fruits. At 30 June 1985 the areas planted in summer fruits were: apricots. 750 ha: cherries, 176 ha; nectarines, 1216 ha; peaches, 1295 ha; plums, 350 ha.
The main summer fruit production areas are Hawke's Bay, Marlborough, Central Otago, Canterbury, and Auckland.
Most summer fruits are produced for local consumption, although exports have expanded in recent years to reach 3486 tonnes with an f.o.b. value of over $9.3 million in 1987. Nectarines account for 75 percent of the volume of exports, followed by peaches, apricots, and cherries. Australia is the main export market. Recently access for cherry exports was gained in the Japanese market.
Following a period of rapid expansion the summer fruit orchard area is now showing some decline owing to overproduction, bringing marketing problems, particularly for nectarines.
Marketing of summer fruits has been poorly organised in the past, forcing the industry to seek a more disciplined approach. In 1987 the industry became one of the first to come under the Horticultural Export Authority.
Kiwifruit. Kiwifruit has become New Zealand's leading horticultural export, with a value of around $500 million in 1987. The industry, regulated by the New Zealand Kiwifruit Authority, has developed rapidly in the last 10 years. This is shown in table 15.46.
Kiwifruit is produced in all regions of the North Island, as well as in the North of the South Island. The Bay of Plenty is the major production area. During 1988 it was announced that a central kiwifruit marketing authority would be established to market the fruit.
Table 15.46. GROWTH IN KIWIFRUIT PRODUCTION
| Year | Area hectares | Production tonnes | Export tonnes |
|---|---|---|---|
| 1978 | 217.3 | 9616 | 7992 |
| 1987 | 17000 | 227000 | 170000 |
Citrus and subtropicals. Although small compared to the kiwifruit and pip fruit industries, export markets are being developed for a large number of these crops—including avocados, citrus (lemons, Seminole tangelos, and navel oranges), tamarillos, feijoas, passion fruit, persimmons, and babacos.
15.1–15.2 Ministry' of Agriculture and Fisheries. Department of Statistics.
15.3 New Zealand Meat Producers Board.
15.4 New Zealand Wool Board.
15.5 New Zealand Dairy Board.
15.6 Department of Statistics, New Zealand Poultry Board. Ministry of Agriculture and Fisheries. National Beekeepers' Association.
15.7 Ministry of Agriculture and Fisheries. Department of Statistics. New Zealand Apple and Pear Marketing Board.
Agricultural Statistics. Department of Statistics (annual).
Annual Report of the Tobacco Board. The Tobacco Board.
Census of Agricultural Contracting Services, 1984–85. Department of Statistics.
Contacts in Agriculture. Ministry of Agriculture and Fisheries (biennial).
Monthly Abstract of Statistics. Department of Statistics.
National Monitoring Report. Ministry of Agriculture and Fisheries (six-monthly).
New Zealand Agricultural Statistics. Ministry of Agriculture and Fisheries (annual).
New Zealand Apple & Pear Marketing Board. Annual Report.
New Zealand Beekeeper. National Beekeepers Association of New Zealand (annual).
New Zealand Dairy Board Annual Report.
New Zealand Fertiliser Statistics. Ministry of Agriculture and Fisheries (annual).
New Zealand Horticulture Statistics. Ministry of Agriculture and Fisheries (annual).
New Zealand Meat Producer. New Zealand Meal Producers Board (quarterly).
New Zealand Meat Producers Board Annual Report.
New Zealand Milk Board Annual Report.
New Zealand Pork Industry Board Annual Report.
New Zealand Poultry Board Annual Report.
New Zealand Wool Board Annual Report.
Report of the Ministry of Agriculture and Fisheries (Parl. paper C. 5.)
Surveillance. (Reports on animal health). Ministry of Agriculture and Fisheries (quarterly).
Table of Contents
New Zealand's forest industries are based on nearly 1.1 million hectares of forest plantations, consisting mainly of conifers. These plantations of largely radiata pine produce usable wood in 25 to 30 years, a much shorter time than the slow-growing native species. There is also very restricted production from natural forests. The government-owned Forestry Corporation manages about half of the plantations and approximately 75 percent of the natural production forests.
The plantation forest resource continues to increase, and, although volumes of harvest-able wood are unlikely to exceed current levels in the 1980s and early 1990s, towards the end of the next decade there will be a marked expansion in the supply of timber. Approximately 40 percent of all softwood harvested in New Zealand is used in export products, providing a sound basis for future expansion of the wood-processing industry.
The Ministry of Forestry conducts research relevant to the foresty and wood-based industries, as well as monitoring them and advising government. Forestry research is described in chapter 13, Science and technology, while the role of the Ministry of Forestry is summarised in section 3.3, State sector.
Plantation forests. Introduced conifers form the bulk of the large and valuable plantation-forest estate: and among these radiata pine (Pinus radiate) is the supreme multi-purpose tree. Radiata pine grows rapidly in New Zealand (reaching sawlog size in 25–30 years), produces a large volume of usable wood, and is remarkably adapted to a variety of sites. Other major species are Douglas fir (Pseudotsuga menziesii). Corsican pine (Pinus nigra (laricio)), and ponderosa pine (P. ponderosa). In recent years, planting of the last two species has stopped because they have proved less versatile and slower growing than radiata pine. The largest forests are in the centre of the North Island, but medium and small plantations are distributed throughout most of the country. Radiata pine constitutes about three-quarters of the area of state plantations and about 95 percent of private plantations.
State plantation forests date from 1896, when an Afforestation Branch of the Lands Department was formed and forest-tree nurseries were established at Tapanui and Eweburn in the South Island, and at Rotorua in the North Island. Planting began in 1898 and proceeded slowly until 1922, by which time 19000 hectares had been established. From 1923 to 1936 there was a boom in afforestation, with no less than 150000 hectares being planted by the state and 120000 hectares by the private sector. After the boom period, planting continued on a more modest scale, but in 1961 state planting was increased and government provided financial incentives for planting by private landholders and local authorities—with the aim of doubling the plantation-forest estate by the end of the century. The annual rate of new planting by the state increased considerably after 1961, and from 1974 averaged some 20000 hectares per annum, over five times the rate achieved in 1961.
Now that the stage of large-scale utilisation has been reached, there are opportunities to increase productivity by correcting the deficiencies in the distribution of age classes, replacing uneconomic plantations, and improving the quality of the trees to provide diversity of marketable products. The trend now is for the Forestry Corporation and private owners to look closely at the economic viability of both existing and new plantations. New planting is being concentrated on those areas that meet commercial rates of return, meaning there has been a reduction in new planting programmes.
Special-purpose plantation species have also been evaluated and these are increasingly being planted on suitable sites. Uses for these timbers include furniture, cabinet work, turnery, joinery, veneer and boat-building.
Natural production forests. Management of natural forests which have been set aside for production of timber involves restriction of the annual cut, rigid insistence on full utilisation, and block sales of carefully measured standing timber. The ecology of the natural forest associations and the silvicultural characteristics of the individual species are being studied by Ministry of Forestry researchers.
Selective harvesting of terrace rimu forest in south Westland provides a favourable forest environment for the regeneration of rimu, while in the central North Island harvesting of timber from natural forest is now restricted to removal of totara for Maori cultural purposes and to recovering dead trees from a few selected forests.
The remnant kauri forests are mainly state-owned. The management objective is perpetuating kauri ecosystems in the interests of science and public enjoyment. Large representative areas of mature and immature kauri have been set aside as sanctuaries, programmes of research and artificial establishment conducted, and the annual cut reduced to the lowest level consistent with economic, social, and legal constraints.
The prospects of improving and perpetuating the beech forests on a sustained yield basis are good. Both major species, red and silver beech, when given the right conditions will regenerate freely; both grow sufficiently rapidly to produce saw-logs in 100–130 years. In the South Island, large areas of beech forest are still intact and, in the case of red beech, there are extensive stands of young forest which have regenerated after fire, wind throw, or mining activities. Against these favourable circumstances must be set the presence, in many localities, of red deer and other feral animals, whose browsing may prevent effective regeneration, and also the difficulties associated with the utilisation of the non-sawlog component of the forest crop.
Many of the earlier plantation forests were developed by the state, which, although allocating a good deal of the resource to private industry for harvesting and processing, has retained the largest stake in New Zealand's forest resources. The impetus for development and ownership has also moved increasingly to the private sector over recent decades, as the industry's capital and infrastructure has expanded.
Today, plantation forest ownership is shared almost evenly by the public and private sectors, with the state holding the majority of indigenous commercial forests.
New Zealand Forestry Corporation Limited. The corporation was established on 1 April 1987 as a state-owned enterprise to manage the Crown's interests in commercial forestry. As such the corporation is responsible for nearly half the country's production forests and half its wood supply, plus two large sawmills which have a combined output of 200000 cubic metres of sawn timber per year.
The forest management (planting, tending, harvesting, marketing and distribution) and the wood-processing (sawn timber, wood chips and round produce) functions of the corporation are handled by two wholly-owned subsidiary companies: New Zealand Timberlands Limited and Prolog Industries Limited, respectively. The corporation also operates a domestic and export seed business—Proseed, based in Rotorua. The corporation's head office in Wellington acts as a holding company for the operation side of the business as well as performing the policy and planning functions. Two profit centres are also based there; one concerned with log exports and another with the provision of computer systems.
The Forestry Corporation is structured in a similar way to other commercial forestry companies. It is also able to develop commercial activities in any forestry-related land use such as agro-forestry or recreation.
Private forestry. Plantation forest holdings other than state forests amount to about 550000 hectares. The Ministry of Forestry provides guidance for private growers in all plantation matters. Because of the high interest in private forestry, increasing emphasis is being given to providing information and training services. Handbooks are available, a correspondence course is offered through the Technical Correspondence Institute, and short residential courses are held periodically. Farm forestry associations also assist in promoting private sector forestry and advising on the management of woodlots.
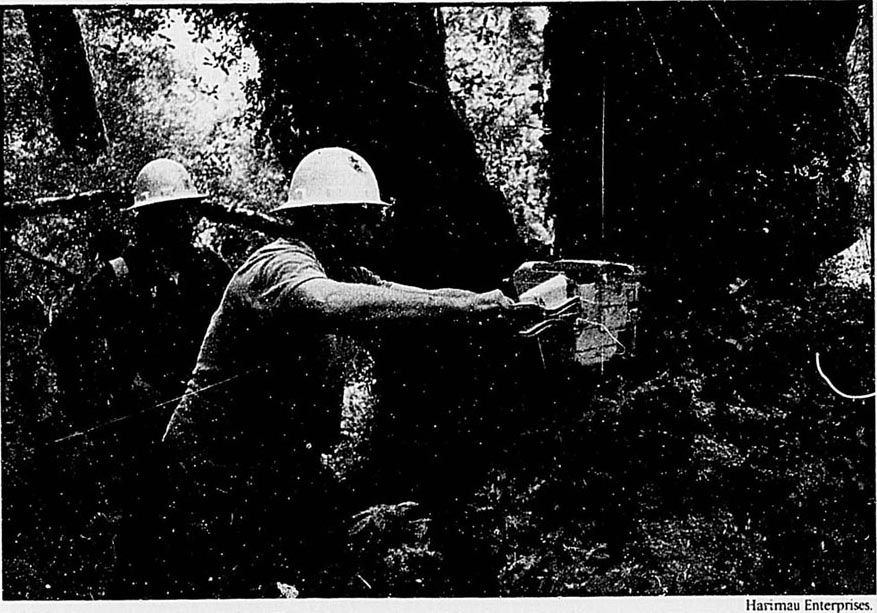
Felling indigenous trees, Westland.
There is a concentration of employment in the forestry and wood products industries near the largest forest areas, particularly in the central North Island, where over half the country's plantation forests are located, and where one-quarter of the regional labour force is engaged in forest industries. Forest industries have had a marked effect on regional development. The fast growth of population in the Rotorua-Bay of Plenty area over recent decades has largely been due to the expansion of the forest industries. Apart from the expansion of the established towns such as Rotorua, the industrial development of New Zealand Forest Products Ltd, Tasman Pulp and Paper Co. Ltd. and Caxton Paper Mills Ltd. led to the establishment of the completely new town—Kawerau—and the rapid growth of another—Tokoroa. The development of these industrial complexes has also stimulated other industries, especially transport, vehicle repair, and building and construction. Similarly, exports of forest products have increased the tonnage that has passed through the ports of Tauranga and Napier.
Table 16.1. FOREST INDUSTRIES EMPLOYEES AND WORKING PROPRIETORS
| As at February | Forestry* | Logging† | Sawmilling‡ | Timber merchanting | Pulp, paper, and paperboard | Other§ | Total |
|---|---|---|---|---|---|---|---|
* Includes silviculture, nurseries, etc. † Includes felling, cutting, and haulage. ‡ Includes planing mills. § Includes other wood industries, plywood and veneer factories, manufacture of furniture and fittings, wooden and cane containers, and wood and cork products. ¶ Coverage changed for 1986 and 1987 surveys. Source: Department of Labour. | |||||||
| 1983 | 5055 | 2773 | 6582 | 3526 | 12346 | 14589 | 44871 |
| 1984 | 5480 | 2896 | 6442 | 3345 | 12147 | 15335 | 45645 |
| 1985 | 5595 | 2554 | 7074 | .. | 12425 | 15059 | .. |
| 1986 | 5001 | 2226 | 7366 | 487¶ | 12288 | 15436 | 42804 |
| 1987 | 3886 | 2305 | 6091 | 419¶ | 11559 | 15570 | 39839 |
Training. The Ministry of Forestry operates a Forestry' Training Centre at Rotorua, which holds block courses for the New Zealand Certificate in Forestry and also offers a wide range of short courses in technical forestry, management and environmental subjects.
The Timber Training Centre in Rotorua provides apprenticeship and short courses in saw-doctoring, timber machining, sawmill practice, timber grading, and preservation.
The University of Canterbury offers a four-year degree course in forestry; the Bachelor of Forestry Science. This can also be taken to masters or doctorate level.
The Logging and Forest Industry Training Board administers basic skills programmes in forestry and logging practice, and the system has gained considerable acceptance in both private and state forestry.
The Census of Forestry and Logging was one of the five-yearly series of integrated economic censuses of business activities in New Zealand carried out by the Department of Statistics until 1985. The 1983–84 census covered all operations carried out by activity and ancillary activity units in the forestry and logging industries during the year ended 31 March 1984 (those with different balance dales submitted data for the year ended within the period 1 April 1983 to 31 March 1984). New data for the industry will be available as part of the 1986–87 Economy Wide Census—reports from which will be available throughout 1989.
Table 16.2. CENSUS OF FORESTRY AND LOGGING 1983–84: GENERAL STATISTICS
| Statistical item | Group 121: Forestry | Group 122: Logging | Census totals |
|---|---|---|---|
| number | |||
| Activity and ancillary units | 626 | 440 | 1066 |
| Working proprietors/partners at 28/2/84 | 350 | 503 | 853 |
| Paid employees at 28/2/84 | 5735 | 2642 | 8377 |
| $(000) | |||
| Salaries paid to working proprietors/partners | 1,307 | 3,350 | 4,657 |
| Salaries and wages paid to employees | 69,090 | 41,894 | 110,984 |
| $(000) | |||
| Stocks— | |||
| Trading, including work-in-progress: | |||
| Opening | 1,778 | 4,470 | 6,248 |
| Closing | 2,077 | 4,063 | 6,139 |
| Standing trees: | |||
| Opening | 3,508,000 | - | 3,508,000 |
| Closing | 3,781,000 | - | 3,781,000 |
| Income— | |||
| Sales of goods—standing trees (stumpage) | 42,641 |  150,030 150,030 | 271,136 |
| —logs (roundwood) | 78,464 | ||
| —other goods | 9,355 | 4,678 | 14,033 |
| Sales of services | 27,872 | 99,884 | 127,756 |
| Direct government cash grants and subsidies | 37,333 | 29 | 37,362 |
| Other income (excluding interest, etc.) | 4,153 | 487 | 4,640 |
| Sales and income (excluding interest, etc.) | 199,818 | 255,109 | 454,927 |
| Interest, dividends, donations, patent fees, and insurance claims received | 7,941 | 297 | 8,239 |
| Total sales and other income (including interest) | 207,759 | 255,407 | 463,166 |
| Expenditure— | |||
| Purchases of—standing trees (stumpage) | 1,095 | 50,761 | 51,856 |
| —goods for resale | 259 | - | 259 |
| —fuel and power, etc | 2,819 | 12,151 | 14,970 |
| Salaries and wages paid | 69,090 | 41,894 | 110,984 |
| Sub-contract payments | 62,048 | 46,972 | 109,020 |
| Depreciation | 3,579 | 6,681 | 10,260 |
| Other expenditure (excluding interest, etc.) | 122,371 | 76,110 | 198,481 |
| Expenditure (excluding interest, etc.) | 261,259 | 234,570 | 495,829 |
| Interest, dividends, donations, royalties, patent fees etc. paid | 36,835 | 5,108 | 41,943 |
| Total expenditure (including interest) | 298,095 | 239,678 | 537,773 |
| Net profit (loss) after deducting working proprietors/partners salaries (excludes changes in values of standing trees) | (91,344) | 11,971 | (79,373) |
| Operating surplus (includes changes in values of standing trees) | 211,857 | 20,132 | 231,989 |
| Value added | 255,058 | 70,611 | 325,669 |
| Gross forest development expenditure (included in total expenditure above) | 187,793 | - | 187,793 |
| Fixed tangible assets— | |||
| Additions to | 47,364 | 14,565 | 61,929 |
| Disposals of | 1,557 | 5,903 | 7,460 |
Table 16.3. CENSUS OF FORESTRY AND LOGGING 1983–84: REGIONAL FORESTRY SUMMARIES
| Local government regions | Activity units (including ancillaries) | Persons engaged end February | Salaries and wages to paid employees | Total sales and income | Additions to fixed assets |
|---|---|---|---|---|---|
| no. | $(000) | ||||
| Northland | 68 | 634 | 7,268 | 10,477 | 5,593 |
| Auckland | 38 | 256 | 3,153 | 12,424 | 2,451 |
| Thames Valley | 10 | 125 | 1,105 | 2,814 | 1,133 |
| Bay of Plenty | 65 | 568 | 4,991 | 18,327 | 10,854 |
| Waikato | 21 | 340 | 5,732 | 34,291 | 974 |
| Tongariro | 49 | 797 | 9,876 | 42,661 | 3,067 |
| East Cape | 27 | 394 | 4,470 | 4,894 | 5,680 |
| Hawke's Bay | 37 | 355 | 3,412 | 6,291 | 3,072 |
| Taranaki | 4 | 40 |  2,282 2,282 | 7,745 | 1,413 |
| Wanganui | 20 | 194 | |||
| Manawatu | 15 | 23 | 516 | 236 | 211 |
| Horowhenua | 9 | 68 |  948 948 | 937 |  302 302 |
| Wellington | 7 | 33 | 698 | ||
| Wairarapa | 25 | 149 | 1,176 | 2,442 | 819 |
| Total, North Island | 395 | 3976 | 14,930 | 144,236 | 35,568 |
| Nelson Bays | 53 | 759 | 7,118 | 36,755 | 6,733 |
| Marlborough | 42 | 68 |  4,327 4,327 | 2,456 | 799 |
| West Coast | 21 | 396 | 3,459 | 1,680 | |
| Canterbury | 23 | 286 | 4,392 | 6,355 |  861 861 |
| Aorangi | 14 | 63 | 933 | 1,314 | |
| Clutha - Central Otago | 27 | 221 | 2,558 | 3,933 | 399 |
| Coastal - North Otago | 15 | 112 | 1,341 | 4,766 | 240 |
| Southland | 36 | 204 | 3,492 | 4,484 | 1,085 |
| Total, South Island | 231 | 2109 | 24,160 | 63,522 | 11,796 |
| Total, New Zealand | 626 | 6085 | 69,090 | 207,759 | 47,364 |
Table 16.4. CENSUS OF FORESTRY AND LOGGING 1983–84: REGIONAL LOGGING SUMMARIES
| Local government regions | Activity units (including ancillaries) | Persons engaged end February | Salaries and wages to paid employees | Total sales and income | Additions to fixed assets |
|---|---|---|---|---|---|
| no. | $(000) | ||||
| Northland | 22 | 72 | 562 | 3,545 | 344 |
| Auckland | 15 | 62 | 730 | 3,753 | 349 |
| Thames Valley | 8 | 38 | 414 | 1,751 | 172 |
| Bay of Plenty | 89 | 1009 | 13,139 | 76,261 | 4,290 |
| Waikato | 67 | 753 | 12,849 | 100,678 | 2,931 |
| Tongariro | 58 | 391 | 4,705 | 16,549 | 2,352 |
| East Cape | 3 | 4 |  519 519 | 2,969 | 363 |
| Hawke's Bay | 15 | 41 | |||
| Taranaki | 11 | 33 | 324 | 1,896 | 292 |
| Wanganui | 11 | 48 | 410 | 2,668 | 251 |
| Manawatu | 11 | 41 |  503 503 | 2,097 | 368 |
| Horowhenua | 4 | 13 | |||
| Wellington | 4 | 9 | 61 | 441 | 122 |
| Wairarapa | 3 | 8 | |||
| Total, North Island | 321 | 2522 | 34,216 | 212,606 | 11,835 |
| Nelson Bays | 32 | 226 | 3,073 | 20,127 | 1,326 |
| Marlborough | 2 | 4 | |||
| West Coast | 13 | 77 | 1,233 | 7,094 | 193 |
| Canterbury | 26 | 86 | 1,230 | 4,826 | 309 |
| Aorangi | 8 | 20 | 92 | 373 | 67 |
| Clutha - Central Otago | 12 | 71 | 773 | 3,475 | 291 |
| Coastal - North Otago | 10 | 32 | 207 | 1,083 | 104 |
| Southland | 16 | 107 | 1,070 | 5,822 | 440 |
| Total, South Island | 119 | 623 | 7,679 | 42,800 | 2,730 |
| Total, New Zealand | 440 | 3145 | 41,894 | 255,407 | 14,565 |
Roundwood. When, by the 1930s, the easy abundance of native timber had gone, some of the plantation forests planted from the 1890s had reached the stage where harvesting could begin. By 1939, of the 1700000 cubic metres per annum of roundwood cut for industrial use, some 280000 cubic metres came from the plantation forests. By 1949 the total annual removals of roundwood had increased to 2500000 cubic metres, with 820000 cubic metres from the plantation forests. The plantation forests are now by far the more important source of wood. In 1986–87 they supplied 9145000 cubic metres, or 94 percent of the total supply. Table 16.5 shows the quantities of roundwood removed from the forests of New Zealand to support approximately 400 sawmills, 6 plywood and veneer plants, 3 particleboard mills, 8 pulp and paper mills, and 4 fibreboard mills in 1987. This roundwood production does not include firewood.
Table 16.5. ROUNDWOOD PRODUCTION
| Year ended 31 March | Natural forests | Plantation forests | Total |
|---|---|---|---|
| Source: Ministry of Forestry. | |||
| cubic metres (000) | |||
| 1983 | 608 | 9019 | 9627 |
| 1984 | 599 | 8736 | 9335 |
| 1985 | 675 | 8951 | 9626 |
| 1986 | 630x | 9380x | 10010x |
| 1987 | 521 | 8624 | 9145 |
SAWN-TIMBER PRODUCTION
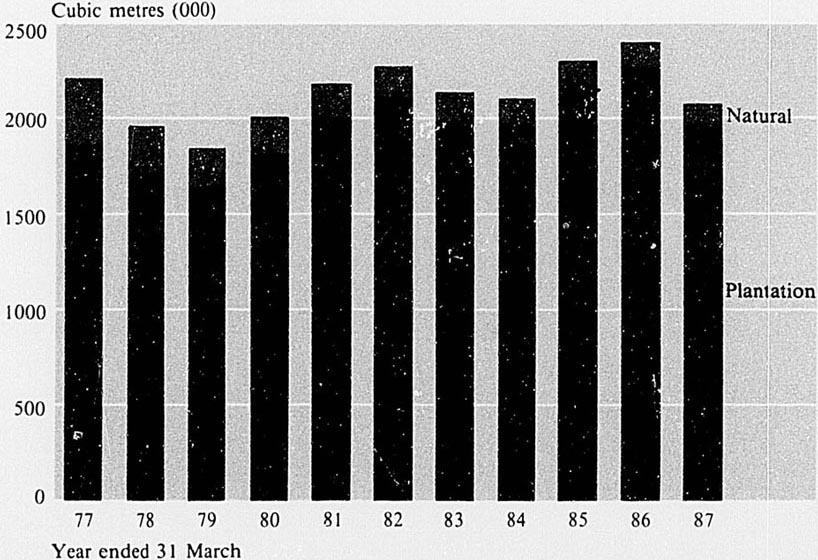
Forestry and fishing
Sawn timber. Radiate pine and other pines account for about 90 percent of the total cut of exotics and Douglas fir for most of the remainder. Only 5 percent of the country's timber requirement comes from the natural forests, and this proportion is being reduced to the point where a small, sustained yield in native timber can be maintained for special purposes.
Table 16.6. ROUGH-SAWN TIMBER PRODUCTION
| Year ended 31 March | Softwoods from | Hardwoods from | Grand total | ||||
|---|---|---|---|---|---|---|---|
| Natural forests | Plantation forests | Total | Natural forests | Plantation forests | Total | ||
| Source: Ministry of Forestry. | |||||||
| cubic metres (000) | |||||||
| 1983 | 117 | 1982 | 2099 | 33 | 4 | 37 | 2136 |
| 1984 | 112 | 1955 | 2067 | 24 | 4 | 28 | 2096 |
| 1985 | 116 | 2162 | 2278 | 25 | 3 | 28 | 2306 |
| 1986 | 111 | 2263x | 2374x | 21 | 2x | 23x | 2397 |
| 1987 | 94 | 1965 | 2059 | 18 | 1 | 19 | 2079 |
Table 16.7. SAWN TIMBER PRODUCTION BY SPECIES
| Species | Year ended 31 March | ||||
|---|---|---|---|---|---|
| 1983 | 1984 | 1985 | 1986 | 1987 | |
| Source: Ministry of Forestry. | |||||
| Natural forest— | cubic metres (000) | ||||
| Rimu and miro | 101 | 100 | 102 | 96 | 85 |
| Matai | 2 | 1 | 1 | 1 | |
| Totara | 1 | 1 | 1 | 2 | 1 |
| Kahikatea | 11 | 9 | 10 | 11 | 7 |
| Tawa | 11 | 7 | 7 | 8 | 10 |
| Beech | 17 | 16 | 17 | 13 | 8 |
| Other | 7 | 2 | 3 | 1 | 1 |
| Total, native | 150 | 136 | 141 | 132 | 112 |
| Plantation forest— | |||||
| Pines | 1777 | 1750 | 1936 | 2044 | 1764 |
| Douglas fir | 164 | 171 | 175 | 183 | 174 |
| Eucalypts | 3 | 4 | 3 | 1 | 1 |
| Other | 42 | 34 | 51 | 37 | 27 |
| Total, plantation | 1986 | 1959 | 2165 | 2265 | 1966 |
| Total, all species | 2136 | 2096 | 2306 | 2397 | 2079 |
Round and split produce. Considerable quantities of native timbers have been used in the past to meet the need for mining, fencing timbers and firewood, and for a proportion of sleeper, pole, and bridge-timber requirements, but, as with forest products in general, most post and pole requirements are now met from exotic resources. A dramatic increase in the volume of posts and poles treated with preservatives (from 19000 cubic metres in 1955 to 312000 cubic metres in 1985–86) indicates the switch from native to introduced round-wood, together with the effective introduction and maintenance of timber preservation.
Export wood chips. An export wood chip industry originated in 1969 in the Nelson region, where there are now two mills producing both native and exotic wood chips for export. Trees unsuitable for sawn timber production are used, enabling replanting with more productive species. The process also uses forest and sawmill residues which would normally be wasted. Nelson remains the principal chip export port, handling about 50 percent of the country's total chip exports. Japan is the principal export destination.
Wood chips have been exported through the port of Mount Maunganui since 1972, through Lyttelton since 1975, through Port Chalmers since 1977 and through Bluff since 1982. Chip exports during the year ended June 1987 totalled 311473 bone-dry units. (A bone-dry unit for radiata pine wood chips is equivalent to 2.63 cubic metres: and for beech, 2.25 cubic metres.)
Timber preservation. Approximately 1.4 million cubic metres of timber, including round-wood, is preservative treated in New Zealand each year. This represents the highest per capita consumption of treated timber in the world. Factors which have encouraged growth in the timber preservation industry include: the versatility, availability and high permeability of non-durable exotic softwood species such as radiata pine: regulations requiring timber to be preservative treated; quality control carried out by the Timber Preservation Authority: and a research programme carried out by the Forest Research Institute.
Timber preservation has expanded markets for timber products in the building, farming and export sectors.
Table 16.8. SAWN TIMBER TREATED WITH PRESERVATIVES
| Year ended 31 March | Open tank | Diffusion* impregnation | Pressure impregnation | Total |
|---|---|---|---|---|
* Mainly boron. Source: Ministry of Forestry. | ||||
| cubic metres | ||||
| 1982 | 10 | 369660 | 628751 | 998421 |
| 1983 | 2 | 336210 | 618682 | 954884 |
| 1984 | 3 | 350693 | 636827 | 987523 |
| 1985 | 11 | 402785 | 664953 | 1067749 |
| 1986 | 5 | 421770 | 693194 | 1114969 |
Quarantine. The quarantine service provides a degree of insurance to the forest industry by limiting the movements of insects and disease into and out of New Zealand. This function is carried out by Ministry of Forestry timber inspectors, who are responsible for the inspection and disinfection of both exported and imported wood and wood products, including logs, sawn timber and manufactured wood products.
Wood utilisation standards. In addition to Timber Preservation Authority specifications, there are a number of inter-related standards concerned with the processing and use of timber. These promote the correct processing and use of timber, safety, and provide consumer protection and a sound basis for trading. Two important standards, the National Timber Grading Rules (NZS 3631:1988) and the Code of Practice for Specifying Timber and Wood-based Products for Use in Buildings (NZS 3602:1988) have recently been revised.
Pulp and paper. The pulp and paper industry is mainly concentrated near the big plantation forests on the volcanic plateau of the North Island. Of the eight plants in New Zealand, seven are in the North Island, and four are integrated with sawmills to utilise fully the total input of wood. There are four main pulp and paper companies.
The Tasman Pulp and Paper Co. Ltd was formed in 1952 to utilise wood from Kaingaroa State Forest and is now part of the Fletcher Challenge Corporation, the largest New Zealand company in terms of shareholders' funds. The company's plant is at Kawerau, Bay of Plenty. The pulp and paper mill began operation late in 1955.
Elders New Zealand Forest Products Ltd operates an integrated pulp mill, paper mill, plywood mill, and reprocessing plant at Kinleith, near Tokoroa, also wallboard products and multiwall bag plants at Penrose, Auckland. A corrugating medium machine at Tepapapa produces corrugating medium paper from waste paper collected in the Auckland area.
Whakatane Board Mills Ltd, a subsidiary of Elders New Zealand Forest Products Ltd, manufactures paperboard from groundwood and from semi-chemical and waste-paper pulp produced on site. Wood supplies are drawn from its radiata pine forest at Matahina and hauled 42 kilometres to the mill by road. A sawmill operates adjacent to the board mill.
Caxton Paper Mills Ltd, at Kawerau, manufactures a wide range of tissues and lightweight merchant and processing papers for domestic and export markets using three machines.
New Zealand Paper Mills Ltd, at Mataura, also a subsidiary of New Zealand Forest Products Ltd, has been in operation for more than 100 years. It has two machines producing a range of papers from kraft wrapping grades to special printing copy, and writing papers. The company uses New Zealand-made sulphate pulp and supplements this with wastepaper and small quantities of imported specialty pulp.
Carter Oji Kokusaku Pan Pacific Ltd. operates an integrated sawmill and thermo-mechanical pulp mill at Whirinaki near Napier.
Winstone Pulp Industries Ltd's chemical thermo-mechanical pulpmill at Karioi produced its first pulp in the latter part of 1978. The plant uses exotic wood from Karioi State Forest, as well as sawmill residues.
The basic products of the pulp and paper industry are mechanical and chemical pulp, which are converted into such products as newsprint, kraft, and other paper and paperboard.
Table 16.9. PULP AND PAPER PRODUCTION
| Year ended 31 March | Wood pulp | Newsprint | Other printing and writing paper | Other paper and paperboard | Total paper and paperboard | |
|---|---|---|---|---|---|---|
| Chemical* | Mechanical† | |||||
* Chemical includes semi-chemical pulp. † Mechanical includes groundwood pulp, thermo-mechanical and chemithermo-mechanical pulp. Source: Ministry of Forestry. | ||||||
| tonnes | ||||||
| 1983 | 571183 | 470730 | 268792 | 34931 | 367096 | 670819 |
| 1984 | 562954 | 499357 | 241572 | 37825 | 414654 | 694051 |
| 1985 | 572839 | 572072 | 297854 | 47849 | 424395 | 770098 |
| 1986 | 532250 | 577897 | 212148 | 45914 | 412905 | 670967 |
| 1987 | 544740 | 562872 | 207445 | 43891 | 392419 | 643756 |
Wood-based panels. Five factories manufacture plywood, and the total output for the year ended 31 March 1987 was 63219 cubic metres. Total production of veneer in the industry in 1986–87 was 84121 cubic metres. Radiata pine has become increasingly important as a species for peeler-log supply because of the demand for industrial plywood, and now constitutes about 96 percent of total peeler-log production. Now that the natural forests have become depleted, the production of peeler logs for veneer and plywood manufacture has first claim on the state forests and sawmillers harvesting timber from state natural forest are required to reserve logs suitable for peeling and divert them to veneer factories.
Manufactured from wood pulp, the different forms of fibreboard (hardboard, softboard, and medium-density fibreboard) have different properties and end uses. Production started in 1943 and has increased steadily. A mill in Canterbury began producing medium-density fibreboard by a dry process in 1976. This product has now established itself on domestic and export markets. Two further mills have been established, one in Taupo by Fletcher Wood Panels and another at Richmond near Nelson by a joint-venture company. Particleboard is manufactured from roundwood and sawmill residues and is used by the domestic market for interior panelling, flooring and furniture manufacture.
In 1988 commercial production began from a triboard plant at Kaitaia. The board is intended for use in domestic and export markets.
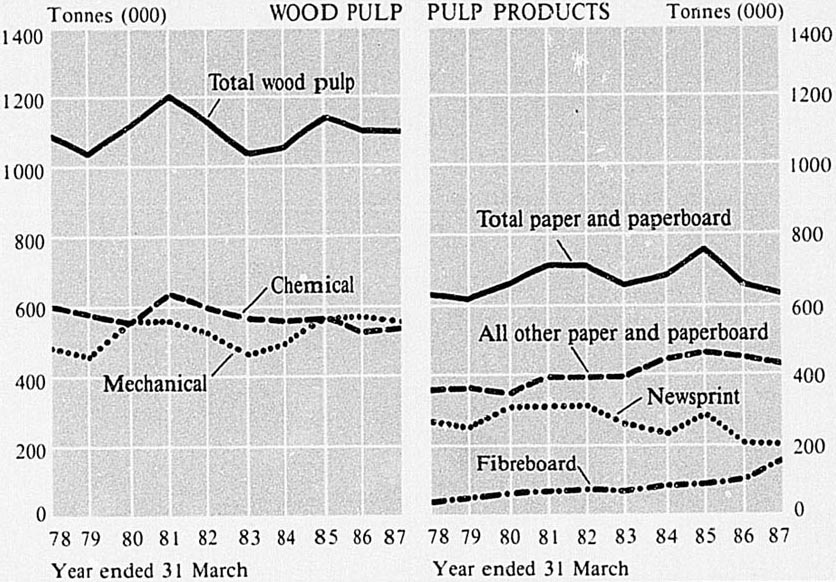
PULP AND PAPER INDUSTRY
Forest products are important earners of overseas funds. For the year ended June 1987 exports of forest products were valued at about $786 million; Australia was the largest customer, taking 37 percent (by value) of exports, mainly in the form of sawn timber, pulp and paper, and Japan was the next largest, taking 26 percent, mainly pulp and logs. For the same period, imports of forest products into New Zealand were valued at $381 million.
Exports. There is an established market in Australia for sawn radiata pine and Douglas fir. Japan takes large volumes of logs, wood chips and a significant quantity of sawn timber. Logs have also been sold to South Korea and China. There are restrictions on the export of native timber.
Australia takes significant volumes of pulp and paper, and Japan takes large volumes of pulp. Both chemical and mechanical pulp are exported. Newsprint accounts for over 50 percent of all paper exports.
Imports. The main categories of sawn timber imports are tropical hardwoods, Australian hardwoods, North American softwoods and radiata pine from Chile. Imported sawn timbers generally have specialist applications such as weatherboards with a natural finish, decorative furniture, panelling, and boat-building. Durable Australian hardwoods are imported for use as large poles, crossarms, wharf, bridge and constructional timbers, etc. Douglas fir, redwood, and western red cedar from North America are imported for structural uses, exterior joinery, and weatherboards. Most of the imported Chilean radiata pine has been used for pallets. Short-fibred pulp and special papers made up 75 percent of the value of total forest products imports in the year ended June 1987.
Table 16.11. OVERSEAS TRADE IN FOREST PRODUCTS
| Year ended 30 June | Wood products | Pulp | Paper and paper products | All forest products |
|---|---|---|---|---|
| Source: Ministry of Forestry. | ||||
| Imports c.i.f. | $(000) | |||
| 1983 | 35,969 | 7,588 | 104,695 | 148,252 |
| 1984 | 41,024 | 8,452 | 136,084 | 185,562 |
| 1985 | 54,266 | 11,021 | 234,971 | 300,258 |
| 1986 | 56,881x | 16,662 | 216,648x | 290,191x |
| 1987 | 69,935 | 18,109 | 293,429 | 381,473 |
| Exports f.o.b. | $(000) | |||
| 1983 | 176,930 | 161,427 | 165,353 | 503,710 |
| 1984 | 230,761 | 190,171 | 232,126 | 653,057 |
| 1985 | 318,951 | 202,655 | 274,352 | 795,958 |
| 1986 | 321,816x | 219,791 | 226,362x | 767,969x |
| 1987 | 319,388 | 252,948 | 213,999 | 786,335 |
Table 16.12. VOLUME OF TIMBER IMPORTS
| Year ended 30 June | Hardwoods | Softwoods | Total | Logs and poles |
|---|---|---|---|---|
| Source: Ministry of Forestry. | ||||
| Cubic metres (000) | ||||
| 1983 | 17 | 11 | 27 | 2 |
| 1984 | 18 | 15 | 32 | 2 |
| 1985 | 21 | 17 | 37 | 3 |
| 1986 | 17 | 37 | 55 | 4 |
| 1987 | 27 | 28 | 55 | 3 |
Table 16.13. VOLUME OF TIMBER EXPORTS
| Year ended 30 June | Sawn timber | Total | Logs and poles | ||||
|---|---|---|---|---|---|---|---|
| Native timber | Radiata pine | Douglas fir | Other plantation | Total plantation | |||
| Source: Ministry of Forestry. | |||||||
| cubic metres (000) | |||||||
| 1983 | 3 | 378 | 48 | 11 | 436 | 440 | 440 |
| 1984 | 6 | 376 | 54 | 10 | 440 | 445 | 540 |
| 1985 | 5 | 430 | 65 | 9 | 504 | 509 | 360 |
| 1986 | 4 | 348x | 51 | 3 | 402 | 407 | 396 |
| 1987 | 3 | 296 | 52 | 3 | 351 | 354 | 426 |
Table 16.14. VOLUME OF OVERSEAS TRADE IN PULP AND PAPER
| Year ended 30 June | Paper and paperboard | ||||
|---|---|---|---|---|---|
| Wood pulp | Fibreboard* | Newsprint | Other† | Total | |
* In cubic metres. † Excludes manufactures of paper and paperboard; excludes minor items for which no quantities are given. Source: Ministry of Forestry. | |||||
| Imports tonnes | |||||
| 1983 | 11567 | 3 | 6221 | 42213 | 49434 |
| 1984 | 11060 | 3377 | 6995 | 56310 | 77632 |
| 1985 | 11151 | 1 | 21111 | 75415 | 96526 |
| 1986 | 23557 | 1 | 47464 | 55601x | 103065x |
| 1987 | 17781 | 120 | 60944 | 18505 | 79448 |
| Exports tonnes | |||||
| 1983 | 451207 | 24991 | 116075 | 118800 | 243875 |
| 1984 | 485584 | 26949 | 188755 | 130137 | 318892 |
| 1985 | 427265 | 20403 | 186559 | 86460 | 273019 |
| 1986 | 504056 | 33900x | 143482 | 105979x | 249462x |
| 1987 | 483316 | 96578 | 121100 | 87925 | 209025 |
New Zealand's 200-mile Exclusive Economic Zone (EEZ) is, with an area of about 1.2 million square nautical miles, one of the world's largest.
The 1978 Act establishing the EEZ does not extend territorial limits. It gives control over conservation and management of resources, but no claim, in real terms, to ownership. Control over all activities in the zone must be in accord with international law, although New Zealand polices the area with fishery-protection patrols.
The zone is divided into seven fisheries management areas. In spite of the large size of the zone some two-thirds of its area is too deep for bottom fishing methods such as trawling and longlining and New Zealand's fishery resources, although substantial, are not rich by world standards. The inshore fisheries of the country's territorial waters are being fully exploited and future development depends largely on the development of a locally-based deep-water fishing industry.
The total allowable catch set for New Zealand territorial sea and EEZ waters was 494000 tonnes of finfish and 121000 tonnes of squid for the 1988 season. The tuna catch was estimated to be over 20000 tonnes. The ‘total allowable catch’ is revised by Ministry of Agriculture and Fisheries scientists each year and is the starting point for the annual quota system that is used to manage New Zealand's fisheries.
The advent of the 200-mile Exclusive Economic Zone provided the incentive for a considerable increase in investment in larger fishing vessels to fish the deep water outside the 200-metre isobath and in fish processing facilities. It also, through government policy, led to the replacement of some licensed foreign fishing effort by co-operative fishing ventures between foreign and New Zealand companies.
The adoption of the revised Deepwater Trawl Policy in 1983 allocated quotas of deep-water species to New Zealand enterprises and further encouraged the use of deepwater resources through the use of domestic vessels or the charter of foreign vessels. While, at the same time, pressures on inshore fisheries resulted in a reduction in the numbers of fishing permits issued, owing to a more restrictive definition of ‘commercial fisherman’.
Each individual or company operating commercially must have a permit and each fishing vessel must be registered.
Processing orange roughy, Dunedin.
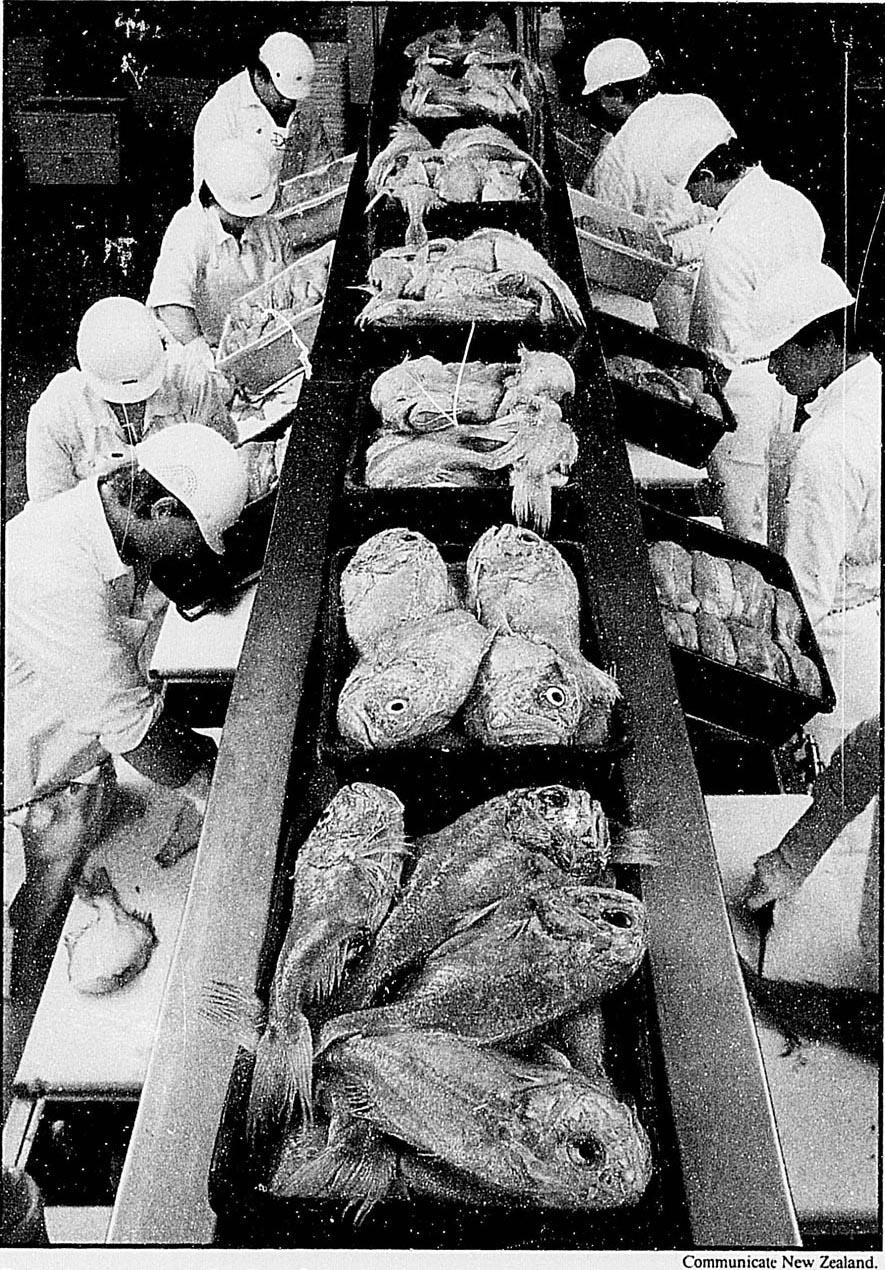
Processing orange roughy, Dunedin.
The primary aims of current government fisheries policy are to:
Ensure a continuing harvest of high quality fish for an economically sound industry providing employment, contributing to export earnings and supplying the local market;
Encourage the development of aquaculture;
Protect and, where possible, improve the fisheries environment;
Enhance the natural stocks where this is practicable and economically feasible; and
Conserve and enhance the opportunities for recreational fishing and the study of marine life.
Two important aspects of fisheries management were adopted by the Government in 1986 to counter the over-fishing of a number of prime inshore species and to permit their recovery: the introduction and implementation of total allowable catches for all major stressed finfish fisheries; and the allocation of individual transferable quotas to fishing operators, based on historically reported catches.
A complete package of management measures, known as the quota management system, was introduced in October 1986 for 26 finfish species, and one shellfish species, and later extended to two further species for the 1987–88 fishing season.
A feature of the new policy was a ‘buy back’ of fishing rights scheme, aimed at reducing pressure on stressed inshore fish stocks. In the latter half of 1986 government paid out $45 million to fishing operators under the scheme, in return for the release of 15800 tonnes of quota. A further $1.4 million was paid for paua quota bought back in 1987.
The adoption of individual transferable quotas is seen as an effective and easily administered way of controlling the effort spent in catching particular species. It allows fishing enterprises to plan the use of their allocated share of the resource, while transferability allows for the expansion and contraction of enterprises and the advent of new-businesses.
Demersal fisheries. The three most important demersal species (living near the sea floor) fished in shallower waters are red cod (Pseudophycis bachus), barracouta (Thyrsites atun) and snapper (Chrysophrys auratus). Other important species are tarakihi (Nemadactylus macropterus), caught round the South Island and the east coast of the North Island; gurnard (Chelidonichthys kumu), taken by trawlers off the North Island and east coast of the South Island; trevally (Caranx georgianus), which is taken by trawlers and purse-seiners round the North Island; and jack mackerel (Trachurus spp.) trawled for on the north-eastern and western North Island shelf. Sole are taken mainly by trawling and flounder by set net.
The principal species taken by longline are snapper, particularly in the north-east of the North Island; and hapuku (Polyprion oxygeneios) and ling (Genypterus blacodes) in most areas, though blue cod (Parapercis colias) is the main line-caught species around Stewart Island and the Chatham Islands.
Further offshore, deeper-water species such as hoki (Macruronus novaezelandiae) and silver warehou (Seriolella punctata) are caught on the Chatham Rise and off the east coast of the South Island. Off the west coast of the South Island hoki is the principal deep-water species; and on the Campbell Plateau to the south of New Zealand, catches are dominated by southern blue whiting (Micromesistius australis). In deeper water still, at around 1000 metres and particularly on the Challenger Plateau and the Chatham Rise, catches consist largely of oreo dories (Allocyttus, Neocyttus and Pseudocyttus) and orange roughy (Hoplostethus atlanticus). Hoki and orange roughy are increasingly important species for the domestic trawl fleet.
Pelagic fisheries. The main pelagic species (belonging to the upper layers of the open sea) taken by purse-seining are trevally, kahawai (Arripis trutta), blue mackerel (Scomber australasicus) and jack mackerel.
Five species of tuna are fished commercially in New Zealand waters. Skipjack (Katsuwonus pelamis) are caught by purse-seiners round the north of the North Island in summer. Albacore (Thunnus alalunga) are caught mainly by trolling off the east coast of the North Island, the west coasts of both islands, and are also caught longline off the north-east and north coast of New Zealand by Japanese. Korean and Taiwanese vessels. The southern bluefin tuna (Thunnus maccoyi) is caught mainly by Japanese longline vessels off the east coasts of both islands, but is also caught by New Zealand vessels off the west coast of the South Island. The bigeye tuna (Thunnus obesus) is caught in offshore waters between North Cape and East Cape, and the yellowfin tuna (Thunnus albacares) is caught by game-fishers between North Cape and East Cape in the warm summer months.
Crustacea. Rock lobsters (Jasus edwardsii and J. verreauxi) are caught by potting off many parts of the New Zealand coast. All rock lobster fisheries are controlled by restricted licences. Rock lobster is the most valuable coastal resource in New Zealand, even though landings have stabilised at a level considerably less than the peak of over 10900 tonnes in 1968 which was achieved with the development of the then-new Chatham Islands fishery.
Although the giant spider crab (Jacquinotia edwardsii), jack-knife prawn (Hymenopenaeus sibogae) and scampi (Metanephrops challengeri) are quite plentiful in some New Zealand waters, the only crustacean other than rock lobster which is becoming commercially significant is the paddle crab (Ovalipes catharus).
Molluscs. The largest fishery' in New Zealand waters is the squid fishers'. The predominant squid are arrow squid (Nototodarus sloanii) and N. gouldi which are caught in large quantities by trawl and jigging methods, although the resource is subject to considerable annual variation.
Other commercially significant mollusc resources are the dredge oysters (Tiostrea lutaria) in Foveaux Strait; scallops (Pecten novaezealandiae) in the Marlborough Sounds, in Tasman Bay and along the North Island's north-east coastline; and paua or abalone (Haliotis iris), which occurs around the rocky coastline, and of which about 500 tonnes per year are taken by free divers. Octopus, cockles, surf clams and pipis have the potential for further commercial exploitation.
Marine. The traditional domestic fisheries in New Zealand are coastal, consisting mostly of the prime demersal inshore finfish, pelagic finfish, rock lobster and dredge oysters. Over the past decade a trend towards utilising larger trawlers (over 35 metres) has occurred, and New Zealand fishing companies have begun to operate in deeper waters. Trawling is the principal method of taking demersal fish, accounting for 77 percent of the domestic fleet's finfish catch in 1986. Trawling is more intensive along the eastern coasts of both islands. Pelagic finfish are mainly caught by purse-seining, which accounted for 9 percent of the domestic finfish catch in 1986. The remaining finfish are caught by various line methods and set nets. In 1985, Nelson was the major fishing region with 19 percent of the total catch landed.
Table 16.15. FISH AND SHELLFISH LANDED BY DOMESTIC FLEET*
| Fish or shellfish | Year ended 31 December | |||
|---|---|---|---|---|
| 1983 | 1984 | 1985 | 1986P | |
* Includes catches made by vessels chartered by NZ companies. Comparisons with tables from previous years is not possible as catches were for domestic vessels only. † No farmed mussels or oysters are included. Source: Ministry of Agriculture and Fisheries. | ||||
| tonnes (000) | ||||
| Barracouta | 21.6 | 22.0 | 17.3 | 17.4 |
| Flounder and sole | 4.6 | 4.7 | 4.1 | 2.4 |
| Gemfish | 3.3 | 5.3 | 5.4 | 4.9 |
| Gurnard | 3.8 | 3.7 | 3.0 | 2.0 |
| Hapuku, bass | 2.4 | 2.5 | 1.9 | 1.4 |
| Hoki | 28.4 | 39.0 | 35.2 | 91.2 |
| Kahawai | 5.0 | 4.9 | 4.4 | 4.9 |
| Ling | 5.0 | 4.8 | 5.2 | 5.1 |
| Orange roughy | 41.8 | 37.3 | 40.0 | 44.3 |
| Oreo dories | 16.9 | 16.9 | 22.3 | 14.4 |
| Blue warehou | 4.3 | 2.9 | 1.9 | 3.1 |
| Silver warehou | 3.0 | 3.6 | 6.8 | 4.5 |
| Jack mackerel | 8.6 | 13.2 | 12.1 | 15.8 |
| Blue mackerel | 2.0 | 0.8 | 1.7 | 1.5 |
| Red cod | 7.3 | 13.2 | 16.2 | 8.0 |
| Shark and rig | 7.8 | 8.8 | 7.8 | 3.0 |
| Shipjack | 8.1 | 3.9 | 1.9 | 5.4 |
| Snapper | 8.8 | 9.2 | 9.1 | 6.3 |
| Tarakihi | 4.5 | 5.0 | 4.9 | 4.5 |
| Trevally | 3.8 | 3.8 | 3.9 | 3.3 |
| Other wet fish | 25.7 | 28.2 | 27.6 | 33.2 |
| Total, wet fish | 216.7 | 233.7 | 232.7 | 276.6 |
| Squid | 38.6 | 55.6 | 43.8 | 31.3 |
| Mussels† | 0.6 | 0.3 | 0.1 | 0.1 |
| Oysters (dredge)† | 9.7 | 9.4 | 8.8 | 6.7 |
| Paua | 1.2 | 1.5 | 0.9 | 0.7 |
| Rock lobsters | 5.0 | 5.5 | 5.5 | 5.2 |
| Scallops | 4.0 | 4.7 | 3.2 | 4.6 |
| Other shellfish | 0.7 | 1.1 | 1.1 | 0.9 |
| Total, all fish | 276.5 | 311.8 | 296.1 | 326.1 |
The deeper waters around New Zealand are fished by domestic vessels, foreign chartered vessels and foreign licensed vessels. Since the quota management system was introduced in October 1986 no distinction has been made between deepwater and inshore domestic quotas.
A growing number of deep-sea vessels have been purchased by New Zealand companies over recent years, and are now being crewed by domestic labour. Domestic fishing companies also charter foreign vessels.
New Zealand also has bilateral fishing agreements with a number of nations and allows licensed vessels of their fleets to fish within the Exclusive Economic Zone.
Table 16.16. REGISTERED COMMERCIAL FISHING VESSELS
| Type of vessel | At 30 September | |||
|---|---|---|---|---|
| 1984 | 1985 | 1986 | 1987 | |
| Source: Ministry of Agriculture and Fisheries. | ||||
| Foreign licensed vessels | 189 | 167 | 177x | 172 |
| Foreign chartered vessels | 117 | 88 | 51x | 106 |
| Domestic vessels | 2747 | 2519 | 2399x | 2453 |
| Shore fishing permits | 261 | 233 | 219 | 182 |
Freshwater. The only significant commercial freshwater fishery is the eel fishery. The freshwater fisheries for trout, salmon, whitebait and koura are recreational, although each season there are (unmonitored) sales of whitebait by amateur fishers. Returning salmon are caught in some South Island rivers by salmon farmers and by recreational fishers.
Aquaculture. The oyster farming industry is based on the stick and tray cultivation of the Pacific oyster (Crassostrea gigas), mainly in waters north of Auckland. Mussel farms produce predominantly green-lipped mussels (Perna canaliculus), although some blue mussels (Mytilis edulis) have been harvested. Most mussel farms are in the Marlborough Sounds but mussels are now being reared in the Bay of Plenty, Coromandel and Northland. Commercial farming of quinnat salmon (Oncorhynchus tshawytscha) is carried out as open ocean ranching along the east coast of the South Island where natural stocks of salmon exist in the braided shingle rivers, such as the Waitaki. Cage rearing of salmon is being developed in Stewart Island and the Marlborough Sounds. Scallop reseeding is a newly developed aspect of aquaculture.
The New Zealand fishing industry is export oriented, with 75 percent of landings being consigned overseas in 1986.
Significant finfish species exported in 1986 were: orange roughy (13131 tonnes, valued at $160 million), hoki (28509 tonnes, valued at $64.8 million), squid (30746 tonnes, valued at $64.5 million), snapper (6212 tonnes, valued at $41.9 million), and warehou (4961 tonnes, valued at $17.2 million).
The most important export markets for New Zealand's fisheries produce in 1986 were the United States ($262.8 million), Japan ($232.2 million) and Australia ($73.7 million).
Table 16.17. FISHERIES EXPORTS
| Commodity exported | 1985 | 1986 | ||
|---|---|---|---|---|
| Quantity | Value | Quantity | Value | |
* Includes small quantities of inedible oils and meal. Source: Ministry of Agriculture and Fisheries. | ||||
| tonnes | $(000) f.o.b. | tonnes | $(000) f.o.b. | |
| Finfish or wetfish | 95171x | 324,341x | 116940 | 446,128 |
| Rock lobster | 2686x | 88,818x | 3158 | 104,297 |
| Shellfish (other crustacea and molluscs)* | 47313x | 131,953x | 38087 | 106,917 |
| Total | 145170x | 545,112x | 158183 | 657,342 |
Within New Zealand, the trend in recent years has been towards greater fish consumption per capita, probably as a result of increased inclusion in restaurant menus, as home consumption has actually reduced. Per capita consumption for 1986 was estimated at 19.6 kilograms green weight. Imported fish products consist largely of canned sprats, sardines, anchovies, herrings, salmon, crab sticks and prawns.
The New Zealand Fishing Industry Board was formed in 1964 to promote the interests of all sectors of the fishing industry. It is a statutory organisation with income from an industry levy. Outside its major responsibilities for orderly and profitable development of the industry, the board deals with issues at the request of individual fishers, processors, retailers, and fish farmers.
Practical involvement with the industry is maintained by the presence on the board of two fisher representatives, two fish processing representatives and a fish retailer. These are elected by their respective organisations. An independent chairperson, the Director-General of the Ministry of Agriculture and Fisheries or the Director-General's nominee, and one other member appointed by the Minister of Fisheries, complete the board's membership.
Continual communication with fishing and governmental organisations in many other countries is fostered. This exchange of information enables the board to bring to the industry a great diversity of developments in technology and fisheries policy areas.
Board staff, stationed in Wellington, provide centralised support for industry in the areas of economic research, information and publicity. There is also close liaison with the Fishing Industry Training Council, in the provision of industry training at all levels.
Since the Territorial Sea and Exclusive Economic Zone Act came into effect in 1978, foreign trawling activity has been strictly controlled and catch limits enforced. Quotas have been issued, and licensed access agreements have been negotiated between New Zealand and the Republic of Korea, the Soviet Union and Japan.
Applications by foreign countries to fish must include plans showing areas to be fished, numbers and sizes of vessels, and target species. Apportionments are made to countries for specific quantities by area, and fees are set on the basis of the value of the quota of each species allocated. By-catch levels are set for selected species.
Table 16.18. ALLOCATIONS TAKEN UP BY OTHER NATIONS: FINFISH AND SQUID FISHERY, 1987–88
| Country | Year ended 30 September | |
|---|---|---|
| Finfish | Squid | |
| Source: Ministry of Agriculture and Fisheries. | ||
| tonnes | ||
| Korea, Republic of | 3803 | 3303 |
| U.S.S.R. | 4181 | 3200 |
| Japan | 28718 | 31280 |
In the 1987–88 season authorisations were given for the Japanese to operate 38 tuna longliners without tonnage restriction in the southern bluefin tuna fishery, and for Japan and Korea to operate 30 and 15 vessels respectively in the albacore fishery in the northern regions of the Exclusive Economic Zone.
To enable local fishing interests to gain more knowledge of advanced fishing techniques, fish handling and fish processing, the Government encouraged the operation of co-operative fishing ventures with foreign partners during the five years to March 1983. This development phase then ended and the resource was allocated to New Zealand interests only, with the use of foreign vessels on charter available as an alternative to using domestic vessels.
The Census of Fishing formed part of the five-yearly series of integrated economic censuses of business activities in New Zealand carried out by the Department of Statistics until 1985. The 1983–84 census covered ail operations carried out by activity and ancillary units in the fishing industry during the year ended 31 March 1984 (those with different balance dates submitted data for the year ended within the period 1 April 1983 to 31 March 1984).
The Census of Fishing included joint fishing ventures and covered the activities of all firms whose predominant activity was the landing of wetfish, whether from the ocean, coastal waters or inland waters. Fish farming (including oyster and mussel fanning) and the gathering of molluscs and seaweed by hand were also within the scope of the census. The actual activities covered ranged from the purchase of materials and supplies to the sale of the caught fish.
The definitions of terms used in table 16.19 are given in the glossary at the end of this book.
More recent statistical information on the fishing industry will be published as part of the 1986–87 Economy Wide Census—volumes from which will become available through 1989.
Table 16.19. GENERAL STATISTICS BY INDUSTRY MAJOR GROUP. CENSUS OF FISHING 1983–84
| Statistical item | Group 131: Ocean and coastal fishing | Group 132: Fishing in inland waters and fish farming | Census totals | Joint ventures |
|---|---|---|---|---|
* Excludes crew members of joint fishing ventures totalling 2195. † Includes $2,393,000 salaries and wages paid to foreign crews. ‡ Includes $56,899,000 representing assessed additional operating surplus included in charter fees paid by joint ventures. | ||||
| Census coverage | number | |||
| Enterprise groups | 1287 | 227 | 1514 | 16 |
| Enterprises | 1292 | 229 | 1521 | 18 |
| Activity units | 1305 | 234 | 1539 | 20 |
| Ancillary activity units | 8 | - | 8 | - |
| Working proprietors/partners at end of February | 1522 | 312 | 1834 | - |
| Paid employees at end of February* | 2099 | 128 | 2227 | 52 |
| Census values in accounting terms | $(000) | |||
| Salaries paid to working proprietors/partners | 3,771 | 374 | 4,144 | - |
| Salaries and wages paid to employees | 34,177 | 1,094 | 35,270 | 3,088 |
| Stocks— | ||||
| Opening | 8,851 | 548 | 9,400 | 5,686 |
| Closing | 8,548 | 659 | 9,207 | 4,171 |
| Income— | ||||
| Sales of fish, shellfish, crustacea, etc. | 296,352 | 6,801 | 303,153 | 148,232 |
| Direct government cash grants and subsidies | 204 | 10 | 214 | - |
| Other income (excluding interest, etc.) | 751 | 587 | 1,338 | - |
| Sales and income (excluding interest, etc.) | 297,307 | 7,398 | 304,705 | 148,232 |
| Interest, dividends, donations, royalties, patent fees and insurance claims | 1,965 | 109 | 2,074 | 574 |
| Total sales and other income (including interest, etc.) | 299,272 | 7,507 | 306,779 | 148,806 |
| Expenditure: | ||||
| Purchases of fuel and oil | 44,844 | 555 | 45,399 | 12,649 |
| Employer contributions | 796 | 46 | 842 | 15 |
| Salaries and wages | 34,177 | 1,094 | 35,270 | 3,088 |
| Depreciation | 12,260 | 678 | 12,938 | 165 |
| Indirect taxes | 1,446 | 37 | 1,484 | 562 |
| Other expenses (excluding interest, etc.) | 170,938 | 4,239 | 175,177 | 124,362 |
| Operating expenditure (excluding interest, etc.) | 264,461 | 6,649 | 271,110 | 140,841 |
| Interest, bad debts, donations, royalties and patent fees paid | 8,620 | 448 | 9,068 | 668 |
| Total expenditure (including interest, etc.) | 273,081 | 7,096 | 280,177 | 141,509 |
| Net profit, after deducting working proprietors/partners salaries | 22,116 | 148 | 22,265 | 5,781 |
| Census values in economic terms | ||||
| Operating surplus† | 89,440 | 860 | 90,301 | 62,774 |
| Value added† | 137,916 | 2,705 | 140,621 | 66,605 |
| Fixed tangible assets: | ||||
| Additions to | 20,596 | 1,796 | 22,392 | .. |
| Disposals of | 5,345 | 310 | 5,656 | .. |
16.1 Ministry of Forestry: Forestry Corporation of New Zealand: Department of Statistics.
16.2 Ministry of Forestry.
16.3 Ministry of Agriculture and Fisheries.
16.4 Ministry of Agriculture and Fisheries; New Zealand Fishing Industry Board: Department of Statistics.
Census of Forestry and Logging 1983–84. Department of Statistics.
Report of the Ministry of Forestry (Parl. paper C. 16).
Statistics of the Forests and Forest Industries of New Zealand. Ministry of Forestry, 1988.
Catch. Ministry of Agriculture and Fisheries (monthly).
Contacts in Fishing. Ministry of Agriculture and Fisheries (biennial).
Economic Review of the New Zealand Fishing Industry. New Zealand Fishing Industry Board, 1987.
Fisheries Research Division Occasional Publications: Data Series. Ministry of Agriculture and Fisheries.
Freshwater Catch. Ministry of Agriculture and Fisheries (quarterly).
New Zealand Census of Fishing 1983–84. Department of Statistics.
New Zealand Journal of Marine and Freshwater Research. Department of Scientific and Industrial Research (quarterly).
Report of the Ministry of Agriculture and Fisheries (Parl. paper C. 5).
Report of the New Zealand Fishing Industry Board (Parl. paper C. 6).
Table of Contents
The New Zealand energy sector was subject to centralised government control, but recently the emphasis has changed to a greater reliance on the market as an economic regulator. There has been a shift in focus from supply factors to the needs of the consumer.
The current thrust of energy policy is to provide greater efficiency of energy use, to increase competition within the sector, and greater flexibility in meeting consumer requirements. The restructuring of the sector has resulted in a reduction in the Government's role and a considerably smaller Ministry of Energy, which now performs more of a policy and regulatory role. The two major changes to the sector have been those resulting from corporatisation and deregulation.
Corporatisation. In 1987 the former Electricity Division and State Coal Mines of the Ministry of Energy became state-owned enterprises: the Electricity Corporation of New Zealand Limited (Electricorp) and the Coal Corporation of New Zealand Limited (Coalcorp). They have limited liability under the Companies Act 1955 but remain subject to special accountability and control provisions, under the State Owned Enterprises Act 1987. The ministry has retained some residual trading functions in natural gas, synthetic petroleum and geothermal activity. These functions have, however, been separated from the non-trading activities and are the responsibility of its gas and geothermal trading group.
Deregulation. The freeing up of the energy market has been aided by a package of deregulation by the Government. Deregulation has already occurred to a limited extent with the removal of the minimum price of petrol. The Petroleum Sector Reform Bill currently under review is looking at the further deregulation of the petroleum sector. In the electricity sector deregulatory reform came into force in 1988 with the establishment of Electricorp, and moves to restructure the distribution industry are well advanced.
Natural gas still remains under price control, although the Government plans to deregulate will be announced late in 1988. Restructuring is likely to include the divesting of government interests in commercial ventures where there is no compelling reason for government involvement. The Government has sold its remaining 70 percent share of Petrocorp to Fletcher Challenge.
Maui gas. The ministry's gas and geothermal trading group is currently renegotiating its Maui gas supply contract with Electricorp, and will be based purely on commercial considerations.
Reviews. A major review of the mining, coal mines and quarries and tunnels legislation was in progress at the time of going to press, and comprehensive reviews of the Petroleum Act 1937 and the Geothermal Act 1953 are planned for 1989.
Table 17.1 provides data from which the trends in New Zealand's consumption of primary energy since 1924 can be seen. ‘Primary energy’ is energy first obtained from natural sources, which means coal is accounted for as it is mined, oil products as they are imported in various degrees of refinement, natural gas as it is taken from the wells at Kapuni and Maui, and so on. Petroleum imports decreased as a percentage of total national imports of all goods during the 1981–86 period from 21.2 percent in 1981 to 10.0 percent in 1986.
In the table ‘primary electricity’ shows electricity generated from hydro and geothermal sources. For these, generation efficiencies are ignored, and the measure of the primary energy is electricity generated. This is justifiable in the case of hydro-electricity, where the generation efficiency is high, but a large quantity of energy is wasted in producing electricity from geothermal heat. However, the wasted energy is low grade, and for the sake of simplicity is not shown in the table.
Table 17.2 provides a similar historical description of consumer energy use, while table 17.3 describes how primary energy supply was used to meet demand in the major sectors of the economy for 1985. Energy use in these sectors is expressed as percentages in table 17.4.
In a number of tables in this chapter, energy is measured in petajoules. The joule is the metric unit of energy and makes comparisons between the different forms of energy possible. For convenience, the petajoule (PJ) or 1015 joules is often used.
Table 17.1. TRENDS IN THE CONSUMPTION OF PRIMARY ENERGY
| Calendar year | Coal | Wood | Oil | Natural gas | Primary electricity | Total* | Imported oil percentage of total | |
|---|---|---|---|---|---|---|---|---|
| Imported | Indigenous | |||||||
* Because of rounding, totals may differ slightly from stuns of individual figures. Source: Ministry of Energy. | ||||||||
| petajoules | ||||||||
| 1924 | 75 | .. | 10 | − | − | 0.5 | 86 | 11 |
| 1934 | 56 | .. | 19 | − | − | 3 | 78 | 24 |
| 1944 | 72 | .. | 30 | − | − | 7 | 109 | 28 |
| 1954 | 66 | .. | 59 | − | − | 14 | 139 | 42 |
| 1964 | 66 | .. | 103 | − | − | 34 | 203 | 51 |
| 1974 | 62 | .. | 193 | 8 | 14 | 55 | 332 | 58 |
| 1984 | 52 | 15 | 142 | 41 | 115 | 77 | 442 | 32 |
| 1985 | 52 | 16 | 134 | 49 | 140 | 75 | 466 | 30 |
| 1986 | 50 | 17 | 100 | 53 | 169 | 83 | 472 | 21 |
| 1987P | 57 | 17 | 135 | 56 | 170 | 90 | 525 | 26 |
Table 17.2. TRENDS IN CONSUMER ENERGY USE
| Calendar year | Solid* | Oil | Gas | Electricity | Total |
|---|---|---|---|---|---|
* Includes wood. Source: Ministry of Energy. | |||||
| petajoules | |||||
| 1924 | 59 | 5 | 2 | 1 | 66 |
| 1934 | 49 | 19 | 2 | 3 | 73 |
| 1944 | 62 | 30 | 2 | 8 | 102 |
| 1954 | 55 | 59 | 2 | 16 | 132 |
| 1964 | 48 | 90 | 2 | 30 | 170 |
| 1974 | 41 | 151 | 1 | 58 | 257 |
| 1984x | 40 | 140 | 48 | 83 | 311 |
| 1985 | 35 | 136 | 54 | 84 | 309 |
| 1986 | 41 | 141 | 53 | 88 | 323 |
| 1987P | 42 | 140 | 54 | 105 | 341 |
The following points should be considered when examining table 17.3:
The Taranaki synthetic fuels plant production is included with refinery production in row ‘secondary production’.
The high use of oil by industry is attributed to the use of motor vehicles and trucks in that sector.
Lpg production is included in indigenous oil production.
Table 17.3. ENERGY SUPPLY AND DEMAND, 1986
| Source of energy | Total | |||||
|---|---|---|---|---|---|---|
| Solid fuel | Oil | Gas | Hydro geothermal | Electricity | ||
* Decreases in stock levels appear as negative stock changes. Such decreases in stocks have to be added to indigenous production (+ imports - exports) in order to obtain figures of energy consumed. Increases in stocks have to be deducted from production in order to obtain figures of energy consumed. † Includes fuel used in gas manufacture, and production of solid fuels such as cones from carbonisation plants, etc. Source: Ministry of Energy. | ||||||
| petajoules | ||||||
| Indigenous production | 71.69 | 59.22 | 169.20 | 82.95 | − | 383.06 |
| Plus, Imports | 0.04 | 95.22 | − | − | − | 95.26 |
| Less, Exports | 8.17 | 4.33 | − | − | − | 12.50 |
| Less, International transport | − | 17.69 | − | − | − | 17.69 |
| Stock changes* | -4.41 | 2.13 | − | − | − | -2.28 |
| Primary energy consumed | 67.97 | 130.29 | 169.20 | 82.95 | - | 450.41 |
| Less, used in electricity generation | 5.67 | 0.06 | 47.28 | 82.95 | − | 135.95 |
| Less, used in liquid fuel production | − | 123.69 | 53.64 | − | 0.32 | 177.66 |
| Less, main gas | 0.34 | − | 0.30 | − | − | 0.64 |
| Plus, secondary production | 0.14 | 142.87 | 0.49 | − | 100.16 | 243.65 |
| Total energy available | 62.10 | 149.41 | 68.47 | - | 99.84 | 379.82 |
| Less— | ||||||
| Consumption by energy sector and losses† | 2.20 | 0.23 | 4.25 | − | 10.00 | 16.68 |
| Non-energy use | − | 7.27 | 11.50 | − | − | 18.77 |
| Total consumer energy (calculated) | 59.90 | 141.91 | 52.72 | − | 89.84 | 344.36 |
| Total consumer energy (observed) | 58.55 | 141.95 | 52.20 | − | 89.85 | 342.55 |
| Energy demand— | ||||||
| Industry | 38.79 | 23.13 | 34.80 | − | 41.47 | 138.19 |
| Transport | 0.08 | 112.00 | 6.00 | − | 0.20 | 118.28 |
| Domestic | 14.31 | 0.30 | 3.60 | − | 32.76 | 50.97 |
| Commercial and other uses | 5.37 | 6.52 | 7.80 | − | 15.42 | 35.11 |
| Error | −1.34 | 0.04 | −0.52 | − | 0.01 | −1.81 |
Table 17.4. MARKET SHARES OF ENERGY RESOURCES, 1986
| Source | Industry and commerce | Transport (incl. international transport) | Households | Thermal electricity generation |
|---|---|---|---|---|
| Source: Ministry of Energy. | ||||
| percent | ||||
| Oil | 17.1 | 94.7 | 0.6 | 0.1 |
| Solid fuel | 25.5 | 0.1 | 28.1 | 10.7 |
| Gas (natural and manufactured) | 24.6 | 5.1 | 7.1 | 89.2 |
| Electricity | 32.8 | 0.1 | 64.2 | - |
| Total | 100.0 | 100.0 | 100.0 | 100.0 |
Energy sources in New Zealand are many and diverse. They range from renewables such as solar radiation to non-renewables such as coal and oil.
Oil. This is the primary fuel source in New Zealand, but the country does not produce enough for domestic consumption, hence the continued need for imported oil products. Discovered oil and condensate resources are listed in table 17.5.
Table 17.5. DISCOVERED OIL AND CONDENSATE RESOURCE ESTIMATES
| Field | Low | Middle | High | Middle |
|---|---|---|---|---|
* Included in ‘Maui condensate’. Source: Ministry of Energy. | ||||
| million standard barrels | petajoules | |||
| Maui condensate | 73.30 | 93.80 | 118.00 | 588 |
| Maui oil (Maui B area) | 8.30 | 11.80 | 17.20 | * |
| McKee | 7.60 | 20.00 | 35.40 | 121 |
| Kaimiro | 0.17 | 0.58 | 1.30 | 3 |
| Tariki | 1.06 | 2.82 | 8.16 | 17 |
| Ahuroa | 0.43 | 0.93 | 1.50 | 6 |
| Kapuni | .. | 29.00 | .. | 165 |
| Kupe | .. | 48.00 | .. | 300 |
| Total | 167.86 | 206.93 | 258.56 | 1200 |
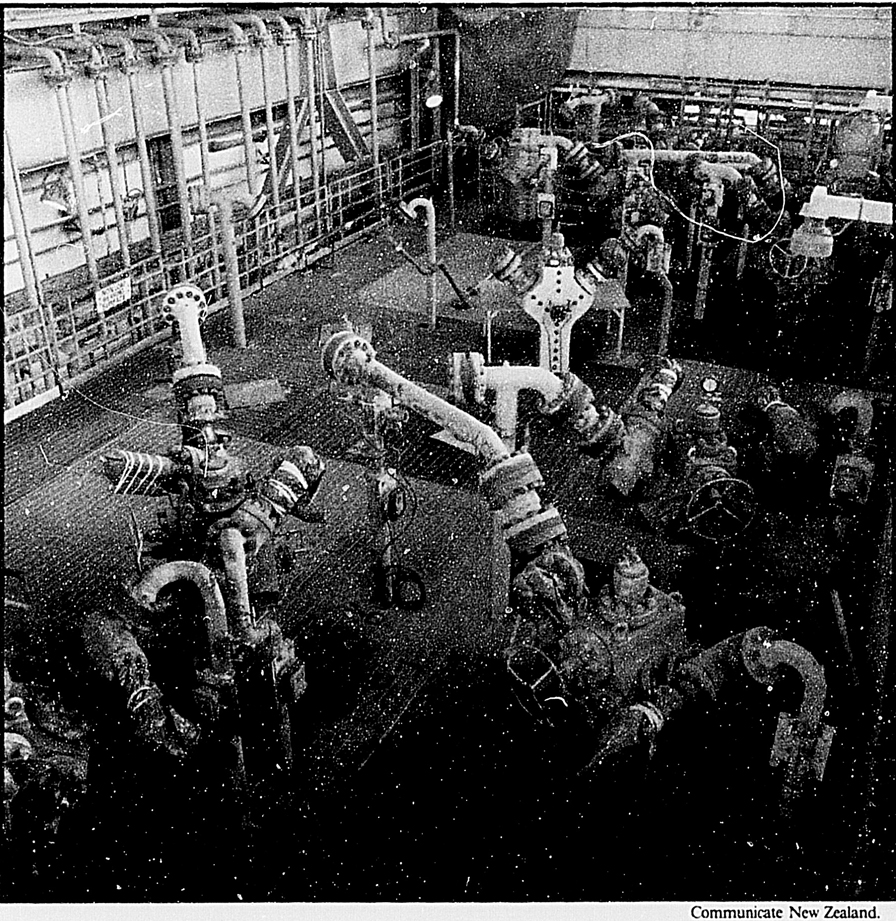
Well heads, Maui gas field
Gas. Natural gas in New Zealand is a premium energy resource, although its use is largely confined to the North Island. Maui gas, thought to be the largest reserve, has recently been re-evaluated and there is thought to be approximately 25 percent less than originally estimated.
Economically gas is not as valuable as oil, as it is difficult to transport and therefore does not have the same international market. Discovered resources are detailed in table 17.6.
Table 17.6. DISCOVERED GAS RESERVES ESTIMATES
| Field | Low | Middle | High |
|---|---|---|---|
| Source: Ministry of Energy. | |||
| petajoules | |||
| Maui | 2775.0 | 3541.0 | 4488.0 |
| Kapuni | 405.0 | 405.0 | 405.0 |
| McKee | 116.7 | 191.9 | 231.6 |
| Kaimiro | 7.0 | 22.4 | 48.7 |
| Tariki | 23.6 | 91.5 | 155.7 |
| Ahuroa | 13.3 | 41.4 | 64.8 |
| Total | 3340.6 | 4293.2 | 5393.8 |
Gas from the recently discovered Kupe, South field is not included, as field definition is continuing.
Coal. Coal represents New Zealand's largest indigenous fossil fuel resource. Coal has property variations which are primarily dependent on the environment of deposition, thus coal from one area cannot necessarily be substituted for coal from another. Most coal is found in the south of the South Island.
Recoverable coal classified by region is detailed below. See also section 17.4
Table 17.7. RECOVERABLE COAL BY REGION
| Region | Petajoules | Coal type |
|---|---|---|
| Source: Ministry of Energy. | ||
| Waikato | 18000 | sub-bituminous |
| Taranaki | 3600 | sub-bituminous |
| Westland | 9000 | sub-bituminous and bituminous |
| Canterbury | 20 | sub-bituminous |
| Otago | 15000 | sub-bituminous and lignite |
| Southland | 72000 | sub-bituminous and lignite |
| Total | 117620 | all types |
Hydro. Compared to many other countries, New Zealand has a relatively high rainfall and steep terrain, factors which have enabled the country to harness an abundance of hydro power.
Approximately 76 percent of all New Zealand's electricity needs comes from hydro generation, and about 70 percent of the resource was produced in the South Island in 1986–87 (total 20623 GWh) (74 PJ per annum). Surveys of potential capacity indicate another 50000 GWh per annum (180 PJ per annum) could be available although most of the largest, and commercially viable rivers have already been harnessed. The hydro resource can generally only be used for electricity generation.
Geothermal. New Zealand has abundant resources of geothermal energy. There are nearly 200 separate geothermal fields or hot springs in the country. It is estimated that there is a potential resource of over 75000 PJ in terms of heat stored above 80C.
The efficiency of conversion into electricity is generally less than 15 percent, meaning the useful output is small compared to its stored energy. Steam from the Wairakei field is used for the generation of electricity and stations at Ohaaki and Tauhara are under construction.
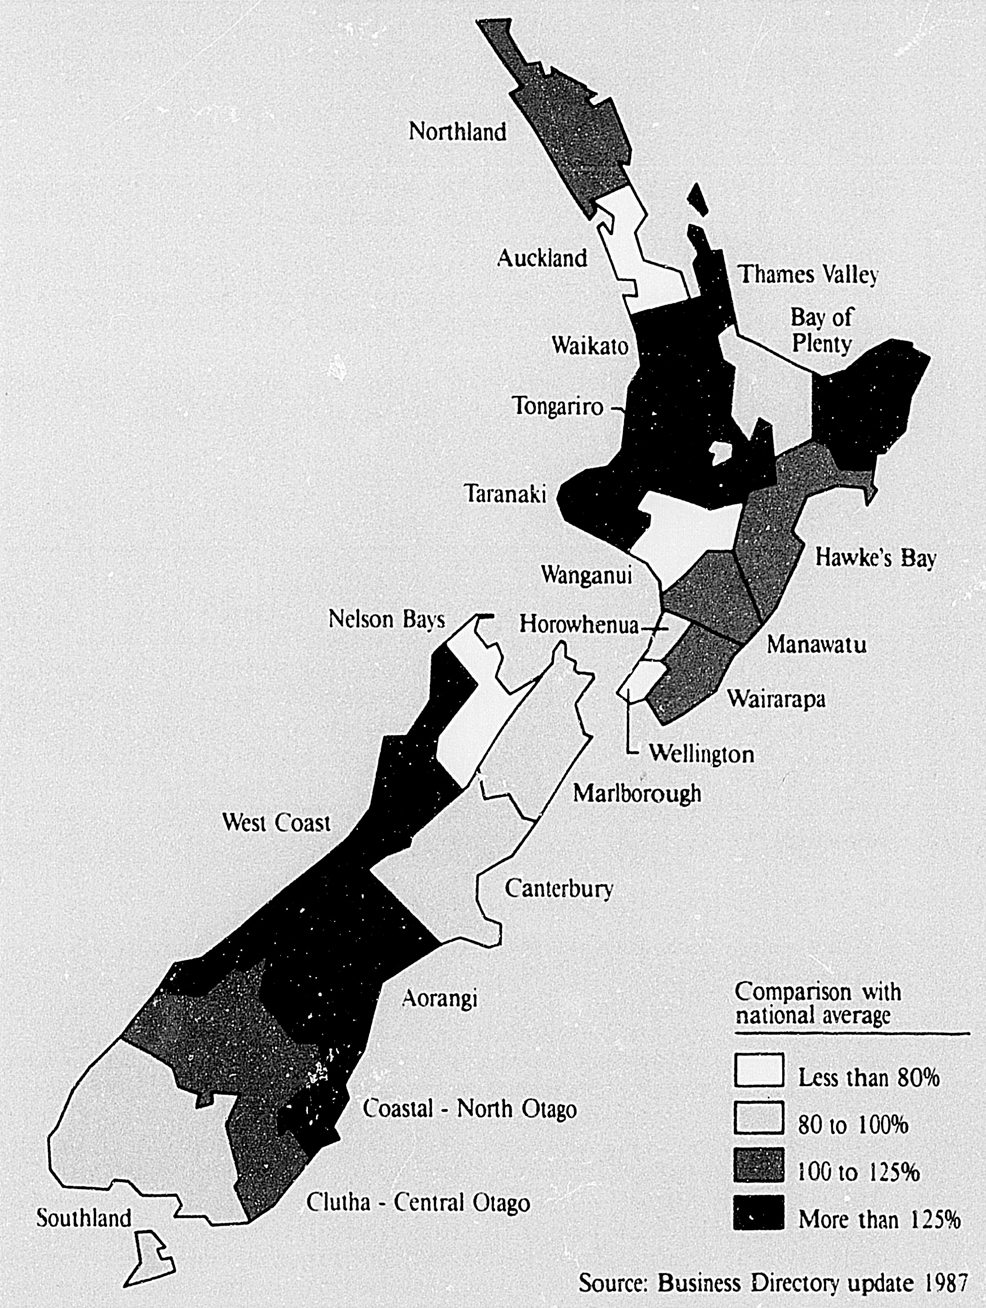
Percentage of workforce employed in
ELECTRICITY, GAS AND WATER
Sunlight. Solar energy can be captured economically by using passive solar design for buildings and hot water heating. In New Zealand the mean daily isolation is 14.1 units. The use of photo-voltaics is also economic in remote areas.
Biological sources. About 0.4 percent of New Zealand's energy supply comes from biomass. The energy content of biological materials is variable and usually low and diffuse. Although it would be currently uneconomic to convert biomass into transport fuels. Liquid Fuels Trust Board studies have indicated that about 200–240 PJ per year could be produced by New Zealand exotic forests.
Wind. It is possible that wind could be utilised more as an energy source. In a number of countries it is harnessed to generate electricity, although in New Zealand it is mostly used for pumping water in remote areas.
Sea. Schemes are being planned overseas which exploit the tidal range in enclosed areas for the generation of electricity. As tidal ranges in New Zealand are comparatively low, there is little prospect for harnessing the tides.
The exploitation of waves as a source of energy is more promising because of the exposed coast line. While some interest has been expressed by some foreign companies, there is still some doubt as to this method's economic viability.
New Zealand's topography, particularly in the South Island, is well suited to hydro-electricity generation and this factor dominates the country's electricity supply. In the year ended 31 March 1987, hydro stations generated 76 percent of the nation's electricity. Of the balance, 20 percent was produced by conventional thermal generation fueled by gas, coal and oil, and the remaining 4 percent came from the geothermal power station at Wairakei.
The structure of the electricity industry is essentially two-tiered. The first tier being the Electricity Corporation of New Zealand, which is responsible for the generation of most of the country's electricity and its transmission by way of a national grid. At the second level, supply authorities buy this bulk electricity, distribute, and sell it to the end consumer.
The Electricity Corporation's vole is the economic and efficient generation and delivery of electricity to supply authorities.
On 1 April 1987 the former Electricity Division of the Ministry of Energy became the Electricity Corporation of New Zealand Limited. The new state-owned enterprise reorganised itself extensively, and this resulted in five autonomous business divisions being set up. These relate to the major elements of the company structure. They are the Production Division, Electricorp Marketing, the National Grid Division, the Power ‘Design-Build’ Group (which comprises two subsidiaries: ‘Design-Power’ and ‘Power-Build’), and the Corporate Group. The tables in this section refer to the year prior to these changes.
Since 1986, the Ministry of Energy has assumed the regulatory functions previously carried out by the Electricity Division. The ministry sets rules and standards for all aspects of the electricity industry, such as for the safety of electrical workers, and for electrical appliances. It also administers regulations for the supply of homes and businesses, and advises the Government on all aspects of the electricity sector.
Table 17.8. ELECTRICITY GENERATION AND SUPPLY INDUSTRY: INCOME AND EXPENDITURE, 1987
| Item | Year ended 31 March |
|---|---|
* These figures represent transfers within the electrical supply industry and therefore do not represent additional income or expenditure to the industry. Source: Ministry of Energy. | |
| Income— | $(000) |
| Gross income (including bulk sales and standby charges, excluding rates) | 2,933,879 |
| Income from bulk sales to supply authorities* | 1,045,755 |
| Net income (excluding rates, bulk sales, and standby charges) | 1,888,124 |
| Expenditure— | |
| Operating (including cost of energy purchased in bulk) | 1,511,770 |
| Cost of energy purchased in bulk* | 1,045,755 |
| Expenditure— | |
| Operating (excluding cost of energy purchased in bulk) | 466,015 |
| Trading administration and general | 288,560 |
| Loan interest and depreciation | 794,184 |
| Net annual expenditure (excluding cost of energy purchased in bulk) | 1,548,759 |
| Surplus | 339,801 |
The Electricity Corporation of NZ Ltd has 38 power stations (see table below) which produce 96 percent of the country's electricity. The other 4 percent comes from supply authorities' own generation schemes.
The first government scheme was opened in 1914 at Lake Coleridge, beginning a policy of hydro development which resulted in the construction of 15 hydro schemes before the first thermal station was built at Meremere in 1958.
As at 31 March 1987 the Electricity Corporation had 30 hydro-electric stations, with a maximum capacity of 4349 megawatts (61 percent of total capacity) while the remaining eight thermal stations had a capacity of 2777 megawatts (39 percent of total capacity). The high fuel costs involved in, operating thermal stations as compared to hydro generally mean that hydro stations actually produce a larger percentage of the nation's electricity.
This difference between maximum capacity and actual output (on average) is expressed as the annual load factor, in percentage form. The higher the percentage the more often the station is used. From the figures in table 17.12 below (showing power stations) it can be seen that hydro stations run more regularly than thermal stations. Wairakei, being geothermal, is the exception because it draws on a natural and relatively continuous resource.
Table 17.9. ELECTRICITY SOURCES
| Year ended 31 March | Hydro | Steam | Oil/gas | Total |
|---|---|---|---|---|
| Source: Ministry of Energy. | ||||
| kWh(million) | ||||
| 1983 | 17987.1 | 5636.3 | 678.0 | 24301.3 |
| 1984 | 20198.9 | 5084.0 | 572.0 | 25854.9 |
| 1985 | 20107.4 | 6343.5 | 313.7 | 26764.6 |
| 1986 | 19706.6 | 6683.0 | 627.5 | 27017.1 |
| 1987 | 21787.4 | 6283.0 | 89.0 | 28159.4 |
Table 17.10. ELECTRICITY GENERATION AND DISPOSAL
| Year ended 31 March | Electricity division | Supply authorities | Other sources* | Total | Sold retail | Nonproductive |
|---|---|---|---|---|---|---|
* Including local hydro. Source: Ministry of Energy. | ||||||
| kWh(million) | ||||||
| 1983 | 23619 | 666 | 16 | 24301 | 21371 | 2930 |
| 1984 | 24997 | 841 | 17 | 25855 | 23027 | 2828 |
| 1985 | 25754 | 992 | 19 | 26765 | 23994 | 2771 |
| 1986 | 25985 | 1019 | 13 | 27017 | 24275 | 2742 |
| 1987 | 26990 | 1163 | 7 | 28160 | 25349 | 2811 |
Table 17.11. ELECTRICITY MARKETS
| Year ended 31 March | Domestic* | Industrial | Commercial | Farming | Public lighting | Rail and bus traction | Total | Electricity account holders |
|---|---|---|---|---|---|---|---|---|
* Includes domestic water-heating units. Source: Ministry of Energy. | ||||||||
| kWh(million) | number | |||||||
| 1983 | 8733 | 8231 | 3734 | 516 | 128 | 29 | 21371 | 1396783 |
| 1984 | 8981 | 9424 | 3962 | 499 | 130 | 31 | 23027 | 1417606 |
| 1985 | 8998 | 9995 | 4224 | 613 | 135 | 30 | 23994 | 1436730 |
| 1986 | 9080 | 10038 | 4417 | 578 | 132 | 30 | 24275 | 1462735 |
| 1987 | 9424 | 10472 | 4722 | 567 | 133 | 31 | 25349 | 1488253 |
Table 17.12. POWER STATIONS 1987
| Station | Installed capacity at 31 March | Static head | Energy generation year ended 31 March | Load factor year ended 31 March | |
|---|---|---|---|---|---|
| Number of units | MW* | ||||
* 'In-situ maximum' rating. Source: Ministry of Energy. | |||||
| Hydro | metres | kWh (million) | percent | ||
| Arapuni | 8 | 156 | 53 | 845.4 | 63.28 |
| Aratiatia | 3 | 84 | 34 | 345.7 | 43.75 |
| Atiamuri | 4 | 81 | 25 | 300.5 | 43.58 |
| Karapiro | 3 | 96 | 30 | 542.4 | 60.46 |
| Mangahao | 5 | 20 | 273 | 99.4 | 54.54 |
| Maraetai | 10 | 360 | 61 | 876.9 | 40.24 |
| Matahina | 2 | 72 | 61 | 276.7 | 37.02 |
| Ohakuri | 4 | 112 | 35 | 415.3 | 41.88 |
| Rangipo | 2 | 120 | 206 | 429.8 | 42.56 |
| Tokaanu | 4 | 200 | 208 | 705.4 | 36.67 |
| Waikaremoana— | |||||
| Kaitawa | 2 | 32 | 135 |  | 34.69 |
| Piripaua | 2 | 40 | 113 | ||
| Tuai | 3 | 56 | 206 | ||
| Waipapa | 3 | 51 | 16 | 242.7 | 53.48 |
| Whakamaru | 4 | 100 | 38 | 512.7 | 57.37 |
| Arnold | 2 | 3 | 13 | 23.3 | − |
| Aviemore | 4 | 240 | 37 | 987.7 | 47.14 |
| Benmore | 6 | 540 | 92 | 2476.5 | 50.71 |
| Cobb | 6 | 32 | 594 | 172.0 | 58.28 |
| Coleridge | 9 | 35 | 149 | 266.3 | 74.74 |
| Highbank | 1 | 25 | 101 | 114.6 | 46.90 |
| Manapouri | 7 | 590 | 177 | 4592.9 | 88.08 |
| Monowai | 3 | 6 | 47 | 41.4 | 72.66 |
| Ohau ‘A’ | 4 | 264 | 58 | 1160.5 | 50.79 |
| Ohau ‘B’ | 4 | 212 | 48 | 936.9 | 46.91 |
| Ohau ‘C’ | 4 | 212 | 48 | 943.3 | 48.08 |
| Roxburgh | 8 | 320 | 46 | 1611.1 | 55.46 |
| Tekapo ‘A’ | 1 | 25 | 30 | 49.7 | 20.56 |
| Tekapo ‘B’ | 2 | 160 | 146 | 761.6 | 57.73 |
| Waitaki | 7 | 105 | 21 | 539.2 | 57.10 |
| North Island supply authorities | 49 | 165 | … | 643.3 | .. |
| South Island supply authorities | 39 | 134 | … | 520.1 | .. |
| South Island private plant | .. | .. | … | 0.3 | .. |
| Subtotal, hydro | 215 | 4648 | … | 21837.8 | … |
| Thermal | |||||
| Huntly | 4 | 948 | … | 3666.2 | 55.68 |
| Marsden | 2 | 230 | … | 8.5 | 1.84 |
| Meremere | 6 | 170 | … | 25.6 | 21.92 |
| New Plymouth | 5 | 600 | … | 1419.6 | 47.20 |
| Otahuhu | 6 | 259 | … | 11.7 | 10.87 |
| Stratford | 4 | 208 | … | 76.2 | 26.77 |
| Wairakei | 9 | 146 | … | 1174.3 | 89.79 |
| Whirinaki | 4 | 216 | … | 1.0 | 0.16 |
| North Island supply authorities | 3 | 8 | … | 0.2 | … |
| South Island supply authorities | 4 | 2 | … | 0.1 | … |
| North Island private plant | .. | .. | … | 4.7 | … |
| South Island private plant | .. | .. | … | 0.8 | … |
| Subtotal, thermal | 48 | 2787 | … | 6371.9 | … |
| Total | 263 | 7435 | … | 28309.7 | … |
Although there is still potential for further hydro development, there are only two major projects currently under construction. The first of these is the Clyde Dam, which will have a maximum capacity of 432 MW and is expected to be commissioned during 1989. The other scheme is the Ohaaki geothermal station which will have a capacity of 100 MW and a planned commissioning date of 1989.
While the Electricity Corporation will probably be the major generating organisation in New Zealand, it and the present supply authorities may not be the only participants in the market.
New regulations for the electricity transmission industry came into effect on 1 January 1988, and there are no longer restrictions on who can generate electricity. Electricity produced may be sold to either the corporation or other customers. All parties will have the right of access to the national transmission network on non-discriminatory terms.
Planning for electricity. Since 1987 the Electricity Corporation has been responsible for forecasting future electricity consumption and drawing up a parallel construction programme to ensure the expected need is met. This was previously the task of the Electricity Sector Forecasting Committee and the Ministry of Energy.
The transmission system, the national grid, links all the power stations together, allowing them to operate as an integrated whole. Every generating station is connected to the network, as well as all the points at which supply authorities access the system. These are known as points of supply and are where the electricity is sold to the supply authorities by the Electricity Corporation.
An important part of the national grid is the Cook Strait cable which connects the transmission systems of the North and South Islands. This allows the surplus generation of the South Island to supply the North Island, where there is the greatest demand.
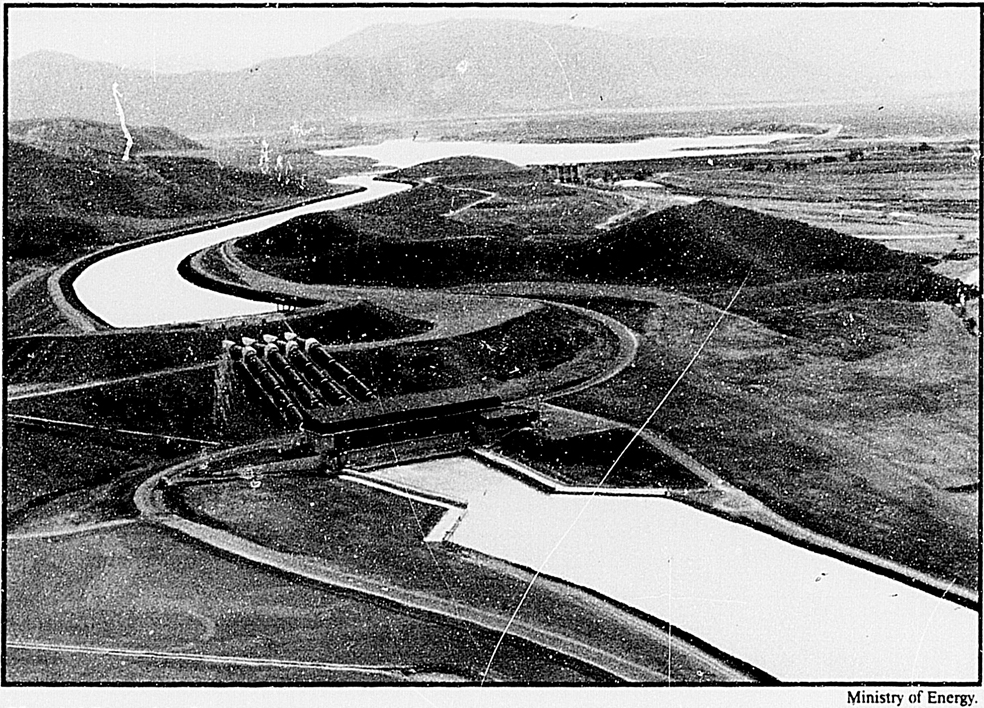
Ohau ‘A’ Dam, Mackenzie country.
Electricity distribution to end consumers is the responsibility of 60 supply authorities. The authorities are licensed to supply electricity to particular areas under the terms of the Electricity Act 1968. They buy electricity in bulk from the Electricity Corporation of NZ Ltd and then sell it to individual consumers.
Thirty-eight of the supply authorities are ad hoc local bodies called electric power boards (one, Rotorua, is referred to as an area electricity authority). They have the sole function of providing electricity and related services in their districts. Another authority (the Hutt Valley Energy Board) also distributes gas. The remainder (22) are territorial authorities (municipalities or counties) which are responsible for distribution of electricity and a range of other services.
In Southland, however, distribution is at present the responsibility of the Southland Electricity Power Supply, the assets being owned by the Crown. This has been the case since 1936, when the central government took over the operations of the Southland Electricity Power Board which had severe financial difficulties. The future of this last direct government involvement in retail supply is under review.
Supply authorities range in their physical size from 3 square kilometres (Riccarton Borough Council) to Southland Electricity Power Supply with an area of 28740 square kilometres. In terms of consumption, the Auckland Electric Power Board is the largest with 3426 GWh in the 1986–87 financial year and the smallest is Bluff Borough Council with 17 GWh.
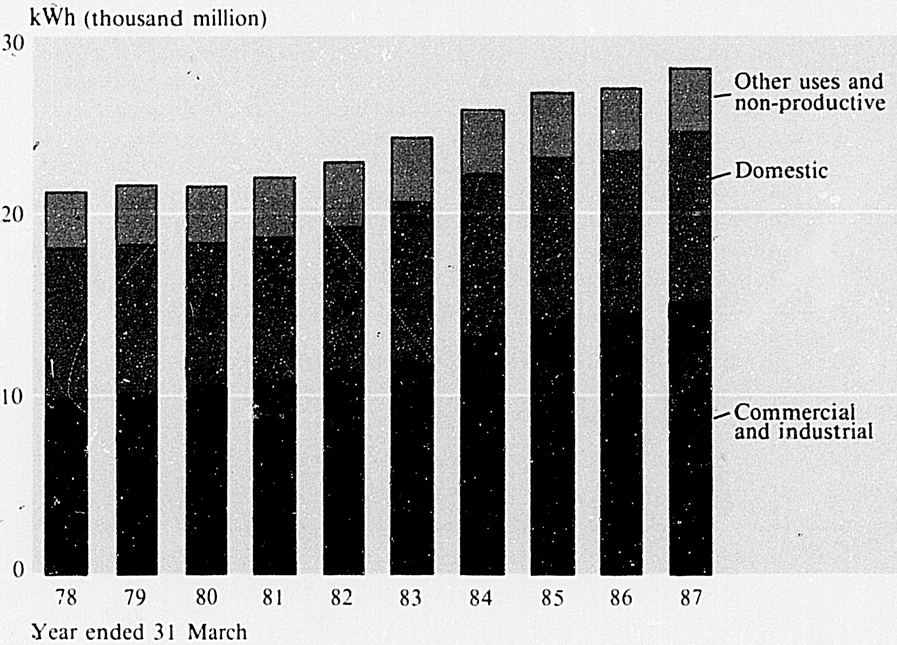
ELECTRICITY GENERATION
The income per kWh sold in 1986–87 was, by categories: domestic 6.658 cents; commercial 10.290 cents; industrial 4,929 cents; farming 10.665 cents; public lighting 8.801 cents; railway traction 11.319 cents; and urban traction 10.040 cents.
Table 17.13. SUMMARY OF ELECTRICITY INDUSTRY, 1987*
| Item | Unit | Year ended 31 March |
|---|---|---|
* Includes the Electricity Division of the Ministry' of Energy. † ‘In-situ maximum’ rating. ‡ Electricity Division only. § Includes starting oil. || Excluding stocks of materials. Source: Ministry of Energy. | ||
| Generating stations | no. | 96 |
| Capacity of generators† | kW (000) | 7435 |
| Fuel used‡— | ||
| Coal | tonnes | 241979 |
| Light oil§ | tonnes | 2685 |
| Heavy oil | tonnes | 3755 |
| Natural gas | terajoules | 51627 |
| Staff employed | no. | 16388 |
| Capital expenditure (less provision for depreciation)||— | ||
| During year (net outlay) | $(m) | 484.2 |
| To date | $(m) | 5388.8 |
| Generation and sales— | ||
| Generation per head of mean population | kWh | 8576 |
| Retail sales per head of mean population | kWh | 7719 |
| Domestic consumption per domestic consumer | kWh | 7670 |
| Income from total retail sales of electricity per kWh sold to consumers | cents | 6,723 |
Local hydro. Twenty-six supply authorities run small generating schemes ranging in output from 0.2 MW to 53 MW. They accounted for 4.1 percent of the nation's electricity needs in 1986–87, with a total capacity of 309 MW.
Rural Electrical Reticulation Council. The council has the responsibility of providing annual subsidies towards the cost of supplying electricity to areas which could not by themselves meet the expense of reticulation. These subsidies are funded by an annual levy on electricity sales. The council subsidises not only distribution lines but also private generating sets when these are a more economical alternative.
Although most of the country is reticulated with electricity, there are still a few areas which are not, such as the off-shore islands and remote rural districts.
An important development was the introduction of the revised Electricity Supply Regulations in 1984, which changed the basis on which supply authorities and consumers share the cost of mains supply. They also replaced an earlier guarantee system with new rules covering uneconomic supply.
In 1986–87 subsidy payments to 29 power boards and 41 private generating set owners totalled $1.5 million. A subsidy of $0.8 million was approved for a central generating plant which now supplies Stewart Island consumers.
Primary production of oil and gas in New Zealand originates from the following mining licences: Kaimiro and McKee (Petrocorp) and Kapuni and Maui (Shell/BP/Todd and Petrocorp's Offshore Mining Ltd). Condensate and lpg are produced from Maui and Kapuni by Shell/BP/Todd and the Natural Gas Corporation of Petrocorp (NGC); the latter also produces carbon dioxide from Kapuni gas. All of these licences are in the Taranaki region.
Processing. A little over one-third of New Zealand's net petrol needs are derived from the jointly-owned synthetic petrol plant at Motunui, 75 percent of which is owned by the Government, the balance by Mobil Corporation. The balance is produced at the Marsden Point Refinery owned by BP/Europa, Mobil, Shell and Caltex, with a 30 percent non-oil-company shareholding. The main refinery feedstocks are indigenous condensate and crude oil, and various imported oils.
Distribution. About 40 percent of total oil supply is distributed through the refinery-owned Auckland pipeline linking Marsden Point and Wiri in South Auckland. The balance is distributed by coastal tankers chartered by four large wholesalers.
Wholesaling and retailing. At the main ports, and at Wiri, products are stored in wholesaler tankage, and each wholesaler distributes by road tanker to retailers and bulk customers. These activities have in the past been licensed, but, with deregulation, several changes are expected.
Before the 1970s virtually all the of New Zealand's oil supplies were imported. The major development in petroleum supply during that period was the establishment of New Zealand's only refinery at Marsden Point, which commenced operations in 1964. This refinery initially used only imported feedstocks.
From the early 1970s a growing volume of locally produced crude oils has been included in the feedstock slate of the Marsden Point refinery; and now make up about 30 to 40 percent of the refinery's intake. These local crude oils consist of the condensates associated with the gas offtake from the Kapuni and Maui fields, and crude oils produced from Petrocorp's onshore Taranaki fields—especially the McKee field.
The other major local production of petroleum fuel takes place at the Motunui synthetic gasoline plant in Taranaki. This plant uses Maui natural gas to make a gasoline which could be used immediately in some motor vehicles, but which needs some further processing to be suitable for vehicles with high compression motors. Its production equates to around 35 percent of New Zealand's petrol consumption.
The original expectation was that the expanded Marsden Point refinery, which came fully on stream early in 1987, together with the Motunui synthetic gasoline plant, would supply all of New Zealand's petroleum fuel needs apart from the small amount of aviation gasoline which has to be imported for piston-engined aircraft. With account taken of local feedstock used at the refinery, this would have led to around 50 percent of New Zealand's petroleum fuel consumption being locally sourced.
However, as synthetic fuel is, effectively, sold to the highest bidder, it has often been exported and refined gasoline imported from overseas to replace it. There has always been some export of refined petroleum products from New Zealand in the form of supply to international shipping and aircraft. Currently, use of the expanded refinery is being maximised, resulting in refined product exports of about 10 to 15 percent of the volume of local consumption.
Oil refinery. In most years since the Marsden Point refinery commenced operation in 1964 it has produced all local consumption of bitumen, and of the fuel (or furnace) oils needed for industry, power generation and shipping. It has also produced most of the local consumption of gasoline (petrol) and of diesel. In most years before the expansion came fully on stream the petrol produced at Marsden Point was about 75 percent of local consumption and the diesel was about 60 percent. Since early 1987 virtually all the consumption of diesel and kerocene (including jet aircraft fuel) has come from Marsden Point. However, the refinery cannot meet all New Zealand's demand for petrol. The expansion was given a bias towards diesel and jet fuel rather than towards petrol because of the petrol available from Motunui. The refinery has the capacity to process (raise the octane level) of Motunui's production, and supply all New Zealand's petrol consumption in conjunction with the Motunui plant.
The Marsden Point refinery has always acted as a seller of the refining service. It has never purchased crude or sold refined product. Its clients have always been oil marketing companies—BP, Caltex, Mobil and Shell, which in combination own approximately 70 percent of the shareholding in New Zealand Refining Company. The other 30 percent shareholding was initially held by the New Zealand public, but most of this portion has now been acquired by Petrocorp.
Distribution and retailing. From the late 1930s until May 1988 the selling of petrol in New Zealand has been an industry licensed by government. Initially this was part of an overall industry licensing scheme introduced by the Labour government of 1935–49.
From the early 1950s there was a world-wide trend for oil companies to take over the ownership of petrol retailing sites and require their lessee retailers to market only their own brand of fuel. Prior to this, it was common for retailers to sell more than one brand of petrol. Therefore in the mid 1950s, when the general industrial licensing scheme was being phased out, a special licensing system for petrol marketing was introduced. This was done mainly to protect Europa, the then New Zealand-owned oil company, from being outbid by the international oil companies in the purchase of petrol retailing sites.
A licence was required to wholesale or retail petrol, and the system aimed to keep wholesaling and retailing under separate ownership and to limit the financial involvement of wholesalers in the retailing sector. This was done through the conditions attached to licences. Licensing applied to petrol only and not to other petroleum fuels. Nevertheless, it had effects on the marketing of other fuels also. A major effect, due to the way in which licensing was de facto administered rather than to the structure of the licensing system, was that there were no new entrants into the bulk supply and wholesaling area for petroleum products generally. The only large companies marketing petroleum fuels were BP, Caltex, Europa, Mobil and Shell. During the 1970s Europa passed into the ownership of BP, thus leaving effectively only four major petroleum fuel companies.
Deregulation of the petroleum industry. In addition to the licensing control over the wholesaling and retailing of petrol, there were for many years controls over the wholesaling of petrol, automotive grade diesel, and the two major grades of fuel oil used in industry. In the case of petrol, wholesale prices were controlled on a minimum as well as on a maximum basis, so that discounting was illegal. There was also an understanding between the Government and oil companies that the latter would maximise their use of the Marsden Point refinery in obtaining their fuel supplies, and would import in a refined state only those fuels which the refinery was unable to supply. This understanding had been strengthened and formalised prior to the expansion of the refinery. On its part, the Government gave undertakings which effectively guaranteed refinery expansion loans, of over $2,000 million, would be repaid to international bankers.
Deregulation involved the removal of all price controls, all licensing controls imposed by the Government, and the exposure of the Marsden Point refinery to the possibility of competition from the import of refined products. This latter factor was of prime importance because, without it, the New Zealand Refining Company may have been able to take advantage of its monopoly.
Competition could come from refined-product Imports made by existing oil companies, or from the establishment of new oil marketing companies not associated with the refining company. The latter possibility was related to the issue of licensing controls. While it was necessary to expose the refinery to competition in order to obtain the full benefits of deregulation, it was also necessary to ensure the repayment of the expansion loans was not jeopardised, and that the refinery then had a reasonable chance to remain viable.
Early in 1988 an agreement concerning the future of the refinery was reached between the Government and the four oil companies, which are the refining company's major shareholders and customers. The Government would take responsibility for all of the refinery's outstanding expansion loans for which it had been making the payments on an interim basis since October 1986. Most of the loan takeover is in the form of a grant. However, $400 million is by way of a suspensory loan from the Government to the refining company, to be written off after five years, but to become repayable (on a reducing scale) should the sale of the refinery take place during that period. Furthermore, to assist the refining company to compete, the Government would pay it a grant of $85 million over a three year period commencing in August 1988.
This agreement opened the way to full deregulation in May 1988. This meant the removal of the maximum price control on petrol and the requirement for a licence from the Government to wholesale or retail petrol. Minimum price control on petrol and maximum price control on diesel and fuel oils was removed, respectively, in February and July 1987.
Many of the sedimentary basins around New Zealand have long been recognised as having the potential to contain reserves of oil and gas. Commercial hydrocarbon discoveries have been made in the last 30 years and there are now major gas-condensate and oil producing fields (Kapuni, Maui, McKee and Kaimiro) in Taranaki. Petroleum exploration and development is regulated by the Ministry of Energy, and prospecting and mining licences are necessary for exploration and exploitation respectively. At mid-1988 there were eight petroleum mining licences for the Taranaki Basin region, one offshore and seven onshore.
Since 1985 a vast acreage has been advertised for exploration under block offers, and many new petroleum licences have been taken up. Advertised blocks are located in various sedimentary basins including offshore and onshore Taranaki, offshore and onshore on the east coast of the North and South Islands, onshore North Wanganui Basin, and onshore Northland. Many parts of New Zealand's potentially hydrocarbon-bearing basins have yet to be fully evaluated, and the prospects are by no means exhausted.
Previous exploration data are available from the New Zealand Geological Survey, a division of the Department of Scientific and Industrial Research.
Natural gas in New Zealand is largely confined to the North Island. There are currently four gas fields in production: Kapuni, Maui, McKee and Kaimiro. The largest of the four is the offshore Maui field which, in conjunction with Kapuni, supplies most of New Zealand's gas.
Distribution network. Gas production in New Zealand is centred in and around the region of Taranaki, both onshore and offshore. A pipeline network extends to Wellington, in the south, and to Whangarei in the north. It also extends to the east coast, at Hastings and Gisborne, and the recent completion of the line to Taupo has delivered gas further into the central North Island.
Nearly all of the gas pipeline network is owned by the Natural Gas Corporation, which is a subsidiary of the Petroleum Corporation of New Zealand—the major exception being the Maui Development Limited pipeline from Oaonui to Huntly. There are other short pipelines owned by various companies, but these tend to be operated by the Natural Gas Corporation.
Downstream industries. About a third of the gas produced in New Zealand is used by the New Plymouth, Huntly and Stratford power stations to produce electricity. Another third goes into the production of gasoline at the synthetic fuel plant at Motunui, and about 12 percent is used to produce methanol at Waitara. The remaining gas is used by domestic and industrial consumers. Domestic users, although constituting a large number, only use about 2 percent of gas produced. Industrial and commercial users use about 25 percent, the building industry and secondary production, in the form of dairy factories, pulp and paper mills and freezing works, making up a large proportion of this group. The ammonia-urea plant at Kapuni is another large user, but this uses solely Kapuni gas.
Consumption patterns and trends. Natural gas production has increased from 88 PJ in 1983 to 175 PJ in 1986 and levelled off in 1987.
New Zealand's mineral resources are diverse, but mining is generally on a small scale. Coal, ironsand, clays, and sand and gravel for construction are the main minerals mined. Total production of non-metallic minerals (excluding coal) in the 1986 calendar year was valued at about $217 million, while metallic minerals totalled about $68 million. Mineral production for 1985 and 1986 (the latest years for which figures are available) is summarised in table 17.15.
New Zealand's coal producers include those in the private sector and the state-owned Coal Corporation of New Zealand. Coalcorp is the major producer, with 15 mines which produce approximately 66 percent of all coal mined—the remaining 34 percent is produced by some 53 smaller, privately-owned mines.
Coal occurs widely in New Zealand. The major areas of coal formation have been divided into seven coal regions (Northland, Waikato, Taranaki, Nelson-Westland, Canterbury, Otago and Southland) with the major coal producing regions being Waikato, Westland and Southland.
The more important producing coalfields, with the class of coal found in each are:
Bituminous—Greymouth, Buller, Garvey Creek.
Sub-bituminous—Maramarua, Huntly, Rotowaro, Ohai.
Lignite—eastern Southland.
Other coalfields which will become major producers are Waikare, (sub-bituminous), Mokau (sub-bituminous) and, potentially, those of Central Otago (lignite) and Kaitangata (lignite).
New Zealand coals are young by world standards (15–75 million years) and the geological conditions allowed coal formation to continue to the present day (for example, peats in the Waikato). Coals of this age and bituminous rank, as occur in Westland, are not common and are only found in countries such as Japan and New Zealand which have an active geological environment.
The young age of New Zealand's coking grade coals has given rise to some valuable properties which, together with low to exceptionally low ash contents, makes them attractive to world markets. The active geological history during the time of coal formation and since has, however, resulted in difficult mining conditions.
New Zealand's recoverable coal resource consists mainly of lignite (82 percent). Sub-bituminous resources make up 14 percent, and bituminous resources less than 4 percent. This is in contrast to current production, of which lignite is 10 percent, sub-bituminous, 70 percent, and bituminous, 20 percent.
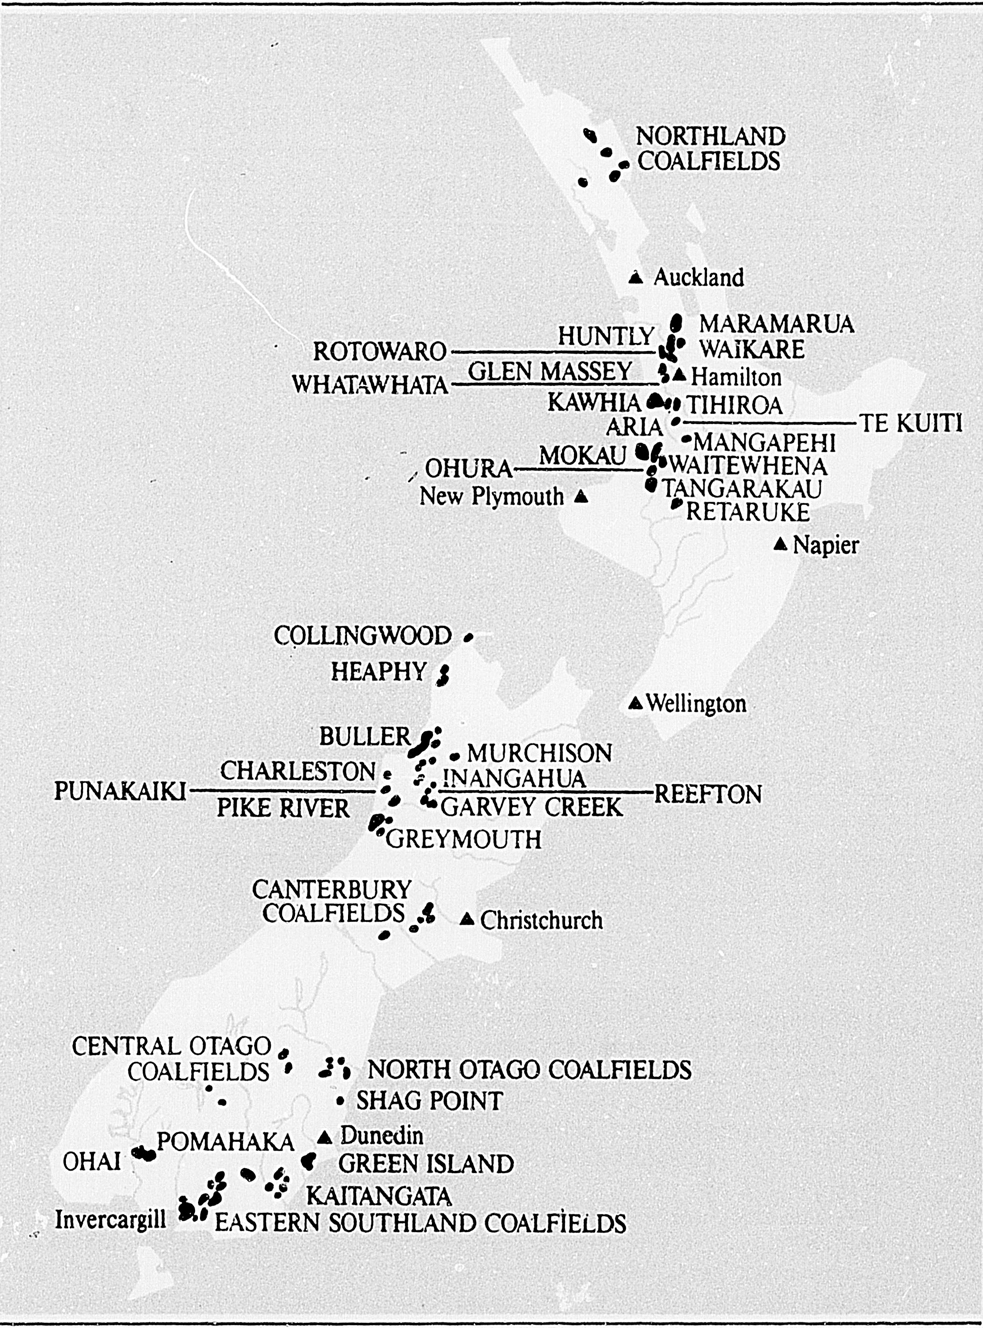
COALFIELDS
Prospecting regulations. Legislative control of mineral production is contained in the Mining Act 1971 (with amendment), the Coal Mines Act 1979, the Iron and Steel Act 1959, the Quarries and Tunnels Act 1982, the Atomic Energy Act 1945, and the Continental Shelf Act 1964. The administrative agency is the Resource Management and Mining Group of the Ministry of Energy.
Table 17.15. MINE AND QUARRY PRODUCTION
| Mineral | 1985* | 1986* | ||
|---|---|---|---|---|
| Quantity | Value | Quantity | Value | |
* Year ended 31 December. † Kilograms Source: Ministry of Energy. | ||||
| tonnes | $ | tonnes | $ | |
| Fuels— | ||||
| State coal | 1603927 | .. | 1745581 | .. |
| Private coal | 942040 | .. | 771448 | .. |
| Metals— | ||||
| Gold | 886,468† | 17,661,815 | 1265,454† | 27,238,555 |
| Iron ore | 3259 | 13,633 | 2086 | 12,600 |
| Ironsand concentrate | 2533203 | 46,034,255 | 2599 | 40,494,680 |
| Tungsten ore (scheelite) | 14,433 | 127,247 | 0.250 | 1,750 |
| Non-metals— | ||||
| Bentonite | 7400 | 345,530 | 3140 | 600,238 |
| Clay for bricks, tiles | 183004 | 564,716 | 104532 | 333,488 |
| Clay for pottery, etc. | 24471 | 4,823,628 | 28464 | 500,466 |
| Dimension stone | 39044 | 1,518,289 | 64153 | 1,238,982 |
| Dolomite for agriculture | 11885 | 91,199 | 9555 | 382,000 |
| Dolomite for industry | 11885 | 91,200 | 9555 | 382,000 |
| Greenstone | 12.30 | .. | 6,037 | .. |
| Limestone and marl for cement | 1738188 | 5,591,153 | 1012022 | 4,880,407 |
| Limestone for agriculture | 1240976 | 11,828,035 | 723172 | 7,079,082 |
| Limestone for industry | 269328 | 2,208,103 | 257606 | 3,180,802 |
| Limestone for roads | 392855 | 2,494,525 | 430029 | 2,459,359 |
| Pumice | 81713 | 409,356 | 43771 | 416,694 |
| Rock for reclamation | 1912987 | 6,819,245 | 2026836 | 8,990,390 |
| Sand for industry | 406965 | 2,095,838 | 472362 | 3,258,668 |
| Sand, rock for building | 6046773 | 42,561,875 | 7087270 | 64,622,344 |
| Sand, rock for roads and ballast | 17891866 | 97,208,757 | 16742999 | 117,392,709 |
| Serpentine | 44759 | 740,008 | 22362 | 466,165 |
| Silica sand | 143442 | 1,593,256 | 114189 | 1,321,108 |
| Sulphur | 294 | 82,326 | 2389 | 146,471 |
Iron. New Zealand's largest resource of potential iron ore is the black sands of the west coast beaches, from Westport south in the South Island and from Wanganui to Muriwai in the North Island. Titanomagnetite sands make up most of the black sands in the North Island, but from Waikato Heads northwards, the beach deposits also contain ilmenite in varying proportions. In the South Island beach sand ilmenite is the chief iron-bearing material. These beach sands have been estimated to contain some 800 million tonnes of titanomagnetite, with a further 8.6 million tonnes of ilmenite in the North Island, and 43 million tonnes in the South Island.
New Zealand Steel Limited operates a smelter using ironsand deposits from the north head of the Waikato River. The steelworks employs a locally developed process whereby titanomagnetic sands can be economically smelted on a large scale to produce a good grade of steel. Slag from the steel contains vanadium and titanium. The vanadium is extracted. The company also mines and exports ironsands.
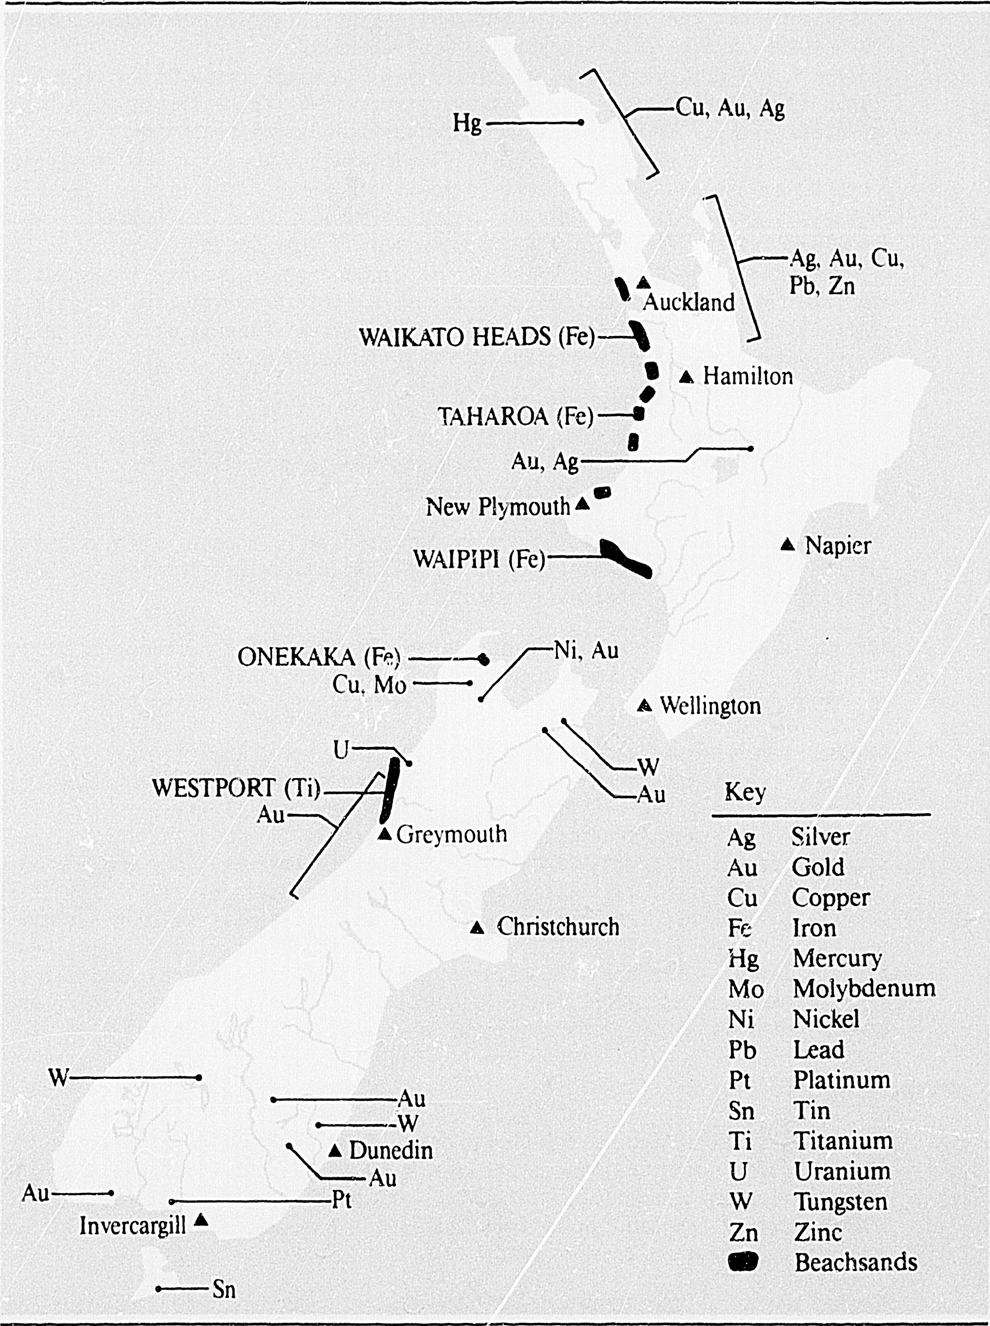
METAL MINING AND PROSPECTING; Past and present
Gold. Gold occurs as alluvial gold in streams, rivers, and gravels, mainly in the South Island, as lode gold in quartz veins, and as disseminated gold, finely dispersed in some volcanic rocks.
The hard rock forms of gold can be mined by underground as well as opencast methods. Most present day New Zealand goldmining is of alluvial gold.
International gold prices make re-examination of bypassed areas and the tailings of former workings attractive. Past gold-producing areas of New Zealand are currently being reassessed using modern prospecting techniques and refined geological concepts.
The main areas of interest for gold in the North Island are Northland, the Coromandel Peninsula and the central volcanic zone. In the South Island, the main areas of interest for alluvial gold are Marlborough, north-west Nelson, Westland, Central Otago and west Southland. In 1986 a total of 1265 kg of gold was recovered in New Zealand.
There are at least 100 small land-based or pontoon-mounted washing plants fed by hydraulic diggers working on the West Coast and in Otago. This number is increasing as more mining licences are granted. In addition, the black-sand mining operations on the West Coast beaches are of considerable interest to small-scale miners.
Silver. In the North Island, silver almost always occurs with gold in various proportions. The Hauraki goldfield has produced most of the silver mined in New Zealand. Silver has been found at Puhipuhi in Northland, north-west Nelson, south Westland and Central Otago, and most of these areas are being prospected.
Tungsten. The principal ore of tungsten in New Zealand is scheelite, which occurs in difficult mining conditions. It is mined on a small scale in Otago and Marlborough, but is being evaluated for potential larger-scale mining.
Ilmenite sands. Beaches south of Greymouth contain ilmenite reserves and are currently subject to prospecting and development proposals. The main use of ilmenite is as a source of titanium dioxide, used as a pigment in paint, paper, plastics, and rubber.
Other metallic minerals. There are small deposits of manganese in many localities. Uranium occurs in Westland but reserves have never been fully assessed. Some areas of Northland, Coromandel, Nelson, and Westland have potential for base metals (copper, lead, and zinc) but there is little prospecting. Iron ore, antimony, arsenic, chromium, monazite, nickel and rutile have been mined in the past and some are presently being investigated. Tin is known on Stewart Island, where less than one tonne has been mined. The aluminium ore, bauxite, is found in Northland where 20 million tonnes have been indicated by the DSIR. Molybdenite occurs in north-west Nelson but awaits full assessment. Cinnabar, the principal ore of mercury, is widely distributed in New Zealand and was produced in limited quantities from sinter deposits in Northland. Interest in platinum mining in New Zealand is increasing and several companies are prospecting in Nelson, south Westland and Southland.
Aggregates. The term ‘aggregates’ is used to describe a variety of rocks, gravels and sands. They are found throughout New Zealand and are usually mined by small operators to supply local needs. Hundreds of firms from Kaitaia to Invercargill extract more than 26 million tonnes of aggregates, worth more than $190 million, annually. Major uses are for reading, reclamation and construction.
Clays. Clays are found throughout New Zealand and include bentonite, halloysite and kaolin. They are used in the manufacture of bricks, tiles, pipes and pottery, and as fillers in the manufacture of paper, paint, pharmaceutical and animal health products. Nearly 133000 tonnes of clays, worth about $800,000 was extracted in New Zealand in 1986.
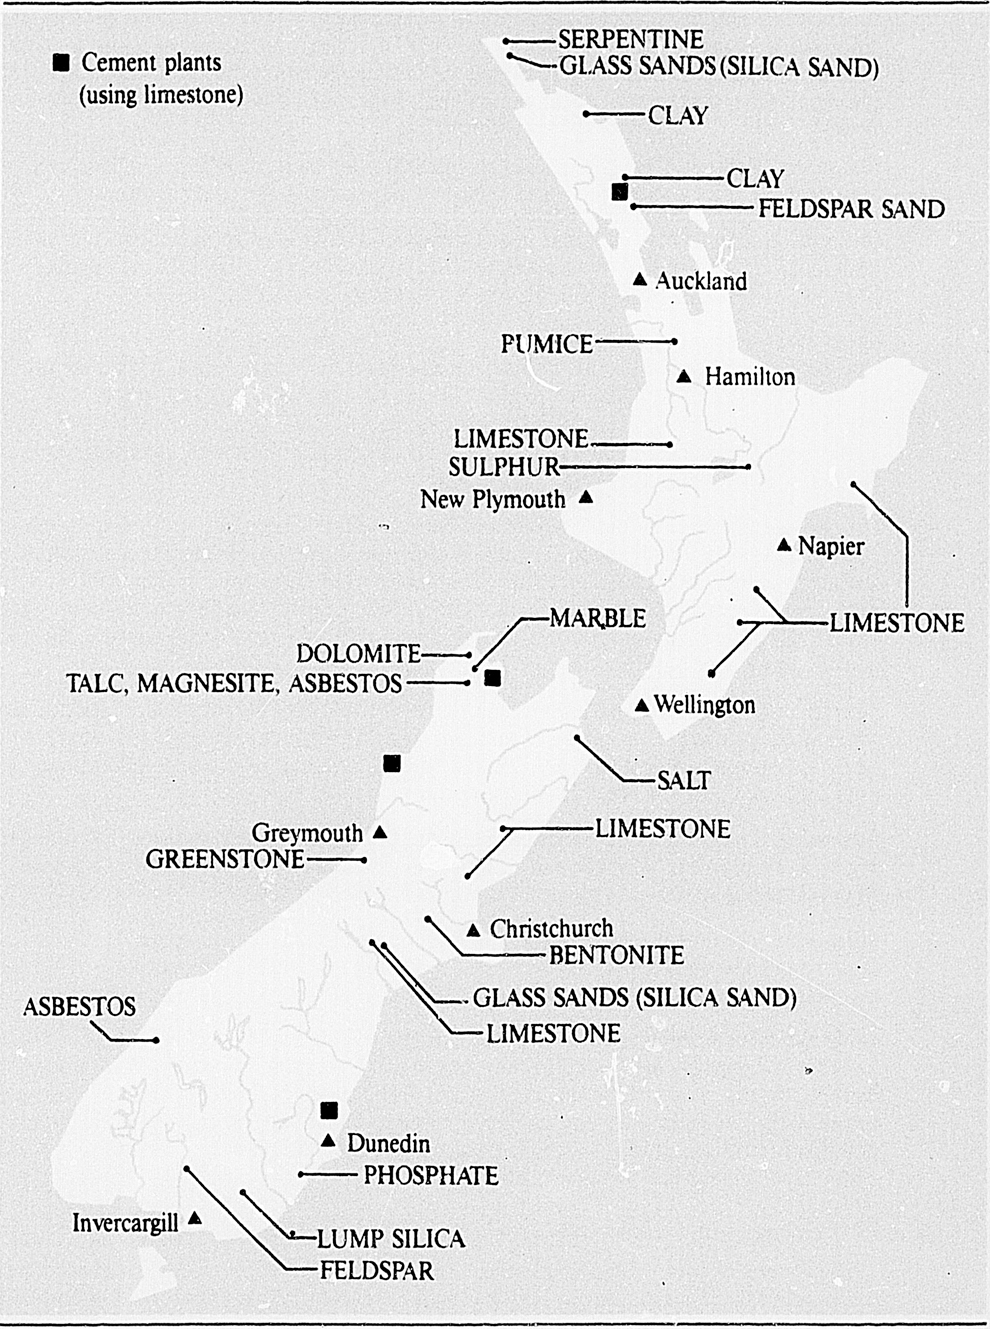
NON-METALLIC MINERALS
Bentonite—Bentonite is used as a bonding agent and for ‘drilling mud’. It is found in Hawke's Bay and in substantial quantities in Canterbury. The latter is finely ground and processed into pellet form for bulk export and milled for local and overseas markets. Although bentonite is still being imported for drilling operations because long established and reliable overseas sources are often preferred, New Zealand bentonite is now being used as well.
Halloysite—Halloysite has been mined in Northland for more than 30 years. It is used in New Zealand and exported for use as industrial fillers and in the ceramic industry.
Dolomite. Dolomite rock is found near Collingwood. It is used in agriculture and home gardening and shipped to Whangarei for use in glassmaking. About 19000 tonnes are extracted each year, and in 1986 this was worth around $764,000.
Greenstone. Nephrite, popularly known as ‘greenstone’, occurs in north Westland. At present the main source is a deposit of greenstone boulders in Olderog Creek, a tributary of the Arahura River. The boulders are reduced in size by a portable diamond trepan saw and airlifted by helicopter.
The best known occurrences of bowenite, the serpentine variety of greenstone, are in Fiordland and are currently being prospected.
Limestone. Limestone is found throughout New Zealand. More than 50 firms mine about 2.4 million tonnes, worth about $18 million each year. Limestone is used in cement manufacture, roading, pottery and agriculture. High-quality limestone from Te Kuiti and Nelson is processed for export. Limestone is also used in New Zealand as a filler in the paint, glass, rubber, plastic and paper industries Marble, a pure form of limestone, is mined in Nelson. It is used as a filler and in building construction.
Salt. At Lake Grassmere in Marlborough, salt is produced by the solar evaporation of sea water. Low rainfall, long hours of sunlight and the right wind conditions make this locality the most suitable in New Zealand for salt production. About 60000 tonnes is produced each year for New Zealand consumption.
Serpentine. Serpentine is a magnesium-rich rock used as a fertiliser additive. Deposits are mined at Piopio near Te Kuiti and Collins Valley, and at Mossburn in the South Island. About 22000 tonnes, worth about $466,165, was mined in 1986.
Silica sand. Northland, North Auckland, Nelson and Canterbury have deposits of silica sand. About 114000 tonnes, worth over $1.3 million, are mined each year for use in glass manufacture, foundries and the building industry.
Other non-metallic minerals. The following non-metallic minerals, some of which have been mined in the past, are also found in New Zealand. They are diatomite (industrial filtration), barite (industrial uses include glassmaking and fillers), asbestos (building material), feldspar (glassmaking, ceramics, enamels), magnesite (used in agriculture), mica (used in electronics), phosphate (fertilizer), and wollastonite (insecticide, paper and plastics production). Pumice, perlite, and sulphur are also extracted at present.
The Census of Mining and Quarrying formed part of the series of integrated economic censuses of business activities in New Zealand, conducted by the Department of Statistics over a five-year cycle until 1985. The 1983–84 census covered all operations carried out by activity and ancillary activity units in the mining and quarrying industry during the year ended 31 March 1984 (those with different balance dates submitted data for the year ended within the period 1 April 1983 to 31 March 1984).
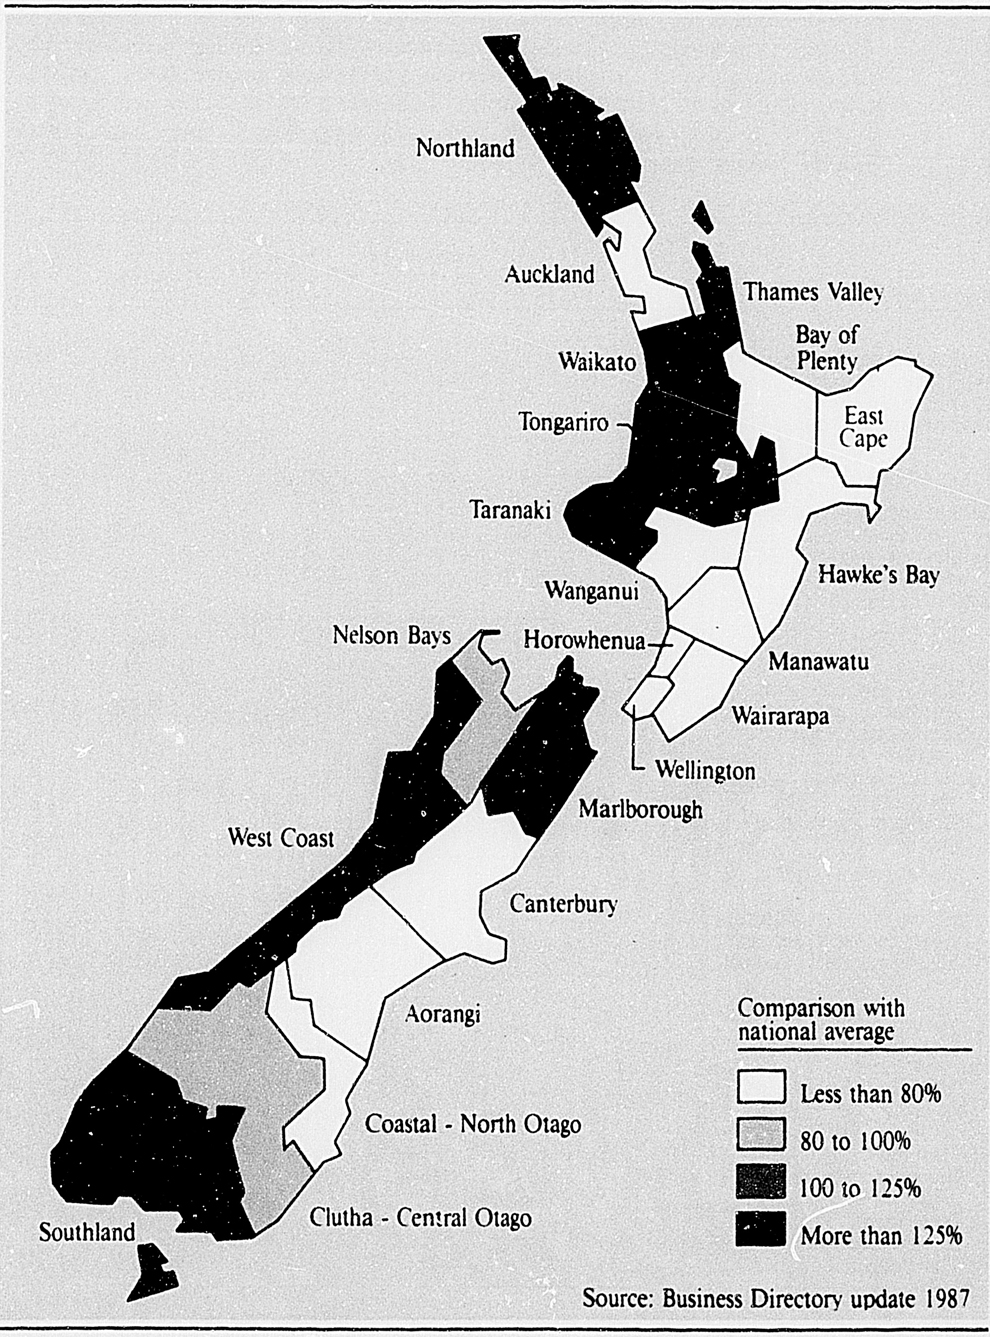
Percentage of workforce employed in MINING AND QUARRYING
All activities from exploration or production to the point at which the goods are sold are within the scope of the census.
The tables which follow give 1983–84 census totals by the four industry divisions and by local government regions. Definitions of terms used in the tables are given in the glossary at the end of this book. More recent statistical information on the mining and quarrying industry will be published as part of the 1986–87 Economy Wide Census—volumes from which will become available during 1989.
Table 17.16. SUMMARY OF CENSUS OF MINING AND QUARRYING 1983–84
| Statistical item | Coal mining | Petroleum and gas production and exploration | Metal ore mining, exploration and prospecting | Other mining and quarrying activities | Census totals |
|---|---|---|---|---|---|
| * Includes capitalised salaries and wages amounting to $5,563,000. | |||||
| number | |||||
| Activity and ancillary units | 72 | 46 | 62 | 344 | 524 |
| Working proprietors/partners at end of February 1984 | 61 | 2 | 40 | 153 | 256 |
| Paid employees at end of February 1984 | 1720 | 1114 | 373 | 1685 | 4892 |
| $(000) | |||||
| Salaries and wages paid to working proprietors/partners | 311 | − | 130 | 2,217 | 2,659 |
| Salaries and wages paid to employees* | 32,921 | 29,719 | 6,766 | 27,312 | 96,718 |
| Stocks: (including work in progress) | |||||
| opening | 46,261 | 36,527 | 3,944 | 11,635 | 98,367 |
| closing | 60,952 | 37,887 | 3,201 | 12,070 | 114,111 |
| Income: | |||||
| Sales of mined or quarried products |  100,659 100,659 | 597,238 | 58,714 | 138,348 | 874,402 |
| Sales of other products and services | 10,477 | 31,034 | |||
| Direct government cash grants and other subsidies | 1,315 | 123,764 | 577 | 276 | 59,243 |
| Other income (excluding interest, etc.) | 4,574 | 71,264 | |||
| Sales and income (excluding interest, etc.) | 101,974 | 721,002 | 59,291 | 153,675 | 1,035,943 |
| Interest, dividends, donations, royalties, patent fees and insurance claims received | 449 | 33,015 | 2,051 | 1,050 | 36,565 |
| Total sales and other income (including interest, etc.) | 102,424 | 754,018 | 61,342 | 154,725 | 1,072,508 |
| Expenditure: | |||||
| Purchases of fuel and power | 3,579 | 5,127 | 3,721 | 15,373 | 27,801 |
| Purchases of all other materials and supplies, including goods for resale | 8,233 | 89,533 | 2,040 | 21,122 | 120,929 |
| Salaries and wages paid to employees | 31,620 | 25,627 | 6,692 | 27,215 | 91,155 |
| Depreciation | 4,958 | 33,259 | 3,379 | 9,156 | 50,752 |
| All other expenses (excluding interest, etc.) | 75,138 | 366,634 | 33,650 | 59,204 | 534,626 |
| $(000) | |||||
| Operating expenditure (excluding interest, etc.) | 123,529 | 520,181 | 49,482 | 132,070 | 825,264 |
| Interest, bad debts, donations, royalties and patent fees | 24,212 | 26,241 | 2,146 | 6,620 | 59,219 |
| Total expenditure (including interest, etc.) | 147,741 | 546,422 | 51,628 | 138,690 | 884,482 |
| Net profit after deducting working proprietors and partners salaries and wages | −30,938 | 208,956 | 8,840 | 14,253 | 201,111 |
| Operating surplus | − 6,864 | 202,181 | 9,066 | 22,040 | 226,423 |
| Value added | 37,082 | 251,072 | 19,899 | 60,665 | 368,719 |
| Fixed tangible assets: | |||||
| Additions to | 26,203 | 29,888 | 3,582 | 16,501 | 76,173 |
| Disposals of | 518 | 594 | 1,086 | 4,053 | 6,252 |
Table 17.17. REGIONAL SUMMARY, CENSUS OF MINING AND QUARRYING 1983–84
| Local government regions | Enterprise groups | Enterprises | Activity units | Ancillary activity units | Persons engaged end February | Salaries & wages paid to employees* | Total sales & income | Additions to fixed tangible assets |
|---|---|---|---|---|---|---|---|---|
* Includes capitalised salaries and wages amounting to $5,563,000. † As some enterprise groups and enterprises have activity units in more than one local government region totals do not sum. | ||||||||
| no. | no. | no. | no. | no. | $(000) | $(000) | $(000) | |
| Northland | 43 | 43 | 56 | − | 235 | 3,022 | 20,669 | 1,351 |
| Auckland | 41 | 50 | 58 | 4 | 338 | 5,939 | 35,646 | 3,430 |
| Thames Valley | 14 | 17 | 18 | 2 | 169 | 2,237 | 9,936 | 1,596 |
| Bay of Plenty | 8 | 8 | 8 | − | 59 | 801 | 4,465 | 255 |
| Waikato | 38 | 39 | 50 | 4 | 1154 | 21,662 | 111,674 | 13,735 |
| Tongariro | 8 | 8 | 8 | 2 | 43 | 602 | 3,552 | 1,410 |
| East Cape | 5 | 5 | 7 | 1 | 39 | 570 | 2,355 |  510 510 |
| Hawke's Bay | 12 | 13 | 13 | − | 106 | 1,685 | 8,432 | |
| Taranaki | 18 | 19 | 22 | 1 | 985 | 25,749 | 204,319 | 7,972 |
| Wanganui | 12 | 12 | 12 | − | 22 | 316 | 2,004 | 294 |
| Manawatu | 8 | 10 | 9 | 1 | 34 |  584 584 |  2,403 2,403 |  632 632 |
| Horowhenua | 2 | 2 | 3 | − | 12 | |||
| Wellington | 32 | 44 | 40 | 5 | 386 | 8,204 | 548,633 | 25,750 |
| Wairarapa | 10 | 10 | 11 | - | 50 | 745 | 3,844 | 488 |
| Total, North Island | 225 | 266 | 315 | 20 | 3632 | 72,116 | 957,930 | 57,425 |
| Nelson Bays | 18 | 20 | 20 | − | 72 | 845 | 4,335 | 290 |
| Marlborough | 9 | 9 | 9 | 1 | 67 | 1,397 | 8,212 | 844 |
| West Coast | 52 | 54 | 61 | 1 | 706 | 11,630 | 37,947 | 10,244 |
| Canterbury | 17 | 18 | 20 | 3 | 90 | 1,330 | 5,348 | 280 |
| Aorangi | 11 | 12 | 14 | − | 59 | 767 | 3,123 | 468 |
| Clutha—Central Otago | 22 | 22 | 23 | 1 | 49 | 483 | 3,639 | 302 |
| Coastal—North Otago | 10 | 10 | 10 | − | 83 | 1,216 | 5,350 | 1,079 |
| Southland | 21 | 21 | 26 | - | 390 | 6,934 | 46,624 | 5,242 |
| Total South Island | 148 | 159 | 183 | 6 | 1516 | 24,603 | 111,578 | 18,748 |
| Total New Zealand† | 364 | 421 | 498 | 26 | 5148 | 96,718 | 1,072,508 | 76,173 |
Annual Statistics in Relation to Electric Power Development and Operation in New Zealand. Ministry of Energy.
Gas Sector Forecast and Plan 1985. Ministry of Energy.
Monthly Abstract of Statistics. Department of Statistics.
Report of the Ministry of Energy (Parl. paper D. 6).
Report of the New Zealand Gas Council (Parl. paper D. 7).
Annual Returns of Production from Quarries and Mineral Production Statistics. Ministry of Energy.
Census of Mining and Quarrying 1983–84. Department of Statistics.
The Geology of New Zealand. New Zealand Geological Survey, 1978.
Industrial Minerals and Rocks. Department of Scientific and Industrial Research, (annual).
Introduction to the Geology of the Coalfields of New Zealand. New Zealand Geological Survey, 1982.
Monthly Abstract of Statistics. Department of Statistics.
New Zealand Coal Reserves. Mines Division, Ministry of Energy, 1983.
Report of the Department of Scientific and Industrial Research (Parl. paper G. 21).
Report of the Ministry of Energy (Parl. paper D. 6).
Table of Contents
Fabricating an lpg tank, Christchurch.
Encouraged by government policies of the late 1950s and the 1960s, manufacturing in New Zealand developed on a broad front, initially to supply products formerly imported and moving later into the export market.
Since the early 1970s there has been a progressive liberalisation of access for imports through the staged removal of import licensing and, more recently, the implementation of a programme of tariff reductions. For certain industries—notably motor vehicles, textiles, footwear and plastics—import licensing and tariff changes have taken place under industry development plans for particular manufacturing sectors. Recent developments in tariff reform are described in section 22.1. Trade development.
Below is a brief description of some of the major secondary industries in New Zealand. Others, particularly some of the country's major export earners, such as meat processing and timber and forest products, are described in the relevant chapters, as are the energy-based industries.
Industry-based research and development is described in section 13.2.
Aluminium. New Zealand Aluminium Smelters Limited's primary aluminium smelter at Tiwai Point, near Bluff, is a significant producer of ingots, with a capacity of 244000 tonnes a year. The smelter is owned by Comalco Industries Pty Ltd of Australia (with an 80 percent shareholding) and the Sumitomo Aluminium Smelting Company Ltd of Japan (20 percent). The greater part of the metal production is exported to Japan and other Asian countries. Aluminium fabrication and foil manufacture, for products widely used in the building and packaging industries, is also carried out in New Zealand.
Electronics. The total value of production by the electronics industry for the year ended 30 June 1987 was $312.2 million, 35 percent of which was consumer products, 52 percent non-consumer products (including radio communications, line telephonic and telegraphic equipment) and 13 percent components production. The manufacture of colour television sets, accounting for over 25 percent of total industry production in 1986–87, has been the principal activity. The major non-consumer sector activity has been the manufacture of line telephonic and telegraphic apparatus, accounting for over 21 percent total industry production in 1986–87. Non-consumer products have traditionally provided by far the major part of the industry's exports.
The Electronics Industry Development Plan, which began in January 1984, has determined the level and type of assistance for the industry over recent years. The plan was reviewed in 1986. As a result, import licensing protection on all electronic products has been completely removed and tariff rates above 25 percent are being phased down annually to cease by 1 October 1990. Two other forms of assistance directed at this industry, the Prototype Development Fund and the Electronics Industry Research and Development Grants Scheme, have both been terminated.
Engineering. The engineering sector involves skills and activities ranging from light manufacturing and metal-casting to the civil and heavy engineering fields. In the early 1980s demand from the construction phase of several major energy-based projects saw a period of considerable expansion, with a valuable spin-off in the development of new skills and techniques. More recently, the completion of these projects has brought about rationalisation, with many firms now actively pursuing export opportunities and the development of new products. Demand for skills and experience is still relatively high in the sector but there is regional variation.
Food and beverages. The food and beverage sector of the manufacturing industry is one of the longest established and largest, and collectively employs more than any other type of manufacturing, without consideration of meat processing or dairy factories. Along with the dairy and meat industries, other forms of food processing are also significant export earners.
Beverage manufacture is scattered throughout the country to supply local markets and, although this is also largely true of food processing, there is also considerable regional variation as primary industry has led to the development of different food processing industries such as canneries, packing houses and other manufacturing establishments.
A recent trend toward lowering duties and eliminating import licensing has not only meant an increasing range of goods available to consumers in New Zealand, but has also increased the level of competition faced by local food and beverage manufacturers. This pressure has in turn led to greater product specialisation amongst manufacturers and rationalisation (including mergers) has also occurred amongst some companies.
Motor vehicles. The first major unit of the motor vehicle assembly industry in New Zealand was established by the American company, General Motors in 1926. This plant assembled chassis and motor bodies, using some local materials. The establishment of three additional assembly plants in the mid-1930s provided a basis for component manufacturing to commence in 1939. This was fostered by certain parts, specifically upholstery materials and batteries, being excluded from importation for use in the assembly of vehicles. Following World War II several new plants commenced vehicle assembly and by 1950, tyres (including tubes) and radios had been added to the list of goods not allowed to be imported (mandatory deletions) for use in vehicle assembly. In 1958 radiators and undercarriage springs were added to the list.
During most of the 1950s and 1960s tight import restrictions limited the availability of both built-up and completely-knocked-down (ckd) vehicles. From the late 1950s local manufacture of a wider range of components was induced by the ability of franchise holders of vehicle marques not being assembled in New Zealand to obtain modest import licence entitlements for ckd packs. It was a requirement of these licences that assembly of the vehicles concerned incorporate specified locally-made components, in addition to those listed as mandatory deletions. In 1973, 16 of these components were added to the list of mandatory deletions thereby forcing long established assemblers to increase domestic content by sourcing these products locally.
The 1970s saw the number of separate car assembly plants grow from 10 to a high of 16, due primarily to the relaxation of restrictions on the importation of ckd packs. Since 1980 increased competition and the need to improve quality, especially in respect of corrosion protection and paint shop facilities, have led to some rationalisation and up-grading of assembly facilities. This process was reinforced by the introduction in December 1084 of the Motor Vehicle Industry Development Plan which exposed both assemblers and component manufacturers to increasing levels of import competition over the four years to 1988. By mid-1988 there were nine franchise holders assembling passenger cars in only seven separate plants.
In December 1987, following a review of the industry plan, the Government announced the removal of import controls from all automotive products from 1 January 1989 and a programme for reducing tariffs on both vehicles and components. These measures, together with eventual duty-free and unrestricted trans-Tasman trade in all automotive products, can be expected to mean further changes in the structure of the motor industry.
Plastics. The Plastics Industry Development Plan to 1990, implemented in 1982, encouraged the industry to use its resources as efficiently as possible by lowering the level of protection under which the industry operates. Pressures towards greater international cost comparability were intended to move the local industry to developing a sustainable base for export-led growth and greater capacity to service the domestic market. 1988 was the final year of the plan before the majority of goods become exempt from import licensing and the industry is now operating in a market place that is virtually free of import licensing.
Production in certain areas has been adversely affected by the liberalisation of import licensing and the impact of other industry plans. For example, special arrangements to encourage the export of cosmetics containers will cease to be of help now the cosmetics themselves can be imported freely. This has far reaching consequences for rigid plastic packaging companies, as many products are now being imported pre-packed. In general, however, plastics manufacturers have adapted well to increased import competition and there has been significant investment in new, automated plant and equipment.
A review of tariffs undertaken in 1986 as part of the Plastics Industry Development Plan resulted in the decision to lower all tariffs over 20 percent down to that figure, to be replaced at the conclusion of the plan by long-term tariffs set in accordance with decisions announced by the Minister of Trade and Industry in December 1987.
Steel. The two major enterprises in this industry are New Zealand Steel Ltd, established in 1970 to manufacture billet slabs and ingots from indigenous ironsands and coal and limestone resources, and Pacific Steel Ltd, established in 1960 to prepare wire rod, bars, angles and channels from scrap, but also subsequently using billet from New Zealand Steel Ltd's complex at Glenbrook, south of Auckland.
In 1980 New Zealand Steel commenced a large two-stage project to expand its iron and steel making capacity to about 750000 tonnes a year and to provide for hot and cold rolling mills to process some 550000 tonnes of slab. This facility will also enable the company to supply raw product to its previously established galvanising, colour-coating and pipe-making lines.
In 1986 New Zealand Steel was financially restructured, with the Crown expanding its shareholding to 90 percent. In 1987 this shareholding was sold to the publicly-owned company Equiticorp Holdings Ltd.
Textiles and footwear. Implemented on 1 July 1980, the Textile Industry Plan was intended to improve competitiveness and the exporting potential of the textile industry. It featured a liberalisation of access to materials, and increased imports of finished goods under the protection of a revised tariff structure. There were also specific financial incentives to encourage production efficiency in woollen mills. An apparel import licence tendering scheme established under the plan allowed a greater range of imported garments, with the aim of creating a more competitive environment for domestic manufacturers and greater consumer choice.
As part of its review of the Textile Industry Development Plan the Industries Development Commission in 1983 reported on the carpet sector, proposing measures for the controlled introduction into the New Zealand market of both imported and locally-made synthetic carpets. In 1986 a long-standing policy of encouraging the manufacture of wool-rich carpet was abandoned, following the breakdown of a carpet industry agreement to voluntarily restrain production of certain types of synthetic carpet for the domestic market.
Government decisions on the commission's recommendations for other textile industry sectors were announced in July 1985. These included: liberalisation of access for textile goods through the establishment of a textile licence tendering scheme; the exemption from import control of many textile products not made in New Zealand; and small annual increments in allocations under the apparel licence tendering scheme. During 1987 and 1988 there has also been final discussion and agreement on the effects of the CER trade agreement with Australia on the textile and apparel industries, and the tariff. Details were being completed at the time of going to press.
New Zealand has a long-established footwear manufacturing industry which in the past has enjoyed relatively high levels of tariff and licensing protection. These were reviewed under the Footwear Industry Development Plan in 1986. As a result, existing import access levels have been increased through licence tendering, with adults' footwear increasing by 3 percent a year, and children's by 5 percent a year. The basis for footwear licensing was also changed—from a volume to a value system. As a consequence of the review and the impact these decisions are having, many manufacturers have begun to look more closely at their commercial viability, with significant restructuring and rationalisation taking place within the industry and the footwear market as a whole. A further review of assistance levels will be held in 1990. Trade in footwear between New Zealand and Australia is also gradually being liberalised, and will become duty and licence free on 1 March 1990.
Table 18.1 shows the different types of manufacturing enterprises recorded by a survey to update the Department of Statistics' annual Business Directory at February 1987. The data were among the most recent available at the time of going to press and show major groupings under the New Zealand Standard Industrial Classification. More detailed statistics on manufacturing enterprises, which include dollar values, are contained in section 18.2, with the summary tables from the Census of Manufacturing 1983–84 (the latest available).
More recent detailed statistics showing economic activity in manufacturing will be available with the publication of reports from the 1987 Economy Wide Census throughout 1989.
Table 18.1. MANUFACTURING ENTERPRISES AND PERSONS ENGAGED, FEBRUARY 1987 *
| NZSIC | Type of manufacturing | Number of employees | ||||||
|---|---|---|---|---|---|---|---|---|
| 0–5 | 6–9 | 10–49 | 50–99 | 100+ | Total | |||
*Annual Business Directory update. | ||||||||
| 3111 | Slaughtering and meat processing | Activity units | 106 | 33 | 82 | 25 | 58 | 304 |
| Persons engaged | 272 | 249 | 1922 | 1736 | 32461 | 36640 | ||
| 3112 | Dairy products | Activity units | 51 | 13 | 54 | 23 | 27 | 168 |
| Persons engaged | 87 | 95 | 1297 | 1658 | 4898 | 8035 | ||
| 3113–3122 | Other foods | Activity units | 706 | 243 | 333 | 44 | 49 | 1375 |
| Persons engaged | 2025 | 1725 | 6816 | 3121 | 10388 | 24075 | ||
| 313 | Beverages | Activity units | 72 | 23 | 41 | 9 | 11 | 156 |
| Persons engaged | 185 | 174 | 785 | 574 | 2076 | 3794 | ||
| 314 | Tobacco products | Activity units | 4 | 1 | 4 | - | 2 | 11 |
| Persons engaged | 6 | 6 | 95 | - | 710 | 817 | ||
| 321 | Textiles | Activity units | 445 | 118 | 173 | 40 | 31 | 807 |
| Persons engaged | 1075 | 856 | 3753 | 2898 | 5406 | 13988 | ||
| 322–324 | Apparel and footwear | Activity units | 834 | 178 | 471 | 93 | 43 | 1619 |
| Persons engaged | 1964 | 1309 | 10733 | 6555 | 6301 | 26862 | ||
| 33 | Wood processing and products | Activity units | 2024 | 400 | 495 | 65 | 27 | 3011 |
| Persons engaged | 4580 | 2926 | 9425 | 4256 | 5373 | 26560 | ||
| 341 | Paper and paper products | Activity units | 61 | 22 | 64 | 19 | 23 | 189 |
| Persons engaged | 152 | 158 | 1599 | 1378 | 7350 | 10637 | ||
| 342 | Printing and publishing | Activity units | 637 | 202 | 318 | 29 | 36 | 1222 |
| Persons engaged | 1644 | 1460 | 6398 | 1956 | 7820 | 19278 | ||
| 351 | Industrial chemicals | Activity units | 105 | 34 | 63 | 14 | 14 | 230 |
| Persons engaged | 250 | 255 | 1341 | 985 | 2248 | 5079 | ||
| 352 | Other chemicals | Activity unit | 221 | 42 | 108 | 33 | 11 | 415 |
| Persons engaged | 540 | 300 | 2289 | 2261 | 2096 | 7486 | ||
| 353 | Petroleum refineries | Activity units | 5 | 1 | 9 | - | 2 | 17 |
| Persons engaged | 13 | 9 | 161 | - | 899 | 1082 | ||
| 354 | Petroleum and coal products | Activity units | 26 | 5 | 8 | 4 | - | 43 |
| Persons engaged | 57 | 38 | 160 | 315 | - | 570 | ||
| 355 | Rubber products | Activity units | 57 | 20 | 48 | 7 | 7 | 139 |
| Persons engaged | 136 | 146 | 1025 | 418 | 7 | 3727 | ||
| 356 | Plastic products | Activity units | 218 | 66 | 136 | 20 | 14 | 454 |
| Persons engaged | 559 | 484 | 3008 | 1295 | 2423 | 7769 | ||
| 36 | Non-metallic mineral products | Activity units | 684 | 100 | 167 | 17 | 13 | 981 |
| Persons engaged | 1588 | 703 | 3302 | 1171 | 2944 | 9708 | ||
| 37 | Basic metal industries | Activity units | 81 | 42 | 48 | 5 | 10 | 186 |
| Persons engaged | 204 | 305 | 962 | 323 | 4805 | 6599 | ||
| 381 | Fabricated metal products | Activity units | 1650 | 433 | 614 | 43 | 31 | 2771 |
| Persons engaged | 3700 | 3143 | 12345 | 2939 | 5319 | 27446 | ||
| 382 | Machinery | Activity units | 1916 | 350 | 384 | 42 | 11 | 2703 |
| Persons engaged | 4309 | 2511 | 7596 | 2921 | 1695 | 19032 | ||
| 383 | Electrical machinery | Activity units | 417 | 104 | 146 | 27 | 35 | 729 |
| Persons engaged | 913 | 744 | 2992 | 1958 | 6838 | 13445 | ||
| 384 | Transport equipment | Activity units | 660 | 143 | 187 | 37 | 39 | 1066 |
| Persons engaged | 1457 | 1026 | 3679 | 2453 | 12767 | 21382 | ||
| 385 | Professional equipment | Activity units | 70 | 9 | 22 | 3 | 2 | 106 |
| Persons engaged | 155 | 69 | 422 | 240 | 427 | 1313 | ||
| 39 | Other manufacturing | Activity units | 683 | 82 | 81 | 13 | 2 | 861 |
| Persons engaged | 1391 | 590 | 1592 | 940 | 226 | 4739 | ||
| 3 | Total manufacturing | Activity units | 11733 | 2664 | 4056 | 612 | 498 | 19563 |
| Persons engaged | 27262 | 19281 | 83697 | 42351 | 127472 | 300063 | ||
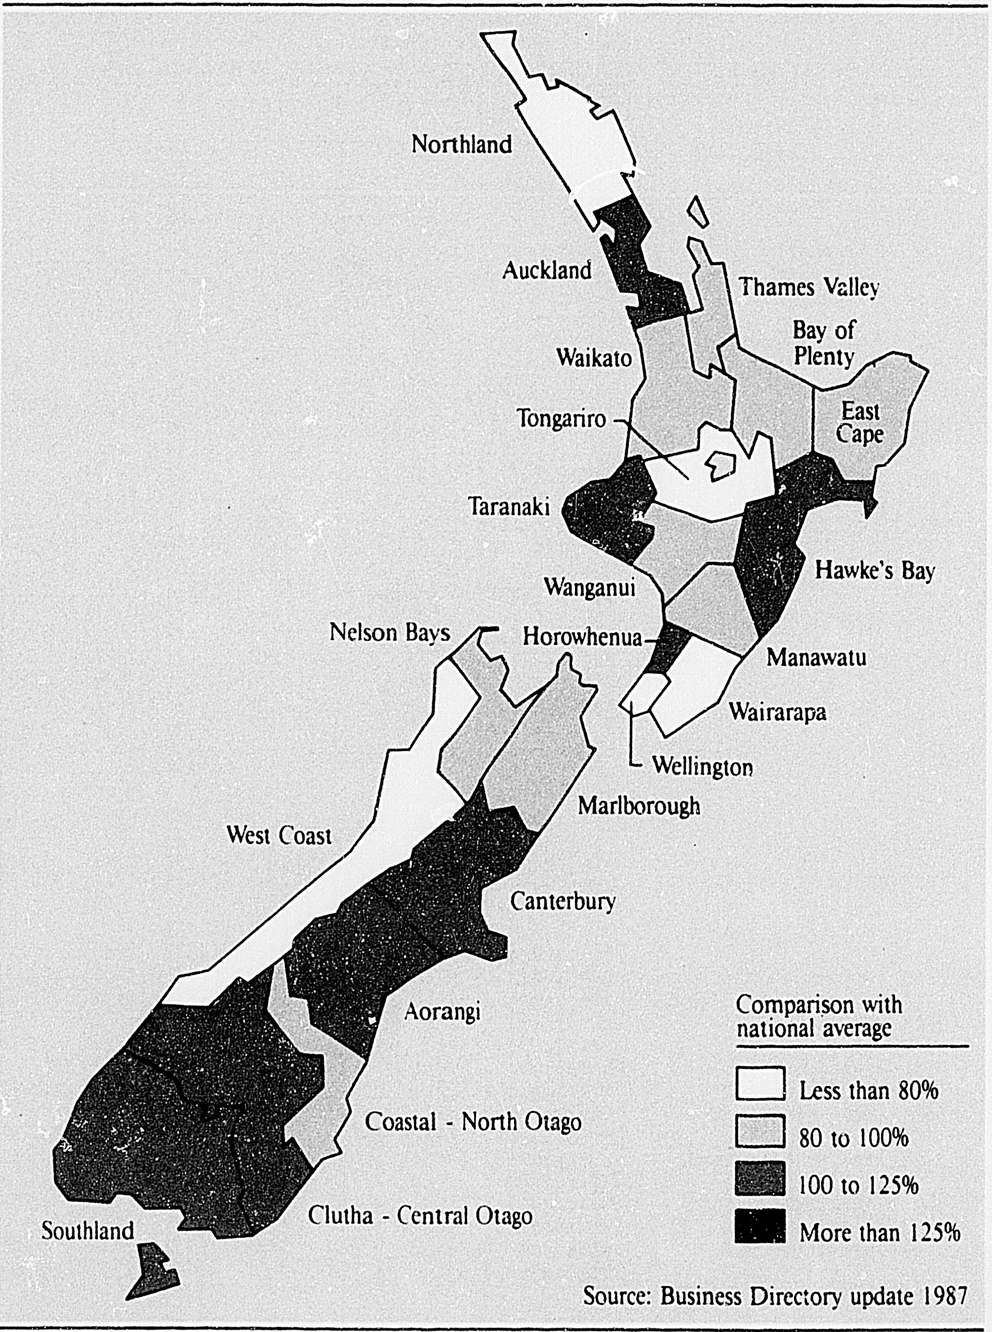
Percentage of workforce employed in MANUFACTURING
In 1984, when the current Government took office, a wide range of financial incentive schemes favouring various sectors of the economy existed.
Investment decisions were being influenced by the availability of a subsidy, rather than solely the merits of the project itself and this was creating distortions which disadvantaged other sectors. The Government therefore removed or phased out most assistance programmes to industry and introduced policies designed to reduce the cost of setting up and operating a business. This policy aims to create an environment in which individuals can pursue their ideas unhampered by unnecessary controls and regulations.
Two programmes remain under which the Department of Trade and Industry's business environment division (until 1 December 1988) disburses money to new business proponents, the Regional Development Investigation Grant Scheme and the Community Employment Investigation Grant Scheme (see section 12.2, Unemployment). Funds are available under these schemes to examine the viability of selected business proposals, not the establishment or running costs of a business.
This scheme aims to stimulate innovative, economically viable, and self-sustaining development in regions. Under the scheme, individuals, businesses or organisations can be assisted with the costs of investigating the viability of proposed developments. Assistance can also be given to regional organisations to study regional resources which have wider significance for the region. Government-appointed regional development councils in each region are involved in assessing applications.
During 1987, a standard rate of assistance of 50 percent was introduced, with a maximum of $100,000 per project. In the nine months to 31 December 1987, 336 applications with a value of $7.2 million were approved.
A diverse range of projects have received assistance since the scheme began in 1986, ranging from new uses for traditional products to the development of completely new products or services.
By the end of 1987, 87 projects had gone beyond the investigatory stage and resulted in 182 new jobs.
The Government welcomes overseas investment in New Zealand. Applications by overseas companies to establish in New Zealand are assessed on their individual merits by the Overseas Investment Commission, under a liberal investment policy which makes provision for up to 100 percent foreign ownership of New Zealand enterprises.
An investment unit within the Department of Trade and Industry (until 1 December 1988) works to encourage overseas investment. It functions as a contact point for overseas organisations, referring them to other government or private organisations as appropriate, as well as preparing explanatory and publicity material and promoting overseas investment in New Zealand. The unit also advises the New Zealand Immigration Service on the business elements of applications made under the Business Immigration Policy (see special article on immigration, chapter 6).
The Pacific Islands Industrial Development Scheme (PIIDS), introduced in 1976, provides financial assistance for New Zealand companies developing approved manufacturing or agro-based operations in the Cook Islands, Fiji, Kiribati, Nauru, Niue, Papua New Guinea, Solomon Islands, Tonga, Tuvalu, Western Samoa and Vanuatu.
The objective of the scheme is to foster economic development opportunities and further the growth of employment in Pacific Island countries.
The Department of Trade and Industry (until 1 December 1988) works to encourage and improve innovation in New Zealand business.
To this end, the department is seeking to promote a dialogue and understanding of issues which might be having an impact on innovation by New Zealand business. Following a number of visits, discussion papers on business research and development, intellectual property, venture capital, biotechnology, and science and technology parks were published during 1987 and 1988.
The department also co-sponsored the publication in January 1988 by the New Zealand Institute of Economic Research, of a research monograph Research and Development in New Zealand: A Public Policy Framework.
With the Department of Scientific and Industrial Research, the department co-sponsored the establishment in 1987 of a private consultancy to assist businesses to introduce new technologies.
During 1987 the Government launched a nationwide campaign to promote the adoption of quality management by New Zealand business. Quality management is defined as “the management of production of goods and services to provide in the most cost-effective way, the quality that is required by the customer”.
It is a philosophy by which senior managers commit their companies to quality in all corporate activities, and is seen as a key to improving profitability, overall business efficiency and competitiveness. Targeting senior managers, the campaign employs case studies of businesses with effective quality management, and a video recording explaining quality management through examples from New Zealand businesses. A series of 70 ‘business to business' workshops is also being held. These workshops provide managers with the opportunity to discuss quality management issues with consultants and their peers who have been through the process of establishing quality management systems.
The campaign is co-ordinated by the Department of Trade and Industry and is supported by a number of leading businesses and agencies.
The table below shows the volume of production of selected goods. It should be noted that the figures refer to December years (except where otherwise stated). Quarterly or, in some cases, monthly production figures for these commodities will be found in the Monthly Abstract of Statistics, published by the Department of Statistics.
Table 18.2. VOLUME OF PRODUCTION OF SELECTED GOODS
| Commodity | Unit | 1984 | 1985 | 1986 |
|---|---|---|---|---|
*Excludes rugs. †Includes white packed granulated sugar, bulk white granulated sugar, fine liquid sugar, castor sugar, brown sugar, coffee crystals and invert sugar. ‡Year ended May. §Year ended March. ||Figures related only to operations of superphosphate manufacturing works. | ||||
| Woollen and worsted yarn | tonnes | 24847 | 26262 | 23394 |
| Carpets* | sq metres (000) | 11611 | 12600 | 11215 |
| Refined sugar† | tonnes (000) | 155 | 149 | 155 |
| Butter‡ | tonnes (000) | 292 | 293 | 300 |
| Cheese‡ | tonnes (000) | 109 | 118 | 127 |
| Flour (white) | tonnes (000) | 209 | 211 | 209 |
| Beer | litres (million) | 384 | 386 | 406 |
| Passenger cars—total | No. | 89772 | 80290 | 64965 |
| Trucks, vans, and buses | No. | 24997 | 24185 | 15964 |
| Paper§ | tonnes (000) | 694x | 770x | 671 |
| Wood pulp§ | tonnes (000) | 1062x | 1145x | 1110 |
| Chemical fertilisers|| | tonnes (000) | 1844 | 1779 | 820 |
| Cigarettes | million | 6274 | 5767 | 5471 |
The Department of Statistics' Quarterly Economic Survey of Manufacturing is based on a sample of approximately 1500 manufacturing units originally selected from a 1979 census of manufacturing and revised in June 1982. All manufacturing divisions of the New Zealand Standard Industrial Classification are represented and allowance is made for the opening of new factories and the closure of established ones.
Table 18.3 summarises the results from the survey over the five years to 1987, while table 18.4 provides a breakdown by major types of manufacturing for the year ended March 1987.
The definitions of terms used in the tables can be found in the glossary at the back of this book. There is, however, some variation in the definition of ‘other income’, and salaries and wages paid to working proprietors and partners are excluded. ‘Purchases and other operating expenses’ excludes exchange losses and extraordinary items, e.g., assets, sales tax, excise and fringe benefit tax.
Table 18.3. QUARTERLY ECONOMIC SURVEY OF MANUFACTURING: ALL-INDUSTRY TOTALS
| Year ended 31 March | Sales and other income | Stocks* | Additions to fixed assets | Salaries and wages | Purchases and other operating expenses | Hours worked | |
|---|---|---|---|---|---|---|---|
| Materials | Finished goods | ||||||
*At end of quarter. | |||||||
| $(million) | (000) | ||||||
| 1983 | 20,660.6 | 1,845.2 | 1,714.6 | 2,323.8 | 4,270.4 | 15,135.8 | 533302 |
| 1984 | 21,827.3 | 1,923.1 | 1,630.6 | 2,430.0 | 4,179.2 | 15,933.8 | 509223 |
| 1985 | 25,995.5 | 2,548.1 | 1,901.8 | 1,956.1 | 4,614.1 | 19,625.1 | 538357 |
| 1986 | 28,419.1 | 2,584.5 | 2,133.2 | 2,393.9 | 5,172.7 | 21,384.8 | 543837 |
| 1987 | 31,285.1 | 2,465.5 | 2,296.8 | 2,001.2 | 5,799.4 | 22,670.0 | 529326 |
Table 18.4. QUARTERLY ECONOMIC SURVEY OF MANUFACTURING, 1987*
| Industry division | Sales and other income | Stocks† | Additions to fixed assets | Salaries and wages | Purchases and other operating expenses | Hours worked | |
|---|---|---|---|---|---|---|---|
| Materials | Finished goods | ||||||
*Year ended 31 March. †At end of quarter. ‡Includes the processing of meat and dairy products, and other primary foods. | |||||||
| $(million) | (000) | ||||||
| Primary food‡ | 4,801.7 | 145.1 | 218.2 | 199.9 | 1,026.8 | 3,654.2 | 82526 |
| Other food | 4,015.4 | 261.3 | 316.3 | 200.0 | 498.9 | 3,026.3 | 50976 |
| Textiles, clothing | 2,913.6 | 241.8 | 292.1 | 88.4 | 581.8 | 2,064.6 | 65671 |
| Wood and furniture | 1,978.8 | 136.9 | 171.8 | 101.3 | 422.7 | 1,413.6 | 39465 |
| Paper and printing | 3,830.9 | 270.6 | 191.4 | 225.5 | 824.8 | 2,657.3 | 69887 |
| Chemical | 4,041.6 | 395.7 | 330.0 | 332.1 | 557.1 | 2,793.4 | 47312 |
| Non-metallic mineral | 1,083.6 | 32.5 | 64.2 | 28.2 | 192.6 | 705.3 | 16931 |
| Basic metal | 1,058.4 | 119.2 | 81.1 | 584.6 | 195.3 | 741.0 | 12859 |
| Fabricated metal | 7,200.5 | 826.0 | 592.0 | 229.0 | 1,427.7 | 5,363.1 | 135775 |
| Other manufacturing industries | 360.5 | 36.3 | 39.6 | 12.1 | 71.8 | 251.2 | 7921 |
| Total, all industries | 31,285.1 | 2,465.5 | 2,296.8 | 2,001.2 | 5,799.4 | 22,670.0 | 529326 |
The 1983–84 Census of Manufacturing covered activity units (factories, workshops, etc.) in New Zealand, where the predominant activity is manufacturing, processing, assembly, or repair. It also covered the activities of ancillary units (head offices, etc.) which service or predominantly service those activity units. Single activity-unit firms having an average of less than two persons engaged full-time were, however, not included in the census.
All activities of the manufacturing operations, from the purchase of materials and supplies to the point at which the products were sold, were within the scope of the census, which is for the year ended 31 March, or the last accounting year prior to 31 March. Manufacturing industries were classified according to the revised New Zealand Standard Industrial Classification (NZSIC), which is based on the 1968 United Nations International Standard Industrial Classification of All Economic Activities.
The 1983–84 manufacturing census was one of a series of integrated economic censuses completed by the Department of Statistics between 1974 and 1985, although it included for the first time enterprises with less than two persons engaged and ‘ancillary enterprises’.
Definitions of terms used are given in the glossary at the back of this book.
The following tables summarise the census. Table 18.5 describes the overall scale of manufacturing enterprise in terms used for national accounting. The aggregate information is also presented to allow comparison with the earlier 1981–82 census of manufacturing (see 1983 Yearbook).
Table 18.6 shows the geographical distribution of manufacturing industry, while table 18.7 provides a more detailed analysis of the enterprises and employees involved in different types of manufacturing, along with total sales and value added.
Table 18.5. SUMMARY OF CENSUS OF MANUFACTURING 1983–84
| Statistical item | Grand total | Grand total comprises | ||
|---|---|---|---|---|
| New enterprises 1983–84 | ||||
| Small | Ancillary | Balance | ||
*Includes capitalised salaries and wages amounting to $24,811,000. | ||||
| number | ||||
| Activity and ancillary units | 15716 | 2876 | 187 | 12653 |
| Working proprietors/partners at 28/2/84 | 16513 | 3124 | 57 | 13332 |
| Paid employees at 28/2/84 | 289328 | 1344 | 4581 | 283403 |
| $(000) | ||||
| Salaries paid to working proprietors/partners | 228,411 | 15,203 | 1,205 | 212,003 |
| Salaries and wages paid to employees* | 4,415,014 | 11,903 | 109,711 | 4,293,400 |
| Stocks, including work-in-progress: | ||||
| opening | 3,544,008 | 16,082 | 33,947 | 3,493,979 |
| closing | 3,562,269 | 16,336 | 35,078 | 3,510,855 |
| Income— | ||||
| Sales of goods produced and services provided, including goods purchased for resale | 22,402,730 | 157,278 | 7,295 | 22,238,157 |
| Direct government cash grants and subsidies | 80,832 | 213 | 1,421 | 79,198 |
| Other income (excluding interest, etc.) | 474,036 | 1,665 | 380,007 | 92,364 |
| Sales and income (excluding interest, etc., and extraordinary items) | 22,957,598 | 159,155 | 388,723 | 22,409,720 |
| Interest, dividends, donations, royalties, patent fees and insurance claims received; bad debts recovered | 348,573 | 1,036 | 221,526 | 126,011 |
| Total sales and other income (including interest, etc.) | 23,306,170 | 160,192 | 610,249 | 22,535,729 |
| Expenditure— | ||||
| Purchases of all materials, components,
supplies, fuels, etc.; payments for all services; and purchases of goods for resale without further processing | 12,487,722 | 76,232 | 7.881 | 12,403,609 |
| Salaries and wages paid to paid employees | 4,390,203 | 11,902 | 109,594 | 4,268,707 |
| Employer contributions | 158,954 | 496 | 5,287 | 153,171 |
| Depreciation | 557,119 | 5,409 | 14,016 | 537,694 |
| Indirect taxes | 53,411 | 653 | 2,087 | 50,671 |
| Other operating expenses (excluding interest, etc.) | 3,328,039 | 29,200 | 156,449 | 3,142,390 |
| Purchases and expenses (excluding interest, etc., and extraordinary items) | 20,975,449 | 123,892 | 295,314 | 20,556,243 |
| Interest, bad debts, donations, royalties and patent fees paid | 926,648 | 4,002 | 237,753 | 684,893 |
| Total purchases and operating expenses (including interest, etc.) | 21,902,097 | 127,894 | 533,066 | 21,241,137 |
| Net profit after deducting working proprietors'/partners' salaries | 1,193,923 | 17,348 | 77,108 | 1,099,467 |
| Operating surplus | 2,000,409 | 35,517 | 94,540 | 1,870,352 |
| Value added | 7,104,076 | 53,766 | 224,219 | 6,826,091 |
| Fixed tangible assets— | ||||
| Additions during the year | 2,506,758 | 12,273 | 58,335 | 2,436,150 |
| Disposals during the year | 228,774 | 5,317 | 16,203 | 207,254 |
| Book value at the end of the year | 9,105,957 | 48,493 | 380,014 | 8,677,450 |
Table 18.6. GEOGRAPHICAL DISTRIBUTION, CENSUS OF MANUFACTURING 1983–84
| Local government region | Activity units | Ancillary activity units | Persons engaged end February | Salaries and wages paid to employees* | Total sales and other income | Additions to fixed tangible assets |
|---|---|---|---|---|---|---|
*Includes capitalised salaries and wages amounting to $24,811,000. | ||||||
| number | $(000) | |||||
| Northland | 371 | 20 | 6321 | 99,189 | 544,487 | 447,991 |
| Auckland | 5330 | 400 | 108812 | 1,529,500 | 8,337,123 | 770,748 |
| Thames Valley | 202 | 10 | 3661 | 52,133 | 459,768 | 49,919 |
| Bay of Plenty | 736 | 45 | 13676 | 226,756 | 1,180,725 | 61,364 |
| Waikato | 803 | 74 | 17332 | 277,824 | 1,625,731 | 122,543 |
| Tongariro | 110 | 3 | 1809 | 25,530 | 105,811 | 2,653 |
| East Cape | 136 | 4 | 3420 | 42,895 | 154,312 | 15,196 |
| Hawke's Bay | 492 | 29 | 13825 | 213,655 | 1,180,504 | 65,396 |
| Taranaki | 414 | 32 | 9579 | 150,370 | 952,609 | 566,160 |
| Wanganui | 232 | 12 | 5164 | 74,037 | 327,544 | 14,972 |
| Manawatu | 472 | 39 | 9846 | 132,141 | 730,973 | 30,193 |
| Horowhenua | 231 | 9 | 3536 | 41,020 | 196,513 | 7,691 |
| Wellington | 1204 | 206 | 27877 | 411,710 | 2,323,040 | 96,231 |
| Wairarapa | 155 | 5 | 3193 | 41,633 | 135,899 | 10,594 |
| Total, North Island | 10888 | 888 | 228051 | 3318,393 | 18,255,038 | 2,261,652 |
| Nelson Bays | 272 | 19 | 4716 | 64,654 | 327,014 | 14,110 |
| Marlborough | 131 | 9 | 2159 | 25,382 | 115,697 | 25,425 |
| West Coast | 133 | 9 | 2233 | 29,580 | 186,924 | 14,301 |
| Canterbury | 1769 | 173 | 36328 | 498,310 | 2,294,925 | 88,542 |
| Aorangi | 332 | 17 | 6467 | 82,998 | 392,148 | 19,049 |
| Clutha—Central Otago | 140 | 4 | 2822 | 37,799 | 128,600 | 11,249 |
| Coastal—North Otago | 487 | 57 | 12037 | 162,849 | 726,270 | 31,172 |
| Southland | 366 | 22 | 11028 | 195,049 | 879,554 | 41,257 |
| Total, South Island | 3630 | 310 | 77790 | 1,096,621 | 5,051,132 | 245,106 |
| Total, New Zealand* | 14518 | 1198 | 305841 | 4,415,014 | 23,306,170 | 2,506,758 |
Table 18.7. INDUSTRIAL GROUPS, CENSUS OF MANUFACTURING 1983–84
| Industry | Enterprises | Activity units | Ancillary activity units | Persons engaged end February | Sales and other income | Value added |
|---|---|---|---|---|---|---|
| number | $(000) | |||||
| Export meat works and abattoirs | 21 | 44 | 9 | 32168 | 1,460,676 | 764,844 |
| Other abattoirs and rural slaughterhouses | 38 | 39 | 5 | 1096 | 61,352 | 27,876 |
| Meat packers and canners | 28 | 42 | 5 | 1524 | 214,158 | 35,651 |
| Ham, bacon, and small goods | 52 | 59 | 21 | 1908 | 197,425 | 41,584 |
| Poultry slaughterhouses | 24 | 28 | 3 | 1321 | 125,818 | 22,752 |
| Game packers | 9 | 11 | 2 | 118 | 14,249 | 2,207 |
| Slaughtering, preparing and preserving meat n.e.c. | 42 | 43 | 4 | 702 | 44,147 | 11,356 |
| Co-operative dairy factories | 32 | 59 | 15 | 6156 | 1,657,887 | 292,391 |
| Milk processing plants | 40 | 44 | 19 | 1056 | 169,149 | 13,206 |
| Ice cream factories | 16 | 25 | 4 | 697 | 74,026 | 13,766 |
| Manufacture of dairy products n.e.c. | 11 | 12 | 4 | 841 | 97,735 | 20,958 |
| Canning and preserving of fruit and vegetables | 66 | 70 | 11 | 4855 | 379,646 | 101,808 |
| Land-based fish factories, etc., | 88 | 115 | 21 | 2970 | 272,284 | 56,986 |
| Vegetable and animal oils and fats | 24 | 22 | 8 | 478 | 83,469 | 19,710 |
| Grain milling and prepared breakfast foods | 24 | 26 | 2 | 866 | 151,392 | 29,484 |
| Bread bakeries | 143 | 162 | 21 | 3053 | 246,033 | 64,868 |
| Cake, pastry, and pie (other than meat) factories | 103 | 113 | 11 | 1744 | 73,911 | 24,913 |
| Cake and pastry kitchens | 331 | 355 | 34 | 2115 | 53,424 | 21,659 |
| Biscuit factories | 10 | 12 | 2 | 1159 | 65,080 | 22,275 |
| Sugar, cocoa, chocolate, and sugar confectionery | 45 | 53 | 22 | 2521 | 305,277 | 77,381 |
| Food products n.e.c. | 73 | 85 | 18 | 2678 | 345,597 | 77,560 |
| Prepared animal feeds | 52 | 61 | 7 | 767 | 170,594 | 23,063 |
| Food manufacturing | 1246 | 1480 | 248 | 70793 | 6,263,329 | 1,716,298 |
| Distilling, rectifying, and blending spirits | 10 | 14 | 2 | 199 | 45,473 | 10,025 |
| Wine | 79 | 87 | 11 | 1131 | 111,641 | 26,883 |
| Brewing and malting, and tobacco manufacturers | 14 | 22 | 13 | 2950 | 408,974 | 133,263 |
| Soft drinks | 28 | 40 | 3 | 1057 | 116,923 | 33,312 |
| Beverage and tobacco manufacturing | 131 | 163 | 29 | 5337 | 683,011 | 203,483 |
| Total: food, beverage, and tobacco manufacturing | 1377 | 1643 | 277 | 76130 | 6,946,340 | 1,919,781 |
| Wool scouring | 44 | 46 | 1 | 1107 | 151,246 | 35,226 |
| Woollen fibres, spinning, and weaving | 25 | 34 | 3 | 3013 | 233,145 | 62,714 |
| Man-made fibres, spinning, and weaving | 15 | 16 | 2 | 594 | 26,733 | 11,677 |
| Dyeing, printing, and finishing yams and textiles | 18 | 18 | - | 340 | 14,273 | 6,966 |
| Canvas goods and similar articles of other fabrics | 109 | 113 | - | 853 | 36,098 | 12,354 |
| Other made-up textile goods | 180 | 189 | 3 | 1941 | 100,583 | 28,812 |
| Knitting mills | 118 | 133 | 9 | 4550 | 229,427 | 85,172 |
| Carpets and rugs | 35 | 41 | 6 | 2464 | 188,124 | 54,258 |
| Textiles n.e.c. including cordage, rope, and twine | 70 | 78 | 8 | 885 | 56,143 | 17,599 |
| Manufacturing textiles | 606 | 668 | 32 | 15747 | 1,035,770 | 314,778 |
| Leather gloves and clothing | 51 | 58 | 5 | 1136 | 40,041 | 12,243 |
| Natural and artificial fur clothing | 21 | 21 | 3 | 241 | 7,376 | 2,790 |
| Clothing other than leather and fur | 766 | 880 | 77 | 18563 | 596,447 | 250,746 |
| Manufacturing clothing (except footwear) | 838 | 959 | 85 | 19940 | 643,864 | 265,779 |
| Tanneries and leather finishing | 14 | 21 | 4 | 1540 | 130,532 | 36,027 |
| Fellmongery | 10 | 13 | 2 | 186 | 15,851 | 5,769 |
| Fur dressing and dyeing, fur and skin articles n.e.c. | 32 | 33 | 1 | 409 | 28,737 | 6,810 |
| Leather and leather substitute products (excluding footwear and clothing) | 154 | 158 | 3 | 1325 | 46,676 | 16,748 |
| Manufacturing leather and products of leather, leather substitutes, and fur except footwear and clothing | 210 | 225 | 10 | 3460 | 221,796 | 65,354 |
| Footwear
except of rubber, plastic or wood | 105 | 136 | 12 | 4856 | 188,152 | 79,095 |
| Total: textile, wearing apparel, leather industries | 1754 | 1988 | 138 | 44003 | 2,089,582 | 725,006 |
| Sawmills | 282 | 326 | 23 | 6895 | 465,234 | 159,018 |
| Planing preserving, and seasoning timber | 62 | 69 | 2 | 1387 | 129,740 | 35,297 |
| Builders carpentry, and builders joinery | 442 | 454 | 6 | 3548 | 166,969 | 54,389 |
| Prefabricated and precut buildings | 46 | 60 | 9 | 1134 | 100,230 | 24,071 |
| Plywood, veneer, and board | 39 | 39 | 2 | 1677 | 160,414 | 48,791 |
| Sawmills, planing, and other wood mills n.e.c. | 31 | 33 | 1 | 430 | 39,239 | 10,682 |
| Wooden and cane containers | 35 | 35 | 2 | 338 | 23,426 | 7,450 |
| Basket and cane ware | 14 | 15 | - | 46 | 1,079 | 223 |
| Cork products and wood products n.e.c. | 211 | 216 | 3 | 1277 | 52,700 | 17,060 |
| Manufacturing wood, and wood and cork products except furniture | 1123 | 1247 | 48 | 16732 | 1,139,032 | 356,980 |
| Wooden furniture and upholstery | 798 | 848 | 22 | 6961 | 301,264 | 106,165 |
| Mattress making | 9 | 14 | 1 | 455 | 33,750 | 10,230 |
| Furniture and fixtures, excluding primarily of metal n.e.c. | 45 | 50 | 4 | 412 | 15,736 | 5,354 |
| Manufacturing furniture and fixtures except primarily of metal | 852 | 912 | 27 | 7828 | 350,750 | 121,749 |
| Total: wood and wood products (including furniture) | 1972 | 2159 | 75 | 24560 | 1,489,782 | 478,729 |
| Pulp, paper, and paperboard | 9 | 12 | 7 | 7532 | 978,042 | 257,164 |
| Corrugated board, paperboard and corrugated board boxes, cases | 21 | 46 | 8 | 3013 | 312,523 | 85,221 |
| Containers, and boxes of paper and paperboard n.e.c. | 13 | 16 | 1 | 648 | 64,248 | 17,884 |
| Wallpaper factories | 7 | 7 | - | 317 | 27,443 | 10,002 |
| Pulp, paper, and paperboard articles n.e.c. | 50 | 54 | 9 | 1455 | 113,353 | 34,829 |
| Manufacturing paper and paper products | 96 | 135 | 25 | 12965 | 1,495,608 | 405,099 |
| Printing and publishing newspapers, periodicals, books | 92 | 121 | 56 | 8546 | 433,785 | 210,539 |
| Job and general printing | 533 | 549 | 57 | 8192 | 454,796 | 178,532 |
| Servicing industries for printing trade | 157 | 160 | 2 | 1451 | 57,555 | 30,020 |
| Printing, publishing, and allied industries n.e.c. | 76 | 79 | 357 | 14,298 | 5,842 | |
| Printing, publishing, and allied industries | 857 | 909 | 115 | 18546 | 960,434 | 424,934 |
| Total:, paper and paper products, printing and publishing | 950 | 1044 | 140 | 31511 | 2,456,042 | 830,033sz |
| Basic industrial chemicals except fertilisers | 22 | 32 | 4 | 694 | 91,386 | 38,193 |
| Chemical fertilisers | 11 | 15 | 10 | 1199 | 331,665 | 42,754 |
| Pesticides | 9 | 23 | 6 | 340 | 62,955 | 15,391 |
| Fertilisers and pesticides n.e.c. | 14 | 14 | 7 | 117 | 11,384 | 2,324 |
| Synthetic resins, plastic materials, and man-made fibres (excludes glass) | 74 | 98 | 16 | 2594 | 300,161 | 81,166 |
| Manufacturing industrial chemicals | 129 | 182 | 43 | 4944 | 797,552 | 179,828 |
| Paints, varnishes, and lacquers | 42 | 49 | 33 | 1476 | 181,083 | 44,325 |
| Drugs and medicines | 36 | 40 | 15 | 1656 | 181,232 | 47,577 |
| Soap and cleaning preparations | 27 | 30 | 6 | 1061 | 117,334 | 31,682 |
| Perfumes, cosmetics, and other toilet preparations | 45 | 48 | 6 | 1309 | 95,796 | 26,709 |
| Cleaning preparations n.e.c. | 15 | 16 | 3 | 385 | 33,991 | 10,285 |
| Ink | 7 | 14 | 7 | 480 | 52,777 | 16,222 |
| Chemical products n.e.c. | 71 | 89 | 29 | 1281 | 137,955 | 38,845 |
| Manufacturing other chemical products | 238 | 286 | 99 | 7648 | 800,169 | 215,644 |
| Petroleum refining | 15 | 19 | 5 | 797 | 151,126 | 43 |
| Manufacturing products of petroleum and coal | 22 | 26 | 7 | 378 | 45,181 | 11,267 |
| Manufacturing rubber tyres and tubes | 25 | 60 | 8 | 1823 | 125,782 | 33,385 |
| Rubber products n.e.c. | 51 | 58 | 11 | 1984 | 113,636 | 44,914 |
| Manufacturing rubber products | 75 | 118 | 19 | 3807 | 239,419 | 78,299 |
| Manufacturing plastic products n.e.c. | 309 | 330 | 19 | 7519 | 535,485 | 184,329 |
| Total: chemicals and chemical, petroleum, coal, rubber, and plastic products | 776 | 961 | 192 | 25093 | 2,568,931 | 669,410 |
| Manufacturing pottery, china, and earthenware | 141 | 160 | 1 | 1232 | 48,764 | 20,057 |
| Manufacturing glass and glass products | 123 | 130 | 2 | 2368 | 164,571 | 69,022 |
| Structural clay products | 21 | 33 | 5 | 558 | 34,041 | 12,450 |
| Manufacture of cement, lime, and plaster | 9 | 24 | 5 | 1038 | 142,754 | 33,196 |
| Precast concrete | 129 | 166 | 12 | 1976 | 133,992 | 51,056 |
| Concrete masonry | 47 | 67 | 10 | 779 | 171,307 | 96,048 |
| Ready-mixed concrete | 63 | 108 | 5 | 1031 | 141,710 | 32,098 |
| Plaster and fibrous plaster products | 24 | 27 | 1 | 356 | 42,807 | 13,161 |
| Monumental masonry and stone masonry | 59 | 66 | 2 | 402 | 18,963 | 7,680 |
| Non-metallic mineral products n.e.c. | 24 | 29 | 2 | 359 | 22,483 | 8,329 |
| Manufacturing other non-metallic mineral products | 368 | 520 | 42 | 6499 | 708,057 | 254,018 |
| Total: non-metallic mineral products (except products of petroleum and coal) | 631 | 810 | 45 | 10099 | 921,391 | 343,096 |
| Iron and steel basic industries | 51 | 57 | 6 | 3753 | 455,190 | 121,949 |
| Non-ferrous basic metal | 23 | 28 | 10 | 2656 | 426,992 | 154,353 |
| Non-ferrous forgings and castings | 61 | 61 | 3 | 788 | 68,447 | '9,238 |
| Non-ferrous metal basic industries | 84 | 89 | 13 | 3444 | 495,440 | 173,592 |
| Total: basic metal industries | 135 | 146 | 19 | 7197 | 950,630 | 295,541 |
| Cutlery and hand tools | 29 | 31 | 4 | 439 | 25,346 | 9,490 |
| Builders, joiners, etc., hardware | 47 | 48 | 5 | 997 | 52,534 | 20.080 |
| General hardware n.e.c. | 53 | 53 | - | 114 | 2,951 | 1,294 |
| Furniture and fixtures primarily of metal | 90 | 94 | 8 | 1291 | 71,002 | 23,637 |
| Metal joinery, fixtures, and fittings | 363 | 382 | 17 | 3789 | 237,331 | 69,985 |
| Sheet metal roofing and related products | 186 | 208 | 5 | 2536 | 229,622 | 69,247 |
| Structural steel, plate metal, and boiler shop products | 249 | 300 | 20 | 4964 | 346,050 | 118,634 |
| Wireworking | 79 | 99 | 6 | 1716 | 163,512 | 39,918 |
| Nail and fastener manufacturing | 14 | 16 | 1 | 380 | 33,741 | 9,502 |
| Household and kitchen utensils | 45 | 45 | 1 | 566 | 31,640 | 12,535 |
| Servicing industries to the metal trades | 270 | 278 | 4 | 1683 | 61,857 | 29,589 |
| Fabricated metal products (excludes machinery and equipment) n.e.c. | 436 | 466 | 42 | 7351 | 504,707 | 180,507 |
| Manufacturing fabricated metal products | 1856 | 2020 | 113 | 25826 | 1,760,291 | 584,418 |
| Manufacturing and reconditioning of engines and turbines | 163 | 184 | 1 | 1089 | 58,602 | 21,257 |
| Manufacturing agricultural machinery and equipment | 354 | 376 | 7 | 3462 | 215,191 | 64,102 |
| Tool, die, and jig making | 161 | 163 | 3 | 1280 | 55,796 | 25,156 |
| Metal and woodworking machinery n.e.c. | 45 | 46 | 1 | 552 | 27,259 | 10,850 |
| Specialised industrial machinery and equipment (excludes metal and woodworking) | 123 | 137 | 3 | 2755 | 211,244 | 60,530 |
| Office, computing, and accounting machinery | 41 | 66 | 2 | 416 | 27,938 | 8,800 |
| Industrial machinery and equipment (except electrical) n.e.c. | 758 | 890 | 44 | 9442 | 568,772 | 186,367 |
| Manufacturing machinery (except electrical) | 1641 | 1862 | 61 | 189% | 1,164,802 | 377,062 |
| Electrical industrial machinery and apparatus | 164 | 182 | 21 | 3094 | 207,537 | 70,499 |
| Radio, television, and communication equipment and apparatus | 188 | 202 | 18 | 4647 | 360,567 | 91,803 |
| Household durables and range making | 18 | 21 | 3 | 2528 | 213,528 | 61,225 |
| Other electrical appliances and housewares n.e.c. | 34 | 40 | 3 | 1444 | 87,213 | 25,708 |
| Electrical cables and wires | 6 | 6 | 7 | 1063 | 123,090 | 37,567 |
| Other electrical apparatus and supplies | 93 | 95 | J3 | 2818 | 168,144 | 57,369 |
| Manufacturing electrical machinery, apparatus, appliances, and supplies | 498 | 547 | 65 | 15594 | 1,160,080 | 344,171 |
| Ship-building and repairing | 255 | 263 | 3 | 3654 | 132,805 | 61,282 |
| Motor vehicle assembly plants | 20 | 23 | 7 | 5788 | 779,091 | 119,948 |
| Motor vehicle body building, caravans, and trailers | 130 | 135 | 9 | 2007 | 133,233 | 37,929 |
| Motor vehicle parts n.e.c. | 119 | 142 | 8 | 3570 | 179,293 | 57,260 |
| Aircraft | 39 | 42 | 2 | 2097 | 130,523 | 83,106 |
| Other transport equipment n.e.c. | 27 | 36 | 5 | 3952 | 147,467 | 80,136 |
| Manufacturing transport equipment | 587 | 641 | 34 | 21068 | 1,502,413 | 439,661 |
| Medical and surgical equipment and supplies n.e.c. | 21 | 23 | 6 | 573 | 44,880 | 16,744 |
| Laboratory, scientific, measuring and controlling equipment, n.e.c. | 31 | 31 | 7 | 466 | 18,527 | 3,678 |
| Photographic and optical goods | 22 | 27 | 6 | 364 | 21,152 | 6,573 |
| Manufacturing professional, scientific, measuring and controlling equipment n.e.c., and photographic and optical goods | 74 | 81 | 19 | 1403 | 84,560 | 26,995 |
| Total: fabricated metal products, machinery and equipment | 4641 | 5151 | 292 | 82887 | 5,672,145 | 1,772,307 |
| Jewellery and related articles | 187 | 191 | 4 | 1031 | 49,650 | 15,498 |
| Musical instruments | 10 | 10 | - | 46 | 2,677 | 879 |
| Sporting and athletic goods | 81 | 81 | 1 | 519 | 30,056 | 9,157 |
| Brushes and brooms | 17 | 26 | - | 462 | 23,167 | 7,920 |
| Toys and games | 88 | 88 | 2 | 585 | 31,327 | 8,346 |
| Other manufacturing industries n.e.c. | 218 | 220 | 13 | 1718 | 74,451 | 28,373 |
| Total: other manufacturing industries | 601 | 616 | 20 | 4361 | 211,328 | 70,172 |
| Grand total, manufacturing | 12760 | 14518 | 1198 | 305841 | 23,306,170 | 7,104,076 |
18.1 Department of Trade and Industry; Department of Statistics.
18.2 Department of Statistics.
Census of Manufacturing 1983–84. Department of Statistics.
The Diffusion of Microelectronics through New Zealand Manufacturing. New Zealand Institute for Economic Research, 1987.
Monthly Abstract of Statistics. Department of Statistics.
Report of the Department of Trade and Industry (Parl. paper G. 14).
Research and Development in New Zealand: A Public Policy Framework. New Zealand Institute for Economic Research, 1987.
Table of Contents
Two main features of the New Zealand housing scene are the dominance of single, detached houses in the housing stock and the preponderance of owner-occupier tenure (see section 6.1, Households). As elsewhere, the housing sector and new house construction form an important component of the economy. Housing (as ‘homes’ and as elements of every community) also plays a central social role. Moreover, in a market-based, property-owning society, housing is the main area of capital investment for many in the population, particularly the middle- to lower-income groups.
Current concerns in housing include its affordability for some groups, the housing requirements of special groups, serious housing needs, and the delivery of housing assistance. New Zealand has so far escaped the type and scale of housing crisis suffered in many other industrialised societies. Problems of homelessness do exist in New Zealand but are concentrated in particular regions and income and social groups. For some the crisis is the inability to pay, and for others, particularly those subject to discrimination, there is a problem of access to housing. However, the majority of New Zealanders are physically well housed, and the legacy of a relatively adequate housing stock gives New Zealand a better basis than many other countries in meeting housing problems.
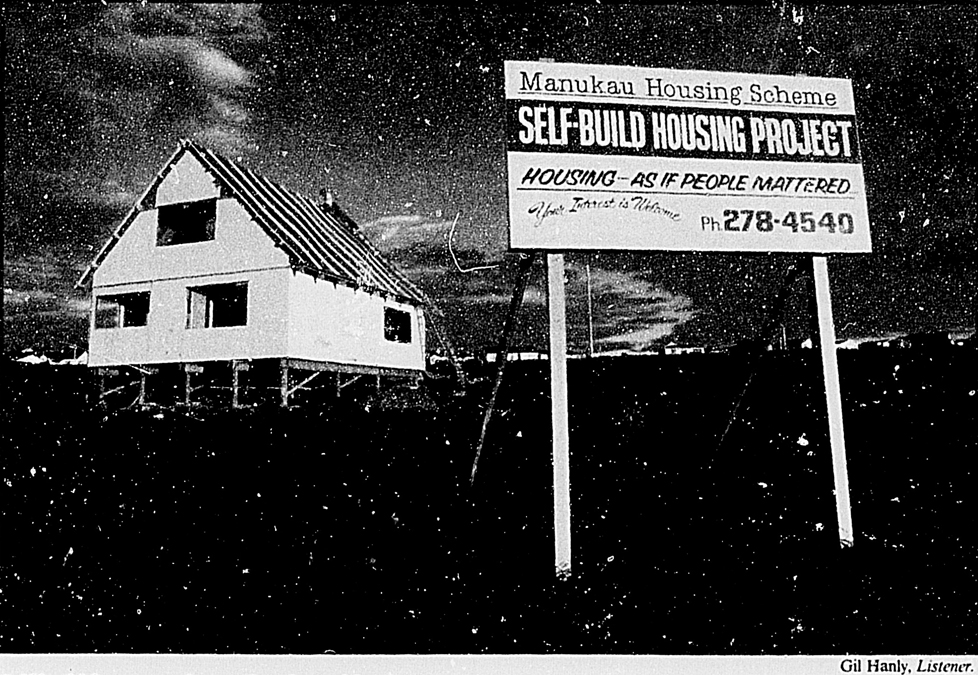
Self-build housing scheme, South Auckland.
The National Housing Commission, set up in 1972 as an independent statutory body to investigate, comment on and advise upon all matters relating to the provision of housing in New Zealand, was disestablished in March 1988.
Since its first meeting in 1974, one of the commission's major activities was its sponsorship of research into a variety of aspects of housing in New Zealand, and the publication of its results as part of an information series. In total, the National Housing Commission published 74 reports.
The last publication of the National Housing Commission was its final five-yearly report, Homing New Zealand, which reviewed past and current housing issues and discussed the urgent social problems arising from inadequate shelter. There were five major areas addressed in the report:
Homeless and very poorly housed people, especially in the northern part of the North Island, both urban and rural. This affected, in particular, Maori and Pacific Island Polynesian people.
The affordability of housing for low- and modest-income households and the need for public awareness about loans, shared ownership and other innovative schemes.
The special needs of housing for the disabled, deinstitutionalised and elderly.
Emergency housing especially for victims of violence, and ‘second chance’ loans for former home owners in need.
Incentives for, and co-operation with, local bodies and other community groups involved in providing lower-cost housing, finance for rental, experimental building and ownership schemes.
A detailed economic commentary with tables is provided, as well as more detail on the findings of the research project into serious housing needs specially commissioned for the report.
The total number of dwellings in New Zealand as at 31 March 1987 was 1047148. (Excluding miscellaneous dwellings, e.g., farm cottages.) An average house built today is about 125 m2 in area, is single-storeyed, and normally built of timber. Approximately 90 percent of the dwellings completed annually are built for private home ownership, with most of the balance being erected by government agencies for rental purposes. There is relatively little housing built for private rental. See chapter 6, Social framework, for Census of Population and Dwellings information on ownership and renting.
The housing market was generally active during the first few months of 1987. This was mainly due to the continuing deregulation of the finance sector and the introduction of the Government's ‘Homestart’ scheme in 1986 increasing the availability of mortgage finance. Activity levels stabilised during mid-1987 and started to decline towards the end of the year, especially in the upper price range.
Traditionally, much of the activity in the housing market has focused on sales of existing houses. (69581 houses were sold during the year ended September 1987.)
New residential building activity (including additions and alterations to existing houses), however, is an important component of activity because it increases the quality and quantity of available housing.
There has been a significant drop in the number of new residential buildings since late 1985 (the number of new buildings reached a pre-GST ‘peak’ during this time). The number of building permits for the year ended September 1987 was 18490, down 15 percent from the year ended September 1986 (21877) and down 23 percent from the year ended September 1985 (23873). In addition, 55061 addition and alteration permits were issued in the year ended September 1987, compared with 61569 for the previous year.
There has been a substantial increase in both new and existing house prices in the past few years. The average value of work for which building permits were let for the year ended September 1987 was $73,667, an increase of 13 percent from the same period in 1986 ($64,586), and an increase of 28 percent when compared to the year ended September 1985 ($57,357).
The rental market experienced a steady to high demand for accommodation in most regions during 1987.
The rental component of the Consumers Price Index rose by 14.8 percent in the year to September 1987. This compares to 16.4 percent in the year to September 1986.
However, despite steady to high demand for accommodation, there are indications that rental costs in most regions have firmed.
Statistics compiled by Valuation New Zealand in the following table illustrate the trend in residential prices in 39 urban areas throughout New Zealand. The figures of average sale prices for sections, houses, and owner-occupier flats exclude family sales, sales of leasehold property, and other sales not subject to normal market forces.
This index is designed to measure changes in the average level of prices paid for residential properties and urban sections sold during each half-year. Variations in the average age of properties transferred, as an indicator of the average quality of such properties, are eliminated in the index methodology in order to arrive at a valid index of price level changes. More recent data are available from Valuation New Zealand.
Table 19.2. URBAN HOUSE PROPERTY PRICE INDEX*
| Centre | Residential properties | Sections | ||||||
|---|---|---|---|---|---|---|---|---|
| July-December 1985 | January-June 1986 | July-December 1986 | January-June 1987 | July-December 1985 | January-June 1986 | July-December 1986 | January-June 1987 | |
| December year 1973 – 1000 | ||||||||
| Whangarei | 4972 | 4975 | 4968 | 5096 | 7307 | 6998 | 7404 | 7222 |
| Auckland | 5094 | 5407 | 5664 | 6585 | 5476 | 6275 | 6453 | 7474 |
| Hamilton | 4584 | 4741 | 4876 | 5336 | 5555 | 6515 | 6925 | 7215 |
| Tauranga | 4280 | 4492 | 4591 | 4956 | 5489 | 5774 | 6508 | 6448 |
| Rotorua | 4925 | 5157 | 5408 | 5872 | 5368 | 5563 | 6358 | 6431 |
| Gisborne | 4839 | 4816 | 4920 | 4963 | 5064 | 5755 | 5551 | 5533 |
| Napier-Hastings | 4162 | 4326 | 4404 | 4576 | 5051 | 5662 | 6172 | 5927 |
| New Plymouth | 4185 | 4082 | 4024 | 4118 | 3747 | 4490 | 4146 | 4135 |
| Wanganui | 5407 | 5362 | 5627 | 5787 | 4066 | 5013 | 5103 | 5314 |
| Palmerston North | 4679 | 4773 | 4894 | 5267 | 6445 | 6971 | 7219 | 8168 |
| Masterton | 4316 | 4364 | 4367 | 4508 | 3393 | 3853 | 3976 | 3671 |
| Wellington-Hutt | 4329 | 4552 | 4935 | 5640 | 4118 | 4186 | 4887 | 5482 |
| Nelson | 5773 | 5936 | 6259 | 6642 | 5941 | 6425 | 7251 | 7516 |
| Christchurch | 4602 | 4687 | 4880 | 5257 | 4674 | 5212 | 5592 | 5782 |
| Timaru | 4775 | 4947 | 4885 | 4958 | 5308 | 6368 | 4723 | 5059 |
| Dunedin | 4135 | 4131 | 4329 | 4600 | 5128 | 5432 | 5676 | 6630 |
| Invercargill | 4053 | 4021 | 4113 | 4185 | 2813 | 3177 | 3024 | 3089 |
| 17 Urban areas combined | 4748 | 4912 | 5139 | 5746 | 5233 | 5811 | 6148 | 6759 |
Deregulation of the finance sector beginning in mid-1984 led to change in the growth of private institutions and in the pattern of home lending. There has been some diversification of loan conditions to meet client needs, and the number and value of mortgage approvals through traditional lending institutions increased to historically high levels during late 1986. Trading banks in particular increased their market share. Latest Reserve Bank figures indicate housing loans approved by the major lending institutions totalled $3,446.9 million for the year ended March 1987. This represents an increase of 83 percent from the previous year (although strictly comparable figures are not available). However, activity levels (as indicated by value of loan approvals) in the March 1987 quarter were 28 percent down from the December 1986 quarter.
Activity levels stabilised at around 22.5 thousand loans advanced per quarter for a total value of approximately $750 million (June and September quarters 1987).
The New Zealand Institute of Economic Research predicts the 1986 sharemarket slump will cause a reduction in household consumption as people cut back discretionary spending, and a reduction in investment by companies. This is likely to increase the proportion of existing house purchases compared to new house purchases, i.e., house buyers will be reluctant to incur the additional expenses related to a new house purchase and manufacturers may cut back on the production of some fittings and appliances.
The future level of activity in the housing market, however, will depend on a combination of factors. High levels of housing inflation combined with high interest rates on mortgages and the recent sharemarket slump should see a decrease in housing activity (especially in the market for new housing).
There is an indication that mortgage interest rates are moving downward, first mortgage interest rates peaked at 19–22.5 percent in mid- to late-1987 and were at 14.5–17.5 percent in mid-1988. However, their level and the impact on the housing market will depend on government policy and the underlying rate of inflation.
Rental housing currently accounts for approximately 23 percent of the housing stock in New Zealand. It caters for people at all income levels but especially for households below median market income levels. The contribution that the rental market makes to the housing stock varies across the five main centres from 28.5 percent in Wellington to 22.1 percent in Christchurch. Outside the five main centres the contribution is lower, at 21.2 percent. Close to 36 percent of rental housing is provided by the public sector, chiefly by the Housing Corporation but also by local authorities and other government departments.
At the 1986 Census of Population and Dwellings the stock of rental housing was 1.2 percent lower than at the 1981 census. The additional stock of housing being provided rent free was also lower in 1986 than in 1981. By contrast, the total housing stock increased by 7.6 percent over the same period. Comparing changes in the five main centres, the greatest decline in both numerical and percentage terms has been in Wellington. The decline in the rental housing stock over the past five years has been the result of losses from the Housing Corporation rental stock and from stocks of rental housing let by other government departments. Local authority rental stocks increased by 2 percent and private rental stocks increased by 4 percent.
The Tenancy Bond Division of the Housing Corporation administers the Residential Tenancies Act 1986, which came into force in 1987. This Act consolidated the law on landlord and tenant, and established a mediation service and Tenancy Tribunal to resolve tenancy disputes. The division runs the mediation service, while the Tenancy Tribunal is administered by the Department of Justice.
Since the introduction of the new law, landlords and tenants have been making extensive use of the services provided. In the first nine months of operation over 8460 tribunal applications have been dealt with by the division. Of this number, 60 percent were resolved by mutual agreement between the parties using the mediation service. The remaining 40 percent of applications were forwarded to the Tenancy Tribunal for an adjudicator's decision. The division's aim is to encourage landlords and tenants to resolve disputes themselves using a trained mediator, rather than proceeding to a formal court hearing. The most common reason for applications from landlords was for termination of tenancy for rent arrears, while applications from tenants mainly concerned the return of bond money.
Another of the division's functions is to hold bonds in trust for landlords and tenants. Presently, approximately $18 million has been deposited with the Housing Corporation. The interest generated by these deposits is being used to fund the activities of the division.
Under the Housing Act 1955 the Housing Corporation builds and lets rental houses and flats, as well as making loans to local authorities to build rental accommodation. Housing Corporation rental houses and flats (formerly known as state rental houses and flats) are allocated to tenants on the basis of need.
The Housing Corporation acquires both developed sections and undeveloped land (which it subsequently develops) to provide sites for its houses. The construction of these houses is carried out under contract, either to corporation design or on a ‘design and build’ basis by builders. Some ‘design and build’ contracts are also let for new houses on land owned by the builder, as a further method of obtaining suitable sections. Existing houses are also bought on the private market or from other government departments.
Table 19.3. HOUSING CORPORATION NEW RENTAL UNITS*
| Year ended 31 March | Rental units |
|---|---|
*Includes purchase of existing houses. Source: Housing Corporation. | |
| 1982 | 420 |
| 1983 | 467 |
| 1984 | 639 |
| 1985 | 1073 |
| 1986 | 1653 |
| 1987 | 1562 |
The number of additional dwelling units taken over by the corporation during the year ended 31 March 1987 totalled 1562. The number of tenancies administered on 31 March 1987 was 60600 and rent accounts in arrears were 2.1 percent of the total compared with 2.2 percent a year earlier. Rents received from tenancies during 1986–87 amounted to $129.8 million compared with $100.5 million for 1985–86. Apart from interest, the largest single item of expenditure charged against rentals was the provision for maintenance of rental houses. For the year ended 31 March 1987 this amounted to $53.4 million compared with $40.1 million for the previous year. Rates payable to local authorities for the year totalled $27.5 million compared with the previous year's figure of $22.2 million.
Instead of building new housing areas at the edges of towns and cities, the corporation's rental programme emphasises renewal and redevelopment more and more, particularly in the main centres. This encourages better utilisation of existing housing and offers a wider range of accommodation. Smaller schemes are emphasised where the social and economic impact on the existing urban pattern is less marked.
Important sources of housing finance are building societies, life insurance offices, trading banks, trustee savings banks, solicitors' trust funds, and the Housing Corporation. Most of the lending by institutions is in the form of table mortgages, being made initially for terms of usually up to 30 years with the Housing Corporation, about 15 years with building societies, and 10 or 20 years with the private savings banks. The general experience of these institutions is that most house mortgages are redeemed in seven to 12 years. Interest rates and the methods of calculating them vary from one institution to another.
Mortgage Guarantee Scheme for housing. The Housing Corporation has statutory authority to guarantee mortgages and operates a scheme whereby an approved lender may be guaranteed repayment of a housing loan. In 1986–87 there were 2774 guarantees issued, compared with 4605 in 1985–86.
The Department of Maori Affairs assists Maori and Pacific Island families with housing under the Maori Housing Act 1935. From the start of the Maori housing programme to 31 March 1988, the department financed 24263 new, and 5055 existing houses. In addition, a limited number of advances are made for additions and repairs to homes, refinancing of existing loans, and finance to second homeowners. The department's priority is to house individual Maori and Pacific Island Polynesian families, in a way that recognises cultural values and supports the whanau. Policies such as papakainga housing (on land in multiple ownership), kaumatua (elders') flats, whareawhina (hospitality-based housing) and wharetapiri (extended-family housing) promote development of the whole community in line with its overall philosophy of tu tangata.
The Housing Corporation generally provides finance to first home seekers receiving a modest income. It also assists some second and subsequent home seekers who demonstrate a special need. For the year ended 31 March 1987, the Housing Corporation authorised 26255 residential loans for $628.65 million. Of this total, 2424 were for the purchase of new houses and 10468 for existing homes. Other types of loans included those for home improvement, refinance, ‘second chance’ housing and housing for the elderly.
Homestart is a form of assistance offered by the Housing Corporation to help low- and middle-income families bridge the deposit gap to home ownership. Families, couples and single people over the age of 26 years, buying or building their first home, may receive a 3 percent loan with no repayments for five years. The loan amounts offered depend on income and the district the applicant intends to buy or build in. The maximum available is $12,000. The interest charges are capitalised every six months until the expiry of the loan, at which time it must be either repaid or refinanced. Extra deposit assistance (up to $3,000) is available to compensate first home buyers for the effects of GST on new houses. The terms and conditions for this are the same as for standard Homestart deposit assistance, except that single people under 26 years are also eligible.
The major aim of the Housing Corporation's lending policy is to assist modest-income families to buy their first homes.
In order that assistance is extended to as many people who need it as possible, some eligibility guidelines have been established. Priority is given to couples and families whose total household income is equal to, or less than, the average weekly wage. Applicants must also be intending first home owners, or not have held any interest in property in either New Zealand or overseas during the previous five years. Assistance is not available to sole persons without dependants (children or elderly or disabled relatives), and applicants must be New Zealand citizens or permanent residents.
Some assistance is available to the following groups who meet the corporation's eligibility guidelines: armed forces or rehabilitation applicants qualifying on service; applicants who meet the requirements of the Tied Accommodation Scheme (those who have lived in employer-provided housing for at least 10 years and are also modest-income earners); or state servants on transfer.
Table 19.4. AVERAGE COST OF HOUSES FINANCED BY THE HOUSING CORPORATION*
| Urban area† | Year ended 31 March | New houses | Existing houses |
|---|---|---|---|
*Calculated from 1 in 5 sample of loans authorized. †Branch areas as quoted in previous years. ‡Includes North Shore, Auckland Central. Henderson and Manukau urban areas. §Includes Wellington City, Kapi-Mana and Hull. Source: Housing Corporation. | |||
| $ | $ | ||
| Auckland‡ | 1986 | 67,000 | 53,000 |
| 1987 | 68,000 | 61,000 | |
| Hamilton | 1986 | 50,000 | 53,000 |
| 1987 | 56,000 | 58,000 | |
| Wellington§ | 1986 | 58,000 | 49,000 |
| 1987 | 78,000 | 63,000 | |
| Christchurch | 1986 | 60,000 | 48,000 |
| 1987 | 77,000 | 53,000 | |
| Dunedin | 1986 | 63,000 | 38,000 |
| 1987 | 71,000 | 47,000 | |
Pensioner rental flats—Government policies encourage local authorities and religious and welfare organisations to meet the housing needs of elderly and disabled people by providing rental accommodation. A low-interest loan of up to $35,000 for up to 25 years for each pensioner rental flat built is available. Additionally, a subsidy of $5,000 per unit is available. This combination of low interest loans and subsidies is directed at keeping the rents at a level that tenants can afford. To ensure that the flats provided are utilised to house people most in need, an asset limit is applicable.
The amount of subsidy approved in 1986–87 was $2.51 million and loan finance provided totalled $8.63 million to provide housing for 507 people. Since the policy began in 1950, subsidy assistance has provided for the accommodation of 14917 people. (Since 1950, 14607 flats have been built.)
Owner-occupier flats—A policy to assist the rehousing of elderly home owners in owner-occupier flats more appropriate to their needs has been in operation for some time. The Housing Corporation provides bridging finance to local authorities and religious and welfare organisations to assist them to construct owner-occupier flats for sale to elderly home owners. The corporation sometimes allows these organisations to on-lend up to $15,000 to the initial purchasers of these flats. In 1986–87 the corporation financed the building of 45 owner-occupier flats.
Relocatable ‘granny flats’—The Housing Corporation makes funds available to both local authorities and religious and welfare organisations to provide relocatable ‘granny flats’ for housing elderly persons on a home owner's property, with the same eligibility applying as for pensioner flats.
Finance available to build the flats is $32,000 per unit—$5,000 subsidy plus a low-interest loan of up to $27,000. Additional loans are available for the connection of services.
Since October 1986 the corporation has been able to hire ‘granny flats’ directly to elderly people for placement on the properties of family or friends, or on corporation rental properties. This is to complement the existing policy.
In addition the corporation has also provided funding for the upgrading of older units and the construction of warden residences and community rooms. Eighty-nine older units were upgraded in 1986–87.
The corporation's new urban renewal programme was introduced in 1986. It provides loans and grants to assist individual home-owners, bona fide housing organisations, housing co-operatives and local authorities undertake urban renewal projects.
During 1986–87 grants of $35,000 and loans of $520,000 were authorised. In the implementation and administration of the new urban renewal programme the corporation is assuming a role as a facilitator to encourage urban renewal in the wider community. The emphasis in this programme is to encourage ‘local solutions to local problems’.
The Housing Corporation builds departmental houses for government departments and the armed forces. However, corporatisation of the public sector has significantly reduced the need for new departmental housing. The numbers of these houses erected by the corporation has declined markedly. In the year ended 31 March 1987 contracts were let for only 13 new departmental houses while in the previous year this figure was 69.
Table 19.5. HOUSING CORPORATION LOANS AUTHORISED
| Type of loan | Year ended March 1986 | Year ended March 1987 | ||
|---|---|---|---|---|
| Number | Value | Number | Value | |
*Loans by the Housing Corporation on sections sold through the Housing Account. †Discontinued from 1 October 1986. ‡Phased out from 1 October 1986. §Introduced in October 1985. ¶Introduced in October 1986. Source: Housing Corporation. | ||||
| $(million) | $(million) | |||
| New houses— | ||||
| Modest income | 2796 | 110.8 | 2180 | 87.6 |
| Tenants scheme | 100 | 3.7 | 55 | 2.4 |
| Service related groups | 323 | 9.8 | 189 | 7.1 |
| Existing houses— | ||||
| Modest income | 5833 | 193.0 | 7490 | 266.5 |
| Tenants scheme | 588 | 20.1 | 352 | 13.4 |
| Service related groups | 2265 | 64.0 | 2626 | 95.1 |
| Home improvement | 1620 | 12.7 | 1344 | 10.0 |
| Refinance/‘second chance’ | 1924 | 45.7 | 1552 | 36.8 |
| Section loans* | 17 | 0.2 | 3 | - |
| Building suspensory loans† | 2156 | 10.8 | 1408 | 7.0 |
| Home-ownership supplemented loans‡ | 963 | 5.7 | 429 | 2.6 |
| Tenancy savings scheme loans | 415 | 0.7 | 153 | 0.3 |
| $(million) | $(million) | |||
| Housing for the elderly | 578 | 8.9 | 471 | 13.6 |
| Urban special loans | 5 | 0.3 | 2 | |
| Equity sharing loans§ | 176 | 9.0 | 348 | 18.0 |
| Homestart and GST assistance¶ | - | - | 7651 | 68.2 |
| Total | 19759 | 495.2 | 26253 | 628.7 |
Table 19.6. HOUSING CORPORATION LOANS BEING ADMINISTERED
| Loans on mortgages | As at 31 March | ||
|---|---|---|---|
| 1985 | 1986 | 1987 | |
| Source: Housing Corporation. | |||
| Residential | 162647 | 162514 | 165531 |
| Local authority | 78 | 48 | 37 |
| Urban housing | 1662 | 1730 | 1776 |
| Rural housing | 1188 | 1188 | 1159 |
| Total | 165575 | 165480 | 168503 |
Table 19.7. HOUSING CORPORATION EXPENDITURE
| Year ended 31 March | Gross expenditure | Increase or decrease over previous year | Funded from public account | Increase or decrease in government expenditure |
|---|---|---|---|---|
| $(000) | percent | $(000) | percent | |
| 1982 | 410,300 | -5 | 175,577 | +21 |
| 1983 | 433,600 | +6 | 222,017 | +26 |
| 1984 | 475,100 | +10 | 249,956 | +13 |
| 1985 | 599,200 | +26 | 460,517 | +84 |
| 1986 | 962,270 | +60 | 503,579 | +9 |
| 1987 | 1,371,638 | +43 | 379,608 | -25 |
Borrowing money on mortgage is a principal means of financing the building or purchase of houses and commercial buildings, and the purchase of farms. Under the Land Transfer Act 1952 under which mortgages are registered ‘mortgage’ means a charge on land created under the provisions of that Act, taking effect as a security, and not operating as a transfer of the estate or interest charged.
Table 19.8. SUMMARY OF MORTGAGES REGISTERED*
| Year ended 31 March | Mortgage registrations | Amount secured | |||||
|---|---|---|---|---|---|---|---|
| Under 2 hectares | 2 hectares and over | Total | Total area | Under 2 hectares | 2 hectares and over | Total | |
| *Excludes certain miscellaneous registrations, but may include minor duplications. | |||||||
| no. | no. | no. | ha(000) | $(m) | $(m) | $(m) | |
| 1983 | 136317 | 29682 | 165999 | 4927 | 2,182.0 | 1,381.6 | 3,563.6 |
| 1984 | 151134 | 27988 | 179122 | 3166 | 2,660.1 | 1,354.5 | 4,014.6 |
| 1985 | 158262 | 27540 | 185802 | 3117 | 2,930.2 | 1,378.4 | 4,308.6 |
| 1986 | 160799 | 25498 | 186297 | 2589 | 4,128.9 | 1,405.9 | 5,534.8 |
| 1987 | 176630 | 20624 | 197254 | 1955 | 5,255.8 | 1,074.4 | 6,330.2 |
Mortgage registration statistics include housing, agricultural, commercial and other land uses. The 197254 mortgage registrations in 1986–87 were in the following categories: first table, 84899; first flat, 48875; subsequent table, 32165; subsequent flat, 25830; increases in amount, 5485.
The following table indicates the sources of finance for mortgages registered. Of the new mortgages registered in 1986–87, 19.78 percent of the aggregate advances were obtained from government agencies (mainly Housing Corporation) compared with 28.60 percent in 1985–86.
Table 19.9. SOURCES OF MORTGAGE FINANCE
| Year ended 31 March | Producer enterprises* | Central govt | Local govt | Trading banks† | Trustee savings banks | Building societies | Insurance and pension funds‡ | Households¶ | Other | Total |
|---|---|---|---|---|---|---|---|---|---|---|
*From 1986 excludes solicitors nominee companies. †Includes related savings banks. ‡Includes Government Life Insurance Corporation and State Insurance Office. §From 1986 includes solicitors nominee companies. | ||||||||||
| $(million) | ||||||||||
| Under 2 hectares | ||||||||||
| 1983 | 600.0 | 397.7 | 6.9 | 31.2 | 92.4 | 200.1 | 177.9 | 327.0 | 348.7 | 2,181.9 |
| 1984 | 725.7 | 523.1 | 8.5 | 36.9 | 74.0 | 218.6 | 172.2 | 363.4 | 537.7 | 2,660.1 |
| 1985 | 802.4 | 580.5 | 9.4 | 47.6 | 89.6 | 273.5 | 221.2 | 418.3 | 487.7 | 2,930.2 |
| 1986 | 195.3 | 1,105.1 | 7.6 | 63.0 | 82.0 | 290.5 | 248.3 | 1,143.1 | 994.0 | 4.128.9 |
| 1987 | 249.1 | 949.3 | 17.1 | 84.9 | 159.2 | 597.2 | 224.1 | 1,290.1 | 1,684.8 | 5,255.8 |
| 2 hectares and over | ||||||||||
| 1983 | 240.6 | 425.8 | 0.1 | 6.6 | 40.3 | 27.7 | 137.6 | 366.1 | 136.8 | 1,381.6 |
| 1984 | 244.3 | 454.5 | 0.8 | 6.7 | 16.5 | 25.0 | 105.3 | 313.1 | 188.3 | 1,354.5 |
| 1985 | 265.4 | 448.2 | 1.9 | 9.5 | 12.2 | 35.2 | 150.4 | 305.8 | 149.8 | 1,378.4 |
| 1986 | 89.0 | 478.0 | 0.7 | 13.7 | 15.6 | 29.9 | 112.3 | 432.4 | 234.2 | 1,405.9 |
| 1987 | 68.5 | 302.9 | 1.8 | 8.9 | 22.6 | 43.5 | 57.5 | 326.3 | 242.4 | 1,074.4 |
The most common construction systems used are light timber framing for housing, reinforced concrete (precast and in situ) for multi-storey buildings and light steel framing for industrial buildings. Construction systems increasing in importance but still uncommon are large-span and 2–3 storey timber structures, and structural steel framing in multi-storey buildings.
All building construction (apart from Crown buildings) requires permission from the local authority. The required approvals are in two main parts; firstly planning permission, and secondly a building permit.
Planning permission involves the district scheme operated by the local authority, which specifies what type of building or project is allowed in a particular area and sets constraints on building height, plot ratios, use, type of industry and similar factors. Local authorities sometimes grant dispensations from the district scheme at special hearings. As a final resort appeals can be made to the national Planning Tribunal (see section 10.1, Legal system). The district scheme is brought up to date every five years.
All new buildings and structural alterations and/or additions to existing buildings require a building permit. Masts and towers over 6.3 metres in height, retaining walls over 1.2 metres, and pools over 23000 litres also require a permit. Local authorities use the model building bylaws produced by the Standards Association of New Zealand, which set out the standards of design, construction, health and safety considerations, etc., required for the work to be in compliance with the building permit. Checking is usually carried out by the authority during construction.
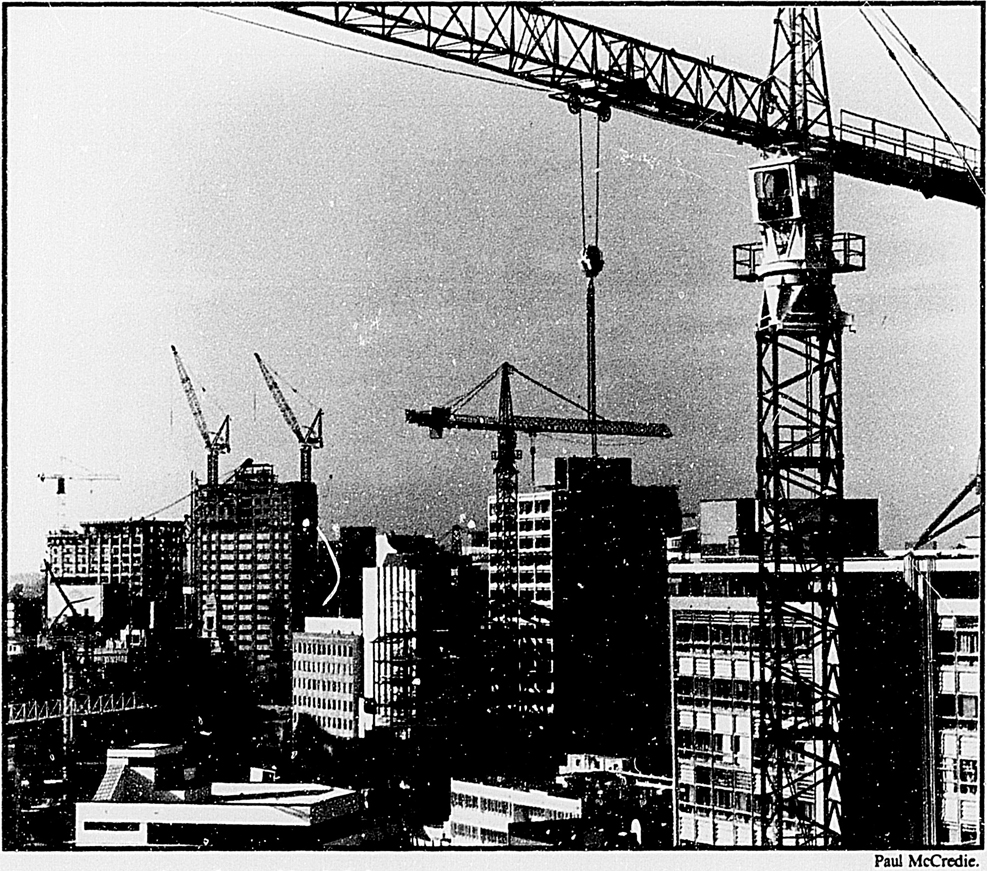
Construction work on the Auckland skyline.
Particular provisions are called up under the by-laws to ensure earthquake resistant design, a field which is well researched locally for concrete and timber structures and their components. Local expertise is also well advanced in hydro and geothermal power station design and construction, and in the area of economic granular road pavements.
The main official building statistics are the Department of Statistics' monthly analyses of building permits and its quarterly analyses of the value of work put in place. Other building information is available from the five-yearly Census of Building and Construction, the five-yearly Census of Population and Dwellings, and inter-industry statistics.
The prime source of these statistics is building permits issued by local authorities. To enable a complete picture of building activity to be shown, construction commenced by government departments, hospitals, and education and harbour boards are included, even though permits may not actually be taken out.
The permit value shown usually represents the contract price or estimated cost of the building prior to the commencement of construction. The finished cost may be higher because of wage increases, the rising cost of materials, etc., particularly in the case of larger buildings.
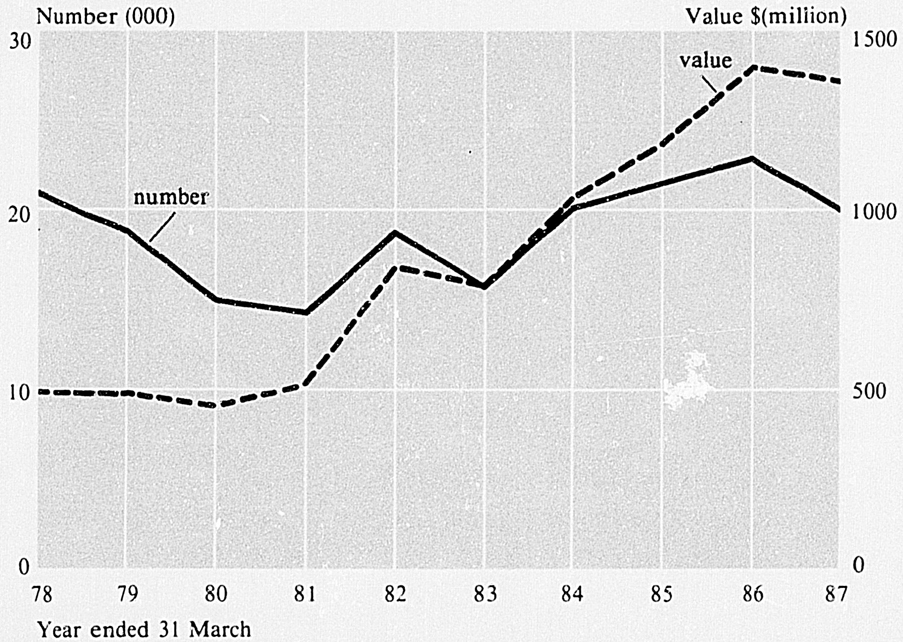
BUILDING PERMITS—new dwellings
The values of building permits for five years to 1987 are described by types of building in the following table. Permits cover alterations and additions as well as new buildings, and government and other buildings not requiring building permits are included.
Table 19.10. VALUE OF BUILDING PERMITS ISSUED
| Type of building | Year ended 31 March | ||||
|---|---|---|---|---|---|
| 1983 | 1984 | 1985 | 1986 | 1987 | |
*Includes additions and alterations. †Includes ancillary buildings. | |||||
| Dwellings— | $(million) | ||||
| New dwellings | 795.1 | 1,035.9 | 1,187.7 | 1,403.0 | 1,361.1 |
| Alterations and additions to dwellings | 294.0 | 330.5 | 330.0 | 354.5 | 409.1 |
| Other buildings*— | |||||
| Hostels, boardinghouses | 15.6 | 13.0 | 13.1 | 20.2 | 20.0 |
| Hotels, motels, etc. | 27.1 | 61.8 | 49.9 | 101.9 | 124.5 |
| Hospitals and nursing homes† | 23.4 | 39.8 | 45.9 | 65.4 | 69.8 |
| Education buildings† | 60.3 | 65.5 | 84.9 | 72.2 | 111.6 |
| Social, cultural, and recreational buildings | 72.1 | 66.5 | 69.8 | 83.4 | 97.6 |
| Shops, restaurants, taverns | 65.6 | 68.2 | 109.5 | 155.5 | 157.2 |
| Office and administrative | 188.9 | 206.5 | 347.7 | 500.1 | 774.5 |
| Warehouses | 70.9 | 67.3 | 100.2 | 161.6 | 160.4 |
| Factories, powerhouses, etc. | 305.6 | 221.8 | 300.1 | 337.3 | 300.8 |
| Farm buildings | 74.0 | 73.0 | 75.9 | 67.8 | 47.3 |
| Miscellaneous buildings | 7.3 | 15.3 | 9.0 | 21.6 | 45.1 |
| All buildings | 2,000.0 | 2,265.2 | 2,723.6 | 3344.5 | 3,678.9 |
Table 19.11. LOCATION AND VALUE OF BUILDING PERMITS, 1986–87
| Main urban area | New dwellings | Other buildings value* | Total buildings value* | |
|---|---|---|---|---|
| Number | Value | |||
| *Includes alterations and additions. | ||||
| $(million) | ||||
| Whangarei | 252 | 14.6 | 22.1 | 40.4 |
| Auckland (Main) Urban Area | 5796 | 430.3 | 727.7 | 1,260.0 |
| Northern Auckland Zone | 1461 | 111.7 | 82.1 | 223.6 |
| Western Auckland Zone | 947 | 59.3 | 46.4 | 118.8 |
| Central Auckland Zone | 1617 | 129.1 | 426.8 | 594.0 |
| Southern Auckland Zone | 1771 | 130.2 | 172.4 | 323.6 |
| Hamilton | 770 | 44.1 | 68.9 | 123.2 |
| Tauranga | 773 | 45.6 | 32.9 | 87.6 |
| Rotorua | 532 | 26.6 | 32.8 | 63.9 |
| Gisborne | 83 | 4.6 | 4.2 | 11.3 |
| Napier | 239 | 14.5 | 8.4 | 28.4 |
| Hastings | 311 | 17.1 | 14.7 | 37.9 |
| New Plymouth | 150 | 10.4 | 38.6 | 54.5 |
| Wanganui | 206 | 11.5 | 16.5 | 31.7 |
| Palmerston North | 244 | 16.5 | 35.9 | 58.7 |
| Wellington (Main) Urban Area | 1201 | 94.5 | 322.5 | 462.7 |
| Upper Hutt Valley Zone | 142 | 9.8 | 12.3 | 26.5 |
| Lower Hutt Valley Zone | 280 | 21.1 | 46.0 | 81.0 |
| Porirua Basin Zone | 334 | 26.9 | 9.6 | 42.3 |
| Wellington City Zone | 445 | 36.8 | 254.6 | 312.9 |
| Nelson | 280 | 19.3 | 27.2 | 52.2 |
| Christchurch | 1324 | 104.9 | 163.4 | 303.7 |
| Timaru | 87 | 5.3 | 7.9 | 15.8 |
| Dunedin | 262 | 19.0 | 44.8 | 73.5 |
| Invercargill | 76 | 4.2 | 7.9 | 17.4 |
| Total, 17 main urban areas | 12586 | 883.0 | 1,5763 | 2,723.0 |
Table 19.12. TYPES OF BUILDING PERMITS AND AUTHORISATIONS, 1986–87*
| Type of building | Type of applicant | |||||
|---|---|---|---|---|---|---|
| Producer enterprises | Financial intermediaries | General government | Private non-profit organizations | Overseas and households | Total | |
*Includes alterations and additions. †Includes ancillary building. ‡Overseas only. | ||||||
| $(000) | ||||||
| Dwellings | 75,120 | 157 | 8,324 | 13,436 | 1,673,090 | 1,770,128 |
| Hostels and boardinghouses | 3,302 | - | 11,384 | 5,311 | - | 19,997 |
| Hotels, motels, etc. | 123,995 | - | 121 | 382 | - | 124,498 |
| Hospitals and nursing homes† | 23,605 | 5,867 | 28,956 | 11,349 | - | 69,778 |
| Education buildings† | 878 | - | 102,256 | 8.571 | - | 111,705 |
| Social, cultural, and recreational | 19,677 | 12 | 23,879 | 54,055 | - | 97,624 |
| Shops, restaurants, taverns | 154,438 | 2,347 | 210 | 195 | - | 157,189 |
| Office and administrative | 593,663 | 109,553 | 65,398 | 5,828 | 71‡ | 774,514 |
| Warehouses | 157,925 | 159 | 1,895 | 383 | 160,362 | |
| Factories, powerhouses, etc. | 277,828 | 427 | 21,486 | 1,045 | - | 300,786 |
| Farm buildings | 46,946 | - | 21 | 361 | - | 47,328 |
| Miscellaneous | 40,051 | 21 | 3,787 | 1,220 | - | 45,079 |
| All buildings | 1,517,429 | 118,543 | 267,719 | 102,137 | 1,673,161 | 3,678,988 |
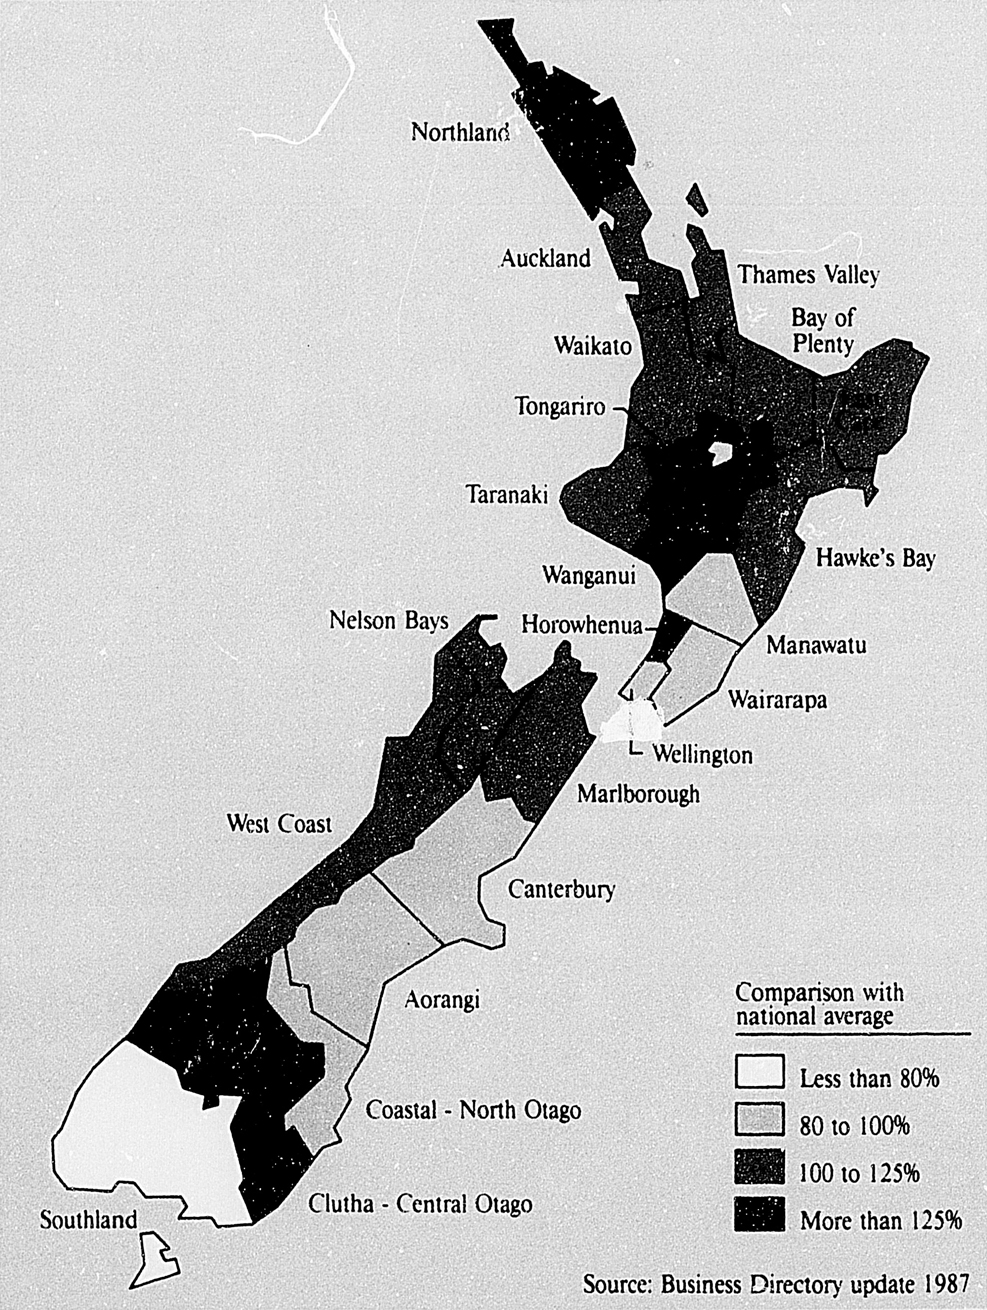
Percentage of workforce employed in BUILDING AND CONSTRUCTION
The high proportion of the total value of building permits represented by dwellings built by the private sector (households) highlights the importance of private investment in residential buildings as a key to stability in the building industry. The total for dwellings during 1986–87 includes 20128 permits or authorisations to a total value of $1,361.1 million for new dwellings. This includes authorisations by central government for 1067 new dwellings (value $69.9 million).
Some categories of buildings used in those and other building permit tables require additional explanation. ‘Hostels and boardinghouses’, for example, includes barracks, orphanages, nurses' homes, and boarding school accommodation; ‘hotels and motels’ includes private and licensed hotels, but exclude taverns; ‘education buildings’ includes primary and secondary schools, teachers colleges, technical institutes, university buildings, kindergartens, and play centres; and the broad category of ‘social, cultural, recreational buildings’ includes churches, halls, theatres, cinemas, clubrooms, community centres, and grandstands.
The average permit value for new for dwellings in 1986–87 was $67,620 compared with $60,908 in 1985–86, $54,525 in 1984–85, $51,214 in 1983–84 and $49,695 in 1982–83.
Table 19.13. PERMITS FOR NEW DWELLINGS
| Year ended 31 March | Units | Value | Area | Total dwelling permits* | Total permits all buildings* |
|---|---|---|---|---|---|
| *Includes additions and alterations. | |||||
| no. | $(million) | sq m (000) | $(million) | ||
| 1983 | 15999 | 795.1 | 2013.1 | 1,089.1 | 2,000.0 |
| 1984 | 20226 | 1,035.9 | 2531.5 | 1,366.3 | 2,265.2 |
| 1985 | 21782 | 1,187.7 | 2686.4 | 1,517.7 | 2,723.6 |
| 1986 | 23035 | 1,403.0 | 2847.8 | 1,757.5 | 3,344.5 |
| 1987 | 20128 | 1,361.1 | 2542.7 | 1,770.1 | 3,679.0 |
The Department of Statistics makes a quarterly survey of building work put in place. In contrast to the statistics based on building permits, these figures show the gross value of actual work done. It should be noted that there are varying time-lags between the issue of the building permit and the commencement of building. The actual work for which a permit is issued can be extended over varying periods. Also, the total value of this work may differ considerably from the value estimated on the building permit, especially in times of inflation.
Table 19.14. WORK PUT IN PLACE
| Year ended 31 March | Dwellings | |||
|---|---|---|---|---|
| New dwellings | Alterations and additions | Subtotal | ||
| Government | Other | |||
| $(million) | ||||
| 1983 | 25.3 | 782.9 | 304.4 | 1,112.7 |
| 1984 | 22.1 | 899.8 | 326.9 | 1,248.7 |
| 1985 | 38.2 | 1,092.2 | 342.5 | 1,472.9 |
| 1986 | 55.9 | 1,296.5 | 363.6 | 1,716.0 |
| 1987 | 67.7 | 1,281.5 | 428.2 | 1,777.3 |
Table 19.14a. WORK PUT IN PLACE
| Year ended 31 March | Other buildings* | Total | ||||||
|---|---|---|---|---|---|---|---|---|
| Hotels, boarding-homes† | Hospitals† | Factories | Commercial buildings | Schools† | Miscellaneous‡ | Subtotal | ||
*Includes alterations and additions. †And ancillary buildings. ‡Includes churches and sports entertainment buildings. | ||||||||
| $(million) | ||||||||
| 1983 | 612 | 43.0 | 274.5 | 399.3 | 72.5 | 138.3 | 994.7 | 2,107.4 |
| 1984 | 61.2 | 39.2 | 323.7 | 413.5 | 67.6 | 158.7 | 1,063.9 | 2,312.6 |
| 1985 | 69.8 | 46.1 | 329.0 | 527.5 | 71.7 | 169.9 | 1,213.9 | 2,686.8 |
| 1986 | 105.4 | 57.2 | 431.8 | 786.4 | 99.2 | 167.9 | 1,648.1 | 3,364.1 |
| 1987 | 146.7 | 99.6 | 342.6 | 1,133.4 | 89.6 | 187.5 | 1,999.5 | 3,776.8 |
Table 19.15. BUILDING MATERIAL PRODUCTION
| Item | Unit | Year ended 31 December | |||
|---|---|---|---|---|---|
| 1983 | 1984 | 1985 | 1986 | ||
| *Year ended 31 March. | |||||
| Ready-mixed concrete | cubic metres (000) | 1297x | 1490x | 1618 | 1771 |
| Paint and varnish— | |||||
| Paints (not water-based) and enamels, lacquers, varnishes, and reaction clears | litres (000) | 18131 | 21030 | 20038 | 18422 |
| Water-based paints, including emulsions | litres (000) | 11425 | 12361 | 13083 | 13390 |
| Fibreboard* | tonnes (000) | 80 | 93 | 97 | 109 |
| Sawn timber* | cubic metres (000) | 2136 | 2096 | 2306 | 2398 |
| 136 | |||||
| Particleboard* | cubic metres | 569 | 157960 | 186190 | 179530 |
| Plywood* | cubic metres | 56316 | 47709 | 5405 | 58577 |
| Cement | tonnes (000) | 760 | 823 | 864x | 895 |
The Census of Building and Construction formed part of the series of integrated economic censuses of business activities over a five-yearly cycle. The 1984–85 census covered all operations carried out by activity and ancillary activity units in the building and construction industries during the year ended 31 March 1985 (those with different balance dates submitted data for the year ended within the period 1 April 1984 and 31 March 1985).
The series of business censuses has been replaced by an economy wide census. See chapter 26, National economy.
Table 19.16. SUMMARY, CENSUS OF BUILDING AND CONSTRUCTION 1984–85
| Statistical item | Division 51 Building | Division 52 Construction | Division 53 Services to building and construction | Major Division 5 Building and construction |
|---|---|---|---|---|
| number | ||||
| Group enterprises | 5525 | 1139x | 6907 | 13529x |
| Enterprises | 5563 | 1174x | 6966 | 13697x |
| Activity units | 5911 | 1499x | 7113 | 14474x |
| Ancillary activity units | 85 | 49 | 15 | 149 |
| Vehicles | 12622 | 15393x | 18681 | 46696x |
| Full-time working proprietors and partners engaged | 6196 | 981 | 8156 | 15333 |
| Part-time working proprietors and partners engaged | 878 | 125 | 1151 | 2154 |
| Full-time paid employees engaged | 18864 | 27142x | 16703 | 62709x |
| Part-time paid employees engaged | 1136 | 398 | 1660 | 3195 |
| Total persons engaged | 27074 | 28646x | 27670 | 83390x |
| $(000) | ||||
| Full-time equivalent—working proprietors and partners | 6635 | 1043 | 8732 | 16410 |
| —paid employees | 19432 | 27342x | 17533 | 64306x |
| —total persons | 26067 | 28385x | 26264 | 80716x |
| $(000) | ||||
| Opening stocks | 227,952 | 39,791 | 47,273 | 315,015 |
| Closing stocks | 292,623 | 61,045 | 56,971 | 410,639 |
| Purchases—land and buildings | 98,720 | 12,842 | 1,567 | 113,128 |
| —fuel and power | 26,587 | 80,819 | 37,157 | 144,563 |
| —materials, equipment and goods for resale | 886,498 | 454,085 | 582,010 | 1,922,592 |
| Salaries and wages to paid employees | 337,522 | 515,592x | 287,690 | 1,140,804x |
| A.C.C. levies/employer contributions etc. | 11,140 | 15,178x | 6,157 | 32,476x |
| Payments to—Labour-only contractors | 56,944 | 61,455 | 25,479 | 143,878 |
| —Sub-contractors | 777,813 | 393,656x | 46,514 | 1,217,983x |
| Renting and leasing of plant and equipment | 24,477 | 103,207 | 17,620 | 145,304 |
| Business insurance premiums | 7,611 | 8,165 | 8,619 | 24,395 |
| Road user charges | 341 | 6,633 | 689 | 7,663 |
| Rates, local central government fees, etc. | 8,769 | 5,449x | 1,997 | 16,215x |
| Depreciation | 21,091 | 52,023 | 31,661 | 104,776 |
| Interest, bad debts, donations etc. | 34,113 | 28,943x | 23,643 | 86,699x |
| All other operating expenses | 146,129 | 452,561x | 112,921 | 711,611x |
| Total, purchases and expenses | 2,437,755 | 2,190,608x | 1,183,727 | 5,812,090x |
| Construction and reno of buildings | 2,264,571 | 126,826 | 548,524 | 2,939,921 |
| Construction, other than buildings | 82,179 | 1,693,180x | 223,097 | 1,998,455x |
| Repairs and maintenance | 87,613 | 404,002 | 571,308 | 1,062,922 |
| Interest, dividends, royalties etc. | 18,877 | 22,904x | 5,504 | 47,285x |
| Other income | 141,954 | 82,726 | 45,913 | 270,594 |
| Total, sales and other income | 2,595,194 | 2,329,637x | 1,394,346 | 6319,177x |
| Salaries to working proprietors and partners | 57,863 | 19,947 | 85,615 | 163,425 |
| Net profit/loss, before tax, and after distributing proprietors' salaries | 164,248 | 140,336x | 134,703 | 439,287x |
| Net profit/loss on extraordinary items | 5,627 | 4,342x | 3,122 | 13,091x |
| Operating surplus | 237,347 | 166,321x | 238,457 | 642,125x |
| Value added | 615,665 | 760,246x | 566,451 | 1,942,362x |
| Additions to fixed assets | 74,180 | 176,074x | 82,324 | 332,578x |
| Disposals of fixed assets | 25,248 | 37,413 | 24,780 | 87,442 |
| Book value of fixed assets | 207,574 | 251,744x | 204,755 | 664,072x |
Table 19.17. REGIONAL EMPLOYMENT, CENSUS OF BUILDING AND CONSTRUCTION 1984–85
| Local government region | Enterprise groups | Enterprises | Activity units | Ancillary activity units | Persons engaged | Salaries and wages to paid employees |
|---|---|---|---|---|---|---|
| no. | $(000) | |||||
| Northland | 575 | 580 | 603 | 6 | 6082 | 106,232 |
| Auckland | 3547x | 3604x | 3688x | 31 | 19920x | 264168x |
| Thames Valley | 275 | 275 | 286 | 3 | 1028 | 9,900 |
| Bay of Plenty | 845 | 851 | 887 | 9 | 4197 | 47,727 |
| Waikato | 895 | 906 | 952 | 9 | 6356 | 102,795 |
| Tongariro | 194 | 194 | 215 | 4 | 1123 | 17,670 |
| East Cape | 213 | 213 | 226 | 6 | 1275 | 13,858 |
| Hawke's Bay | 622 | 631 | 648 | 5 | 3158 | 38,300 |
| Taranaki | 525 | 531 | 545 | 8 | 4629 | 72,389 |
| Wanganui | 278 | 280 | 300 | 5 | 2316 | 35,261 |
| Manawatu | 515 | 519 | 538 | 5 | 2721 | 33,229 |
| Horowhenua | 301 | 301 | 308 | 1 | 947 | 7,605 |
| Wellington | 1324 | 1338 | 1384 | 16 | 9122 | 137,544 |
| Wairarapa | 186 | 189 | 198 | - | 764 | 7,752 |
| Total, North Island | 10123x | 10256x | 10778x | 108 | 63638x | 894,430x |
| Nelson Bays | 306 | 308 | 317 | 3 | 1485 | 15,936 |
| Marlborough | 164 | 164 | 178 | 2 | 790 | 8,877 |
| West Coast | 121 | 121 | 150 | 4 | 796 | 11,002 |
| Canterbury | 1247 | 1260 | 1299 | 11 | 6671 | 77,537 |
| Aorangi | 334 | 336 | 351 | 4 | 1946 | 26,442 |
| Clutha-Central Otago | 319 | 320 | 339 | 6 | 2267 | 36,245 |
| Coastal-North Otago | 554 | 560 | 589 | 9 | 3570 | 44,490 |
| Southland | 458 | 460 | 473 | 2 | 2227 | 25,843 |
| Total, South Island | 3440 | 3469 | 3696 | 41 | 19752 | 246,373 |
| Total | 13529x | 13697x | 14474x | 149 | 83390 | 1,140,804x |
19.1 Housing Corporation.
19.2 Valuation New Zealand; Department of Statistics; Housing Corporation.
19.3–19.4 Department of Statistics.
Annual Accounts and Statistics. Housing Corporation of New Zealand.
Fading Expectations—the Crisis in Maori Housing. Department of Maori Affairs, 1986.
Financial Institutions; Their Ability to Lend for Housing. National Housing Commission, 1984.
Housing New Zealand. National Housing Commission, 1988.
Housing Provision for the Elderly. National Housing Commission, 1987.
Infill Housing. National Housing Commission, 1986.
Marriage Breakdown and its Effect on Housing. National Housing Commission, 1985.
Population and Social Trends; Implications for New Zealand Housing. National Housing Commission, 1986.
The Private Residential Landlord and Tenant in Christchurch. National Housing Commission, 1986.
Quality Evaluation of Residential Buildings. National Housing Commission, 1985.
Report of the Housing Corporation of New Zealand (Parl. paper B. 13).
Report of the National Housing Commission (Parl. paper G.30).
Report of the Valuation Department (Parl. paper G.26).
Supply Aspects of Housing 1985–86 to 1988–89. National Housing Commission, 1987.
Urban Real Estate Market in New Zealand. Valuation Department (six-monthly).
Women's Views on Housing. Housing Corporation of New Zealand, 1987.
Table of Contents
The evolution of New Zealand's transport system is characterised not only by the country's remoteness from many of its trading partners, but also by its relatively small population being spread over two main islands with a combined length of nearly 2000 kilometres.
International air and telecommunication links have helped overcome the country's isolation, but there is still a heavy reliance on sea transport for overseas trade.
The establishment of road and rail links to ports served by refrigerated cargo ships was an important factor in New Zealand's development as one of the world's major exporters of meat and dairy products. Comprehensive railway and road networks have been established over difficult terrain, frequently through innovative engineering, and at a high capital cost when compared with the population.
In recent years the trend of deregulation has brought change to most sectors of the transport industry.
A significant event affecting the country's railways was the turning of the former Railways Department into the Railways Corporation in 1982. This spearheaded a number of major changes in the industry.
Legislative restrictions encouraging the use of railways by imposing distance limits on road transport operations were gradually discontinued between 1983 and 1986. In 1984 the quantitative licensing system for road transport operators was replaced by a qualitative system for all but taxi services. Licensing provisions for both the taxi industry and the rest of the road transport industry are currently under review by the Ministry of Transport.
In aviation, the regulatory and commercial functions of the Ministry of Transport's Civil Aviation Division have been separated. On 1 April 1987 the Airways Corporation of New Zealand Limited was formed to take over the division's commercial operations. International air services have expanded since December 1985, when the Government announced its liberalised external aviation policy. Domestic aviation has been opened up to competition. In mid-1987 the privately-owned Ansett New Zealand began flying on domestic routes in direct competition with Air New Zealand.
There have also been changes in the way New Zealand's airports are managed. Airports, which were run jointly by local and central government, are being encouraged to form airport companies, On 1 April 1988 Auckland and Christchurch airports formed companies. Several other airports are expected to form companies by the end of 1988.
New Zealand's ports industry is experiencing similar changes. Companies are in the process of being established to manage the commercial operations of the ports. Harbour Boards will retain a majority shareholding in the new companies and will oversee the ports’ recreational and non-commercial activities.
Over 90 percent of New Zealand exports and imports by value, and almost 99 percent by volume, are carried by sea. This clearly illustrates the importance to New Zealand of efficient and cost competitive international shipping services. In contrast, coastal shipping in New Zealand has been steadily eroded by rail and road transport. However, the core of inter-island ferries, bulk cement and fuel carriers remains essential to New Zealand's transport system.
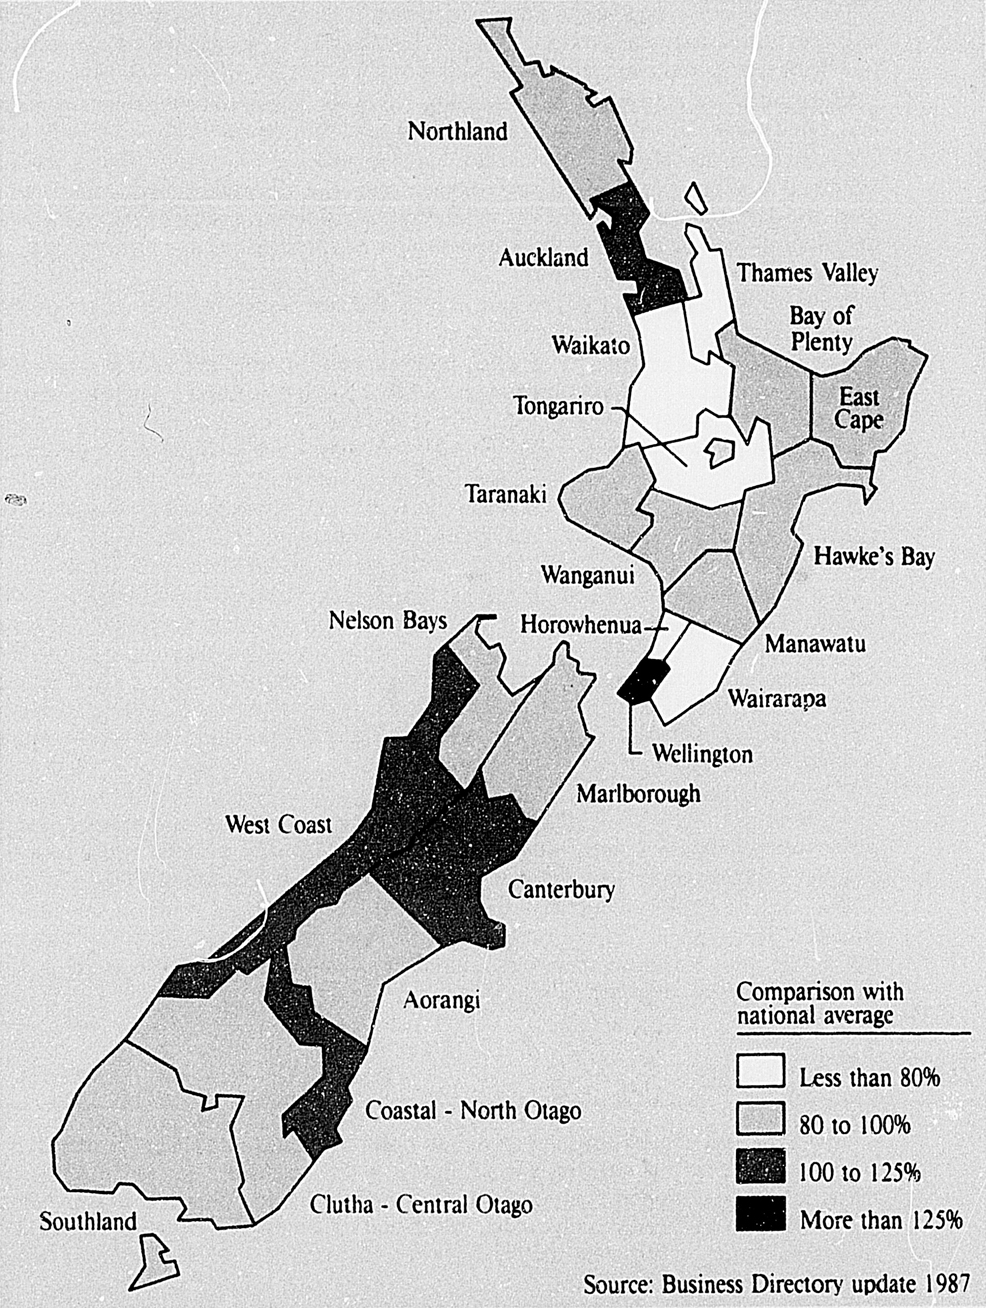
Percentage of workforce employed in TRANSPORT, STORAGE AND COMMUNICATION
Recently there has been renewed interest in coastal tug and barge operations as a flexible, lower-cost alternative to conventional means of shipping some bulk cargoes such as coal.
Although heavily reliant on foreign-owned shipping, New Zealand exporters and importers have benefited from the intensely competitive conditions created by world-wide overtonnaging in recent years. These conditions have suppressed freight rates in real terms and forced ship owners to cut costs. They have also given rise to new shipping services as owners redeploy surplus and under-utilised ships.
At the same time the impact of capital and operating costs has accelerated the development of on-board automation and engine, hull and propeller design. This has achieved economies in crewing, maintenance and fuel costs as new ships replace older vessels which are less efficient and more expensive to operate. Such developments are expected to maintain sea freight costs at competitive levels as the industry resolves the problem of overtonnaging.
Conference lines handle much of New Zealand's overseas shipping. These are associations between shipping companies to provide joint service on established trade routes. New Zealand's shipping operations in this conference arrangement are handled by the Shipping Corporation, a wholly government-owned shipping line. The New Zealand Line is the trading name of the Shipping Corporation. The corporation was established by Act of Parliament in 1973 and commenced trading in 1974. It adopted the name New Zealand Line in 1985. The Government announced in its Budget of 28 July 1988, its intention to sell or lease its interest in the line.
The conference lines and trade routes are set out below.
The New Zealand European Shipping Association and the New Zealand and United Kingdom Shipowners’ Committee play the main role in the carriage of New Zealand exports to Europe. The association serves Mediterranean and Northern European ports and comprises three British and eight European lines, the Australian National Line, and the New Zealand Line; while the committee serves the United Kingdom and comprises three British lines, as well as the Australian National Line, and the New Zealand Line. Competition from independent lines outside the conference is strong.
Direct container services are provided by NYK Line (Japan) and a United Kingdom joint service (Blue Star and P&OCL). Some lines in the New Zealand-United Kingdom/Europe conference trade also offer direct services and a number of other carriers provide container trans-shipment services. Chartered conventional tonnage plays an important role in these trades.
New Zealand's outward liner trade is served by one conference, a joint service and a number of independent operators. The New Zealand Line is a member of the Australian and New Zealand Eastern Shipping Conference which provides a direct container service between New Zealand, Japan and Korea. A trans-shipment service to China on China Ocean Shipping Company vessels from Australia has operated since 1985.
Changes to United States regulations governing line shipping have recently opened the way for the rationalisation of services on these trades. The New Zealand Line and Australia/New Zealand Container Lines merged with the Swedish Pacific Australia Direct Line to form the Australia/New Zealand Direct Line in 1987. This line operates between Australia, New Zealand and the United States and provides for the transport of cargo by road and rail from the west coast of North America to destinations throughout the United States and Canada.
Australia/New Zealand Container Lines also joined the Blue Star and Pace Lines (United Kingdom), and the Columbus Line (West Germany) in a cross-charter agreement to coordinate services.
Australian and New Zealand carriers play a prominent role in the provision of trans-Tasman shipping services. The largest market share is held by the long-established Union Shipping Group which is based in New Zealand and operates one multi-purpose and two roll-on/roll-off vessels. Most of the remaining cargo is carried by another New Zealand line, Tasman Express Line, and a joint venture between the Australian National Line and the New Zealand Line known as Tranztas. Tasman Express Line and Tranztas operate two container vessels each. Since 1987 Tranztas and the Union Shipping Group have rationalised their services under a space sharing agreement.
Pacific Forum Line increased its involvement in this trade with the introduction of eastward and westbound services to Brisbane, using the Forum New Zealand II, in 1987. Company shipping, deployed primarily to provide in-house capacity for semi-bulk cargoes such as forest products and steel, also provide limited services for general cargo on backhaul voyages.
The New Zealand Line at present manages and operates the Cook Islands/Niue/New Zealand joint shipping service on behalf of the governments of the three countries, and one New Zealand Line vessel serves the trade under charter to the Ministry’ of Foreign Affairs. The regionally-owned Pacific Forum Line operates three container vessels linking New Zealand, Fiji, Tonga, Western Samoa, the Solomon Islands, Papua New Guinea, New Caledonia and Australia, and provides a feeder service to Tuvalu and Kiribati.
A Cook Islands Line vessel has provided a breakbulk service (where more than one type of bulk cargo is carried at once) to Niue and the Cook Islands since September 1986. Container and breakbulk services to the region are provided by vessels from New Zealand, Fiji and Tonga as well as French. Dutch, Norwegian. Polish and Israeli vessels.
A regular and frequent ferry service across Cook Strait between Wellington and Picton is provided by rail ferries operated by the Railways Corporation. The Arahura and Aratika carry vehicles, passengers and freight. The Arahanga is confined to the carriage of freight and provides passenger accommodation only for truck drivers and others whose vehicles are carried. Pacifica Shipping Limited, now a subsidiary of Skeggs Corporation Limited, operates the freight-only roll-on/roll-off vessels Spirit of Competition between Wellington and Lyttelton, and Spirit of Freedom between Lyttelton and Auckland.
A freight-only shipping service to the Chatham Islands is subsidised by government, while a private operator has provided a passenger/freight service to Stewart Island since September 1985.
In tonnage terms, most of New Zealand's external trade is carried in bulk vessels. While a certain amount of bulk tonnage is dedicated to the trade—such as the two trans-Tasman forest product carriers owned by Tasman Pulp and Paper, and the bulk ore vessel used to carry alumina from Queensland to the Tiwai Point aluminium smelter—New Zealand's bulk-shipping needs are served in the main by a fluid mix of vessels.
Cargoes carried by these vessels (frequently registered in open-registry countries like Liberia and Panama) include crude oil, phosphate rock and petroleum coke inwards, and ironsands, coal and forest products outwards.
Bulk cement distribution is handled by four small cement carriers operated by New Zealand Cement Holdings Ltd (2), the Tarakohe Shipping Company Ltd (1), and Wilsons (N.Z.) Portland Cement Ltd (1). Four product tankers operated by the Union Steam Ship Company on behalf of the oil industry distribute petroleum products from the Marsden Point oil refinery, whilst the Liquigas lpg carrier Tarihiko operates under New Zealand Shipping Corporation management.
Shipping statistics are compiled from returns lodged by port authorities. These returns also detail the amount of coastal cargo loaded or unloaded at ports. Overseas cargo details are obtained from customs entry data.
In the year ended December 1986, 10166 arrivals and 10161 departures were recorded. The busiest port was Wellington with 2816 arrivals and 2812 departures, although a good proportion of these figures come from the Cook Strait rail ferries and foreign fishing vessels calling at the port for registration and provisioning. By tonnage, Auckland handled over 8 million net registered tons of shipping in the 1986 year, of which over 5 million net registered tons was for ships arriving from overseas ports. (The size of registered ships is measured in ‘net register tons’, an imperial unit equivalent to 100 cubic feet of cargo space. Cargo figures are, on the other hand, expressed below as weight in metric tonnes.)
All cargo is now measured in gross tonnes, instead of manifest tonnes, as part of a move towards better international comparability. Commodities recorded under coastal cargo have been limited to those items either carried in bulk or readily identifiable from ships’ manifests.
For the year ended 31 December 1986 a total of 13.4 million tonnes of cargo was shipped between New Zealand ports. Whangarei loaded out 1.9 million tonnes of refined petroleum products while Port Taranaki loaded 2.5 million tonnes of petroleum crude and liquified petroleum gas for other ports. Bulk cement totalling 764000 tonnes was carried from works near Whangarei (286000 tonnes), Tarakohe (151000 tonnes), and Westport (325000 tonnes) during the year. Rail ferry traffic between Wellington and Picton accounted for 697000 tonnes of southbound cargo and 682000 tonnes northbound.
Table 20.1. COASTAL CARGO—MAJOR ITEMS CARRIED. 1986*
| Commodity | Unloaded | Loaded |
|---|---|---|
* Year ended 31 December | ||
| gross tonnes | ||
| Cement | 746117 | 763556 |
| Coal and coke | - | - |
| Petroleum products | 3876801 | 3946998 |
| Sand and shingle | 81346 | 230529 |
| Grain | 40647 | 48284 |
| Motor vehicles | 325821 | 331379 |
| Container goods | 201106 | 237292 |
| Other goods | 1245822 | 1292631 |
| Total | 6517660 | 6850669 |
Cargo loaded during the 1986 year for overseas destinations totalled 9.7 million tonnes, of which 2.2 million tonnes were ironsands from Taharoa and Waverley. Tauranga loaded 1.7 million tonnes and Auckland. 1.1 million tonnes, while total cargo loaded for overseas at South Island ports amounted to 2.6 million tonnes.
Imported cargo totalled 6.0 million tonnes for the year ended 31 December 1986. Of this. Auckland unloaded 1.6 million tonnes, Whangarei 1.1 million tonnes and Tauranga 0.8 million tonnes. South Island ports accounted for 1,7 million tonnes of inwards cargo from overseas.
Table 20.2. OVERSEAS CARGO—COMMODITIES CARRIED, 1986*
| Unloaded | Loaded | |||
|---|---|---|---|---|
| Commodity | Gross tonnes | c.i.f. | Gross tonnes | f.o.b. |
* Year ended 31 December. | ||||
| $(m) | $(m) | |||
| Food and live animals | 380286 | 580 | 2779158 | 5,082 |
| Beverages and tobacco | 33681 | 123 | 21885 | 40 |
| Crude materials | 1287894 | 395 | 3873284 | 2,434 |
| Mineral fuels | 2420066 | 699 | 535379 | 79 |
| Animal and vegetable oils | 42757 | 44 | 117318 | 59 |
| Chemicals and related products | 673639 | 1,371 | 548576 | 563 |
| Manufactured goods | 907817 | 2,179 | 1711151 | 1,661 |
| Machinery and transport equipment | 250662 | 4,133 | 46166 | 961 |
| Miscellaneous manufactured articles | 69329 | 1,295 | 31636 | 447 |
| Commodities and transactions not classified elsewhere | 4286 | 162 | 73861 | 37 |
| Total | 6070416 | 10,981 | 9738414 | 11,369 |
Overseas arrivals and departures are classified according to the country last visited and the next country to which the ship is cleared. Some port information within the foreign country is also recorded. This enables analyses by ‘previous’ and ‘next’ country to be compiled. However, this should not be confused with the origin or destination of the ship or the cargo. For example, ships destined for UK/Europe will often be cleared for Panama upon their departure from New Zealand. Similarly, container vessels on the North American west coast trade route may call at an Australian port en route.
Table 20.3. OVERSEAS ARRIVALS AND DEPARTURES WITH CARGO BY TRADE ROUTES, 1986*
| Arrivals | Departures | |||||
|---|---|---|---|---|---|---|
| Trade routes | Number 1 vessels | Net tonnage | Cargo tonnage | Number 1 vessels | Net tonnage | Cargo tonnage |
* Year ended 31 December † Includes Hawaii ‡ Includes Mexico. § Excludes fishing vessels at sea but includes coastwise visits of overseas ships. | ||||||
| United Kingdom-Europe | 505 | 6487589 | 524164 | 474 | 6362465 | 1085548 |
| North American trans west coast† | 242 | 1959675 | 646632 | 189 | 1525349 | 268892 |
| Japan and Asia | 1221 | 9718059 | 1230322 | 1175 | 9361528 | 5714159 |
| Trans-Tasman | 691 | 3473535 | 1671834 | 731 | 4095085 | 904305 |
| Singapore, India, Malaysia and Persian Gulf | 247 | 2051935 | 1223855 | 292 | 2203476 | 603715 |
| North American trans east coast‡ | 168 | 1976604 | 299394 | 156 | 1795645 | 406550 |
| Africa | 24 | 54604 | 3177 | 15 | 43182 | 9272 |
| West Indies and South America | 113 | 535372 | 124132 | 129 | 661636 | 255121 |
| Pacific Islands | 404 | 1782293 | 266172 | 373 | 1694372 | 355115 |
| Total§ | 3615 | 28039666 | 5989682 | 3534 | 27742738 | 9602677 |
Port and country data for cargo loaded are given in table 20.4, which gives the gross tonnage of export cargo handled by selected exporting ports of New Zealand and the total tonnage handled. The country referred to in the table is the country of destination of the cargo as declared on the export documentation.
Shipping movements are categorised as either ‘overseas’ or ‘coastwise’. In table 20.5 overseas arrivals and departures are those which have come directly from or have been cleared to a foreign port. Foreign fishing vessels working the Exclusive Economic Zone are also included in the overseas category. Coastwise arrivals and departures include the coastwise movements of overseas ships subsequent to their arrival from overseas and prior to final clearance, and also the movements of domestic shipping.
Table 20.4. OVERSEAS CARGO LOADED BY SELECTED PORTS AND COUNTRIES, 1986*
| Country | Auckland | Tauranga | Port Taranaki | Napier | Lyttelton | Invercargill (Bluff) |
|---|---|---|---|---|---|---|
* Year ended 31 December. † Includes countries not listed separately. | ||||||
| gross tonnes | ||||||
| Algeria | 8103 | 15410 | 5817 | 1664 | - | - |
| American Samoa | 8388 | 1038 | - | - | 590 | - |
| Australia | 110670 | 331832 | 173815 | 19826 | 63631 | 13 |
| Belgium | 6625 | 3278 | 369 | 123 | 5044 | 33 |
| Brazil | 114 | 41403 | 5048 | - | 45 | - |
| Canada | 19391 | 260 | - | 30 | 1011 | - |
| China (Province of Taiwan) | 16145 | 56370 | 6043 | 13049 | 13383 | 27322 |
| China (People's Republic of) | 38611 | 94326 | - | 45124 | 7559 | 23344 |
| Cook Islands | 12839 | - | - | - | 5 | - |
| Cuba | - | 2523 | 10523 | - | - | - |
| Fiji | 49279 | 15149 | - | - | 1000 | - |
| France | 7127 | 6020 | 263 | 887 | 3661 | 2682 |
| French Polynesia | 17446 | - | 30 | 3520 | 4 | - |
| Germany (Federal Republic of) | 18154 | 22049 | 1124 | 2733 | 7084 | 2276 |
| Hong Kong | 7800 | 37167 | - | 7717 | 7768 | 2891 |
| India | 5206 | 9643 | 1976 | 39373 | 16542 | 509 |
| Indonesia | 19072 | 56018 | 12647 | 29480 | 12156 | 10144 |
| Iran | 16303 | 6939 | 6244 | 38204 | 26130 | 51998 |
| Italy | 3590 | 4865 | 70 | 2576 | 1072 | 96 |
| Japan | 129397 | 583948 | 159895 | 277375 | 325822 | 373044 |
| Korea (Republic of) | 9634 | 51094 | 12120 | 14822 | 27925 | 23989 |
| Malaysia | 9739 | 61610 | 37 | 5173 | 6154 | 2262 |
| Mexico | 454 | 9739 | 9241 | - | 1241 | - |
| Netherlands | 13576 | 8299 | 90859 | 3537 | 4747 | 1041 |
| New Caledonia | 8769 | 4136 | - | 299 | 247 | - |
| Papua New Guinea | 27350 | 11073 | - | 12312 | 5838 | - |
| Peru | 3422 | 9259 | 5882 | 9049 | 3211 | 13202 |
| Philippines | 5728 | 48370 | 664 | 2676 | 5006 | 30 |
| Saudi Arabia | 9096 | 882 | 4884 | 13750 | 22532 | 29863 |
| Singapore | 10051 | 75044 | 99643 | 9270 | 5158 | 2185 |
| Sri Lanka | 4171 | 14224 | 58 | 129 | 426 | - |
| Thailand | 1997 | 25878 | 32 | 900 | 791 | 450 |
| United Kingdom | 16368.9 | 2058 | - | 13258 | 34700 | 210 |
| U.S.A. | 256649 | 7313 | 180485 | 16247 | 6418 | 96 |
| U.S.S.R. | 8933 | 24206 | 13524 | 19340 | 5484 | 15061 |
| Total, all countries† | 1054567 | 1691291 | 830606 | 066593 | 643066 | 603174 |
Table 20.5. OVERSEAS AND COASTWISE SHIPPING BY SELECTED PORTS, 1986*
| Coastwise | Overseas | |||
|---|---|---|---|---|
| Selected ports | No. of vessels | Net tonnage (000) | No. of vessels | Net tonnage (000) |
* Year ended 31 December. † Includes ports not listed separately. | ||||
| Arrivals | ||||
| Whangarei | 279 | 1986 | 66 | 546 |
| Auckland | 517 | 2896 | 612 | 5182 |
| Tauranga | 296 | 2302 | 204 | 1283 |
| Port Taranaki | 541 | 2274 | 99 | 593 |
| Napier | 224 | 1488 | 72 | 317 |
| Wellington | 2280 | 6675 | 536 | 1536 |
| Nelson | 135 | 835 | 186 | 567 |
| Picton | 1755 | 3038 | 5 | 16 |
| Lyttelton | 606 | 2946 | 298 | 960 |
| Timaru | 143 | 1033 | 76 | 122 |
| Otago | 257 | 2329 | 155 | 675 |
| Invercargill (Bluff) | 105 | 868 | 82 | 672 |
| Total, all ports† | 7647 | 29354 | 2519 | 13388 |
| Departures | ||||
| Whangarei | 280 | 1979 | 64 | 543 |
| Auckland | 712 | 4908 | 419 | 3151 |
| Tauranga | 202 | 1664 | 304 | 2002 |
| Port Taranaki | 540 | 2305 | 94 | 556 |
| Napier | 178 | 1213 | 117 | 558 |
| Wellington | 2348 | 7225 | 464 | 972 |
| Nelson | 146 | 770 | 172 | 632 |
| Picton | 1756 | 3009 | 5 | 45 |
| Lyttelton | 608 | 2706 | 298 | 1166 |
| Timaru | 102 | 780 | 115 | 372 |
| Otago | 191 | 1333 | 221 | 1678 |
| Invercargill (Bluff) | 87 | 780 | 101 | 773 |
| Total, all ports† | 7634 | 29361 | 2527 | 13365 |
On 1 May 1988, as part of the Government's reform package for the ports industry, the New Zealand Ports Authority was abolished. Since 1968 the Ports Authority had been responsible for co-ordinating national harbour development and promoting an efficient and integrated ports system. The authority's consent to port developments exceeding specific expenditure limits had been required by harbour boards and all other concerns wishing to undertake harbour works. The Port Companies Act 1988 took effect from 11 October 1988. It repealed the New Zealand Ports Authority Act 1968 and has as its main aim the establishment of port companies to operate harbour boards’ commercial port facilities. These companies will operate under normal commercial constraints, and any development decisions would be based on the same commercial criteria applicable to other business enterprises.
As at 31 December 1987 there were 2217 ships on the New Zealand register, with a total gross tonnage of 383192 tonnes and net register tonnage of 201453 tonnes. This compared with 2123 ships totalling 388788 gross tonnes and with a net tonnage of 205026 tonnes in December 1986.
New registrations of significance were the cargo vessels Spirit of Freedom; the bulk cement carrier Milburn Carrier II; the deep-sea fishing vessels Will Watch, Ocean Ranger, San Te Maru No. 18 and Giljanes; the coastal fishing vessels Cindy Hardy and Hunter One; the tug Purau; the passenger vessels Taupo Cat, Supercat III and Lady Bowen; and the dumb barges Sea Tow 8 and Sea Tow 9.
Vessels removed from the register during the year included the passenger vessel Gulf Explorer, the cargo vessels Ngahere, Tiare Moana, Coastal Trader and New Zealand Trader, and the dumb barge Marsden Offshore, which were all sold to overseas buyers.
Table 20.6. REGISTERED VESSELS INVOLVED IN DOMESTIC AND OVERSEAS TRADE*
| Year | Number of vessels | Net registered tonnage* | Number of crew |
|---|---|---|---|
* Ships in overseas trade mainly engaged in trans-Tasman and Pacific Islands trading movements. † The shipping register is not metricated and 1 net register ton equals 100 cubic feet (or 2.83 cubic metres) of cargo capacity. Source: Ministry of Transport. | |||
| Domestic | |||
| 1983 | 15 | 46260 | 586 |
| 1984 | 16 | 55440 | 516 |
| 1985 | 17 | 56463 | 541 |
| 1986 | 15 | 53767 | 506 |
| 1987 | 14 | 52369 | 480 |
| Overseas | |||
| 1983 | 13 | 72488 | 356 |
| 1984 | 12 | 73777 | 332 |
| 1985 | 13 | 96393 | 369 |
| 1986 | 15 | 102716 | 420 |
| 1987 | 12 | 96661 | 344 |
The Marine Division of the Ministry of Transport conducts regular examinations for merchant service personnel who wish to obtain certificates of competency as master, mate, or engineer. There are different standards of certificates for foreign-going, home-trade, and restricted-limits ships. The foreign-going certificates as master, first mate, second mate, watchkeeper and class 1, 2 and watchkeeping engineers, are valid in most Commonwealth countries. Examinations are also conducted for skippers, mates and engineers of deep-sea, coastal, and inshore fishing boats. Voluntary examinations are held for amateur sailors.
The Marine Division carries out surveys of ships as required by the Shipping and Seamen Act 1952. In the 1986 calendar year, 1435 certificates of survey were issued, compared with 1432 in 1985 and 1314 in 1984.
Forty-nine foreign squid boats and 17 foreign trawlers, which were exempted from survey and crewing requirements, were issued with certifying letters. Twenty-one foreign trawlers were exempted from crewing requirements only, two of these each being granted two exemptions during the year.
During 1986, 51 certificates were issued under the International Convention for the Safety of Life at Sea 1960, to which New Zealand is a signatory, compared with 45 in 1985, and 66 in 1984. In addition 29 surveys were carried out on overseas-registered ships towards the issue of certificates under the International Convention for the Safety of Life at Sea 1974 and the 1978 Protocol to that Convention.
Special surveys are also made for seaworthiness after damage, for efficiency of equipment and for tonnage measurement.
On headlands, capes, reefs, and shoals around some 7000 kilometres of coastline and the waters in harbours and lakes controlled by the Ministry of Transport there are 190 navigational aids. At the end of 1987 these aids consisted of 7 staffed lighthouses, 98 automatic lights, 71 day beacons, 6 navigational buoys, and 8 radio beacons. They are a responsibility of the Marine Division and cost about $3 million annually. This is met by light dues collected from overseas and coastal ships. During 1988 it was announced that the remaining staffed lighthouses would be phased out.
The Ministry of Transport investigates the cause and circumstances of any wreck or shipping casualty in New Zealand waters. In cases of loss of life or serious damage, a Superintendent of Mercantile Marine, or appointee, carries out a preliminary inquiry. The report is sent to the Minister of Transport, who may order a formal investigation. Such an investigation is usually held by a judge, assisted by technical assessors, who can cancel or suspend the certificate of any officer found to be at fault.
Receivers of Wreck have extensive powers for preserving life and protecting property. Contrary to popular belief a wreck or any article belonging to it remains the property of the owner and it is illegal for others to take any items of wreckage.
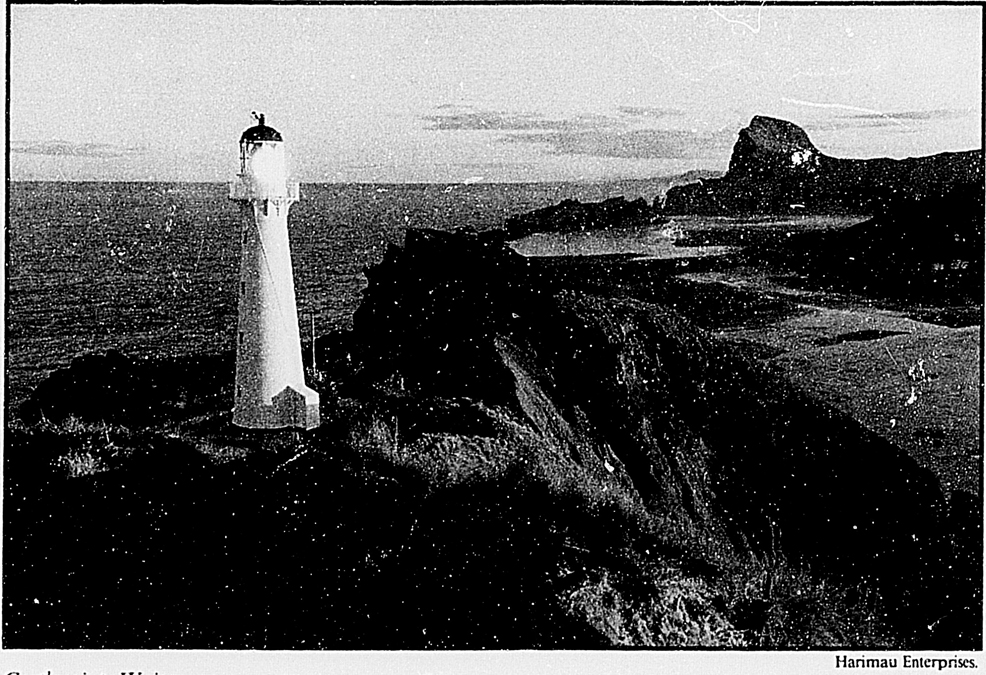
Castlepoint, Wairarapa
Table 20.7. SHIPPING CASUALTIES, 1986*
| Type of ship | Machinery breakdown and miscellaneous | Capsizing and collision | Stranding and grounding | Foundering | Fire | Total |
|---|---|---|---|---|---|---|
* Year ended 31 December. | ||||||
| incidents reported | ||||||
| Passenger | 6 | 2 | 6 | 2 | - | 16 |
| Cargo | 3 | 4 | 2 | - | 3 | 12 |
| Fishing | 10 | 9 | 7 | 8 | 2 | 36 |
| Dredges, tugs, etc. | - | 3 | 1 | 3 | 1 | 8 |
| Pleasure | 371 | 107 | 59 | 34 | 6 | 577 |
| Total | 390 | 125 | 75 | 47 | 12 | 649 |
Fishing boat casualties during 1987 resulted in the loss of six vessels and seven lives. Pleasure boat accidents resulted in 28 deaths including one as a result of a non-commercial river rafting mishap. Nineteen preliminary inquiries were carried out by marine inspectors.
The Shipping and Seamen Act 1952, administered by the Ministry of Transport, is primarily concerned with the safety of ships and those who sail in them. This Act contains the necessary authority for implementing the provisions of several international conventions to which New Zealand is a signatory. It also provides for the safety of all ships plying New Zealand coastal waters, and all New Zealand registered ships on international voyages.
The Marine Pollution Act 1974 gives effect to a number of international conventions relating to oil pollution. The most important of these are the International Convention for the Prevention of Pollution of the Sea by Oil 1954, as amended in 1962 and 1969, and the International Convention on Civil Liability for Oil Pollution Damage 1969.
This Act is being revised to give effect to Marpol 73/78 (International Convention for the Prevention of Pollution from Ships 1973 as modified by its Protocol in 1978).
The 1954 convention is concerned with the prevention of oil pollution resulting from normal shipping operations. Marpol 73/78 not only strengthens the 1954 convention but also introduces measures to mitigate the effects of pollution resulting from tanker accidents and deals with pollution of the sea by substances other than oil.
There is a contingency plan to deal with a major spillage of oil in New Zealand waters and oil pollution control equipment, including dispersants, is stockpiled in New Zealand to deal with such an eventuality. The Act also provides for control of the dumping of waste at sea from ships. It prohibits the dumping of substances known to be harmful to the marine environment, but also allows the Ministry of Transport to issue permits for the dumping of other wastes, such as dredging spoil, under appropriate conditions and in approved sites.
The principal legislation affecting civil aviation in New Zealand is the Civil Aviation Act 1964. This Act established the Department of Civil Aviation which later, under the Ministry of Transport Act 1968, became a division of the Ministry of Transport.
The Air Services Licensing Authority, a three-person independent body, grants air service licences. An air service licence is essential for any air transport or aerial work conducted for hire or reward. There is a right of appeal to the High Court against the decisions of the Air Services Licensing Authority. In 1986, an amendment to the Act repealed provisions which prohibited the control of air services by overseas persons.
International air services are governed by intergovernmental air transport agreements and the International Air Services Licensing Act 1947. International air tariffs are administered under the Civil Aviation Act 1964. In 1987, an amendment to this Act altered the criteria by which tariffs are authorised. In addition, certain exemptions from the competition aspects of the Commerce Act 1986 were provided for international aviation agreements on tariffs and capacity, in recognition of the unique manner in which international aviation operates world-wide.
New Zealand is a party to the Warsaw Convention of 1929, as amended at The Hague in 1955, and this convention defines the financial liabilities of international air carriers towards their passengers. New Zealand has signed but has yet to ratify the Guatemala City Protocol which, although not in force, raises the limits of liability from $15,000 to $100,000. Air New Zealand is also a party to the airline agreement known as the Montreal Agreement, which imposes a limit of US$75,000 for travel to and from the United States. This limit is now being extended world-wide in its application, pending the ratifying of the Guatemala City Protocol. Liabilities of domestic air carriers are governed by the Carriage by Air Act 1967 and the Carriage of Goods Act 1979.
The Airport Authorities Act 1966 empowers local authorities to provide airports. Under the Act 24 local authorities entered into separate joint-venture agreements with the Crown. However, the Airport Authorities Amendment Act 1986 authorises the Crown and local authorities to form, and hold shares in, airport companies. It also provides for flexibility in charging mechanisms. In its Budget of 28 July 1988 the Government announced its intention to sell its shareholding in the three international airports.
The Aviation Crimes Act 1972 gives effect to the Tokyo Convention 1963 relating to offences committed on board aircraft, the Hague Convention 1970 relating to hijacking, and the Montreal Convention 1971 relating to aerial sabotage.
The Aviation Security Service was established as a branch of the Civil Aviation Division of the Ministry of Transport in 1976. The service screens passengers and baggage and, where necessary, searches passengers, baggage, cargo, aircraft, aerodromes, and navigational installations. It also carries out security patrols, and in general, reviews, investigates and inquires into security techniques, systems, devices, etc., co-operating where necessary with police, airport officials, government departments, and other responsible authorities.
The State Owned Enterprises Act 1986 and a 1987 amendment to the Civil Aviation Regulations 1953 provided for the corporatisation of a major part of the Civil Aviation Division. From 1 April 1987 all ground service activities, with the exception of the Aviation Security Service, became the responsibility of the Airways Corporation of New Zealand Ltd.
The Civil Aviation Division is responsible for setting and overseeing standards for airworthiness, aerodromes, aviation security, airways services, flight safety, and flight supervision and standards. It is also responsible for the licensing of flight crew, aircraft maintenance engineers and aerodromes as well as the registration of aircraft.
Responsible for ensuring the safe and orderly flow of air traffic, the corporation provides extensive ground services including air traffic control, and telecommunications. The provision of fire rescue services is the responsibility of the aerodrome licensee, and in a number of locations the services are provided on a contractual basis by the corporation. The corporation also assists search and rescue and aerodrome emergency organisations. Elements of these ground services are provided at most aerodromes served by regular air services. In addition to control towers and flight-service stations at aerodromes, area control and flight information centres are established at Auckland, Wellington and Christchurch airports and provide services to en route aircraft throughout the country. There are rescue co-ordination centres at Auckland, Wellington and Christchurch for major search and rescue operations in their respective regions.
The Airways Corporation provides all air navigation facilities in New Zealand. These navigation facilities include electronic aids such as non-directional medium frequency beacons (NDB), very-high-frequency omni-directional radio ranges (VOR), instrument landing systems (ILS), surveillance radar equipment (SRE), distance measuring equipment (DME) and very-high-frequency direction finding equipment (VDF). Visual aids include the visual approach slope indicator systems (VASIS) and precision approach path indicator (PAPI). An Aeronautical Information Service publishes the journal Notices to Airmen, and regular circulars. It collaborates with the Department of Survey and Land Information in the production of aeronautical maps and charts.
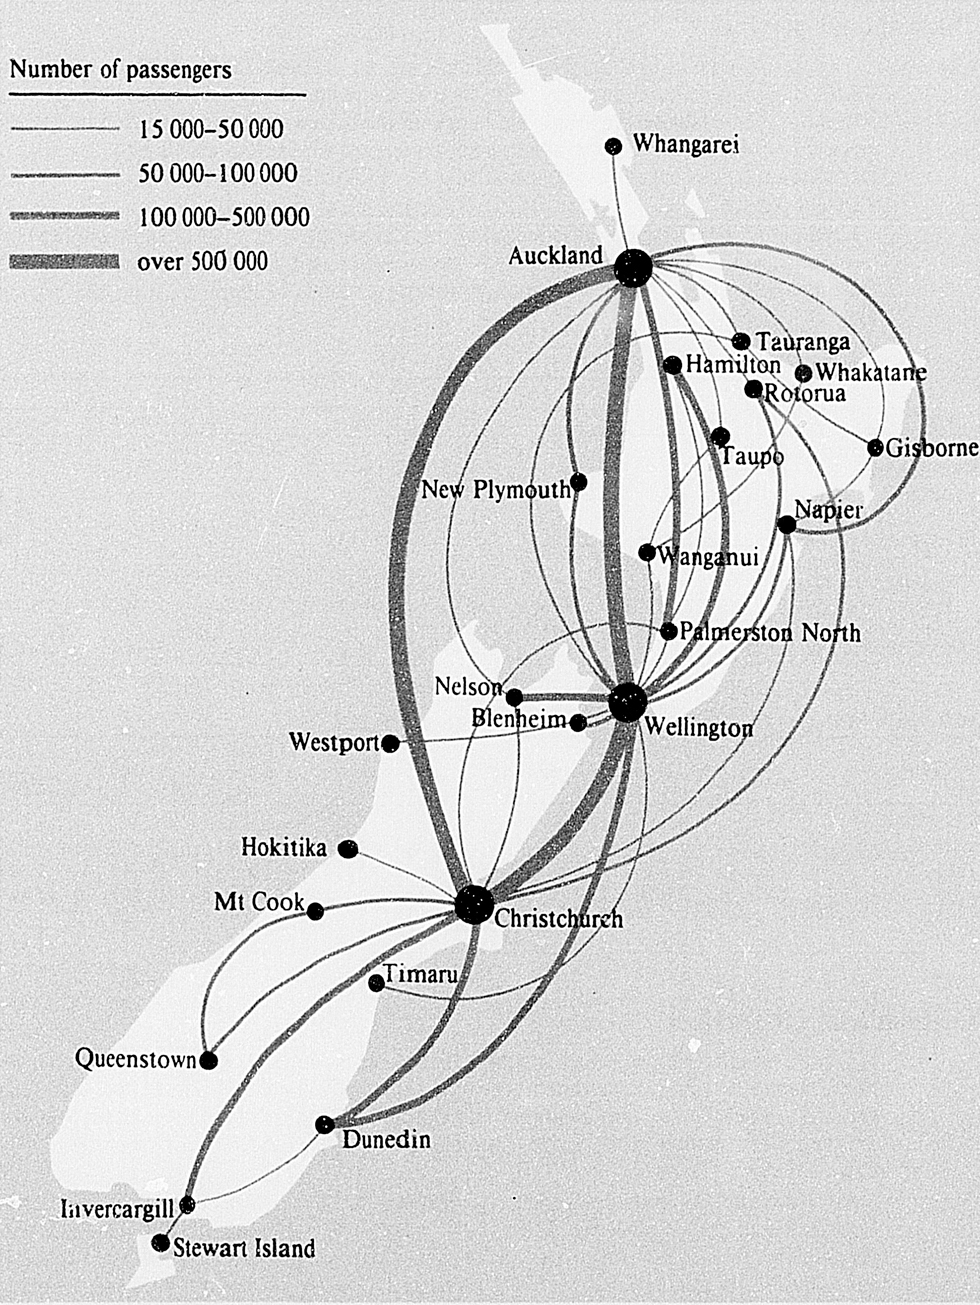
DOMESTIC AIR TRAVEL—passenger volumes, 1987
The corporation also maintains an aeronautical training college at Christchurch International Airport. Regular courses are conducted in air traffic services, telecommunications engineering, and fire and rescue procedures.
The state-owned airline, Air New Zealand, and Ansett New Zealand (which was established as a joint-venture company with New Zealand and Australian shareholding but is now wholly Australian-owned) are the largest domestic air service operators. The Mount Cook Group Limited, which is substantially owned by Air New Zealand, provides mainly tourist-oriented passenger services, while Safe Air, an Air New Zealand subsidiary, provides a freight service.
Commuter operators also provide regular services throughout the country. In addition, at most aerodromes there are light aircraft operators licensed for charter services. Some of these are aero clubs and flying schools providing facilities for flight training and private flying.
Table 20.8. DOMESTIC OPERATIONS OF AIR NEW ZEALAND
| Year ended 31 March | Percentage change | ||||
|---|---|---|---|---|---|
| Item | 1985 | 1986 | 1987 | 1985–86 | 1986–87 |
Source: Ministry of Transport. | |||||
| Passengers carried | 2602793 | 2772023 | 2998112 | +6.5 | +8.2 |
| Seat kilometres available (million) | 1838 | 1992 | 2132 | +8.4 | +7.0 |
| Passenger kilometres flown (million) | 1304 | 1382 | 1494 | +6.0 | +8.1 |
| Revenue passenger-load factor (percent) | 71.0 | 69.4 | 70.1 | -2.3 | +1.0 |
| Revenue tonne-kilometres created (million) | 212 | 233 | 251 | +9.9 | +7.7 |
| Overall tonne-kilometres used (million) | |||||
| Passenger and baggage | |||||
| Freight | 141 | 147 | 158 | +4.3 | +7.5 |
| Overall revenue load factor (percent) | 66.4 | 63.2 | 63.0 | -4.8 | -0.3 |
Table 20.9. SUMMARY OF DOMESTIC SCHEDULED AIR SERVICES
| December year | Seat kilometres available | Passengers carried | Passenger-kilometres | Freight carried (tonnes) | Freight (tonne-kilometres) | Mail (tonne-kilometres) |
|---|---|---|---|---|---|---|
Source: Ministry of Transport. | ||||||
| (000) | ||||||
| 1982 | 1640145 | 2248 | 1084897 | 38.6 | 22462 | 1397 |
| 1983 | 1738503 | 2429 | 1167545 | 36.8 | 21918 | 1391 |
| 1984 | 2027485 | 2950 | 1397115 | 45.7 | 25483 | 1411 |
| 1985 | 2270473 | 3255 | 1553971 | 42.1 | 23508 | 1369 |
| 1986 | 2413526 | 3443 | 1652398 | 65.1 | 33577 | 1199 |
Trans-Tasman air travel, which accounts for the largest number of passengers to and from New Zealand, is subject to agreement between Air New Zealand and Qantas, the Australian national airline. On the trans-Tasman route Qantas operates services to Auckland, Wellington, and Christchurch, from Sydney, Melbourne, Brisbane, Adelaide, Townsville, Perth, Cairns, Hobart, Darwin.
Air New Zealand provides services to Sydney, Brisbane, Melbourne, Hobart, Perth, Norfolk Island, New Caledonia, Tahiti, Cook Islands, Western Samoa, Fiji, Tonga, Singapore, Tokyo, Honolulu, Vancouver, Los Angeles, Hong Kong, Dallas/Fort Worth, Frankfurt and London. Its international fleet is: 1 Douglas DC 8–54F, 3 Boeing 767s, and 5 Boeing 747–200s. Boeing 737–200s are used on short-haul Pacific operations.
Airline companies operating through New Zealand include: Aerolineas Argentinas—from Buenos Aires to Auckland; Air Caledonie International—from Noumea to Auckland; Air Nauru—from Mauru via Honiara/Vila to Auckland and beyond to Niue; Air Pacific—from Nadi/Suva to Auckland; British Airways—from London via the Middle East/South-east Asia/Australia to Christchurch/Auckland; Canadian Airlines International—from Toronto/Vancouver via Honolulu/Nadi to Auckland; Cathay Pacific—from Hong Kong to Auckland; Continental Airlines—from the United States through Honolulu/Papeete, to Auckland and beyond to Sydney/Melbourne; Cook Islands International—from Rarotonga to Auckland; Hawaiian Airlines—from Pago Pago to Auckland; Japan Air Lines—from Tokyo to Auckland; Polynesian Airlines—from Apia via Tonga to Auckland; Singapore Airlines—from Singapore to Christchurch/Auckland; Thai Airways International—from Bangkok to Auckland; Union de Transport Aeriens—from Tahiti/Noumea to Auckland; and United Air Lines—from the United States through Honolulu, to Auckland and beyond to Sydney/Melbourne.
Table 20.10. INTERNATIONAL OPERATIONS OF AIR NEW ZEALAND
| Year ended 31 March | |||
|---|---|---|---|
| Item | 1985 | 1986 | 1987 |
Source: Ministry of Transport. | |||
| Passengers carried | 1100009 | 1211743 | 1413384 |
| Passenger kilometres flown (million) | 6092 | 6568 | 7515 |
| Seat kilometres available (million) | 8770 | 9268 | 11058 |
| Revenue passenger-load factor (percent) | 69.5 | 70.9 | 68.0 |
| Cargo and airmail tonne-kilometres (million) | 286 | 303 | 328 |
| Total revenue tonne-kilometres (million) | 865 | 927 | 1042 |
| Total revenue load factor (percent) | 73.8 | 74.6 | 70.9 |
Table 20.11. SUMMARY OF INTERNATIONAL SCHEDULED AIR SERVICES
| Calendar year | Passengers carried | Freight carried | Mail carried |
|---|---|---|---|
Source: Ministry of Transport. | |||
| (000) | tonnes | tonnes | |
| 1982 | 1664 | 70484 | 3099 |
| 1983 | 1693 | 76903 | 3256 |
| 1984 | 1851 | 88117 | 3502 |
| 1985 | 2056x | 91998x | 3927x |
| 1986 | 2399 | 94825 | 4162 |
Table 20.12. TRAFFIC ON INTERNATIONAL SCHEDULED SERVICES BY AIRPORT*
| 1984 | 1985 | 1986 | ||||
|---|---|---|---|---|---|---|
| Airport and type of traffic | In | Out | In | Out | In | Out |
* Passengers and freight in transit are excluded. Source: Ministry of Transport. | ||||||
| Auckland International Airport— | ||||||
| Passengers | 746646 | 730194 | 801151 | 806011 | 912436 | 909117 |
| Freight (tonnes) | 30417 | 45549 | 30986 | 48703 | 36376 | 42023 |
| Mail (tonnes) | 1993 | 1197 | 2308 | 1245 | 2440 | 1177 |
| Wellington— | ||||||
| Passengers | 60303 | 59663 | 67650 | 70209 | 94862 | 95839 |
| Freight (tonnes) | 1851 | 3018 | 1981 | 2718 | 3512 | 3205 |
| Mail (tonnes) | 125 | 67 | 114 | 64 | 147 | 57 |
| Christchurch International Airport— | ||||||
| Passengers | 140228 | 148618 | 158959 | 166342 | 191777 | 195478 |
| Freight (tonnes) | 2720 | 6419 | 3223 | 6148 | 4701 | 5496 |
| Mail (tonnes) | 66 | 43 | 94 | 60 | 112 | 77 |
Table 20.13. INTERNATIONAL AIR SERVICES: VOLUMES
| December 1984 | December 1985 | December 1986 | ||||
|---|---|---|---|---|---|---|
| Sector and traffic | In | Out | In | Out | In | Out |
* Auckland, Wellington, or Christchurch to Melbourne or Brisbane (and vice versa), Wellington or Christchurch to Sydney (and vice versa); Christchurch to Hobart (and vice versa); and Auckland to Perth, Darwin, Adelaide or Townsville (and vice versa). † Other Pacific short-haul sectors are Auckland to Noumea, Norfolk Island, Tonga, Suva, Papeete, Pago Pago. Rarotonga, or Apia (and vice versa), and includes all traffic to/from Rarotonga International Airport. ‡ Long-haul sectors are Auckland to Nauru, Honolulu, Singapore, San Francisco, Los Angeles, Hong Kong, Tokyo, London and Buenos Aires (and vice versa). Source: Ministry of Transport. | ||||||
| Trans-Tasman— | ||||||
| Auckland-Sydney-Auckland— | ||||||
| Flights | 1115 | 1110 | 1112 | 1113 | 1308 | 1308 |
| Passengers | 240562 | 230364 | 244542 | 245532 | 257235 | 256107 |
| Freight and mail (tonnes) | 11790 | 16068 | 11795 | 14599 | 13943 | 10220 |
| Kilometres flown (000) | 3180 | 2413 | 2400 | 2402 | 2822 | 2823 |
| Other trans-Tasman*— | ||||||
| Flights | 1502 | 1498 | 1689 | 1686 | 2762 | 2750 |
| Passengers | 375305 | 377875 | 407900 | 420468 | 489499 | 501979 |
| Freight and mail (tonnes) | 10468 | 19339 | 12372 | 18574 | 19422 | 15457 |
| Kilometres flown (000) | 4193 | 3781 | 4236 | 4229 | 7183 | 7134 |
| Pacific short-haul— | ||||||
| New Zealand-Nadi-New Zealand— | ||||||
| Flights | 622 | 648 | 573 | 565x | 633 | 632 |
| Passengers | 74898 | 81568 | 75140 | 78721 | 88449 | 81778 |
| Freight and mail (tonnes) | 1897 | 3226 | 1540 | 3823 | 1978 | 3272 |
| Kilometres flown (000) | 1341 | 1397 | 1235 | 1218 | 1365 | 1362 |
| Other sectors†— | ||||||
| Flights | 778 | 761 | 833 | 838 | 943 | 947 |
| Passengers | 72494 | 63297 | 70952 | 67664 | 89703 | 79830 |
| Freight and mail (tonnes) | 1688 | 1924 | 1723 | 2306 | 1788 | 2884 |
| Kilometres flown (000) | 1375 | 1340 | 1500 | 1543 | 1881 | 1907 |
| Long-haul‡— | ||||||
| Flights | 1222 | 1221 | 1337 | 1333 | 1613 | 1604 |
| Passengers | 193841 | 191194 | 249356 | 248600 | 305076 | 309561 |
| Freight and mail (tonnes) | 11447 | 15852 | 11765 | 20056 | 10883 | 21265 |
| Kilometres flown (000) | 6898 | 8223 | 8532 | 8873 | 10393 | 10697 |
Distances to the Australian cities from the airports at Wellington and Christchurch differ slightly from the Auckland figures given in the following table. The distances are: Wellington-Sydney, 2235 km; Wellington-Melbourne, 2589 km; and Wellington-Brisbane, 2508 km; Christchurch-Sydney, 2124 km; Christchurch-Melbourne, 2413 km; Christchurch-Brisbane, 2495 km; and Christchurch-Hobart. 2024 km.
Table 20.14. DISTANCES FROM AUCKLAND AIRPORT TO SELECTED OVERSEAS DESTINATIONS*
| Destination | Distance |
|---|---|
* These are airport-to-airport great circle distances. Source: Ministry of Transport. | |
| km | |
| Adelaide | 3247 |
| Apia | 2893 |
| Brisbane | 2293 |
| Hong Kong | 9145 |
| Honolulu | 7086 |
| Los Angeles | 10480 |
| Melbourne | 2635 |
| Nadi | 2156 |
| Norfolk Island | 1091 |
| Noumea | 1859 |
| Pago Pago | 2902 |
| Papeete | 4093 |
| Perth | 5400 |
| Port Moresby | 4126 |
| Rarotonga | 3013 |
| San Francisco | 10503 |
| Singapore | 8410 |
| Suva | 2141 |
| Sydney | 2158 |
| Tokyo | 8837 |
| Tonga | 2004 |
| Townsville | 3359 |
Air freight involves mostly exports and imports to and from Australia and the United States. Exports are mainly made-up textiles, meat, fish and live animals, notably racehorses. Air-freighted imports consist mainly of machinery, scientific instruments, pharmaceutical products, and textiles.
Table 20.15. OVERSEAS AIR CARGO TRANSPORTED BY TYPE, 1986*
| Loaded | Unloaded | |||
|---|---|---|---|---|
| Commodity | Gross tonnes | f.o.b. $(000) | Gross tonnes | c.i.f. $(000) |
* Year ended 31 December. † Not elsewhere specified. | ||||
| Food and live animals | 33680 | 337,526 | 9028 | 114,118 |
| Beverages and tobacco | 227 | 686 | 279 | 1,726 |
| Crude materials | 1660 | 59,589 | 386 | 7,997 |
| Mineral fuels | 11 | 59 | 94 | 722 |
| Animal and vegetable oils, fats | 22 | 40 | 34 | 429 |
| Chemicals and related products n.e.s.† | 2201 | 56,483 | 5485 | 264,261 |
| Manufactured goods | 6616 | 145,310 | 11149 | 267,897 |
| Machinery and transport | 6122 | 419,307 | 16940 | 1,308,978 |
| Miscellaneous manufactured articles | 5466 | 229,013 | 12889 | 674,534 |
| Commodities n.e.s.† | 236 | 34,415 | 217 | 40,084 |
| Total | 56242 | 1,282,429 | 56500 | 2,680,746 |
Table 20.16. OVERSEAS AIR CARGO BY COUNTRY, 1986*
| Loaded | Unloaded | |||
|---|---|---|---|---|
| Destination/source | Gross tonnes | f.o.b. $(000) | Gross tonnes | c.i.f. $(000) |
* Year ended 31 December. † Includes other countries. | ||||
| Argentina | 86 | 2,056 | 23 | 2,332 |
| Australia | 23064 | 596,012 | 37347 | 1,035,000 |
| Belgium | 393 | 3,100 | 143 | 10,341 |
| Canada | 1775 | 24,086 | 304 | 40,586 |
| China (People's Republic of) | 93 | 1,034 | 31 | 1,097 |
| China (Province of Taiwan) | 154 | 2,753 | 700 | 34,527 |
| Cook Islands | 749 | 9,547 | 773 | 11,930 |
| Denmark | 48 | 4,065 | 180 | 16,920 |
| Fiji | 566 | 17,634 | 494 | 10,172 |
| Finland | 10 | 564 | 104 | 6,873 |
| France | 186 | 8,724 | 345 | 32,114 |
| French Polynesia | 3359 | 18,515 | 2 | 310 |
| Germany (Federal Republic of) | 577 | 12,847 | 1737 | 88,099 |
| Hong Kong | 1155 | 22,024 | 1514 | 48,567 |
| India | 43 | 666 | 199 | 13,272 |
| Indonesia | 160 | 4,504 | 43 | 2,211 |
| Ireland | 38 | 1,585 | 127 | 26,817 |
| Italy | 98 | 14,844 | 576 | 43,687 |
| Japan | 7953 | 98,245 | 1601 | 147,779 |
| Korea (Republic of) | 176 | 15,084 | 224 | 9,290 |
| Malaysia | 156 | 2,789 | 38 | 1,216 |
| Netherlands | 164 | 4,397 | 519 | 30,279 |
| New Caledonia | 473 | 4,355 | 3 | 241 |
| Papua New Guinea | 105 | 8,164 | 5 | 555 |
| Samoa | 106 | 2,403 | 146 | 20,184 |
| Saudi Arabia | 330 | 1,116 | – | 13 |
| Singapore | 1627 | 38,978 | 542 | 49,856 |
| Sweden | 75 | 3,263 | 263 | 26,376 |
| Switzerland | 499 | 8,658 | 428 | 54,203 |
| U.S.A. | 9443 | 235,854 | 4890 | 580891 |
| United Kingdom | 1638 | 83,432 | 2669 | 292,697 |
| Total† | 56242 | 1,282,429 | 56500 | 2,680,746 |
Aerial topdressing, as a means of improving hill pastures and checking and preventing soil erosion, began commercially in 1949. During recent years the extent of both aerial topdressing and spraying has declined, reflecting the decrease in demand by farmers.
Table 20.17. SUMMARY OF AERIAL WORK
| Year ended 31 December | |||||
|---|---|---|---|---|---|
| Aerial work | 1982 | 1983 | 1984 | 1985 | 1986 |
* Method of application by round particles. | |||||
| Hours flown (other than training) | 114775 | 106302 | 106576 | 103925 | 58892 |
| Number of operators | 75 | 105 | 119 | 102 | 106 |
| Material distributed— | |||||
| Fertiliser and lime (tonnes) | 879150 | 835319 | 862056 | 753910 | 304382 |
| Seed (tonnes) | 2763 | 2213 | 2053 | 5590 | 2078 |
| Spray (litres) | 38823173 | 45528203 | 47741854 | 53795834 | 29044437 |
| Animal poison (tonnes) | 2696 | 3729 | 4450 | 3444 | 3385 |
| Supplies (tonnes) | 5047 | 2333 | 6336 | 6968 | 10602 |
| Fencing (tonnes) | 3550 | 2048 | 2570 | 2255 | 2169 |
| Dusts (tonnes) | 327 | 229 | 43 | 36 | 16 |
| Prills (tonnes)* | 193 | 144 | 741 | 418 | 836 |
| Miscellaneous (tonnes) | 17391 | 17693 | 12930 | 10936 | 1180 |
A railway network extending over nearly 4300 kilometres links almost all the principal centres of population. There are also a number of short private railways mainly serving collieries and other industrial undertakings. Rail services are operated by the New Zealand Railways Corporation, which also provides road services over more than 10000 route kilometres of highway, and a rail and road vehicle and passenger ferry service across Cook Strait (Wellington-Picton).
The most significant recent development has been the electrification of the central section of the North Island main trunk rail system, a project which began in 1984 and was completed in 1988. The section of line involved is the 411 kilometres between Palmerston North and Te Rapa, north of Hamilton. Electrification required the installation of new signalling and communications systems (laid underground), and a major overhaul and improvement of the line.
These works are expected to result in reduced fuel costs and faster travelling times for freight and diesel-electric passenger services. The project, the biggest single railway development since completion of the main trunk in 1908, was completed at a cost of approximately $250 million.
A more detailed description of the electrification project was given in the 1987-88 edition of the Yearbook.
All track is laid to a gauge of 1067 mm (3ft 6in.). The major routes are laid with rails of 42.2 or 45.1 kg/m but these are progressively being relaid with rails weighing 50 kg per metre. Secondary and branch lines have generally been laid with rails weighing 27.3, 34.7, and 35.7 kg/m and the practice is to re-lay these lines with heavier rails from the main lines. Treated Pinus radiata sleepers, laid about 1480 per kilometre, have gradually replaced Australian hardwood sleepers, and locally manufactured concrete sleepers are also being used on selected areas on the main routes. Track with fishplates and bolts at every joint is progressively being replaced with rails welded at the joints on all major routes and on some secondary lines.
To carry the railways across the many gorges, rivers, and streams in New Zealand, about 2303 bridges and viaducts have been built with an aggregate length of 68.71 kilometres. The longest railway bridge is that over the Rakaia River, 55 kilometres south of Christchurch. Completed in 1939 to replace an original timber structure of the 1870s, it is 1743 metres in length.
The highest viaduct is the Mohaka, completed in 1937 to carry the Napier-Gisborne railway 97 metres above the Mohaka River. Twenty-one New Zealand railway viaducts carry the rails more than 33 metres above the rivers and streams they cross.
In addition to suburban services, New Zealand Railways Corporation runs three passenger services; the Silver Fern, Northerner, and Southerner.
The Silver Fern daylight express railcar runs five-days-a-week, between Auckland and Wellington. The Northerner express runs nightly between Auckland and Wellington, and stops at many of the smaller towns not served by the Silver Fern. The Southerner runs six-days-a-week between Christchurch and Invercargill.
There are also daily services between Wellington and Gisborne, Christchurch and Picton, and Christchurch and Greymouth.
Provincial passenger services to other districts are operated by Railways Road Services. This is one of the country's largest road operations. Its passenger services cover over 10000 km of highways—more than 10 percent of the 93000 km of formed roads and streets.
Table 20.18. NEW ZEALAND RAILWAYS—SUMMARY OF OPERATIONS
| As at 31 March | ||||
|---|---|---|---|---|
| Category | Unit | 1977 | 1982 | 1987 |
| Route— | ||||
| North Island | km | 2593 | 2555 | 2555 |
| (electrified) | km | 85 | 85 | 139 |
| South Island | km | 2131 | 1863 | 111 |
| (electrified) | km | 14 | 14 | 14 |
| Bridges | no. | 2303 | ||
| km | 68.71 | |||
| Tunnels | no. | 178 | 172 | 165 |
| km | 94.14 | 92.63 | 91.53 | |
| Locomotives— | ||||
| diesel/diesel-electric | no. | 505 | 508 | 416 |
| electric | no. | 14 | 11 | 5 |
| steam | no. | 2 | 2 | 2 |
| Rolling stock— | ||||
| freight | no. | 30379 | 26899 | 18305 |
| passenger (incl. motorised) | no. | 520 | 442 | 171 |
| Passengers carried— | ||||
| long distance | no. | 1288593 | 899555 | 845202 |
| suburban | no. | 17189541 | 13440352 | 14203287 |
| Total freight carried | tonnes | 13601372 | 11520401 | 9003516 |
Two ferries carrying road and rail vehicles and passengers are operated by the Railways Corporation between Wellington and Picton: the Arahura, and the Aratika. A third vessel, the Arahanga, carries rail wagons and road freight vehicles, but not passengers.
The Arahura, the newest of the ferries, makes the Wellington-Picton crossing in 3 hours, compared to 3 hours 20 minutes taken by the others. See also, ‘Ferry services’ in section 20.1.
Capital investment in New Zealand's roading and road transport system exceeds that in all other forms of transport. There are about 93000 kilometres of formed roads and streets, and over 1.8 million motor vehicles. The 1984-85 Census of Transport, Storage, and Communication showed that, at the end of February 1985, 10768 persons were engaged in the provision of road passenger transport services, 18223 in providing freight transport by road, and 1739 in supplying supporting services to land transport such as car and truck rental, and vehicle parking facilities.
The Transport Act 1962 is the main legislation governing road transport; attendant regulations set out the rules of the road, the requirements as to motor vehicle equipment, and the obligations of motor drivers and owners, and pedestrians.
It also provides for a system of road transport licensing which operates on a qualitative basis for goods, passenger and rental services and a quantitative basis for taxi services. The licensing system for taxis is currently under review.
On 1 August 1987 legislation was passed which revised the driving hours regime for passenger and freight operators and introduced a logbook system for recording driving hours. Heavy penalties for breaching the driving hours and logbook requirements were also introduced.
The Urban Transport Act 1980 provides for a co-ordinated approach to transport planning and funding in each of New Zealand's four main urban areas.
In each area, the regional authority is required to prepare a comprehensive transport plan covering all surface transport. This is in turn developed into annual funding programmes by the regional bodies concerned. The Act also provides for urban transport funding in other centres.
The Act also established the Urban Transport Council as the national co-ordinating body for urban transport. The council prepares a combined programme of expenditure, and arranges any central government funding. It also conducts and sponsors research, and advises the Minister of Transport and local authorities on urban transport.
In 1987-88 the Urban Transport Council was allocated $73.19 million.
The cost of providing adequate roads in New Zealand as a proportion of annual expenditure is relatively high in comparison with many other countries, largely because of the nature of the country and the wide variety of terrain frequently encountered within relatively short distances. In most years the cost of repairing flood damage is a large item of road maintenance.
Annual roading expenditure by central and local government is now over $660 million. Maintenance accounts for over 60 percent of the expenditure, and the main emphasis of state highway development in recent years has been on the maintenance and improvement of existing roading assets. There are 14891 bridges of more than 3 metres, with a total length of nearly 335 kilometres.
Table 20.19. FORMED ROADS AND STREETS AT 31 MARCH 1987
| Local authority roading | ||||
|---|---|---|---|---|
| Nature of surface | Urban* areas | Rural† areas | State highways and motorways | Total |
* With a restricted speed limit. † With an open-road speed limit. Source: National Roads Board. | ||||
| Kilometres | ||||
| Paved or sealed | 13499.8 | 26820.8 | 11033.1 | 51353.7 |
| Metal or gravel | 530.8 | 40735.0 | 510.5 | 41776.3 |
| Total, maintained roads | 14030.6 | 67555.8 | 11543.6 | 93130.0 |
The main statutes covering roads administration in New Zealand are the Public Works Act 1981, the Local Government Act 1974, and the National Roads Act 1953. Administration of the country's roading system is exercised by the National Roads Board in respect of state highways and motorways, and territorial local authorities in respect of other roads.
The board was formed in 1954 to provide a roading system balanced to meet the country's needs. It is chaired by the Minister of Transport and has nine members, representing private motorists, commercial vehicle owners, counties, municipalities, and the Ministry of Transport. Government members are a minority. This ensures a wide background of knowledge and experience is brought to bear on roading matters.
The most important functions of the board are:
To administer a National Roads Fund;
To provide a roading system adequate for New Zealand's needs;
To advise government on all matters concerning roading, including finance;
To assist and advise local authorities on roading problems; and
To undertake at intervals of not more than five years a comprehensive survey of roading in New Zealand.
The board reports annually to Parliament on its expenditure from the fund and Parliament can debate the board's activities.
The National Roads Board can be likened to a board of directors with the Minister of Transport as chairman and the Director of Roading as chief executive officer. The board meets once a month. Most of the business is conducted in open meeting.
No staff are employed directly, but the Ministry of Transport provides an engineering and administrative service and in servicing the board uses consultants for bridge design and land purchase. For state highways and motorways, the board meets the full cost of construction and maintenance and subsidises local authority roading. The National Roads Board is the controlling authority for state highways. As the board's agent, the Ministry of Transport has responsibility for financial and technical control. In certain cases, the board has delegated its powers of construction and/or maintenance to local authorities.
In the case of local authority roads, responsibility lies with the authority concerned. Apart from the question of standards on major works there is no overriding control by central government.
Each year the board is required to estimate its income for the following year and to make its primary allocations of funds expected to be available. The board then prepares a final programme of road works for the coming year. There are two sectors, and funds are allocated on the following basis: for local authorities—not less than 39 percent of motor revenue; for state highways—not less than 47 percent of motor revenue: this leaves 14 percent of motor revenue for allocation to any or all of the above, at the discretion of the board.
New Zealand is divided geographically into 21 roads districts, and funds are allocated by the board to each sector in each district as fairly and equitably as possible having regard to particular needs. In each roads district there is an advisory body known as a district roads council. These councils are representative of the same interests as the board itself. Although they have no executive powers, their recommendations concerning relative priorities have considerable influence on board decisions. In addition to its regular meetings, the board makes visits of inspection to several district councils each year. These visits give board members a better appreciation of local problems, needs, and conditions through observation and discussion.
This fund operates within the system of public accounts and contains revenue derived mainly from motor taxation.
Fuel tax equal to 9.9c per litre from all lightweight petrol, lpg. and cng powered vehicles using public roads is paid into the fund. All heavy motor vehicles, including trailers, and all remaining lightweight vehicles (mainly diesel-powered), are required to purchase distance licences at a cost that varies according to their nominated maximum gross weight, their axle configuration, and the distance they travel.
The National Roads Fund and roads taxation are described in section 25.1, Central government finance, and section 25.2, Taxation.
The National Roads Act 1953 provides for the declaration of roads as state highways with the approval of the Minister of Transport. The state highway system is based on the principle that the network allows for national development, needs of defence, and directness of route and main travel lines. The most important principles in designing and maintaining a state highway system are that the total length of the system must be based on routes of primary importance, that routes must be equitably distributed in relation to the pattern of national development, and that routes must be confined to those which have characteristics in keeping with the function of the system.
Although urban development is a major issue, the National Roads Board is also aware of the need for the continued development of an effective inter-regional network with adequate rural feeder roads, and balanced development of a total network.
During the year ended 31 March 1987, 22.3 kilometres of new sealing on state highways was completed, giving 11033.1 kilometres of sealed highway.
Table 20.20. EXPENDITURE ON STATE HIGHWAYS*
| Class of expenditure | 1983 | 1984 | 1985 | 1986 | 1987 |
|---|---|---|---|---|---|
* Years ended 31 March. † Excludes motorway structures. ‡ Maintenance figures include the cost of flood damage restoration when applicable. Source: National Roads Board. | |||||
| $(000) | |||||
| Construction and improvement | 32,610 | 42,875 | 50,037 | 42,754 | 53,614 |
| Bridges and other structures* | 11,322 | 11,036 | 13,090 | 12,130 | 11,934 |
| Maintenance, repairs, etc.‡ | 95,910 | 108,214 | 119,577 | 142,912 | 157,133 |
| Total | 139,843 | 162,125 | 182,704 | 197,796 | 222,681 |
Motorways provide efficient and economic means of communication, while the control of access and the total elimination of ribbon development improves road safety and prevents obsolescence.
The total length of motorways in use at 31 March 1987 was 111.8 kilometres.
To qualify for roading subsidies local authorities are required to carry out works to a standard approved by the National Roads Board. Subsidies are not payable unless the approved standard is observed. Work of a higher standard may be undertaken provided the additional expenditure involved is found by the local authorities concerned. From time to time the board's standards are revised to meet developments in highway practice and engineering design and to cater for the requirements of increasing traffic. The board produces guides to good practice, and standard specifications for roading materials and construction methods.
The National Roads Board pays a basic subsidy at the rate of $1.50 for each $2 spent by local authorities on approved works. In special cases grants are also made.
Local authorities may also receive grants for bridge replacement, but wooden bridges built 50 and 60 years ago continue to deteriorate at a greater rate than replacements can be built. In the 19 years to March 1987, 3760 bridges were built, totalling 82889 metres in length.
For the year ended 31 March 1987, $187, 263, 177 was paid to local authorities from the National Roads Fund for roading. To assist local authorities with their planning, the National Roads Board meets 30 percent of the cost of approved transport surveys in urban areas. Surveys have been completed or are being prepared for all urban areas with a population of 30000 or more.
Needs studies of local authority roading are carried out by Ministry of Transport staff on behalf of the board on a cyclic basis to assess relative needs.
Details of New Zealand public roading expenditure financed from the National Roads Fund, the Consolidated Account, and local authority funds (both from revenue and loans) are summarised in table 20.21.
Table 20.21. PUBLIC ROADING EXPENDITURE*
| Item | 1985 | 1986 | 1987 |
|---|---|---|---|
* Years ended 31 March. Source: National Roads Boards. | |||
| $(000) | |||
| State highways expenditure | 182,704 | 197,796 | 222,681 |
| Special purpose roads | 1,230 | 1,226 | 1,328 |
| Local authority roading expenditure— | |||
| From local authority funds | 197,629 | 221,036 | 216,716 |
| From National Roads Fund | 157,082 | 169,373 | 187,263 |
| From Consolidated Account (developmental roading) | 6,443 | 2,588 | - |
| Total | 545,088 | 592,019 | 627,988 |
Table 20.22. ROADING EXPENDITURE RELATED TO GROSS DOMESTIC PRODUCT
| Year ended 31 March | Roading expenditure: central and local gov't. | Gross domestic product | Roading expenditure as percentage of G.D.P. |
|---|---|---|---|
Source: National Roads Board. | |||
| $(million) | percent | ||
| 1983 | 425.33 | 31,160 | 1.36 |
| 1984 | 515.37x | 34,329 | 1.50x |
| 1985 | 571.71x | 38,667 | 1.48x |
| 1986 | 623.65 | 44,868 | 1.39 |
| 1987 | 666.15 | 52.879P | 1.26 |
All vehicles using public roads in New Zealand are required to be registered. An annual relicensing charge is payable, which includes a licence fee, accident compensation levy, goods and services tax, and, in some cases, a certificate of fitness or transport licence fee. During 1986 the administration of motor vehicle registration changed from a system where the country's more than 2.2 million vehicles were registered for the year to 30 June to one where they are relicensed progressively throughout the year.
The annual relicensing charges are, from 1 November 1987: ordinary motorcars, $161.92, motorcars subject to transport licence fee, $207.02; motorcycles, $58.85 (60cc or less) or $141.02; rental cars $229.02; trucks, vans and utilities from $161.92 to $254.93; and tractors, $79.75.
The various types of motor vehicles registered and licensed over recent years are itemised in the tables following.
Table 20.23. LICENSED MOTOR VEHICLES
| At 31 March | ||||
|---|---|---|---|---|
| Type of vehicle | 1984 | 1985 | 1986* | 1988 |
* Figures for 1987 are unavailable due to the introduction of the new spread relicensing system. † From 1 July 1984 a contract vehicle is licensed as either a truck or a service coach. Source: New Zealand Post. | ||||
| Cars | 1431779 | 1481822 | 1511400 | 1373338 |
| Rental cars | 7395 | 10117 | 11762 | 8988 |
| Private taxicabs | 399 | 374 | 368 | 462 |
| Goods service vehicles | 294033 | 299811 | 305984 | 289161 |
| Contract vehicles† | 713 | |||
| Omnibuses | 3029 | 3169 | 3392 | 6942 |
| Public taxicabs | 2620 | 2582 | 2660 | 2361 |
| Service coaches | 1105 | 1483 | 1646 | 1235 |
| Motor cycles | 141156 | 137442 | 133954 | 97313 |
| Power cycles (mopeds) | 1379 | 1441 | 895 | 1020 |
| Total, motor vehicles | 1883608 | 1938241 | 1972061 | 1780820 |
| Trailers, including trailer-type caravans | 390924 | 384810 | 385916 | 347954 |
| Dealers' cars | 5105 | 5116 | 5235 | 4687 |
| Dealers' motor cycles | 264 | 222 | 260 | 284 |
| Vehicles exempted from annual licence fees | 74318 | 72344 | 62827 | 9973 |
| Miscellaneous | 11424 | 11270 | 11030 | 35287 |
| Total, all vehicles | 2365643 | 2412003 | 2437329 | 2179005 |
Table 20.24. REGISTRATIONS OF NEW VEHICLES
| New cars and station-wagons—c.c rating | |||||||||
|---|---|---|---|---|---|---|---|---|---|
| December year | 850 and under | 851 to 1300 | 1301 to 1600 | 1601 to 2000 | 2001 to 5000 | 5001 and over | Total | Cars previously registered overseas* | New motor cycles |
* Included in total. Source: New Zealand Post. | |||||||||
| 1983 | 704 | 20977 | 22899 | 26116 | 4984 | 171 | 75851 | 1766 | 16938 |
| 1984 | 970 | 27758 | 27325 | 35644 | 6472 | 268 | 98437 | 2019 | 15975 |
| 1985 | 596 | 23280 | 18789 | 32326 | 9108 | 335 | 84434 | 2918 | 13425 |
| 1986 | 847 | 17907 | 18232 | 30218 | 12398 | 419 | 80021 | 3946 | 13372 |
| 1987 | 746 | 18566 | 20510 | 29160 | 19717 | 929 | 89628 | 12129 | 12609 |
Table 20.25. REGISTRATIONS OF NEW COMMERCIAL VEHICLES
| December year | New commercial vehicles by gross weight in kilograms | Total commercial vehicles | |||||
|---|---|---|---|---|---|---|---|
| 2500 or less | 2501 to 4500 | 4501 to 9000 | 9001 to 14500 | 14501 and over | Omnibus and service couches | ||
Source. New Zealand Post. | |||||||
| 1983 | 19628 | 2133 | 1249 | 946 | 917 | 151 | 25024 |
| 1984 | 19324 | 3414 | 1476 | 1330 | 1296 | 195 | 27035 |
| 1985 | 15000 | 4220 | 1462 | 1177 | 1169 | 256 | 23284 |
| 1986 | 11818 | 3336 | 1227 | 1058 | 940 | 204 | 18583 |
| 1987 | 9819 | 3005 | 1197 | 884 | 931 | 283 | 16119 |
Not included in the above tables are new tractors, of which there were 2201 in 1983, 2217 in 1984, 1793 in 1985, 887 in 1986, and 741 in 1987.
Motor vehicles exempted from the annual licence fee include a variety of machines such as farmers' motor vehicles used solely on the farm and only venturing on roads to proceed from one part of the farm to another, or from farm to garage for repair, etc., excavators, scoops, trench diggers, cranes, and logging trucks (used on private roads), etc.
Table 20.26. LICENSED VEHICLES BY POPULATION
| As at 31 March | Number of persons in population per car | Number of persons in population per motor vehicle* | As at 31 March | Number of persons in population per car | Number of persons in population per motor vehicle* | |
|---|---|---|---|---|---|---|
* Excluding trailers and caravans. | ||||||
| 1983 | 2.3 | 1.6 | 1986 | 2.2 | 1.6 | |
| 1984 | 2.3 | 1.6 | 1987 | .. | .. | |
| 1985 | 2.2 | 1.6 | 1988 | 2.4 | 1.6 | |
Table 20.27 shows the main means of transport to work used by those employed in the full-time labour force at the 1986 census, whose census night and usual residential address were the same.
A large section (44.7 percent) drove a privately-owned car, truck or van to work, while a further 11.8 percent used a vehicle owned by the employing company. The public transport system serviced only 9.3 percent of those travelling to full-time work, with buses contributing 7.6 percent and trains only 1.7 percent.
Among the less common employment related means of transport are walking and ‘other’ (10.0 percent), travelling as passengers in cars, trucks or company buses (7.7 percent), by bicycle (5.2 percent) and as riders of motorcycles or powercycles (3.9 percent). The remaining 7.5 percent worked at home.
Significant patterns of travel to work at the 1986 census relate to male-female differentials in means of transport. Males showed a much greater tendency than females to drive company vehicles, or ride motorcycles or powercycles to work. Females, by contrast, tended to make greater use of the public transport system (public buses and trains), drive private vehicles, travel as passengers in cars, trucks and company vehicles, and walk more than their male counterparts. This male-female structure of transport use reflects a combination of demographic and economic variables including living arrangements, household composition and income, number of household income earners, access to household vehicles, distance travelled to work, occupation, industry and employment status.
Table 20.27. TRANSPORT TO WORK, 1986 CENSUS
| Employed in full-time labour force* x | |||||
|---|---|---|---|---|---|
| Males | Females | ||||
| Means of transport | Number | Percentage | Number | Percentage | Males as percentage of total |
* Population resident in New Zealand aged 15 years and over working 30 or more hours. Excludes those unemployed and seeking full-time work. † Includes jogging or running. | |||||
| Public bus | 43788 | 5.2 | 52890 | 12.2 | 45.3 |
| Train | 12879 | 1.5 | 8295 | 1.9 | 60.8 |
| Drive private vehicle | 356862 | 42.7 | 210984 | 48.6 | 62.8 |
| Drive company vehicle | 136992 | 16.4 | 12957 | 3.0 | 91.4 |
| Passenger in car, truck or company bus | 52797 | 6.3 | 44817 | 10.3 | 54.1 |
| Bicycle | 47949 | 5.7 | 17856 | 4.1 | 72.9 |
| Motorcycle, powercycle | 42234 | 5.1 | 6888 | 1.6 | 86.0 |
| Walk† | 71178 | 8.5 | 46101 | 10.6 | 60.7 |
| Other | 7986 | 1.0 | 2046 | 0.5 | 79.6 |
| Work at home | 63378 | 7.6 | 31410 | 7.2 | 66.9 |
| Not specified | 5292 | 2625 | 66.8 | ||
| Total | 841338 | 100.0 | 436869 | 100.0 | 65.8 |
Except in five cities and boroughs where it is controlled by local authorities, road traffic is controlled throughout the country and on all motorways by the Ministry of Transport. In national emergencies or major disasters, all traffic control comes under the ministry's supervision.
Ministry of Transport traffic officers enforce traffic laws and driving standards and investigate serious and fatal accidents. They also enforce the laws relating to heavy traffic, the allowable weights of vehicles and loads on different classes of road, and the licensing of road transport services (such as taxis and buses).
Traffic officers are not police officers and do not make criminal investigations. They form, however, a uniformed and disciplined enforcement body, and a close liaison is maintained with the police.
Since 1 May 1985 all drivers' licences have been valid without renewal until the end of the month in which the holder turns 71. Those special classes of licence which require annual medical tests, such as passenger service vehicles, require validation but otherwise no testing or renewal need be undertaken until the age of 70. A separate regime of medical and practical tests for renewal begins at this age.
A new form of driver's licence has been issued since 1 August 1987, coinciding with the introduction of a graduated driver licensing system. Replacement licences of this type were being issued to all licence holders progressively through 1988-89. At the same time licence holders are asked whether they wish to donate vital organs in the event of death and if so, this is indicated on the new licences.
The graduated system involves a number of restrictions on learner drivers to ensure they are protected from high-risk situations until they have obtained experience on the road in ‘normal’ conditions. Incentives for attending driver training courses are also built into the system, which applies to all first applicants for licences under the age of 25. The new system follows three stages:
Learner stage—This normally lasts for six months. On or after their 15th birthday, applicants may undergo a theory test and a vision test to obtain a learner permit which allows the holder to drive under the following conditions:
The permit is to be carried;
They must be accompanied by a full-licence holder who is in charge; and
They must effectively have a zero blood-alcohol limit (below 30mg/100ml of blood or 150mcg/litre of breath).
Restricted stage—This normally lasts 18 months. After completion of the learner stage the applicant undergoes a practical driving test to obtain a restricted licence which allows the holder to drive under the following conditions:
The restricted licence is to be carried;
There is no driving between 10 p.m. and 5 a.m. without adult supervision;
No passengers are to be carried without adult supervision; and
There is effectively a zero blood-alcohol limit (below 30mg/100ml of blood or 150mcg/litre of breath).
Full licence—Issued at the completion of the restricted stage without further test. Breaches of the conditions in either stage will result in their extension by up to six months.
All vehicles using the roads must be inspected regularly to ensure their mechanical and structural fitness. They are inspected every six months, but vehicles first registered since 1 December 1985 and less than three years old may be inspected every 12 months. Most lightweight vehicles are required to have a warrant of fitness which can be issued at approved garages, or at testing stations operated by local authorities or the Ministry of Transport. All heavy vehicles, with minor exceptions, undergo a more exacting examination for a certificate of fitness, which, in respect of passenger service buses, has special regard for the safety and comfort of passengers. Taxicabs and rental vehicles also require a certificate of fitness.
The design and standard of construction of vehicles manufactured, assembled, or modified in New Zealand are also regulated to ensure safety.
Wearing of seat-belts is compulsory for drivers and front-seat passengers in most classes of light vehicles registered after January 1955. All new cars registered since 1 November 1979 must have seat-belts fitted in the rear passenger seats and it is compulsory for rear-seat passengers to wear seat-belts where fitted.
For children under eight years the law also requires:
If an approved child restraint is available it must be used.
If there is no approved child restraint but a seat-belt is available it must be used (where appropriate).
If neither are available, the unrestrained child must travel in the rear seat. (Unrestrained children are allowed in the front seat only if the vehicle has no rear seat or if the rear seat is already fully occupied by children.)
For everyone eight years and older the law is:
If a seat-belt is available it must be used.
The driver is responsible for ensuring that children use available child restraints or seat-belts.
If there is no seat-belt available an unrestrained child must travel in the rear seat. All motorcyclists and pillion riders must wear safety helmets at all speeds.
Traffic officers have a wide range of tests available to them when they suspect a driver is affected by alcohol or drugs or a combination of the two. Any driver a traffic officer suspects is under the influence of alcohol or who commits a driving offence may be required to give a breath-screening test. If this proves to be positive the person may be required to give an evidential breath test. If this is positive, the person then has the option of either accepting the breath-test reading or providing a blood sample for analysis.
A driver commits an offence and is liable for prosecution if either.
His/her breath-alcohol concentration as recorded on an evidential breath-testing device exceeds 500 micrograms of alcohol per litre of breath; or
His/her blood-alcohol concentration exceeds 80 micrograms of alcohol per 100 millilitres of blood.
Drivers subject to the new graduated driver licensing system are subject to extensions of the learner or restricted stage if they are detected while driving with a breath-alcohol level exceeding 150 micrograms/litre or a blood-alcohol concentration exceeding 30 milligrams/100 millilitres. (These lower levels also mean additional prosecution for those apprehended for driving without an appropriate form of driver's licence.)
The maximum speed limits for highways and motorways are: 100 km/h for cars, motorcycles, vans and light vehicles; 90 km/h for buses, heavy motor and articulated vehicles; and 80 km/h for school buses and any vehicles towing trailers.
A general speed limit of 50 km/h is fixed in cities, boroughs, town districts, or other localities declared to be closely populated. Areas with a speed limit of 70 km/h may also be specified by the Minister of Transport; and limited speed zones may be established for which the maximum permitted speed may be either 100 km/h or 50 km/h depending on conditions and circumstances.
Penalties are awarded by courts for driving and other offences under the Transport Act 1962 and attendant regulations. There is also a system in operation whereby points are automatically registered according to a fixed scale against people convicted of driving offences.
The Secretary for Transport has authority to suspend drivers' licences for six months where 100 or more demerit points are received in less than a year, or for three months where this number of points is received within two years. The demerit scale for speeding offences has been increased from 15 to 35 points. Official notice of more than 60 points is given.
Breaches of certain laws are dealt with under an infringement system where a motorist may pay an infringement fee within a certain time to avoid court proceedings.
The following table covers only offences reported by officers of the Ministry of Transport; in addition traffic prosecutions are taken by the police, particularly for serious offences, following accidents or other police investigations. Some city councils employ their own traffic control staff, and the total number of offences is therefore rather higher than shown.
Table 20.28. TRAFFIC OFFENCES REPORTED*
| Type of offence | 1985 | 1986 | 1987 |
|---|---|---|---|
* Years ended 31 December. †Include infringements and notice to prosecute offences. ‡ Excludes breaches of rail restrictions, waybill and route permit offences, miscellaneous offences and those offences not elsewhere indicated. For this reason, totals will differ from past years. Source: Ministry of Transport. | |||
| Accident-promoting offences— | |||
| Driving or attempting to drive under the influence of drink or drugs | 263 | 300 | 315 |
| Breath/blood alcohol offences | 9157 | 9726 | 8945 |
| Evidential/excess alcohol | 9846 | 9899 | 10584 |
| Failure to fulfil duties after an accident | 1390 | 1619 | 1515 |
| Reckless driving | 251 | 213 | 189 |
| Driving in a dangerous manner | 1466 | 1504 | 1491 |
| Driving at a dangerous speed | 618 | 724 | 711 |
| Driving without reasonable consideration | 316 | 353 | 311 |
| Careless use of a motor vehicle | 15076 | 17444 | 17978 |
| Overtaking offences | 949 | 1062 | 1067 |
| Failure to keep to the left | 4204 | 4198 | 3974 |
| Failure to yield right of way | 2412 | 2803 | 2227 |
| Failure to stop in half clear road | 3146 | 3622 | 3226 |
| Exceeding 50 km/h† | 78999 | 101221 | 93750 |
| Exceeding 70 km/h† | 2765 | 4119 | 3664 |
| Exceeding 80 km/h† | 24441 | 166 | 189 |
| Exceeding 100 km/h† | 7745 | 19319 | 26912 |
| Exceeding temporary speed limits | 942 | 1108 | 937 |
| Exceeding by-law speed limits | 94 | 54 | 14 |
| Failure to stop at traffic lights | 6430 | 7645 | 6745 |
| Failure to stop at compulsory stop sign | 8397 | 9100 | 8342 |
| Failure to give way at give way sign | 1487 | 1677 | 1304 |
| Failure to yield right of way at pedestrian crossing | 543 | 595 | 560 |
| Failure to stop or give way for siren | 324 | 327 | 298 |
| Failure to comply with road signs | 2909 | 3230 | 2829 |
| Failure to wear safety helmet | 3469 | 3884 | 3717 |
| Provisional motor cyclist exceeding 50 km/h | 103 | 100 | 47 |
| Exceeding 70 km/h with trailer | 595 | 20 | 14 |
| Exceeding 70 km/h with heavy motor vehicle | 619 | 4 | 1 |
| Exceeding 80 km/h with trailer | 297 | 973 | 1376 |
| Exceeding 90 km/h with trailer | 43 | 11 | 37 |
| Exceeding 90 km/h with heavy motor vehicle while towing | - | 23 | 29 |
| Exceeding 90 km/h with heavy motor vehicle | - | 90 | 86 |
| Exceeding other limits | 321 | 73 | 11 |
| Defective brakes | 184 | 227 | 195 |
| Lighting offences | 5213 | 5437 | 3578 |
| Failure to dip lights | 102 | 108 | 72 |
| Mechanically defective or unsafe vehicle | 6368 | 6421 | 5161 |
| Trailer offences | 415 | 496 | 436 |
| Subtotal | 201899x | 219895x | 212837 |
| Non accident-promoting offences— | |||
| Failure to obey officer | 2669 | 3050 | 3747 |
| Owner failing to supply information | 128 | 179 | 146 |
| Failure to pay overloading infringement fee | 330 | 863 | 584 |
| Failure to pay fees | 36 | 21 | 1 |
| Warrant of fitness offences | 49070 | 46544 | 47189 |
| Certificate of fitness offences | 1641 | 1626 | 1570 |
| Certificate of loading offences | 544 | 470 | 341 |
| Exceeding certificate of loading | 200 | 187 | 204 |
| Cng and lpg offences | - | 33 | 67 |
| No distance licence carried | 2031 | 2216 | 1836 |
| Hubodometer offences | 4220 | 4060 | 3896 |
| Driving without a time licence | 162 | 162 | 101 |
| Exceeding maximum gross weight or distance or time | 4071 | 4106 | 3478 |
| Road user licence altered, defaced or not displayed | 935 | 446 | 1785 |
| Driver's licence offences | 14369 | 15214 | 19147 |
| Driving whilst disqualified | 3371 | 3540 | 3957 |
| Probationary drivers' offences | 745 | 901 | 742 |
| Vehicle licences and registration offences | 13976 | 15802 | 22847 |
| Safety-belt offences | 6761 | 21821 | 22184 |
| Noisy motor vehicles | 879 | 773 | 561 |
| Emitting excessive smoke | 121 | 140 | 115 |
| Loading offences | 1904 | 3095 | 2353 |
| Other nuisances | 269 | 253 | 270 |
| Cycling offences | 2077 | 2041 | 1983 |
| Pedestrian offences | 74 | 113 | 81 |
| Passenger offences | 197 | 233 | 207 |
| Bylaw offences (other than speed limit) | 275 | 318 | 118 |
| Unlicensed goods service | 665 | 366 | 67 |
| Breach of goods service licence | 107 | 39 | 4 |
| Exceeding rail restriction limit | 44 | 11 | - |
| Rental vehicle offences | 82 | 79 | 50 |
| Taxi offences | 85 | 218 | 56 |
| No vehicle authority or not carried | 230 | 217 | 157 |
| Other transport service licence offences | 490 | 363 | 280 |
| Subtotal | 112758x | 129500x | 140133 |
| Other notices issued— | |||
| Parking infringements and offences | 101091 | 97712 | 82095 |
| Total, all offences and infringements | 415718‡ | 447017‡ | 435065 |
The first post office was set up at Kororareka (now Russell) in 1840. The same year overland mail routes were begun, and offices were established in the North and at Port Nicholson (Wellington). In 1858 a Post Office Act was passed which made the Post Office an independent department of state with 73 post offices.
A telegraph system began in the 1860s, and from 1865 a separate Telegraph Department was responsible for it. The North and South Islands were linked by telegraph cable in 1866 and by telephone cable in 1926.
In 1881 the telegraph and postal services were amalgamated. Later, under the Post Office Act 1959, the name of the department became the Post Office, and the minister's title became Postmaster-General.
By 1987 the Post Office had grown to be the country's largest employer with over 40000 staff in three trading areas: postal, telecommunications, and the related Post Office Savings Bank.
From 1 April 1987 the Post Office was split into three separate state-owned corporations. Non-commercial policy and regulatory functions relating to communications, including responsibility for international obligations, were transferred to the Department of Trade and Industry. This included the Radio Frequency Service, which allocates and manages the radio frequency spectrum, and administration of the Telecommunications Act 1987 and the Postal Services Act 1987.
A study by international consultants on the telecommunications sector formed the basis of the Government's announcement in December 1987 to liberalise the telecommunications market.
New Zealand Post Limited commenced operations as a state-owned enterprise and limited liability company on 1 April 1987. Its principal business is the provision of postal services within New Zealand and to and from other countries. Postal business generates about two-thirds of New Zealand Post's revenue, with most of the balance made by its acting as an agent for other organisations.
New Zealand Post is a member of the Universal Postal Union, the international agency responsible for regulating international postage. The company is also a member of the Asian and Pacific Postal Union—a grouping of postal administrations in the Asian and Pacific region.
New Zealand Post took over a network of approximately 1200 offices formerly the postal and agency business of the New Zealand Post Office. A closure programme was implemented to reduce the number of post offices to a more appropriate level for the size and population of New Zealand. An efficient postal service can be provided using a much smaller network and thus avoiding significant duplication of costs. From 5 February 1988 the New Zealand Post network has consisted of:
Official post offices;
Mail delivery services door to door, by rural contractors, and through community mail boxes;
Post agencies which provide full postal services in some local stores;
Postal delivery centres providing sales of stamps, delivery of mail across the counter, and holding mail for pick-up by New Zealand Post;
Stamp retailers such as small shops.
With about 750 outlets the company has the largest retail network in the country.
Table 20.29. TOTAL NEW ZEALAND POST OUTLETS
| As at 30 June 1988 | Number |
|---|---|
Source: New Zealand Post. | |
| Post branches | 513 |
| Post agencies | 220 |
| Post delivery centres | 242 |
| Stamp retailers | 173 |
| Total | 1148 |
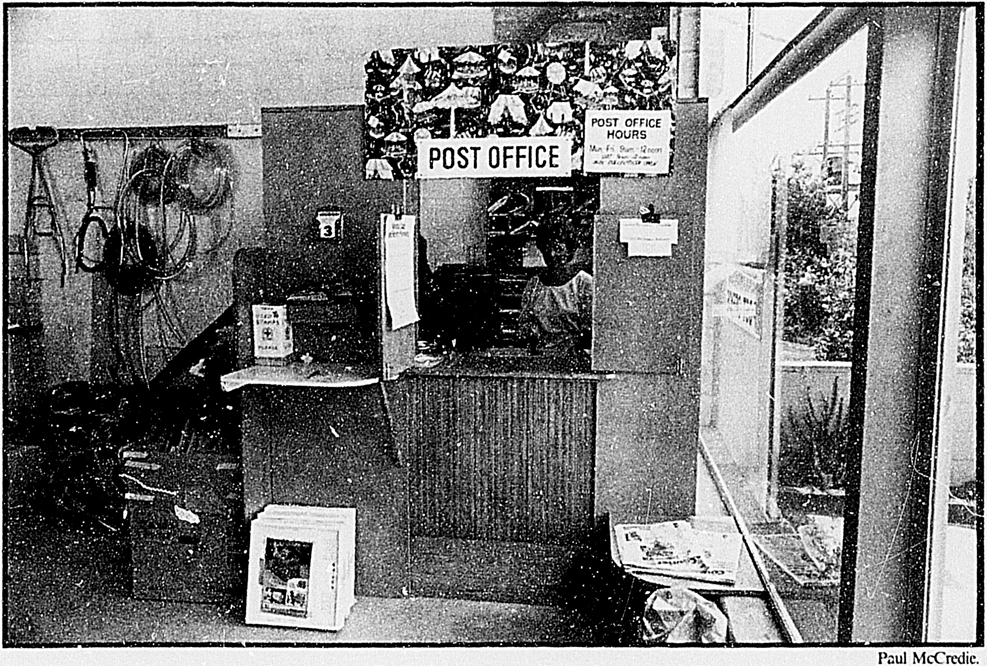
Agency post office, Kawakawa Bay.
The company's products and services include letter and parcel post conveyance and delivery, philatelic products and agency services. Associated with its limited monopoly for the carriage of letters, is the requirement that the company operate a price-equalised postal service throughout New Zealand. The continuation of this requirement and monopoly is subject to government review.
New Zealand Post handles over 800 million pieces of mail annually. The company employs over 9000 staff, in its 513 permanent post offices and its mail processing, transportation and delivery network.
Any postal item, from a letter to a parcel up to 20 kilograms, can be sent by fast post or by standard post. Fast post offers assured overnight delivery between over 500 centres. Standard post offers overnight delivery across town, or two-three day delivery elsewhere.
Easipost is an easy mailing, priority service in the form of a prepaid mailing envelope, holding up to about one kilogram of documents.
Within its simplified two stream postal system, fast post and standard post, New Zealand Post gives discounts for bulk mailing, and handles unaddressed mail (circulars), direct mail and registered publications.
Table 20.30. POSTAL DELIVERIES AND VOLUME OF ARTICLES POSTED
| Year ended 31 March | ||
|---|---|---|
| 1987 | 1988 | |
Source: New Zealand Post. | ||
| Deliveries to— | number | |
| Households | 1150000 | .. |
| Businesses— | ||
| by delivery | 47300 | .. |
| by business box and bag | 97000 | .. |
| Volume | items (million) | |
| Letters | 632 | 640 |
| Other articles (incl. parcels) | 157 | 182 |
| Total volume | 789 | 822 |
| Average daily volume | 2.2 | 2.3 |
Surface, surface air lifted, and airmail services are operated from New Zealand. Express Post International provides an assured delivery time, backed up by a money-back guarantee.
Other special services include international reply coupons, printpost direct bags, insurance and registration, literature for the blind, and advice of delivery.
New Zealand Post produced 14 stamp issues during the 1988 calendar year. A variety of philatelic products are sold by mail order through the Philatelic Bureau at Wanganui, at philatelic sales centres and through New Zealand Post outlets.
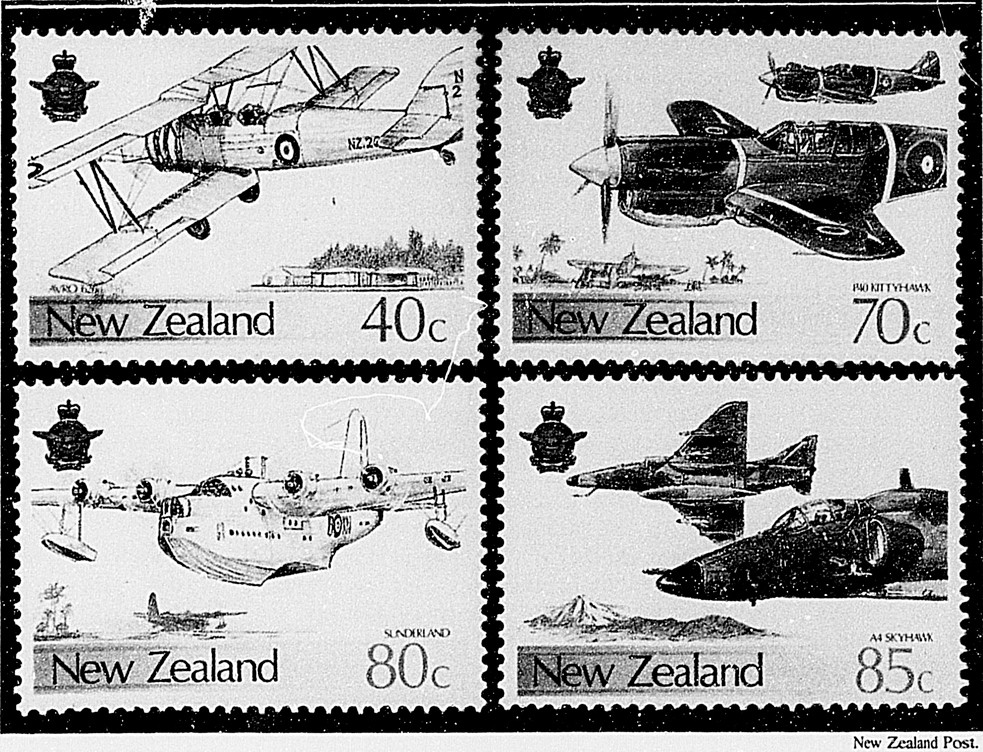
1987 stamp issue commemorating the RNZAF's fiftieth anniversary.
Table 20.32. NEW STAMPS RELEASED DURING 1988
| Date | Issue | Denominations |
|---|---|---|
| 13 January | Centenary of electricity | 40c, 60c, 70c, 80c |
| 13 January | Centenary of philately | 40c X 2, $1.00 |
| 3 March | Rafter painting | 40c X 3, 60c |
| 20 April | Takahe definitive | $5.00 |
| 18 May | Personal message stamp booklet | 40c X 5 |
| 7 June | Paradise shelduck | 70c |
| 8 June | 1988 Scenic walkways | 70c, 80c, 85c, $1.30 |
| 21 June | Australian Bi-Centenary | 40c |
| 27 July | Health (Olympic Games) | 40c, 60c, 70c, 80c |
| 14 September | 1988 Christmas Carols | 35c, 70c, 80c |
| 5 October | 1988 Heritage | 40c, 60c, 70c, 80c, $1.05, $1.30 |
| 19 October | Round kiwi | $1.00 |
| 2 November | New Zealand birds | 10c, 20c, 30c, 40c, 50c, 60c |
| 2 November | Whales (Ross Dependency) | 60c, 70c, 80c, 85c |
About 100 post offices have opened self-service shops in their customer service areas, selling a range of post related items, stationery, packaging products and greetings cards, including New Zealand Post's own range of packaging products.
Through its nationwide network of retail outlets, New Zealand Post undertakes a variety of work on behalf of government and business agencies. This work includes the collection of the public broadcasting fees, banking transactions for PostBank Ltd, receipt of telephone account payments, Lotto sales, registration of births, deaths and marriages, maintenance of the electoral rolls, motor registration, collection of road-user charges, sale of government stock, tenancy agreements for the Housing Corporation, membership enrolments for the Automobile Association central region, display of mail order catalogues and mail order photographic film processing.
The postal and agency operation of the former New Zealand Post Office incurred significant losses over three years culminating in a $48 million loss for 1986–87. New Zealand Post, however, is expected to make a modest profit in its first year of operation. This change has been affected through controlling costs, increasing revenue, improving service performance, marketing and the redirection of capital. Cost savings were achieved by a reduction in staff numbers by more than 10 percent, transport rationalisation and the office closure programme.
The Telecom Corporation of New Zealand provides telecommunication (including telephone) services which were formerly the monopoly of the New Zealand Post Office.
On its formation on 1 April 1987 Telecom retained this monopoly on services, although a programme of deregulation of the telecommunications industry will eventually see the state-owned enterprise facing competition from throughout the industry.
Deregulation began in October 1987 when the wiring of houses and the provision of telex machines was removed from the monopoly. This was followed by the deregulation of the supply and wiring of telephones for commercial premises, and the process will continue until deregulation is completed by April 1989. This will create more competition for the Telecom Corporation in all network, product and service areas of telecommunications.
The corporation operates an extensive telecommunications network, with over 99 percent of subscribers using automatic services and 96 percent having access to subscriber toll dialling. Over 80 percent of revenue is derived from basic telecommunications network services, with about 90 percent of this coming from telephone line rentals and from inland and international toll calls.
Other network products include leased circuits, telex services, mobile radio, telepaging, packet switched data services and a recently introduced digital data network. Collectively these activities account for under 10 percent of revenue, but data services are an area of rapid growth.
New Zealand continues to have one of the highest telephone densities in the world, 69.7 telephones per 100 of population. Since the first telephone exchange was installed in 1881 the telephone system has expanded to over 800 exchanges serving 1323000 subscribers at 31 March 1987.
Telephone exchanges are grouped into 157 toll-free calling areas within which there is no charge for local calls. The long-term objective is to reduce the number of toll-free calling areas to about 80. Toll fees are charged for calls between different toll-free calling areas, at rates varying according to distance. At March 1987, subscriber toll dialling was available to 96.2 percent of subscribers.
Telephone communication by cable, satellite, and radio is available to almost all countries of the world. An international gateway telephone exchange in Auckland handles all outgoing and incoming international telephone calls. International subscriber dialling is available to 94 percent of subscribers who may dial 150 countries and territories. Optical fibre cables and digital radio systems are now standard technology for long distance links and all new telephone exchanges employ the latest digital stored-programme-control technologies.
An integrated services digital network is planned for the 1990s. The network will enable simultaneous transmission of voice and data services over the same circuit. The installation and commissioning of a new trans-Tasman optical fibre cable system (TASMAN 2) by 1991 is also planned. Telecom will own 50 percent of this system in return for a total investment of about $112 million.
In 1987, mobile telephone services (sometimes called cellular radio), were introduced in Auckland and have been extended to include Wellington, Christchurch and Hamilton. This service provides for the use of both portable and vehicle-mounted telephones.
Table 20.33. TELEPHONE SERVICES
| As at 31 March | |||||
|---|---|---|---|---|---|
| Item | 1983 | 1984 | 1985 | 1986 | 1987 |
Source: New Zealand Post Office. | |||||
| Telephones (000) | |||||
| Subscribers | 1192 | 1220 | 1254 | 1290 | 1323 |
| Applicants awaiting service | 7 | 11 | 14 | 16 | 19 |
| Total demand | 1199 | 1231 | 1268 | 1306 | 1342 |
| Total telephones | 1939 | 2010 | 2105 | 2203 | 2315 |
| Telephones (per 1000 population) | 600 | 616 | 639 | 667 | 697 |
| Exchanges (number) | |||||
| Automatic | 764 | 778 | 796 | 798 | 814 |
| Manual | 61 | 46 | 31 | 28 | 14 |
| Percentage of subscribers served by automatic exchanges | 96.6 | 97.2 | 98.0 | 98.2 | 99.2 |
| Toll service | |||||
| Inland toll calls (million) | 110.2 | 120.3 | 135.9 | 151.7 | 170.9 |
| Percentage increase in toll traffic | 4.9 | 9.3 | 12.9 | 11.7 | 12.5 |
| Subscribers with STD facilities (000) | 693 | 797 | 1013 | 1157 | 1273 |
| Outward international toll calls (000) | 3653 | 4255 | 5326 | 7122 | 10215 |
In line with a world-wide decline in telegram traffic, Telecom stopped its inland telegram service on 31 August 1988. The service has since been reintroduced by a private firm.
A public bureaufax service was introduced in 1980, and is accessed through local post offices. This electronic document transfer service produces a facsimile of documents, including typewritten or handwritten manuscripts, charts and graphs. Documents are transmitted to both internal and overseas destinations, and use of the service is increasing steadily. During the year ended 31 March 1987, 706000 pages were transmitted. The international bureaufax service, which opened in September 1980, has continued to grow.
The telex service is a subscriber-to-subscriber teleprinter communication service, operated through a world-wide network of automatic telex exchanges.
An international telex service began in 1960. An automatic inland and international service was introduced in 1964. Demand for telex service has increased steadily and, as at 31 March 1987, there were over 6000 subscribers in New Zealand. In 1977 automatic telex service became available to ships at sea.
Computer-controlled telex exchanges were introduced in Auckland in June 1980 and in Wellington in May 1981. In addition to meeting the demand for new connections, the new exchanges enabled a reduction in the inland call charge because of reduced operating costs and the introduction of several special services.
These services include datel, datex, leased data circuits, and videotex. Datel provides for data communication over the switched telephone network at speeds of up to 2400 bits per second (measure of information flow). Subscribers' privately-owned terminals are connected to telephone lines through Telecom modems which convert the data signals to a form suitable for transmission over telephone circuits. Datel calls are charged at the same rates as normal telephone calls.
Datex is a 300-bit-per-second switched text and data communication service whereby subscribers can use their word processors or computers to communicate with other datex subscribers, or to telex subscribers at the slower speed of 50 bits per second. Datex calls are charged at the same rate as telex calls.
A leased data-circuit service provides the direct connection of subscribers' data terminal equipment by means of leased data-circuits operating at speeds of 300, 1200, 2400, 4800, and 9600 bits per second.
Videotex is a two-way, interactive, electronic information service which links subscribers, video screens to data bases through the telephone network. Subscribers may buy information and establish their own data bases for use by other subscribers. Demand for the service continues to grow and by the end of 1987 there were more than 5000 registered users accessing over 70 data bases. Financial services were the most frequently accessed with more than 11000 calls per month being made by the end of 1987. In November 1986 a new videotex access service was introduced based on the packet switching network. Development of the public data base also continues and includes a wide range of business, agricultural and other information.
A computer-based electronic messaging service called STARNET (store and retrieve network) was introduced as a pilot service in January 1986 and a full commercial service followed later that year.
In addition to circuits leased for electronic data, circuits are leased for private voice, teleprinter and facsimile networks, music, and fire alarm systems.
Radio stations for communication with ships at sea are located at Auckland, Wellington, Awarua and the Chatham Islands. They provide a service for the exchange of radio telegrams with ships at sea, and special rates operate for vessels registered in New Zealand and Australia. A free radio-medical service also operates for ships at sea and lighthouses on the New Zealand coast.
Telecom has a share in the ownership of the INTELSAT and INMARSAT organisations. Telecom also has an agreement with AUSSAT Pty Ltd of Australia for the lease of circuit capacity on its AUSSAT 3 satellite.
An earth station was opened in 1971 at Warkworth, near Auckland, for communicating with other countries via space satellites.
As well as providing additional internal and international telecommunication facilities, the earth-stations are used for both ‘live’ and recorded television relays. Two smaller earth-stations have operated at Wellington (Mt Crawford) and Christchurch (Rangiora) since 1986.
With the introduction of satellite communications, services provided by HF (high frequency) radio have progressively been converted to satellite operation. However, HF radio links are still maintained with Niue, Ross Dependency (Scott Base), Chatham Islands, Raoul and Campbell Islands and Pitcairn Island.
The censuses of transport, storage and communication form part of a series of integrated economic censuses of business activities in New Zealand carried out by the Department of Statistics over a five-yearly cycle until 1985. The 1984–85 census covered all operations by activity and ancillary activity units in the transport, storage and communication industries during the year ended 31 March 1985 (those with different balance dates submitted data for the year ended within the period 1 April 1984 and 31 March 1985). More recent industry data, from the 1987 Economy Wide Census, will be released progressively throughout 1989.
Table 20.34. SUMMARY OF CENSUS OF TRANSPORT, STORAGE AND COMMUNICATION 1984–85
| Statistical item | Transport and storage | Communication | Transport, storage and communication |
|---|---|---|---|
| number | |||
| Group enterprises | 6770 | 64 | 6833 |
| Enterprises | 7034 | 66 | 7100 |
| Activity units | 8558 | 1027 | 9585 |
| Ancillary activity units | 233 | 3 | 236 |
| Total number of vehicles | 40838 | 7042 | 47880 |
| Full-time working proprietors and partners | 6996 | 98 | 7094 |
| Part-time working proprietors and partners | 1105 | 32 | 1137 |
| Full-time paid employees | 55890 | 34429 | 90319 |
| Part-time paid employees | 4937 | 267 | 5204 |
| Total, persons engaged | 68928 | 34826 | 103754 |
| Full-time equivalent—working proprietors and partners | 7548 | 114 | 7662 |
| Full-time equivalent—paid employees | 58359 | 34563 | 92921 |
| Full-time equivalent—total persons | 65907 | 34677 | 100583 |
| $(000) | |||
| Opening stocks | 86,376 | 104 | 86,480 |
| Closing stocks | 93,976 | 168 | 94,144 |
| Expenditure on commissions and fees | 360,924 | 42 | 360,966 |
| Purchases—fuel and power | 594,626 | 22,501 | 617,127 |
| Salaries and wages to paid employees | 1,279,135 | 532,530 | 1,811,665 |
| Accident compensation levies/employer contributions etc. | 50,043 | 35,337 | 85,380 |
| Renting and leasing | 76,092 | 13,124 | 89,216 |
| Repairs and maintenance | 250,266 | 3,161 | 253,427 |
| Business insurance premiums | 48,365 | 110 | 48,475 |
| Road user charges | 79,561 | 81 | 79,642 |
| Rates, local/central government fees etc. | 44,407 | 7,002 | 51,409 |
| Depreciation | 260,139 | 101,075 | 361,215 |
| Interest, bad debts, donations etc. | 181,199 | 68,715 | 249,914 |
| All other operating expenses | 1,633,236 | 173,352 | 1,806,588 |
| Total, purchases and expenses | 4,857,993 | 957,030 | 5,815,023 |
| Commission and fees | 1,109,670 | 236 | 1,109,907 |
| Income from transporting passengers | 1,403,744 | 745 | 1,404,489 |
| Income from transporting freight | 2,073,717 | 31,185 | 2,104,902 |
| Subsidies received | 94,906 | 8 | 94,914 |
| Interest, dividends, royalties etc. | 118,005 | 64 | 118,069 |
| Other income | 505,250 | 1,238,908 | 1,744,159 |
| Total, sales and other income | 5,305,292 | 1,271,147 | 6,576,439 |
| Salaries to working proprietors and partners | 55,664 | 335 | 55,999 |
| Net profit/loss before tax and after deducting proprietors' salaries | 399,234 | 313,846 | 713,080 |
| Net profit/loss on extraordinary items | 11,925 | -1 | 11,924 |
| Operating surplus | 518,093 | 382,832 | 900,924 |
| Value added | 2,197,737 | 1,117,204 | 3,314,942 |
| Additions to fixed assets | 612,971 | 343,853 | 956,824 |
| Disposals of fixed assets | 143,976 | 38,292 | 182,268 |
| Book value of fixed assets | 2,307,792 | 1,232,739 | 3,540,531 |
Table 20.35. REGIONAL SUMMARY OF CENSUS OF TRANSPORT, STORAGE AND COMMUNICATION 1984–85
| Local government region | Enterprise groups | Enterprises | Activity units | Ancillary activity units | Persons engaged | Salaries and wages* |
|---|---|---|---|---|---|---|
* Includes capitalised salaries and wages amounting to $58,261,000. | ||||||
| no. | no. | no. | no. | no. | $(000) | |
| Northland | 249 | 257 | 352 | 14 | 2804 | 47,047 |
| Auckland | 2160 | 2283 | 2653 | 62 | 30836 | 575,930 |
| Thames Valley | 105 | 107 | 136 | 3 | 832 | 12,667 |
| Bay of Plenty | 330 | 347 | 444 | 10 | 4165 | 82,372 |
| Waikato | 463 | 477 | 592 | 13 | 4885 | 78,512 |
| Tongariro | 115 | 116 | 141 | - | 720 | 10,970 |
| East Cape | 124 | 126 | 152 | 2 | 1108 | 16,997 |
| Hawke's Bay | 311 | 325 | 399 | 8 | 3455 | 62,472 |
| Taranaki | 223 | 230 | 293 | 4 | 2698 | 49,825 |
| Wanganui | 135 | 137 | 185 | 9 | 1568 | 25,300 |
| Manawatu | 246 | 251 | 308 | 3 | 3237 | 51,467 |
| Horowhenua | 82 | 83 | 108 | - | 775 | 13,085 |
| Wellington | 976 | 1018 | 1187 | 33 | 18857 | 353,737 |
| Wairarapa | 93 | 95 | 113 | 1 | 745 | 10,459 |
| North Island, total | 5271 | 5472 | 7063 | 162 | 76685 | 1,390,841 |
| Nelson Bays | 115 | 129 | 177 | 7 | 1855 | 33,021 |
| Marlborough | 72 | 82 | 118 | 7 | 965 | 20,231 |
| West Coast | 69 | 77 | 127 | 5 | 1152 | 20,742 |
| Canterbury | 715 | 751 | 936 | 24 | 11931 | 206,426 |
| Aorangi | 151 | 162 | 233 | 9 | 2219 | 37,903 |
| Clutha-Central Otago | 114 | 120 | 167 | 1 | 1079 | 17,379 |
| Coastal-North Otago | 318 | 333 | 415 | 11 | 4813 | 85,759 |
| Southland | 266 | 275 | 349 | 10 | 3054 | 57,623 |
| South Island, total | 1660 | 1739 | 2522 | 74 | 27067 | 479,085 |
| New Zealand, total | 6833 | 7100 | 9585 | 236 | 103753 | 1,869,926 |
20.1 Ministry of Transport; Department of Statistics; New Zealand Ports Authority.
20.2 Ministry of Transport; Airways Corporation of New Zealand.
20.3 New Zealand Railways Corporation.
20.4 Ministry of Transport.
20.5 New Zealand Post Ltd; Telecom Corporation of New Zealand.
20.6 Department of Statistics.
Census of Transport, Storage and Communication 1984–85. Department of Statistics.
Enterprise Survey 1985–86. Department of Statistics.
Monthly Abstract of Statistics. Department of Statistics.
Report of the Communications and Road Safety Committee (Parl. paper I. 2b).
Report of the Ministry of Transport (Parl. paper F. 5).
Report of the Urban Transport Council (Parl. paper F. 9).
Transport Statistics. Department of Statistics (annual).
New Zealand Shipping Policy—December 1983 (Parl. paper F. 14).
Report of the New Zealand Ports Authority (Parl. paper F. 5a until 1988).
Report of the Shipping Corporation of New Zealand (Parl. paper F. 13).
Report of the Waterfront Industry Commission (Parl. paper G. 2).
Shipping and Cargo Movements. Department of Statistics (annual).
Stevedoring Statistics. Waterfront Industry Commission (annual).
Turn-round of Overseas Shipping. Waterfront Industry Commission (four-monthly).
New Zealand Civil Aircraft Accidents. Office of Aircraft Accident Investigation (annual).
New Zealand Civil Aircraft Register. Ministry of Transport (annual).
New Zealand Civil Aviation Statistics. Ministry of Transport (annual).
Breath Tests in New Zealand. Ministry of Transport (annual).
Car Operating Costs. Ministry of Transport. (annual).
Local Authority Statistics. Department of Statistics (annual).
Motor Accidents in New Zealand. Ministry of Transport (annual).
Report of the National Roads Board (Parl. paper F. 8).
Report of the New Zealand Police (Parl. paper G. 6).
Report of the Urban Transport Council (Parl. paper F. 9)
Roading Statistics. National Roads Board (annual).
Roading Survey. National Roads Board (annual).
Statistics of the Licensed Road Transport Industry. Ministry of Transport (annual).
Truck Operating Costs. Ministry of Transport (annual).
Table of Contents
Current government thinking regards competition as an essential ingredient in an efficient economy, and as a means of achieving increased efficiency, lower, more stable prices, improved availability of a wider range of goods and services, and the efficient allocation of resources.
Policies are based on the argument that New Zealand's previous system of controls on the commercial and other sectors discouraged structural change. Economic growth was hindered by not allowing the marketplace to determine which industries would contract, so as to let resources move into more productive areas, and hence encourage growth.
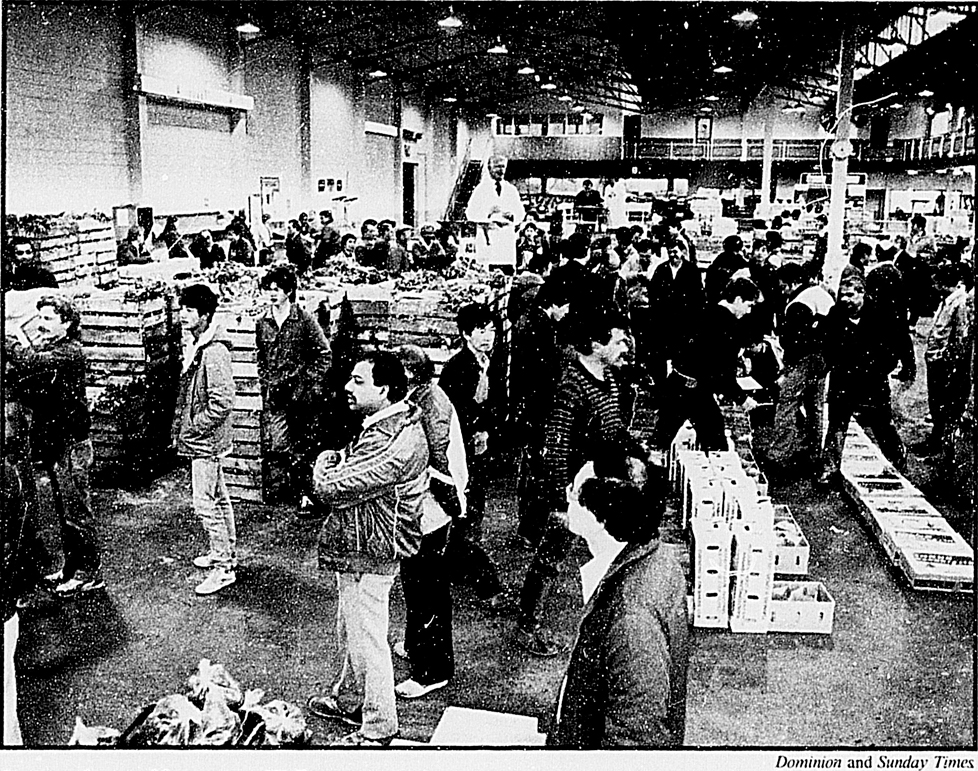
Fruit and vegetable auction, Wellington.
Deregulation has been an element of putting these policies into effect. The Government has been involved in a programme of industry assistance reform, a continued move away from import licensing towards tariffs, the removal of further restrictions on the operation of financial markets, and the reorganisation of state trading enterprises on a more commercially competitive basis. Among specific sectors deregulated to introduce more competition are the telecommunications and petroleum industries.
The process of change has been rapid since 1984. Along with these policies to increase competition, emphasis has been placed on improving the level of consumer protection. Legislation was introduced in the form of the Fair Trading Act 1986, and the Ministry of Consumer Affairs established to protect the interests of consumers.
There have also been extensive reviews of the legislation covering both shop trading hours and the sale of liquor.
This Act, which came into effect on 1 March 1987, reformed the law relating to false trade descriptions and deceptive trade conduct. It also provided new consumer information and product safety measures. It complements the Commerce Act 1986, which promotes effective competition in markets, and the Sale of Goods Act 1908.
The Fair Trading Act 1986 replaced several Acts relating to consumer information and labelling with a comprehensive set of measures covering the following inter-related spheres:
Misleading or deceptive conduct—There is a statutory prohibition on misleading or deceptive conduct in trade, although contravention of this provision gives rise to civil remedies only.
False trade descriptions—The prescriptive trade descriptions approach to false or misleading information, contained in the Merchandise Marks Act 1954 and the Consumer Information Act 1969, was extended by the Fair Trading Act 1986 to apply to representations relating to sales of land and promotion of employment opportunities. Contraventions of these provisions incur both criminal and civil liability.
Unfair practices—Certain selling practices, namely pyramid selling, third party trading stamp schemes, and misleading statements about certain business activities are prohibited by the Act. To these are added prohibitions on offers of gifts and prizes with no intention of fulfilling them ‘bait advertising’ and referral selling. There is also a prohibition on demanding or accepting payment without intending, or being able, to supply as ordered. Contraventions of these provisions incur both criminal and civil liability. The use of physical force, harassment, or coercion in connection with the supply of goods, services, or land is also prohibited and incurs civil liability.
Consumer information—The Fair Trading Act 1986 consolidated and extended information requirement powers previously in the Consumer Information Act 1969 and the Merchandise Marks Act 1954 into a single power to require information, which is vested in the Minister of Consumer Affairs.
Services and product safety standards—The Act provides for the creation of safety standards. Where goods are found to be unsafe, the Minister of Consumer Affairs may prohibit their supply and order the recall of any goods already supplied. These are powers of last resort, intended as a legal back-up to, rather than a substitute for, the work of the Product Safety Council, which promotes voluntary recall procedures and compliance with safety standards.
Enforcement of the Act's provisions is undertaken by the Commerce Commission. In addition, private actions may be taken in relation to contraventions of any provision. The functions of the commission are outlined in section 21.2, Commercial framework.
The ministry's functions are: to advise the Government on matters affecting consumers; to promote and participate in the review of consumer-related legislation, policies and programmes; to promote awareness among consumers and the business sector of their rights and obligations in the marketplace, so that exchange activities are undertaken without loss or disadvantage to either party; and to support and co-ordinate non-government involvement in consumer issues.
The Ministry of Consumer Affairs is involved in a wide range of consumer policy issues, many of which relate to the Fair Trading Act 1986. It is developing a role in consumer education and awareness. This includes assisting with training of those handling consumer complaints and encouraging consumers to have a voice in policy and decision-making processes.
The ministry also provides a consumer perspective on existing or proposed legislation and, where appropriate, on proposed economic and social policy. This involves working with government, business, and particularly community groups, in the process of identifying consumer concerns. Current issues include a review of credit legislation from a consumer perspective and the establishment of basic standards for post-sales service provided by suppliers.
The ministry examines specific issues of concern relating to product safety and promotes it through liaison with business, industry and other interested organisations and government departments. The ministry advises the Minister of Consumer Affairs on the declaration of appropriate product safety standards, or on the need to ban particular products found to be unsafe.
The ministry was established on 1 July 1986. It operates as a division of the Department of Trade and Industry but is responsible directly to the Minister of Consumer Affairs.
The work of the institute comprises consumer research, protection and information activities: product testing and safety; research into and advice on legal, financial, health, and welfare matters; representation at public hearings; and magazine and book publishing. The institute liaises with government, business, trade and safety organisations and operates on an independent and impartial basis.
The Consumer's Institute was set up in 1959 and became a statutory body under the Consumer Council Act 1966. In 1986 the Government decided this Act would be repealed on 31 December 1988. The institute's governing body, the Consumer Council will be abolished and the institute will be a private consumer association from 1 January 1989 instead of a statutory body. It will be an incorporated society known as Consumers' Institute of New Zealand Inc., governed by a board of management, working for its members and funded by them. The Government will no longer make financial grants towards the work of the institute.
Most of the functions formerly carried out by the council and the institute will continue under the new administration. The institute's complaints advisory service and consumer education resources programme for schools will be discontinued at the end of 1988. These activities will become the responsibility of the Ministry of Consumer Affairs.
There were around 131000 members of the institute at the end of 1987. All members receive the monthly magazine Consumer. During 1988 the institute also began publication of the quarterly Consumer Home and Garden.
Under the Shop Trading Hours Act 1977 shops may open at any time between 7 a.m. and 9 p.m., Mondays to Saturdays inclusive, but are to be closed outside these hours and on Sundays and statutory holidays, unless an extension of opening hours has been authorised by the Shop Trading Hours Commission.
The Act provides that ‘approved’ goods may be sold at any time. Goods not on the approved list are ‘restricted’ goods. If an occupier intends to open a shop to sell approved goods outside the hours mentioned, then all restricted goods must be out of sight of the public or kept in a part of the shop that is closed off.
Provision is made for orders authorising a shop occupier to open at times other than those mentioned. The majority of the shop occupiers in an ‘area’ (which may be a street, mall, or municipality) can also apply for such an order to cover the whole area.
‘Approved’ goods are listed in a schedule contained in an order made under the Act. Approved goods include bakers' and pastrycooks' goods, building supplies and domestic repair requisites, condiments, confectionery, dairy produce, drinks, fish, frozen foods, fruit and flowers, fuels, gardening supplies, aquarium flora and fauna, miscellaneous groceries, magazines and periodicals, meats and smallgoods, medicinal and household goods, motor fuels, motor accessories, photographic goods, plants, prepared and cooked foods, tobacco etc., vegetables, and a number of miscellaneous lines.
The Act makes special provision for bona fide ‘dairy-mixed businesses' to allow them to open on a seven-day-week basis. Dairies need only complete an application form which is lodged with the Shop Trading Hours Commission. The application, together with a report from an inspector, is then considered by the commission without the need for a formal hearing. If the application is granted, the dairy may open outside the hours set by the Act. If it is declined the shop must observe the legally permitted hours or, if the proprietor wants to open outside those hours, he or she must confine the display to items on the approved list.
In early 1988 an advisory committee appointed by the Minister of Labour, carried out a review of the Shop Trading Hours Act 1977. The committee's terms of reference were to consider the appropriateness of the law for present day conditions and the special needs of the tourist industry. The committee has since recommended changes but remains divided on the question of repeal of the current laws.
The current law relating to liquor licensing has been reviewed by a working party on liquor (the Laking Committee), which reported to the Minister of Justice in 1986. At the time of going to press, new legislation was before a select committee of Parliament and was being considered with submissions from interested individuals and organisations. Before it becomes law the legislation will be subject to a conscience vote by members of Parliament. Its provisions will take effect a year from the date it is passed.
Currently the principal legislation governing the sale of alcoholic liquor is the Sale of Liquor Act 1962. As a general rule it provides that no liquor may be sold without the appropriate licence, or a club charter. Licences are authorised if they are necessary or desirable in particular localities. The Act also regulates the licensed trade and accommodation, amenities, and services provided for the public.
The Wine Makers Act 1981 sets quality standards for export wine.
The sale of liquor is allowed to persons of 20 years or older. Liquor may also be supplied to persons of 18 years of age if the person is accompanied by a spouse of 20 or a parent. There is also a family lounge permit. Parents, guardians or adult family members may take under-age children into parts of hotels, taverns, or chartered clubs. Liquor may be supplied to an unaccompanied person of 18 years of age as part of a meal.
The hours for the sale of liquor in hotels, taverns, and chartered club bar rooms are 11 a.m. to 10 p.m. Hotels and taverns may open earlier than 11 a.m., but not more than 11 hours a day. Further extensions (on application) are allowed for individual hotels or taverns. They may remain open until 11 p.m. on Friday or Saturday or Christmas Eve, and 12.30 a.m. on New Year's Day, in addition to the normal 11 hours per day. With certain exceptions, sales from hotels and taverns are prohibited on Sundays, Christmas Day, and Good Friday. Hotels and taverns may serve liquor to guests and lodgers with a meal between the hours of 9 a.m. and 1 a.m.
The Trespass Act 1980 gives the licensee or manager authority to issue warnings to patrons to leave or stay off public bar premises, or else be liable to a fine not exceeding $1,000, or to imprisonment for a term of up to three years.
With the food and entertainment licence the Licensing Control Commission is authorised to fix hours of sale between 9 a.m. and 3 a.m. on the following day. Club licence hours must generally be between 11 a.m. and 10 p.m. Permits for unlicensed restaurants authorise consumption by patrons of their own liquor until 11.30 p.m., and the vineyard bar permit authorises sales until 9 p.m. except on Sundays, Good Friday, or Christmas Day.
Central to the current system of liquor licensing is the Licensing Control Commission which determines the need for accommodation services and other facilities on licensed premises (as well as what new licences and club charters are necessary or desirable and authorising their issue). The commission also prescribes and enforces standards of accommodation, facilities and services on licensed premises, and hears appeals from regional licensing committees' decisions.
There are 21 licensing committees. They are serviced by local District Courts. Each committee has five members, four nominated by local authorities, and the chairperson who is a District Court judge. They issue licences, renew licences annually, and hear applications for cancellation or suspension of licences. There is a right of appeal to the Licensing Control Commission except on a matter of law or character, when the appeal is to the High Court. Some commission decisions are subject to appeal to the administrative division of the High Court.
Types of licence include hotel, tavern, and tourist house (premises and keeper's) licences, and wholesale, wine reseller's, booth, airport, ship, food and entertainment, and club licences. With food and entertainment or club licences the commission has a discretion to fix hours (within broad statutory parameters) and conditions.
Permits for specific purposes are also provided for. For example, patrons may take liquor to an unlicensed restaurant for consumption with their meal. A wine distributor's licence authorises the holder to sell wine to other licensees only.
The Licensing Control Commission decides after a public inquiry, at which all interested parties may make representations, whether the issue of any new hotel or tavern premises licences, or wholesale or wine resellers' licences, are necessary or desirable in particular localities. Hotel or tavern premises licences prescribe the minimum standards of accommodation, services, and other facilities. There is provision for a poll of residents on whether they want a hotel or tavern in their locality. If the majority is against a licence, the commission may not authorise it unless special circumstances exist. Subject to the result of any poll, the commission may then call for applications for the new hotel or tavern premises or wholesale licence, and grant it to the most suitable applicant. When the commission decides to issue a new wine reseller's licence, however, the matter is referred to the appropriate licensing committee, which invites and considers applications. Applications for other types of licences may be made at any time and are considered at public hearings.
There were 6049 liquor licences of various kinds in force at 30 June 1986.
The system of trust control is an alternative to privately-held licences supervised by licensing committees, and the Licensing Control Commission gives the public an indirect control over the conditions under which liquor is sold. Licensing trusts are local bodies, elected by the residents and responsible to them. There are eight district trusts: Ashburton, Clutha, Geraldine, Invercargill, Masterton, Mataura, Oamaru, and Porirua. In addition local trusts operate hotels and taverns.
Suburban trusts are free to establish outlets without the need of licences, but the commission's approval must first be obtained. This allows the commission to consider the requirements of the particular area, as well as providing forum for objections. Residents also have the right to a poll on proposed new premises. There are also local licensing trusts, which operate new hotels or taverns authorised by the commission. Local trusts are set up following a poll on whether the new licence should be issued to a trust. Licensing trusts may operate catering facilities on the same basis as holders of a food and entertainment licence.
Individuals wishing to join together to form a business have the choice of two principal forms of operation. They can form an ordinary or special partnership under the Partnership Act 1908, or they may form a registered company under the Companies Act 1955. If, as usually happens, they wish to limit their individual liability for any losses that the business may suffer, then they will choose to register a limited liability company under the Companies Act 1955. This is by far the most usual form of business operation in New Zealand.
Any number of persons from two to 25 may form a private company, but in special circumstances the number may increase to 50. A public company must have a minimum of seven members. Under certain conditions a private company may be re-registered as a public company and vice versa.
A registered company becomes a corporation, which is a separate legal entity from the individual members of the company. Certain important consequences flow from this. The debts of a registered company are those of the company and not of its members, that is, the shareholders in most cases. A registered company contracts in its own name and is liable on its contracts. The members, therefore, are not usually liable on its contracts. A registered company has perpetual succession. This means the death, bankruptcy, retirement, etc., of its members does not affect its existence or its capacity to hold property. A registered company can enter into contracts with its members. Lastly, the members of a registered company are not its agents and therefore have no power to deal with its assets, or enter into binding contracts on its behalf.
Associated with the principle of separate legal entity is that of limited liability. Most companies are registered with the members having limited liability. A company is always fully liable for claims against it; it is the members' liability for a company's debts that is limited. In the case of a company limited by shares the liability is limited to the amount, if any, unpaid on that member's shares.
Despite having the highest per capita number of registered companies in the world, many New Zealanders work on an individual basis as sole traders. There are no statutory restrictions but, in the event of the business failing, bankruptcy is a likely consequence.
Comprehensive legislation relating to companies is contained in the Companies Act 1955. Modelled on the English Companies Act 1948, this Act reflects more of a New Zealand approach to matters affecting corporations. The Act is currently undergoing a complete review.
An important principle of the legislation is the protection of shareholders, creditors, and the general public by the requirement that there be the fullest practical disclosure of information concerning the activities of companies. Annual statements of account are required from public and non-exempt private companies (which have 25 percent or more of their capital held by persons domiciled overseas) and must exhibit a true and complete account of a company's affairs and transactions. There is a prescribed form of presentation, and comparative figures for the previous year have to be included.
Offers of shares to the public can only be made after the issue of a prospectus, which has to be registered with the Registrar of Companies. The Securities Act 1978 established a Securities Commission, whose responsibilities include recommending rules in this area, which are set out in the Securities Regulations 1983. The regulations cover restrictions on, and the content of, registered prospectuses and advertisements.
The Companies Amendment Act 1963 regulates takeovers by ensuring that shareholders in other companies have enough time and information to make a proper decision about the takeover offer. The Companies Amendment Act 1964 deals with flat-owning companies, which issue occupation licences registered under the Land Transfer Act 1952.
A partnership is defined in the Partnership Act 1908 as the relationship which subsists between persons carrying on a business in common with a view of profit. Partnerships are started by mutual agreement, which can be informal, but the terms would normally be contained in a written agreement. Its characteristics are described below. Each partner is usually under a joint liability for all the partnership debts. A partnership will as a rule be dissolved by the death or retirement of a partner. Partnership interests are not usually capable of being assigned or transferred. Control and management of a partnership's affairs are (subject to the partnership agreement) vested in all the partners. Lastly, a partner is ostensibly an agent for the other partners, and can commit the partnership to agreements and arrangements that bind them.
In the process of freeing up the economy and reducing government regulation of markets, legislation has been introduced to prevent large companies and industries from dominating markets by, for example, buying out their competitors, thus creating a monopoly over goods and services.
The commission investigates companies for compliance with and enforces the provisions of the Commerce Act 1986. This Act exists to promote workable and effective competition in markets within New Zealand and controls restrictive trade practices, mergers and takeovers, and prices.
In the area of trade practices, such as contracts, covenants, arrangements and understandings, the Commerce Act prohibits any that have the purpose or effect of substantially lessening competition in a market, except where public benefits outweigh this outcome and the commerce commission authorises it.
The Commerce Commission is also the approving authority for mergers and takeover proposals and may only give clearance to a notified merger or takeover if it is satisfied that implementation would not result in any person acquiring or strengthening a dominant position in a market to eliminate or deter competition.
In the prices area, the commission determines prices of controlled goods and services. Direct price control may be imposed where competition is significantly reduced or absent in a market. Competition is therefore given some primacy as a policy objective to regulate markets. The Commerce Act 1986 does, however, provide a process under which other public policy objectives may be balanced against that objective.
The commission was established by the Commerce Act 1975 and reconstituted under the Commerce Act 1986 as a body corporate with its existing membership. Formerly a quasi-judicial body, the role of the commission is now more investigative and administrative in character. It undertakes an adjudicative rather than an adversarial role.
The commission comprises three to five members, appointed for their experience in, or knowledge of, industry, commerce, economics, law, accounting, public administration, or consumer affairs. Provision is mad for additional associate members, to be appointed in relation to a particular matter or class of matters. The commission is staffed by officers of the Department of Trade and Industry.
The Commerce. Commission also has responsibility for administering the Fair Trading Act 1986 (see above).
This body, established under the Securities Act 1978, has a wide range of functions aimed to ensure fair practices are followed in the securities market. These are:
To keep under review the law relating to companies, securities and issuers of securities, and recommend changes.
Surveillance of practice—To review securities practices and comment on them with power to hold enquiries in particular cases, if necessary in public.
Education—To promote public understanding of the law and practice about securities.
Exemptions—To exempt persons and classes of persons either temporarily or on a long-term basis, from compliance with various provisions of the Securities Act and Regulations.
Substantive jurisdiction in particular cases—To suspend or cancel the registration of prospectuses, to prohibit the publication of advertisements, to exercise powers for the protection of investors in contributory mortgage schemes, to approve persons to act as trustees and statutory supervisors, to recommend that entities in difficulties should be placed under statutory management, and to hear appeals against decisions of the Registrar of Companies.
The commission's current law reform programme includes a review of the law and practice relating to (i) company mergers and takeovers: (ii) contributory mortgages; (iii) financial reporting; (iv) insider trading; (v) future contracts; and (vi) group investment funds. The commission also proposes to review the Securities Act 1978 and regulations. The commission has recommended legislation on the disclosure of any beneficial interest in securities held in the name of a nominee.
The commission consists of 10 members appointed by the Governor-General on the recommendation of the Minister of Justice. The chairperson is a barrister and solicitor appointed on a full-time basis. Other members and alternates are engaged on a part-time basis, and are expected to have wide experience in commercial affairs.
There are three broad categories of stock that people can buy on the New Zealand Stock Exchange—shares in companies, debentures and other loans to companies, and government and semi-government stock. As on other stock exchanges around the world, company shares account for the vast bulk of trading.
This central exchange operates under the authority of the Sharebrokers Act 1908. Its main office in Wellington is responsible for the granting of listing, the supervision of listed companies as regards their compliance with the listing manual, and the collection and promulgation of all market information.
The exchange is financed by the payment of annual fees by companies listed on it and by levies on its members.
It co-ordinates regional stock exchanges in Wellington, Auckland, and Christchurch which maintain trading floors providing the facilities for buying and selling government securities and securities in semi-government corporations and companies operating in the private sector.
The New Zealand Stock Exchange is made up of members (sharebrokers) whose function it is to act as agents on behalf of their clients. Members send their staff on to one or more of the trading floors to buy and sell shares on their clients' behalf. To become a member, a person must obtain a sharebrokers' licence; be proposed and seconded; be approved by the stock exchange committee, which is guided by character, financial standing, and experience; be elected by a meeting of members; and pay an entrance fee.
The international market ‘crash’ in October 1987 affected the New Zealand market severely. Prices fell by more than half in the ensuing months and many of the new investors sold out of the market. The stock exchange changed its rules as outlined below, and the Securities Commission recommended to the Government that insider trading be made illegal. The Securities Law Reform Bill has subsequently been introduced into Parliament to implement most of the commission's recommendations on ‘insider trading’, along with other matters.
Looking further back, New Zealand's stock market has been through a period of great change in the past few years, with changes in the regulatory environment, the size and nature of the market, and the way it is conducted.
The stock market was one of the many aspects of the economy affected by the changes in economic policy which followed the 1984 election. It benefited from the investment boom which followed the new government's moves to remove regulations restricting economic activity—in particular, those on borrowing and lending. Investor optimism fuelled a boom which lifted share prices by 450 percent in the four years to the end of 1986. With the rise in prices came many new investors—a high proportion of whom were buying shares for the first time.
The exchange, which conducts the market, responded to the changes by overhauling its own regulations. As a result, sharebrokers gained the right to incorporate, open branch offices, take in non-member shareholders, trade on more than one of the three trading floors, and advertise more freely. In addition, fixed-brokerage rates were abolished, so that brokerage could now be set by negotiation. In response to the stock market crash in October 1987, the exchange added new rules in sharebroker liquidity and tightened its listing requirements to improve standards of disclosure by listed companies—both moves being aimed at providing greater protection for investors.
The pattern of change is continuing—due in particular to the advance of computerisation. The exchange is implementing a fully-automated trading and settlement system designed to facilitate all aspects of trading, from the initial placing of orders through to settlement and registration of the resulting transactions. This is streamlining procedures in sharebrokers' offices and has enabled the introduction of sophisticated information services. In addition, the new system will enable the introduction, if the stock exchange so decides, of screen trading. This method, which is already in use in other markets, involves buying and selling shares on a computer screen rather than using the traditional ‘open outcry’ method. Another major change in the offing is the gradual introduction of ‘scripless’ share trading, by which shares will be bought and sold without the exchange of share certificates as at present. Instead, changes of ownership will be recorded electronically, abolishing serious delays in settlement and registration such as have occurred in recent years.
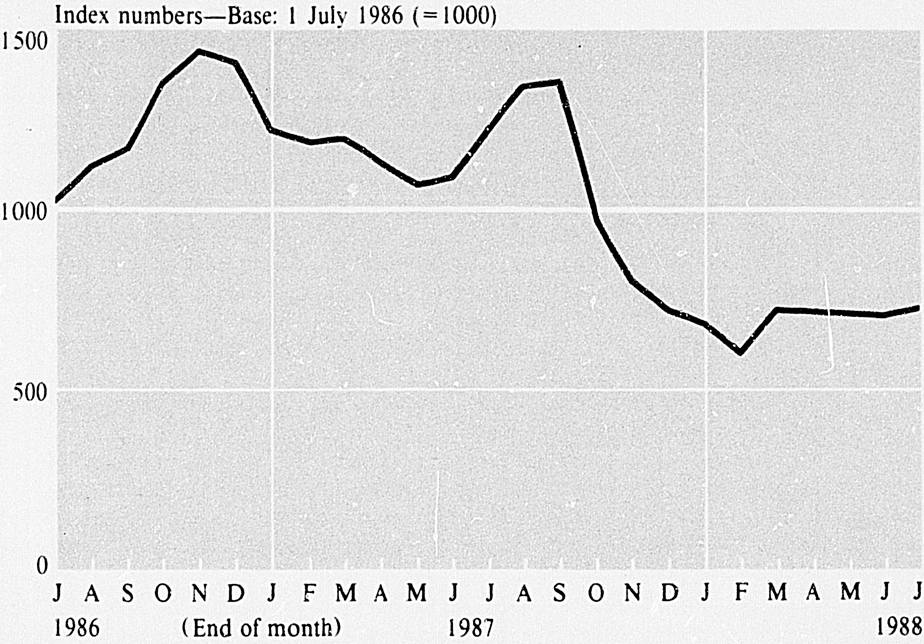
SHARE PRICES—New Zealand Stock Exchange Gross Index
The term bankruptcy refers to the financial insolvency of individuals only. The law relating to bankruptcy in New Zealand is contained in the main in the Insolvency Act 1967 (which came into force in 1971), the Insolvency Rules 1970, and the Insolvency Regulations 1970. Jurisdiction in bankruptcy matters is vested in the High Court.
All proceedings in bankruptcy are commenced by a petition filed in the court by either the debtor or a creditor. The filing of a debtor's petition is equivalent to an order of the court adjudging the debtor a bankrupt, no order being required in this case. Not less than $200 in total must be owing by the debtor to the creditor, or creditors, filing a petition.
The Official Assignee is a statutory officer, and an officer of the court, in whom (apart from certain statutory exceptions) all the assets of a bankrupt vest on adjudication, and who acts as a trustee in respect of those assets. The assignee is empowered to sell the bankrupt's property by auction, tender, or private treaty, and enforce debts due to the bankrupt's estate. The assignee may carry on the business of the bankrupt so far as it is necessary or expedient for its disposal or conclusion. When all the assets are realised, the assignee divides the proceeds among the creditors. Secured creditors are paid from the proceeds of the security, and other creditors are paid on a pro rata basis.
Creditors may accept a composition in satisfaction of the debts due to them. In such a case, after approval of the court, a deed of composition is executed and filed, and the bankruptcy annulled.
Upon application being made by the bankrupt, the court is empowered to grant an order of discharge, which can be absolute, conditional, or suspended. The application may be opposed by the assignee, or by any creditor whose claim has been proved. A public examination of the bankrupt may be demanded by the assignee, or by the creditors, on the passing of a resolution. In all other cases a person adjudged bankrupt is automatically discharged three years after adjudication, in the absence of any earlier application by the bankrupt.
Where a creditor is concerned that a bankrupt may realise the assets and depart, without regard for any financial obligations, application may be made under the Insolvency Act 1967 for the assignee to be appointed as a receiver/manager of the property prior to the hearing of the creditor's petition. This procedure-has been used on a few occasions in recent years.
Another form of financial failure is covered by private assignments, which are not included in official bankruptcy statistics.
In the case of a partnership, each partner is counted in the total of transactions and also the partnership. The general bankruptcy statistics do not cover assignments and compositions, but relate only to cases dealt with by official assignees. In some cases of company liquidation, subsequent court orders are given for the winding up of companies to be transferred to private liquidators.
Table 21.2. BANKRUPTCIES
| Year | Bankruptcies* | ||
|---|---|---|---|
| Petitions by debtors | Adjudications on petitions by creditors | Total | |
*The bankruptcy figures include orders under Part XVI and XVII of the Insolvency Act 1967 and Part IV of the Administration Act 1969. These figures have not been adjusted for annulments granted during the year. | |||
| 1982 | 324 | 244 | 569 |
| 1983 | 466 | 403 | 869 |
| 1984 | 409 | 405 | 814 |
| 1985 | 445 | 424 | 869 |
| 1986 | 575 | 390 | 965 |
Table 21.3. OCCUPATIONS OF BANKRUPTS
| Occupational group | 1982 | 1983 | 1984 | 1985 | 1986 |
|---|---|---|---|---|---|
| Professional, technical, and related workers | 12 | 27 | 24 | 30 | 32 |
| Administrative and managerial workers | 28 | 59 | 54 | 53 | 61 |
| Clerical and related workers | 5 | 11 | 21 | 21 | 22 |
| Sales workers | 76 | 113 | 100 | 96 | 115 |
| Service workers | 30 | 44 | 80 | 90 | 54 |
| Agricultural, animal husbandry, and forestry workers, fishermen, and hunters | 81 | 117 | 64 | 104 | 142 |
| Production and related workers, transport equipment operators, and labourers | 212 | 323 | 297 | 326 | 317 |
| Not gainfully employed/actively engaged | 120 | 161 | 172 | 146 | 217 |
| Occupational group total | 564 | 855 | 812 | 866 | 960 |
| Partnerships | 2 | 12 | 2 | 3 | - |
| Annulments | 3 | 2 | - | - | 5 |
| Total bankruptcy petitions | 569 | 869 | 814 | 869 | 965 |
Table 21.4. EMPLOYMENT STATUS OF BANKRUPTS
| Year | Working for salary or wages | Employer of labour | Working on own account but not employing labour | Not gainfully employed | Annulment partnership and status not known | Total |
|---|---|---|---|---|---|---|
| 1982 | 160 | 103 | 170 | 131 | 5 | 569 |
| 1983 | 254 | 83 | 257 | 261 | 14 | 869 |
| 1984 | 242 | 91 | 183 | 296 | 2 | 814 |
| 1985 | 296 | 134 | 246 | 190 | 3 | 869 |
| 1986 | 298 | 131 | 213 | 318 | 5 | 965 |
Liquidation (sometimes called ‘winding up’) is the legal process by which a company's life is ended. The company's assets are realised, its creditors paid out, any surplus is distributed to the shareholders, and the company is then dissolved.
Liquidation is carried out in accordance with the relevant provisions of the Companies Act 1955 and the Companies (Winding Up) Rules 1956. The procedure is generally as follows:
The company passes a special resolution or the court makes an order for the company to be wound up and a liquidator is appointed to control the company's affairs.
The liquidator realises all the company's assets, calls in (where relevant) as much of its uncalled capital as is necessary to meet its debts, and pays out the company's creditors. If the realised assets and uncalled capital are not sufficient then the creditors are paid out according to the priorities set out in the Companies Act.
Any surplus remaining, after payment of the liquidator's expenses and all the creditors, is distributed to the company's members in accordance with its memorandum and articles of association.
The company is then dissolved.
Companies with heavy debt loads and cash-flow problems often have a receiver appointed over their assets, either by the court, or more usually under an express clause in a mortgage or debenture. Modern debentures usually contain a lengthy recital of the events which will enable debenture-holders to recover their loans if borrowers get into financial difficulties. One of these provisions will be the power of the debenture-holder to appoint a receiver. The usual reason for appointment of a receiver is default in payment of principal and/or interest. It is also possible for a receiver to be appointed because of any other breach of the provisions of the debenture.
The function of a receiver once appointed is to get in or realise the assets charged by the debenture, collect rents and profits, and exercise the debenture-holder's powers of realisation, then pay the net proceeds to the debenture-holder in reduction of its charge. In short, the receiver goes in, sells what is necessary to recover the amount owed to the debenture-holder (plus costs), and then gets out. No property of the company actually vests in the receiver, and, although the directors remain in office, the receiver supersedes them and exercises their powers. The receiver's status is one of agent, not officer of the company. Control of the company is transferred to the receiver, but the appointment of a receiver does not terminate the company's operations. Accordingly receivership is quite distinct from liquidation as a receiver acts for the benefit only of the debenture-holder who appointed him or her.
The insurance industry in New Zealand, both life and non-life, has a number of unique characteristics which make international comparison difficult. In taking an overview of the New Zealand industry it is necessary to identify and understand those characteristics.
The New Zealand insurance market is one of the least regulated in the world, a circumstance that applies to both fire and general insurance and life insurance. The most important regulatory legislation is the Insurance Companies' Deposits Act 1953 which requires any person or company carrying on the business of insurance in New Zealand to lodge approved securities with a market value of not less than $500,000 with the Public Trustee.
Under earlier legislation, the amount of the deposit was set using different criteria and some companies have deposits less than $500,000.
There is a similar provision for deposits under the Life Insurance Act 1908 but the requirement to deposit has been for securities with a market value of not less than $500,000 for many years. The deposits are held by the Public Trustee as security for policyholders or claimants in respect of policies or other contracts issued, granted or entered into by the person making the deposit. The value of deposits held by the Public Trustee under the Insurance Companies Deposits Act 1953, $30.04 million, and under the Life Insurance Act 1908, $27.5 million at August 1988.
Statutory reporting is required in terms of the Life Insurance Act 1908, and the Insurance Companies' Deposits Act 1953 was amended in 1983 to require detailed annual reports and statements of financial condition to be provided to the New Zealand Justice Department. New Zealand has no Insurance Commissioner or equivalent public official and there are no statutory solvency requirements or controls, nor is there any restriction or control on reinsurance.
There are currently no fiscal regulations designed to direct life or fire insurance investment funds to particular investment sectors. There are some limited reporting and disclosure requirements contained in the Marine Insurance Act 1908.
The Mutual Insurance Act 1955 is special legislation providing for the establishment of mutual insurance associations which were intended to provide insurance primarily for farm owners and certain rural industries and their employees. Other insurance companies are subject in the ordinary way to the provisions of the Companies Act 1955 and comply with New Zealand company law in the same manner as other business enterprises.
The regulatory position can be summarised by saying that the size and closely knit nature of the New Zealand insurance market, and, especially in the fire and general part of the market the importance of the State Insurance Office, has meant that regulation of the industry has proceeded through a combination of rather loose government supervision coupled with a measure of self-regulation. However the self-regulatory process has tended to be limited due to the effect of the Commerce Act 1986, which controls what might be regarded as restrictive trade practices. Competition has also been an important factor in regulating all parts of the insurance market.
These are not regulated, and New Zealand has, particularly over recent years, developed a highly sophisticated system for marketing of insurance services. It has very large numbers of various insurance intermediaries. Traditionally, the insurance needs of the community were served through a network of agents established by each insurance company. The remnants of this agency network still remain, now reinforced however by other networks of international and local insurance brokers, the former servicing the major commercial accounts and providing access to international insurance services, and a growing network of independent insurance agents selling fire and general insurance.
The life insurance agency system has substantially been a tied agency system with individual agents contracted to a particular life insurance company. This system has been preserved in New Zealand to a quite unusual degree, although there have been some minor trends to a more relaxed approach from several smaller offices.
Some classes of insurance which make a substantial contribution to the premium pool outside New Zealand do not feature in New Zealand at all because of the different legal climate and background. For instance, the enactment of the Accident Compensation Act 1974 effectively removed from the New Zealand market many classes of liability insurance. This Act is comprehensive ‘no fault’ legislation which abolishes all common law actions in tort for negligence and provides a system of income-related compensation and the right to rehabilitation in respect of all classes of accidental injury. The insurance industry in New Zealand is not therefore, unlike most insurance industries overseas, concerned with motor vehicle third party injury claims, claims for injury arising out of defective goods and products, and claims arising from medical misadventure and similar forms of professional negligence. Nor is it concerned with workers' compensation or similar areas of insurance, the Accident Compensation Act having absorbed the areas of insurance against injury and death arising from industrial accidents. The current Accident Compensation Act 1982 is administered by the Accident Compensation Corporation which also has statutory responsibilities in the field of accident prevention. The system of accident compensation in place is described in section 8.4, Accidents.
New Zealand has a fairly high degree of susceptibility to losses arising from earthquake and other geophysical events, so insurance in respect of loss arising from earthquake and volcanic activity has presented a considerable problem. The result of this circumstance was the enactment of the Earthquake and War Damage Act 1944 and its various amendments, which established a fund guaranteed by government which is designed to meet losses arising from earthquake, war damage and certain other specified catastrophic events. The system of earthquake and war damage insurance (which is under review) is described in section 8.5, Civil defence and fire safety.
Historically, government has also been involved in both fire and general and life insurance through the State Insurance Office and government-backed life insurance and mutual funds.
The taxation regime in New Zealand in respect of both life insurance, non-life insurance and reinsurance is also different in a number of respects to the taxation regimes applying overseas. This includes the imposition of goods and services tax on non-life insurance services, income tax in respect of both life and non-life insurers, and insurance transactions.
Fire services in New Zealand are funded through a levy upon all fire insurance policyholders. The role of the New Zealand Fire Service Commission is outlined in section 8.5, Civil defence and fire safety.
Each of these interventions in the insurance market by government influence the size of the premium pool and the level of insurance required by businesses and private individuals, affect the level of employment in the insurance industry, and influence the expenses of the industry and the location of points of service within the industry.
The insurance industry arrived in New Zealand with the first European settlers. The first insurance was written by business people in Wellington and Auckland who operated agencies for major London companies, but the rapid growth of the colony soon persuaded business operators in Auckland to gather together to establish the first indigenous New Zealand underwriters. The New Zealand Insurance Co. Ltd was founded in 1859, shortly followed by the South British Insurance Co. Ltd in 1872. The British companies also established branches, particularly in Auckland, Wellington and later in Dunedin as the Otago colony grew in response to the gold rushes. The Dunedin business community also decided that there was a place for their own indigenous insurance companies and The National Insurance Co. of N.Z. Ltd was founded in 1873, and the Standard Insurance Co. Ltd (later to be the subject of one of New Zealand's most notable financial disasters), in 1874.
Life insurance arrived a little later, with some of the London companies writing life insurance quite early, but the main thrust of growth of the life insurance market being the establishment of branches of the major Australian mutual companies in the late 1800s. The New Zealand Government joined the market, first with the establishment of the Government Life Insurance Office in 1869 to augment the very inadequate life insurance facilities that then existed, with the State Insurance Office being established in 1905 to undertake fire and marine business, and later to take over the accident business originally operated by the Government Life Insurance Office.
The life insurance industry in New Zealand assumes major importance as an investor and savings vehicle. New Zealanders, per capita, are among the five largest purchasers of life insurance in the world. The life insurance market is dominated by three large mutual societies (AMP, National Mutual and Colonial Mutual), New Zealand Insurance Life and the Government Life Insurance Corporation which between them write over 70 percent of the country's life insurance/superannuation business, measured by annual premium income. The Department of Statistics' annual Business Directory update recorded 47 life insurance enterprise groups at February 1988.
The non-life insurance market is divided amongst 123 companies and individuals who have made deposits under the Insurance Companies Deposits Act 1953, but many of these depositors are not active now in the New Zealand market. Some deposits are made to support placements overseas by brokers, by international reinsurers, and some are retained to support the runoff of workers' compensation business by insurers no longer active in New Zealand. Some New Zealand insurance business is directly placed offshore with Lloyds and the company market in London. Another source of information on the industry, the Business Directory update, recorded 94 fire, marine and general enterprise groups trading in New Zealand at February 1988.
The New Zealand premium pool is divided approximately: 20 percent commercial fire business, 26 percent domestic fire, 32 percent motor, 16 percent general accident, 2 percent marine hull and 4 percent marine cargo.
The level of economic activity represented by the insurance industry can be broadly measured by levels of employment and by the premium pool of both industries. Industry sources indicate that approximately 11400 persons were employed within the industry as at 31 December 1987, including independent life insurance agents. The premium pool at the same date was:
Life (including superannuation) $1,900 million; and
Non-life $1,380 million.
Considerable change is already taking place in the insurance industry in New Zealand and is likely to continue. The size of the New Zealand market indicates that a reduction in the number of direct underwriters operating in the New Zealand market is likely, and recent amalgamations and withdrawals indicate that this process is already beginning. The process seems to be accompanied by an increase in the number of reinsurers establishing a place of business in New Zealand.
It is also probable that the number of major international brokers will be reduced but that there will be a growing number of brokers operating on a local or regional level to service small businesses and the domestic market. Present indications are that a current period of unprofitability in the industry will continue for at least the next two or three years, and there is no sign of a reversal of the trend for the premium pool to grow at less that the inflation rate, while the cost of claims is increasing at a rate greater than the inflation rate. Frequency of claims also shows signs of increase in many classes of business.
In the life insurance and superannuation fields it is generally anticipated that market growth will be slower in the absence of taxation incentives to encourage the purchase of life insurance.
The Accident Compensation Corporation has the statutory duty to promote occupational safety and accident prevention and this activity has had some indirect benefit to the insurance industry.
The Insurance Council of New Zealand is active in the field of fire prevention. It maintains a technical department which operates in a similar fashion to the Fire Offices' Committee in the United Kingdom and maintains a close liaison with that body and with loss prevention agencies in Australia and the United States. The Fire Service Commission, which administers the New Zealand Fire Service, is also active in fire prevention and fire safety education. Most other activity in the field of loss prevention and accident prevention is undertaken by government or quasi-government bodies which are wholly or partly public funded.
The Building Research Association of New Zealand undertakes some work in respect of the assessment of building materials and methods of construction and The Automobile Association and similar organisations are active in the field of prevention of motor vehicle accidents. Much of New Zealand's effort in loss prevention has traditionally been organised and financed through the insurance industry, which has pioneered work in a number of areas, including electrical safety and the registration and education of electricians (an area subsequently taken over by government), research into fire prevention and fire safety equipment, and the approval of passive fire protection and alarm systems.
Several industry organisations are maintained, the principal ones are:
The Insurance Council of New Zealand Inc.—fire and general insurers;
The Life Offices' Association of New Zealand Inc.—maintained by life insurers;
The Corporation of Insurance Brokers of New Zealand—made up of brokers;
The Independent Insurance Agents Association—representing independent agents;
The Chartered Institute of Loss Adjusters and The Institute of Loss Adjusters of New Zealand Inc.—comprising adjusters and assessors; and
The Insurance Institute of New Zealand Inc.—the educational body of the industry. The Insurance Council operates a disaster emergency scheme. Both the Insurance Council and the Life Offices' Association operate consumer inquiry facilities.
The first Census of Services (Insurance) 1982-83 formed part of the first series of integrated economic censuses of business activities in New Zealand carried out by the Department of Statistics until 1985. It provides the latest complete industry data and will be updated by the 1987 Economy Wide Census (reports from which will be released progressively throughout 1989). The census covered the activities of all businesses classified into division 82 of the New Zealand Standard Industrial Classification. A summary of results is given below according to the various industrial classifications.
(industry 82110). This division covers businesses primarily providing life insurance cover, life reinsurance, and mortgage repayment insurance. Also included are other ‘insurance’ activities carried out by those businesses, such as industrial insurance, personal accident insurance, and superannuation funds operated on behalf of others.
Table 21.6. LIFE INSURANCE: INDUSTRY COVERAGE, 1982-83
| Statistical item | Number |
|---|---|
| Enterprise groups in the industry | 36 |
| Enterprises within those groups | 41 |
| Activity units (e.g., offices, etc.) | 274 |
| Ancillary activity units | 7 |
| Persons engaged within those activity units—full-time | 3044 |
| —part-time | 218 |
| Self-employed commission agents—full-time | 2856 |
| —part-time | 154 |
Table 21.7. LIFE INSURANCE: INDUSTRY VALUES, 1982-83
| Statistical item | $(000) |
|---|---|
| Income— | |
| Premiums and superannuation contributions net of reinsurance | 654,342 |
| Interest | 345,189 |
| Dividends | 56,999 |
| Rent and leasing (gross) | 83,925 |
| Management fees | 9,645 |
| Other income | 1,727 |
| Total income | 1,151,827 |
| Operating expenses— | |
| Claims, payments and pensions—on maturity | 130,667 |
| —on death/accident | 89,135 |
| —on surrender | 183,965 |
| Salaries and wages | 55,748 |
| Commissions—self-employed agents | 81,568 |
| —other | 8,579 |
| Employer contributions | 10,702 |
| Interest | 1,073 |
| Depreciation | 20,881 |
| Indirect taxes | 8,778 |
| Insurances | 396 |
| Donations and grants | 183 |
| Management fees | 17,435 |
| Other operating expenses | 75,945 |
| Total operating expenses | 685,057 |
| Balance of income over operating expenses for the year | 466,771 |
| Plus—Net gains from revaluation of financial and fixed assets | 34,603 |
| —Net gains on sale of financial and fixed assets and exchange transactions | 31,754 |
| Subtotal | 533,128 |
| Less, net transfers to reserves | 436 |
| —Policy transfers to overseas branches | 6,262 |
| —Income tax | 52,518 |
| —Dividends and bonuses to shareholders | 2,378 |
| Increase in policyholders' funds | 471,534 |
| End of year value of policyholders' funds | 4,484,297 |
Table 21.8. EXPENSES OF REAL ESTATE ACTIVITIES OF LIFE INSURANCE COMPANIES, 1982-83
| Gross rental income | Percent |
|---|---|
| Wages | 1.98 |
| Rates | 8.67 |
| Other operating expenses | 12.00 |
| Gross margin before interest and depreciation | 77.35 |
| 100.00 |
Table 21.9. LIFE INSURANCE: INDUSTRY SIZE-GROUP ANALYSIS—PERSONS ENGAGED, 1982-83
| Persons engaged per enterprise | Enterprises | Units | Persons engaged at end of February 1983 | Total income per full-time equivalent persons engaged | Balance of income per full-time equivalent persons engaged* | Balance of income per total income* | |
|---|---|---|---|---|---|---|---|
| Activity | Ancillary | ||||||
*Total income less operating expenses. | |||||||
| no. | no. | no. | no. | no. | $ | $ | % |
| 0 | 10 | 7 | 3 | - | ... | ... | 17.3 |
| 1-9 | 9 | 10 | - | 37 | 414,261 | 194,692 | 47.0 |
| 10-39 | 6 | 12 | 2 | 108 | 191,712 | 70,169 | 36.6 |
| 40-99 | 5 | 13 | - | 296 | 240,557 | 80,954 | 33.7 |
| 100-199 | 6 | 81 | 2 | 837 | 262,946 | 103,299 | 39.3 |
| 200 and over | 5 | 151 | - | 1984 | 418,747 | 177,328 | 42.3 |
| Total | 41 | 274 | 7 | 3262 | 365,312 | 148,040 | 40.5 |
(industry 82120). This division covers benefit societies providing medical, hospital and dental insurance, and funeral benefits. Included are employee benefit, benevolent and welfare societies, and friendly societies.
Table 21.10. MEDICAL INSURANCE—INDUSTRY COVERAGE, 1982-83
| Statistical item | Number |
|---|---|
| Enterprise groups in the industry | 33 |
| Enterprises within those groups | 41 |
| Activity units (e.g., offices, etc.) | 64 |
| Ancillary activity units | 0 |
| Persons engaged within those activity units—full-time | 198 |
| —part-time | 18 |
| Self-employed commission agents—full-time | 124 |
| —part-time | 46 |
Table 21.11. MEDICAL INSURANCE—INDUSTRY VALUES, 1982-83
| Statistical item | $(000) |
|---|---|
| Income— | |
| Premiums, levies and contributions received | 49,141 |
| Interest | 7,403 |
| Dividends, rents and other income | 541 |
| Total income | 57,086 |
| Operating expenses— | |
| Claims and benefits paid | 38,102 |
| Salaries and wages | 2,533 |
| Commissions | 2,013 |
| Employer contributions | 91 |
| Interest | 54 |
| Depreciation | 423 |
| Indirect taxes | 86 |
| Donations and grants | 172 |
| Management fees | 414 |
| Other operating expenses | 2,153 |
| Total operating expenses | 46,042 |
| Balance of income over operating expenses for the year | 11,044 |
| Less, net transfers to reserves and income tax | 206 |
| Increase in funds | 10,838 |
| End of year value of funds | 60,233 |
Table 21.12. MEDICAL INSURANCE—INDUSTRY ACTIVITY ANALYSIS, 1982-83
| Type of enterprise | Enterprise groups | Activity units | Paid employees | Start of year value of funds 1982 | Total income | Total operating expenses | Net transfers to and from reserves, etc. | End of year value of funds 1983 |
|---|---|---|---|---|---|---|---|---|
| no. | no. | no. | $(000) | $(000) | $(000) | $(000) | $(000) | |
| Private benefit societies | 11 | 28 | 214 | 15,838 | 48,378 | 41,374 | +182 | 23,024 |
| Employee benefit societies | 8 | 14 | 2 | 3,780 | 4,062 | 2,550 | -537 | 4,755 |
| Friendly societies | 14 | 22 | - | 29,776 | 4,646 | 2,118 | +152 | 32,456 |
| Total | 33 | 64 | 216 | 49,394 | 57,086 | 46,042 | -206 | 60,233 |
(industry 82130). This division covers businesses providing fire insurance cover for commercial and domestic properties; motor vehicle insurance cover; aviation insurance cover; and other fire and accident insurance. It also covers businesses concerned primarily with fire and general reinsurance.
Table 21.13. FIRE AND GENERAL INSURANCE—INDUSTRY COVERAGE, 1982-83
| Statistical item | Number |
|---|---|
| Enterprise groups in the industry | 43 |
| Enterprises within those groups | 55 |
| Activity units (e.g., offices, etc.) | 398 |
| Ancillary activity units | 9 |
| Persons engaged within those activity units—full-time | 5042 |
| —part-time | 209 |
Table 21.14. FIRE AND GENERAL INSURANCE—ANALYSES BETWEEN GROSS PREMIUMS WRITTEN/NET PREMIUMS EARNED AND GROSS/NET CLAIMS INCURRED, 1982-83
| Statistical item | $(000) |
|---|---|
*IBNR denotes ‘incurred but not received.’ | |
| Premiums— | |
| Gross written premiums, less local facultative reinsurance ceded | 709,942 |
| Adjusted for other reinsurance premiums— | |
| N.Z. resident offices—received from | +14,528 |
| —ceded to | -38,824 |
| Offshore—received from | +14,658 |
| —ceded to | -93,596 |
| Net written premiums | 606,708 |
| Adjusted for movement in unearned premium reserve | -41,137 |
| Net premium earned | 565,571 |
| Claims— | |
| Gross incurred claims, less local facultative reinsurance recoveries | 436,147 |
| Adjusted for other reinsurance claims incurred— | |
| N.Z. resident offices—paid to | +7,009 |
| —recovered from | -15,932 |
| Offshore—paid to | +9,539 |
| —recovered from | -71,343 |
| Subtotal | 365,419 |
| Adjusted for IBNR* and other internal adjustments | +8,601 |
| Net incurred claims | 374,020 |
Table 21.15. FIRE AND GENERAL INSURANCE—INDUSTRY VALUES IN ACCOUNTING TERMS, 1982-83
| Statistical item | $(000) |
|---|---|
*Net gain on extraordinary items (14129 gains less 631 losses). | |
| Income— | |
| Net premiums earned | 565,571 |
| Interest | 35,028 |
| Dividends | 31,748 |
| Rent and leasing (gross) | 7,649 |
| Management fees | 6,933 |
| Reinsurance commissions | 17,910 |
| Other income | 3,565 |
| Total income | 668,405 |
| Operating expenses— | |
| Net incurred claims | 374,020 |
| Fire services levy | 27,512 |
| Salaries and wages | 81,617 |
| Commissions and brokerage | 55,821 |
| Employer contributions | 10,977 |
| Interest | 2,120 |
| Depreciation | 6,290 |
| Indirect taxes | 1,408 |
| Insurances | 722 |
| Donations and grants | 124 |
| Management fees | 4,802 |
| Other operating expenses | 52,619 |
| Total operating expenses | 618,032 |
| Net profit, before tax and extraordinary items* | 50,372 |
| Fixed tangible assets— | |
| Additions during year | 27,181 |
| Disposals during year | 6,439 |
| Book value at end of the year | 134,446 |
| 13,499 | |
Table 21.16. FIRE AND GENERAL INSURANCE—INDUSTRY VALUES IN ECONOMIC TERMS, 1982-83
| Statistical item | $(000) |
|---|---|
*This value added represents 0.4 percent of New Zealand Gross Domestic Product (GDP) for the year ended March 1983. | |
| Operating surplus— | |
| Total income | 668,405 |
| Total operating expenses | 618,032 |
| Less, donations and grants | 124 |
| Operating surplus | 50,496 |
| Value added— | |
| Operating surplus | 50,496 |
| Fire services levy | 27,512 |
| Salaries and wages | 81,617 |
| Employer contributions | 10,977 |
| Depreciation | 6,290 |
| Indirect taxes | 1,408 |
| Value added | 178,301* |
(industry 82210). This division covers the operation of recognised superannuation, pension and mutual funds. The figures include the operations of the Government Superannuation Fund and the National Provident Fund. Tables 21.17 and 21.18 list the general coverage of the industry.
Table 21.17. SUPERANNUATION AND PENSION FUNDS—INDUSTRY COVERAGE, 1982-83
| Statistical item | Number |
|---|---|
| Enterprise groups/enterprises within the industry | 1950 |
| Activity units | 1950 |
| Persons engaged | 58 |
Table 21.18. SUPERANNUATION AND PENSION FUNDS—INDUSTRY VALUES, 1982-83
| Statistical item | $(000) |
|---|---|
| Income— | |
| Members' contributions | 334,283 |
| Employers' contributions | 328,154 |
| Interest | 321,266 |
| Dividends | 65,474 |
| Rent and leasing | 26,276 |
| Other income | 31,049 |
| Total income | 1,106,501 |
| Operating expenses— | |
| Claims, payments and pensions—on maturity or retirement | 303,734 |
| —on death/disability | 7,804 |
| —on surrender | 120,916 |
| Salaries and wages | 748 |
| Commissions, all kinds | 173 |
| Interest | 39,784 |
| Depreciation | 1,659 |
| Employer contributions and indirect taxes | 622 |
| Insurances | 2,883 |
| Management fees | 2,525 |
| Other operating expenses | 3,928 |
| Total operating expenses | 484,777 |
| Balance of income over operating expenses for the year | 621,724 |
| Plus, net gains: | |
| —from exchange transactions | 423 |
| —from revaluation of assets | 27,791 |
| —on sale of assets | 12,826 |
| —on transfers from reserves | 71 |
| Subtotal | 662,835 |
| Less, income tax | 26 |
| Increase in funds | 662,810 |
| End of year value of funds | 4,137,328 |
(industry 82301). This division covers insurance broking and agency services; adjustment (loss adjusters), assessing and consultancy services; the selling of insurance on a commission or fee basis (other than self-employed commission agents who do not employ labour); the management of pension and superannuation funds on a commission or fee basis; other services not elsewhere classified.
Table 21.19. SERVICES TO INSURANCE AND SUPERANNUATION—INDUSTRY COVERAGE, 1982-83
| Statistical item | Number |
|---|---|
| Enterprise groups in the industry | 341 |
| Enterprises within those groups | 413 |
| Activity units (e.g., offices, etc.) | 494 |
| Ancillary activity units | 3 |
| Persons engaged within those activity units: Working proprietors/partners—full-time | 312 |
| —part-time | 92 |
| Paid employees—full-time | 1164 |
| —part-time | 263 |
| Self-employed commission agents—full-time | 145 |
| —part-time | 724 |
Table 21.20. SERVICES TO INSURANCE AND SUPERANNUATION—INDUSTRY VALUES, 1982-83
| Statistical item | $(000) |
|---|---|
| Income— | |
| Interest | 7,068 |
| Dividends | 394 |
| Renting and leasing | 638 |
| Commissions and brokerage | 53,209 |
| Management fees | 3,292 |
| Other income | 11,781 |
| Total income | 76,382 |
| Operating expenses— | |
| Salaries and wages | 21,730 |
| Commission, to self-employed agents | 4,544 |
| Employer contributions | 1,452 |
| Interest | 641 |
| Insurance | 767 |
| Depreciation | 1,498 |
| Indirect taxes | 183 |
| Bad debts, royalties, etc. | 226 |
| Management fees | 1,678 |
| Other operating expenses | 21,245 |
| Total operating expenses | 53,961 |
| Net profit— | |
| Balance of income over operating expenses for the year | 22,421 |
| Plus, gains in extraordinary transactions | 323 |
| Subtotal | 22,744 |
| Less, salaries and wages paid to working proprietors and partners | 6,144 |
| Net profit, after adding extraordinary items and deducting salaries and wages paid to working proprietors and partners | 16,600 |
‘Domestic trade’ embraces retail and wholesale businesses, hotels and restaurants, and businesses providing household and personal services. The trend of retail trade is one of the most perceptive barometers of economic activity as it constitutes a large proportion of personal expenditure on consumer goods and services.
The sample survey of retail trade was revised in June 1982, based on 15 store-type groupings from the 1977-78 Census of Distribution. The survey coverage was extended to include three new store-type groups: automotive, fuel, and repairs; liquor including licensed accommodation; and accommodation; while restaurants and takeaways, previously part of the other food group, is now a separate store-type group. The survey now follows internationally accepted definitions as used in the New Zealand Standard Industrial Classification.
Table 21.21. RETAIL TRADE SURVEY: SALES*
| Store type | Quarter ended | ||||||
|---|---|---|---|---|---|---|---|
| sep 1984 | Sep 1985 | Sep 1986 | Dec 1986 | Mar 1987 | Jun 1987 | Sep 1987 | |
*Values given exclude GST. †Excludes licensed accommodation. | |||||||
| $(million) | |||||||
| Butcher | 110.5 | 117.6 | 103.4 | 115.9 | 97.5 | 109.7 | 108.7 |
| Supermarket/grocer | 765.6 | 901.7 | 1,043.3 | 1,099.2 | 1,032.9 | 1,097.4 | 1,130.8 |
| Other food | 54.9 | 55.1 | 60.0 | 72.7 | 60.9 | 57.3 | 61.9 |
| Footwear | 52.3 | 58.7 | 63.5 | 63.2 | 57.6 | 67.4 | 57.1 |
| Clothing and textiles | 166.5 | 197.8 | 259.3 | 257.5 | 215.1 | 274.7 | 245.1 |
| Furniture | 180.0 | 208.6 | 318.1 | 188.2 | 180.9 | 213.4 | 229.0 |
| Household appliances | 202.0 | 212.5 | 286.2 | 228.2 | 220.7 | 234.2 | 238.6 |
| Hardware | 74.2 | 88.1 | 117.8 | 113.6 | 103.4 | 97.7 | 105.2 |
| Chemist | 114.0 | 143.4 | 174.1 | 195.0 | 177.1 | 174.8 | 197.4 |
| Department and general stores | 266.2 | 279.1 | 330.3 | 358.3 | 265.4 | 315.8 | 288.3 |
| Restaurants and takeaways | 198.7 | 246.3 | 277.3 | 279.9 | 269.3 | 279.8 | 290.5 |
| Liquor incl. licensed accommodation | 367.4 | 448.9 | 501.5 | 569.8 | 519.1 | 505.2 | 532.9 |
| Accommodation† | 55.9 | 57.4 | 62.5 | 58.5 | 73.8 | 60.8 | 70.2 |
| Other stores | 306.1 | 365.5 | 507.9 | 534.2 | 465.8 | 448.4 | 484.1 |
| Subtotal | 2,914.8 | 3,380.9 | 4,105.2 | 4,134.1 | 3,739.6 | 3,936.7 | 4,039.8 |
| Automotive fuel and repairs | 2,175.5 | 2,313.8 | 2,597.6 | 2,031.3 | 2,219.3 | 2,461.6 | 2,475.1 |
| All stores | 5,090.3 | 5,694.7 | 6,702.9 | 6,165.4 | 5,958.8 | 6,398.2 | 6,514.9 |
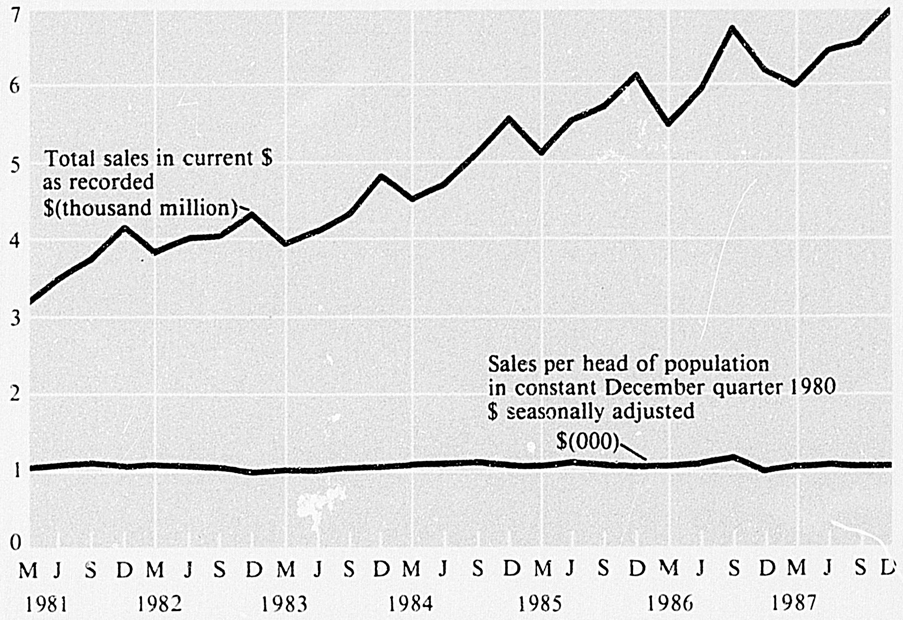
RETAIL TRADE
Table 21.22. RETAIL TRADE SURVEY: STOCKS
| Stocks as at 31 March | |||||
|---|---|---|---|---|---|
| 1983 | 1984 | 1985 | 1986 | 1987 | |
| $(million) | |||||
| Butcher | 7.3 | 8.8 | 8.7 | 7.8 | 7.8 |
| Supermarket/grocer | 157.7 | 165.4 | 193.3 | 195.7 | 221.4 |
| Other food | 4.7 | 6.2 | 7.1 | 7.0 | 8.4 |
| Footwear | 75.7 | 79.3 | 90.5 | 91.1 | 89.2 |
| Clothing and textiles | 191.8 | 191.6 | 204.8 | 219.6 | 253.8 |
| Furniture | 115.2 | 117.3 | 128.3 | 151.7 | 157.6 |
| Household appliances | 89.1 | 99.0 | 147.9 | 161.0 | 183.0 |
| Hardware | 51.3 | 56.5 | 64.2 | 70.7 | 75.4 |
| Chemist | 55.1 | 62.1 | 70.1 | 84.7 | 94.3 |
| Department and general stores | 213.4 | 221.4 | 252.2 | 261.5 | 309.2 |
| Restaurants and takeaways | 15.9 | 17.2 | 22.5 | 24.6 | 25.3 |
| Liquor including licensed accommodation | 72.8 | 78.4 | 98.1 | 99.0 | 109.8 |
| Other stores | 233.0 | 260.6 | 281.7 | 310.8 | 319.2 |
| Subtotal | 1,282.9 | 1,363.7 | 1,569.6 | 1,685.5 | 1,854.3 |
| Automotive fuel and repairs | 568.7 | 610.5 | 744.6 | 800.9 | 903.0 |
| All stores | 1,851.6 | 1,974.2 | 2,314.2 | 2,486.4 | 2,757.3 |
To allow direct comparisons between quarterly figures, seasonally adjusted values of retail trade sales have been prepared. To do this, seasonal adjustment factors were calculated representing, for each quarter, an average over several years of the ratio of sales in this quarter to the trend value for the quarter (the trend values being calculated as appropriately-centred moving averages).
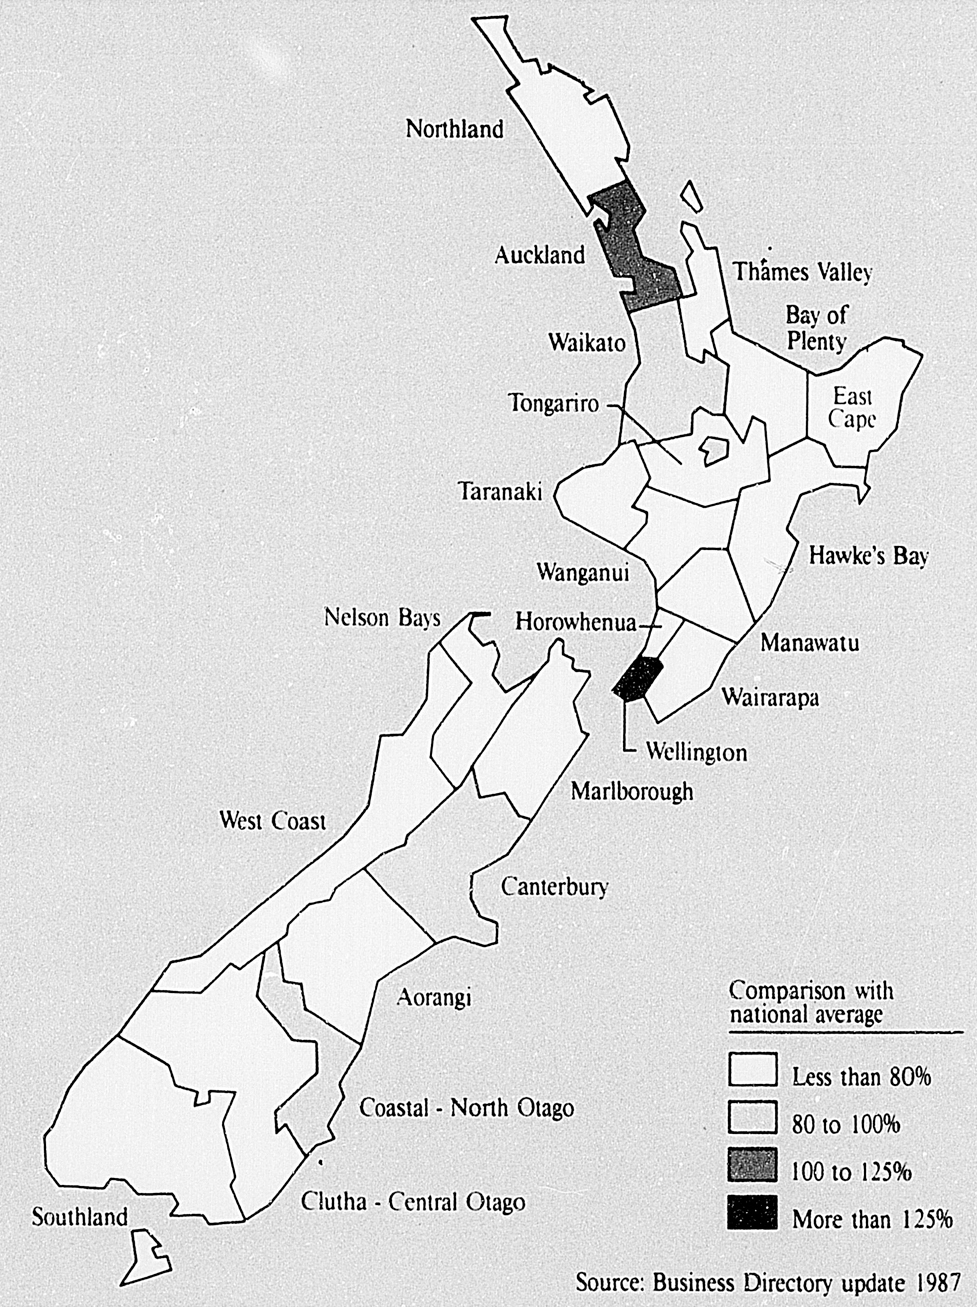
Percentage of workforce
employed in
FINANCING, INSURANCE
AND REAL ESTATE
A price index has been prepared for the purpose of deflating the retail sales figures to give a series in dollars of constant purchasing power—i.e., the adjusted series shows the changes in the real volume of retail sales. The principal source of the prices used for this index are the commodity prices used in the Consumers Price Index. The prices have been appropriately weighted and the whole index expressed on the base: December quarter 1980 (= 1000), so that application of the index to the original figures, gives a series in constant December quarter 1980 dollars.
Table 21.23. RETAIL TRADE SEASONALLY ADJUSTED*
| Quarter ended | Total sales or turnover | Sales per head of population | |||||
|---|---|---|---|---|---|---|---|
| In current $ | In constant Dec qtr 1980 $ | In current $ | In constant Dec qtr 1980 $ | ||||
| As recorded | Seasonally adjusted | Seasonally adjusted | As recorded | Seasonally adjusted | Seasonally adjusted | Percentage change† | |
*Values given exclude GST. †Each quarter on previous quarter. | |||||||
| $(million) | $ | $ | $ | ||||
| 1985—Dec | 6,096.7 | 5,662.7 | 3,416.0 | 1,854.5 | 1,722.5 | 1,039.1 | -2.1 |
| 1986—Mar | 5,459.2 | 5,819.2 | 3,441.0 | 1,652.1 | 1,761.1 | 1,041.3 | +0.2 |
| Jun | 5,894.6 | 6,009.9 | 3,487.8 | 1.802.9 | 1,838.1 | 1,066.7 | +2.4 |
| Sep | 6,702.9 | 6,664.3 | 3,759.5 | 2,057.5 | 2,045.7 | 1,154.0 | +8.2 |
| Dec | 6,165.4 | 5,768.8 | 3,264.2 | 1,873.1 | 1,752.7 | 991.7 | -14.1 |
| 1987—Mar | 5,958.8 | 6,295.3 | 3,471.6 | 1,795.8 | 1,897.2 | 1,046.2 | +5.5 |
| Jun | 6,398.2 | 6,556.3 | 3,504.2 | 1,939.1 | 1,987.0 | 1,062.0 | +1.5 |
| Sep | 6,514.9 | 6,452.6 | 3,449.1 | 1,979.5 | 1,960.6 | 1,048.0 | -1.3 |
Instalment credit trading in New Zealand has grown steadily over the last decade and longer, as in other developed countries. This growth generally is explained by common causes, including an increasing social acceptance and the development of borrowing facilities. There is an increasing tendency for consumer durables to be purchased on credit. Instalment credit allows high-priced goods to be acquired as opportunity or desire dictates, with less reference to the purchaser's immediate cash position. Consumer credit is provided either by retailers or finance companies. A major activity of the finance companies is the financing of motor vehicles on hire-purchase.
The Hire Purchase Act 1971 is the governing legislation in New Zealand. Regulations to control hire-purchase trade, including limits on minimum deposit and the maximum period of credit, were removed in September 1983.
The Credit Contracts Act 1981 reformed the law relating to the provision of credit under contracts of various kinds. It includes provisions to prevent oppressive contracts and conducts and ensures that all the terms of contracts are disclosed to debtors before they become irrevocably committed to them. It also includes provisions to ensure that the cost of credit is disclosed on a uniform basis in order to prevent deception and encourage competition, and to prevent misleading credit advertisement.
The quarterly survey of hire-purchase advances made by the Department of Statistics was revised for the June 1980 quarter and the revisions made retrospective to the June 1977 quarter to enable comparisons to be made. For the revised survey the list of businesses surveyed was updated to include large finance companies not previously covered and retail stores whose sales on hire-purchase exceeded $0.5 million during the year ended March 1978. Sales on hire-purchase by businesses covered by the revised survey represented some 92 percent of total hire-purchase sales in 1977-78 as recorded in the 1978 Census of Distribution.
Table 21.24. HIRE-PURCHASE SURVEY*
| 1986 | 1987 | ||||||
|---|---|---|---|---|---|---|---|
| Mar | Jun | Sep | Dec | Mar | Jun | Sep | |
*This is a ‘restricted’ survey as indicated above. †Advances under hire-purchase agreements. ‡Advances as a percentage of value of purchases financed. §Includes appliances, furniture, TV sets, etc. ||Total amount owing under hire-purchase agreements. ¶Percentage of amount owing that is overdue. | |||||||
| Motor buses, trucks, and tractors— | |||||||
| Advances ($million)† | 39.5x | 49.6x | 56.6 | 51.0 | 43.6 | 57.8 | 64.2 |
| Percentage financed‡ | 65 | 66 | 66 | 72 | 71 | 71 | 71 |
| Cars, motorcycles, caravans, etc.— | |||||||
| Advances ($million) | 135.5x | 161.9x | 211.0 | 169.1 | 173.3 | 195.5 | 202.0 |
| Percentage financed | 57 | 60 | 62 | 65 | 65 | 64 | 67 |
| Plant and machinery— | |||||||
| Advances ($million) | 26.8x | 32.9x | 32.2 | 32.8 | 29.4 | 32.4 | 35.1 |
| Percentage financed | 78x | 76 | 80 | 82 | 79 | 80 | 83 |
| Household and personal goods§— | |||||||
| Advances ($million) | 82.1x | 105.0x | 114.3 | 103.5 | 86.7 | 113.8 | 100.8 |
| Percentage financed | 83 | 83x | 83 | 84 | 82 | 84 | 83 |
| Total advances ($million) | 283.9x | 349.3x | 414.1 | 356.5 | 330.0 | 399.4 | 402.1 |
| Total owing ($million)|| | 1,989.8x | 2,007.8x | 2,177.3 | 2,182.5 | 2,157.0 | 2,168.1 | 2,187.4 |
| Percentage overdue¶ | 2.6x | 2.4x | 2.4 | 2.7 | 2.5 | 2.4 | 2.5 |
A form of short-term credit trading which has grown rapidly during recent years is the use of credit cards as a substitute for cash. This has largely been the result of the introduction of bank credit cards by the four trading banks. The following table gives the value of sales by trading bank cards, Trust Bank Visa, American Express and Diners Club.
Table 21.25. VALUE OF CREDIT CARD SALES
| Calendar year | Billings | |||
|---|---|---|---|---|
| Total advances outstanding* | N.Z. cardholders spending in New Zealand | N.Z. cardholders spending overseas | Total | |
*As at 31 December. Source: Reserve Bank Bulletin. | ||||
| $(million) | ||||
| 1984 | 428.4 | 1,110.4 | 238.7 | 1,349.1 |
| 1985 | 483.5 | 1,305.1 | 237.0 | 1,542.1 |
| 1986 | 613.3 | 1,537.6 | 359.9 | 1,873.5 |
| 1987 | 692.5 | 1,778.7 | 433.1 | 2,211.8 |
The seventh five-yearly Census of Distribution, which provides the basis for the current monthly and quarterly surveys of retail and wholesale trade, was taken for the year 1982–83. It was the second fully-integrated economic census covering the activities of establishments and ancillary units predominantly engaged in wholesale or retail trade, hotels and restaurants, etc., and the supply of personal and household services.
The census formed part of the five-yearly series of integrated economic censuses taken by the Department of Statistics until 1985, and contain the latest industry data available at the time of going to press. Updated data from the 1987 Economy Wide Census will be released progressively throughout 1989.
In 1982–83 the distribution industries were reclassified under the New Zealand Standard Industrial Classification covering the following:
Wholesale trade;
Retail trade;
Restaurants and hotels; and
Personal and household services.
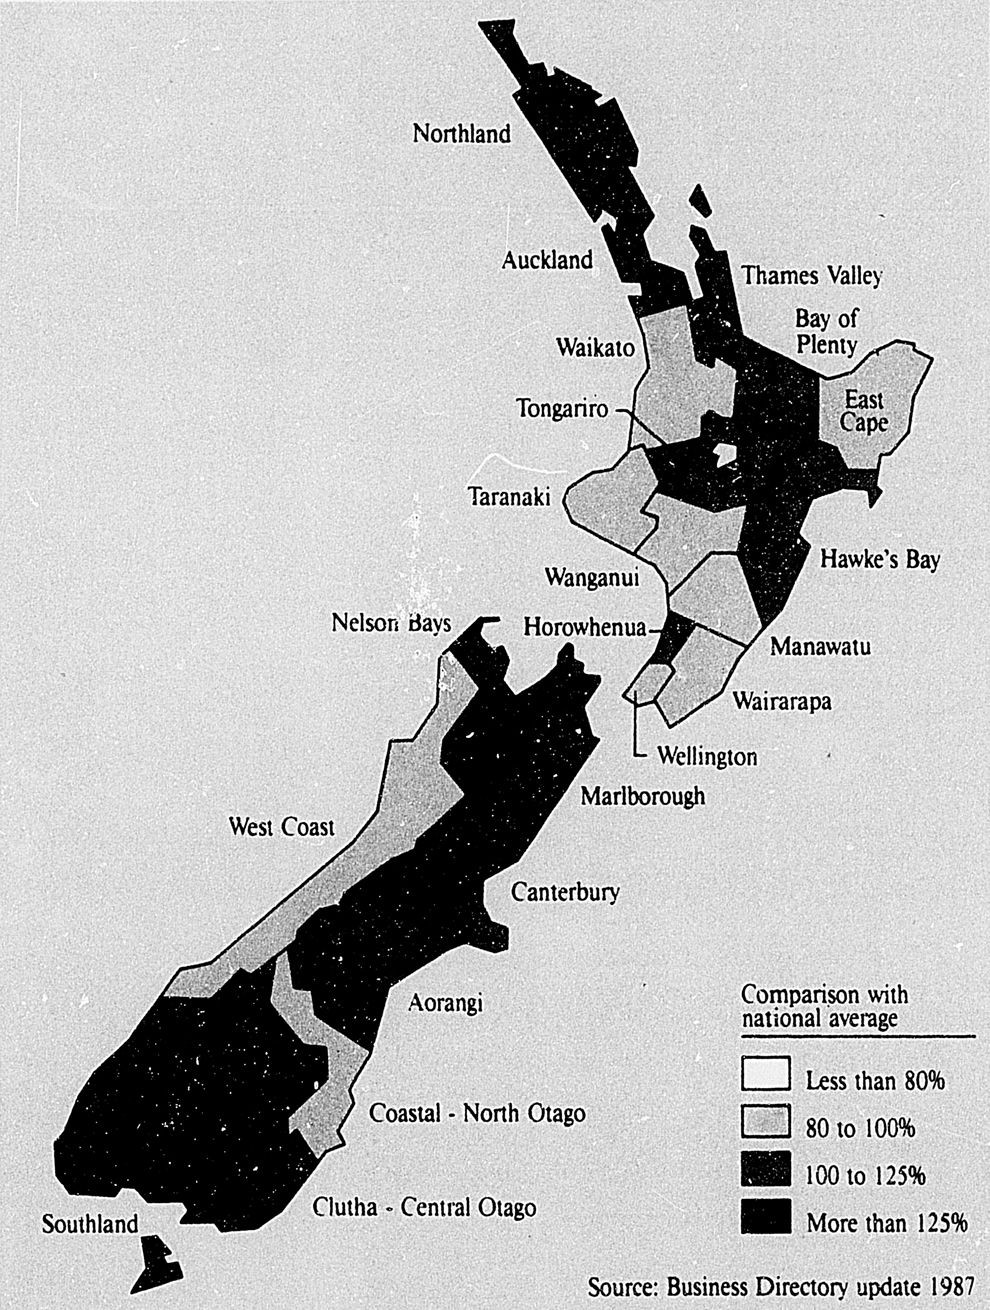
Percentage of workforce employed in
WHOLESALE/RETAIL TRADE, RESTAURANTS AND
HOTELS
The tables which follow give summaries of those four divisions. The definitions used are given in the glossary at the back of this book.
Table 21.26. GENERAL SUMMARY OF CENSUS OF DISTRIBUTION
| Statistical item | 1978 | 1983 |
|---|---|---|
| no. | no. | |
| Census coverage— | ||
| Group enterprises | .. | 44151 |
| Enterprises within those group enterprises | .. | 46082 |
| Activity units | 47790 | 55016 |
| Ancillary activity units | 547 | 662 |
| Persons engaged within those activity units—full-time | 299893 | 236577 |
| —part-time | 90747 | |
| Fixed tangible assets— | $(000) | $(000) |
| Purchases during the accounting year | 239,263 | 733,850 |
| Sales during the accounting year | 239,530 | |
| Book value at the end of the accounting year | .. | 3,453,412 |
| Census values in accounting terms— | ||
| Purchases of— | ||
| Goods for resale | 13,128,754 | 29,195,698 |
| Materials used in manufacturing | 232,639 | 2,259,481 |
| Operating expenses— | ||
| Employer contributions | 28,961 | 67,723 |
| Salaries and wages | 1,346,575 | 2,755,114 |
| Indirect taxes | 23,355 | 101,076 |
| Interest etc. | .. | 613,690 |
| Depreciation | 143,302 | 301,888 |
| All other purchases and operating expenses | 1,821,974 | 3,718,573 |
| Total, purchases and operating expenses | .. | 39,013,243 |
| Stocks— | ||
| Closing | 312,205 | 5,903,231 |
| Less, opening | 5,146,321 | |
| Sales of— | ||
| Goods and services | 17,163,718 | 36,536,272 |
| Manufactured goods | 241,638 | 2,785,824 |
| Other income— | ||
| Interest, etc. | .. | 258,822 |
| Subsidies | 262,937 | 212,138 |
| Other income | 481,602 | |
| Total, sales and other income, (adjusted for change in stock values) | .. | 41,031,570 |
| Net profit— | ||
| Total sales and other income adjusted for change in stock values | .. | 41,031,570 |
| Less, total purchases and operating expenses | .. | 39,013,243 |
| Less, working proprietors' and partners' salaries and wages | .. | 581,999 |
| Net profit | .. | 1,436,330 |
| Census values in economic terms— | ||
| Operating surplus— | ||
| Total sales and other income, adjusted for change in stock values | 17,980,498 | 41,031,570 |
| Less, interest, etc. received | .. | 258,822 |
| Less, total purchases and operating expenses | 16,725,561 | 39,013,243 |
| Less, interest, etc. paid | .. | 613,690 |
| Operating surplus | 1,254,937 | 2,373,197 |
| Value added— | ||
| Operating surplus | 1,254,937 | 2,373,197 |
| Employer contributions | 28,961 | 67,723 |
| Salaries and wages | 1,346,575 | 2,755,114 |
| Depreciation | 143,302 | 301,888 |
| Indirect taxes | 23,355 | 101,076 |
| Plus, capitalised salaries and wages | 31 | .. |
| Less, subsidies received | .. | 212,138 |
| Value added | 2,797,161 | 5,386,860 |
Table 21.27. WHOLESALE TRADE, CENSUS OF DISTRIBUTION 1982–83
| Statistical item | Division 61 wholesale trade |
|---|---|
| number | |
| Enterprise groups | 4252 |
| Enterprises | 5093 |
| Activity units | 8263 |
| Ancillary activity units | 367 |
| Unpaid workers at end of February 1983 | 179 |
| Working proprietors and partners engaged at end of February 1983 | 5153 |
| Paid employees engaged at end of February 1983 | 76664 |
| Full-time equivalent working proprietors and partners | 4702 |
| Full-time equivalent paid employees | 73314 |
| Total, full-time equivalent persons engaged | 78016 |
| Ordinary hours worked by paid employees | 141016 |
| Overtime hours worked by paid employees | 3737 |
| $(000) | |
| Salaries, wages and commission paid to working proprietors and partners | 94,582 |
| Salaries, wages and commission paid to employees | 1,117,055 |
| Stocks— | |
| Opening | 3,454,562 |
| Closing | 4,028,730 |
| Income— | |
| Sales of goods bought for resale, and services | 19,934,488 |
| Direct government cash grants and subsidies | 10,305 |
| Other income (excluding interest, etc.) | 3,108,374 |
| Sales and income (excluding interest, etc.) | 23,053,167 |
| Interest, dividends, donations, royalties, patent fees and insurance claims received | 192,076 |
| Total sales and other income (including interest, etc.) | 23,245,243 |
| Expenditure— | |
| Purchases of goods for resale; materials for use in accommodation, catering or other personal and repair services | 16,812,961 |
| Salaries, wages and commission paid to employees | 1,117,055 |
| Depreciation | 118,690 |
| Other purchases and expenses (excluding interest, etc.) | 4,439,600 |
| Operating expenditure (excluding interest, etc.) | 22,488,305 |
| Interest, bad debts, donations, royalties and patent fees | 365,795 |
| Total expenditure (including interest, etc.) | 22,854,100 |
| Net profit/loss after deducting working proprietors' and partners' salaries and wages | 870,729 |
| Operating surplus | 1,139,030 |
| Value added | 2,443,214 |
| Fixed tangible assets— | $(000) |
| Additions to | 306,413 |
| Disposals of | 128,669 |
| Floor space— | m2 |
| Selling space | 1812106 |
| Other space | 4722311 |
| Total space | 6534417 |
Table 21.28. RETAIL TRADE, CENSUS OF DISTRIBUTION 1982–83
| Statistical item | Division 62 retail trade |
|---|---|
| number | |
| Enterprise groups | 24890 |
| Enterprises | 25559 |
| Activity units | 29961 |
| Ancillary activity units | 227 |
| Unpaid workers at end of February 1983 | 3084 |
| Working proprietors and partners engaged at end of February 1983 | 35784 |
| Paid employees engaged at end of February 1983 | 116301 |
| Full-time equivalent working proprietors and partners | 33702 |
| Full-time equivalent paid employees | 95603 |
| Total, full-time equivalent persons engaged | 129306 |
| Ordinary hours worked by paid employees | 176007 |
| Overtime hours worked by paid employees | 6630 |
| $(000) | |
| Salaries, wages and commission paid to working proprietors and partners | 346,301 |
| Salaries, wages and commission paid to employees | 1,071,292 |
| Stocks— | |
| Opening | 1,566,797 |
| Closing | 1,736,209 |
| Income— | |
| Sales of goods bought for resale, and services | 13,755,783 |
| Direct government cash grants and subsidies | 200,393 |
| Other income (excluding interest, etc.) | 128,632 |
| Sales and income (excluding interest, etc.) | 14,084,809 |
| Interest, dividends, donations, royalties, patent fees and insurance claims received | 56,082 |
| Total sales and other income (including interest, etc.) | 14,140,892 |
| Expenditure— | |
| Purchases of goods for resale; materials for use in accommodation, catering or other personal and repair services | 11,028,119 |
| Salaries, wages and commission paid to employees | 1,071,292 |
| Depreciation | 108,540 |
| Other purchases and expenses (excluding interest, etc.) | 1,158,826 |
| Operating expenditure (excluding interest, etc.) | 13,366,777 |
| Interest, bad debts, donations, royalties and patent fees | 179,290 |
| Total expenditure (including interest, etc.) | 13,546,067 |
| Net profit/loss after deducting working proprietors and partners salaries and wages | 417,937 |
| Operating surplus | 887,447 |
| Value added | 1,927,766 |
| Fixed tangible assets— | $(000) |
| Additions to | 248,113 |
| Disposals of | 75,454 |
| Floor space— | m2 |
| Selling space | 5006516 |
| Other space | 2764957 |
| Total space | 7771473 |
Table 21.29. RESTAURANTS AND HOTELS, CENSUS OF DISTRIBUTION 1982–83
| Statistical item | Division 63 restaurants and hotels |
|---|---|
| number | |
| Enterprise groups | 7834 |
| Enterprises | 7910 |
| Activity units | 8596 |
| Ancillary activity units | 33 |
| Unpaid workers at end of February 1983 | 846 |
| Working proprietors and partners engaged at end of February 1983 | 11426 |
| Paid employees engaged at end of February 1983 | 50434 |
| Full-time equivalent working proprietors and partners | 10991 |
| Full-time equivalent paid employees | 35611 |
| Full-time equivalent total persons engaged | 46602 |
| Ordinary hours worked by paid employees | 61757 |
| Overtime hours worked by paid employees | 1491 |
| $(000) | |
| Salaries, wages and commission paid to working proprietors and partners | 61,113 |
| Salaries, wages and commission paid to employees | 372,091 |
| Stocks— | |
| Opening | 64,993 |
| Closing | 75,344 |
| Income— | |
| Sales of goods bought for resale, and services | 1,892,389 |
| Direct government cash grants and subsidies | 564 |
| Other income (excluding interest, etc.) | 24,783 |
| Sales and income (excluding interest, etc.) | 1,917,735 |
| Interest, dividends, donations, royalties, patent fees and insurance claims received | 8,058 |
| Total sales and other income (including interest, etc.) | 1,925,793 |
| Expenditure— | |
| Purchases of goods for resale; materials for use in accommodation, catering or other personal and repair services | 943,017 |
| Salaries, wages and commission paid to paid employees | 372,091 |
| Depreciation | 55,388 |
| Other purchases and expenses (excluding interest, etc.) | 379,026 |
| Operating expenditure (excluding interest, etc.) | 1,749,523 |
| Interest, bad debts, donations, royalties and patent fees | 52,156 |
| Total expenditure (including interest, etc.) | 1,801,679 |
| Net profit/loss after deducting working proprietors' and partners' salaries and wages | 73,353 |
| Operating surplus | 178,564 |
| Value added | 627,686 |
| Fixed tangible assets— | $(000) |
| Additions to | 134,333 |
| Disposals of | 20,890 |
| Floor space— | m2 |
| Selling space | 2916111 |
| Other space | 1048759 |
| Total space | 3964870 |
Table 21.30. PERSONAL AND HOUSEHOLD SERVICES, CENSUS OF DISTRIBUTION 1982–83
| Statistical item | Division 95 personal and household services |
|---|---|
| number | |
| Enterprise groups | 7620 |
| Enterprises | 7668 |
| Activity units | 8196 |
| Ancillary activity units | 35 |
| Unpaid workers at end of February 1983 | 237 |
| Working proprietors and partners engaged at end of February 1983 | 9466 |
| Paid employees engaged at end of February 1983 | 22096 |
| Full-time equivalent working proprietors and partners | 8980 |
| Full-time equivalent paid employees | 19048 |
| Full-time equivalent total persons engaged | 28027 |
| Hrs(000) | |
| Ordinary hours worked by paid employees | 33359 |
| Overtime hours worked by paid employees | 585 |
| $(000) | |
| Salaries, wages and commission paid to working proprietors and partners | 80,003 |
| Salaries, wages and commission paid to paid employees | 194,676 |
| Stocks— | |
| Opening | 59,969 |
| Closing | 62,948 |
| Income— | |
| Sales of goods bought for resale, and services | 953,612 |
| Direct government cash grants and subsidies | 876 |
| Other income (excluding interest, etc.) | 5,637 |
| Sales and income (excluding interest, etc.) | 960,126 |
| Interest, dividends, donations, royalties, patent fees and insurance claims received | 2,606 |
| Total sales and other income (including interest, etc.) | 962,732 |
| Expenditure— | |
| Purchases of goods for resale; materials for use in accommodation, catering or other personal and repair services | 411,601 |
| Salaries, wages and commission paid to paid employees | 194,676 |
| Depreciation | 19,270 |
| Other purchases and expenses (excluding interest, etc.) | 169,401 |
| Operating expenditure (excluding interest, etc.) | 794,948 |
| Interest, bad debts, donations, royalties and patent fees | 16,449 |
| Total expenditure (including interest, etc.) | 811,397 |
| Net profit/loss after deducting working proprietors' and partners' salaries and wages | 74,311 |
| Operating surplus | 168,156 |
| Value added | 388,194 |
| Fixed tangible assets— | $(000) |
| Additions to | 44,991 |
| Disposals of | 14,517 |
| Floor space— | m2 |
| Selling space | 560623 |
| Other space | 680741 |
| Total space | 1241364 |
The first economic Census of Services formed part of the five-yearly series of integrated economic censuses of business activities in New Zealand carried out by the Department of Statistics until 1985. The census covered, for the year ended 31 March 1981, the following activities of the New Zealand Standard Industrial Classification:
Real estate and business services;
Sanitary and similar services;
Social and related services; and
Recreational and cultural services.
Table 21.31. SUMMARY OF CENSUS OF SERVICES 1980–81
| Statistical item | Industry totals |
|---|---|
| Census coverage— | no. |
| Establishments and ancillary units | 20110 |
| Paid employees, and working proprietors/partners | 237572 |
| Census values in accounting terms— | |
| Expenditure— | $(000) |
| Purchases, including fuel and power | 500,890 |
| Levies and duty | 49,147 |
| Employer contributions | 46,769 |
| Salaries and wages | 2,310,933 |
| Depreciation | 73,081 |
| Indirect taxes | 13,095 |
| Insurances | 17,234 |
| Interest, etc. | 103,574 |
| Other expenses | 721,897 |
| Total expenditure | 3,836,621 |
| Stocks— | |
| Closing stocks | 72,943 |
| Less, opening stocks | 60,964 |
| 11,979 | |
| Income— | |
| Interest, etc. | 50,189 |
| Subsidies | 13,303 |
| Rents, etc. | 12,876 |
| Other | 4,194,957 |
| 4,271,324 | |
| Total income | 4,283,303 |
| Net profit— | $(000) |
| Total income adjusted for stocks | 4,283,303 |
| Less, total expenditure | 3,836,621 |
| 446 | 682 |
| Less, salaries of working proprietors or partners | 136,438 |
| Net profit | 310,244 |
| Census values in economic terms— | |
| Operating surplus— | |
| Total income, adjusted for change in stocks | 4,283,303 |
| Less, interest, etc., received | 50,189 |
| Total expenditure | 3,836,621 |
| Less, interest, etc., paid | 103,574 |
| 3,733,047 | |
| Operating surplus | 500,068 |
| Value added— | |
| Operating surplus | 500,068 |
| Levies and duty | 49,147 |
| Salaries and wages | 2,310,933 |
| Employer contributions | 46,769 |
| Depreciation | 73,081 |
| Indirect taxes | 13,095 |
| 2,993,093 | |
| Plus, capitalised salaries and wages | 1,279 |
| Less, subsidies | 13,303 |
| Value added | 2,981,069 |
Table 21.32. INDUSTRY LEVELS, CENSUS OF SERVICES 1980–81
| Service | Enterprise groups | Enterprises | Operating units | Persons engaged at end of February | Salaries and wages paid to employees | |
|---|---|---|---|---|---|---|
| Establishments | Ancillary units | |||||
| Real estate and business services— | number | $(000) | ||||
| Land and estate agents | 709 | 765 | 1081 | 5 | 4536 | 48,368 |
| Real estate valuing and appraising | 87 | 87 | 93 | - | 305 | 1,089 |
| Subtotal, real estate | 796 | 852 | 1174 | 5 | 4841 | 49,456 |
| Legal services | 900 | 902 | 1030 | - | 9647 | 61,320 |
| Accounting, auditing, and bookkeeping services | 1167 | 1223 | 1305 | 1 | 9992 | 65,407 |
| Data processing and tabulating services | 139 | 149 | 193 | - | 3458 | 38,652 |
| Architects | 332 | 333 | 358 | - | 1408 | 8,967 |
| Consulting engineers | 207 | 208 | 281 | 2 | 2134 | 21,707 |
| Land surveyors | 132 | 132 | 167 | - | 1530 | 15,791 |
| Quantity surveyors | 47 | 47 | 66 | - | 384 | 2,850 |
| Town planning consultant services | 11 | 11 | 13 | - | 39 | 148 |
| Engineering, architectural, and technical services, n.e.c. | 215 | 218 | 268 | 3 | 1386 | 13,836 |
| Subtotal, engineering, architectural, and technical services | 938 | 947 | 1153 | 5 | 6881 | 63,299 |
| Advertising agencies | 99 | 102 | 134 | 1 | 531 | 18,633 |
| Commercial artists and display specialists | 217 | 217 | 220 | 1 | 678 | 3,542 |
| Market research agencies | 23 | 25 | 29 | 2 | 535 | 2,567 |
| Public relations consultant services | 53 | 54 | 54 | - | 183 | 1,198 |
| Advertising services, n.e.c. | 76 | 77 | 88 | - | 342 | 2,004 |
| Subtotal, advertising services | 465 | 474 | 525 | 4 | 3269 | 27,943 |
| Security services | 47 | 48 | 75 | - | 1469 | 13,177 |
| Debt collecting and credit rating services | 29 | 33 | 58 | - | 469 | 3,450 |
| Typing, duplicating, and other office services | 89 | 89 | 96 | - | 215 | 789 |
| Contract packing services | 21 | 21 | 23 | - | 284 | 2,652 |
| Mailing and delivery services | 12 | 12 | 12 | - | 186 | 436 |
| Management consultant services | 90 | 95 | 107 | - | 390 | 2,832 |
| Business services, n.e.c. | 365 | 373 | 435 | 4 | 2825 | 18,971 |
| Business services, n.e.c. (except rental and leasing) | 644 | 671 | 806 | 4 | 5838 | 42,308 |
| Subtotal, business services | 4230 | 4365 | 5012 | 14 | 39085 | 298,928 |
| Machinery and equipment rental and leasing | 180 | 182 | 227 | 6 | 1164 | 9,381 |
| Total, real estate and business services | 5196 | 5395 | 6413 | 25 | 45090 | 357,765 |
| Sanitary services— | ||||||
| Collection and disposal of refuse | 331 | 332 | 338 | 1 | 1227 | 9,499 |
| Sewerage and urban drainage | 251 | 251 | 256 | 3 | 1451 | 14,633 |
| Subtotal, sanitary and garbage disposal services | 387 | 388 | 594 | 4 | 2678 | 24,132 |
| Cleaning services | 701 | 710 | 791 | 15 | 13023 | 49,289 |
| Fumigation and pest control services | 29 | 29 | 29 | - | 89 | 372 |
| Total, sanitary and similar services | 1115 | 1127 | 1414 | 19 | 15790 | 73,793 |
| Social and related community services— | ||||||
| Pre-school education | 169 | 276 | 1478 | 54 | 2815 | 16,116 |
| Primary education | 269 | 269 | 2513 | 1 | 31512 | 373,920 |
| Secondary education | 265 | 265 | 361 | - | 20659 | 319,563 |
| Tertiary education | 34 | 34 | 44 | 1 | 15891 | 197,433 |
| Other education services | 461 | 524 | 608 | 2 | 2627 | 19,929 |
| Ancillary units servicing education | 7 | 7 | - | 8 | 47 | 714 |
| Subtotal, education services | 1185 | 1332 | 5004 | 66 | 73551 | 927,675 |
| General practitioners | 1687 | 1687 | 1708 | - | 5343 | 22,425 |
| Private medical specialists | 522 | 522 | 523 | - | 1282 | 4,142 |
| Private dental practices | 765 | 768 | 789 | - | 2599 | 11,908 |
| Optometrists and dispensing opticians | 156 | 158 | 182 | - | 596 | 3,188 |
| Physiotherapists | 133 | 133 | 143 | 1 | 355 | 1,277 |
| Chiropractors | 77 | 77 | 80 | - | 209 | 612 |
| Public and private hospitals | 143 | 152 | 356 | 22 | 63610 | 700,239 |
| Other health services | 159 | 295 | 403 | 14 | 4717 | 43,619 |
| Medical, dental, and other health services | 3635 | 3786 | 4184 | 37 | 78711 | 787,409 |
| Medical laboratories | 18 | 18 | 64 | 62 | 1144 | 10,075 |
| Dental laboratories | 133 | 133 | 136 | 1 | 328 | 1,252 |
| Radiologists in private practice | 29 | 29 | 37 | - | 263 | 1,848 |
| Medical and dental laboratories and radiologists | 180 | 180 | 237 | 63 | 1735 | 13,175 |
| Private veterinary practices | 181 | 182 | 219 | 3 | 936 | 4,971 |
| Other veterinary practices, incl. clubs | 44 | 44 | 75 | - | 357 | 5,099 |
| Boarding kennels and catteries, etc. | 71 | 71 | 71 | - | 140 | 90 |
| Veterinary services, boarding kennels, and catteries, etc. | 296 | 297 | 365 | 3 | 1433 | 10,160 |
| Ancillary units servicing medical, dental, other health, and veterinary services | 10 | 10 | - | 18 | 1373 | 17,041 |
| Subtotal, medical, dental, other health and vet. services | 4111 | 4263 | 4786 | 121 | 83252 | 827,786 |
| Licensed old people's rest homes | 318 | 324 | 392 | 17 | 5536 | 26,012 |
| Total, social and related community services | 5597 | 5907 | 1018 | 2204 | 162339 | 1,781,473 |
| Recreational and cultural services— | ||||||
| Motion picture production | 47 | 49 | 50 | 1 | 373 | 3,825 |
| Motion picture distribution and projection | 81 | 86 | 181 | 70 | 1766 | 9,426 |
| Radio and television broadcasting | 13 | 13 | 45 | 10 | 4297 | 66,756 |
| Total motion picture and other entertainment services | 139 | 147 | 276 | 81 | 6436 | 80,008 |
| Racing and trotting clubs | 156 | 156 | 157 | - | 3507 | 5,743 |
| Self-employed jockeys, horse trainers and TAB | 990 | 990 | 1339 | - | 4410 | 13,430 |
| Subtotal, amusement and recreational services, n.e.c. | 1146 | 1146 | 1496 | - | 7917 | 19,173 |
| Total, recreational and cultural services | 1285 | 1293 | 1772 | 81 | 14353 | 99,181 |
| Total services | 13179 | 13717 | 19781 | 329,237 | 572 | 2,312,212 |
Table 21.33. INDUSTRY LEVEL BY EXPENSES AND SALES, CENSUS OF SERVICES 1980-81
| Service | Purchases and operating expenses | Total sales and other income | Value added | Net capital additions |
|---|---|---|---|---|
| Real estate and business services— | $(000) | |||
| Land and estate agents | 76,208 | 100,268 | 74,676 | 4,131 |
| Real estate valuing and appraising | 2,891 | 6,270 | 4,737 | 225 |
| Subtotal, real estate | 79,099 | 106,538 | 79,412 | 4,356 |
| Legal services | 120,076 | 207,931 | 156,315 | 3,901 |
| Accounting, auditing, and bookkeeping services | 117,770 | 190,388 | 145,781 | 3,021 |
| Data processing and tabulating services | 102,930 | 113,900 | 65,361 | 26,468 |
| Architects | 23,264 | 35,924 | 22,775 | 382 |
| Consulting engineers | 43,680 | 58,388 | 38,334 | 1,121 |
| Land surveyors | 22,796 | 26,392 | 20,299 | 1,200 |
| Quantity surveyors | 5,584 | 9,549 | 7,050 | 110 |
| Town planning consultant services | 508 | 790 | 467 | 33 |
| Engineering, architectural, and technical services, n.e.c. | 27,634 | 32,984 | 20,360 | 820 |
| Subtotal engineering, architectural, and technical services | 123,466 | 164,027 | 109,286 | 3,666 |
| Advertising agencies | 159,746 | 168,448 | 29,974 | 1,559 |
| Commercial artists and display specialists | 12,081 | 15,845 | 7,970 | 601 |
| Market research agencies | 6,467 | 7,091 | 3,414 | 199 |
| Public relations consultant services | 3,004 | 3,769 | 2,097 | 105 |
| Advertising services, n.e.c. | 7,107 | 8,076 | 3,452 | 200 |
| Subtotal advertising services | 188,404 | 203,230 | 46,907 | 2,665 |
| Security services | 22,360 | 23,958 | 16,030 | 1,095 |
| Debt collecting and credit rating services | 10,992 | 11,218 | 4,016 | 168 |
| Typing, duplicating, and other office services | 2,248 | 2,698 | 1,447 | 121 |
| Contract packing services | 12,590 | 13,120 | 4,115 | 822 |
| Mailing and delivery services | 1,944 | 2,167 | 720 | 25 |
| Management consultant services | 7,602 | 10,009 | 5,390 | 275 |
| Business services, n.e.c. | 44,644 | 51,733 | 28,562 | 1,564 |
| Subtotal business services, n.e.c. (except rental and leasing) | 102,380 | 114,904 | 60,280 | 4,070 |
| Subtotal business services | 755,026 | 994,379 | 583,930 | 43,790 |
| Machinery and equipment rental and leasing | 56,605 | 63,159 | 21,571 | 5,514 |
| Total, real estate and business services | 890,730 | 1,164,076 | 684,913 | 53,660 |
| Sanitary services— | ||||
| Collection and disposal of refuse | 42,675 | 45,334 | 15,684 | 1,691 |
| Sewerage and urban drainage | 58,964 | 59,487 | 34,081 | 3,091 |
| Total sanitary and garbage disposal services | 101,640 | 104,821 | 49,766 | 4,782 |
| Cleaning services | 66,624 | 75,223 | 60,100 | 1,606 |
| Fumigation and pest control services | 1,566 | 2,107 | 1,064 | 79 |
| Total, sanitary and similar services | 169,830 | 182,150 | 110,930 | 6,467 |
| Social and related community services— | ||||
| Pre-school education | 21,358 | 21,811 | 14,438 | 1,061 |
| Primary education | 427,582 | 431,263 | 382,063 | 43,435 |
| Secondary education | 368,532 | 372,637 | 328,359 | 42,367 |
| Tertiary education | 258,004 | 259,904 | 195,631 | 21,080 |
| Other education services | 30,425 | 31,960 | 20,605 | 1,424 |
| Ancillary units servicing education | 1,430 | 1,173 | 696 | 10 |
| Subtotal, education services | 1,107,331 | 1,118,748 | 941,792 | 109,377 |
| General practitioners | 53,604 | 104,651 | 75,912 | 2,756 |
| Private medical specialists | 13,740 | 28,508 | 19,334 | 736 |
| Private dental practices | 33,445 | 57,209 | 37,599 | 586 |
| Optometrists and dispensing opticians | 17,042 | 23,920 | 11,032 | 575 |
| Physiotherapists | 3,171 | 5,848 | 4,288 | 96 |
| Chiropractors | 2,126 | 3,860 | 2,512 | 82 |
| Public and private hospitals | 946,852 | 931,634 | 760,502 | 89,076 |
| Other health services | 58,062 | 59,613 | 46,861 | 1,869 |
| Medical, dental, and other health services | 1,128,043 | 1,215,244 | 958,039 | 95,777 |
| Medical laboratories | 18,012 | 23,267 | 15,909 | 201 |
| Dental laboratories | 3,734 | 6,467 | 4,220 | 153 |
| Radiologists in private practice | 4,063 | 6,678 | 4,623 | 164 |
| Medical and dental laboratories and radiologists | 25,809 | 36,412 | 24,752 | 518 |
| Private veterinary practices | 23,301 | 30,794 | 13,687 | 1,129 |
| Other veterinary practices, including clubs | 19,790 | 20,465 | 6,776 | 117 |
| Boarding kennels and catteries, etc. | 1,074 | 1,320 | 537 | 96 |
| Veterinary services, boarding kennels and catteries, etc. | 44,165 | 52,580 | 21,000 | 1,342 |
| Ancillary units servicing medical, dental, other health and veterinary services | 65,783 | 64,749 | 18,911 | 2,112 |
| Subtotal, medical, dental, other health and veterinary services | 1,263,800 | 1,368,984 | 1,022,703 | 99,749 |
| Licensed old people's rest homes | 47,223 | 51,318 | 32,158 | 9,310 |
| Total, social and related community services | 2,418,354 | 2,539,049 | 1,996,653 | 218,437 |
| Recreational and cultural services— | ||||
| Motion picture production | 14,213 | 15,559 | 6,282 | 1,224 |
| Motion picture distribution and projection | 41,052 | 46,601 | 17,907 | 116 |
| Radio and television broadcasting | 149,119 | 145,957 | 83,269 | 8,187 |
| Subtotal, motion picture and other entertainment services | 204,384 | 208,117 | 107,458 | 9,527 |
| Racing and trotting clubs | 75,392 | 76,419 | 33,154 | 2,232 |
| Self-employed jockeys, horse trainers, and Totalisator Agency Board | 77,932 | 101,513 | 47,962 | 2,055 |
| Subtotal, amusement and recreational services, n.e.c. | 153,324 | 177,933 | 81,116 | 4,286 |
| Total, recreational and cultural services | 357,708 | 386,049 | 188,574 | 13,814 |
| Total, services | 3,836,621 | 4,271,325 | 2,981,069 | 292,377 |
21.1 Department of Trade and Industry; Consumers' Institute; Department of Labour; Department of Justice.
21.2 Department of Justice; Department of Trade and Industry; Securities Commission; New Zealand Stock Exchange; Department of Statistics.
21.3 Insurance Council of New Zealand; Department of Statistics.
21.4 Department of Statistics.
Licensing Polls (Parl. paper E. 9B).
Report of the Consumer Council (Parl. paper G. 29).
Report of the Department of Labour (Parl. paper G. 1).
Report of the Department of Trade and Industry (Parl. paper G. 14).
Report of the Licensing Control Commission (Parl. paper E. 8).
Sale of Liquor in New Zealand: Report of the Working Party on Liquor. Department of Justice, 1986.
Shop Trading Hours Act 1977: Report of the Advisory Committee, 1988. Department of Labour.
Current Issues in New Zealand Competition and Consumer Law. Commerce Commission, 1988.
Report of the Commerce Commission (Parl. paper G. 34).
Report of the Department of Justice (Parl. paper E. 5).
Report of the Securities Commission (Parl. paper E. 25).
Census of Services, Finance and Insurance, 1983. Department of Statistics.
Insurance Statistics. Department of Statistics (annual).
Report of the Earthquake and War Damage Commission (Parl. paper B. II).
Report of the Government Life Insurance Corporation (Parl paper B. 22).
Report of the State Insurance Office (Parl. paper B. 21).
Table of Contents
New Zealand is heavily dependent on overseas trade. The 12-member European Community is New Zealand's largest trading partner, and Japan, the United States and Australia are the most important individual trading partners. Trade with Canada, the countries of East Asia, the Soviet Union and the Middle East has also become very important. Over recent decades New Zealand has been moving away from dependence on dairy, meat and wool exports, and exports from the forestry, horticulture, fishing and manufacturing industries have become more and more significant.
Through its network of overseas offices, and with its staff and extensive information resources within New Zealand, the Department of Trade and Industry (until 1 December 1988) has assisted exporters in several ways. It has operated two trade divisions—International Trade Relations, and the New Zealand Trade Commission (Tradecom). Trade officers are located in 40 offices overseas and four in New Zealand.
The International Trade Relations Division has primary responsibility for advising and assisting the Government on its trading relationships with other governments. The division is involved in securing and maintaining an environment that allows the growth of international trade by negotiation and continuing contact with trading partners either bilaterally or in international organisations such as the General Agreement on Tariffs and Trade (GATT). The division communicates with other governments, either through their trade representatives in Wellington or through New Zealand representatives around the world.
Prior to going to press with this edition it was announced that the Department of Trade and Industry as such would be disestablished from 1 December 1988. The International Trade Relations Division will become part of the new Ministry of External Relations and Trade, while Tradecom will become part of the New Zealand Market Development Board (see below). Other functions of the department will be continued by the new Ministry of Commerce.
Tradecom's officers assist exporters in their trade promotion activities by providing: information on potential markets, and market opportunities for individual products; reports on access conditions such as customs duties, sales tax and quotas as well as market requirements such as packaging, labelling, plant and animal health requirements; commercial intelligence and advice; information on tender opportunities; assistance at trade exhibitions; and arranging inward missions, export opportunity visits, trade missions, seminars and in-market promotions.
Services offered by Tradecom are provided on a cost-sharing basis.
In addition, trade officers overseas (known as trade commissioners) monitor the overall pattern of New Zealand trade within their territory and report on any significant developments, such as changes in legislation or regulations which could affect New Zealand exports. They also help ensure that the government officials and influential people in their territory are aware of New Zealand's export interests. From time to time they are required to make official representations to the government concerned, as well as representing New Zealand at international conferences.
Japanese advertisement for New Zealand milk powder.
Tradecom also administers the Export Award Scheme, which gives recognition to individuals, companies and organisations which have made significant contributions to the expansion of New Zealand's export trade.
The New Zealand Export-Import Corporation has the objective of promoting and encouraging the development of New Zealand's overseas trade. The corporation operates as a commercial enterprise and may act either on its own account or on behalf of manufacturers, producers, exporters or importers as required. It is also entitled to act as a purchasing and selling agent for the Government and to undertake trade transactions on its behalf.
The corporation is managed by a board of directors with wide commercial experience.
It maintains an office in China (Xiamen), and has representatives in Venezuela and Malaysia, and has held an interest in a cold storage and warehousing company in Bahrain.
The board was established in 1986 and fosters New Zealand's foreign exchange earnings by assisting groups to develop overseas markets for goods and services. Groups are required to contribute a minimum of 50 percent of the funding for promotional programmes, desirably long-term. A number of programmes are now underway, especially in the agricultural/horticultural area.
The Export Guarantee Office (EXGO) operates in accordance with the Export Guarantee Act 1964. The office's function is to promote export trade by providing insurance against commercial and political risks arising from the export of goods or services. It also provides guarantees to lending institutions for amounts advanced to exporters which are covered by EXGO insurance. The Export Guarantee Office can provide a wide range of policies sufficient to meet most requirements.
New Zealand was one of the original parties to the General Agreement on Tariffs and Trade negotiated in Geneva in 1947 and has since taken an active part in its work. The GATT is the only body of rules governing international trade, and provides a vehicle for reducing barriers to trade and a forum for the discussion and settlement of international trade problems and disputes.
The basic GATT principle of non-discrimination, embodied in the most-favoured-nation concept, is particularly important to countries such as New Zealand, since it ensures that larger nations cannot exert economic muscle through discriminatory trade policies. By the end of 1987 a total of 95 of the world's trading nations, representing over 80 percent of total world trade, had become contracting parties to the GATT. They are therefore entitled to most-favoured-nation treatment.
A series of multilateral trade negotiations has been held under the auspices of the GATT to reduce obstacles to trade and refine the rules. Earlier negotiating rounds concentrated on reducing tariff levels and binding them at agreed maximum levels. The Tokyo Round which ran from 1973 to 1979, broadened its scope, as well as negotiating important tariff reductions and formulating codes of conduct which elaborated on or added to existing GATT rules.
New Zealand participated in all aspects of the negotiations, making a global tariff offer through ‘binding’ certain tariff rates which covered items with a trade value of around $579 million. In return for offers made in the context of bilateral negotiations, New Zealand received useful concessions on tariffs and access for our major export products, particularly for trade with the United States, the European Community and Canada. New Zealand also joined the multilateral arrangements negotiated on meat and dairy products.
In September 1986, the eighth GATT round of multilateral trade negotiations, known as the Uruguay Round, was launched to address rules governing agricultural trade and other concerns of contracting parties about the functioning of the international trading system. The Uraguary Round negotiations entered their second phase in January 1988.
This arrangement was negotiated during the Tokyo Round of GATT multilateral trade negotiations, and has been in operation since 1979. New Zealand is a member of the IDA, which contains provision for an exchange of information on the international dairy market. It has also established agreed minimum prices for certain internationally traded dairy products.
GATT: International Arrangement Regarding Bovine Meat (IMC). New Zealand is also a member of the IMC, which was the second commodity agreement to emerge from the Tokyo Round of the GATT multilateral trade negotiations in 1979 Unlike the IDA, the IMC contains no economic provisions, but is a forum for exchanging information on production and trade of beef and sheepmeat. The IMC also meets to evaluate the market situation and outlook, and to examine possible solutions if a structural imbalance is identified.
Sugar. Between 1973 and 1984 the bulk of New Zealand's annual requirement for sugar was imported from Australia and Fiji under long-term agreements. A major review of New Zealand's sugar importing policy was completed in 1985. The outcome of this review was to remove controls on the importation and pricing of sugar, effective from 31 August 1986.
To allow Fiji time to adjust to supplying the New Zealand market at prevailing world market prices, which are currently depressed, New Zealand entered into a three-year agreement (which expired March in 1988) to compensate Fiji for any shortfall in earnings for a quantity of raw sugar exported to New Zealand.
New Zealand has been a signatory to the International Sugar Agreements in 1958, 1968 and 1978. These agreements incorporated mechanisms that regulate the supply and price of sugar on world markets. In 1984 negotiations for a new sugar agreement failed, and an interim agreement which contained no pricing mechanisms was finally accepted. New Zealand renewed its membership of the agreement then, following a review of membership of international commodity agreements, withdrew from the International Sugar Agreement on 31 December 1987.
Coffee. New Zealand was a party to the International Coffee Agreement 1983 and was also a party to the previous 1968 and 1976 agreements. Its membership lapsed on 30 September 1987. The 1987-88 edition of the Yearbook describes the agreement in more detail.
Customs tariff. On 1 January 1988 New Zealand introduced a new customs tariff based on the international Harmonised Commodity Description Coding System (harmonised system). The harmonised system replaced the previous tariff which had been in force since 1978, and like the previous tariff it has been developed from Customs Co-operation Council Nomenclature. Advantages of the harmonised system include its widespread use by other countries, among them New Zealand's major trading partners, its convenience for statistical purposes, and greater efficiency in administering customs duties.
The tariff has a major role in assistance to industry and is the administrative basis on which New Zealand operates its customs controls and collects duty. There is a requirement that all goods brought into the country should be ‘entered’ for customs and then dealt with according to the relevant provisions of the tariff. The Customs Tariff of New Zealand itself consists of a manual in two parts, the first dealing with the standard tariff, and the second with concessions. It contains a comprehensive, itemised list of every type of goods that might possibly be imported. The structure of the list breaks it down into broad categories, which are then further refined into very specific, detailed classifications of goods. Against each item the tariff indicates the appropriate duty payable on that class of goods depending on their country of origin. A range of goods obtain preferential rates of duty when they originate in certain countries, eg., Australia, Canada or least developed countries. The various types of duty used in the tariff include ad valorem duties (a straight percentage of the value for duty of the goods), specific duties (set at a fixed sum of money for a given quantity irrespective of value), or combinations of the two, and concessionary duties (including duty free items, such as travellers' baggage concessions). Ad valorem duties range from duty-free to 65 percent. A great many items whose manufacture is outside the scope of local industry are duty free. There is now limited use of specific duties in the tariff, and the trend of policy is in favour of ad valorem duties in most cases.
The following extract from the tariff gives an example of an ad valorem duty:
| Number | Statistical Key | Goods | Rates of Duty | ||
|---|---|---|---|---|---|
| Code | Unit | Normal Tariff | Preferential Tariff | ||
| 85.17 | Electrical apparatus for line telephony or line telegraphy, including such apparatus for carrier-current line systems: | ||||
| 8517.10.00 | 00E | No. | Telephone sets | 32.5 | AU Free |
| 10/88 30 | CA 20 | ||||
| 10/89 27.5 | LLDC Free | ||||
| 10/90 25 | Pac Free | ||||
The two left-hand columns give identification and statistical codes for the category and sub-category of goods in the example, the middle column gives the relevant description, and the two right-hand columns give the standard and concessionary rates of duty. For the specific item, telephone sets, the standard duty is 32.5 percent of value until October 1988, reducing to 25 percent by October 1990. These goods are duty-free if they originate in Australia, least developed countries, or the Pacific, and there is a preferential duty of 20 percent if they originate in Canada.
The objectives of the customs tariff have varied with time. Historically it began as a simple revenue collection measure, and later also came to be seen as a means of protection for local industry. It now has trade policy and development assistance objectives as well, and is a way of meeting obligations under international trade agreements, and a way of encouraging trade with developing countries.
The Government recently reviewed the tariff and in 1988 announced a five-step programme to reduce tariff levels between July 1988 and 1992.
Excise. In addition to customs duty, imported goods, like locally made goods are liable to GST (goods and services tax) and excise duty in some cases. When GST was introduced in 1986, sales tax was abolished but motor vehicles, wines, petroleum fuels, and natural gas fuels (cng and lpg) were added to the traditional list of goods subject to excise duty: beer, potable spirits and tobacco.
See chapter 25, Public sector finance, for information on customs and excise revenue.
Import licensing is being phased out and now controls less than 10 percent of New Zealand's imports by value. Under the licensing system certain specific goods may not be imported except with a licence.
Extensive import licensing was introduced in 1938 as a foreign exchange control measure, and the system has continued to varying degrees since then. Its sole purpose now is providing assistance to local manufacturing, and the tariff (import duties) is preferred as the principal means of industry assistance. Only goods covered by industry development plans are still subject to licensing. Each plan, except those for apparel, adults' footwear, wheat flour, and certain secondhand commercial ships, provides a programme to end licensing within the next few years. There will be no import licensing for goods of Australian origin after 1 July 1990.
Import and export statistics are compiled by the Department of Statistics using as a source data from copies of entries submitted by the importers/exporters and their agents via the Customs Department.
Exports. Exports are shown on an f.o.b. (free on board) valuation basis in New Zealand dollars (see glossary). In some cases, however, goods are sent on consignment and the selling prices are not known until goods are disposed of at their destination. In these cases f.o.b. values are assessed on the basis of prices current at the time of export.
Exported goods of foreign origin previously imported into New Zealand are valued in the same way as goods of New Zealand origin, irrespective of whether the goods exported are exempt from import duty, exported ex-warehouse, or exported under drawback. In some instances the ultimate destination of exports not known at the time of export, such goods being entered as exported to the country to which they are being shipped. This applies more particularly to wool, considerable quantities of which are shipped to the United Kingdom, and subsequently re-exported to other European countries. However, in all instances where the final destination is known at the time of export, the exports are credited to that destination in the New Zealand trade statistics.
A distinction is made between exports of New Zealand produce and re-exports of imported goods.
Imports. All v.f.d. (value for duty) and c.i.f. (cost including insurance and freight) values are shown in New Zealand dollars. These values are converted from the foreign currency at the time an import entry is lodged with the Customs Department. The exchange rate used for the conversion is set by Customs on a two-weekly basis. It should be noted that where there have been wide fluctuations in the exchange rate for a specific country it is not feasible to convert the New Zealand totals back to a foreign currency total.
Two values may be given for imports. The v.f.d. on which customs duty is based, equates approximately with the f.o.b. cost of the goods in the exporting country though the former often excludes special export packaging and other costs incidental to delivering the goods on board ship. Further differences may arise from price fluctuations between the purchase date and the date of shipment, and from different export and domestic price levels. The other valuation is the c.i.f. which represents the cost to the importer of buying the goods and bringing them to this country to the wharfside.
Import totals do not include gold and current, coin.
In the following tables Australia includes the Cocos Islands, Norfolk Island, and Christmas Island. The United States includes American Samoa, Guam, Pacific Islands Trust Territory, Puerto Rico, U.S. Virgin Islands and miscellaneous U.S. Pacific Islands.
New Zealand's balance of merchandise trade for the 1986-87 trade year ended 30 June 1987, showed a surplus of $307.0 million. Total exports were valued at $12,107.2 million (f.o.b.) and imports at $11,800.2 million (c.i.f.).
Table 22.1. VISIBLE BALANCE OF MERCHANDISE TRADE
| Year ended 30 June | Total exports (f.o.b.) | Total imports (c.i.f.) | Excess exports(+) or imports(-) |
|---|---|---|---|
| $(000) | |||
| 1985 | 11,315,802 | 12,472,592 | -1,156,790 |
| 1986 | 10,571,747 | 11,466,970 | -895,223 |
| 1987 | 12,107,217 | 11,800,187 | +307,030 |
Visible trade is not the only factor to be taken into account in considering the balance of payments between countries. Other factors are given in chapter 26. National economy.
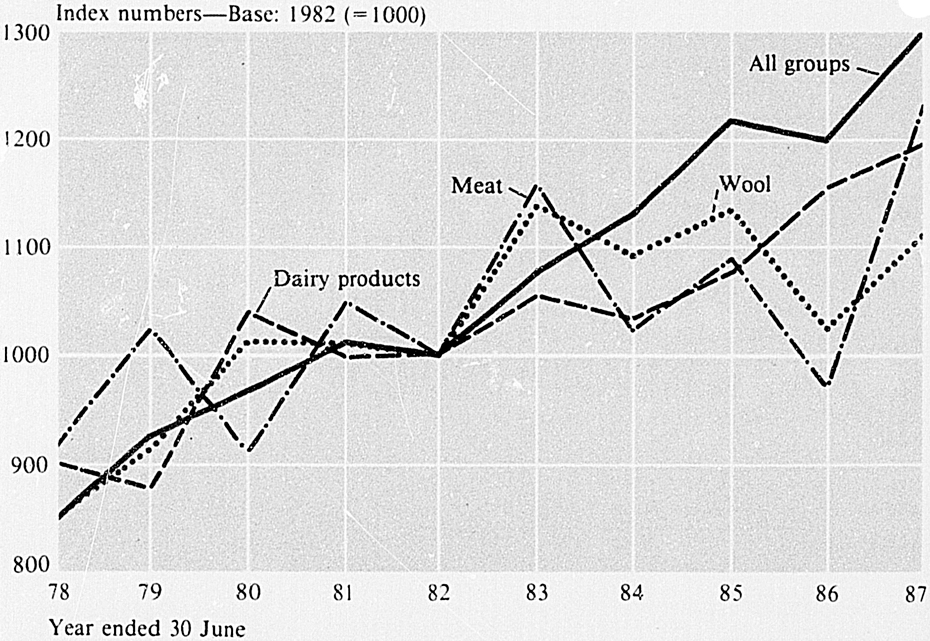
VOLUME OF EXPORTS
The European Community (EC) remains New Zealand's largest trading partner. For the year ended June 1987 the EC accounted for 22 percent of New Zealand's exports and 23 percent of its imports.
New Zealand and Japan have continued to develop closer economic and trade relations. Japan became New Zealand's largest individual trading partner in 1985, and trade between the two countries accounted for 18 percent of New Zealand's two-way trade in the year ended June 1987. Continued efforts are being made to improve access for New Zealand exports, particularly agricultural exports. Close contact has been maintained between the two governments, with regular consultations being held at ministerial and official level.
Access to the North American market is also very important, accounting for 18 percent of New Zealand exports in the year ended June 1987. The United States is New Zealand's second largest individual export market and is a major market for beef and casein.
Australia is New Zealand's third largest individual export market and is particularly important for manufactured goods.
Trade between the two countries is governed by the Australia - New Zealand Closer Economic Relations Trade Agreement (ANZCERTA), which will result in the removal of all restrictions on trans-Tasman trade by 1995 at the latest.
Significant trading links have developed with China, Hong Kong, the Republic of Korea, and the ASEAN (Association of South-east Asian Nations), countries. China, Hong Kong and Taiwan accounted for 6.6 percent of New Zealand's exports in the year ended June 1987, with China contributing more than half of the total.
Table 22.2. DESTINATION AND ORIGIN OF EXTERNAL TRADE
| Year | Exports* | Year | Imports | ||||||||
|---|---|---|---|---|---|---|---|---|---|---|---|
| United Kingdom | Australia | Japan | United States | Other countries | United Kingdom | Australia | Japan | United States | Other countries | ||
| *Includes re-exports. | |||||||||||
| percentage of trade f.o.b. | percentage of trade v.f.d. | ||||||||||
| December year | December year | ||||||||||
| 1920 | 75 | 5 | 15 | 5 | 1920 | 49 | 17 | 2 | 18 | 14 | |
| 1930 | 81 | 3 | 5 | 11 | 1930 | 47 | 8 | 1 | 18 | 26 | |
| 1940 | 90 | 1 | 3 | 6 | 1940 | 47 | 16 | 2 | 12 | 23 | |
| 1950 | 66 | 2 | 1 | 10 | 21 | 1950 | 61 | 12 | 7 | 20 | |
| 1960 | 53 | 4 | 3 | 13 | 27 | 1960 | 44 | 18 | 3 | 10 | 25 |
| June year | June year | ||||||||||
| 1970 | 36 | 8 | 10 | 16 | 30 | 1970 | 30 | 21 | 8 | 13 | 28 |
| 1980 | 14 | 13 | 13 | 14 | 46 | 1980 | 14 | 19 | 13 | 14 | 40 |
| 1983 | 13 | 12 | 14 | 15 | 46 | 1983 | 9 | 20 | 17 | 17 | 37 |
| 1984 | 11 | 15 | 16 | 13 | 45 | 1984 | 9 | 20 | 21 | 15 | 35 |
| 1985 | 9 | 17 | 15 | 15 | 44 | 1985 | 9 | 19 | 20 | 17 | 35 |
| 1986 | 9 | 17 | 14 | 16 | 44 | 1986 | 9 | 17 | 21 | 17 | 36 |
| 1987 | 9 | 15 | 15 | 17 | 44 | 1987 | 10 | 18 | 21 | 16 | 35 |
The cornerstone of the trans-Tasman trading relationship is the Australia - New Zealand Closer Economic Relations Trade Agreement (ANZCERTA). The impetus behind the agreement lay in the belief that such an arrangement, which was based on the eventual free trade of all goods, would bring economic benefits to both countries in the context of trans-Tasman and international trade.
The agreement provided for the phased removal of duty rates by 1 January 1988 and the progressive liberalisation of all quantitative restrictions on trans-Tasman trade by 1995. The agreement applies to all goods except those which were covered by modified arrangements. Since 1983, most of these goods have been incorporated into the trade liberalisation provisions. Those goods still outside the agreement (steel, taps, stopcocks and valves, sugar, tobacco and petroleum) are the subject of continuing consultation about how best to bring them under the ANZCERTA umbrella.
The agreement also includes undertakings and detailed procedures in respect of such matters as dumping and countervailing action, intermediate goods issues, and safeguard measures to ensure that trade develops under conditions of fair competition.
Major changes to the agreement were discussed by the Prime Ministers of Australia and New Zealand in November 1987 and another summit meeting was held in 1988 to finalise these changes.
Proposed changes included completing the liberalisation of quantitative restrictions earlier than the current treaty date 1995; including trade in services within the scope of the treaty; and removing inconsistencies in commercial regulations between the two countries.
Preference to British countries in respect of certain commodities was provided for in the earliest tariff in force in New Zealand, that was introduced in 1841, and New Zealand made various attempts to introduce reciprocity with Australian colonies during the nineteenth century.
Imperial preference proper was introduced in New Zealand by the Preferential and Reciprocal Trade Act 1903. At first only a few items were covered by the extra duties levied upon goods of foreign origin, but the Tariff Act of 1907 extended this additional preferential duty to a great number of items thereby allowing Australia, amongst other Commonwealth countries, advantages in trade.
1922 agreement—A trade agreement between Australia and New Zealand was first entered into on 11 April 1922. Under this agreement, each country granted to goods of the other, the full benefits of its British preferential tariff, except with regard to certain classes of goods on which special rates were fixed. The tariff agreement was later confirmed by the Tariff Agreement (New Zealand and Australia) Ratification Act 1922 which came into effect on 1 September of that year.
1933 agreement—During 1933, a minister of the Commonwealth Government visited New Zealand to discuss the commercial relations between the two countries. A provisional agreement was reached in April 1933, and confirmed by the Trade Agreement (New Zealand and Australia) Ratification Act 1933, under which lower duties than those offered under the British preferential tariff would apply. However, to protect New Zealand industries, the duties on certain classes of Australian goods were fixed at rates higher than those in force in 1933 on similar United Kingdom goods. Under the trade agreement, goods partially manufactured in Australia or New Zealand came outside the scope of the preferential system unless the material costs and/or labour performed within either country represented more than half of the factory or works cost of the goods in their finished state.
NAFTA agreement—between 1966 and 1982 the New Zealand-Australia Free Trade Agreement (NAFTA) governed trans-Tasman trade. The central element of NAFTA was Schedule A, which provided for the elimination of duties on certain goods. The agreement also contained a number of other arrangements which promoted reciprocal trade. However, in spite of NAFTA's success in fostering a rapid expansion of trans-Tasman trade, by the late 1970s both New Zealand and Australia felt that NAFTA no longer provided the most appropriate framework for promoting trade between the two countries. It did not provide any automatic mechanism for improving access conditions by the removal of quantitative restrictions, nor did it guarantee that existing conditions of access would be maintained for those products not covered by NAFTA arrangements.
CER agreement—Following negotiations during 1980–82 an initial agreement was signed on 14 December 1982, to come into effect on 1 January 1983. The formal trade agreement, the Australia-New Zealand Closer Economic Relations Trade Agreement (ANZCERTA), was signed on 28 March 1983. It replaces the 1933 Trade Agreement between Australia and New Zealand, the 1965 New Zealand-Australia Free Trade Agreement (NAFTA), and a 1977 Agreement on Tariff and Tariff Preferences.
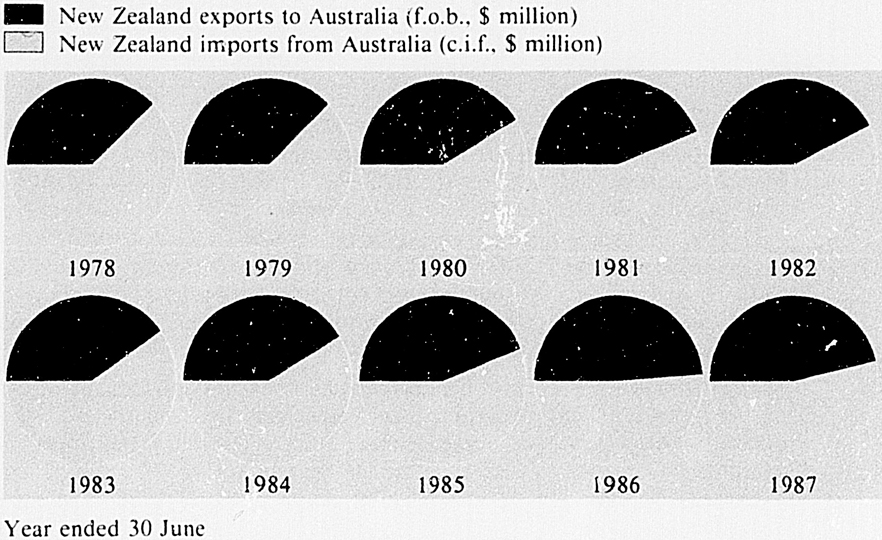
TRANS-TASMAN TRADE BALANCE
Table 22.3. TRADE WITH AUSTRALIA
| Year ended June | Total exports* f.o.b. | Imports c.i.f. | Excess exports (+) or imports (-) | Ratio of trade in Australia's favour† |
|---|---|---|---|---|
*Includes re-exports. †Ratio of imports c.i.f. to exports f.o.b. (including re-exports). | ||||
| $(000) | ||||
| 1977 | 380,748 | 731,732 | -350,984 | 1.922:1 |
| 1978 | 411,030 | 674,485 | -263,455 | 1.641:1 |
| 1979 | 499,491 | 817,451 | -317,960 | 1.637:1 |
| 1980 | 631,510 | 911,663 | -280,153 | 1.444:1 |
| 1981 | 814,725 | 1,066,158 | -251,433 | 1.309:1 |
| 1982 | 1,025,155 | 1,372,636 | -347,481 | 1.339:1 |
| 1983 | 949,032 | 1,446,370 | -497,338 | 1.524:1 |
| 1984 | 1,287,141 | 1,809,564 | -522,423 | 1.406:1 |
| 1985 | 1,835,672 | 2,303,971 | -468,299 | 1.255:1 |
| 1986 | 1,821,754 | 1,897,975 | -76,221 | 1.042:1 |
| 1987 | 1,794,912 | 2,119,829 | -324,917 | 1.181:1 |
In 1977 exports to Australia contributed 12 percent of total exports by New Zealand. While exports to Australia increased by an average 17 percent per year in the following 10 year period, exports to all countries also increased by an annual average of 14 percent, and exports to Australia now contribute 15 percent of total exports. Australia supplied 21 percent of New Zealand's imports in 1977, but this fell to 18 percent by 1987.
An increase in the merchandise trade balance in Australia's favour to $325 million in the 12 months to 30 June 1987, reflected in particular the benefit to Australia of a hardening of the New Zealand dollar and progressive removal of New Zealand's import controls.
Significant value import items for the 1986-87 year were:
Road vehicles $256.2 million,
Electrical machinery, apparatus and appliances $98.4 million,
Non-ferrous metals $96.1 million,
Textile yarn, fabrics and made-up articles $91.3 million,
Artificial resins and plastic materials $82.1 million,
Fruit and vegetables $73.4 million,
General industrial machinery and equipment $73.0 million and
Paper, paperboard and articles thereof $52.4 million.
Significant changes in imports from 1985-86 to 1986-87:
Wheat down $15 million to $13.1 million,
Aluminium oxide down $15 million to $157.9 million,
Crude petroleum up $38 million to $50.6 million,
Refined petroleum down $191 million to $67.2 million,
Chemicals and related products up $43 million to $274.7 million,
Universals, plates and sheets of iron and steel down $25 million to $41.7 million,
Aluminium up $14 million to $31.5 million,
Road vehicles up $125 million to $256.2 million,
Miscellaneous manufactures up $39 million to $190.1 million.
Significant value export commodities for the 1986-87 year were:
Live horses $105.5 million,
Textile yarn $79.8 million,
Fruit and vegetables $76.4 million,
Wool and other animal hair $66.9 million,
Pulp and waste paper $59.5 million,
Leather $44.1 million and
Perfumery and cosmetics $38.5 million.
Significant changes in exports from 1985-86 to 1986-87:
Fresh, chilled and frozen fish down $14 million to $35.9 million,
Live horses up $25 million to $105.5 million,
Crude petroleum down $54 million to $12.9 million,
Leather up $19 million to $44.1 million,
Paper and paperboard down $17 million to $122.1 million,
Floor coverings down $23 million to $66.6 million.
The South Pacific has become a significant export market, now accounting for 3.3 percent of New Zealand exports. Fiji, Papua New Guinea and French Polynesia are the principle markets in the region. Imports from the region are encouraged by the South Pacific Regional Trade and Economic Co-operation Agreement (SPARTECA).
Exports of New Zealand produce (excluding re-exports) to the Pacific island countries amounted to $393.6 million (f.o.b.) and imports (c.i.f.) from these islands came to $85.1 million in 1986-87. Exports were relatively static and imports decreased by 9.7 percent over the previous trade year.
Under the South Pacific Regional Trade and Economic Co-operation Agreement (SPARTECA) New Zealand and Australia provide, on a non-reciprocal basis, duty-free and unrestricted access into their markets for most of the products exported by the Pacific Forum countries. After 1 July 1988 all Pacific Forum island goods meeting the SPARTECA rules of origin requirements can enter the New Zealand market free of duty and import licensing.
The agreement also includes provision for general economic, commercial and technical co-operation, safeguard provisions relating to dumped and subsidised goods and provides for special treatment and assistance to be extended to the smaller island countries. It also recognises that the full potential of the access provisions can be achieved only through closer economic co-operation and development assistance aimed at enhancing the export capabilities of the island countries. New Zealand officials visit most of the islands to publicise the benefits of the agreement and discuss opportunities for export to New Zealand with businessmen.
The agreement took effect in 1981 and except for items subject to revenue duties and a few items of particular sensitivity to New Zealand the revised customs tariff introduced from that date reflected the duty-free access provisions of the agreement.
In New Zealand's case the preferential tariff applies only to goods of Pacific Island origin. These are either wholly obtained in the preferential area or partly manufactured in the area, where the Pacific Island and/or New Zealand content exceeds a nominated level.
Exports of New Zealand produce (excluding re-exports) to the Pacific Forum Island countries amounted to $271.4 million (f.o.b.) and imports (c.i.f.) from these nations came to $84.3 million in 1986-87. Exports increased by 2.3 percent and imports decreased by 10 percent from the previous year. The three major countries New Zealand exported to during 1986-87 were Fiji ($123.1 million), Papua New Guinea ($74.4 million) and French Polynesia ($57.0 million). The top three import country suppliers were Fiji ($28.1 million), Nauru ($18.3 million) and Papua New Guinea ($13.9 million).
The member countries of the Association of South-east Asian Nations (Indonesia, Malaysia, the Philippines, Singapore, Thailand and Brunei) are an increasingly important market for New Zealand for agricultural, forestry, and manufactured exports, although dairy products still account for over half of total exports to the region. New Zealand's exports to the ASEAN group have increased substantially over the last six years to reach $544.9 million f.o.b. (or 4.6 percent of total exports) in the trade year 1986-87. The major imports from ASEAN countries are petroleum products. New Zealand's trade relations with ASEAN are governed by the ASEAN/New Zealand Joint Trade Study Group which meets periodically to review trade developments. New Zealand also continues to place a strong emphasis on bilateral relations with each individual country and has a trade agreement with each ASEAN member (except Singapore, with which New Zealand has a Scientific, Industrial and Technological Agreement, and Brunei).
Under the terms of the trade agreement between Malaysia and New Zealand both countries agree to grant tariff bindings and/or margins of preference to each other for a limited range of goods of trade interest.
Since the New Zealand High Commission in New Delhi was re-opened in 1984, New Zealand's trade relations with India have improved significantly. A major step was taken when a trade agreement was signed in 1986, and the first meeting of the India-New Zealand Joint Trade Committee was held in June 1987.
For the year ended 30 June 1987, merchandise trade between New Zealand and the Republic of Korea reached $423.1 million, almost double the figure for the previous year. Korea was New Zealand's eighth largest export market, accounting for exports worth $249.1 million. This represents an increase of 60 percent over the previous year's total, and 17 percent more than the previous highest total of $209.3 million recorded in 1984-85. Wool, hides, skins and aluminium ingots were the main contributors to the increase, but other commodities also registered good growth. The principle export earner was wool which increased by 69 percent to reach its highest ever level of $60.5 million. Hides and skins showed the most significant growth (219 percent to $57.2 million) while aluminium ingots more than doubled to $26.2 million. Notable value increases were also recorded for fish and caseins. New Zealand and Korea signed a trade agreement in April 1978, which superseded a 1967 agreement.
Trade between New Zealand and China has witnessed significant expansion since the normalisation of relations between the two countries in 1972, and the signing of a trade agreement in 1973. New Zealand exports to China increased from $1.7 million in 1971-72 to $425 million in 1986-87. In 1987 China ranked as New Zealand's fifth largest export market. During this year China became the single largest buyer of New Zealand wool ($284 million f.o.b). By value, other leading exports were aluminium, pulp and paper, dairy products, iron and steel, tallow and sausage casings. China's total exports to New Zealand have increased at a slower rate and reached $96.5 million in 1986-87. A 50000 tonne shipment of crude oil contributed $8.5 million to this figure, and underscored the potential of such bulk products to expand China's trade figures.
The Government has identified agriculture/horticulture, forestry, and science and technology as high priority areas and has developed strategies to further enhance the Government's ability to support New Zealand exporters in these fields. New Zealand has participated in livestock and pasture development projects in China and is examining a range of forestry possibilities. Prospects for co-operative manufacturing ventures in light industry have already been realised in some cases, with several joint ventures in place and others in the pipeline. As China's economy continues its strong growth, bilateral trade can be expected to increase further. A joint trade commission meets annually to review developments in bilateral trade.
In the 1986-87 trade year, Japan was New Zealand's largest country export market and largest source of imports. Two-way merchandise trade totalled $4,049 million, making Japan New Zealand's single largest trading partner. The principal export earner was unwrought aluminium ($378 million), while fish showed the most significant growth (72 percent to $290.5 million). Other major exports were dairy products, fresh fruit and vegetables, wool, meat and iron ore. Efforts continue to be made to improve access conditions for New Zealand exports. Japan has committed itself to an ongoing programme of import liberalisation, but this has only a limited effect on New Zealand exports so far. New Zealand and Japan continue to pursue a closer trade and economic relationship. Regular consultations are held between the two governments at ministerial and official level. Close contacts are also maintained between the business communities of both countries.
The United States was New Zealand's second largest country export market in the 1986-87 trade year, when total exports reached $1,976 million, an increase of 20.0 percent compared with $1,646 million in the previous year. The United States is New Zealand's largest market for beef, veal, and casein, and a major market for fish and cheese. Other important exports to the United States in 1986-87 were fruit and vegetables (mainly kiwifruit and apples), hides and skins, wool, lamb, and manufactured products—textiles, iron and steel, metal and industrial products, furniture and apparel.
There are a number of restraints imposed on New Zealand's agricultural-based exports to the United States. The Meat Import Act 1979 sets an annual limit on imports of beef and veal using a counter-cyclical formula which increases the level of permissible imports when United States domestic production is low, and vice versa. After three years of unrestricted access, ‘voluntary’ restraints were imposed for the last few months of 1987, but lifted again in 1988. Since the 1950s an array of import quota controls have been applied to dairy products, especially butter, cheese and milk powder. These controls have severely limited New Zealand's ability to expand its sales of dairy products to the United States. However, with the loss of the traditional British market, the United States is New Zealand's largest cheese market in value and, after Japan, the second largest market in volume terms.
Canada is New Zealand's eleventh largest export market, taking total exports of $199 million in 1986-87. Beef and veal were the main exports to Canada, followed by lamb, sausage casings, metal manufactures, fruit and vegetables, wool, cheese, leather goods and fish.
The Canadian Meat Import Act of 1981 permits the Canadian Government to restrict beef imports. Quotas were imposed for the first time in 1985 to restrain European Community exports, with New Zealand exports being subject to a quota of 63.4 million pounds, which did not limit New Zealand shipments. Quotas were not imposed in 1986 or 1987.
In 1981 a Trade and Economic Co-operation Agreement (TEC) was signed between the Governments of New Zealand and Canada. The agreement came into force in 1982 and replaced the 1932 trade agreement and the 1970 amending protocol, as well as the 1973 interim preferences agreement.
The objective of the TEC agreement is the promotion of economic co-operation in its broadest sense. The preferential tariff rates applicable under the previous agreement were retained, but the obligation by both countries to maintain specified minimum margins of preference between these rates and the normal rates no longer applied in the new TEC agreement.
Apart from the obligations on preferential rates, both countries undertake to consult prior to making any adverse changes to tariffs or promulgating new, or extending, existing non-tariff measures. If either country were to make a major change in its import regime on an item of active trade interest to the other, the agreement provides for the affected country to seek equivalent compensation in another product. Both countries have extended to each other certain specific undertakings on agricultural, horticultural and fishery products. The agreement also contains an agreed definition on rules of origin, and guidelines for action on dumped or subsidised goods. The agreement also calls for increased co-operation in promoting commercial contacts, investment, joint ventures, technology transfer and trade in services.
Brazil, Peru and Venezuela have become useful markets for New Zealand, particularly for dairy products. Total New Zealand exports to these countries in 1986-87 were $86.5 million to Brazil, $82.5 million to Peru, and $65.2 million to Venezuela. A New Zealand/Mexico Scientific and Technical Agreement (STC) was signed with Mexico in 1983, and in 1986 Memoranda of Understanding on Trade were signed with Brazil and Equador.
New Zealand and the European Community (EC) have a strong trading relationship, involving not only direct bilateral trade but also shared interests in the international trading system. The community of 12 member states (including Spain and Portugal) is New Zealand's largest single trading partner, accounting for 22 percent of New Zealand's exports and 23 percent of imports for the year ended June 1987. In addition the United Kingdom, Federal Republic of Germany, Italy, and France figure individually among New Zealand's top 10 export markets (ranked fourth, sixth, seventh and ninth respectively in 1987).
Trade in visible goods between New Zealand and the EC in 1986-87 showed a balance in New Zealand's favour of NZ$30 million. When invisibles are included, the balance is overwhelmingly in the favour of the community.
New Zealand's total exports to the EC increased 28 percent in 1986-87. The level of trade between New Zealand and the EC has been increasing steadily over the last decade despite barriers to exports, including substantial reduction in access for our butter to the United Kingdom since its entry to the community and EC restrictions on imports of agricultural products generally.
New Zealand's principal exports to the community are wool, lamb, butter, apples, kiwifruit, leather, hides and skins. Sales of manufactured items are also increasing. Special terms of access to the community market have been negotiated for butter and sheepmeat.
Under Protocol 18 of the Treaty of Accession negotiated at the time of British entry to the EC, New Zealand was provided with access to the British market for specified quantities of butter for an initial period of five years.
Successive negotiations secured access for decreasing amounts of butter until 1986. In 1986 the community's Council of Ministers granted further access for 1987 and 1988 of 76500 and 74500 tonnes respectively. Post-1988 access is to be based on fixed returns for New Zealand, while volumes will reduce. New Zealand's sheepmeat trade with the community is limited by a Voluntary Restraint Agreement, whereby New Zealand has undertaken to limit exports of sheepmeat to the community to 245500 tonnes annually in return for a reduction in the EC import tariff (from 20 to 10 percent).
Imports from the community cover a wide range of agricultural items (particularly cheese and processed foods), industrial goods and componentry, plant and transport equipment, pharmaceuticals and sophisticated consumer items.
Outside the direct trading relationship, New Zealand and the European Community, as the world's two largest exporters of dairy products, co-operate both bilaterally and in the context of the GATT's International Dairy Arrangement to maintain satisfactory world prices and secure the stability of markets. An important objective of this co-operation is to ensure that the large subsidised surplus stocks of butter within the community do not serve to disrupt the normal, commercial trade undertaken by New Zealand and other exporters.
The United Kingdom, although no longer New Zealand's predominant trading partner, remains an important market for exports. In 1950 the United Kingdom took 66 percent of New Zealand's exports but by the year ended June 1987 its share had fallen to 9 percent, reflecting New Zealand's efforts to diversify export markets and products following British entry to the European Community. The United Kingdom remains New Zealand's largest market for butter, wool, and lamb (although for lamb it was surpassed by Iran in both 1983-84 and 1984-85).
New Zealand's exports to the region largely reflect the Eastern European need to meet occasional shortfalls in domestic production of food (dairy products and mutton), and the requirement for raw materials for manufacturing (wool, tallow, and hides). This fluctuating demand is seen in the statistics for total exports to Eastern European countries (other than the Soviet Union) the last three trade years: 1984-85 $62.9 million, 1985-86 $33.1 million, 1986-87 $68.9 million (f.o.b). Emphasis is being placed on diversification from the narrow range of traditional exports, and newer products exported to Eastern Europe include breeding sheep, seeds, milking equipment, animal identification ear tags, and pharmaceutical raw materials.
New Zealand imports from Eastern Europe in the same period have been more stable: 1984-85 $21.8 million, 1985-86 $16.1 million, and 1986-87 $18.2 million (c.i.f). Goods imported were chemicals, machinery, textiles, glassware, fertilisers, rail and motor vehicles.
The Soviet Union was New Zealand's tenth largest export market in 1986-87. Total exports to the U.S.S.R. were $205.1 million (f.o.b) in the 1986-87 trade year, a decline from $241.3 million (f.o.b.) in 1985-86. Meat, dairy products and wool account for almost all of this trade.
New Zealand imports from the U.S.S.R. in the trade year 1986-87 increased to $12.6 million (c.i.f.) from $7.5 million (c.i.f.) the previous year. Goods imported were mainly machine tools, fertiliser, chemicals and motor vehicles.
New Zealand exports to this region increased from $3 million in 1970-71 to a record $766.0 million in 1984-85 but dropped over 1985-86 and 1986-87 to $546.8 million and $482.0 million respectively due to the general downturn in the economies of the countries in the area, which are largely dependent for their revenue upon oil sales. Iran, which took $195.1 million of New Zealand goods in 1986-87, continues to be the largest market in the region; followed by Saudi Arabia ($99.0 million) and Algeria ($27.5 million). Sales of New Zealand lamb to Iran declined from 202500 tonnes in 1985-86 to 112091 tonnes in 1986-87. Total New Zealand imports from the region have decreased, from $526 million in 1980-81 to $281.0 million in 1986-87, mainly as a result of a drop in New Zealand's imports of Middle East oil. In 1986-87, nearly 80 percent of New Zealand's imports from the Middle East came from Saudi Arabia ($222.2 million c.i.f).
New Zealand responded to the recommendation of the United Nations Committee on Trade and Development (UNCTAD) that developed countries introduce ‘Generalised Systems of Preference’ in favour of developing nations, and special developing country rates were incorporated in the customs tariff from 1972.
When New Zealand introduced a revised Generalised System of Preference (GSP) in 1976 the new scheme was based on the negative list concept and significantly increased the GSP coverage granted previously. Every effort was made to keep the list of exceptions to the minimum to give the greatest possible coverage to the scheme.
The revised GSP was based on an intention to maintain, in terms of GSP criteria, specified margins of preference for developing countries up to a level of 20 percent. Since 1976 also special provisions have been made for the duty-free importation of specified handicraft products.
The emergence of some developing countries as newly industrialised or oil rich has necessitated a review of their entitlement to preferential tariff treatment into New Zealand. In 1984 the GSP was reviewed. The result was a policy of country graduation whereby the GSP scheme would no longer apply to those countries whose per capita gross national product (GNP) was over 70 percent of New Zealand's per capita GNP. Since 1985 the policy of country graduation has resulted in 17 countries being graduated from New Zealand's GSP scheme, the most recent being Hong Kong. It was also decided that any country affected by the graduation policy could apply for the reinstatement of LDC (developing country) duty rates for specific tariff items. Several items have since been reinstated, including 105 items for Hong Kong in 1986 and some 34 items for Singapore and Brunei.
Duty-free treatment for least developed countries (LLDCs) was also introduced as a result of the 1984 tariff review. As of 1 January 1988 the list of beneficiaries of the New Zealand GSP scheme includes 142 countries and territories, of which 40 countries are listed as beneficiaries of special tariff treatment as least developed countries. The list also includes Pacific Forum island countries, which also enjoy duty free treatment under non-reciprocal free trade arrangements. From 1 July 1986 the developing country rate is being calculated at 80 percent of the normal tariff rate where new and developing country rates are being created or where normal rates are being reduced. The coverage of the GSP was extended to some additional 50 items (the majority being food items, surface coating preparations or glue products).
Located in the Department of Trade and Industry (until 1 December 1988), this unit was set up in 1977 to help developing country exporters find markets for their products in New Zealand. The assistance is available to 142 countries which are classified as developing countries in the New Zealand customs tariff.
The unit provides information on the New Zealand market for a wide range of products and puts developing country exporters in touch with potential New Zealand buyers. In addition, it assists visiting businessmen and trade missions from developing countries, and helps organise trade exhibitions in New Zealand.
New Zealand is also a party to certain commercial treaties, conventions, and arrangements with countries outside the Commonwealth resulting from direct negotiations with the countries concerned. In practice, some of the earlier arrangements (which generally provided for reciprocal most-favoured-nation tariff treatment) became superseded by New Zealand's accession to the General Agreement on Tariffs and Trade. Trade agreements which are still operative include those with Switzerland (1938 and since extended to Liechtenstein in 1956); the Federal Republic of Germany (1959, amended 1977); Japan (1958, amended 1962); the Union of Soviet Socialist Republics (1963, protocol 1973); the Polish People's Republic (1965); Republic of Korea (1967, amended 1976); People's Republic of Bulgaria (1968); Republic of Philippines (1968, amended 1976); Hungarian People's Republic (1970, revised and superseded 1978); The People's Republic of China (1973); Iran (1974, revised 1985); Socialist Federal Republic of Yugoslavia (1975); Arab Republic of Egypt (1977); German Democratic Republic (1978); Indonesia (1978); the Socialist Republic of Romania (1979); Thailand (1981); the Republic of Iraq (1982); and India (1986).
Table 22.4. TRADE WITH COUNTRIES, YEAR ENDED JUNE 1987
| Country | Total exports f.o.b.* | Imports c.i.f. |
|---|---|---|
*Includes re-exports. †ESCAP member countries. ‡ASEAN member countries. §Includes minor trading partners not shown. ¶From 1 July 1986 Middle East includes Algeria, Morocco, Sudan and Tunisia. | ||
| $(million) | ||
| OECD Countries— | ||
| EC Countries— | ||
| Belgium | 161.5 | 107.9 |
| Denmark | 42.8 | 64.1 |
| France | 226.0 | 210.6 |
| Germany, West | 310.8 | 704.3 |
| Greece | 73.0 | 1.8 |
| Ireland | 21.9 | 39.6 |
| Italy | 301.9 | 265.8 |
| Luxembourg | – | 2.9 |
| Netherlands | 165.5 | 174.3 |
| Portugal | 24.7 | 11.5 |
| Spain | 133.7 | 52.4 |
| United Kingdom | 1,125.1 | 1,157.2 |
| Destination unknown—EC | 49.0 | ... |
| Total | 2,635.8 | 2,792.4 |
| $(million) | ||
| Other OECD countries— | ||
| Australia† | 1,800.9 | 2,128.9 |
| Austria | 13.6 | 43.0 |
| Canada | 198.9 | 260.2 |
| Finland | 7.6 | 34.4 |
| Iceland | 0.8 | 0.6 |
| Japan† | 1,823.1 | 2,411.6 |
| New Zealand (re-imports)† | ... | 57.0 |
| Norway | 6.5 | 17.1 |
| Sweden | 18.8 | 129.6 |
| Switzerland | 29.3 | 128.6 |
| Turkey | 25.8 | 3.6 |
| United States | 1,975.9 | 1,882.2 |
| Yugoslavia | 7.2 | 4.3 |
| Total | 8,544.1 | 9,893.4 |
| China— | ||
| People's Republic† | 425.5 | 96.5 |
| Taiwan | 169.7 | 317.7 |
| Total | 595.2 | 414.2 |
| Asia— | ||
| Bangladesh† | 0.5 | 7.0 |
| Brunei Darussalam† | 0.6 | - - |
| Burma† | 1.0 | 0.2 |
| Hong Kong† | 186.2 | 195.6 |
| India† | 71.5 | 46.3 |
| Indonesia†‡ | 98.9 | 123.1 |
| Korea, Republic of† | 245.0 | 193.9 |
| Macau | 0.2 | 2.2 |
| Malaysia†‡ | 133 | 55.0 |
| Nepal† | 12.1 | 0.1 |
| Pakistan† | 35.2 | 15.8 |
| Philippines†‡ | 94.4 | 31.3 |
| Singapore†‡ | 170.2 | 206.7 |
| Sri Lanka† | 29.4 | 7.2 |
| Thailand†‡ | 48.1 | 37.9 |
| Vietnam† | 1.0 | 0.2 |
| Total§ | 1,128.0 | 922.8 |
| Oceania— | ||
| Cook Islands† | 30.2 | 7.2 |
| Fiji† | 123.1 | 28.1 |
| French Polynesia | 57.0 | 0.3 |
| Kiribati† | 2.2 | 0.1 |
| Nauru† | 1.8 | 18.3 |
| New Caledonia | 26.8 | 0.4 |
| Niue† | 4.1 | 0.3 |
| Papua New Guinea† | 74.4 | 13.9 |
| Samoa† | 28.0 | 9.4 |
| Solomon Islands† | 8.6 | 1.6 |
| Tonga† | 26.1 | 5.3 |
| Tuvalu† | 0.6 | – |
| Vanuatu† | 9.9 | 0.1 |
| Total§ | 393.6 | 85.0 |
| South, Central America and Caribbean— | ||
| Argentina | 6.1 | 24.4 |
| Bahamas | 2.7 | 1.4 |
| Barbados | 11.2 | – |
| Belize | 0.6 | – |
| Bermuda | 5.5 | – |
| Brazil | 86.5 | 30.5 |
| Chile | 19.0 | 4.0 |
| Colombia | 9.0 | 1.0 |
| Cuba | 19.0 | - - |
| Dominican Republic | 18.1 | - - |
| Ecuador | 5.4 | 19.8 |
| El Salvador | 11.5 | - - |
| Grenada | 1.4 | - - |
| Guadeloupe | 4.8 | – |
| Guatemala | 3.1 | 0.7 |
| Haiti | 0.7 | - - |
| Honduras | 0.9 | - - |
| Jamaica | 9.3 | 9.5 |
| Martinique | 1.8 | – |
| Mexico | 31.3 | 24.6 |
| Netherlands Antilles | 1.0 | 1.2 |
| Panama | 6.9 | 0.1 |
| Peru | 82.5 | 0.3 |
| Trinidad and Tobago | 15.7 | 0.2 |
| Uruguay | 3.8 | 0.1 |
| Venezuela | 65.2 | 8.7 |
| Total§ | 417.9 | 127.2 |
| Middle East¶— | ||
| Algeria | 27.5 | – |
| Bahrain | 8.9 | 8.5 |
| Egypt | 24.6 | - - |
| Iran† | 195.1 | 1.1 |
| Iraq | 17.5 | 0.3 |
| Israel | 2.3 | 25.6 |
| Jordan | 18.6 | 3.5 |
| Kuwait | 19.9 | 10.1 |
| Lebanon | 2.3 | - - |
| Libya | 15.2 | – |
| Morocco | 3.0 | 1.5 |
| Oman | 14.7 | – |
| Qatar | 2.4 | 8.2 |
| Saudi Arabia | 99.0 | 222.2 |
| Syria | 3.7 | – |
| Tunisia | 1.0 | - - |
| United Arab Emirates | 23.4 | 0.1 |
| Yemen | 1.3 | – |
| Yemen, Democratic | 1.0 | – |
| Total | 482.0 | 281.0 |
| Eastern Europe— | ||
| Czechoslovakia | 15.2 | 5.4 |
| Germany, East | 0.8 | 1.0 |
| Hungary | 3.6 | 4.0 |
| Poland | 48.0 | 5.4 |
| Romania | 1.4 | 2.3 |
| Soviet Union | 205.1 | 12.6 |
| Total§ | 274.0 | 30.8 |
| Africa— | ||
| Cameroon, Republic of | 0.6 | - - |
| Gabon | 0.5 | – |
| Ghana | – | 6.3 |
| Ivory Coast | - - | 0.8 |
| Kenya | 0.2 | 1.5 |
| Malawi | 1.4 | 2.9 |
| Mauritius | 24.4 | 0.6 |
| Mozambique | 2.5 | 0.2 |
| Niger | 1.7 | – |
| South Africa | 15.0 | 23.5 |
| Swaziland | 0.1 | 0.8 |
| Tanzania | 0.4 | 1.5 |
| Zambia | - - | 0.5 |
| Zimbabwe | 3.4 | 6.3 |
| Total§ | 51.4 | 45.1 |
| Other countries— | ||
| Cyprus | 3.9 | 0.3 |
| Malta | 4.2 | 0.3 |
| Destination unknown (Non EC) | 5.3 | ... |
| Total§ | 13.7 | 0.7 |
| Total, all countries | 11,899.9 | 11,800.2 |
| Bunkering ships or aircraft | 150.9 | ... |
| Passengers' duty-free goods | 33.7 | ... |
| Ships' stores | 22.7 | ... |
| Total, merchandise trade | 12,107.2 | 11,800.2 |
New Zealand's export trade has become more diversified in recent years, as regards both products and markets. The traditional export commodities—dairy products, meat, and wool—remain the backbone of export trade. However, commodities produced by the fishing, forestry, horticultural, and manufacturing industries are of increasing importance.
Meat and meat preparations amounted to 19.3 percent ($2,262.7 million) of New Zealand produce exported. The main countries purchasing beef and veal were the United States ($758.3 million), Canada ($86.3 million) and Japan ($45.3 million). Lamb exports to the United Kingdom amounted to $309.5 million. The next largest customer was Iran ($175.4 million), followed by West Germany ($54.2 million) and Japan ($50.2 million). Lamb exports totalled $952.9 million for the 1986-87 trade year.
Exports of dairy products increased by 2.6 percent ($1,409.9 million) over the 1985-86 figure ($1,374.8 million). Major customers of cheese exports ($276.7 million), were Japan ($63.9 million), the United States ($63.5 million) and the United Kingdom ($34.0 million). Total butter exports amounted to $510.1 million during 1986-87. The United Kingdom purchased $232.5 million of butter. Other main countries were Poland ($42.0 million), Brazil ($39.0 million) and Cuba ($19.0 million).
The value of wool exports increased by 22.3 percent from $1,281.4 million in 1985-86 to $1,566.9 million in 1986-87. The People's Republic of China purchased the largest amount ($284.4 million), with the United Kingdom ($161.0 million), Japan ($150.9 million), the U.S.S.R. ($138.6 million) and Belgium ($80.7 million) following.
The export of fish, including crustaceans and molluscs increased by $207.0 million over the previous year. The 1986-87 value was $731.3 million.
Kiwifruit exports amounted to $432.4 million, 54.0 percent of total fruit and vegetable exports ($800.3 million).
Other significant exports during the 1986-87 trade year were unwrought aluminium ($470.2 million), hides, skins and pelts ($537.8 million), wood pulp ($252.9 million), casein ($205.8 million), sawn coniferous timber ($91.2 million) and newsprint ($88.2 million).
Table 22.5. PRINCIPAL COMMODITIES EXPORTED, 1987
| Commodity (New Zealand produce) | Unit of quantity | Year ended June 1987 | |
|---|---|---|---|
| Quantity | f.o.b. $(000) | ||
| Racehorses | No. | 2648 | 113,646 |
| Beef | tonne | 274958 | 998,294 |
| Lamb— | |||
| Carcasses | tonne (000) | 284 | 509,781 |
| Boneless or cuts | tonne | 133911 | 443,076 |
| Mutton | tonne | 91471 | 141,495 |
| Other meat and edible offals | tonne | 54813 | 125,268 |
| Skim-milk powder | tonne | 155692 | 221,217 |
| Other dried milk and cream | tonne | 191631 | 374,034 |
| Butter | tonne | 220486 | 510,110 |
| Cheese | tonne | 100704 | 276,725 |
| Fish, fresh, chilled or frozen | tonne | 110949 | 457,107 |
| Crayfish, fresh and simply preserved | tonne | 2847 | 108,274 |
| Apples, fresh, whole fruit | tonne | 166091 | 124,398 |
| Kiwifruit, fresh | tonne | 128625 | 432,448 |
| Cattle hides | (000) | 1282 | 92,068 |
| Lamb pelts | (000) | 31241 | 285,569 |
| Sheep pelts | (000) | 10582 | 106,858 |
| Timber and saw-logs | cu. mere | 637152 | 90,847 |
| Wood pulp, mechanical | tonne | 309384 | 130,369 |
| Wood pulp, sulphate, not dissolving grades | tonne | 173932 | 122,578 |
| Wool, greasy | tonne | 103116 | 464,383 |
| Wool, slipe | tonne | 18601 | 78,961 |
| Wool, scoured | tonne | 181358 | 1,023,596 |
| Sausage casings, natural | hank (000) | 9459 | 93,988 |
| Petroleum distillate | litre (000) | 256477 | 57,477 |
| Tallow, inedible | tonne | 124579 | 60,692 |
| Casein | tonne | 53999 | 205,757 |
| Caseinates | tonne | 19690 | 75,373 |
| Newsprint | tonne | 121100 | 88,249 |
| Kraft paper and kraft cardboard | tonne | 72651 | 57,472 |
| Yarn of wool or hair | tonne | 7876 | 102,235 |
| Carpets and carpeting, excluding floor rugs | sq m (000) | 3204 | 81,039 |
| Iron or steel | tonne | 86168 | 69,152 |
| Aluminium, unwrought | tonne | 211521 | 470,156 |
Japan was New Zealand's principal supplier with $2,411.6 million (c.i.f.) worth of goods imported during 1986-87. Australia was the next largest supplier with $2,128.9 million, followed by the United States ($1,882.2 million) and the United Kingdom ($1,157.2 million).
Machinery and transport equipment was the largest single section of commodities imported in the 1986-87 trade year, with a value of $4,653.5 million (c.i.f.). Of this amount, $1,320.6 million was for road vehicle purchases and $595.7 million for electrical machinery, apparatus and appliances.
The second largest group of imports was the manufactured goods classified chiefly by material ($2,315.0 million). Textile yarn, fabrics and made-up articles, etc., amounted to $742.5 million of the total group, and iron and steel imports were valued at $453.1 million.
Imports of mineral fuels, lubricants and related materials came to $761.3 million, or 6.5 percent of total imports. A 10.3 percent increase in imports of chemicals was recorded in 1986-87. Imports in this area went from $1,328.5 million the previous year to $1,464.7 million.
Purchases of crude inedible materials (except fuels) amounted to $430.1 million. Of this, imports of crude fertilisers and crude minerals accounted for $88.3 million while metalliferous ores and metal scrap amounted to $162.2 million.
Other large value commodities imported during 1986-87 were fruit and vegetables ($190.0 million), coffee, tea, cocoa and spices ($102.1 million), live animals ($112.8 million) and beverages ($96.6 million).
Table 22.6. PRINCIPAL COMMODITIES IMPORTED, 1987
| Commodity | Unit of quantity | Year ended June 1987 | |
|---|---|---|---|
| Quantity | v.f.d. $(000) | ||
*Alcohol litre. †Excludes hardboards, softboards, wallpaper, lincrusta, and window transparencies. | |||
| Sugar, not refined | tonne | 173616 | 46,468 |
| Coffee, raw | tonne | 6274 | 35,928 |
| Spirits, liqueurs, and other spirituous beverages over 40 percent proof | al. litre* (000) | 2506 | 40,940 |
| Crude rubber, including synthetic and reclaimed | tonne | 20607 | 33,015 |
| Crude petroleum | tonne (000) | 1599 | 336,729 |
| Kerosene and white spirit (in bulk) | tonne (000) | 293 | 79,025 |
| Distillate fuels | litre (000) | 365091 | 77,437 |
| Aluminium oxide | tonne | 466336 | 147,330 |
| Paper and paperboard† | tonne | 133,789 | 222,968 |
| Textile yarn and thread | tonne | 18351 | 149,393 |
| Cotton fabrics, woven, excl. tyrecord | sq m(000) | 54278 | 126,677 |
| Woven textile fabrics, of synthetic fibres, excl. tyrecord | sq m (000) | 66897 | 143,059 |
| Iron and steel, universals, plates and sheets | tonne | 319584 | 259,620 |
| Iron and steel, tubes, pipes and fittings | tonne | 24988 | 38,472 |
| Copper and copper alloys, excl, foil, powders and flakes | tonne | 18620 | 64,310 |
| Unwrought zinc | tonne | 20403 | 31,451 |
| Internal combustion engines (not aircraft) | no. | 87247 | 62,505 |
| Electric motors | no. | 927 | 32,629 |
| Thermionic, cold cathode, photocathode valves and tubes | no. (000) | 155 | 23,540 |
| Motorcars—assembled | no. | 25012 | 311,226 |
| —unassembled | no. | 64361 | 496,625 |
| Buses, trucks, vans—unassembled | no. | 12570 | 165,018 |
| Aircraft, excl. parts, balloons, airships | no. | 206 | 256,684 |
| Ships and boats excl. those for breaking up (incl. buoys) | no | 7782 | 46,453 |
Table 22.7. TRADE BY STANDARD INTERNATIONAL CLASSIFICATIONS, 1987
| Section and division | Year ended June 1987 | |
|---|---|---|
| Exports of produce f.o.b. | Imports v.f.d. | |
| $(000) | ||
| 0 Food and live animals chiefly for food | ||
| 00 Live animals chiefly for food | 152,958 | 109,142 |
| 01 Meat and meat preparations | 2,262,664 | 11,887 |
| 02 Dairy products and birds' eggs | 1,409,882 | 7,223 |
| 03 Fish, crustaceans, and molluscs, and preparations thereof | 731,282 | 44,068 |
| 04 Cereals and cereal preparations | 65,804 | 30,720 |
| 05 Vegetables and fruit | 800,339 | 150,126 |
| 06 Sugar, sugar preparations, and honey | 31,073 | 62,491 |
| 07 Coffee, tea, cocoa, spices, and manufactures thereof | 29,270 | 94,393 |
| 08 Feeding stuff for animals (not including unmilled cereals) | 83,647 | 10,707 |
| 09 Miscellaneous edible products and preparations | 45,663 | 31,857 |
| Total, section 0 | 5,612,582 | 552,615 |
| 1 Beverages and tobacco | ||
| 11 Beverages | 35,284 | 88,017 |
| 12 Tobacco and tobacco manufactures | 7,287 | 25,991 |
| Total, section 1 | 42,571 | 114,008 |
| 2 Crude materials, inedible, except fuels | ||
| 21 Hides, skins, and furskins, raw | 537,786 | 8,712 |
| 22 Oil seeds and oleaginous fruit | 2,715 | 11,803 |
| 23 Crude rubber (including synthetic and reclaimed) | 536 | 33,015 |
| 24 Cork and wood | 137,446 | 28,678 |
| 25 Pulp and waste paper | 258,356 | 16,299 |
| 26 Textile fibres (other than wool tops) and their wastes | 1,579,903 | 28,309 |
| 27 Crude fertilisers and crude minerals other than coal, etc. | 11,202 | 65,347 |
| 28 Metalliferous ores and metal scrap | 44,063 | 148,955 |
| 29 Crude animal and vegetable materials, n.e.s. | 196,581 | 30,167 |
| Total, section 2 | 2,768,588 | 371,284 |
| 3 Mineral fuels, lubricants, and related materials | ||
| 32 Coal, coke, and briquettes | 29,781 | 1,212 |
| 33 Petroleum, petroleum products, and related materials | 75,773 | 686,734 |
| 34 Gas, natural and manufactured | 333 | 114 |
| Total, section 3 | 105,887 | 688,059 |
| 4 Animal and vegetable oils, fats, and waxes | ||
| 41 Animal oils and fats | 66,193 | 949 |
| 42 Fixed vegetable oils and fats | 1,124 | 28,997 |
| 43 Animal and vegetable oils and fats, processed, and waxes of animal or vegetable origin | 528 | 4,895 |
| Total, section 4 | 67,845 | 34,841 |
| 5 Chemicals and related products n.e.s. | ||
| 51 Organic chemicals | 68,936 | 180,548 |
| 52 Inorganic chemicals | 2,404 | 117,130 |
| 53 Dyeing, tanning, and colouring materials | 10,384 | 85,976 |
| 54 Medicinal and pharmaceutical products | 47,648 | 278,350 |
| 55 Essential oils and perfumes, etc. | 58,300 | 73,832 |
| 56 Fertilisers, manufactured | 15,227 | 46,789 |
| 57 Explosives and pyrotechnic products | 707 | 4,157 |
| 58 Artificial resins and plastic materials, and cellulose esters and ethers | 41,435 | 389,499 |
| 59 Chemical materials and products, n.e.s. | 331,734 | 137,415 |
| Total, section 5 | 576,775 | 1,313,696 |
| 6 Manufactured goods classified chiefly by material | ||
| 61 Leather, leather manufactures, n.e.s., and dressed furskins | 185,404 | 24,096 |
| 62 Rubber manufactures, n.e.s. | 27,456 | 96,008 |
| 63 Cork and wood manufactures (excluding furniture) | 104,820 | 22,199 |
| 64 Paper, paperboard, and articles of paper pulp, of paper, or of paperboard | 253,489 | 253,686 |
| 65 Textile yarn, fabrics, made-up articles, n.e.s., and related products | 251,778 | 686,163 |
| 66 Non-metallic mineral manufactures, n.e.s. | 41,587 | 170,271 |
| 67 Iron and steel | 115,549 | 403,785 |
| 68 Non-ferrous metals | 518,363 | 163,976 |
| 69 Manufactures of metal, n.e.s. | 148,334 | 272,746 |
| Total, section 6 | 1,646,780 | 2,092,929 |
| 7 Machinery and transport equipment | ||
| 71 Power generating machinery and equipment | 7,198 | 200,655 |
| 72 Machinery specialised for particular industries | 84,245 | 436,857 |
| 73 Metalworking machinery | 5,496 | 91,411 |
| 74 General industrial machinery and equipment, n.e.s., and machine parts, n.e.s. | 101,843 | 488,824 |
| 75 Office machines and automatic data processing equipment | 5,417 | 554,164 |
| 76 Telecommunications, sound recording and reproducing apparatus and equipment | 34,327 | 462,389 |
| 77 Electrical machinery, apparatus and appliances, n.e.s., and electrical parts thereof | 143,342 | 555,271 |
| 78 Road vehicles (including air-cushion vehicles) | 39,469 | 1,190,545 |
| 79 Other transport equipment | 18,579 | 372,480 |
| Total, section 7 | 439,917 | 4,352,596 |
| 8 Miscellaneous manufactured articles | ||
| 81 Sanitary, plumbing, heating, etc., fixtures and fittings, n.e.s. | 2,864 | 16,173 |
| 82 Furniture and parts thereof | 54,091 | 46,221 |
| 83 Travel goods, handbags, and similar containers | 3,010 | 8,966 |
| 84 Articles of apparel and clothing accessories | 75,919 | 71,333 |
| 85 Footwear | 8,150 | 28,742 |
| 87 Professional, scientific, and controlling instruments and apparatus, n.e.s. | 28,848 | 226,396 |
| 88 Photographic apparatus, optical goods, watches and clocks | 5.542 | 183,514 |
| 89 Miscellaneous manufactured articles, n.e.s. | 183,435 | 544,158 |
| Total, section 8 | 361,860 | 1,125,504 |
| 9 Commodities and transactions not classified elsewhere in the S.I.T.C. | ||
| Total, section 9 | 101,068 | 157,844 |
| Total New Zealand produce exports | 11,723,871 | |
| Re-exports | 383,346 | |
| Grand total, merchandise trade | 12,107,217 | 10,803,376 |
Table 22.8 provides a summary of the Department of Statistics' Export Price Index for the last five years. For a description of the methodology used to compile the following indexes see the last edition of the Yearbook.
Table 22.8. EXPORT PRICE INDEX*
| Year ended 30 June | Butter | Cheese | Dairy products | Meat | Wool | Meat, wool, and by-products | All pastoral and dairy products | Food, live animals, beverages, and tobacco | Manufactured goods other than food | Crude materials other than fuels | All groups |
|---|---|---|---|---|---|---|---|---|---|---|---|
| *Base: Year ended June 1982 (= 1000) | |||||||||||
| 1983 | 1052 | 1134 | 1063 | 1033 | 972 | 1022 | 1036 | 1059 | 1093 | 1015 | 1057 |
| 1984 | 1066 | 1095 | 1023 | 1077 | 1110 | 1105 | 1087 | 1083 | 1216 | 1146 | 1125 |
| 1985 | 1101 | 1331 | 1152 | 1308 | 1418 | 1398 | 1312 | 1278 | 1493 | 1510 | 1376 |
| 1986 | 946 | 1288 | 1037 | 1141 | 1371 | 1280 | 1212 | 1168 | 1418 | 1452 | 1285 |
| 1987 | 884 | 1235 | 1026 | 1171 | 1541 | 1392 | 1288 | 1226 | 1512 | 1658 | 1373 |
In table 22.9 separate series are prepared for December and June years, the latter relating more closely to the farming year.
Table 22.9. EXPORT PRICE INDEX*
| Year | Pastoral and dairy products | All groups | Year | Pastoral and dairy products | All groups |
|---|---|---|---|---|---|
| *Base: Year ended June 1982 (= 1000) | |||||
| December year | |||||
| 1932 | 46 | 45 | 1982 | 1022 | 1032 |
| 1942 | 82 | 79 | 1983 | 1057 | 1090 |
| 1952 | 193 | 185 | 1984 | 1176 | 1232 |
| 1962 | 196 | 189 | 1985 | 1288 | 1349 |
| 1972 | 310 | 294 | 1986 | 1226 | 1315 |
| June year | |||||
| 1932 | 48 | 47 | 1982 | 1000 | 1000 |
| 1942 | 82 | 79 | 1983 | 1036 | 1057 |
| 1952 | 194 | 186 | 1984 | 1087 | 1125 |
| 1962 | 191 | 184 | 1985 | 1312 | 1376 |
| 1972 | 280 | 269 | 1986 | 1212 | 1285 |
Table 22.10. IMPORT PRICE INDEX*
| Year ended 30 June | Petroleum and petroleum products | Textile yarn, fabrics, etc. | Iron and steel | Machinery other than electrical | Electrical machinery and apparatus | Transport equipment | Food, live animals, beverages, and tobacco | Manufactured goods other than food | Crude materials other than fuels | Mineral fuels, lubricants, and related materials | All groups |
|---|---|---|---|---|---|---|---|---|---|---|---|
| *Base: Year ended June 1982 (= 1000) | |||||||||||
| 1983 | 1076 | 1079 | 1053 | 1131 | 1068 | 1084 | 1105 | 1098 | 1085 | 1076 | 1094 |
| 1984 | 1007 | 1158 | 1102 | 1211 | 1097 | 1265 | 1203 | 1188 | 1166 | 1008 | 1155 |
| 1985 | 1263 | 1524 | 1425 | 1481 | 1285 | 1626 | 1523 | 1483 | 1445 | 1264 | 1442 |
| 1986 | 1099 | 1468 | 1289 | 1529 | 1231 | 1674 | 1386 | 1454 | 1310 | 1100 | 1381 |
| 1987 | 719 | 1507 | 1318 | 1642 | 1291 | 2041 | 1324 | 1530 | 1235 | 720 | 1377 |
Table 22.11 shows a longer time series of all groups import prices index numbers on the same expression base for years ended March, June, and December.
The Overseas Terms of Trade Index conceptually provides a measure of the changing level of the volume of imports which can be purchased by a unit quantity of exports. The index is calculated as the ratio of the level of export prices to that of import prices. On expression base: December year 1957 (=100) the formula for calculating the Overseas Terms of Trade Index is: with both price indexes expressed on a common base. The choice of the base year was arbitrarily made at the time and does not indicate that 1957 was a normal or standard year so far as price levels or the terms of trade are concerned.

Table 22.12. IMPORT AND EXPORT PRICE INDEXES AND OVERSEAS TERMS OF TRADE INDEX*
| Year ended June | Import price index | Export price index | Overseas terms of trade index | Quarter ended | Import price index | Export price index | Overseas terms of trade index |
|---|---|---|---|---|---|---|---|
| *Base: Year ended December 1957 (= 100) | |||||||
| 1957 | 100 | 100 | 100 | 1983—31 Mar | 689 | 498 | 72 |
| 1971 | 134 | 112 | 83 | 30 Jun | 717 | 532 | 74 |
| 1972 | 140 | 130 | 93 | 30 Sep | 721 | 535 | 74 |
| 1973 | 147 | 165 | 113 | 31 Dec | 725 | 539 | 74 |
| 1974 | 165 | 185 | 112 | 1984—31 Mar | 724 | 546 | 75 |
| 1975 | 218 | 169 | 78 | 30 Jun | 738 | 549 | 74 |
| 1976 | 288 | 208 | 72 | 30 Sep | 858 | 620 | 72 |
| 1977 | 328 | 258 | 79 | 31 Dec | 921 | 673 | 73 |
| 1978 | 347 | 270 | 78 | 1985—31 Mar | 919 | 680 | 74 |
| 1979 | 364 | 312 | 86 | 30 Jun | 938 | 673 | 72 |
| 1980 | 462 | 379 | 82 | 30 Sep | 906 | 640 | 71 |
| 1981 | 552 | 421 | 76 | 31 Dec | 824 | 603 | 73 |
| 1982 | 629 | 482 | 77 | 1986—31 Mar | 892 | 629 | 71 |
| 1983 | 688 | 510 | 74 | 30 Jun | 849 | 609 | 72 |
| 1984 | 727 | 542 | 75 | 30 Sep | 865 | 635 | 73 |
| 1985 | 907 | 664 | 73 | 31 Dec | 893x | 665 | 74 |
| 1986 | 869 | 620 | 71 | 1987—31 Mar | 866x | 669x | 77 |
| 1987 | 866 | 662 | 76 | 30 Jun | 845 | 680 | 80 |
| 30 Sep | 829 | 666 | 80 | ||||
For the index of the volume of external trade, both the import and the export series are chain-linked series with changing (price) weighting patterns, each year being calculated using the previous year as a base and then linked on.
Table 22.13. EXPORT VOLUME INDEX*
| Year ended 30 June | Butter | Cheese | Dairy products | Meat | Wool | Meat wool, and by-products | All pastoral and dairy products |
|---|---|---|---|---|---|---|---|
| *Base: Year ended June 1982 (= 1000) | |||||||
| 1983 | 1123 | 941 | 1056 | 1158 | 1139 | 1151 | 1124 |
| 1984 | 948 | 1187 | 1035 | 1023 | 1092 | 1054 | 1090 |
| 1985 | 1038 | 1063 | 1077 | 1089 | 1133 | 1116 | 1172 |
| 1986 | 1027 | 1143 | 1156 | 970 | 1024 | 997 | 1133 |
| 1987 | 1035 | 1235 | 1196 | 1235 | 1112 | 1184 | 1296 |
| Year ended 30 June | Food, live animals, beverages, and tobacco | Manufactured goods other than food | Crude materials other than fuels | All groups | |||
| 1983 | 1116 | 971 | 1084 | 1077 | |||
| 1984 | 1108 | 1228 | 1064 | 1129 | |||
| 1985 | 1194 | 1335 | 1101 | 1216 | |||
| 1986 | 1205 | 1297 | 1017 | 1198 | |||
| 1987 | 1371 | 1251 | 1119 | 1299 | |||
Table 22.14. IMPORT VOLUME INDEX*
| Year ended 30 June | Petroleum and petroleum products | Textile yarn, fabrics, etc. | Iron and steel | Machinery other than electrical | Electrical machinery and apparatus | Transport equipment |
|---|---|---|---|---|---|---|
| *Base: Year ended June 1982 (= 1000) | ||||||
| 1983 | 974 | 898 | 840 | 1097 | 1126 | 620 |
| 1984 | 944 | 1039 | 1035 | 1183 | 1386 | 739 |
| 1985 | 967 | 1079 | 1041 | 1249 | 1755 | 849 |
| 1986 | 910 | 956 | 916 | 1264 | 2063 | 849 |
| 1987 | 775 | 1066 | 801 | 1100 | 2371 | 826 |
| Year ended 30 June | Food, live animals, beverages, and tobacco | Manufactured goods other than food | Crude materials other than fuels | Mineral fuels, lubricants, and related materials | All groups | |
| 1983 | 814 | 901 | 950 | 973 | 914 | |
| 1984 | 904 | 1041 | 1106 | 943 | 1027 | |
| 1985 | 994 | 1161 | 1114 | 966 | 1137 | |
| 1986 | 951 | 1144 | 1003 | 909 | 1093 | |
| 1987 | 1208 | 1193 | 908 | 774 | 1126 | |
22.1 Department of Trade and Industry; Customs Department; Department of Statistics.
22.2 Department of Trade and Industry; Department of Statistics.
22.3-22.4 Department of Statistics.
Customs Tariff of New Zealand. Customs Department.
Export News. Department of Trade and Industry (monthly).
Exports. Department of Statistics (annual).
Imports. Department of Statistics (annual).
International Coffee Agreement, 1976 (Parl. paper A. 171979).
International Sugar Agreement, 1977 (Parl. paper A. 501979).
Monthly Abstract of Statistics. Department of Statistics.
New Zealand Standard Classifications. Department of Statistics.
New Zealand Harmonised System Classification.
New Zealand Standard Classification by Broad Economic Categories.
New Zealand Standard Trade Classification.
New Zealand Standard Country Codes (NZSCC).
Report and Analysis of External Trade. Department of Statistics (annual).
Report of the Customs Department (Parl. paper B. 24).
Report of the Department of Trade and Industry (Parl. paper G. 14).
Report of the Ministry of Foreign Affairs (Parl. paper A. 1).
Shipping and Cargo Statistics. Department of Statistics (annual).
Trade agreements with individual countries are published as parliamentary papers in the ‘A’ series.
Table of Contents
Prices of a large number of goods and services are collected periodically by the Department of Statistics to compile price indexes. These cover external trade (imports, exports), household expenditure (retail prices), farming inputs, capital expenditure, and producer prices (input and output prices).
Price indexes are constructed from prices weighted to reflect the importance of each ratio to the sector as a whole. Changes in the importance of individual items to a sector require periodic revisions of weights.
Table 23.1. PRICE INDEXES SUMMARY*
| December year | Producers Price Index all industries inputs | Consumers Price Index | Export Price Index | Import Price Index | |
|---|---|---|---|---|---|
| Food | All groups | ||||
* Base: December quarter 1983 (= 1000) | |||||
| 1951 | .. | 109 | 105 | 206 | 126 |
| 1961 | .. | 151 | 149 | 165 | 136 |
| 1971 | .. | 231 | 233 | 218 | 190 |
| 1976 | .. | 393 | 402 | 433 | 429 |
| 1977 | .. | 460 | 460 | 497 | 471 |
| 1978 | 482 | 509 | 515 | 529 | 490 |
| 1979 | 568 | 597 | 585 | 640 | 553 |
| 1980 | 697 | 719 | 686 | 740 | 714 |
| 1981 | 814 | 840 | 791 | 835 | 816 |
| 1982 | 938 | 944 | 919 | 923 | 907 |
| 1983 | 988 | 982 | 987 | 975 | 984 |
| 1984 | 1059 | 1039 | 1047 | 1102 | 1122 |
| 1985 | 1222 | 1192 | 1209 | 1207 | 1238 |
| 1986 | 1292 | 1328 | 1369 | 1176 | 1207 |
| 1987 | 1394 | 1504 | 1584 | 1246 | 1152 |
The average level of consumer prices rose by 15.7 percent between the 1986 and 1987 calendar years, compared with a rise of 13.2 percent between the corresponding 1985 and 1986 years. Although price increases were recorded in all groups of the Consumer Price Index, the major contributions to the latest increase came from the following subgroups: private transport; home ownership; tobacco and alcoholic drinks; food, other than fruit, vegetables; meat, fish and poultry; other services (e.g., health and personal services); and household furnishings.
The Consumers Price Index (CPI) measures changes in the general level of the prices of the goods and services which households purchase. It is the best available measure of the effect of changes in retail prices on the average household budget. Index series of retail prices have a long history in New Zealand, starting with a food and rent index for the four main centres from 1891, and increasing in comprehensiveness as to both commodity and geographical coverage over successive years since then.
The basic objective of the Consumers Price Index is to provide a multi-purpose indicator of retail price changes of those goods and services purchased by New Zealanders. The weights in the Consumers Price Index are based on the pattern of expenditure of the population and, over the full period for which the Consumers Price Index has been compiled, this has shown considerable alterations. Analysis of any long-term series must involve consideration of the effects of such changes in the pattern of expenditure.
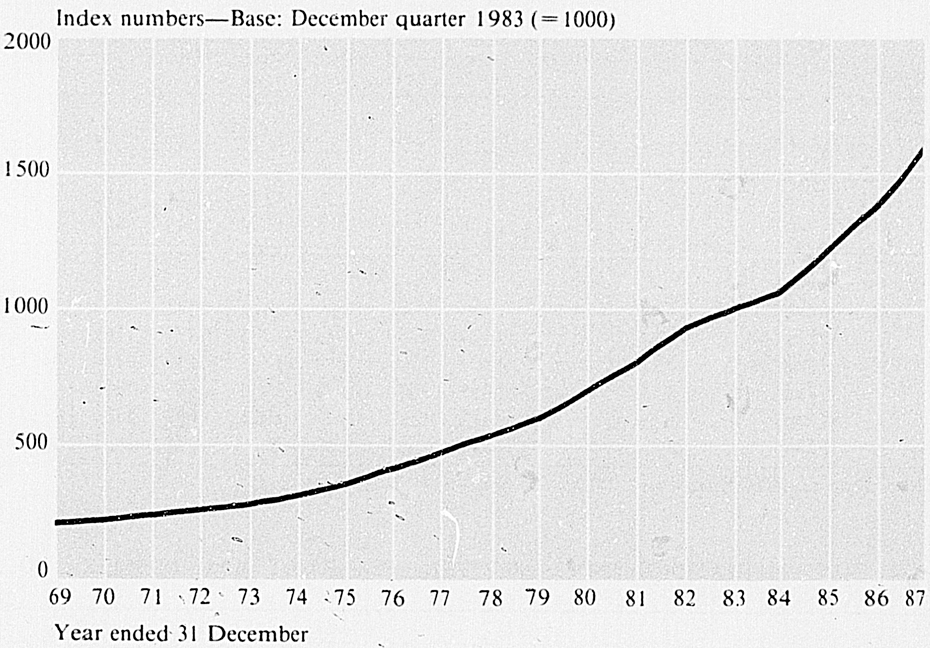
CONSUMERS PRICE INDEX—all groups annual average
Table 23.2 shows all-groups index numbers of individual groups and sub-groups for 25 urban areas combined. The group and sub-group weights are also shown as percentages of base expenditure.
Table 23.2. CONSUMERS PRICE INDEX—ALL GROUPS—25 URBAN AREAS COMBINED
| Period | Food | Housing | Household operation | Apparel | Transportation | Miscellaneous | All groups |
|---|---|---|---|---|---|---|---|
*Base: Weighted average 25 urban areas, December quarter 1983 (= 1000). | |||||||
| Groups— | |||||||
| Percentage of base expenditure | 18.35 | 21.00 | 16.00 | 6.37 | 18.22 | 20.06 | 100.00 |
| December year annual average— | |||||||
| 1985 | 1192 | 1238 | 1153 | 1140 | 1258 | 1216 | 1209 |
| 1986 | 1328 | 1441 | 1324 | 1293 | 1352 | 1406 | 1369 |
| 1987 | 1504 | 1701 | 1519 | 1503 | 1506 | 1685 | 1584 |
| Quarter ended— | |||||||
| 1986—30 Sep | 1306 | 1439 | 1332 | 1283 | 1352 | 1424 | 1369 |
| 31 Dec | 1462 | 1533 | 1452 | 1406 | 1430 | 1588 | 1491 |
| 1987—31 Mar | 1469 | 1608 | 1476 | 1423 | 1461 | 1625 | 1526 |
| 30 Jun | 1502 | 1669 | 1524 | 1514 | 1511 | 1668 | 1576 |
| 30 Sep | 1519 | 1724 | 1538 | 1523 | 1506 | 1708 | 1601 |
| 31 Dec | 1529 | 1804 | 1537 | 1550 | 1546 | 1739 | 1634 |
Table 23.3. CONSUMERS PRICE INDEX—FOOD AND HOUSING—25 URBAN AREAS COMBINED*
| Period | Food | Housing | Household operation | |||||
|---|---|---|---|---|---|---|---|---|
| Fruit and vegetables | Meat, fish, and poultry | Other food | Rentals | Home ownership | Fuel and light | Furnishings | Supplies and services | |
*Base: Weighted average 25 urban areas, December quarter 1983 (= 1000). | ||||||||
| Subgroups— | ||||||||
| Percentage of base expenditure | 2.70 | 4.53 | 11.11 | 3.17 | 17.83 | 2.43 | 8.51 | 5.06 |
| December year annual average— | ||||||||
| 1985 | 1121 | 1121 | 1238 | 1375 | 1214 | 1210 | 1160 | 1114 |
| 1986 | 1298 | 1148 | 1408 | 1649 | 1403 | 1418 | 1294 | 1330 |
| 1987 | 1398 | 1316 | 1607 | 1893 | 1667 | 1688 | 1447 | 1558 |
| Quarter ended— | ||||||||
| 1986—30 Sep | 1287 | 1089 | 1399 | 1675 | 1398 | 1417 | 1293 | 1357 |
| 31 Dec | 1434 | 1280 | 1544 | 1735 | 1497 | 1562 | 1403 | 1483 |
| 1987—31 Mar | 1364 | 1292 | 1566 | 1787 | 1576 | 1574 | 1422 | 1519 |
| 30 Jun | 1459 | 1306 | 1593 | 1834 | 1639 | 1728 | 1451 | 1548 |
| 30 Sep | 1428 | 1324 | 1620 | 1923 | 1689 | 1732 | 1460 | 1577 |
| 31 Dec | 1342 | 1341 | 1650 | 2029 | 1764 | 1721 | 1455 | 1587 |
Table 23.4. CONSUMERS PRICE INDEX—APPAREL, TRANSPORT AND MISCELLANEOUS—25 URBAN AREAS COMBINED*
| Period | Apparel | Transportation | Miscellaneous | ||||
|---|---|---|---|---|---|---|---|
| Clothing | Footwear | Public transport | Private transport | Tobacco and alcohol | Other supplies | Other services | |
Base: Weighted average 25 urban areas, December quarter 1983 (= 1000) | |||||||
| Subgroups— | |||||||
| Percentage of base expenditure | 5.12 | 1.25 | 3.07 | 15.15 | 9.31 | 5.61 | 5.15 |
| December year annual average— | |||||||
| 1985 | 1141 | 1136 | 1142 | 1282 | 1239 | 1180 | 1214 |
| 1986 | 1296 | 1278 | 1270 | 1368 | 1418 | 1334 | 1462 |
| 1987 | 1519 | 1436 | 1206 | 1567 | 1722 | 1523 | 1794 |
| Quarter ended— | |||||||
| 1986—30 Sep | 1287 | 1269 | 1290 | 1364 | 1450 | 1338 | 1469 |
| 31 Dec | 1413 | 1375 | 1325 | 1451 | 1637 | 1448 | 1651 |
| 1987—31 Mar | 1431 | 1389 | 1212 | 1512 | 1659 | 1488 | 1712 |
| 30 Jun | 1533 | 1439 | 1245 | 1565 | 1698 | 1518 | 1775 |
| 30 Sep | 1542 | 1444 | 1192 | 1569 | 1748 | 1543 | 1817 |
| 31 Dec | 1569 | 1473 | 1174 | 1621 | 1784 | 1543 | 1869 |
Table 23.5 shows changes in price levels between urban areas. The indexes from which the percentage changes have been calculated are designed on the assumption that expenditure patterns are the same in each urban area. In reality, completely identical purchase patterns, goods, services and shops do not occur. The indexes, therefore, aim at pricing the same goods and services at the same stores each period, rather than attempting consistency between urban areas. The differences in the samples between urban areas prevents comparisons of price levels.
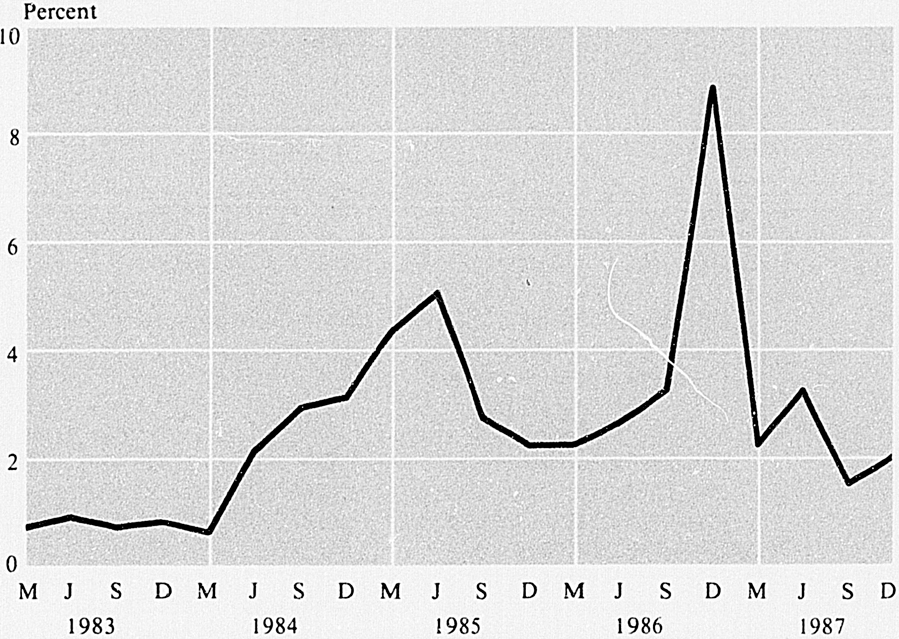
CONSUMERS PRICE INDEX—percentage change by quarter
Table 23.5. CONSUMERS PRICE INDEX—PERCENTAGE MOVEMENTS 1986 TO
1987,
INDIVIDUAL URBAN AREAS AND
GROUPINGS OF URBAN AREAS
| Urban area | Calendar year annual average | ||||||
|---|---|---|---|---|---|---|---|
| Food | Housing | Household operation | Apparel | Transportation | Miscellaneous | All groups | |
*Includes six smaller urban areas, viz Whakatane, Taupo, Hawera, Blenheim, Ashburton and Gore. | |||||||
| Auckland | 14.1 | 17.5 | 14.9 | 17.1 | 11.5 | 20.2 | 16.0 |
| Hamilton | 12.4 | 18.3 | 13.6 | 17.5 | 11.2 | 20.7 | 15.6 |
| Napier-Hasting | 12.8 | 17.7 | 16.5 | 18.2 | 10.3 | 19.0 | 15.7 |
| Palmerston North | 13.1 | 19.1 | 14.2 | 16.6 | 9.7 | 20.4 | 15.7 |
| Wellington-Hutt Valley | 13.8 | 18.9 | 16.0 | 16.8 | 12.2 | 20.8 | 16.6 |
| Christchurch | 12.2 | 18.3 | 14.1 | 13.4 | 12.0 | 19.7 | 15.4 |
| Dunedin | 13.1 | 18.0 | 12.6 | 14.3 | 11.2 | 19.0 | 15.0 |
| Seven main urban areas | 13.4 | 18.1 | 14.7 | 16.3 | 11.4 | 20.1 | 15.8 |
| Whangarei | 13.8 | 17.7 | 14.9 | 17.3 | 12.2 | 19.8 | 15.8 |
| Tauranga | 13.6 | 18.3 | 15.2 | 15.7 | 11.8 | 20.1 | 16.0 |
| Rotorua | 12.4 | 17.4 | 14.7 | 14.0 | 12.1 | 20.3 | 15.5 |
| Tokoroa | 13.3 | 18.3 | 13.8 | 15.7 | 11.7 | 21.4 | 15.9 |
| Gisborne | 13.7 | 18.1 | 14.5 | 14.9 | 10.1 | 19.0 | 15.2 |
| New Plymouth | 13.1 | 17.9 | 14.9 | 15.5 | 9.5 | 18.7 | 15.1 |
| Wanganui | 13.5 | 18.0 | 16.5 | 17.9 | 9.8 | 19.1 | 15.7 |
| Masterton | 12.7 | 18.4 | 13.9 | 17.0 | 12.0 | 19.1 | 15.7 |
| Nelson | 14.1 | 18.5 | 15.3 | 15.1 | 11.6 | 18.1 | 15.7 |
| Greymouth | 11.6 | 18.3 | 13.4 | 16.7 | 11.7 | 19.3 | 15.2 |
| Timaru | 13.5 | 18.4 | 13.1 | 15.8 | 11.2 | 19.4 | 15.4 |
| Invercargill | 12.3 | 18.2 | 14.6 | 17.3 | 11.2 | 18.4 | 15.4 |
| 12 secondary urban areas | 13.2 | 18.1 | 14.5 | 16.2 | 11.3 | 19.4 | 15.7 |
| 25 urban areas combined* | 13.3 | 18.0 | 14.7 | 16.2 | 11.4 | 19.8 | 15.7 |
The salient features of the Consumers Price Index may be summarised as follows:
The basic formula used is that of Laspeyres in its aggregative form. (See glossary under ‘indexes’.)
The number of published regimen items excluding fresh fruit and vegetables is 390.
The sources of group and commodity weights are the average expenditure per household from the Household Expenditure and Income Survey, supplemented by cross-checks from other statistical sources. Where considered appropriate, the base weights assigned to selected items represent expenditure on kindred items not selected for pricing.
Prices are surveyed, in the main, by statistical interviewers in 25 urban areas. For some items, including rentals, postal surveys are conducted. Property and some additional prices are obtained from other government departments.
The prices surveyed after 1 October 1986 include payments for goods and services tax (GST). For those commodities which are not subject to GST (e.g., dwelling rentals, mortgage interest, previously occupied housing) the prices will embody elements of GST incurred in the cost of production. This treatment is consistent with the legislation which precludes household consumers from recovering GST from their non-business-related, final consumption expenditure.
Individual index numbers are compiled for the all food and the food subgroups at monthly intervals, and for all other groups and subgroups at quarterly intervals.
Index numbers are published for seven main urban areas and 12 secondary urban areas individually. Combined index numbers are also published for each of these two groupings and for all urban areas combined. Each urban area and grouping of urban areas is published on its own base.
Expenditures on the following items are, for various reasons, excluded: direct taxation; purchases of shares, bonds or debentures; payments to superannuation funds and the like; savings; collectors' items; gambling; court fines; legal expenses for traffic cases, criminal and civil cases, estates, family settlements, divorces, adoptions, etc.; charitable and church donations; wages of domestic servants, home aids, home nurses, jobbing gardeners, etc.; catering and other service charges for private receptions; training, racing and stabling fees for race or trotting horses; purchase, boarding and breeding charges for animals; grazing fees and fees for pony clubs; overseas holidays (other than airfares); baby-sitting fees; life insurances other than those directly related to mortgage repayments; and interest charges on revolving credit schemes such as charge accounts and credit cards.
Full details on index methodology and changes between successive revisions are given in the publications listed at the end of this chapter.
Revision of the Consumers Price Index is normally carried out every three years, but this may vary to take into account changes in the pattern of expenditure. To this end, major reviews occurred in 1965, 1974, 1977, 1980 and 1983. At the time of going to press work had begun on a major revision of the index to assess changes in spending patterns as a result of the introduction of goods and services tax in 1986.
Table 23.6 provides a comparison of consumer price indexes of selected countries. Comparisons may be drawn between the movements in price levels experienced by domestic consumers in each country. The indexes do not convey any information about the relative price levels existing in each country. Indexes published by each country have been converted to a common base of December quarter 1980 (= 1000).
Table 23.6. INTERNATIONAL COMPARISON OF CONSUMER PRICE INDEXES*
| Year | New Zealand | Australia | Canada | France (Paris) | Japan | United Kingdom | United States |
|---|---|---|---|---|---|---|---|
*Base: December quarter 1980 (= 1000). | |||||||
| 1983 | 1364 | 1301 | 1264 | 1323 | 1073 | 1223 | 1160 |
| 1984 | 1447 | 1351 | 1319 | 1422 | 1098 | 1284 | 1200 |
| 1985 | 1671 | 1443 | 1372 | 1505 | 1120 | 1363x | 1242x |
| 1986 | 1892 | 1574 | 1428 | 1539 | 1126 | 1409 | 1261 |
| 1987 | 2189 | 1707 | 1491 | 1591 | 1128 | 1467 | 1307 |
In table 23.7 food prices are for the months of December 1986 and December 1987. Prices other than food shown in table 23.7 are averages prevailing in the calendar quarter. These weighted average prices of selected items are used in the calculation of the CPI and provide a reliable indicator of relative movements in price levels when compared with average prices for earlier periods. They are not designed to give a statistically accurate measure of absolute average transaction prices at the stated time. Item specifications can also differ between urban areas and over time, and this adds to the variability of the weighted average price data when used to measure changes at item price levels.
Table 23.7. RETAIL PRICES OF SELECTED FOOD ITEMS
| Commodity | Unit | Price | Annual percentage change | |
|---|---|---|---|---|
| Dec 1986 | Dec 1987 | |||
| $ | $ | % | ||
| Apples, eating | kg 2.70 | 2.82 | 4.4 | |
| Bananas | kg | 2.26 | 2.33 | 3.1 |
| Oranges | kg | 1.84 | 1.97 | 7.1 |
| Cabbage | kg | 0.82 | 0.59 | -28.0 |
| Carrots | kg | 2.01 | 1.50 | -25.4 |
| Onions | kg | 1.61 | 1.37 | -14.9 |
| Potatoes | kg | 1.08 | 0.81 | -25.0 |
| Peaches, canned | 425 g tin | 1.39 | 1.45 | 4.3 |
| Peas, green frozen | 1 kg pkt | 2.38 | 2.54 | 6.7 |
| Beef, blade steak | kg | 7.13 | 7.01 | -1.7 |
| corned silverside | kg | 6.94 | 6.94 | - |
| prime rib rolled | kg | 5.80 | 5.80 | - |
| porterhouse steak | kg | 10.22 | 10.13 | -0.9 |
| rump steak | kg | 8.83 | 8.73 | -1.1 |
| Hogget, cut leg, | ||||
| knuckle end | kg | 4.38 | 4.19 | -4.3 |
| forequarter | kg | 2.82 | 2.74 | -2.8 |
| Lamb, leg, whole | kg | 4.81 | 4.65 | -3.3 |
| Pork, cut leg, knuckle end | kg | 8.01 | 8.35 | 4.2 |
| Pork, loin chops | kg | 8.54 | 8.96 | 4.9 |
| Bacon, middle rashers | kg | 13.85 | 14.60 | 5.4 |
| Mince | kg | 4.88 | 4.76 | -2.5 |
| Ham, cooked, pressed, sliced | kg | 15.11 | 16.05 | 6.2 |
| Sausages | kg | 3.27 | 3.47 | 6.1 |
| Fish, sole or flounder, wet | kg | 6.42 | 7.24 | 12.8 |
| fresh, filleted—e.g., tarakihi/groper | kg | 13.75 | 15.54 | 13.0 |
| Salmon, canned | 220 g | 2.54 | 2.98 | 17.3 |
| Chicken, deep frozen | No. 6 (Med) | 6.15 | 6.49 | 5.5 |
| Eggs, min. 636 g/dozen | dozen | 2.23 | 2.45 | 9.9 |
| Butter | 500 g | 1.62 | 1.65 | 1.9 |
| Cheese, mild cheddar | kg | 5.54 | 5.72 | 3.2 |
| Milk, delivered | 600 ml | 0.45 | 0.47 | 4.4 |
| Milk powder, full cream | 400 g tin | 2.87 | 3.21 | 11.8 |
| Biscuits, chocolate wheaten | 200 g | 1.47 | 1.55 | 5.4 |
| Bread, sliced, wrapped | 750 g | 1.22 | 1.29 | 5.7 |
| Cake, block, light fruit | 500 g | 3.48 | 3.65 | 4.9 |
| Oatmeal, fine porridge | 1.4 kg | 2.74 | 2.91 | 6.2 |
| Flour, white | 1.5 kg | 1.52 | 1.47 | -3.3 |
| Rice, long grain | 500 g | 0.71 | 0.70 | -1.4 |
| Breakfast flake biscuits | 750 g | 2.40 | 2.62 | 9.2 |
| Honey | 500 g ctn | 2.03 | 1.96 | -3.4 |
| Jam, apricot | 400 g tin | 1.64 | 1.71 | 4.3 |
| Coffee, instant | 100 g jar | 4.68 | 4.54 | -3.0 |
| Tea | 250 g | 2.19 | 2.14 | -2.3 |
| Margarine, table | 500 g | 1.86 | 1.86 | - |
| Cooking oil, vegetable | 500 ml | 2.27 | 1.83 | -19.4 |
| Salt, iodised | 2 kg bag | 1.18 | 1.29 | 9.3 |
| Spaghetti in tomato sauce | 440 g tin | 1.25 | 1.26 | 0.8 |
| Soup, tomato | 450 g tin | 1.21 | 1.29 | 6.6 |
| Sugar, white | 1.5 kg pkt | 1.43 | 1.61 | 12.6 |
| Aerated waters incl. bottle | 1.25 litre | 1.85 | 1.85 | - |
| Ice cream, vanilla | 2 litre | 3.07 | 3.38 | 10.1 |
| Chocolate, block | 150 g | 2.01 | 2.15 | 7.0 |
| Meals, grill, steak and chips | each | 10.40 | 11.24 | 8.1 |
| Meals, coffee and 2 sandwiches | each | 2.46 | 2.65 | 7.7 |
| Takeaways, chicken, hot snack | box | 3.62 | 4.02 | 11.0 |
| Takeaways, hamburger, hot | each | 1.96 | 2.05 | 4.6 |
Table 23.8. RETAIL PRICES OF SELECTED ITEMS
| Commodity | Unit | Price | Annual percentage change | |
|---|---|---|---|---|
| Nov 1986 | Nov 1987 | |||
| $ | $ | % | ||
| Timber, dressed, 150 mm X 25 mm finishing tanalised radiata pine | per 100 lineal metres | 377.78 | 386.15 | 2.2 |
| Concrete blocks, 390 mm X 190 mm X 140 mm | per 100 | 149.98 | 166.18 | 10.8 |
| Paint (water-based), highgloss white | 4 litre tin | 57.55 | 57.50 | -0.1 |
| Coal, domestic | 255 kg | 62.38 | 66.11 | 6.0 |
| Electricity, domestic (incl. water heating)-30 days | 2520 MJ | 52.02 | 57.68 | 10.9 |
| Gas, domestic-30 days | 1100 MJ | 13.46 | 14.03 | 4.2 |
| Electric jug, chrome finish, 1500 W std element | each | 50.46 | 51.85 | 2.8 |
| Electric range, four elements, automatic | each | 995.46 | 1,043.72 | 4.8 |
| Refrigerator, single temp., 0.26 cu m | each | 819.34 | 827.97 | 1.1 |
| Refrigerator, dual temp., freezer-fridge 0.32 cu m | each | 1,140.27 | 1,187.50 | 4.1 |
| T.V. set, colour 56 cm | each | 1,616.86 | 1,532.71 | -5.2 |
| Lawn mower, rotary type, two-stroke, 46 cm | each | 697.86 | 744.28 | 6.7 |
| Venetian blind, 175 cm wide, 130 cm drop | each | 235.56 | 260.82 | 10.7 |
| Carpet, broadloom, 80/20 wool/nylon. 950 g/m2 | metre | 209.79 | 219.45 | 4.6 |
| Vinyl flooring, 183 cm | metre | 52.42 | 53.93 | 2.9 |
| Pillow, dacron-filled | each | 15.17 | 16.60 | 9.4 |
| Mixing bowl, stainless steel, 20 cm | each | 14.61 | 15.37 | 5.2 |
| Fork, table, stainless steel, med. quality | each | 1.13 | 1.19 | 5.3 |
| Torch battery, dry cell, 1250 | each | 1.09 | 1.22 | 11.9 |
| Electric light bulb, 100 watt | each | 0.95 | 1.00 | 5.3 |
| Household cleaning powder | 500 g | 1.46 | 1.76 | 20.6 |
| Detergent, plastic container | 990 ml | 2.48 | 2.30 | -7.3 |
| Disinfectant | 500 ml | 1.75 | 1.77 | 1.1 |
| Fly spray, aerosol | 335 ml can | 3.44 | 3.34 | -2.9 |
| Shoe polish | 50 g | 1.20 | 1.35 | 12.5 |
| Soap powder | 1.10 kg | 2.59 | 2.53 | -2.3 |
| Postal letter, standard, surface | each | 0.30 | 0.40 | 33.3 |
| Telephone rental (private), main exchange | 1 year | 273.90 | 273.90 | - |
| Drycleaning, man's two piece suit | each | 10.43 | 11.68 | 12.0 |
| Licence, T.V., black and white | 1 year | 38.50 | 38.50 | - |
| Licence, T.V., colour | 1 year | 71.50 | 71.50 | - |
| Pantyhose, sheer, av. size, popular brand | pair | 3.52 | 3.72 | 5.7 |
| Shorts, casual sports, boy's | pair | 11.72 | 13.07 | 11.5 |
| Socks, ankle, girl's | pair | 3.70 | 4.34 | 17.3 |
| Nursery squares, 76 cm X 76 cm, cotton | doz. | 42.29 | 44.55 | 5.3 |
| Baby's vest | each | 5.06 | 5.66 | 11.9 |
| Dress pattern | each | 5.65 | 6.12 | 8.3 |
| Wool, hand knitting, crepe, double knitting | 50 g | 3.55 | 3.81 | 7.3 |
| Slippers, felt, man's | pair | 18.98 | 22.84 | 20.3 |
| Shoe repairs, cemented leather half sole, size 5 woman's | pair | 20.42 | 21.33 | 4.5 |
| Bicycle, man's 10 speed, without accessories, N.Z. manufacture | each | 424.19 | 428.64 | 1.0 |
| Petrol, 96 octane | 10 litres | 8.36 | 9.20 | 10.0 |
| Cigarettes, filter tipped | pkt of 20 | 2.73 | 2.85 | 4.4 |
| Tobacco, cigarette | 50 g | 5.06 | 5.36 | 5.9 |
| Beer in public bar—glass | 200 ml | 0.70 | 0.81 | 15.7 |
| Wine, N.Z. sherry medium dry | 2 litre flagon | 14.59 | 16.02 | 9.8 |
| Aspirin | pkt of 24 | 2.33 | 2.43 | 4.3 |
| Razor blades (not bonded) | pkt of 5 | 2.28 | 2.70 | 18.4 |
| Baby talcum powder | 330 g | 3.90 | 4.55 | 16.7 |
| Toilet paper, two-ply, 37.8 m | 4 rolls | 2.74 | 2.59 | -5.5 |
| Toilet soap | 150 g | 0.62 | 0.71 | 14.5 |
| Toothbrush | each | 2.08 | 2.57 | 23.6 |
| Toothpaste | 100 g tube | 1.31 | 1.42 | 8.4 |
| Suitcase, large | each | 85.08 | 88.61 | 4.1 |
| Umbrella, collapsible, woman's | each | 18.16 | 22.34 | 23.0 |
| Envelopes, 89 mm X 146 mm gummed | pkt of 20 | 1.03 | 1.11 | 7.8 |
| Writing pad, 203 mm X 127 mm, lightweight | 80 leaf pad | 1.24 | 1.35 | 8.9 |
| Pencil, black lead | each | 0.51 | 0.53 | 3.9 |
| Film colour slide (including processing), 35 mm, 25 ASA 20 | ||||
| exposures | each | 15.92 | 17.47 | 9.7 |
| Developing and printing, 126 colour film, 12 prints, 87 mm | ||||
| X 90 mm | total | 9.64 | 10.06 | 4.4 |
| Tennis balls, 2nd grade | pair | 6.75 | 7.06 | 4.6 |
| Newspaper, delivered, daily | each | 0.39 | 0.40 | 2.6 |
| Popular book, paperback | each | 8.75 | 11.95 | 36.6 |
| Optician's fee, full examination and spectacles with case | each | 153.31 | 175.07 | 14.2 |
| Dental filling, simple amalgam, one surface | each | 23.51 | 28.35 | 20.6 |
| Dentures, full set, acrylic | set | 554.31 | 621.64 | 12.1 |
| Football admission to ground, club game | each | 2.33 | 2.92 | 25.3 |
| Cinema admission, adult, evening | seat | 5.23 | 5.30 | 1.3 |
| Rugby club subscription, per annum | per member | 44.74 | 53.41 | 19.4 |
| Tennis club subscription, per annum | per member | 91.47 | 115.88 | 26.7 |
| Funeral, burial | each | 1,803.26 | 2,083.85 | 15.6 |
| cremation | each | 1,567.35 | 1,793.36 | 14.4 |
| Hair cut, woman's wet | each | 22.93 | 25.18 | 9.8 |
| man's dry | each | 8.83 | 10.01 | 13.4 |
The Producers Price Index measures average price changes over all industrial and government sectors of the economy.
Price indexes for inputs and outputs at both all-industry and group levels are contained in this index. The all-groups level of the Producers Price Index reflects price level movements as these affect the inputs and sales of business and government. Industry groups, for which separate index series are available, correspond with the New Zealand System of National Accounts production groups. It is conceptually impossible to calculate an output index for the non-market-oriented groups of central government services, local government services, and private non-profit services to households. Their activities differ substantially in character from market-oriented industries in that their output is produced for free distribution or at prices which bear no relationship to the cost of production.
The use of identical industry classification in the national accounts and in the Producers Price Index is part of the Department of Statistics' long-term policy to integrate all economic statistics. With price deflation of the current value of each industry's input of goods and services and its output, it is possible to calculate the industry's real net output and contribution to the gross domestic product. This will be in constant prices or, effectively, in volume terms.
The commodity expenditure weighting patterns and selection of price-surveyed items are based on data from the economic censuses of business activity undertaken by the Department of Statistics. Additional information for weighting purposes has been obtained from other government departments, producer boards, professional organisations and the business community. Specifications for the goods and services that are price-surveyed have been obtained in collaboration with suppliers of the price data to ensure representativeness of priced commodities and adherence to these specifications over time.
The weight assigned to an industry to obtain the all-industry group index is based on the New Zealand System of National Accounts, production accounts for 1983-84.
Tables 23.9 and 23.10 show price indexes of inputs (i.e., current purchases of commodities and services) and of outputs by industry groups. Output prices are those prevailing at the factory door, farm gate, or forest gate or as near to this point as is possible to price and sales taxes and subsidies have been excluded. Input prices include sales taxes and subsidies. Prices of imported items include freight, insurance and customs duty.
The industry production group and sub-group output indexes after the September quarter 1986 exclude GST.
Table 23.9. PRODUCERS PRICE INDEX-INPUTS*
| Industry group | Quarter ended | |||
|---|---|---|---|---|
| 31 Dec 1986 | 31 Mar 1987 | 30 Jun 1987 | 30 Sep 1987 | |
*Base: December quarter 1982 (= 1000). †Includes industry groups 5 to 13. ‡Includes industry groups 1 to 21. | ||||
| 1 Agriculture | 1251 | 1262 | 1297 | 1324 |
| Sheep and beef farming | 1248 | 1256 | 1301 | 1330 |
| Dairy farming | 1230 | 1240 | 1265 | 1289 |
| Mixed cropping | 1321 | 1341 | 1361 | 1382 |
| Horticulture | 1313 | 1343 | 1370 | 1398 |
| Pig, poultry and other farming | 1222 | 1229 | 1225 | 1249 |
| All farming | 1250 | 1260 | 1295 | 1322 |
| Agricultural contracting | 1292 | 1330 | 1358 | 1373 |
| 2 Fishing and hunting | 1423 | 1483 | 1486 | 1494 |
| 3 Forestry and logging | 1387 | 1434 | 1464 | 1472 |
| 4 Mining and quarrying | 1283 | 1308 | 1357 | 1372 |
| 5 Food, beverages and tobacco | 1249 | 1248 | 1274 | 1287 |
| Primary food processing | 1193 | 1192 | 1226 | 1235 |
| Other food processing | 1260 | 1262 | 1275 | 1291 |
| 6 Textiles, apparel and leather | 1408 | 1455 | 1518 | 1569 |
| 7 Wood and wood products | 1478 | 1499 | 1507 | 1519 |
| 8 Paper, printing and publishing | 1344 | 1366 | 1418 | 1445 |
| 9 Chemicals, petroleum and plastics | 1030 | 1111 | 1100 | 1108 |
| 10 Non-metallic mineral products | 1372 | 1397 | 1447 | 1464 |
| 11 Basic metals | 1203 | 1186 | 1226 | 1241 |
| 12 Machinery and metal products | 1487 | 1498 | 1497 | 1497 |
| 13 Other manufacturing | 1311 | 1326 | 1366 | 1384 |
| 14 Electricity, gas and water | 1456 | 1461 | 1562 | 1568 |
| 15 Construction | 1382 | 1418 | 1450 | 1464 |
| 16 Trade, restaurants and hotels | 1416 | 1457 | 1494 | 1525 |
| Wholesale and retail trade | 1437 | 1484 | 1520 | 1553 |
| Hotels, restaurants, takeaways | 1366 | 1392 | 1432 | 1460 |
| 17 Transport and storage | 1279 | 1310 | 1333 | 1367 |
| Road transport | 1279 | 1325 | 1347 | 1358 |
| Transport and storage other than road | 1281 | 1306 | 1329 | 1373 |
| 18 Communication | 1304 | 1347 | 1364 | 1398 |
| 19 Insurance and financing | 1668 | 1727 | 1776 | 1822 |
| 20 Ownership of dwellings | 1594 | 1631 | 1678 | 1696 |
| 21 Community and personal services | 1384 | 1433 | 1464 | 1489 |
| 22 Central government | 1412 | 1457 | 1481 | 1497 |
| 23 Local government | 1387 | 1426 | 1460 | 1470 |
| 24 Private non-profit services | 1436 | 1486 | 1523 | 1553 |
| All manufacturing groups† | 1307 | 1333 | 1354 | 1370 |
| All market groups‡ | 1367 | 1397 | 1428 | 1450 |
| All industry | 1369 | 1400 | 1432 | 1452 |
Table 23.10. PRODUCERS PRICE INDEX—OUTPUTS*
| Industry group | Quarter ended | |||
|---|---|---|---|---|
| 31 Dec 1986 | 31 Mar 1987 | 30Jun 1987 | 30 Sep 1987 | |
*Base: December quarter 1982 (= 1000). †Includes industry groups 5 to 13. ‡Includes industry groups 1 to 21. | ||||
| 1 Agriculture | 1230 | 1230 | 1279 | 1308 |
| 2 Fishing and hunting | 2036 | 2060 | 2088 | 2170 |
| 3 Forestry and logging | 1940 | 1991 | 1991 | 1959 |
| 4 Mining and quarrying | 1114 | 1151 | 1158 | 1158 |
| 5 Food, beverages and tobacco | 1298 | 1321 | 1343 | 1363 |
| Primary food processing | 1222 | 1252 | 1268 | 1273 |
| Other food processing | 1394 | 1406 | 1436 | 1482 |
| Industry group | 31 Dec 1986 | 31 Mar 1987 | 30Jun 1987 | 30 Sep 1987 |
| 6 Textiles, apparel and leather | 1365 | 1422 | 1469 | 1443 |
| 7 Wood and wood products | 1454 | 1471 | 1471 | 1491 |
| 8 Paper, printing, and publishing | 1383 | 1420 | 1482 | 1491 |
| 9 Chemicals, petroleum and plastics | 1097 | 1132 | 1171 | 1182 |
| 10 Non-metallic mineral products | 1361 | 1379 | 1418 | 1432 |
| 11 Basic metals | 1260 | 1242 | 1274 | 1290 |
| 12 Machinery and metal products | 1489 | 1517 | 1523 | 1532 |
| 13 Other manufacturing | 1376 | 1391 | 1443 | 1458 |
| 14 Electricity, gas and water | 1421 | 1425 | 1558 | 1562 |
| 15 Construction | 1369 | 1411 | 1443 | 1463 |
| 16 Trade, restaurants and hotels | 1382 | 1417 | 1449 | 1461 |
| Wholesale and retail trade | 1356 | 1393 | 1420 | 1422 |
| Hotels, restaurants, takeaways | 1484 | 1514 | 1564 | 1615 |
| 17 Transport and storage | 1278 | 1280 | 1317 | 1343 |
| Road transport | 1330 | 1375 | 1437 | 1450 |
| Transport and storage other than road | 1247 | 1229 | 1251 | 1283 |
| 18 Communication | 1356 | 1436 | 1437 | 1443 |
| 19 Insurance and financing | 1827 | 1892 | 1958 | 2019 |
| 20 Ownership of dwellings | 1790 | 1807 | 1825 | 1917 |
| 21 Community and personal services | 1500 | 1530 | 1570 | 1617 |
| All manufacturing groups† | 1339 | 1368 | 1395 | 1405 |
| All market groups‡ | 1412 | 1443 | 1480 | 1501 |
A series of price indexes, jointly called the Capital Expenditure Price Index (CEPI), measure price level changes of physical capital assets purchased by businesses and government.
The concept of price employed is the ‘price to the final user’ and does not include freight or installation costs unless these are normally included in the final price. No account can be taken of special discounts. Sales tax has been included where applicable, and GST is excluded from the measurement of price changes for capital assets.
Each capital expenditure asset-type index is constructed by combining the relative price changes of representative items. The importance given to each item is determined by the expenditure made on all the assets which that item represents. The relative importance of any item, vis-a-vis other price items, is known technically as the ‘weight’ for that item.
Because expenditure on capital items tends to be irregular, the weights used in the Capital Expenditure Price Index have, in general, been based on expenditure over a two- to five-year period ranging from 1975-76 to 1979-80. In deriving the weighting pattern for the index the Department of Statistics has primarily used statistics on external trade, manufacturing, and building. These have been supplemented with data from a range of sources including other government departments, marketing and producer boards, manufacturers, wholesalers, and retailers. A revision of the index is currently being undertaken.
It should be noted that the index numbers relate to the price levels ruling at the mid-point of each quarter. More information on the methodology of the index is available from the Department of Statistics.
Table 23.11. CAPITAL EXPENDITURE PRICE INDEX*
| Capital asset | Quarter ended | |||
|---|---|---|---|---|
| Dec 1986 | Mar 1987 | Jun 1987 | Sep 1987 | |
*Base: December quarter 1979 (= 1000). | ||||
| Residential buildings— | ||||
| Houses, flats, garages | 2344 | 2369 | 2371 | 2417 |
| Hostels | 2222 | 2273 | 2347 | 2345 |
| Non-residential buildings— | ||||
| Commercial buildings | 2171 | 2221 | 2288 | 2289 |
| Factories | 2186 | 2231 | 2293 | 2302 |
| Hospitals, rest homes | 2209 | 2248 | 2305 | 2306 |
| Educational buildings | 2213 | 2263 | 2321 | 2239 |
| Motels, hotels | 2208 | 2251 | 2314 | 2332 |
| Farm buildings | 2219 | 2244 | 2267 | 2301 |
| Other construction— | ||||
| Transport ways | 2360 | 2430 | 2515 | 2579 |
| Pipelines | 2187 | 2221 | 2271 | 2294 |
| Electrical works | 2041 | 2068 | 2104 | 2122 |
| Earthmoving and site work | 2231 | 2253 | 2324 | 2333 |
| Land improvements— | ||||
| Land clearing | 2161 | 2169 | 2207 | 2285 |
| Fencing | 1821 | 1831 | 1915 | 1945 |
| Irrigation and land drainage | 2082 | 2119 | 2177 | 2201 |
| Reclamation and river control | 2225 | 2228 | 2285 | 2282 |
| Transport vehicles— | ||||
| Cars, less than 1600 c.c. | 2399 | 2421 | 2425 | 2308 |
| Cars, 1600 c.c. and above | 2081 | 2085 | 2116 | 2060 |
| Commercial vehicles, less than 2500 kg | 2387 | 2411 | 2447 | 2375 |
| Commercial vehicles, 2500 kg and over | 2003 | 2015 | 2033 | 2039 |
| Buses | 2519 | 2666 | 2815 | 2831 |
| Trailers | 1843 | 1882 | 1926 | 1959 |
| Motorcycles | 1288 | 1280 | 1274 | 1269 |
| Fishing boats | 2439 | 2527 | ||
| Light fixed-wing aircraft | 3280 | 3345 | 3184 | 3184 |
| Helicopters | 3250 | 3348 | 3126 | 3182 |
| Plant, machinery, and equipment— | ||||
| Agricultural tractors | 1735 | 1756 | 1784 | 1832 |
| Self-propelled harvesting machinery | 1792 | 1961 | 1940 | 1926 |
| Other harvesting and mowing machinery | 1784 | 1798 | 1851 | 1851 |
| Soil preparation and cultivation machinery | 2222 | 2236 | 2348 | 2371 |
| Other agricultural machinery and equipment | 1997 | 2012 | 2091 | 2107 |
| Farm motorcycles | 1522 | 1524 | 1555 | 1560 |
| Self-propelled construction machinery | 2001 | 1998 | 1978 | 1956 |
| Non-self-propelled construction machinery, quarrying machinery | 2235 | 2292 | 2328 | 2332 |
| Food and drink processing machinery | 2258 | 2271 | 2301 | 2299 |
| Bottling and packaging machinery | 2114 | 2240 | 2236 | 2191 |
| Textile machinery | 2359 | 2391 | 2392 | 2355 |
| Woodworking machinery | 1992 | 2059 | 2029 | 2041 |
| Printing and publishing equipment | 2037 | 2045 | 2021 | 2059 |
| Metal working machinery | 1972 | 1938 | 1930 | 1907 |
| Forklifts and mobile material-handling equipment | 1884 | 1895 | 1895 | 1942 |
| Mechanical hoists, conveyors, etc. | 2496 | 2520 | 2587 | 2561 |
| Electrical distribution equipment | 2149 | 2168 | 2188 | 2203 |
| Electric motors, up to 7 kW (1-9hp) | 1718 | 1718 | 1776 | 1774 |
| Electric motors, 7 kW and over (over 9 hp) | 2094 | 2094 | 2113 | 2127 |
| Industrial engines, non-electric | 2094 | 2214 | 2275 | 2268 |
| Air-conditioning and cooling equipment | 1907 | 1927 | 1933 | 1936 |
| Refrigerating equipment | 1937 | 2023 | 2037 | 1971 |
| Industrial boilers and heating equipment | 2164 | 2203 | 2183 | 2200 |
| Pumping and compressing equipment | 1984 | 1990 | 2033 | 2101 |
| Office and shop equipment, electronic | 1210 | 1209 | 1183 | 1174 |
| Office and shop equipment, non-electronic | 1403 | 1326 | 1379 | 1347 |
| Office and shop furniture and fittings | 2366 | 2409 | 2484 | 2479 |
| Duplicating and photocopying machines | 766 | 746 | 747 | 752 |
| Scales and weighing machinery | 1137 | 1201 | 1188 | 1287 |
| Shipping and transportation containers | 2076 | 2108 | 2144 | 2168 |
| Tanks, vats, and storage units | 2127 | 2245 | 2260 | 2262 |
| Photographic and optical equipment | 1937 | 2046 | 2045 | 2018 |
| Technical and scientific equipment | 2156 | 2147 | 2146 | 2125 |
| Medical, dental, and hospital furniture and equipment | 2309 | 2335 | 2333 | 2434 |
| Stereo equipment | 864 | 864 | 851 | 821 |
| Television receivers | 1315 | 1336 | 1357 | 1351 |
| Peripheral data processing units | 1398 | 1358 | 1307 | 1292 |
| Radio-telephone and telegraphic equipment | 1795 | 1780 | 1806 | 1796 |
| Domestic-type furniture and furnishings | 2098 | 2146 | 2203 | 2212 |
| Domestic-type appliances | 1649 | 1662 | 1663 | 1663 |
| Domestic-type equipment and utensils | 1828 | 1842 | 1857 | 1864 |
| Portable power tools | 2025 | 2051 | 1904 | 1869 |
| Sport and recreation equipment | 2001 | 2033 | 2119 | 2164 |
Consumers Price Index. Department of Statistics (annual).
External Trade Indexes. Department of Statistics (annual).
Monthly Abstract of Statistics. Department of Statistics.
Prices Statistics. Department of Statistics (annual).
Producers Prices Statistics. Department of Statistics (annual).
Report of the Consumers Price Index Advisory Committee (Parl. paper G. 28A, 1985).
Table of Contents
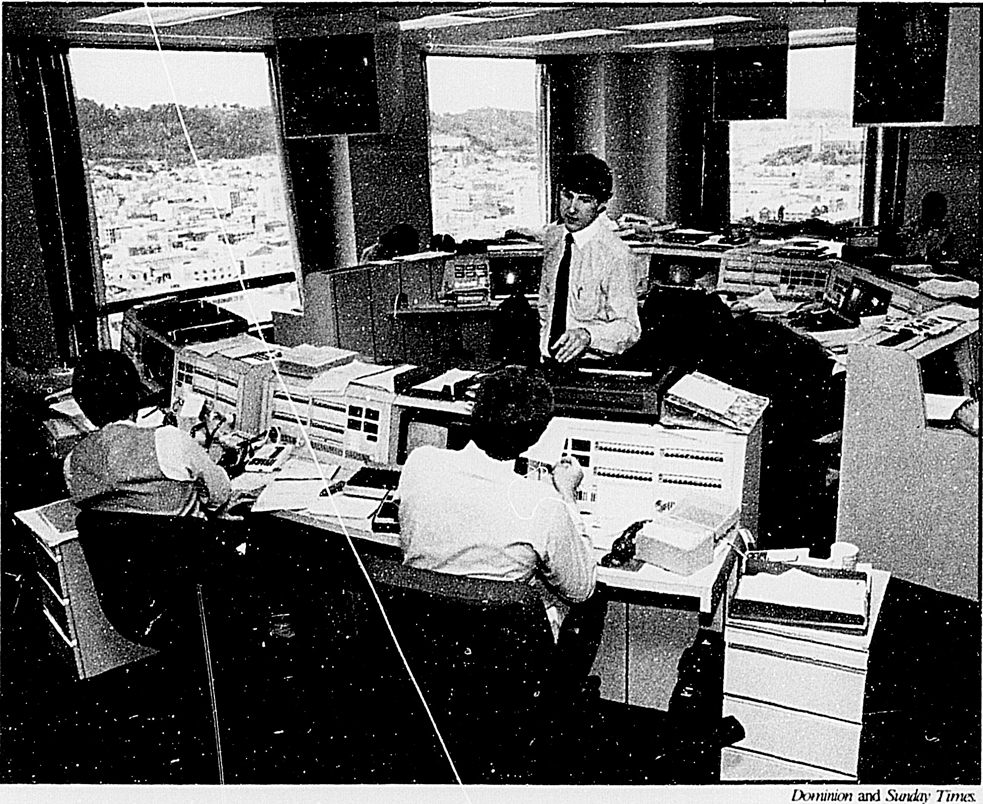
Foreign exchange dealing room, Wellington.
The financial sector has undergone a period of dramatic change since 1984, the culmination of a process of gradual evolution and reform which started over a decade earlier, but was substantially accelerated from mid-1984 onwards.
Until the early 1960s, the financial sector was dominated by a few major institutions, most notably the trading banks. Monetary policy was implemented primarily through direct and relatively detailed controls over the operations of those major financial institutions. Over the subsequent two decades, the process of financial innovation and increasing sophistication in the financial sector saw the growth of a range of new financial institutions, particularly in areas less subject to direct controls, and also a rapid expansion in the variety of financial services available to the public. The approach to policy making also changed over this period, with a gradual move away from direct controls towards the greater use of system-based policy instruments applying to all institutions operating in the market. Most significantly, in a relatively short period following the change of government in 1984, most direct controls on the financial sector were removed.
The impact on the financial system of these changes in the way policy is implemented has been substantial. The result has been rapid growth in money market activity since 1984, the development of a sizeable secondary market in government securities, the introduction of a range of new financial instruments, including forward contracts, options, and interest rate and exchange rate futures, and the growing use of such hedging devices to handle interest rate and exchange rate risk.
The removal of direct controls and subsequent legislative amendments to make financial markets more contestable have resulted in significant institutional changes within the finance industry. One important development was the Reserve Bank Amendment Act 1986. This Act contained provisions enabling suitably qualified financial institutions to become ‘registered banks’. There are currently 15 registered banks, four of which were the existing trading banks and 11 banks which were registered during the 1986-87 financial year. The Trustee Banks Restructuring Act, which was passed in April 1988, and the Building Societies Amendment Act 1987 were also aimed at removing distinctions between various types of financial institutions.
The Reserve Bank of New Zealand, the central bank, was established in 1934 as a privately-owned institution, but became fully state-owned in 1936. A brief survey of its historical development was included in this section in the 1976 and earlier Yearbooks.
The Reserve Bank has 10 directors, comprising the Governor, the Deputy Governor, the Secretary to the Treasury, and seven other directors appointed by the Governor-General by Order-in-Council. The Reserve Bank of New Zealand Act 1964, and subsequent amendments, provide the bank with powers broadly in line with modern central banking practice.
Among the main functions of the Reserve Bank are:
To act as the central bank of New Zealand;
To advise the Government on matters relating to monetary policy, banking, credit, and overseas exchange;
To give effect to the monetary policy of the Government;
To maintain public confidence in the operation and stability of the financial system, including monitoring the prudential soundness of specified financial institutions and facilitating the orderly exit of failed institutions;
To manage the note and coin issue, and in conjunction with the Treasury, the public debt and foreign exchange reserves;
To collect statistics from financial institutions relating to monetary and credit developments and interest rates regularly. These statistics are published in the Reserve Bank Bulletin.
To receive and assess applications for registration as ‘registered banks’; and
To act as banker to the Government.
To authorise foreign exchange dealers and, if appropriate, suspend foreign exchange trading.
The Reserve Bank also acts as banker to the settlement banks. Settlement accounts are provided through which transactions between the Reserve Bank and its customers, and the banks and their customers are settled. In early 1988 three newly-registered banks, NZI, Countrywide and National Australia, took to eight (after the four former trading banks and Post Bank) the number of institutions to hold settlement accounts at the Reserve Bank. Other banks are also likely to become settlement institutions.
The bank may also fix the exchange rate and implement exchange control regulations, although exchange controls were effectively removed in December 1984 and the exchange rate floated in March 1985.
In the Budget of July 1988 the Government announced a number of reforms of the Reserve Bank and its functions to be completed during the 1988-89 financial year. These reforms include a new degree of autonomy and accountability for the bank in maintaining price stability through monetary policy (see section 24.2, following). At the same time it was announced that the Public Account would be moved from the Reserve Bank, effectively meaning it would cease to be banker to the Government and government departments, provided that adequate new arrangements could be found.
Details of the liabilities and assets of the Reserve Bank are shown in the following tables.
Table 24.1. LIABILITIES OF THE RESERVE BANK
| At end of June | Bank notes | State | Deposits | Overseas liabilities | Other liabilities | Total liabilities | |||
|---|---|---|---|---|---|---|---|---|---|
| Marketing | Other | Short-term | Long-term | Allocation of special drawing rights | |||||
| Source: Reserve Bank of New Zealand. | |||||||||
| $(million) | |||||||||
| 1985 | 705.7 | 945.2 | 273.8 | 165.7 | 267.3 | 1,588.0 | 307.6 | 250.7 | 4,504.0 |
| 1986 | 775.5 | 1,987.3 | 318.5 | 62.4 | 684.6 | 1,096.6 | 287.6 | 304.5x | 5,517.0x |
| 1987 | 1,003.0 | 116.1 | 102.4 | 10.2 | 4,060.4 | 358.5 | 315.8 | 390.4 | 6,356.8 |
Table 24.2. ASSETS OF THE RESERVE BANK
| At end of June | Overseas assets | Investments in New Zealand | Advances and discounts | Other assets | ||||||
|---|---|---|---|---|---|---|---|---|---|---|
| Gold | Short-term | Long-term | Special drawing rights | State | Marketing | Trading banks | Other | |||
| Source: Reserve Bank of New Zealand. | ||||||||||
| $(million) | ||||||||||
| 1985 | 0.7 | 1,719.4 | 18.7 | 2.7 | 1,070.5 | 142.5 | 1,409.0 | 5.9 | 0.3 | 134.3 |
| 1986 | 0.7 | 2,217.2x | 14.8 | 2.2 | 1,137.6 | 380.3 | 1,660.9 | 4.3 | 0.3 | 98.7 |
| 1987 | 0.7 | 4,750.5 | 14.3 | 2.5 | 569.5 | 838.5 | 52.6 | 3.0 | 0.5 | 116.0 |
Until recently, a specific Act of Parliament was required for a financial institution to include the word ‘bank’ (or any derivative of ‘bank’) in its name. Accordingly each of the four trading banks has its own legislation, as do the trustee banks, the private savings banks, and the former Post Office Savings Bank (now Post Bank). Those institutions enjoyed certain privileges relative to other financial institutions, relating in particular to the status traditionally carried by the word ‘bank’ in financial markets and also in the area of raising funds from depositors (such as authorised trustee status and, in the case of transferable certificates of deposit issued by trading banks, exemption from stamp duty).
To create an environment which as far as possible is competitively neutral between institutional groups, the Reserve Bank was empowered to register new banks from 1 April 1987. Under the ‘new banks’ policy, there is no limit placed on the number of banks that can be registered, nor is there a time limit on the receipt of applications. In addition, the policy places no particular limit on the entry of banks from abroad, whether they be branch operations or subsidiaries of overseas banks.
In general, the criteria applied in considering registration are qualitative in nature. The only quantitative criterion applied is a minimum capital requirement of $15 million paid-up capital and $30 million issued capital (in the case of branches of overseas banks, a permanent contribution of at least $15 million endowment capital is required). Other matters to which the Reserve Bank has regard when assisting applications for bank registration include expertise in the business of banking: standing in the market; prudential and accounting policies; capital adequacy; internal management systems; and the quality of senior management. In the case of overseas applicants, the Reserve Bank is also required to have regard to the reciprocal rights of access of New Zealand banks to an applicant's country of domicile. There are, however, no requirements as to the type of business a registered bank must engage in, nor for a specific branch network.
The new framework provides little basis on which to distinguish between ‘bank’ and ‘non-bank’ financial institutions. The principal privilege registered banks enjoy, apart from any status that registration itself may carry, is the right to use the word ‘bank’ in their names. Otherwise ‘non-bank’ institutions are able to compete on a more or less equal footing with registered banks. The opportunity was also taken to address other regulatory distinctions between ‘banks’ and ‘non-banks’.
The four existing trading banks became registered banks. These are the Bank of New Zealand, the Westpac Banking Corporation, (which is incorporated in Australia), the ANZ Banking Group (New Zealand) Limited, and the National Bank of New Zealand Limited. The Bank of New Zealand is majority state-owned, although its sale was being considered at the time of going to press. The trading banks jointly own a computer company, Databank Systems Limited, which has a national network of computer centres, and handles the daily operations of the trading banks, including the clearing of cheques.
The following new banks were registered in the 1987-88 financial year: Banque Indosuez New Zealand Limited, Barclays Bank NZ Limited; B. T. New Zealand (Holdings) Limited; CIBC New Zealand Limited; Citibank N. A.; Countrywide Banking Corporation Limited; Hong Kong and Shanghai Banking Corporation; Macquarie Bank Limited; NZI Bank Limited; National Australia Bank (NZ) Limited; Security Pacific Bank New Zealand Limited.
Table 24.3. SELECTED LIABILITIES OF TRADING BANKS*
| Year | Liabilities in New Zealand | Liabilities outside New Zealand | Total liabilities | Total deposits per head of mean population | ||
|---|---|---|---|---|---|---|
| Deposits | Other liabilities | |||||
| Demand | Time† | |||||
*Trading bank business only, excludes liabilities of savings bank subsidiaries, shareholders’ funds, capital liabilities to overseas head offices, contingencies, interbank accounts, and transit items within New Zealand. †Compensatory deposits included. Source: Reserve Bank of New Zealand. | ||||||
| S(million) | ||||||
| Monthly average for calendar year | ||||||
| 1983 | 2,381.6 | 5,327.1x | 125.2 | 347.4 | 8,352.8 | 2,443.1 |
| 1984 | 2,610.5 | 6,352.1x | 246.2x | 432.7 | 9,910.1 | 2,800.0 |
| 1985 | 2,713.6 | 8,864.2x | 131.1 | 671.6 | 12,441.7 | 3,549.8 |
| 1986 | 3,214.5 | 10,960.1 | 187.6x | 920.3 | 15,276.5 | 4,321.6x |
| 1987 | 4,390.0 | 14,472.4 | 373.7 | 1,589.0 | 20,825.1 | 5,693.8 |
| At end of June | ||||||
| 1983 | 2,308.1 | 5,152.8 | 133.4 | 328.7 | 7,923.0 | 2,329.5 |
| 1984 | 2,518.8 | 5,930.5 | 306.6 | 313.7 | 9,069.6 | 2,605.3 |
| 1985 | 2,700.5 | 8,800.2 | 114.2 | 618.8 | 12,233.7 | 3,515.7 |
| 1986 | 3,123.3 | 10,419.6 | 133.5 | 834.8 | 14,511.2 | 4,170.1 |
| 1987 | 4,200.8 | 15,090.6 | 435.5 | 1,766.5 | 21,493.4 | 5,882.4 |
Table 24.4. SELECTED ASSETS OF TRADING BANKS
| Year | Coin | Reserve bank notes | Demand deposits held in Reserve Bank | Overseas assets | Investments | Loans* | Other assets† | Total selected assets | Ratio of loans to total deposits |
|---|---|---|---|---|---|---|---|---|---|
* Includes advances, discounts and term lending but excludes interbank lending. †Includes interbank lending, land and buildings. Source: Reserve Bank of New Zealand. | |||||||||
| $(million) | |||||||||
| Monthly average for calendar year | |||||||||
| 1983 | 7.8 | 65.0 | 0.2 | 618.4 | 2,183.6 | 5,913.8x | 276.0 | 9,064.7 | 75.0 |
| 1984 | 7.8 | 68.3 | - | 603.9 | 2,793.5x | 6,965.8x | 347.1x | 10,840.6 | 76.3 |
| 1985 | 8.2 | 61.4 | 55.6 | 943.5 | 3,493.1x | 8,789.6 | 414.9 | 13,768.8 | 75.5 |
| 1986 | 8.1 | 67.2 | 43.7 | 1,009.9 | 4,791.8x | 10,665.4x | 564.7x | 17,150.5 | 75.2 |
| 1987 | 8.2 | 176.2 | 16.1 | 1,607.6 | 6,436.1 | 14,128.7 | 779.1 | 23,152.0 | 74.9 |
| At end of June | |||||||||
| 1983 | 6.9 | 56.6 | - | 573.3 | 1,823.4 | 5,857.7 | 307.3 | 8,625.2 | 78.5 |
| 1984 | 7.1 | 61.5 | - | 525.1 | 2,176.7 | 7,050.6 | 295.7 | 10,116.7 | 83.4 |
| 1985 | 7.5 | 59.8 | - | 1,004.5 | 3,001.3 | 8.823.0 | 435.3 | 13,331.4 | 76.7 |
| 1986 | 7.5 | 64.1 | - | 942.7 | 4,523.7 | 10,262.0 | 515.7 | 16,315.7 | 75.3 |
| 1987 | 7.9 | 211.3 | 2.0 | 2,124.5 | 6,601.1 | 13,966.7 | 712.2 | 23,625.7 | 72.4 |
This group of institutions includes the Post Bank, the trustee savings banks and building societies.
Trading as Post Bank, this government-owned corporation was formed in 1987 from the Post Office Savings Bank.
The Post Office Savings Bank had been a national institution since 1869, when it was set up with the aim of providing a reliable, widely accessible deposit service to small savers. In the late 1950s it had 80 percent of the savings bank business in New Zealand. However, increased competition from trustee banks and the private savings banks subsequently led to an erosion of this market share. Moreover the savings banks as a group tended to be more heavily controlled than were many other financial institutions and this contributed to the decline in market share. The POSB in particular was required to invest entirely in government stock, and to offer rates on deposits which were set by government. During the 1970s, however, these controls were gradually relaxed, and the POSB was permitted to lend part of its funds to the private sector by way of mortgages, personal loans, and overdrafts. In addition controls on investment account interest rates were largely removed. The deposits of the POSB were subject to a government guarantee, which was carried over to Post Bank but is to be phased out.
Post Bank had assets of $3,268 million at 31 March 1988. There were 319 branches and service centres, 234 agencies and 5 mobile banks operating in New Zealand, with total lending being $1,092 million. In the Budget of July 1988 it was announced that the Government's shareholding in Post Bank could be sold.
The trustee banks have grown up on a regional basis, with the first bank opening in Wellington in 1846. Traditionally they have targeted the small saver and have provided mainly housing finance through mortgages.
The banks are divided into three groups, the Taranaki Savings Bank, the ASB Bank (Auckland) together with Westland Bank, and the Trust Bank to which the other trustee banks belong. In the past, they have had no formal ownership structure, but the Trustee Banks Restructuring Bill 1988 requires that each bank forms a public company. Commercial banking will be separated from charitable functions and each company will be owned by a community trust. The government guarantee currently applying to deposits with trustee banks is to be removed once the new companies have built up a satisfactory capital base.
From the mid-1950s, the trading banks sought government approval to operate savings accounts. This was designed, in part, to compensate for their decreasing share of both deposit-taking and lending business, which arose mainly due to limitations imposed on the trading banks by the monetary authorities. In its desire to encourage savings, the government agreed in 1964 to the trading banks entering this field.
The private savings banks, which are wholly-owned subsidiaries of the respective trading banks, are registered as private companies under the Companies Act 1955. The Private Savings Bank Act 1964 requires that effective control of each private savings bank be vested in the parent company, which is required by the statute to guarantee its subsidiary.
There are now no longer any regulatory reasons for the trading banks to segment this type of business, and recent years have seen a gradual running down in the assets and liabilities of the private savings banks. For statistical purposes, the private savings banks are counted as registered banks.
The first building societies in New Zealand were established in the 1860s. Over the years they developed into two distinct types of society—permanent and terminating societies. Both have specialised in home mortgage finance.
Building societies expanded rapidly in New Zealand during the 1950s and early 1960s. They provided a range of savings accounts and investment services and have become an increasingly important source of home finance. Traditionally they have been required to place the bulk of the funds they raise into housing loans, but recent amendments to the legislation covering building societies have reduced the number of restrictions and made provision for societies to convert to companies. One major building society, Countrywide, has become a bank.
This category includes financial companies, merchant banks (commercial bill dealers), stock and station agents, and the Rural Bank.
Merchant banks are largely involved in corporate financing activities and trade finance. They operate in both the domestic and international money markets and deal in money market instruments such as commercial bills and government securities, as well as organising longer-term finance facilities and offering financial advisory services.
Merchant banking operations began to emerge in New Zealand in the 1950s when the short-term money market was developing. However, these operations were limited until 1971, when the then government allowed overseas banks to take up shareholding in New Zealand merchant banks. In addition, each of the trading banks operating in New Zealand established an equity interest in a merchant bank.
Further stimulus has been given to the development of merchant banks with the deregulation of the financial system since 1984. Merchant banks have since been able to develop a wide range of innovative financial services designed to satisfy their clients’ funding needs more effectively. Securing of assets, foreign exchange dealing, improvements in the marketability of debt, the tailoring of facilities to include such products as options and convertible debt facilities, and the establishment of links with stockbroking firms have all been areas of development by merchant banks. In addition, New Zealand merchant banks have expanded their involvement in international financial markets.
Hire-purchase finance provides the major basis for the activities of most finance companies, but many also provide a range of additional financial services such as corporate finance, commercial bills, foreign exchange transactions, import/export advice, investment advice, leasing mortgages, and extended credit facilities.
Finance companies recorded rapid growth in relative terms over the 1960s and 1970s, with their share of total M3 deposits (see following section) increasing from 1.1 percent in December 1960 to 18.6 percent in mid-1984.
Since the moves to deregulate the financial sector in 1984, however, finance companies have faced strong competition from other deposit-taking institutions, and, as regulatory distinctions have been removed, traditional finance companies have been of diminished significance.
Stock and station agents originally began business as general merchants or retailers. Over time they expanded their operations to woolbroking, livestock transactions, land and property, supplying merchandise, machinery, equipment, and miscellaneous farm requirements, as well as the provision of financial services to the farming community. These agents developed specialised financial services including the operation of current accounts for farmers, the acceptance of term deposits, and the making of secured and unsecured loans for seasonal and farming development needs.
Stock and station agents prefer to provide only short- and medium-term finance, leaving the provision of longer-term finance to other financial institutions. The fortunes of the agents have fluctuated with those of the farming industry, and over recent years they have also faced growing competition from other financial intermediaries.
This investment banking group was established in 1964 and reconstituted by the government as the Development Finance Corporation in 1973. Its original role as a development bank has since broadened. DFC companies provide selected financial services to, and trade with, major corporations, businesses, governments, banks and other financial institutions in New Zealand and internationally. Core activities are lending or debt financing, securities and currency trading, and fee-based investment banking.
On 28 June 1988, the New Zealand Government signed an unconditional contract to sell DFC to New Zealand-based mutual fund, National Provident Fund (NPF) and New York-based Salomon Brothers. Settlement in November 1988 will see NPF acquire 80 percent and Salomon Brothers 20 percent of DFC.
The corporation was established by Act of Parliament in 1974, with the broad objective of providing development finance to individuals and organisations in the farming, fishing and related industries. It was the most recent of a number of government institutions which encouraged land development through loans to farmers at reasonable rates and on stable terms since government first entered the field wit the Advances to Settlers Act of 1894.
Since late 1984 the Government decision to discontinue concessional lending to land-based industry has meant a changing role for the Rural Bank. The deregulation of the finance and banking sector has also required the Rural Bank to restructure its operations and, today, its borrowing and lending are on an almost completely commercial footing. However, since 1985 existing clients who borrowed under previous concessional lending schemes for farm purchase, farm workers’ holdings, irrigation, and other items have had their interest rates progressively increased to market rates. This process will take some time to complete.
Demand for new loans at commercial rates of interest nevertheless continues, and in the year ended March 1987, 2330 loans were approved (totalling $218 million). There has also been a marked increase in lending to non-traditional farming, such as deer and goat farming ventures and to downstream processing and servicing industries.
From April 1988 the Rural Bank was to be established as a limited liability company with the shares in the new company owned by the New Zealand Government, but this process was delayed after the 1988 Budget announcement that commercially sound parts of the Rural Bank would be sold in the coming year.
The present decimal currency system was introduced in 1967, when the dollar as the monetary unit replaced the previous system of pounds, shillings and pence.
Since 1934 the Reserve Bank has had the sole right to issue banknotes in New Zealand. Coin is a liability of the Treasury but is distributed by the Reserve Bank. Notes and coin are issued in response to the demands of the public, which fluctuate in line with both seasonal and general economic influences, most notably changes in the level of economic activity and in domestic prices. The demand for currency is also influenced by changes in methods of payment, such as the increasing use of credit cards and the automatic crediting or debiting of payments to cheque account balances.
Notes and coin form only a relatively small part of the public's total holdings of money balances, amounting to about one-eighth of the narrowly defined money supply (M1) and roughly 3 percent of the broad money supply (M3). By far the bulk of the public's ‘money’ or ‘near money’ asset holdings is made up of deposits with banks or other financial institutions.
Notes issued by the Reserve Bank are constituted legal tender under the Reserve Bank of New Zealand Act 1964 and consequently bear the words “This note is legal tender for . . .”. Coins also constitute legal tender in terms of the Decimal Currency Act 1964.
The total value of notes on issue from the Reserve Bank was $1,036 million during the year ended 31 March 1988. During the preceding year the bank replaced banknotes to the value of $1,823 million.
A review of the currency was recently carried out by the Reserve Bank and Treasury. In August 1988 the Government announced that 1c and 2c coins are to be phased out and that over the next few years coins will replace notes for the $1 and $2 denominations.
Price stability is the major objective of monetary policy implemented by the Reserve Bank on behalf of the Government. In recent years the Government has maintained a firm monetary policy stance to reduce New Zealand's level of inflation to a level at least as low as its major trading partners and maintain relative price stability. Definite progress has been made towards achieving this objective with consumer price inflation falling to its lowest levels since the early 1970s (excluding the wage-price freeze of 1982-84) by the beginning of 1988 (see section 23.1, Consumer prices).
The main instrument of monetary policy in the past was a complex system of reserve asset-ratio requirements applied in various forms, and at various levels, to a wide range of financial institutional groups. This was supplemented from time to time by credit growth guidelines, qualitative lending directives, and by direct controls on lending and/or deposit interest rates. Public debt policy (i.e., the sale of government debt) was also used for monetary policy purposes from time to time, most notably through the issuance of competitive debt instruments aimed at the retail segment of the market. Wholesale debt sales were not used actively for monetary policy purposes, owing to general unwillingness on the part of successive governments to offer competitive rates of interest on wholesale public debt. This also meant that there was no active secondary market in government stock and little scope for using open market operations as a monetary policy instrument. Finally the government operated a fixed-exchange-rate regime, and as a consequence, balance of payments flows impacted fully on the reserves base of the financial system and had a significant impact on domestic monetary conditions.
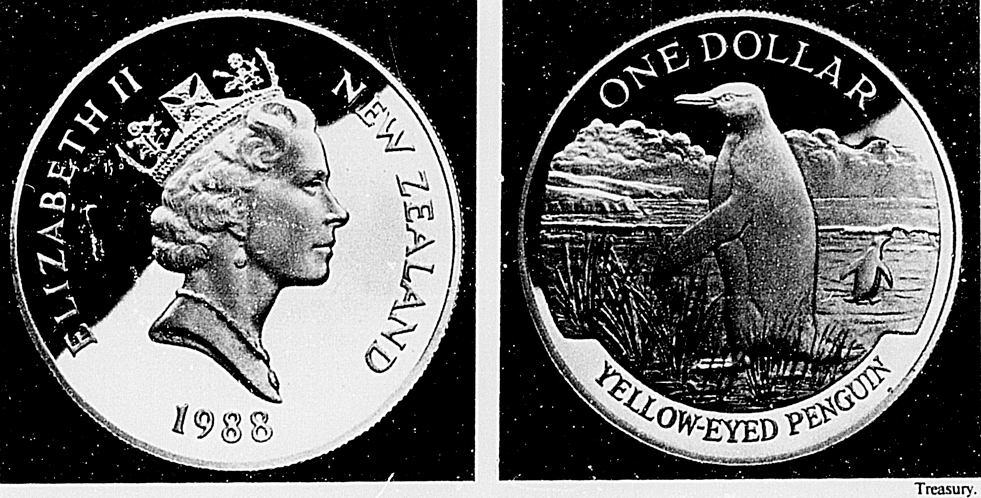
1988 Commemorative coin issue, featuring yellow-eyed penguin
There was a general trend away from the use of institution-specific controls in the operation of monetary policy over the 1970s and early 1980s, although there were also periods when the trend was reversed; most notably when interest rate and other financial controls were restored between 1982 and 1984.
After the 1984 change of government a programme of comprehensive deregulation of the financial system was introduced with two broad objectives. The first was to ensure that government intervention in the area of monetary policy should be implemented in a way which would encourage the development of an efficient financial sector. The second objective was to control inflation.
During 1984-85 this meant the removal of controls on interest rates, foreign exchange, lending ratios and other controls on the sector. The Government also removed exchange rate controls and (since 1983) changed the methods of financing public debt from a ‘tap’ system to a tightly controlled tender system at competitive rates.
With all direct controls on the financial sector having been removed, monetary policy has since 1985 operated primarily by controlling growth in the monetary base over time. The monetary base definition currently most commonly used in New Zealand is ‘primary liquidity’ (PL). This comprises the cash balances held by settlement institutions at the Reserve Bank plus government securities with less than 30 days to maturity outstanding (which the Reserve Bank is prepared to repurchase at any time, and therefore represent a potential source of settlement cash for the financial system). Financial institutions seek to hold primary liquidity as a buffer stock in order to enable them to settle daily transactions with the Reserve Bank (mainly related to government transactions, since the Government banks with the Reserve Bank) and also to settle transactions between private sector financial institutions themselves. By controlling the supply of settlement cash and primary liquidity relative to demand, the Reserve Bank can influence short-term interest rates and those other variables which affect the level of nominal economic activity and inflation: most notably, the overall interest rate structure, money and credit growth and the exchange rate.
The main instrument used to control the supply of primary liquidity is sales of new issue medium-term government debt through regular stock tenders (usually held seven or eight times a year). This is supplemented during the year by sales of shorter-dated government debt (called Treasury bills), which are sold by way of weekly tenders, and by open market operations (i.e., purchases and sales of existing government securities on the secondary market). Both government stock and Treasury bills are wholesale debt instruments, i.e., they are aimed mainly at large institutional investors rather than at small savers. The government stock tender programme has been determined to date on the basis of ‘fully funding’ net public sector injections into primary liquidity, which effectively means holding the average level of primary liquidity constant.
The other instruments used to control primary liquidity are the daily target level of settlement cash held by the settlement institutions and the discount margin, the penalty incurred by institutions when forced to sell their holdings of government stock before maturity. The level of settlement balances has been used as a control since 1986, and over 1987-88 the Reserve Bank changed the daily settlement targets eight times and, in October, increased the discount margin.
Although the monetary policy framework uses settlement cash, the discount margin and primary liquidity as operating targets, no formal intermediate targets such as M3 (the broad money supply) are used. The bank instead uses a range of indicators, including the exchange rate, the level and term structure of interest rates, and monetary and credit aggregates (see table 24.5), developments in asset markets and the real economy, and evidence of inflation and inflationary expectations in the economy. To measure the latter element the bank uses regular surveys of both market participants and the public.
A significant event in the financial markets during the 1987-88 year was the October crash in local and overseas sharemarkets. In effect the share crash had little immediate impact on domestic monetary conditions. The Reserve Bank re-affirmed its commitment to both its principal objectives—the control of inflation and stability in the financial sector—but did not initially follow central banks in many other countries which injected liquidity following the crash. However, a sharp fall in the exchange rate at the end of October, due in part to overseas investors liquidating New Zealand dollar assets, added additional pressure to interest rates. In response the bank increased the settlement cash target to relieve pressure on short-term interest rates in early November.
The bank's firm monetary policy stance has been maintained since, for the reasons stated above and with the added intention of reducing the public's and the business community's expectation of inflation.
Any short-term benefits from easing monetary policy were seen by the bank as being outweighed by the likely eventual costs of having, once again, to tighten policy to restrain any resurgence in inflation.
Table 24.5. MONEY SUPPLY AND CREDIT AGGREGATES
| Selected aggregates | As at 31 March | ||||
|---|---|---|---|---|---|
| 1984 | 1985 | 1986 | 1987 | 1988 | |
*Readily available money supply. †Broad money supply, including term deposits. Source: Reserve Bank of New Zealand. | |||||
| $(million) | |||||
| Monetary— | |||||
| Notes and coin held by the public | 652 | 718 | 831 | 868 | 846 |
| Transaction account balances— | |||||
| (a) Registered banks | 2,567 | 2,516 | 3,004 | 3,737 | 4,998 |
| (b) Savings institutions | 217 | 272 | 394 | 531 | 1,608 |
| Less, inter-institutional transaction balances | 55 | 72 | 68 | 115 | 74 |
| Less, government deposits | 87 | 56 | 62 | 63 | 76 |
| Ml* | 3,289 | 3,378 | 4,099 | 4,958 | 7,302 |
| Other funds— | |||||
| (a) Registered banks | 7,625 | 9,379 | 11,857 | 15,362 | 23,534 |
| (b) Financial corporations | 5,196 | 7,558x | 10,897x | 14,015x | 10,483 |
| (c) Savings institutions | 6,363 | 7,060 | 7,651 | 8,351 | 8,606 |
| Total | 19,184 | 23,997x | 30,405x | 37,728x | 42,623 |
| Less, other inter-institutional funding | 2,507 | 2,046 | 1,763x | 3,705x | 4,915 |
| Less, government deposits | 185 | 299 | 355 | 438 | 251 |
| M3† | 19,781 | 25,030x | 32,386x | 38,543x | 44,759 |
| Credit— | |||||
| Gross claims— | |||||
| (a) Registered banks | 7,497 | 9,428 | 11,673 | 16,343 | 25,906 |
| (b) Financial corporations | 7,916 | 10,675x | 15,363x | 16,626x | 13,727 |
| (c) Savings institutions | 3,854 | 4,459 | 5,710 | 6,787 | 8,931 |
| (d) Other (Reserve Bank) | 10 | 13 | 17 | 20 | 24 |
| 19,277 | 24,575x | 32,763x | 39,776x | 48,588 | |
| Less, inter-institutional claims | 1,657 | 1,489 | 1,602x | 3,025x | 5,314 |
| Private sector credit | 17,620 | 23,086x | 31,161x | 36,751x | 43,274 |
| Marketing and stabilisation | 1,006 | 1,129 | 1,405 | -40 | -69 |
| Claims on government— | |||||
| (a) Registered banks | 2,634x | 2,157x | 2,876x | 3,359x | 4,340 |
| (b) Financial corporations | 859 | 1,202 | 2,169x | 1,463x | 846 |
| (c) Savings institutions | 3,139 | 3,127 | 2,913 | 2,346 | 1,614 |
| (d) Reserve Bank | -126 | -490 | -383 | 1,188 | 928 |
| (e) Coins in circulation | 62 | 66 | 75 | 83 | 97 |
| Total | 6,568x | 6,062x | 7,650x | 8,439x | 7,825 |
| Domestic credit | 25,194x | 30,277x | 40,216x | 45,150x | 51,030 |
The Government currently sells three types of debt instruments to meet its financing requirements:
Government stock, which is a medium-term (generally 2-5 year) instrument paying a fixed coupon or interest rate, and aimed at the wholesale market (mainly large institutional investors) (Since September 1983, government stock has been sold through regular, usually monthly, competitive tenders, whereby the price, or the effective yield, is determined by market bids. Previously stock was sold by ‘tap’ issue, whereby the Government set the price of the issue, and the amount sold was determined by market demand.)
Treasury bills, which are short-term (usually less than one year) wholesale debt instruments, primarily used to meet the Government's seasonal financing needs during the year. (Bills are zero coupon instruments, i.e., they pay no interest but rather are initially sold at a discount to their par value, implying an effective yield for the holder of the bills. Bills have been sold through regular weekly tenders since January 1985; previously being sold by tap issue); and
Retail stock, which is aimed mainly at small savers (A variety of retail instruments have been issued by government in the past but, since November 1985, the sole retail instrument on issue has been ‘Kiwi Bonds’. This is a fixed-interest instrument which is transferable, i.e., may be sold by the holder to another party, but is not redeemable prior to maturity. Kiwi Bonds are issued with two- and four-year maturities. The interest rate is set by the Government on the basis of a formula, whereby the rates on each issue are linked to the current market yields on wholesale government stock of comparable maturities.)
The secondary market in government securities (where existing debt instruments are bought and sold) is largely confined to government stock. Turnover in the market has grown significantly over recent years, with transactions usually in multiples of $1 million with settlement on a seven-day basis.
A key factor in the growth of the government stock market has been the major policy changes outlined in the section, ‘Monetary policy’ above.
Previously, when government stock was sold by tap issue, and also in the early stages of stock tendering (when bids were often rejected because the yields were considered by the Government to be too high), the yields available were generally unattractive to institutional investors. As a result, the demand for stock tended to be limited to those financial institutions which had a legal requirement to hold a certain level of stock. Market-related yields are now accepted in tenders, and government stock has become a more attractive investment option for the private sector and is now held by a wide range of holders, including foreign investors.
One notable change in this regard has been in the amount of stock registered in the name of trustee and nominee companies. From a level of about 1 percent of total outstanding government debt held in the name of such companies in 1980, the amount is now over 10 percent. As nominee companies are the main channel through which overseas investors purchase stock, this change is indicative of the increased foreign interest in New Zealand government securities.
A futures contract on five-year government stock has been traded on the New Zealand Futures Exchange since March 1986. This involves an agreement to buy or sell stock at an agreed price at some point in the future and is an important device for hedging interest-rate risk. Each contract is for $100,000 of stock.
The Reserve Bank maintains registers of stock for government, local authorities and other public bodies.
At 31 March 1988, the value of total securities registered was $23,897 million, an increase of 8.1 percent over the year. These securities comprised Treasury bills and other wholesale government stocks, of $20,879 million, government retail stock of $974 million, and local authority and public body stocks of $1,684 million and $360 million respectively. As retail debt issues became less important to the Government, the total number of holdings of government securities fell by 14.3 percent during the year.
Table 24.6. GOVERNMENT SECURITIES ON ISSUE
| Year ended | |||
|---|---|---|---|
| March 1987 | September 1987 | March 1988 | |
| Source: Reserve Bank of New Zealand. | |||
| $(million) | |||
| Ordinary government stock, by maturity: | |||
| Less than or equal to 1 month | — | — | 40.0 |
| More than 1 month, up to 3 months | 127.6 | 335.0 | 157.1 |
| More than 3 months, up to 6 months | 564.3 | 1,146.3 | 1,005.8 |
| More than 6 months, up to 2 years | 4,450.7 | 4,066.5 | 5,050.0 |
| More than 2 years, up to 5 years | 7,997.8 | 8,690.1 | 7,263.7 |
| More than 5 years | 3,269.0 | 2,991.7 | 2,875.3 |
| Treasury bills by maturity: | |||
| Less than or equal to 3 months | 1,170.0 | 1,102.2 | 953.9 |
| More than 3 months, up to 6 months | — | 2,618.9 | 1,073.1 |
| More than 6 months, up to 1 year | — | 423.8 | 375.0 |
| Index linked stock | 1,877.8 | 1,650.0 | 1,505.3 |
| Kiwi stock | 250.0 | 187.0 | 164.8 |
| IASBs | 643.0 | 581.4 | 537.0 |
| ONZ Bonds | 27.1 | 25.1 | 22.2 |
| Premium stock | — | — | — |
| Savings stock | — | — | — |
| Kiwi Bonds | 296.5 | 346.3 | 251.0 |
| Total internal public debt: | 20,674.0 | 24,164.3 | 21,274.2 |
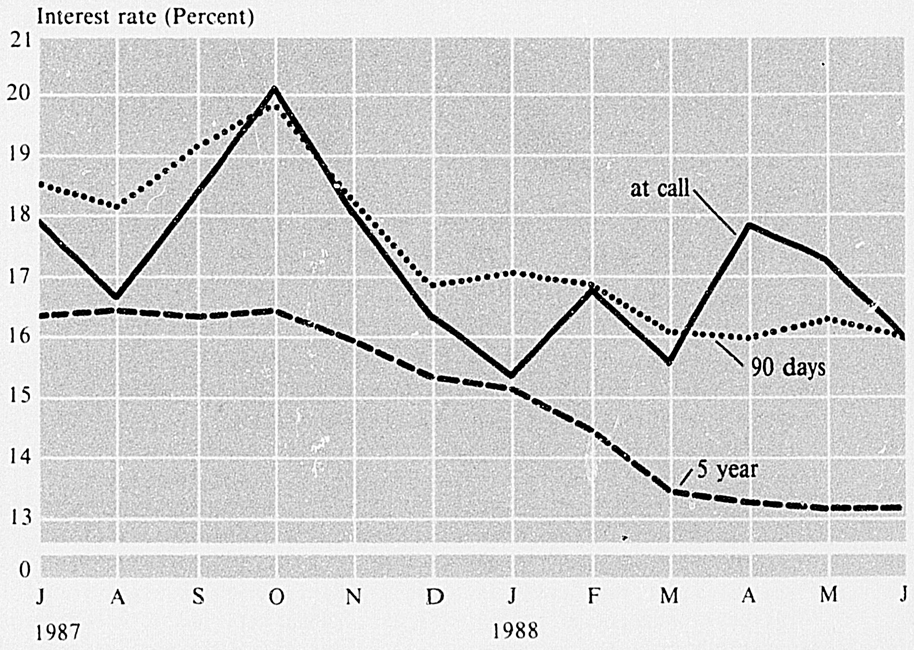
KEY MARKET RATES—monthly averages
Since March 1985 the New Zealand dollar has ‘floated’, with its value against other currencies determined by demand and supply in the foreign exchange market. This contrasts with all the previous arrangements, where the authorities had set the exchange rate, by virtue of the Reserve Bank being prepared to clear the market (buying or selling foreign exchange) at the predetermined rate. The Reserve Bank continues to monitor and supervise the market. It also purchases the Government's current account foreign exchange requirements in the market, but no longer quotes exchange rates or stands in the market to buy or sell foreign currency on demand. Accordingly, the authorised foreign exchange dealers are free to deal with their customers in currencies at negotiated rates.
In the preceding decade New Zealand's exchange rate system had moved through four broad stages.
Prior to July 1973 the value of the New Zealand dollar was pegged, or fixed; initially against sterling and later against the US dollar. This link was broken in 1973, with the New Zealand currency instead being fixed against a basket of the currencies of the country's main trading partners. Although the value of the dollar still changed on a day-to-day basis against these currencies, its average value was kept constant. Changes against the basket were relatively infrequent and were in the form of discrete devaluations or revaluations. (The 1976 and 1985 Yearbooks present more detailed accounts of exchange rate developments prior to and during this period.)
In 1979 a more flexible exchange rate system was introduced. Instead of infrequent but relatively large adjustments to the exchange rate, a new ‘crawling peg system’ enabled smaller (usually less than 0.5 percent), more frequent changes to be made. The main criterion for adjustment was the amount by which inflation in New Zealand (as indicated by movements in consumer prices and export costs) differed from the average overseas inflation rate. Where the New Zealand rate of inflation exceeded that of its major trading partners, then, other things being equal, the average value of the New Zealand dollar would be reduced in a number of small steps to yield a devaluation which would approximately reflect the inflation differential. Some account was also taken of other factors affecting the balance of payments—for instance long-term changes in the terms of trade, and the impact of policy measures such as those aimed at shifting investment towards export-based production.
In June 1982 the crawling peg system was suspended and the New Zealand dollar was once again fixed against the basket of currencies. In July 1984, following the general election, the dollar was devalued 20 percent against the basket, but then remained fixed at its new value.
High domestic interest rates kept upward pressure on the exchange rate for most of the 1987-88 financial year, although periods of uncertainty in financial markets meant there were some sharp movements.
Over the year the dollar appreciated by 5.8 percent against the basket of currencies of New Zealand's major trading partners. Bilaterally, the dollar strengthened by 15 percent against the US dollar, with increases of 9.8 percent and 6.1 percent respectively against the Australian dollar and deutschmark. Conversely, the New Zealand dollar (or ‘Kiwi’, as it is frequently known) weakened by approximately 1.5 percent against both the yen and sterling. These movements were largely the result of the yen strengthening against the US dollar, while the Australian dollar firmed against the US dollar but tended to weaken against most other currencies.
Support for the New Zealand dollar over the year came from offshore demand for the currency to invest in New Zealand dollar denominated securities issued in Europe and the United States. Issues of Euro- and Yankee- New Zealand dollar bonds amounted to NZ$2.3 billion over the year, with investors being attracted to these bonds by the relatively high yields attached to them.
Political uncertainty preceding the General Election saw the exchange rate index fall by around 8 percent in late July. Support reappeared for the New Zealand dollar following the election and was further strengthened by the reduction of the Reserve Bank's settlement cash target, and by offshore demand for New Zealand dollars to buy bonds in August and September.
The exchange rate experienced a second sharp downward shift over the last week of October when the index fell by 9 percent, following a period of increased uncertainty after the sharemarket crash. Moves by a number of monetary authorities in October and November to liquify financial markets helped reduce nervousness in the financial sector. In New Zealand, a decision to raise the target for settlement cash contributed to more stable foreign exchange rates for the last two months of the year.
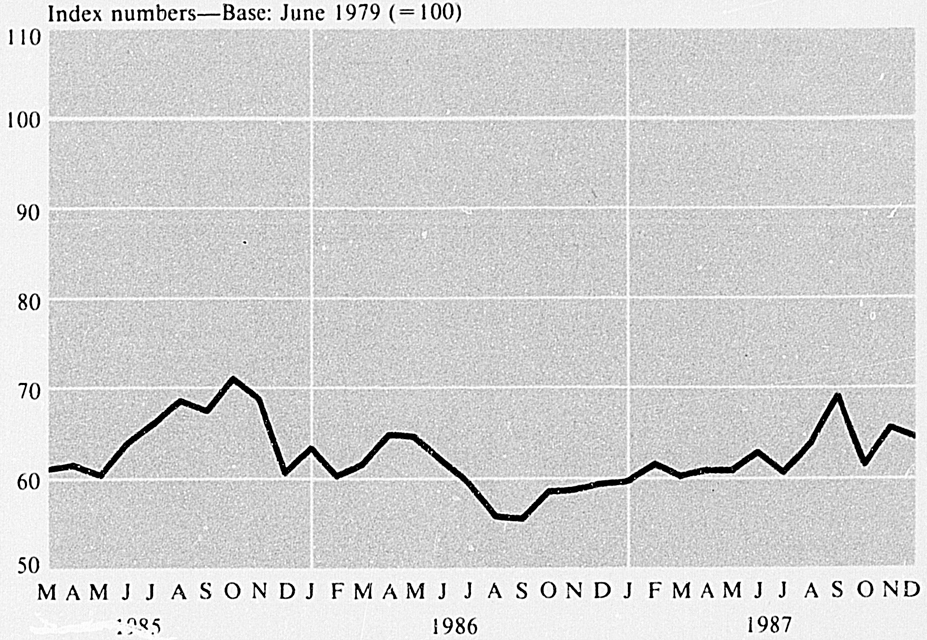
TRADE-WEIGHTED EXCHANGE RATE INDEX
The substantial realignments of major currencies over year's end and into January 1988 coincided with a period of uncertainty in New Zealand concerning the exact nature and timing of changes in the domestic taxation structure. Clarification of the taxation policy issue in February and improving interest rate differentials resulted in upward pressure on the exchange rate which continued through much of the last quarter of the year. In late March, however, the downward trend in domestic interest rates and a buildup of negative sentiments regarding prospects for the New Zealand dollar were factors in causing the exchange rate index to fall approximately 4 percent, although it quickly recovered by around 2 percent to close the financial year at a level of 63.9. (See table 24.7).
A measure of New Zealand's real exchange rate indicates an approximate 18 percent appreciation over 1987-88, suggesting a loss of international competitiveness for the New Zealand export and import substitution sectors. While the appreciating nominal exchange rate was a contributing factor, an equally important factor was New Zealand's still high inflation rate of 9 percent to March 1988 compared with the average OECD rate for the same period of only 3.6 percent.
There has been significant expansion of New Zealand's spot and forward foreign exchange markets over the last few years. There have also been major changes in the distribution of foreign exchange business over the last two years.
During the 1987-88 financial year total turnover in the New Zealand foreign exchange market, at an average NZ$14 billion a day over the last six months of the year, was up 60 percent on the same period a year earlier. The most significant expansion in activity was in New Zealand dollar spot and forward business with turnover doubling over the year to an average NZ$8 billion and NZ$2 billion a day respectively.
Table 24.7. FOREIGN EXCHANGE RATES*
| End of period | U.S.A. mid-rate (US$ per NZ$l) | U.K. mid-rate (Stg per NZ$l) | Aust. mid-rate (A$ per NZ$l) | Japan mid-rate (Yen per NZ$l) | West Germany mid-rate (DM per NZ$l) | Switzerland mid-rate (Franc per NZ$l) | Exchange rate index, Base (June 1979=100)† |
|---|---|---|---|---|---|---|---|
* The US rates are representative market mid-rates at 3pm on the last working day of each month. Exchange rates for currencies other than the US dollar are market determined indicative mid-rates at the last business of each month. †The exchange rate index is as calculated at 3pm on the basis of representative market rates for the currencies in the basket. On 23 November 1987, the Reserve Bank switched to a new nominal exchange rate index. All previous index figures have been recalculated on this basis. Source: Reserve Bank of New Zealand. | |||||||
| 1986—Jul. | 0.5188 | 0.3474 | 0.8479 | 80.68 | 1.0949 | 0.8778 | 59.6 |
| Aug. | 0.4865 | 0.3332 | 0.8081 | 76.80 | 1.0105 | 0.8156 | 56.0 |
| Sep. | 0.4885 | 0.3414 | 0.7826 | 75.34 | 0.9913 | 0.8041 | 55.7 |
| Oct. | 0.5080 | 0.3617 | 0.7916 | 81.82 | 1.0404 | 0.8631 | 58.6 |
| Nov. | 0.5116 | 0.3622 | 0.7953 | 84.17 | 1.0293 | 0.8586 | 58.7 |
| Dec. | 0.5245 | 0.3566 | 0.7885 | 83.74 | 1.0195 | 0.8513 | 59.5 |
| 1987—Jan. | 0.5413 | 0.3533 | 0.8216 | 82.76 | 0.9715 | 0.8167 | 59.8 |
| Feb. | 0.5594 | 0.3626 | 0.8281 | 85.51 | 1.0190 | 0.8582 | 61.6 |
| Mar. | 0.5658 | 0.3519 | 0.8042 | 82.62 | 1.0166 | 0.8480 | 60.3 |
| Apr. | 0.5824 | 0.3496 | 0.8224 | 80.83 | 1.0400 | 0.8531 | 61.0 |
| May | 0.5771 | 0.3545 | 0.8091 | 82.73 | 1.0493 | 0.8700 | 61.0 |
| Jun. | 0.5923 | 0.3697 | 0.8211 | 86.82 | 1.0822 | 0.8992 | 63.0 |
| Jul. | 0.5629 | 0.3550 | 0.8103 | 84.46 | 1.0488 | 0.8690 | 60.7 |
| Aug. | 0.6056 | 0.3733 | 0.8506 | 85.49 | 1.0920 | 0.8996 | 63.8 |
| Sep. | 0.6526 | 0.3980 | 0.9028 | 94.93 | 1.1927 | 0.9914 | 69.2 |
| Oct. | 0.5870 | 0.3383 | 0.8675 | 80.44 | 1.0083 | 0.8343 | 61.5 |
| Nov. | 0.6490 | 0.3532 | 0.9253 | 84.69 | 1.0505 | 0.8675 | 65.7 |
| Dec. | 0.6593 | 0.3533 | 0.9122 | 81.02 | 1.0475 | 0.8466 | 64.6 |
| 1988—Jan. | 0.6635 | 0.3758 | 0.9383 | 85.16 | 1.1169 | 0.9092 | 66.5 |
| Feb. | 0.6651 | 0.3752 | 0.9253 | 85.32 | 1.1232 | 0.9234 | 66.7 |
| Mar. | 0.6512 | 0.3501 | 0.8891 | 81.72 | 1.0890 | 0.8996 | 64.1 |
| Apr. | 0.6754 | 0.3587 | 0.8865 | 83.69 | 1.1219 | 0.9307 | 65.7 |
| May | 0.6935 | 0.3751 | 0.8620 | 86.69 | 1.1963 | 0.9993 | 66.8 |
| Jun. | 0.6760 | 0.3889 | 0.8446 | 88.65 | 1.2138 | 1.0064 | 67.1 |
In the six-month period to March 1987, the four original registered trading banks as a group continued to dominate the market in total and in each category of turnover. In the six month period to March 1988, total turnover was split evenly between those banks and the newer entrants with the latter capturing the largest proportion of New Zealand dollar spot business for the first time. This expansion, and the more even dispersion of business, was partly attributable to the appearance of new dealers and to changes in the financial substance of New Zealand foreign exchange dealers. Apart from the four former trading banks, there are now 13 other foreign exchange dealers. Turnover growth has been boosted by increased international interest in the currency as an investment and by increased demand for active financial risk management services.
There has been a gradual decline in the level of volatility displayed by the New Zealand dollar over the last two years.
The average daily movement of the New Zealand dollar against the United States dollar over 1987-88 was 0.7 percent compared with 0.8 percent in the previous year, but this is still about twice the level of the volatility of the US dollar against each of the Australian dollar, yen, sterling and the deutschmark.
During the year, higher levels of foreign exchange transactions were evident during periods of market instability. The periods around the lead-up to the election in August and at the time of the stockmarket crash in October were characterised by sharp shifts in the exchange rate, by withdrawal of some foreign exchange dealers from price making in the inter-bank market, and by a significant widening of bid-offer spreads for exchange rate quotations from the normal 7 to 10 basis points. When such market conditions prevailed most foreign exchange dealers moved quickly to lay off the exposure with other dealers, meaning daily turnover in the New Zealand dollar spot and forward markets reached record highs of NZ$15 billion and NZ$16 billion in late July and late October respectively.
While there were brief periods during 1987-88 when foreign exchange dealing was difficult, central bank intervention was not necessary to restore stability to the market. Under the Government's policy of non-intervention in the foreign exchange market (except to stem extreme disorder) no intervention has been undertaken by the Reserve Bank in the foreign exchange market to influence the exchange rate since the adoption of the policy in 1985.
24.1 Reserve Bank of New Zealand; Post Office Bank Limited; DFC New Zealand Limited; Rural Banking and Finance Corporation.
24.2 Reserve Bank of New Zealand.
Census of Services 1982-83. Department of Statistics.
Economic Trends and Policies. New Zealand Planning Council, Economic Monitoring Group (annual).
Financial Policy Reform. Reserve Bank of New Zealand, 1986.
Financial Services Industry: Effects of Regulatory Reform. New Zealand Institute for Economic Research, 1986.
Financial Statement (‘Budget’, Parl. paper B. 6).
Monetary Policy and the New Zealand Financial System. Reserve Bank of New Zealand (2nd ed., 1983).
Monthly Abstract of Statistics. Department of Statistics.
New Zealand News Review. Reserve Bank of New Zealand (monthly).
Report of the Bank of New Zealand (Parl. paper B. 15).
Report of the Post Office Bank (Parl. paper F. 1).
Report of the Registrar of Building Societies (Parl. paper B. 14).
Report of the Registrar of Friendly Societies and Credit Unions (Parl. paper B. 18).
Report of the Reserve Bank of New Zealand (Parl. paper B. 16).
Report of the Rural Banking and Finance Corporation of New Zealand (Parl. paper B. 25).
Reserve Bank of New Zealand Bulletin. Reserve Bank of New Zealand (quarterly).
Weekly Statistical Release. Reserve Bank of New Zealand.
Table of Contents
The general structure of the public accounts is set out in the Public Finance Act 1977. They consist of the following accounts:
All taxation is credited to either the Consolidated Account or the National Roads Fund. The Consolidated Account also receives most miscellaneous revenues, and ordinary expenditure is debited to it.
Highways taxation is credited to the National Roads Fund, which meets both capital and maintenance expenditure on roading, but a proportion of the motor spirits duty and road user charges are credited to the Consolidated Account.
The Loans Account receives loan money raised for works and development. A proportion of this is transferred to the Consolidated Account, and most of the balance is advanced by way of capital to the Housing Corporation and the Ministry of Energy, and other state enterprises outside the public account.
Money received into the Loans Redemption Account includes an annual contribution from the Consolidated Account towards the repayment of the public debt, the proceeds of issues of Treasury bills, and money borrowed for the purpose of repaying or converting loans to the Crown. The main purpose of the account is the repayment or conversion of loans, but money not required for these purposes may be transferred to the Loans Account.
Any money in the Consolidated Account regarded as surplus to immediate requirements may be transferred to the Reserve Account and invested in New Zealand or overseas. The Minister of Finance has authority to realise these investments and retransfer the proceeds to the Consolidated Account at his or her discretion.
Money held in trust or awaiting disposal is paid into the Trust Account. Funds in the Trust Account may be invested in government or other approved securities.
In addition to these six accounts there is a Suspense Account. This is simply a holding account for receipts banked to the credit of the public accounts but not yet allocated to one of the six accounts.
The financial year commences on 1 April and ends on 31 March. The expenditure of public money is authorised by an annual Appropriation Act, which lapses at the end of the financial year. However, the Minister of Finance is authorised to pay money for services for a period of three months from the commencement of the next financial year, pending the granting of supplies by Parliament.
New Zealand has a centralised form of government developed from the Westminster style. Unlike more populous Canada and Australia, New Zealand does not have a system of state or provincial governments. As described in chapter 3, Government, the Cabinet, representing the Executive, sets up organisations to propose the funding for the departmental activities and programmes through the Public Account and this expenditure is subject to Parliament's approval and control.
In recent years, legislative reviews have brought about several changes in Parliament's traditional forms of control over the financial activities of central government.
Historically, parliamentary control has applied to the financial activities of the Crown, either though agencies of the Crown itself or through agencies possessing separate legal status.
The following six types of central government organisations have evolved:
Government departments operating in the name of the Crown through the Consolidated Account and Loans Account of the public accounts (e.g., Department of Health);
Government departments operating on a user-pays philosophy, in the name of the Crown through the Trust Account of the public accounts (e.g., Government Printing Office);
Self-funding departments (e.g., State Insurance Office, Public Trust Office), operating independently of the public accounts either in the name of the Crown or with legal status separate from the Crown;
‘Quangos’ (e.g., Law Commission), which operate with legal status separate from the Crown but which are dependent on Parliament to fund expenditure;
Other organisations (e.g., Broadcasting Commission, Waterfront Industry Commission), which operate with legal status separate from the Crown but whose right to collect revenue is dependent on Parliament's authority; and
State-owned enterprises (e.g., Telecom Corporation, New Zealand Post Limited), which operate with legal status separate from the Crown and in which the only legal authority is that conferred through ownership of shares by the Crown.
All the above types of organisations, except state-owned enterprises, require Parliament's authority before funding their activities. This authority can take the form of annual appropriations or standing statutory authority. Annual appropriations account for most of government expenditure; $25,763 million or 79 percent in 1987–88. Nearly all other central government expenditure is made under standing statutory authority (permanent legislative authority).
Both types of expenditure are appropriated by an Act of Parliament and are included in the annual Estimates of Expenditure. These estimates are presented to Parliament showing the requirements of individual government departments and other activities. They are tabled in Parliament as part of the Budget papers, usually between three and four months into the financial year.
However, the Budget covers much more than the expenditure proposals contained in the Estimates. It is also concerned with the whole range of the Government's financial and economic policy. It also details, through tables, taxation and other revenue sources, expenditure patterns and debt transactions and is, in effect, the means by which the government of the day reports to Parliament, and therefore to the public on its finances. Within Parliament, the Estimates are reviewed by select committees and debated in the House each year.
Once the annual Appropriation Act is passed by Parliament, the monitoring of appropriated funds is assisted through government's central accounting system. (Departments have their own internal information systems.) This system forms the basis of the Public Account where payments are classified against their particular departmental estimates. Actual authority to spend money is approved by Cabinet, although much of Cabinet's authority has been delegated to ministers (either departmental ministers alone or jointly with the Minister of Finance) or to chief executives for the bulk of routine transactions.
As well as reporting to Parliament on their estimates of expenditure, departments also submit annual reports to Parliament on their expenditure and the success or otherwise of their programmes. In the case of government trading organisations, these reports show full revenue statements and balance sheets and are increasingly being set out along the lines of private sector enterprises. The quality of annual reports presented to Parliament has been evaluated recently to improve the content for accountability purposes and to ensure that the information presented is sufficient and appropriate. The chief executives of departments are also being held increasingly accountable by reforms such as those in the State Sector Act 1988 (see section 3.3, State sector).
Chief executives of state-owned enterprises are accountable to their respective boards in the same way as other public companies. Each state-owned enterprise is required to manage and report on the investment of shareholders’ funds as is the case for public companies. This involves tabling in Parliament financial statements which outline corporate objectives, performance targets and dividend policy. Parliament and its committees exercise influence over the achievements of these enterprises by scrutiny of their reports, and the Crown, through its ministers, has the authority to direct the enterprises on any recommendations arising from examination of such reports in Parliament.
Over the past few years, several major initiatives have been introduced to rationalise the way government money is spent to fund the Government's programmes and activities. These changes were considered necessary by the Government to provide flexibility for certain departmental managers, particularly those operating in a commercial environment, and to make the cost of operations more transparent to the taxpayer and users of services.
These initiatives have involved reforms of public administration and accounting practices. The formation of state-owned enterprises from former trading government departments was one of the reforms. State-owned enterprises are required to make a rate of return on taxpayers’ funds, and pay taxes on the same basis as any other business (see section 3.3, State sector.)
For several departments, some new accounting principles have been adopted, such as the ‘user-pays’ policy for selected goods and services and the introduction of ‘net funding’, (where a department meets a percentage of its expenditure through revenue) and ‘revolving funds’ (where revenue obtained by a department is retained by it to fund its operations).
Charging for goods and services means the cost associated with providing goods and services by government departments is financed through payments rather than taxation. Managers are required to be more market-oriented in their decision making and in assessing, for example, the type and quality of goods and services which may be produced.
The advent of the revolving fund system for trading departments (such as the Government Printing Office), represents a change from the traditional method of funding these organisations. It can mean their activities may become fully self-financing, as revenue generated by an activity is applied to the continued operation of that activity.
Table 25.1 shows gross government expenditure as well as the net expenditure financed from the public accounts. The functional classification is intended to focus attention on the broad areas of the economy in which there is substantial government activity. The public accounts shown are prepared on a receipts and payments (cash) basis, and consequently the accounts of the operations of various departments (prepared on an accrual basis) shown in other sections will differ to some extent from those appearing here.
Fuller explanations of some items are given with the similar table in the Budget (Parl. paper B. 6).
Table 25.1. GOVERNMENT EXPENDITURE: PUBLIC ACCOUNT
| Item | Years ended 31 March | |||||
|---|---|---|---|---|---|---|
| 1987 | 1988 | 1989 (estimated) | ||||
| Gross | Net* | Gross | Net* | Gross | Net* | |
*Net expenditure is generally arrived at by deducting trading and departmental receipts from gross expenditure. †Includes the Government Computing Service, previously under General administration. ‡This total does not include the net $3,358.0 million spent on major project and producer board debt refinancing ($1,529.8 million in Land use, $977.5 million in Fuel and power, $830.7 million in Other industrial services, and $20.0 million in Transport). §This total does not include the net $380.7 million spent on major project and producer board debt refinancing ($370.7 million in Fuel and power and $10.0 million in Transport). ¶This total does not include provision for Supplementary Estimates, or the provision of $321.1 million spent on major project debt financing in Fuel and power. Source: Treasury. | ||||||
| $(million) | ||||||
| Administration— | ||||||
| General administration | 956.3 | 768.9 | 1,578.8 | 1,384.7 | 1,928.3 | 1,758.0 |
| Law and order | 636.5 | 520.6 | 831.6 | 681.4 | 1,039.4 | 847.2 |
| Government services | 359.0 | 170.1† | 1,844.6 | 141.7† | 140.0 | 2.0 |
| Miscellaneous services | 15.7 | 11.6 | 20.1 | 15.8 | 24.4 | 19.7 |
| 1,967.5 | 1,471.2 | 4,275.0 | 2,223.5 | 3,132.1 | 2,626.9 | |
| Foreign relations— | ||||||
| Defence | 1,096.0 | 1,072.1 | 1,278.5 | 1,257.6 | 1,413.0 | 1,390.2 |
| Foreign Affairs | 270.1 | 255.0 | 277.5 | 256.0 | 290.5 | 263.7 |
| 1,366.1 | 1,327.1 | 1,555.9 | 1,513.6 | 1,703.5 | 1,653.9 | |
| Development of industry— | ||||||
| Land use | 2,608.8 | 476.4 | 626.5 | 343.0 | 633.0 | 391.5 |
| Fuel and power | 6,764.8 | 162.1 | 1,184.2 | 119.6 | 1,424.3 | 136.5 |
| Other industrial services | 3,008.6 | 845.4 | 980.4 | 887.0 | 987.7 | 845.7 |
| 12,382.2 | 1,483.9 | 2,791.1 | 1,349.6 | 3,045.0 | 1,373.7 | |
| Education— | ||||||
| Education | 2,617.9 | 2,595.2 | 3,179.3 | 3,118.2 | 3,568.8 | 3,481.3 |
| Social services— | ||||||
| Social Welfare | 6,175.1 | 6,121.6 | 7,190.8 | 7,142.4 | 8,271.6 | 8,204.6 |
| Other social services | 669.0 | 357.7 | 991.6 | 649.5 | 1,160.8 | 856.8 |
| 6,844.1 | 6,479.2 | 8,182.4 | 7,791.9 | 9,432.4 | 9,061.4 | |
| Health— | ||||||
| Health | 2,961.1 | 2,957.3 | 3,397.1 | 3,387.5 | 3,633.1 | 3,622.7 |
| Transport and communications— | ||||||
| Transport | 924.2 | 670.5 | 774.1 | 654.8 | 1,013.1 | 718.9 |
| Communications | 2,322.2 | 368.9 | - | - | - | - |
| 3,246.4 | 1,039.5 | 774.1 | 654.8 | 1,013.1 | 718.9 | |
| Debt services and miscellaneous investment and financing transactions— | ||||||
| Debt services | 4,091.9 | 4,091.9 | 4,970.9 | 4,970.9 | 4,575.0 | 4,575.0 |
| Miscellaneous investment transactions | 3.8 (11.9) | 3,460.0 | (1,241.2) | 15,539.4 | (3,228.4) | |
| Miscellaneous financing transactions | - | (488.2) | - | (652.3) | - | (816.8) |
| 4,095.7 | 3,591.8 | 8,430.9 | 3,077.3 | 20,114.4 | 529.7 | |
| Total | 35,480.9 | 20,945.1‡ | 32,585.8 | 23,116.6§ | 45,642.4 | 23,068.5¶ |
The structure of table 25.2 has changed noticeably when compared with those produced in previous Yearbooks. Since the 1986–87 financial year two net expenditure levels have been identified, and consequently two amounts to be financed from borrowing (or surpluses where relevant) have been defined. This occurred as a result of the decision to identify separately the expenditure which has been incurred on major projects and producer boards refinancing.
The first of these total expenditure figures includes amounts provided for in the estimates, unauthorised expenditure, and expenditure under permanent legislative authority. The second also incorporates expenditure on major projects and producer boards refinancing. Items included in this category were:
New Zealand Steel Development Limited;
Petroleum Corporation of New Zealand Limited;
New Zealand Refining Company Limited;
New Zealand Synthetic Fuels Corporation Limited;
New Zealand Meat Producers Board;
New Zealand Dairy Board;
Rural Banking and Financing Corporation; and
Shipping Corporation of New Zealand.
Details of the transactions involved are outlined in the 1986 Budget.
In addition the accounting treatment of some new items in this table has made it difficult to compare directly the net expenditure since the 1986–87 financial year with previous years.
The changes that occurred were:
The Family Support tax rebate is shown as an expenditure item. If it was categorised on a similar basis to the Principal Income Earner Rebate it would not increase expenditure, but decrease revenue.
Goods and services tax was collected for the first time in 1986–87. GST has increased net expenditure by departments and is offset by increased tax receipts. (Any net fiscal impact only occurs where payments and collections arise in different fiscal years.)
Import licensing revenue, formerly shown as a receipt in Vote Trade and Industry (and therefore appeared in net expenditure) is now more properly treated as a payment direct to the Consolidated Account and is included in ‘Interest profits and miscellaneous receipts’. Although there is no net impact on the deficit, net expenditure for trade and industry rose.
A decision was made to ‘gross up’ untaxed benefits and make them liable for taxation. The real value of the benefits remained unchanged but both revenue and expenditure increased.
Table 25.2. FINANCING OF GOVERNMENT EXPENDITURE
| Years ended 31 March | |||
|---|---|---|---|
| 1987 | 1988 | 1989 (estimated) | |
*In 1986–87, a net $3,358.0 million was spent of which $1,529.8 million was in Land use, $977.5 million in Fuel and power, $830.7 million in Other industrial services and $20.0 million in Transport. In 1987–88, $1,057.6 million was spent of which $370.7 million was in Fuel and Power, $10.0 million in Transport and $676.9 million from the Trust Account, in 1988–89, it is estimated that $2,300.0 million will be spent of which $321.1 million will be Fuel and power and the balance from the Trust Account. Source: Treasury. | |||
| $(million) | |||
| Expenditure*— | |||
| Administration | 1,471.2 | 2,223.5 | 2,626.9 |
| Foreign relations | 1,327.1 | 1,513.6 | 1,653.9 |
| Development of industry | 1,483.9 | 1,349.6 | 1,373.7 |
| Education | 2,595.2 | 3,118.2 | 3,481.3 |
| Social services | 6,479.2 | 7,791.9 | 9,061.4 |
| Health | 2,957.3 | 3,387.5 | 3,622.7 |
| Transport and communications | 1,039.5 | 654.8 | 718.9 |
| Debt services | 4,091.9 | 4,970.9 | 4,575.0 |
| Misc. investment transactions | (11.9) | (1,241.2) | (3,228.4) |
| Misc. financing transactions | (488.2) | (652.3) | (816.8) |
| Subtotal | 20,945.1 | 23,116.6 | 23,068.5 |
| Supplementary estimates | - | - | 200.0 |
| Total expenditure(1) | 20,945.1 | 23,116.6 | 23,268.5 |
| Expenditure on major projects and producer boards refinancing* | 3,358.0 | 1,057.6 | 2,300.0 |
| Total expenditure(2) | 24,303.1 | 24,174.2 | 25,568.5 |
| Financed from— | |||
| Direct taxation: | |||
| Income tax: | |||
| Individuals | 10,906.2 | 11,396.2 | 12,120.0 |
| Companies | 1,221.2 | 2,026.4 | 2,380.0 |
| Other | 304.4 | 377.3 | 790.0 |
| Other direct taxation | 98.7 | 120.6 | 195.0 |
| Indirect taxation: | |||
| Goods and services tax | 1,228.7 | 3,818.5 | 4,220.0 |
| Sales tax | 1,016.7 | 1,924.6 | 1,785.0 |
| Other indirect taxation | 2,213.2 | 1,354.8 | 985.0 |
| Highways taxation | 419.0 | 509.6 | 560.0 |
| Total taxation | 17,408.1 | 21,528.1 | 23,035.0 |
| Interest, profits and miscellaneous receipts | 1,584.4 | 2,055.6 | 2,494.1 |
| Total revenue | 18,992.5 | 23,583.8 | 25,529.1 |
| Amount financed from borrowing net of refinancing of major projects and producer boards (surplus) | 1,952.6 | (467.3) | (2,260.6) |
| Amount financed from borrowing including refinancing of major projects and producer boards (surplus) | 5,310.5 | 590.4 | 39.4 |
| Borrowing in New Zealand | 5,505.5 | 4,475.3 | |
| Less, repayments in New Zealand | 2,456.8 | 3,601.3 | |
| 3,048.7 | 874.0 | ||
| Plus, sales (less purchase) of investments | 706.1 | 480.6 | |
| Net borrowing/(repayment) in New Zealand | 3,754.8 | 1,354.6 | |
| Internal surplus/(deficit) | (1,555.7) | 764.2 | |
| Borrowing overseas | 12,523.0 | 7,771.7 | |
| Less, repayment overseas | 5,941.1 | 10,506.2 | |
| 6,581.9 | (2,734.5) | ||
| Plus, sales (less purchase) of overseas investments | (5,021.2) | 1,967.5 | |
| Net borrowing/repayment overseas | 1,560.7 | (767.0) | |
| Cash surplus/(deficit) | 5.0 | (2.8) | |
Table 25.3. GOVERNMENT EXPENDITURE: CONSOLIDATED ACCOUNT
| Years ended 31 March | |||
|---|---|---|---|
| Item | 1987 | 1988 | 1989 (estimated) |
*New votes established since 1 April 1986. Source: Treasury. | |||
| $(000) | |||
| Permanent appropriations— | |||
| Under special Acts, legislature— | |||
| Civil List | 8,102 | 9,454 | 9,674 |
| Debt services— | |||
| Interest | 4,069,438 | 4,947,762 | 4,545,000 |
| Transfer to Loans Redemption Account | 320,022 | 1,974,789 | |
| Administration and management | 22,437 | 23,140 | 30,000 |
| Debt services | 4,411,897 | 6,945,691 | |
| Superannuation | 219,369 | 417,905 | 585,829 |
| Miscellaneous | 116,292 | 108,975 | |
| Subtotal, permanent appropriations and debt servicing | 4,755,660 | 7,482,034 | |
| Annual appropriations— | |||
| General administration— | |||
| Vote— | |||
| Accident Compensation | 201 | 261 | 100,278 |
| Audit | 15,448 | 21,264 | 23,230 |
| Broadcasting | 280 | 444 | 490 |
| Building Performance Guarantee Corporation | 21 | 17 | - |
| Conservation* | 1,028 | 114,548 | 109,111 |
| Customs | 59,237 | 69,390 | 73,992 |
| Domestic and External Security Secretariat* | - | 219 | 347 |
| Environment, Commission for the | 2,076 | - | - |
| Environment, Ministry for the* | 1,248 | 5,019 | 58,248 |
| Environment, Parliamentary Commissioner for the* | 132 | 1,023 | 850 |
| Government Life Insurance Corporation | 39 | 61 | 85 |
| Inland Revenue (Programmes I–VI) | 186,850 | 244,165 | 330,076 |
| Internal Affairs (excl. Rates Rebate and Pacific Island Affairs) | 170,217 | 191,601 | 208,131 |
| Office of the Clerk of House of Representatives* | - | - | 9,566 |
| Ombudsmen | 2,198 | 1,690 | 2,365 |
| Parliamentary Counsel* | - | - | 1,554 |
| Parliamentary Service | 26,096 | 41,702 | 35,006 |
| Privacy Commissioner | 155 | 176 | 212 |
| Prime Minister's Office | 2,857 | 2,137 | 2,778 |
| Railways | 232 | 242 | 250 |
| State Services Commission | 167,472 | 128,156 | 110,275 |
| Statistics | 36,834 | 40,784 | 39,729 |
| Survey and Land Information* | 633 | 55,592 | 63,691 |
| Treasury | 32,810 | 206,431 | 119,210 |
| Valuation | 23,554 | 25,938 | 4,664 |
| Women's Affairs | 1,363 | 2,023 | 3,227 |
| General administration | 730,981 | 1,152,883 | 1,297,365 |
| Law and order— | |||
| Vote— | |||
| Crown Law | 5,390 | 8,292 | 10,205 |
| Justice | 280,724 | 412,353 | 528,760 |
| Police | 328,312 | 386,144 | 473,640 |
| Security Intelligence Service | 7,592 | 9,433 | 9,777 |
| Law and order | 622,022 | 816,222 | 1,022,382 |
| $(000) | |||
| Government services— | |||
| Vote— | |||
| Government Computing Service* | - | - | - |
| Government Printing Office | 45 | 1,430 | 2,000 |
| Works and Development | 194,125 | 1,616,734 | - |
| Government services | 194,170 | 1,618,164 | 2,000 |
| Subtotal, administration | 1,546,273 | 3,587,269 | 2,321,747 |
| Foreign relations— | |||
| Vote— | |||
| Defence | 1,095,961 | 1,278,488 | 1,413,010 |
| Foreign Affairs | 269,839 | 276,103 | 289,900 |
| Subtotal, foreign relations | 1,365,800 | 1,554,591 | 1,702,910 |
| Development of industry— | |||
| Land use— | |||
| Agriculture and Fisheries | 1,824,752 | 345,101 | 469,803 |
| Forest Service | 381,162 | - | - |
| Forestry* | 1,000 | 111,945 | 59,168 |
| Lands* | - | 19,239 | 19,698 |
| Lands and Survey | 136,276 | - | - |
| Maori Affairs (Part Progs. II and IV) | 51,743 | 52,680 | 64,176 |
| Rural Banking and Finance Corporation | 63,167 | 78,988 | - |
| Land use | 2,458,100 | 607,953 | 612,845 |
| Fuel and power— | |||
| Energy | 5,673,763 | 553,720 | 504,190 |
| Other industrial services— | |||
| Labour | 531,155 | 542,108 | 519,339 |
| Scientific and Industrial Research | 149,878 | 167,653 | 185,558 |
| Tourist and Publicity | 53,771 | 76,767 | 93,600 |
| Trade and Industry | 2,272,611 | 147,599 | 133,241 |
| Other industrial services | 3,007,415 | 934,127 | 931,738 |
| Subtotal, development of industry | 11,139,278 | 2,095,800 | 2,048,773 |
| Education— | |||
| Education | 2,617,899 | 3,179,340 | 3,568,828 |
| Social services— | |||
| Housing Corporation | 291,392 | 400,440 | 603,270 |
| Inland Revenue* | 186,906 | 403,406 | 350,000 |
| Internal Affairs (Rates Rebate and Pacific Island Affairs) | 5,054 | 4,921 | 6,253 |
| Maori Affairs (Progs. I, III and V, and part Progs. II and IV) | 97,386 | 182,759 | 201,204 |
| Social Welfare | 6,175,123 | 7,190,763 | 8,271,576 |
| Social services | 6,568,955 | 8,182,289 | 9,432,303 |
| Health— | |||
| Health | 2,961,132 | 3,397,077 | 3,633,139 |
| Transport and communications— | |||
| Transport— | |||
| Works and Development (Prog. III) | 1,278 | 1,690 | - |
| Transport | 466,326 | 307,378 | 313,068 |
| Transport and communications | 467,604 | 309,068 | 313,068 |
| Annual appropriations | 26,666,941 | 22,305,434 | 23,020,768 |
| $(000) | |||
| Unauthorised expenditure | 71,819 | 72,244 | |
| Transfer to Reserve Account | - | 40,000 | |
| Exchange differences on overseas transactions | 168,645 | 131,056 | |
| Total payments | 31,663,065 | 22,548,734 | |
Table 25.4. NATIONAL ROADS FUND: RECEIPTS AND PAYMENTS
| Years ended 31 March | |||
|---|---|---|---|
| Item | 1986 | 1987 | 1988P |
*Since 1 April 1987 the National Roads Board has reimbursed local authorities for subsidised work on receipt of claims. Previously 50 percent of the subsidy was advanced during the first quarter of the year. Source: Treasury. | |||
| Receipts— | $(000) | ||
| Excise duty | 268,841 | ||
| Motor spirits duty (less refunds) | 189,248 | 193,814 | .. |
| Road user charges (less refunds) | 210,520 | 210,562 | 240,756 |
| Other taxation, etc. | 23,837 | 14,640 | .. |
| Contribution from Consolidated Account | - | - | - |
| Receipts from land and property | 10,257 | 14,295 | 16,225 |
| Miscellaneous | 1,418 | 1,687 | 6,614 |
| Interest | 215 | 622 | 28,982 |
| Excess of payments over receipts | - | 20,961 | - |
| Total receipts | 435,495 | 456,581 | 561,418 |
| Payments*— | .. | ||
| State highways maintenance | 143,012 | 156,920 | .. |
| State highways construction | 54,936 | 65,460 | .. |
| Subsidies to local authorities | 170,287 | 189,258 | .. |
| Administration and general expenses | 32,559 | 38,002 | .. |
| Purchase of land and property | 4,647 | 6,934 | .. |
| Unauthorised expenditure | 7 | 7 | 6 |
| Excess of receipts over payments | 30,047 | - | 96,386 |
| Total payments | 435,495 | 456,581 | 561,418 |
| Balance at end of year | 38,091 | 38,091 | 113,516 |
Table 25.5. LOANS ACCOUNTS: RECEIPTS AND PAYMENTS
| Years ended 31 March | |||
|---|---|---|---|
| Item | 1986 | 1987 | 1988 |
* Includes capital equipment credit arrangements. Source: Treasury. | |||
| Receipts | $(000) | ||
| Loans raised— | |||
| In New Zealand | 3,876,277 | 5,479,324 | 2,840,384 |
| Overseas* | 1,972,008 | 33,380 | 21,337 |
| International Finance Agreements Act 1961— | |||
| Non-negotiable, non-interest-bearing stock and notes issued to international financial institutions | 276,309 | 6,236 | 104,327 |
| Premiums on issues | - | 27,822 | 6,537 |
| Total receipts | 6,124,594 | 5,546,762 | 3,876,100 |
| Payments | |||
| Permanent appropriations— | |||
| Subscriptions—Asian Development Bank (ADB) | 1,149 | 1,293 | 1,038 |
| International Bank For Reconstruction and Development (IBRD) | 468 | 463 | 256 |
| International Finance Corporation | - | - | 1,095 |
| International Monetary Fund (IMF) | 2 | 2 | 7 |
| Encashment of securities—Asian Development Bank | 3,000 | 2,000 | 900 |
| International Bank for Reconstruction and Development | 160 | - | 50 |
| Charges and expenses of raising loans | |||
| New Zealand | 332,044 | 363,877 | 155,670 |
| Overseas | 11,108 | - | - |
| Total, permanent appropriations | 347,931 | 367,635 | 159,016 |
| Annual appropriations— | |||
| Development of industry— | |||
| Energy | 197,900 | 317,000 | 52,300 |
| Social services— | |||
| Housing Corporation | 62,450 | 88,215 | 88,620 |
| Miscellaneous investment and financing transactions— | |||
| Capital participation— | |||
| Export-Import Corporation | 2,000 | - | - |
| Bank of New Zealand | - | - | - |
| New Zealand Steel Development Ltd | - | - | - |
| Petroleum Corporation of New Zealand Ltd | - | - | - |
| Tourist Hotel Corporation of New Zealand | 1,201 | - | - |
| Post Bank | - | - | 250,000 |
| State-owned enterprises | - | - | 3,200,500 |
| Housing Corporation | 155,100 | - | - |
| Post Office | 299,396 | 385,000 | - |
| Rural Banking and Finance Corporation | 80,000 | - | - |
| Total, annual appropriations | 798,047 | 790,215 | 3,591,420 |
| Capital equipment purchased under credit arrangements | 37,786 | 33,380 | 21,337 |
| Transfer to Consolidated Account | 1,580,000 | 11,410,000 | 750,000 |
| Transfer to Loans Redemption Account | 3,120,000 | - | |
| Security in favour of— | |||
| Asian Development Bank (ADB) | 1,724 | 1,939 | 1,557 |
| International Bank for Reconstruction and Development (IBRD) | 4,208 | 4,297 | - |
| International Monetary Fund (IMF) | 270,377 | - | 102,770 |
| Total payments | 6,160,073 | 12,607,681 | 4,626,100 |
| Excess of receipts over payments | Cr 35,479 | Cr 7,060,919 | Cr 750,000 |
| 6,124,594 | 5,546,762 | 3,876,100 | |
Table 25.6. PUBLIC ACCOUNTS: SUMMARY OF BALANCES
| Account | Balance at 31 March | ||
|---|---|---|---|
| 1986 | 1987 | 1988 | |
*Cash received but not yet allocated. Source: Treasury. | |||
| $(000) | |||
| Consolidated Account | 121,460 | 126,225 | 134,655 |
| Loans Redemption Account | 1,857,299 | 385,362 | 162,431 |
| Loans Account | 69,125 | 8,421 | 54,906 |
| National Roads Fund | 38,091 | 17,130 | 113,516 |
| Reserve Account | 363,635 | 396,543 | 415,861 |
| Suspense Account* | 2,103 | 1 | 7,473 |
| Trust Account | 93,776 | 5,924,026 | 3,545,943 |
| Total | 2,545,489 | 6,857,708 | 4,434,785 |
The following summary of the New Zealand tax system takes into account all relevant amending legislation effective at 31 March 1988. The tax year is from 1 April to 31 March.
Income tax is levied under the Income Tax Act 1976 and is chargeable on most forms of income received by individuals, companies, and estates. Income, because of its many forms, is not exhaustively defined, but includes earnings from the following: property; labour or effort; pensions, estates, and trusts; value of benefit allowances received in cash or kind; unemployment benefits and other income-tested benefits paid by the Department of Social Welfare; and wages or income (earnings-related compensation) paid by the Accident Compensation Corporation where a taxpayer is unable to work because of personal injury or incapacity. (Pensions paid by countries with which New Zealand has a double tax agreement are generally exempt from tax in the country of origin and subject to tax in New Zealand. If a pension is taxed in the country of origin, credit is allowed in a New Zealand income tax assessment for the overseas tax paid to the extent that it does not exceed New Zealand tax payable on that income).
There is no capital gains tax in New Zealand but certain ‘gains’ are deemed to be income. These are profits on the sale of patent rights, and profits on the sale of property (land and buildings). Generally, profits from ordinary sales of a person's private residence, business, or farm property, are exempt from tax. Apart from ordinary sales of a person's residence, business, or farm property, profits on sale of property are subject to income tax where the owner:
Acquires the property for the purpose or intention of resale;
Deals in property;
Is a builder;
Makes a profit which is primarily due to rezoning or likely rezoning;
Subdivides the property within 10 years of purchase; or
Subdivides the property more than 10 years after purchase and carries out extensive subdivisional work before selling. (Only the ‘development profit’ is taxable in this case.)
A ‘pay as you earn’ (PAYE) system of collecting income tax is used for individuals. Income for PAYE purposes falls into two general classes—
Salaries, wages and other remuneration—With these, PAYE tax is deducted at time of payment.
Business, farming, investment, and professional incomes—With these incomes, tax is not deducted at time of receipt but the taxpayer pays ‘provisional tax’, usually based on an estimate of the following year's income. Provisional tax is based on either the previous year's or current year's estimated residual income tax. ‘Residual income tax’ is basically the amount of the tax assessed (and any national superannuitant surcharge to which a taxpayer is liable in respect of the income year), reduced by the amount of tax deductions made from source deduction payments, any superannuitant surcharge paid by way of source deduction payments, family support tax credit, tax paid overseas, tax paid by trustees, etc.
In both cases an adjustment or ‘square-up’ is made when the return of income for the particular year is furnished. Tax is assessed on the basis of the annual return, and credit is allowed against the residual income tax for any provisional tax paid during the year. If there is an overpayment the taxpayer will receive a refund or credit against future tax—if insufficient tax was paid there will be further tax to pay. Similarly, in some situations, interest will be charged/paid on the under/over payment of provisional tax.
At the beginning of each year employees complete a tax code declaration, which also incorporates a tax deduction certificate. The certificate is returned to the employee on termination of employment or at the end of the financial year and shows the total amount of income earned; tax deducted; family support received; extra pays; superannuation deducted; the period of employment; and tax-free allowances.
This information is used when the employee completes a tax return at the end of the tax year.
The Family Support Tax Credit and Guaranteed Minimum Family Income Schemes were introduced in 1986 to replace the Family Rebate which had previously been available through the income tax system.
These schemes are designed to assist low-income families by providing regular financial assistance throughout the year rather than a lump sum payment at the end of each financial year, as had been the case with the previous income tax rebate. The entitlements are paid out in equal amounts to each spouse through one of three methods:
By reducing the PAYE tax deducted from a person's wages and thereby increasing the ‘take-home pay’; or
As a social welfare benefit or an increase to an existing benefit; or
As an income tax credit at the end of the financial year.
Families with children for whom family benefit is payable are eligible for the additional benefit from the Family Support Tax Credit and Guaranteed Minimum Family Income Schemes. The Family Support entitlement is $1,872 for the first child and a further $832 for every additional child.
Family Support now abates as follows:
| 1989 income year | |
| 0-$15,000 | nil in $ |
| $15,001-$16,000 | 9c in $ |
| $16,001-$27,000 | 18c in $ |
| $27,001 and over | 24c in $ |
| 1990 income year | |
| 0-$16,000 | nil |
| $16,001-27,000 | 18c in $ |
| $27,001 and over | 30c in $ |
The Guaranteed Minimum Family Income Scheme ensures that a family's net income is $15,288 per annum.
Most salary and wage earners file tax returns each year and refunds can arise as a result of exemptions and rebates being claimed which are not allowed for in the tax code declaration, or being employed for part of the year only. Most salary and wage earners use the return form IR 5, which is required to be completed and sent to the Inland Revenue Department by 7 June.
Salary and wage earners are assessed on their total taxable income, less any special exemptions. Rebates and the taxes previously paid are deducted from the tax assessed to give either a refund or further tax to pay. About 70 percent of returns result in a refund. Further information about exemptions and rebates follows.
Individuals who are self-employed or in partnership, or who receive income (which does not have tax deducted at source such as interest, dividends, rents or business income) pay provisional tax. Provisional tax is payable in three instalments. For the majority of taxpayers whose balance date is 31 March, payments are made in July, November and March each year and is calculated using as a base the previous year's or current year's estimated residual income tax.
Provisional taxpayers use form IR 3 which is to be furnished by 7 July for the majority of taxpayers. Expenses are deducted from the gross business or investment income and tax is calculated on the net income less any special exemptions. Credit is given for the provisional tax already paid and for any rebates. If there is an overpayment the taxpayer will receive a refund or credit against future tax. If insufficient tax was paid there will be further tax to pay. Similarly, in some situations interest is charged/paid on the under/overpayment of provisional tax.
For people in business, expenses which are incurred in producing income and are relevant and incidental to deriving that income, may be claimed as a deduction from income. Expenses of a private, domestic, or capital nature are not deductible.
Income is exempt from tax in New Zealand only if provisions are made in the Income Tax Act 1976.
Some of the more common items exempt from tax are the following: maintenance or alimony payments; the first $200 of interest and dividends from all sources; some war pensions and service disability pensions; interest on National Development Bonds (not exceeding $500 in any one year); income derived by charitable and certain non-profit organisations; lottery and raffle prizes.
Rebates are deducted from the total tax payable.
Table 25.8. REBATES: YEAR ENDED 31 MARCH 1989
| Rebate | Amount |
|---|---|
| Source: Inland Revenue Department. | |
| Transitional tax allowance | This can be claimed if net income was under $9,880 and the taxpayer worked for more than 20 hours each week. Further information is available from the Inland Revenue Department. |
| Housekeeper (under certain circumstances) | Limited to the smaller of 33 cents for each complete dollar of payment made or $310. |
| Child rebate | If the taxpayer was a child for whom the Family Benefit was payable, a rebate of $156 can be claimed. |
| Special home, farm, or fishing-vessel ownership account | 45 cents for each $1 of annual savings increase in Special Home, or Farm Ownership or Fishing Vessel Ownership Account. Maximum rebateable savings are: Home ownership—$3,000 per year (rebate $1,350); Farm ownership—$5,000 per year (rebate $2,250); Fishing vessel ownership—$5,000 per year (rebate $2,250). |
| First home mortgage rebate | A rebate of 31 cents for each dollar of qualifying interest is allowable to first home owners who also occupy the property. The maximum rebate is $1,000 in any one year and the rebate is allowable in respect of the first five years of ownership. The property must have been acquired prior to 9 November 1984. The year ended 31 March 1990 will be the last year in which this rebate can be claimed. |
| Donations | 33 percent of all qualifying charitable donations, the maximum rebate being $200. The minimum qualifying charitable donation is $5. |
| Low income rebate | See below. |
For the year ended 31 March 1989 there is a 19 percent surcharge on a national superannuitant's income other than national superannuation. An exemption of $7,800 applies to that other income before the surcharge takes effect. For married couples their combined exemption is $13,000.
Major changes have been made in the income tax legislation, and there are two basic rates of income tax after 1 October 1988. This means that a composite scale is in effect for the year 1 April 1988-31 March 1989. The two-step system comes into full application in the year 1989-1990. A rebate preserves the position of those on low incomes.
The composite rate of tax for the 1988-89 year is as listed in table 25.9.
Table 25.9. PERSONAL INCOME TAX RATES, YEAR ENDED 31 MARCH 1989
| Taxable income | Basic tax rate |
|---|---|
| Source: Inland Revenue Department. | |
| $ | cents |
| 0-9,500 | 19.5 |
| 9,500-30,000 | 27.0 |
| 30,000-30,875 | 36.0 |
| Over 30,875 | 40.5 |
The rate of tax for the 1989-90 year will be:
| Income not exceeding $30,875 | 24.0c for every dollar |
| Income exceeding $30,875 | 33.0c for every dollar |
The rebate compensates low income earners where their rate of tax would be 24 cents in the dollar. The rebate will ensure that low income taxpayers with income below $9,500 will continue to pay tax at the rate of 15 cents in the dollar.
The maximum rebate will be $855 at the income level of $9,500 and will reduce at the rate of 4 cents in the dollar for each dollar of income above this amount.
New Zealand residents—New Zealand residents are liable to New Zealand tax on all income including income from outside New Zealand. Credit is allowed for any tax paid overseas, but this is limited to the New Zealand tax payable on that income.
A New Zealand resident is defined for tax purposes as a person whose permanent place of abode is in New Zealand. In general where a person is present in New Zealand for a period of not less than 365 days, he or she will be classified as a New Zealand resident throughout that period. Conversely a person absent from New Zealand for a period of not less than 365 days will generally be treated as not resident during that absence. This means that people who come to New Zealand with the intention of residing permanently or to stay more than 365 days are taxed on their total income from all sources, both inside and outside New Zealand, as from the date of arrival.
Visitors—A person who comes to New Zealand and intends to stay less than 365 days is taxed as a visitor or non-resident. If he/she stays for a longer period he/she is normally deemed to be a resident for tax purposes. A person not resident in New Zealand is liable to New Zealand tax on income from New Zealand but not on income from outside New Zealand.
Visitors are taxed on income from a New Zealand employer for personal services while in New Zealand; income from an overseas employer for personal services in New Zealand (there are certain exemption periods which are outlined in the following paragraphs); and any other income from New Zealand sources. The employer deducts the tax from the salary or wages of a visitor in the same way as for a resident. The proportion is based on the amount of time spent working in New Zealand. Visitors are not entitled to claim the special exemption in respect of life insurance, or superannuation payments.
A visitor (other than a public entertainer) who performs personal (including professional) services in New Zealand for an overseas employer is exempt from New Zealand tax provided:
The length of the visit or visits is not more than 92 days in any income year; and
The income received from the performance of those personal services in New Zealand is chargeable with tax in the country where the visitor is normally resident.
Public entertainers are subject to a withholding tax of 20 percent on the gross income derived by them. This is a final tax unless the entertainer considers that the true rate will be lower. To be taxed at a lower rate, a return of the income received and expenses incurred in New Zealand must be furnished.
Agreements to avoid double taxation have been entered into between New Zealand and Australia, Belgium, Canada, China, Denmark, Fiji, Finland, France, Federal Republic of Germany, Japan, India, Italy, Korea, Malaysia, The Netherlands, Norway, Philippines, Singapore, Sweden, Switzerland, the United Kingdom, and the United States. A visitor from one of these countries who receives income for personal services in New Zealand from an overseas employer should refer to the relevant agreement. Depending on the circumstances and the terms of the particular agreement, the exemption period of 92 days could be extended.
Non-residents—The Income Tax Act 1976 also covers persons who are not resident in New Zealand during any part of the income year, but who derive income from a New Zealand source. A withholding tax is imposed on the following classes of income derived from New Zealand by non-residents—dividends interest, and royalties as defined payments.
The rate of tax is 30 percent on the gross payments of dividends, and 15 percent on gross payments of interest and royalties. It is a final tax on dividends, cultural royalties and on interest, except where the borrower and the lender are associated persons. On other royalties, ‘know how’ payments, and interest where the payer and payee are associated persons, it is a minimum tax. A later assessment may be made if the rate of income tax on the income is greater than the withholding tax.
These provisions may be varied by the double tax agreements, and the relevant agreement should be referred to.
Capital brought into New Zealand—Capital brought into New Zealand is free from tax, and there is no limit on the amount which may be brought into the country. However, income earned from investing that capital is taxable.
This is a tax at 48 percent of the value of taxable fringe benefits provided by an employer to an employee. It is payable by the employer quarterly during the year. There are three main groups of taxable fringe benefits. These are:
The private use or enjoyment of a motor vehicle, or the availability of a motor vehicle for private use or enjoyment, by an employee;
Low-interest loans; and
Other employment-related benefits, i.e., free, subsidised or discounted transport, goods and services (other than transport), employers’ contribution to superannuation funds, and employees’ accident, sickness or death benefit funds.
Company taxation is also levied under the Income Tax Act 1976, although companies in New Zealand are taxed in a different way from individual taxpayers. The main differences are that:
A company does not get any of the special exemptions or rebates which the individual taxpayer may claim;
A company does not get the interest exemptions;
Dividends received by a company incorporated in New Zealand are exempt from income tax. This exemption does not apply to life insurance companies; and
The rate of income tax is different.
Income tax—Resident companies pay tax on their income at the flat rate of 28 cents in the dollar.
Excess retention tax—Privately-controlled New Zealand investment companies are liable for an ‘excess retention tax’ if the investment company does not pay a dividend equal to at least 40 percent of its tax-paid profits and 100 percent of its dividends from other companies. The rate of excess retention tax is 35 cents in the dollar on any ‘insufficient distribution’. A refund of excess retention tax paid will be made if, in a later year, the investment company declares a dividend greater than the amount needed for that year.
Differing methods of assessment apply to overseas shipping companies, life insurance companies and certain types of mining companies.
Non-resident companies are taxed in the same way as resident companies except that they pay an additional tax of 5 percent of their income on top of the 28 percent rate payable by a resident company. Dividends paid to non-residents are subject to a non-resident withholding tax of 30 percent of the gross income. A withholding tax of 15 percent is payable on interest and royalties. Both of these rates may be limited by the various double tax agreements. This is the final liability except for interest paid between associated persons and royalties (other than ‘cultural’ royalties), when there may be an end-of-year assessment.
These provisions may be varied by a double taxation agreement and the relevant agreement should be referred to. Special concessions apply to non-resident investment companies receiving dividends or interest from approved ‘development investments’, and processors of minerals to the primary metal stage under a ‘special development project’.
This is a broad-based consumer tax levied at a flat rate of 10 percent on all goods and services supplied in New Zealand by a registered person.
GST does not cover private recreation pursuits or hobbies, employment under a contract of service, or exempt activities. It does apply to some business sales of land and property, local authority rates, fire and general insurance and supplies made by government departments.
Suppliers of goods and services who are registered for GST pay GST on purchases of goods and services, but a credit may be claimed for this tax. Therefore no GST is borne by the supplier, who includes GST in the price of the goods and services sold. This amount, less the input tax paid, is remitted with a GST return to the Inland Revenue Department. GST is therefore only borne by the final consumer.
Registration for GST is compulsory where the value of gross turnover exceeds $24,000 in any 12-month period. Registration is optional for persons with an annual turnover under $24,000 but there are advantages in registering, as unregistered persons cannot claim a credit for GST included in their costs.
The point at which GST is levied is generally the earlier date of invoice or payment. The standard return period is two months.
From its introduction on 1 October 1986 to 31 March 1987, $719.46 million was collected in GST.
Land tax is assessed on the total ‘land value’ of land owned at 31 March each year after allowing any special exemption. Both companies and individual taxpayers are liable to land tax, which is due and payable on 7 October each year.
Various types of land, including land used solely or principally for farming or agricultural activities, and various land owners are exempt from land tax.
Special exemption—The exemption is $175,000 reduced by $1 for every $1 by which the ‘land value’ exceeds $175,000. Thus no exemption is allowable when the ‘land value’ exceeds $350,000.
Rate of land tax—Land tax is charged at a flat rate of 2 percent of the taxable land value (land value after exemptions).
Special adjustments—There are special adjustments for absentee owners and in addition companies and estates can be subject to a special basis of assessment.
Generally, estate duty is a tax on the total net wealth of a deceased person.
The first $450,000 of the final balance of a deceased estate is exempt from death duties, but a 40 percent duty is payable on any amount above $450,000.
The following reliefs have been abolished: widows; widowers; infant children; orphan infant children; and lineal ancestors or lineal descendants in the estates of deceased servicemen. However, there are the following exemptions from estate duty:
Joint family homes—A home registered under the Joint Family Homes Act 1964 is excluded from the dutiable estate of the first spouse to die.
Matrimonial home allowance—Where the deceased had an interest in a matrimonial home (other than a joint family home) that interest is excluded if the home or other property of equivalent value passes to the surviving spouse.
Pensions from superannuation funds—These are excluded from the estate up to $2,000 per annum if payable to the deceased's spouse for the rest of his or her life or until remarriage.
Personal chattels—The value of any furniture and personal effects passing to the surviving spouse is excluded from the dutiable estate. In addition, the first $6,000 of personal chattels passing to any other person is also excluded from the estate.
Charitable bequests—Bequests to charities of up to $25,000 are exempt from duty.
The pamphlet Estate and Gift Duties, available from the Inland Revenue Department, supplies more information.
Stamp duty is no longer payable on instruments executed on or after 17 March 1988, except for duty payable in respect of commercial land and buildings. Duty has been abolished in respect of property such as shares, mortgages, counterparts and goodwill and residential property.
Table 25.10. RATES OF STAMP DUTY
| Type of document | Rate of duty |
|---|---|
| Source: Inland Revenue Department. | |
| Transfer of— | |
| Mortgage, debenture, shares, share rights, mining rights | 40 cents for each $100 or part of $100 of the value of the property. |
| Transfer of commercial land and buildings | 1 percent for the first $50,000 of the value of the property; 1.5 percent for the excess over $50,000 up to $100,000; 2 percent for the excess over $100,000. |
| Cheques (as from 4 July 1980) | 5 cents for each bill of exchange. |
The pamphlet Stamp Duty, available from the Inland Revenue Department, supplies more information.
Individual or aggregated gifts with a value of over $27,000 are subject to gift duty.
A gift statement is required to be filed with the Inland Revenue Department for any gift or gifts valued at $12,000 or more.
There is an exemption for small gifts of up to $2,000 in value made by a donor in good faith as part of the normal expenditure.
Table 25.11. RATES OF GIFT DUTY*
| Value of item | Rate of duty |
|---|---|
*Applies to all dutiable gifts made on or after 1 April 1984. Source: Inland Revenue Department. | |
| $ | |
| Not exceeding 27,000 | Nil |
| 27,001-36,000 | 5 percent on excess over $27,000 |
| 36,001-54,000 | $450 plus 10 percent of excess over $36,000 |
| 54,001-72,000 | $2,250 plus 20 percent of excess over $54,000 |
| Exceeding 72,000 | $5,850 plus 25 percent of excess over $72,000 |
Fuel tax equal to 9.9c per litre from all lightweight petrol, lpg, and cng powered vehicles using public roads is paid into the National Roads Fund. All heavy motor vehicles, including trailers, and all remaining lightweight vehicles (mainly diesel-powered), are required to purchase distance licences at a cost which varies according to their nominated maximum gross weight, their axle configuration, and the distance they travel.
The government taxation on totalisator turnover is at the rate of 5.5 percent of gross on-course and off-course investments for each day of a race meeting conducted by a totalisator club. For race meetings conducted by a restricted totalisator club the rate for each day of a race meeting is 5 percent of the amount (if any) by which the gross investments on that day's races exceeds $300,000. A totalisator club is entitled to a rebate of duty equal to 2.5 percent of the first $100,000 of the gross investments received by the club in any one year.
Totalisator turnover for the year ended 31 July 1987 rose by 16.64 percent, from $835.9 million in the previous year to $975 million.
The Inland Revenue Department Act 1974 provides for the establishment of one or more taxation review authorities. There are now three authorities. Each consists of one person who is a barrister or solicitor of the High Court of not less than seven years practice, and is appointed by the Governor-General. The functions of the authority are to sit as a judicial authority for hearing and determining such objections to assessments of tax or duty, or the decisions or determinations of the Commissioner of Inland Revenue, as are authorised by the relevant legislation. A determination of an authority is subject to an appeal to the High Court as to any question or fact (where the tax or duty exceeds $2,000) and to any question of law.
A summary of income tax revenue and total public account taxation revenue is given for a series of years in table 25.12.
Table 25.12. SUMMARY OF TAX REVENUE
| Year ended 31 March | Income tax | Percentage of total taxation (all sources) | Total public account taxation | ||
|---|---|---|---|---|---|
| Total | Per head of mean population | Total* | Per head of mean population | ||
* Includes taxation revenue paid into both the Consolidated Account and the National Roads Fund. Source: Treasury. | |||||
| $(million) | $ | % | $(million) | $ | |
| 1975 | 2,136.0 | 701.01 | 74.5 | 2,865.3 | 940.37 |
| 1980 | 4,465.6 | 1,429.10 | 74.2 | 6,020.0 | 1,926.52 |
| 1985 | 8,348.5 | 2,556.73 | 70.1 | 11,913.6 | 3,648.61 |
| 1986 | 10,567.2 | 3,210.94 | 74.2 | 14,235.9 | 4,325.70 |
| 1987 | 12,431.8 | 3,785.80 | 71.4 | 17,408.1 | 5,301.20 |
Table 25.13. RECEIPTS OF TAXATION
| Item | Years ended 31 March | ||
|---|---|---|---|
| 1986 | 1987 | 1988 | |
*Additional to portions paid into National Roads Fund. Source: Treasury. | |||
| $(million) | |||
| Consolidated Account— | |||
| Direct taxation— | |||
| Income tax | 10,567.2 | 12,431.8 | 13,799.9 |
| Estate and gift duty | 28.4 | 35.1 | 49.4 |
| Land tax | 55.9 | 63.6 | 71.2 |
| Total, direct taxation | 10,651.5 | 12,530.5 | 13,920.5 |
| Indirect taxation— | |||
| Goods and services tax | ... | 1,228.7 | 3,818.5 |
| Customs and excise duty | 741.5 | 1,461.3 | 2,771.8 |
| Beer duty | 225.3 | 115.7 | - |
| Motor spirits duty* | 208.7 | 127.9 | - |
| Motor vehicle fees and charges | 121.5 | 129.0 | 120.0 |
| Sales tax | 1,553.6 | 1,016.7 | - |
| Racing duty | 69.8 | 67.1 | 52.9 |
| International departure tax | 16.7 | 10.6 | - |
| Domestic air travel tax | 17.7 | 11.7 | - |
| Energy resources levy | 72.1 | 82.7 | 77.5 |
| Stamp duties— | |||
| On instruments | 110.4 | 180.9 | 226.0 |
| On cheques, etc. | 16.8 | 18.3 | 19.8 |
| Lottery duty | 9.4 | 7.9 | 10.8 |
| Total, indirect taxation | 3,160.8 | 4,458.6 | 7,098.0 |
| Total, taxation receipts to Consolidated Account | 13,812.3 | 16,989.1 | 21,018.5 |
| National Roads Fund— | |||
| Highways taxation | 423.6 | 419.0 | 509.6 |
| Total public account taxation | 14,235.9 | 17,408.1 | 21,528.1 |
Table 25.14. COMPARISON OF PUBLIC ACCOUNT TAXATION AND NATIONAL DISPOSABLE INCOME
| Year ended 31 March | National disposable income | Public account taxation | |
|---|---|---|---|
| Total | Percentage of national disposable income | ||
| Source: Treasury. | |||
| $(million) | percent | ||
| 1983 | 28,202 | 10,097.5 | 35.8 |
| 1984 | 30,370 | 10,431.2 | 34.3 |
| 1985 | 34,434 | 11,913.6 | 34.6 |
| 1986 | 39,277 | 14,235.9 | 36.2 |
| 1987 | 46,599 | 17,408.1 | 37.4 |
Table 25.15. INCOME OF COMPANIES
| Year ended 31 March | Number of returns | Assessable income before losses* | Assessable income | Ordinary dividends received† | Income tax assessed† | Export tax credits |
|---|---|---|---|---|---|---|
*Assessable income before deduction of losses carried forward from previous years. †Includes non-resident withholding tax. | ||||||
| $(million) | ||||||
| 1981 | 80826 | 2,186.2 | 1,865.4 | 364.8 | 748.5 | 185.5 |
| 1982 | 82190 | 2,728.5 | 2,419.1 | 535.1 | 962.3 | 259.6 |
| 1983 | 82720 | 2,749.9 | 2,492.6 | 618.4 | 991.9 | 301.3 |
| 1984 | 83920 | 3,742.4 | 3,281.9 | 863.4 | 1,261.8 | 434.8 |
| 1985 | 86820 | 4,977.0 | 4,345.9 | 1,458.3 | 1,622.8 | 586.1 |
A strict comparison of the figures for any year with those of another is not possible, as changes in compilation practice and numerous amendments in income tax law have affected the comparability of the figures.
The principal legislative measure which is concerned with public indebtedness is the Public Finance Act 1977. The money comprising the public debt has been borrowed on the security of the public revenues of New Zealand. No portion of the public estate is pledged for either principal or interest.
Most of the present public debt was borrowed for national development. A National Development Loans Account, into which money for national development was to be paid, has been established within the Public Account since 1942. Money from this account, now renamed the Loans Account, is transferred as required to the Consolidated Fund or to accounts now outside the public accounts such as the Housing Corporation. Transfers and appropriations during the latest three years are given in section 25.1.
Table 25.16. TOTAL PUBLIC DEBT OUTSTANDING
| Type and currency | Outstanding at 31 March | Increase or decrease | |
|---|---|---|---|
| 1986 | 1987 | ||
*Treasury bills. Source: Treasury | |||
| $(000) | |||
| External debt— | |||
| Pounds sterling | 1,905,125 | 1,819,039 | -86,086 |
| Deutschmarks | 1,419,145 | 1,404,736 | -14,409 |
| Dutch guilders | 166,037 | 157,108 | -8,929 |
| Japanese yen | 4,579,490 | 6,055,083 | 1,475,593 |
| United States dollars | 4,362,524 | 8,968,997 | 4,606,473 |
| Swiss francs | 1,858,682 | 2,491,208 | 632,526 |
| Australian dollars | 4,924 | 1,840 | -3,084 |
| Canadian dollars | 18,116 | 11,939 | -6,177 |
| European currency unit | 397,298 | 814,416 | 417,118 |
| Miscellaneous | 14,856 | 10,593 | -4,263 |
| Internal debt— | |||
| Long-term | 16,496,069 | 19,573,918 | 3,077,849 |
| Floating debt* | 779,980 | 1,170,000 | 390,020 |
| Total | 32,002,246 | 42,478,877 | 10,476,631 |
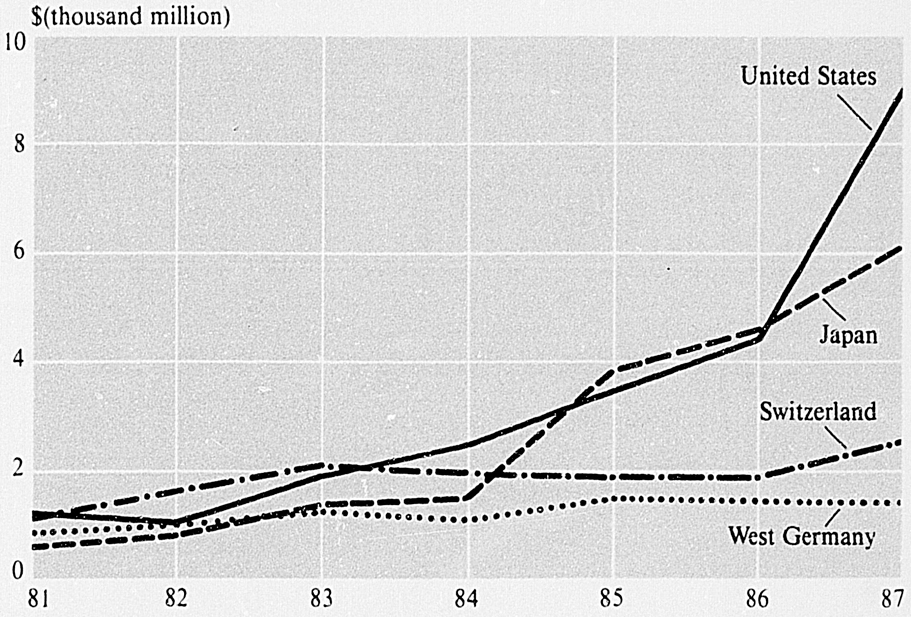
OVERSEAS DEBT—to selected countries
Table 25.17. EXTERNAL AND INTERNAL PUBLIC DEBT
| Outstanding at 31 March | External debt | Internal debt/Amount | Total debt | |||
|---|---|---|---|---|---|---|
| Amount | Percent of total debt | Amount | Percent of total debt | Amount | Percent increase on previous year | |
| Source: Treasury. | ||||||
| $(million) | $(million) | $(million) | ||||
| 1979 | 2,920.1 | 33.1 | 5,899.4 | 66.9 | 8,819.5 | 17.8 |
| 1980 | 3,567.5 | 34.5 | 6,778.9 | 65.5 | 10,346.4 | 17.3 |
| 1981 | 4,236.1 | 36.5 | 7,381.0 | 63.5 | 11,617.1 | 12.3 |
| 1982 | 5,549.4 | 38.6 | 8,832.0 | 61.4 | 14,381.4 | 23.8 |
| 1983 | 7,764.7 | 41.4 | 10,968.0 | 58.5 | 18,732.8 | 30.3 |
| 1984 | 8,226.3 | 37.6 | 13,652.4 | 62.4 | 21,878.7 | 16.8 |
| 1985 | 12,409.5 | 43.9 | 15,836.8 | 56.1 | 28,246.3 | 29.1 |
| 1986 | 14,726.2 | 46.0 | 17,276.0 | 54.0 | 32,002.2 | 13.3 |
| 1987 | 21,734.9 | 51.2 | 20,743.9 | 48.8 | 42,478.8 | 32.7 |
| 1988 | 17,256.9 | 44.1 | 21,854.6 | 55.9 | 39,111.4 | -7.9 |
Table 25.18. GROSS INDEBTEDNESS OF CENTRAL GOVERNMENT
| As at 31 March | Amount | Per head of population | As at 31 March | Amount | Per head of population |
|---|---|---|---|---|---|
| Source: Treasury. | |||||
| $(m) | $ | $(m) | $ | ||
| 1982 | 14,381 | 4,508.13 | 1985 | 28,246 | 8,582.02 |
| 1983 | 18,733 | 5,799.62 | 1986 | 32,002 | 9,729.12 |
| 1984 | 21,879 | 6,700.05 | 1987 | 42,479 | 12,796.04 |
Table 25.19. INTEREST PAYMENTS
| Year ended 31 March | Interest | Interest on overseas debt as percentage of exports of goods and services* | Recovery of interest from government enterprises and investments† | Net interest cost | Net cost as a percentage of total taxation | ||
|---|---|---|---|---|---|---|---|
| Overseas | New Zealand | Total | |||||
*Revised to include exports of goods and services. †Revised to include interest credited to the Reserve Account. ‡Estimated. Source: Treasury. | |||||||
| $(000) | |||||||
| 1983 | 514,955 | 960,837 | 1,475,792 | 5.6 | 740,189 | 735,603 | 7.3 |
| 1984 | 620,199 | 1,394,676 | 2,014,875 | 5.7x | 815,197 | 1,199,678 | 11.5 |
| 1985 | 896,808 | 1,633,225 | 2,530,033 | 6.7 | 1,018,236 | 1,511,797 | 12.7 |
| 1986 | 1,026,427 | 2,275,953 | 3,302,380 | 7.4x | 1,485,837 | 1,816,543 | 12.8 |
| 1987 | 1,292,131 | 2,777,307 | 4,069,438 | 8.7‡ | 1,664,644 | 2,404,792 | 13.8 |
Table 25.20. MATURITY DATES OF PUBLIC DEBT OUTSTANDING, AS AT 31 MARCH 1988
| Loans maturing in financial year ending 31 March* | Due | |||
|---|---|---|---|---|
| New Zealand | Total debt (nominal amount) | |||
| Overseas | Public | Departmental and other | ||
*In respect of many of the loans the Government has the option to redeem the securities at an earlier date. †At 31 March 1987 the obligation in respect of premiums on redemptions was $501,311,142. Source: Treasury. | ||||
| $(000) | ||||
| 1988 | 1,286,258 | 1,762,156 | 676,664 | 3,725,078 |
| 1989 | 968,212 | 2,129,194 | 879,485 | 3,976,891 |
| 1990 | 2,284,586 | 2,101,324 | 776,503 | 5,162,413 |
| 1991 | 1,303,010 | 1,255,328 | 649,283 | 3,207,621 |
| 1992 | 3,481,512 | 2,655,643 | 1,126,732 | 7,263,887 |
| 1993 | 1,731,522 | 740,672 | 374,996 | 2,847,190 |
| 1994 | 2,281,178 | 356,613 | 417,138 | 3,054,929 |
| 1995 | 1,672,479 | 726,034 | 540,310 | 2,938,823 |
| 1996 | 365,572 | 302,884 | 153,216 | 821,672 |
| 1997 | 647,624 | 324,232 | 198,868 | 1,170,724 |
| 1998 | 614,488 | .. | .. | 614,488 |
| 1999 | 250,930 | .. | .. | 250,930 |
| 2000 | 51,680 | 17,275 | 67,725 | 136,680 |
| 2001 | 950,961 | .. | .. | 950,961 |
| 2002 | 51,680 | 65,125 | 59,875 | 176,680 |
| 2003 | 51,680 | .. | .. | 51,680 |
| 2004 | 51,680 | .. | .. | 51,680 |
| 2005 | 51,681 | .. | .. | 51,681 |
| 2006 | 411,393 | .. | .. | 411,393 |
| 2007 | 591,249 | .. | .. | 591,249 |
| 2008 | 51,540 | .. | .. | 51,540 |
| 2009 | 298,657 | .. | .. | 298,657 |
| 2010 | 26,792 | .. | .. | 26,792 |
| 2011 | 269,784 | .. | .. | 269,784 |
| 2015 | 278,474 | .. | .. | 278,474 |
| 2017 | 629,497 | .. | .. | 629,497 |
| Inflation Adjusted Savings Bonds† | .. | 643,022 | .. | 643,022 |
| Kiwi Bonds | .. | 272,605 | 24,000 | 296,605 |
| Kiwi Savings Stock | 249,958 | 1 | 249 | 959 |
| Our N.Z. Bonds | .. | 27,057 | .. | 27,057 |
| Premium Stock | .. | .. | .. | .. |
| Treasury bills | .. | 585,000 | 585,000 | 1,170,000 |
| Sovereign notes | 1,080,840 | .. | .. | 1,080,840 |
| Total | 21,734,959 | 14,214,122 | 6,529,796 | 42,478,877 |
Table 25.21. PUBLIC DEBT TRANSACTIONS, 1986-87
| New Zealand | Overseas | |
|---|---|---|
| Source: Treasury. | ||
| $(000) | ||
| Loans raised (gross value)— | ||
| For general purposes | 5,479,324 | .. |
| Capital equipment credit arrangements | .. | 33,380 |
| For repayment of loans (incl. Tsy bills and Sovereign notes) | 9,992,755 | 12,589,150 |
| Total, loans raised | 15,472,079 | 12,622,530 |
| Loans repaid— | ||
| For general repayments (incl. Tsy bills and Sovereign notes) | 12,004,210 | 5,803,213 |
| Capital equipment credit arrangements | .. | 96,193 |
| International Bank for Reconstruction and Development | .. | 613 |
| Total, loans repaid | 12,004,210 | 5,900,019 |
| Increase (decrease) in debt due to— | ||
| 1 June 1986 realignment | .. | (472,329) |
| 1 September 1986 realignment | .. | 2,649,189 |
| 1 December 1986 realignment | .. | (383,356) |
| 1 March 1987 realignment | .. | (1,507,253) |
| Total, realignments increase (decrease) | .. | 286,251 |
| Net increase (decrease) during the year | 3,467,869 | 7,008,762 |
| Public debt at 1 April 1986 | 17,276,049 | 14,726,197 |
| Public debt at 31 March 1987 | 20,743,918 | 21,734,959 |
| 42,478,877 | ||
Table 25.22. PUBLIC DEBT HELD BY GOVERNMENT DEPARTMENTS
| As at 31 March | |||
|---|---|---|---|
| 1985 | 1986 | 1987 | |
| Source: Treasury. | |||
| $(000) | |||
| Investments held by accounts within the Public Account | 5,872 | 5,871 | 5,771 |
| Earthquake and War Damage Commission | 1,028,364 | 1,224,491 | 1,407,838 |
| Government Life Insurance | 243,437 | 293,201 | 395,439 |
| Government Superannuation Board | 1,219,780 | 1,240,188 | 1,553,570 |
| Maori Trustee | 1,600 | 826 | 1,300 |
| National Provident Fund | 263,728 | 365,321 | 587,570 |
| Post Office | 1,776,173 | 1,439,094 | 1,266,068 |
| Public Trustee | 7,075 | 4,800 | 8,412 |
| Reserve Bank | 1,077,608 | 485,500 | 831,009 |
| Housing Corporation of New Zealand | 95,952 | 105,117 | 123,364 |
| Rural Banking and Finance Corporation | 76,308 | 81,169 | 312,209 |
| State Insurance Office | 18,045 | 27,045 | 37,246 |
| Total | 5,813,942 | 5,272,623 | 6,529,796 |
Section 3.4 describes the general aspects of local government.
Local government is concerned with the provision of local facilities with funds levied from the area. Territorial authorities raise money mainly by rates on property and by loans. They expend it on the provision of roads, water supply, sewerage, transport, recreational, and a wide range of other services. Electric power boards and harbour boards, among the larger of the other local authorities, collect revenue from consumers or users in payment for the facilities or services provided. Hospital boards and area health boards, which are funded through the Department of Health, are omitted from most of the statistics contained in this section. A special note is made where they are included, while summarised data relating to hospital boards and area health boards can be found in chapter 8.
In general, the local authority financial year ends on 31 March. Exceptions are harbour boards, where the year ends on 30 September and united councils, where the year ends on the last day of February.
The Government is completing a review of local government and its funding (see section 3.4).
Territorial authorities are largely dependent on revenue from rates to carry out their activities.
Rating provides a financial base which is independent of central government, is relatively cheap to administer and can be adapted to suit local circumstances. There are three main systems of rating:
land value;
capital value (i.e., land plus improvements); and
annual (rental) value.
As at 31 March 1987, most territorial authorities in New Zealand, i.e., 179 from a total of 221, rated on the land value system; 33 rated on the capital value; 9 rated on the annual value; and, 11 rates on the capital and land values in different parts of their districts.
For rating on either the capital value or the land value, the rating roll is based on the district valuation roll prepared by Valuation New Zealand (see section 14.1). Where the rating is on the annual value, the territorial authority generally prepares its valuation roll on the basis of the valuations made by its own valuers. Provision is made for the Valuer-General to act as a territorial authority valuer where an annual roll is to be prepared.
The Rating Powers Act 1988 provides for the levying of rates. The Act consolidated and rationalised the rating powers of the different types of local authority, and revised the machinery provisions governing rating in the Rating Act 1967.
There are three broad classes of territorial authority rates:
General—for general purposes;
Separate rates—levied for a variety of purposes including works and services, fire protection, sewerage and storm water drainage and lighting; and
Special rates—may be imposed to secure the repayment of loans.
A territorial authority may levy each year on each separately rateable property a uniform annual charge not exceeding $150 (or a lesser amount in the case of any rating area where the levying of a charge of $150 would exceed the maximum authorised general rate). In addition there is a wide range of services for which uniform charges may be levied instead of separate rates.
Income from the sale of commodities and services includes: the sale of electricity and gas, public transport fares, and other user charges for council facilities such as libraries, swimming pools and car-parking spaces. Income from licences includes dog registration fees and inspection fees.
Subsidies and grants play an important role in providing revenue for all local authorities but are particularly significant for education boards and hospital and area health boards, which are financed almost entirely by this means. For other local authorities, grants and subsidies have historically been tied to expenditure on particular functions and often made only where specified conditions are fulfilled. Examples of these are as diverse as agricultural pest control grants to territorial authorities and pest destruction boards, and home improvement advisory services grants and National Roads Board subsidies to territorial authorities. Many of these are now being phased out, although National Roads Board subsidies remain a substantial source of income to many rural authorities.
Under revenue sharing the government shared some of its tax revenue with territorial and regional authorities, with authorities able to spend it how they saw fit.
It was announced in the 1988 Budget that the revenue sharing scheme would be terminated from 1 April 1989.
Under the general revenue assistance component $26.4 million plus GST was distributed to territorial and regional authorities in the year ended 31 March 1988. Under the incentive grant component $3.6 million plus GST was allocated to territorial and regional authorities in the same year.
Table 25.23. SOURCES OF REVENUE OF ALL LOCAL AUTHORITIES*
| Year ended 31 March | Rates, levies, fines, etc. | Grants from central and local government | Sales of commodities and services incl. water rates | Other receipts | Total receipts |
|---|---|---|---|---|---|
| * Includes electric power boards. | |||||
| $(000) | |||||
| 1982 | 608,844 | 250,294 | 1,506,993 | 129,537 | 2,495,668 |
| 1983 | 714,680 | 300,575 | 1,804,035 | 159,792 | 2,977,081 |
| 1984 | 763,612 | 392,607 | 1,884,822 | 187,288 | 3,228,329 |
| 1985 | 812,900 | 429,671 | 2,070,393 | 216,607 | 3,529,571 |
| 1986 | 919,474 | 461,630 | 2,430,889 | 306,530 | 4,118,522 |
Table 25.24. RECEIPTS OF LOCAL AUTHORITIES, 1985-86
| Local authority | Rates, levies, fines, etc. | Grants from central and local government | Sales of commodities and services | Other receipts | Total receipts |
|---|---|---|---|---|---|
| $(000) | |||||
| City and borough councils | 600,032 | 146,742 | 671,163 | 136,813 | 1,554,750 |
| County councils | 187,607 | 143,910 | 56,089 | 22,414 | 410,021 |
| District councils | 53,005 | 24,532 | 25,566 | 8,083 | 111,186 |
| Electric power boards | 31 | 89 | 1,120,371 | 37,313 | 1,157,805 |
| Harbour boards | 1,190 | 25 | 228,166 | 43,628 | 273,009 |
| Regional authorities | 7,811 | 90,440 | 100,497 | 37,184 | 235,933 |
| Urban drainage boards | 22,965 | 6,270 | 1,478 | 2,363 | 33,076 |
| Catchment boards | 29,502 | 16,580 | 10,077 | 8,514 | 64,673 |
| Pest destruction boards | 5,904 | 5,608 | 637 | 586 | 12,736 |
| Urban transport board | 8,091 | 4,003 | 6,511 | 2,035 | 20,639 |
| Other local authorities | 3,334 | 23,429 | 210,334 | 7,599 | 244,694 |
| Total | 919,474 | 461,630 | 2,430,889 | 306,530 | 4,118,522 |
The purchase of goods and services makes up over half the expenditure of local authorities. Other substantial areas are: labour costs, which are one-third of the total, and interest payments. Traditional areas of local authority expenditure are roading, water supply, sewerage, drainage and refuse collection while local authority responsibilities have tended to increase in areas such as land use planning and the provision of recreation and welfare services.
Table 25.25. PAYMENTS BY ALL LOCAL AUTHORITIES
| Year ended 31 March | Labour and related costs | Purchases of commodities and services | All interest | Other payments | Total payments |
|---|---|---|---|---|---|
| $(000) | |||||
| 1982 | 767,966 | 1,251,488 | 139,415 | 152,909 | 2,311,778 |
| 1983 | 859,376 | 1,502,280 | 159,888 | 178,410 | 2,699,955 |
| 1984 | 908,671 | 1,652,928 | 192,528 | 221,863 | 2,975,990 |
| 1985 | 959,304 | 1,822,994 | 211,326 | 263,998 | 3,257,622 |
| 1986 | 1,090,549 | 2,175,874 | 249,434 | 305,626 | 3,821,483 |
Table 25.26. PAYMENTS BY TYPES OF LOCAL AUTHORITIES, 1985-86
| Local authority type | Labour and related costs | Interest | Purchases of commodities and services | Other payments | Total payments |
|---|---|---|---|---|---|
| $(000) | |||||
| City and borough councils | 473,930 | 94,661 | 738,839 | 105,664 | 1,413,095 |
| County councils | 131,397 | 19,778 | 209,576 | 19,473 | 380,224 |
| District councils | 38,540 | 5,112 | 48,101 | 5,628 | 97,381 |
| Electric power boards | 168,246 | 57,742 | 857,470 | 64,991 | 1,148,449 |
| Harbour boards | 109,257 | 31,692 | 80,649 | 30,986 | 252,584 |
| Regional authorities | 63,477 | 28,270 | 46,798 | 40,192 | 178,736 |
| Urban drainage boards | 11,349 | 5,203 | 7,633 | 462 | 24,647 |
| Catchment boards | 27,496 | 2,072 | 24,381 | 3,976 | 57,924 |
| Pest destruction boards | 6,658 | 132 | 5,147 | 478 | 12,416 |
| Urban transport board | 11,228 | 135 | 4,748 | 2,785 | 18,896 |
| Other local authorities | 48,971 | 4,637 | 152,533 | 30,992 | 237,134 |
| Total | 1,090,549 | 249,434 | 2,175,874 | 305,626 | 3,821,483 |
Table 25.27. RECEIPTS AND PAYMENTS OF TERRITORIAL LOCAL AUTHORITIES
| Item | Years ended 31 March | ||
|---|---|---|---|
| 1984 | 1985 | 1986 | |
| Receipts— | $(million) | ||
| Rates and grants in lieu | 648.1 | 692.0 | 785.3 |
| Other taxes and fines | 57.0 | 59.2 | 63.7 |
| Grants and contributions from central government | 293.2 | 325.7 | 350.5 |
| Grants and contributions from local authorities | 55.2 | 64.4 | 69.1 |
| Sales of main product | 417.6 | 446.7 | 527.9 |
| Other commodities and services | 265.3 | 304.8 | 325.7 |
| Interest | 56.5 | 77.4 | 124.0 |
| Miscellaneous current receipts | 67.1 | 73.0 | 82.8 |
| Total | 1,860.0 | 2,043.2 | 2,328.9 |
| Payments— | |||
| Labour and related costs | 591.6 | 628.4 | 709.9 |
| Interest paid | 118.5 | 128.8 | 148.0 |
| Levies and grants to central government and local authorities | 83.6 | 100.0 | 114.7 |
| Bulk purchase for resale | 214.4 | 229.6 | 278.2 |
| Other commodities and services | 605.6 | 677.5 | 767.3 |
| Other current payments | 49.7 | 61.1 | 68.5 |
| Subtotal | 1,663.5 | 1,825.3 | 2,086.6 |
| Less, capitalised payments | 70.5 | 63.0 | 67.7 |
| Total | 1,593.0 | 1,762.3 | 2,018.9 |
Table 25.28. RECEIPTS AND PAYMENTS OF TERRITORIAL LOCAL GOVERNMENT BY ACTIVITY*
| Activity | 1983-84 | 1984-85 | 1985-86 | |||
|---|---|---|---|---|---|---|
| Receipts | Payments | Receipts | Payments | Receipts | Payments | |
| * Excludes sales and purchases of fixed assets and repayments of loans. | ||||||
| $(million) | ||||||
| Electricity supply | 266.2 | 232.3 | 283.6 | 257.3 | 333.6 | 304.0 |
| Passenger transport | 94.8 | 93.5 | 114.5 | 105.4 | 134.6 | 123.4 |
| Water supply | 137.3 | 122.7 | 157.2 | 138.9 | 186.4 | 161.4 |
| Road construction and maintenance | 329.7 | 329.7 | 358.5 | 354.1 | 405.1 | 405.5 |
| Refuse, sewerage, and drainage | 160.4 | 150.0 | 177.5 | 163.6 | 210.4 | 197.4 |
| Abattoirs | 20.6 | 18.9 | 20.1 | 18.5 | 21.6 | 20.3 |
| Libraries | 41.1 | 39.5 | 45.6 | 42.7 | 52.8 | 51.1 |
| Parks and domains | 111.5 | 102.6 | 129.2 | 116.9 | 141.2 | 130.6 |
A wide variety of public utilities and amenities are provided by territorial local government, the main activities being electricity supply, water supply, roading, sewerage, drainage, and refuse collection.
Many of the services provided are also trading undertakings. Generally speaking, territorial local authorities are restrained from operating trading undertakings which are particularly profitable. Public transport undertakings, which are usually a substantial burden upon ratepayers, are particularly unprofitable. The only major exception is electricity distribution, from which most territorial local authorities make surpluses.
The Local Authorities Loans Act 1956 requires all local authorities wishing to raise a loan to obtain authorisation of the Local Authorities Loans Board, except for those loans covered by the Local Authorities Exemption Order 1986.
As a general rule, local authorities may raise a loan by special order and without a poll of electors, but in the case of a local authority which is a rating body a poll of electors is to be taken if:
The Local Authorities Loans Board requires a poll to be taken; or
Before the date fixed for the meeting of the local authority to confirm the resolution to raise the loan, not less than 15 percent of the electors demand a poll; or
The local authority itself decides to take a poll.
A poll is not required in cases such as renewal loans, loans raised for emergency expenditure by reason of flood, storm, earthquake, etc., or loans for work of national and local importance and carried out by an agreement between the Government and a local authority.
Where a poll is required the proposal is carried if a bare majority of the valid votes recorded is in favour. The properties and revenue of the local authority may be pledged as security for the repayment of any principal sum or interest thereon, or a special rate may be levied for the same purpose.
Borrowing by certain types of local authority is subject to special provisions. Under the Hospitals Act 1957 and the Area Health Boards Act 1983 hospital boards and area health boards must first obtain the approval of the Minister of Health before borrowing. Harbour boards derive their authority to borrow for harbour works from special empowering legislation, and similar authority is given for the capital works of certain other local authorities.
Since November 1984 interest rates for loans have been determined only by the rates which prevail on the New Zealand securities market.
Table 25.29. OPERATIONS OF THE LOCAL AUTHORITIES LOANS BOARD*
| Year ended 31 March | Value of total applications | Sanctioned | ||
|---|---|---|---|---|
| New works | Redemption loans | Exemption order notifications | ||
| * Includes hospital boards and Fire Service Commission. | ||||
| $(million) | ||||
| 1982 | 400.6 | 311.3 | 50.4 | .. |
| 1983 | 409.9 | 289.9 | 37.0 | .. |
| 1984 | 404.5 | 304.3 | 1.6 | 82.6 |
| 1985 | 388.9 | 303.4 | - | 80.0 |
| 1986 | 296.6 | 176.1 | - | 117.6 |
Table 25.30. LOANS AUTHORISED, RAISED AND UPLIFTED, 1986-87
| Authority | Amounts authorised | Amounts raised | Balance | Amounts uplifted | |
|---|---|---|---|---|---|
| $(000) | |||||
| Territorial local authority— | |||||
| Cities and boroughs | 156,758 | 64,189 | 92,569 | 61,000 | |
| County councils | 12,129 | 5,679 | 6,450 | 5,679 | |
| District councils | 12,575 | 2,321 | 10,254 | 2,321 | |
| Regional authority | 33,955 | 2,990 | 30,965 | 2,990 | |
| Town districts | 80 | 60 | 20 | 60 | |
| Other local authority— | |||||
| Catchment districts | 406 | 406 | - | 406 | |
| Electric power and gas boards | 26,050 | 3,315 | 22,735 | 3,315 | |
| Harbour boards | 20,542 | 10,538 | 10,004 | 10,538 | |
| Miscellaneous | 60 | 50 | 10 | 50 | |
| Urban drainage boards | 2,627 | 907 | 1,720 | 907 | |
| Central government— | |||||
| Fire Service Commission | 4,280 | 1,474 | 2,806 | 1,474 | |
| Hospital boards | 63,207 | 17,369 | 45,838 | 17,369 | |
| Total | 332,669 | 109,298 | 223,371 | 106,109 | |
Table 25.31. GROSS PUBLIC DEBT OF LOCAL AUTHORITIES AND ANNUAL CHARGES*
| Year ended 31 March | Gross public debt | Annual loan charge | ||
|---|---|---|---|---|
| Amount | Rate per head of mean population | Amount | Rate per head of mean population | |
| * Excludes hospital board and area health board debt and Fire Service Commission debt. | ||||
| $(000) | $ | $(000) | $ | |
| 1982 | 1,672,000 | 524.8 | 209,612 | 65.8 |
| 1983 | 1,878,835 | 582.3 | 299,295 | 92.8 |
| 1984 | 2,062,593 | 632.5 | 335,407 | 102.9 |
| 1985 | 2,207,427 | 676.0 | 360,258 | 110.3 |
| 1986 | 2,248,924 | 680.8 | 486,926 | 147.4 |
In the following table it should be noted that the debt of electric power districts shown does not represent the complete local authority debt on account of electric power activities, since a considerable portion of the city and borough debt, and a small part of the county and town district debt also, was incurred for that purpose.
Table 25.32. GROSS PUBLIC DEBT BY TYPE OF LOCAL AUTHORITY
| Year ended 31 March | Cities, boroughs and town districts | Counties | Regional authorities | Electric power districts | Harbour districts | Urban drainage districts | Other districts | Total |
|---|---|---|---|---|---|---|---|---|
| $(000) | ||||||||
| 1982 | 663,969 | 136,091 | 203,074 | 301,162 | 253,839 | 53,734 | 60,130 | 1,672,000 |
| 1983 | 731,870 | 153,288 | 223,369 | 374,270 | 271,135 | 53,803 | 71,099 | 1,878,835 |
| 1984 | 800,935 | 169,314 | 235,956 | 438,609 | 288,527 | 53,952 | 75,300 | 2,062,593 |
| 1985 | 856,112 | 180,565 | 247,951 | 477,235 | 320,658 | 51,013 | 73,893 | 2,207,427 |
| 1986 | 892,100 | 183,436 | 247,242 | 489,901 | 308,321 | 49,022 | 78,902 | 2,248,924 |
25.1 Treasury.
25.2 Inland Revenue Department; Treasury.
25.3 Treasury.
25.4 Department of Internal Affairs; Treasury.
Budget (Parl. paper B. 6).
Income and Income Tax of Companies. Department of Statistics (annual).
Local Authority Statistics. Department of Statistics (annual).
Monthly Abstract of Statistics. Department of Statistics.
The Public Accounts (Parl. paper B. I [Pt. I and II]).
Reform of Local and Regional Government: Discussion Document. The Officials Coordinating Committee on Local Government, 1988.
Report of the Department of Internal Affairs (Parl. paper G. 7).
Report of the Inland Revenue Department (Parl. paper B. 23).
Report of the Local Authorities Loans Board (Parl. paper B. 17).
Report of the Local Government Commission (Parl. paper G. 9).
Report of the Valuation Department (Parl. paper G. 26).
Report of the Working Party on Revenue Sharing. Department of Internal Affairs, 1987.
Table of Contents
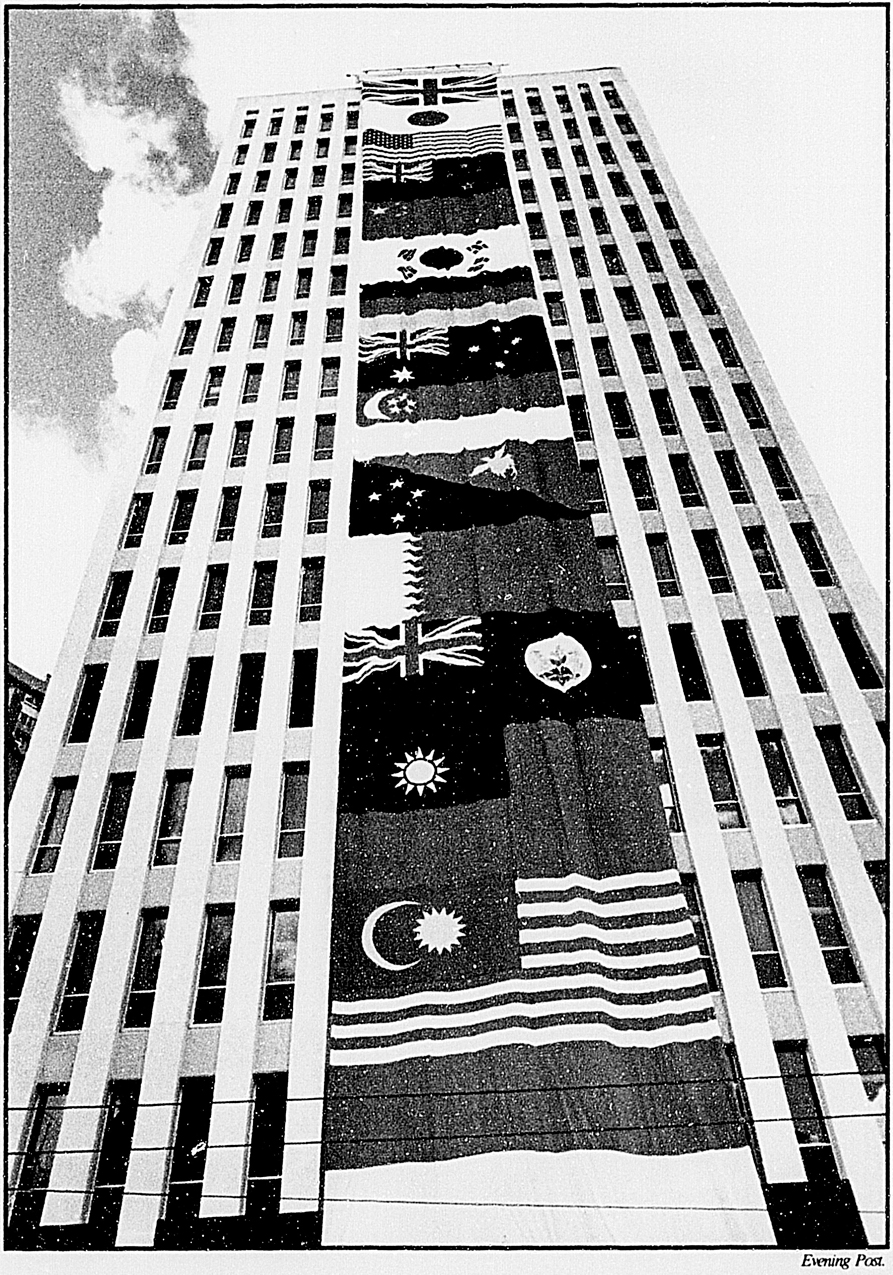
Evening Post
The Department of Statistics made major changes in the collection of business statistics during 1986 and 1987. In 1986 it introduced an annual update of its Business Directory, and an annual Enterprise Survey. The department also introduced a five-yearly Economy Wide Census, first taken in 1987. These changes replaced the previous five-year rolling cycle of business censuses.
The first Economy Wide Census gathered data on most non-farming businesses for the 1986-87 financial year, covering over 130000 separate businesses and more than 500 different industrial activities. The census answers the need for a ‘snapshot’ of the whole economy and allows inter-relationships to be examined simultaneously using data that relate to the same period. The information gained is used in the national accounts, price indexes, inter-industry tables, and several major econometric models, as well as by businesses themselves. Results from the 1987 census began to become available late in 1988. The census will be repeated every five years.
The annual Enterprise Survey supplements the census. It samples approximately 20000 businesses to provide an overview of the economy in the interval between five-yearly censuses. In addition to the financial data from this survey, the department also brings its Business Directory up-to-date annually. As well as being the basic register for survey and census, it provides a source of non-financial data about businesses, such as their location, size, type of activity and degree of overseas ownership.
Definitions of terms used in the presentation of business census data are included in the glossary at the back of this book, although these may vary according to the year in question.
Further details, including results of all censuses at subgroup (industry) level of the New Zealand Standard Industrial Classification, are available in the Department of Statistics’ series of business census publications.
Table 26.1. GENERAL SUMMARY OF ENTERPRISE SURVEY 1985-86, INDUSTRIAL GROUPS
| Industry no. | NZSIC | Description | Group enterprises | Enterprises | Activity units | Persons engaged* |
|---|---|---|---|---|---|---|
*Figures apply to full-time equivalent persons engaged. | ||||||
| 1 | 112 | Agricultural contracting services | 2046 | 2079 | 2461 | 10634 |
| 2 | 12 | Forestry and logging | 838 | 860 | 1107 | 10311 |
| 3 | 13 | Fishing | 1891 | 1907 | 1956 | 4454 |
| 4 | 21 | Coal mining | 37 | 42 | 65 | 2013 |
| 5 | 22 | Crude petroleum and natural gas | 32 | 57 | 63 | 1014 |
| 6 | 23,29 | Other mining and quarrying | 329 | 366 | 465 | 2745 |
| 7 | 3111 | Slaughtering and reserving meat | 185 | 216 | 297 | 39327 |
| 8 | 3112 | Manufacture of dairy products | 77 | 87 | 166 | 8652 |
| 9 | 3113-3122 | Manufacture of other foods | 858 | 946 | 1186 | 23170 |
| 10 | 313 | Beverage industries Tobacco manufacturing | 110 | 120 | 163 | 4519 |
| 11 | 314 | |||||
| 12 | 321 | Manufacture of textiles | 525 | 571 | 664 | 14610 |
| 13 | 322, 323, 324 | Manufacture of clothing and leather goods including footwear | 1056 | 1122 | 1300 | 26151 |
| 14 | 33 | Manufacture of wood and wood products | 1924 | 2018 | 2271 | 24306 |
| 15 | 341 | Manufacture of paper and paper products | 87 | 103 | 162 | 13101 |
| 16 | 342 | Printing and publishing | 839 | 916 | 1052 | 18879 |
| 17 | 351 | Manufacture of industrial chemicals | 112 | 124 | 198 | 4925 |
| 18 | 352 | Manufacture of other chemical products | 243 | 255 | 366 | 7476 |
| 19 | 353 | Petroleum refineries | 12 | 11 | 17 | 1104 |
| 20 | 354 | Manufacture of petroleum and coal products | 21 | 23 | 34 | 366 |
| 21 | 355 | Manufacture of rubber products | 70 | 82 | 130 | 3847 |
| 22 | 356 | Manufacture of plastic products | 333 | 361 | 400 | 8108 |
| 23 | 36 | Manufacture of non-metallic minerals | 609 | 659 | 839 | 9545 |
| 24 | 37 | Basic metal industries | 117 | 129 | 157 | 7221 |
| 25 | 381 | Manufacture of fabricated metal products | 1777 | 1906 | 2167 | 26882 |
| 26 | 382 | Manufacture of machinery | 1627 | 1686 | 1984 | 19305 |
| 27 | 383 | Manufacture of electrical machinery | 485 | 531 | 614 | 15283 |
| 28 | 384 | Manufacture of transport equipment | 556 | 583 | 738 | 22405 |
| 29 | 385 | Manufacture of professional equipment | 70 | 72 | 87 | 1286 |
| 30 | 39 | Other manufacturing industries | 583 | 592 | 620 | 4172 |
| 31 | 4102 | Gas | 15 | 18 | 34 | 1046 |
| 32 | 51, 53 | Building and ancillary building services | 12767 | 12922 | 13523 | 57669 |
| 33 | 52 | Other construction | 1223 | 1225 | 1608 | 20879 |
| 34 | 61 | Wholesale trade | 5036 | 6009 | 9871 | 80920 |
| 35 | 62 | Retail trade | 21310 | 21960 | 26863 | 130508 |
| 36 | 63 | Restaurants and hotels | 7452 | 7690 | 8596 | 53308 |
| 37 | 7112, 7113 | Road passenger transport | 2153 | 2176 | 2406 | 9987 |
| 38 | 7114 | Road freight transport | 3443 | 3523 | 3897 | 18774 |
| 39 | 7111, | Rail transport Services to transport | 819 | 945 | 1951 | 16742 |
| 42 | 7116, 719 | |||||
| 40 | 712 | Sea transport | 106 | 118 | 254 | 12413 |
| 41 | 713 | Air transport | 194 | 198 | 304 | 7205 |
| 43 | 72 | Communication | 67 | 69 | 1027 | 33485 |
| 44 | 811 | Banking | 20 | 24 | 1315 | 26691 |
| 45 | 812-814 | Other finance and investment including services | 1613 | 2465 | 3065 | 11397 |
| 47 | 83 (excluding 83102, 83103) | Real estate and business services | 8061 | 8863 | 8358 | 54525 |
| 53 | 95 (excluding 953) | Personal services | 7682 | 7760 | 8505 | 29727 |
Table 26.2. GENERAL SUMMARY OF ENTERPRISE SURVEY 1985-86, INCOME AND EXPENDITURE
| Industry no. | NZSIC | Description | Total expenditure | Total income (adjusted for stocks) | Net profit (before tax)* | Value added |
|---|---|---|---|---|---|---|
*Prior to deduction of working proprietors/partners salaries, wages and drawings. | ||||||
| $(000) | ||||||
| 1 | 112 | Agricultural contracting services | 367,203 | 417,723 | 50,521 | 216,365 |
| 2 | 12 | Forestry and logging | 584,888 | 582,888 | -2,001 | 164,911 |
| 3 | 13 | Fishing | 263,086 | 324,321 | 61,235 | 139,508 |
| 4 | 21 | Coal mining | 153,884 | 133,543 | -20,341 | 67,570 |
| 5 | 22 | Crude petroleum and natural gas | 870,410 | 1,129,987 | 259,577 | 650,449 |
| 6 | 23, 29 | Other mining and quarrying | 343,949 | 393,317 | 49,368 | 141,714 |
| 7 | 3111 | Slaughtering and preserving meat | 2,629,908 | 2,738,162 | 108,254 | 1,039,492 |
| 8 | 3112 | Manufacture of dairy products | 2,336,194 | 2,430,316 | 94,122 | 400,199 |
| 9 | 3113-3122 | Manufacture of other foods | 2,815,436 | 3,093,851 | 278,415 | 730,444 |
| 10 | 313, | Beverage industries | 870,090 | 968,620 | 98,530 | 225,678 |
| 11 | 314 | Tobacco manufacturing | ||||
| 12 | 321 | Manufacture of textiles | 1,403,741 | 1,511,731 | 107,990 | 387,519 |
| 13 | 322, 323, 324 | Manufacture of clothing and leather goods including footwear | 1,336,420 | 1,448,937 | 112,517 | 523,943 |
| 14 | 33 | Manufacture of wood and wood products | 1,948,056 | 2,139,330 | 191,274 | 707,513 |
| 15 | 341 | Manufacture of paper and paper products | 1,781,441 | 1,887,340 | 105,899 | 553,966 |
| 16 | 342 | Printing and publishing | 1,344,572 | 1,516,779 | 172,207 | 653,914 |
| 17 | 351 | Manufacture of industrial chemicals | 1,187,865 | 1,291,419 | 103,554 | 269,296 |
| 18 | 352 | Manufacture of other chemical products | 1,082,588 | 1,168,953 | 86,365 | 285,378 |
| 19 | 353 | Petroleum refineries | 450,596 | 220,142 | -230,454 | -1,240 |
| 20 | 354 | Manufacture of petroleum and coal products | 66,661 | 70,316 | 3,655 | 14,794 |
| 21 | 355 | Manufacture of rubber products | 334,878 | 368,064 | 33,186 | 141,032 |
| 22 | 356 | Manufacture of plastic products | 760,742 | 839,087 | 78,345 | 277,236 |
| 23 | 36 | Manufacture of non-metallic minerals | 1,011,316 | 1,167,795 | 156,479 | 355,650 |
| 24 | 37 | Basic metal industries | 1,128,821 | 1,205,535 | 76,714 | 345,503 |
| 25 | 381 | Manufacture of fabricated metal products | 2,368,909 | 2,613,459 | 244,550 | 811,017 |
| 26 | 382 | Manufacture of machinery | 1,506,021 | 1,630,981 | 124,960 | 529,679 |
| 27 | 383 | Manufacture of electrical machinery | 1,378,802 | 1,444,930 | 66,128 | 401,838 |
| 28 | 384 | Manufacture of transport equipment | 1,992,008 | 2,073,830 | 81,822 | 550,633 |
| 29 | 385 | Manufacture of professional equipment | 106,384 | 117,592 | 11,208 | 40,371 |
| 30 | 39 | Other manufacturing industries | 259,679 | 289,661 | 29,982 | 96,304 |
| 31 | 4102 | Gas | 140,005 | 152,556 | 12,551 | 45,520 |
| 32 | 51, 53 | Building and ancillary building services | 4,945,985 | 5,452,127 | 506,142 | 1,338,743 |
| 33 | 52 | Other construction | 2,328,000 | 2,467,559 | 139,559 | 681,802 |
| 34 | 61 | Wholesale trade | 33,400,929 | 34,181,177 | 780,248 | 2,881,978 |
| 35 | 62 | Retail trade | 18,475,601 | 19,431,674 | 956,073 | 2,686,161 |
| 36 | 63 | Restaurants and hotels | 2,614,514 | 2,809,173 | 194,659 | 916,073 |
| 37 | 7112, 7113 | Road passenger transport | 471,355 | 536,012 | 64,656 | 205,450 |
| 38 | 7114 | Road freight transport | 1,255,504 | 1,399,538 | 144,034 | 642,228 |
| 39 | 7111 | Rail transport | 1,265,823 | 1,252,901 | -12,922 | 303,723 |
| 42 | 7116, 719 | Services to transport | ||||
| 40 | 712 | Sea transport | 1,229,384 | 1,260,788 | 31,404 | 492,074 |
| 41 | 713 | Air transport | 1,168,826 | 1,291,783 | 122,957 | 519,691 |
| 43 | 72 | Communication | 1,215,054 | 1,451,856 | 236,802 | 1,179,213 |
| 44 | 811 | Banking | 4,073,746 | 4,710,942 | 637,196 | 1,334,767 |
| 45 | 812-814 | Other finance and investment including services | 3,903,350 | 4,464,928 | 552,862 | 622,328 |
| 47 | 83 (excluding 83102, 83103) | Real estate and business services | 2,296,365 | 2,831,639 | 535,274 | 1,677,536 |
| 53 | 95 (excluding 953) | Personal services | 1,311,540 | 1,520,511 | 208,971 | 552,588 |
Table 26.3 is based on the annual Business Directory update survey and shows persons engaged (working proprietors and paid employees, full time equivalents) as at February 1987. The table is not a measure of total employment. Farms are held on a separate directory and are not included here. Also, the survey does not include some other businesses, namely: self-employed insurance, real estate, and finance agents; property owners’, non-profit organisations; and non-trading and dormant companies.
Table 26.3. REGIONAL BUSINESS PATTERNS*
| Region† | Agricultural services hunting forestry fishing | Mining and quarrying | Manufacturing | Electricity gas and water | Construction | Wholesale and retail trade restaurants and hotels | Transport storage and communication | Business and financial services | Community social and personal services | Total |
|---|---|---|---|---|---|---|---|---|---|---|
*NZSIC. † Local Government Regions. | ||||||||||
| persons engaged | ||||||||||
| Northland | 1562 | 243 | 6779 | 610 | 3441 | 8886 | 2955 | 2393 | 8993 | 35862 |
| Auckland | 1999 | 689 | 108148 | 2911 | 30648 | 94235 | 34205 | 46768 | 79029 | 398632 |
| Thames Valley | 763 | 160 | 3561 | 296 | 1495 | 3857 | 940 | 944 | 3198 | 15214 |
| Bay of Plenty | 3121 | 113 | 14107 | 628 | 5335 | 15465 | 4641 | 4805 | 13336 | 61551 |
| Waikato | 1663 | 1343 | 16354 | 1713 | 6966 | 16673 | 4952 | 6872 | 20967 | 77503 |
| Tongariro | 2389 | 101 | 2269 | 595 | 1440 | 3599 | 885 | 702 | 2736 | 14716 |
| East Cape | 1201 | 45 | 3160 | 241 | 1283 | 3507 | 1099 | 1095 | 3701 | 15332 |
| Hawke's Bay | 1579 | 111 | 12534 | 556 | 3278 | 10858 | 3448 | 3522 | 10053 | 45939 |
| Taranaki | 473 | 913 | 8991 | 1049 | 2685 | 7696 | 2662 | 2319 | 7592 | 34380 |
| Wanganui | 594 | 20 | 4829 | 186 | 2147 | 4746 | 1550 | 1458 | 6692 | 22222 |
| Manawatu | 891 | 33 | 9977 | 510 | 3251 | 9644 | 3291 | 3324 | 12467 | 43388 |
| Horowhenua | 225 | 33 | 3667 | 140 | 1343 | 3477 | 853 | 853 | 3089 | 13680 |
| Wellington | 624 | 252 | 26166 | 1213 | 10087 | 34017 | 18117 | 28017 | 46052 | 164545 |
| Wairarapa | 593 | 40 | 3229 | 161 | 860 | 2611 | 766 | 787 | 2528 | 11575 |
| North Island total | 17677 | 4096 | 223771 | 10809 | 74259 | 219271 | 80364 | 103859 | 220433 | 954539 |
| Nelson Bays | 1173 | 84 | 4886 | 191 | 1747 | 5292 | 1820 | 1737 | 5485 | 22415 |
| Marlborough | 676 | 97 | 2383 | 111 | 1068 | 2863 | 936 | 675 | 3231 | 12040 |
| West Coast | 687 | 967 | 2140 | 215 | 977 | 2588 | 1017 | 528 | 2661 | 11780 |
| Canterbury | 1506 | 110 | 34926 | 1419 | 8333 | 31416 | 11833 | 11492 | 33017 | 134052 |
| Aorangi | 998 | 40 | 6560 | 446 | 1830 | 6275 | 2020 | 1662 | 5402 | 25233 |
| Clutha/Central Otago | 1213 | 63 | 3928 | 228 | 2415 | 4150 | 1144 | 816 | 2520 | 16477 |
| Coastal/North Otago | 746 | 120 | 10668 | 759 | 3489 | 11477 | 4385 | 4177 | 14504 | 50325 |
| Southland | 1980 | 315 | 10699 | 380 | 2182 | 8771 | 2876 | 2448 | 7365 | 37016 |
| South Island total | 8979 | 1796 | 76190 | 3749 | 22041 | 72832 | 26031 | 23535 | 74185 | 309338 |
| Extra county islands and shipping | 383 | - | 102 | 1 | 28 | 101 | 135 | 18 | 79 | 847 |
| New Zealand total | 27039 | 5892 | 300063 | 14559 | 96328 | 292204 | 106530 | 127412 | 294697 | 1264724 |
The New Zealand System of National Accounts (NZSNA) provides a systematic analysis of the performance of the New Zealand economy. Information on production and associated flows of income and expenditure meet a variety of needs, including economic analysis, forecasting, and policy formulation. The system is based on an internationally accepted standard detailed in A System of National Accounts (United Nations, 1968). In addition to providing key economic information, the national accounts also provide the basic framework of standard concepts, definitions, and classifications for economic agents and transactions. The economic censuses and surveys of the Department of Statistics are all integrated in the system, as is the inter-industry study. Balance of payments statistics follow similar concepts and provide the basis of the External Transactions Account of the national accounts.
Annual national accounts for years ended 31 March are calculated twice each year. In September, provisional estimates are prepared for the preceding March year only for the Consolidated Accounts of the Nation. These estimates are revised in the following March as more information becomes available. Detailed breakdowns of some of the main aggregates are also published at this time. The information used to compile the accounts becomes available progressively over a long period, and for many areas of the economy may not be available for up to three years after the March year to which it relates. Consequently, national accounts estimates are subject to revision during this period. All revisions to earlier years are published with the estimates prepared in March.
Tables in this section contain data for the latest available five years. For the Consolidated Accounts of the Nation, data are provided for the years ended March 1983 to 1987, while detailed breakdowns of the main aggregates are included for the years ended March 1982 to 1986. Full national accounts series back to 1971-72 are available from the Department of Statistics on request.
The total market value of goods and services produced in New Zealand after deducting the cost of goods and services utilised in the process of production, but before deducting allowances for the consumption of fixed capital.
The total expenditure within a given period on final goods and services by New Zealand residents (i.e., excluding goods and services used up during the process of production).
The income accruing within a given period to New Zealand residents from their services in supplying factors of production in New Zealand and overseas, plus net indirect taxes, and before the deduction of allowances for the consumption of fixed capital.
This item is equivalent to gross national product after the deduction of allowances for consumption of fixed capital. It is a measure of income accruing to New Zealanders from their services in supplying factors of production in New Zealand and overseas, plus net indirect taxes.
The total income of New Zealand residents from all sources available for final consumption or savings.
Payments of salaries and wages, whether in cash or in kind, to employees. Includes contributions paid on employees’ behalf to superannuation funds, private pension schemes, the Accident Compensation Corporation, casualty and life insurance schemes, etc.
The value of depreciation at ordinary rates allowed for taxation purposes, plus an estimate for the normal rate of accidental damage based on the insurance claims by each industry group.
Taxes which are assessed on producers in respect of the production, sale, purchase, and use of goods and services, and add to the market process of these goods and services. Includes goods and services tax, sales tax, local authority rates, import and excise duties, and also registration fees, such as motor vehicle registration, which are paid by producers.
Grants made by government to market-oriented producers, who regard the transfers as an addition to income from current production. These grants include payments to ensure a guaranteed price, or to enable market prices of goods and services to be held below the cost of production. Transfers out of rates receipts made by local authorities to finance the losses of their trading departments, and deliberately incurred losses of government trading organisations are also included.
The value of non-durable goods and services used in production. Valuation is at purchasers’ values.
Gross output at producers’ values:
(a) Market production groups—The total market value including commodity taxes on all goods and services produced during the year, including stocks of work-in-progress. Included is output produced for sale in the market, and capital formation on own account.
(b) Non-market production groups—These producers may sell a proportion of their output in the market, and such receipts are included in total output. However, most of the services produced represent unmarketed output and are valued at cost price. This assumption is necessary because there is no other basis for valuation.
This is a residual item, being gross output at producers’ values less the sum of intermediate consumption, compensation of employees, consumption of fixed capital, and indirect taxes net of subsidies. It is approximately equal to accounting profit before the deduction of direct taxes, dividends and bad debts, and before the deduction of interest paid, or the addition of interest received.
Final consumption expenditure:
(a) Resident households—All outlays on consumer goods and services, including expenditure on consumer durables such as motor vehicles and furniture; included are payments made by government on behalf of households, and the imputed rent of owner-occupied dwellings.
(b) Producers of general (central and local) government services and private non-profit services to households—Total current expenditure by these producers less the value of any sales or own account capital formation (i.e., the total net current costs incurred in providing the services).
The change in value of stocks of raw materials, work-in-progress, and finished goods, between the beginning and the end of the year.
(i) Value of the physical increase in stocks—The change in stocks valued at the average prices for the year. This valuation removes capital gains and losses caused by holding stocks purchased at prices higher or lower than those ruling during the year.
(ii) Increase in book value of stocks—The change in stocks as valued in accounting records.
The outlays of producers on durable real assets, such as buildings, motor vehicles, plant and machinery, hydro-electric construction, roading, and improvements to land. In measuring the outlays, sales of similar goods are deducted. Land is excluded from gross fixed capital formation. Included is the value of construction work done by a firm's own employees. The term ‘gross’ indicates that consumption of fixed capital has not been deducted from the value of the outlays.
In these accounts the items making up gross domestic product and expenditure on gross domestic product are estimated independently. Including the statistical discrepancy on the expenditure side of the first consolidated account, Gross Domestic Product and Expenditure, is simply a convention. It does not imply that one side of this account is more accurate than the other. The case is the same with the Capital Finance Account and the External Transactions Account.
The residual item in the National Income and Outlay Account after all current receipts and disbursements have been accounted for.
The value of purchases by residents from non-residents of intangible assets, less sales of such assets by residents to non-residents. Examples of these types of assets are mineral rights, fishing quotas, patents, copyrights, and trademarks. In the NZSNA flows associated with this item are not distinguishable in the source data and consequently are included in exports/imports of goods and services.
The excess of the value of capital transfers by non-residents to New Zealand residents over the value of similar transfers by residents to non-residents. Capital transfers are unrequited transfers in cash or in kind which are not considered by the recipient as adding to current income, nor by the donor as reducing current income. Examples are unilateral transfers of capital goods, legacies, investment grants, and transfers of migrants’ funds. In the NZSNA it has not been possible to identify all of these flows separately, and they have been included in current transfers to/from the rest of the world.
All goods and services produced by New Zealand residents and purchased by the rest of the world. Exports of merchandise are valued f.o.b. (free-onboard).
All goods and services produced by the rest of the world and purchased by New Zealand residents. Imports of merchandise are valued c.i.f. (cost, including insurance and freight).
In theory, these items cover the compensation residents of one country earn from employment in another where they are classed as non-resident, because their stay is for a period of less than 12 months. In practice, available data do not permit estimates of these items.
The property income component of these items refers to the transfers of income accruing to the owners of financial assets, intangible assets such as patents, copyrights and concessions, and mineral rights. This income is mainly in the form of interest, dividends, rent, and royalties. The entrepreneurial income refers to the actual withdrawals of income from enterprises operating overseas, such as the branches of foreign companies.
In theory, these items cover all current transfers other than property and entrepreneurial income. However, in practice, it has not been possible to identify all these transfers separately, and the figures are deficient in two respects. Firstly, not all current transfers can be identified. In particular, those associated with insurance transactions are omitted, since all insurance flows are recorded as either exports or imports of services. Secondly, it has proved difficult to distinguish between current and capital transfers to the rest of the world, and in the NZSNA all have been treated as current.
The excess in the External Transactions Account of current receipts over current disbursements.
The change in actual indebtedness of New Zealanders to non- residents. It relates to the issue, less the redemption, of financial claims, such as currency and transferable deposits, bonds, corporate equities, loans, and long term trade credits. Changes in the holdings of paid-up capital of companies, and changes in intercompany indebtedness are also included.
The change in actual claims by New Zealanders, or non-residents. It relates to the purchase, less the sale, of financial claims, such as those described for the net incurrence of foreign liabilities. It also includes changes in New Zealand's holdings of special drawing rights in its reserve position at the International Monetary Fund, and in the assets of the New Zealand banking system.
Table 26.4. PRINCIPAL AGGREGATES OF THE NATIONAL ACCOUNTS
| Aggregates | Year ended March | ||||
|---|---|---|---|---|---|
| 1983 | 1984 | 1985 | 1986 | 1987 | |
| $(million) | |||||
| Gross domestic product | 31,160 | 34,329 | 38,667 | 44,868 | 52,879 |
| Plus, net factor receipts from rest of world | -860 | -1,298 | -1,904 | -2,044 | -2,237 |
| Gross national product | 30,300 | 33,031 | 36,763 | 42,824 | 50,642 |
| Less, consumption of fixed capital | 2,216 | 2,615 | 3,085 | 3,757 | 4,281 |
| National income at market prices | 28,084 | 30,416 | 33,678 | 39,067 | 46,361 |
| Plus, net current transfers from rest of world | 118 | 84 | 210 | 184 | 239 |
| National disposable income | 28,202 | 30,500 | 33,888 | 39,251 | 46,600 |
The Consolidated Accounts of the Nation comprise four accounts as follows:
Gross domestic product is a measure of the value added from all economic activity in New Zealand. The account shows the various forms of income generated by the economy, and the categories of the final expenditure on the domestic product.
National disposable income is the value of income available to New Zealanders, consisting mainly of the incomes generated in New Zealand. Adjustments are made for the income paid to, and received from, the rest of the world. The account also shows that part of disposable income which was spent by New Zealanders on current consumption, and the portion of income which was saved.
Capital expenditure is recorded in this account. The difference between the accumulation of capital assets and the sources of funds (mainly savings and the income set aside for the use of assets) gives a residual to be borrowed from (or lent to) the rest of the world.
This account brings together all transactions with the rest of the world. The residual ‘Surplus of nation on current transactions’ records New Zealand's net borrowing from the rest of the world.
Table 26.5. GROSS DOMESTIC PRODUCT AND EXPENDITURE
| Item | Year ended March | ||||
|---|---|---|---|---|---|
| 1983 | 1984 | 1985 | 1986 | 1987 | |
| $(million) | |||||
| Compensation of employees | 17,168 | 17,459 | 18,986 | 22,120 | 26,045 |
| Operating surplus | 9,091 | 11,064 | 12,651 | 14,514 | 16,277 |
| Consumption of fixed capital | 2,216 | 2,615 | 3,085 | 3,757 | 4,281 |
| Indirect taxes | 3,440 | 3,847 | 4,543 | 4,839 | 6,542 |
| Less, subsidies | 755 | 655 | 598 | 361 | 266 |
| Gross domestic product | 31,160 | 34,329 | 38,667 | 44,868 | 52,879 |
| Final consumption expenditure— | |||||
| General government | 5,554 | 5,839 | 6,208 | 7,279 | 9,033 |
| Private | 18,592 | 20,060 | 22,577 | 26,414 | 30,708 |
| Value of physical increase in stocks | 316 | 514 | 1,524 | 791 | 1,221 |
| Gross fixed capital formation | 7,809 | 8,475 | 9,605 | 11,389 | 11,777 |
| Statistical discrepancy | 90 | -168 | 245 | 52 | 40 |
| Gross national expenditure | 32,362 | 34,720 | 40,209 | 45,924 | 52,780 |
| Exports of goods and services | 9,116 | 10,699 | 13,317 | 14,037 | 15,040 |
| Less, imports of goods and services | 10,318 | 11,090 | 14,859 | 15,043 | 14,941 |
| Expenditure on gross domestic product | 31,160 | 34,329 | 38,667 | 44,868 | 52,879 |
Table 26.6. NATIONAL INCOME AND OUTLAY
| Item | Year ended March | ||||
|---|---|---|---|---|---|
| 1983 | 1984 | 1985 | 1986 | 1987 | |
| $(million) | |||||
| Final consumption expenditure— | |||||
| Government—Central | 4,877 | 5,050 | 5,353 | 6,287 | 7,915 |
| Government—Local | 677 | 789 | 854 | 992 | 1,119 |
| Private—Households | 18,298 | 19,771 | 22,259 | 26,038 | 30,249 |
| Private—Non-profit organisations serving households | 293 | 288 | 318 | 376 | 459 |
| Savings | 4,056 | 4,602 | 5,103 | 5,559 | 6,858 |
| Appropriation of national disposable income | 28,202 | 30,500 | 33,888 | 39,252 | 46,599 |
| Compensation of employees | 17,168 | 17,459 | 18,986 | 22,120 | 26,045 |
| Compensation of employees from the rest of the world, net | |||||
| Operating surplus | 9,09 | 11,064 | 12,651 | 14,514 | 16,277 |
| Property and entrepreneurial income from the rest of the world, net. | -860 | -1,298 | -1,904 | -2,044 | -2,237 |
| Indirect taxes | 3,440 | 3,847 | 4,543 | 4,839 | 6,542 |
| Less, subsidies | 755 | 655 | 598 | 361 | 266 |
| National income | 28,084 | 30,416 | 33,678 | 39,068 | 46,360 |
| Current transfers from the rest of the world, net | 118 | 84 | 210 | 184 | 239 |
| National disposable income | 28,202 | 30,500 | 33,888 | 39,252 | 46,599 |
Table 26.7. CAPITAL FINANCE
| Item | Year ended March | ||||
|---|---|---|---|---|---|
| 1983 | 1984 | 1985 | 1986 | 1987 | |
*Includes all government-owned producer enterprises. | |||||
| $(million) | |||||
| Value of physical increase in stocks | 316 | 514 | 1,524 | 791 | 1,221 |
| Gross fixed capital formation— | |||||
| Private | 5,152 | 5,491 | 6,917 | 7,636 | 8,286 |
| Central government* | 2,070 | 2,368 | 2,085 | 3,058 | 2,721 |
| Local government* | 588 | 616 | 604 | 695 | 771 |
| Purchase of intangible assets from the rest of the world, net | .. | .. | .. | .. | .. |
| Net lending to the rest of the world | -1,944 | -1,605 | -3,236 | -2,916 | -1,899 |
| Gross accumulation | 6,182 | 7,385 | 7,893 | 9,264 | 11,099 |
| Savings | 4,056 | 4,602 | 5,103 | 5,559 | 6,858 |
| Consumption of fixed capital | 2,216 | 2,615 | 3,085 | 3,757 | 4,281 |
| Capital transfers from the rest of the world, net | .. | .. | .. | .. | .. |
| Statistical discrepancy | -90 | 168 | -295 | -52 | -40 |
| Finance of gross accumulation | 6,182 | 7,385 | 7,893 | 9,264 | 11,099 |
Table 26.8. EXTERNAL TRANSACTIONS
| Item | Year ended March | ||||
|---|---|---|---|---|---|
| 1983 | 1984 | 1985 | 1986 | 1987 | |
| $(million) | |||||
| Current | |||||
| Exports of goods and services | 9,116 | 10,699 | 13,317 | 14,037 | 15,040 |
| Compensation of employees from the rest of the world | .. | .. | .. | .. | .. |
| Property and entrepreneurial income from the rest of the world | 208 | 232 | 275 | 321 | 402 |
| Other current transfers from the rest of the world | 413 | 454 | 652 | 709 | 846 |
| Current receipts | 9,737 | 11,385 | 14,244 | 15,067 | 16,289 |
| Imports of goods and services | 10,318 | 11,090 | 14,854 | 15,093 | 14,942 |
| Compensation of employees to the rest of the world | .. | .. | .. | .. | .. |
| Property and entrepreneurial income to the rest of the world | 1,068 | 1,530 | 2,179 | 2,365 | 2,640 |
| Other current transfers to the rest of the world | 295 | 370 | 442 | 525 | 607 |
| Surplus of nation on current transactions | -1,944 | -1,605 | -3.236 | -2,916 | -1,899 |
| Current disbursements | 9,737 | 11,385 | 14,244 | 15,067 | 16,289 |
| Capital | |||||
| Surplus of nation on current transactions | -1,944 | -1,605 | -3,236 | -2,916 | -1,899 |
| Capital transfers from the rest of the world, net | .. | .. | .. | .. | .. |
| Net incurrence of foreign liabilities | 3,984 | ||||
| Capital receipts | 2,040 | ||||
| Purchase of intangible assets from the rest of the world, net | .. | .. | .. | .. | .. |
| Net acquisition of foreign financial assets | 1,489 | ||||
| Statistical discrepancy | 551 | ||||
| Capital disbursements | 2,040 | ||||
Input-output analysis is a powerful tool for studying national economies. It defines and measures in money terms the relationships between the industry groups in the economy, or between the commodity groups produced. For example, the input-output tables can be used to analyse the effect of an increase in production for export of the meat freezing and preserving industry, in terms of the increased supporting production required of all the other industries in the economy, and whether that production goes directly to the meat export works, or indirectly to them through other industries. In commodity terms, the effect of an increase in production of meat carcasses and cuts can be analysed in terms of the direct and indirect supporting production required of all other commodities in the economy.
The main objective of an inter-industry study is to provide an economic statement of the industrial structure of the economy for a given year, measuring the direct and indirect interrelationships between industries and commodities. Aims are as follows:
(a) To provide an overall view of the economy;
(b) To trace the probable effects of major rises or falls in one industry's demand throughout the economy;
(c) To enable the effect of actual or hypothesized changes in the economy to be estimated more accurately than is otherwise possible. Examples of such changes are government policies affecting consumer prices, wages, exchange rates, etc.; and
(d) To provide a measure of the relative demands of industries for imports and the contribution to exports. This demonstrates which industries are the best net earners of overseas exchange.
The concepts used in the study are reconcilable with those in the national accounts.
The Department of Statistics undertakes full-scale five-yearly inter-industry studies covering a great number of industry groups. It supplements these with less detailed 25 industry updates made between the full studies. Considerable delay is inevitable with a full-scale study because an enormous amount of preparatory investigation is necessary, and the detailed information required is not available for a considerable time after the relevant period. Work on the most recent full study, for 1981-82 is well advanced and the first tables were made available in 1988. An update of the previous full study to 1983-84 (which provides 25-category commodity into commodity and inter-industry transactions tables) is available.
The contribution of each producer to gross domestic product (GDP) is measured by the value which it adds in producing goods and services. For each producer, value added may be calculated in two ways: as the gross output of goods and services less the value of goods and services used up in production; or, as the sum of the individual components of value added, i.e., compensation of employees, plus operating surplus, plus consumption of fixed capital, plus indirect taxes, less subsidies.
Individual producers are grouped into production groups on the basis of common economic activity. The classification used to define these production groups distinguishes between those producers that are market-oriented, and those that produce goods and services not normally marketed. Market producers are classified by industry, based on the New Zealand Standard Industrial Classification, while those not normally producing for the market are subdivided into those owned by central government, by local government, and by private non-profit organisations which provide services for households.
The system explicitly recognises government as a producer when it carries out its conventional role of the provision of administrative, health, education, and defence services, etc. Similarly, the large number of organisations which provide services on a non-profit basis—religious orders, schools, hospitals, sporting clubs, etc.—are included as a separate group in the national accounts. Also included among the non-market production groups is an account recording the wages paid by households employing domestic labour.
The table showing contributions to GDP by production group is a summary of data contained in full production accounts which are prepared for each of 25 production groups, and which are also analysed by private, central government, and local government sectors. These accounts are published annually in an appendix to the Monthly Abstract of Statistics.
Table 26.9. CONTRIBUTION TO GROSS DOMESTIC PRODUCT (GDP) BY PRODUCTION GROUP
| Production group | Year ended March | ||||
|---|---|---|---|---|---|
| 1982 | 1983 | 1984 | 1985 | 1986 | |
| $(million) | |||||
| Market production groups— | |||||
| Agriculture | 2,243 | 2,117 | 2,413 | 2,977 | 3,116 |
| Fishing and hunting | 78 | 90 | 105 | 124 | 175 |
| Forestry and logging | 341 | 356 | 431 | 612 | 874 |
| Mining and quarrying | 237 | 385 | 304 | 421 | 513 |
| Food, beverages, and tobacco | 1,647 | 1,986 | 2,358 | 2,499 | 2,582 |
| Textiles, apparel, and leather | 716 | 756 | 708 | 834 | 960 |
| Manufacture of wood products | 472 | 442 | 517 | 615 | 703 |
| Manufacture of paper products, and printing | 724 | 803 | 844 | 1,135 | 1,183 |
| Manufacture of chemicals, petroleum, rubber, plastic | 595 | 668 | 674 | 823 | 1,032 |
| Manufacture of non-metallic mineral products | 337 | 373 | 399 | 436 | 501 |
| Basic metal industries | 217 | 298 | 335 | 442 | 451 |
| Manufacture of fabricated metal products | 1,726 | 1,839 | 1,934 | 2,264 | 2,501 |
| Other manufacturing | 83 | 71 | 81 | 113 | 146 |
| Electricity, gas, and water | 828 | 962 | 1,066 | 1,101 | 1,383 |
| Construction | 1,512 | 1,696 | 1,862 | 2,083 | 2,536 |
| Trade, restaurants, and hotels | 5,334 | 6,208 | 7,074 | 7,406 | 8,539 |
| Transport and storage | 1,449 | 1,624 | 1,922 | 2,121 | 2,291 |
| Communication | 729 | 909 | 1,025 | 1,091 | 1,172 |
| Financing, insurance, real estate, and business services | 2,954 | 3,400 | 3,874 | 4,526 | 5,543 |
| Ownership of owner-occupied dwellings | 1,004 | 1,174 | 1,273 | 1,445 | 2,123 |
| Community, social, and personal services | 1,041 | 1,178 | 1,255 | 1,493 | 1,723 |
| Nominal industry (bank service charge) | -834 | -968 | -1,100 | -1,275 | -1,455 |
| Total, market production groups | 23,434 | 26,366 | 29,356 | 33,290 | 38,593 |
| Non-market production groups— | |||||
| Central government services | 3,360 | 3,686 | 3,767 | 3,915 | 4,580 |
| Local government services | 355 | 402 | 435 | 474 | 533 |
| Private non-profit services | 271 | 274 | 256 | 281 | 320 |
| Domestic services of households | 18 | 19 | 21 | 21 | 22 |
| Total, non-market production groups | 4,004 | 4,381 | 4,479 | 4,691 | 5,455 |
| Total, all production groups | 27,439 | 30,747 | 33,836 | 37,982 | 44,048 |
| Plus, fringe benefits adjustment | ... | ... | ... | ... | 183 |
| Plus, import duties | 337 | 362 | 432 | 604 | 535 |
| Plus, other indirect taxes | 55 | 51 | 62 | 81 | 103 |
| Gross domestic product | 27,831 | 31,160 | 34,329 | 38,667 | 44,868 |
In the table the entry ‘nominal industry (bank service charge)’ requires further explanation. Banks and similar financial institutions largely finance their activities by the excess of interest and other property income received over property income paid out. In the national accounts, property income receipts and payments are regarded as transfers, and not as receipts and payments for a financial service. Therefore, if financial institutions were treated like producers in other industries, their value added would be very small, due to their property income being excluded from the production account.
To overcome this problem, financial institutions are recorded as receiving an imputed bank service charge which is paid by the users of banking services. Rather than spread the payment of this imputed charge across all users, in the national accounts the convention is adopted that it is all paid by a nominal industry, which accordingly has a negative operating surplus equal to the value of the charge. The result is that financial institutions show a realistic operating surplus, while the total operating surplus of all producers, and GDP is unaffected.
Gross fixed capital formation tables record purchases of capital assets, reduced by the value of sales of such assets, plus the value of construction work done by an establishment's own employees; no deduction has been made for assets used up during the period of account. Land purchases and sales, but not land improvements, are excluded by definition.
The tables showing breakdowns of gross capital formation by production group and asset type are summaries of detailed tables, including separate series for private, central and local government sectors, which are available from the Department of Statistics on request.
Table 26.10. GROSS CAPITAL FORMATION BY PRODUCTION GROUP
| Production group | Year ended March | ||||
|---|---|---|---|---|---|
| 1982 | 1983 | 1984 | 1985 | 1986 | |
| $(million) | |||||
| Market production groups— | |||||
| Agriculture | 777 | 776 | 807 | 893 | 575 |
| Fishing and hunting | |||||
| Forestry and logging | 43 | 27 | 31 | 37 | 41 |
| Mining and quarrying | 51 | 66 | 116 | 117 | 159 |
| Manufacture of food, beverages, and tobacco | 393 | 394 | 393 | 440 | 429 |
| Textiles, apparel, and leather | 35 | 68 | 65 | 86 | 102 |
| Manufacture of wood products | 27 | 42 | 41 | 107 | 149 |
| Manufacture of paper products, and printing | 115 | 137 | 141 | 239 | 194 |
| Manufacture of chemicals, petroleum, rubber, plastic | 382 | 1,067 | 1,010 | 779 | 634 |
| Manufacture of non-metallic mineral products | 53 | 63 | 39 | 42 | 41 |
| Basic metal industries | 172 | 301 | 343 | 284 | 560 |
| Manufacture of fabricated metal products | 125 | 148 | 160 | 202 | 252 |
| Other manufacturing | 3 | 3 | 8 | 10 | 12 |
| Electricity, gas, and water | 510 | 592 | 614 | 562 | 547 |
| Construction | 213 | 195 | 219 | 296 | 364 |
| Trade, restaurants, and hotels | 627 | 665 | 788 | 1,024 | 1,236 |
| Transport and storage | 605 | 529 | 465 | 673 | 1,216 |
| Communication | 119 | 195 | 277 | 298 | 444 |
| Financing, insurance, real estate and business services | 539 | 564 | 714 | 985 | 1,472 |
| Community, social, and personal services | |||||
| Ownership of owner-occupied dwellings | 1,095 | 1,214 | 1,417 | 1,640 | 1,873 |
| Total, market production groups | 5,884 | 7,046 | 7,652 | 8,712 | 10,300 |
| Non-market production groups— | |||||
| Central government services | 410 | 449 | 468 | 525 | 671 |
| Local government services | 223 | 240 | 266 | 273 | 315 |
| Private non-profit services | 81 | 74 | 90 | 96 | 103 |
| Domestic services of households | - | - | - | - | - |
| Total, non-market production groups | 714 | 763 | 823 | 893 | 1,089 |
| Total, all production groups | 6,597 | 7,809 | 8,475 | 9,605 | 11,389 |
Table 26.11. GROSS FIXED CAPITAL FORMATION BY TYPE OF CAPITAL GOOD
| Year ended March | Residential buildings | Non-residential buildings | Other construction | Land improvements | Transport equipment | Plant, machinery, and other equipment | Total |
|---|---|---|---|---|---|---|---|
| $(million) | |||||||
| 1982 | 1,180 | 1,034 | 862 | 274 | 1,217 | 2,030 | 6,597 |
| 1983 | 1,333 | 1,176 | 1,054 | 271 | 1,246 | 2,728 | 7,809 |
| 1984 | 1,555 | 1,250 | 1,1 | 250 | 1,194 | 3,097 | 8,475 |
| 1985 | 1,784 | 1,473 | 1,107 | 256 | 1,698 | 3,286 | 9,605 |
| 1986 | 2,085 | 1,982 | 1,276 | 187 | 2,116 | 3,743 | 11,389 |
The table shows the value of the physical increase in stocks of raw materials, work-in-progress, and finished goods by production group. This is a new measure, which removes capital gains and losses caused by holding stocks purchased at prices higher or lower than those ruling during the year. Statistics showing increases in book value of stocks are available from the Department of Statistics on request.
Table 26.12. INCREASE IN STOCKS
| Production group | Year ended March | ||||
|---|---|---|---|---|---|
| 1982 | 1983 | 1984 | 1985 | 1986 | |
| $(million) | |||||
| Market production groups— | |||||
| Agriculture | 86 | -65 | 241 | 256 | 611 |
| Fishing and hunting | 2 | - | - | - | - |
| Forestry and logging | 258 | 289 | 365 | 522 | 733 |
| Mining and quarrying | 19 | 1 | 7 | 11 | 10 |
| Manufacture of food, beverages, and tobacco | 91 | -15 | -2 | 136 | -92 |
| Textiles, apparel, and leather | 57 | -12 | 16 | 118 | 26 |
| Manufacture of wood products | 35 | 26 | -22 | 16 | 50 |
| Manufacture of paper products, and printing | 29 | 52 | - | 89 | 52 |
| Manufacture of chemicals, petroleum, rubber, and plastic | 36 | 47 | -11 | 129 | 146 |
| Manufacture of non-metallic mineral products | 13 | 5 | -2 | 4 | 4 |
| Basic metal industries | 19 | -6 | 20 | 47 | -24 |
| Manufacture of fabricated metal products | 157 | 97 | -50 | 350 | 96 |
| Other manufacturing | 6 | 3 | 1 | 19 | 15 |
| Electricity, gas, and water | 19 | 17 | 47 | 34 | 24 |
| Construction | 9 | 18 | 8 | 22 | 2 |
| Trade, restaurants, and hotels | 656 | 494 | 173 | 1,289 | -150 |
| Transport and storage | 1 | 14 | 10 | 14 | 1 |
| Communication | 21 | 41 | 42 | 112 | 175 |
| Financing, insurance, real estate, and business services, community, social, personal services | 9 | 5 | 8 | 14 | 1 |
| Ownership of owner-occupied dwellings | - | - | - | - | - |
| Total, market production groups | 1,524 | 1,012 | 849 | 3,180 | 1,681 |
| Non-market production groups— | |||||
| Central government services | 2 | 4 | 3 | 5 | - |
| Local government services | |||||
| Private non-profit services | |||||
| Domestic services of households | - | - | - | - | - |
| Total, all production groups | 1,526 | 1,015 | 852 | 3,184 | 1,681 |
Gross domestic product and expenditure on gross domestic product at constant prices is calculated by removing the effects of price changes from the current price production accounts and expenditure aggregates respectively. Such statistics enable annual and quarterly comparisons to be made of the relative volumes of goods and services produced, consumed, stockpiled, and accumulated in the New Zealand economy. Details on industries and aggregates provide information on structural changes in the economy which are not readily observed in the current price accounts. Gross domestic product estimates at constant prices have been developed from 1977-78 onwards and are now based on the 1982-83 year.
With the constant price series it has not been possible to produce separate statistics for all 25 production groups used in the current price accounts. The production groups which have been amalgamated are as follows:
Manufacturing of fabricated metal products; machinery and equipment; and other manufacturing industries;
Community, social, and personal services; private non-profit services to households; and domestic services of households; and
Central government services; and local government services.
Table 26.13. CONTRIBUTION TO GDP AT CONSTANT 1982-83 PRICES BY PRODUCTION GROUP
| Industrial groups | Year ended March | ||||
|---|---|---|---|---|---|
| 1982 | 1983 | 1984 | 1985 | 1986 | |
*For imputed bank service charge. | |||||
| $(million) | |||||
| Agriculture | 2,015 | 2,117 | 2,000 | 1,975 | 2,512 |
| Fishing and hunting | 86 | 90 | 97 | 95 | 95 |
| Forestry and logging | 358 | 356 | 365 | 378 | 406 |
| Mining and quarrying | 253 | 386 | 303 | 399 | 576 |
| Food, beverages, tobacco | 1,872 | 1,986 | 1,998 | 2,085 | 1,926 |
| Textiles, apparel, and leather | 745 | 756 | 736 | 819 | 797 |
| Wood and wood products | 489 | 442 | 468 | 521 | 505 |
| Paper, printing, and publishing | 832 | 803 | 871 | 986 | 990 |
| Chemicals, petroleum, and plastics | 689 | 668 | 716 | 818 | 791 |
| Non-metallic mineral products | 360 | 373 | 377 | 412 | 427 |
| Basic metal industries | 285 | 298 | 334 | 371 | 315 |
| Machinery and metal products, miscellaneous | 1,911 | 1,909 | 1,935 | 2,212 | 2,115 |
| Electricity, gas, water | 956 | 962 | 1,062 | 1,076 | 1,102 |
| Construction | 1,655 | 1,696 | 1,846 | 1,909 | 2,079 |
| Trade, restaurants, and hotels | 6,362 | 6,208 | 6,402 | 6,631 | 6,522 |
| Transport and storage | 1,641 | 1,623 | 1,811 | 1,948 | 1,893 |
| Communications | 874 | 909 | 963 | 1,046 | 1,134 |
| Financing, insurance, real estate and business services | 3,419 | 3,400 | 3,674 | 3,914 | 4,169 |
| Owner-occupied dwellings | 1,148 | 1,174 | 1,198 | 1,225 | 1,255 |
| Community and personal services | 1,441 | 1,471 | 1,538 | 1,589 | 1,674 |
| General government services | 4,053 | 4,088 | 4,126 | 4,135 | 4,134 |
| Plus, unallocated indirect taxes | 449 | 413 | 382 | 474 | 493 |
| Less, nominal industry* | -946 | -968 | -1,126 | -1,251 | -1,414 |
| Gross domestic product | 30,950 | 31,160 | 32,076 | 33,765 | 34,497 |
The series of gross domestic product at constant prices commenced in 1977-78, replacing the previously published Index of Real GDP. A historical series of GDP expressed at 1977-78 base year prices has been calculated from 1954-55 to 1977-78 and is available on request from the Department of Statistics. The historical series does not account for stocks valued at the average prices for each year. Increases in book values are used.
In addition to the annual constant price series shown above, quarterly indexes of gross domestic product at constant prices are also calculated. The quarterly indexes are fully reconciled with the annual series, but are not available at the same level of production group detail used in the annual constant price series.
The following production groups from the annual constant price series have been combined:
Fishing and hunting; forestry and logging; mining and quarrying;
Food, beverages, tobacco; textiles, apparel and leather; wood and wood products; paper, printing and publishing; chemicals, petroleum and plastics; non-metallic mineral products; basic metal industries; machinery and metal products, miscellaneous; and
Transport and storage; communications; financing, insurance, real estate and business services; community and personal services.
Quarterly indexes for unallocated indirect taxes and the nominal industry are not available.
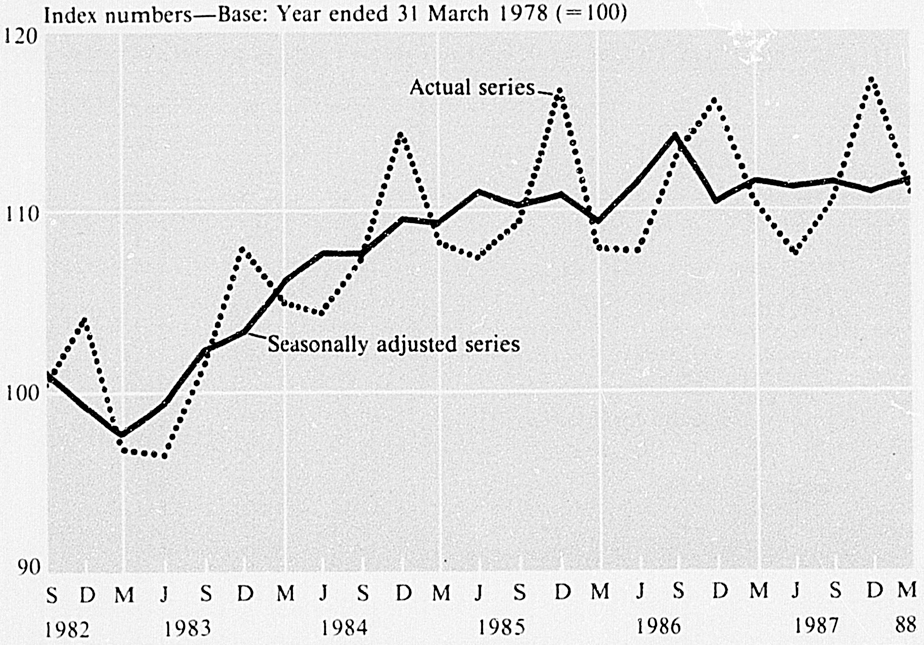
INDEX OF TOTAL GDP—at constant prices
Both actual and seasonally adjusted indexes of GDP at constant prices are shown in table 26.14 for the four quarters to September 1987.
Table 26.14. INDEXES OF GROSS DOMESTIC PRODUCT AT CONSTANT PRICES*
| Industrial groups | Quarter ended | |||
|---|---|---|---|---|
| December 1986 | March 1987 | June 1987 | September 1987 | |
*Quarterly indexes are shown as annual equivalent: Base: 1982-83 (= 100.0) | ||||
| Actual— | ||||
| Agriculture | 170 | 142 | 83 | 110 |
| Fishing, hunting, forestry, mining | 167 | 148 | 92 | 122 |
| Manufacturing | 108 | 104 | 109 | 104 |
| Electricity, gas, water | 119 | 111 | 130 | 134 |
| Construction | 125 | 118 | 131 | 142 |
| Trade, restaurants, hotels | 105 | 101 | 99 | 100 |
| Owner-occupied dwellings | 110 | 110 | 111 | 111 |
| Transport, communications, business and personal services | 128 | 129 | 131 | 134 |
| General government services | 103 | 93 | 104 | 101 |
| Gross domestic product | 116.8 | 111.0 | 109.3 | 112.3 |
| Seasonally adjusted— | ||||
| Agriculture | 124 | 122 | 134 | 130 |
| Fishing, hunting, forestry, mining | 130 | 137 | 122 | 142 |
| Manufacturing | 111 | 114 | 108 | 106 |
| Electricity, gas, water | 125 | 119 | 130 | 122 |
| Construction | 121 | 127 | 133 | 135 |
| Trade, restaurants, hotels | 100 | 103 | 102 | 101 |
| Owner-occupied dwellings | 110 | 110 | 111 | 111 |
| Transport, communications, business and personal services | 129 | 131 | 133 | 136 |
| General government services | 102 | 102 | 101 | 100 |
| Gross domestic product | 113.0 | 114.9 | 114.9 | 115.0 |
Expenditure on gross domestic product estimates at Constant Prices have been developed from 1982-83 onwards and produce separate statistics for six expenditure aggregates.
Table 26.15. EXPENDITURE ON GROSS DOMESTIC PRODUCT AT CONSTANT 1982-83 PRICES
| Expenditure aggregate | Year ended March | |||
|---|---|---|---|---|
| 1983 | 1984 | 1985 | 1986 | |
| Final consumption expenditure | ||||
| A. General government | 5,554 | 5,706 | 5,737 | 5,860 |
| B. Private | 18,592 | 19,110 | 19,837 | 19,912 |
| Increase in stocks | 330 | 322 | 1,103 | 145 |
| Gross fixed capital formation | 7,809 | 8,185 | 8,451 | 8,791 |
| Gross national expenditure | 32,285 | 33,323 | 35,128 | 34,708 |
| Exports of goods and services | 9,279 | 9,862 | 10,539 | 10,902 |
| Less Imports of goods and services | 10,319 | 10,280 | 11,580 | 11,214 |
| Expenditure on GDP | 31,245 | 32,905 | 34,087 | 34,396 |
Final consumption expenditure of resident households is now available by purpose and type. The series are calculated for the years ended 31 March 1983 to 1987. Points to note are:
In tables, total expenditure by households in the domestic market (including expenditure by non-resident individuals) is analysed by purpose and type. This total is then adjusted to obtain final consumption expenditure of resident households, by deducting expenditure of overseas visitors in New Zealand, and adding that of New Zealand visitors overseas.
Table A, expenditure by purpose, classifies expenditure on goods and services by their use, that is, the analysis distinguishes between the purposes for which households purchase goods and services. Accordingly, a mixture of goods and services may be combined in a single category, for example, item 8, restaurants and hotels, includes expenditure on food, alcohol and accommodation.
Table B, expenditure by type, classifies expenditure on goods and services by durability. Non-durable goods are defined as those with an average useful life of less than one year. Durable goods are expected to last one year or longer.
Table 26.16. FINAL CONSUMPTION EXPENDITURE OF RESIDENT HOUSEHOLDS
| (A) BY PURPOSE | |||||
|---|---|---|---|---|---|
| Year ended 31 March | |||||
| 1983 | 1984 | 1985 | 1986 | 1987 | |
*Includes fringe benefits received by households. †Included in ‘hotels and restaurants’ is the expenditure on alcohol consumed in chartered clubs, hotels, taverns and licensed restaurants. Purchases from bottle stores and wine shops are included in ‘beverages’. | |||||
| $(million) | |||||
| Food and beverages | |||||
| Food | 2,518 | 2,726 | 2,985 | 3,368 | 3,873 |
| Beverages† | 632 | 692 | 759 | 827 | 983 |
| Clothing and footwear | 1,362 | 1,390 | 1,552 | 1,751 | 2,101 |
| Housing | |||||
| Imputed rent of owner-occupied dwellings | 1,837 | 1,977 | 2,247 | 3,031 | 3,544 |
| Rental payments and associated costs | 616 | 647 | 731 | 921 | 1,071 |
| Household goods and services | |||||
| Fuel and power | 439 | 463 | 482 | 572 | 716 |
| Furniture, floor coverings and appliances | 959 | 1,033 | 1,163 | 1,311 | 1,513 |
| Textiles and tableware | 396 | 389 | 443 | 492 | 601 |
| Other goods and services | 358 | 417 | 461 | 526 | 637 |
| Health and medical goods and services | 858 | 928 | 1,034 | 1,282 | 1,608 |
| Transport | |||||
| Cars, motorcycles and other vehicles | 1,134 | 1,195 | 1,429 | 1,543 | 1,645 |
| Vehicle operation* | 1,570 | 1,739 | 1,977 | 2,447 | 2,502 |
| Public transport | 741 | 819 | 951 | 1,051 | 1,207 |
| Recreation and education | 1,670 | 1,840 | 2,041 | 2,308 | 2,766 |
| Hotels and restaurants† | 1,526 | 1,698 | 1,954 | 2,327 | 2,687 |
| Other goods and services | |||||
| Tobacco | 406 | 464 | 512 | 563 | 694 |
| Personal goods and services | 691 | 715 | 815 | 974 | 1,119 |
| Postal and telephone | 311 | 341 | 366 | 398 | 514 |
| Services not elsewhere classified* | 406 | 457 | 553 | 726 | 886 |
| Total expenditure by households in New Zealand | 18,431 | 19,930 | 22,454 | 26,418 | 30,665 |
| Less, Non-resident
households’ expenditure in New Zealand. Plus, resident households’ expenditure overseas | -133 | -159 | -195 | -380 | -417 |
| Final consumption expenditure of resident households | 18,298 | 19,771 | 22,259 | 26,038 | 30,249 |
| (B) BY TYPE | |||||
| Year ended 31 March | |||||
| 1983 | 1984 | 1985 | 1986 | 1987 | |
| $(million) | |||||
| Total non-durable goods | 5,590 | 6,071 | 6,675 | 7,647 | 8,737 |
| Total durable goods | 5,671 | 5,998 | 6,851 | 7,698 | 8,875 |
| Total services* | 7,169 | 7,860 | 8,928 | 11,073 | 13,053 |
| Total expenditure by households in New Zealand | 18,431 | 19,930 | 22,454 | 26,418 | 30,665 |
| Less, Non-resident
households’ expenditure in New Zealand. Plus, resident households’ expenditure overseas | -133 | -159 | -195 | -380 | -417 |
| Final consumption expenditure of resident households | 18,298 | 19,771 | 22,259 | 26,038 | 30,249 |
A country's overseas balance of payments statement is a comprehensive account of its economic transactions with the rest of the world. The New Zealand balance of payments estimates are based on the principles set out in the Balance of Payments Manual, Fourth Edition, International Monetary Fund, and are in conformity with the methods used by other countries.
Annual estimates of the New Zealand balance of payments, together with an explanation of methodology, are shown in more detail in the annual volume Overseas Balance of Payments published by the Department of Statistics. Annual, quarterly, and monthly estimates are available through the department's ‘INFOS’ database. Annual and quarterly estimates are also published in the Monthly Abstract of Statistics.
The major principles used in preparing a balance of payments statement are:
Goods sold from one country to another are recorded at the time ownership changes, and other transactions are recorded at the time they occur;
Exports and imports of merchandise are valued at f.o.b. (free on board) in the exporting country;
As far as possible, all transactions are shown on a gross, rather than on a net, settlement basis;
Wherever possible, all transactions are valued at market prices; and
All transactions are recorded in New Zealand dollars. Where another currency was used for the transaction the currency exchange rates ruling at the time the transaction occurred have been used to convert the transaction to New Zealand dollars.
These are for March years and are otherwise identical with the figures published in chapter 22, Overseas trade. Exports are valued f.o.b. (free on board); imports are valued c.i.f. (cost, insurance, and freight).
There are some imports and exports which are included in the balance of payments out not in external trade statistics.
A portion of New Zealand's exports are sold on consignment in the United Kingdom. The change of ownership occurs well after the goods have been recorded in New Zealand external trade statistics. Also, the valuation in external trade statistics is an estimate of future realisations. Adjustments to bring trade statistics to balance of payments concepts show mainly as a credit entry.
The debit entry contains the adjustment of imports from c.i.f. value to f.o.b. value.
New Zealand's exports and imports of merchandise on balance of payments basis.
The exports of services from, and imports of services to, New Zealand. The balance on services is the difference between the sum of the credit entries and the sum of the debit entries for these items.
The credit entries show the income accruing to New Zealand residents from overseas investments, while the debit entries show the income accruing to overseas residents from their investments in New Zealand.
This item provides the counter-entries for gifts of goods, services, and financial assets to and from New Zealand. Examples are immigrants’ transfers, gifts and donations, foreign aid payments, and relief supplies.
The balance on services plus international investment income credits, minus international investment income debits, plus transfer credits, minus transfer debits.
The balance on merchandise trade, plus the balance on invisibles. It is a measure of the surplus of outflows of goods, services, and transfers from New Zealand over the inflows of goods, services, and transfers into New Zealand.
These items show the changes in long- term claims on the rest of the world, and in long-term liabilities to the rest of the world, of the private sector.
Includes all government capital movements except movements in government-held reserve assets, and government borrowing to maintain New Zealand's foreign exchange reserves. Direct investment transactions of government-owned corporations are included.
This item includes those capital movements by the Reserve Bank of New Zealand and the trading banks which are not movements in reserve assets or borrowing to maintain reserves.
This is the balancing item. It offsets any difference between the sum of the credit column and the sum of the debit column. It covers any errors in the balance of payments estimates and all omissions. Included in the omissions are short-term private capital movements.
An indicator of the net capital inflow which occurred during the period. A negative sign denotes a net outflow. The item includes net official borrowing, direct investment flows, other long-term private and government capital movements, capital movements by monetary institutions, and the residual item.
The movements in New Zealand's foreign exchange reserves during the year. Reserves measured in New Zealand dollars may change because transactions have occurred, or because the value of the New Zealand dollar has changed relative to the currency in which the reserve asset is denominated. The presentation shows the total change in reserves and, separately, a counterpart to changes in reserves caused by exchange rate changes. The difference between these two items is equal to the change in reserves caused by transactions in reserve assets.
New Zealand's reserves may change because of an allocation of special drawing rights by the International Monetary Fund. This is not regarded as a transaction, and there is a counterpart item for such an allocation.
The regional break-up of the balance of payments is on a geographical (as distinct from a currency) basis. This means that it is not the currency in which any economic transaction is settled, but the residence of New Zealand's immediate partner in the transaction which determines the region in which the transaction is recorded. Any exception to this rule is due to statistical necessity, insufficiency of basic data, etc., rather than choice.
United States of America, Puerto Rico, Virgin Islands, American Samoa, Guam, and other American islands in the Pacific.
The members of the European Community which form a common market; Belgium, the Netherlands, Luxembourg, France, Greece, Italy, the Federal German Republic, Denmark, Ireland, and Spain and Portugal (after 1 January 1986). The United Kingdom is also a member of the EC but is shown separately.
Austria, Canada, Finland, Iceland, Liechtenstein, Norway, Portugal and Spain (before 1 January 1986), Sweden, Switzerland, and Turkey.
Asian countries east of Iran, and all Pacific countries except Australia, Japan, the Americas, and New Zealand.
Transactions with the United Nations and its agencies, the International Monetary Fund, the International Bank for Reconstruction and Development, the International Finance Corporation, the Asian Development Bank, the South Pacific Air Transport Council, and other international organisations.
The system used in preparing the New Zealand balance of payments statement is by double entry. Every transaction results in a pair of equal credit and debit entries. Any entries which are not automatically paired are deliberately furnished with special off-setting entries. The sum of all the credit entries in the statement is thus, in principle, numerically equal to the sum of all the debit entries, with any inequality that may arise being attributable to net statistical errors and omissions. In practice, the residual item comprises short-term capital movements, data on which are not compiled, as well as errors and omissions.
The balance of payments is a record of economic transactions between residents and non-residents. Residents include the general government, all individuals, private non-profit organisations and enterprises, located or operating within the territory of an economy.
The general government of New Zealand includes New Zealand embassies, consulates and military establishments located abroad. Conversely the embassies and consulates, etc., which are located in New Zealand are not considered to be New Zealand residents.
The concept of residence adopted for individuals is designed to encompass all persons who may be expected to consume goods and services, participate in production, or engage in other economic activities in New Zealand, on other than a temporary basis.
As a general rule, persons who live, or who intend to live, in New Zealand for at least one year are considered to be residents. The exception to this are employees of foreign governments, such as diplomatic and consular representatives, and personnel stationed in New Zealand. These employees are regarded as non-residents. New Zealand citizens who are employed by foreign embassies are regarded as New Zealand residents employed by foreigners.
Enterprises resident in New Zealand are the actual units that engage in the production of goods and services in New Zealand. Therefore, subsidiaries and branches of overseas companies are treated as residents, while subsidiaries and branches of New Zealand companies operating overseas are regarded as residents of the country in which they operate.
The Department of Statistics has commenced a new statistical series covering the transactions of New Zealand foreign exchange dealers from July 1986. This replaces the overseas exchange transactions record previously maintained by the Reserve Bank of New Zealand. Details are available from the department. See also chapter 24, Money and banking, which describes overseas exchange and the foreign exchange market.
As far as possible, the balance of payments statement and the external transactions account are prepared using the same principles and definitions. However, they have different uses and there are some major differences in content. The most important of these is the inclusion of the undistributed earnings of direct investment enterprises in the balance of payments. These earnings are included as a memorandum item in the external transactions account. Therefore the balance on current account (i.e., the surplus of the nation on current account) in the external transactions account is more favourable than the balance on current account as shown in the balance of payments statement.
A user who is interested in the effect of New Zealand's transactions with the rest of the world on the major economic aggregates of the economy should use the external transactions account of the national accounts, which is an integrated system designed for this type of analysis.
A user who is interested in a close examination of New Zealand's external transactions should use the balance of payments, which offers a more detailed classification of transactions than the external transactions account.
Table 26.17. SUMMARY OF NEW ZEALAND TRANSACTIONS WITH OTHER COUNTRIES
| Item | 1984–85* | 1985–86* | 1986–87* | ||||
|---|---|---|---|---|---|---|---|
| Credit | Debit | Credit | Debit | Credit | Debit | ||
*Figures are derived from quarterly balance of payments data, and are subject to later revision. Quarterly statistics are not available on a regional basis. †Includes direct investment, other private and government capital movements, capital movements by monetary institutions, and errors and omissions. | |||||||
| NZ$(million) | |||||||
| Exports/imports (as published in external trade statistics) | 10,520 | 11,642 | 10,893 | 12,092 | 11,599 | 11,368 | |
| Adjustments to balance of payments concepts | -129 | -887 | -121 | -929 | -107 | -855 | |
| Exports/imports (f.o.b. exporting country) | 10,391 | 10,755 | 10,772 | 11,164 | 11,491 | 10,513 | |
| Balance on merchandise trade | -364 | -391 | -978 | ||||
| Transportation | 1,533 | 1,601 | 1,664 | 1,681 | 1,717 | 1,761 | |
| Travel | 597 | 839 | 757 | 817 | 982 | 1,027 | |
| Insurance | 23 | 51 | 23 | 46 | -18 | 55 | |
| Other miscellaneous services | 477 | 1,074 | 531 | 1,031 | 625 | 1,050 | |
| Government transactions | 93 | 191 | 73 | 200 | 51 | 295 | |
| Balance on services | -1,033 | -723 | -832 | ||||
| International investment income | 399 | 2,459 | 458 | 2,657 | 583 | 2,966 | |
| Transfers | 652 | 442 | 710 | 524 | 847 | 608 | |
| Balance on invisibles | -2,882 | -2,738 | -2,976 | ||||
| Balance on current account | -3,245 | -3,128 | -1,996 | ||||
| Residual (includes short-term private capital movements and errors and omissions) | 1,904† | ... | 3,121 | ... | 797 | ... | |
| Government borrowing (net) | 1,605 | ... | 945... | ... | 6,721 | ... | |
| Reserve Bank borrowing (net) | -217 | ... | -323 | ... | -166 | ... | |
| IMF drawings (net) | - | ... | - | ... | - | ... | |
| Total official borrowing (net) | 1,388 | ... | 623 | ... | 6,557 | ... | |
| Net apparent capital inflow | 3,292 | 3,744 | 7,352 | ||||
| Changes in reserve assets— | |||||||
| Monetary gold | ... | - | ... | - | ... | - | |
| Special drawing rights (SDRs)— | |||||||
| Total change in holdings | ... | 9 | ... | -2 | ... | 8 | |
| Counterpart to allocation/cancellation | ... | - | ... | - | ... | - | |
| Counterpart to valuation changes | ... | 1 | ... | - | ... | - | |
| Change due to transactions | ... | 8 | ... | -2 | ... | 9 | |
| Reserve position at the IMF— | |||||||
| Total change in holdings | ... | -45 | ... | - | ... | - | |
| Counterpart to valuation changes | ... | - | ... | - | ... | - | |
| Change due to transactions | ... | -45 | ... | - | ... | - | |
| Reserve Bank overseas reserves— | |||||||
| Total change in holdings | ... | 751 | ... | 633 | ... | 4,324 | |
| Counterpart to valuation changes | .. | ... | -1 | ... | -413 | ||
| Change due to transactions | ... | 751 | ... | 635 | ... | 4,738 | |
| Treasury overseas reserves— | |||||||
| Total change in holdings | ... | 97 | ... | 95 | ... | 544 | |
| Counterpart to valuation changes | ... | 762 | ... | 113 | ... | -66 | |
| Change due to transactions | ... | -665 | ... | -18 | ... | 610 | |
| Summary of reserve transactions— | |||||||
| Total change in reserves | ... | 811 | ... | 728 | ... | 4,876 | |
| Counterpart to valuation changes | ... | 763 | ... | 112 | ... | -479 | |
| Changes in reserves due to transactions | ... | 48 | ... | 616 | ... | 5,357 | |
| Total reserves at 31 March (as
shown in Reserve Bank Bulletin) | 1,940 | 2,667 | 7,544 | ||||
Table 26.18. REGIONAL SUMMARIES OF BALANCE OF PAYMENTS TRANSACTIONS
| Merchandise trade balance | Invisibles balance | Current account balance | Net capital movements* | Net compensatory financing | Net transactions in reserves | |
|---|---|---|---|---|---|---|
*Includes all transactions in financial assets and liabilities other than transactions in reserves and reserve related liabilities. Excludes errors and omissions. | ||||||
| NZ$(million) 1981–82 | ||||||
| United Kingdom | 328 | -454 | -32 | 189 | 1,294 | -8 |
| Other EC | 61 | -141 | -59 | 41 | 24 | 12 |
| Australia | -488 | -303 | -845 | 406 | - | - |
| United States | -281 | -384 | -645 | -41 | -300 | 21 |
| Japan | -143 | -131 | -273 | 84 | 183 | -108 |
| Other OECD | -88 | -127 | -208 | 42 | 228 | -9 |
| Asia-Oceania | 214 | -31 | 159 | -87 | - | 1 |
| Central and South America—Caribbean | 128 | -26 | 102 | 5 | - | 1 |
| Other countries | 254 | -26 | 228 | 8 | 32 | 5 |
| International organisations | - | -39 | -55 | -7 | -130 | 47 |
| Total 1981–82 | -14 | -1,662 | -1,628 | 638 | 1,331 | -40 |
| NZ$(million) 1982–83 | ||||||
| United Kingdom | 156 | -558 | -298 | 938 | 255 | -187 |
| Other E.C. | 10 | -147 | -110 | 6 | 13 | -338 |
| Australia | -645 | -212 | -831 | 169 | - | - |
| United States | -225 | -658 | -845 | 582 | 575 | -72 |
| Japan | -172 | -127 | -296 | 330 | 378 | -274 |
| Other OECD | -89 | -150 | -227 | -139 | 259 | 7 |
| Asia-Oceania | 126 | -63 | 49 | 285 | - | - |
| Central and South America—Caribbean | 129 | 3 | 133 | -28 | - | - |
| Other countries | 551 | -46 | 506 | 4 | 80 | -100 |
| International organisations | - | -26 | -85 | -12 | -104 | -7 |
| Total 1982–83 | -158 | -1,984 | -2,004 | 2,133 | 1,456 | -971 |
New Zealand's economy is small and dependent on overseas trade. The value of exports of merchandise over the three years April 1984—March 1987 averaged 24 percent of gross domestic product (GDP), and the value of imports of merchandise (valued f.o.b.) averaged 24 percent. The current account receipts (credits) in the balance of payments averaged 34 percent of GDP, and the current account payments (debits) averaged 40 percent.
Over these three years 1984–87, the earnings from merchandise exports made up 72 percent of total current account credits, while the cost (f.o.b.) of imports of goods accounted for 61 percent of current account payments. Thus the balance of payments is dominated by the fluctuations in the earnings from exports and in the payments for imports of goods. The balance on merchandise trade is strongly influenced by changes in the terms of trade as well as by changes in the volumes of exports and imports.
The balance on current account for the 1986–87 financial year was a deficit of $1,996 million. This can be compared to a deficit of $3,128 million in 1985–86. There was a total increase in overseas reserves of $5,357 million in 1986–87, compared with an increase of $616 million in 1985–86.
New Zealand Business Patterns. Department of Statistics (annual).
New Zealand Enterprise Survey 1985–86. Department of Statistics.
Consolidated National Accounts for New Zealand on an SNA Basis. Research Paper No. 32, D. Grindell (ed). Reserve Bank of New Zealand, 1981.
National Accounting Analysis of the Public Accounts, 1975–76 to 1984–85. Monthly Abstract of Statistics, November/December 1986, Appendix V. Department of Statistics.
National Accounts in Constant Prices. Monthly Abstract of Statistics, September 1984, Appendix I. Department of Statistics.
New Zealand System of National Accounts. Department of Statistics (annual).
New Zealand's Real National Disposable Income. Monthly Abstract of Statistics, June 1985, Appendix 1. Department of Statistics.
Quarterly National Accounts at Constant Prices. Monthly Abstract of Statistics, August 1985, Appendix VI. Department of Statistics.
Quarterly Predictions. New Zealand Institute of Economic Research.
A System of National Accounts: Studies in Methods, Series F, No. 2, Rev. 3. United Nations, 1968.
Inter-industry Study of the New Zealand Economy, (1959–60, 2 parts), (1971–72, 1 part), (1976–77, provisional bulletin), (1976–77, 1 part). Department of Statistics.
New Zealand Input-Output Tables 1983–84. Department of Statistics.
Provisional New Zealand Input-Output Tables 1981–82. Department of Statistics.
New Zealand had converted from the Imperial to the International System of units for measurement by 1976. Almost all the statistics in this volume are in metric (SI) units, except for shipping (excluding cargo).
| Metric to Imperial | Metric to multiples | ||
|---|---|---|---|
| Length | |||
| 1 millimetre (mm) | = 0.04 inches (in.) | 1 centimetre (cm) | = 10 millimetres (mm) |
| 1 centimetre (cm) | = 0.39 inches (in.) | 1 metre (m) | = 100 centimetres (cm) |
| 1 metre (m) | = 39.37 inches (in.) | 1 kilometre (km) | = 1000 metres (m) |
| = 1.09 yards (yds) | |||
| 1 kilometre (km) | = 0.62 miles | ||
| Area | |||
| 1 square metre (m2) | = 10.76 square feet (sq. ft) | 1 hectare (ha) | = 10000 square metres (m2) |
| = 1.20 square yards (sq. yd) | 1 square kilometre (km2) | = 100 hectares (ha) | |
| 1 hectare (ha) | = 2.47 acres | ||
| 1 square kilometre (km2) | = 247 acres | ||
| = 0.39 square miles | |||
| Volume and capacity | |||
| 1 cubic centimetre (cm3) | = 0.06 cubic inches (cu. in.) | 1 cubic metre (m3) | = 10000000 cubic centimetres (cc) |
| 1 cubic metre (m3) | = 35.31 cubic feet (cu. ft) | 1 litre (l) | = 1000 millilitres (ml) |
| = 1.31 cubic yards (cu. yd) | 1 millilitre (ml) | = 1 cubic centimetre (cc) | |
| 1 litre (l) | = 1.76 pints | 1 cubic metre (cm3) | = 1000 litres (l) |
| = 0.22 gallons | |||
| Mass (weight) | |||
| 1 gram (g) | = 0.04 ounces (oz) | ||
| 1 kilogram (kg) | = 2.20 pounds (lb) | 1 kilogram (kg) | = 1000 grams (g) |
| 1 tonne (t) | = 2204.62 pounds (lb) | 1 tonne (t) | = 1000 kilograms (kg) |
| = 0.98 tons | |||
| Velocity | |||
| 1 kilometre per hour (km/h) | = 0.62 miles per hour (mph) | ||
| Pressure | |||
| 1 kilopascal (kPa) | = 0.15 pounds per square inch (psi) | 1 megapascal (MPa) | = 1000 kilopascals (kPa) |
| 1 megapascal (MPa) | = 0.06 tons per square inch (tons psi) | ||
| Temperature | |||
| Degrees Fahrenheit (F) | = 9 X C/5 + 32 | ||
| Degrees Celsius (C) | = 5 (F - 32)/9 | ||
| Energy | |||
| 1 kilojoule (kJ) | = 0.95 British thermal units (Btu) | 1 megajoule (MJ) | = 1000 kilojoules (kJ) |
| = 0.24 calories (cal) | 1 kilowatt hour (kWh) | = 3.6 megajoules (MJ) | |
| 1 gigajoule (GJ) | = 1000 megajoules (MJ) | ||
| 1 petajoule (PJ) | = 1 million gigajoules (GJ) | ||
| Power | |||
| 1 kilowatt (kW) | = 1.34 UK horsepower | 1 kilowatt (kW) | = 1000 watts |
| 1 megawatt (MW) | = 1000 kilowatts (kW) | ||
| 1 gigawatt (GW) | = 1000 megawatts (MW) | ||
Statistical terms defined here are those frequently used in censuses of population and businesses and other data and index series referred to in this book. For definitions of national accounting terms and conventions see section 26.2, National accounts.
- Activity unit.
Formerly known as an establishment, this is a separate operating unit engaged in New Zealand in one (or predominantly one) kind of economic activity from a single physical location or base from which work is carried out—includes an ancillary activity unit.
- Additions to fixed assets.
Purchases of new and secondhand fixed assets and the cost of work done by a firm's own employees in producing, constructing and installing fixed assets for its own use.
- Ancillary activity unit.
An administrative or general servicing unit such as a head office, storage unit, laboratory, etc., the prime function of which is to provide services for other locations of the enterprise.
- Bone-in weight.
Dressed carcass weight, including bone.
- Capital expenditure less disposals.
The amount spent on the purchase of new and secondhand fixed assets, less the proceeds received from the sale of any such assets.
- C.i.f. (cost including insurance and freight).
A basis for valuation of merchandise imports, representing the cost to the importer of buying the goods and bringing them to the wharfside in New Zealand.
- Census.
A type of survey in which all members of a given population provide information. These units may be people, companies, buildings, local authorities, etc. The Department of Statistics carries out a range of national censuses at regular intervals, such as the Census of Population and Dwellings, the Census of Fishing, and the Census of Manufacturing. (See also sample survey.)
- Density (of population).
Usually expressed as the average number of persons per square kilometre (or hectare) in a particular locality.
- Depreciation.
As charged in the books of account on fixed tangible assets owned by the establishments and ancillary units.
- Employer contributions.
Payments to superannuation, pension and welfare schemes, and accident compensation levies.
- Employment status.
The respondent's employment status within the labour force. This applies to persons in the full and part-time labour force. At the 1981 census it applied only to persons in the full-time labour force. Employment status categories are: working for wages or salary; self-employed and not employing others; employer of others in own business; and unpaid worker in a family business.
- Enterprise.
A single business entity operating in New Zealand either as a legally constituted body such as a company, partnership, trust, local or central government trading organisation, incorporated society, producer board, church, voluntary organisation or self-employed individual.
- Enterprise group.
An independent business unit operating in New Zealand either as a single business entity, or a group of business entities under common ownership or control.
- Establishment.
A term used in business censuses prior to 1982–83. While normally at a single physical location, in the transport or building industries an establishment may include activities at several locations which are accounted for as one activity. (See also activity unit.)
- Ex-nuptial birth.
Birth of a child out of wedlock, including from a de facto relationship.
- Exports (as applied to balance of payments data).
Goods and services sold by New Zealand-resident producers to non-residents. (See also merchandise exports, invisibles (trade), and re-exports.)
- F.o.b. (free on board).
A basis for valuation of merchandise exports. It is the current market value of goods in the country of origin, including all costs necessary to get them on board the ship or aircraft, but excluding freight, insurance, and other costs involved in transporting goods between countries.
- Fertility.
The actual level of reproductive performance of a population, based on the number of live births that occur. Fertility is normally measured in terms of women of child-bearing age, defined as 15–44 years, although births to women outside this age range can occur.
- Gainfully employed in the labour force.
Persons employed in the labour force either full- or part-time, excluding persons who are unemployed and seeking work.
- Gross tonne.
The unit of actual weight of cargo, including packaging but not including the weight of a reusable container.
- Imports (as applied to balance of payments data).
All goods and services purchased by New Zealand residents from non-residents. (See also merchandise trade and invisible (trade)).
- Income (total).
Income before tax which a person aged 15 years and over receives for a financial year from all sources, e.g., wages, salary, social welfare payments, interest, dividends, commission, pre-tax business or farming income (less expenses).
- Indexes.
Indexes are used to measure the total impact of changes in the attributes of commodities which cannot be compared directly. In New Zealand the most common use of index numbers is to measure changes in prices or money values over time. When calculating a price index the type, quantity and quality of each commodity are all held constant so that the price movement can be measured. There are a number of methods for calculating index numbers and a type called the Laspeyres index is that most often encountered. The most frequently quoted index is the Consumers Price Index, which reports quarterly the change in price level of those goods and services purchased by private New Zealand households during the index-base period. By expressing the changes as an index, price changes in commodities as diverse as beef, hairdressing and club subscriptions can all be aggregated to produce a measure of overall price change.
Using the Consumers Price Index as an example, a fixed-base Laspeyres index is compiled as follows:
The base for measurement is established by choosing a representative selection of goods and services from commodities purchased by New Zealand households in the previous year. The commodities in the base are often referred to as a basket of goods or an index regimen and the time period as a base year. By convention the index number of 1000 is used to express the value of the basket of goods in the base year.
As part of the process of establishing the base, a weight is assigned to each commodity. This weight shows the relative importance of the commodity in household expenditure. The weighting procedure ensures that major expenditure items are given their due importance. For example, a small increase in the price of commodities like bread or petrol will be more significant than a large increase in the price of pianos.
Once the base for measurement is established, the quantity, type and quality of the commodities chosen are kept constant so that the price movement alone is measured. This continues to be the case until the index base is revised. Such revisions are needed because new products come onto the market, old products disappear and the pattern of household expenditure changes.
Data on the current prices of the commodities in the base are then obtained at three-monthly intervals.
Once collected, the current prices are compared with the prices in the base year and the percentage increase or decrease for each commodity is computed. Finally the index is obtained by multiplying the percentage changes for each commodity by their assigned weights and aggregating these changes for all commodities.
- Indirect taxes.
Taxes not based on income; includes land tax, road user charges, licence fees, rates and GST.
- Insurances.
Business insurance premiums paid.
- Interest, etc.
Interest, bad debts, donations, royalties, insurance claims paid or received and patent fees.
- Invisible (trade).
Export and import of services such as transport, travel, and insurance.
- Labour force.
Consists of persons aged 15 years and over who regularly work for one or more hours per week for financial gain, are unpaid working in a family business, or who are unemployed and seeking either full or part-time work. The full-time labour force comprises persons working 30 hours or more per week, including unemployed persons seeking full-time work. The part-time labour force comprises persons working 1 to 29 hours per week, including unemployed persons seeking part-time work.
- Main activity.
The main activity in which persons aged 15 years and over are involved which includes: home duties, looking after children, full-time student, retired, unemployed, paid job—business farm or profession, unpaid work in a family business, other e.g., hospital patient.
- Main urban areas.
The criteria for defining a main urban area is a population of 30000 or more. There are 17 main urban areas. The two major urban centres, Auckland and Wellington, are each classified as a main urban area subdivided into four zones. These zones were previously classified as separate main urban areas.
- Mean population.
The average number of people in an area during a given period, usually a year. This measure may be estimated in terms of simple or weighted averages of population, monthly or quarterly during the reference period.
- Merchandise exports.
Goods of domestic origin, and re-exports, sent from New Zealand to other countries.
- Merchandise imports.
Goods landed in New Zealand, having been consigned from other countries, for immediate consumption or for storage in bonded warehouses.
- Merchandise trade.
All goods which add to or subtract from the stock of material resources in a country, as a result of their movement in or out of it.
- Minor urban areas.
Towns with a population of 1000 or more, not already classified as a main or secondary urban area.
- Net profit.
The difference between total income and total expenditure, less working proprietors/partners salaries and wages and before extraordinary items, gains/losses from sales of capital assets, exchange losses and revaluation of assets and tax.
- Operating surplus.
Net profit/loss, as defined above, but net of interest, etc., paid/received.
- Other operating expenditure.
All other operating expenses excluding salaries and drawings by working proprietors/partners and expenses of a capital nature.
- Other income.
Gross income from renting and leasing of land and buildings, direct government cash grants and subsidies, plus all other income (excluding proceeds from the sales of capital assets, exchange gains, revaluation of assets, and other extraordinary items).
- Paid employees.
See persons engaged.
- Persons engaged.
The total number of persons engaged, full-time and part-time in activity and ancillary activity units at or on the nearest payday to 28 February during a business census year.
- Population projection.
A conditional forecast of the future size and/or composition of a specified population. It calculates the effect on the current (base) population during successive periods if certain stated assumptions apply.
- Provisional (statistics).
Statistics which are derived using preliminary or incomplete data and released before final data become available.
- Purchases and other operating expenses.
Total purchases and operating expenses, less interest, bad debts, donations, royalties and patent fees. Also excludes salaries and wages paid, and depreciation. In the Quarterly Economic Survey of Manufacturing this term excludes exchange losses and extraordinary terms, e.g., losses on sales of fixed assets, sales tax, beer and excise duty and fringe benefit tax.
- Re-exports.
Goods, materials or articles exported in the same condition as they were imported, and imported goods which have undergone operations such as repair, repacking, or bottling which leave them essentially unchanged before exporting.
- Rent and leasing.
Total expenditure on or income from the rent and leasing of land and buildings and of plant, equipment and vehicles.
- Rural areas.
Those areas not specifically designated as ‘urban’. They include towns of less than 1000 population plus administrative county or district territory where this is not included in an urban area. Rural areas include extra-county islands.
- Salaries and wages.
Gross earnings during the accounting year of all paid employees (full-time, part-time and casual) in the enterprise included in the census. Included are such items as overtime, sick and holiday pay, bonuses, payments under penal-rate schemes, severance pay, value of free supplies and sales commission paid to own employees, and excludes drawings of working proprietors or partners.
- Sales of goods and services sold.
Goods and materials manufactured from purchased materials; includes repairs and other services provided and sales of goods purchased for resale.
- Sample survey.
A type of survey in which only a representative proportion of the given population provides detailed information. The sample statistics are summarised and are used to estimate statistics for the full population.
- Seasonal adjustments.
Adjustments made to statistical time series (usually monthly or quarterly) to provide a refined series for trend analysis in which the fluctuations due to seasonal variations have been removed.
- Secondary urban areas.
Introduced at the 1981 census and referring to areas with populations which range between 10000 and 29999. Fourteen secondary urban areas (including Masterton, formerly a main urban area) were created and still exist.
- Sector of employment.
Refers to the industrial sector in which an employing organisation is engaged. This was introduced at the 1981 census and now includes: producer enterprises; financial intermediaries; general government; private non-profit organisations serving households; households and rest of world.
- Standard International Trade Classification (S.I.T.C.).
A classification published by the United Nations defining export and import commodities.
- Statistical areas.
Broad geographic regions not conforming to any legal or administrative boundaries with no pre-determined population size. There are 13 statistical areas.
- Statistical divisions.
Statistically defined areas introduced at the 1971 census to cover the seven main population centres of the country. The basic requirement is a minimum population of 75000 within a relatively compact area, including rural residents.
- Stocks.
This includes materials, such as components, stores, fuels, containers, and other packaging materials as well as finished goods and work in progress, such as goods purchased for resale without further processing.
- Subsidies.
Direct government cash grants and subsidies, other than for capital purposes.
- Total expenditure.
Purchases and operating expenses, excluding losses in extraordinary items, less working proprietors/partners salaries and wages.
- Total income.
Sales and other income, excluding gains in extraordinary items, adjusted for difference between opening and closing stocks.
- Turnover.
Total sales and other income, less: interest; dividends; donations; grants; royalties; insurance claims received. Capital work done by employees is included.
- Urban areas.
Comprises a three-part classification consisting of main, secondary and minor urban areas which constitute the ‘urban’ population of New Zealand. Main and secondary urban areas are centred on a major city or borough and include neighbouring boroughs, town districts and parts of counties which are regarded as suburban and belonging to that centre of population.
- V.f.d. (value for duty).
This is the assessed value of merchandise imports on which duty is based. It is roughly equivalent to the current domestic value of goods in the exporting country.
- Value added.
The amount added to goods and services by the contributions of capital and labour (i.e., the costs of bought-in materials and services has been deducted from the total value of output). For business censuses up to 1981–82, value added is equal to the sum of salaries and wages, depreciation and profit, before interest is brought to account. It can also be calculated by deducting from the value of output, the cost of bought-in material and bought-in non-labour services.
- Vital statistics.
Statistics of events such as births, deaths, and marriages which influence the numbers of a population.
- Work status.
Refers to the full-time labour force (persons working 30 hours or more per week plus unemployed and seeking full-time work); the part-time labour force (persons working 1 to 29 hours per week plus unemployed and seeking part-time work) and persons not working.
Table of Contents
The following list of books has been compiled to give New Zealand and overseas readers an introduction to the country's literature and sources of information. It complements the ‘Further information’ section at the end of each chapter and covers books published in New Zealand as well as books published overseas about New Zealand. Entries are arranged alphabetically under appropriate subject headings, which are in approximate order of the Dewey Classification. The following abbreviations for places of publication have been used: Ak (Auckland), Wn (Wellington), Ch (Christchurch), and Dn (Dunedin). Works of less than 75 pages are indicated by an asterisk.
The New Zealand National Bibliography is published monthly and cumulated annually in microfiche. It lists books, pamphlets, music, maps, periodicals, and selected non-book materials. It is prepared in the New Zealand Bibliographic Unit, and available from the National Library of New Zealand, Private Bag, Wellington.
Air New Zealand Almanac, compiled and edited by Max Lambert and Ron Palenski, Eileen Lambert and Kathy Palenski. Ak, Moa Almanac Press, 1987.
Bagnall, A. G. New Zealand national bibliography to the year 1960. Wn, Govt Print., 1970–80. Vol. 1, to 1889. Vol. 2–4, 1890–1960. Vol. 5, 1985.
Bateman New Zealand Encyclopaedia, editor-in-chief, G. McLauchlan. Ak, David Bateman, 2nd ed, 1987.
Bloomfield, G. T. New Zealand, a handbook of historical statistics. Boston, G. K. Hall, 1984.
Directory of Official Information. Wn, State Services Commission, 1987.
Dunmore Book of New Zealand Records, edited by P. Dunmore, Palmerston North, Dunmore Press, 1978.
Ellis, N. comp. New Zealand associations, societies and clubs; a national directory. 2nd ed. Wn, Victoria University Press with Price Milburn, 1979.
Encyclopaedia of New Zealand, edited by A. H. McLintock. 3 vol. Wn, Govt Print., 1966. (Out of print.)
Fraser, B. Ed. The New Zealand book of events. Ak: Reed Methuen, 1986.
Gilderdale, B. A sea change: 145 years of New Zealand junior fiction. Ak, Longman Paul, 1982.
Guide to New Zealand Information Sources, Palmerston North, Massey University, 1975. Bibliographies have been published on plants and animals, farming, field and horticultural crops, education, livestock farming, fisheries, forestry, religion, and official publications.
Harvey, D. R. Union list of newspapers preserved in libraries, newspaper offices, local authority offices and museums in New Zealand. 1987.
Heinemann New Zealand Atlas, general editor, D. W. McKenzie. Heinemann with Department of Survey and Land Information, 1987.
Heinemann New Zealand Dictionary, edited by H. W. Orsman. Ak, Heinemann Educational, 1979.
*Millett, A. P. U. and F. T. H. Cole. Bibliographical work in New Zealand 1987; work in progress and work published. Hamilton, University of Waikato Library, 1987.
National Register of Archives and Manuscripts in New Zealand., Vol. 1, Pt 1. Compiled by National Archives of New Zealand. Wn, National Library of New Zealand, 1979.
New Zealand Books in Print. Melbourne, Thorpe, 1987.
New Zealand Library Association, Bibliography of New Zealand bibliographies. Wn, 1967.
Robertson, E and P. H. Hughes, New Zealand Royal Commissions, Commissions and Committees of Inquiry, 1864–1981: a checklist. Wn, New Zealand Library Association, 1982.
Smith, L. Race Relations in New Zealand: a bibliography, 1970–86. Ak, Office of the Race Relations Conciliator, 1987.
Taylor, C. R. H. A bibliography of publications on the New Zealand Maori. Oxford, Clarendon Press, 1972.
Taylor, C. R. H. A Pacific bibliography. 2nd ed. Oxford, Clarendon Press, 1965. (Out of print.)
Union List of Theses of the University of New Zealand, 1910–1954. Wn, New Zealand Library Association, 1956. (Out of print.) Supplement, 1955–1962. Supplement, 1963–1967. Supplement, 1968–1971. Supplement, 1971–1975. Supplement, 1976–1978. Supplement, 1979–82.
Wilson, J. O. New Zealand parliamentary record, 1840–1984. Wn, Govt Print., 1985.
Wilson, N. and A. Bollard. A bibliography of New Zealand industrial economics research. Wn, Department of Trade and Industry, 1984.
*Wood, G. A. A guide for students of New Zealand history. Dn, McIndoe, 1973.
Ageing New Zealanders, edited by R. A. Barker, F. M. Caughey, M. W. Guthrie. Wn, Dept of Health, 1982.
Bedggood, D. Rich and poor in New Zealand. Sydney, Allen and Unwin, 1980.
Beyond New Zealand. The foreign policy of a small state, edited by John Henderson, Keith Jackson, and Richard Kennaway. Ak, Methuen, 1980.
Blackburn, A. Race against time. Wn, Human Rights Commission, 1982.
Bush, G. W. A. Local government and politics in New Zealand. Sydney, Allen and Unwin, 1980.
Daniels, K. R. An annotated bibliography of social work education and training in New Zealand. University of Canterbury, 1982.
Davis, P. Health and health care in New Zealand. Ak, Longman Paul, 1981.
Easton, B. Social policy and the welfare state in New Zealand. Ak, Allen and Unwin, 1980.
Families in New Zealand Society, edited by P. G. Koopman-Boyden. Wn, Methuen New Zealand, 1978.
Geare, A. J. The system of industrial relations in New Zealand. Wn, Butterworths, 1983.
Gray, A. The Jones men; 100 New Zealand men talk about their lives. Wn, Reed, 1983.
Grimshaw, P. Women's suffrage in New Zealand. Ak, Auckland U.P.: Wn, O.U.P., 1972.
Gustafson, B. S. Labour's path to political independence. Ak, Auckland University Press, 1980.
Hanson, E. A. The politics of social security. Ak, Auckland University Press, 1980.
Hill, M. et al. Shades of deviance: a New Zealand collection, Palmerston North, Dunmore Press.
Holt, J. Compulsory arbitration in New Zealand: the first forty years. Ak, Auckland U.P., 1986.
Issues in Equity by Judith Davey and Peggy Koopman-Boyden. Wn, New Zealand Planning Council, 1983.
Levine, S. Maori political perspectives. Ak, Hutchinson, New Zealand, 1985.
McGee, D. G. Parliamentary practice in New Zealand. Wn, Govt Print., 1985.
McGibbon, I. C. Blue-water rationale: the naval defence of New Zealand, 1914–1942. Wn, Govt Print., 1981.
McGill, D. The other New Zealanders. Wn, Mallinson Rendel, 1982.
McGill, J. F. Immigration and the New Zealand economy. Wn, New Zealand Institute of Economic Research, 1981.
Mascarenhas, R. C (ed.) Public and Private enterprise in New Zealand. Wn, New Zealand Institute of Public Administration, 1983.
Meade, A. New Zealand early childhood care and education bibliography, 1979–82. Wn, New Zealand Council for Educational Research, 1984.
Mol, Hans. The fixed and the fickle: religion and identity in New Zealand. Dn, Pilgrims Southern Press, 1982.
Mulgan, R. G. Democracy and power in New Zealand: a study of New Zealand politics. Ak, O.U.P., 1984.
New Zealand Population: Patterns of Change. (Population Monitoring Group. Report No. 1). Wn, New Zealand Planning Council, 1984.
New Zealand, Sociological Perspectives edited by Paul Spoonley, David Pearson, Ian Shirley. Palmerston North, Dunmore Press, 1982.
Palmer, G. Unbridled power: an interpretation of New Zealand's constitution and government. Wn, O.U.P., 1979.
Pearson, D. G. Johnsonville: continuity and change in a New Zealand township. Sydney, Allen and Unwin, 1980.
Pearson, D. G. and D. C. Thorns. Eclipse of equality. Sydney, Allen and Unwin, 1983.
The Path to Reform, edited by C. Burns. Wn, New Zealand Institute of Public Administration, 1982.
People Like Us, Celebrating Cultural Diversity, edited by Anthony Haas, Allison Webber, Pam Brown. Wn, Asia Pacific Books, 1982.
Phillips, R. Divorce in New Zealand: A social history. Ak, O.U.P., 1981.
The Population of New Zealand, edited by R. J. W. Neville and C. J. O'Neill. Ak, Longman Paul, 1979.
Religion in New Zealand Society, edited by Brian Colless and Peter Donovan. Palmerston North. Dunmore Press, 1980.
Roth, B. and J. Hammond. Toil and trouble; the struggle for a better life in New Zealand. Ak, Methuen, New Zealand, 1981.
Roth, B. Trade unions in New Zealand. Wn, Reed, 1974.
Saphira, M. For your child's sake: understanding sexual abuse. Reed Methuen, 1987.
Scott, C. D. Local and regional government in New Zealand: function and finance. Sydney, Allen and Unwin, 1979.
Simpson, T. A vision betrayed: the decline of democracy in New Zealand. Hodder and Stoughton, 1984.
Social Welfare and New Zealand Society, edited by A. D. Trlin. Wn, Methuen, 1977.
State Servants and the Public in the 1980s, edited by R. M. Alley, Wn, New Zealand Institute of Public Administration, 1980.
Voluntary Unionism; Proceedings of a Seminar, 5 October 1983, edited by P. Brosnan. Wn, Industrial Relations Centre, Victoria University of Wellington, 1983.
Who Makes Social Policy? New Zealand Planning Council. Wn, 1982.
Women in New Zealand Society, edited by P. Bunkle and B. Hughes. Sydney, Allen and Unwin, 1980.
Boston, J. Incomes policy in New Zealand. Wn, Victoria University Press for the Institute of Policy Studies, 1984.
Burrowes, A. W. and R. D. Mulholland. Investing on the New Zealand sharemarket. Rev. ed. Ak, Macmillan, 1983.
Campbell, R. and A. Kirk. After the freeze: New Zealand unions in the economy. Eastbourne, Port Nicholson Press, 1983.
Easton, B. H. Economics for New Zealand social democrats. Dn, John McIndoe Ltd, 1981.
Easton, B. H. Income distribution in New Zealand. Wn, NZIER, 1983.
Easton, B. H. and N. J. Thomson. An introduction to the New Zealand economy. St Lucia, Qld, University of Queensland Press, 1982.
Economic Summit Conference. A briefing on the New Zealand economy. Wn, Govt Print., 1984.
External Economic Structure and Policy, An Analysis of New Zealand's Balance of Payments, edited by R. S. Deane, P. W. E. Nicholl, and M. J. Walsh. Wn, Reserve Bank of New Zealand, 1981.
Gould, J. The rake's progress? The New Zealand economy since 1945. Ak, Hodder and Stoughton, 1983.
Hawke, G. R. Between government and banks. Wn, Govt Print., 1973.
Hawke, G. R. The Making of New Zealand: an economic history. Cambridge, Cambridge University Press, 1985.
Haywood, E., D. Rose and A. Stroombergen. Towards 1990: patterns of national and sectoral development. Wn, NZ Planning Council, 1983.
Horsfield, A. K. and D. J. O'Dea. Equity investment in New Zealand. Wn, Govt Print., 1983.
Inflation and Economic Adjustment, edited by R. A. Buckle. Wn, Dept of Economics, Victoria University of Wellington, 1983.
Lodge, J. The European Community and New Zealand. London, F. Pinter, 1982.
Monetary Policy and the New Zealand Financial System, edited by R. S. Deane, P. W. Nicholl and R. G. Smith. 2nd ed. Wn, Reserve Bank of New Zealand, 1983.
National Incomes Policy, Proceedings of a Seminar, edited by Pat Walsh. Wn, Industrial Relations Centre, Victoria University of Wellington, 1982.
New Zealand Valuation Dept. Handbook for local authorities. 4th ed. Wn, 1982.
Preston, D. A. Government accounting in New Zealand. Wn, Govt Print., 1980.
Stone, R. J. C. Makers of fortune. Ak, Auckland U.P./O.U.P., 1973.
Studies of the New Zealand Labour Market, ed B. H. Easton. Wn, NZIER, 1983.
Tisdale, C. A. and J. T. Ward. Economics in our society. Milton, Qld, Jacaranda Press, 1981.
The Treasury. Economic management. Wn, Govt Print., 1984.
Ward, A. H. A command of co-operatives. Wn, N.Z. Dairy Board, 1975.
Bulletin of the Reserve Bank of New Zealand. Wn, Reserve Bank (monthly).
The Financial Statement. Wn, Govt Print. (annual).
Medium Term Review. Wn, NZ Institute of Economic Research (annual).
New Zealand: OECD Economic Survey. Paris, OECD (about 18-monthly).
New Zealand Business Abstracts (monthly).
Quarterly Predictions. Wn, NZ Institute of Economic Research (quarterly).
Quarterly Survey of Business Opinion. Wn, NZ Institute of Economic Research (quarterly).
Report of the Economic Monitoring Group. Wn, New Zealand Planning Council (annual).
Afford, J., S. Kos, and B. Napier. The law and you; a practical guide for New Zealanders. Wn, Reed, 1981.
Blair, A. P. Accident compensation in New Zealand: the law relating to compensation for personal injury by accident in New Zealand. 2nd ed. Wn, Butterworths, 1983.
Brooks, B. T. The practice of industrial relations in New Zealand. Ak, Commerce Clearing House (New Zealand), 1978.
Butterworths Family Law Guide. Wn, Butterworths, 1983.
Campbell, L. G. The framework of industrial law in New Zealand. 2nd ed. Wn, Victoria University of Wellington, Industrial Relations Centre, 1982.
Doyle, M. W. Criminal procedure in New Zealand. Wn, Sweet and Maxwell, 1978.
Duncan, P. C. The layman and the law in New Zealand. Ak, J. M. McGregor, 1981.
Family Guide to New Zealand Law. Surrey Hills, NSW, Reader's Digest, 1980.
A Guide to Environmental Law in New Zealand, edited by N. E. Wells, 2nd ed. Brooker and Friend, 1984.
Hinde, G. W. and M. S. Hinde. New Zealand law dictionary. 3rd ed. Wn, Butterworths, 1979.
McBride, T. J. New Zealand civil rights handbook. Wn, Price Milburn, Butterworths, 1980.
Mulholland, R. D. Business law today. 2nd ed. Palmerston North, Dunmore Press, 1985.
Mulholland, R. D. Consumer law in New Zealand. Palmerston North, Dunmore Press, 1982.
Mulholland, R. D. Introduction to the New Zealand legal system, 6th ed. Wn, Butterworths, 1985.
Northey, J. F. Index to New Zealand legal writing. Ak, Legal Research Foundation, 1982. Annual supplements also published.
O'Keefe, J. A. B. The principles and practice of rating and rating valuations in New Zealand. Auckland University, 1982.
Reprinted Statutes of New Zealand. Wn, Govt Print., 1979.
The Statutes of New Zealand. Wn, Govt Print., (annual).
Tapp, P. and M. Wilson. Women and the law in New Zealand. Ak, Methuen, 1982.
Williams, D. A. R. Environmental law in New Zealand. Wn, Butterworths, 1980.
Barrington, J. M. and T. H. Beaglehole. Maori schools in a changing society: an historical review. Wn, New Zealand Council for Educational Research, 1974.
Boshier, R. Adult and continuing education in New Zealand, 1851–1978: a bibliography. Vancouver, Adult Education Research Centre, Faculty of Education, University of British Columbia; Toronto, International Council for Adult Education, 1979.
Campbell, W. J. Realities of teacher development. Wn, Dept of Education, 1977.
Cumming, I. and A. Cumming. History of state education in New Zealand, 1840–1975. Wn, Pitman, 1978.
Educational System of New Zealand, Washington. D.C., US Government Printing Office, 1981.
Education and the Equality of the Sexes: conference on women and education sponsored by the Committee on Women and the Department of Education, 23–27 November 1975, Victoria University of Wellington. Wn, Dept of Education, 1976.
Fitzgerald, T. K. Education and identity; a study of the New Zealand Maori graduate. Wn, New Zealand Council for Educational Research, 1977.
Forward to Basics, edited by J. Shallcrass. Wn, New Zealand Education Institute, 1978.
Gadd, D. B. H. Cultural difference in the classroom: the special needs of Maoris in pakeha schools. Ak, Heinemann Educational, 1976.
Guidance in New Zealand Secondary Schools, compiled and edited by G. Hermansson. Ak, New Zealand Counselling and Guidance Association, 1981.
McDonald, G. Maori mothers and pre-school education. Wn, New Zealand Council for Educational Research, 1973.
Meade, A. comp. New Zealand early childhood care and education: bibliography, 1979–82; with annotations. Wn, New Zealand Council for Educational Research, 1984.
New Zealand Committee on Health and Social Education. Growing, sharing, learning; the report of the committee on health and social education. 2nd ed. Wn, Dept of Education, 1978.
New Zealand Early Childhood Care and Development Convention: 2nd, University of Canterbury, 1979. Early childhood in New Zealand: their needs, our concern. Ch, Christchurch Teachers College, 1979.
*New Zealand Educational Development Council. Review of educational developments, 1974–1978: progress on recommendations of the educational development conference. Wn, Educational Development Council, 1978.
New Zealand National Advisory Committee on Maori Education. He Huarahi. Wn, Dept of Education, 1980.
New Zealand Research Committee on Open Plan Schools. Report on open plan education in New Zealand primary schools, Wn, Dept of Education, 1977.
Parton, H. The University of New Zealand. Ak, Auckland U.P. Wn, O.U.P., 1979.
Policies of Education in New Zealand, edited by M. Clark. Wn, New Zealand Council for Educational Research, 1981.
Ramsay, P. D. K. and others. The family and the school in New Zealand society: an introduction to the sociology of New Zealand education. Carlton, Vic., Pitman, 1975.
Roth, H. O. A bibliography of New Zealand education. Wn, New Zealand Council for Educational Research, 1964.
Shuker, R. Educating the workers: a history of the Workers’ Education Association. Palmerston North, Dunmore, 1984.
Sutton-Smith, B. A history of children's play: New Zealand, 1840–1950. Wn, New Zealand Council for Educational Research, 1982.
Williams, B. M. Structures and attitudes in New Zealand adult education, 1945–75. Wn, New Zealand Council for Educational Research, 1978.
Abigail, Jill. Secondary school influences on the training and career aspirations of girls: a study in 17 Wellington schools. Wn, Vocational Training Council, 1983.
Barrington, Rosemary and Alison Gray. The Smith women: 100 New Zealand women talk about their lives. Wn, Reed, 1981.
Celebrating Women: New Zealand women and their stories. Produced by Mediawomen of New Zealand. Whatamongo Bay, Cape Catley, 1984.
Clark, M., editor. Beyond expectations. Wn, Allen and Unwin/Port Nicholson, 1986.
Conference on Women and Recreation (1981: Wellington, New Zealand). Papers and reports from the Conference on Women and Recreation, 31 August-3 September, 1981. Wn, New Zealand Council for Recreation and Sport, 1981.
Dann, Christine. Up from under: women and liberation in New Zealand 1970–1985. Wn, Allen and Unwin, 1985.
Ebbett, E. When the boys were away: New Zealand women in World War II. Wn, Reed, 1984.
Fry, R. Out of the silence: methodist women of Aotearoa. Ch. Methuen, 1987.
Hughes, Beryl and Bunkle, Phillida (eds) Women in New Zealand society. Ak, Allen and Unwin, 1980.
Mein Smith, P. Maternity in dispute: New Zealand, 1920–1939. Wn, Department of Internal Affairs/Govt Print., 1986.
Murchie, Elizabeth. Rapuora: health and Maori women. Wn, Maori Women's Welfare League, 1984.
Myers, V. Head and shoulders. Ak, Penguin Books, 1986.
National Women's Health Conference, 1982: a report on the Women's Health Network National Conference held on the 17th, 18th, 19th September, 1982. Tauranga, NZ Women's Health Network, 1983.
New Women's Fiction. Edited by Cathie Dunsford. Ak, New Women's Press, 1986.
Phillips, Jenny. Mothers matter too: a book for New Zealand women at home. Wn, Reed, 1983.
Profile of Women. Department of Statistics, 1985.
Public and Private Worlds: women in contemporary New Zealand. Edited by Shelagh Cox. Wn, Allen and Unwin/Port Nicholson, 1987.
Rape in New Zealand: papers presented at the Rape Symposium, Wellington 11–12 September 1983. Edited by Hilary Haines and Max Abbott. Ak, Mental Health Foundation of New Zealand, 1983.
Sargison, Patricia. Victoria's furthest daughters: a bibliography of published sources for the study of women in New Zealand, 1830–1914. Wn, Alexander Turnbull Library, 1984.
Taylor, N. M. The New Zealand people at war: the home front. Wn, Department of Internal Affairs in conjunction with Govt Print., 1986.
The Role of Women in New Zealand Society. NZ Parliament. Select Committee on Women's Rights. Wn, Govt Print., 1975.
Women in Wartime: New Zealand women tell their story. Edited by Lauris Edmond with Carolyn Milward. Wn, Govt Print., 1986.
Women's Studies Conference Papers: papers of Women's Studies Association Conference 1978–1984. Various editors. Women's Studies Association (NZ).
Women's Work: contemporary short stories by New Zealand women. Chosen by Marion McLeod and Lydia Wevers. Ak, Oxford University Press, 1985.
Te Ao Hurihuri; The world moves on: aspects of Maoritanga, edited by M. King. Wn, Hicks Smith, 1975. Reprinted 1977.
Best, E. Games and pastimes of the Maori. Wn, Board of Maori Ethnological Research for the Dominion Museum, 1924. Reprinted Wn, Govt Print., 1976.
Best, E. The Maori as he was. Wn, Dominion Museum, 1924. Reprinted Wn, Govt Print.,1974.
Best, E. Maori agriculture. Wn, Board of Maori Ethnological Research for the Dominion Museum, 1925. Reprinted Wn, Govt Print., 1976.
Biggs, B. The complete English-Maori dictionary. Ak, Auckland University Press, Wn, O.U.P., 1981.
Biggs, B. Let's learn Maori; a guide to the study of the Maori language. Wn, Reed, 1975.
Binney, J. and G. Chaplin. Nga morehu—the survivors. Ak, Oxford University Press, 1986.
Brailsford, B. The tattooed land—the southern frontiers of the pa Macri. Wn, Reed, 1981.
Buck, Sir P. The coming of the Maori. 2nd ed. Wn, Whitcombe and Tombs, 1974.
Dansey, H. Maori custom today. Auckland, Shortland Publications, reprinted 1978.
Davidson, J. The prehistory of New Zealand. Ak, Longman Paul, 1984.
Duff, R. S. The moa-hunter period of Maori culture. 3rd ed. Wn, Govt Print., 1977.
Firth, R. W. Economics of the New Zealand Maori. 2nd ed. Wn, Govt Print., 1972.
Hanson, F. and L. Counterpoint in Maori. London, Routledge and Kegan Paul, 1983.
Hart, R. and A. W. Reed. Maori myth and legend. Wn, Reed, 1983.
He Matapuna—Some Maori Perspectives, N.Z. Planning Council, Wn, 1979.
Into the World of Light: An Anthology of Maori Writing, edited by Witi Ihimaera and D. S. Lang. Ak, Heinemann, 1982.
King, M. Being pakeha: an encounter with New Zealand and the Maori renaissance. Ak, Hodder and Stoughton, 1985.
King, M. Maori: a photographic and social history. Ak, Heinemann, 1983.
Lewis, D. The Maori: heirs of Tane. London, Orbis, 1982.
Maori is My Name: historical Maori writings in translation, edited by John Caselberg. Dn, McIndoe, 1975.
The Maori People in the Nineteen Sixties: a symposium edited by E. G. Schwimmer. Ak, Longman Paul, 1972.
Mead, S. M. Te Toi Whakario: the art of Maori carving. (New ed.) Ak, Reed Methuen, 1986.
Metge, J. The Maoris of New Zealand: rautahi. London, Routledge, 1976.
Ngata, A; Sir. Na to hoa aroha—from your dear friend: the correspondence between Sir Apirana Ngata and Sir Peter Buck, 1925-1950. Edited by M. P. K. Sorrenson. Ak, Auckland University Press, 1986.
The Old-Time Maori. Makeriti (Maggie Papakura). Edited by T. K. Penniman. London: Gollancz, 1938. Ak, New Women's Press, 1986.
Orbell, M. Hawaiki: a new approach to Maori tradition. Ch, University of Canterbury, 1985.
Pool, D. I. The Maori population of New Zealand, 1769-1971. Ak, Auckland University Press, 1977.
Reed, A. W. Treasury of Maori exploration: legends relating to the first Polynesian explorers of New Zealand. Wn, Reed, 1977.
Ryan, P. M. A dictionary of modern Maori. Ak, Heinemann Educational, 1974.
Salmond, A. Hui: a study of Maori ceremonial gatherings. Wn, Reed, 1975.
Schwimmer, E. G. The world of the Maori. Wn, Reed, 1974.
Selected Readings in Maori, edited by B. Biggs. P. Hohepa, and S. M. Mead. Wn, Reed, 1967.
Simmons, D. R. Whakairo: Maori tribal art. Ak, O.U.P., 1985.
Simmons, D. R. The great New Zealand myth: a study of the discovery and origin traditions of the Maori. Wn, Reed, 1976.
Sorrenson, M. P. K. Maori origins and migrations: the genesis of some pakeha myths and legends. Ak, Auckland University Press, 1979.
Stirling, F. Eruera: the teachings of a Maori elder. Wn. O.U.P., 1980.
Tauroa, H. Te marae: a guide to customs and protocol. Ak, Reed Methuen, 1986.
Taylor, C. R. H. A bibliography of publications on the New Zealand Maori and the Moriori of the Chatham Islands. London, Oxford, 1972.
Tuhe Mauri Ora: Aspects of Maoritanga, edited by M. King. Wn, Methuen 1978.
Walker, R. J. Nga tau tohetohe—years of anger. Ak, Penguin, 1987.
Williams, H. W. A bibliography of printed Maori to 1900, and Supplement. Wn, Govt Print., 1975.
Williams, W. a dictionary of the Maori language. H. W. Williams, rev. and augmented by the Advisory Committee on the Teaching of the Maori language, Department of Education. 7th ed. Wn, Govt Print., 1975.
Wilson, J., editor. The archaeology of the Maori. Ak, Penguin, NZHPT, 1987.
Biogeography Ecology in New Zealand, edited by G. Kuschel. The Hague, Dr W. Juur, 1975.
Directory of New Zealand Science. 5th ed. Wn, New Zealand Association of Scientists, 1975.
Ellis, N. E. The New Zealand environment: a bibliography of material available through New Zealand public libraries, including a select list of overseas publications, 1968-1974. Wn, Nature Conservation Council, 1975. Supplements also published.
Environmental Policies in New Zealand. Paris, OECD, 1981.
Landsat II Over New Zealand: monitoring our resources from space, edited by P. J. Ellis, I. L. Thomas and M. J. McDonnell. Wn, DSIR, 1978.
New Zealand's Nature Heritage. Ak, Hamlyn, 1976.
Adkin, G. L. and B. W. Collins. A bibliography of New Zealand geology to 1950. Wn, DSIR, 1967. (Out of print.) Index, compiled by D. L. Jenkins. Wn, DSIR, 1976.
Bibliography of New Zealand Geology, 1951-1969, compiled by Guyon Warren and others. Wn, DSIR, 1977. Updates Adkin (above).
Eiby, G. A. Earthquakes. London, Heinemann, 1980.
Fleming, Sir C. A. The geological history of New Zealand and its life. Ak, Auckland University Press, 1979.
Gage, M. Legends in the rocks: an outline of New Zealand geology. Ch, Whitcoulls, 1980.
Geochemistry, 1977: a collection of papers by New Zealand geochemists in honour of S. H. Wilson, compiled by A. J. Ellis. Wn, DSIR, 1977.
Geology of New Zealand, chief editor, R. P. Suggate, associate editors, G. R. Stevens, M. T. Te Punga. 2 vols. Wn, Govt Print., 1980.
Houghton, B. F. Geyserland: a guide to the volcanoes and geothermal areas of Rotorua. Lower Hutt, Geological Society of New Zealand, 1982.
Landforms of New Zealand, edited by J. M. Soons and M. J. Selby. Ak, Longman Paul, 1982.
New Zealand Cave Atlas, compiled by P. C. Crossley, B. P. Hurst and R. G. West. Ak, University of Auckland, Dept of Geography, 1981.
Salmon, J. H. M. A history of goldmining in New Zealand. Wn, Govt Print., 1963.
Stevens, G. R. Rugged landscape: the geology of central New Zealand. Wn, Reed, 1974.
Stevens, G. R. New Zealand adrift. Wn, Reed, 1980.
Taylor, E. and J. Cole. Volcanic New Zealand. Ak, O.U.P., 1983.
Andrews, J. R. H. The Southern Ark: Zoological discovery in New Zealand 1769-1900. London, Century, 1987.
Ayling, A. M. Collins guide to the sea fishes of New Zealand. Ak, Collins, 1982.
Buller, Sir W. L. Birds of New Zealand. Facsimile Diamond Jubilee ed. Wn, Royal Forest and Bird Protection Society of New Zealand, 1983.
Bull, P. C. The atlas of bird distribution in New Zealand. Wn, Ornithological Society of New Zealand, 1985.
Chapman, M. A. and M. H. Lewis. An introduction to the freshwater crustacea of New Zealand. Ak, Collins, 1976.
Cusa, N. W. and R. M. Lockley. New Zealand endangered species. Ak, Cassell, 1980.
Doak, W. T. Fishes of the New Zealand region. Rev. ed. Ak, Hodder and Stoughton, 1978.
Falla, R. A., R. B. Sibson, and E. G. Turbott. A new guide to birds of New Zealand and outlying islands. Rev. ed. London, 1979.
Forster, R. R., and L. M. Forster. Small land animals of New Zealand. Dn, McIndoe, 1970.
Forster, R. R. New Zealand spiders. Ak, Collins, 1973.
Gibbs, G. W. New Zealand butterflies. Ak, Collins, 1980.
Gunson, D. Collins guide to the New Zealand seashore. Ak, Collins, 1983.
King, C. M. Immigrant killers: introduced predators and the conservation of birds in New Zealand. Ak, O.U.P., 1984.
McDowall, R. M. New Zealand freshwater fishes: a guide and natural history. Ak, Heinemann Educational, 1978.
Marshall, J., F. C. Kinsky and C. J. R. Robertson. The Fiat book of common birds in New Zealand. 3 vols. Wn, Reed, 1972-75.
Miller, D. Common insects in New Zealand. Wn, Reed, 1971.
O'Brien, C. A. A book of New Zealand wildlife. Ak, Landsdowne Press, 1981.
Powell, A. W. B. New Zealand mollusca: marine, land and freshwater shells. Ak, Collins, 1979.
Powell, A. W. B. Shells of New Zealand, an illustrated handbook, 5th ed. Ch, Whitcoulls, 1976.
Ramsay, G. W. and P. Singh. Guide to New Zealand entomology. Ak, Entomological Society of New Zealand, 1982.
Sharell, R. New Zealand insects and their story. Ak, Collins, 1971.
Sharell, R. The tuatara, lizards, and frogs of New Zealand. London, Collins, 1966.
Sibson, R. B. Birds at risk: rare or endangered species of New Zealand. Wn, Reed, 1982.
Soper, M. F. Birds of New Zealand and outlying islands. Ch, Whitcoulls, 1984.
Wild Animals in New Zealand, compiled by of A. L. Poole. Wn, Reed, 1970.
Allison, K. W. and J. Child. The mosses of New Zealand. Dn, University of Otago Press, 1971.
Burstall, S. W. Great trees of New Zealand. Wn, Reed/New Zealand Forest Service, 1984.
Chinnock, R. J. and E. Heath. Common ferns and fern allies. Wn, Reed, 1981.
Connor, H. E. The poisonous plants in New Zealand. 2nd ed. Wn, Govt Print., 1977.
Cooper, D. A field guide to New Zealand native orchids. Wn, Price Milburn for Wn Orchid Soc., 1981.
Crowe, A. A field guide to the native edible plants of New Zealand. Ak, Collins, 1981.
Eagle, A. L. Trees and shrubs of New Zealand in colour: 228 botanical paintings. Ak, Collins, 1975. Also published 1978 in two volumes as Eagle's 100 trees of New Zealand, and Eagle's 100 shrubs and climbers of New Zealand.
Fisher, M. E. New Zealand ferns in your garden. Ak, Collins, 1976.
Flora of New Zealand, Wn, Govt Print., Vol. 1 by H. H. Allan, 1961, vol. 2 by L. B. Moore and E. Edgar, 1970, vol. 3 by A. J. Healey and E. Edgar, 1980.
Gardening with New Zealand ferns. Ak, Collins, 1984.
Gardening with New Zealand plants, shrubs and trees. Ak, Collins, 1985.
Galloway, D. J., Flora of New Zealand: Lichens. Wn, Govt Print., 1985.
Given, D. R. Rare and endangered plants of New Zealand. Wn, Reed, 1981.
Healy, A. J. Standard common names for weeds in New Zealand. Hastings, NZ Weed and Pest Control Soc. 2nd rev. ed., 1984.
Johns, J. H. and B. Molloy. Native orchids of New Zealand. Wn, Reed, 1983.
Laing, R. M., and E. W. Blackwell. Plants of New Zealand. 7th ed. Ch, Whitcombe and Tombs, 1964.
Mark, A. F., and N. M. Adams. New Zealand alpine plants. Wn, Reed, 1973.
Matthews, L. J. and Z. Carter. South African proteaceae in New Zealand. Manakau, Matthews Publishing, 1983.
Metcalf, L. J. Cultivation of New Zealand trees and shrubs. Ak, Reed Methuen, 1987.
Moore, L. B. and J. B. Irwin. The Oxford book of New Zealand plants. Wn, O.U.P., 1978.
Mortimer, J. Trees for the New Zealand countryside: a planter's guide. Ak, Silverfish, 1984.
Parham, B. E. V. and A. J. Healy. Common weeds in New Zealand: an illustrated guide to their identification, with a section on noxious plants. Rev. ed. Wn, Govt Print., 1981.
Poole, A. L., and N. M. Adams. Trees and shrubs of New Zealand. Wn, Govt Print., 1980.
Salmon, J. T. The native trees of New Zealand. Wn, Reed, 1980.
Taylor, G. M. Mushrooms and toadstools in New Zealand. Wn, Reed, 1981.
Tritenbach, P. Botanic gardens and parks in New Zealand. Ak, Excellence Press, 1987.
Upritchard, E. A. A guide to the identification of New Zealand common weeds in colour. Palmerston North, NZ Weed and Pest Control Soc., 1986.
Atkinson, J. D. DSIR's First fifty years. Wn, Department of Scientific and Industrial Research, 1976.
Burton, D. Two hundred years of New Zealand food and cookery. Wn, Reed, 1982.
Caughley, G. The deer wars: the story of deer in New Zealand. Ak, Heinemann, 1983.
The Farming of Deer, World Trends and Modern Techniques, edited by David Yerex. Wn, Agricultural Promotion Associates, 1982.
Fenemore, P. G. Plant pests and their control. Wn, Butterworths, 1982.
Gibbs, H. S. New Zealand soils. Wn, O.U.P., 1980.
Harrison, R. E. Handbook of bulbs and perennials for the southern hemisphere. 2nd. ed. Rev. Palmerston North, R. E. Harrison, 1971.
Harrison, R. E. Handbook of trees and shrubs. New ed. Rev. Wn, Reed, 1979.
Healy, B. A hundred million trees: the story of New Zealand Forest Products Ltd. Ak, Hodder and Stoughton, 1982.
Holden P. The wild pig in New Zealand. Ak, Hodder and Stoughton, 1982.
Langer, R. H. M. Pastures and pasture plants. Wn, Reed, 1973.
Leach, H. 1,000 years of gardening in New Zealand. Wn, Reed, 1984.
Leitch, D. B. Railways of New Zealand. Ak, L. Fullerton: Newton Abbot, Devon, David and Charles, 1972.
Levy, E. B. Grasslands of New Zealand. 3rd ed. Wn, Govt Print., 1970.
McLauchlan, G. The farming of New Zealand. Ak, Australia and New Zealand Book Company, 1981.
Mclean, I. The future for New Zealand agriculture: economic strategies for the 1980s. Wn, Fourth Estate Books, 1978.
Matthews, B. W. Gardens of New Zealand. Ak: Hamlyn, 1975.
Morton, H. The whale's wake. Dn, McIndoe, 1982.
Munro, M. N. and J. Munro. A taste of New Zealand in food and pictures. Wn, Reed, 1977.
New Zealand Farmers Veterinary Guide. 4th. ed. Wn, New Zealand Dairy Exporter, 1972.
New Zealand Insect Pests, edited by D. N. Ferro, Lincoln, Lincoln University College of Agriculture, 1976.
New Zealand Ministry of Agriculture and Fisheries. New Zealand Agriculture. Wn, Govt Print., 1974.
Noonan, R. J. By design: a brief history of the Public Works Department, Ministry of Works. Wn, Govt Print., 1975.
Pearce, G. L. The pioneer craftsmen of New Zealand. Ak, Collins, 1982.
Schofield, J. C. Materials for the New Zealand potter. Wn, Govt Print., 1977.
Sheep Production, Breeding and Reproduction, edited by G. A. Wickham and M. F. McDonald. Wn, New Zealand Institute of Agricultural Science, 1982.
Simpson, T. E. Kauri to radiata: origin and expansion of the timber industry of New Zealand. Ak, Hodder and Stoughton, 1973.
Thornton, G. G. New Zealand's industrial heritage. Wn, Reed, 1982.
Troup, G. S. Steel roads of New Zealand: an illustrated survey. Wn, Reed, 1973.
Archey, Sir G. E. Whaowhia: Maori art and its artists. Ak, Collins, 1977.
Barrow, T. T. Decorative art of the New Zealand Maori. 4th ed. Wn, Reed, 1975.
Barrow, T. T. Maori art of New Zealand. Wn, Reed; Paris, Unesco Press, 1978.
Blumhardt, D. and B. Brake. Craft New Zealand. Wn, Reed, 1981.
Brake, B., J. M. Mcneish and D. Simmons. Art of the Pacific. Wn, O.U.P., 1979.
Brown, G. H. and H. Keith. An introduction to New Zealand painting, 1839-1980. Rev. ed. Ak, Collins, 1982.
Brown, G. H. Colin McCahon, artist. Wn, Reed, 1984.
Brown, G. H. New Zealand painting 1940-1960, conformity and dissension. Wn, Queen Elizabeth II Arts Council, 1981.
Cape, P. I. New Zealand painting since 1960: a study in themes and developments. Ak, Collins, 1979.
Cape, P. I. Please touch: a survey of the three-dimensional arts. Ak, Collins, 1980.
Cape, P. I. Prints and printmakers in New Zealand. Ak, Collins, 1974.
Corrugated Iron in New Zealand, G. Chapple et al. Wn, Reed, 1983.
Docking, G. C. Two hundred years of New Zealand painting. 2nd ed. Wn, Reed, 1982.
Downes, P. E. Shadows on the stage. Theatre in New Zealand: the first seventy years. Dn, McIndoe, 1975.
Downes, P. E. and P. Harcourt. Voices in the air: radio broadcasting in New Zealand. Wn, Methuen, 1976.
Ellis, E. M. and D. G. Ellis. Early prints of New Zealand, 1642-1875. Ch, Avon Fine Prints, 1978.
Fowler, M. and R. Van de Voort. The New Zealand house. Ak, Landsdowne, 1983.
Harcourt, P. M. A dramatic appearance: New Zealand theatre, 1920-1970. Wn, Methuen, 1978.
*Hill, P. M. New Zealand architecture. Wn, Dept of Education, 1976.
Historic Buildings of New Zealand: North Island, edited by Frances Porter. Ak, Cassell New Zealand, 1979.
Historic Buildings of New Zealand: South Island, edited by F. Porter. Ak, Methuen, 1983.
Kirker, A. New Zealand women artists. Ak, Reed Methuen, 1986.
McLean, M. E. and M. Orbell. Traditional songs of the Maori. Ak, Auckland University Press; Wn, Oxford University Press, 1979.
N.Z. Art & Antiques Yearbook, 1984. Rosemary Hemmings. Wn, Newrick Associates, 1984.
*New Zealand Folk Songs: Songs of a young country, compiled by N. Colquhon. 2nd ed. Wn, Reed, 1972.
New Zealand Poster Book, 1830-1940, compiled by E. Ellis. Wn, Reed, 1977.
New Zealand Potters: their work and words, edited by D. Blumhardt. Wn, Reed, 1976.
Norman, P. T. Bibliography of New Zealand compositions, vol. 1. Ch, Nota Bene Music, 1982.
Performance: A Handbook of the Performing Arts in New Zealand. Wn, Association of Community Theatres, 1982.
Platts, U. Nineteenth century New Zealand artists. Ch, Avon Fine Prints, 1980.
Smyth, B. W. and H. Howorth. Books and pamphlets relating to culture and the arts in New Zealand: a bibliography including works published to the end of the year 1977. Ch, Dept of Extension Studies, University of Canterbury; Wn, New Zealand National Commission for UNESCO, 1979.
Te Maori: Maori art from New Zealand collections, edited by S. M. Mead. Ak, Heinemann, 1984.
Thompson, F., E. Littlewood and M. Norris. Craft hunter's guide, New Zealand 1980. Ak, 1980. (Available from Pitmans.)
Thomson, K. W. Art galleries and museums of New Zealand. Wn, Reed, 1981.
Agnew, I. J. Kiwis can fly. Ak, Marketforce, 1976.
Allan, W. J. D. Power and sail: a complete guide to yachting and boating in New Zealand. Ak, Heinemann, 1975.
Baker, M. Coast to coast. Lyttelton, Icon Publishers, 1986.
Blake, P. Lion: the Round the World Race with Lion New Zealand. Ak, Hodder and Stoughton, 1986.
Bisman, R. A salute to trotting: a history of harness racing in New Zealand. Ak, Moa Publications, 1983.
Brittenden, R. T. The finest years: twenty years of New Zealand cricket. Wn, Reed, 1977.
Byrne, J. Wing shooting in New Zealand: pheasant, quail, partridge, duck and goose. Wn, Reed, 1982.
Chester, R. H. and N. A. C. McMillan. Men in black. Rev. and updated ed. Ak, Moa Publications, 1983.
Costello, J. B. New Zealand galloping greats. Enl. ed. Ak, Moa Publications, 1977.
Elenio, P. Centrecourt: a century of New Zealand tennis, 1886-1986. Wn, New Zealand Lawn Tennis Association, 1986.
Encyclopedia of New Zealand Rugby. Compiled by R. H. Chester. Moa Pub., 1987.
Forrester, R. and N. Illingworth. Hunting in New Zealand. New rev. ed. Wn, Reed, 1979.
Garner, I. and I. Walter. New Zealand soccer: the impossible dream. Ak, Hodder and Stoughton, 1982.
Glengarry, J. The great decade of New Zealand racing, 1970-1980. Ak, Collins, 1983.
Gooding, B. KZ7: inside stories of fear and loathing. Ak, Reed Methuen, 1987.
Howitt, R. J. New Zealand rugby greats. Ak, Moa Publications, 1982.
Lousley, D. P. Guide to the ski-fields of the South Island, New Zealand. Dn, McIndoe, 1976.
Memorable Moments in New Zealand Sport, edited by Don Cameron. Ak, Moa Publications, 1979.
New Zealand Sporting Clubs Directory 1980. Ak, Tasman, 1980.
Radio New Zealand Sports Annual. Wn, Broadcasting Corporation of New Zealand. 16th ed., 1987.
Scanlan, M. The New Zealand boating handbook. Wn, Reed, 1980.
Sport New Zealand. Ak, New Zealand International Publishing Group, 1982.
Todd, S. P. DB sporting records of New Zealand, Ak, Moa Publications, 1976.
Wilson, J. The New Zealand fisherman's bible. Ak, Lansdowne Press, 1981.
Adcock, F. The incident book. Ak, O.U.P., 1986.
Antipodes New Writing. Edited by Louis Johnson. Plimmerton, Antipodes Press, 1987.
Bertram, J. Flight of the Phoenix. Wn, Victoria University Press, 1985.
Curnow, A. Look back harder. Ak, Auckland University Press, 1987.
Jones, L. Barbed wire & mirrors: essays on New Zealand prose. Dn, Univ. of Otago, 1987.
A Book of New Zealand, edited by J. C. Reid and P. Cape. Rev. and enl. ed. Ak, Collins 1979.
McCormick, E. H. New Zealand literature: a survey. London, O.U.P., 1959. (Out of print.)
Misellany: Women writers’ prose and poetry. Compiled by B. Bremner et al. Wn, NZ Women Writers’ Soc., 1987.
The Oxford Book of New Zealand Writing Since 1945, chosen by M. P. Jackson and V. O'Sullivan. Ak, Oxford University Press, 1983.
Stead, C. K. In the glass case: essays on New Zealand literature. Ak, Auckland University Press and Oxford University Press, 1981.
Thomson, J. E. P. New Zealand literature to 1977: a guide to information sources. Detroit. Gale, 1980.
Women Writers of New Zealand, 1932-1982: Jubilee History and Writings of the New Zealand Women Writers’ Society, edited by Margaret Hayward and Joy Cowley. Wn, Colonial Associates, 1982.
Anthology of Twentieth Century New Zealand Poetry, selected by V. O'Sullivan. 2nd ed. Wn, O.U.P., 1976.
Bland, P. Selected poems. Dn, McIndoe, 1987.
Edmond, L. Seasons and creatures. Ak, O.U.P., 1986.
Hunt, S. Selected poems. Ak, Penguin, 1987.
Mitcalfe, B. Maori poetry: the singing word. Wn, Price Milburn, 1974.
The New Poets: initiatives in New Zealand poetry. Edited by Murray Edmond and Mary Paul. Allen and Unwin/Port Nicholson, 1987.
Nga Moteatea, edited by A. T. Ngata. 3 vol. Wn, Polynesian Society, 1959-72. Collection of Maori songs.
O'Sullivan, V. The pilate tapes. Ak, O.U.P., 1986.
The Oxford Book of Contemporary New Zealand Poetry Chosen by Feur Adcock. Ak, Oxford University Press, 1982.
Penguin Book of New Zealand Verse, edited by T. A. M. Curnow. Harmondsworth, Penguin, 1966.
Penguin Book of New Zealand Verse, edited by Ian Wedde and Margaret Orbell. Ak, Penguin, 1985.
Smithyman, K. Are you going to the pictures? Ak, Auckland University Press, 1987.
Trossell, D. Words for the rock antipodes. Ak, Hudson and Cresset, 1986.
Tuwhare, H. Mihi: collected poems. Ak, Penguin, 1987.
Wedde, I. Driving into the storm: selected poems. Ak, O.U.P., 1987.
Burns, J. New Zealand novels and novelists, 1861-1979: an annotated bibliography. Ak. Heinemann, 1981.
Critical Essays on the New Zealand Novel, edited by Cherry Hankin. Ak, Heinemann Educational, 1976.
Critical Essays on the New Zealand Short Story, edited by Cherry Hankin. Ak, Heinemann, 1982.
Duckworth, M. Rest for the wicked. Ak, Hodder and Stoughton, 1986.
Gifkins, M. Summer is the Cote d' Azur. AK, Penguin, 1987.
Grace, P. Electric city and other stories. Ak. Penguin, 1987.
Gray, A. Stepping out. Wn, Allen and Unwin/Port Nicholson, 1987.
Ihimaera, W. The matriarch. Ak, Heinemann, 1986.
Ihimaera, W. The whale rider. Ak, Heinemann, 1987.
Kidman, F. The book of secrets. Ak, Heinemann, 1987.
Koea, S. The women who never went home and other stories. Ak, Penguin, 1987.
Mann, P. Master of Paxwax: book one of the story of Paul Paxwax the gardener. London, Gollancz, 1986.
Marshall, O. The lynx hunter and other stories. Dn, McIndoe, 1987.
New Women's Fiction. Edited by Cathie Dunsford. Ak, New Women's Press, 1986.
New Zealand Short Stories, Wn, O.U.P., 1975-84. 4 series.
Rosier-Jones, J. Voyagers. Ak, Hodder and Stoughton, 1987.
Smither, E. Brother-love, sister-love. Ak, Hodder and Stoughton, 1986.
Stevens, J. The New Zealand novel, 1860-1965. 2nd ed. Wn, Reed, 1966.
Wedde, I. Symmes hole. Ak, Penguin, 1986.
Women's Work: contemporary short stories by New Zealand women. Edited by Marion McLeod and Lydia Wevers. Ak, Oxford University Press, 1985.
Contemporary New Zealand Plays, selected by H. McNaughton. Wn, O.U.P., 1974.
Directory of New Zealand Plays and Playwrights. Rev. ed. Wn, Playmarker, 1981.
Hall, R. The Share Club. Wn, Victoria University Press, 1988.
Hoar, S. Squatter. Wn, Victoria University Press, 1988.
Mason, B. The healing arch: 5 plays on Maori themes. Wn, Victoria University Press, 1988.
McNaughton, H. D. New Zealand drama: a bibliographical guide. Ch, Library, University of Canterbury, 1974.
McNaughton, H. D. New Zealand drama. Boston, Twayne, 1981.
O'Sullivan, V. Shuriken. Wn, Victoria University Press, 1988.
Thomson, J. New Zealand drama, 1930-80. Ak, O.U.P., 1984.
Thompson, M. Selected plays. Dn, Pilgrims South Press, 1984.
AA Guide to Walkways, North Island. Rev. Ed. Sydney, Lansdowne, 1987.
AA Guide to Walkways, South Island. Rev. Ed. Sydney, Lansdowne, 1987.
About New Zealand. Wn, Ministry of Foreign Affairs, 1982.
Alexander, L. Adventure holidays in New Zealand. Wn, INL Print, 1982.
Barriball, M. New Zealand, images, impressions. Wn, Reed, 1982.
Chavasse, C. G. R. and J. H. Johns. New Zealand forest parks. Wn, Govt Print., 1983.
Cobb, L. and J. Duncan. New Zealand's national parks. Ak, Hamlyn, 1980.
Conlon, D. Presenting New Zealand. Ak, Golden Press, 1982.
A Day in the Life of New Zealand; Friday, March 18th, 1983. Ak, McGregor, 1983.
Foster, B. and V. Wright. Stockman country: a New Zealand mustering adventure. Wn, Listener, 1983.
Heinemann New Zealand Atlas. General editor, D. W. McKenzie. Ak, Heinemann and Dept of Survey and Land Information, 1987.
Joyce, R. and B. Saunders. Discover New Zealand, the glorious islands. Ak, Landsdowne, 1982.
King, M. and M. Barriball. New Zealand in colour. Wn, Reed, 1982.
Matthews, G. The edge of the land: the coastline of New Zealand. Ch, Whitcoulls, 1983.
New Zealand Atlas, edited by Ian Wards. Wn, Govt Print., 1976.
New Zealand Automobile Association. AA road atlas of New Zealand. Rev. ed. Ak, Hamlyn, 1978.
New Zealand Automobile Association. AA Book of the New Zealand Countryside. 6th ed. Ak, Lansdowne, 1984.
New Zealand in Maps, edited by A. G. Anderson. London, Hodder and Stoughton, 1977.
Peat, N. Detours, a journey through small-town New Zealand. Ch, Whitcoulls, 1982.
Pope, D. and J. Pope. The Mobil illustrated guide to New Zealand. Wn, Reed, 1982.
Pope, D. M. and J. D. Pope. Mobil New Zealand travel guide, North Island. 4th ed. Wn, Reed, 1986.
Pope, D. M. and J. D. Pope. South Island. 4th ed. Wn, Reed, 1986.
Reed, A. W. Place names of New Zealand. Wn, Reed, 1975. Supplement, 1979.
Roberts, G. and B. Turner. New Zealand high country. Wn, Millwood, 1983.
Temple, P. New Zealand explorers. Ch, Whitcoulls, 1985.
Wild New Zealand. Sydney, Reader's Digest, 1981.
Wises New Zealand Guide: a gazetteer of New Zealand. 8th ed. Ak, Wises Publications, 1987.
Adams, P. W. T. Fatal necessity: British intervention in New Zealand, 1830-1847. Ak. Auckland University Press, 1977.
Arnold, R. The farthest promised land: English villagers, New Zealand immigrants of the 1870s. Wn, Victoria University Press; Price Milburn, 1981.
Atkinson, J. New Zealand as it was . . . today. Ak, In Focus Publishing, 1984.
Bassett, J. et al. The Story of New Zealand. Ak, Reed Methuen, 1985.
Beaglehole, J. C. The discovery of New Zealand. 2nd ed. London, O.U.P., 1961. (Out of print.)
Begg, A. C. and N. C. Begg. James Cook and New Zealand. Wn, Govt Print., 1969.
Belich, J. The New Zealand Wars and the Victorian interpretation of racial conflict. Ak, Auckland University Press, 1986.
Bentley G. Portrait of an air force: the Royal New Zealand Air Force 1937-1987. Wn, Grantham House, 1987.
Brett, H. White wings. Ak, Brett Printing Co., 1924-28. Reprinted Ch, Capper Press, 1976. 2 vol. Also other facsimile titles by the same publisher.
Cook, J. The journals of Captain James Cook on his voyages of discovery. Edited by J. C. Beaglehole. Cambridge, Hakluyt Society, 1955-5 vol. to date. (Hakluyt Society. Extra series No. 34.)
Cowan, J. The New Zealand wars: a history of the Maori campaigns and the pioneering period. Wn: Govt Print., 1956. 2 vol.
Cumberland, K. B. Landmarks. Surrey Hills N.S.W., Reader's Digest, 1981.
Eldred-Grigg, S. Pleasures of the flesh: sex and drugs in colonial New Zealand, 1840-1915. Wn, Reed, 1984.
Eldred-Grigg, S. A southern gentry: New Zealanders who inherited the earth. Wn, Reed, 1980.
Ewing, R. and R. Macpherson. The history of New Zealand aviation. Ak, Heinemann, 1986.
Facsimiles of the Declaration of Independence and the Treaty of Waitangi. Wn, Govt Print., 1976.
Grant, I. F. The unauthorised version: a cartoon history of New Zealand. Ak, Cassell, 1980.
Hill, R. S. Policing the colonial frontier the theory and practice of coercive social and racial control in New Zealand, 1767-1867. Wn, Govt Print., 1986.
Ingram, C. W. N. New Zealand shipwrecks, 1795-1975. 6th ed. Wn, Reed, 1984.
Jackson, H. Churches and people in Australia and New Zealand 1860-1930. Wn, Allen and Unwin/PN, 1987.
Jackson, W. K. The New Zealand Legislative Council: a study of the establishment, failure, and abolition of an upper house. Dn, University of Otago Press, 1972.
Kay, R. and T. Eden. Portrait of a century: the history of the N.Z. Academy of Fine Arts, 1882–1982. Wn, Millwood, 1983.
King, M. New Zealanders at war. Ak, Heinemann, 1981.
Lissington, M. P. New Zealand and Japan, 1900–1941. Wn, Govt Print., 1972.
Lissington, M. P. New Zealand and the United States, 1840–1944. Wn, Govt Print., 1972.
Looking Back: a photographic history of New Zealand, compiled by K. Sinclair and W. Harrex. Wn, O.U.P., 1978.
McLeod, J. Myth and reality: the New Zealand soldier in World War II. Ak, Reed Methuen, 1986.
McLintock, A. H. Crown colony government in New Zealand. Wn, Govt Print., 1958.
McLintock, A. H. The upper house in colonial New Zealand in the period 1854–1887 . . . rev. and completed by G. A. Wood. Wn, Govt Print., 1987.
McNab, R. The old whaling days: a history of southern New Zealand from 1830 to 1840. Ak, Golden Press, 1975.
Maddock, S. These antipodes: a New Zealand album, 1814 to 1854. Ak, Collins, 1979.
Maning, F. E. Old New Zealand: a tale of the good old times and a history of the war in the north told by an old chief of the Ngapuhi tribe. Ak, Golden Press, 1973. Reprint. (First published 1863.)
Millen, J. Colonial tears and sweat: the working class in nineteenth-century New Zealand. Wn, Reed, 1984.
Morrell, W. P. The Anglican church in New Zealand: a history. Dn, McIndoe, 1973.
Morrell, W. P. The provincial system in New Zealand, 1852–76. 2nd rev. ed. Ch, Whitcombe and Tombs, 1964.
New Zealand Centennial Branch. Making New Zealand: pictorial surveys of a century. Wn, 1939–40. 2 vol. (Out of print.)
New Zealand Historic Places Trust. Leaflets on various historic sites: booklets.
New Zealand War History Branch. Documents relating to New Zealand's participation in the second world war, 1939–45. Wn, 1949–63. 3 vol. (Out of print.)
New Zealand's Heritage: The making of a nation. Ak, Hamlyn, 1977. 7 vol. in 105 pts, issued weekly.
Oliver, W. H. The story of New Zealand. 2nd ed. London, Faber, 1963.
Olssen, E. The Red Feds: revolutionary industrial unionism and the New Zealand Federation of Labour 1908–14. Ak, O.U.P., 1988.
Orange, L. The Treaty of Waitangi. Wn, Allen and Unwin/PN, 1987.
The Oxford History of New Zealand, edited by W. H. Oliver with B. R. Williams. Oxford, Clarendon Press: Wn, Oxford University Press, 1981.
Pascoe, J. D. Exploration New Zealand. Wn, Reed. 1971.
Pugsley, C. Gallipoli: the New Zealand story. Ak, Hodder and Stoughton, 1984.
Roch, S. The red and the gold: an informal account of the Waihi strike, 1912. Ak, Oxford University Press, 1982.
Simpson, A. C. The road to Erewhon. Ak, Beaux Arts, 1976.
Simpson, A. C. The sugarbag years. Wn, A. Taylor, 1974.
Sinclair, K. A. A destiny apart. Wn, Allen and Unwin, PNP, 1986.
Sinclair, K. A. History of New Zealand. Rev. ed. London, Lane, 1980.
Sinclair, K. A. The origins of the Maori wars. 2nd ed. Ak, Auckland University Press, 1974.
Sutch, W. B. Poverty and progress in New Zealand. A reassessment. 2nd rev. ed. Wn, Reed, 1969.
Sutch, W. B. The quest for security in New Zealand. 1840 to 1966. Wn, O.U.P., 1966.
Taylor, R. Te lka a Maui, or New Zealand and its inhabitants. Wn, Reed, 1974.
Thirteen Facets: Essays to celebrate the silver jubilee of Queen Elizabeth the Second, 1952–1977, edited by I. Wards. Wn, Govt Print., 1978.
Wakefield, E. J. Adventure in New Zealand. Ak, Golden Press, 1975.
Wilson, O. From Hongi Hika to Hone Heke: a quarter century of upheaval. Dn, McIndoe, 1985.
Women in History. Edited by B. Brookes, C. Macdonald and M. Tennant. Wn, Port Nicholson Press, 1986.
Wood, F. L. W. The Zealand people at war: political and external affairs. Wn, Historical Publications Branch in conjunction with Reed, 1971.
The following are representative of the many titles in this category:
Aburn, A. Pirinoa: people and pasture. Carterton, Roydhouse Publishing, 1987.
Acland, L. G. D. The early Canterbury runs. 4th. ed. Ch, Whitcoulls, 1975.
Alfredton: the school and the people. Carterton, Roydhouse Publishing, 1987.
Alington, M. H. Unquiet earth: a history of the Bolton Street cemetery. Wn, Wellington City Council, Govt Print., 1978.
Allan, R. M. Nelson a history of early settlement. Wn, Reed, 1965.
Allen, E. C. In the hills of Waimarino. Wanganui, Wanganui Newspapers, 1984.
Andersen, J. C. Place names of Banks Peninsula: a topographical history. Wn, Govt Print., 1927. Reprinted Ch, Capper Press, 1976. Also other facsimile titles by the same publisher.
Bagnall, A. G. Wairarapa. Masterton, Hedley's Bookshop, 1976.
Barber, L. H. The view from Pirongia: the history of Waipa county. Ak, Richards Publishing, 1978.
Begg, A. C. and N. C. Begg. Port preservation. Ch, Whitcombe and Tombs, 1973.
Bennett, F. Tairua. Pauanui, Pauanui Information Bureau, 1986.
Boyd, M. City of the plains: a history of Hastings. Wn, Victoria University Press, for the Hastings City Council, 1984.
Brake, T. Bush track to highway. Taumaranui, C & S Publications, 1986.
Buchanan, J. D. H. The Maori history and place names of Hawke's Bay. Wn, Reed, 1973.
Bull, B. H. The years between: Greytown Borough Centennial, Carterton, Roydhouse Publishing, 1986.
Campbell, M. D. N. Story of Napier, 1874–1974. Napier, Napier City Council, 1975.
Carkeek, W. The Kapiti Coast: Maori history and place names. Wn, Reed, 1966. Reprinted Ch, Capper Press, 1978.
Dreaver, A. J. Horowhenua County and its people: a centennial history. Horowhenua County Council, 1984.
Eldred-Grigg, S. A new history of Canterbury. Dn, McIndoe, 1982.
Field, T. A. Relics of the goldfields, Central Otago. Dn, McIndoe, 1976.
Gardner, W. J. The Amuri: a county history. 2nd ed. Amuri County Council, 1983.
Gibbons, P. J. Astride the river: a history of Hamilton. Ch, Whitcoulls for the Hamilton City Council, 1977.
Goodall, M., and G. J. Griffiths. Maori Dunedin. Dn, Otago Heritage Books, 1980.
Greenwood, W. Te Waimatemate: history of Waimate County and Borough. Waimate County and Borough Councils, 1986.
Guthrie-Smith, W. H. Tutira: The story of a New Zealand sheep station. 4th ed. Wn, Reed, 1969.
Hall-Jones, Fiordland explored: an illustrated history. Wn, Reed, 1976.
Harris, P. Otunui. Taumaranui, C & S Publications, 1985.
A History of Canterbury. Canterbury centennial historical and literary committee. 3 vol. Ch, Whitcombe and Tombs, 1957–71.
Holcroft, M. H. The line of road: a history of Manawatu County, 1876–1976. Dn, McIndoe for the Manawatu County Council, 1977.
Howard, B. H. Rakiura: a history of Stewart Island. Dn, Reed, 1974.
Irvine-Smith, F. L. The streets of my city: Wellington, New Zealand. Wn, Reed, 1967.
Kirk, W. R. Pulse of the plain: a history of Mosgiel. Mosgiel Borough Council, 1985.
Lambert, G. An illustrated history of Taranaki. Palmerston North, Dunmore Press, 1983.
Lambert, T. The story of old Wairoa and the East Coast district, North Island, New Zealand. Dn, Coulls Somerville Wilkie, 1925. Reprinted Ch, Capper Press, 1977.
Latham, D. The golden reefs: an account of the great days of quartz mining at Reefton, Waiuta and the Lyell. Ch, Pegasus, 1984.
Law, M. D. From bush to swamp: the centenary of Shannon, 1887–1987. P. North., Dunmore, 1987.
Lee, J. Hokianga. Ak, Hodder and Stoughton, 1987.
McAra, J. B. Gold mining at Waihi, 1878–1952. Waihi, Waihi Historical Society, 1978.
McLean, G. J. Otago Harbour: currents of controversy. Dn, Otago Harbour Board, 1985.
Main, W. Auckland through a Victorian lens. Wn, Millwood Press, 1977.
May, P. R. The West Coast gold rushes. 2nd rev. ed. Ch, Pegasus, 1967.
Nordmeyer, A. Waitaki: the river and its lakes, the land and its people. Oamaru, Waitaki Lakes Committee, 1981.
Oliver, W. H. Challenge and response: a study of the development of the Gisborne East Coast region. Gisborne, East Coast Development Research Association, 1971.
Olssen, E. A history of Otago. Dn, McIndoe, 1984.
Pankhurst, E. E. Safe haven: Riverton 1935–1985. Riverton, Riverton Sesquicentennial Soc., 1985.
Parker, S. K. Cambridge: an illustrated history 1886–1986: the centenary of local government in Cambridge. Cambridge Borough Council, 1986.
Reed, A. H. The story of Northland. Wn, Reed, 1975.
Scott, D. Seven lives on Salt River. Ak, Hodder and Stoughton and Southern Cross Books, 1987.
Sissons, J. The puriri trees are laughing: a political history of the Nga Phui in the inland Bay of Islands. Ak, Polynesian Soc., 1987.
Smart, M. J. G. and A. P. Bates. The Wanganui story. Wanganui, Wanganui Newspapers, 1972.
Smedley, B. Homewood and its families. Wn, Mallinson Rendel, 1980.
Stafford, D. The founding years of Rotorua. Ak, Ray Richards, 1986.
*Standish, M. W. The Waimate mission station. Wn, Govt Print., 1962.
Tullett, J. S. The industrious heart: a history of New Plymouth. New Plymouth, New Plymouth City Council, 1981.
Voelkerling, R. H. From sand to papa: a history of the Wanganui County. Wanganui, Wanganui Newspapers, 1986.
Woodhouse, A. E. Blue cliffs, the biography of a South Canterbury sheep station, 1856–1970. Wn, Reed, 1982.
Alley, R. An autobiography. 2nd ed. Ak, Ode Record and Publishing Co., 1987.
Basset, J. Sir Harry Atkinson, 1831–1892. Ak, Auckland University Press, 1975.
Beaglehole, J. C. The life of Captain James Cook. London, Black, 1974.
Binney, J., G. Chaplin and C. Wallace. Mihaia: The prophet Rua Kenana and his community at Maungapohatu. Wn, O.U.P., 1979.
Brooking, T. W. H. And captain of their souls: an interpretative essay on the life and times of Captain William Cargill. Dn, Otago Heritage Books, 1984.
Burns, P. Te Rauparaha. Wn, Reed, 1980.
Chapple, G. Rewi Alley of China. Ak, Hodder and Stoughton, 1982.
Condliffe, J. B. Te Rangi Hiroa: the life of Sir Peter Buck. Ch, Whitcombe and Tombs, 1971.
Cresswell, W. D. The letters of D'Arcy Cresswell. Ch, University of Canterbury, 1971.
Dalziel, R. Julius Vogel: business politician. Ak, Auckland University Press and Oxford University Press, 1986.
Davies, S. Bread and roses: her story/Sonja Davies. Ak, Australia and New Zealand Book Co., Masterton, Fraser Books, 1984.
Edwards, J. Break down these bars: Jim Edwards as told to David Ballantyne. Edited by Graham Adams. Ak, Penguin, 1987.
Fairburn, A. R. D. The letters of A. R. D. Fairburn, selected and edited by L. Edmond. Ak, Oxford University Press, 1981.
Fingleton, D. Kiri Te Kanawa. London, Collins, 1982.
Frame, J. To the is-land: an autobiography: volume one. London, Women's Press; Ak, Hutchinson Group, 1983.
Frame, J. An angel at my table: an autobiography: volume two. Ak, Hutchinson, 1984.
Frame, J. The envoy from mirror city: an autobiography: volume three. Ak, Hutchinson, 1985.
Gordon, J. All the world's a stage. Wn, Mallinson Rendel, 1981.
Graham, J. Frederick Weld. Ak, O.U.P./Auckland University Press., 1983.
Gustafson, B. From the cradle to the grave: a biography of Michael Joseph Savage. Ak, Reed Methuen, 1986.
Harper, B. Petticoat pioneers: South Island women of the colonial era. Wn, Reed, 1980.
Hayward, M. Diary of the Kirk years. Wn, Reed: Queen Charlotte Sound, Cape Catley, 1981.
Henderson, J. M. Ratana: the man, the church, the political movement. 2nd ed. Wn, Polynesian Society, 1972.
Honours, Titles, Styles, and Precedence in New Zealand, compiled and edited by P. P. O'Shea. Wn, Govt Print., 1977. Supplement, 1980.
Journal of a Rambler: The journal of John Boultbee. Edited by June Starke. Ak, Oxford University Press; Wn, Alexander Turnbull Library Endowment Trust, 1986.
King, M. Te Puea. Ak, Hodder and Stoughton, 1982.
King, M. Whina: a biography of Whina Cooper. Ak, Hodder and Stoughton, 1983.
Lee, J. A. The John A. Lee diaries, 1936–40. Ch, Whitcoulls, 1981.
Lush, V. The Waikato journals, 1864–68, 1881–82. Ch, Pegasus, 1982.
Macgregor, M. F. Petticoat pioneers: North Island women of the colonial era. 2 vol. Wn. Reed, 1973.
McCormick, E. H. Omai, Pacific envoy. Ak, Auckland University Press, 1977.
McCormick, E. H. Portrait of Frances Hodgkins. Ak, Auckland University Press; O.U.P., 1981.
McNeish, J. Walking on my feet: A. R. D. Fairburn, 1904–1957. Ak, Collins, 1983.
Marsh, N. Black beech and honeydew: an autobiography. Rev. and enl. ed. Ak, Collins, 1981.
Marshall, J. Memoirs. Vol. 1, 1912 to 1960. Ak, Collins, 1983.
Meyers, J. Katherine Mansfield: a biography. Ak, Hodder and Stoughton, 1979. Also published London, H. Hamilton, 1978.
Moore, M. K. Hard labour. Ak, Penguin, 1987.
Notable New Zealanders. Ak, Hamlyn, 1979.
Oliver, W. H. James K. Baxter: a portrait. Wn, Port Nicholson Press, 1983.
Olssen, E. N. John A. Lee. Dn, University of Otago Press, 1977.
O'Shea, P. P. An unknown few: the story of those holders of the George Cross, the Empire Gallantry Medal, and the Albert Medals associated with New Zealand. Wn, Govt Print., 1981.
Raeside, J. D. Sovereign chief: a biography of Baron de Thierry. Ch, Caxton Press, 1977.
Rolleston, R. William and Mary Rolleston. Wn, Reed, 1971.
Sargeson, F. Sargeson. Ak, Penguin, 1981.
Scott, R. G. A stake in the country; Assid Abraham Corban and his family, 1892–1977. Ak, Southern Cross Books, 1977.
Shadbolt, M. F. R. Love and legend: some 20th century New Zealanders. Ak, Hodder and Stoughton, 1976.
Sinclair, K. Walter Nash. Ak, Auckland University Press, 1976.
Sinclair, K. William Pember Reeves: New Zealand Fabian. Oxford, Clarendon Press, 1965.
Stirling, A. M. Amiria: the life story of a Maori woman, as told to Anne Salmond. Wn Reed, 1976.
Stone, R. J. C. The father and his gift: John Logan Campbell's later years. Ak, Auck. Univ. Press, 1987.
Stone, R. J. C. Young Logan Campbell. Ak, Auckland University Press, 1982.
Te Wiata, B. Inia Te Wiata, most happy fella. Ak, Hutchinson, 1982.
Thomson, J. M. A distant music, the life and times of Alfred Hill, 1870–1960. Ak, O.U.P., 1980.
Trussell, D. Fairburn. Ak, Auckland University Press and Oxford University Press, 1984.
Webster, P. Rua and the Maori millennium. Wn, Price Milburn for Victoria University Press, 1979.
Wilson, O. An outsider looks back: reflections on experience. Wn, Port Nicholson Press, 1982.
Who's Who in New Zealand, 11th ed., edited by J. E. Traue. Wn, Reed, 1978.
Table of Contents
Publications marked with an asterisk are obtainable only from the Department of Statistics, Wellington. All other publications may be obtained from Government Bookshops in Auckland, Hamilton, Wellington, Lower Hutt, Christchurch and Dunedin.
Annual Report of the Government Statistician (Parliamentary Paper G. 28)
Employment Statistics
Handbook on Survey Procedures*
Inter-industry Study of the New Zealand Economy
Monthly Abstract of Statistics
New Zealand Brochure (annual)*
New Zealand Business Patterns 1986*
New Zealand Enterprise Survey
New Zealand Input-Output Tables
New Zealand Life Tables
New Zealand Population Projections 1983–2016
New Zealand Sub-national Population Projections 1986–2006
New Zealand System of National Accounts
Pocket Digest of Statistics
Publications Catalogue*
Report on the 1980 Revision of the Consumers Price Index
Statistics—Product Index*
Social Indicators Survey Report 1980–81
Social Indicators Working Paper No. 1: Defining Unemployment
Agricultural Statistics
Building Statistics (see also Bulletins)
Consumers Price Index
Demographic Trends
Exports
External Migration Statistics
External Trade Price and Volume Indexes
External Trade, Report and Analysis of
Household Expenditure and Income Survey
Imports
Insurance Statistics
Justice Statistics: Parts A and B
Local Authority Statistics
Merchandise Trade with Australia (also quarterly)
Overseas Balance of Payments
Overseas Travel Statistics* (also quarterly)
Producers Prices Statistics
Shipping and Cargo Movements
Statistics of Incomes and Income Tax of Persons
Statistics of Incomes and Income Tax of Companies
Transport Statistics
Vital Statistics
Wages and Earnings
Work Stoppages and Industrial Union Statistics
Census of Population and Dwellings 1986
A2 Local Authority Population and Dwelling Statistics
A3 Rural Population Statistics
B1 Provisional Regional Summary Statistics
Local Government Regions
| B2 | Northland |
| B3 | Auckland |
| B4 | Thames Valley |
| B5 | Bay of Plenty |
| B6 | Waikato |
| B7 | Tongariro |
| B8 | East Cape |
| B9 | Hawke's Bay |
| B10 | Taranaki |
| B11 | Wanganui |
| B12 | Manawatu |
| B13 | Horowhenua |
| B14 | Wellington |
| B15 | Wairarapa |
| B16 | Nelson Bays |
| B17 | Marlborough |
| B18 | West Coast |
| B19 | Canterbury |
| B20 | Aorangi |
| B21 | Clutha/Central Otago |
| B22 | Coastal/North Otago |
| B23 | Southland |
| B24 | Regional Summary |
| B25 | Usually Resident Population |
| B26 | Hospital Board Districts and Health Districts |
| B27 | 1987 Electorate Profiles |
| C1 | Provisional National Summary Statistics |
| C2 | National Summary |
| C3 | Ages and Marital Status |
| C4 | Labour Force Part 1 |
| C5 | Labour Force Part 2 |
| C6 | Birthplaces and Ethnic Origin |
| C7 | Internal Migration |
| C8 | Incomes and Social Welfare Payments |
| C9 | New Zealand Maori Population and Dwellings |
| C10 | Pacific Island Polynesian Population and Dwellings |
| C11 | Dwellings |
| C12 | Households |
| C13 | Families |
| C14 | Religious Professions |
| C15 | Education and Training |
| C16 | Total Population Statistics |
| C17 | Overseas Visitor Statistics |
| D1 | Questionnaire Content and Submissions |
| D2 | Range and Availability of Statistics, 1 Table of Contents |
| D3 | General Information |
| D4 | Census Data Files |
| D5 | Information on the Range of Statistics |
Census of Agricultural Contracting Services 1984–85
Census of Building and Construction 1984–85
Census of Distribution 1982–83
Census of Fishing 1983–84
Census of Forestry and Logging 1983–84
Census of Manufacturing 1983–84
Census of Mining and Quarrying 1983–84
Census of Services 1980–81
Census of Services (Finance and Insurance) 1982–83
Census of Transport, Storage and Communication 1984–85
Building Statistics (monthly, quarterly and annually)*
Census of Distribution 1982–83
| C1 | Wholesale Trade |
| C2 | Retail Trade |
| C3 | Restaurants and Hotels |
| C4 | Personal and Household Services |
Census of Manufacturing 1983–84
| B1 | Local Government Administration Regional Measurements |
| C1 | Manufacture of Food, Beverages and Tobacco |
| C2 | Textile, Wearing Apparel and Leather Industries |
| C3 | Manufacture of Wood and Wood Products, including Furniture |
| C4 | Manufacture of Paper and Paper Products, Printing and Publishing |
| C5 | Manufacture of Chemicals and Chemical, Petroleum, Coal, Rubber and Plastic Products |
| C6 | Manufacture of Non-metallic Mineral Products, except Products of Petroleum and Coal |
| C7 | Basic Metal Industries |
| C8 | Manufacture of Fabricated Metal Products, Machinery and Equipment |
| C9 | Other Manufacturing Industries |
The New Zealand Labour Force (quarterly)
Overseas Travel Statistics (quarterly and annual)*
The Effect of Increases in Nominal Incomes on Personal Income Tax Rates
ASSET—A Simulation System for Evaluating Taxation
A Comparison of New Zealand and Australian Manufacturing Industries 1981–82
New Zealand Rural Profile
An Investigation of Official Ethnic Statistics
New Zealand Harmonised System Classification
New Zealand Standard Classification by Broad Economic Categories
New Zealand Standard Classification of Occupations
New Zealand Standard Country Codes
New Zealand Standard Industrial Classification
New Zealand Standard Institutional Sector Classification Manual
New Zealand Standard Trade Classification
Report of the Review Committee on Continuing Education Statistics (1976)
Report of the Review Committee on Tourism Statistics (1977)
Report of the Review Committee on Forestry Statistics (1979)
Report of the Review Committee on Agriculture Statistics (1979)
Report of the Review Committee on Housing Statistics (1979)
Report of the Review Committee on New Zealand Transport Statistics (1980)
Report of the Review Committee on Statistics on the Processing and Marketing of Meat, Wool and Dairy Produce (1981)
Report of the Review Committee on New Zealand Fisheries Statistics (1981)
Report of the Review Committee on Justice Statistics (1982)
Report of the Review Committee on Finance Statistics (1983)
Report of the Review Committee on Energy and Mining Statistics (1983)
Report of the Review Committee on New Zealand Wine Statistics (1983)
Review of Plastics Statistics (1984)
Report of the Review Committee on New Zealand Statistics of Accidents Involving Injury (1984)
Report of the Standard Land Use Code Committee (1984)
Report of the Review Committee on New Zealand Fertility and Related Statistics (1984)
Review of Electronic Statistics (1986)
Study of Research and Development Statistics (1983)
A regularly updated list of the department's publications is published in the Monthly Abstract of Statistics.
Further details on this list, and the complete Publications Catalogue, are available from any office of the department.
| Special articles before 1976 are listed in the 1985 and earlier Yearbooks. | |
|---|---|
| Subject | Year |
| Tourism: the invisible export | 1976 |
| One hundred years of Lands and Survey | 1976 |
| Royal visit 1977 | 1977 |
| New Zealand at the turning point | 1977 |
| Education in the New Zealand community | 1977 |
| Abbreviations, contractions, and acronyms | 1978 |
| General Price Index | 1978 |
| Abbreviations, contractions, and acronyms (revised) | 1979 |
| The child and learning in a multi-cultural society | 1979 |
| The New Zealand environment and changes in environmental management since 1970 | 1980 |
| Life tables: a measure of life expectancy | 1980 |
| Golden fleece: The evolution of the New Zealand wool industry | 1981 |
| Consumers Price Index 1980 revision | 1981 |
| General election 1981 | 1982 |
| A century of meat exports | 1982 |
| INFOS (Information Network for Official Statistics) | 1984 |
| New Zealand women: their changing situation, 1970–84 | 1985 |
| Goods and services tax | 1986–87 |
| National parks centennial | 1987–88 |
Names of places and geographic features are not indexed separately, but can be found on pages listed under the relevant headings, e.g., Cities; Mountains; Population. Exceptions are names of countries, and inhabited islands.
Acts of Parliament are not indexed separately, and statutory bodies are indexed separately only where there is a major reference.
A large number of organisations and bodies indexed by name have the prefixes ‘National’ or ‘New Zealand’. If there is no reference under a more generally known name, they may be found under these prefixes (e.g., National Film Library; New Zealand Dairy Board).
Individual commodities or products are indexed separately only when they are unusually significant, e.g., Wool. Where there is no individual entry, look on pages listed under the appropriate general index entry:
General commodity or product headings, e.g., Crops, Dairy products, Minerals, Meat; or
General economic and business activity headings, e.g., Retail trade, Manufacturing, Prices.
Similarly, specific services and industries should be looked for in listings under general headings such as Business censuses or National accounts.
A
- Abortion, 313–5
- ACCESS training scheme, 213, 370, 445
- Accident Compensation Corporation, 324–7
- Accidents, 320–1, 324–7
- cases of, treated in public hospitals, 32
- Safety
- falls, 331
- Safety
- fatal, 331
- Safety
- at home, 321
- Safety
- motor vehicle, 327–9
- Safety
- prevention of,
- Safety
- water, 329–30
- Accommodation benefit, 261
- Accommodation, tourist, 427
- Acts of Parliament, 62, 64–5, 89–97
- Adoption, 161, 284
- Adult education,
- Continuing education
- Advertising, 416–7
- Advisory Council for Occupational Safety
- and Health, 336
- Aerial topdressing, 523–4, 656
- Africa, relations with, 112
- Age distribution,
- by sex, 140
- of parents, 158–9
- of population, 140–1, 165
- of mothers, 159–60, 161
- at death, 162, 163
- Agricultural land, 491–4, 518–23
- Agricultural production price index, 525–6
- Agricultural Production Account, 524–5
- Agricultural production, aspects of, 548–51
- marketing, of products, 532–4, 537–8, 539–41, 543–5
- Agriculture and Fisheries, Ministry of, 78, 480–3, 527–8
- Agriculture, aspects of, 518
- capital expenditure, 522
- cattle, 531, 535
- current situation and trends, 518
- dairy farming, 541–5
- deer farming, 528–9
- farm employees, 520–2
- goat farming, 529
- government policy, 518
- historical development of, 34, 39, 43, 44, 49
- irrigation, 482, 506–7
- machinery for, 522
- numbers and types of farms, 518–23
- production price index, 525–6
- research on, 470–4, 480–2
- sheep, and sheep farming, 528, 530, 534–5
- Aid, overseas, 112–5
- Air force, 135–6
- Air freight, 652, 654–6
- Air mail, 670
- Air New Zealand, 75, 652, 653
- Air pollution, 299, 508–9
- Air Services Licensing Authority, 649
- Air transport,
- Aviation
- Airways Corporation of New Zealand Ltd, 75, 650, 652
- Alcohol
- consumption, 306
- excise on, 721, 793
- and health, 306-7
- legal aspects of consumption, 665–6, 681–3
- Alcoholic Liquor Advisory Council, 306
- Alexander Turnbull Library, 409
- Aluminium industry, 604
- Ambassadors, 120–3, 123–6
- foreign, in New Zealand, 120–3
- New Zealand, overseas, 108, 123–6
- Amenities, of dwellings, 175
- Animals and plants,
- Vegetation and wildlife
- Animals, farm,
- Livestock
- Anniversary day holidays, provincial, 464–5
- Antarctica, 2, 127
- Ante-natal services, 303
- Antiquities, protection of, 404
- ANZUS (Australia, New Zealand and United States) Treaty, 110, 130
- Apiaries, 547
- Appeals against convictions and sentences, 386–7
- Apples and pears, 550–1, 552–3
- Appliances, in dwellings, 175
- expenditure on, 173–4
- Apprentices, 369–70, 441
- Aquaculture, 571–2
- Arbitration Commission, 455
- Arbitration Court,
- Labour Court
- Archaeological sites, protection of, 403–4
- Area health boards, 292
- Area, total land, 1–2, 500
- Armed forces, 127
- assistance to community, 131–2
- exercises overseas, 131
- historical involvement, 41, 47
- New Zealand Army, 134–5
- Royal New Zealand Air Force, 135–6
- Royal New Zealand Navy, 133–4
- strength of, 133–6
- Arrivals, in country, 155–7
- (Immigration)
- Art galleries and museums, 402–3
- Arts and cultural activities, 397–400
- awards in, 400
- support of, 397–9
- Arts Council (Queen Elizabeth II), 397–9
- ASEAN (Association of South-east Asian Nations), 110, 131, 728
- Asian countries, relations with, 110, 728–9
- Asian Development Bank, 118–9
- Assistance to developing countries, 112–5
- Audit Office, 86
- Australia New Zealand and United States Treaty (ANZUS), 110–130
- Australia New Zealand Closer Economic Relations Trade Agreement (CER). 109–10, 724–6
- Australia, relations with, 109–10, 724–7
- Authority for Advanced Vocational Awards, 369
- Average Gross Income Index, 450–1
- Average retail prices, 749–52
- Average Tax Rates Index, 451–2
- Aviation.
- airlines, 639, 652–3
- airports, 650
- distances to overseas destinations, 654
- domestic, 651, 652
- freight and passenger volumes, 651, 652, 653–6
- international, 652–5
- licensing of, 649–50
- services to, 650, 652
- Awards in literature and the arts, 400
B
- Balance of payments, 822–8
- definition and principles of, 822–6
- summaries, 826–8
- Bank cards. 704
- Bank notes, 764
- Bankruptcies, 687–9
- Banks and banking, 757–64
- financial corporations, 762–4
- hire purchase, 703–4
- registration of banks, 759–61
- Reserve Bank of New Zealand, 46, 758–9
- savings institutions, 761–2
- trading banks, 760–1
- Beef, 535
- Beer,
- consumption per capita, 306
- production, 610
- Bees and beekeeping, 547
- Benefits and pensions, 257
- accident compensation, 324–7
- accommodation, 261
- current rates, 257–8, 268–9, 271–3
- death, 262, 277
- dental, 273
- disability, 263–5
- domestic purposes, 258–9, 262, 263, 267, 271
- emergency, 260, 261
- expenditure on, 265, 273–4
- family, 259, 260, 262
- handicapped child's allowance, 261, 265
- health, 271–4
- hospital, 262, 272, 273–4
- invalids’, 257, 259–60, 262
- maternity, 265, 272
- miners’, 258, 260, 262, 263
- national superannuation, 258, 263, 265, 266, 270, 271
- orphans’, 259, 262, 263
- pharmaceutical, 272, 274
- physiotherapy, 273
- population receiving, 269–71
- reciprocity agreements, 266
- sickness, 260–1, 262, 263, 271
- social welfare, 257–67, 269–71
- unemployment, 258, 260, 262, 263, 265, 271
- war pensions and allowances, 267–9
- widows’, 258, 262, 263
- Betting, 422–4
- Bibliography, Books about New Zealand, 837
- Bilateral assistance, 113–5
- Bills, passing of, 62, 64
- Biography, Dictionary of New Zealand, 405
- Birthplaces, of population, 190–1
- Births and birth rates, 157–61
- ex-nuptial, 160–1
- multiple, 158
- registration of, 157
- stillbirths, 161
- Board of Maori Affairs, 494–5
- Books and libraries, 359, 406–11
- Boroughs and borough councils, 99
- population of, 150–2
- Books about New Zealand, 837
- Broadcasting, 411–5
- independent, 412
- public broadcasting fee, 412
- radio, 413–4
- to schools, 358
- standards, 414–5
- television, 412–3
- Broadcasting Corporation of New Zealand, 411–2
- Broadcasting Tribunal, 414
- Building and construction, 625–6, 630
- activity, 631–6
- census of, 636–8
- construction standards, 630–1
- employment in, 635
- materials used, 636
- permits and work put in place, 632–4, 636
- of rental houses, 625–6
- Building societies, 762
- Buildings,
- construction of, 625–6, 630
- historic, 403–4, 516
- used as dwellings, 167–71
- Bureaufax services, 673
- Burial and cremation, 163
- Bursaries,
- school boarding, 354–5
- for tertiary study, 362, 364
- Buses, 657, 658, 662, 663
- school, 355
- Business Directory, 807
- Business statistics, 805–8
- Butter, 541–2, 544–5
C
- Cabinet, 68–70
- Campbell Island, 2
- Canada, relations with, 110–1, 730
- Cancer, deaths from, 311–2
- Capital Expenditure Price Index, 754–6
- Capital Finance Accounts, 813–4
- Capital gains, tax on, 784–5
- Cargo,
- air, 652, 654–6
- handled at ports, 643–6
- Caribbean, relations with, 111, 730
- Carpets,
- Textile industry
- Cars, 662–3
- Casein, 541–2, 544–5
- Cattle, 531, 535
- Caucuses, political party, 61–2
- Cawthron Institute, 485
- Censorship, 401–2
- films and video recordings, 401–2
- indecent publications, 402
- Census of Building and Construction 536–8
- Census of Distribution, 704–11
- Census of Fishing, 573–4
- Census of Forestry and Logging, 558–60
- Census of Manufacturing, 612–9
- Census of Mining and Quarrying, 598, 600–1
- Census of Population and Dwellings, results of,
- country of birth, 190–1
- ethnic origins, 188–90
- households and dwellings, 167–72
- employment, 432, 434–6, 437–40
- incomes, 447–8
- Maori population, 208–11
- Pacific Island Polynesian population, 228–9
- population, 139–44, 145–6, 148–55
- religious professions, 187–8
- social welfare payments, 269–71
- unemployment, 443–5
- Census of Services, 711–6
- insurance, 694–700
- Census of Transport, Storage, and Communication, 674–6
- Central government finance, 774
- expenditure, 774–84
- Taxation
- public accounts, 774, 777–84
- Taxation
- public debt, 794–7
- Taxation
- revenue,
- Taxation
- securities on issue, 767–9
- CER (Australia New Zealand Closer Economic Relations Trade Agreement), 109–10, 724–6
- Cereals, 548–50
- Chatham Islands, 2, 20
- Cheese, 541–2, 544–5
- Chemicals, poisonous, 301–2
- Childbirth, 157–61
- births and birth rate, 157–61
- infant mortality, 312
- maternal deaths, 313
- maternity benefits, 265, 272
- maternity leave, 465
- stillbirths, 161, 312
- Childcare and pre-school education, 184, 282, 347–8, 352, 353
- (Kohanga reo)
- Children,
- adoption of, 161, 284
- in care of Department of Social Welfare, 284, 287–8
- custody and guardianship of, 181, 182–3
- day-care for, 184, 282, 284
- deaths of, 332
- health of, 304–5
- and justice system, 284–8
- long-term care for, 284, 287–8
- Children and Young Persons Courts, 285–8, 378
- Children's health camps, 304
- Children's homes, 284
- China, relations and trade with, 110, 729
- Chiropractors, 297
- Chronology of events, 52–5
- Churches and religious organisations, number of adherents of, 187–8
- Cities and city councils, 99
- (Urban areas)
- population of, 150
- Citizenship, 191–2
- Civil aviation,
- Aviation
- Civil defence, 332–3
- Civil jurisdiction of courts, 379–80
- Clerk of the House of Representatives, 62
- Climate, 9–14
- Coal, 580, 592–3
- Coal Corporation of New Zealand Ltd, 75, 592
- Coastal shipping, 642, 643
- Coat of arms, 104–5
- Coates, J. Gordon, 42, 45
- Coins and coinage, 764
- Colleges,
- secondary, 348–50, 350–4
- teachers, 355–7
- Colonisation, 27–9
- Commerce Commission, 679, 684–5
- Commerce, Ministry of, 83, 717
- Commercial law and practices, 683–5
- Commissioner for the Environment, Parliamentary, 505
- Commissions of inquiry, 74
- Commodity agreements, international, 720
- Commonwealth, relations with, 119
- Commonwealth Games, 421
- Communications, Census of Transport, Storage and, 674–6
- Community care ordered by courts, 386, 388
- Community centres, 371–2
- Community councils, 101–2
- Community Employment Investigation Scheme, 446
- Community service, imposed by courts, 386, 388
- Community welfare services,
- assistance to individuals, 264–5
- funding of, 282–3
- programmes, 263–4, 282–3
- Companies, 683–5, 689–90
- incomes of, 794
- insolvencies, 689–90
- mergers of, 684–5
- practices of, 684–5
- registrations, 683
- taxation of, 789–90, 794
- Compensation, accident, 324–7
- Conservation, Department of, 78, 489–90, 497, 510–5
- Conservation of cultural property, 403
- Conservation of natural resources
- forests, 513–4
- legislative reform, 509–10
- research on, 473–5
- of water and soil, 505–8
- Consolidated Account, 774, 780–2, 784
- Consolidated Accounts of the Nation, 808
- Constitution, 57, 59–62
- history of, 27–8, 30, 37–8, 47–8
- recent reform, 59–60
- Construction,
- Building and construction
- Consumer Council, 680
- Consumer protection, 679–80
- Consumers Price Index, 744–9
- all groups, 25 urban areas combined, 745
- geographical variation, 746–7
- international comparison, 749
- methodology, 748–9
- percentage movements, 747
- Continuing education, 357, 359, 371–3
- Convictions,
- appeals against, 386-7
- numbers of, 383–4, 387
- sentencing on, 386, 391
- Cook Islands, 108–9
- Cook, James, 24, 25
- Cook Strait rail/ferry service, 642, 658
- Copyright, 400–1
- Corporations, government, See State-owned enterprises
- Corrective training, 389, 391
- Correspondence School, 352
- Cost of living,
- (Consumers Price)
- Index, Real disposable income indexes, Retail prices), 172–4
- Council for Educational Research, 341–2
- Council for Maori and South Pacific Arts, 399
- Counties and county councils, 99
- population of, 152–4
- Country of birth, 190–1
- Court of Appeal, 375, 384, 387
- Courts, 374–8
- of Appeal, 375, 384, 387
- Children and Young Persons, 285–8, 378
- District, 285, 377, 380, 382–6
- Family, 285, 377
- High, 98, 376–7, 379–80, 384–7
- Labour, 377–8, 445
- Maori Land and Appellate, 378, 494–5
- Planning Tribunal, 378
- trial, 384–7
- CPI (Consumers Price Index), 744–9
- Credit, 703–4
- Credit cards, 704
- Cremation and burial, 163
- Crime, 381, 384–7
- compensation for, 387
- criminal jurisdiction, 384
- criminal trials, 383, 384–7
- reported offences, 381–2
- Crops, 471–2, 548–51
- fruit, 550–1, 552–4
- grains, 548–50
- research, 481
- seeds, 550
- vegetables, 550
- Crown land, 489, 495–8
- disposal of, 495, 497
- Crown Law Office, 78
- Cultural activities, 397–400
- Currency, 764
- Customs Department, 78, 720–1
- Customs tariff and revenue, 720–1
D
- Dairy farming and products, 541–5
- butter, 541–2, 544–5
- casein, 541–2, 544–5
- cheese, 541–2, 544–5
- exports, 543–5
- marketing of, 543–4
- milk and milk products, 541–2, 544–5
- prices, 545
- production index, 525
- Data communications, 674
- Day-care, 184, 282, 284
- Daylight saving, 19–20
- Deaf persons, aids for, 273, 302
- Death benefits, 262, 277
- Death duty, estates passed for, 790–1
- Deaths and death rates, 161–4, 208–9, 310
- accidental, 330–1
- from cancer, 311–2
- of children, 332
- infant, 312–3
- maternal, 313
- major causes, 310
- Maori, 208–9
- registration of, 163
- Credit
- Mortgages
- stillbirths, 161, 312 Debt,
- Credit
- Mortgages
- private,
- Credit
- Mortgages
- public, 794–7, 801–3
- Deer farming, 528–9
- Defence, 127
- agreements, 130–1
- expenditure, 132–3
- Ministry of, 78, 127–9
- policy and co-ordination, 116, 117, 128–9
- Democratic Party, 73, 74
- Demography,
- Population
- Dental benefits, 273
- Dental health, 273, 293, 307–8
- Dentists, 296
- Department of Conservation, 78, 496, 510–5
- Department of Education, 78–9, 340, 343–5
- Department of Health, 80, 271–4, 293, 295, 305, 308–9
- Department of Internal Affairs, 80–1, 446
- Department of Justice, 81
- Department of Labour, 81, 336–7, 432, 445
- Department of Lands, 81–2, 495–8
- Department of Maori Affairs, 82, 212–3, 214, 216, 494–5
- Department of Scientific and Industrial Research, 82, 470–80
- Department of Social Welfare, 82, 256–7, 281
- Department of Statistics, 82–3
- publications, 859
- Department of Survey and Land Information, 83, 489–90, 497
- Department of Trade and Industry, 83, 609–10, 668, 680, 685, 717
- Departments, government, 76, 77
- functions of, 75, 78–84
- Departures, from country, 155–7
- Deportation, 202, 207
- Depression, economic, 35, 42
- Design, industrial, 485–7
- Developing countries, relations with, 112–5, 732–3
- DFC New Zealand Limited, 763
- Dictionary of New Zealand Biography, 405
- Dietitians, 297
- Diplomatic, consular and other representation in New Zealand, 123–6
- Diplomatic representatives overseas, 120–3
- Disability allowances, 263–5
- Disabled persons, 308
- aids for, 273
- Benefits and pensions
- assistance and services for, 263–5
- Benefits and pensions
- benefits for,
- Benefits and pensions
- Disarmament, 116
- Disaster relief, 132
- Diseases, treated, 319–20
- Displaced persons,
- Refugees
- Dissolution of marriage, 181–2
- Distribution of population, 141–55
- District communities and community councils, 102
- District Courts, 377
- civil cases, 380
- criminal cases, 382–6
- male/female appearances, 387
- traffic offences, 384
- District Maori Councils, 214, 216
- District planning, 502, 504
- Districts and district councils, 99
- population of, 154–5
- Divorce, 181–2
- Doctors, 29
- Domestic assistance, 259, 261–2, 273
- Domestic purposes benefits, 258–9, 262, 263, 267
- Domestic trade, 700
- census of distribution, 704–11
- retail trade, 700–4, 708–9
- wholesale trade, 707–8
- Domestic travel, 428–9
- Drinking, legal aspects of, 681–3
- Drivers’ licences, 664–5
- Driving offences, 383–4, 666–8
- Drownings, 329–30
- Drugs,
- legal, control of, 300
- offences involving, 395
- treatment, 306
- DSIR (Department of Scientific and Industrial Research), 82, 470–80
- Dwellings, 167–71
- tenure of, 168–9, 171
- types of, 168, 170
E
- Earthquake and War Damage Commission, 333, 691
- Earthquakes, 3–4, 6–9, 474
- EC (European Community), 111, 730–1
- Economic history,
- pre-1840, 25–8
- 1840–1919, 34–6
- 1919 to present day, 39–44, 46–7, 49–50
- Economy Wide Census, 805
- Education
- administration of, 340–4, 345–6
- continuing, 357, 359, 371–3
- curriculum, 348
- Department of, 78–9, 340, 343–5
- international links, 345
- of Maori, 212–3, 223–4, 342, 349, 353
- of Pacific Island Polynesians, 342
- pre-school, 184, 282, 347–8, 352, 353
- public expenditure on, 343–4
- review of, 345–6
- and the Royal Commission on Social Policy, 249
- rural, 357
- special, 355, 356
- teacher numbers, 353
- teaching resources, 357–9
- teacher training, 355–7
- technical, 367–71
- university, 343, 359–67
- Women's Advisory Committee on, 184
- Educational research, 341–2
- EEZ (Exclusive Economic Zone), 567–9
- Eggs, 546–7
- Elections, 70–4, 102–3
- licensing poll, 74
- local body, 102–3
- parliamentary, 70–4
- Electorates, parliamentary,
- listed, 67–8
- maps of, 71–2
- review of, 70, 73
- Electricity, 580, 582–8
- consumption of, 577–8, 583–5
- generation of, 583–5
- supply authorities, 586–8
- Electricity Corporation of New Zealand Ltd, 75, 582–6
- Electronics industry, 476–7, 604
- Embassies, 120–6
- of foreign countries, 120–3
- New Zealand, overseas, 108, 123–6
- Emergency benefits, 260, 261
- Emigration, 155, 156, 157
- Employer organisations, 459
- Employment, 432
- farm, 520–2
- Human Rights Commission
- and human rights,
- Human Rights Commission
- status, 438
- surveys of, 432–3
- termination of, 465
- and training programmes, 445–6
- of women, 435–7
- Energy, 576
- consumption, 576–8
- demand and supply, 578
- Ministry of, 79, 337–8, 576
- policy and planning, 576
- resources, 475, 578–81, 591–3
- Energy, forms of,
- coal, 580, 592–3
- electricity, 580, 582–8
- gas, 579–80, 591–2
- geothermal, 580, 585
- oil, 578–9, 588–90
- renewable, 581, 582
- Engineering industry, 477–9, 604
- Enterprise Survey, annual, 805–7
- Environment, 14–9
- agencies responsible for, 505, 515–6
- and mineral exploitation, 505
- Ministry for the, 79
- Parliamentary Commission for, 505
- research on, 473, 479
- Environmental health, 299, 479
- Equal employment opportunities, 76–7
- Equal Opportunities Tribunal, 183
- Equal pay, 464
- Erosion, control of, 505
- Estate duty, 790–1
- Ethnicity, 188–90, 199
- Maori, See Maori population
- (Treaty of Waitangi)
- Pacific Island Polynesians, See Pacific Island Polynesians
- (Treaty of Waitangi)
- race relations and racial discrimination, 183–4, 217, 252
- (Treaty of Waitangi)
- European Community (EC), 111, 730–1
- European countries, relations with, 111, 730–2
- Europeans, exploration by, 24–5
- settlement by, 25–9
- Events, chronology of, 52–5
- Examinations, 348–50
- Exchange rates, 769–73
- (Foreign exchange market)
- (Overseas exchange transactions)
- Excise duties, 721, 793
- Exclusive Economic Zone (EEZ), 567–9
- Executive Council, Cabinet and, 59, 68–70
- Ex-nuptial births, 160–1
- Exotic forests, 555–6
- Explorers of New Zealand, 22,24–6
- Export awards, 719
- Export Guarantee Office, 719
- Export Prices Index, 740–1, 742
- Export Volume Index, 742
- Exports, 717
- agricultural,
- Marketing, of agricultural products
- destinations, by country, 733–6
- main, value and volume of, by commodity, 737
- technical help to exporters, 487
- value of, by SITC, 738–40
- External migration, 155–7
- emigration, 155, 156, 157
- immigration, see Immigration
- External trade, 717
- agreements, 723–33
- balance of merchandise trade, 722–3
- commodities, trade in, 736–40
- listed by country and region, 733–6
- price and volume indexes, 740–3
- statistics of, types and sources, 722
- terms of, index, 741–2
- External transactions account, 812, 814, 826–8
F
- Factories, 604–7, 610–9
- (Manufacturing industry
- (Occupational safety and health)
- Fair trading legislation, 679–80
- Families,
- Households
- Family benefits, 259, 260, 262
- Family Courts, 181–3, 285, 377
- Family health, 303–4
- Family law, 181–3
- Family planning, 303
- Family Support, 778, 785–6
- Farm employment, 520–2
- Farming,
- Agriculture, aspects of
- Farming Inputs Price Index, 525–6
- Farms,
- numbers and types, 519–20
- land for, 491–3
- Fauna,
- Vegetation and wildlife
- Ferries, 642, 658
- Fertiliser, 481, 523–4
- (Topdressing)
- Fertility rates, 140, 210–1
- Fiji, 108–9
- Films and video recordings, 399, 400
- censorship of, 401–2
- National Film Library, 358
- New Zealand Film Commission, 400
- Financial institutions, 757–64
- Fines, 388
- Fire and general insurance, 692–3, 696–8
- Fire fighting and prevention, 334–5, 515
- First aid, in factories, 302
- Fish,
- catch, 570–1
- exports, 572
- species, 17, 569–70
- Fisheries resources, 567–70
- protection of, 567–9
- Fishing,
- census of, 573–4
- by foreign vessels, 573
- Industry Board, 572
- recreational, 421
- Fishing vessels, 571
- Five Power Defence Arrangements, 130
- Flag, New Zealand, 104
- Flora,
- Vegetation and wildlife
- Fluoridation, 308
- Food,
- expenditure on, 173
- and nutrition, 300–1
- processing research, 472
- standards, 300–1
- Food and Agriculture Organisation, United Nations (FAO), 117
- Footwear industry, 606
- Foreign Affairs, Ministry of, 79, 120
- Foreign exchange market, 769–73, 826–7
- Foreign policy, 108
- (Official Development Assistance (ODA))
- Foreign trade,
- External trade
- Forensic science, 476
- Forest parks, 513–4
- Forest products,
- Timber and forest products
- Forest Research Institute, 483–4
- Forestry and logging, 557
- employment in, 557–8
- Timber and forest products
- Forestry Corporation
- census of, 558–60
- Timber and forest products
- Forestry Corporation
- private, 557
- Timber and forest products
- Forestry Corporation
- products,
- Timber and forest products
- Forestry Corporation
- research into, 483–4
- Forestry Corporation
- state,
- Forestry Corporation
- training in, 558
- Forestry Corporation Ltd, New Zealand, 75, 556–7
- Forestry, Ministry of, 79, 483–4, 555
- Forests, 556
- conservation and protection 513–4
- exotic, 555
- native, 18, 556
- ownership of, 556
- Freight,
- Cargo
- Fringe benefit tax, 789
- Frost, 12–3
- Fruit, 550–1, 552–4
- Fuels,
- coal, 580, 592–3
- gas, 579–80, 591–2
- oil, 578–9, 588–90
G
- Galleries, art, 402–3
- Gambling, 422–4
- Gas, 579–80, 591–2
- GELS (Group Employment Liaison Service), 446
- General Agreement on Tariffs and Trade (GATT), 118, 543, 719–20
- General Assembly,
- House of Representatives
- General elections, 70–4
- Generalised System of Preference, 732–3
- Geographical features, 1–3
- glaciers, 2
- lakes, 3
- mountains, 2
- Geology, 3–9
- (Minerals and mineral products)
- Geothermal power, 580, 585
- Geriatric hospitals, 275
- Gift duty, 791
- Glaciers, 2
- Glossary of statistical terms, 831
- Goat farming, 529
- Gold, 34, 194, 596
- Golden Kiwi lottery, 423–4
- Goods and services tax (GST), 790
- Government, the, 69–70
- Government Computing Service, 75
- Government departments
- chief executives of, 77
- expenditure by, 774–84
- functions of, 78–84
- Government finance, See Central government finance
- Government Life Insurance Corporation, 75, 692
- Government Printing Office, 80
- Government Property Services Ltd, 75
- Government stock and securities, 767–9, 796–7
- Government Superannuation Fund, 276–9
- Governor-General, 63
- functions of, 57, 59, 62, 64, 68, 69
- letters patent, 57, 74
- Graduates, university, 360–3
- Grains, 548–50
- Grape growing and wine production, 551–2
- Gravel, 471
- Greenstone, 471
- Grey, George, 30, 32
- Greyhound racing, 423
- Gross domestic product, 812–3
- in constant prices, 818–22
- defined, 809
- and expenditure, 812–3
- by production group, 815–6
- Gross fixed capital formation, 810, 817–8
- Gross national expenditure, 809, 812
- Group Employment Liaison Service (GELS), 446
- GST, 790
- Guardianship, 181, 182–3
H
- Hail, 11–2
- Handicapped child's allowance, 261
- Handicapped persons,
- Disabled persons
- Harbour boards, 100
- Harbours,
- Ports
- Health, 290
- and causes of death, 310–3
- Hospitals
- Department of, 80, 271–4, 293, 295, 305, 308–9
- Hospitals
- environmental, 299, 479
- Hospitals
- expenditure, 291–2, 294–5
- Hospitals
- family, 303–4
- Hospitals
- and hospitals,
- Hospitals
- insurance, 291
- Maori, 213
- mental, 303
- occupational, 301–2, 336
- practitioners, 295–9
- research, 308–9, 479
- services structure, 290–4
- statistics, 309
- voluntary sector, 291
- Health benefits, 271–4, 292
- Health boards, area, 292
- Health camps, 304
- Health education, 293, 305
- Health inspection, 299–300
- Health Service Personnel Commission, 294
- Health Services Research and Development Unit, 308
- High Court, 98, 183, 376–7, 379–80, 384–7
- Higher School Certificate, 348
- Highways, 660–1
- Hillary Commission for Recreation and Sport, 418
- Hire-purchase, 703–4
- Historic places, 403–4, 516
- Historic reserves, 514
- History of New Zealand, 22
- chronology of events, 52–5
- Economic history
- Social history
- constitutional, 27–8, 30, 37–8, 47–8
- Economic history
- Social history
- economic,
- Economic history
- Social history
- social,
- Social history
- Hocken Library, 411
- Holidays, 464–5
- Home appliances, 173–5
- Home help, 261, 273
- Homelessness, 621–2
- Home ownership, 168–9, 171
- Homestart, 622, 626–7
- Homicide, 381, 385–6
- Horse racing, 422–3
- Honey, 547
- Horticulture, 470–3, 474, 481–2, 525, 548–54
- (Crops)
- Hospital benefits, 262, 272, 273–4
- Hospital boards, 293
- finances, 317–8
- Hospitals,
- administration, 293, 315–6
- beds available, 315–6
- geriatric, 275
- patients treated, 318
- private, 315–6
- public, 315–6
- staff, 317
- treatment in, 318–20
- Hotels and restaurants, 681–3, 709–10
- Hours of work, 437, 464
- House of Representatives,
- Parliament
- Household Expenditure and Income Survey, 172–5
- Household Labour Force Survey, 432–3
- Households, 167–75
- amenities of, 175
- composition of, 167, 169–70
- expenditure by, 172–4
- incomes of, 172–3
- transport, 171–2
- Housing, 621
- costs of, 172–4, 623–4
- (Rental housing)
- of elderly 627–8
- (Rental housing)
- home ownership, 168–9, 171
- (Rental housing)
- Homestart, 622, 626–7
- (Rental housing)
- investment, 624
- (Rental housing)
- loans for 626–30
- (Rental housing)
- Maori, 169–71, 626
- (Rental housing)
- market, 622–4
- (Rental housing)
- Pacific Island Polynesian, 169–71, 626
- (Rental housing)
- rental, 623–5
- (Rental housing)
- state services, 628
- Housing Corporation, 80, 625–6, 629–9
- Human rights, 183
- Bill of Rights, 60, 61, 62
- elimination of discrimination, 181–3
- official information, 86–7
- promotion of equal opportunity, 76–7, 184–6
- Human Rights Commission, 183
- Humidity, 12
- Hunting, 42
- Hydro-electric power, 580, 585
I
- IBRD (World Bank), 116, 117, 118
- IMF (International Monetary Fund), 117
- Immigration, 193
- current provisions, 205–7
- and demography, 155, 156, 157
- historical, 29, 34, 35, 50, 193–200
- recent policy, 200–5
- Immunisation, 305
- Import licensing, 721–2
- Import Price Index, 741, 742
- Imports, 717
- by country, 733–6
- value and volume of principal items, 737–8
- value by SITC, 738–40
- Imprisonment,
- Prisons and prisoners
- Income tax, 784–9
- companies, 789–90
- index of, 451–2
- personal, 784–9
- revenue from, 792–4
- Incomes, 447–53
- of companies, 794
- of households, 172–3
- Indecent Publications Tribunal, 402
- Independent Broadcasters’ Association, 411, 412
- Index of Gross Domestic Product, 819–21
- Indexes, explained, 832–3
- Indexes, listed,
- Average Gross Income Index, 450–1
- Average Tax Rates Index, 451–2
- Capital Expenditure Price Index, 754–6
- Consumers Price Index, 744–9
- Export Prices Index, 740–1
- Export Volume Index, 742
- Farming Inputs Price Index, 526
- Import Prices Index, 741
- Import Volume Index, 743
- Index of Gross Domestic Product, 819–21
- Prevailing Weekly Wage Rates Index, 452–3
- Producers Price Index, 752–4
- Real disposable income indexes, 449–52
- Terms of Trade Index, 741–2
- Urban House Property Price Index, 623–4
- Volume Index of External Trade, 742–3
- Volume of agricultural production, 525
- Industrial accidents, 331
- Industrial design, 485–7
- Industrial relations,
- Labour relations
- Industrial safety,
- Occupational safety and health
- Industrial structure of labour force, 439–40
- Industry,
- Manufacturing industry
- Infant mortality, 312–3
- Inflation,
- Consumers Price Index
- Information and communication technology, 475
- Information Authority, 87–8
- Inland Revenue Department, 80
- (Taxes and taxation)
- Insects, species, 17
- Insolvency, 687–90
- Insurance, 690–700
- accident, 324–7, 691
- earthquake and war damage, 333, 691
- fire and general, 692–3, 696–8
- Government Life, 75, 692
- life, 692, 694–5
- medical, 291, 695–6
- State, 82, 691, 692
- Intellectually handicapped adults and children, 321–4, 355
- Interest rates,
- Monetary policy
- Inter-industry studies, 814–5
- Internal Affairs, Department of, 80–1, 446
- Internal migration, 142–5
- International Bank for Reconstruction and Development (IBRD), 116, 117, 118
- International commodity agreements, 720
- International comparisons,
- abortion rates, 315
- consumer prices, 749
- defence expenditure, 133
- health expenditure, 292
- infant mortality, 312
- life expectancy, 164
- motor vehicle accidents, 329
- research effort, 469
- standards of living, 175, 177
- International Development Association (IDA), 117
- International Finance Corporation (IFC), 117, 118
- International Monetary Fund (IMF), 117
- International organisations, participation in, 115–20
- International relations, 108
- International Whaling Commission (IWC), 120
- International Wool Secretariat, 539
- Invalids’ benefits, 257, 259–60, 262
- Iron and ironsands, 594
- (Steel)
- Irrigation, 482, 506–7, 522–3
J
- Japan, relations with, 110, 729
- Job creation programmes, 445–6
- Judges and judiciary, 59, 374–7
- Juries, 380–1
- Justice, Department of, 81
- Justice, system of,
- Courts
K
- Kermadec Islands, 2
- Kindergartens, 348, 352, 353, 354
- Kiwifruit, 553–4
- Kohanga reo, 212–3, 223–4, 347
- Korea, trade with, 729
L
- Laboratory technicians, medical, 298–9
- Labour Court, 377–8, 455
- Labour, Department of, 81, 336–7, 432, 445
- Labour force, 432
- employment status, 438
- Household Labour Force Survey, 432–3
- industrial structure, 438–9
- industrial structure of, 439–40
- occupational structure, 439–40
- part-time, 437
- projections, 433–4
- Quarterly Employment Survey, 432, 448–9
- survey of, 432–3
- women in, 435–7
- Labour Party, 41, 42, 45–6, 69–70
- Labour relations,
- private sector, 454–5
- public sector, 456–7
- reform, 454
- rights disputes, 466
- Lakes, 3
- Lamb, 531–2, 533–4, 536
- Land,
- agricultural, 491–4, 518–23
- area, total, 1–2, 500
- Crown, 489, 495–8
- development and settlement of, 22–3, 25–9, 31–2, 34–5
- leasehold and leases, 498
- Maori, 28, 29, 31–4, 36, 37, 40, 45
- recreational, 510–5
- registration of ownership, 491–3
- surveys of, 489–90
- transfers of, 492–4, 495–6
- use of, 491–2, 506
- valuation of, 498–500
- Land Corporation Ltd, 75, 497–8
- Land Settlement Board, 497
- Land tax, 790
- Land transfers, 492–4
- Land wars, 29–30, 32–4
- Latitude and longitude, 2
- Law, sources of, 378–9
- Laws,
- Legislation
- Leasehold land and leases, 498
- Legal aid, 381
- Legal systems, 374
- civil jurisdiction, 379–80
- criminal jurisdiction, 382
- Legal tender, 764
- Legislation, 62, 64–5, 89–97
- Legislative Department,
- Parliamentary Service
- Leisure activities, outdoor, 421–2
- Liberal political party, 37–40
- Libraries, 407–11
- Licensing Control Commission, 682
- Licensing trusts, 682–3
- Life expectancy, 164, 211
- Life insurance, 692, 694–5
- Government Life Insurance Corporation, 75, 692
- Lighthouse service, 647
- Liquidation, of companies 689–70
- Liquor,
- Alcohol
- Liquor licensing, 681–3
- Livestock, 528–31, 546
- cattle, 531, 535
- deer farming, 528–9
- goat farming, 529
- health services for, 527, 480
- pigs, 546
- poultry, 546–7
- sheep, and sheep farming, 528, 530, 534–5
- Loans Accounts, 774, 782–3, 784
- Local authorities, 99–104
- election and membership of, 102–4
- health functions, 294
- population of, 150–5
- powers of, 102
- rating and valuation, 499–500, 798, 799
- roading, 659–60, 661
- Local Authorities Loans Board, 801–2
- Local government, 97–104
- community, 101–2
- planning and, 502–5, 509–10
- reform of, 98–9
- regional, 100–1
- special purpose, 100
- territorial, 99–100
- Local Government Commission, 104
- Local government finance, 797–802
- borrowing, 801–2
- expenditure, 799–801
- income, 798–9
- income from rates, 798, 799
- revenue sharing, 799
- Local government regions, population of, 144, 145–6
- Lockouts, 459–61
- Logging,
- Forestry and logging
- Lotteries and lotto, 423–4
- funding from, 397, 424
M
- Maatua Whangai, 213
- Magazines, 416
- Magistrates’ Courts,
- District Courts
- Mail services, 668–72
- Mana Enterprises Scheme, 446
- Mana Motuhake Party, 73, 74
- Manila Treaty, 131
- Manufacturing industry, 603
- assistance to, 609–10
- census of, 612–9
- enterprises, 607
- geographical distribution of, 608
- historical development of, 35, 36, 44, 46–7, 603–6
- inter-industry studies, 814–5
- quarterly survey of, 611
- research for, 475–9
- selected production, 610–1
- standards, 487
- Maori, 208–16
- education of, 212–3, 223–4, 342, 349, 353
- employment and training of, 213
- health of, 213
- housing, 169–71, 626
- tribal developments and locations, 213–5
- unemployment among, 441
- women, 187, 216
- Maori Affairs, Board of, 494–5
- Maori Affairs, Department of, 82, 212–3, 214, 216, 494–5
- Maori community officers, 214, 216
- Maori Community Services Programme, 214, 216
- Maori Council, New Zealand, 214, 216
- Maori Education Foundation, 342
- Maori Enterprise Development Scheme, 213–4
- Maori electorates, 70–3
- Maori history,
- pre-European, 22–4
- 1770–1890, 26–7, 31–4, 36–7
- 1890 to present day, 44–5, 51–2
- Maori land, 28, 29, 31–4, 36, 37, 40, 45, 494–5, 496
- Maori Land Court and Maori Appellate Court, 378, 494–5
- Maori language, 217–227
- Commission, 217, 224–5
- current use, 217, 219–24
- fostering use of, 225–7
- origins, 218–9
- structure, 219
- Maori population, 208–11
- age distribution of, 208–9
- birth and death rates of, 208, 210–11
- geographical distribution of, 209–10, 225
- historical, 26, 31, 37, 44, 209
- households, 169–70
- infant mortality in, 312–3
- life expectancy, 211
- sex ratio of, 210
- Maori trust boards, 213–4
- Maori wardens, 216
- Maori Women's Secretariat, 184, 186
- Maori Women's Welfare League, 214, 216
- Mapping, 489, 490
- Marine pollution, 649
- Marital status, 177–9
- Maritime parks and reserves, 512
- Maritime planning, 503, 504–5
- Marketing, authorities for agricultural products,
- apples and pears, 552–3
- dairy products, 543
- kiwifruit, 553
- meat, 532–3
- poultry, 546
- wool, 537–9
- Marriage and marriages, 177–83
- age at, 179–80
- dissolution of, 181–2
- guidance, 180
- rates of, 177–8
- Maternal deaths, 313
- Maternity benefits, 265, 272
- Maternity leave, 465
- Meat and meat products, 531–6, 546
- beef, 535
- chicken, 546–7
- exports, 532–4
- grading of, 534–5
- pigmeats, 531
- prices, 535–6
- processing, 531–2
- sheepmeats, 531–2, 533–4, 536
- veal, 535
- Media, 411–7
- advertising, 416–7
- magazines, 416
- newspapers, 415–6
- radio, 413
- television, 412
- Mediation Service, 455
- Medical Council, 296
- Medical insurance, 291, 695–6
- Medical laboratory technologists, 298–9
- Medical practitioners, 296
- Medical radiation technologists, 298
- Medical Research Council, 309
- Medicines, control of, 300
- Members of Parliament, 65–8
- listed, 67–8
- salaries and allowances, 65–6
- Mental health, 303
- Merchant banks, 762
- Merchant navy qualifications, 647
- Mergers, 684–5
- Metals, 594–6
- gold, 596
- iron and ironsands, 594
- Meteorology,
- Climate
- Meteorological Service, 84
- Metric system, 830
- Middle East, relations with, 111–2, 732
- Migration,
- external,
- External migration, Immigration
- internal, 142–5,
- Milk and milk products
- (Dairy products), 541–5
- Minerals and mineral products, 592
- coal, 580, 592–3
- metallic, 594–6
- non-metallic, 596–8
- production, 594
- Miners’ benefits, 258, 260, 262, 263
- Minimum wage, 464
- Mining, 592
- laws on, 505, 509–10
- and quarrying, census of, 598, 600–1
- safety and working conditions, 337
- Ministers of the Crown,
- list of, 69–70
- salaries and allowances of, 65–6
- responsibilities of, 69–70
- Ministry for the Environment, 79
- Ministry of Agriculture and Fisheries, 78, 480–3, 527–8
- research by, 480–3
- Ministry of Civil Defence, 332–3
- Ministry of Commerce, 83, 717
- Ministry of Consumer Affairs, 679–80
- Ministry of Defence, 78, 127–9
- Ministry of Energy, 79, 337–8, 576
- Ministry of External Relations and Trade, 120, 717
- Ministry of Foreign Affairs, 79, 120
- overseas posts, 121–3
- Ministry of Forestry, 79, 483–4, 555
- Ministry of Pacific Island Affairs, 229–30
- Ministry of Transport, 84, 337, 647–9, 649–50, 664–6
- Ministry of Women's Affairs, 84, 184–7
- Monetary policy, 764–6
- Money, 764–7
- Monopolies, 684–5
- Mortality, See Deaths and death rates
- Mortgages, 629–30
- Housing Corporation, 80, 626–9
- housing, loans for, 626–30
- Motor spirits, duty on, 660, 792
- Motor vehicle industry, 604–5
- Motor vehicles, 662–3
- registration and licensing, 662–3
- inspection, 665
- Motorways, 660–1
- Mountains, 2, 10, 12
- formation of, 4–6
- Multiple births, 158
- Multilateral assistance, 113–5
- Murder, 381, 385–6
- Museums and art galleries, 403
- Mutton, 531, 532, 535
N
- Narcotics,
- Drugs
- National Accounts, New Zealand System of (NZSNA), 808
- National Acoustics Centre, 302
- National Advisory Council on the Employment of Women, 436–7
- National anthems, 103
- National Archives, 404–5
- National Art Gallery, 403
- National disposable income, 809, 812, 813
- National Drug Intelligence Bureau, 395
- National Film Library, 358
- National gross equalised capital value, 500
- National Health Institute, 308
- National Health Statistics Centre, 309
- National Housing Commission, 622
- National identity, rise of, 41, 49
- National Library of New Zealand, 407–10
- National Licensing Poll, 74
- National Museum, 403
- National parks
- administration of, 510
- history of, 510–2
- listed, 512–3
- National Party, 45, 48–9, 73–4
- National Poisons and Hazardous Chemicals Information Centre, 302
- National Provident Fund, 279–81
- National Radiation Laboratory, 302–3
- National Roads Board, 659–61
- National Roads Fund, 660–1, 782, 784
- National superannuation, 258, 263, 265, 266, 270, 271
- Natural gas, 579–80, 591–2
- Natural increase, of population, 139, 162, 208, 209, 270, 271
- Nature Conservation Council, 516
- Nature reserves, 514
- Navy, Royal New Zealand, 133–4
- New Zealand Apple and Pear Marketing Board, 552–3
- New Zealand Army, 134–5
- New Zealand-Australia Closer Economic Relations Trade Agreement (CER), 109–10
- New Zealand Bibliographic Network, 410
- New Zealand Certificate, 369
- New Zealand Council for Educational Research, 341–2
- New Zealand Council of Trade Unions, 459
- New Zealand Dairy Board, 543
- New Zealand Democratic Party, 73, 74
- New Zealand Employers’ Federation, 459
- New Zealand Employment, 445
- New Zealand Export-Import Corporation, 719
- New Zealand Film Commission, 400
- New Zealand Fire Service, 334–5
- New Zealand Fishing Industry Board, 572
- New Zealand Forestry Corporation Ltd, 75, 495, 556–7
- New Zealand Government, the, 69–70
- New Zealand Government stock and securities, 767–9
- New Zealand Historic Places Trust, 403, 516
- New Zealand Household Expenditure and Income Survey, 172-5
- New Zealand Import-Export Corporation, 719
- New Zealand Institute of Economic Research, 484-5
- New Zealand Land Resources Inventory, 508
- New Zealand Listener, 411-2
- New Zealand Literary Fund, 400
- New Zealand Lottery Board, 423-4
- New Zealand Lotteries Commission, 423
- New Zealand Maori Council, 214, 216
- New Zealand Market Development Board, 719
- New Zealand Meat Producers Board, 532-3
- New Zealand Milk Authority, 542
- New Zealand Party, 73, 74
- New Zealand Planning Council, 85
- New Zealand Police, 82, 285, 393-5
- New Zealand Ports Authority, 646
- New Zealand Post Ltd, 75, 668-72
- New Zealand Poultry Board, 546
- New Zealand Railways Corporation, 75, 656-8
- New Zealand Sports Foundation, 419
- New Zealand Symphony Orchestra, 399-400
- New Zealand System of National Accounts (NZSNA), 808
- Consolidated accounts of the nation, 812
- definitions, 809-12
- New Zealand Time Service, 19-20
- New Zealand Tourist and Publicity Department, 83, 429
- New Zealand Tourism Council, 429
- New Zealand Tourist Industry Federation, 429
- New Zealand Trade Certification Board, 369-70
- New Zealand Walkway Commission, 515-6
- New Zealand Wars, 29-30, 32-4
- New Zealand Wool Board, 537-9
- New Zealand Workers Educational Association (WEA), 372
- New Zealand's overseas posts, 120-3
- Newspapers and magazines, 415-6
- Niue, relations with, 108-9
- Noise, 302
- Nominal Weekly Wage Rates Index, 453
- North America, relations with, 110-1 729-30
- North Island, population of, 142, 143
- Nuclear Free Zone (New Zealand), 116
- Nurses, and nursing services, 296, 302
- NZSNA (New Zealand System of National Accounts), 808
O
- Occupations, 439-40
- immigration by, 205-6
- Occupational safety and health, 301-2, 336, 466
- Advisory Council for occupational safety and health, 336
- in factories, 336
- Occupational therapists, 297
- Occupied land, 508,
- OECD (Organisation for Economic Co-operation and Development), 119-20
- Official Development Assistance (ODA), 112-5
- Official information, 86-7
- Ohu Whakatupu, Te (Maori Women's Secretariat), 184, 186
- Oil, 578-9, 588-90
- Ombudsmen, 87-8
- Optometrists and opticians, 297
- Organisation for Economic Co-operation and Development (OECD), 119-20
- Orphans’ benefits, 259, 262, 263
- Outdoor leisure activities, 421-2
- Overseas aid, 112-5
- Overseas balance of payments, 822-8
- Overseas debt, 794-6
- Overseas exchange transactions, 769-73, 826-7
- Overseas investment, in New Zealand, 609
- Overseas students, 364
- Overseas trade,
- External trade
P
- Pacific countries, relations with, 108-10, 727-8
- Pacific Forum Line, 109
- Pacific Island Affairs Advisory Council, 230
- Pacific Island Affairs Unit, 230
- Pacific Island Employment Development Scheme, 446
- Pacific Island Polynesian Education Foundation, 342
- Pacific Island Polynesian population, 228-9
- age distribution of, 228-9
- geographical distribution, 229
- households and dwellings, 169, 170, 171, 626
- unemployment, 444
- Pacific Islands Industrial Development Scheme (PIIDS), 108-9, 609-10
- Paper, 563-4
- Parental leave, 465
- Parks, 513-4
- forest, 513-4
- national, 510-6
- Parliament, 57, 59-60, 61-2, 64-5
- establishment of, 30
- members of, 66-8
- opposition, 62
- proceedings of, 65
- salaries and allowances of members, 65-6
- sessions of, 64
- Parliamentary Service, 65
- Parliamentary Commissioner for the Environment, 505
- Parliamentary Library, 410-11
- Parole system, 393
- Partnerships, 684
- Part-time work, 437
- Passports, 81, 205
- Pastoralism, history of, 34, 38, 39
- Patents and trade marks, 485-6
- Patients, hospital, 318-24
- Pay, fixing rates of, 461-
- PAYE tax, 785
- Penal system, 387
- corrective training, 389, 391
- fines, 388
- imprisonment, 389
- parole system, 393
- prisons and prisoners, 389-93
- probation, 393
- reparation, 388
- Pensions,
- Benefits and pensions
- Superannuation
- Performing arts, 398-400
- Perinatal mortality, 312
- Periodic detention, 388
- Permits, building and construction, 532-4
- Personal services, 710-1
- Petroleum, 578-9, 588-90
- consumption, 577-8
- processing and distribution, 588-91
- prospecting and drilling, 591
- Pharmaceutical benefits, 272, 274
- Pharmacists, 298
- Physiotherapists, 296-7
- Physiotherapy benefits, 273
- Pigmeats, 531
- Pigs, 546
- Planning, 502-5, 509-10
- district, 504
- maritime, 504-5
- New Zealand Planning Council, 85
- permission for building, 630
- regional, 503-4
- Planning Tribunal, 378
- Plant breeders’ rights, 550
- Plants,
- Vegetation and wildlife
- Plastics industry, 605
- Play centres, 347, 352, 353
- Plumbers, gasfitters and drainlayers, 297-8
- Podiatrists, 297
- Poisons, 301-2
- Police, New Zealand, 82, 285, 393-5
- Political parties, 73-4
- Pollution, air, 299-300, 509
- water, 508-9, 649
- Polynesians, See Pacific Island Polynesians
- Population, 138
- age distribution, 140-1, 165
- Migration
- Pacific Island Polynesian population
- birthplaces, 190-1
- Migration
- Pacific Island Polynesian population
- change in, 139-40, 144
- Migration
- Pacific Island Polynesian population
- ethnic groups in, 188-90, 199
- Migration
- Pacific Island Polynesian population
- geographical distribution of, 141-55
- Migration
- Pacific Island Polynesian population
- of local governments regions, 144, 145-6
- Migration
- Pacific Island Polynesian population
- Maori, See Maori population
- Migration
- Pacific Island Polynesian population
- marital status of, 177-9
- Migration
- Pacific Island Polynesian population
- migration
- Migration
- Pacific Island Polynesian population
- Polynesian
- Pacific Island Polynesian population
- projections of, 164-5
- religious professions of, 187-8
- rural, 149
- sex ratio in, 139, 158
- urban, 146, 148-9
- Ports, 644-6
- Postal services, 668-72
- Post Office Bank Ltd, 75, 761
- Poultry and eggs, 546-7
- Pre-school education and childcare, 184, 282, 347-8, 352, 353
- Kohanga reo programme, 212-3, 223-4, 347
- Preventive detention, 389
- Prevailing Weekly Wage Rates Index, 452-3
- Price indexes, 744
- Capital Expenditure Price Index, 754-6
- Consumers Price Index, 744-9
- Export Prices Index, 740-1, 742
- Farming Inputs Price Index, 526
- Import Prices Index, 741, 742
- Producers Price Index, 752-4
- Terms of Trade Index, 741-2
- Urban House Property Price Index, 623-4
- Prices, 744
- farm products, 535-6, 539, 545
- housing, 623-4
- international comparison, 749
- retail trade, 749-52
- Primary schools, 342-3, 347-8, 350, 352, 353
- Prime Minister, 63
- Governor-General powers, 57-8
- Office of the, 82
- Salary and allowances, 65-6
- Prisons and prisoners, 389
- institutions, 390
- classification and treatment, 392-3
- numbers of prisoners, 390-1
- Private hospitals, 315-6
- Private savings banks, 762
- Private schools, 341, 352-3
- Privy Council, Judicial Committee of, 374-5
- Probation,
- Supervision ordered by courts
- Producers Price Index, 752-4
- Production accounts, 816, 819
- Protected Natural Areas Programme, 515
- Provinces, history of, 30, 31, 35
- Psychiatric hospitals, 272, 321-4
- deaths, 324
- diagnoses, 323-4
- patient numbers, 322
- Psychological services and psychologists, 296, 392
- Public accounts, 774, 777-84
- Public broadcasting fee, 412
- Public debt, 794-7, 801-3
- interest on, 796
- maturity of, 796
- per capita, 795
- securities on issue, 768-9, 796-7
- transactions, 797
- Public health, 299
- Public holidays, 464-5
- Public lands
- Crown land, 489, 495-8
- forests, 495-6, 555-7
- national parks, 510-3
- Queen Elizabeth II National Trust, 516
- walkways, 515-6
- Public Service, See Government departments, State sector
- Public Trust Office, 82, 690
- Publishing, books, 406-7
- newspapers and magazines, 415-6
- Pulp and paper, 563-4
Q
- Quality management, 610
- Quangos, 84-5
- Quarantine, 294, 563
- Quarries and quarrying,
- Mining
- Quarterly Economic Survey of Manufacturing, 611
- Quarterly Employment Survey, 432, 448-9
- Quarterly Survey of Retail Trade, 700-3
- Queen Elizabeth II Arts Council, 397-9
- Queen Elizabeth II National Trust, 516
R
- Race relations and racial discrimination, 183-4, 217, 252
- (Ethnicity)
- Racing, horse and greyhound, 422-4
- taxation, 792
- Radiation protection, 302-3,
- Radio, 413-4
- Radiologists, 298
- Railways, 656-8
- construction and engineering, 656-7
- New Zealand Railways Corporation, 75, 656-8
- services, 657
- Rainfall, 10-1, 12-3
- Raoul Island, 2
- Rapu Mahi/Hanga Mahi programme, 213
- Rates, local authority, 499-500
- Real disposable income indexes, 449-52
- Receivership, 689-90
- Recreation and sport, 417-24
- Hillary Commission for, 418
- provision for, 418-9
- Recreation reserves, 515
- Redundancy, 465-6
- Refinery, petroleum, 588-9
- Reform political party, 40, 41
- Refugees, 196-7, 198, 202, 206
- Regional Development Investigation Grant Scheme, 609
- Regional government, 100-1
- Regional planning, 503-4
- Regional water boards, 506
- Registered banks, 759-61
- Rehabilitation, 308
- after accidents, 324
- of war veterans, 267
- Religious professions of population, 187-8
- Rental housing, 624-5
- Reparation ordered by courts, 388
- Representation Commission, 73
- Reproduction rates, 158, 210-1
- Research, scientific, 469
- Department of Scientific and Industrial Research, 82, 470-80
- expenditure on, 469-70, 479-80
- Science and Technology Advisory Committee, 469-70
- Reserve Bank of New Zealand, 46, 758-9
- Reserves, land, 514-5
- Resource conservation, See Conservation of natural resources
- Rest homes, 261, 275
- Restaurants and hotels, 681-3, 709-10
- Retail prices, 749-52
- Retail trade, 700-3
- credit, 703-4
- top trading hours, 680-1
- Rivers, 2-3, 505-7
- Roads, 658-61
- expenditure on, 660, 661, 782
- National Roads Board, 659-61
- safety, 327, 329, 664-6
- speed limits, 666
- taxes for, 660, 792, 794
- Rock aggregate, 596
- Rocks, types of,
- Geology
- Ross Dependency, 2, 127
- Royal commissions, 74
- Royal Commission on Social Policy, 231
- organisation of, 232-6
- submissions to, 232-5
- summary of findings, 236-53
- terms of reference, 231-3
- Royal New Zealand Air Force, 135-6
- Royal New Zealand Navy, 133-4
- Rural Banking and Finance Corporation, 82, 763-4
- Rural education activities programmes (REAPs), 357
- Rural Electrical Reticulation Council, 588
- Rural population, 149
S
- Safety, 324
- fire, 334-5
- occupational, 336-7
- road, 327, 329, 664-6
- of ships, aircraft, cranes, 337
- Salaries,
- Wages
- Salt, 598
- Sand dunes, 19
- Satellites, 674
- Savings institutions, 761-2
- Post Office Bank Ltd, 75, 761
- private savings banks, 762
- trustee banks, 761-2
- Scenic reserves, 514
- School Certificate, 348-9, 350
- School Dental Service, 307
- Schools
- committees and boards, 340
- correspondence, 352, 368-9
- curriculum, 348
- primary, 342-3, 347-8, 350, 352, 353
- private, 341, 352-3
- pupils of, numbers, 352-3, 354
- secondary, 348-50, 350-4
- transport to, 355
- Science and scientific services, 469-87
- expenditure, 470, 479-80
- Scientific and Industrial Research, Department of, 82, 470-80
- Scientific reserves, 514
- SCOPE (Small Co-operative Enterprises Scheme), 446
- Search and rescue operations, 131, 394
- Secondary schools, 348-50, 350-4
- Securities Commission, 686
- Securities, government, 767-9, 796-7
- Security Intelligence Service (SIS), 136-7
- Seddon, Richard John, 38, 40
- Seismic activity, 3-4, 6-9
- Sentencing, on conviction, 386
- Services, Census of, 694-700, 711-6
- Settlement, of New Zealand, 22-3, 25-9
- Share market, 685-7
- Sheep, and sheep farming, 528, 530, 534-5
- Sheepmeats, 531-2, 533-4, 536
- Shipping, 639-49
- coastal, 642, 643
- Cook Strait ferries, 642, 658
- register of, 646-7
- to overseas markets, 641-2, 643-6
- services to, 646-9
- Shipping Corporation of New Zealand, 75, 641, 642
- Ships, 646-7, 648-9
- fishing vessels, 571
- Shipwrecks, 647-8
- Shop trading hours, 680-1
- Sickness benefits, 260-1, 262, 263, 271
- SITC (Standard International Trade Classification), 738-40
- Sixth Form Certificate 349, 350
- Skiing, 422
- Skim milk and skim-milk powder, 541-2
- Small Claims Tribunal, 377
- Small Co-operative Enterprises Scheme (SCOPE), 446
- Snow, 12
- Social Credit Party,
- New Zealand Democratic Party
- Social history, 1840-1935, 37-44
- 1935 to present day, 45-51
- Social Policy, Royal Commission's recommendations on, 236
- the disabled, 252-3
- education, 249
- the elderly, 253
- employment, 241-2
- energy, 251
- funding social services, 244-6
- health, 248-9
- housing, 449-50
- income maintenance and taxation, 242-4
- justice 250-1
- mass media, 251-2
- paid and unpaid work, 238, 239, 240-1
- policy making and participation, 240-1
- removal of discrimination, 252
- transport, 251
- Treaty of Waitangi, 237-8
- women, 238-40
- youth, 253
- Social sciences, 476
- Social welfare, 256
- benefits,
- Benefits and pensions
- Department of, 82, 256-7, 281
- system, 256-7
- Social work, 263-4, 281-5, 287-8
- Soil erosion, 505
- Soil types, 501-2
- South and Central America, relations with, 110-1, 730
- South Island, population of, 142, 143
- South Pacific countries, relations with, 108-10, 727-8
- South Pacific Bureau for Economic Co-operation (SPEC), 109
- South Pacific Commission, 109
- South Pacific Forum, 109, 727
- South Pacific Regional Trade and Economic Co-operation Agreement (SPARTECA), 108, 728
- Soviet Union, relations with, 111, 732
- Speaker of the House of Representatives, 62, 63, 65–6
- Special education, 355, 356
- Special articles,
- New directions in social policy, 231–53
- New Zealand's immigration policy, 193–207
- Te reo Maori, 217–27
- Special-purpose authorities, 97, 100
- Sports, 417–21
- Olympic and Commonwealth Games, 421
- participation in, 419–21
- provision for, 418–9
- Stamp duty, 791
- Stamp issues, 670
- Standard International Trade Classification (SITC), 738–40
- Standards of living, international indicators, 175, 177
- Standards Council, 487
- Standing Orders of the House of Representatives, 62
- State forests, 495–6, 555–7
- State Insurance Office, 82, 691–2
- State-owned enterprises, 75, 775–6
- Air New Zealand, 75, 652, 653
- Airways Corporation, 75, 650, 652
- Coal Corporation, 75, 592
- Electricity Corporation, 75, 582–6
- Government Computing Service, 75
- Government Property Services, 75
- Land Corporation, 75, 495, 497–8
- New Zealand Forestry Corporation, 75, 495, 556–67
- New Zealand Post, 75, 668–72
- Post Office Bank, 75, 761
- Railways Corporation, 75, 656–8
- Shipping Corporation, 75, 641, 642
- Telecom Corporation, 75, 672–4
- Tourist Hotel Corporation, 75
- Works and Development Services Corporation Limited, 75
- State sector, 75
- recent reform of, 75–6
- State Services Commission, 76
- Statistics, Department of, 82–3
- Statute of Westminster, 48
- Statutes, 64–5, 89–97
- Statutory bodies, boards, and committees, 84–5
- Steel, 606
- Stillbirths, 161, 312
- Stock and station agents, 763
- Stock change, by production group, 810, 818
- Stock exchange, 685–7
- Strikes, 459–61
- Students 349–50, 352–4, 361–8
- disabled, 355
- Maori, 353
- numbers, 352–3, 354, 356–7, 361, 365, 367–8
- overseas, 364
- part-time, 365–7, 368
- primary school, 350, 352
- projected numbers of, 354
- teachers college, 356–7
- technical, 367–70
- university, 361–7
- Sunshine, 11, 12–3
- Superannuation, 275, 698–9
- Government Superannuation Fund, 276–9
- National Provident Fund, 279–81
- National superannuation, 258, 263, 265, 266, 270, 271
- Supervision ordered by courts, 388, 389
- Supreme Court,
- High Court
- Survey and Land Information, Department of, 83, 489–90, 497
- Survey Board, 490
- Surveys, land, 489–90
T
- TAB (Totalisator Agency Board), 423
- Tariff (customs), 720–1
- Tasman, Abel, 24–5
- Taxation review authorities, 792
- Taxes and taxation, 784
- Average Tax Rates Index, 451–2
- company income tax, 789–90, 794
- estate duty, 790–1
- excise duties, 721
- fringe benefit tax, 789
- gift duty, 791
- goods and services, 790
- land tax, 790
- personal income tax, 784–9
- racing taxation, 792
- revenue from, 792–4
- roads taxation, 660, 792, 794
- stamp duty, 791
- Teachers and teaching, 354, 355–9
- resources for, 357–9
- Teachers colleges, 355–7
- Technical education, 369–71
- Technical Correspondence Institute, 368–9
- Tectonic plates, 3–4, 8
- Telecom Corporation of New Zealand Ltd, 75, 672–4
- Telecommunications, 672–4
- Telegrams, 673
- Telephone services, 672–3
- Television, 412–3
- Telex services, 673
- Temperatures, air, 11, 12, 13–4
- Tenancy, 625
- Tenancy Tribunal, 625
- Terms of Trade Index, 741–2
- Territorial authorities, 99
- boroughs and city councils, 99
- county councils, 99
- district councils, 99
- finances, 797–802
- town councils, 99
- Territories, New Zealand,
- Ross Dependency, 2, 127
- Tokelau, 2, 108–9, 126–7
- Tertiary study grants, 362, 364
- Textiles industry, 606–7
- (Wool)
- Thermal generation of electricity, 583–5
- Thunderstorms, 11
- Timber and forest products, 561
- exports of, 565–7
- imports of, 566
- production of, 563–5
- Timber preservation, 563
- Time, 19–20
- Tokelau, 2, 108–9, 126–7
- Topdressing, 523–4, 656
- Tornadoes, 11–2
- Totalisator Agency Board (TAB), 423
- Tourism, 424–30
- accommodation, 427
- domestic, 428–9
- international, 427–8
- promotion, 429–30
- Tourist and Publicity Department, New Zealand, 83, 429
- Tourist Hotel Corporation of New Zealand, 75
- Town districts, population of, 155
- Town milk supply, 542
- Toxic substances, 301–2
- Trade, 108
- domestic,
- Domestic trade
- External trade
- external,
- External trade
- historical, 25–6, 35–6, 41, 43, 46–7
- terms of, 741–2
- Trade and Industry, Department of, 83, 609–10, 668, 680, 685, 717
- Tradecom, 717–9
- Trade marks, 485–6
- Trade organisations and agreements, 117–8
- Trade practices, 684–5
- Trade representatives overseas, 120–3, 717
- Trade routes, maritime, 641–2, 644
- Trade training, 369–70
- apprentices, 369–70, 441
- technical education, 369–71
- Trades Certification Board, 369–70
- Vocational Training Council, 441
- Trade unions, 457–9
- Trading banks, 760–1
- Trading legislation, 679–83
- Traffic,
- accidents, 327–9
- offences, 383–4, 666–8
- safety, 327, 329
- Training, vocational, 369–71, 441–2
- Vocational Training Council, 441
- Transport 639
- air, 649–56
- Census of Transport, Storage and Communication, 674–6
- household expenditure on, 171–2, 173, 174
- licensing, 658
- Ministry of, 84, 337, 647–9, 649–50, 664–6
- rail, 656–8
- road, 658–68
- sea, 639–49
- to work, 663–4
- Travel, domestic, 428–9
- Treasury, 84
- Treaties,
- defence agreements, 130–1
- trade agreements, 116, 118
- Treaty of Waitangi, 28, 44, 57, 58, 211–2, 494, 496
- Trial courts, 384–7
- Triparite wage conference, 462
- Trustee banks, 761–2
- Tu Tangata programme, 212–3
U
- Unemployment
- benefits, 258, 260, 262, 263, 265, 271
- ethnicity and age of, 441
- history of, 42, 443–4
- policies and programmes, 445–6
- school qualifications and, 445
- Unions, of employers, 459
- Unions, of workers, 39, 40, 41, 457–9
- United councils, 100–1
- United Nations Education, Scientific and Cultural Organisation (UNESCO), 117
- United Nations, New Zealand membership of, 115–6, 117
- United States of America, relations with, 110–1, 729–30
- Universities, 343, 359–67
- extension programme, 371
- graduates from, 360, 361–2, 363
- scholarships and bursaries to, 362, 364
- staff in, 365
- students in, 361–7
- Urban areas, 146
- population of, 146, 148–9
- transport in, 658
- Urban House Property Price Index, 623–4
- Urban Transport Council, 658
V
- Valuation New Zealand, 84, 499–500, 623
- Valuation of land, 498–500
- Valuers, registration of, 500
- Values Party, 74
- Vegetables, 550
- Vegetation and wildlife, 14–19
- exotic, 15, 17–18, 19
- origins of, 14–5
- native, 15–9
- Video Recording Authority, 402
- Videotex, 674
- Vital statistics, 157–64
- (Births and birth rates)
- (Deaths and death rates)
- (Marriage)
- Viticulture, 551–2
- Vocational guidance, 445
- Vocational Training Council, 441
- Vogelism, 35, 194
- Volcanoes, 3, 4, 6–7, 9
- Volume Index of External Trade, 742–3
- Voluntary welfare organisations, 275
- Voting,
- Elections
W
- Wages, 448–9, 452–3, 464
- Nominal Weekly Wage Rates Index, 453
- Prevailing Weekly Wage Rates Index, 452–3
- Real Disposable Income Indexes, 449–52
- Waitangi, Treaty of, 28, 44, 57, 58, 211–2, 494, 496
- Waitangi Tribunal, 212
- Wakefield settlements, 28, 29, 34, 193–4
- Walkways, 422, 515–6
- War, New Zealand's participation in, 41, 47
- Wars, New Zealand, 29, 30, 32–4
- War pensions and allowances, 267–9
- Water and soil conservation, 505–8
- Water pollution, 508–9
- Water supply, 505–7
- catchment authorities, 507
- fluoridation of, 308
- irrigation, 506–7
- regional water boards, 507
- WEA (New Zealand Workers Educational Association), 372
- Weights and measures, 830
- Western Samoa, 108, 109
- Wholesale trade, 707–8
- Widows’ benefits, 258, 262, 263
- Wildlife,
- Vegetation and wildlife
- Wildlife reserves, 515
- Winds, 10
- Wine and winemaking, 551–2
- Women, 238–40
- health of, 304
- in the labour force, 186, 435–7
- Maori, 187, 214, 216
- members of Parliament, 67–8
- Ministry of Women's Affairs, 84, 184–7
- ratio in population, 139, 158
- removal of discrimination against, 184–6
- Wood,
- Timber and forest products
- Wool, 537–41
- exports, 539–41
- International Wool Secretariat, 539
- New Zealand Wool Board, 537–9
- prices, 538–539
- production, 537
- Wool Research Organisation, 538
- Wool Testing Authority, 538
- Work development scheme, 446
- Work stoppages, 459–61
- Working conditions, 463–7
- (Occupational safety and health)
- Working hours, 464
- Works and Development Services Corporation, 75
- World Bank, 116, 117, 118
- World Health Organisation, 117, 310
- Wrecks, 647–8
Y
- Youth, programmes,
- Community welfare services