
ACKNOWLEDGMENT
This publication was produced in the Information Services Division of the Department of Statistics.
Assistant Government Statistician: L. W.
Cook.
Director: F. F.
Knight.
Editor: S. M.
Antill.
Graphic Designer: H. G.
Verhagen.
FURTHER INFORMATION
Further sources of information, given at the end of each section or subsection, refer generally to official sources, especially Parliamentary papers, statistical reports, and other publications of Government departments. These can usually be consulted in the principal public libraries (Parliamentary papers, for example, are collected in annual volumes entitled Appendix to the Journals of the House of Representatives) or can be purchased from Government bookshops. Where difficulty is experienced in obtaining publications the Government department or other organisation responsible should be consulted.
Other publications giving fuller information on many of the subjects mentioned in the Yearbook may be found listed in the select bibliography of New Zealand books near the back of the Yearbook.
NEW ZEALAND OFFICIAL
YEARBOOK PRICE
(N.Z.) $19.50 + p. & p.
CAT. NO. 01.001
ISSN
0078–0170
Table of Contents
This, the 89th edition, continues the long series of New Zealand Official yearbooks begun in 1893.
The contents of the Yearbook have changed over the years, reflecting the changes in New Zealand's people and their social and economic circumstances. The presentation has also changed as printing technology has developed.
One thing, however, has not changed. The original objective of the Yearbook was to present within the compass of a single volume an authoritative official reference work on New Zealand. This 1984 Yearbook continues the tradition of presenting reference information in the primary form of descriptive and expository text, but supported by statistical information where appropriate. The aim is to cater for the non-specialist in an authoritative and technically accurate manner which also caters in part for specialist needs.
The Yearbook enjoys a very wide use, both in New Zealand and overseas. Catering for the diverse reader needs poses a difficult problem of selection of subject-matter material over a very wide range of topics. The Yearbook must be regarded, as a consequence, as an introductory reference work, with more specialist reference works having to be consulted for more extensive information. Achieving the correct balance of contents while keeping the Yearbook to a reasonable size and price can be a difficult process, but past acceptance of the Yearbook indicates that the department has been reasonably successful in this.
A sample survey of Yearbook subscription readership was conducted by the department during 1984. The wealth of information gathered will lead to some changes in future editions of the Yearbook. I express my appreciation to all those readers who responded to the survey.
The Yearbook is prepared and edited by the Department of Statistics, but significant portions of it are contributed by other Government departments, producer boards, the Reserve Bank and other official organisations.
I would like to thank all those involved in copy preparation, editing and printing of the 1984 Yearbook, with special mention of the contribution by the staff of the Government Printing Office.
S.
KUZMICICH,
GOVERNMENT
STATISTICIAN
Department of Statistics,
Wellington,
New Zealand.
September 1984.
SYMBOLS
The interpretation of the symbols used in the tables throughout this publication is as follows:
| − | nil or zero |
| .. | figures not available |
| not yet available—space left blank | |
| … | not applicable |
| - - | amount too small to be expressed |
| x | revised |
METRIC SYSTEM
The conversion of the system of weights and measures used in New Zealand to metric units was substantially completed by the end of 1976.
As far as possible, statistics in this issue have been converted to the metric system, but for various reasons, this has to be a gradual process extending over a number of years.
CONVERSION OF BRITISH (IMPERIAL) AND SI (METRIC) UNITS
Some relationships between common British units and common SI units are shown in the following table. Measures are rounded unless otherwise indicated.
| * Measure is exact. | |
|---|---|
| Length— | |
| 1 in. | = 25.4 mm* |
| = 2.54 cm* | |
| 1 ft | = 30.48 cm* |
| = 0.3048 m* | |
| 1 yd | = 0.9144 m* |
| 1 mile | = 1.6093 km |
| 1 mm | = 0.0394 in. |
| 1 cm | = 0.3937 in. |
| 1 dm | = 3.9370 in. |
| 1 m | = 39.3701 in. |
| = 1.0936 yds | |
| 1 km | = 0.6214 miles |
| Area— | |
| 1 sq ft | = 0.0929 m2 |
| = 929.030 cm2 | |
| 1, sq yd | = 0.8361 m2 |
| 1 acre | = 0.4147 hectare (ha) |
| 1 sq mile | = 2.5900 km2 |
| = 258.9988 ha | |
| 1 m2 | = 10.7639 sq ft |
| = 1.1960 sq yds | |
| 1 da | = 0.2471 acres |
| 1 ha | = 2.4710 acres |
| 1 km2 | = 247.105 acres |
| = 0.3861 sq miles | |
| Volume— | |
| 1 cu in. | = 16.3871 cm3 |
| l cu ft | = 0.0283 m3 |
| 1 cu yd | = 0.7646 m3 |
| 1 cm3 | = 0.0610 cu in. |
| 1 m3 | = 35.3148 cu ft |
| = 1.3080 cu yds | |
| Capacity— | |
| 1 pt | = 0.5683 litres |
| 1 qt | = 1.1365 litres |
| 1 gal | = 4.5461 litres |
| 1 litre | = 1.7598 pts |
| = 0.8799 qts | |
| = 0.2200 gal | |
| Weight— | |
| 1 oz | = 28.3495 grams (g) |
| 1 lb | = 0.4536 kilograms (kg) |
| 1 cwt | = 50.8024 kg |
| 1 long ton | = 1 016.0469 kg |
| = 1.016 tonnes (t) | |
| 1 g | = 0.0353 oz |
| 1 kg | = 2.2046 lb |
| 1 t | = 2 204.624 lb |
| = 0.9842 long tons | |
| = 1.1023 short tonnes | |
| Velocity— | |
| 1 mile per hour (mph) | = 1.609 kilometres per hour (km/hr) |
| 1 kilometre per hour (km/hr) | = 0.621 miles per hour (mph) |
| Pressure— | |
| 1 pound per sq in. (psi) | = 6.8948 kilopascals (kPa) |
| 1 kilopascal (kPa) | = 0.1450 pounds per sq in. (psi) |
| 1 ton per sq in. (ton/in.2) | = 15.444 megapascals (MPa) |
| 1 megapascal (MPa) | = 0.0647 tons per sq in. (tons/in.2) |
| Temperature— | |
| Degree Fahrenheit (°F) | = 9(°C+32)/5 |
| Degree Celsius (°C) | = 5(°F-32)/9 |
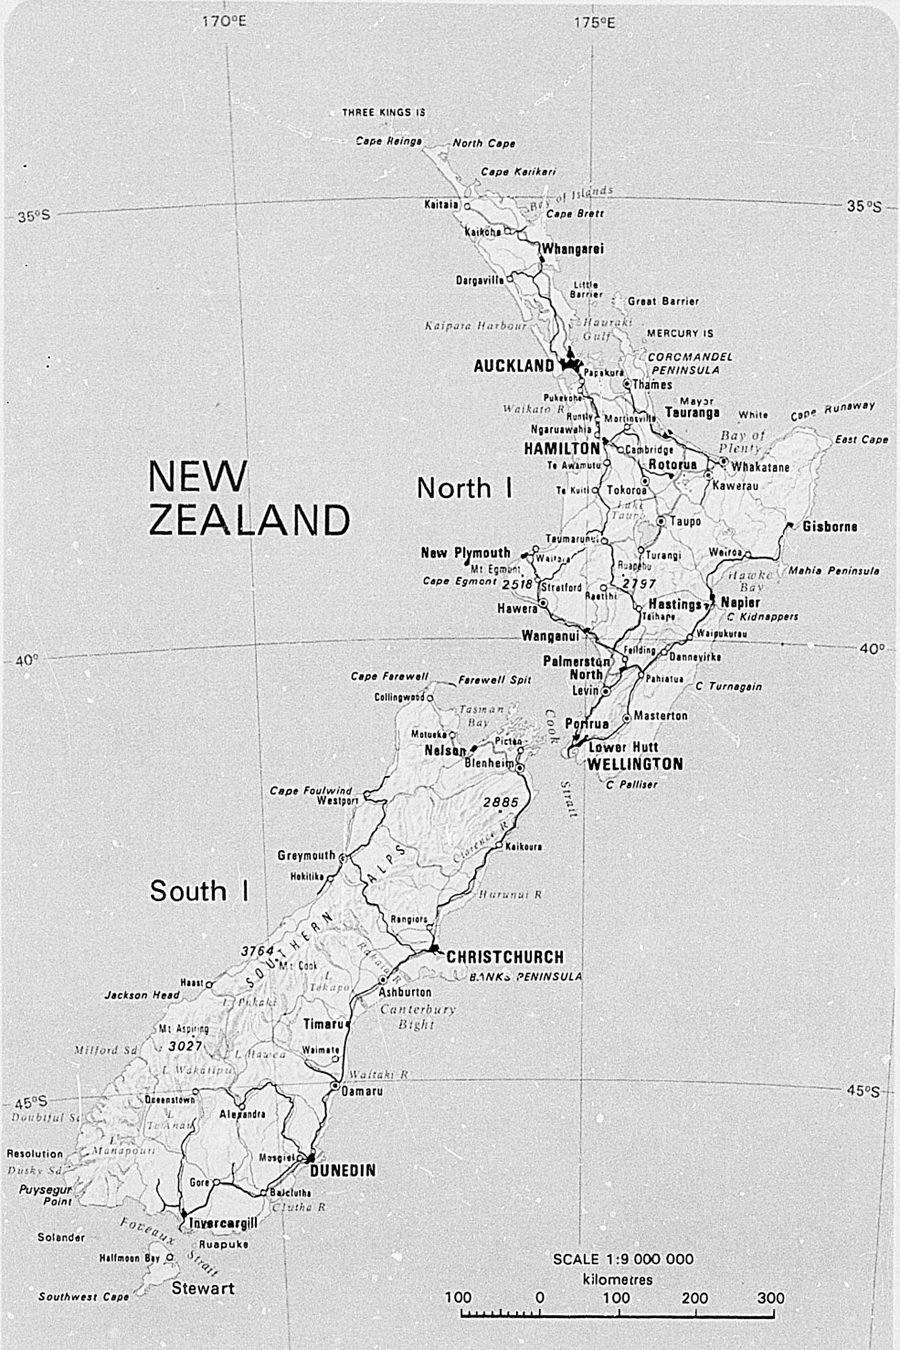
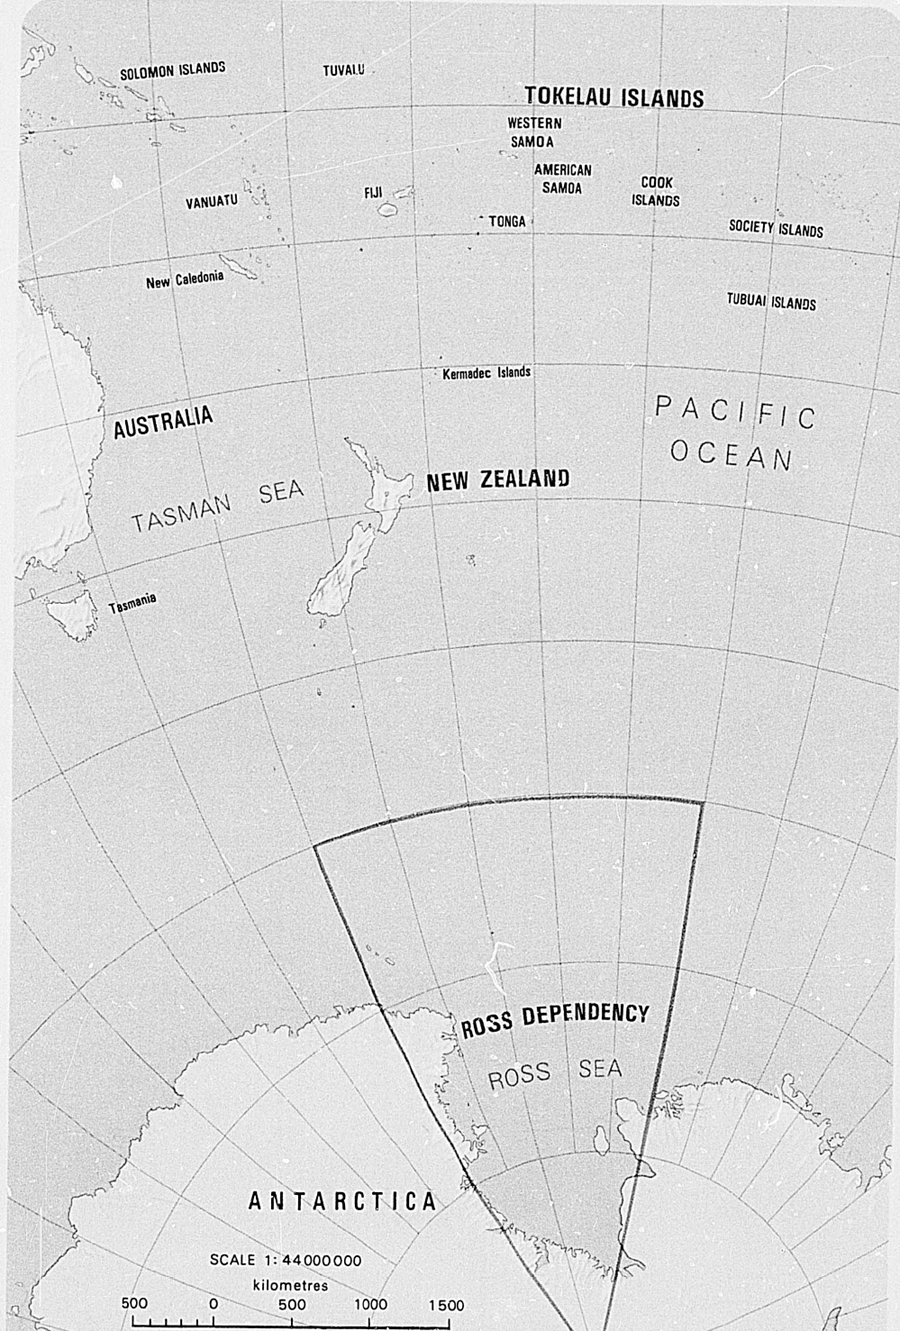
Table of Contents
Table of Contents
New Zealand is in the south-west section of the Pacific. To the west, beyond the Tasman Sea, is Australia, 1600 kilometres away. From its position on the rim of the Pacific basin, New Zealand is a little over 10 000 kilometres from San Francisco and Panama and a similar distance from Tokyo and Singapore. In area 26.9 million hectares, it is similar in size to the British Isles and Japan.
GEOGRAPHICAL POSITION—The islands of New Zealand have been shaped from the projecting crests of earth folds which rise as broad ridges from the floor of the South Pacific Ocean, 1600 kilometres east of the continent of Australia. There are three main islands—North, South, and Stewart separated only by relatively narrow straits—with adjacent islets and a small group called Chatham Islands, 850 kilometres to the east of Lyttelton. With the exception of the low-lying North Auckland peninsula, the New Zealand land mass lies along a south-westerly and north-easterly axis. Dating from 1842 the administrative boundaries of New Zealand, including the minor islands, extend from 33 degrees to 53 degrees south latitude and from 162 degrees east longitude to 173 degrees west longitude. Inhabited outlying minor islands are Raoul Island in the Kermadec Group, 930 kilometres north-east of the Bay of Islands, and Campbell Island, 590 kilometres south of Stewart Island.
The Ross Dependency, some 2300 kilometres to the south, has been under New Zealand's jurisdiction since 1923 and comprises the sector of the Antarctic continent between 160 degrees east and 150 degrees west longtitude, together with the islands lying between those degrees of longitude and south of latitude 60 degrees south. The land area of the Ross Dependency is estimated at 414 400 square kilometres.
The area of New Zealand can be classified as follows:
| AREAOF NEW ZEALAND | |
|---|---|
| (1 April 1983) | |
| Area in Square Kilometres | |
| North Island— | |
| Districts | 18,496 |
| Counties | 93 060x |
| Cities and boroughs | 3 060x |
| Town districts | 8 |
| Chatham Islands | 963 |
| Adjacent Islands not included in a territorial local authority— | |
| Three Kings | 7 |
| Little Barrier | 28 |
| Mayor | 14 |
| White | 4 |
| Other islands (Browns, Mokohinau, Motiti. Motuhora (Whale), etc.) | 16 |
| Other offshore islands—Kermadec | 34 |
| Total, North Island | 115 690x |
| South Island— | |
| Counties | 143 884x |
| Districts | 378 |
| Cities and boroughs | 600x |
| Stewart Island | 1,746 |
| Adjacent islands not included in a territorial local authority (Solander, etc.) | 4 |
| Other offshore islands— | |
| Inhabited—Campbell | 106 |
| Uninhabited—Auckland (612 km2), Snares (2 km2), Antipodes (22 km2), Bounty (2 km2) | 638 |
| Total. South Island | 152 356x |
| Total, North and South Islands | 268 046x |
| Ross Dependency (land area only) | 414,400 |
| Total, including Ross Dependency | 682 446x |
GEOGRAPHICAL FEATURES: Coastline—An overall length of more than 1600 kilometres, and a width up to 450 kilometres combine to provide New Zealand with a very lengthy coastline in proportion to its area.
The nature of the coastline has provided New Zealand with numerous sites for harbours although the size of shipping capable of using them varies with the locality. The development of the natural North Island harbours of Whangarei, Auckland, Tauranga, and Wellington and the dredging and breakwater constructions at the South Island harbours of Lyttelton, Timaru, Otago, and Bluff have produced ports suitable for overseas ships.
Strong ocean drifts and high seas along the west coast produce shoaling at river mouths and harbour entrances although New Plymouth is one port which has been developed to take overseas shipping. While artificial harbours have been built on the east coast of the North Island at Gisborne and Napier the large quantities of shingle brought down by the South Island rivers have strictly limited development in many South Island areas to small ports suitable for fishing and coastal shipping only.
Mountains—The mountainous nature of New Zealand is one of its most striking physical characteristics, with less than one-quarter of the land surface lying below the 200 m contour. In the North Island the higher mountains occupy approximately one-tenth of the surface; but, with the exception of the four volcanic peaks of Egmont (2518 m), Ruapehu (2797 m). Ngauruhoe (2290 m), and Tongariro (1968 m), they do not exceed an altitude of 1800 m. Of these four volcanoes only the first named can be classed as dormant. Ruapehu and Ngauruhoe have been particularly active from time to time. Other volcanoes include Mount Tarawera and White Island, each of which has, upon one occasion within historical times, erupted with disastrous consequences. Closely connected with the volcanic system are the multitudinous hot springs and geysers.
The mountain system of the North Island runs generally in a south-west direction, parallel to the coast, from East Cape to Turakirae Head, and includes the following ranges from the north: Raukumara, Huiarau, Ruahine, Tararua, and Rimutaka. This chain is flanked on the west between the Huiarau and Ruahine by the Ahimanawa, Kaweka, and Kaimanawa Ranges, while west of the Kaimanawa is the National Park volcanic group comprising Mounts Ruapehu, Ngauruhoe, and Tongariro. The Hauhangaroa and Rangitoto Ranges run in a northerly direction from the National Park group. In the east the Moehau Range parallels the length of the Coromandel Peninsula. Mount Egmont forms the only area above 1200 m on the west coast of the island.
The South Island is much more mountainous than the North. Along almost the entire length of the island runs the massive chain known as the Southern Alps, which attains its greatest height in Mount Cook (3764 m), while 19 named peaks exceed 3000 m. West and north-west of the main portion of the Southern Alps are the Victoria, Brunner, and Lyell Ranges and the Tasman Mountains, the Victoria Range being flanked by the Paparoa Range. To the north run the St. Arnaud and Richmond Ranges, while to the north-east are the Spenser Mountains and the Kaikoura and Seaward Kaikoura Ranges, the two latter ranges running parallel to the east coast. The south portion of the Southern Alps breaks up into a miscellany of ranges dominating the mountainous Fiord and north-western Southland regions.
There are at least 223 named peaks of 2300 m or more in altitude. Below is a list of the peaks restricted to the four largest volcanic cones in the North Island and to mountains of a minimum height of 2740 m in the South Island.
| Mountain or Peak | Height (metres) |
|---|---|
| NORTH ISLAND | |
| Ruapehu | 2,797 |
| Egmont | 2,518 |
| Ngauruhoe | 2,290 |
| Tongariro | 1,968 |
| SOUTH ISLAND | |
| Kaikoura Ranges— | |
| Tapuaenuku | 2,885 |
| Alarm | 2,877 |
| Southern Alps— | |
| Cook | 3,764 |
| Tasman | 3,497 |
| Dampier | 3,440 |
| Silberhorn | 3,279 |
| Lendenfeldt | 3,201 |
| Mt. Hicks (St. David's Dome) | 3,183 |
| Torres | 3,163 |
| Teichelmann | 3,160 |
| Sefton | 3,157 |
| Malte Brun | 3,155 |
| Haast | 3,138 |
| Elie de Beaumont | 3,117 |
| Douglas Peak | 3,085 |
| La Perouse | 3,079 |
| Haidinger | 3,066 |
| Minarets | 3,055 |
| Aspiring | 3,027 |
| Glacier Peak | 3,007 |
| Hamilton | 2,996 |
| De la Beche | 2,992 |
| Darwin | 2,961 |
| Chudleigh | 2,952 |
| Low | 2,942 |
| Haeckel | 2,941 |
| Aiguilles Rouges | 2,911 |
| Annan | 2,911 |
| Nazomi | 2,911 |
| Goldsmith | 2,905 |
| Walter | 2,903 |
| Conway Peak | 2,901 |
| Bristol Top | 2,898 |
| Grey | 2,893 |
| D'Archiac | 2,865 |
| Green | 2,850 |
| Hutton | 2,834 |
| Ronald Adair | 2,827 |
| Hochstetter Dome | 2,822 |
| Barnicoat | 2,819 |
| Earnslaw | 2,819 |
| Nathan | 2,804 |
| Sibbald | 2,798 |
| Arrowsmith | 2,795 |
| Spenser | 2,794 |
| The Footstool | 2,765 |
| Rudolf | 2,755 |
| The Dwarf | 2,751 |
| Darran Range— | |
| Tutoko | 2,756 |
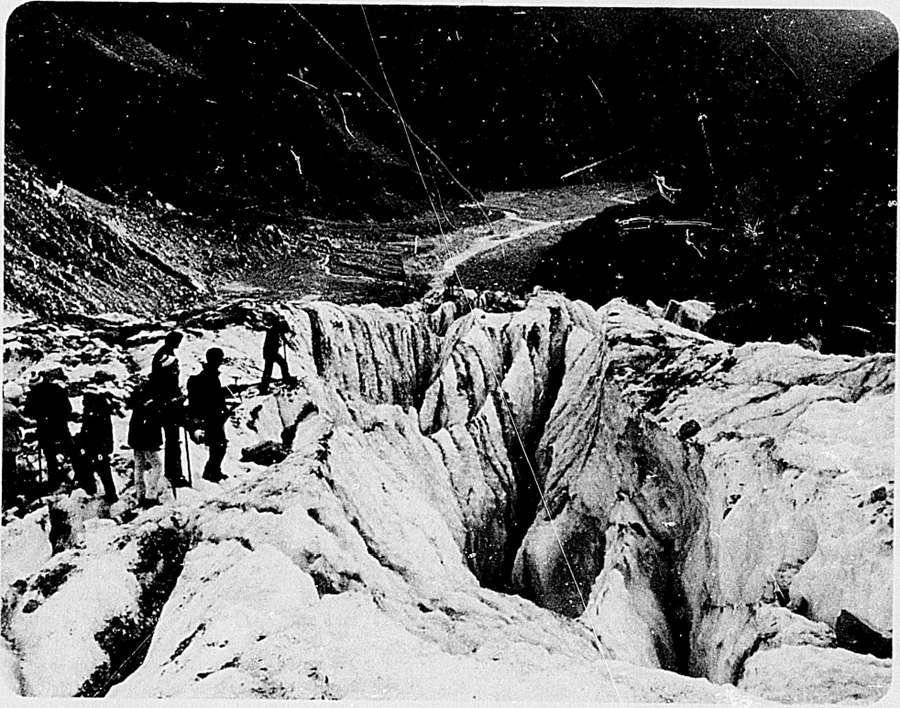
Glaciers—In keeping with the dimensions of the mountain system, New Zealand possesses, in the South Island, a glacial system of some magnitude. Of the glaciers the largest is the Tasman, which, with others of comparable size, rises in the more elevated area surrounding Mount Cook. Flowing down the eastern slope of the range, the Tasman Glacier has a length of 29 km and a width of 1 km. In common with other glaciers, on the eastern slope, of which the more important are the Murchison (17 km), the Mueller (13 km), the Godley (13 km), and the Hooker (11 km), its rate of flow is slow, while its terminal face is at an altitude of somewhat over 600 m. On the western slope of the range,
owing to the greater snow precipitation, the glaciers are more numerous and descend to lower levels. At the same time the steeper slope gives them a more rapid rate of flow. The two largest of these are the Fox and the Franz Josef, with lengths of 15 km and 13 km respectively, and terminal faces at altitudes of 200 m and 210 m.
The glaciers are fed by snow brought to the Southern Alps by the prevailing winds off the Tasman Sea. Total yearly snowfalls at the higher elevations (1800–2500 m) vary from 3 m to 6 m. The steeper West Coast glaciers have little moraine (rock debris) carried on their surfaces and have shown a marked terminal retreat in recent decades. However, latest evidence suggests that, in response to recent cooler wetter weather, the Fox and Franz Josef glaciers are showing signs of limited growth. The large glaciers on the eastern side of the Southern Alps are mantled with moraine and show some terminal retreat.
In the North Island there are 7 relatively small glaciers on the slopes of Mount Ruapehu compared with more than 360 in the Southern Alps. However, during the skiing season the Whakapapa Glaciers, near the Chateau Tongariro, are visited by several thousand people each week.
Rivers—New Zealand rivers, owing to the high relief of the country, are mostly swift-flowing and difficult to navigate. As sources of hydro-electric power the rivers are of considerable importance, since their rapid rate of flow and dependable volume of water make them eminently suitable for this purpose. The Waikato and the Rangitaiki in the North Island and the Waitaki, Cobb, Clutha, and Waipori in the South are used for major hydro-electric schemes.
Following is a list of the more important rivers. For purposes of uniformity, the length of a river is taken to be the distance from the mouth to the farthest point in the system, whether this should happen to bear the same name or that of an affluent, and is inclusive of the estimated course of a river flowing into and emerging from any lake in the system.
| River | Length (kilometres) |
|---|---|
| * Cook Strait is defined as follows: northern limit is a line between northern point of Stephens Island and Kapiti Island: southern limit is a line between Cape Palliser and Cape Campbell. | |
| NORTH ISLAND | |
| Flowing into the Pacific Ocean— | |
| Piako | 90 |
| Waihou (or Thames) | 175 |
| Rangitaiki | 193 |
| Whakatane | 105 |
| Waipaoa (from source, Mata River) | 121 |
| Waiapu (from source, Waipapa Stream) | 113 |
| Wairoa (from source, Hangaroa River) | 137 |
| Mohaka (from source, Taharua River) | 172 |
| Ngaruroro | 154 |
| Tukituki | 113 |
| Flowing into Cook Strait*— | |
| Ruamahanga | 124 |
| Hutt | 56 |
| Flowing into the Tasman Sea— | |
| Otaki | 48 |
| Manawatu | 182 |
| Rangitikei | 241 |
| Turakina | 137 |
| Whangaehu | 161 |
| Wanganui | 290 |
| Waitotara | 108 |
| Patea | 143 |
| Waitara | 98 |
| Mokau | 158 |
| Waikato (from source, Upper Waikato River) | 425 |
| Wairoa (from source, Waiotu Stream) | 132 |
| Hokianga (from source, Waihou River) | 72 |
| SOUTH ISLAND | |
| Flowing into Cook Strait— | |
| Pelorus | 64 |
| Wairau | 169 |
| Awatere | 126 |
| Flowing into the Pacific Ocean— | |
| Clarence | 209 |
| Conway | 48 |
| Waiau-uha (or Waiau) | 169 |
| Hurunui | 138 |
| Waipara | 64 |
| Ashley | 97 |
| Waimakariri | 161 |
| Selwyn | 95 |
| Rakaia | 145 |
| Ashburton | 90 |
| Rangitata (from source, Clyde River) | 121 |
| Opihi | 80 |
| Pareora | 56 |
| Waihao | 64 |
| Waitaki (from source, Hopkins River) | 209 |
| Kakanui | 64 |
| Shag | 72 |
| Taieri | 288 |
| Clutha (from source, Makarora River) | 322 |
| Flowing into Foveaux Strait— | |
| Mataura | 240 |
| Oreti | 203 |
| Aparima (Jacobs River) | 113 |
| Waiau (from source, Clinton River) | 217 |
| Flowing into the Tasman Sea— | |
| Hollyford | 76 |
| Cascade | 64 |
| Arawhata | 68 |
| Haast | 64 |
| Karangarua | 37 |
| Cook | 32 |
| Waiho (from source, Callery River) | 32 |
| Whataroa | 51 |
| Wanganui | 56 |
| Waitaha | 40 |
| Hokitika | 64 |
| Arahura | 56 |
| Taramakau | 80 |
| Grey | 121 |
| Buller (from source, Travers River) | 177 |
| Mokihinui | 56 |
| Karamea | 80 |
| Heaphy | 35 |
| Aorere (from source, Spee River) | 72 |
| Takaka (from source, Cobb River) | 72 |
| Motueka | 108 |
| Waimea (from source, Wai-iti River) | 48 |
The discovery in 1861 that the beds of rivers in the South Island contained extensive deposits of alluvial gold was of considerable importance in the early economic development of the country.
Many rivers are valuable for recreational activities such as swimming, canoeing, rafting, jet boating, tramping, camping, and picnicking, and with the very successful acclimatisation of freshwater fish, notably trout, rivers now provide exceptionally fine fishing.
Lakes—In considering New Zealand's numerous lakes a distinction can be made, especially from the scenic viewpoint, between the lakes of the 2 islands. Surrounded by extremely rugged country the larger lakes of the South Island are distinguished by the grandeur of their alpine settings, while some of the larger ones of the North Island, situated on a volcanic plateau, have their own particular beauty. The lakes of both islands are of vital importance as reservoirs, for the maintenance of the rivers and streams draining them and as a means of flood prevention, especially where hydro-electric schemes are involved. Lakes Waikaremoana and Taupo in the North Island, and Lakes Coleridge, Pukaki, Tekapo, Wanaka, Hawea, Manapouri, Ohau, Monowai, and Wakatipu in the South Island are of particular significance in this respect. A series of narrow man-made lakes have been produced in connection with hydro-electric development along some of the rivers. In 1965 Lake Benmore, New Zealand's largest artificial lake, was created. It lies on the Waitaki River in North Otago and covers 75 sq km in area and consists of two arms, the main arm being 30 km in length and the Ahuriri Arm 18 km in length.
Some particulars of the more important lakes are given in the following table.
| Lake | Length in Kilometres | Greatest Breadth in Kilometres | Area in Square Kilometres | Drainage Area in Square Kilometres | Approximate Volume of Discharge in Cubic Metres per Second | Maximum Height Above Sea Level in Metres (Range in Parentheses)* | Greatest Depth in Metres |
|---|---|---|---|---|---|---|---|
| * The range in lake levels is not available for all lakes. | |||||||
| NORTH ISLAND | |||||||
| Natural | |||||||
| Taupo | 40.2 | 27.4 | 606 | 3,289 | 130 | 357 (1.5) | 159 |
| Rotorua | 12.0 | 9.7 | 80 | 526 | 280 (0.6) | 26 | |
| Rotoiti | 16.1 | 4.8 | 34 | 642 | 24 | 279 (0.6) | 70 |
| Tarawera | 11.2 | 8.9 | 36 | 186 | 8 | 299 (0.6) | 87 |
| Rotoaira | 4.8 | 2.8 | 16 | 129 | 33 | 564 (0.9) | |
| Waikaremoana | 19.3 | 9.7 | 54 | 347 | 18 | 614 (13.7) | 256 |
| Wairarapa | 19.3 | 6.4 | 80 | 3,201 | 8 | 20 | |
| Rotoehu | 4.8 | 3.2 | 8 | 44 | 295 (1.2) | ||
| Rotoma | 5.2 | 3.6 | 12 | 31 | 316 (1.8) | ||
| Okataina | 6.4 | 4.8 | 10 | 65 | 310 (2.7) | ||
| Okareka | 2.4 | 2.0 | 3 | 21 | 354 (1.2) | ||
| Rotomahana | 6.4 | 2.8 | 9 | 70 | 340 (6.7) | ||
| Rerewhakaitu | 4.0 | 2.8 | 8 | 439 (1.2) | |||
| Tikitapu | 1.6 | 1.2 | 1 | 416 | |||
| Rotokakahi | 4.0 | 1.6 | 5 | 28 | 1 | 396 | |
| Artificial | |||||||
| Matahina | 3 | 70 | |||||
| Otamangakau | 2 | 14 | 613 | ||||
| Te Wharau | |||||||
| Moawhango | 4 | 12 | 853 | ||||
| Ohakuri | 33.8 | 0.4 | 13 | 4,791 | 155 | 287 | |
| Atiamuri | 6.4 | 0.4 | 2 | 5,128 | 158 | 252 | |
| Whakamaru | 21.7 | 0.8 | 7 | 5,581 | 176 | 226 | |
| Maraetai | 7.2 | 0.8 | 5 | 6,190 | 195 | 188 | |
| Waipapa | 9.7 | 0.4 | 2 | 6,475 | 207 | 127 | |
| Arapuni | 16.1 | 0.8 | 9 | 6,876 | 211 | 111 (0.6) | |
| Karapiro | 24.1 | 0.4 | 8 | 7,459 | 226 | 54 | |
| Whakamarino | 0.8 | 0.4 | 1 | 369 | 18 | 274 | |
| SOUTH ISLAND | |||||||
| Natural | |||||||
| Rotoiti | 8.9 | 2.8 | 10 | 184 | 12 | 616 (1.8) | 76 |
| Rotoroa | 14.5 | 3.2 | 23 | 376 | 27 | 446 (1.5) | 152 |
| Brunner | 8.9 | 8.9 | 39 | 414 | 85 | 109 | |
| Kaniere | 9.7 | 2.0 | 16 | 28 | 131 | 197 | |
| Coleridge | 17.7 | 3.2 | 36 | 559 | 510 | 207 | |
| Sumner | 9.7 | 2.4 | 14 | 337 | |||
| Tekapo | 17.7 | 5.6 | 88 | 1,424 | 79 | 713 (12.0) | 189 |
| Pukaki | 15.3 | 8.0 | 169 | 1,355 | 132 | 534 (15.8) | |
| Ohau | 17.7 | 4.8 | 61 | 1,191 | 80 | 524 (48) | |
| Hawea | 30.6 | 8.0 | 141 | 1,389 | 63 | 348 (20.0) | 392 |
| Wanaka | 45.1 | 4.8 | 193 | 2,575 | 188 | 280 (3.8) | |
| Wakatipu | 77.2 | 4.8 | 293 | 3,067 | 155 | 312 (2.7) | 378 |
| Te Anau | 61.2 | 9.7 | 344 | 3,302 | 267 | 205 (4.0) | 276 |
| Manapouri | 28.9 | 8.0 | 142 | 4,623 | 401 | 181 (6.4) | 443 |
| Monowai | 19.3 | 1.6 | 31 | 241 | 14 | 196 (4.0) | |
| Hauroko | 35.4 | 2.4 | 71 | 583 | 31 | 156 (1.8) | |
| Poteriteri | 28.9 | 2.4 | 47 | 414 | 30 | 29 | |
| Waihola | 6.4 | 2.0 | 8 | 5,698 | (Tidal) | 16 | |
| Ellesmere | 22.5 | 12.9 | 181 | 1,930 | (Tidal) | 2 | |
| Artificial | |||||||
| Cobb | 4.8 | 0.4 | 2 | 69 | 5 | 811 (15.2) | 96 |
| Waitaki | 4.8 | 0.8 | 6 | 9,774 | 327 | 232 | |
| Aviemore | 10.8 | 4.1 | 29 | 9,701 | 327 | 269 | |
| Roxburgh | 32.2 | 0.4 | 6 | 15,857 | 486 | 133 | |
| Mahinerangi | 14.5 | 1.6 | 21 | 311 | 7 | 391 | |
| Benmore— | |||||||
| Ahuriri Arm | 18.5 | 4.4 | 75 | 8 532 | 319 | 362 | |
| Main Arm | 29.8 | ||||||
GEOLOGY—The islands of New Zealand are part of the unstable circum-Pacific Mobile Belt. This is a region where volcanoes are active and where the Earth's crust has long been buckling and breaking at a geologically rapid rate. The interplay, in the past, of earth movements and erosion has created the sedimentary rocks that cover almost three-quarters of New Zealand. Land areas that the earth movements have raised have been attacked by erosion, and the sand, mud, shingle, and other debris thus formed has been carried away to the sea, where it has accumulated in great thicknesses to form rocks such as sandstone, mudstone, greywacke, and conglomerate; the shells and other skeletons of sea creatures have accumulated to form thick layers of limestone. Many of the sedimentary rocks are in distinct layers called strata. Earth movements have later raised them above the sea to form land, and the strata have in many places been tilted and folded by pressure. Seas have advanced and retreated over the New Zealand area many times and these sedimentary rocks represent almost every geological period since the Cambrian (see Time Scale). Their age is revealed by the molluscan shells, foraminifera, and other fossils that they contain, as well as by various radioactive techniques.
As well as sedimentary rocks, and volcanic rocks of various ages, New Zealand incorporates in its complex structure schist, gneiss, marble and other metamorphic rocks, and granite, diorite, gabbro, serpentine, and other intrusive igneous rocks. Most of these metamorphic and intrusive rocks are hundreds of millions of years old. They were formed at depth in the Earth's crust early in New Zealand's history, in the “roots” of ancient mountain ranges, long ago destroyed, and are visible at the land surface today only because erosion has removed thousands of metres of other rocks that once covered them. The metamorphic rocks were developed by the action of heat and pressure on the thick sediments (up to tens of thousands of metres) deposited in huge, elongated sea basins (geosynclines), which continued to sink as the deposits accumulated. When these geosynclines were slowly compressed during major mountain-building episodes the deeper sediments were subjected to great pressure and shearing stress, which caused new minerals and structures to develop, changing the sediments into metamorphic rocks. The granites and other intrusive rocks are coarsely crystalline, and are usually considered to have intruded into the outer crust in a molten state during mountain building; some, however, may be the products of an intense metamorphism of sediments.
| GEOLOGICAL TIME-SCALE | |||
|---|---|---|---|
| Eras | Periods | Approximate Time Since Period Began (Years) | |
| Cenozoic | Holocene (Recent) | Quaternary | 10 thousand |
| Pleistocene | 2 million | ||
| Pliocene | Tertiary | 11 “ | |
| Miocene | 25 “ | ||
| Oligocene | 38 “ | ||
| Eocene | 60 “ | ||
| Paleocene | 70 “ | ||
| Mesozoic | Cretaceous | 135 “ | |
| Jurassic | 180 “ | ||
| Triassic | 225 “ | ||
| Paleozoic | Permian | 270 “ | |
| Carboniferous | 350 “ | ||
| Devonian | 400 “ | ||
| Silurian | 440 “ | ||
| Ordovician | 500 “ | ||
| Cambrian | 600 “ | ||
Geological History—Evidence of the earliest-known events in New Zealand's history is given by ancient rocks in Nelson, Westland, and Fiordland that were formed in the early Paleozoic era, perhaps as long as 600 million years ago (some in Westland may be older). They include thick, geosynclinal sedimentary rocks. This suggests that a large land mass existed nearby at that time to yield the great volume of sediments, but little has been deduced about its shape or position.
The history of the later part of the Paleozoic era, and the Mesozoic era, is rather better understood. For a vast span of time from the Carboniferous period—probably until the early Cretaceous period— an extensive geosyncline occupied the New Zealand region. At first, during much of the late Paleozoic time, huge quantities of submarine lava and volcanic tuff were included in the materials that accumulated in the geosyncline, but in the later Permian and Mesozoic times the sediments were mainly sand and mud, derived probably from some land west of present New Zealand; they were compacted into hard greywacke (a type of sandstone) and argillite (hard, dark mudstone).
In the early Cretaceous period one of the main mountain-building episodes in New Zealand's history took place. Although geosynclinal sedimentation continued through the Cretaceous period in eastern New Zealand the geosyncline elsewhere was compressed, and the sediments were intensely crumpled and broken and raised above the sea, probably forming a large, mountainous land mass. Some of the geosynclinal deposits, now exposed over much of Otago, alpine Westland, and parts of Marlborough Sounds, were metamorphosed into schist and gneiss by high temperatures and the tremendous deforming pressures to which the geosyncline was subjected.
The time that has elapsed since the intense folding of the strata in the New Zealand geosyncline in the mid-Cretaceous period may be considered as the later geological history of this country, embracing roughly 100 million years.
During the early part of this late history, erosion slowly wore down the mountains that had risen, producing a land of low relief. Over these worn-down stumps of the Mesozoic mountains the sea gradually advanced, beginning its transgression earlier in some areas than in others. In the early Cretaceous period it began to submerge land in the region of present North Auckland and the eastern margins of the North and South Islands, and thick deposits of mudstone and sandstone accumulated in some parts of these areas. At the close of the Mesozoic era, and in the very early Tertiary era, land became so reduced in size and relief that little sediment was formed, and only comparatively thin deposits of fine bentonitic and sulphurous muds, and fine white foraminiferal limestone accumulated. In some areas New Zealand's main coal deposits accumulated in swamps on the surface of the old land. These became buried by marine deposits as the sea continued its transgression in the Eocene period.
By the Oligocene period most of the land was submerged, and in shallow waters free of land sediments thick deposits of shell and foraminiferal limestone accumulated. (Scattered remnant patches of this Oligocene limestone furnish most of New Zealand's cement and agricultural lime.)
After the Oligocene submergence earth movements became more vigorous; many ridges rose from the sea as islands, and sank or were worn down again; sea basins formed and rapidly filled with sediments. New Zealand's late Tertiary environment has been described as follows: “The pattern of folds, welts, and troughs that developed was on a finer scale than in the Mesozoic … the land moved up and down as a series of narrow, short, interfingering or branching folds. … We can think of Tertiary New Zealand as an archipelago … A kind of writhing of part of the mobile Pacific margins seems to have gone on …”. The thick deposits of soft, grey mudstone and sandstone that now make up large areas of the North Island, and some parts of the South Island, are the deposits that accumulated rapidly in the many sea basins, large and small, that developed in the later Tertiary.
Very late in the Cenozoic era—in the Pliocene and Pleistocene periods—one of the greatest episodes of mountain building in New Zealand's history took place. Earth movements became intense, and slowly pushed up the Southern Alps and other main mountain chains, and determined the general shape and size of the present islands of New Zealand. Much of the movement during this mountain-building period (the Kaikoura Orogeny) took the form of displacement of blocks of the Earth's crust along fractures called faults. The total movements of the Earth blocks adjacent to major faults amounted to thousands of metres. It must have been achieved very slowly, probably by innumerable small movements, each less than a few metres. The blocks adjacent to “transcurrent” faults moved not only vertically but also laterally along the faults. The New Zealand landscape today in some regions shows well preserved tilted fault blocks bounded by fault-scarps—steep faces hundreds or even thousands of metres high. Fault movements continue to the present day, and have accompanied several major earthquakes of the past century. Many minor but revealing landscape features such as scarplets, fault ponds, and shutter ridges show where movement has been occurring in recent centuries.
Erosion during this time has eaten into the major landscape forms that the earth movements built, carving detailed landscape patterns of peaks, ridges, valleys, and gorges, and the deposition of the debris has built up alluvial plains, shingle fans, and other construction forms. At the coast, waves have driven back the headlands and built beaches, spits, and bars. The Pleistocene period was the time of the Ice Age, and in the high mountains of the South Island glaciers carved deep valleys and carried huge loads of rock, dumping them in the lower parts of the valleys as moraines. The late Pleistocene glaciers carved the fiords of Fiordland and the basins occupied by most South Island lakes; there were small glaciers also on Ruapehu, where remnants survive, and on Mount Egmont and the Tararua Range. Sea-level changes accompanied the formation and later melting of the land ice, affecting the erosion or deposition of the rivers and thus being responsible for the formation of the many prominent river terraces in this country.
Volcanic activity of the past few million years has played an important part in making the rocks and shaping the landscape of parts of the central and northern North Island. Banks Peninsula, a twin volcanic dome in Canterbury, also achieved much of its growth then. The largest volcanic outpourings of late geological times in New Zealand have been in the region between Tongariro National Park and the Bay of Plenty Coast: andesite lava, scoria, and ash were erupted in the Pleistocene period and later to build the huge volcanoes, Ruapehu, Tongariro, and Ngauruhoe. More than 8000 cu km of molten rhyolitic magma was erupted in the form of ignimbrite, pumice, and rhyolite lava, building up the Volcanic Plateau. This is one of the largest and youngest accumulations of acid volcanic rocks in the world.
Mount Egmont is a huge, conical, andesite volcano, with the remnants of two other volcanic cones nearby; all are of Pleistocene age. In the Waikato there are eroded Pleistocene cones of approximately basic andesite composition. The largest is Pirongia, some 900 m high. Auckland city and the area immediately to the south has been the scene of many eruptions of basalt lava and scoria in late Pleistocene and Holocene times; and many small scoria cones can be seen in the locality. Late Tertiary and Quaternary basaltic eruptions in North Auckland have built lava plateaus and many young cones.
EARTHQUAKES: Geophysical Background—An earthquake occurs when energy is suddenly released from a volume of rock within the Earth's outer layers, and is radiated outwards in the form of elastic waves that can be felt at places near the origin, and detected by sensitive instruments at greater distances. Earthquakes are most common in certain geographically limited regions, one of which includes New Zealand. Within these disturbed zones, young fold mountains, oceanic trenches, volcanoes, anomalies in the Earth's gravitational field, and active geological faulting are also usual, and like the earthquakes have their ultimate cause in the internal processes incidental to the major structural development of the Earth, and as yet are imperfectly understood.
The seismically active zones define the margins of a system of stable blocks or plates which are not completely inactive, but experience large earthquakes only infrequently, and are thought to be the primary units of the Earth's crust. Two of these units, the Pacific and Indian Plates, abut in the vicinity of New Zealand, forming a triple junction with a third, the Antarctic Plate, south of Macquarie Island. As a result of thermally generated convective movements in the deeper levels of the earth, relative displacement of the plates is occurring and this provides the continuing source of the energy that is intermittently released as earthquakes.
Instrumental records have shown that at the time of an earthquake large shearing movements take place at the source. It seems probable that all major earthquakes are the result of the breakage of rock under strain, but other factors such as the presence or absence of liquid in the pores and fractures of the rock are also of primary importance in determining the time and place at which a shock occurs.
In large shallow earthquakes a rupture may appear at the surface, forming or renewing movement on a geological fault. In regions where the majority of earthquakes are very shallow, such as California, there is a tendency for the earthquake origins to cluster near geological fault traces, but in regions where there is deeper activity, such a New Zealand, this is not so. For example, there is little activity near the Alpine Fault, which stretches for some 500 km from Milford Sound to Lake Rotoiti, and is considered one of the world's largest and most active faults. Conversely, instances of fault movement that have not been accompanied by earthquakes are known. Practical assessments of earthquake risk must therefore be based upon the statistics of known earthquake distribution and the broader geological setting of the origins.
New Zealand Seismicity—Compared with some other parts of the Pacific margin, such as Japan, Chile, and the Philippines, the level of seismic activity in New Zealand is moderate. It may be roughly compared with that prevailing in California. A shock of Richter magnitude 6 or above occurs on the average about once a year, one of magnitude 7 or above once in ten years, and one of about magnitude 8 perhaps once a century, but in historic times only one shock (the south-west Wairarapa earthquake in 1855) is known to have reached this magnitude.
Other natural disasters and accidents are together responsible for more casualties than earthquakes, the most serious seismic disasters in New Zealand having been the Hawke's Bay earthquake of 1931 in which 256 deaths occurred, and the Buller earthquake of 1929 in which there were 17. The total resulting from all other shocks since 1840 is less than 15 deaths. The last earthquake to cause deaths occurred at Inangahua in 1968, when 3 people died.
Regarded broadly, the zone of seismicity within which New Zealand lies extends continuously from the triple junction south of Macquarie Island to Samoa. When looked at more closely, breaks in continuity and changes in the character of the activity become apparent. There are changes in direction, in the positional relationship of the deeper and shallower activity, and in its association with the other geophysical and geological features of the region.
Within New Zealand itself, at least two separate systems of seismic activity can be distinguished. The Main Seismic Region, which is the larger, covers the whole of the North Island apart from the Northland peninsula, and the South Island north of a line passing roughly between Banks Peninsula and Cape Foulwind. The Southern, or Fiordland, Seismic Region includes Southern Westland, Western Southland, and Western Otago. Less clearly defined activity covers the remainder of the two main islands, and extends eastwards from Banks Peninsula to include the Chatham Islands.
Shallow earthquakes, which are the most numerous, originate within the Earth's crust, which in New Zealand has an average thickness of some 35 km. These shocks are responsible for almost all damage to property, and now and in the past they have been widely scattered throughout the country. In historically recent times, the Main and Fiordland Seismic Regions have been significantly more active than the rest of New Zealand, but neither the Central Seismic Region that lies between them nor the Northern peninsula has been free from damaging shocks. The details of the present pattern are not necessarily unchanging, and could alter significantly after the occurrence of a major earthquake. Because of this, because of the broader geophysical setting, and because of the distance to which the effects of a large earthquake extend, it would be highly imprudent to treat any part of New Zealand as free from the risk of serious earthquake damage.
Many active regions of the Earth have only shallow earthquakes, but in others shocks have been known to occur at depths as great as 700 km below the surface. It is thought that these deep shocks originate within the edges of crustal plates that have been drawn down or thrust beneath their neighbours. Such deep events are common in both the Main and Fiordland Seismic Regions of New Zealand, but their relative positions with respect to the shallow activity and to other geophysical features are rough mirror images. This is believed to indicate that in the North Island, the edge of the Pacific Plate lies below that of the Indian Plate, while in the south of the South Island the Pacific Plate is uppermost and the Indian Plate has been thrust beneath it.
The most important system of deep shocks in New Zealand lies in a well-defined zone beneath the Main Seismic Region, stretching from the Bay of Plenty to Nelson and Marlborough. The maximum depth of occurrence is about 400 km at the northern end, and decreases smoothly to a depth of about 200 km before the southern boundary of the region is reached. Along the whole of the system, there is also a decrease in maximum depth from west to east. In northern Taranaki, near the western limit of this activity, a small isolated group of shocks at a depth of about 600 km has also been recorded. In the Central Seismic Region only shallow shocks are known.
The maximum depth of the earthquakes in the Fiordland Region appears to be only about 160 km. Here, the deep activity is more concentrated than in the north, lying close to Lakes Te Anau and Manapouri.
Both earthquakes and volcanoes are found in geophysically disturbed regions, but although small earthquakes usually accompany volcanic eruptions, large ones are rare. Regions of active volcanism are also subject to periodic outbreaks of small earthquakes, all of similar magnitude, and very numerous. These events are known as “earthquake swarms”. Although the number of shocks may cause alarm, it is unusual for even minor damage to result. There is not often a simultaneous volcanic outbreak, but swarms are rare in non-volcanic regions. In New Zealand they have occurred in the volcanic zone that includes Mt. Ruapehu and White Island, in the Coromandel Peninsula, in parts of Northland, and near Mt. Egmont.
Seismological Observatory—Each year the Seismological Observatory, Wellington, a section of the Geophysics Division of the Department of Scientific and Industrial Research, publishes the analyses of hundreds of earthquakes originating in the New Zealand region, using data obtained from its own network of recording stations, and from stations in other countries. The instrumental data are supplemented by information about felt effects, supplied by a large number of voluntary observers, who complete a standard questionnaire.
The network of recording stations controlled by the Observatory is now one of the world's most extended, covering the main islands of New Zealand, a large part of the south-west Pacific, and the Ross Dependency. The 33 permanent stations now operating are:
Afiamalu, Apia (Western Samoa); Nadi (Fiji); Niue; Rarotonga (Cook Islands); Raoul Island (Kermadecs); Cape Reinga, Onerahi, Great Barrier, Auckland, East Cape, Karapiro, Whakatane, Gisborne, Wairakei, Tuai, Tarata, Taradale, Mangahao, Castlepoint, Cobb River, Wellington, Kaikoura, Kaimata, Cashmere, Chatham Islands, Milford Sound, Oamaru, Roxburgh, Borland Lodge, Oban, Campbell Island, Scott Base (Antarctica).
At Afiamalu, Rarotonga, Wellington, and Scott Base the equipment includes instruments of internationally standardised pattern designed to record both local and distant activity. At the other stations, many of which record more than one component of the ground motion, the instruments are primarily intended for the study of shocks within about 1000 km. At Wellington there is also a modern Seismic Research Observatory with digital recording, one of only 12 of its kind in the world. Scott Base and several of the island stations provide preliminary readings by radio, but all final analyses are made at the Observatory in Wellington.
A network of more closely-spaced stations, connected to a central recorder by radio links and land lines, provides for detailed studies of small earthquakes in the Wellington region. This network is for general research but also provides valuable readings of New Zealand and overseas earthquakes. A similar network operated from 1975 to 1983 near Lake Pukaki in the South Island. Its primary function was to monitor the changes in earthquake activity which accompanied the raising of the level of the lake for hydro-electric development. The observatory also has portable equipment available for more intensive studies of aftershock sequences, earthquake swarms, and microearthquakes, and for other research projects.
Other organisations operate seismographs in association with the observatory as follows: the Geophysical Survey of the DSIR in the Tongariro National Park (3 instruments), N.Z. Geological Survey at White Island and Waimangu, N.Z. Electricity at Tomahawk Gully near Lake Pukaki, and the University of Otago in Dunedin.
The information collected and published by the observatory covers all significant earthquakes in the New Zealand region. It is made freely available to the public and the press, as well as to seismologists, engineers, and other specialists. In addition, a very large number of distant earthquakes are recorded, and readings of these, as well as of the local activity, are regularly sent to international agencies and to overseas seismologists who have a need for them. The observatory itself carries out a vigorous programme of research into problems of seismicity and earthquake mechanism, and into the structure and constitution of the Earth's crust and its deep interior.
EARTHQUAKES DURING 1983—The only earthquake to cause significant damage in New Zealand during 1983 occurred near Reporoa, northeast of Lake Taupo, on December 15. It was only of magnitude 4.9, but because it was very shallow with a focal depth of about 5 km, the felt effects were quite strong, although not over a very wide area. At least $600 worth of stock was damaged at the Waiotapu Hotel Tavern. In Reporoa a milk tank was twisted off its foundations at the Dairy Company, and ridge tiles on a house in the town were displaced. In many houses objects fell from shelves, windows fell out of frames, and hot water cylinders were fractured. Power failed in some areas because switchgear tripped at substations. There were also some landslides in the Paeroa Range to the west of Reporoa, although heavy rain a few weeks earlier had left slopes susceptible to that sort of damage.
The quake was preceded by a number of foreshocks and followed by a series of aftershocks which lasted several days. A portable recorder, installed in the Waikite Valley by DSIR staff from Rotorua, recorded 150 small aftershocks in the first day, 70 the second day and fewer thereafter. A number of these were strong enough to be felt, though none was as strong as the mainshock.
There were 2 swarms of small earthquakes near Taupo in February and in June. From 29 January to the end of February, some 80 small shocks were reported felt, and other smaller ones were detected on instruments. In June there was another swarm, when more than 70 shocks were reported felt within 10 days. However none of these were large and all were very shallow.
The phenomenon of an earthquake swarm is quite common, particularly in the volcanic-geothermal area. The term is used to describe an earthquake sequence where there is no one clearly definable major event. This is in contrast to a foreshock—mainshock—aftershock sequence such as at Reporoa in December, when one shock was clearly much larger than the others. Of the Taupo earthquakes, the maximum magnitude was 3.9, and most were less than 3.0. A larger swarm occurred near Wanganui in 1982.
Two earthquakes which occurred near New Plymouth on 17 April were sufficient to cause minor damage there. The first was of magnitude 4.9 and the second of 5.3. A window was broken, a chimney brought down, and there was some damage to plaster.
Most of the other earthquakes which occurred throughout the year were either not large enough or not close enough to populated areas to cause any damage. On 26 January a large earthquake of magnitude 7.3 occurred to the north of New Zealand, in the Kermadec Islands. Because of its large size, it was felt as far south as Christchurch.
Other significant shocks although closer, were much smaller, such as the magnitude 4.6 earthquake on 20 February in Golden Bay which was felt throughout the Nelson area. On 25 June an earthquake of magnitude 5.2 occurred in Fiordland, felt most strongly at Manapouri power station, and at lower intensities as far away as Cromwell. A small earthquake off the Makara coast, near Wellington, at 12.30 a.m. on 17 November, was felt throughout the Wellington area and brought some goods off shelves in Porirua.
The shock of magnitude 5.2 which occurred 550 km to the south-east of Dunedin on 3 June was of considerable scientific interest. This is a most unusual location in that most earthquakes occur close to the plate boundary through New Zealand, which runs from the Kermadec Islands in the north-east to the Macquarie Ridge to the south of Fiordland. But shocks do occur well away from this axis from time to time.
WEATHER INFORMATION—The New Zealand Meteorological Service maintains networks of meteorological stations within New Zealand, on its outlying islands, at Scott Base and, by arrangement, in the Cook Islands, Kiribati, Niue, Tokelau, Tonga, Tuvalu, and Vanuatu. The weather observations are transmitted regularly to Wellington for international exchange, for the preparation of weather forecasts and special warnings, for compiling climatological statistics, and for providing a general weather information service for Government departments, industry, and the general public. All weather observations are preserved in the Meteorological Archives, Wellington. The Meteorological Service also has a programme of atmospheric research.
Observations recorded at a few selected stations in 1983 are summarised in tables which follow but for further detailed climatological statistics reference should be made to the annual publications of the New Zealand Meteorological Service: Miscellaneous Publications No. 109 Meteorological Observations, and No. 110 Rainfall Observations. Current statistics appear monthly in the New Zealand Gazette. Special reports are published from time to time to supplement the regular data publications.
Most weather data are now held in computer-accessible data files, and several kinds of output are available to provide an alternative means of dissemination of information to the printed publications.
CLIMATE—Situated between 34°S and 47°S the main islands of New Zealand lie just south of the subtropical mean high pressure belt and penetrate into the hemispheric westerly airstream which is usually strongest in the New Zealand region between 50°S and 55°S. The daily weather patterns are dominated by eastward-moving anticyclones and troughs of low pressure whose frequencies and intensities vary substantially. The troughs normally have a north-west to south-east orientation and are associated with deep depressions centred far to the south. A typical weather sequence commences with a low-pressure trough approaching from the west. Freshening north-westerly winds prevail with increasing cloud, followed by rain for a period during which winds may reach gale force. The passage of the trough, with its associated cold front, is accompanied by a change to cold south-westerly or southerly winds and showery weather, occasionally with some hail and thunder. The barometer then rises with the approach of the next anticyclone from the west. Winds moderate and fair weather prevails for a few days as the anticyclone moves across the country.
While the sequence just described is very common the situation is frequently much more complex. The troughs are very unstable systems where depressions readily form. Some of these develop into vigorous storms that may pass over New Zealand at any time of the year. Occasionally in summer a cyclonic storm of tropical origin accompanied by gales and heavy rain passes over or near New Zealand, affecting mainly northern and eastern districts of the North Island. The anticyclones vary in size, intensity, and rate of movement. Their centres, on the average, follow a track across the North Island but individual centres may pass either north or south of the country, the more northerly tracks being favoured in spring and the southerly tracks in autumn and winter. At times when little development occurs within the troughs the anticyclones follow each other at intervals of about 6–7 days.
The other main factors which influence the climate of New Zealand are, first, its position in the midst of a vast ocean, and second, the shape and topography of the country itself.
Hot air masses from the interior of Australia in summer or freezing air masses from the Antarctic, which occasionally reach New Zealand, retain little of their original characteristics after their long ocean passages. Since abundant supplies of moisture are supplied by evaporation from the ocean, and depressions are frequent and vigorous, the average precipitation is high.
The chain of high mountains, which extends from south-west to north-east through the length of the country, rises as a formidable barrier in the path of the prevailing westerly winds. The effect is to produce much sharper climatic contrasts from west to east than in the north-south direction. In some inland areas of the South Island just east of the mountains the climate is distinctly continental in character, despite the fact that no part of New Zealand is more than 130 km from the sea.
Winds—Winds from a westerly quarter prevail in all seasons although in individual months easterlies may predominate. In the North Island winds generally decrease for a period in the summer or early autumn. However, in the South Island, July and August are the least windy months. Important modifications to the wind pattern are caused by mountain ranges and by the heating or cooling contrasts between land and sea. The north-westerly föhn wind in eastern areas of both islands gives rise to a characteristic weather type. The blocking effect of the mountain ranges decreases wind strength on the
upwind side but increases it in the mountain passes and in Cook and Foveaux Straits and about the Manawatu Gorge. Sea breezes are frequent and in many parts of New Zealand are almost certainly coupled with the mountain winds. North of Taranaki the general air flow is from the south-west and there is a noticeable reduction of windiness in the summer.
An indication of the variation in the frequency of strong winds from summer to winter, and in different parts of the country, is given in the next table. These figures were all obtained by the use of anemographs at airports.
| Station | Average Number of Days with Gusts Reaching | Years of Data | |||||
|---|---|---|---|---|---|---|---|
| 63 km/h or more | 96 km/h or more | ||||||
| Nov-Apr | May-Oct | Year | Nov-Apr | May-Oct | Year | ||
| Kaitaia | 20 | 39 | 59 | 0.8 | 2.3 | 3.1 | 26 |
| Whangarei | 10 | 21 | 31 | 0.4 | 0.8 | 1.2 | 26 |
| Auckland | 21 | 36 | 57 | 0.9 | 1.7 | 2.6 | 18 |
| Tauranga | 15 | 23 | 38 | 0.5 | 0.7 | 1.2 | 22 |
| Rotorua | 11 | 19 | 30 | 0.5 | 0.4 | 0.9 | 15 |
| Hamilton | 9 | 13 | 22 | – | 0.6 | 0.6 | 8 |
| Gisborne | 21 | 27 | 48 | 0.4 | 0.9 | 1.3 | 29 |
| New Plymouth | 31 | 49 | 80 | 1.4 | 4.4 | 5.8 | 26 |
| Napier | 20 | 27 | 47 | 0.8 | 0.8 | 1.6 | 27 |
| Wanganui | 35 | 41 | 76 | 2.2 | 3.9 | 6.1 | 26 |
| Palmerston North | 26 | 22 | 48 | 1.1 | 0.8 | 1.9 | 18 |
| Wellington | 83 | 90 | 173 | 13.3 | 19.2 | 32.5 | 21 |
| Nelson | 20 | 14 | 34 | 0.5 | 0.3 | 0.8 | 30 |
| Blenheim | 23 | 15 | 38 | 0.7 | 0.5 | 1.2 | 30 |
| Westport | 15 | 22 | 37 | 0.8 | 1.5 | 2.3 | 26 |
| Hokitika | 18 | 20 | 38 | 0.8 | 1.6 | 2.4 | 26 |
| Christchurch | 31 | 23 | 54 | 1.5 | 1.3 | 2.8 | 29 |
| Timaru | 17 | 14 | 31 | 0.9 | 0.8 | 1.7 | 27 |
| Dunedin | 33 | 35 | 68 | 2.5 | 3.2 | 5.7 | 24 |
| Gore | 29 | 20 | 49 | 0.9 | – | 0.9 | 5 |
| Invercargill | 55 | 46 | 101 | 5.9 | 5.7 | 11.6 | 26 |
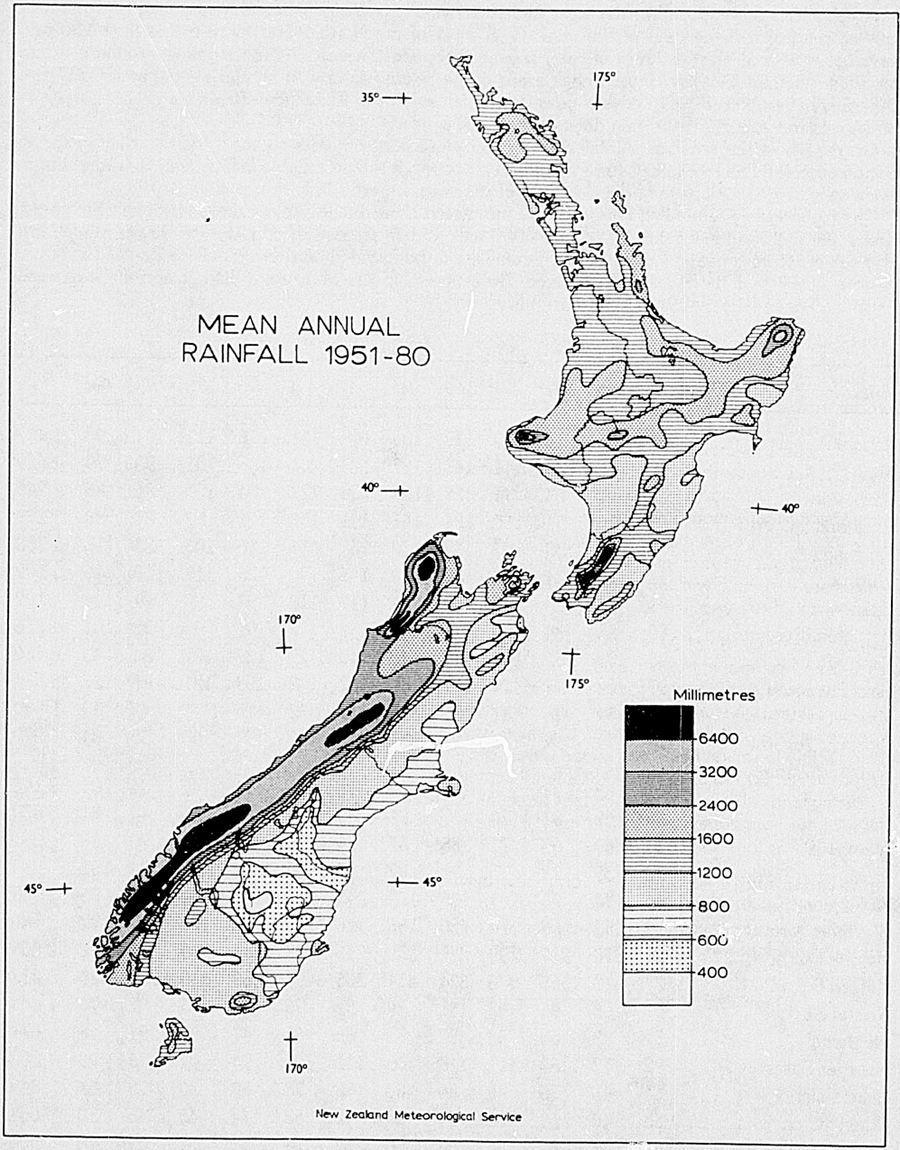
Rainfall—The distribution of rainfall is mainly controlled by mountain features, and the highest rainfalls occur where the mountains are exposed to the direct sweep of the westerly and north-westerly winds. The mean annual rainfall (see map) ranges from as little as 300 mm in a small area of Central Otago to over 8000 mm in the Southern Alps. The average for the whole country is high, but for the greater part it lies between 600 and 1500 mm, a range regarded as favourable for plant growth in the temperate zone. The only areas with average rainfalls under 600 mm are found in the South Island to the east of the main ranges. These include most of Central and North Otago, and South Canterbury. In the North Island, the driest areas are central and southern Hawke's Bay, Wairarapa, and Manawatu where the average rainfall is 700–1000 mm a year. Of the remainder, much valuable farm land, chiefly in northern Taranaki and Northland, has upwards of 1500 mm. Over a considerable area of both islands rainfall exceeds 2500 mm a year but, with the exception of Westland, this is mountainous and unoccupied, much of it being forest-covered.
For a large part of the country the rainfall is spread evenly through the year. The greatest contrast is found in the north, where winter has almost twice as much rain as summer. This predominance of winter rainfall diminishes southwards. It is still discernible over the northern part of the South Island but, over the southern half, winter is the season with least rainfall, and a definite summer maximum is found inland due to the effect of convectional showers. The rainfall is also influenced by seasonal variations in the strength of the westerly winds. Spring rainfall is increased in and west of the ranges as the westerlies rise to their maximum about October, while a complementary decrease occurs at the same time in the lee of the ranges.
Areas which are exposed to the west and south-west experience much showery weather, and rain falls on roughly half the days of the year. Over most of the North Island there are at least 130 rain days (days with at least 1.0 mm of rain) a year except to the east of the ranges where there are in places fewer than 110 rain days. Those areas of the South Island with annual rainfall under 600 mm generally have about 80 rain days a year. In the far south the frequency of rain increases sharply; in Stewart Island and Fiordland rain days exceed 200 a year.
On the whole the seasonal rainfall does not vary greatly from year to year, the reliability in spring being particularly advantageous for agricultural purposes. It is least reliable in late summer and autumn, when very dry conditions may develop east of the ranges, particularly in Hawke's Bay.
The highest daily rainfall on record is 582 mm which occurred at Rapid Creek, Hokitika Catchment, where the mean annual rainfall exceeds 6000 mm. Other areas with considerably lower rainfall are also subject to very heavy daily falls; such areas are to be found in northern Hawke's Bay and in northeastern districts of the Auckland province. By contrast, in the Manawatu district and in Otago and Southland daily falls reaching 80 mm are very rare.
| NORMAL MONTHLY AND ANNUAL RAINFALL (MILLIMETRES) (1951–80) | |||||||||||||
|---|---|---|---|---|---|---|---|---|---|---|---|---|---|
| Station | Jan | Feb | Mar | Apr | May | Jun | Jul | Aug | Sep | Oct | Nov | Dec | Year |
| Kaitaia Airport | 87 | 111 | 81 | 110 | 139 | 166 | 148 | 164 | 118 | 111 | 101 | 93 | 1,429 |
| Kerikeri | 91 | 144 | 125 | 141 | 163 | 197 | 173 | 201 | 138 | 131 | 93 | 99 | 1,629 |
| Dargaville | 71 | 91 | 83 | 94 | 126 | 157 | 130 | 129 | 94 | 103 | 86 | 85 | 1,249 |
| Auckland (Albert Park) | 65 | 96 | 91 | 117 | 124 | 141 | 141 | 139 | 101 | 97 | 89 | 88 | 1,289 |
| Tauranga Airport | 79 | 90 | 133 | 107 | 130 | 130 | 137 | 134 | 116 | 106 | 85 | 116 | 1,363 |
| Rotorua | 97 | 115 | 124 | 119 | 139 | 140 | 146 | 136 | 123 | 117 | 108 | 145 | 1,509 |
| Taupo | 81 | 88 | 80 | 87 | 102 | 114 | 117 | 110 | 97 | 99 | 91 | 124 | 1,190 |
| Hamilton (Ruakura) | 76 | 83 | 84 | 100 | 116 | 131 | 132 | 117 | 101 | 97 | 98 | 101 | 1,236 |
| Taumarunui | 96 | 91 | 82 | 102 | 149 | 140 | 140 | 127 | 127 | 127 | 134 | 145 | 1,460 |
| New Plymouth Airport | 97 | 102 | 97 | 124 | 167 | 150 | 162 | 142 | 109 | 121 | 126 | 117 | 1,514 |
| Masterton (Waingawa) | 65 | 51 | 76 | 81 | 96 | 99 | 112 | 92 | 76 | 76 | 73 | 83 | 980 |
| Gisborne Airport | 70 | 71 | 92 | 93 | 92 | 121 | 117 | 125 | 91 | 68 | 55 | 84 | 1,079 |
| Waikaremoana (Onepoto) | 147 | 168 | 173 | 190 | 182 | 202 | 196 | 234 | 174 | 147 | 134 | 201 | 2,148 |
| Napier | 50 | 62 | 81 | 70 | 67 | 94 | 80 | 83 | 61 | 61 | 44 | 77 | 830 |
| Wanganui | 70 | 59 | 63 | 71 | 85 | 87 | 84 | 76 | 63 | 75 | 70 | 88 | 891 |
| Palmerston North | 77 | 58 | 72 | 75 | 93 | 87 | 98 | 86 | 74 | 87 | 82 | 102 | 991 |
| Wellington (Kelburn) | 86 | 74 | 96 | 107 | 136 | 139 | 143 | 131 | 104 | 101 | 93 | 95 | 1,305 |
| Westport Airport | 159 | 153 | 162 | 200 | 220 | 186 | 176 | 179 | 176 | 187 | 211 | 177 | 2,186 |
| Hokitika Airport | 221 | 210 | 217 | 239 | 271 | 205 | 215 | 233 | 236 | 269 | 271 | 222 | 2,809 |
| Milford Sound | 527 | 513 | 665 | 576 | 524 | 414 | 355 | 404 | 566 | 560 | 580 | 529 | 6,213 |
| Nelson Airport | 69 | 68 | 86 | 92 | 111 | 79 | 92 | 96 | 71 | 85 | 82 | 74 | 1,005 |
| Blenheim | 51 | 38 | 53 | 63 | 72 | 57 | 66 | 68 | 47 | 57 | 51 | 48 | 671 |
| Hanmer Forest | 92 | 72 | 89 | 111 | 115 | 105 | 111 | 124 | 94 | 102 | 88 | 99 | 1,202 |
| Lake Coleridge | 64 | 48 | 55 | 85 | 84 | 68 | 73 | 78 | 69 | 80 | 75 | 63 | 842 |
| Christchurch | 53 | 40 | 61 | 68 | 74 | 59 | 72 | 58 | 42 | 45 | 46 | 50 | 668 |
| Lake Tekapo | 52 | 33 | 47 | 56 | 60 | 50 | 52 | 54 | 53 | 51 | 52 | 48 | 608 |
| Timaru | 57 | 47 | 61 | 57 | 49 | 34 | 43 | 40 | 32 | 49 | 58 | 59 | 586 |
| Dunedin (Musselburgh) | 71 | 54 | 76 | 72 | 80 | 71 | 66 | 56 | 49 | 61 | 73 | 73 | 802 |
| Queenstown | 69 | 50 | 73 | 75 | 86 | 70 | 59 | 59 | 77 | 80 | 71 | 63 | 832 |
| Alexandra | 38 | 27 | 39 | 31 | 33 | 22 | 18 | 19 | 21 | 32 | 31 | 35 | 346 |
| Gore | 100 | 59 | 88 | 74 | 87 | 77 | 57 | 52 | 63 | 78 | 76 | 83 | 894 |
| Invercargill Airport | 96 | 72 | 89 | 104 | 107 | 103 | 72 | 62 | 77 | 85 | 89 | 84 | 1,040 |
Thunderstorms—Thunderstorms are not numerous. Their frequency is greatest in the north and west where thunder is heard on 15 to 20 days a year; east of the ranges (except in Gisborne) the figure is five or less.
Hail—Hail is most frequent in the south-west where it is reported on about 20 days a year, but for the greater part of the country it occurs on about 5 days a year or less. Most of the hailstones are small, but occasionally large stones cause local damage to glasshouses, and to orchards and market gardens, chiefly in Canterbury and Hawke's Bay.
Temperature—Mean temperatures at sea level decrease steadily southwards from 15°C in the far north to 12°C about Cook Strait, then to 9°C in the south. With increasing altitude, temperatures drop about 2°C per 300 m. January and February, with approximately the same mean temperature are the warmest months of the year; July is the coldest. Some temperature statistics for selected places are included in the table on climatological averages. Highest temperatures are recorded east of the main ranges, where they exceed 30 °C on a few afternoons in most summers, usually in association with a north-westerly föhn wind. The extremes for New Zealand (measured in a standard thermometer screen) are 42°C, which has been recorded in three places: Jordan (Marlborough), Christchurch, and Rangiora (Canterbury); and −19°C at Ophir (Central Otago).
As is to be expected, there is a small annual range of temperature (difference between mean temperature of the warmest and coldest months). In Northland and in western districts of both Islands the annual range is about 8°C. For the remainder of the North Island, and east coast districts of the South Island it is 9°−10°C. Further inland it exceeds 11°c in places, reaching a maximum of 14°C in Central Otago where there is an approach to a continental type of climate.
Frost—It is well known that local variations in frostiness are considerable, even within quite small areas. On a calm, clear night the cold air in contact with a sloping surface gravitates slowly downhill to collect in valleys and depressions, and it is these “katabatic” drifts which are mainly responsible for local temperature variations at night. Gently sloping ground with a northerly aspect tends to be least affected by frost. Favourable sites in coastal areas of Northland are free of frost, although further inland light frosts occur frequently in the winter months. At Albert Park, Auckland, the screen minimum thermometer (1.3 m above the ground) has registered below 0°C only once in 65 years, yet up the harbour at Whenuapai Aerodrome there are eight screen frosts per annum on the average. Excluding the uninhabited mountainous areas, the coldest winter conditions are experienced in Central Otago and the Mackenzie Plains of inland Canterbury, and on the central plateau of the North Island. Even in these areas night temperatures as low as −12°C are rarely recorded. Elsewhere over the North Island the winters are very mild and pastures maintain continuous growth. In both islands sheep and cattle remain in the open all the year round.
Snow—The majority of New Zealanders rarely see snow except on the mountains. The North Island has a small permanent snow field above 2500 m on the central plateau, but the snow line rarely descends below 600 m even for brief periods in winter. In the South Island snow falls on a few days a year in eastern coastal districts, and in some years may lie for a day or two even at sea level. In Westland it does not lie at sea level. The snow line on the Southern Alps is around 2000 m in summer, being slightly lower on the western side where the Franz Josef and Fox Glaciers descend through heavy bush to within 300 m of sea level. In inland Canterbury and Otago, where there are considerable areas of grazing lands above 300 m, snowfalls are heavier and more persistent and have caused serious losses of sheep during severe winters in the past. However, only rarely does the winter snow line there remain below 1000 m for extended periods.
Relative Humidity—Humidity is commonly between 70 and 80 percent in coastal areas and about 10 percent lower inland. It varies inversely to the temperature, falling to a minimum in the early afternoon when temperature is highest and frequently lying between 90 and 100 percent during clear nights. As the following table shows, the diurnal variation is greater than the difference between summer and winter.
| Station | Mean Relative Humidity | |||
|---|---|---|---|---|
| January | July | |||
| 3 a.m. | 3 p.m. | 3 a.m. | 3 p.m. | |
| percent | ||||
| Auckland (Mechanics Bay) | 85 | 63 | 90 | 74 |
| Gisborne | 85 | 57 | 87 | 69 |
| Ohakea Airport | 87 | 62 | 89 | 72 |
| Wellington | 89 | 71 | 87 | 77 |
| Christchurch | 83 | 57 | 88 | 70 |
| Hokitika | 94 | 76 | 87 | 70 |
| Invercargill | 87 | 68 | 90 | 77 |
Very low humidity—from 30 percent down to about 5 percent—occurs at times in the lee of the Southern Alps where the föhn effect is often very marked. In summer the hot, dry “Canterbury Nor'wester” is generally a most unpleasant wind. Cool south-westerlies are also at times very dry when they reach eastern districts. In Northland the humid mid-summer conditions are inclined to be rather oppressive though temperatures rarely reach 30°C. Dull, humid spells are generally not prolonged anywhere, but their frequency shows a marked increase in the south.
Sunshine—The sunniest places are near Blenheim, the Nelson-Motueka area, and Whakatane, where the average duration of bright sunshine exceeds 2350 hours a year. The rest of the Bay of Plenty and Napier are only slightly less sunny. A large portion of the country is favoured with at least 2000 hours. Even Westland, despite its high rainfall, has 1800 hours. Southland and coastal Otago, where sunshine drops sharply to about 1700 hours a year, lie on the northern fringe of a broad zone of increasing cloudiness. Four hundred miles further to the south at Campbell Island the sunshine has the extremely low value of 650 hours a year. A pleasant feature of the New Zealand climate is the high proportion of sunshine during the winter months. To eliminate the effect of varying day-length the summer and winter sunshine at a few selected stations has been expressed as a percentage of the possible sunshine.
| Station | Summer | Winter |
|---|---|---|
| percent | ||
| Auckland | 54 | 47 |
| Hamilton | 54 | 43 |
| New Plymouth | 54 | 46 |
| Napier | 56 | 50 |
| Wellington | 53 | 41 |
| Nelson | 59 | 57 |
| Hokitika | 46 | 45 |
| Christchurch | 47 | 46 |
| Dunedin | 40 | 42 |
| Invercargill | 41 | 35 |
As these figures indicate, there is a marked increase in cloudiness in the North Island in winter, but little seasonal change in the South Island, except in Southland.
Climatological Averages—The following table provides a brief summary of the main climatological elements for selected locations.
| Station | Altitude (metres) | Annual Averages | Air Temperatures (Degrees Celsius) | |||||||||
|---|---|---|---|---|---|---|---|---|---|---|---|---|
| Rain Days (1.0mm or More) | Rain Days (5.0mm or More) | Bright Sunshine (Hrs) | Days of Screen Frost (min. air temp. less than 0°C) | Mean Temp. | Mean Daily Maximum | Mean Daily Minimum | Mean Annual | |||||
| Jan | Jul | Jan | Jul | Maximum | Minimum | |||||||
| Kaitaia Airport | 80 | 138 | 72 | 2,113 | 0 | 15.6 | 24 | 15 | 15 | 8 | 29 | 0 |
| Kerikeri | 73 | 135 | 72 | 1,988 | 1 | 15.1 | 25 | 15 | 14 | 6 | 29 | 0 |
| Dargaville | 20 | 147 | 72 | 1,949 | 5 | 14.8 | 23 | 15 | 14 | 7 | 29 | −2 |
| Auckland (Albert Park) | 49 | 140 | 67 | 1,904 | 0 | 15.7 | 24 | 15 | 16 | 8 | 28 | 3 |
| Tauranga Airport | 4 | 118 | 64 | 2,217 | 5 | 14.3 | 24 | 14 | 14 | 5 | 29 | −2 |
| Hamilton (Ruakura) | 40 | 131 | 72 | 1,981 | 26 | 13.5 | 24 | 13 | 12 | 3 | 29 | −5 |
| Rotorua | 307 | 123 | 68 | 1,872 | 27 | 12.7 | 23 | 12 | 12 | 3 | 30 | −4 |
| Gisborne Airport | 4 | 113 | 55 | 2,173 | 7 | 14.1 | 24 | 14 | 13 | 4 | 33 | −2 |
| Taupo | 376 | 123 | 66 | 2,015 | 37 | 12.0 | 24 | 11 | 11 | 2 | 30 | −4 |
| Waikaremoana (Onepoto) | 643 | 164 | 100 | 6 | 11.3 | 21 | 9 | 11 | 3 | 29 | −1 | |
| Taumarunui | 171 | 140 | 83 | 1,686 | 35 | 13.1 | 25 | 12 | 12 | 2 | 31 | −5 |
| New Plymouth Airport | 27 | 142 | 83 | 2,157 | 2 | 13.4 | 22 | 13 | 13 | 5 | 26 | −1 |
| Napier | 2 | 92 | 43 | 2,187 | 9 | 14.3 | 24 | 14 | 14 | 4 | 32 | −2 |
| Wanganui | 22 | 117 | 59 | 2,033 | 4 | 13.7 | 22 | 13 | 14 | 5 | 29 | −1 |
| Palmerston North | 34 | 127 | 62 | 1,764 | 14 | 13.2 | 22 | 12 | 13 | 4 | 28 | −3 |
| Masterton (Waingawa) | 114 | 123 | 57 | 1,944 | 31 | 12.4 | 24 | 12 | 11 | 3 | 31 | −4 |
| Wellington (Kelburn) | 126 | 124 | 68 | 2,008 | 0 | 12.7 | 20 | 11 | 13 | 6 | 27 | 1 |
| Nelson Airport | 2 | 96 | 54 | 2,372 | 38 | 12.2 | 22 | 12 | 13 | 1 | 28 | −4 |
| Blenheim | 4 | 84 | 39 | 2,449 | 39 | 12.9 | 24 | 12 | 12 | 2 | 32 | −4 |
| Westport Airport | 2 | 169 | 111 | 1,893 | 1 | 12.3 | 20 | 12 | 12 | 4 | 25 | 0 |
| Hanmer Forest | 387 | 115 | 65 | 1,881 | 82 | 10.2 | 23 | 9 | 9 | −2 | 32 | −9 |
| Hokitika Airport | 39 | 168 | 118 | 1,889 | 16 | 11.6 | 19 | 12 | 11 | 3 | 25 | −2 |
| Lake Coleridge | 364 | 98 | 52 | 70 | 10.3 | 22 | 9 | 10 | −1 | 31 | −7 | |
| Christchurch | 7 | 85 | 37 | 1,992 | 36 | 11.9 | 22 | 11 | 12 | 1 | 34 | −5 |
| Timaru | 17 | 81 | 33 | 1,828 | 38 | 11.4 | 22 | 10 | 10 | −1 | 32 | −4 |
| Milford Sound | 3 | 183 | 145 | 29 | 10.5 | 19 | 9 | 11 | 2 | 25 | −3 | |
| Queenstown | 329 | 93 | 50 | 1,865 | 50 | 10.4 | 22 | 8 | 10 | 0 | 30 | −5 |
| Alexandra | 141 | 64 | 20 | 2,034 | 86 | 10.8 | 24 | 8 | 11 | −2 | 32 | −8 |
| Dunedin (Musselburgh) | 2 | 119 | 48 | 1,645 | 10 | 11.1 | 19 | 10 | 11 | 3 | 29 | −2 |
| Gore | 72 | 137 | 60 | 1,665 | 40 | 9.7 | 20 | 8 | 9 | 0 | 31 | −5 |
| Invercargill Airport | 0 | 157 | 69 | 1,595 | 46 | 9.7 | 18 | 9 | 9 | 1 | 28 | −5 |
NOTES: (1) Averages of sunshine 1951–80, mean temperature, mean daily maximum and mean daily minimum 1951–80; other temperature data, rain days, and days of screen frost, various periods—all exceeding 10 years.
(2) For normal monthly and annual rainfall of these stations, see table under subsection on Rainfall.
(3) At Hanmer, Queenstown, and Alexandra the possible sunshine is considerably reduced by hills or mountains, by amounts varying from 3/4; hour per day at Alexandra to 1 1/2; hours per day at Hanmer and 3 1/4; hours per day at Queenstown. The reductions in actual sunshine are less than this—mainly between half and three-fifths of the above amounts.
Pressures to the south of New Zealand were much lower than usual during January, March, and September and strong west to southwest winds were unusually frequent. However during April, June, July, October, and November pressures were often higher than usual over, and south of New Zealand and as a result easterly winds were frequent during these months.
Rainfall was below average over most of the North Island and in some eastern South Island areas. Napier recorded only 59 percent of its usual rain, establishing a new record for low rainfall. Over most of the South Island and about Wellington rainfalls were above average, particularly in the central high country of the South Island. At Mt John and Alexandra rainfalls were about 150 percent of the average, making 1983 the wettest year on record at these places.
Eastern North Island areas experienced temperatures that were marginally warmer than usual but over the remainder of the country temperatures were approximately 0.5C below average.
Sunshine totals were below average almost everywhere, with most places recording between 85 percent and 95 percent of their usual sunshine. The only places to record more sun than usual were Rotorua and Christchurch, both of which received about 105 percent of their normal sunshine.
January was a cool, dry month in most parts of New Zealand, although it was wet in the south and west of the South Island. Northern areas had the highest frequency of southwesterly winds for January and the second highest for any month on record, while the south had the highest frequency of
northwesterlies since 1964. Pressures were low, especially to the south. Most of the North Island was drier than usual, especially about Gisborne and Wellington which had less than 20 percent of normal rainfall. The north and east of the South Island were also dry, but the south and west had up to 300 percent of the average January rainfall. Extensive flooding occurred in parts of Central Otago as a result of heavy rain between the 9th and 15th. Temperatures were below normal by between 0.5°C and 2°C in the North Island and by 1°C to 3°C in the South Island, apart from Marlborough which was warmer than usual. The North Island and the north and east of the South Island were sunnier than usual.
February was cool and dry, and southwesterly winds were more frequent than usual over the whole country. Pressures were slightly higher than normal over New Zealand and the Tasman Sea, and lower than normal east of the Chatham Islands. Rainfall was below average for the whole country except Southland and coastal Otago which had average or slightly above average rainfall. The rest of the South Island had 50 percent or less normal rainfall, with parts of Nelson and Marlborough receiving no rain at all. The North Island was also very dry, with areas around East Cape and Gisborne recording less than 10 percent of average rainfall. Mean temperatures were between normal and 1°c below normal over the whole country. Eastern, southern and central areas of the North Island, and Nelson had above average sunshine but the rest of the country was cloudier than usual.
March was mainly mild and dry. Southwesterlies were frequent in the north and northwesterlies were frequent in the south. Apart from Horowhenua, rainfall was below average over the North Island. In northern and eastern areas extremely dry conditions persisted for the fourth consecutive month. Eastern and northern areas of the South Island were drier than usual, while the rest of the South Island had up to 250 percent of the normal rainfall. Local flooding occurred in parts of Southland and Otago after heavy rain on the 9th and 10th. Temperatures were between normal and 2°C above normal, apart from the south and west of the South Island which were 1°C to 2°C cooler than usual. Sunshine hours were generally above normal apart from in some central North Island, and southern and western South Island areas.
April was a generally cloudy, wet month. Southwesterly winds were less frequent than usual and pressures were high, especially in eastern areas. Rainfall was above average over the whole country except in Fiordland, Southland, some central parts of the North Island and Wairarapa, where rainfalls were between 70 percent and 90 percent of normal. Temperatures were about average everywhere except for some areas of Southland and Central Otago, which were 1°C to 2°C cooler than usual, and some eastern areas of the North Island which were 1°C to 2°C warmer than usual. Apart from Canterbury and parts of Otago and Southland, the whole country had less sunshine than usual in April. The weather in the Bay of Plenty-Coromandel area was particularly dull.
May was cool and windy. Southwesterly winds were more frequent than usual over the whole country and strong winds occurred more often than usual. Very persistent high winds in the Cook Strait region between the 20th and 22nd severely disrupted inter-island travel. May was drier than usual in the North Island, apart from in Wairarapa and some central areas, and in the north and east of the South Island. The rest of the South Island was wetter than usual. Flooding occurred in parts of Otago after heavy rain on the 17th and 18th. Mean temperatures over the whole country were close to normal. Northern and eastern areas of both islands had average or above average sunshine while the rest of the country had less sun than usual. Southern and western areas of the South Island were particularly cloudy.
June was cloudy, with frequent strong winds and unusually frequent northeasterlies. Rainfalls were above average in most places, especially in parts of the South Island high country, where more than twice the normal June rainfall was recorded. However some parts of central New Zealand were very dry. Temperatures were close to normal in most places, although some central and southern North Island areas were a little warmer than usual, and western South Island areas were cooler than usual. Apart from some western districts, and Wellington and Christchurch, June was cloudier than usual.
July had frequent southeasterly winds, producing more rain than usual over most of the South Island and in some eastern parts of the North Island. Very heavy rain, with return periods of over 50 years in many places, during the 8th, 9th and 10th led to extensive flooding in the Nelson and Marlborough areas. However, many other areas were very dry; Hamilton, Whakatane and Tauranga all had record, or near record, low rainfalls. Although some central and eastern areas recorded near average temperatures, most of the country was 0.5°C to 1°C cooler than usual. Two occurrences of sea-ice were reported, one on Lyttelton Harbour and the other on Aotea Lagoon (near Wellington). Sea-ice had previously been recorded on Lyttelton harbour in 1947 and was unprecedented in the twenty-three years since the formation of the Aotea Lagoon. The unusually frequent southeasterly winds produced cloudier than usual conditions in most eastern areas and very sunny conditions in the west. Record high sunshine totals were recorded at Auckland and Hamilton.
August was a mild, dry month and pressures over the country were higher than usual. The only areas to record more rain than usual were parts of the Manawatu and the west and south of the South Island. Tauranga, Napier and Kaikoura recorded less than 30 percent of their usual rain. Temperatures were generally close to, or a little above average, however there were some cold periods, and heavy snowfalls closed roads for a time in the central North Island. August was a sunny month in the Waikato, Bay of Plenty and Taranaki districts as well as over much of the South Island. However, the remainder of the North Island, along with Southland and Otago, were cloudier than usual.
September was mild, cloudy and wet in most places, although eastern North Island areas remained very dry. It was also a very windy month and gales disrupted power supplies and air services on the 20th, 21st and 23rd. Several buildings were damaged and at least two people were injured as a result of being blown over. While both Napier and Gisborne recorded very low rainfalls, most of the country received a good deal of rain; Timaru and Alexandra recorded more than three times their usual September rain. Temperatures over most of the country ranged between 0.5°C and 1 °C above average but some inland and western areas of the South Island were around 0.5°C cooler than usual. There were some heavy snowfalls over the South Island, resulting in serious avalanches in Fiordland and causing heavy lamb losses. Most parts of New Zealand were cloudier than usual and both Ohakea and Dunedin had record low sunshine totals. Only a few eastern North Island areas and parts of Northland recorded more sun than usual.
October was another cloudy, mild and wet month. Winds from the easterly quarter were much more frequent than usual, producing more cloud and rain than normal in eastern areas and therefore alleviating the drought in Hawke's Bay. The Bay of Plenty received 2 to 3 times its usual October rainfall, Rotorua recorded its highest ever rainfall (for any month), and Kawerau recorded its highest ever October rainfall. Heavy rain on the 21st gave the Nelson-Marlborough area its second major flood of 1983. However, overall rainfalls in coastal Marlborough and in Canterbury were only about half of the October average. Night-time temperatures were about average throughout the country and some inland North Island areas recorded mean daily minimum temperatures up to 2.5°C above average. Day-time temperatures were above average in western areas but cooler than usual in the east. Parts of Westland recorded day-time temperatures up to 1.5°C above average, while South Canterbury and Otago recorded mean daily maximum temperatures about 1.5°C cooler than usual. A few places in Westland and Southland recorded sunshine totals that were about average but most of the country was cloudier than usual. Record or near record low sunshine totals were recorded at Gisborne, Paraparaumu, Blenheim and Wellington.
November was cloudy and cool in many eastern areas, but sunny and mild in western districts. Winds were much lighter than usual and easterlies were frequent. Rainfalls were below average almost everywhere with only Wellington and parts of Westland and the Southern Alps recording more rain than usual. Rainfalls at Whangarei, Auckland, Napier and Alexandra were among the lowest ever recorded at these places. Temperatures in the east of the North Island and in some inland parts of Canterbury were about 0.5°C below average but the remainder of the country experienced temperatures at least 0.5°C above average. The frequent east to southeast winds produced cloudier than usual conditions in eastern areas from East Cape to Kaikoura, and Gisborne recorded its cloudiest November since 1952. Western areas however were sunnier than usual, especially the West Coast of the South Island where Hokitika recorded almost 130 percent, of its usual November sunshine.
December was cool and changeable with very high rainfalls in many places. Strong winds, especially southwesterlies, were more frequent than usual. Rainfalls varied widely with many areas in the northern half of the North Island, as well as Nelson and Invercargill, recording their highest December rainfalls for many years, while much of the central North Island and some inland parts of the South Island recorded considerably less rain than usual. With the exception of Palmerston North which was slightly warmer than usual, temperatures over New Zealand were below average, by between 1°C and 2°C in inland South Island areas and by up to 1°C over the remainder of the country. Several hailstorms were reported during the month and hailstones the size of marbles damaged crops in the Marlborough and Whakatane areas on the 14th. It was cloudier than usual over much of the country although some parts of the Waikato, Taranaki and Canterbury were a little sunnier than usual.
Summary of Meteorological Observations for 1983—The observations from which the following summary was compiled for the year 1983 were made at 0900 hours New Zealand standard time, i.e. 2100 hours Greenwich mean time, except during January, February, November, and December, when they were made at 0900 hours N.Z. daylight time (2000 G.M.T.).
| Station | Rainfall (mm) | Rain Days (1.0mm or more) | Bright Sunshine (hours) | Screen Frost Days* | Air Temperatures (Degrees Celsius) | ||||||
|---|---|---|---|---|---|---|---|---|---|---|---|
| Mean Temp. | Mean Daily Maximum | Mean Daily Minimum | Extremes | ||||||||
| Jan | Jul | Jon | Jul | Maximum | Minimum | ||||||
| * Minimum air temperatures less than 0.0°C. | |||||||||||
| Dargaville | 994 | 121 | 1780 | 06 | 14.8 | 22.3 | 14.3 | 13.4 | 4.5 | 33.5 | −3.0 |
| Whangarei | 1231 | 128 | 1802 | 03 | 15.0 | 24.4 | 14.6 | 11.8 | 4.3 | 31.3 | −1.5 |
| Auckland (Albert Park) | 1053 | 119 | 1901 | 00 | 15.3 | 22.6 | 13.9 | 14.6 | 6.5 | 28.1 | 3.3 |
| Tauranga Airport | 1057 | 96 | 2061 | 02 | 14.2 | 23.8 | 13.9 | 12.6 | 3.6 | 33.7 | −1.5 |
| Rotorua Airport | 1268 | 104 | 2075 | 21 | 12.5 | 21.9 | 11.6 | 10.5 | 1.5 | 31.5 | −2.8 |
| Taupo | 916 | 110 | 1894 | 33 | 11.8 | 21.4 | 10.7 | 9.3 | 0.2 | 31.2 | −4.0 |
| Hamilton (Ruakura) | 985 | 119 | 1868 | 23 | 13.2 | 21.7 | 12.9 | 10.3 | 0.6 | 28.6 | −4.6 |
| Taumarunui | 1233 | 139 | 1478 | 38 | 12.5 | 21.9 | 11.8 | 9.2 | 0.2 | 29.3 | −4.3 |
| New Plymouth Airport | 1230 | 132 | 2045 | 06 | 13.1 | 19.4 | 12.7 | 12.1 | 4.5 | 24.3 | −1.3 |
| Masterton (Waingawa) | 903 | 123 | – | 24 | 12.3 | 22.6 | 11.3 | 10.2 | 2.9 | 30.3 | −3.2 |
| Gisborne Airport | 778 | 93 | 2103 | 09 | 14.1 | 24.9 | 12.8 | 10.6 | 3.8 | 35.1 | −1.2 |
| Waikaremoana (Onepoto) | 1589 | 165 | – | 08 | – | 21.4 | – | 9.2 | 2.5 | 33.6 | −2.5 |
| Napier | 549 | 76 | 2075 | 13 | 14.3 | 24.2 | 12.9 | 12.7 | 4.0 | 31.8 | −3.5 |
| Palmerston North DSIR | 792 | 132 | 1432 | 10 | 12.8 | 19.4 | 11.4 | 11.7 | 3.9 | 25.6 | −1.7 |
| Wellington (Kelburn) | 1300 | 130 | 1960 | 00 | 12.4 | 18.9 | 10.3 | 12.2 | 5.8 | 24.5 | 0.2 |
| Wanganui | 692 | 115 | 1766 | 01 | 13.4 | 19.6 | 12.1 | 12.6 | 4.4 | 29.6 | −0.5 |
| Westport Airport | 2285 | 175 | 1616 | 03 | 11.8 | 17.1 | 11.8 | 10.5 | 3.7 | 22.7 | −0.3 |
| Hokitika Airport | 3357 | 191 | 1679 | 17 | 11.0 | 16.9 | 11.0 | 10.0 | 1.9 | 24.0 | −3.0 |
| Milford Sound | 7712 | 208 | – | 49 | 9.5 | 15.8 | 8.5 | 8.3 | 0.9 | 21.6 | −2.7 |
| Nelson Airport | 1004 | 96 | 2322 | 41 | 12.0 | 21.2 | 11.7 | 11.1 | 0.2 | 28.5 | −3.8 |
| Blenheim | 666 | 73 | 2301 | 34 | 12.7 | 23.9 | 12.5 | 11.2 | 0.6 | 32.0 | −4.4 |
| Hanmer Forest | 1217 | 133 | 1711 | 85 | 10.2 | 21.2 | 9.0 | 8.6 | −1.1 | 32.9 | −8.0 |
| Lake Coleridge | 1038 | 119 | – | 67 | 10.0 | 19.8 | 8.7 | 8.2 | −1.4 | 31.5 | −5.9 |
| Christchurch | 737 | 93 | 2044 | 31 | 11.8 | 22.4 | 10.1 | 10.3 | 1.5 | 33.8 | −3.4 |
| Lake Tekapo | 769 | 91 | – | 96 | 8.2 | 18.5 | 4.1 | 7.4 | −3.7 | 30.0 | −10.0 |
| Timaru | 689 | 88 | 1728 | 26 | 10.7 | 20.4 | 9.0 | 10.1 | 1.0 | 30.3 | −2.5 |
| Dunedin (Musselburgh) | 968 | 117 | 1376 | 00 | 10.5 | 18.0 | 9.5 | 10.2 | 3.0 | 29.7 | 0.0 |
| Queenstown | 1060 | 120 | 1718 | 53 | 9.9 | 19.2 | 6.6 | 8.7 | −0.8 | 31.0 | −4.5 |
| Cromwell | 520 | 81 | 1958 | 86 | 10.7 | 21.4 | 6.8 | 8.8 | −1.5 | 32.8 | −7.3 |
| Gore | 1068 | 159 | 1349 | 33 | 9.3 | 17.4 | 8.1 | 8.6 | 1.1 | 30.6 | −2.6 |
| Invercargill Airport | 1198 | 181 | 1334 | 36 | 9.4 | 17.1 | 9.3 | 8.4 | 1.3 | 29.8 | −3.9 |
For 1983 the mean sea level pressure values in millibars at 0900 hours New Zealand Standard Time were: Auckland, 1017.4; Kelburn, Wellington, 1014.5; Nelson Airport, 1015.0; Hokitika Airport, 1014.8; Christchurch 1012.8; and Dunedin Airport, 1012.3.
FURTHER INFORMATION—Further information on the geography and climate of New Zealand will be found in the following publications.
New Zealand Atlas—Government Printer.
Encyclopaedia of New Zealand—Government Printer.
New Zealand Gazette—Government Printer.
New Zealand Seismological Report—Geophysics Division, DSIR.
Rainfall Observations—New Zealand Meteorological Service.
Meteorological Observations—New Zealand Meteorological Service.
Table of Contents
The early history of the people of New Zealand and the coming of the Maoris is shrouded in myth and based on orally-transmitted traditions. It is difficult to establish the period when the voyages of the Polynesian people to New Zealand began. Tradition has it that the first voyager to visit New Zealand was Kupe in about 950 A.D., and according to some Maori tribes it was he who named the land Aotearoa (“land of the long white cloud”). Finding no other inhabitants Kupe returned to Hawaiki, the legendary homeland of the Maori. Following his return there were various waves of migration to New Zealand, and the names of the canoes and of their captains and crews are still remembered by the Maoris and are important features of their history and genealogy.
Linguistic and other evidence indicates that Hawaiki was situated in Eastern Polynesia, which makes their voyages impressive and bears testimony to the sophistication of their vessels and navigation.
From the people of each canoe arose tribal groupings claiming common descent and symbolic unity. About 10 major tribes evolved, divided into many subtribes. All tribes can claim their ancestry back to members of one or more of the canoes, and many of the more familiar canoes such as Aotea, Te Arawa, Tainui, and Takitimu have become synonymous today with tribal groupings and territories.
The Maoris mainly confined themselves to the warmer North Island and the population was organised into descent groups of different scale-tribes (iwi), subtribes (hapū), and extended families (whānau). The main themes in this society were mana (prestige), tapu (sacredness) and utu (the principle of equal return, often expressed in revenge).
The bases of Maori society have changed profoundly from the original subsistence economy in pre- European contact times.
The introduction of European disease and firearms, and the impact of European civilisation on the traditional way of life and customs of the Maoris, had such an adverse effect that their numbers must have been reduced by over half during the nineteenth century. However from the beginning of the twentieth century the Maori population has been rapidly increasing, and now forms 9 percent of the New Zealand population.
Discovery by Europeans—On 13 December 1642, Abel Janszoon Tasman, a navigator of the Dutch East India Company, discovered the country to which he gave the name of Staten Land, and which later became known as “Nieuw Zeeland”. Tasman had left Batavia on 14 August 1642, and after having discovered Tasmania, he steered eastward and sighted the west coast of the South Island, described by him as a high mountainous country. Sailing north he came into conflict with the Maoris at Golden Bay, on the north coast of the South Island, so that, though he continued his northward journey until he reached the northern tip of the country, he did not again attempt to land.
There is no record of any European visit to New Zealand after Tasman's departure until Captain (then Lieutenant) James Cook sighted land on 7 October 1769 near Gisborne. Cook and a party of men from the Endeavour landed at Gisborne on 9 October 1769. On his first voyage Cook spent 6 months exploring the New Zealand coastline, and he completely circumnavigated the North and South Islands. His activities can best be described by saying “he found New Zealand a line on a map, and left it an archipelago”. Not only was Cook's ability shown by his cartographical accuracy, but also in his peaceful dealings with the Maoris. He returned to New Zealand again in 1773, 1774, and in 1777. His careful observations made New Zealand known to the western world; the accounts of his voyages were translated into a dozen languages.
First European Settlements—Whaling stations sprang up along the New Zealand coast from 1792 onwards and a trade with New South Wales began not only in whale oil and seal skins, but also in flax and timber. In 1814 Samuel Marsden, chaplain to the Governor of New South Wales, was responsible for the establishment of the first mission station in the Bay of Islands.
The growing white population in the Bay of Islands, and the lawlessness of crews of visiting ships led to the appointment by the British Government of James Busby as British Resident art Waitangi in 1833. The Governor of New South Wales in 1837 sent Captain William Hobson, in command of HMS Rattlesnake, from Sydney to the Bay of Islands to report on New Zealand. Among other things, Hobson suggested a treaty with the Maori chiefs and the placing of British subjects under British law. On 29 January 1840 Hobson arrived at the Bay of Islands as Governor to proclaim British sovereignty.
By 1840 numerous mission stations had spread through the northern half of the North Island. Conversion of Maori tribes to Christianity was accompanied by the introduction of new crops and methods of cultivation and the pacification of warring tribes.
Early Constitutional Developments—On 29 January 1840 Captain William Hobson, R.N., arrived in the Bay of Islands. His instructions from the British Government required him to take possession of the country with the consent of the Maori chiefs. Hobson read his commission at Kororareka on 30 January and on 6 February 46 chiefs signed the Treaty of Waitangi, a compact whereby all rights and powers of sovereignty were ceded to the Queen, all territorial rights were secured to the chiefs and their tribes (with the Crown having the sole right of purchase) and in return the Queen extended her protection and all the rights and privileges of British subjects. Other chiefs throughout both islands later adhered to this Treaty.
On 21 May 1840 Governor Hobson proclaimed British sovereignty over the North Island by virtue of the Treaty of Waitangi, and over the South Island and Stewart Island by right of discovery. New Zealand remained a dependency of New South Wales until 3 May 1841, when it was created a separate colony by Royal Charter dated 16 November 1840. The capital was at first transferred from Russell to Auckland, but in 1865 it was again transferred, on this occasion to Wellington, where the seat of Government has since remained.
During Governor Grey's term, steps were taken to draft a constitution for the colony. An Act granting representative institutions was passed by the Imperial Parliament on 30 June 1852, and was published in New Zealand by Proclamation on 17 January 1853. Under it, provision was made for the constitution of a General Assembly consisting of a Legislative Council and a House of Representatives. Provision was also made for the division of the country into provinces, each province having an elected Council and Superintendent. (The provincial system was abolished in 1875 and the Legislative Council in 1950.) In the first General Assembly of 27 August 1854 certain members of this body were associated with the permanent members of the executive but they did not hold any portfolios. It was not until 7 May 1856 that responsible government was actually established.
One aspect, that of Native Affairs, was withheld from the responsible Ministers, and the Governor, as representative of the Crown, continued to act independently of his elected advisers in this sphere. In 1861 Grey attempted unsuccessfully to hand over this responsibility but the Ministers were unwilling to assume responsibility for the cost of the growing hostilities between Pakeha and Maori. Finally in 1864 Sir Frederick Weld instituted the “self-reliant policy” whereby the colony accepted responsibility for the settlement of difficulties with the Maoris and consented to the withdrawal of troops by the Imperial Government.
Colonisation—The first body of European immigrants to reach New Zealand under a definite scheme of colonisation arrived at Port Nicholson, Wellington, on 22 January 1840 to found the initial settlement of the New Zealand Company. The colonists were in the main resourceful people seeking a better future than was offering in nineteenth century industrial England.
Founder of the company, Edward Gibbon Wakefield, aware of the intention of the British Government to annex New Zealand, had earlier (in 1839), dispatched his agents in order to purchase large areas of land from the Maoris before the Crown could assume a monopoly of land purchase.
Wakefield's scheme of colonisation was based on the sale of land to investors for development by labouring class immigrants. With the profit from land sales the company could bring out more immigrants. Wakefield aimed at a balance between landowners and labourers; in effect he aimed to transplant a cross-section of English society. But, ignorant of the system of tribal ownership of Maori land, the company had bought land from individual Maoris; then Hobson provided that all European land titles should derive from the Crown which would be the only purchaser of land from the Maoris. Title to land remained a difficulty for some years and was a cause of distress to the colonists and, combined with a considerable degree of absentee ownership and land speculation, made most precarious the existence of the early company settlements of Wellington, Wanganui, New Plymouth, and Nelson. The company had brought nearly 10 000 persons to New Zealand by 1848. The later settlements of Otago, in 1848, and Canterbury, in 1850, organised under the aegis of the New Zealand Company in co-operation with the Free Church of Scotland and the Church of England respectively, achieved a much greater measure of success owing to the absence of any large Maori population and to satisfactory land purchase arrangements.
The non-Maori population in the main settlements in 1842 totalled 3801 in Wellington. 2895 in Auckland, 2500 in Nelson, 895 in New Plymouth, 380 in Russell, 263 in Hokianga, and 198 in Akaroa. By 1862 the non-Maori population had reached 125 000 (as against 55 000 Maoris) and by 1866 it had jumped to 200 000 with people from Australia joining in the gold rush to Otago. Migration then dropped away until 1874 when there was a high inflow for several years from Britain under the Vogel policy of assisted immigration and public works development.
War Over Land—After the death of Hobson in 1842, the Colonial Office appointed Captain George Grey as Governor and provided him with adequate funds and troops so that he soon restored order and won not only the confidence of the Maoris but also for a time that of the settlers. Grey, through his chief land purchase officer, Donald McLean, endeavoured to buy up land in advance of the settlers' needs in order to prevent conflict between settlers and Maoris. By 1858 the Census of Population revealed that the settlers outnumbered the Maoris who, fearful that they were being swamped by the settlers, became increasingly reluctant to sell their land. At the same time the intensified settler pressure for more land led McLean to negotiate only with those Maoris still favourably disposed to land sales. This practice alarmed the other Maoris and finally the war broke out in 1860 over a land dispute at Waitara in Taranaki where settler demand for land was strongest. The return of Grey as Governor did not solve the problem for, as an autocrat, he could not work with elected ministers nor could he regain the confidence of the Maoris, and finally he quarrelled with the commander of the Imperial troops. Widespread confiscation of Maori land by the settlers' government in order to pay the cost of the war included land belonging to friendly as well as hostile Maoris and aroused further resentment. The war had died down by 1870 and during the term of Donald McLean as Native Minister some measure of reconciliation began. However, although a substantial portion of the confiscated land was subsequently purchased or returned, land transactions remained a source of bitterness and potential hostility between Maori and settler.
Public Works and Farm Development—The absence of hostilities and the discovery of gold had allowed the South Island to obtain a lead in commercial and political development which it long maintained. Moreover, with the subsequent agrarian expansion especially in the development of the large pastoral holdings, the country ceased to be merely self-sufficient agriculturally and began to develop a substantial export trade, mainly in wool.
By 1870 the gold boom had ended in the South Island. To remedy the situation of economic stagnation, Sir Julius Vogel began a policy of extensive borrowing for railway and road construction and for immigrant labour. The results of this policy were to double the population to 500 000 by 1880, to immensely improve transport and communications, and to encourage industry in the towns where most of the immigrants had congregated.
With the introduction of refrigeration in 1882 and steam navigation in the late 19th century, the development of exports of frozen meat and dairy products assured the dominance of the United Kingdom in New Zealand's external trade. These developments, with a continued substantial investment of British capital, particularly in farming and food processing industries, established the degree of specialisation to meet the needs of the British markets, which shaped the entire New Zealand economy during its first hundred years.
The depression of the 1880s, a consequence of a fall in world price levels, resulted in unemployment and substantial emigration, but export prices recovered in the nineties. From 1880 onwards the natural increase of births over deaths exceeded the net inflow from migration.
In 1891 John Ballance, as leader of the Liberal Party, became Premier to be followed on his death in 1893 by Richard John Seddon, who remained premier until his death in June 1906. The Government pursued a vigorous legislative programme in which the main emphasis was on social justice.
The expansion of the exports in dairy produce and frozen meat during the 1890s produced more intensive settlement and the rise of a new farming class in which the “cow-cockie” was the dominant figure. These farmers, having benefited by the spread of prosperity, were in 1911 mainly responsible together with the city businessmen for the overthrow of the Liberal regime. The new Reform Government under William Massey introduced measures to strengthen the primary producer, of which the extension of rural credit was typical.
Three years after the advent of the Reform Party, the First World War (1914–1918) broke out, leading to a Coalition Government and an Imperial Commandeer of exports which created the precedent for the establishment after the war of central boards to regulate the exports of pastoral products. War activities were marked by heavy casualties in proportion to the population while the landing at Gallipoli signified the growing awareness of a sense of nationhood.
Though the effects of the post-war depression during the period 1921–24 showed themselves in an increase in unemployment and slight wage reduction, no drastic legislation was necessary to stabilise economic conditions. During the following years the price level rose; and on the administrative side, the period was characterised by extensive public works expenditure, with particular attention to hydroelectric schemes and highways.
Land values rose steeply, accelerated by Government efforts to settle returned servicemen on the land, and between 1915 and 1925 forty percent of the occupied land had changed hands. New Zealand was extremely vulnerable to the overseas price fluctuations of pastoral products. With the advent of the depression by 1930, farmers, despite greatly increased production, were faced with a serious decline in income (over forty percent) together with heavy mortgage commitments on land bought at high prices so that many were faced with foreclosure. In the towns, tradesmen and shopkeepers faced bankruptcy, and wage earners unemployment or reduction in wages. A Coalition Government was formed in 1931 to meet the crisis. Partly as a result of measures taken by this government and partly as a result of a rise in overseas price levels a general economic revival was taking place by 1935. The election of a Labour Government, under the leadership of Michael Savage, in 1935 led to change in administrative policy and a renewed emphasis on social problems.
War and Post-war—The financial needs of the Second World War from 1939 onwards were mat with virtually no overseas borrowing. Financing the war by taxation and internal borrowing also assisted in the achievement of a successful stabilisation policy. Full employment in war was followed by full employment in peace. Expansion and diversification of manufacturing and servicing industries provided avenues of employment for the growing labour force.
At the 1949 election the Labour Government was defeated after holding office since 1936. It was succeeded by a National Government, under the leadership of Sidney Holland.
In 1957, the Labour Party gained a narrow victory at the polls under the leadership of Walter Nash. Budgetary policy to meet a recurrence of the balance of payments crisis proved unpopular and at the 1960 election, the National Party under the leadership of Keith Holyoake was returned to power, as it was in subsequent elections in 1963, 1966, and 1969. At the 1972 election the Labour Party swept back into power under Norman Kirk. Following Kirk's untimely death in 1974, W. E. Rowling became Prime Minister. At the 1975 election there was a dramatic reversal of the position 3 years earlier, and the National Party under Robert Muldoon was returned to power with a substantial majority. The new Government faced growing economic difficulties and rising unemployment as a result of economic recession overseas, steep rises in oil prices, and the loss or shrinkage of traditional markets for agricultural products. At the 1978 election and again in 1981 the National Party retained power with greatly reduced majorities. In 1984 following a snap election the Labour Party gained power under the leadership of David Lange.
Later Constitutional Developments—In 1907, in recognition of an emerging sense of nationality and an increasing desire for self-reliance in political matters, New Zealand had been given the title of Dominion in lieu of Colony.
A further step in the evolution of New Zealand into full nationhood came in 1947, when New Zealand belatedly adopted the Statute of Westminister, which had been passed by the United Kingdom Parliament in 1931. The draft of this statute had been submitted for the confirmation of the various Commonwealth legislatures before its passage through the United Kingdom Parliament. The statute granted complete autonomy to the various self-governing member countries, but it did not automatically apply to Australia or New Zealand. Its operation in the latter self-governing members of the Commonwealth was declared to require specific adoption by the legislatures of those countries.
Some surviving doubts concerning the authority of the New Zealand Parliament over the Constitution were resolved when, at the request of the New Zealand Parliament, the United Kingdom Parliament passed a Constitution Amendment Act authorising the New Zealand Parliament to amend any of the provisions of the Constitution Act of 1852.
In 1950 the Prime Minister, Sidney Holland, initiated a constitutional change when the Legislative Council, the “second house” of the General Assembly, was abolished on the grounds that it no longer possessed any effective function.
The present Constitution and recent developments are dealt with later in this section under the heading, “The Constitution of New Zealand”.
DEVELOPMENT OF INTERNATIONAL RELATIONS—The emergence of a distinctive and independent New Zealand foreign policy is usually regarded as dating from 1935, following the election of a Labour Government under Michael Savage.
The contrast between the policies followed in the 1920s and those adopted under the Savage Government from the close of 1935 is most clearly illustrated by the New Zealand attitude to the League of Nations. From the foundation of the League following the Peace Conference at Versailles, Massey and those who followed took the view that the League was no place for a loyal Dominion to voice views that contradicted Imperial policy. With the coming to power of the Savage Labour Government there re-emerged a willingness to take an independent line that had lain largely dormant since the death of Seddon. New Zealand spoke strongly for the principle of collective security and collective police action on a succession of issues (Abyssinia, Spain, China) at a time when the United Kingdom and other powers were following a policy which would later be described as appeasement.
Despite these differences there was no suggestion that New Zealand was departing from its historically close association with Britain. The course it would follow in the event of war was never in doubt. When war broke out the Prime Minister, the Right Hon. M. J. Savage, expressed New Zealand's position in terms which reflected New Zealand's sovereignty as well as its ties with Britain:
“Behind the sure shield of Britain we have enjoyed and cherished freedom and self-government. Both with gratitude for the past, and with confidence in the future, we range ourselves without fear beside Britain. Where she goes, we go. Where she stands, we stand. We are only a small and young nation, but we are one and all a band of brothers, and we march forward with a union of hearts and wills to a common destiny.”
Post-War Policies—The Second World War changed the pattern of power in the world. The New Zealand Government established (in effect from 1943) a career foreign affairs service, and made a beginning in stationing its own diplomatic representatives in countries where New Zealand's interests made their presence necessary. In particular, New Zealand sought to foster good relationships with its neighbours in the Pacific and Asia and to increase the measure of security and welfare in these areas.
Woven into post-war policy was the traditional New Zealand belief in the principles of collective security and international justice, which the United Nations was pledged to support. There was also the belief that the international community should give high priority to the welfare and political advancement of dependent peoples and to the elimination of poverty, disease, and other economic and social causes of international tension.
There have been several periods of expansion in the establishment of New Zealand posts overseas. Aside from the three posts set up during the Second World War (Washington, Ottawa, Canberra) to maintain consultations with our closest allies, the first main period of expansion came in the 1950s as a consequence of the recognition that our security was closely bound up with that of South-east Asia. Following the signature of the ANZUS Treaty, which came into force in 1952, and the Manila Treaty in 1954, diplomatic relations were established with a growing number of Asian countries. By the end of the 1950s five New Zealand posts had been set up in Asia and the substance of our bilateral relations had broadened considerably.
A second period of expansion in the 1960s led to the setting up of a number of diplomatic posts in Western Europe in response to the need to defend New Zealand's essential economic and political interests as Britain negotiated its terms of entry into the European Economic Community. At the same time a more gradual expansion was under way in the Pacific. As island states became independent and as the extent of New Zealand's economic and political relations in the South Pacific increased, a number of South Pacific posts were opened. A fourth phase, still under way, is closely related to New Zealand's search for new trading opportunities as the degree of dependence on traditional markets gradually declines. The diversification both in the range of goods exported and in markets led to the strengthening of posts in certain areas—particularly in Asia and the Pacific—and the opening of posts in the Middle East, Latin America, and China, in addition to the reopening of the post in the Soviet Union. An extensive network of multiple accreditations has allowed New Zealand's overseas representatives to cover several countries from the one base.
While New Zealand's overseas relations continue to grow, economic constraints in recent years have resulted in a continuing reappraisal of the pattern of overseas representation. This has led to the closure of 3 posts (Port of Spain, Toronto, New Delhi), and staffing reductions in remaining posts.
In response to developing New Zealand interests elsewhere, a post was opened in Mexico in 1983, and another is planned to open in Saudi Arabia in 1984. As at November 1983, New Zealand has 45 posts overseas, details of which are given in the Official Section of this Yearbook.
Commonwealth—As a member of the Commonwealth, New Zealand is able to consult and co-operate with 48 other countries in a wide variety of activities, both governmental and non-governmental. The value to New Zealand of its Commonwealth links is derived not only from the practical benefits of what the Commonwealth does, but also from the heterogeneous composition of the association. Its 49 members take in the 6 continents and the 5 oceans of the world. The Pacific region is now well represented in the Commonwealth: Fiji, Tonga, Western Samoa, Papua New Guinea, Solomon Islands, Kiribati, and Vanuatu are full members, along with Australia and New Zealand, and Nauru and Tuvalu have special membership status. The Cook Islands and Niue are not eligible for full membership because of their continuing constitutional association with New Zealand. They cannot therefore attend Commonwealth heads of government meetings, but they are entitled to participate in Commonwealth meetings dealing with those subjects for which their governments are responsible.
The belief of member counties in the potential of the Commonwealth led to the establishment of a permanent Commonwealth Secretariat in London in 1965 to be the main agency for multilateral communication among Commonwealth governments. The Secretariat promotes consultation and disseminates information on matters of common concern, organises meetings and conferences, and coordinates many Commonwealth activities. Prominent among these is the Commonwealth Fund for Technical Co-operation, financed by voluntary contributions to promote economic development through self-help and mutual assistance.
Besides contributing to the budget of the Commonwealth Secretariat and the Commonwealth Fund for Technical Co-operation, New Zealand provides financial support to a number of other inter-governmental Commonwealth organisations which promote co-operation in specific areas. New Zealand also contributes to the Commonwealth Foundation, which was established at the same time as the Secretariat to promote close links in the professions throughout the Commonwealth. It has sponsored official and non-official Commonwealth professional organisations and strengthened the links between administrators, engineers, lawyers, accountants, scientists, and private individuals in the different Commonwealth organisations. Like the Secretariat it has provided a focus for Commonwealth activities and a basis for extending international co-operation.
Western Europe—New Zealand has a great deal in common with the countries of Western Europe in terms of historical experience (notably immigration links), democratic political systems, shared values, and related life styles. Nowadays the community's importance as a market for agricultural exports tends to emphasise the economic aspects of the relationship; the European Community is New Zealand's largest export market and trading partner.
Nevertheless the range of bilateral contacts between New Zealand and the individual countries of Western Europe in all fields is steadily expanding. The benefits of exchanges and co-operation with Western Europe generally, and the European Economic Community in particular, have come to assume greater significance in the wider international setting of New Zealand's political and economic objectives.
In terms of the New Zealand/Community relationship, they reflect above all a fundamental appreciation on New Zealand's part of the progress achieved to date by the community's members (currently comprising 10 states, and shortly to become 12, following the accession of Spain and Portugal in 1986) in co-ordinating and co-operating in the conduct of their mutual affairs.
So far this has been predominantly in the economic sphere (the EEC now constitutes the world's largest trade grouping). But the community also has steadily expanded its interests in broadening and making more effective co-operation at the political level. New Zealand, like other countries with already well-established ties to individual community members, will be following developments in European political co-operation closely.
The community of broad interests between New Zealand and Western Europe is further underlined by New Zealand's participation in such multilateral co-operative and consultative organisations as the Organisation for Economic Co-operation and Development (OECD) and the International Energy Agency (IEA).
Altogether in Western European circles there is now appreciably greater attention to New Zealand's region of the world (encompassing South-east Asia, the South Pacific, and Antarctica).
Soviet Union and Eastern Europe—Relations and trade with the countries of Eastern Europe have been developed in recent years, and this has been reflected in the expansion of New Zealand's diplomatic representation in the area. New Zealand's Ambassador in Vienna is accredited to five East European countries (Poland, Hungary, Romania, Czechoslovakia, and the German Democratic Republic); and the Ambassador in Rome is accredited to Yugoslavia. Relations with the U.S.S.R. have been adversely affected by the Soviet intervention in Afghanistan in 1979 and Soviet attitudes to developments in Poland, but the Soviet Union has become a major market for New Zealand's exports.
Middle East—Involvement in the Middle East has increased markedly within the past decade. For more then 30 years New Zealand has watched the Arab-Israeli conflict with concern, if from a distance. Recognising the implications for world peace this country has contributed personnel to United Nations truce observation teams. Early in 1982 it also supplied a small contingent to the Sinai peace keeping force. New Zealand has consistently upheld Israel's right to exist and, equally consistently, the rights of the Palestinian people to self-determination.
Since 1973, when Middle East members of the Organisation of Petroleum Exporting Countries (OPEC) emerged as a major economic force in the world, the area has increasingly assumed a direct and immediate importance for this country. Although 63 percent of New Zealand's crude oil imports in 1982–83 came from Indonesia, the growing wealth of the Persian Gulf region (due largely to substantial increases in the price of oil) has created new markets for New Zealand exports. These include manufactured goods and agricultural products. In 1982 the region absorbed a considerable amount of New Zealand's total sheepmeat exports. The Middle East, moreover, represents a significant source of investment finance.
New Zealand in recent years has made continuing efforts to broaden its range of contacts with Middle Eastern countries. At the same time, those countries have themselves taken a closer interest in New Zealand and the South Pacific and have expanded their diplomatic representation in the area. Egypt and Israel have embassies in Wellington, while Iran, Iraq, Lebanon, and Libya have cross-accreditation from Canberra. New Zealand established resident missions in Iran and Iraq in 1975, and in 1977 established a consulate-general in Bahrain, with commercial responsibilities in Saudi Arabia, the Gulf emirates, and the Yemens. The pattern of representation is rounded out by the cross-accreditation of the ambassador in Rome to Egypt and to Saudi Arabia. An embassy is to be established in Jeddah during 1984.
Closer relations between New Zealand and the Middle East have been marked by a growing appreciation of each other's concerns. This has been fostered by visits in both directions by ministers, officials, and businessmen. Also, a growing number of tourists, students, and sports teams are coming to New Zealand, a trend that is expected to continue.
Africa—Contacts with African countries have been mainly within the Commonwealth and the United Nations. It is in these settings that the major political and economic issues relating to the emergence to independence and the subsequent development of African countries have been presented. These forums have also been where New Zealand has joined with the international community in opposing South Africa's policy of apartheid or racial separation.
New Zealand does not have resident diplomatic or consular representation in Africa. The New Zealand Ambassador in Athens is cross-accredited as High Commissioner to Tanzania and Kenya. The High Commissioner in London is accredited to Nigeria.
New Zealand's policy on sporting contacts with South Africa continues to be the subject of considerable international attention. The Government joined with other Commonwealth governments in June 1977 in a statement, commonly known as the Gleneagles Agreement, which condemns apartheid (especially apartheid in sport) and pledges each Government to do all it can to discourage sporting contacts with South Africa or any other country where sports are organised on the basis of race. Gleneagles also seeks the support of individuals and sports organisations in the pursuit of this objective. In October 1982 the Commonwealth Games Federation adopted into its constitution a Code of Conduct which expressly sets out the responsibilities of Commonwealth sportsmen and sporting bodies under Gleneagles and provides for exclusion from participation in future Commonwealth Games of those who do not meet those responsibilities.
In a variety of ways, New Zealand has contributed to the economic and social development of African countries—with bilateral assistance and by contributions to Commonwealth and other multilateral programmes. Support for political development has also been given, most notably in contributions during 1980 to Commonwealth monitoring forces and observer teams in both Zimbabwe and Uganda.
New Zealand's total trade with African countries amounts to only a modest percentage of its global trade, but there has been growth in the volume of both exports and imports. Trade surveys have been undertaken in East, North, and West Africa to identify commercial opportunities. The major New Zealand exports are milk powder, tallow, butter, fish, and wool. The main imports from Africa are cocoa, coffee, sisal, vegetable oil, tanner extract, and tobacco.
Asia—During the last 25 years there has been a considerable expansion in New Zealand's relations with countries in Asia. New Zealand has a direct interest in the maintenance of peace and the growth of prosperity in the area. It enjoys a close relationship with Japan, the Republic of Korea, and with the countries which make up the Association of South-east Asian Nations (ASEAN): Indonesia, Malaysia,
Singapore, Thailand, and the Philippines. Since the establishment of relations with the People's Republic of China in 1972, New Zealand's contacts with China have been increasing.
Trade with Asia is becoming more and more important to New Zealand. Private initiative, with Government assistance, has been able to develop new markets, new products, new selling processes, and new economic and commercial relationships. A pattern of regular economic consultations with our main trading partners has been developed; bilateral economic agreements have been concluded.
New Zealand's growing interests and involvement in Asia are reflected in the changing pattern of its diplomatic representation. Prior to 1955, when New Zealand opened a post in Singapore, it had only one diplomatic mission in the region, in Tokyo. Representation has now been established in all five of the ASEAN countries, and in Peking, Hong Kong, and Seoul. Several of these missions are also accredited to other Asian capitals. The network thus created enables New Zealand to assess external events in the light of this country's own interests and needs, and to work directly with other countries in areas of common concern. New Zealand has also developed its political contacts with countries of the area in other important ways. Exchanges of visits by heads of state and government ministers and parliamentarians have increased, and the development of regular bilateral consultations has also been encouraged.
New Zealand has placed particular emphasis on supporting regional organisations for co-operation and consultation in both the political and economic fields. It is one of a group of nations closely associated with ASEAN, which it sees as a force for stability and economic development in South-east Asia. It has initiated a number of joint projects with ASEAN for development and trade co-operation. Recent developments in Indochina have had major implications for the stability of the region and have been of particular concern to New Zealand. The massive outflow of refugees from Vietnam and Kampuchea, and the political uncertainties stemming from the continued presence in Kampuchea of Vietnamese forces have together posed difficult problems for the countries of the region. New Zealand has consulted closely with the ASEAN countries over these developments.
The degree of cultural interchange between New Zealand and the countries of Asia has increased steadily. Where once New Zealanders looked largely to Britain for cultural inspiration and experience, now their horizons have broadened. Increased contacts with Asia have brought with them an awareness of what the cultural background of the countries there can offer New Zealand. Professional bodies, sporting associations, cultural groups, and universities today have links with similar organisations in Asia, as well as with more traditional partners such as Britain and Australia. The development of civil air links, and the concurrent growth of tourism, have also helped to bring a wider range of contacts.
Nowhere within the Pacific Basin has New Zealand's adaption to changed circumstances been more complete than in its relationship with Japan. Today that association is one of the most important that New Zealand has and it is friendly and rewarding for both sides. Its elements are varied—trade, fishing, and a growing range of cultural, educational, sporting, and personal ties. In many ways, the conditions for a developing trading relationship are ideal, for the two countries are located in different hemispheres, their economies are complementary, and each has in abundance some things that the other needs. New Zealand continues to seek improved conditions of access for certain important commodities, including dairy products, and on both sides there are expectations of continued and expanding trade and of closer involvement together in other settings. Meanwhile, the steady growth in the extent and cordiality of New Zealand's relations with the People's Republic of China further illustrates New Zealanders' changing preceptions of Asia. China is now our second largest market there and is important to New Zealand as a major power with a leading role in Asia.
South Pacific—New Zealand has a long history of interest and involvement in the South Pacific. In the latter part of the 19th century Prime Minister Richard Seddon harboured ambitions of a South Pacific empire controlled by New Zealand, and as a result of pressure from Seddon the administration of the Cook Islands and Niue, which were British colonial possessions, was handed over to New Zealand in 1901. The number of New Zealand Pacific dependencies increased when, following the establishment of the League of Nations, Western Samoa, which had been occupied by New Zealand troops at the outbreak of the First World War, became a mandated territory under the administration of New Zealand. In 1925 the Tokelau Islands (now known as Tokelau) then part of the Gilbert (Kiribati) and Ellice Islands (Tuvalu) Colony, were ceded by the United Kingdom to New Zealand.
Despite its geographical situation, the acquisition of overseas dependencies in the South Pacific, and the ethnic kinship of the Maori and Polynesian peoples, New Zealand's present identity as a South Pacific country was slow in developing for a number of reasons. Culturally, New Zealand has been closer to Western Europe than to the Pacific. For many years almost all of New Zealand's exports went to the United Kingdom. Politically, New Zealand's outlook was oriented towards Europe and, more recently, South-east Asia. Also the Pacific Islands were, and in some cases still are, administered by other countries.
But during the 1960s there was a dramatic emergence of new nations in the South Pacific. New Zealand led this development with moves in its own territories.
In Western Samoa, which had become a United Nations Trust Territory administered by New Zealand, political and constitutional development was carried forward in accordance with the wishes of the Samoan people. This culminated in the establishment of the independent State of Western Samoa on 1 January 1962. The Cook Islands voted under United Nations supervision in 1965 to become a self-governing state in free association with New Zealand. Niue achieved a similar status in an act of self-determination in 1974. Under their respective constitutions the Cook Islands and Niue governments have full legislative and executive competence over all their affairs. The constitutional relationship provides for the exercise by New Zealand of certain responsibilities for the defence and external relations of the Cook Islands and Niue (in the former case, in consultation with the Cook Islands Prime Minister). This does not confer upon the New Zealand Government any rights of control: the Cook Islands and Niue governments retain legislative and executive powers in these fields as in all other matters.
The relationship between the Cook Islands and New Zealand was elaborated in the 1973 Exchange of Letters between the then New Zealand Prime Minister, the Rt. Hon. Norman Kirk, and the Premier of the Cook Islands, Sir Albert Henry. The Prime Minister's letter described the relationship as “one of partnership, freely entered into and freely maintained”. The central features of the partnership are common citizenship and the same head of state. The Cook Islands can at any time amend its constitution to end the “free association” status in favour of complete independence. These points apply equally to the relationship with Niue (though the Cook Islands now has its own Queen's Representative).
The Cook Islands and Niue not only have full constitutional capacity to conduct their own external relations and to enter directly into international arrangements and agreements, but they also in fact directly conduct certain aspects of their external relations. Their capacity to do so is limited only by the extent to which the governments of other states will accord them recongnition and deal with them. In practice, the Cook Islands and Niue have participated on an equal basis with sovereign states in the South Pacific. They are members of the South Pacific Forum, the South Pacific Bureau for Economic Co-operation (SPEC), the South Pacific Commission, and the Forum Fisheries Agency. They have associate membership of ESCAP, and the Cook Islands has joined the Asian Development Bank. The Cook Islands has recently signed on a bilateral basis with the United States a maritime boundary delimitation treaty and it has applied to accede to the Lome Convention.
Tokelau is still included within the boundaries of New Zealand and is administered under the authority of the Tokelau Act 1948 and its amendments. Tokelauans are New Zealand citizens.
In accordance with United Nations resolutions on non-self-governing territories, New Zealand has committed itself to assisting Tokelau towards a greater degree of self-government and economic self-sufficiency. New Zealand has stated that it will be guided by the wishes of the Tokelauan people regarding political developments in the territory and the pace at which greater self-determination is introduced. The Tokelau Amendment Act 1982 was passed at the request of the General Fono, Tokelau's traditional decision-making body, imposing a community services levy on salaries, wages and honoraria paid by the Tokelau Administration.
The developments in New Zealand's territories are part of a wider pattern of political evolution in the region. In 1968 Nauru became an independent republic; in 1970 Fiji became independent; and in the same year Tonga rejoined the Commonwealth. In 1975 Papua New Guinea became fully independent after being self-governing since December 1973. In 1978 the Solomon Islands and Tuvalu (formerly the Ellice Islands) became independent. Kiribati (formerly the Gilbert Islands) attained independence in 1979, and Vanuatu (formerly the New Herbrides) in 1980.
It is natural that New Zealand and its South Pacific neighbours should have become very closely associated. One important reason has been the movement of Pacific peoples into New Zealand. Cook Islanders, Niueans, and Tokelauans are New Zealand citizens and move freely back and forth. New Zealand's historical association with Western Samoa, which is reflected in the Treaty of Friendship signed in August 1962, and its close association with the Kingdom of Tonga, have resulted in a flow of immigrants and visitors from both countries. In 1982 a protocol was added to the Treaty of Friendship on the subject of citizenship.
New Zealand has also played an active role in building up regional co-operation in the South Pacific. A major step in this direction was the creation of the South Pacific Forum, which now comprises the independent and self-governing countries of the South Pacific: Fiji, Nauru, Tonga, Western Samoa, the Cook Islands, Niue, Papua New Guinea, the Solomon Islands, Tuvalu, Kiribati, and Vanuatu, together with Australia, and New Zealand. The Federated States of Micronesia has observer status. The first session comprising 5 of the present island members (Fiji, Nauru, Tonga, Western Samoa, and the Cook Islands), as well as Australia and New Zealand, met at the invitation of New Zealand at Wellington in August 1971. Since then meetings have been held in Canberra (Australia), Suva (Fiji), Apia (Western Samoa), Rarotonga (Cook Islands), Nuku'alofa (Tonga), Nauru, Port Moresby (Papua New Guinea), Niue, Honiara (Solomon Islands), Taraua (Kiribati), Vila (Vanuatu), and Rotorua (New Zealand).
The South Pacific Forum provides the opportunity for the leaders of the South Pacific states to discuss common problems, exchange views, consider priorities, and plan programmes for mutual and regional benefit. The topics considered include such matters as regional trade, shipping, civil aviation, telecommunications, education, the law of the sea, fishing, disaster relief, and nuclear testing.
At the Canberra session of the South Pacific Forum in 1972 members agreed to establish the South Pacific Bureau for Economic Co-operation (SPEC) to deal with trade and relation matters. The main purpose of the SPEC is to advise Forum members on ways of promoting regional trade and free trade among Island members and to encourage collaboration in areas such as regional transport which will assist the economic development of the Island members. The headquarters of the SPEC are in Suva, Fiji.
At the Niue session of the South Pacific Forum in 1978 members agreed to set up the South Pacific Forum Fisheries Agency, which is an organisation designed to facilitate the rational utilisation and conservation of the region's marine resources. The headquarters of the Agency are in Honiara, Solomon Islands.
Recognising that the development of the South Pacific island countries was largely dependent on the existence of regular and reliable shipping services, the governments of the Cook Islands, Fiji, Kiribati, Nauru, New Zealand, Papua New Guinea, Tonga, and Western Samoa established the Pacific Forum Line (PFL) in 1977. Subsequently the Solomon Islands, Tuvalu, and Kiribati joined the Pacific Forum Line while both Australia and Niue, although not shareholders, have made financial contributions to it.
The Pacific Forum Line presently charters three vessels, the Forum New Zealand, the Forum Samoa and the Fua Kavenga, owned respectively by New Zealand, Western Samoa, and Tonga. The headquarters of the line are in Apia.
The Pacific Forum Line has incurred substantial financial losses since it began operations in 1978. Together with other governments in the region, New Zealand has made additional contributions to help the line overcome its financial difficulties. Under an agreement negotiated with the European Investment Bank and endorsed by the 1982 Forum, measures have been taken to put the line on a sound financial basis. New Zealand agreed to contribute half the US$12.6 million required from Forum members. New Zealand and Australia also agreed to fund jointly a new feeder service to Kiribati and Tuvalu managed by the PFL.
The South Pacific Regional Trade and Economic Co-operation Agreement (SPARTECA), which provides that Australia and New Zealand will grant duty-free and unrestricted access on a non-reciprocal basis for most of the products exported by the Forum island countries, was signed at the 1980 Forum. The agreement has since been ratified by New Zealand and a number of other Forum countries and entered into force for these countries on 1 January 1981. SPARTECA also includes provisions relating to economic, commercial, and technical co-operation, aimed at enhancing the export capabilities of the Forum island countries. A Regional Committee on Trade has been set up under the agreement to review its operation regularly.
The South Pacific Commission, created in 1947 by the Canberra Agreement of which New Zealand is a signatory, is the other major regional body. Representatives from 27 governments and territorial administrations from within the South Pacific Commission comprise the South Pacific Conference. The Conference which meets annually decides the work programme of the commission. Since its establishment the commission, which is primarily a technical assistance organisation, has accomplished much in promoting the economic and social welfare of the South Pacific peoples as well as in helping to build a sense of regional identity. The commission's annual budget (which in 1983 will total approximately $4.5 million) is financed for the most part from proportional contributions by participating governments— Australia, the Cook Islands, Fiji, France, Nauru, New Zealand, Niue, Papua New Guinea, Solomon Islands, Tuvalu, the United Kingdom, the United States, and Western Samoa. Other member governments contribute on a voluntary basis.
The United Nations and its specialised agencies are also an important source of technical assistance in the South Pacific. The independent countries of the region are members of various UN bodies, and the United Nations Development Programme (UNDP) has offices in Fiji and Western Samoa.
Australia—New Zealand's most comprehensive bilateral relationship is with Australia. Geographical proximity and shared foreign policy and defence interests reinforced the important historical, cultural, and Commonwealth ties between the two nations that have given rise to this unusually close and mutually beneficial relationship. New Zealand established a diplomatic office in Australia in 1943, very early in its diplomatic history, and in 1944 the Canberra Pact was signed. This paved the way for a tradition of joint consultation and co-operation that reflects the interdependence of the two nations' interests and the goodwill and friendship of their peoples.
In matters of foreign policy, in defence and in the economic field, the degree of co-operation also reflects the importance of each country to the other and a need for continuing close working contacts. Regular and increasingly frequent ministerial and official meetings have taken place, with a minimum of formality, to cover almost the entire range of government activity. Moreover, the two countries are bound together by innumerable personal contacts, widespread family ties, and by institutionalised links in business, finance, education, the professions, and in nearly all fields of national activity. A significant ingredient in the relationship which facilitates these contacts is the free movement of people between the two countries under the trans-Tasman Travel Arrangement.
New Zealand and Australia share a common foreign policy objective in acting to promote stability and development in the South Pacific and South-east Asian regions in their immediate vicinity, as well as a more general interest in co-ordinating their positions on major international political and economic questions of current concern in the United Nations, the Commonwealth, GATT, and elsewhere. In the economic context, Australia is a major trading partner for New Zealand which is in turn Australia's largest single market for manufactured exports. Trade has significantly expanded and the two economies have become increasingly related under the New Zealand-Australia Free Trade Agreement (NAFTA), dating from 1965–66. In the defence field, the former ANZAC partners continue to co-operate closely, both in relation to training programmes and exercises and the provision of equipment and other supplies, and in terms of the broader issues of defence policy, especially in their common membership of ANZUS.
In 1978 the Deputy Prime Minister, the Rt. Hon. B. E. Talboys, paid an extensive visit to Australia. During the visit, Mr Talboys and the Prime Minister of Australia made a joint press statement (the Nareen Declaration) which underlined the determination of both governments to co-operate and consult closely in many fields. The Nareen Declaration also provided for the establishment of an Australia-New Zealand Foundation in both countries to promote the bilateral relationship publicly.
The foundation was set up in 1978. It has an annual budget of $60,000 and has sponsored, as part of its work, studies on closer economic relations between Australia and New Zealand, a workshop on trans-Tasman migration, and a number of other research projects and publications, as well as cultural exchanges between Australia and New Zealand.
In March 1980 the then Prime Minister, the Rt. Hon. R. D. Muldoon and the then Australian Prime Minister the Rt. Hon. Malcolm Fraser, issued a joint communique announcing a set of agreed principles on which the two countries intended their future economic co-operation to be based and according to which the bilateral relationship could be strengthened. This announcement set in train over two years of intensive negotiations on the detail of a new set of arrangements for closer economic relations (CER) between the two countries. On 14 December 1982 the two governments recorded an understanding on the framework of a new treaty to replace NAFTA. The terms of the new agreement, which applied from 1 January 1983, will eventually result in all goods produced in either country being traded between the two countries free of duties and import restrictions. The agreement also contains provisions permitting the development of co-operation in a range of fields to bring about a closer economic relationship.
Americas: United States—Continuing and close contact with the United States is an essential part of New Zealand's foreign policy. The United States remains New Zealand's principal security guarantor, is a major trading partner, and has an important influence on the New Zealand way of life. The two countries share a common English-speaking heritage and a friendship of long standing, both in peace and war.
Since the opening in Washington in 1941 of New Zealand's second diplomatic mission, close consultations have been held with the United States on many bilateral questions and international issues of common interest. Basic similarities in political philosophy and social and economic processes have encouraged the development of close governmental relations, which have been supported by increasing contacts, both official and non-official, across a broad range of activities.
This comprehensive bilateral relationship finds expression in political, strategic, economic, and cultural fields. Under ANZUS New Zealand looks to the United States for assistance in the maintenance of its national and regional security. In turn, where national interests coincide, New Zealand is able to offer the United States active support for constructive international and regional diplomatic efforts. On the economic side, the United States is one of New Zealand's major trading partners. For some products, notably beef, it is this country's largest export market. Regular intergovernmental consultations are held to review the trading relationship. Programmes for scientific and technical co-operation, and academic and cultural exchanges, serve to maintain an awareness of New Zealand in the United States and to promote a vigorous and beneficial interchange of ideas and experience.
Canada—With a common British heritage and long association through the Commonwealth, New Zealand and Canada have traditionally enjoyed a close and easy relationship. Since New Zealand established diplomatic representation in Canada in 1942, the association has been marked by ministerial and official exchanges in many fields in which the two countries' shared democratic traditions and similar attitudes have provided a strong basis for bilateral consultation and co-operation. Similarly, in the international field, and particularly in Commonwealth and United Nations contexts, New Zealand and Canada have a sound record of co-operation. New Zealand's particular interest and involvement in the South Pacific and Canada's in the Caribbean, have provided a basis for the exchange of experience, and both countries take a close interest in developments within the Pacific Basin.
The new trade and economic co-operation agreement concluded in September 1981 provides the basic framework upon which trade and economic relations between the two countries will be developed in future. The 1981 agreement retains the Customs tariff rates currently applying to goods traded between the two countries and, in addition, makes provision for regular consultations with the objective of encouraging a further expansion of trade and economic and technological co-operation. Canada remains one of New Zealand's important trading partners, being at present the second largest market for New Zealand beef and veal.
Caribbean and Latin America—Relations with the Caribbean centre on mutual Commonwealth interests and a useful export trade, largely in dairy products and meat. Since 1974 the New Zealand High Commissioner in Ottawa has been cross-accredited to Trinidad and Tobago, Jamaica, Barbados, and Guyana. New Zealand has given technical assistance to these four Commonwealth countries and to the multilateral Caribbean Development Bank under a modest aid programme. Resident representation, a trade commission in Trinidad and Tobago, was established in 1958, but closed early in 1982 because of the decline in the proportion of New Zealand's exports going to the Caribbean.
Latin America is a region of increasing importance for New Zealand. Relations with the region, limited in the past by geographical orientation and linguistic and cultural differences, developed rapidly in the 1970s. In 1972 the New Zealand Government opened diplomatic missions in Chile and Peru, primarily to support an expanding trade in dairy products with these countries. By cross-accreditation, diplomatic relations have since been established with Brazil, Ecuador, Colombia, and Venezuela. The official visit to Mexico in 1980 by the Prime Minister, the then Rt. Hon. R. D. Muldoon, and a high-level economic mission, has led to a rapid expansion of economic and political relations with that country. A resident diplomatic mission was opened in Mexico City in 1983.
Trade in dairy products, meat, and agricultural technology from New Zealand to Latin America has increased steadily, the principal trading partners in these commodities being Mexico, Peru, and Venezuela. Agriculture is the main field of co-operation. New Zealand maintained a modest but successful pasture and livestock development project (until its completion in mid-1982) under its aid programme in the highlands of Peru. Other interests shared with Latin American countries include Antarctica, the law of the sea, and alternative and renewable sources of energy.
UNITED NATIONS—New Zealand was a founding member of the United Nations and, since the organisation's inception on 24 October 1945, successive governments of this country have strongly supported the development of the UN as a major instrument for maintaining peace and security, for developing friendly relations among countries, for promoting international co-operation aimed at solving economic and social problems, and for ensuring respect for human rights. As a consequence, New Zealand has played an active and prominent role in the UN system.
With the expanding work within the UN's six main organs (the General Assembly, the Security Council, the Economic and Social Council, the Trusteeship Council, and the International Court of Justice), the increase in UN related bodies, and the growth in the range and complexity of functions undertaken by the specialised agencies, New Zealand has had to adopt a more selective approach, concentrating its efforts on areas where it can play a useful and productive role and where matters of particular relevance are involved.
General Assembly—The New Zealand delegation to the 38th session of the General Assembly, held from 20 September to late December 1983, was led by the Prime Minister. The session discussions centred on recent events concerning the Middle East, Central America and the Caribbean, global economic issues, racism and apartheid, Southern Africa, refugees, arms control and disarmament, and human rights. In these areas New Zealand sought to make constructive contributions in either supporting, co-sponsoring or speaking in favour of resolutions which would help to remove international tension, establish economic and political justice for the deprived, and provide humanitarian relief or development assistance to the needy. New Zealand began a 3-year term on the Economic and Social Council in January 1983.
In addition, New Zealand, as outlined below, took an active part in discussions on a wide range of international issues in other UN forums.
Arms Control, Disarmament, Peacekeeping—At the 38th session of the General Assembly, New Zealand co-sponsored a number of resolutions dealing with arms control and disarmament, including a resolution calling for the implementation of a comprehensive nuclear test ban. The need for progress in this area of arms control and the responsibility of the nuclear powers to resume their negotiations remain as pressing as ever.
Support also continued for UN peacekeeping operations: four New Zealand officers currently serve in the Middle East with the United Nations Truce Supervision Organisation; and New Zealand's financial contribution to UN peacekeeping operations in 1983 was in the order of $1.08 million.
International Economic and Development Activity—During 1983 north-south issues remained a feature of almost all aspects of international economic activity. Within the United Nations framework attention focussed on these issues at the sixth United Nations Conference in Trade and Development in Belgrade in June, where the Prime Minister led the New Zealand delegation. They also received attention in other meetings, including the Williamsburg Summit, the Commonwealth Finance Ministers' Meeting in Trinidad and Tobago, and the annual meetings of the IBRD and IMF.
On development issues, New Zealand continued to stress the special requirements of the South Pacific Island countries, many of which are not represented at the United Nations. It also welcomed increased assistance to the South Pacific from the United Nations Development Programme (UNDP), to which the Government contributed $1.45 million in 1983.
International Legal Issues—During 1983 New Zealand participated actively with other consultative parties in the informal meetings aimed at establishing an Antarctic Minerals Regime. As a result of these meetings, considerable international attention has focussed on Antarctica. At its 37th session the United Nations General Assembly adopted a resolution calling on the Secretary-General to conduct a study of the continent.
New Zealand's position on Antarctica is based on the Antarctic Treaty 1959. The treaty establishes a system of peaceful international co-operation in Antarctica which includes effective environmental conservation measures and a comprehensive disarmament regime. Of prime importance to New Zealand, the treaty also removes the potential for disputes between states exercising sovereignty in parts of Antarctica (refer to section 37 of this Yearbook on the Ross Dependency) and those which do not. It does not, however address the question of resources. While no minerals in commercially exploitable quantities have been proven to exist, a major discovery would in the absence of settled rules bring back the potential for conflict in a way which could undermine the Antarctic Treaty. For this reason New Zealand is an active participant in the minerals meetings.
Humanitarian Issues—A continuing concern in international measures to find solutions to the problem of the rapidly expanding numbers of refugees led to New Zealand's working closely with the Office of the United Nations High Commissioner for Refugees (UNHCR) in resettling Indochinese refugees. In 1983 the Government made a regular annual contribution of $100,000 to the UNHCR, and in addition provided $120,000 to the UNHCR's General Programme Appeal to assist refugees in Africa, Asia, and Central America. The Government also made a $120,000 voluntary contribution to the United Nations Relief and Works Agency for Palestine Refugees in the Near East (UNRWA). In addition, part of the $700,000 annual contribution made by this country to the United Nations Children's Fund (UNICEF) goes towards refugee relief.
New Zealand also continues to be concerned to ensure that measures taken within the UN to eliminate discrimination against women are fully implemented. In this regard, New Zealand participates fully in the activities of the UN Decade for Women and gives full support to those practical aspects of the Programme of Action for the Second Half of the Decade established at the mid-Decade Conference in Copenhagen in July 1980. A further contribution of $12,000 was made to a voluntary fund established by the UN to finance programmes and projects benefiting women in developing countries.
Human Rights—New Zealand is committed to the eradication of all forms of racism and racial discrimination. In August 1983 New Zealand participated in the second World Conference to Combat Racism and Racial Discrimination, which was held in Geneva. Arising from the conference, the culminating activity of the Decade to Combat Racism and Racial Discrimination (inaugurated by the UN in December 1973) was a recommendation for a Second Decade to Combat Racism and Racial Discrimination. This recommendation was endorsed at the UN General Assembly.
New Zealands' first report to the Human Rights Committee, required in terms of the International Convenant on Civil and Political Rights, was examined by the Committee in November 1983 at a meeting in Geneva, and was favourably received.
Specialised Agencies—The UN system encompasses 15 specialised and intergovernmental agencies which have been independently established with their own intergovernmental organs, secretariats, and budgets. The advantage of membership of these agencies is participation in the co-ordination and standardisation of international systems to handle and advance technical, financial, and development matters. New Zealand is a member of all fifteen, and its contributions to the individual agencies are generally based on the scale of assessments used by the UN organisation.
Food and Agriculture Organisation (FAO)—As an agricultural nation and founding member, New Zealand has taken a particularly active part in the FAO work to promote international food security. New Zealand in 1981 was elected for the fifth time as an FAO Council member. The country's assessed contribution for 1983 was $869,562.
General Agreements on Tariffs and Trade (GATT)—New Zealand is a founder member of GATT, which is the only multilateral instrument that lays down agreed rules for international trade. As such, it comprises a contractual balance of trade rules and obligations. The latest round of GATT multilateral trade negotiations (the “Tokyo Round” 1973–79) resulted in a number of agreements on the reduction of tariff barriers and non-tariff trade restrictions.
The GATT framework remains a cornerstone of New Zealand's trading policy despite an imbalance in its treatment of agricultural trade. New Zealand is actively participating in the work of the Committee on Trade in Agriculture, which was established following the 1982 GATT Ministerial Meeting with a mandate to achieve liberalisation in the trade of agricultural products. The committee is due to report back to a ministerial session at the end of 1984.
International Atomic Energy Agency (IAEA)—New Zealand has been a member of the IAEA since 1957 and, although not a member of the Board of Governors, has customarily attended the annual conference of the Agency in Vienna in September. The great value in membership of this Agency is in the information provided by the IAEA on a range of peaceful uses of nuclear energy, including the use of isotopes in agriculture and industry. In 1983 the New Zealand contribution to the Agency budget was $288,863.
Intergovernmental Maritime Organisation (IMO)—New Zealand makes a regular contribution to IMO, which establishes international standards for maritime activities. Our 1983 assessment was $13,028.
International Civil Aviation Organisation (ICAO)—Established in 1944, ICAO promotes international discussion of civil aviation questions, particularly in the safety, technical, economic, and regulatory fields. Through its membership of the organisation New Zealand has been able to join with other small countries in expressing its views on current aviation issues and, in this regard, is regularly represented at ICAO's regional and international meetings. New Zealand contributed $136,542 in 1983 towards ICAO's budget.
International Labour Organisation (ILO)—New Zealand supports the ILO's concern to protect the basic dignities and rights of the wage earners and also the organisation's endeavours on a tripartite basis to frame international conventions to improve working and living conditions. In 1983 New Zealand's assessed contribution was $508,221.
International Telecommunication Union (ITU)—Membership of the ITU enables New Zealand to work to promote the most rational and efficient operation of worldwide telecommunications services. New Zealand's assessed contribution for 1983 was $295,094.
Universal Postal Union (UPU)—As an island nation in the South Pacific, New Zealand's membership of the UPU is essential to facilitate the efficient international movement of mails to and from this country. New Zealand's 1983 assessed contribution was $247,088.
United Nations Educational, Scientific and Cultural Organisation (UNESCO)—New Zealand continues to be closely involved with the work of UNESCO. It has a Permanent Delegate, based at the New Zealand Embassy in Paris, and in late 1983 completed a 5-year term on the Executive Board. In 1983 New Zealand's assessed contribution was $820,339.
World Health Organisation (WHO)—New Zealand takes an active part in the work of WHO. New Zealand's assessed contribution for 1983 was $892,318.
World Meteorological Organisation (WMO)—The WMO provides a network for exchanging information on international weather systems. In 1983 New Zealand's assessed contribution was $140,606.
International Banking and Finance Agencies under the aegis of the UN—Membership of the International Bank for Reconstruction and Development (IBRD, also referred to as the “World Bank”), the International Monetary Fund, and the International Finance Corporation, enables New Zealand to participate in efforts to increase the stability of international trade and promote the economic development of less developed countries. In the year ended 31 March 1983 New Zealand contributed $3.33 million to the International Development Association, the “soft loan” arm of the IBRD. Membership of these international financial agencies also serves to strengthen New Zealand's own economic position by providing access to financial information and to varied sources of funding for capital projects or for balance of payments purposes.
This country is also a member of one of the regional development banks of the UN—the Asian Development Bank—which fosters economic growth and co-operation in the Asia-Pacific region.
Contributions to UN—Contributions are based on capacity to pay, and New Zealand's assessed contribution rate for 1983, 1984, and 1985 of 0.26 percent required the country to pay $2,333,646 as its 1983 membership cost.
Contributions to the certain bodies established by the UN are on a voluntary basis. New Zealand's contributions for the year 1982–83 are shown in the subsection dealing with multilateral aid on a later page of this section. Along with many other countries New Zealand has been concerned about the rapidly rising operating and programme costs of the UN, its bodies, and the specialised and intergovernmental agencies. Accordingly, in the UN's Fifth Committee (Administrative and Budgetary) and at the general meetings of the specialised agencies, New Zealand has sought to promote trim and efficient financial management through supporting or proposing the introduction of better budgeting techniques, the elimination of defunct programmes, applying savings made elsewhere to more effective programmes, and restraining the introduction of new institutions to an absolute minimum.
NEW ZEALAND'S AID AND OTHER RESOURCES FLOWS TO DEVELOPING COUNTRIES—During 1982–83 Official Development Assistance (ODA) amounted to $79.2 million, a 12.82 percent increase on the previous year's figure of $70.2 million. Bilateral and regional assistance totalled $56.791 million, with $10.982 million going to multilateral agencies.
The following is a summary of 1982–83 ODA expenditure:
| Vote: Foreign Affairs— | $(000) |
| Bilateral— | |
| Country | 55,755 |
| Other | 1,036 |
| Multilateral | 10,982 |
| South Pacific shipping | 7,912 |
| Vote: Transport— | 75,685 |
| Pacific civil aviation and meteorological services | 900 |
| Vote: Permanent Legislative Authority— | |
| Asian Development Bank: World Bank capital contribution | 2,615 |
| Total | 79,200 |
Almost all of New Zealand's ODA is administered by the External Aid Division of the Ministry of Foreign Affairs. Geographic distribution of the 1982–83 assistance to developing countries followed the pattern of previous years, with over two-thirds going to bilateral and regional programmes in the South Pacific. The ASEAN group of countries (Indonesia, Singapore, Malaysia, Thailand, and the Philippines) was the second region of bilateral aid concentration. The total programme involves the skills and experience of hundreds of New Zealanders, together with capital and technical back-up from New Zealand.
Government assistance to voluntary agencies in 1982–83 amounted to $578,189. This comprised the annual grant to Volunteer Service Abroad (VSA) and disbursements under the Voluntary Agency Support Scheme (VASS). Under VASS the Government provides a subsidy for approved projects undertaken by New Zealand non-governmental agencies in developing countries.
The total transfer of resources from New Zealand to developing countries in the calendar year 1982, as reported to the Development Assistance Committee of the OECD in Paris, was estimated (with some margin of allowance for unconfirmed data) at $157.34 million. This figure included private export credits and direct investment by New Zealand interests ($60.22 million) and transfers by New Zealand voluntary agencies ($8.90 million).
Bilateral ODA 1982–83—Under its bilateral (government-to-government) aid programmes, New Zealand responds to the development priorities established by the developing countries themselves, mainly in the South Pacific and South-east Asia. Project aid is the main form of assistance. Hundreds of projects are involved, and New Zealand inputs of expertise and/or material and capital resources are often committed for several years on end.
The main purpose of New Zealand's bilateral assistance is to help promote the economic and social development of the recipient countries by expanding their capabilities to raise the living standards of their peoples. Emphasis is placed on productive sector development such as livestock and pasture improvement programmes, assistance with crops, and the development of forestry, fisheries and energy resources. Advisors' assignments vary from a few weeks to several years. In 1982–83 the bilateral aid programme had about 70 long-term (2 years or more) advisors in the field, and several hundred on short-term assignments. The transfer of New Zealand expertise to developing countries is supplemented by the provision of bilateral aid study and training awards. In 1982–83 there were about 650 students in New Zealand and about 200 at “third country” institutions. The training is linked with specific requirements in the recipient countries. Bilateral assistance is complemented in the South Pacific and South-east Asia by programmes promoting regional development co-operation, particularly in the fields of forestry, education, livestock improvement, transport, communications and trade promotion. Bilateral assistance also includes emergency and distress relief.
The following country breakdown of bilateral ODA in 1982–83 shows the direction and scope of New Zealand assistance:
| BILATERAL OFFICIAL DEVELOPMENT ASSISTANCE 1982–83 | |
|---|---|
| * This figure covers study and training programmes and awards other than those incorporated in the individual Pacific and Asian country disbursements shown under Bilateral Aid. | |
| South Pacific— | NZ$ |
| Cook Islands | 9,886,505 |
| Fiji | 4,995,188 |
| Kiribati | 552,210 |
| Niue | 5,922,148 |
| Papua New Guinea | 2,695,819 |
| Solomon Islands | 903,775 |
| Tokelau | 2,161,710 |
| Tonga | 3,622,830 |
| Tuvalu | 545,182 |
| Vanuatu | 1,064,284 |
| Western Samoa | 4,910,874 |
| Regional | 6,254,577 |
| Total Pacific | 43,515,102 |
| South and South-east Asia— | |
| ASEAN— | |
| Indonesia | 6,863,591 |
| Malaysia | 235,359 |
| Philippines | 1,397,524 |
| Singapore | 133,030 |
| Thailand | 1,611,212 |
| Regional | 550,850 |
| Subtotal | 10,791,566 |
| Other Asian— | |
| Bangladesh | 69,769 |
| Bhutan | 3,198 |
| India | 125,478 |
| Korea (South) | 39,653 |
| Laos | 7,114 |
| Nepal | 72,164 |
| Pakistan | 20,690 |
| Sri Lanka | 35,381 |
| Regional | 600,352 |
| Maldive Islands | 2,402 |
| Subtotal | 976,201 |
| Total Asia | 11.766,767 |
| Africa— | NZ$ |
| Botswana | 15,753 |
| Lesotho | 4,350 |
| Malawi | 8,976 |
| Swaziland | 5,997 |
| Tanzania | 47,540 |
| Uganda | 5,097 |
| Zambia | 47,731 |
| Zimbabwe | 67,569 |
| Total Africa | 203.013 |
| Latin America— | |
| Peru | 195,763 |
| Regional | 24,134 |
| Total Latin America | 219,897 |
| Middle East— | |
| Egypt | 10,916 |
| Iran | 2,696 |
| Total Middle East | 13,612 |
| Caribbean— | |
| Barbados | 11,947 |
| Guyana | 14,239 |
| Jamaica | 11,085 |
| Total Caribbean | 37,271 |
| Other Bilateral Programmes— | |
| Voluntary agencies | 578,189 |
| Information | 58,660 |
| Miscellaneous | 14,671 |
| Study and training awards* | 384,415 |
| Total other | 1,035,935 |
| Total Bilateral Aid | 56,791,597 |
Multilateral ODA 1981–82—The multilateral programme enables New Zealand to make a contribution to development work which would usually be beyond the scope of the bilateral aid programme, either in terms of the scale of the projects or in their ability to help countries beyond the regions of concentration of the bilateral aid effort.
Multilateral disbursements in 1982–83 amounted to $10.9 million. To a large extent the pattern of disbursement to United Nations, Commonwealth, South Pacific, and international development finance institutions and agencies followed that of the previous year.
| MULTILATERAL ODA 1982–83 | |
|---|---|
| United Nations Institutions | NZ$ |
| UN Development Programme | 1,500,000 |
| UN Disaster Relief Office | 10,000 |
| World Food Programme | 800,000 |
| UN Children's Fund | 700,000 |
| UN Fund for Population Activities | 350,000 |
| UN Relief and Works Agency | 120,000 |
| UN High Commission for Refugees | 100,000 |
| UN Education Training Programme for Southern Africa | 16,000 |
| UN Trust Fund for Southern Africa | 8,000 |
| UN Trust Fund for Namibia | 5,000 |
| Total, United Nations | 3,609,000 |
| South Pacific Institutions— | |
| South Pacific Commission | 639,998 |
| South Pacific Bureau for Economic Co-operation | 394,800 |
| Regional Fisheries Agency | 196,902 |
| Total, South Pacific | 1,231,700 |
| Development Finance Institutions— | |
| International Fund for Agricultural Development (IFAD) | 400,000 |
| International Development Association (IDA) | 2,980,000 |
| Asian Development Bank (ADB)—Asian Development Fund | 1,000,000 |
| Asian Development Bank (ADB)—Technical Assistance Special Fund (TASF) | 75,000 |
| Caribbean Development Bank | 50,000 |
| International Monetary Fund (IMF)—Oil Subsidy Account | 96,000 |
| Total, Development Finance | 4,601,000 |
| Commonwealth Programmes— | |
| Commonwealth Fund for Technical Co-operation | 750,000 |
| Commonwealth Youth Programme | 70,000 |
| Commonwealth Agricultural Bureau | 53,222 |
| Zimbabwe Students Trust Fund | 17,000 |
| Total, Commonwealth | 890,222 |
| Other Contributions | |
| International Rice Research Institute | 25,000 |
| International Planned Parenthood Fund | 250,000 |
| International Committee of the Red Cross | 50,000 |
| Refugee Relief | 325,000 |
| Total, other | 650,000 |
| Total, Multilateral Aid | 10,981,922 |
THE CONSTITUTION OF NEW ZEALAND: Introduction—The history of the present constitution dates back to the declaration of British sovereignty in 1840. By the Treaty of Waitangi, 50 Maori chiefs ceded their sovereignty to the British Crown in exchange for guarantees contained in the Treaty. Territory not included in the Treaty was claimed on the ground of discovery. The constitution is wholly Anglo-Saxon in its origin and takes no account of Maori custom and usage.
Since its signing the Treaty has remained a contentious issue. Maori grievances focus on the following points: the full implications of the Treaty were not explained at the time; Maori translation of the Treaty was in parts misleading; and its promises have not been honoured.
From 1840 until the grant of responsible government in 1856 the colony was subject to gubernatorial rule. Attempts to persuade the Imperial government to establish representative institutions bore fruit in 1846 with the enactment of a Constitution Act (never fully implemented) superseded by a further Constitution Act in 1852, which created a bicameral General Assembly with limited powers and 6 provinces each with its own executive and unicameral legislature or provincial council. The system of government was unitary however—the General Assembly could legislate in areas in which the provinces had jurisdiction and could amend or annul provincial ordinances.
The 1852 Act constituted the governor as part of the General Assembly with the power to summon, prorogue, and dissolve it and to assent or refuse the assent to legislation passed by it. But the actual form of the executive government was omitted from the Act and left to the will of the governors and the Colonial Office. The appointment and tenure of the judges, and matters normally contained in a constitutional document were left to be decided by ordinary legislation.
Amendments to the 1852 Act stemming from political development reflect New Zealand's transition from colonial to fully-independent status within the period 1840–1973. Contemporary concern about the constitution centres on the operation of, and the balance between, the legislature and the executive rather than in the broader context of the merits of monarchy or republic.
The Constitution—The constitution is not a single written instrument granted to, or by, the people but a miscellany of statutory and customary law welded together and given coherence by the operation and observance of formal unwritten rules known as the conventions. The constitutional framework is erected on, and maintained by, the ordinary law as opposed to a supreme or basic law such as that found in most jurisdictions.
Certain statutes and statute-derived law have important constitutional significance. Among the more important are:
Constitution Act 1852—creation of Parliament;
Bill of Rights 1688;
Habeas Corpus Act 1679;
Electoral Act 1956—election of members of Parliament;
Legislature Act 1908—declaration of powers, privileges of Parliament;
Economic Stabilisation Act 1948—wide-ranging powers of the Government to affect socio-economic activity;
Public Safety Conservation Act 1932—states of emergency, powers of executive;
Letters Patent 1983—exercise of prerogative powers by Governor-General.
Such laws exist by force of the ordinary legislative process because of the basic canon of the legislative primacy of Parliament—the legal capacity of the legislature to make and unmake laws and the self-imposed collateral incapacity of any court or forum to impeach the validity of the legislature's exercise of that power when expressed as an Act of Parliament.
Although not as important in New Zealand as they are in the United Kingdom, the personal, i.e., prerogative powers of the Crown, almost all of which are exercisable by the Governor-General, remain part of constitutional law. A prerogative power may be abrogated only by statute.
On the foregoing basis, it is open to Parliament to change or abolish the constitutional framework on which it rests its primacy, and for a later Parliament to reverse that change, one aspect of the rule being that one Parliament cannot bind its successors. Consequently five provisions of the Electoral Act, which can be changed only by a vote of 75 percent of the members of Parliament, are entrenched in a political, rather than a strict legal, sense. The section which entrenches them could not act as a bar to the repeal of itself by simple majority, and thereafter the repeal or amendment of one or more of the five sections, also by simple majority.
On paper, major changes to the constitutional framework could be effected with comparative ease and speed, but constitutional history shows that those changes which have been made reflected shifts in social or political attitudes already evident.
PARLIAMENT AND THE HOUSE OF REPRESENTATIVES—The Constitution Act created a bicameral General Assembly empowered to make laws for the peace, order, and good government of New Zealand. Legislative competence was restricted, e.g., laws enacted were not to be repugnant to those of England; laws did not have extra-territorial effect; certain laws needed the Sovereign's assent; and all were subject to Royal disallowance. It was only with the passage of the Constitution Amendment Act 1947 (U.K.) and the Statute of Westminster Adoption Act 1947 (N.Z.) that the New Zealand Parliament obtained plenary legislative power, any residual doubts on the matter having been removed by a further amendment to the 1852 Act in 1973.
Until 1950, Parliament consisted of the Governor-General, the Legislative Council, and the House of Representatives. Despite repeated proposals for reform the council remained an appointive chamber, and the decline in its capacity as a curb on the lower House and the Government was accelerated by the partisan nature of the appointments made. Each ministry sought to ensure that its supporters were in a majority. The council's demise was assured when the National Party, which had campaigned for abolition, was returned as the Government in the 1949 General Election. The necessary legislation was passed by both Houses and the council ceased to exist on 1 January 1951. Although it was intended that the council should be replaced by an elected second chamber nothing has so far come of the idea.
Parliament now consists of the Governor-General (the Queen when resident in New Zealand), and the 92-member House of Representatives. The role of the Governor-General, as part of the General Assembly, is purely formal and for all practical purposes “Parliament” is synonymous with “House of Representatives”.
The principal functions of Parliament are to enact laws, supervise the Government's administration, vote supply, provide a government, and redress grievances by way of petition.
The Constitution Act forbids the House to allocate public funds for any purpose unless first recommended by the Governor-General. Although the reasons for this provision are historic, it is also used by governments to defeat legislation brought forward by individual members which ministers are unwilling to support or adopt. On the other hand, the law forbids the Crown to tax citizens without express parliamentary approval.
Constitutional law includes the law and custom of Parliament, itself derived from a variety of sources. The Bill of Rights saves any proceeding in Parliament from being questioned in any forum, other than the House itself, and the Legislature Act 1908 provides that the powers, privileges, rights, and immunities of the House (and its committees and members) are those possessed by the British House of Commons on 1 January 1865. One aspect of the powers of the House is the ability to make rules for the conduct of its business. Most of these are contained in the Standing Orders although some are made on a sessional, and others on an ad hoc, basis. The traditional three readings given to a bill are part of Standing Orders, but it is open to the House to alter or suspend its rules at any time. The House has retained the right to punish breaches of its privileges, whether by members or citizens, from which there is no appeal (although the courts could be asked to decide whether the privilege claimed is one recognised by law).
Perhaps the most important privilege of the House is that of freedom of speech, guaranteed by the Bill of Rights, and claimed by the Speaker upon confirmation in his office by the Governor-General.
The House meets, as Parliament, in answer to a summons from the Governor-General. Sessions of Parliament are marked by a formal opening (the Government's legislative programme is described in the Speech from the Throne read by the Governor-General) and a closing prorogation by proclamation. Unless the House, by resolution made under the authority of the Legislature Act (1977 Amendment), carries forward business to the next session, all business before the House on prorogation lapses. Parliament is dissolved by the Governor-General or expires by efflux of time after 3 years.
Because control of the House's business lies with the Government, many of the rules and customs of the House are designed to ensure that members of the House are given a full opportunity to debate any aspect of a government's proposals. Control of the debates and the conduct of members is vested in the Speaker, whose rulings are binding unless overturned by the House.
Proposed laws are placed before the House in the form of draft laws known as 'bills'. There are 3 types of bills—public bills, dealing with the most important subjects of a public and general nature (most public bills are introduced by the Government), local bills, which are promoted by local authorities to give themselves special powers or validate illegal action they may take, and private bills, which are promoted by private individuals or companies also to give themselves special powers. The procedure for passing each of these types of bill through Parliament differs.
Detailed scrutiny of legislation and facets of executive activity, e.g., expenditure of public money, is carried out by select committees consisting of a small number of members, usually 7, which report their findings and recommendations to the House. Since 1980, all government bills stand referred to a select committee unless certified by the Speaker as “money bills”. The change was recommended by the Standing Orders Committee (see Parliamentary paper I. 14, 1979). This is intended to enable the public and interested bodies to make submissions, in the expectation that better laws will result.
In the context of the party system, it is unlikely that the Opposition would be in a position to bring down a government by means of a no-confidence vote—there is no instance of a successful no-confidence vote in the history of the New Zealand Parliament since 1928. The strength of the parties, especially that of the National and Labour Parties, is so great that many of the rules and customs of the House are based on there being two parties only in the House. The presence of third party members, as at present, has raised a number of problems in relation to speaking times, membership of select committees, and so forth.
Because of the growth of a largely two-party system and the importance that the parties have assumed within the political framework, the party caucus (a meeting of each party's members of Parliament in closed session at regular intervals, once a week when Parliament is in session) is a primary means of developing policies and tactics. Caucus committees of both the National and Labour Parties travel around the country frequently, investigating issues of interest or concern to them. Although the existence of the caucuses and their committees is not recognised by the law, indirect recognition has been given, e.g., travelling allowances are payable to members when travelling as members of a caucus committee.
In the exercise of their functions and powers, the Speaker and the Chairman of Committees are assisted by permanent officials, headed by the Clerk of the House, charged with the administration of the House and the provision of advice on parliamentary law and custom.
The procedure for fixing the salaries and allowances of members and ministers was changed in 1977.
Responsibility now rests with the Higher Salaries Commission established by the Act of the same name.
The following table lists the salaries payable from 10 November 1981.
| Office | Yearly Rate of Salary Payable On and After 10 November 1981 |
|---|---|
| Members of the Executive | $ |
| Prime Minister | 79,717 |
| Deputy Prime Minister | 62,146 |
| Each Minister of the Crown holding a portfolio or portfolios (other than the Prime Minister or the Deputy Prime Minister) | 55,115 |
| Each Minister of the Crown without portfolio | 44,572 |
| Each Parliamentary Under-Secretary | 42,814 |
| Officers of the House of Representatives | |
| Speaker of the House of Representatives | 51,161 |
| Chairman of Committees of the House of Representatives | 44,134 |
| Leader and Deputy of the Official Opposition | |
| Leader of the Official Opposition | 55,115 |
| Deputy Leader of the Official Opposition | 42,814 |
| Whips | |
| Chief Government Whip | 39,300 |
| Chief Opposition Whip | 39,300 |
| Junior Government Whip | 36,665 |
| Junior Opposition Whip | 36,665 |
| Members of the House of Representatives | |
| Each member of the House of Representatives to whom the foregoing provisions of this Schedule do not apply | 32,271 |
The following allowances are also paid:
| Office | Yearly Rate of Expenses Allowance |
|---|---|
| $ | |
| Prime Minister | 14,000 |
| Deputy Prime Minister | 6,000 |
| Each Minister of the Crown holding a portfolio or portolios (other than the Prime Minister or the Deputy Prime Minister) | 5,750 |
| Each Minister of the Crown without portfolio | 4,500 |
| Each Parliamentary Under-Secretary | 4,500 |
| Minister of Foreign Affairs (Additional) | 5,000 |
| Speaker | 2,500 |
| (Additional allowance as Speaker; plus electorate allowance abated by one-third of the appropriate rate, and day allowance) | 4,600 |
| Chairman of Committees | 2,500 |
| (Additional allowance as Chairman plus electorate allowance abated by one-third of the appropriate rate, and day allowance) | 2,700 |
| Leader of the Opposition | 5,750 |
| (Plus house and travelling allowances) | |
| Deputy Leader of the Opposition | 2,500 |
| (Plus additional allowance as Deputy and electorate, night, and day allowances at appropriate rates) | 2,250 |
| Members (Plus electorate, day, and night allowances at appropriate rates) | 2,500 |
The rate at which an electorate allowance is paid depends on the nature of each member's electorate, e.g., urban, rural, or semi-rural, and ranges from $4,500 to $9,250.
A day allowance of $12 is payable where indicated for each day on which a member attends a sitting of Parliament or a committee, and a night allowance of $26 for each night a member requires overnight accommodation away from home by reason of such attendance.
In addition to the foregoing allowances, a once-only setting up allowance is paid to members elected for the first time. The current rate is $350.
The Crown and the Governor-General—Constitutional law vests the executive power in the Crown, i.e., the Monarch acting through, or with the advice of, responsible ministers. Primarily because of political developments within the British Empire and, later, the Commonwealth, changes in the substantive law have left the constitutional position, but not the role, of the Monarch in some doubt. By virtue of the Royal Titles Act 1974, the present Monarch is styled “… Elizabeth the Second … Queen of New Zealand …” which, taken together with changes made to the Constitution Act in 1973, tend to suggest that the Queen of New Zealand is a separate legal entity from that of the United Kingdom, a suggestion which has found support in a 1976 Supreme Court decision. If such is the case, English or Imperial law which was thought to be part of New Zealand's law, e.g., the Regency Act 1937–53, may have ceased to be so.
Although not a viceroy, the Governor-General (appointed by the Monarch on the advice of the New Zealand Prime Minister for a 5-year term) may lawfully exercise most of the Royal powers and functions, whether derived from the general law or statute. The 1983 Letters Patent reinforced by a strong convention, require him to accept and act on the advice of his New Zealand ministers. By convention the discretion or reserve powers which may be exercised by the Governor-General enable him in certain extraordinary circumstances to reject advice if he believed that a government was intending to act improperly or unconstitutionally. Events in Australia in 1975 have demonstrated how controversial the use of the reserve powers can be, and it is likely that a Governor-General would seek a political, rather than a legal, solution.
As part of the General Assembly, the Governor-General summons, prorogues, and dissolves parliament, and his assent to Bills passed by the House is necessary to transform them into Acts. As the Monarch's representative, he is the head of the Executive and his participation, albeit formal in nature, is required to give legal effect to decisions made by the Government or individual ministers.
Sir David Stuart Beattie assumed office as Governor-General on 6 November 1980. For further information on previous Governors-General refer to the 1982 Yearbook.
The Executive Government—The governance of New Zealand is executed by Ministers of the Crown in the name of, and on behalf of, the Monarch. The dual conventions that ministers are responsible to Parliament for their official acts and those of their officials and that the Government is responsible for its acts have been translated, indirectly, into statute. The Civil List Act 1979 provides that no person may be appointed or remain a minister or member of the Executive Council unless he is, concurrently, a member of Parliament.
Following a General Election, the leader of the party which has, or is most likely to secure, a majority of seats in the House is invited by the Governor-General to accept the office of Prime Minister and form a ministry. Although the selection process has varied between the two major parties, the respective leaders have final responsibility for the allocation of portfolios. Acting on the new Prime Minister's advice, the Governor-General appoints a number of members of Parliament as ministers with responsibility for one or more areas of government administration (portfolios), although in rare cases ministers are appointed without portfolio. In addition, a few members are appointed as parliamentary undersecretaries to assist ministers in specific areas. Under-Secretaries are neither ministers nor members of the Executive Council.
The Executive Council, constituted under the 1983 Letters Patent, consists of the ministers, any two of whom together with the person presiding (normally the Governor-General) form a quorum. The council is the legal vehicle for the promulgation of a government's decisions which are intended to form part of the law. It is also one of the primary means whereby the Government tenders formal advice to the Governor-General.
The membership of the council, following a snap election on 14 July 1984, remained at 20.
Unlike the council, the Cabinet owes its existence solely to convention. Although both institutions have the same membership (the Governor-General is a member of neither), their respective functions differ markedly. It is the Cabinet which determines or approves a government's legislative and administrative proposals and policies and co-ordinates the work of ministers.
To facilitate this process, a number of Cabinet committees have been set up, consisting of ministers whose responsibilities are related to the subject covered by the committees. Each committee has power within its terms of reference to make decisions. On 30 July 1984 the structure of Cabinet committees was changed and now includes committees on policy; social equity; development and marketing; transport, communications, and state enterprises; external relations and security; management and state employment; legislation; honours and appointments; and terrorism.
One important feature of the Cabinet is the informality of its proceedings and their confidentiality, thus allowing for a consensus of views to emerge without the need, in most cases, to take a vote. Cabinet discussion and agreement ensures the Government's support in the House for a minister's legislative or other proposals and supports the convention of collective responsibility.
The Cabinet Office is responsible for the servicing and co-ordination of the Cabinet and its committees to ensure their smooth functioning, as well as providing liaison and advice within the interdepartmental framework. The Secretary of the Cabinet is also Clerk of the Executive Council.
The Judiciary—New Zealand has inherited the strong British tradition of an independent judiciary seen as a bulwark against unnecessary intrusion by the State in the lives of citizens. One means of maintaining that tradition is to provide superior court judges with security of tenure. Accordingly, the law provides that High court judges are appointed “… during good behaviour …” and are removable by the Governor-General in answer to an address from the House. Moreover, the salaries of High Court judges cannot be reduced while they remain in office. High Court judges must retire at the age of 68.
As from 1 April 1980 the name of the superior court of New Zealand, hitherto known as the Supreme Court, was changed to the High Court. At the same time, magistrates were renamed District Court Judges and their courts, District Courts. Appeals from the Court of Appeal to the Privy Council were not affected by the changes made.
District Court Judges are appointed, as with High Court judges, by the Governor-General on ministerial advice and are removable by him, without the need for an address from the House, for misbehaviour or inability. Although a District Court judge's security of tenure is not as entrenched as that of a High Court judge, nevertheless, the convention against arbitrary removal ensures his independence of action in the exercise of his judicial functions.
Judicial offices of specialist courts enjoy the tenure provisions of High Court judges or District Court judges depending on the ranking of their court within the judicial structure.
New Zealand courts apply the primacy of Parliament doctrine which, in the judicial context, means that a court will not question the validity of what purports to be an Act of Parliament. However, the doctrine has never prevented them from declaring legislation made by the Executive Council, under delegated authority from Parliament, outside the powers of the council or Governor-General, as the case may be, on the grounds that, in fact, no power to make that particular piece of subordinate legislation exists.
In the constitutional context, the growth and proliferation of tribunals and other administrative bodies as an answer to the complexities of modern administration, and the increasing regulation by successive governments of socio-economic affairs, has challenged the traditional, original, and supervisory jurisdictions of the High Court. In answer to parliamentary attempts to oust or restrict the Court's jurisdiction, the superior courts of many common law countries have dusted off hitherto unused writs and remedies and adapted them to meet modern demands.
The balance between the courts and the administrative agencies has been restored, partially, by the creation in 1968 of an Administrative Division of the Supreme Court (now the High Court) to hear appeals or review the law applied by these agencies, and the institution in 1972 of a simplified procedure to obtain judicial review. Conversely, New Zealand still lacks a coherent policy towards the role and ambit of the High Court's jurisdiction in the field of administrative law.
Because the High Court lacks the capacity to declare an Act unconstitutional or beyond the scope of Parliament's powers, the High Court judges have seen their supervisory jurisdiction over administrative acts as an important means of maintaining the balance of competing interests between the citizen and the State, and have taken steps to stem any erosion of that jurisdiction.
CONTROLLER AND AUDITOR-GENERAL: ROLE AND POWERS—The Controller and Auditor-General is an officer of the Crown appointed by the Governor-General on behalf of Her Majesty. Much like the judiciary, he/she is independent of the Executive, being obliged to report only to Parliament and only able to be removed from office by the Governor-General upon an address from the House of Representatives. He/she has a Deputy whose mode of appointment and tenure of office are the same. It is also laid down by statute that no Minister is in any way responsible for the carrying out or exercise by the Audit Office of its functions, duties, and powers.
With some exceptions, the Controller and Auditor-General functions through the Audit Office, which was established by the Public Finance Act 1977. The Audit Office is defined as the Controller and Auditor-General and any person under delegation or appointment by him to perform or exercise any particular function, duty, or power.
The role of the Audit Office embraces 2 main activities. The major and better known, is the audit of the accounts of all Government departments and local authorities, and most Government-owned or controlled corporations, boards, and companies. The lesser known but constitutionally important role is that of the control of issues of money cut of the Public Account to meet Government expenditure. No money can be issued out of the Public Account unless it is covered by some authority given by Parliament, and it is the responsibility of the Audit Office to ensure that the rule is observed.
In relation to its role as auditor of the public sector, the Audit Office is required to carry out financial audits, to review procedures, and is empowered to undertake examinations to determine whether resources have been applied effectively and efficiently. The Audit Office cannot question policies on which broad spending decisions are made. To enable it to carry out these functions, the Audit Office has a number of powers. These include rights of access to the books, accounts, and property of its clients, and the right to require persons to supply information or deliver up books and accounts in their possession, or under their control.
The Controller and Auditor-General has no general power of sanction to remedy shortcomings discovered during an audit. The principal recourse is to report to the management of the organisation, either by letter or in the formal audit opinion on financial statements, to a Minister, or to Parliament.
However, if the shortcoming involves a deficiency or loss of public money or stores, the Controller and Auditor-General has the power to surcharge the person or persons responsible to recover the amount involved. This power is used rarely.
OMBUDSMEN—The position of Parliamentary Commissioner for Investigations (Ombudsman) was created in 1962. Until 1968 the principal function of the Ombudsman was to inquire into complaints from members of the public relating to administrative decisions of Government departments and related organisations only. In 1968 his jurisdiction was extended to hospital boards and education boards and, under the Ombudsmen Act 1975, it was further extended to all other local authorities and to certain national boards and organisations. Under the 1975 Act, provision was made for the appointment of a Chief Ombudsman and one or more other ombudsmen, who could be permanent or temporary.
Complaints to the ombudsmen must be made in writing. Investigations are conducted in private, but an ombudsman can decide not to investigate where, for instance, the subject-matter is trivial or the complainant has not a sufficient personal interest in the subject-matter of the complaint.
Where an ombudsman forms the opinion that a complaint can be sustained he is required in the case of a Government department or Government organisation to report that opinion and any recommendation that may be made to the department or organisation concerned and to make a copy of the report available to the responsible minister. In the case of a local organisation the ombudsman is required to report the opinion formed to that organisation and to make a copy of the report available to the mayor or chairman.
An analysis of the complaints made to the Ombudsmen during the latest available year is given in the following table.
| Action on Complaint | Year Ended March 1983 |
|---|---|
| Declined, no jurisdiction | 153 |
| Declined or discontinued | 680 |
| Sustained, recommendation made | 17 |
| Sustained, no recommendation made | 54 |
| Not sustained | 496 |
| Abandoned before investigation | 203 |
| Still under investigations as at 31 March | 369 |
| Total number of complaints | 1 972 |
ROYAL COMMISSIONS AND COMMISSIONS OF INQUIRY—The Commissions of Inquiry Act 1908, which has been amended from time to time as necessary, provides that the Governor-General may by Order in Council, appoint any person or persons to be a commission to inquire into and report upon any question arising out of, or concerning:
The administration of the Government;
The working of any existing law;
The necessity or expediency of any legislation;
The conduct of any officer in the Service of the Crown;
Any disaster or accident (whether due to natural causes or otherwise) in which members of the public were killed, injured, were or might have been exposed to risk of death or injury;
Any other matter of public importance.
A Royal Commission is appointed by the Governor-General pursuant to his Letters Patent, but in other respects derives its powers from the Commissions of Inquiry Act. Royal Commissions, appointed as they are in the name of the Sovereign, are generally regarded as having a greater prestige and standing and accordingly they are presided over by a Judge or former Judge of the High Court or a person of equivalent judicial status.
A committee of inquiry may be set up by a minister to investigate some matter but such a committee has no statutory basis in the normal course of events, although there are ancillary powers in some instances.
Amendments to the legislation in 1979 and 1980 now confer new rights upon any person if he/she is a party to the inquiry or satisfies the commission that he/she has an interest in the inquiry apart from any interest in common with the public.
Usually the terms of reference for a commission are quite specific. While there is frequently a final term of reference which appears to include everything else, this term of reference must be considered in context. It does not confer the right on almost anyone to become a party or participant in the inquiry.
The Department of Internal Affairs, (originally the Colonial Secretary's Office), administers the Commissions of Inquiry legislation and provides basic services to the various commissions. These inquiries are not part of the justice system, nor are they part of the conventional administrative bureaucracy. The department retains important constitutional responsibilities and in this context is held responsible to ensure that complete independence and impartiality of investigations is maintained.
Commissions of Inquiry must report to the Governor-General, who in turn, refers the findings and report to his/her Ministers. It is frequently the custom for the report to be published and copies are available from the Government Printing Office.
Although a costly exercise, the role of Commissions of Inquiry in a parliamentary democracy with an unicameral system is a significant one. Besides serving as a valuable channel for public disquiet, a commission is able to weigh the submissions according to the accuracy with which they are formulated, make findings, seek comment, and arrive at considered conclusions.
Further information is available in the following publications: Royal Commissions and Commissions of Inquiry, published by the Government Printing Office in 1974; A Checklist: New Zealand Royal Commissions, Commissions and Committees of Inquiry 1864–1981, published by the New Zealand Library Association in 1982; and the Report of the Department of Internal Affairs (Parl. paper G. 7).
PARLIAMENTARY ELECTIONS—The law on elections is contained in the Electoral Act 1956 and its amendments. Responsibility for the electoral process is shared between 4 Government departments. The Post Office maintains and prints electoral rolls and the Department of Justice is responsible for the conduct of the polls, electoral policy, and legislation. The Departments of Statistics and Lands and Survey provide geographical referencing material and mapping services. Following the population census (every 5 years) the boundaries of all electorates are revised, and new boundaries come into force at the expiry of the Parliament existing when the Proclamation is issued.
To assist this revision, the Government Statistician is required to supply general electoral population figures to the Surveyor-General.
The term “general electoral population” means total population with the following exceptions:
Maori electoral population—a figure based on the number of adult New Zealand Maoris registered in Maori electoral districts adjusted to include children. A Maori is defined in the 1980 amendment as “a person of the Maori race of New Zealand; and includes any descendant of such a person”:
Persons residing on board any ship;
Temporary guests in any guest house, hotel, or motel;
Temporary residents in any defence area;
Patients or inmates in any hospital or institution;
Persons detained in any penal institution.
After the population figures are supplied by the Government Statistician it is then the responsibility of a Representation Commission to define new electoral districts. The commission comprises eight members. Five of these are official members; the Surveyor-General, the Government Statistician, the Chief Electoral Officer, The Director-General to the Post Office, and the Chairman of the Local Government Commission (who is without voting rights). Two are unofficial members, being persons nominated by the House of Representatives, one nominated to represent the Government and one to represent the Opposition. The eighth member is appointed, on the nomination of the official and unofficial members of the commission or a majority of them, to be the chairman of the commission. The chairman and unofficial members cease to be members on the date on which the first periodical census is taken after the date of their appointment.
The number of general electorates is based on population under a formula that allocates 25 seats to the South Island. The general electoral population of the South Island is divided by 25, and the quota thus obtained for each South Island electorate is then divided into the North Island general electoral population to give the number of electorates in the North Island.
The number of Maori seats is fixed at four.
When the boundaries have been provisionally determined, maps are prepared illustrating the proposed electoral districts, and descriptions of each electoral district are published in the New Zealand Gazette. A time limit of 1 month is given during which objections to the proposed boundaries may be lodged. The objections are published and a further 2 weeks is allowed for lodgment of counter objections. Both objections and counter objections are then considered by the Representation Commission and a final decision is reached on boundaries which then define the new electoral districts.
Franchise—Since September 1974, persons 18 years of age and over have had the right to vote in the election of members of the House of Representatives. (From 1893 onwards all persons aged 21 years had voting rights and the qualifying age had been lowered to 20 years in 1969.)
Registration of Electors—Registration as an elector is compulsory, although it is not compulsory to vote. To be qualified for registration as a parliamentary elector in New Zealand a person must have attained the age of 18 years and must (a) be a New Zealand citizen or a permanent resident and (b) at some period have resided continuously in New Zealand for at least a year and (c), except in special cases, have resided continuously for 3 months or more in the electoral district in respect of which application for registration is made, and not have subsequently resided for 3 months or more in any other electoral district. Maoris and persons of part-Maori descent may elect to be included on either the General or the Maori electoral roll but their options are renewable only at prescribed intervals.
Voting—Voting is controlled in each electoral district by a Returning Officer appointed to arrange voting facilities and staffing, conduct the election, supervise the counting of votes, and formally declare the election result. A preliminary count of ordinary votes is available on election night and final results are generally available 2 weeks later after all overseas and special votes are received and counted.
Voting is by secret ballot. In general, only those persons whose names are lawfully on the electoral rolls compiled prior to an election are qualified to vote. All general elections and by-elections are held on a Saturday and polling booths are open from 9 a.m. to 7 p.m.
Any member of the armed forces aged 18 years and over serving overseas is qualified to vote as an elector of the electoral district in which he or she last resided before leaving New Zealand.
The vote is normally cast by the elector at a polling booth within his/her district. He/she may however vote as a “special voter”, either at a polling booth outside his/her district or by post for reasons of distant travel on polling day, sickness, etc. Provision is also made for overseas voting.
Voting papers list the surnames of candidates nominated for the electoral district concerned and the elector indicates his/her preference by striking out the name of every candidate except the one for whom he/she wishes to vote. The candidate obtaining the highest number of votes is elected to represent that electoral district as a member of the House of Representatives.
| PARLIAMENTARY SESSIONS | |
|---|---|
| Parliament | Period of Session |
| Thirty-sixth | 12 March 1970–13 March 1970 |
| 1 April 1970–3 December 1970 | |
| 25 February 1971–25 March 1971 | |
| 9 June 1971–17 December 1971 | |
| 8 June 1972–20 October 1972 | |
| Thirty-seventh | 15 February 1973–16 March 1973 |
| 5 June 1973–23 November 1973 | |
| 4 February 1974–29 March 1974 | |
| 28 May 1974–8 November 1974 | |
| 25 March 1975–10 October 1975 | |
| Thirty-eighth | 23 June 1976–14 December 1976 |
| 28 February 1977–4 March 1977 | |
| 19 May 1977–16 December 1977 | |
| 11 May 1978–6 October 1978 | |
| Thirty-ninth | 17 May 1979–14 December 1979 |
| 15 May 1980–12 December 1980 | |
| 20 May 1981–23 October 1981 | |
| Fortieth | 7 April 1982–17 December 1982 |
| 7 April 1983–16 December 1983 | |
Summary of Parliamentary Proceedings—
| 1980 | 1981 | 1982 | 1983 | |
|---|---|---|---|---|
| * In hours or minutes. | ||||
| Sitting days | 119 | 85 | 110 | 99 |
| Hours of sitting after midnight* | 19:38 | 4:04 | 27:43 | 31:17 |
| Public Bills introduced by Government | 105 | 73 | 107 | 96 |
| Public Bills referred to Select Committees | 92 | 62 | 86 | 80 |
Parliamentary Representation—Parliamentary representation of Maoris, Pacific Island Polynesians and women are shown in the following table. The ages of Members of Parliament are also compared with that of the total population.
| Percentage of Total Members of Parliament | Percentage of Population | |
|---|---|---|
* As at 31 March 1984. †As at the 1981 Census. ‡As at 31 December 1983. | ||
| Maoris | 6.3 | 8.9* |
| Pacific Island Polynesians | – | 2.9† |
| Women | 12.6 | 50.3* |
| Age groups— | ||
| Under 30 years | 1.1 | 51.6‡ |
| 30–39 | 28.4 | 14.6‡ |
| 40–49 | 40.0 | 10.4‡ |
| 50–59 | 22.1 | 9.1‡ |
| 60 years and over | 8.4 | 14.3‡ |
Legislation 1983—During the parliamentary session of 1983, 155 Public Acts were passed, compared with 185 passed in 1982.
Governor-General of New Zealand—His Excellency the Hon. Sir David Stuart Beattie, G.C.M.G., G.C.V.O., Q.C.
Official Secretary—James Brown.
The Ministry—
Rt. Hon. D. R. LANGE, Prime Minister, Minister of Foreign Affairs, Minister in Charge of the New Zealand Security Intelligence Service.
Hon. G. W. R. PALMER, Deputy Prime Minister, Leader of the House, Attorney-General, Minister of Justice, Minister in Charge of the Legislative Department, Minister in Charge of the Government Printing Office.
Hon. M. K. MOORE, Minister of Overseas Trade and Marketing, Minister of Tourism, Minister in Charge of Publicity, Minister of Recreation and Sport.
Hon. R. O. DOUGLAS, Minister of Finance, Minister in Charge of the Inland Revenue Department, Minister in Charge of Friendly Societies.
Hon. R. W. PREBBLE, Minister of Transport, Minister of Civil Aviation and Meteorological Services, Minister of Railways, Minister of Pacific Island Affairs, Associate Minister of Finance.
Hon. K. T. WETERE, Minister of Maori Affairs, Minister of Lands, Minister of Forests, Minister in Charge of the Valuation Department.
Hon. D. F. CAYGILL, Minister of Trade and Industry, Minister of National Development, Associate Minister of Finance.
Hon. C. R. MARSHALL, Minister of Education, Minister for the Environment.
Hon. F. D. O'FLYNN, Q.C., Minister of State, Minister of Defence, Minister in Charge of War Pensions, Minister in Charge of Rehabilitation, Deputy Minister of Foreign Affairs, Associate Minister of Overseas Trade and Marketing.
Dr the Hon. M. E. R. BASSETT, Minister of Health, Minister of Local Government.
Hon. A. HERCUS, Minister of Social Welfare, Minister of Police, Minister of Women's Affairs.
Hon. R. J. TIZARD, Minister of Energy, Minister of Statistics, Minister of Science and Technology, Minister in Charge of the Audit Department.
Hon. C. J. MOYLE, Minister of Agriculture, Minister of Fisheries, Minister in Charge of the Rural Banking and Finance Corporation.
Hon. S. J. RODGER, Minister of Labour, Minister of State Services.
Hon. J. L. HUNT, Minister of Broadcasting, Postmaster-General.
Hon. F. M. COLMAN, Minister of Works and Development, Minister in Charge of the Earthquake and War Damage Commission, Associate Minister of Energy.
Hon. T. K. BURKE, Minister of Regional Development, Minister of Employment, Minister of Immigration.
Hon. M. SHIELDS, Minister of Customs, Minister of Consumer Affairs.
Dr the Hon. P. TAPSELL, M.B.E., Minister of Internal Affairs, Minister of Civil Defence, Minister for the Arts, Associate Minister of Local Government, Associate Minister of Tourism.
Hon. P. B. GOFF, Minister of Housing, Minister in Charge of the Government Life Insurance Corporation, Minister in Charge of the State Insurance Office, Minister in Charge of the Public Trust Office.
Executive Council—Membership of the Executive Council is identical with the Cabinet and comprises all the Ministers. The Clerk of the Executive Council is P. G. MILLEN. M.A. (OXON).
Parliamentary Under-Secretaries—
D. J. BUTCHER, Parliamentary Under-Secretary for Agriculture and Fisheries, Lands, and Forests.
T. A. DE CLEENE, Parliamentary Under-Secretary for Finance, with special responsibility for the Inland Revenue Department.
E. E. ISBEY, Parliamentary Under-Secretary for Labour, Employment, and Immigration.
W. P. JEFFRIES, Parliamentary Under-Secretary for Transport, and Works and Development.
P. NEILSON, Parliamentary Under-Secretary for Trade and Industry.
P. T. E. WOOLLASTON, Parliamentary Under-Secretary for Local Government and Environment.
HOUSE OF REPRESENTATIVES—
Prime Minister—Rt. Hon. D. R. Lange.
Leader of the Opposition—Sir Robert Muldoon, G.C.M.G., C.H.
Speaker—Hon. Sir Basil Arthur, Bt.
Chairman of Committees—J. J. Terris.
Clerk of the House—C. P. Littlejohn. LL.M.
| Name | Year of Birth | Previous Occupation | Electoral District |
|---|---|---|---|
| * Government member. | |||
| Anderton, J. P.* | 1938 | Company director | Sydenham |
| Angus, D. A. | 1938 | Freezing company stock buyer | Wallace |
| Arthur, Hon. Sir Basil, Bt.* | 1929 | Timber worker | Timaru |
| Austin, H. N. | 1925 | Farmer | Bay of Islands |
| Austin, Mrs M.* | 1933 | Teacher | Yaldhurst |
| Austin, W. R. | 1931 | Farmer | Awarua |
| Banks, J. A. | 1946 | Restaurateur | Whangarei |
| Bassett, Dr the Hon. M. E. R.* | 1938 | Lecturer | Te Atatu |
| Batchelor, Mrs M. D.* | 1927 | Trade union organiser | Avon |
| Birch, Hon. W. F. | 1934 | Consultant surveyor-engineer | Franklin |
| Bolger, Hon. J. B. | 1935 | Farmer | King Country |
| Boorman, R. G.* | 1935 | Superannuation consultant | Wairarapa |
| Braybrooke, G. B.* | 1935 | Sales manager | Napier |
| Burdon, P. R. | 1939 | Company director | Fendalton |
| Burke, Hon. T. K.* | 1942 | Teacher | West Coast |
| Butcher, D. J.* | 1948 | Research officer | Hastings |
| Caygill, Hon. D. F.* | 1948 | Barrister and solicitor | St. Albans |
| Clark, Helen* | 1950 | Lecturer | Mt. Albert |
| Colman, Hon. F. MacD.* | 1925 | Secretary of Labour Party Headquarters | Pencarrow |
| Cooper, Hon. W. E. | 1933 | Motelier | Otago |
| Cox, M. E. C. | 1939 | Accountant | Manawatu |
| Cullen, Dr M.* | 1945 | Lecturer | St. Kilda |
| de Cleene, T. A.* | 1933 | Barrister and solicitor | Palmerston North |
| Dillon, R.* | 1933 | Barrister and solicitor | Hamilton East |
| Douglas, Hon. R. O.* | 1937 | Company secretary | Manurewa |
| Dunne, P. F.* | 1954 | Deputy chief executive officer | Ohariu |
| East, P. C. | 1946 | Barrister and solicitor | Rotorua |
| Elder, J.* | 1949 | Teacher | West Auckland |
| Falloon, Hon. J. H. | 1942 | Farm management consultant | Pahiatua |
| Fraser, Mrs A. L.* | 1954 | Teacher | East Cape |
| Friedlander, Hon. A. P. D. | 1944 | Farm appraiser | New Plymouth |
| Gair, Hon. G. F. | 1926 | Personal Assistant to General Manager, Air New Zealand | North Shore |
| Gerbic, F. M.* | 1932 | Industrial conciliator | Onehunga |
| Gerard, R. J. | 1936 | Farmer | Rangiora |
| Goff, Hon. P.* | 1953 | Lecturer | Roskill |
| Graham, D. A. M. | 1942 | Barrister and solicitor | Remuera |
| Gray, R. M. | 1931 | Farmer | Clutha |
| Gregory, Dr B.* | 1937 | Doctor of Medicine | Northern Maori |
| Hercus, Hon. Ann* | 1942 | Member of Commerce Commission | Lyttelton |
| Hunt, Hon. Jonathan* | 1938 | Teacher | New Lynn |
| Isbey, E. E.* | 1917 | Watersider | Papatoetoe |
| Jeffries, W. P.* | 1945 | Barrister and solicitor | Heretaunga |
| Jones, N. P. H., Q.S.M. | 1923 | Teacher | Invercargill |
| Keall, Mrs J. M.* | 1942 | Teacher | Glenfield |
| Kidd, D. L. | 1941 | Barrister and solicitor | Marlborough |
| King, Mrs A. F.* | 1947 | Dental tutor | Horowhenua |
| Knapp, G. T. | 1947 | Businessman | East Coast Bays |
| Lange, Rt. Hon. D. R.* | 1942 | Barrister and solicitor | Mangere |
| Lee, G. E. | 1935 | Company director | Hauraki |
| Luxton, J. F. | 1923 | Farmer | Matamata |
| McClay, R. N. | 1945 | Teacher | Waikaremoana |
| McKinnon, D. C. | 1939 | Real estate agent | Rodney |
| McLay, Hon. J. K. | 1945 | Barrister | Birkenhead |
| McLean, I. | 1935 | Farmer | Tarawera |
| Mallard, Trevor* | 1954 | Teacher | Hamilton |
| Marshall, Hon. C. R.* | 1936 | Minister and teacher | Wanganui |
| Marshall, Denis | 1943 | Farmer and company director | Rangitikei |
| Matthewson, Dr C. D.* | 1944 | Civil engineer | Dunedin West |
| Maxwell, Ralph* | 1934 | Teacher | Waitakere |
| Maxwell, Roger | 1941 | Farmer | Taranaki |
| Moore, Hon. M. K.* | 1949 | Freezing worker | Christchurch North |
| Morrison, N. J. | 1938 | Manufacturer | Pakuranga |
| Moyle, Hon. C. J.* | 1929 | Teacher/Farmer | Otara |
| Muldoon, Rt. Hon. Sir Robert, G.C.M.G., C.H. | 1921 | Accountant | Tamaki |
| Neilson, P.* | 1954 | Civil servant | Miramar |
| Northey, R. J.* | 1945 | Advisory officer | Eden |
| O'Flynn, Hon. F. D., Q.C.* | 1918 | Barrister and Queen's Counsel | Island Bay |
| O'Regan, Mrs K. V. | 1946 | Farmer | Waipa |
| Palmer, Hon. Geoffrey* | 1942 | Lecturer | Christchurch Central |
| Peters, W. R. | 1945 | Barrister and solicitor | Tauranga |
| Prebble, Hon. R. W.* | 1948 | Barrister and solicitor | Auckland Central |
| Richardson, Ruth | 1950 | Legal adviser/Farmer | Selwyn |
| Rodger, Hon. S. J.* | 1940 | M.O.W.D. employee | Dunedin North |
| Scott, N.* | 1929 | Education administrator | Tongariro |
| Shields, Hon. Margaret* | 1941 | Research worker | Kapiti |
| Shirley, K. L.* | 1950 | Scientist | Tasman |
| Smith, Dr A. L. | 1948 | Managing Director | Kaipara |
| Storey, W. R. | 1936 | President of Federated Farmers | Waikato |
| Sutton, J. R* | 1941 | Farmer | Waitaki |
| Sutton, Dr W. D.* | 1944 | Scientist | Hawke's Bay |
| Talbot, Hon. R. L. G. | 1923 | Farmer | Ashburton |
| Tapsell, Dr the Hon. P. W., M.B.E.* | 1930 | Doctor of Medicine | Eastern Maori |
| Terris, J.J.* | 1939 | Broadcaster | Western Hutt |
| Tirikatene-Sullivan, Hon. Mrs T. W. M.* | 1932 | Political scientist | Southern Maori |
| Tizard, Hon. R. J.* | 1924 | Teacher | Panmure |
| Townshend, C. B. | 1931 | Farmer | Kaimai |
| Upton, S. D. | 1958 | Student/Teacher | Raglan |
| Wall, Dr G. A.* | 1920 | Doctor of Medicine | Porirua |
| Wallbank, A. R.* | 1937 | Farmer | Gisborne |
| Wellington, Hon. M. L. | 1940 | Teacher | Papakura |
| Wetere, Hon. K. T.* | 1935 | Farmer | Western Maori |
| Wilde, Fran* | 1948 | Journalist | Wellington Central |
| Woollaston, P. T. E.* | 1944 | Teacher | Nelson |
| Young, T. J.* | 1925 | General Superintendent of New Zealand Alliance | Eastern Hutt |
| Young, Hon. V. S. | 1929 | Farmer | Waitotara |
NOTE: For further information on previous ministries, Prime Ministers and Governors-General, refer to the 1982 Yearbook.
GENERAL—Local government in New Zealand is characterised by 6 principles which are outlined below:
Each local authority is established by Act of Parliament (either by its own special or local Act of Parliament or, more commonly, by a public Act of Parliament);
Each local authority has its powers defined in the Act of Parliament under which it is established, and under such other Acts of Parliament that apply to local authorities generally;
Each local authority has a specific district within which it operates;
Each local authority is controlled by its own council;
All local authorities except for hospital boards rely on 1 or more of the following sources of funding—local taxes on land (rates), levies on other local authorities, and/or charges derived from trading utilities under their control. Hospital boards are the exception in that they are totally funded by central government;
All local authorities are able to determine their own expenditure priorities and, except for hospital boards, all local authorities are free to set their own overall levels of expenditure.
Local government in New Zealand does not involve itself in the funding, administration or management of education, social welfare, police, or urban fire services, and, except for a small number of specified urban areas, it does not involve itself in traffic control and enforcement. In the New Zealand context, these services are seen as being either the responsibility of central government, or of specialised agencies which are themselves closely involved with central government. For example urban fire services are provided for by the New Zealand Fire Service Commission (see Section 10B of this Yearbook) while education services are provided for through a variety of education boards and councils funded by central government (see Section 7A of this Yearbook). In the New Zealand context, neither the New Zealand Fire Service Commission nor these various education boards and councils are regarded as local authorities.
A particular feature of local government in New Zealand is the importance placed on its accountability to its electors. The emphasis in local government is on local accountability. This precludes central government from becoming directly involved in local government decision-making, (although in the case of catchment authorities there is some central government involvement through representation on each catchment authority). It also means that the decisions of local authorities cannot be reviewed or overturned by central government. Although hospital boards are funded from central government, they have always been locally responsible for the services they provide to meet the health-needs of the populations of their districts. With the advent in 1982 of a population-based system of funding hospital boards, greater emphasis has been placed on local decision-making and accountability in which central government does not have a role to play.
Although central government is unable to review decisions made by local authorities, this does not mean that local government decisions are not subject to review. There is, for example, provision for the Ombudsmen to investigate complaints regarding specific instances of maladministration in local government—a responsibility which they undertake in addition to their duties concerning complaints about central government maladministration. There is also provision for the Controller and Auditor General to carry out investigations regarding any financial misconduct or conflict of financial interest that may occur either on the part of local government officers or elected members. Such investigations can, in certain circumstances, result in automatic forfeiture of office and/or prosecution in terms of the Local Authorities (Members Interests) Act 1968 or the Local Government Act 1974. (The Controller and Auditor General is an officer of State who is directly responsible to Parliament on all matters affecting central government and local government which relate to financial management and control.) Apart from the issues of maladministration and misconduct, there is further scope for review of local government decisions in a limited number of areas by means of appeal to various judicial tribunals or to the District Court. The' Planning Tribunal acts as the appropriate appeal body on issues which concern land-use planning and related issues. Under the Local Government Act and related legislation, the District Court acts as an appeal body on some more minor issues relating to local government and property. (This responsibility is in addition to its normal function as the Court for minor civil and criminal proceedings.)
Apart from specialised tribunals and the District Court, local authorities are subject to the general power of judicial review of the High Court. The Administrative Division of the High Court has jurisdiction to consider appeals from the District Court and from judicial bodies, such as the Planning Tribunal. In the case of the Planning Tribunal, appeals are only on points of law. In addition, the Administrative Division of the High Court has general jurisdiction to consider applications for review arising from the exercise of any statutory power by any organisation, including any local authority. Under the Bylaws Act 1910 the Administrative Division of the High Court can quash or amend any bylaws of a local authority on the grounds that they are ultra vires of the local authority, or repugnant to the laws of New Zealand, or unreasonable.
The ability of a local authority to incur debts is also subject to control. Since 1926 all local authorities have been subject to loan-raising controls which are exercised by the Local Authorities Loans Board (a statutory board composed of 4 local government and 3 central government members). Since 1983, some local authorities and some categories of loans have been exempted by central government on the recommendation of the Local Authorities Loans Board. In addition, hospital and harbour boards are subject to capital expenditure controls. (In the case of hospital boards, these controls are exercised by central government, and, in the case of harbour boards, these controls are exercised by the National Ports Authority.) However apart from hospital and harbour boards, local authorities in New Zealand are not subject to any capital expenditure controls other than the loan-raising controls already referred to. In practice, where central government wishes to influence the policies of local government, its only effective means of doing so is through appropriate subsidy and grant schemes, the reason being that local authorities can, and do, finance most of their expenditure from local land taxes (rates), and/or charges from trading utilities under their control.
Local government in New Zealand falls into 4 broad categories:
Territorial local government;
Special purpose local government;
Regional local government;
Community local government.
TERRITORIAL LOCAL GOVERNMENT—Territorial authorities in New Zealand act as directly elected general purpose authorities with responsibilities for roading, water supply, sewage disposal, rubbish disposal, parks and reserves, libraries, community development, land subdivision, land-use planning, pensioner housing, health and building inspection, urban passenger transport, parking meter enforcement and civil defence. The present system of territorial local government in New Zealand has evolved since the abolition of provincial government in 1876. (From 1853, New Zealand had operated a system of provincial government with each province having its own provincial council able to pass its own enactments known as provincial ordinances, but in 1875 Parliament provided for the abolition of the provinces to take effect in 1876.) In 1876, Parliament passed the Rating Act, the Municipal Corporations Act and the Counties Act. These 3 Acts established a system of locally-elected general purpose territorial local authorities funded from local taxes on land (rates). Municipalities were provided for in urban areas, and these included 36 municipalities already in existence which had been incorporated under an earlier Municipal Corporations Act. The remainder of the North and South Islands, together with Stewart Island, was divided into counties, although in the more sparsely settled counties it was intended that no county councils would be immediately established. The last of these designated counties to come under the control of a county council was Fiord County. This happened in 1981 when it was included in the district of the Wallace County Council.
In 1901, Parliament authorised the establishment of a county council for the Chatham Islands (although the first elections for this county council were not held until 1925). In 1912, Parliament authorised the establishment of a county council for Great Barrier Island and in 1970 the Waiheke County Council was constituted covering Waiheke Island (formerly under the control of the Waiheke Road Board) and also covering a number of small islands in the Hauraki Gulf. Apart from some small usually uninhabited offshore islands, all of New Zealand is now covered by directly elected territorial local government—231 territorial authorities in total.
New Zealand's system of directly elected general purpose or territorial local government now comprises counties, district councils and municipalities. There are, in turn, 3 separate classes of municipalities (boroughs, town districts and cities). With the repeal of the Counties Act and the Municipal Corporations Act in 1980, all territorial authorities are now constituted under the Local Government Act. Particular features of all of the types of territorial authority mentioned above are as follows:
Counties—Counties were originally constituted by the Counties Act 1876. Generally, counties are concerned with the needs of rural areas. Initially, there were 63 counties but with increasing settlement this number increased to 129 in 1920. Since then, the number of counties has been reduced by mergers and at 1 April 1984 there were 90 counties. The members of each county council are responsible for electing once every 3 years one of their number to be the chairman of the county council. A complete table of counties with their populations and land areas is set out in Section 3A of this Yearbook.
Municipalities—The Municipal Corporations Act 1876 provided for the incorporation of the 36 boroughs then in existence and fur the creation of new boroughs. Boroughs provide for the needs of concentrated populations and, until 1978, there had to be a population of at least 1500, with an average density of population of at least one person per 4000 square metres, before they could be constituted. By 1955, there were 146 boroughs in existence, but by 1 April 1984 there were 128 boroughs—this reduction having resulted from some boroughs being incorporated into adjoining boroughs or counties.
The town district represents a form of municipality that was originally provided for in the Town Districts Act 1881, and later in the Municipal Corporations Act, for areas that had a certain concentration of urban population but not sufficient to justify the formation of a borough. Since 1978, no new town districts can be constituted, and there are now only 3 town districts in existence.
The city is in legal terms merely a borough which has a population of more than 20 000 and has been designated as a city by the Governor-General by Proclamation. Provision for this was originally made in 1886 in the Municipal Corporations Act and the figure of 20 000 population as a requirement for city status has remained unaltered since 1886. In 1886 there were only 5 cities—Dunedin, Christ-church, Wellington, Auckland and Nelson. The Municipal Corporations Act 1886 provided that these 5 cities were deemed to have been cities from the year in which they had legally been incorporated as boroughs, although these cities had previously been recognised as such by provincial ordinances in the case of Dunedin, Wellington and Auckland, and by Letters Patent issued by Queen Victoria in the case of Christchurch and Nelson. By 1955 there were 15 cities (these being included in the figure of 146 boroughs already mentioned above) and in 1984 there were 27 cities (these being included in the figure of 128 boroughs already mentioned above).
Each borough and city has a mayor who is directly elected by the electors of the borough or city, while a town district has a chairman elected by the council of the town district. Apart from acting as the chairman at all meetings of the council, the legal powers of a mayor which directly relate to the function of the borough or city are no greater than the powers of any other member of the council of a borough or city.
A table showing the population and land area of each borough and city is set out in Section 3A of this Yearbook, and a separate table for town districts is also included in this section.
District Councils—This form of territorial local authority was introduced by the Local Government Act 1974 in recognition of the fact that nowadays many territorial authorities are neither wholly urban nor wholly rural District councils may now be constituted either by Local Government Commission schemes resulting in a merger of a county and a borough or a county and a city, or by a borough council or county council deciding to become a district council. The Governor-General may by Proclamation designate a district under a district council to be a city if, in his opinion, it is predominantly urban and it has a population of not less than 20 000. As at 1 April 1984, there were 10 district councils. Eight of these districts comprise areas which have resulted in a merger of a separate county and borough, or a separate county and city. Some districts have a chairman who is appointed in the same way as the chairman of a county council. Other districts have a mayor who is directly elected by the electors of the district in the same way as the mayor of a borough or city. A table showing the population and land areas of each of these districts is set out in Section 3A of this Yearbook.
SPECIAL PURPOSE LOCAL GOVERNMENT—During the late 19th century various special purpose local authorities were established to carry out specific tasks thought to be beyond the capacity of territorial local authorities. Special purpose local authorities differ from territorial local authorities in that a special purpose local authority is charged with only 1 major function. In the majority of cases the boundaries of special purpose local authorities bear little relationship to the boundaries of the districts of territorial authorities in the same geographical area. Most special purpose local authorities include all or part of a number of territorial authority districts within their own district. Sometimes territorial authorities themselves are also constituted as, and perform the functions of, special purpose local authorities. The more important special purpose local authorities are those administering harbours, hospital services, the retail distribution of electricity, and soil conservation and rivers control (including management and allocation of water resources). Other special purpose local authorities are involved in water supply, urban drainage and transport, pest destruction, nassella tussock control, land drainage, and in some areas the liquor and hotel trade. (Territorial authorities also function as harbour boards in 8 cases, as pest destruction boards in 37 cases, and as electric power supply authorities in 23 cases.) Most Special purpose local authorities are directly elected by the electors of the local authority's district, although a minority of special purpose local authorities are indirectly elected in that their membership involves representation from other local authorities that are themselves directly elected. Apart from catchment authorities, pest destruction and nassella tussock boards, there are no Government representatives on any special purpose local authorities, or indeed on any other type of local authority.
The major categories of special purpose local authorities and the number involved in each category are: hospital boards (29); electric power boards including 1 energy (electric power and gas) board (38); harbour boards (15); and catchment authorities (including the Waikato Valley Authority) (18). These categories of special purpose local authorities are found throughout New Zealand. Electric power boards and harbour boards are all directly elected local authorities. Of the 18 catchment authorities, 13 are directly elected catchment boards (although with some Government representation not exceeding one-third of the membership of any catchment board), 4 are indirectly elected catchment commissions with the majority of their members appointed to represent constituent territorial authorities and a minority of their members appointed to represent central government, and the remaining one is the Waikato Valley Authority which is also indirectly elected in the same way. As mentioned above, catchment authorities are responsible for soil conservation and rivers control (including management and allocation of water resources).
In addition to the special purpose local authorities already mentioned, there are various minor categories of special purpose local authorities which are found only in some parts of New Zealand. These include 30 directly elected liquor licensing trusts (which are community controlled liquor and hotel businesses), 60 directly elected pest destruction boards, 2 directly elected and 2 indirectly elected urban drainage boards, 24 directly elected land (rural) drainage boards, 6 directly elected river boards (2 of which are also land drainage boards), 2 directly elected charitable lands trusts, 1 directly elected transport board, and 1 directly elected rural water supply board. (The names of all directly elected special purpose local authorities are found in the Local Authority Election Statistics published by the Department of Internal Affairs.)
There are also a small number of indirectly elected special purpose local authorities. Apart from the Auckland Harbour Bridge Authority, all of the indirectly elected special purpose authorities referred to in Section 2C of the 1983 edition of the New Zealand Official Yearbook are still in existence.
REGIONAL LOCAL GOVERNMENT—In 1963, the Auckland Regional Authority was established under its own Act of Parliament as a directly elected regional council to carry out a range of regional functions within the Auckland metropolitan area and its immediately adjoining rural hinterland—an area which contains 26 percent of New Zealand's total population. The range of functions carried out by the Auckland Regional Authority includes the operation of the Auckland International Airport, urban public passenger transport, regional planning, regional parks and reserves, regional urban water supply, regional drainage, regional refuse collection and disposal, regional roads, community development, regional civil defence, and assistance to beach patrol rescue services and the regional orchestra. The Auckland Regional Authority also carries out within its region the various responsibilities that in other parts of the country are carried out by catchment authorities.
The only other regional council apart from the Auckland Regional Authority is the Wellington Regional Council (established in 1980), which contains within its region 10 percent of New Zealand's population. The Wellington Regional Council was established in terms of the Local Government Act 1974 and carries out within its region the various responsibilities that in other parts of the country are carried out by catchment authorities, as well as also being responsible for regional planning, regional civil defence, regional parks and reserves, regional urban water supply, forestry and urban public passenger transport planning.
In addition to the Wellington Regional Council, in the period 1977 to 1983, 20 united councils were established in terms of the Local Government Act 1974, each with its own region. The principle behind the establishment of these 20 united councils was that they were seen as providing a form of regional government for those regions that are generally accepted as not justifying the expense of a regional council. Particular features of united councils which distinguish them from regional councils are:
The membership of the united council is appointed directly by the territorial authorities of the region (rather than by election by the electors of the region, as in the case of a regional council);
The finance of the united council is by way of levy on the territorial authorities of the region (rather than by way of a rate payable by the ratepayers of the region, as in the case of a regional council);
In addition, a united council must have the prior consent of the majority of territorial authorities in its region (having sufficient weighting in capital value, population and area) before it can take on any new function. (This again is a restriction that regional councils are not subject to.)
Most united councils also have an arrangement whereby their staff are seconded to them by 1 of the territorial authorities of the region—this territorial authority being known as “the administering authority”. (This is a situation which is unlike that which pertains to regional councils which employ their own staff and resources.)
Regional councils and united councils possess their functions through several means. First, every united or regional council has 2 mandatory functions—regional planning (under the Town and Country Planning Act 1977) and regional civil defence (under the Civil Defence Act 1983). Besides these 2 mandatory functions, the Local Government Act provides, with qualifications in some cases, that a united or regional council may undertake functions relating to regional reserves, forestry, regional roading, and community services. A united or regional council may, in certain circumstances, undertake the functions of any territorial authority or (where a special purpose local authority or the appropriate Minister of the Crown concurs) the functions of that special purpose local authority. A united or regional council is empowered to undertake exclusively any new regional function which Is not undertaken by any other local authority in the region. A united or regional council may also enter into an agreement with a constituent authority to undertake any function of that authority where, in the opinion of either party, that function would be more effectively and economically undertaken by the regional body. Finally, united and regional councils may enter into agreements with the Crown whereby they may exercise any function or provide any service for or on behalf of the Crown.
The regions of the 20 united councils and the 2 regional councils (Auckland and Wellington) cover all of the country, except for Great Barrier Island County which is not yet included in any region, and the Chatham Islands County which, because of its isolation, is specifically excluded from the requirement to be part of a region. A table listing all the regions, together with their populations, is set out in Section 3A of this Yearbook.
COMMUNITY LOCAL GOVERNMENT—This is a form of local government participation which is subordinate to territorial local government. The Local Government Act provides for the establishment of “communities” within the districts of territorial local authorities. Since 1976, a community may be constituted only in an urban area within the rural part of a territorial authority district that is predominantly urban in character, or in an urban area within a territorial authority district that is predominantly rural in character, or in the whole of the area of one or more offshore islands forming part of a territorial authority district. (These provisions are broadly in line with earlier provisions which had enabled “county towns” and “county boroughs” to be formed within counties, and most “communities” are in fact former “county towns” or “county boroughs”.) Notwithstanding the provisions for establishing “communities”, a number of towns in rural areas do not have “community” status, usually because these towns feel they are sufficiently large that their interests will not be overlooked by their territorial authority.
Although not local authorities in the true sense, each “community” has either a “district community council” or a “community council” of not less than 5 nor more than 12 members, elected by residents and ratepayers for a 3-year term. These “district community councils” or “community councils” are legally committees of their parent territorial authority. The differences between “district community councils” and “community councils” are as follows.
District Community Councils—The district community has direct representation on its parent territorial authority. By statute, except for certain reserved powers dealing with finance, staff and planning, a district community council may exercise all the powers and functions of its parent territorial authority. A district community council may be established only in respect of a community having a population of not less than 1500. As at 1 April 1984 there were 15 district community councils. These 15 district community councils together had the equivalent of 1.9 percent of New Zealand's population within their “communities”. A table listing these district community councils together with their populations and the name of their parent territorial authority is set out in Section 3A of this Yearbook.
Community Councils—A community council does not have direct representation on its parent territorial authority. Community councils derive their powers by delegation from their territorial authority, at its discretion, but powers dealing with finance, staff and planning cannot be delegated. In addition to exercising such powers as may be delegated to it, the general purpose of a community council is to coordinate and express to the parent territorial authority the views of the community on any matter of concern to it, and to undertake, encourage and co-ordinate activities for the general well-being of the residents of the community. Although a community council does not have direct representation on its parent territorial authority, it is entitled to have one of its members present at meetings of the council of the territorial authority with speaking rights on issues relating to the community. As at 1 April 1984, there were 119 community councils. These 119 community councils together had the equivalent of 2.8 percent of New Zealand's population within their “communities”. A table showing those community councils which have a population of 1000 or more and the name of their parent territorial authority is set out in Section 3A of this Yearbook.
GENERAL POWERS OF LOCAL AUTHORITIES—Local authorities in New Zealand derive their powers from the Act under which they are constituted. As mentioned above, the Local Government Act is the main governing Act for territorial authorities, as it is for united, regional, district community and community councils. Special purpose local authorities are constituted under other Acts of Parliament.
There are several statutory measures which are more or less applicable to all local authorities, such as the Public Bodies Meetings Act 1962, the Local Authorities (Members Interests) Act 1968 and the Local Authorities Loans Act 1956. Other legislation applicable to territorial, regional and various other types of local authority includes the Rating Act 1967, the Local Elections and Polls Act 1976, the Public Bodies Leases Act 1969, the Town and Country Planning Act 1977, the Public Works Act 1981, the Reserves Act 1977, the Health Act 1956, the Local Authorities (Employment Protection) Act 1963 and the Joint Council for Local Authorities Services Act 1977.
A local authority's powers to levy local taxes on land (rates) are dealt with in Section 28 of this Yearbook. A local authority can make bylaws within limits defined in its constituting Act. In the case of a special purpose local authority these bylaws are subject to approval by a Minister of the Crown. In the case of territorial authorities and regional councils, their bylaws (apart from fire bylaws) do not require the prior approval of central government if they have been made solely under the Local Government Act. A local authority can promote Parliamentary legislation on matters which affect the government of the area under its jurisdiction and which it is not already empowered to deal with. If the subject is transient and not contentious and is approved by Government, it is usually dealt with by the inclusion of an appropriate section in the annual Local Legislation Act passed by Parliament for this purpose. If, on the other hand, the local authority seeks powers of a permanent or major nature additional to those conferred on it by general Acts, it must submit the proposal to Parliament in the form of a local Bill. If it is approved by Parliament, the proposal then is enacted as a local Act. Thirteen local Acts were passed in 1983.
Elections—Under the Local Elections and Polls Act 1976, local government general elections are held on the second Saturday in October every third year. Relevant statistics from these elections are published by the Department of Internal Affairs in its publication Local Authority Election Statistics. The local government general elections were last held on 8 October 1983. All territorial authorities are responsible for conducting their own elections as well as the elections of those special purpose local authorities and the regional, community and district community councils whose districts cover all or part of the territorial authority districts.
Each territorial authority is required to use its electoral roll for regional council elections and community and district community council elections where applicable, and for the elections of all special purpose local authorities, other than land drainage boards, river boards and pest destruction boards.
Each territorial authority is required to choose once every 3 years whether its council is to be elected with the territorial authority district being constituted as one electorate; or, whether the territorial authority district should be constituted as separate electorates (known as “wards” in cities and boroughs, and “ridings” in counties); or, if the elections could be held with some members of the council elected from the district as a whole, and others from separate “wards” or “ridings” within the district. Where a territorial authority decides to divide its district into “wards” or “ridings” for electoral purposes, the council has the sole responsibility for determining the number of “wards” or “ridings” and the area, population and representation of each “ward” or “riding”.
In the case of the 2 regional councils and most of the elected special purpose local authorities, the district of the regional council or the special purpose local authority is divided into separate electorates— the boundaries of which usually coincide with territorial authority district boundaries. The electoral districts of regional councils and special purpose local authorities are determined on the basis specified in the various Acts of Parliament under which these authorities are constituted.
Voting Procedures—Under the provisions of the Local Elections and Polls Act 1976, any territorial authority may determine whether an election or poll is to be conducted by personal attendance at a polling booth or by way of postal vote. Where the franchise is to be exercised by personal attendance at a polling booth, the territorial authority may decide to conduct the election or poll over a period of not more than 11 consecutive days instead of confining voting to a single day.
The method of casting a vote is broadly similar to that used for Parliament. The names of candidates are printed on the ballot paper and the elector must indicate on the ballot paper the name of the candidate or candidates for whom the elector wishes to vote. In so doing, the number of candidates chosen by the elector must not exceed the number of positions shown on the ballot paper. In addition in filling out a ballot paper an elector may not allocate more than 1 vote for any candidate, nor is there any provision for an elector to otherwise indicate a preference for any candidate.
Franchise for Electors—In general, the franchise extends to all persons aged 18 years or over who are New Zealand citizens or are permanent residents (as defined in the Electoral Act), and who either possess a ratepayer qualification or have resided for 3 months in the district of the local authority concerned. (In the case of persons who do not have a ratepayer qualification but who have resided for 3 months in the district—these persons are deemed to be qualified to be residential electors.) Each legally defined property has attached to it 1 ratepayer qualification, and this is irrespective of the number of persons who own the property or the status these persons have. Unless the owners of a property determine otherwise, the ratepayer qualification is exercised by the person whose name appears first in the Valuation Department's records for the property concerned, and this is so whether or not the person who holds this qualification resides within the district. No person can hold more than one ratepayer-elector qualification in each territorial authority district, nor can a person exercise a residential elector qualification in addition to a ratepayer-elector qualification. In the case of residential electors, these persons must have applied for enrolment at the office of their territorial authority, although if they are on the current published Parliamentary electoral roll and are still resident at the address which is shown on that roll, they can vote even though their names are not found on the territorial authority roll.
For regional councils the franchise is limited to those who are resident within the region and have a ratepayer-elector qualification or a residential elector qualification, and in the case of licensing trusts and the two charitable lands trusts the right to vote is similarly restricted to those who are qualified by residence within the district. (The significance of these variations is that persons who are ratepayers and who live outside the region or district cannot vote for these categories of local authority, although as absentee ratepayers they can still vote for the territorial authority in whose district they hold their qualification.)
Membership of Local Authorities—All persons eligible to vote are also eligible to stand for election for the council of the local authority concerned. Depending on the Act of Parliament under which the local authority is constituted, vacancies in the elected membership of the council of the local authority may be filled by either election or appointment. In the case of a territorial authority or a regional council, a petition by 5 percent of the electors of the district is sufficient to require the territorial authority to hold a by-election. In the case of most special purpose local authorities any vacancy in membership is filled by appointment by the territorial authority or territorial authorities whose districts comprise the special purpose local authority electorate in respect of which the vacancy exists.
As far as is known, the earliest case of involvement of a woman as a council member of a local authority was in 1893 when Mrs Elizabeth Yates was elected mayor of Onehunga Borough. In recent years there has been a significant increase in the number of women who are mayors, chairmen and members of councils of local authorities. With the holding of the 1983 local government elections women now comprise approximately 21 percent of the total membership of municipalities, and preliminary indications are that there have been increases in participation by women in the membership of other local authorities. (Figures on the extent of participation of women in the membership of various categories of local authorities are contained in the Local Authority Election Statistics published by the Department of Internal Affairs.)
Remuneration of Members—The remuneration of members of councils of local authorities is governed by the Acts of Parliament constituting the various types of local authorities. Most local authorities pay their chairman an annual allowance with a maximum fixed for each type of authority, while their other members are paid an allowance on a 'per meeting' basis. The maximum allowance payable to mayors and chairmen of territorial authorities varies according to the population of the territorial authority. The chairman and members of a united or regional council may also be paid such annual allowances as may from time to time be approved by the Minister of Local Government with the concurrence of the Minister of Finance.
PLANNING AND RELATED ISSUES—The Town and Country Planning Act 1977 provides for the making and enforcement of regional, district and maritime planning schemes, and the detailed procedure to be followed in each case is amplified by the Town and Country Planning Regulations
1978. Although the Government administers the Act through the Minister of Works and Development, the statutory responsibility for planning under the Town and Country Planning Act lies with territorial authorities, regional and united councils in the case of district and regional schemes, and in the case of some maritime planning schemes it lies with harbour boards. On planning matters, the Planning Tribunal (which is a specialised judicial body) acts as the appropriate appeal body on issues which concern district land use planning, regional planning, the granting of water rights, the subdivision of land, the preservation of historic places, the making of local government financial levies on subdivisions and on development projects to finance public reserves, the taking of land for public works, the creation of pedestrian malls and the designation of regional roads and limited access roads.
LOCAL GOVERNMENT REFORM—To promote reform of the structure of local government, a Local Government Commission was first established, as a quasi-judicial body, in 1946. The present Local Government Commission, constituted by the Local Government Amendment Act (No. 2) 1977, comprises a chairman appointed by the Minister of Local Government and 2 other members, one appointed by the Minister on the nomination of the New Zealand Counties Association and the other on the nomination of the Municipal Association of New Zealand. Where the Local Government Commission is to consider a proposal affecting a local authority other than a territorial authority, it may request the Minister of Local Government to appoint a person, having special knowledge of the functions undertaken by that local authority, to be a temporary member of the Commission.
The Local Government Commission undertakes investigations, prepares schemes and makes recommendations and reports for the purpose of ensuring that:
The system of local government in any local authority district best provides for the needs and well-being of its residents and the continued development of the district;
Local authorities have such district boundaries and such functions and powers as enable them to provide most effectively and economically essential or desirable local government services and facilities;
Local authorities have such resources as enable them to engage adequate services and to obtain and operate adequate technical facilities, plant and equipment; and
Districts are of such a size and nature as will promote efficient local government and avoid the necessity of uneconomic expenditure.
The legislation sets out procedures to guide the Local Government Commission, with emphasis being placed on consultation on proposals at an early stage, prior to formulating a provisional scheme. After the hearing of objections to a provisional scheme, the commission may draw up a final scheme. A commission scheme may provide for the union of local authority districts, the constitution or abolition of any district, the adjustment of boundaries, or a transfer of functions from one local authority to another. A particular feature is provision for the appointment of conciliators by the commission to inquire into and negotiate on a proposal for a scheme, prior to any provisional scheme procedures being initiated.
The Local Government Act, as originally enacted in 1974, brought all special purpose local authorities (other than hospital boards, licensing trusts and charitable lands trusts) within the jurisdiction of the Local Government Commission. An amendment in 1976, however, removed the automatic jurisdiction of the commission in relation to special purpose local authorities, so that it may now include these local authorities in a provisional scheme where the appropriate Minister of the Crown or the special purpose local authorities concerned are agreed.
A further function of the Local Government Commission in the period 1977–83 was the establishment of regions throughout New Zealand, and this was also carried out using the scheme procedures already mentioned (although without the requirement to appoint conciliators).
All Local Government Commission final schemes are implemented either by an Order in Council promulgated by the Governor-General with the advice and consent of the Executive Council, or by an Act of Parliament to amend or repeal a special or local Act (where the local authority was originally established under its own special or local Act of Parliament).
In addition to the Local Government Commission scheme procedures mentioned above, a local authority can be abolished by an Act of Parliament without reference to the Local Government Commission. The only cases where this has happened in recent years was with the abolition of the Christchurch-Lyttelton Road Tunnel Authority in 1979 and the abolition of the Auckland Harbour Bridge Authority in 1984. In both cases this action was taken by an Act of Parliament in the previous year and was consequential to a decision by Central Government to take over the responsibility for the financing and maintenance of these two sections of roading as part of the national roading system.
FURTHER INFORMATION—Books dealing with various aspects of the wide range of historical, constitutional, political, economic, and governmental matters touched on in this section will be found listed in the select bibliography of New Zealand books near the back of this Yearbook.
Parliamentary papers which may be found useful include the following:
Report of the Ministry of Foreign Affairs (Parl. paper A. 1).
Report of the Department of Internal Affairs (Parl. paper G. 7).
Report of the Local Government Commission (Parl. paper G. 9).
Report of the Ombudsmen (Parl. paper A. 3).
Local Authority Election Statistics—Department of Internal Affairs.
Table of Contents
By world standards New Zealand's population is small—3.2 million at the end of 1983. New Zealand's first million of population was recorded in 1908, 68 years after the signing of the Treaty of Waitangi. In 1952, 44 years later, the second million was reached, and the third million late in 1973. Recent predictions are that the fourth million will not be reached until well into the twenty-first century.
Population growth has 2 components—natural increase (excess of births over deaths) and net migration (excess of arrivals over departures). In its early years in New Zealand the bulk of the increase was through migration. From the late 1870s natural increase permanently displaced immigration as the chief contributor to population growth. At the Census of 1881 the percentages of the total population born in New Zealand and born overseas were approximately equal (50.2 percent New Zealand-born to 49.8 percent overseas-born), and each succeeding census until 1951 recorded an increased proportion of the population being New Zealand-born. Since 1951 (when the New Zealand-born made up 86 percent of the population) the proportion has fallen slightly, mainly because increased international travel and tourism have meant that at each census increased numbers of overseas-born tourists and travellers have been included in the population as enumerated on census date. At the 1981 Census, data based on the usually resident population (that is, the population excluding tourists and other visitors) showed that 85 percent had been born in New Zealand.

During the present century, natural increase has accounted for over three-quarters of the growth of population. New Zealand's rate of natural increase has, until recently, been relatively high compared with other countries whose population is predominantly of European origin.
The natural increase rate has, in the main, closely reflected the changes in the birth rate with a low point of 8.63 births per 1000 persons in 1935 and high points of 18 per 1000 in 1947 and 1961. In the 1960s the average rate was less than 16 per 1000, and the rate continued to fall throughout the 1970s, reflecting the continued fall in the birth rate, until it has now fallen below the previous low point recorded in 1935 (in 1982 the natural increase rate was 7.67). The fall in birth rate in the sixties and seventies is a feature that New Zealand shared with a number of other developed countries, and notably with Australia, Canada, and the United States.
The natural increase in recent years is shown in the following table. A series of vital statistics is included in the Statistical Summary near the back of this Yearbook.
| Period | March Years | December Years | ||||
|---|---|---|---|---|---|---|
| Births* | Deaths | Natural Increase | Births* | Deaths | Natural Increase | |
* Excluding Section 14 birth registrations. These are “late” registrations. See Yearbook Section 4B Births. †Provisional. | ||||||
| (thousand) | ||||||
| 1946–1950 | 239.5 | 88.0 | 151.5 | 244.5 | 88.1 | 156.3 |
| 1951–1955 | 258.1 | 93.1 | 165.1 | 263.2 | 94.2 | 169.0 |
| 1956–1960 | 294.6 | 101.5 | 193.1 | 300.1 | 102.9 | 197.2 |
| 1961–1965 | 319.4 | 110.5 | 208.9 | 317.3 | 112.1 | 205.2 |
| 1966–1970 | 306.0 | 118.6 | 187.4 | 307.5 | 120.2 | 187.3 |
| 1971–1975 | 308.6 | 124.8 | 183.9 | 304.4 | 124.8 | 179.6 |
| 1976–1980 | 268.2 | 127.4 | 140.8 | 263.1 | 128.1 | 135.0 |
| 1981–1983 | 151.2 | 77.3 | 74.0 | 151.2† | 76.7 | 74.5† |
| Total, 1946–1983 | 2 145.7 | 841.1 | 1 304 5 | 2 151.3† | 847.1 | 1 304.2† |
In the present century, migration has continued to add to the population quite substantially except during the two world wars and in times of economic difficulties. Gains and losses from external migration since the Second World War are shown in the following table. Movements of the armed forces are not included.
| Period | March Years*Migration Gain | December Years Migration Gain |
|---|---|---|
* March years ended in years listed. †Excess of departures. ‡Provisional. | ||
| (000) | (000) | |
| 1946–1950 | 27.4 | 32.5 |
| 1951–1955 | 66.6 | 69.0 |
| 1956–1960 | 49.2 | 43.9 |
| 1961–1965 | 63.9 | 70.2 |
| 1966–1970 | 6.0 | 6.5 |
| 1971–1975 | 107.8 | 116.9 |
| 1976–1980 | −78.7† | −98.8† |
| 1981–1983 | −4.7† | 19.0‡ |
| Total, 1946–1983 | 237.6 | 259.2‡ |
The years since the late 1960s stand out because of the major changes in the levels and directions of net external migration. Also, Australia has replaced the United Kingdom as the country having the largest exchange of migrants with New Zealand.
Annual figures of the net inflow or outflow from migration since 1975 are shown in the following table and in more detail later in this section.
| Year Ended March | Net Inflow or Outflow*From | |
|---|---|---|
| Total Migration | Permanent and Long-term Migration | |
* A minus sign indicates outflow. †Provisional. | ||
| 1975 | 29,643 | 22,439 |
| 1976 | 6,567 | 5,300 |
| 1977 | −13 727 | −19 072 |
| 1978 | −22 307 | −26 708 |
| 1979 | −26 906 | −40 200 |
| 1980 | −22 299 | −34 417 |
| 1981 | −15 328 | −24 825 |
| 1982 | −5 182 | −11 482 |
| 1983 | 15,852 | 3,180 |
| 1984 | 10,491 | 6,558 |
POPULATION STATISTICS—Population statistics are based primarily on the 5-yearly population census. Intercensal population estimates are based on the most recent census data available, adjusted in accordance with later figures of births, deaths, and migration. Estimates of the populations of particular localities, e.g., cities and boroughs, also take into account local economic developments, housing schemes, the numbers on school rolls, changes in boundaries, and any other factors leading to, or indicating, changes in population.
The population census, and other population statistics in New Zealand, represent the population physically present in the place of enumeration, at the time of enumeration. All references to New Zealand relate solely to geographic New Zealand. Though Tokelau is constitutionally part of New Zealand, for geographical reasons it is administered separately. The Cook Islands and Niue are self-governing but the inhabitants are New Zealand citizens.
The most recent Census of Population and Dwellings in New Zealand was taken on 24 March 1981. The next will be taken on 4 March 1986.
The figures in the table following are intercensal estimates and exclude members of New Zealand armed forces who were overseas, and also members of the armed forces of other countries who were in New Zealand.
| Year | Total Population at End of Year | Increase During Year | Mean Population for Year | |||
|---|---|---|---|---|---|---|
| Males | Females | Total | Numerical | Percent | ||
| Years Ended 31 March | ||||||
| 1980 | 1,571,400 | 1,589,900 | 3,161,300 | 3,100 | 0.1 | 3,138,000 |
| 1981 | 1,576,500 | 1,594,400 | 3,170,900 | 9,600 | 0.3 | 3,146,700 |
| 1982 | 1,585,100 | 1,605,000 | 3,190,100 | 19,200 | 0.6 | 3,162,100 |
| 1983 | 1,605,000 | 1,625,000 | 3,230,000 | 39,900 | 1.3 | 3,192,200 |
| 1984 | 1,621,500 | 1,644,000 | 3,265,500 | 35,500 | 1.1 | 3,234,900 |
| Years Ended 31 December | ||||||
| 1979 | 1,573,800 | 1,590,100 | 3,163,900 | −1 300 | – | 3,137,800 |
| 1980 | 1,581,500 | 1,594,900 | 3,176,400 | 12,500 | 0.4 | 3,144,000 |
| 1981 | 1,580,200 | 1,607,600 | 3,195,800 | 19,400 | 0.6 | 3,157,200 |
| 1982 | 1,604,800 | 1,625,000 | 3,229,800 | 34,000 | 1.1 | 3,182,900 |
| 1983 | 1,625,200 | 1,644,300 | 3,269,500 | 39,700 | 1.2 | 3,225,500 |
INCREASE OF POPULATION—The growth of population in the most recent intercensal period was unusually low. Before the 1976–81 period, the lowest rates were those of 1926–36, which included some years of economic depression, of 1936–45, which included World War II, and 1966–71, mainly attributable to a marked change in migration patterns. However, the population increase of only 46 354 between the censuses of 1976 and 1981, covering years of net migration losses and low birth rates, represents a steep fall from any intercensal increase recorded during this century. It is the more significant because the increase of 266 752 during the previous intercensal period (1971–76) was the highest ever recorded in New Zealand.
Totals and increase rates from the five most recent censuses are shown below.
| Census Date | Population* | Increase | ||
|---|---|---|---|---|
| Intercensal | Intercensal | Annual Average | ||
| * Numbers of persons in New Zealand armed forces overseas are excluded. | ||||
| Number | Percent | |||
| 18 April 1961 | 2,414,984 | 240,922 | 11.08 | 2.12 |
| 22 March 1966 | 2,676,919 | 261,935 | 10.85 | 2.08x |
| 23 March 1971 | 2,862,631 | 185,712 | 6.94 | 1.35 |
| 23 March 1976 | 3,129,383 | 266,752 | 9.32 | 1.80 |
| 24 March 1981 | 3,175,737 | 46,354 | 1.48 | 0.30 |
COMPARISON WITH OTHER COUNTRIES—The annual average percentage increases of population for the period 1975–82, are given in the following table for certain selected countries. (Source: United Nations Demographic Yearbook, 1981 and United Nations Population and Vital Statistics Report, Vol. XXXV No. 3.)
| Country | Average Annual Percentage Increase |
|---|---|
| * Provisional. | |
| Australia | 1.4* |
| Canada | 1.2* |
| Denmark | 0.2* |
| France | 0.4* |
| Germany, West | – |
| India | 2.4* |
| Japan | 0.9 |
| Netherlands | 0.7 |
| New Zealand | 0.4* |
| Sweden | 0.2* |
| Switzerland | 0.2* |
| United Kingdom | – |
| United States | 1.0 |
| U.S.S.R. | 0.8* |
POPULATION PROJECTIONS—An indication of possible future growth of the total New Zealand population up to 2016 is given in the detailed alternative projections which follow.
Projections of future population involve an element of uncertainty owing to an incomplete knowledge of the factors underlying changes in fertility, mortality and migration levels. Also, difficulties in forecasting the future behaviour of these components of population change result from rapidly changing trends brought about by varying social, and especially economic, conditions.
It should be understood that, as with all demographic projections prepared by the Department of Statistics, these projections are not strict forecasts or targets, but conditional forecasts based on the stated assumptions. Presentation and use of the projections, therefore, cannot be divorced from consideration of the assumptions adopted.
These national population projections incorporate alternative short-term assumptions involving changing annual levels of net immigration as described in the footnotes to the table.
Age-sex-specific projections, equivalent to those in the table below, are available from the Demographic Specialist Studies Section, Department of Statistics, Private Bag, Christchurch.
| At 31 March | Projected Total New Zealand Population Assuming:*† | |||||
|---|---|---|---|---|---|---|
| Long-term Net Annual Immigration of Zero and Short-term Migration Variant Designated‡ | Long-term Net Annual Immigration of 5000 and Short-term Migration Variant Designated‡ | |||||
| Low | Medium | High | Low | Medium | High | |
* These projections have as base the estimated population at 31 March 1982. They incorporate the following assumptions:
†Three alternative fertility variants—designated “low”, “medium”, and “high” have been derived in terms of age specific fertility rates. These rates are generally projected to decrease over the period 1983–1991, after which time they are assumed to remain constant. The “low”, “medium”, and “high” fertility variants give total fertility rates of 1.59, 1.85, and 2.11 from 1992 onwards. (These rates represent alternative average family sizes in the long-term.) ‡
| ||||||
| (thousand) | ||||||
| 1982 (Base) | 3,190 | 3,190 | 3,190 | 3,190 | 3,190 | 3,190 |
| 1984 | 3,270 | 3,274 | 3,280 | 3,270 | 3,274 | 3,280 |
| 1985 | 3,304 | 3,314 | 3,225 | 3,304 | 3,314 | 3,325 |
| 1986 | 3,335 | 3,350 | 3,366 | 3,335 | 3,350 | 3,366 |
| 1991 | 3,463 | 3,485 | 3,512 | 3,489 | 3,506 | 3,527 |
| 1996 | 3,579 | 3,603 | 3,632 | 3,633 | 3,651 | 3,675 |
| 2001 | 3,670 | 3,695 | 3,726 | 3,754 | 3,772 | 3,798 |
| 2006 | 3,728 | 3,754 | 3,786 | 3,844 | 3,863 | 3,889 |
| 2011 | 3,759 | 3,786 | 3,821 | 3,909 | 3,928 | 3,956 |
| 2016 | 3,775 | 3,803 | 3,839 | 3,959 | 3,980 | 4,008 |
DISTRIBUTION OF POPULATION—Detailed population statistics are compiled for each census and are published in 3 parts as Volume 1, Location and Increase of Population, Part A. Population Size and Distribution, Part B. Population Density and Part C. Usually Resident Population of the Census of Population and Dwellings. In the case of the 1981 Census, prior to the publication of the subject-matter volumes a series of 10 Regional Statistics bulletins has been published, each giving final population, dwelling, and household statistics by population centre and subdivision for a major area of New Zealand.
North and South Islands—In 1858 the North Island had a larger population than the South, but this position was reversed at the succeeding enumeration, and the South Island had the larger population (exclusive of NZ Maoris) at each census from 1861 to 1896. In 1901 the North Island was found to have slightly the larger total and since then has steadily increased its lead.
The following table gives the population of the North and South Islands since 1901.
| Census Year | Total Population | Percentages | |||
|---|---|---|---|---|---|
| North Island | South Island | Total | North Island | South Island | |
| 1901 | 431,471 | 384,391 | 815,862 | 52.9 | 47.1 |
| 1911 | 610,599 | 447,713 | 1,058,312 | 57.7 | 42.3 |
| 1921 | 791,918 | 479,750 | 1,271,668 | 62.3 | 37.7 |
| 1936 | 1,018,038 | 555,774 | 1,573,812 | 64.7 | 35.3 |
| 1945 | 1,146,315 | 556,015 | 1,702,330 | 67.3 | 32.7 |
| 1956 | 1,497,364 | 676,698 | 2,174,062 | 68.9 | 31.3 |
| 1966 | 1,893,326 | 783,593 | 2,676,919 | 70.7 | 29.3 |
| 1971 | 2,051,363 | 811,268 | 2,862,631 | 71.7 | 28.3 |
| 1976 | 2,268,393 | 860,990 | 3,129,383 | 72.5 | 27.5 |
| 1981 | 2,322,989 | 852,748 | 3,175,737 | 73.1 | 26.9 |
The 1981 Census revealed that the population of the North Island continues to increase at a greater proportionate rate than that of the South Island. At the 1981 Census the North Island population was 2 322 989, a 2.4 percent increase on the 1976 total of 2 268 393. At the same census the South Island total was 852 748, a decrease of 1.0 percent on the 1976 total of 860 990. However, between the 1976 and 1981 censuses, births in the South Island totalled over 65 000 and deaths over 38 000, giving a net natural increase of approximately 27 000. The fact that the total population decrease was over 8000 indicates a net migration outflow during the intercensal period of approximately 35 000, but the relative movements to and from overseas and the North Island are not yet available.
In the previous intercensal period (1971–76), there was a total of net migration inflow of approximately 10 000. This was attributable to a substantial net gain from overseas, which offset a small loss to the North Island of almost 4000 persons aged 5 years and over.
Statistical Areas—In the following table are shown the areas and enumerated populations of the statistical areas at the most recent census and the estimated population at 31 March 1983.
| Statistical Area* | Area (Square Kilometres) | Population Census 1981 | Estimated Population as at 31 March 1983 |
|---|---|---|---|
* Includes adjacent islands and land reclamations where appropriate. †Includes Chatham Islands County. ‡Includes Stewart Island County. | |||
| Northland | 12,653 | 114,295 | 118,300 |
| Central Auckland | 5,581 | 829,519 | 863,900 |
| South Auckland-Bay of Plenty | |||
| Bay of Plenty | 36,882 | 491,304 | 506,500 |
| East Coast | 10,885 | 48,573 | 48,900 |
| Hawke's Bay | 11,289 | 147,722 | 150,200 |
| Taranaki | 9,729 | 105,153 | 105,900 |
| Wellington | 27,766 | 586,423 | 585,800 |
| Total, North Island | 114 785 | 2 322 989 | 2 379 500 |
| Marlborough | 10,210 | 36,027 | 36,500 |
| Nelson | 18,948 | 77,223 | 78,200 |
| Westland | 15,477 | 23,489 | 23,200 |
| Canterbury† | 43,346 | 424,280 | 422,500 |
| Otago | 36,873 | 183,559 | 182,000 |
| Southland‡ | 28,464 | 108,170 | 108,100 |
| Total, South Island | 153 318 | 852 748 | 850 500 |
| Total, New Zealand | 268 103 | 3 175 737 | 3 230 000 |
Statistical Divisions and Urban Areas—Statistical divisions and urban areas are statistical concepts and have no administrative purpose. They provide stable and comparable boundaries for the larger centres of population which may cover several territorial local authorities. Statistical divisions were introduced in 1971. The basic criterion for a statistical division is a population of 75 000 or more within the area of economic and social interests of a heavily populated centre. Seven statistical divisions have been established, namely, Auckland, Hamilton, Napier- Hastings, Palmerston North, Wellington (including Hutt), Christchurch, and Dunedin. The division, like the urban area, does not have any administrative functions, but embraces areas of unified community, economic, and social interests. In addition to the central city or borough, urban areas include neighbouring boroughs and town districts and parts of counties which are regarded as suburban to the centre of population. Minor adjustments of main urban area boundaries have been made because of the peripheral growth of population in some of the urban areas between 1976 and 1981.
For the 1981 Census, a new group of 14 secondary urban areas, with populations of over 10 000 but below 30 000, has been structured. The populations of the 7 statistical divisions and the 37 defined urban areas are as follows:
| Statistical Division (S. Div) and Urban Area (U.A.) | Population Census | Percentage Increase or Decrease 1976–81 | Estimated Population as at 31 March 1983 | |
|---|---|---|---|---|
| 1976 | 1981 | |||
| Auckland S. Div.— | Statistical Divisions | |||
| Main U.A.— | ||||
| Northern Auckland | 137,421 | 149,321 | 8.7 | 160,800 |
| Western Auckland | 108,139 | 116,407 | 7.6 | 123,200 |
| Central Auckland | 289,125 | 275,914 | −4.6 | 273,800 |
| Southern Auckland | 208,101 | 227,916 | 9.5 | 242,200 |
| Subtotal, Combined Auckland Main U.A. | 742,786 | 769,558 | 3.6 | 800,100 |
| Secondary U.A.— | ||||
| Pukekohe | 12,889 | 13,292 | 3.1 | 13,700 |
| Remainder S. Div. | 41,731 | 46,669 | 11.8 | 50,100 |
| Total | 797 406 | 829 519 | 4.0 | 863 900 |
| Hamilton S. Div.— | ||||
| Main U.A.— | ||||
| Hamilton | 94,777 | 97,907 | 3.3 | 100,500 |
| Remainder S. Div. | 59,829 | 62,308 | 4.1 | 64,200 |
| Total | 154 606 | 160 215 | 3.6 | 164 700 |
| Napier-Hastings S. Div.— | ||||
| Main U.A.— | ||||
| Napier | 50,164 | 51,330 | 2.3 | 52,300 |
| Hastings | 50,814 | 52,563 | 3.4 | 53,900 |
| Remainder S. Div. | 8,032 | 8,152 | 1.5 | 8,280 |
| Total | 109 010 | 112 045 | 2.8 | 114 400 |
| Palmerston North S. Div.— | ||||
| Main U.A.— | ||||
| Palmerston North | 63,873 | 66,691 | 4.4 | 68,200 |
| Secondary U.A.— | ||||
| Feilding | 11,645 | 12,203 | 4.8 | 12,550 |
| Remainder S. Div. | 13,206 | 12,927 | −2.1 | 12,950 |
| Total | 88 724 | 91 821 | 3.5 | 93 700 |
| Wellington S. Div.— | ||||
| Main U.A.— | ||||
| Upper Hutt Valley | 35,584 | 36,525 | 2.6 | 36,900 |
| Lower Hutt Valley | 97,194 | 94,732 | −2.5 | 94,000 |
| Porirua Basin | 55,698 | 54,653 | −1.9 | 54,400 |
| Wellington | 138,938 | 135,094 | −2.8 | 133,700 |
| Subtotal, Combined Wellington Main U.A. | 327,414 | 321,004 | −2.0 | 319,100 |
| Secondary U.A.— | ||||
| Kapiti | 18,911 | 20,083 | 6.2 | 20,600 |
| Remainder S. Div. | 3,303 | 2,895 | −12.4 | 2,900 |
| Total | 349 628 | 343 982 | –1.6 | 342 500 |
| Christchurch S. Div.— | ||||
| Main U.A.— | ||||
| Christchurch | 295,296 | 289,959 | −1.8 | 289,000 |
| Remainder S. Div. | 30,414 | 31,761 | 4.4 | 33,200 |
| Total | 325 710 | 321 720 | –1.2 | 322 200 |
| Dunedin S. Div.— | ||||
| Main U.A.— | ||||
| Dunedin | 113,222 | 107,445 | −5.1 | 105,600 |
| Remainder S. Div. | 7,204 | 6,588 | −8.6 | 6,450 |
| Total | 120 426 | 114 033 | –5.3 | 112 000 |
| Urban Areas Not in Any Statistical Division | ||||
| Main U.A.— | ||||
| Whangarei | 39,069 | 40,212 | 2.9 | 41,300 |
| Tauranga | 48,153 | 53,097 | 10.3 | 57,000 |
| Rotorua | 46,675 | 48,314 | 3.5 | 50,000 |
| Gisborne | 31,790 | 32,062 | 0.9 | 32,200 |
| New Plymouth | 43,914 | 44,095 | 0.4 | 45,000 |
| Wanganui | 39,679 | 39,595 | −0.2 | 39,600 |
| Nelson | 42,433 | 43,121 | 1.6 | 43,700 |
| Timaru | 29,958 | 29,225 | −2.4 | 28,900 |
| Invercargill | 53,762 | 53,868 | 0.2 | 54,000 |
| Secondary U.A.— | ||||
| Tokoroa | 19,481 | 19,333 | −0.8 | 19,400 |
| Taupo | 14,674 | 15,356 | 4.6 | 15,900 |
| Whakatane | 14,282 | 15,159 | 6.1 | 15,750 |
| Hawera | 11,351 | 11,344 | −0.1 | 11,300 |
| Levin | 18,213 | 18,070 | −0.8 | 18,000 |
| Masterton | 21,001 | 20,422 | −2.8 | 20,100 |
| Blenheim | 21,481 | 22,104 | 2.9 | 22,600 |
| Greymouth | 11,811 | 11,604 | −1.8 | 11,500 |
| Ashburton | 15,357 | 15,303 | −0.4 | 15,250 |
| Oamaru | 15,095 | 14,664 | −2.9 | 14,550 |
| Gore | 12,105 | 12,061 | −0.4 | 12,050 |
| Total, 23 Main Urban Areas | 2,113,779 | 2,140,046 | 1.2 | 2,180,200 |
| Total, 14 Secondary Urban Areas | 218,296 | 220,998 | 1.2 | 223,300 |
| Total, 96 Minor Urban Areas | 285 091x | 293 372x | 2.9x | 298,100 |
| Total, 7 Statistical Divisions | 1,945,510 | 1,973,335 | 1.4 | 2,013,400 |
Local Government Regions—The Local Government Act of 1974 provides for the constitution of these regions, the mandatory function of such being regional planning and civil defence. At the time of preparing this publication, 22 regions had been determined by the Local Government Commission. These cover every territorial local authority in New Zealand with the exception of Chatham Islands County. Extra-county islands and shipboard population are also excluded.
The populations in the following table are for the local government regions as they existed at 31 March 1983; they may be subject to modification as a result of objections lodged by various local body organisations.
| Local Government Region | Population Census 1981 | Estimated Population as at 31 March 1983 |
|---|---|---|
| * The scheme relating to this region has only provisional status at 31 March 1983. | ||
| Northland | 113,994 | 118,000 |
| Auckland | 827,980 | 862,400 |
| Thames Valley | 54,343 | 55,500 |
| Bay of Plenty | 172,480 | 181,300 |
| Waikato | 221,850 | 226,300 |
| Tongariro | 40,089 | 40,700 |
| East Cape | 53,295 | 53,800 |
| Hawke's Bay* | 137,840 | 140,300 |
| Taranaki | 103,798 | 104,500 |
| Wanganui | 68,702 | 68,400 |
| Manawatu | 113,238 | 115,100 |
| Horowhenua | 49,296 | 49,700 |
| Wellington | 323,162 | 321,200 |
| Wairarapa | 39,689 | 39,200 |
| Nelson Bays | 65,934 | 66,900 |
| Marlborough | 37,557 | 36,700 |
| West Coast | 34,178 | 33,900 |
| Canterbury | 336,846 | 337,700 |
| Aorangi | 84,772 | 83,500 |
| Clutha-Central Otago | 45,402 | 46,000 |
| Coastal-North Otago | 138,164 | 136,000 |
| Southland | 107,905 | 107,800 |
| Total, 22 Local Government Regions | 3 170 514 | 3 224 900 |
Cities and Boroughs—The estimated populations and areas of cities and boroughs as at 31 March 1983 is shown in the following table.
| City or Borough | Estimated Population as at 31 March 1983 | Approximate Area in Hectares |
|---|---|---|
| North Island— | ||
| Kaitaia | 4,880 | 695 |
| Kaikohe | 3,730 | 544 |
| Whangarei (city) | 37,400 | 4,913 |
| Dargaville | 4,840 | 1,133 |
| Helensville | 1,390 | 532 |
| East Coast Bays (city) | 33,400 | 1,558 |
| Takapuna (city) | 68,600 | 8,671 |
| Devonport | 10,400 | 445 |
| Northcote | 10,200 | 540 |
| Birkenhead (city) | 22,300 | 1,266 |
| Waitemata (city) | 93,500 | 37,550 |
| Henderson | 6,620 | 517 |
| Glen Eden | 9,710 | 503 |
| New Lynn | 10,450 | 564 |
| Auckland (city) | 144,100 | 7,472 |
| Newmarket | 1,180 | 74 |
| Mt. Albert (city) | 26,200 | 983 |
| Mt. Eden | 18,050 | 598 |
| Mt. Roskill | 33,500 | 1,863 |
| Onehunga | 15,150 | 764x |
| One Tree Hill | 11,000 | 983 |
| Ellerslie | 5,380 | 301 |
| Mt. Wellington | 19,350 | 1,650 |
| Howick | 13,900 | 621 |
| Otahuhu | 10,250 | 574 |
| Papatoetoe (city) | 21,800 | 907 |
| Manukau (city) | 173,000 | 56,573 |
| Papakura (city) | 23,200 | 1,384 |
| Pukekohe | 9,320 | 1,405 |
| Waiuku | 3,840 | 593 |
| Tuakau | 2,090 | 442 |
| Huntly | 7,030 | 930 |
| Cambridge | 9,050 | 1,071 |
| Ngaruawahia | 4,480 | 450 |
| Hamilton (city) | 93,600 | 6,749 |
| Te Awamutu | 8,110 | 713 |
| Taumarunui | 6,570 | 1,815 |
| Paeroa | 3,680 | 574 |
| Waihi | 3,580 | 539 |
| Te Aroha | 3,480 | 1,002 |
| Morrinsville | 5,220 | 476 |
| Matamata | 5,410 | 533 |
| Putaruru | 4,210 | 395 |
| Tokoroa | 18,750 | 1,359 |
| Mt. Maunganui | 12,100 | 1,946 |
| Tauranga (city) | 39,900 | 4,020 |
| Te Puke | 4,940 | 532 |
| Taupo | 14,500 | 3,384 |
| Kawerau | 9,000 | 2,174 |
| Murupara | 2,960 | 287 |
| Gisborne (city) | 30,200 | 2,628 |
| Wairoa | 5,420 | 649 |
| Napier (city) | 49,200 | 3,021 |
| Hastings (city) | 37,100 | 1,949 |
| Havelock North | 8,640 | 563 |
| Dannevirke | 5,720 | 526 |
| Woodville | 1,670 | 427 |
| Waitara | 6,100 | 575 |
| New Plymouth (city) | 36,300 | 2,380 |
| Inglewood | 2,890 | 284 |
| Stratford | 5,550 | 816 |
| Eltham | 2,420 | 333 |
| Patea | 1,770 | 575 |
| Ohakune | 1,530 | 841 |
| Raetihi | 1,270 | 388 |
| Wanganui (city) | 36,900 | 3,392 |
| Taihape | 2,520 | 778 |
| Marton | 4,830 | 573 |
| Feilding | 11,850 | 855 |
| Foxton | 2,720 | 306 |
| Palmerston N. (city) | 61,400 | 4,302 |
| Levin | 14,600 | 1,298 |
| Otaki | 4,350 | 714x |
| Kapiti | 15,650 | 17,428 |
| Upper Hutt (city) | 31,700 | 48,428 |
| Lower Hutt (city) | 62,900 | 8,968 |
| Petone | 7,820 | 1,043 |
| Eastborne | 4,500 | 1,274 |
| Porirua (city) | 40,800 | 8,384 |
| Tawa | 12,050 | 696 |
| Wellington (city) | 134,300 | 26,336 |
| Pahiatua | 2,600 | 291 |
| Masterton | 18,500 | 1,799 |
| Carterton | 3,970 | 512 |
| Greytown | 1,740 | 442 |
| Featherston | 2,390 | 307 |
| Martinborough | 1,320 | 443 |
| Total, North Island cities and boroughs | 1 780 600 | 310 091x |
| South Island— | ||
| Picton | 3,190 | 426 |
| Blenheim | 18,300 | 1,770 |
| Nelson (city) | 33,700 | 4,762 |
| Richmond | 6,970 | 1,052 |
| Motueka | 4,790 | 1,021 |
| Westport | 4,600 | 308 |
| Runanga | 1,260 | 487 |
| Greymouth | 8,020 | 1,068 |
| Hokitika | 3,340 | 273 |
| Rangiora | 6,560 | 357 |
| South Island— | ||
| Kaiapoi | 4,990 | 434 |
| Riccarton | 6,480 | 339 |
| Christchurch (city) | 162,700 | 10,635 |
| Lyttelton | 3,130 | 1,036 |
| Ashburton | 14,100 | 1,227 |
| Geraldine | 2,150 | 301 |
| Temuka | 3,800 | 395 |
| Timaru (city) | 28,100 | 2,342 |
| Waimate | 3,370 | 312 |
| Oamaru | 12,900 | 1,161 |
| Port Chalmers | 2,860 | 410 |
| Dunedin (city) | 75,500 | 15,685 |
| St. Kilda | 6,070 | 249 |
| Green Island | 6,860 | 781 |
| Mosgiel | 9,240 | 787 |
| Milton | 2,210 | 204 |
| Kaitangata | 1,080 | 518 |
| Balclutha | 4,450 | 509 |
| Tapanui | 1,080 | 121 |
| Lawrence | 600 | 249 |
| Roxburgh | 740 | 208 |
| Naseby | 170 | 76 |
| Alexandra | 4,460 | 987 |
| Cromwell | 2,490 | 740 |
| Arrowtown | 600 | 134 |
| Queenstown | 3,440 | 416 |
| Gore | 9,180 | 946 |
| Mataura | 2,320 | 515 |
| Winton | 2,060 | 240 |
| Invercargill (city) | 49,600 | 5,616 |
| Bluff | 2,630 | 866 |
| Total, South Island cities and boroughs | 520 100 | 59 963x |
| Grand total, all cities and boroughs | 2 300 600 | 370 054x |
Note: Because of rounding, individual figures in this table do not always add to give the stated total.
Districts—A new concept in local government—the district—appeared in the 1976 Census of Population and Dwellings statistics in the form of the Thames-Coromandel District, constituted on 1 October 1975 and amalgamating the former Thames and Coromandel Counties and Thames Borough. Similar amalgamations occurred between 23 March 1976 and 1 April 1982 resulting in the constitution of 9 further districts, the largest of which is Rotorua, formed from Rotorua City and Rotorua County.
| District | Estimated Population as at 31 March 1983 | Approximate Area in Square Kilometres |
|---|---|---|
| Thames-Coromandel | 18,950 | 2,212 |
| Otorohanga | 9,350 | 1,976 |
| Waitomo | 10,800 | 3,407 |
| Rotorua | 60,400 | 2,708 |
| Whakatane | 28,300 | 4,308 |
| Waipawa | 5,060 | 1,354 |
| Waipukurau | 7,960 | 2,031 |
| Hawera | 12,800 | 500 |
| Total, North Island | 153 700 | 18 496 |
| Rangiora | 5,600 | 263 |
| Waimairi | 71,400 | 115 |
| Total, South Island | 77 000 | 378 |
| Total, New Zealand | 230 800 | 18 874 |
Town Districts—The population of town districts—i.e., those contained in the following table—is not included with that of the county in which the town district is located.
| Town District | Estimated Population as at 31 March 1983 | Approximate Area in Square Kilometres |
|---|---|---|
| North Island— | ||
| Hikurangi | 1,330 | 389 |
| Manaia | 1,010 | 206 |
| Waverley | 1,250 | 202 |
| Total, town districts | 3 590 | 797 |
Communities—The following table lists communities with estimated populations of 1000 or more as at 31 March 1983. The parent local authority is shown in parentheses. The populations of communities are included in the administrative county populations given in a later table.
| Community | Estimated Population as at 31 March 1983 | Approximate Area in Hectares |
|---|---|---|
| North Island— | ||
| Kerikeri (Bay of Islands) | 1,560 | 404 |
| Moerewa (Bay of Islands) | 1,630 | 91x |
| Kawakawa (Bay of Islands) | 1,630 | 229 |
| Paihia (Bay of Islands) | 1,840 | 232 |
| Raglan (Raglan) | 1,470 | 372 |
| Kihikihi (Waipa) | 1,360 | 212 |
| Whitianga (Coromandel Div.) | 2,060 | 2,467 |
| Coromandel (Coromandel Div.) | 1,020 | 297 |
| Whangamata (Thames Div.) | 1,700 | 485 |
| Thames (Thames Div.) | 6,460 | 1,653 |
| Waihi Beach (Ohinemuri) | 1,370 | 209 |
| Katikati (Tauranga) | 1,840 | 960 |
| Papamoa Beach (Tauranga) | 2,250 | 313 |
| Mangakino (Taupo) | 1,570 | 261 |
| Edgecumbe (Whakatane Dist.) | 1,990 | 172 |
| Ohope | 1,830 | 544 |
| South Island— | ||
| Renwick (Marlborough) | 1,120 | 175 |
| Kaikoura (Kaikoura) | 2,200 | 611 |
| Woodend (Rangiora Dist.) | 1,040 | 215 |
| Darfield (Malvern) | 1,200 | 233 |
| Halswell (Paparua) | 4,850 | 328 |
| Pleasant Point (Strathallan) | 1,130 | 378 |
| Brighton (Silverpeaks) | 1,170 | 183 |
| Fairfield (Silverpeaks) | 1,900 | 143 |
| Ranfurly (Maniototo) | 1,010 | 391 |
| Wanaka (Lake) | 1,170 | 313 |
| Te Anau (Wallace) | 2,660 | 395 |
| Riverton (Wallace) | 1,450 | 403 |
District Communities—The following table lists the estimated populations of district communities as at 31 March 1983. The parent local authority is shown in parentheses. The populations of district communities are included in the administrative county populations given in the following table.
| District Community | Estimated Population as at 31 March 1983 | Approximate Area in Hectares |
|---|---|---|
| North Island— | ||
| Warkworth (Rodney) | 1,820 | 577 |
| Wellsford (Rodney) | 1,630 | 554 |
| Otorohanga (Otorohanga) | 2,760 | 380 |
| Ngongotaha (Rotorua District) | 2,570 | 773 |
| Turangi (Taupo) | 5,340 | 579 |
| Waipawa (Waipawa District) | 1,720 | 692 |
| Bulls (Rangitikei) | 1,800 | 405 |
| Ashhurst (Oroua) | 2,010 | 173 |
| Waikanae (Horowhenua) | 5,090 | 1,076 |
| Shannon (Horowhenua) | 1,380 | 342 |
| Heretaunga-Pinehaven (Hutt) | 6,310 | 4,700 |
| Wainuiomata (Hutt) | 19,150 | 26,614 |
| Total | 51 500 | 36 865 |
| South Island— | ||
| Hornby (Paparua) | 7,980 | 493 |
| Sockburn | 6,430 | 1,300 |
| Total | 14 400 | 1793 |
| Total, District Communities | 66 000 | 38 658 |
Extra-county Islands and Shipboard Population—In addition to the populations quoted for administrative counties, districts, cities and boroughs, and town districts, the New Zealand totals include shipboard population and persons located on islands not within the boundaries of any county. The two latter categories comprised an estimated total of 4470 persons as at 31 March 1983.
Counties—The following table gives the estimated population of individual counties as at 31 March 1983 together with the approximate area of each. It should be noted that “administrative counties” do not include boroughs or town districts, which are independent of county control, but include district communities and communities, which form parts of counties.
| Administrative County | Estimated Population as at 31 March 1983 | Approximate Area, in Square Kilometres |
|---|---|---|
| North Island— | ||
| Mangonui | 8,860 | 2 479x |
| Whangaroa | 2,310 | 622 |
| Hokianga | 4,790 | 1,588 |
| Bay of Islands | 19,900 | 2 133x |
| Whangarei | 18,000 | 2 668x |
| Hobson | 5,390 | 1,929 |
| Otamatea | 6,480 | 1,108 |
| Rodney | 40,600 | 2,334 |
| Waiheke Is. | 3,910 | 155 |
| Great Barrier Is. | 660 | 285 |
| Franklin | 19,350 | 1,419 |
| Raglan | 9,860 | 2,411 |
| Waikato | 17,250 | 1,655 |
| Waipa | 16,200 | 1,129 |
| Taumarunui | 6,100 | 4,808 |
| Hauraki Plains | 5,180 | 603 |
| Ohinemuri | 5,170 | 624 |
| Piako | 10,200 | 1 169x |
| Matamata | 12,250 | 2,541 |
| Tauranga | 23,600 | 2,020 |
| Taupo | 13,500 | 7,225 |
| Opotiki | 7,430 | 3 107x |
| Waiapu | 4,750 | 2,824 |
| Waikohu | 2,980 | 2,647 |
| Cook | 8,500 | 2,857 |
| Wairoa | 5,870 | 4,111 |
| Hawke's Bay | 21,000 | 4,838 |
| Dannevirke | 4,360 | 2,211 |
| Woodville | 1,280 | 404 |
| Clifton | 2,220 | 1 175x |
| Taranaki | 13,050 | 588 |
| Inglewood | 2,750 | 521 |
| Stratford | 4,570 | 2,157 |
| Egmont | 5,220 | 622 |
| Eltham | 2,410 | 512 |
| Waimate West | 1,940 | 215 |
| Patea | 2,230 | 1,531 |
| Waimarino | 1,470 | 2,147 |
| Waitotara | 2,950 | 1,226 |
| Wanganui | 3,380 | 1,189 |
| Rangitikei | 13,500 | 4,549 |
| Kiwitea | 1,680 | 930 |
| Pohangina | 840 | 671 |
| Oroua | 5,570 | 492 |
| Manawatu | 6,720 | 692 |
| Kairanga | 6,560 | 461 |
| Horowhenua | 15,150 | 1,420 |
| Hutt | 27,200 | 428 |
| Pahiatua | 2,100 | 741 |
| Eketahuna | 1,910 | 862 |
| Masterton | 4,090 | 2,386 |
| Wairarapa South | 2,440 | 1,140 |
| Featherston | 2,820 | 2,471 |
| Total, North Island counties | 438 500 | 93 030x |
| South Island— | ||
| Marlborough | 11,650 | 10,478 |
| Kaikoura | 3,580 | 2,382 |
| Golden Bay | 4,340 | 2,618 |
| Waimea | 17,050 | 7511 |
| Buller | 3,890 | 5,035 |
| Inangahua | 2,180 | 2,440 |
| Grey | 5,010 | 3,957 |
| Westland | 5,560 | 11,440 |
| Amuri | 3,200 | 4,296 |
| Cheviot | 1,560 | 875 |
| Hurunui | 6,720 | 3,717 |
| Eyre | 3,320 | 458 |
| Oxford | 1,810 | 814 |
| Malvern | 6,850 | 5,046 |
| Paparua | 32,000 | 446 |
| Heathcote | 8,810 | 34 |
| Mt. Herbert | 1,100 | 171 |
| Akaroa | 1,910 | 437 |
| Chatham Islands | 770 | 963 |
| Wairewa | 630 | 438 |
| Ellesmere | 8,860 | 1,200 |
| Ashburton | 10,700 | 6,174 |
| Strathallan | 9,350 | 2,676 |
| South Island— | ||
| Mackenzie | 6,970 | 7,456 |
| Waimate | 4,930 | 3,558 |
| Waitaki | 8,740 | 6,314 |
| Waihemo | 1720 | 880 |
| Silverpeaks | 12,150 | 3,205 |
| Bruce | 3,250 | 1350 |
| Clutha | 5,600 | 2,698 |
| Tuapeka | 3,780 | 3,560 |
| Maniototo | 2,500 | 3,477 |
| Vincent | 4,360 | 7,620 |
| Lake | 5,200 | 10,235 |
| Southland | 26,800 | 9,577 |
| Wallace | 14,700 | 16 311x |
| Stewart Island | 540 | 1,746 |
| Total, South Island counties | 252 100 | 151 593x |
| Grand total, all counties | 690 600 | 244 623x |
Non-administrative Population Centres—For the first time in 1979 population estimates were prepared for other non-administrative centres with total populations of 1000 or more. Populations of these centres are included in the figures for the parent local authority areas given previously. In the table which follows the populations at the 1981 Census of Population and Dwellings are compared with the estimated populations as at 31 March 1983.
| Non-administrative | Population Census 1981 | Estimated Population as at 31 March 1983 |
|---|---|---|
| North Island— | ||
| Temple View (Waipa Co.) | 1,232 | 1,280 |
| Te Kuiti (Waitomo Dist.) | 4,795 | 4,820 |
| Rotorua (Rotorua Dist.) | 38,157 | 38,600 |
| Ngongotaha (Rotorua Dist.) | 2,881 | 3,290 |
| Whakatane (Whakatane Dist.) | 12,286 | 12,800 |
| Opotiki (Opotiki Co.) | 3,388 | 3,480 |
| Waipukurau (Waipukurau Dist.) | 3,648 | 3,680 |
| Bell Block (Taranaki) | 3,062 | 3,260 |
| Opunake (Egmont Co.) | 1,637 | 1,680 |
| Hawera (Hawera Dist.) | 8,400 | 8,420 |
| Waiouru (Rangitikei Co.) | 3,154 | 3,050 |
| Linton Military Camp (Kairanga Co.) | 1,072 | 1,150 |
| Total, North Island Centres | 83 712x | 85 500 |
| South Island— | ||
| Hope (Waimea Co.) | 1,049 | 1,030 |
| Reefton (Inangahua Co.) | 1,200 | 1,190 |
| Burnham Military Camp (Malvern Co.) | 1,159 | 1,750 |
| Lincoln (Ellesmere Co.) | 1,769 | 1,790 |
| Twizel (Mackenzie Co.) | 4,119 | 3,420 |
| Total, South Island Centres | 9 296 | 9 180 |
| Total, Non-Administrative Centres | 93 008 | 94 700 |
Urban Concentration of Population—The bulk of New Zealand's population is located in urban areas, where until 1976 the most rapid growth rates occurred. This was due largely to the development of both manufacturing and tertiary industries in urban areas, which provided employment for a growing labour force. Other factors, including better social, cultural, educational, and economic opportunities, served to attract persons to these areas, and the majority of immigrants tended to settle in the larger urban centres. These factors, combined with amalgamation of farms, centralisation of dairy factories, and increasing agricultural mechanisation (resulting in less labour required), had combined to produce a noticeable rural-urban drift. Urban concentration features are common to “developed” countries at advanced stages of economic development.
The 1981 Census of Population and Dwellings figures show that many rural areas and a number of small and intermediate sized towns located outside urban areas are continuing to decline in population, although there are indications that the rate of urbanisation is stabilising. Horticultural and forestry developments in recent years have undoubtedly contributed to this situation. Thirty-eight counties recorded smaller populations than at the previous Census in 1976, compared with 40 between 1971 and 1976. Of 54 small self-administrative towns (1000 to 4999 population) 25 had declined in population between 1976 and 1981 compared with 12 during the previous intercensal period. Ten intermediate towns (5000 to 9999 population) showed decreases in population compared with two at the previous Census.
Of the 9500 rural gain recorded on 1981 boundaries between 1976 and 1981, over 5000 was within rural areas lying outside urban areas, but within the 7 major population centres forming the statistical divisions, so indicating a continuation of the urban expansion that occurred between the 1971 and 1976 Censuses. The major population increases in the rural components of statistical divisions between the 1976 and 1981 Censuses were in the Auckland and Christchurch Statistical Divisions, which recorded gains of 3965 (12.06 percent) and 1350 (6.88 percent) respectively. With the exception of the Napier Hastings Statistical Division, the rate of population increase in the rural components of all other statistical divisions slowed during the latest intercensal period (for example, the rural component of Hamilton Statistical Division recorded a growth rate of 4.60 percent for 1971–76 but of only 0.39 percent for 1976–81). Palmerston North and Dunedin Statistical Divisions, in fact, both recorded decreases during the latest intercensal period.
The following table shows intercensal population changes in the rural components of the 7 statistical divisions. The rural component within each statistical division is made up of county territory outside main and secondary urban areas, towns with populations of under 1000, and (where applicable) extra county islands.
| Statistical Division | Population Census | Increase or Decrease | |||||
|---|---|---|---|---|---|---|---|
| 1971 | 1976 | 1981 | Number | Percent | |||
| 1971–76 | 1976–81 | 1971–76 | 1976–81 | ||||
| Auckland | 28,040 | 32,876 | 36,841 | 4,836 | 3,965 | 17.25 | 12.06 |
| Hamilton | 25,782 | 26,967 | 27,071 | 1,185 | 104 | 4.60 | 0.39 |
| Napier-Hastings | 7,495 | 7,692 | 7,998 | 197 | 306 | 2.63 | 3.98 |
| Palmerston North | 11,149 | 11,241 | 11,088 | 92 | −153 | 0.83x | −1.36 |
| Wellington | 2,000 | 2,469 | 2,568 | 469 | 99 | 23.45 | 4.01 |
| Christchurch | 17,192 | 19,612 | 20,962 | 2,420 | 1,350 | 14.08 | 6.88 |
| Dunedin | 6,484 | 7,006 | 6,474 | 522 | −532 | 8.05 | −7.59 |
| Total, all statistical divisions | 98 142 | 107 863 | 113 002 | 9 721 | 5 139 | 9.91x | 4.76 |
The following table shows the urban-rural distribution of the population. Urban population has been defined as that of the 37 defined urban areas plus that of all boroughs, town districts, communities, district communities, and townships with populations of 1000 or over.
| Census | Urban | Rural | ||
|---|---|---|---|---|
| Number | Percent | Number | Percent | |
| Total Population | ||||
| 1926 | 952,102 | 67.93 | 449,572 | 32.07 |
| 1936 | 1,065,228 | 67.89 | 503,885 | 32.11 |
| 1945 | 1,227,069 | 72.22 | 472,076 | 27.78 |
| 1956 | 1,625,887 | 74.94 | 543,727 | 25.06 |
| 1966 | 2,145,601 | 80.30 | 526,507 | 19.70 |
| 1971 | 2,361,314 | 82.64 | 496,171 | 17.36 |
| 1976 | 2,614,119 | 83.65 | 511,004 | 16.35 |
| 1981 | 2,650,904 | 83.59 | 520,487 | 16.41 |
In the process of urbanisation some centres have grown more quickly than others. There is a tendency towards concentration of population in the largest centres and also a drift of population from the south to the north. Where the two tendencies reinforce each other, as they do in the case of the combined Auckland Urban Areas, the rate of growth has been very rapid.
The initial reason for the drift to the north lay in the change in emphasis of farming activities in which the development of dairying played an important part. The expansion of dairying in itself called for the development of factory processing facilities and service industries. These farming trends have been reinforced by the growth of forest processing industries in the North Island and compounded further by the general tendency for the large-scale manufacturing units to be located close to the biggest local markets.
In addition to the movement of population from the South Island to the North Island, shown on a long-term basis earlier in this section, there has also been a population drift northwards from the south of the North Island, which has intensified during the latest intercensal period. This is illustrated in the following table of the geographic distribution of population.
| Census | North Island | South Island | ||
|---|---|---|---|---|
| Southern* | Northern† | Total | ||
* Comprises Hawke's Bay, Taranaki, and Wellington Statistical Areas. †Comprises Northland, Central Auckland, South Auckland-Bay of Plenty, and East Coast Statistical Areas. | ||||
| 1971 | 787,131 | 1,264,232 | 2,051,363 | 811,268 |
| 1976 | 843,744 | 1,424,649 | 2,268,393 | 860,990 |
| 1981 | 839,298 | 1,483,691 | 2,322,989 | 852,748 |
| Percentage of Total Population | ||||
| 1971 | 27.5 | 44.2 | 71.7 | 28.3 |
| 1976 | 27.0 | 45.5 | 72.5 | 27.5 |
| 1981 | 26.4 | 46.7 | 73.1 | 26.9 |
In the larger cities a notable feature of recent decades has been a movement of population from the central or “inner” areas to the perimeter or “outer” areas; residential units in the city centres have been replaced by shops, offices, places of entertainment, and other commercial or industrial buildings. However, in recent years there has been an offsetting movement with the building of multi-storey flats in the inner areas, and more recently still, the petrol crisis has led to a greater desire for inner-city living.
The distribution of population by size of centres is shown in the following table.
| Population of Centre (City. Borough, Town District, or Community) | Census | Census | ||||||||
|---|---|---|---|---|---|---|---|---|---|---|
| 1926 | 1961 | 1971 | 1976 | 1981 | 1926 | 1961 | 1971 | 1976 | 1981 | |
| Number of Centres | Percentage of Population in These Centres | |||||||||
| 1 000- 2 499 | 63 | 45 | 43 | 48 | 57 | 7.5 | 3.0 | 2.4 | 2.4 | 2.8 |
| 2 500- 4 999 | 23 | 47 | 40 | 39 | 42 | 6.2 | 7.2 | 5.0 | 4.7 | 5.0 |
| 5 000- 9 999 | 11 | 34 | 35 | 32 | 31 | 5.9 | 9.6 | 8.8 | 7.4 | 6.9 |
| 10 000–24 999 | 12 | 21 | 23 | 25 | 25 | 13.3 | 15.0 | 12.8 | 12.5 | 11.9 |
| 25 000 and over | 4 | 12 | 22 | 25 | 26 | 24.1 | 325 | 44.6 | 50.4 | 51.0 |
| Total | 113 | 159 | 163 | 169 | 181 | 57.0 | 67.3 | 73.6 | 77.4 | 77.6 |
In the South Island a higher proportion of the population is rural, that is outside urban communities, than in the North Island, the proportion at the 1981 Census of Population being 21.1 in the South Island against 14.8 percent in the North Island.
Male and Females—Statistics from the Census of 24 March 1981 showed that females outnumbered males by 17 883 in the total population (excluding Armed Forces overseas), there being 1 578 927 males and 1 596 810 females. The changing sex distribution of the population, recorded at successive Censuses, is given below.
| Census | Males | Females | Females Per 1000 Males |
|---|---|---|---|
| 1881 | 293,973 | 240,057 | 817 |
| 1901 | 429,108 | 386,754 | 901 |
| 1926 | 719,642 | 688,497 | 957 |
| 1936 | 799,091 | 774,721 | 970 |
| 1945 | 832,909 | 869,421 | 1044 |
| 1956 | 1,093,211 | 1,080,851 | 989 |
| 1966 | 1,343,743 | 1,333,176 | 992 |
| 1971 | 1,430,856 | 1,431,775 | 1,001 |
| 1976 | 1,562,042 | 1,567,341 | 1,003 |
| 1981 | 1 578 927x | 1 596 810x | 1 011x |
The table excludes members of the N.Z. Armed Forces overseas at Census date.
There are marked differences in the sex composition of the population of different parts of New Zealand. Females tend to outnumber males in urban areas and to be outnumbered in rural areas. One important reason is doubtless the generally better employment and educational opportunities for women and girls in the larger industrial and commercial centres.
DENSITY OF POPULATION—Density of population refers to the relationship between population numbers and land area, and is expressed in terms of numbers of persons per unit of area. It presents a useful tool for the analysis of population distribution providing it is borne in mind that the land area used is the gross area, and includes mountain ranges, rivers, lakes, forests, and barren country. In the case of cities and towns it includes parks, reserves, roads and streets, and the commercial and industrial districts.
The total area of New Zealand, including inland waters, is 268 808 square kilometres, giving an average population density at the 1981 Census of Population and Dwellings of 11.8 persons per square kilometre. This is low by international standards (for example, the United Kingdom has 229 persons per square kilometre, and the Netherlands, 344) but it must be remembered that in New Zealand there is a great area of high mountainous country, particularly in the South Island, and also large areas of rough hilly country which cannot be closely settled.
Within New Zealand there are wide variations in density of population. The following table shows the density of population in the 23 main and 14 secondary urban areas for the 1926, 1956, 1976, and 1981 Censuses of Population. Only 2 urban areas, those of Central Auckland and Wellington, have an overall concentration of population exceeding 10 persons per hectare, with respective densities of 18.9 and 12.5 persons per hectare.
| Urban Area | Area In Hectares* | Persons Per Hectare at Census | |||
|---|---|---|---|---|---|
| 1926 | 1956 | 1976 | 1981 | ||
| * Excludes inland water areas. | |||||
| Main Urban Areas | |||||
| Whangarei | 11 046x | 0.9 | 1.8 | 3.5 | 3.6 |
| Northern Auckland | 26,461 | 0.9 | 2.0 | 5.2x | 5.6 |
| Western Auckland | 24 668x | 0.4 | 1.5 | 4.4 | 4.7 |
| Central Auckland | 14 631x | 11.3 | 17.4 | 19.8 | 18.9 |
| Southern Auckland | 35,855 | 0.5 | 1.5 | 5.8 | 6.4 |
| Combined Auckland U A. | 101 615x | 2.1 | 3.9 | 7.3 | 7.6 |
| Hamilton | 25,851 | 0.7 | 1.8x | 3.7 | 3.8 |
| Tauranga | 11,884 | 0.4 | 1.7 | 4.1x | 4.5 |
| Rotorua | 7 815x | 0.8 | 2.5 | 6.0x | 6.2x |
| Gisborne | 8,592 | 1.8 | 2.7 | 3.7 | 3.7 |
| Napier | 8 833x | 2.1x | 3.1x | 5.7x | 5.8x |
| Hastings | 14 033x | 1.1 | 2.2x | 3.6 | 3.7 |
| New Plymouth | 10 640x | 1.6 | 2.7 | 4.1x | 4.1x |
| Wanganui | 10 131x | 2.6 | 3.2x | 3.9 | 3.9 |
| Palmerston North | 17 641x | 1.2 | 2.3 | 3.6 | 3.8x |
| Upper Hutt | 5 419x | 0.7 | 3.1x | 6.6x | 6.7x |
| Lower Hutt | 13 495x | 1.6 | 5.2 | 7.2 | 7.0 |
| Porirua Basin | 14,274 | 0.2 | 1.2 | 3.9 | 3.8 |
| Wellington | 10,837 | 9.3 | 11.3 | 12.8 | 12.5 |
| Combined Wellington U.A. | 44 025x | 3.0x | 5.1 | 7.4 | 7.3 |
| Nelson | 14,246 | 1.0 | 1.9 | 3.0 | 3.0 |
| Christchurch | 50 796x | 2.4 | 4.0x | 5.8x | 5.7x |
| Timaru | 7 332x | 2.3 | 3.4 | 4.1 | 4.0 |
| Dunedin | 18 418x | 4.8 | 5.4x | 6.1 | 5.8 |
| Invercargill | 11,741 | 1.9 | 3.1x | 4.6 | 4.6 |
| Total. 23 main urban areas | 374 639x | 2.0 | 3.5x | 5.6 | 5.7 |
| Secondary Urban Areas | |||||
| Pukekohe | 8,782 | 0.5 | 1.0 | 1.5 | 1.5 |
| Tokoroa | 4,246 | 0.1 | 1.5 | 4.6 | 4.6 |
| Taupo | 7,931 | 0.1 | 0.4 | 1.9x | 1.9 |
| Whakatane | 8 152x | 0.3 | 1.0x | 1.8x | 1.9x |
| Hawera | 11 674x | 0.7x | 0.8 | 1.0 | 1.0 |
| Feilding | 4,599 | 1.0 | 1.7 | 2.5 | 2.7x |
| Levin | 10,914 | 0.4 | 0.9 | 1.7 | 1.7x |
| Kapiti | 5,884 | 0.2 | 1.0 | 3.2 | 3.4 |
| Masterton | 13,468 | 0.7 | 1.1 | 1.6 | 1.5 |
| Blenheim | 9,092 | 0.9 | 1.5 | 2.4 | 2.4 |
| Greymouth | 4 226x | 1.9 | 2.9 | 2.8 | 2.7 |
| Ashburton | 7,531 | 1.1 | 1.5 | 2.0 | 2.0 |
| Oamaru | 5,148 | 1.8 | 2.3 | 2.9 | 2.8 |
| Gore | 7,232 | 0.8 | 1.2 | 1.7 | 1.7 |
| Total, 14 secondary urban areas | 108 879x | 0.7 | 1.2 | 2.0 | 2.0 |
The series of tables on the following pages contain statistics from the 1981 Census of Population and Dwellings. The figures in the following tables have been rounded using simple random rounding to base three, and because of the rounding procedures used, totals do not necessarily represent the exact sum of the component parts.
MARITAL STATUS—The marital status of usually-resident persons aged 15 years and over as returned at the Census of Population 1981 is summarised in the following tables.
| Age Group (Years) | Never Married | Married | Separated* | Widowed | Divorced | Total† | De Facto Relationship‡ |
|---|---|---|---|---|---|---|---|
* Includes persons who are still married but permanently separated. †Including persons not specifying status. ‡Persons in this column are also included in one of the preceding formal marital status columns. | |||||||
| Males | |||||||
| 15–19 | 153,708 | 885 | 36 | 6 | 18 | 156,816 | 2,517 |
| 20–24 | 98,706 | 29,010 | 1,671 | 66 | 240 | 137,424 | 11,514 |
| 25–34 | 50,445 | 161,568 | 11,589 | 330 | 5,391 | 237,297 | 16,404 |
| 35–44 | 14,265 | 146,652 | 9,507 | 801 | 6,699 | 180,960 | 7,803 |
| 45–54 | 11,331 | 126,141 | 6,687 | 2,493 | 6,021 | 154,158 | 3,873 |
| 55–64 | 9,462 | 108,690 | 3,870 | 5,490 | 4,656 | 132,867 | 1,455 |
| 65–74 | 5,910 | 70,605 | 1,809 | 9,285 | 2,418 | 90,339 | 369 |
| 75 and over | 2,640 | 25,140 | 567 | 11,331 | 609 | 40,485 | 84 |
| Total, 1981 | 346 470 | 668 688 | 35 745 | 29 796 | 26 055 | 1 130 340 | 44 016 |
| Total, 1976 | 313 875 | 700 244 | 17 024 | 27 355 | 15 005 | 1 075 175 | … |
| Females | |||||||
| 15–19 | 139,833 | 5,028 | 252 | 33 | 9 | 149,817 | 6,765 |
| 20–24 | 65,010 | 54,156 | 4,320 | 198 | 696 | 132,216 | 13,377 |
| 25–34 | 28,710 | 178,902 | 15,753 | 1,317 | 8,124 | 238,722 | 14,079 |
| 35–44 | 8,571 | 145,641 | 10,713 | 3,234 | 8,946 | 179,442 | 6,276 |
| 45–54 | 6,501 | 118,152 | 6,123 | 8,913 | 6,705 | 147,282 | 2,403 |
| 55–64 | 7,695 | 99,321 | 3,360 | 23,880 | 5,199 | 139,917 | 786 |
| 65–74 | 8,310 | 54,333 | 1,524 | 41,055 | 3,036 | 108,543 | 201 |
| 75 and over | 7,242 | 14,691 | 360 | 46,833 | 987 | 70,425 | 51 |
| Total, 1981 | 271 875 | 670 221 | 42 405 | 125 460 | 33 708 | 1 166 364 | 43 941 |
| Total, 1976 | 240 781 | 703 264 | 21 842 | 114 164 | 20 149 | 1 101 303 | … |
The percentage distribution aged 15 years or over according to marital status is given in the following
| Marital Status | 1976 | 1981 | ||
|---|---|---|---|---|
| Males | Females | Males | Females | |
* Legally separated only. †All permanent separations of married persons. | ||||
| Never married | 29.2 | 21.9 | 31.3 | 23.8 |
| Married | 65.2 | 63.9 | 60.4 | 58.6 |
| Separated | 1.6* | 2.0* | 3.2† | 3.7† |
| Widowed | 2.5 | 10.4 | 2.7 | 11.0 |
| Divorced | 1.4 | 1.8 | 2.4 | 2.9 |
| Total | 100.0 | 100.0 | 100.0 | 100.0 |
HOUSEHOLDS—Statistics from the 1981 Census on the family composition of New Zealand households, compared to the 1976 Census, show fewer children per family; an increasing percentage of childless couples; a decline in two-parent family numbers; and a sharp rise in families with one parent. Overall the proportion of households made up of one or two persons only, has increased to form 48 percent of all households, a rise of 76 325 (19 percent) since 1976. There was a total of 1 003 113 private households living in permanent dwellings at the Census in 1981. The following table analyses the type of household by the number of occupants. A complete one-family-only household consists of a husband and wife with or without unmarried children of any age who are living at home.
| Type of Household | Total Households | Number of Members Per Household | ||||||
|---|---|---|---|---|---|---|---|---|
| 1 | 2 | 3 | 4 | 5 | 6 | 7 or More | ||
| * Parent absent permanently (3660 households) or temporarily (2097 households). | ||||||||
| Number of Households | ||||||||
| One-family-only— | ||||||||
| One-family-only (complete) | 555,561 | – | 207,150 | 96,339 | 136,989 | 76,629 | 26,967 | 11,484 |
| One-family-only (incomplete)— | ||||||||
| Family with one parent absent (permanently) | 59,451 | – | 29,910 | 17,805 | 7,581 | 2,796 | 894 | 462 |
| Family with one parent absent (temporarily) | 11,154 | – | 2,958 | 4,485 | 2,556 | 825 | 234 | 90 |
| Family with children absent | 29,499 | – | 6,681 | 9,198 | 7,434 | 3,795 | 1,419 | 972 |
| Family with children and one parent* absent | 5,757 | – | 2,673 | 1,779 | 804 | 324 | 108 | 75 |
| Total, one-family-only | 661 422 | – | 249 372 | 129 606 | 155 364 | 84 369 | 29 622 | 13 083 |
| Other family— | ||||||||
| One family with other (non-family) persons | 78,534 | – | – | 23,607 | 18,735 | 16,704 | 10,491 | 8,994 |
| Two or more families (with or without other persons) | 16,986 | – | – | – | 3,432 | 3,504 | 3,504 | 6,540 |
| Total, other family | 95 514 | – | – | 23 607 | 22 170 | 20 208 | 13 998 | 15 534 |
| Non-family— | ||||||||
| Two or more persons | 61,188 | – | 43,635 | 11,427 | 4,182 | 1,371 | 399 | 174 |
| One person | 184,992 | 184,992 | – | – | – | – | – | – |
| Total, non-family | 246 180 | 184 992 | 43 635 | 11 427 | 4 182 | 1 371 | 399 | 174 |
| Total, households | 1 003 113 | 184 992 | 293 007 | 164 640 | 181 707 | 1105 945 | 44 019 | 28 791 |
In the following table one-complete-family-only households at the 1981 Census are analysed by membership and the employment status of the head of the household.
| Employment Status of Head | Total Households | Husband and Wife Only | Husband and Wife with | ||||
|---|---|---|---|---|---|---|---|
| 1 Child | 2 Children | 3 Children | 4 Children | 5 or More Children | |||
* Includes heads working part-time (1 to 19 hours weekly). †Child/short-term visitors. | |||||||
| Number of Households | |||||||
| In full-time labour force— | |||||||
| Self-employed—has employees | 40,926 | 8,565 | 7,356 | 12,411 | 8481 | 3,018 | 1,095 |
| Self-employed—no employees | 48,087 | 12,288 | 8,442 | 14,118 | 8,907 | 3,306 | 1,029 |
| Salary or wage earner | 357,954 | 101,538 | 67,563 | 104,361 | 56,541 | 19,434 | 8,514 |
| Unemployed, seeking work | 6,315 | 1,731 | 1,410 | 1,455 | 873 | 465 | 378 |
| Relative assisting—unpaid | 558 | 327 | 105 | 72 | 27 | 15 | 9 |
| Not specified (working 20 hrs or more) | 1,125 | 402 | 237 | 234 | 144 | 66 | 48 |
| Total | 454 962 | 124 854 | 85 110 | 132 651 | 74 973 | 26 304 | 11 073 |
| Not in full-time labour force*— | |||||||
| Retired | 90,252 | 77,730 | 9,282 | 2,331 | 621 | 174 | 117 |
| Student | 978 | 621 | 144 | 138 | 48 | 24 | 6 |
| Household duties | 4,554 | 1,974 | 861 | 942 | 477 | 198 | 99 |
| Other | 4,605 | 1,845 | 918 | 891 | 495 | 264 | 192 |
| Total | 100 392 | 82 170 | 11 202 | 4 302 | 1 641 | 660 | 411 |
| Not defined† | 204 | 129 | 24 | 33 | 15 | 6 | 3 |
| Grand total | 555 561 | 207 150 | 96 339 | 136 989 | 76 629 | 26 967 | 11 484 |
The following table shows the composition of one-complete-family-only households in 1981 analysed by the age group of the head of the household.
| Age Group of Head (Years) | Husband and Wife Only | Husband and Wife with | Total Households | ||||
|---|---|---|---|---|---|---|---|
| 1 Child | 2 Children | 3 Children | 4 Children | 5 or More Children | |||
| Number of Households | |||||||
| Under 20 | 1,215 | 552 | 105 | 27 | 9 | 3 | 1,908 |
| 20–24 | 17,871 | 7,617 | 4,170 | 846 | 144 | 42 | 30,690 |
| 25–44 | 41,358 | 39,885 | 98,340 | 58,266 | 19,860 | 7,566 | 265,278 |
| 45–64 | 77,592 | 41,214 | 32,880 | 17,115 | 6,858 | 3,819 | 179,478 |
| 65 and over | 69,120 | 7,068 | 1,491 | 372 | 99 | 54 | 78,210 |
| Total | 207 150 | 96 339 | 136 989 | 76 629 | 26 967 | 11 484 | 555 561 |
| Percentage of Age Group | |||||||
| Under 20 | 63.7 | 28.9 | 5.5 | 1.4 | 0.5 | 0.2 | 100.0 |
| 20–24 | 58.2 | 24.8 | 13.6 | 2.8 | 0.5 | 0.1 | 100.0 |
| 25–44 | 15.6 | 15.0 | 37.1 | 22.0 | 7.5 | 2.9 | 100.0 |
| 45–64 | 43.2 | 23.0 | 18.3 | 9.5 | 3.8 | 2.1 | 100.0 |
| 65 and over | 88.4 | 9.0 | 1.9 | 0.5 | 0.1 | 0.1 | 100.0 |
| All ages | 37.3 | 17.3 | 24.7 | 13.8 | 4.9 | 2.1 | 100.0 |
Household Incomes—The first of the 2 table's following shows the incomes (excluding incomes from Social Security benefits) of one-complete-family only households by composition of households.
| Income of Household* | Husband and Wife Only | Husband and Wife with | Total Households | ||||
|---|---|---|---|---|---|---|---|
| 1 Child | 2 Children | 3 Children | 4 Children | 5 or More Children | |||
* Estimated incomes before Social Security benefits for the year ended 31 March 1981. †Includes 207 households headed by short-term visitors or children. | |||||||
| $ | Number of Households | ||||||
| Nil | 16,467 | 1,275 | 918 | 504 | 258 | 159 | 19,584 |
| 1–1,999 | 22,494 | 1,230 | 801 | 396 | 153 | 78 | 25,152 |
| 2,000–4,999 | 13,551 | 1,710 | 1,263 | 603 | 246 | 102 | 17,475 |
| 5,000–9,999 | 21,453 | 9,156 | 9,843 | 5,175 | 2,004 | 837 | 48,462 |
| 10,000–13,999 | 22,638 | 15,825 | 22,296 | 11,700 | 3,873 | 1,452 | 77,787 |
| 14,000–19,999 | 29,523 | 19,740 | 32,877 | 17,112 | 5,262 | 1,815 | 106,341 |
| 20,000–24,999 | 29,655 | 13,494 | 19,803 | 10,503 | 3,273 | 1,212 | 77,943 |
| 25,000–39,999 | 25,053 | 15,720 | 22,542 | 12,708 | 4,185 | 1,623 | 81,828 |
| 40,000–59,999 | 3,582 | 3,078 | 5,358 | 3,843 | 1,458 | 546 | 17,868 |
| 60,000 and over | 1,188 | 1,059 | 1,713 | 1,359 | 507 | 198 | 6,024 |
| Not specified† | 21,543 | 14,055 | 19,572 | 12,726 | 5,748 | 3,462 | 77,103 |
| Total | 207 150 | 96 342 | 136 986 | 76 629 | 26 970 | 11 484 | 555 561 |
The following table shows income (including income from Social Security benefits) of all households in permanent private dwellings by type of household.
| Total Household Income (incl. Income from Social Security Benefits) | Household Type | Total Households | ||||
|---|---|---|---|---|---|---|
| One Family Only Complete | One Family Only Incomplete | Other Family | Non-Family | One Person | ||
| * Includes 534 households headed by short-term visitors or children. | ||||||
| $ | Number of Households | |||||
| Nil | 681 | 993 | 102 | 294 | 2,028 | 4,098 |
| 1- 1,999 | 2,961 | 6,315 | 612 | 522 | 4,725 | 15,138 |
| 2,000- 4,999 | 6,783 | 9,711 | 1,524 | 2,190 | 65,529 | 85,737 |
| 5,000- 9,999 | 77,322 | 21,015 | 6,273 | 8,190 | 44,046 | 156,846 |
| 10,000–13,999 | 76,122 | 12,309 | 8,199 | 7,542 | 27,231 | 131,409 |
| 14,000–19,999 | 118,698 | 14,979 | 14,301 | 11,319 | 16,950 | 176,253 |
| 20,000–24,999 | 82,302 | 9,018 | 11,289 | 9,216 | 4,266 | 116,094 |
| 25,000–39,999 | 88,212 | 10,659 | 19,845 | 9,777 | 2,547 | 131,040 |
| 40,000–59,999 | 19,008 | 2,706 | 6,351 | 2,046 | 567 | 30,678 |
| 60,000 and over | 6,363 | 1,260 | 2,151 | 420 | 288 | 10,485 |
| Not specified* | 77,103 | 16,887 | 24,861 | 9,681 | 16,809 | 145,338 |
| Total | 555 561 | 105 855 | 95 514 | 61 188 | 184 992 | 1 003 113 |
People Living Alone—The following tables show persons living alone in 1981 by age, sex, and marital status.
| Age Group (in Years) | Marital Status | |||||
|---|---|---|---|---|---|---|
| Never Married | Married | Separated* | Divorced | Widowed | Total† | |
* Includes persons who are still married but permanently separated. †Includes children, short-term visitors, and those of unspecified marital status. | ||||||
| Males Living Alone | ||||||
| Under 20 | 1,566 | 9 | 3 | – | – | 1,614 |
| 20–24 | 5,814 | 321 | 213 | 24 | 12 | 6,519 |
| 25–44 | 12,180 | 2310 | 4,428 | 2,478 | 123 | 21,951 |
| 45–64 | 8,412 | 2,493 | 3,816 | 4,116 | 3,126 | 22,182 |
| 65 and over | 3,912 | 2,079 | 1,209 | 1,641 | 11,355 | 20,301 |
| Total | 31 884 | 7 221 | 9 669 | 8 259 | 14 610 | 72 567 |
| Females Living Alone | ||||||
| Under 20 | 1,368 | 27 | 9 | – | 6 | 1,473 |
| 20–24 | 3,702 | 471 | 249 | 48 | 12 | 4,605 |
| 25–44 | 6,894 | 1,089 | 1,734 | 1,473 | 303 | 11,661 |
| 45–64 | 5,901 | 2,262 | 2,760 | 4,485 | 14,529 | 30,054 |
| 65 and over | 7,545 | 2,016 | 1,131 | 2,529 | 51,282 | 64,635 |
| Total | 25 413 | 5 865 | 5 883 | 8 538 | 66 132 | 112 425 |
GROUP-LIVING QUARTERS—The following table shows the number of inmates and total occupants of various types of group-living quarters at the time of the 1981 Census of Population and Dwellings. In comparing the numbers of inmates with the total number of occupants (especially in the case of prisons and penal institutions) it should be borne in mind that only those staff who actually live in the group-living quarters are included in the table. Those occupying separate residences outside the group-living quarters will have been enumerated in their own homes, even though they may have been on duty in the boarding school, hospital, prison, or other group-living quarters on the night of the Census.
| Type of Group-living Quarters | Number | Number of Group-living Quarters By Number of Inmates | Total Inmates | Total Occupants Including Staff | ||
|---|---|---|---|---|---|---|
| Below 20 | 20–99 | 100 and Over | ||||
| Hotels, motels, hostels, boardinghouses, and motor camps | 3,162 | 2,469 | 633 | 54 | 51,585 | 56,151 |
| Educational institutions | 387 | 156 | 159 | 75 | 22,650 | 23,433 |
| Welfare institutions (children's homes, etc.) | 780 | 567 | 198 | 12 | 13,743 | 15,522 |
| Medical institutions (hospitals, etc.) | 456 | 219 | 171 | 63 | 27,303 | 27,960 |
| Religious institutions | 297 | 270 | 24 | 3 | 2,643 | 3,186 |
| Armed forces (including naval base and naval vessels) | 84 | 39 | 30 | 12 | 5,460 | 6,747 |
| Works and construction camps and police camps, etc. | 438 | 270 | 150 | 18 | 10,704 | 11,199 |
| Prisons and penal institutions | 51 | 24 | 12 | 12 | 2,892 | 2,913 |
| Seasonal workers' quarters | 195 | 198 | – | – | 996 | 1,245 |
| Vessels (excluding naval vessels) | 138 | 135 | 9 | – | 498 | 3,258 |
| Other institutions | 399 | 330 | 54 | 15 | 5,946 | 6,660 |
| Total | 6 393 | 4 671 | 1 452 | 264 | 144 414 | 158 280 |
RELIGIOUS PROFESSIONS—The following summary presents the main religious professions returned at the 1971, 1976, and 1981 Censuses.
| Religious Profession | Number of Adherents | Percentage | ||||
|---|---|---|---|---|---|---|
| 1971 | 1976 | 1981 | 1971 | 1976 | 1981 | |
| * Associated Pentecostal Churches of New Zealand. | ||||||
| Anglican (Church of England) | 895,839 | 915,202 | 814,740 | 31.3 | 29.2 | 25.7 |
| Presbyterian | 583,701 | 566,569 | 523,221 | 20.4 | 18.1 | 16.5 |
| Roman Catholic (including Catholic undefined) | 449,974 | 478,530 | 456,858 | 15.7 | 15.3 | 14.4 |
| Methodist | 182,727 | 173,526 | 148,512 | 6.4 | 5.5 | 4.7 |
| Christian n.o.d. | 33,187 | 52,478 | 101,901 | 1.2 | 1.7 | 3.2 |
| Baptist | 47,350 | 49,442 | 50,043 | 1.7 | 1.6 | 1.6 |
| Latter Day Saints (Mormon) | 29,785 | 36,130 | 37,686 | 1.0 | 1.2 | 1.2 |
| Ratana | 30,156 | 35,082 | 35,781 | 1.1 | 1.1 | 1.1 |
| Brethren | 25,768 | 24,414 | 24,324 | 0.9 | 0.8 | 0.8 |
| Agnostic | 9,481 | 14,136 | 24,201 | 0.3 | 0.5 | 0.8 |
| Atheist | 9,291 | 14,283 | 21,528 | 0.3 | 0.5 | 0.7 |
| Salvation Army | 19,371 | 22,019 | 20,490 | 0.7 | 0.7 | 0.6 |
| Protestant n.o.d. | 37,475 | 33,309 | 16,989 | 1.3 | 1.1 | 0.5 |
| Jehovah's Witness | 10,318 | 13,392 | 13,740 | 0.4 | 0.4 | 0.4 |
| Assemblies of God* | 3,599 | 5,581 | 12,525 | 0.1 | 0.2 | 0.4 |
| Seventh Day Adventist | 10,477 | 11,958 | 11,520 | 0.4 | 0.4 | 0.4 |
| Pentecostal* | 1,859 | 4,846 | 6,408 | 0.1 | 0.2 | 0.2 |
| Church of Christ | 8,930 | 8,087 | 6,372 | 0.3 | 0.3 | 0.2 |
| Ringatu | 5,635 | 6,230 | 6,117 | 0.2 | 0.2 | 0.2 |
| Hindu | 3,845 | 5,203 | 6,078 | 0.1 | 0.2 | 0.2 |
| Lutheran | 5,930 | 6,297 | 5,676 | 0.2 | 0.2 | 0.2 |
| Indigenous Pentecostal* | 12 | 824 | 5,295 | – | – | 0.2 |
| Apostolic* | 2,361 | 2,693 | 4,503 | 0.1 | 0.1 | 0.1 |
| Congregational | 7,704 | 6,600 | 3,825 | 0.3 | 0.2 | 0.1 |
| Eastern Orthodox Catholic | 4,319 | 4,153 | 3,813 | 0.2 | 0.1 | 0.1 |
| Undenominational | 3,709 | 4,222 | 3,720 | 0.1 | 0.1 | 0.1 |
| Buddhist | 1,370 | 2,382 | 3,693 | – | 0.1 | 0.1 |
| Union Church | 1,154 | 3,045 | 3,399 | – | 0.1 | 0.1 |
| Hebrew Congregational | 3,803 | 3,921 | 3,360 | 0.1 | 0.1 | 0.1 |
| Spiritualist | 1,015 | 1,731 | 2,418 | – | 0.1 | 0.1 |
| Samoan Congregational | 8 | 566 | 2,310 | – | – | 0.1 |
| Uncertain | 353 | 1,029 | 2,253 | – | – | 0.1 |
| Islam | 779 | 1,415 | 2,004 | – | – | 0.1 |
| Reformed Church of N.Z. | 1,628 | 1,358 | 1,923 | 0.1 | – | 0.1 |
| Christadelphian | 1,667 | 1,686 | 1,698 | 0.1 | 0.1 | 0.1 |
| Bahai | 350 | 981 | 1,452 | – | – | – |
| All other religious professions | 19,664 | 36,961 | 36,414 | 0.7 | 1.2 | 1.1 |
| No religion (so returned) and not specified | 161,018 | 140,591 | 275,832 | 5.6 | 4.5 | 8.7 |
| Object to state | 247,019 | 438,511 | 473,115 | 8.6 | 14.0 | 14.9 |
| Total | 2 862 631 | 3 129 383 | 3 175 737 | 100.0 | 100.0 | 100.0 |
The category “All other religious professions” includes also cases of facetious answers and those which were not specified in sufficient detail to allow precise classification. Figures under “Object to state” represent those persons availing themselves of the special statutory right of objecting to answer a question on this subject.
AGE DISTRIBUTION—In the following table the total population at the 1976 and 1981 Censuses of Population is shown by sex and age distribution.
| Age (Years) | 1976 Census | 1981 Census | Percentage of Total Population | |||||
|---|---|---|---|---|---|---|---|---|
| Males | Females | Total | Males | Females | Total | 1976 | 1981 | |
| * Under 20 years. | ||||||||
| 0–4 | 151,086 | 145,019 | 296,105 | 128,946 | 123,687 | 252,633 | 9.5 | 8.0 |
| 5–9 | 159,187 | 152,586 | 311,773 | 148,134 | 141,933 | 290,067 | 10.0 | 9.1 |
| 10–14 | 163,869 | 156,458 | 320,327 | 156,126 | 149,748 | 305,874 | 10.2 | 9.6 |
| 15–17 | 94,943 | 91,101 | 186,044 | 93,087 | 88,758 | 181,848 | 5.9 | 5.7 |
| 18–19 | 58,392 | 56,301 | 114,693 | 64,398 | 61,680 | 126,075 | 3.7 | 4.0 |
| 20–24 | 131,644 | 127,931 | 259,575 | 139,374 | 133,947 | 273,324 | 8.3 | 8.6 |
| 25–29 | 125,668 | 123,472 | 249,140 | 120,558 | 121,374 | 241,932 | 8.0 | 7.6 |
| 30–34 | 100,847 | 98,651 | 199,498 | 120,357 | 119,700 | 240,060 | 6.4 | 7.6 |
| 35–39 | 89,717 | 87,380 | 177,097 | 97,026 | 96,165 | 193,188 | 5.7 | 6.1 |
| 40–44 | 77,899 | 74,732 | 152,631 | 85,986 | 84,528 | 170,514 | 4.9 | 5.4 |
| 45–49 | 84,161 | 78,717 | 162,878 | 75,945 | 73,026 | 148,968 | 5.2 | 4.7 |
| 50–54 | 78,166 | 77,535 | 155,701 | 80,100 | 76,161 | 156,264 | 5.0 | 4.9 |
| 55–59 | 66,547 | 70,639 | 137,186 | 74,298 | 74,895 | 149,196 | 4.4 | 4.7 |
| 60–64 | 60,924 | 66,304 | 127,228 | 61,020 | 68,583 | 129,603 | 4.1 | 4.1 |
| 65–69 | 49,805 | 56,643 | 106,448 | 53,346 | 61,950 | 115,296 | 3.4 | 3.6 |
| 70–74 | 33,826 | 42,029 | 75,855 | 39,246 | 49,509 | 88,752 | 2.4 | 2.8 |
| 75–79 | 19,942 | 30,136 | 50,078 | 23,820 | 34,434 | 58,254 | 1.6 | 1.8 |
| 80–84 | 9,511 | 18,425 | 27,936 | 11,325 | 21,252 | 32,577 | 0.9 | 1.0 |
| 85–89 | 4,347 | 9,491 | 13,838 | 4,179 | 10,614 | 14,793 | 0.4 | 0.5 |
| 90 and over | 1,561 | 3,791 | 5,352 | 1,650 | 4,869 | 6,519 | 0.2 | 0.2 |
| Total | 1 562 042 | 1 567 341 | 3 129 383 | 1 578 927 | 1 596 810 | 3 175 737 | 100.0 | 100.0 |
| Under 15 years | 474,142 | 454,063 | 928,205 | 433,206 | 415,368 | 848,574 | 29.7 | 26.7 |
| 15–64 years | 968,908 | 952,763 | 1,921,671 | 1,012,149 | 998,817 | 2,010,972 | 61.4 | 63.3 |
| 65 years and over | 118,992 | 160,515 | 279,507 | 133,566 | 182,628 | 316,191 | 8.9 | 10.0 |
| Minors* | 627,477 | 601,465 | 228,942 | 590,691 | 565,806 | 1,156,497 | 39.3 | 36.4 |
| Adults | 934,565 | 965,876 | 1,900,441 | 988,230 | 1,031,007 | 2,019,240 | 60.7 | 63.6 |
ETHNIC GROUPS—The following table shows the broad ethnic origins of the usually resident New Zealand population.
| Ethnic Group | Usually Resident in N.Z. Population | |
|---|---|---|
| 1976 Census | 1981 Census | |
* Covers persons who specified themselves as half or more New Zealand Maori, plus those who indicated they were persons of the Maori race of New Zealand, but did not specify the degree of Maori origin. †Half or more of given descent group. | ||
| European | 2,672,919 | 2,696,568 |
| Maori* | 269,954 | 279,084 |
| Other origins†— | ||
| Pacific Island Polynesian— | ||
| Samoan | 27,747 | 42,078 |
| Cook Island Maori | 18,547 | 23,880 |
| Niuean | 5,671 | 8,079 |
| Tongan | 3,873 | 6,900 |
| Tokelauan | 1,709 | 2,274 |
| Other | 3,424 | 5,613 |
| Subtotal, Pacific Island Polynesian | 60,971 | 88,824 |
| Chinese | 14,236 | 18,480 |
| Indian | 8,861 | 11,244 |
| Fijian | 1,324 | 1,833 |
| Syrian, Lebanese, and Arab | 740 | 900 |
| Other ethnic groups | 5,550 | 9,762 |
| Subtotal, others | 30,711 | 42,219 |
| Not specified | 68,710 | 36,609 |
| Total | 3 103 265 | 3 143 307 |
Note—For further information on Pacific Island Polynesian population refer to Section 3C.

COUNTRY OF BIRTH—Since 1945 the New Zealand-born population has remained in the range 84 to 86 percent of the total population including short-stay visitors to the country.
For 1976 and 1981, of the population usually resident in New Zealand who specified country of birth, the percentages born in New Zealand were 84.3 and 85.6 respectively.
The next table shows the duration of residence in New Zealand of persons born overseas and usually resident in New Zealand at the 1976 and 1981 censuses.
| Years of Residence | 1976 Census | 1981 Census* | ||
|---|---|---|---|---|
| Number Born Overseas† | Percentage of Specified Cases | Number Born Overseas† | Percentage of Specified Cases | |
* Specified overseas birthplaces totalled 450 939. An additional 13 314 cases of not specified birthplaces are included in the analysis by duration. †N.Z. residents. | ||||
| 0–4 | 133,518 | 28.1 | 57,354 | 13.3 |
| 5–9 | 59,052 | 12.4 | 88,119 | 20.4 |
| 10–14 | 64,467 | 13.6 | 51,831 | 12.0 |
| 15–19 | 48,691 | 10.2 | 53,619 | 12.4 |
| 20 and over | 169,792 | 35.7 | 180,561 | 41.8 |
| Not specified | 10,040 | 32,766 | … | |
| Total | 485 560 | 100.0 | 464 253 | 100.0 |
INTERNAL MIGRATION—At the 1981 Census of Population and Dwellings the questions on internal migration related to place of usual residence at the 1981 census, and usual residence 1 year and 5 years prior to the census.
Between the censuses of 1976 and 1981, 1 203 435 persons of the usually resident New Zealand population aged 5 and over changed their place of residence within New Zealand at least once. They represented 43.3 percent of the population resident in New Zealand at both censuses. In 1981 the remaining 56.7 percent (1 574 319 persons) were still living in the same dwelling they occupied in 1976.
The regional patterns of migration show that between 1976 and 1981 there were only 2 areas of New Zealand in which incoming migrants exceeded outgoing migrants. These were the upper half of the North Island and the northern tip of the South Island.
The following table shows the movements of persons arriving and leaving each statistical area (the 13 broad geographic regions into which New Zealand is divided for statistical purposes):
| Regional Patterns of Migration, 1976–81* | ||
|---|---|---|
| Statistical Area | North Island | |
| Persons Arriving in Area | Persons Leaving Area | |
* Excludes children under 5 years and other persons who are not resident in New Zealand or are without a specified address at both census dates. †To ensure anonymity within small groups of figures, all cell values have been rounded using simple random rounding to base 3. As a result, a total will not necessarily be the exact sum of its component parts. | ||
| Northland | 17,424 | 14,880 |
| Central Auckland | 66,231 | 49,746 |
| South Auckland— | ||
| Bay of Plenty | 55,482 | 49,311 |
| East Coast | 6,339 | 7,722 |
| Hawke's Bay | 17,637 | 17,904 |
| Taranaki | 10,800 | 13,347 |
| Wellington | 51,171 | 63,900 |
| Marlborough | 6,333 | 5,931 |
| Nelson | 10,875 | 9,417 |
| Westland | 3,357 | 4,173 |
| Canterbury | 34,416 | 36,336 |
| Otago | 17,757 | 21,543 |
| Southland | 9,516 | 13,113 |
| Total† | 307 326 | 307 326 |
Statistics on residence 1 year ago, together with more detailed statistics on residence 5 years ago, will be found in the 1981 Census Volume 11, Internal Migration.
STATISTICS OF WORLD POPULATION—The area and estimated population of the major areas and selected countries at mid-year 1982 are shown in the following table. (Source: U.N. Population and Vital Statistics Report.) The U.N. report should be consulted for further information and greater detail.
| Major Areas and Countries | Area | Population |
|---|---|---|
| * Includes Central' America, the Caribbean, and Hawaii. | ||
| Major Areas | km2 (000) | million |
| Africa | 30,319 | 499 |
| America—North* | 24,249 | 383 |
| America—South | 17,832 | 251 |
| Asia | 27,580 | 2,672 |
| Europe | 4,937 | 487 |
| Oceania | 8,510 | 23 |
| U.S.S.R. | 22,402 | 271 |
| World total | 135 830 | 4 586 |
| Selected Countries | ||
| Africa— | ||
| Algeria | 2,382 | 20.3 |
| Angola | 1,247 | 7.5 |
| Egypt | 1,001 | 44.7 |
| Ethiopia | 1,222 | 32.8 |
| Ghana | 239 | 12.2 |
| Kenya | 583 | 17.9 |
| Morocco | 447 | 21.7 |
| Mozambique | 783 | 11.1 |
| Nigeria | 924 | 82.4 |
| South Africa | 1,221 | 31.0 |
| Sudan | 2,506 | 19.5 |
| Uganda | 236 | 14.1 |
| Zaire | 2,345 | |
| America, North— | ||
| Canada | 9,976 | 24.6 |
| United States | 9,363 | 232.1 |
| America, South— | ||
| Argentine | 2,767 | 28.4 |
| Brazil | 8512 | 126.8. |
| Chile | 757 | 11.5 |
| Colombia | 1,139 | |
| Peru | 1,285 | 18.8 |
| Venezuela | 912 | 14.7 |
| Asia— | ||
| Afghanistan | 647 | 16.8 |
| China | 9,597 | 1 020.7 |
| Hong Kong | 1 | 5.2 |
| India | 3,288 | 711.7 |
| Indonesia | 1,904 | 153.0 |
| Iran | 1,648 | 40.2 |
| Iraq | 435 | 14.0 |
| Israel | 21 | 4.0 |
| Japan | 372 | 118 |
| Jordan | 98 | 3.5 |
| Korea—North | 121 | 18.7 |
| Korea—South | 98 | 39.3 |
| Lebanon | 10 | 2.7 |
| Malaysia | 330 | 14.8 |
| Nepal | 141 | |
| Pakistan | 804 | 87.1 |
| Philippines | 300 | 50.7 |
| Saudi Arabia | 2,150 | 9.7 |
| Singapore | 0.6 | 2.5 |
| Sri Lanka | 66 | 15.2 |
| Syrian Arab Republic | 185 | 9.7 |
| Thailand | 514 | 48.4 |
| Turkey | 781 | 46.3 |
| Europe— | ||
| Austria | 84 | 7.6 |
| Belgium | 31 | 9.8 |
| Bulgaria | 111 | 9.1 |
| Czechoslovakia | 128 | 15.4 |
| Denmark | 43 | 5.1 |
| France | 547 | 54.2 |
| Germany—East | 108 | 16.9 |
| Germany—West | 249 | 61.6 |
| Greece | 132 | 9.8 |
| Hungary | 93 | 10.7 |
| Ireland, Republic of | 70 | 3.5 |
| Italy | 301 | 56.3 |
| Luxembourg | 3 | 0.4 |
| Netherlands | 41 | 14.3 |
| Norway | 324 | 4.1 |
| Poland | 313 | 36.2 |
| Portugal | 92 | 10.1 |
| Romania | 238 | 22.6 |
| Spain | 505 | 37.9 |
| Sweden | 450 | 8.3 |
| Switzerland | 41 | 6.5 |
| United Kingdom | 244 | 55.8 |
| Yugoslavia, Republic of | 256 | 22.6 |
| Oceania— | ||
| Australia | 7,687 | 15.2 |
| Fiji | 18 | 0.7 |
| New Caledonia | 19 | 0.1 |
| New Zealand | 269 | 3.2 |
| Papua New Guinea | 462 | 3.1 |
Note—All population estimates except for that of New Zealand are provisional.
For statistical purposes, all persons of half or more Maori descent have, in the past, been defined as Maoris. This differs from the wider definition introduced in the Maori Affairs Amendment Act 1974. That Act states that “Maori” means a person of the Maori race of New Zealand; and includes any descendant of such a person.
A total of 279 255 persons stated at the 1981 Census of Population and Dwellings that they were of half or more Maori descent. This compares with 227 414 in 1971 and 270 035 in 1976. However, the 1976 figure included 65 582 persons who indicated that they were of Maori origin but did not specify degree of descent.
The following tables show the New Zealand Maori population during the present century on the basis of persons of half or more Maori origin. Members of the Armed Forces overseas are excluded.
| Census Year | New Zealand Maori Population*† | Intercensal Increase | Intercensal Increase | Average Annual Increase |
|---|---|---|---|---|
* Prior to 1976 comprises persons who specified themselves as half or more New Zealand Maori. In 1976 and 1981 this group plus those who indicated they were persons of the Maori race of New Zealand, but did not specify the degree of Maori origin, are included. †Includes temporary visitors from overseas who were in New Zealand on Census night. | ||||
| number | percent | |||
| 1901 | 45,549 | 3,436 | 8.16 | 1.59 |
| 1906 | 50,309 | 4,760 | 10.45 | 1.98 |
| 1911 | 52,723 | 2,414 | 4.80 | 0.96 |
| 1916 | 52,997 | 274 | 0.52 | 0.09 |
| 1921 | 56,987 | 3,990 | 7.53 | 1.62 |
| 1926 | 63,670 | 6,683 | 11.73 | 2.24 |
| 1936 | 82,326 | 18,656 | 29.30 | 2.62 |
| 1945 | 98,744 | 16,418 | 19.94 | 1.93 |
| 1951 | 115,676 | 16,932 | 17.15 | 2.89 |
| 1956 | 137,151 | 21,475 | 18.56 | 3.46 |
| 1961 | 167,086 | 29,935 | 21.83 | 4.02 |
| 1956 | 201,159 | 34,073 | 20.39 | 3.84 |
| 1971 | 227,414 | 26,255 | 13.05 | 2.48 |
| 1976 | 270,035 | 42,621 | 18.74 | 3.49 |
| 1981 | 279 255x | 9 220x | 3.41x | 0.67x |
| Year | New Zealand Maori Population at End of Period | Increase During Year | Mean Population for Year | |||
|---|---|---|---|---|---|---|
| Males | Females | Total | Number | Percent | ||
| Year Ended 31 March | ||||||
| 1979 | 137,200 | 136,200 | 273,400 | 5,900 | 2.2 | 270,100 |
| 1980 | 138,700 | 137,900 | 276,600 | 3,200 | 1.2 | 274,800 |
| 1981 | 140 000x | 139,400 | 279 400x | 2 800x | 1.0 | 277,900 |
| 1982 | 141 800x | 141,000 | 282 800x | 3 400x | 1.2 | 280 700x |
| 1983 | 143,700 | 142,800 | 286,500 | 3,700 | 1.3 | 284,200 |
| Year Ended 31 December | ||||||
| 1979 | 138,400 | 137,300 | 275,700 | 3,700 | 1.3 | 274,000 |
| 1980 | 139,800 | 139,000 | 278,800 | 3,100 | 1.1 | 277,200 |
| 1981 | 141,200 | 140,500 | 281,700 | 2,900 | 1.0 | 279,800 |
| 1982 | 143,300 | 142,400 | 285,700 | 4,000 | 1.4 | 283,300 |
| 1983 | 145,100 | 144,200 | 289,300 | 3,600 | 1.3 | 287,000 |
Census data on the New Zealand Maori population are presented in the following table using 2 classifications—those of half or more New Zealand Maori origin, and a wider category containing all persons of Maori descent irrespective of their degree of Maori origin.
| Census Year | Half or More Maori Origin* | Maori Descendants | ||||
|---|---|---|---|---|---|---|
| Total Population† | Average Annual Increase | Proportion of Total Population | Total Population | Average Annual Increase | Proportion of Total Population | |
* Prior to 1976 comprises persons who specified themselves as half or more New Zealand Maori. In 1976 and 1981 this group plus those who indicated they were persons of the Maori race of New Zealand, but did not specify the degree of Maori origin, are included. †Includes temporary visitors from overseas who were in New Zealand on Census night. | ||||||
| Percent | Percent | |||||
| 1951 (17 April) | 115,676 | 2.9 | 6.0 | 134,842 | 2.7 | 7.0 |
| 1961 (18 April) | 167,086 | 3.7 | 6.9 | 202,535 | 4.2 | 8.4 |
| 1971 (23 March) | 227,414 | 3.1 | 7.9 | 290,501 | 3.7 | 10.1 |
| 1981 (24 March) | 279,252 | 2.1 | 8.8 | 385,524 | 2.9 | 12.1 |
Births, Deaths, Infant Mortality—For statistics comparing Maori and non-Maori rates of births, deaths, infant and perinatal mortality by cause, and life expectancy, refer to Section 4, Vital Statistics.
Geographical Distribution—The increasing urbanisation of the Maori population is a significant population trend. At the 1926 Census of Population and Dwellings the urban New Zealand Maori population totalled 9905 (15.6 percent). By the 1981 Census the comparable figure for usually resident Maoris was 219 174 (78.5 percent), the largest concentration being in the Central and Southern Auckland Urban Areas where a total of 49 821 were enumerated.
Urban population is defined as that of main, secondary, and minor urban areas.
Between 1971 and 1976 the proportion of Maori population in the North Island dropped from 93.9 percent to 92.8 percent, but the proportion rose again to 930 percent (259 590) in 1981.
The following table shows the usually resident Maori population at the 1981 Census by statistical area.
| Statistical Area | N.Z. Maoris*† | |
|---|---|---|
| Number | Percent | |
* Persons of half or more Maori descent. †N.Z. residents | ||
| North Island— | ||
| Northland | 22,353 | 8.01 |
| Central Auckland | 68,631 | 24.59 |
| South Auckland - Bay of Plenty | 79,710 | 28.56 |
| East Coast | 14,880 | 5.33 |
| Hawke's Bay | 21,174 | 7.59 |
| Taranaki | 7,992 | 2.86 |
| Wellington | 44,853 | 16.07 |
| Total, North Island | 259 590 | 93.02 |
| South Island— | ||
| Marlborough | 1,035 | 0.37 |
| Nelson | 1,593 | 0.57 |
| Westland | 522 | 0.19 |
| Canterbury | 9,252 | 3.32 |
| Otago | 2,754 | 0.99 |
| Southland | 4,341 | 1.56 |
| Total, South Island | 19 491 | 6.98 |
| Total, New Zealand | 279 084 | 100.00 |
Age Distribution—At the 1981 Census, 40 percent of the Maori population were under the age of 15 years, compared with 26.7 percent of the total population. The youthfulness of the Maori population is further demonstrated by the fact that at the 1981 Census, over half (53 percent) of the Maori population were under 20 years of age, compared to 36.4 percent of the total population.
Only 3.9 percent of Maoris are over 60 years of age. This compares with 14.0 percent of the total population.
In the following table, figures of the Maori and total population at the 1981 Census, are given for a number of broad age groups.
| Age Group (Years) | Total Population† | Maori Population*† | ||||||
|---|---|---|---|---|---|---|---|---|
| Males | Females | Total | Males | Females | Total | |||
| Number | Percentage | Number | Percentage | |||||
* Persons of half or more N.Z. Maori origin. †Includes temporary visitors from overseas who were in New Zealand on Census night 1981. | ||||||||
| Under 15 | 433,206 | 415,368 | 848,574 | 26.7 | 56,733 | 54,921 | 111,651 | 40.0 |
| Under 18 | 526,293 | 504,126 | 1,030,422 | 32.4 | 68,031 | 65,709 | 133,737 | 47.9 |
| Under 20 | 590,691 | 565,806 | 1,156,497 | 36.4 | 75,312 | 72,828 | 148,137 | 53.0 |
| 18 and over | 1,052,628 | 1,092,687 | 2,145,315 | 67.6 | 71,874 | 73,632 | 145,500 | 52.1 |
| 20 and over | 988,230 | 1,031,007 | 2,019,240 | 63.6 | 64,593 | 66,513 | 131,100 | 46.9 |
| 60 and over | 194,586 | 251,211 | 445,794 | 14.0 | 5,244 | 5,526 | 10,761 | 3.9 |
| 65 and over | 133,566 | 182,628 | 316,191 | 10.0 | 3,189 | 3,315 | 6,498 | 2.3 |
| 80 and over | 17,154 | 36,735 | 53,889 | 1.7 | 300 | 369 | 666 | 0.2 |
| Total | 1 578 927 | 1 596 810 | 3 175 737 | 100.0 | 139 911 | 139 344 | 279 255 | 100.0 |
Sex Ratio—The earliest reliable statistics on the Maori population show a high predominance of males. In 1881 there were 81.1 females per 100 males and the gap has progressively closed until in 1976, there were 98.9 females to every 100 males. At the 1981 Census there were 139 911 males and 139 344 females in the total Maori population, a difference of only 567, representing a sex ratio of 99.6 females to every 100 males.
Labour Force—The resident Maori full-time labour force grew by 14 497 (16.2 percent) between 1976 and 1981 to reach 104 181 (7.8 percent of the total full-time resident labour force who specified their ethnic origin) at the 1981 Census. Intercensal growth for the non-Maori labour force was due mainly to growth in the female workforce. In contrast the increase in the male workforce for the Maori labour force was greather than for the female workforce.
| Full-time Labour Force* | 1976 | 1981 | Intercensal Change† | |
|---|---|---|---|---|
| Number | Percent | |||
* N.Z. residents. †Includes cases where ethnic origin was not specified. | ||||
| Maori | ||||
| Male | 61,545 | 69,852 | 8,307 | 13.5 |
| Female | 28,139 | 34,329 | 6,190 | 22.0 |
| Total | 89 684 | 104 181 | 14 497 | 16.2 |
| Non-Maori | ||||
| Male | 794,174 | 806,754 | 12,580 | 1.6 |
| Female | 375,244 | 421,407 | 46,163 | 12.3 |
| Total | 1 169 418 | 1 228 161 | 58 743 | 5.0 |
The number of wage and salary earners in the Maori labour force increased by 7.6 percent between 1976 and 1981. However, the proportion of wage and salary earners within the Maori labour force dropped from 88.7 percent in 1976 to 82.1 percent in 1981, largely because of an increase in the number of unemployed.
The following table shows Maori labour force by employment status at the 1976 and 1981 Censuses. The most dramatic feature of the table is the increase of 8668 (146.3 percent) in the number of Maoris unemployed and seeking work. In comparison non-Maori unemployed increased by 19 606 to 45 660 (132.9 percent).
At the 1981 Census the unemployed represented 14.1 percent of the Maori labour force compared with 3.7 percent of the non-Maori labour force. Maoris, in fact, made up nearly a quarter (24.2 percent) of the total unemployed. Almost half (49 percent) of the unemployed Maori population were aged between 15 and 19 years, while a further 21.6 percent were aged 20–24 years.
| Employment Status | 1976 | 1981 | ||
|---|---|---|---|---|
| Number | Percent | Number | Percent | |
| * Includes persons seeking work. | ||||
| Employer | 1,709 | 1.9 | 1,572 | 1.5 |
| Self employed | 2,301 | 2.6 | 2,181 | 2.1 |
| Wage and salary earner | 79,247 | 88.7 | 85,248 | 82.1 |
| Relative assisting | 207 | 0.2 | 222 | 0.2 |
| Unemployed* | 5,924 | 6.6 | 14,592 | 14.1 |
| Not specified | 296 | .. | 369 | .. |
| Total | 89 684 | 100.0 | 104 181 | 100.0 |
Main Occupational Groups—The main occupational groups of Maoris differ from those of the total New Zealand labour force. Maoris are more predominant amongst the unemployed and semi- and unskilled occupations, than among the professional and skilled white collar occupations. The principal occupational groups for Maori males were labourers (12.2 percent of the Maori male labour force), food and beverage processors (11.3 percent), and transport equipment operators (8.6 percent). Farmers, machinery fitters/assemblers, and managers were the principal occupational groups for males in the total labour force.
The main occupational groups for Maori females in the full-time labour force were tailors, dressmakers and sewing machine operators (6.8 percent), clerical workers (6.3 percent), and agricultural and animal husbandry workers (6.2 percent). This compares with clerical workers, salespersons/shop assistants and stenographers/typists/punch machinists for females in the total labour force.
The following table gives main occupational groups of the Maori full-time labour force at the 1981 Census of Population and Dwellings.
| Ranking* | Occupation | Number Engaged† | Percentage of Maori Labour Force | Percentage of Maoris in Total Labour Force | |
|---|---|---|---|---|---|
| 1976 | 1981 | ||||
* Predominant occupational groups at each Census. †N.Z. residents, 1981 Census. | |||||
| Males | |||||
| 2 | 1 | Labourers | 8,517 | 12.2 | 22.2 |
| 1 | 2 | Food and beverage processors | 7,899 | 11.3 | 19.8 |
| 3 | 3 | Transport equipment operators | 6,036 | 8.6 | 16.0 |
| 5 | 4 | Agricultural and animal husbandry workers | 4,899 | 7.0 | 12.5 |
| 4 | 5 | Material handlers and related equipment— Operators, dockers, and freight handlers | 4,560 | 6.5 | 13.2 |
| 9 | 6 | Forestry workers | 2,895 | 4.1 | 31.1 |
| 7 | 7 | Wood preparation workers and paper makers | 2,613 | 3.7 | 27.7 |
| 6 | 8 | Bricklayers, carpenters, and other construction workers | 2,487 | 3.6 | 6.1 |
| 8 | 9 | Machinery fitters, machine assemblers, and precision-instrument makers | 2,202 | 3.2 | 4.3 |
| 12 | 10 | Protective service workers | 1,887 | 2.7 | 8.4 |
| Total, full-time labour force | 69 852 | 100.0 | 8.0 | ||
| Females | |||||
| 1 | 1 | Tailors, dressmakers and sewers | 2,331 | 6.8 | 12.3 |
| 2 | 2 | Clerical and related workers | 2,160 | 6.3 | 3.4 |
| 6 | 3 | Agricultural and animal husbandry workers | 2,121 | 6.2 | 13.4 |
| 4 | 4 | Labourers | 1,923 | 5.6 | 23.0 |
| 3 | 5 | Cooks, waitresses, and bartenders | 1,857 | 5.4 | 12.8 |
| 11 | 6 | Building caretakers and cleaners | 1,455 | 4.2 | 19.3 |
| 5 | 7 | Housestaff and related housekeeping services | 1,434 | 4.2 | 15.5 |
| 9 | 8 | Food and beverage processors | 1,380 | 4.0 | 26.8 |
| 8 | 9 | Material handlers and related equipment— Operators, dockers, and freight handlers | 1,269 | 3.7 | 16.7 |
| 7 | 10 | Salespersons, shop assistants and related workers | 1,179 | 3.4 | 3.3 |
| Total, full-time labour force | 34 329 | 100.0 | 7.5 | ||
Income—The most common income group for Maori males in the full-time labour force at the 1981 Census was $10,000-$11,999, the same as for non-Maori males. For Maori females the most common income group, $8,000-$9,999 was also the same as for non-Maori females.
However excluding those with nil income, the median income (point at which half of the incomes are lower and half were higher) was $9,936 for Maori males ($11,975 for non-Maori males). Similarly the median income was lower for Maori females ($6,837) compared to non-Maoris ($7,762). While the income differential can be partly explained in terms of the younger age structure of the Maori workforce, it also results from factors such as lower educational attainment and hence a lower underrepresentation of Maoris in the higher-paid occupations.
EDUCATION: Maori Education Foundation—The Maori Education Foundation Act 1961 established the Maori Education Foundation for the general purpose of promoting and encouraging the better education of Maoris and of providing financial assistance for that purpose. The capital resources of the foundation are $3,000,000. The principal purpose for which the Board of Trustees is empowered is to apply the income of the Foundation to the educational and vocational training of Maoris. This includes the provision of grants to pre-school groups and the employment of a pre-school officer; sponsorship of the 2 annual speech contests; grants to secondary school pupils, and to students attending university or other tertiary institutions of similar status; the provision of scholarships and fellowships to students undertaking graduate and post-graduate study at New Zealand and overseas universities; and grants to students undertaking research or study which will be of ultimate benefit to the Maori people.
In the 1983 academic year a total of $1,182,000 was expended on grants. Of this, $50,000 was for pre-school activities; $852,000 was for grants to secondary school pupils; $240,000 was for grants at undergraduate level; and $40,000 on grants at graduate and post-graduate level. In addition the Foundation made grants totalling $570,000 in support of the teaching and development of the Maori language.
Pacific Islands Polynesian Education Foundation—In 1972 the Pacific Islands Polynesian Education Foundation was established to assist Pacific Island students who reside permanently in New Zealand. The aims and objectives of the Foundation are similar in most respects to those of the Maori Education Foundation, and assistance is also given at all levels of education. In the 1983 academic year $32,000 was expended on grants and a total of 300 students were assisted.
School Qualifications—At the 1981 Census of Population and Dwellings, School Certificate or equivalent was the highest qualification attained by 15.3 percent of the Maori population aged 15 years and over (22.1 percent for non-Maoris). For a further 3.7 percent of Maoris (18.5 percent for non-Maoris), University Entrance or equivalent was the highest school qualification held.
In the younger age groups, 26.1 percent of Maoris aged between 15 and 19 years had attained School Certificate or University Entrance as their highest school qualification. This compares with 60.1 percent of non-Maoris of that age. Maoris aged 15 years and over with no secondary school qualifications totalled 80.9 percent compared to 50.9 percent of the non-Maori population. In the age group with the highest level of unemployment (15–19 years) 73.8 percent of Maoris had no secondary school qualifications, compared to 39.8 percent of non-Maoris.
The following tables show years of attendance at secondary schools, school qualifications gained, and destinations of Maori school leavers at the end of 1982.
| Attainment | Years of Attendance of School Leavers*During or at the End of | ||||||||||||||
|---|---|---|---|---|---|---|---|---|---|---|---|---|---|---|---|
| 1st Year | 2nd Year | 3rd Year | 4th Year | 5th Year | 6th Year | Total | |||||||||
| M | F | M | F | M | F | M | F | M | F | M | F | M | F | Grand | |
| * Does not include deceased or students leaving to attend another secondary school. | |||||||||||||||
| University Scholarship | 1 | 1 | 1 | ||||||||||||
| University Bursaries examination | 1 | 47 | 39 | 5 | 2 | 53 | 41 | 94 | |||||||
| Higher School Certificate | 1 | 1 | 83 | 62 | 21 | 6 | 105 | 69 | 174 | ||||||
| University Entrance | 64 | 109 | 113 | 105 | 19 | 8 | 196 | 222 | 418 | ||||||
| Sixth Form Certificate | 1 | 1 | 211 | 296 | 151 | 152 | 26 | 17 | 389 | 466 | 855 | ||||
| Three or more School Certificate subjects | 73 | 67 | 123 | 126 | 32 | 18 | – | – | 228 | 211 | 439 | ||||
| Two School Certificate subjects | 51 | 68 | 116 | 122 | 14 | 16 | 1 | – | 182 | 206 | 388 | ||||
| One School Certificate subject | 130 | 129 | 138 | 149 | 10 | 20 | – | 1 | 278 | 299 | 577 | ||||
| No attainment | 163 | 100 | 939 | 724 | 1,303 | 1,172 | 438 | 504 | 31 | 30 | 1 | 1 | 2,875 | 2,531 | 5,406 |
| Total | 163 | 100 | 939 | 724 | 1 558 | 1 437 | 1 092 | 1 307 | 482 | 442 | 73 | 35 | 4 307 | 4 045 | 8 352 |
| Source: Department of Education. | ||
|---|---|---|
| Destination of Maori School Leavers | 1981 | 1982 |
* Requiring further part-time or directed education. Source: Department of Education. | ||
| Further Full-time Education— | ||
| University | 188 | 176 |
| Teacher training— | ||
| Attending university full-time | 11 | 15 |
| Other (including kindergarten) | 53 | 32 |
| Technical institute | 559 | 594 |
| Other full-time education | 49 | 80 |
| Labour Force— | ||
| Technical or professional work*— | ||
| Health services | 77 | 79 |
| Technicians and other | 90 | 103 |
| Apprenticeships | 479 | 395 |
| Clerical, sales and related work | 820 | 800 |
| Production, service industries (including Armed Forces), agricultural and manual occupations | 2,210 | 1,988 |
| No occupation or unknown | 3,885 | 4,090 |
| Total | 8 421 | 8 352 |
Vocational Training for Maori and Pacific Islanders—This programme has been operating for over 20 years. It encourages young Maori and Pacific Islanders into opportunities for higher education, and to participate in pre-apprentice and vocational courses aimed at improving employment prospects.
A total of $4.1 million was spent on vocational training by the Department of Maori Affairs for the year ended 31 March 1983. The programmes are concentrated in polytechnics and community colleges and the effectiveness of the scheme is largely dependent upon liaison with these institutions and with the Department of Education.
In recent years there has been a move to supplement the 'institution' based courses with training in the work place. The department has entered into agreements with several employers to engage Maori and Pacific Island youth under a joint incentive training scheme. This provides for the employer to accept an applicant for training in skills relevant to the employer's operation. The trainee receives an award wage but this is subsidised by the department to the extent of the standard training allowance. There is normally an undertaking by the employer to engage the trainee at the completion of the training period.
The following table lists the number of trainees engaged in the various courses and compares numbers with 2 previous years:
| Course | 1981 | 1982 | 1983 |
|---|---|---|---|
| Agriculture courses— | |||
| Farming training, fishing, and horticulture | 50 | 53 | 52 |
| Pre-apprentice training courses— | |||
| Auto-diesel; carpentry (1st and 2nd year); coachbuilding and panelbeating; electrical wiring; fitting and turning; fitting and welding; metal trades; hairdressing; joinery; meat retailing; motor mechanics; painting and decorating; plumbing and gasfitting and sheetmetal | 466 | 467 | 434 |
| Vocational or non-trade courses— | |||
| Carving and Maori language (2 year course); chef cooking and catering; general merchandising; hotel receptionists, secretarial and typing; technicians courses in building and engineering; and office training | 315 | 295 | 304 |
| Sponsorship courses— | |||
| Accountancy and management; computer programming and New Zealand Certificates | 102 | 132 | 201 |
| Introductory courses— | |||
| Key-to-disk operators; journalism; radio accounting | 549 | 150 | 96 |
| Total, trainees | 1 482 | 1 097 | 1 087 |
Historically, an important aspect of the programme has been the satisfactory placement of trainees in an appropriate trade or occupation at the conclusion of the course. The current employment situation, however, makes it very difficult for trainees to find jobs and at 31 March 1983 there were still 37 percent of the trainees from the 1982 courses who had not been placed in a job consistent with their training.
Over the past 3 years some emphasis has been placed on support for university students engaged in business studies. This support is now extended to 57 students and to 4 who are studying at the School of Forestry at Canterbury University.
Kokiri Centres—Kokiri Basic Skills centres were established under the Maori Affairs Act 1953 as a joint venture between the Department of Maori Affairs, the Maori community, and local private employers to develop a basic skills education programme for Maori youth, and to provide training in cultural skills in a traditional Maori setting. The centres are run on a voluntary basis independent of Maori Affairs in their administration and staffing. Small grants are made by the department to assist in running costs, but the main support comes from the community in which the Kokiri centre operates.
There are 40 Kokiri centres located as follows: Auckland (10), Wellington (5), Christchurch (3), Gisborne (3), Whangarei (2), Hamilton (2), New Plymouth, Te Hauke, Tokomaru Bay, Rotorua, Hastings, Otaki, Nelson, Ashburton, Dunedin, Oamaru, Temuka, Blenheim, Westport, Taumarunui, and Invercargill.
There are on average 4 tutors per centre giving tuition on activities ranging from traditional carving, weaving, language, and arts; contemporary basic skills tuition in carpentry, horticulture, cooking, and childcare to the more esoteric teachings of Maori thought, philosophy, religion, and tribal lore.
Rapu Mahi Programme—In October 1981 the Government approved grants to assist the Maori community take its own initiatives in finding employment for young Maoris. This was a challenge the Maori people themselves had been pressing for, as it allowed the strengths of the whanau (family) and iwi (tribe) to be brought to bear on this concern of the people. The people, with departmental back up and support, took the initiative. Over the period November 1982 to March 1983:
4202 school leavers and unemployed youth were involved;
1124 young unemployed were placed in jobs and 1186 were referred for additional tuition, with a further 570 being placed in Department of Labour Schemes (Project Employment Programme and Work-Skills Development).
By 31 March 1983, the department had made grants totalling $196,280 to Maori community groups, which as part of their contribution gave $275,430 either in cash donations or in time and materials (e.g., use of private motor-vehicles, free use of facilities, donations of food and equipment such as typewriters and office equipment). The main emphasis was on identifying Maori resources, such as whanau (family), who could take on a young person in a full-time job, or locate job vacancies through the whanau (tribal network). This involved 1 Maori adult taking responsibility for 1 unemployed Maori school leaver and finding him/her a job.
MAORI HOUSING—In addition to the facilities of the Housing Corporation, financial assistance towards the building of houses, including the purchase of building sites, additions, repairs to existing dwellings, and for the purchase of houses, is available to Maoris and other Polynesians under the Maori Housing Act 1935. This assistance is now generally not available to those who qualify for assistance from the Housing Corporation.
The Department of Maori Affairs also arranges for construction of the houses in many cases. Finance through the department up to set loan limits, rebated interest rate, and capitalisation of family benefits, is similar to loans granted by the Housing Corporation. Where the applicant does not qualify for special interest concessions the finance is made available at an interest rate of 7 1/2; percent.
All applications for State tenancies are dealt with by the Housing Corporation.
From the inception of the scheme to 31 March 1983, the department has provided finance for 22 169 new houses and the purchase of 3084 existing houses. An additional 14 323 advances have been made for additions and repairs to houses and other buildings.
The following table gives 1981 Census data on tenure of permanent private dwellings of Maoris and non-Maoris.
Almost three quarters (72.9 percent) of permanent, private non-Maori dwellings were owned (with or without a mortgage), while less than half (45.3 percent) of Maori dwellings were owned.
| Tenure | Permanent Private Dwellings | ||
|---|---|---|---|
| Maori | Non-Maori | ||
| Number | Percent | Percent | |
| Owned—without mortgage | 7,716 | 12.9 | 29.8 |
| Owned—with mortgage | 19,383 | 32.4 | 43.1 |
| Rented—not from employer | 23,166 | 38.8 | 20.0 |
| Rented—from employer | 6,243 | 10.4 | 3.5 |
| Rented—undefined | 513 | 0.9 | 0.2 |
| Provided free—not with job | 1,296 | 2.2 | 1.2 |
| Provided free—with job | 1,461 | 2.4 | 2.1 |
| Not specified | 555 | .. | .. |
| Total | 60 330 | 100.0 | 100.0 |
The average number of occupants per Maori dwelling at the 1981 Census was 4.2 (4.6 at 1976 Census) which compares with 2.9 for non-Maori dwellings (3.1 at 1976 Census). A total of 4686 Maori dwellings (7.8 percent) had 8 or more occupants (0.8 percent for non-Maori dwellings).
Persons living alone, permanently or temporarily, comprised 8.9 percent of Maori dwellings, compared with 19.0 percent of non-Maori dwellings.
Amenities—The following table shows the ownership level at the 1981 Census and the intercensal increase of amenities for Maori and non-Maori households.
| Amenity | Maori Households | Non-Maori Households | ||
|---|---|---|---|---|
| Increase in Ownership 1976–81 | Proportion with Amenity (1981 Census) | increase in Ownership 1976–81 | Proportion with Amenity (1981 Census) | |
| Telephone | 18.0 | 71.0x | 10.4 | 92.9x |
| Electric clothes dryer | 47.6 | 29.7x | 28.7 | 46.3x |
| Automatic washing machine | 3.5 | 25.8x | 47.0 | 53.0x |
| Other washing machine | .. | 64.4x | .. | 42.6x |
| Colour television | 520.7 | 64.3x | 228.3 | 67.4x |
| Black and white television | −52.1 | 31.9x | −48.6 | 34.1x |
| Deep freeze | 16.6 | 65.6x | 12.4 | 73.2x |
| None | −37.8 | 1.6 | −46.2 | 0.6 |
COMMUNITY SERVICE FOR MAORI PEOPLE AND PACIFIC ISLAND POLYNESIANS—The legislative basis of the Maori Community Services Programme is the Maori Community Development Act 1962, and the aim is the social and economic advancement and the promotion and maintenance of the health and general well-being of the Maori community, and the facilitation of full integration of the Maori race into the social and economic life of the country. The Act provides for subsidies to be paid on moneys raised by Maori people through their associations for the promotion of community services. An important feature of the Community Services Programme is that it calls upon the Maori and Pacific Island people to exercise the control and direction of their own communities.
The Maori organisations consist of 2 statutory groups and many voluntary groups. The statutory groups are:
Maori associations comprising the New Zealand Maori Council, the district Maori councils, Maori executive committees, and the Maori committees. All are democratically elected and work independently of the Department of Maori Affairs.
The Department of Maori Affairs—The broad functions of the department are to assist Maori and Pacific Island peoples, particularly in social, economic, and cultural matters. Through its community services division, the department gives assistance in the fields of education, employment, housing, and health.
TU TANGATA PROGRAMME—Under its Tu Tangata programme, the Department of Maori Affairs has encouraged a partnership with the Maori people in the area of community administration.
The high success rate of community programmes such as Rapu Mahi, Kokiri, Kohanga Reo, and other Tu Tangata activities is largely due to the better use of “Maori systems”. In particular, the whanau (extended family system) is bringing more cohesiveness to community action especially between the various Maori organisations and Government agencies.
Maoridom is experiencing a major revolution in its tikanga Maori (social and cultural order). Maori people are restructuring their community organisations and adopting a wide range of activities aimed at providing a better future for their young people. The following Tu Tangata programmes are currently operating:
Te Kohanga Reo (The Language Nest)—The primary focus of Te Kohanga Reo is to stimulate growth of whanau centres which offer the best Maori childcare in an environment which is Maori in action and language.
The reasons for Te Kohanga Reo are many but principally the need is for a Maori-based programme to stop the decline of Maori-speaking people in New Zealand. Without the Maori language there can be no Maori culture, and the survival of a unique Maori identity is the spiritual force behind the creation of Te Kohanga Reo.
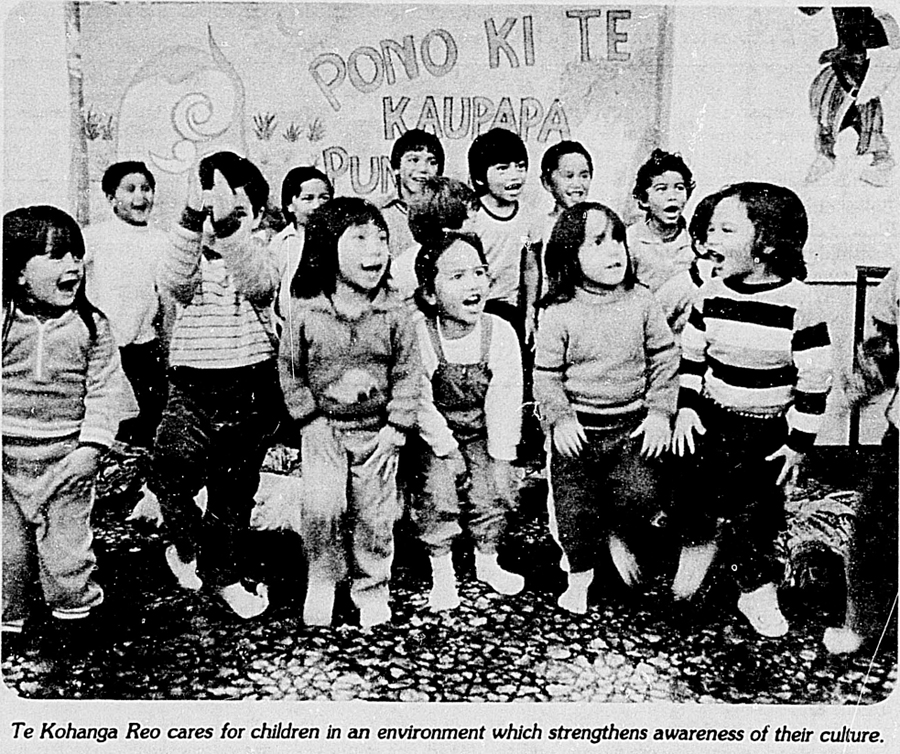
Te Kohanga Reo is designed to enhance qualities in the upbringing of the Maori child so that he/she will have a firm base upon which to grow into adulthood, secure in their personal identity in their iwi (tribal) and hapu (whanau).
The first early childhood language centre opened at the Pukeatua Kokiri Centre, Wainuiomata in April 1981. By 31 March 1983 there were 84 Te Kohanga Reo Whanau centres in operation catering for over 1377 infants under 5 years of age. Two hundred and forty-three kaumatua as “Koro” or “Kuia” are actively involved daily as well as approximately 497 rostered volunteers from the whanau (i.e., mothers, fathers, uncles, aunts, cousins, grandparents etc.). One hundred and fifty native speakers of Maori are either receiving koha or are giving their time freely to service the 84 operations. This remuneration by way of koha is controlled and financed by each Te Kohanga Reo Management group.
Every Te Kohanga Reo whanau receives an establishment grant of $5,000 through Maori Affairs grant funding to Whanau centres or through assistance provided by the Maori Education Foundation. Eighteen centres which have obtained a licence and which are eligible under the Department of Social Welfare provisions for subsidy, receive a Department of Social Welfare subsidy of up to $18 per child per week. In addition, parents pay an average of $25 per child per week. The Maori community also give gifts of money and food to support the Te Kohanga Reo Whanau centres in their locality.
The Te Kohanga Reo programme is being carefully monitored and there is continual discussion through the National Officials Co-ordinating Group made up of officers from the departments of Maori Affairs, Education, Social Welfare, Labour, and Health together with the Maori Education Foundation, the Pre-school Childcare Association, and the Wellington Hospital Board.
There is still much work to be done in the are of transition from Te Kohanga Reo Whanau centres to school life. The National Advisory Committee on Maori Education has given priority to the preparation of junior class teachers who will be receiving children into their classrooms from Te Kohanga Reo Whanau centres.
Maatua Whangai—In 1981 the Hui Whakatauira gave unanimous support to the Department of Maori Affairs for the promotion of a programme to take young Maoris out of Social Welfare institutions and to place them back with their tribal groups. Since that time the Human Rights Commission and Archbishop Johnson have supported this move in special reports.
The Departments of Maori Affairs and Social Welfare, along with Maori leadership, have now launched a programme Maatua Whangai (foster parenting). This programme will ensure that all is done to keep young Maoris out of institutional care and to provide the opportunity for the whanau system to provide alternatives in family care. It is expected that this programme will have a major impact on reducing the numbers of Maoris in the Social Welfare system.
Kokiri Units—Kokiri Units were set up to strengthen Maori community administration. The Kokiri Unit concept allows groups to concentrate energies and resources on those areas identified by the community as the most essential. By this means the community group is able to work out its own strategies for dealing with the situation, and those closest to the issues are able to make decisions about what sort of action is appropriate in their neighbourhood.
Each unit is staffed by Maori Affairs officers, and operates under the 'umbrella' of a Kokiri Community Management Group which sets the priorities for community action. Such tasks involve visiting schools to promote achievement, vocational selection in secondary schools, finding jobs for the unemployed, acting in a support and advisory capacity in the courts, providing language learning, and stimulating cultural activities within communities.
This new style of community administration began in Wellington in 1981 with the Poneke (Wellington city), Heretaunga (Hurt Valley), and Porirua units. The success of these units led to the establishment of 7 Kokiri Units in Auckland (Waitemata, Waipareira, Tamaki, Maungarei, Otara, Mangere, and Counties).
Rapu Mahi Programme and Kokiri Centres—For information on these programmes refer to pages 99–100.
New Zealand Maori Council—The primary functions of the New Zealand Maori Council are to encourage Maoris as individuals and in groups to take the initiative in matters affecting their own welfare and that of their kinsfolk; and to be a forum of discussion in which they can crystallise their ideas and gain the co-operation of others in actively pursuing mutually agreed objectives, and eventually achieving progressive improvement in the various spheres of welfare. By its own request it is charged with the duty of maintaining and promoting harmony between Maori and non-Maori.
Maori Wardens—Appointed by the Minister at the initiative of Maori committees to whom they are responsible, Maori wardens assist in the maintenance of law and order.
Maori Women's Welfare League—The League was formed in 1951 and has branches throughout the country. Its membership approximates 3000. Special tribal groups, social, sports, and cultural clubs, church groups, and women's organisations are some of the many other groups which have their own spheres of action promoting and furthering the physical, social, spiritual, and moral well-being of the people.
The League is involved actively in education, particularly at the pre-school level and plays a major role in initiating and promoting Tu Tangata Whanau programmes.
Maori and Pacific Island Community Officers—The Maori and Pacific Island Community Officers carry out a different range of functions from those of other social workers. Their primary function is to work with groups rather than individuals. For example, it is not strictly a Maori community officer's duty to deal with a Maori child playing truant from school, but if truancy is a common problem amongst Maori students in any locality, it is the community officer's duty to hold discussions with parents and try to convince them of the importance of ensuring that their children attend school regularly. A great deal of the time of the community services staff is occupied in informing Maori and Pacific Island parents of vocational opportunities open to their children, in recruiting and organising vocational training groups for school leavers, stimulating the formation of play centres and other pre-school groups, and in dealing with youth problems in the cities. The whole emphasis is on youth and community development and the strengthening of the family and kinship groups which have traditionally supported the individual.
MAORI LAND—Before European settlement, all land was held by the various groups and tribes of the Maori people in accordance with their traditional customs and usages, and the land remaining in
this tenure is termed Maori customary land. By the Treaty of Waitangi the right to purchase land from Maoris was reserved to the Crown. Almost all of what had been Maori customary land was converted to other forms of title by one or other of the following processes:
Purchase or other acquisition by the Crown (from whom the European colonists obtained land for farms, etc.).
The issue of a Crown grant to a Maori owner on the recommendation of the Maori Land Court.
The issue of a freehold order by the Maori Land Court in favour of the Maori or Maoris found entitled upon an investigation of title. This process was used instead of process (b) after the introduction of the land transfer system into New Zealand.
Land in titles issued under processes (b) and (c) became known as Maori freehold land.
Maori freehold land becomes Crown land if purchased or otherwise acquired by the Crown. If sold or transferred other than to the Crown it remains Maori freehold land unless the document of transfer states otherwise, in which case even though the new owner may be a Maori, the land becomes general land. A Maori may buy or otherwise acquire land which is not Maori freehold land, i.e. general land, and for this reason there is an unknown but considerable amount of general land owned by Maoris in addition to their holdings of Maori freehold land.
The area of Maori freehold land in New Zealand is over 1 300 000 hectares. Maori freehold land is subject to the jurisdiction of the Maori Land Court pursuant to the Maori Affairs Act 1953 and some general land owned by Maoris is subject to certain provisions of that Act.
Maori Land Court—The Maori Land Court consists of a Chief Judge and such other judges as the Governor-General may from time to time appoint. It is a Court of Record and its general function is to deal with problems peculiar to multiple ownership of Maori lands, including the partitioning and combining of titles for better utilisation, the effecting of exchanges, directing the holding of meetings of owners, and confirming or disallowing resolutions passed by such meetings, confirming sales, and making other miscellaneous orders including in certain cases, determining entitlement to, and vesting in persons entitled, the beneficial interests of deceased owners, in Maori freehold land.
The Maori Appellate Court consists of any 3 or more Judges of the Maori Land Court, provided that 2 Judges at least shall concur in every decision of the court. With certain exemptions, the Appellate Court determines appeals, whether on law or on fact, from all from final orders of the Maori Land Court.
During the year ended 31 March 1983 the Maori Land Court conducted 81 sittings throughout New Zealand and dealt with 5859 applications, from which a total of 10 286 orders were made.
Maori Land Development and Rural Lending—The Board of Maori Affairs is constituted by section 5 of the Maori Affairs Act 1953 to promote greater involvement in, and identification of the Maori owners with, land development activities. The board is assisted by district Maori Land Advisory Committees. Owners of Maori land have access to usual lending institutions but it is not easy to borrow money for land development unless mortgage security can be given. Multiplicity of ownership often prevents this. Under the Maori Affairs Act 1953 the board, through the Department of Maori Affairs, may lend money for the development and settlement of Maori land. This does not affect the legal ownership, but the rights of the owners are suspended and the board has the right to exclusive occupation of the land. At 30 June 1983 stations farmed by the department contained a total of 100 697 hectares, 64 871 hectares of which were in grass.
The grassing programme achieved 1524 hectares of new development during 1982–83.
The original objective of Maori land development was to subdivide developed blocks for settlement by Maori farmers. A recent trend has been a preference by owners to form incorporations or trusts to assume control on their behalf when properties are sufficiently consolidated and have attained financial stability. Horticultural enterprises are becoming a most effective means by which Maori land can be utilised with the added advantage of providing employment opportunities.
The board makes loans to suitably qualified Maori trusts and incorporations to enable them to purchase farms or to enter into leasing or share farming contracts. New loans and further advances are also made available to existing farmers.
Maori Trustee—The Maori Trust Office was originally created to take over from the Public Trust Office the administration of certain Maori reserves, estates of deceased Maoris, and those under disability. It is headed by the Maori Trustee, comparable in status and functions with the Public Trustee. Maori Trustee activities have been decentralised by the delegation of wide powers to the directors of the Department of Maori Affairs, who deal primarily with all Maori Trustee matters in their districts.
Administration of leases of Maori land and distribution of rent to numerous owners, also lending to Maoris for businesses, homes and other purposes are now major activities of the Maori Trustee. The
Maori Trust Office operates independently but within the general framework of the Department of Maori Affairs.
The following table is a summary of the assets and liabilities of the Maori Trustee as at 31 March in each of the latest 3 years.
| Item | As at 31 March | ||
|---|---|---|---|
| 1981 | 1982 | 1983 | |
| $(thousand) | |||
| Assets— | |||
| Cash and short-term investments | 1,141 | 965 | 1,324 |
| Government stock | 1,700 | 1,700 | 1,700 |
| Local authority debentures and stock | 2,909 | 2,854 | 2,731 |
| Company debentures | 1,706 | 1,706 | 1,706 |
| Mortgages and charges | 7,417 | 9,072 | 9,399 |
| Conversion Fund land interests | 1,408 | 1,442 | 1,481 |
| Miscellaneous assets | 879 | 483 | 632 |
| Total assets | 17,160 | 18,222 | 18,973 |
| Liabilities— | |||
| Amounts held for beneficiaries | 9,173 | 10,248 | 10,308 |
| Conversion Fund | 1,879 | 1,621 | 1,735 |
| Creditors and miscellaneous | 768 | 920 | 778 |
| 11,820 | 12,789 | 12,821 | |
| Accumulated revenue | 5,340 | 5,433 | 6,152 |
| Total liabilities | 17,160 | 18,222 | 18,973 |
The total Pacific Island Polynesian population in New Zealand numbered 89 697 at the 1981 Census of Population and Dwellings and represented 2.9 percent of the total New Zealand population compared with 2.0 percent in 1976. Of these persons, 873 were temporary visitors in New Zealand on census night leaving a resident Pacific Island Polynesian population of 88 824 (60 966 at the 1976 Census), an intercensal increase of 27 861 (45.7 percent). Nearly half (42 078 or 47.4 percent) of the resident Pacific Island Polynesian population were Samoans while more than a quarter (23 880 or 26.9 percent) were Cook Island Maoris (see table on page 89).
Age Distribution—The Pacific Island Polynesian population in New Zealand is characterised by high proportions of children (0–14 years) and also by high proportions in the main working ages (25–44 years). Some 41.3 percent of the Pacific Island Polynesian population were under 15 years of age compared with 40.0 percent of the New Zealand Maori population and only 25.2 percent of the population excluding New Zealand Maoris and Pacific Island Polynesians.
However, while both the Maori and Polynesian populations in New Zealand have youthful age structures, the proportion in the major working ages (25–44) is a distinguishing feature when comparing the two populations.
The following table shows that 29.6 percent of the Pacific Island Polynesian population were aged between 25 and 44, compared with 23.7 percent of Maoris and 26.8 percent of the population excluding Maoris and Polynesians.
| Age (Years) | Resident New Zealand Population | ||
|---|---|---|---|
| Pacific Island Polynesian | N.Z. Maori | European*and Other | |
| * Population excluding Pacific Island Polynesians and New Zealand Maoris. | |||
| Percent | |||
| 0–4 | 15.2 | 12.6 | 7.3 |
| 5–14 | 26.1 | 27.4 | 17.9 |
| 15–19 | 10.0 | 13.1 | 9.4 |
| 20–24 | 9.4 | 10.4 | 8.4 |
| 25–44 | 29.6 | 23.7 | 26.8 |
| 45–59 | 7.0 | 9.0 | 15.0 |
| 60 and over | 2.6 | 3.9 | 15.2 |
| Total | 100.0 | 100.0 | 100.0 |
Geographical Distribution—The Central Auckland Statistical Area had the largest resident Pacific Island Polynesian population—57 462 or 64.7 percent of the resident Pacific Island Polynesian population of New Zealand. They represented 7.1 percent of the resident population of the statistical area.
The next largest concentration was in the Wellington Statistical Area with a Pacific Island Polynesian population of 17 580 (3.1 percent of the population of the area) representing 19.8 percent of the resident Pacific Island Polynesian population in New Zealand. Only 6.5 percent (5793) of the New Zealand Pacific Island Polynesian population lived in the South Island at the 1981 Census.
Urbanisation—At the 1981 Census, 97.9 percent of the Pacific Island Polynesian population were in areas classified as 'urban' and this population was concentrated within particular urban centres.
The Porirua Basin Main Urban Area has the highest proportion of Polynesians with 12.0 percent (6513) of the population being Pacific Island Polynesians. Tokoroa Secondary Urban Area had the next highest proportion of Polynesians with 2232 persons, constituting 11.6 percent of the resident population of the urban area.
In the Porirua Basin Main Urban Area, the Pacific Island Polynesian population exceeded the New Zealand Maori population. This was also the case in Central Auckland Main Urban Area which had a Pacific Island Polynesian population of 23 769 (8.7 percent of the resident population). The largest Pacific Island Polynesian population was in Southern Auckland Main Urban Area with 25 320 representing 11.2 percent of the resident population. Between them, these four urban centres accounted for 65.1 percent of the resident Pacific Island Polynesian population in New Zealand.
Labour Force—The Pacific Island Polynesian full-time labour force of 35 019 represented 2.6 percent of the New Zealand resident labour force in 1981. The intercensal increase in the Polynesian labour force, of 44.8 percent (10 830), was proportionately greater than that for either the Maori labour force (16.2 percent) increase intercensally, or the labour force excluding Maoris and Polynesians (4.2 percent).
The full-time labour force represented 39.4 percent of the resident Pacific Island Polynesian population. Over half (56.1 percent) of the labour force were aged between 25 and 44 years.
The following table shows that in contrast to the New Zealand Maori labour force (40.0 percent were under the age of 25), only 29.9 percent of the Pacific Island Polynesian labour force were under 25.
| Age (Years) | Resident Full-Time Labour Force | ||
|---|---|---|---|
| Pacific Island Polynesian | N.Z. Maori | European*and Other | |
| * Full-time labour force excluding Pacific Island Polynesians and New Zealand Maoris. | |||
| Percent | |||
| 15–19 | 11.7 | 20.7 | 11.5 |
| 20–24 | 18.2 | 19.4 | 15.3 |
| 25–44 | 56.1 | 43.0 | 44.7 |
| 45–59 | 13.0 | 15.4x | 24.1 |
| 60 and over | 1.1 | 1.5 | 4.4 |
| Total | 100.0 | 100.0 | 100.0 |
The numbers in the Pacific Island Polynesian labour force who were unemployed increased by 2575 (246.9 percent) between 1976 and 1981 to reach 3618 or 10.4 percent of the Pacific Island Polynesian full-time labour force in 1981, compared with 4.3 percent in 1976. Largely as a result, the proportion of wage and salary earners dropped from 94.0 percent in 1976, to 87.8 percent of the Pacific Island Polynesian full-time labour force in 1981. However the following table shows that the proportion of wage and salary earners in the Pacific Island Polynesian labour force (87.8 percent) remains higher than that for the New Zealand Maori labour force (82.1 percent) or for the remainder of the labour force (81.9 percent).
| Employment Status | Resident Full-time Labour Force | ||||
|---|---|---|---|---|---|
| Pacific Island Polynesian | N.Z. Maori 1981 Percent | European*and Other 1981 Percent | |||
| 1976 Percent | 1981 | ||||
| Number | Percent | ||||
| * Full-time labour force excluding Polynesians and Maoris. | |||||
| Employer | 0.8 | 345 | 1.0 | 1.5 | 6.4 |
| Self-employed | 0.8 | 246 | 0.7 | 21 | 7.6 |
| Wage and salary earner | 94.0 | 30,546 | 87.8 | 82.1 | 81.9 |
| Relative assisting | .. | 18 | 0.1 | 0.2 | 0.5 |
| Unemployed | 4.3 | 3,618 | 10.4 | 14.1 | 3.5 |
| Not specified | .. | 246 | .. | .. | .. |
| Total | 100.0 | 35 019 | 100.0 | 100.0 | 100.0 |
The main industry for the Pacific Island Polynesian labour force was manufacturing which employed 18 285 workers, over half (58.2 percent) of the Pacific Island Polynesian full-time labour force in specified industries at the 1981 Census of Population and Dwellings.
However, the proportion in the manufacturing industry has dropped since 1976, with resulting increases in the proportions in some other industry groups—in particular, “wholesale, retail and restaurant”, “finance, insurance and business” and “community, social and personal services”. The high degree of urbanisation of the Pacific Island Polynesian population is reflected in the low proportion of workers in agriculture and related industries.
| Industry Major Group | Resident Full-time Labour Force | ||||
|---|---|---|---|---|---|
| Pacific Island Polynesian | N.Z. Maori 1981 Percent | European*and Other 1981 Percent | |||
| 1976 Percent | 1981 | ||||
| Number | Percent | ||||
| * Labour force excluding Polynesians and Maoris. | |||||
| Agriculture, hunting, forestry, fishing | 1.3 | 588 | 1.9 | 13.1 | 11.3 |
| Mining and quarrying | 0.1 | 39 | 0.1 | 0.7 | 0.3 |
| Manufacturing | 61.4 | 18,285 | 58.2 | 35.2 | 22.4 |
| Electricity, gas, water | 0.6 | 213 | 0.7 | 1.6 | 1.2 |
| Building and construction | 5.3 | 1,182 | 3.8 | 8.6 | 6.6 |
| Wholesale, retail and restaurant | 7.1 | 2,517 | 8.0 | 9.0 | 17.9 |
| Transport, storage, communication | 8.2 | 2,460 | 7.8 | 10.5 | 8.2 |
| Finance, insurance, business | 1.7 | 723 | 2.3 | 1.8 | 7.7 |
| Community, social, personal | 14.3 | 5,424 | 17.3 | 19.5 | 24.4 |
| Inadequately defined | .. | 3,594 | .. | .. | .. |
| Total | 100.0 | 35 019 | 100.0 | 100.0 | 100.0 |
Income—The most common income group for Pacific Island Polynesian males in the full-time labour force was $8,000-$9,999. The most common income group for both Maori male labour force and for the remainder of the male labour force was $10,000-$11,999. The median income for the Polynesian male labour force was also lower ($9,593) than that for either the Maoris ($9,936) or the remainder of the male labour force ($12,068).
For Polynesian females in the full-time labour force the most common income group was $8,000-$9,999, the same as that for Maori females and for the remainder of the female labour force. However, the median income for Pacific Island Polynesian women ($7,342) was higher than that for Maori women ($6,837) and compared with $7,780 for the remainder of the female labour force.
Pacific Island Polynesian Dwellings—Some 18 096 permanent and private dwellings were classified as Pacific Island Polynesian at the 1981 Census. They represented 1.8 percent of all permanent and private dwellings in New Zealand.
There were 85 707 occupants in these dwellings giving an average occupancy rate of 4.7 persons per dwelling. This compares with an average occupancy rate of 4.2 persons per dwelling for New Zealand Maori dwellings and 2.9 for all other permanent and private dwellings (i.e. excluding Polynesian and Maori).
A total of 2217 (12.3 percent) Pacific Island Polynesian dwellings had 8 or more occupants, the equivalent proportions for New Zealand Maori dwellings being 7.8 percent and for “other” dwellings just 0.6 percent. Some 6.1 percent of Pacific Island Polynesian dwellings had one occupant compared with 8.9 percent of New Zealand Maori dwellings and 19.3 percent of all other dwellings.
| Number of Occupants | Permanent and Private Dwellings | ||
|---|---|---|---|
| Pacific Island Polynesian | New Zealand Maoris | European*and Other | |
| * Excluding Polynesian and Maori dwellings. | |||
| Percent | |||
| 1 | 6.1 | 8.9 | 19.3 |
| 2–4 | 44.3 | 51.7 | 64.9 |
| 5–7 | 37.3 | 31.6 | 15.2 |
| 8 and over | 12.3 | 7.8 | 0.6 |
| Total | 100.0 | 100.0 | 100.0 |
The majority of Pacific Island Polynesian dwellings were rented (10 773 or 60.3 percent), the proportion being higher than that for both Maori dwellings (50.1 percent) and other dwellings (23.1 percent). In comparison, 38.9 percent (6951) of Pacific Island Polynesian dwellings were owned (with or without a mortgage) compared with 45.3 percent of Maori dwellings and 73.6 percent of the remaining dwellings.
Households—The following table shows that both Pacific Island Polynesian and New Zealand Maori households had lower proportions of households as “one family complete” than did the remainder of the population.
Nearly a third of Pacific Island Polynesian households (5658 or 31.3 percent) were “other family households” (i.e. multi-family or families plus other persons). For Maoris, 24.1 percent were “other family households” while the proportion for all other households was only 8.1 percent.
For the Pacific Island Polynesian population some 75.8 percent of these “other family households” consisted of one family plus other persons while the remaining 24.2 percent were “multi-family households”.
Only 6.1 percent of Polynesian households were one person households compared to 8.9 percent of Maori and 19.3 percent of all other households.
| Household Type | Proportion of Households | Average Number of Members Per Household | ||||
|---|---|---|---|---|---|---|
| Pacific Is. Polynesian | N.Z. Maori | European*and Other | Pacific Is. Polynesian | N.Z. Maori | European*and Other | |
* Total permanent, private dwellings excluding those classified as Pacific Island Polynesian and New Zealand Maori. †Households of which total occupants consist of members of one family (husband, wife, unmarried children), but with one or more members absent on Census night. | ||||||
| Percent | Percent | |||||
| One family complete | 46.4 | 45.5 | 56.2 | 4.6 | 4.3 | 3.3 |
| One family incomplete† | 10.6 | 15.7 | 10.2 | 3.8 | 3.7 | 3.0 |
| Other family: | ||||||
| One family plus other persons | 23.7 | 18.2 | 6.8 | 5.8 | 5.4 | 4.4 |
| Multi-family | 7.6 | 5.9 | 1.3 | 8.3 | 7.7 | 5.8 |
| Total, other family | 31.3 | 241 | 8.1 | 6.4 | 6.0 | 4.6 |
| Non-family | 5.6 | 5.8 | 6.1 | 2.6 | 2.5 | 2.4 |
| One person | 6.1 | 8.9 | 19.3 | 1.0 | 1.0 | 1.0 |
| Total, Households | 100.0 | 100.0 | 100.0 | 4.7 | 4.2 | 2.9 |
FURTHER INFORMATION—For further information relating to the Pacific Island Polynesian population on education, housing and community services programmes refer to Section 3B. Immigration regulations and the Citizenship (Western Samoa) Act 1982 are contained in Section 3D.
EXTERNAL MIGRATION—During the years 1978 to 1981 there was a significant increase in the numbers of New Zealand residents going overseas, seeking better employment opportunities, on business or pleasure trips, and on working holidays. The 1982 and 1983 years have, however, seen a decrease in departures of New Zealanders, particularly in the permanent and long-term category.
Total migration figures (excluding only movements of armed forces) are shown in the following table for the most recently available 5 years. (A later year is included in the Latest Statistical Information Section at the back of this Yearbook). “Long-term”, as used here, indicates arrivals or departures for an intended stay of 12 months or more. Conversely, “short-term” refers to less than 12 months.
Through passengers, not included in the “All Passengers” totals, are persons who arrive in New Zealand but do not pass through immigration controls and do not complete arrival declarations. Also described as transit passengers, they normally depart on the same flight or vessel within a few hours of arriving in New Zealand.
| ARRIVALS IN NEW ZEALAND | |||||||
|---|---|---|---|---|---|---|---|
| Year Ended 31 March | Long-term (Including Permanent) Arrivals | Short-term Movements | All Passenger Arrivals | Through Passengers | Crews | Total Arrivals | |
| N.Z. Residents Returning | Temporary Visitors Arriving | ||||||
| 1979 | 40,808 | 346,324 | 418,744 | 805,876 | 176,586 | 172,825 | 1,155,287 |
| 1980 | 41,607 | 439,137 | 445,195 | 925,939 | 176,822 | 175,810 | 1,278,571 |
| 1981 | 44,965 | 462,006 | 463,456 | 970,427 | 138,378 | 170,961 | 1,279,766 |
| 1982 | 45,292 | 428,414 | 472,581 | 946,287 | 129,866 | 164,047 | 1,240,200 |
| 1983 | 45,854 | 381,951 | 487,658 | 915,463 | 161,416 | 167,074 | 1,243,953 |
| DEPARTURES FROM NEW ZEALAND | |||||||
|---|---|---|---|---|---|---|---|
| Year Ended 31 March | Long-term (Including Permanent) Departures | Short-term Movements | All Passenger Departures | Through Passengers | Crews | Total Departures | |
| N.Z. Residents Departing | Temporary Visitors Departing | ||||||
| 1979 | 81,008 | 343,764 | 407,648 | 832,420 | 176,586 | 173,187 | 1,182,193 |
| 1980 | 76,024 | 426,805 | 444,424 | 947,253 | 176,822 | 176,795 | 1,300,870 |
| 1981 | 69,790 | 451,300 | 465,546 | 986,636 | 138,378 | 170,080 | 1,295,094 |
| 1982 | 56,774 | 419,458 | 474,798 | 951,030 | 129,866 | 164,486 | 1,245,382 |
| 1983 | 42,674 | 373,193 | 484,154 | 900,021 | 161,416 | 166,664 | 1,228,101 |
A summary by sex of arrivals and departures during the latest 5 years is given in the following table. Crews, through passengers, and armed forces personnel on military exercises have not been taken into account in this table.
| Year Ended 31 March | Arrivals | Departures | Excess of Arrivals Over Departures* | ||||
|---|---|---|---|---|---|---|---|
| Males | Females | Total | Males | Females | Total | ||
| * A minus sign denotes an excess of departures over arrivals. | |||||||
| 1979 | 424,848 | 381,028 | 805,876 | 438,504 | 393,916 | 832,420 | −26 544 |
| 1980 | 484,986 | 440,953 | 925,939 | 495,131 | 452,122 | 947,253 | −21 314 |
| 1981 | 513,469 | 456,958 | 970,427 | 520,370 | 466,266 | 986,636 | −16 209 |
| 1982 | 500,946 | 445,341 | 946,287 | 502,856 | 448,174 | 951,030 | −4 743 |
| 1983 | 486,896 | 428,567 | 915,463 | 478,186 | 421,835 | 900,021 | 15,442 |
From 1968 to 1970 there was an alteration in the net migration flow. This is illustrated in the following graph which covers all passenger migration, excluding through passengers and crews. The excess of departures over arrivals recorded during the March years 1967–68 to 1969–70 was a migration feature which has not occurred since the depression of the 1930s. Although this period was followed by 6 years of migration gains, the March years 1976–77 to 1981–82 recorded substantial annual losses, totalling an excess of 107 236 departures over arrivals. However, the 1982–83 year has shown a reversal of this trend, recording an excess of 15 442 arrivals.
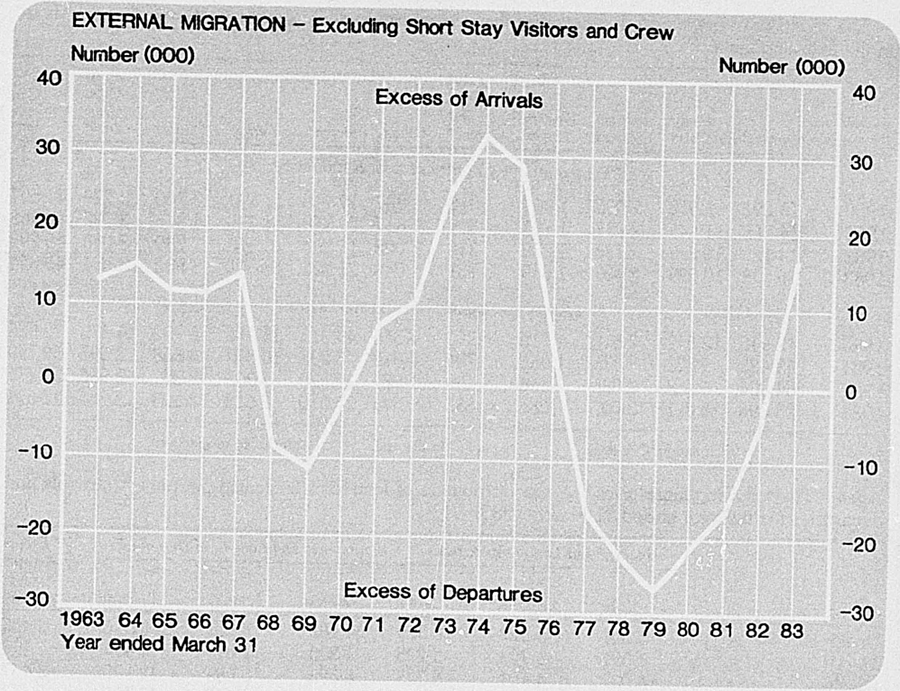
Long-term Migration—The following table gives an analysis of long-term (including permanent) arrivals and departures for March years. (Short-term migration is analysed in Section 9, Travel and Tourism.) In the year ended March 1983 there was a net gain of 3180 from permanent and long-term migration. The main area of change was in the number of departures, which decreased by 14 100 or 24.8 percent.
| Year Ended 31 March | Long-term (Including Permanent) Arrivals | Long-term (Including Permanent) Departures | ||||||
|---|---|---|---|---|---|---|---|---|
| Permanent Arrivals | Long-term | Permanent and Long-term Arrivals (Immigrants) | Permanent Departures of New Zealand Residents | Long-term | Permanent and Long-term Departures (Emigrants) | |||
| N.Z. Residents Returning* | Long-term Visitors* | N.Z. Residents Depart'g* | Long-term Visitors Depart'g* | |||||
| * Arrivals: after absence of, or Intending to stay, 12 months or more. Departures: persons intending to stay away for, or after stay in New Zealand of, 12 months or more. | ||||||||
| 1979 | 9,960 | 22,328 | 8,520 | 40,808 | 19,680 | 52,952 | 8,376 | 81,008 |
| 1980 | 10,769 | 23,561 | 7,277 | 41,607 | 23,875 | 46,162 | 5,987 | 76,024 |
| 1981 | 12,528 | 25,774 | 6,663 | 44,965 | 25,536 | 39,198 | 5,056 | 69,790 |
| 1982 | 12,312 | 26,830 | 6,150 | 45,292 | 19,719 | 33,050 | 4,005 | 56,774 |
| 1983 | 12,595 | 27,105 | 6,154 | 45,854 | 12,314 | 26,197 | 4,163 | 42,674 |
The countries of origin and destination of these long-term (including permanent) migrants are shown in the following table.
| Year Ended 31 March | Australia* | United Kingdom† | United States | Western Samoa* | Cook Islands and Niue* | Canada | Oceania | Europe | Asia | All Other Countries‡ | Total |
|---|---|---|---|---|---|---|---|---|---|---|---|
* Included in Oceania. †Included in Europe. ‡Includes unspecified. | |||||||||||
| Immigrants by Country of Last Residence | |||||||||||
| 1980 | 13,292 | 9,912 | 2,005 | 1,007 | 1,018 | 807 | 19,716 | 11,890 | 3,960 | 3,229 | 41,607 |
| 1981 | 14,065 | 11,445 | 2,087 | 1,191 | 859 | 817 | 20,360 | 14,091 | 4,878 | 2,732 | 44,965 |
| 1982 | 14,120 | 12,290 | 2,138 | 1,038 | 818 | 1,002 | 19,963 | 15,370 | 3,739 | 3,080 | 45,292 |
| 1983 | 16,078 | 10,599 | 2,407 | 1,069 | 731 | 1,048 | 21,322 | 13,641 | 3,582 | 3,854 | 45,854 |
| Emigrants by Country of Next Residence | |||||||||||
| 1980 | 42,910 | 13,549 | 2,517 | 1,015 | 720 | 1,345 | 49,315 | 15,416 | 2,952 | 4,479 | 76,024 |
| 1981 | 42,483 | 9,323 | 2,373 | 1,055 | 704 | 1,312 | 48,292 | 10,848 | 3,368 | 3,597 | 69,790 |
| 1982 | 34,934 | 6,688 | 2,085 | 864 | 499 | 1,081 | 39,970 | 7,903 | 2,801 | 2,934 | 56,774 |
| 1983 | 23,096 | 6311 | 2,007 | 685 | 583 | 671 | 27,010 | 7,613 | 2,609 | 2,764 | 42,674 |
Ages—The following table gives the age distribution of long-term (including permanent) arrivals and departures for the year ended 31 March 1983.
| Age, in Years | Permanent and Long-term Arrivals | Permanent and Long-term Departures | Excess of Arrivals Over Departures* | ||||
|---|---|---|---|---|---|---|---|
| Males | Females | Total | Males | Females | Total | ||
| * A minus sign denotes an excess of departures over arrivals. | |||||||
| Under 15 | 5,301 | 5,028 | 10,329 | 4,103 | 3,911 | 8,014 | 2,315 |
| 15–19 | 1,591 | 1,704 | 3,295 | 1,875 | 2,619 | 4,494 | −1 199 |
| 20–24 | 4,032 | 4,691 | 8,723 | 6,095 | 6,095 | 12,190 | −3 467 |
| 25–44 | 10,602 | 8,918 | 19,520 | 7,985 | 6,402 | 14,387 | 5,133 |
| 45 and over | 2,032 | 1,955 | 3,987 | 1,785 | 1,804 | 3,589 | 398 |
| Total | 23 558 | 22 296 | 45 854 | 21 843 | 20 831 | 42 674 | 3 180 |
Occupations—The following table shows permanent and long-term arrivals and departures during the year ended 31 March 1983 by occupation major groups and by those occupations or groups of occupations which were the main contributors to the movement within each major group.
| Occupation | Permanent and Long-term Migrants | ||
|---|---|---|---|
| Arrivals | Departures | Net Gain or Loss | |
| * Protective service workers include fire fighters, policemen, detectives, security officers, night watchmen, etc. | |||
| Professional, technical, and related workers— | |||
| Architects, engineers, and related technicians | 1,181 | 957 | 224 |
| Medical, dental, veterinary, and related workers | 2,127 | 2,236 | −109 |
| Teachers | 1,664 | 1,331 | 333 |
| Accountants | 421 | 399 | 22 |
| Workers in religion | 326 | 273 | 53 |
| Other | 2,189 | 2,186 | 3 |
| Total | 7 908 | 7 382 | 526 |
| Administrative and managerial workers— | |||
| Managers | 899 | 941 | −42 |
| Other | 62 | 59 | 3 |
| Total | 961 | 1 000 | –39 |
| Clerical and related workers— | |||
| Stenographers, typists, and card and tape punching machine operators | 1,323 | 1,239 | 84 |
| Computing machine operators | 243 | 322 | −79 |
| Other | 2,326 | 3,210 | −884 |
| Total | 3 892 | 4 771 | –879 |
| Sales workers— | |||
| Salespeople, shop assistants, and related workers | 709 | 892 | −183 |
| Other | 642 | 771 | −129 |
| Total | 1 351 | 1 663 | –312 |
| Service workers— | |||
| Cooks, waiters and waitresses, bartenders, and related workers | 776 | 869 | −93 |
| Protective service workers* | 289 | 357 | −68 |
| Other | 743 | 910 | −167 |
| Total | 1 808 | 2 136 | –328 |
| Agricultural, animal husbandry and forestry workers, fishermen, and hunters— | |||
| Farmers | 435 | 359 | 76 |
| Agricultural and animal husbandry workers | 397 | 553 | −156 |
| Other | 215 | 227 | −12 |
| Total | 1 047 | 1 139 | –92 |
| Production and related workers, transport equipment operators, and labourers— | |||
| Food and beverage processors | 303 | 550 | −247 |
| Tailors, dressmakers, sewers, and related workers | 247 | 347 | −100 |
| Machinery fitters, machine assemblers, and precision instrument makers (except electrical) | 1,428 | 1,289 | 139 |
| Electrical fitters and related electrical and electronics workers | 533 | 580 | −47 |
| Plumbers, welders, sheet-metal and structural metal preparers and erectors | 654 | 555 | 99 |
| Printers and related workers | 216 | 278 | −62 |
| Painters | 268 | 303 | −35 |
| Bricklayers, carpenters, and other construction workers | 1,191 | 878 | 313 |
| Material-handling and related equipment operators, dockers, and freight handlers | 382 | 434 | −52 |
| Transport equipment operators | 566 | 590 | −24 |
| Labourers, not elsewhere classified | 974 | 1,166 | −192 |
| Other | 968 | 1,147 | −179 |
| Total | 7 730 | 8 117 | –387 |
| Occupations unidentifiable or inadequately described | 1 305 | 1 085 | 220 |
| Total, actively engaged | 26 002 | 27 293 | –1 291 |
| Not actively engaged | 19 852 | 15 381 | 4 471 |
| Total arrivals and departures | 45 854 | 42 674 | 3 180 |
Origin—The following table shows for the latest 3 years the birthplaces of long-term (including permanent) migrants.
| Country of Birth | Immigrants* | Emigrants† | ||||
|---|---|---|---|---|---|---|
| 1980–81 | 1981–82 | 1982–83 | 1980–81 | 1981–82 | 1982–83 | |
* Persons arriving in New Zealand for a period of 12 months or more (including permanent arrivals), plus New Zealand residents returning after an absence of 12 months or more. †New Zealand residents departing for a period of 12 months or more (including permanent departures), plus overseas visitors departing from New Zealand after a stay of 12 months or more. | ||||||
| North America | 1 553 | 1 506 | 1 774 | 1 326 | 1 101 | 1 079 |
| Canada | 444 | 452 | 504 | 419 | 378 | 244 |
| United States | 1,055 | 1,008 | 1,217 | 864 | 679 | 789 |
| South America | 88 | 84 | 95 | 119 | 89 | 66 |
| Europe | 9 736 | 11 346 | 10 733 | 9 065 | 6 584 | 5 326 |
| Netherlands | 1,180 | 1,471 | 1,409 | 444 | 366 | 401 |
| United Kingdom | 7,373 | 8,609 | 7,897 | 7,550 | 5,262 | 4,184 |
| Asia | 3 699 | 2 693 | 2 435 | 1 679 | 1 507 | 1 374 |
| Malaysia | 476 | 510 | 446 | 562 | 497 | 388 |
| Africa | 463 | 433 | 495 | 482 | 340 | 252 |
| Oceania | 29 382 | 29 202 | 30 284 | 57 100 | 47 123 | 34 563 |
| Australia | 4,013 | 3,557 | 4,002 | 3,716 | 2,945 | 2,212 |
| Cook Islands and Niue | 758 | 696 | 707 | 595 | 486 | 441 |
| Fiji | 569 | 524 | 505 | 418 | 322 | 297 |
| New Zealand | 22,143 | 22,462 | 23,087 | 50,657 | 41,994 | 30,628 |
| Other Countries | 44 | 23 | 38 | 19 | 30 | 14 |
| Total | 44 965 | 45 292 | 45 854 | 69 790 | 56 774 | 42 674 |
IMMIGRATION POLICY—New Zealand's immigration policy is designed to encourage the entry of skilled labour into New Zealand, and to protect domestic employment opportunities for New Zealand citizens and residents who have the right to reside here permanently. At the same time, considerable emphasis is placed on humanitarian considerations such as the reunification of families, and the provision of settlement opportunities for refugees.
Further information may be obtained from the nearest New Zealand overseas representative, from district offices of the Department of Labour, or by writing to the Secretary of Labour, Department of Labour, Private Bag, Wellington.
CITIZENSHIP—The current basic legislation of New Zealand citizenship is the Citizenship Act 1977, and the Citizenship (Western Samoa) Act 1982, which are administered by the Department of Internal Affairs. Prior to the 1977 Act, the relevant legislation was the British Nationality and New Zealand Citizenship Act 1948.
Citizenship Act 1977—Under the Citizenship Act 1977, New Zealand citizenship may be acquired in the following ways:
by birth in New Zealand;
by descent (i.e., birth outside New Zealand);
by grant of citizenship.
Those persons who were citizens under the 1948 Act (whether by birth, descent, naturalisation, registration or under transitional provisions) at 31 December 1977, retain their status under the 1977 Act. The 1977 Act also introduced citizenship by descent through the female line, and citizenship by adoption.
To be eligible for a grant of New Zealand citizenship, a person (other than the spouse of a New Zealand citizen; or a person under 18 years of age) must:
have resided in New Zealand for the 3 years immediately preceding the date of application;
be entitled in the terms of the Immigration Act 1964 to reside in New Zealand permanently;
be of full capacity;
be of good character;
have sufficient knowledge of the English language and of the responsibilities and privileges attaching to New Zealand citizenship;
intend to continue to reside in New Zealand or to enter or continue Crown service under the New Zealand Government, or service in the employment of a person, company, society, or other body of persons resident or established in New Zealand.
Citizenship (Western Samoa) Act 1982—This Act provides primarily for the grant of citizenship to any person who—
can establish that he/she is a Western Samoan citizen or that he/she comes within the specified degrees of association with Western Samoa; and who either
was in New Zealand at any time on 14 September 1982; or
lawfully entered New Zealand on or after 15 September 1982 and is entitled to reside in New Zealand permanently in terms of the Immigration Act 1964.
Under the 1977 and 1982 Acts, adults who acquired New Zealand citizenship by grant may be asked to swear allegiance to the Queen of New Zealand. Commonwealth citizens (British subjects) whose country recognises Queen Elizabeth II as Head of State are asked to take the oath on the application form. Other persons holding citizenship of a country which does not give this recognition are conditionally approved as New Zealand citizens, and are required to swear allegiance at a private or public ceremony to make the grant effective. Apart from this one differentiation, the 1977 Act treats aliens (non-British subjects) on exactly the same basis as British subjects. The requirement that aliens be registered was abolished on the introduction of this Act.
New Zealand citizens may be deprived of New Zealand citizenship if they voluntarily acquire a foreign nationality by any formal act other than by marriage, and have acted in a manner that is contrary to the interests of New Zealand, or voluntarily exercise any of the privileges or perform any of the duties of another nationality or citizenship in a manner that is contrary to the interests of New Zealand. Citizenship obtained by fraud, false representation, mistake, or wilful concealment of relevant information may be withdrawn. Under certain conditions New Zealand citizenship may also be validly renounced.
There was a marked increase in applications for citizenship during the year ended 31 March 1983. Applications received totalled 13 728 compared with 12 396 during the previous year, and 13 458 persons were granted citizenship.
Permanent Entry on Occupational Grounds—The New Zealand Government periodically determines the occupational skills in demand in New Zealand which warrant recruitment from overseas. A list of these skills, called the Occupational Priority List (OPL), is published by the Department of Labour to assist employers who are unable to fill job vacancies from within New Zealand.
Another measure adopted to assist employers is the Immigration Placement Service (IPS), which operates through the Migration Branch of the New Zealand High Commission in London and the Employment and Vocational Guidance Service of the Department of Labour. This service provides employers with information on suitably qualified prospective migrants in the United Kingdom.
In general, applicants for permanent entry on occupational grounds must be between the ages of 18 and 45 years, of sound mental and physical health and of good character, and, if married, have no more than 4 dependent children. Accommodation and employment are usually required to be prearranged.
In certain skilled occupations where there is a known shortage in New Zealand, the New Zealand Government has relaxed the criteria for entry by waiving the requirement of employment and accommodation guarantees. This applies to suitable applicants from selected countries, who are single or married couples without children. There is also provision for the entry of business people and entrepreneurs who can bring both skills and capital which the Government considers will benefit New Zealand, for example, by creating additional employment opportunities or by generating new exports.
Applications are occasionally received from persons who have distinguished themselves in the arts or sciences, or in public or cultural life overseas, and who wish to settle in New Zealand. Although they could make a major contribution to New Zealand life, most of them do not qualify in terms of normal occupational criteria. In the same way, applications are sometimes received from persons who, although outside normal criteria, have been actively involved in promoting or protecting New Zealand's interests overseas. The Minister of Immigration may approve such applications in appropriate cases.
Family Reunification—The policy on family reunification provides for the entry of relatives who are spouses and/or dependent children of New Zealand citizens or permanent residents; parents of New Zealand citizens or permanent residents if they have no children living in their own country; brothers, sisters, and children of New Zealand citizens or permanent residents if they are single without dependants, and alone in their country of residence. Other cases where there are special circumstances such as a high degree of financial or emotional dependence on the New Zealand citizen or permanent resident may also be considered.
Western Samoa—Within the South Pacific region, immigrants from Western Samoa constitute by far the largest group entering New Zealand for permanent settlement, under a special quota arrangement instituted in 1962. Up to 1100 Western Samoan citizens may be accepted for permanent entry each year, over and above those who qualify under the family reunification provisions of the immigration policy. Applicants who seek entry under the quota are required to meet normal requirements in relation to age, family size, health, character, and accommodation, and to be in possession of a guarantee of employment in any occupation, prior to entry.
As a result of the passing of the Citizenship (Western Samoa) Act 1982 by the New Zealand Parliament in September 1982, many Western Samoan citizens who were in New Zealand at that time became eligible to apply to the Department of Internal Affairs for New Zealand citizenship. Applications from Western Samoan citizens for permanent residence in New Zealand continue to be considered in accordance with the policies outlined above.
The Netherlands—Under the terms of a migration agreement between the Netherlands and New Zealand, an annual quota of immigrants from the Netherlands is accepted. Migrants accepted under this arrangement are required to meet normal criteria with respect to age, family size, health and character, and the Netherlands Emigration Service guarantees to place such migrants in employment and accommodation after arrival.
Refugees—The admission and resettlement of refugees who come within the mandate of the United Nations High Commissioner for Refugees (UNHCR) has been an important priority of the New Zealand Government. Refugees have been accepted in New Zealand since 1944 from Europe, Asia, South America, and Uganda. When selecting refugees emphasis is placed on the humanitarian circumstances of each case. The selection criteria may vary for different refugee situations but it is considered in the best interests of the refugees themselves that those selected can be expected to adapt quickly to New Zealand conditions. Account is also taken of any previous association with New Zealand, and of links with friends or relatives living in New Zealand.
Where refugees arrive in large groups (e.g., as in the Indo-Chinese Refugee Programme) the Government provides special assistance in the form of group orientation programmes for up to 6 weeks after arrival. During that period the refugees are accommodated in the Mangere Reception Centre and costs are met by various Government departments including the Department of Social Welfare, which pays a special emergency benefit to meet living expenses until the breadwinner begins working. Medical and dental checks are provided by the Department of Health, and the Department of Education organises general orientation and familiarisation courses (covering aspects of daily living in New Zealand) and instruction in the English language. After completing the orientation programme the refugee settlers are moved to their final destinations where they are helped by their sponsors and, where possible, by other persons from their country of origin, to overcome their early resettlement problems in a local community.
Resettlement committees at each of the district offices of the Department of Labour assist refugee sponsors at the local level with employment and any other problems that the refugees may face, as well as following up each local group's progress.
Current policy establishes quotas of refugees who may be accepted for entry, and the quotas are kept under review. Quotas approved in the continuing programme of acceptance of East European, Russian, Jewish, and handicapped refugees provide for the entry of 90 families. The New Zealand Government agreed to the entry of up to 650 Indo-Chinese refugees for resettlement in New Zealand between 1 July 1983 and 30 June 1984. Priority was given to those refugees with immediate family already resident in New Zealand. Once established in New Zealand, refugee settlers may sponsor the entry of relatives to New Zealand for family reunification under normal family reunification policy. During 1983, 626 Indo-Chinese refugees arrived for resettlement bringing the total number of Indo-Chinese refugee settlers in New Zealand to 5305 at the end of 1983.
In November 1982 the Government agreed to resettle a third group of 100 Polish refugees in New Zealand. By 31 March 1983, 292 Polish refugees had been resettled in New Zealand. When these migrants were selected, account was taken of their occupational skills and links with New Zealand. The East European quota is expected to cater for any future applications from Polish refugees.
Interdepartmental Committee on Resettlement—The Interdepartmental Committee on Resettlement (ICR), in consultation with other Government agencies and non-Government bodies, reviews the facilities available to assist new migrants, and as appropriate develops proposals to satisfy the reasonable requirements of new migrants.
Resettlement Unit—As a part of the Immigration Division of the Department of Labour, the Resettlement Unit's role is to assess the range of settlement services available to new settlers and working visitors, and to make recommendations to Government agencies, the ICR and other interested bodies. Work undertaken by the Resettlement Unit this year has been aimed at fostering a better understanding in New Zealand of the difficulties faced by migrants and working visitors, encouraging recognition of the value of the contribution that new settlers make to New Zealand society, and suggesting ways in which these settlers may be assisted to take their place in the community. The Unit has focussed its attention on the information needs of migrants, and ways in which they can be better informed about New Zealand and the services available to them in New Zealand.
Temporary Entry—Entry permits for people wishing to visit New Zealand on a temporary basis are generally issued for varying periods of up to 6 months, though further extensions may be granted to bona fide tourists and other visitors to allow a total stay of up to 12 months. Visitors who wish to work while in New Zealand, whether for a New Zealand employer or on behalf of an overseas company, must apply for a temporary work permit; otherwise visitors are prohibited from working here. This requirement does not, however, affect Australian citizens who wish to work while in New Zealand, nor does it affect persons born in the Cook Islands, Niue, or Tokelau, who are New Zealand citizens and therefore have unrestricted right of entry into this country.
South Pacific Work Permit Schemes—New Zealand has special work permit schemes in operation for citizens of Tonga, Fiji, and Western Samoa. Under these schemes, agreed upon after negotiations with the respective governments, workers may undertake employment in response to specific job offers from New Zealand employers. Employers are required to make financial and other commitments to ensure the welfare of Island workers while they are in New Zealand, and the Department of Labour checks that the conditions of employment offered are acceptable and that the accommodation provided is of a suitable standard. The maximum period of employment is 11 months.
From time to time New Zealand makes special arrangements on an ad hoc basis with other Pacific countries to provide employment opportunities as local conditions permit.
Student Entry—Entry may be granted to overseas students to undertake approved courses of study, provided they make prior application and meet a number of requirements (including producing evidence of the availability of the necessary funds). The primary aim in permitting students from other countries to study in New Zealand is to train them to a stage where they can be of value in the development programmes of their own countries. For this reason, students from developing nations have preference.
Entry Permits—Except for New Zealand citizens and certain other categories of travellers listed below under “Special Arrangements” and “Trans-Tasman Travellers”, all persons entering New Zealand are required to obtain entry permits under the Immigration Act 1964. All persons intending permanent residence in New Zealand should seek prior approval before setting out on their journey. This may be done by writing to the nearest overseas representative of the New Zealand Government or to the Secretary of Labour, Private Bag, Wellington, New Zealand for the necessary application forms. Visitors to New Zealand from a number of countries may not require visas or prior entry authority, provided the purpose of entry is for tourism or to visit family and friends. Further details are available from the nearest overseas representative of New Zealand.
Departure from New Zealand—All persons leaving New Zealand must have a valid travel document (except for short visits by New Zealand citizens to Rarotonga and direct return). As from 1 July 1981 New Zealand citizens were required to have a passport to enter Australia. This greatly affected the number of passports issued as noted below. New Zealand citizens do not require a visa to enter Australia.
Passports—All persons who arrive in New Zealand, except New Zealand citizens travelling direct from Australia and certain other trans-Tasman travellers listed below, may be required to produce a valid passport or some other acceptable and recognised travel document. Authority for the issue of passports in New Zealand and by New Zealand representatives overseas is contained in the Passports Act 1980.
New Zealand passports are issued and renewed within New Zealand by the Department of Internal Affairs at Wellington, Auckland, Rotorua, Christchurch, and Dunedin, at Rarotonga and Niue by the New Zealand Representatives, and overseas by the representatives of New Zealand at Apia, Athens, Baghdad, Bahrain, Bangkok, Bonn, Brussels, Canberra, Geneva, The Hague, Hong Kong, Honiara, Jakarta, Kuala Lumpur, Lima, London, Los Angeles, Manila, Melbourne, Mexico City, Moscow, New York, Noumea, Nuku'alofa, Ottawa, Paris, Peking, Port Moresby, Rome, San Francisco, Santiago (Chile), Seoul, Singapore, Suva, Sydney, Tehran, Tokyo, Vancouver, Vienna, and Washington.
United Kingdom, Canadian, Australian, Malaysian, Singapore, Fijian, Western Samoan, and Indian passports are issued and renewed in New Zealand by the respective High Commissioners for those countries.
During the year ended 31 March 1983 there were 173 950 New Zealand passports issued, compared with 242 441 during the previous year.
Special Arrangements for Australian Citizens—Australian citizens are exempt from New Zealand entry permit requirements (but not from other provisions of the Immigration Act). They are not required to produce a passport on arrival in New Zealand if they have travelled direct from Australia.
Trans-Tasman Travellers—British Commonwealth citizens and citizens of the Republic of Ireland who have been granted permission to reside indefinitely without restriction in Australia, providing they have travelled direct from Australia to New Zealand, are not required to obtain a prior entry authority or to produce a passport on arrival. They may, however, be asked to produce some evidence of their entitlement to the exemption. These travellers are not exempted from other provisions of the Immigration Act.
Prohibited Immigrants—The following categories of persons are prohibited from entry to New Zealand whether for permanent or temporary entry:
Mentally disordered persons, or people suffering from tuberculosis, leprosy, or syphilis;
Persons who have been convicted of an offence and sentenced to a term of imprisonment or other form of detention for 1 year or more or to any form of indeterminate detention for which they may be detained for a period of 1 year or more;
Persons who have been deported from New Zealand (except for a certain class of ship deserter), or deported from any other country. Those within any of the above categories who enter New Zealand without first obtaining special permission to do so commit an offence under the Immigration Act 1964.
Re-entry—Persons who have the status of permanent residents lose their residential status when they travel out of the country, unless they have first obtained a re-entry authority. Multiple re-entry authorities are valid for a period of up to four years and entitle the holder to leave and return to New Zealand on any number of occasions while the authority remains valid. Application for a re-entry authority may be lodged at any district office of the Department of Labour before departure.
Remaining in New Zealand Without a Permit—Persons who remain in New Zealand beyond the validity of a temporary permit are committing an offence against the Immigration Act and, if convicted, are liable to be deported.
Deportation—The Immigration Act 1964 makes provision for the deportation of persons in four main categories: persons convicted of certain offences against the Immigration Act; permanent residents who are convicted within specified periods of their arrival in New Zealand of an offence for which the Court has the power to impose imprisonment; those who have engaged in, or who belong to organisations which have engaged in, acts of terrorism; and any person who the Minister of Immigration has certified constitutes a threat to national security.
Appeals Against Deportation—Persons who have been convicted of offences against the Immigration Act may appeal in writing to the Minister of Immigration against deportation on the grounds that it would be unduly harsh or unjust to deport them. In addition, a Deportation Review Tribunal is empowered to hear appeals on humanitarian grounds from permanent residents against deportation orders following convictions for criminal offences.
In the past 30 years there has been a marked change in the social and economic factors which affect traditional roles in the community. These factors include changes in the structure of the population, in the family cycle and its composition, and employment opportunities available for both men and women.
This process of social and economic change is characteristic of industrialised nations in particular. It has led to increasing attention to the role and status of women, including the commitment of the international community to the United Nations Decade for Women 1975–85, and the recommendation of the United Nations Convention on the Elimination of All Forms of Discrimination against Women (1981).
It is in this context, that the following government bodies have been established. Their role is to promote and advise the Government of the day on particular issues relating to the achievement of equal opportunities for women, and their full integration into all aspects of national life.
National Advisory Council on the Employment of Women (NACEW)—The increase in the numbers and proportion of women in the paid workforce in the fifties and sixties, led employers, unions, and women themselves, to recognise that wages and conditions of employment for women required attention. Legislation (both protective and restrictive), regulations and practices prevented women from enjoying equal opportunity in the workplace. In response to this concern, the National Advisory Council on the Employment of Women (NACEW) was established in 1967.
The council was charged with the responsibility of advising the Minister of Labour on all matters relating to the employment of women in New Zealand for example: equal pay, part-time work, child care, parental leave, and positive action to promote equal opportunity for women in the workforce. It also has responsibility for promoting a greater public awareness and understanding of all aspects of women's employment.
The NACEW is composed of a chairperson and 12 other members. The Chair and 6 council members are appointed by the Minister of Labour for their knowledge and experience in women's employment matters. The remaining 6 members represent employer and employee organisations in the private and state sectors, and the Departments of Labour and Education.
Committee on Women—The Committee on Women had its origins in a National Development Council subcommittee established in 1969 and convened by Mrs (now Dame) Miriam Deli, and a paper produced by that subcommittee on “The Role of Women in National Development” in 1970.
In 1974 the NDC subcommittee was raised to full sector council status and its membership, under the Chair of Miriam Dell, was expanded from 3 to 5. At this time it was responsible to the Prime Minister and serviced through the Cabinet Office.
The committee was given responsibility for the implementation of International Women's Year (1975) and established a working party to organise the year's activities. One such activity was an evaluation of the Report of the Parliamentary Select Committee on Women's Rights which had been published in June 1975.
In 1976 the Committee on Women was expanded to a total membership of 12. Miriam Dell was appointed as Chair, and the 11 additional members were appointed as individuals, with the exception of an ex officio representative of the National Advisory Council on the Employment of Women.
Responsibility for the Committee on Women was returned to the Minister for National Development, and the committee was charged with the following tasks:
to promote the objectives of the World Plan of action for IWY and the UN Decade for Women;
to assess New Zealand's progress towards achievement of these objectives;
to advise the Government through the Minister for National Development on these and all other matters affecting women in New Zealand.
These tasks were expanded in 1978 to include administration of a special project fund of $25,000 per annum, set up to provide assistance for projects of benefit to women, e.g., the establishment of women's centres, production of resources, exhibitions, training courses and cultural activities.
In 1979, responsibility for the Committee on Women passed to the Minister of Justice, the Hon. J. K. McLay, who was appointed to the newly-created Cabinet position of Government Spokesman on Women's Affairs. In 1981 the committee was restructured as the Advisory Committee on Women's Affairs and given expanded terms of reference (see ACWA below).
Advisory Committee on Women's Affairs (ACWA)—In September 1981 the Committee on Women was reconstructed and became the Advisory Committee on Women's Affairs to the Government on matters affecting women. Members are appointed by the Government, not as representatives of any particular organisations or special interests, but as individuals who are familiar with a wide range of issues affecting women. ACWA currently has 7 members, including the Chair.
The ACWA's terms of reference are:
to evaluate government policies on the basis of the identified needs of women in New Zealand;
to generate appropriate policies on the basis of the identified needs of women in New Zealand;
to promote the co-ordination of activities, programmes and policies of all agencies relevant to the concerns of women.
In addition to these, ACWA has continued with activities originally undertaken by the Committee on Women, such as administration of the Project Fund (which remains at $25,000), production of a news sheet, promotion of the UN Decade for Women, and maintenance of the women's resources library.
It also houses end provides administrative assistance for the Women's Appointment File (WAF), which is a curriculum vitae resource of over 600 women who are willing and available to serve on government boards and committees.
The WAF was set up in 1979 and aims to counteract the imbalance of men and women in public office, and to encourage greater participation by women in the decision-making process. It is currently managed by a voluntary committee comprising various representatives of voluntary women's organisations.
One of ACWA's most important functions is that of liaison with women and women's groups throughout New Zealand, to ensure that the committee can fairly represent and articulate the views and the needs of New Zealand women to the Government.
To this end, women's groups and individuals are encouraged to maintain close contact with ACWA, and committee members accept a large number of speaking engagements throughout New Zealand. The quarterly news sheet, which outlines ACWA's current activities and reports on national and international items of interest to women, is another medium through which this important liaison is effected.
To enable the committee to deal with its extensive brief, a subcommittee structure has been evolved reflecting the areas of concern to ACWA. It is a flexible structure, and the subcommittees are convened to respond to particular issues and needs as they arise, or are identified. The subcommittees currently in operation are Economic Status, Education, Health, International Statistics, and Violence.
Women's Advisory Committee of the Vocational Training Council (WAC/VTC)—The Women's Advisory Committee of the Vocational Training Council was established in 1975 to advise the council on matters relating to women's training and to act as a catalyst to change the traditional attitudes affecting the vocational training of women and girls. The council, which formerly reported to the Minister of Education, now reports to the Minister of Labour.
Membership of the committee comprises representatives from the Federation of Labour, the Employers Federation, State Services Co-ordinating Committee, the Combined State Unions, the Departments of Education and Labour, the Technical Institute/Community College system, the Polynesian Advisory Committee of the VTC, the National Advisory Council on the Employment of Women, and the Advisory Committee on Women's Affairs. There is also provision for an additional person with experience and knowledge of the special needs of women in relation to training and employment.
The committee is chaired by a Ministerial appointee to the VTC.
Since its establishment, the committee has been directing its efforts towards achieving equality of opportunity for women in the areas of training, and the promotion of non-traditional occupations for women is one of its current major programmes.
National Advisory Committee on Women and Education (NACWE)—The National Advisory Committee on Women and Education replaced an ad hoc committee originally set up to organise the 1975 conference “Education and the Equality of the Sexes” which was jointly sponsored by the Committee on Women and the Department of Education. This ad hoc committee continued in order to monitor the implementation of recommendations from the conference, and its work expanded to the extent that the Minister of Education set up a formal advisory committee in 1979.
The NACWE had 16 members, representative of relevant interest groups, who advised the Minister of Education on matters pertaining to the education of girls and women; the achievement of equality of opportunity and treatment for women in the education service; and ways in which the education system could contribute to equality of the sexes in New Zealand society.
The NACWE was disestablished by the Government in June 1982, and its work programme passed to various sections of the Department of Education. The Chair of NACWE was subsequently appointed to ACWA.
Legislation—The following legislation, either removing legal discriminations against women or directly aimed at assisting women, has been passed since 1970.
Domestic Proceedings Amendment Act 1971—Extended provisions for maintenance orders.
Equal Pay Act 1972—Established the principle of equal pay for equal work without discrimination on the basis of sex.
Social Security Amendment Act 1973—Established the domestic purposes benefit for solo parents.
Accident Compensation Amendment Act 1973—Extended compensation provisions to non- earners.
Matrimonial Property Act 1976—Provided for a more equitable division of property on the dissolution of a marriage.
Domicile Act 1976—Provided that a woman's domicile does not have to follow that of her husband.
Social Security Amendment Act 1977—Introduced national superannuation without discrimination.
Human Rights Commission Act 1977—Prohibited discrimination in such areas as employment, and access to goods and services on the grounds of sex or marital status.
Citizenship Act 1977—Accorded all New Zealand citizens the same rights with respect to the citizenship of spouses and children.
Social Security Amendment Act 1979—Provided for the payment of sickness and unemployment benefits to women and men on an equal basis.
Evidence Amendment Act 1980—Provided some restrictions on the cross-examination or presentation of evidence pertaining to a victim's sexual history.
Family Courts Act 1980—Removed family law to special court with special support services.
Family Proceedings Act 1980—Introduced no fault dissolution of marriage, and revised the law relating to matrimonial and domestic proceedings.
Guardianship Amendment Act 1980—Introduced custodial provisions which ensure that the welfare of the child is paramount and no one person can be preferred as custodial parent on the basis of sex.
Maternity Leave and Employment Protection Act 1980—Guaranteed up to 26 weeks unpaid leave to most women workers expecting a baby or planning to adopt a young child.
Factories and Commercial Premises Amendment Act 1981—Lifted restrictions on women working during night hours.
Domestic Protection Act 1982—Extended protection to the victims of domestic violence in whatever situation this occurs.
Coal Mines Amendment Act 1983—Provided for the repeal of the restriction on employment of women underground. New Zealand is no longer bound by the International Labour Convention 45.
Estate and Gift Duties Amendment Act 1983—Provided for a gift duty exemption where a matrimonial property agreement results in the non-owner spouse receiving half the matrimonial property.
FURTHER INFORMATION—Other publications containing data on population include the following. Department of Statistics bulletins may be obtained from the Department of Statistics, Private Bag, Wellington or, in some cases, Government Bookshops. Most other official publications may be obtained from Government Bookshops in the main centres.
Population and Migration—Department of Statistics (Annual)
Pt. A—Population
Pt. B—External Migration
Vital Statistics—
Department of Statistics (Annual)
Census of Population and Dwellings 1981—Department of Statistics.
Regional Statistics Series
Bulletin 1–10 (Each bulletin gives final population, dwelling, and household statistics on a major area of New Zealand)
Vol. 1—Pt. A—Location and Increase of Population.
Pt. B—Population Density.
Pt. C—Usually Resident Population.
Vol. 2—Ages, Marital Status, and Fertility.
Vol. 3—Religious Professions.
Vol. 4—Labour Force.
Vol. 5—Incomes.
Vol. 6—Education and Training.
Vol. 7—Birthplaces and Ethnic Origin.
Vol. 8A—Maori Population and Dwellings.
8B—Pacific Island Polynesian Population.
Vol. 9—Dwellings.
Vol. 10—Households, and Families.
Vol. 11 —Internal Migration.
1983 Electorate Profiles.
Bulletin on Cigarette Smoking.
Monthly Abstract of Statistics—Department of Statistics.
Demographic Bulletin—Department of Statistics.
New Zealand Population Projections 1983–2016—Department of Statistics.
Pocket Digest of Statistics—Department of Statistics.
Miscellaneous Bulletin Series—Department of Statistics.
No. 1—New Zealand Males and Females—A Statistical Comparison.
No. 7—New Zealand Maori and Non-Maori Populations
No. 10—Family Statistics in New Zealand.
No. 12—New Zealand Children 1979.
Occasional Paper Series—Department of Statistics.
No. 4—New Zealand Rural Profile.
No. 5—An Investigation of Official Ethnic Statistics.
Social Trends in New Zealand—Department of Statistics (1977).
Maps of Statistical Boundaries—Department of Statistics.
Report of the Department of Maori Affairs (Parl. paper E. 13).
Table of Contents
The major components of population growth are natural increase and migration. The varying rate of New Zealand's population growth in recent years has been a result of changes in both components. The balance of migration showed an annual loss during 1976–81, but is now providing net gain to population growth. However the continued fall in the birth rate over the past 2 decades has substantially reduced the natural increase from the excess of births over deaths.
The following table shows the numbers and rates of natural increase for the latest 5 years, and emphasises the relatively high rate for the Maori component of the population.
| Year | Total Population | Maoris | Natural Increase Rates per 1000 Mean Population | |||||
|---|---|---|---|---|---|---|---|---|
| Births | Deaths | Natural Increase | Births | Deaths | Natural Increase | Total | Maori | |
| 1979 | 52,279 | 25,340 | 26,939 | 6,654 | 1,306 | 5,348 | 8.59 | 19.52 |
| 1980 | 50,542 | 26,676 | 23,866 | 6,420 | 1,339 | 5,081 | 7.59 | 18.33 |
| 1981 | 50,794 | 25,150 | 25,644 | 6,605 | 1,290 | 5,315 | 8.12 | 19.00 |
| 1982 | 49,938 | 25,532 | 24,406 | 6,216 | 1,318 | 4,398 | 7.67x | 17.29x |
| 1983 | 50,474 | 25,991 | 24,483 | 6,271 | 1,326 | 4,945 | 7.59 | 17.23 |
In the 5 years to 31 December 1983 New Zealand gained by natural increase of population a total of over 125 000.
COMPARISON WITH OTHER COUNTRIES—An international comparison of birth and natural increase rates for certain countries is made in the following table. The rates, taken from the United Nations Monthly Bulletin of Statistics, are for 1982.
| Country | Rate per 1000 of Population | ||
|---|---|---|---|
| Births | Deaths | Natural Increase | |
| * As at 1981. | |||
| United States | 16.0 | 8.6 | 7.4 |
| Australia* | 15.8 | 7.3 | 8.5 |
| New Zealand | 15.7 | 8.0 | 7.7 |
| Canada | 15.1 | 6.9 | 8.2 |
| France* | 14.9 | 10.3 | 4.6 |
| United Kingdom* | 13.1 | 11.8 | 1.3 |
| Japan | 12.9 | 6.6 | 6.3 |
| Norway | 12.4 | 10.0 | 2.4 |
| Netherlands | 12.0 | 8.2 | 3.8 |
| Switzerland* | 11.5 | 9.3 | 2.2 |
| Italy* | 10.9 | 9.5 | 1.4 |
| West Germany | 10.1 | 11.6 | −1.5 |
REGISTRATION—The law regarding the registration of births is contained in the Births and Deaths Registration Act 1951. A birth is normally registered at the office of the Registrar nearest the place of birth.
Birth statistics are compiled by the Department of Statistics from the records of the Registrar-General. The births covered by a year's statistics are those registered during the year. The figures do not include still births, except where multiple births are discussed. A special classification of still births is given later in this subsection.
Under Section 14 of the Births and Deaths Registration Act 1951, provision is made for births not registered in the ordinary way to be recorded at a later date in a special register kept by the Registrar-General. Such cases include elderly people requiring evidence of age for social welfare purposes. Until 1971 these late registrations were included in published live-birth statistics but they are now excluded. The numbers are normally relatively small; in 1982 they totalled 487.
NUMBERS AND RATES—The following table shows the numbers of births and the rates for the latest 5 years. Late registrations (see above) have been excluded from all these figures. The crude birth rate fell in the early 1960s and in the later 1960s appeared to stabilise at 22 to 23 births per 1000 of mean population. During the 1970s the crude birth rate continued to decline, and following a period of stability in the late 1970s, has fallen again.
A more refined cross-sectional measure called the total fertility rate is also shown in the following table for the latest 5 years. The total fertility rate at which any population replaces itself, under certain conditions, is approximately 2.10 births per women. In New Zealand this situation is unlikely to arise until early next century because of the existing population age-structure.
| Year | Live Births | Crude Birth Rate* | Total Fertility Rate† |
|---|---|---|---|
* Per 1000 of mean population. †Average number of births a woman would have during her reproductive life if she were exposed to the fertility rates characteristic of various childbearing age-groups. | |||
| 1979 | 52,279 | 16.66 | 2.12 |
| 1980 | 50,542 | 16.08 | 2.03 |
| 1981 | 50,794 | 16.09 | 2.01 |
| 1982 | 49,938 | 15.69 | 1.95 |
| 1983 | 50,474 | 15.65 | 1.92 |
REFINED BIRTH RATE—“Crude” rates of the number of births per 1000 of the mean population, irrespective of sex or age, do not take account of variations in the proportion of women of the childbearing ages. Refined rates are provided by computations of the nuptial birth rate per 1000 married women of 16–44 years of age, or the total birth rate per 1000 women aged 15–44 years. The following table gives both rates for Census years (on the basis of the births registered in that year and the population as at the Census of Population and Dwellings) together with the “crude” rate for the year.
| Census Year | Birth Rate per 1000 Women | “Crude” Birth Rate per 1000 Mean Population | |
|---|---|---|---|
| Married Women 16–44 Years | Total Women 15–44 Years | ||
| * New Zealand residents. | |||
| 1966 | 152.8x | 114.4 | 22.37 |
| 1971 | 145.7x | 112.9 | 22.51 |
| 1976 | 104.7x | 83.5 | 17.68 |
| 1981 | 94.9* | 72.5* | 16.09 |
The percentage of married women among women in the child-bearing age groups was 61.8 in 1981 compared with 66.0 in 1966. A study of the figures for successive Censuses reveals considerable changes in the age composition of married women within the child-bearing ages; as the birth rate also varies with age, the change in age composition over the period is a factor which should be taken into account.
The following diagram shows numbers of births and deaths and indicates the current decreasing rate of natural increase in New Zealand.
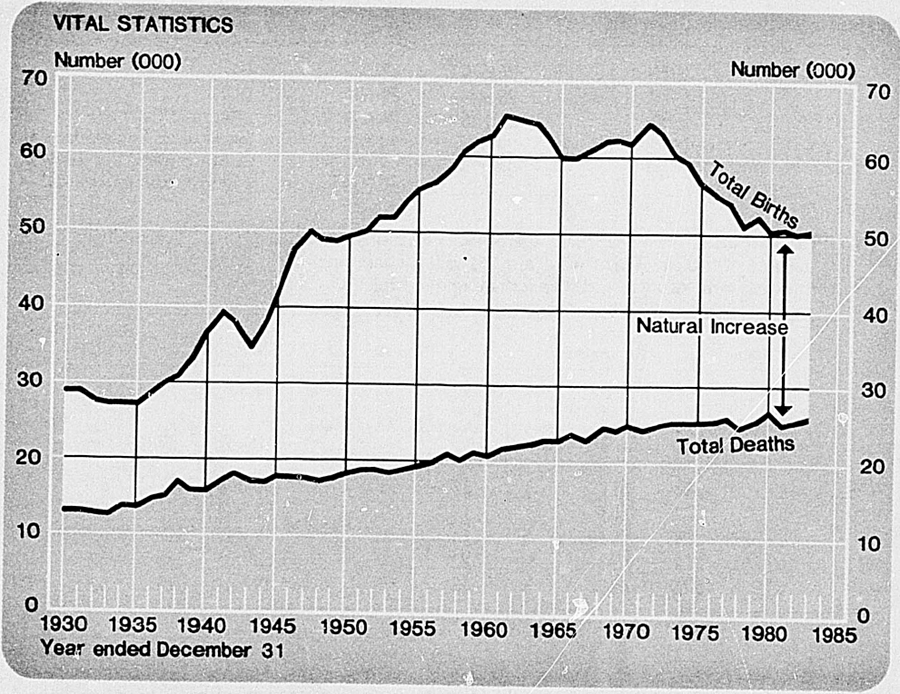
REPRODUCTION INDEX—The reproduction index is based on the fact that the future size of a population is related to the number of female children born to women in the reproductive age groups at any given time. The gross rate is based on the average number of girls that will be born to a woman during her reproductive period given the prevailing age-specific fertility rates. The net rate takes into account prevailing mortality rates. A net rate of 1.0 indicates zero population growth if the population is closed to migration, and its age-sex structure has long-term stability.
Reproduction rates during the 6 most recent years were as follows:
| Year | Gross Rate | Net Rate |
|---|---|---|
| 1978 | 1.014 | 0.990 |
| 1979 | 1.041 | 1.014 |
| 1980 | 0.990 | 0.965 |
| 1981 | 0.978 | 0.953 |
| 1982 | 0.944 | 0.920 |
| 1983 | 0.934 | 0.909 |
SEX OF CHILDREN BORN—The numbers of boys and girls born during the latest 5 years are given in the following table. In each year more boys than girls are born, a disparity in births that is outweighed by the higher death rates of males at every age level. The death rate per 1000 live births for babies under 12 months of age in 1982 was 12.96 for boys and 10.48 for girls. Per 1000 mean population the death rate for children of from 1 to 4 years of age was 0.67 for boys and 0.63 for girls; for children aged 5 to 14 years it was 0.31 for boys and 0.23 for girls; and the pattern repeated itself for each age group through adolescence and adult life.
The following table illustrates the disparity in the numbers born.
| Year | Number of Births of | Male Births per 1000 Female Births | |
|---|---|---|---|
| Males | Females | ||
| 1979 | 26,670 | 25,609 | 1,041 |
| 1980 | 25,938 | 24,604 | 1,054 |
| 1981 | 26,126 | 24,668 | 1,059 |
| 1982 | 25,698 | 24,240 | 1,060 |
| 1983 | 25,876 | 24,598 | 1,052 |
MULTIPLE BIRTHS—In 1982 there were 493 confinements resulting in all live multiple births, including 7 cases of triplets. There were also 13 cases where one of the twins was stillborn, 3 cases where both twins were stillborn, and 3 cases where one triplet was stillborn.
| Year | Single Births | Twin Births | Triplets | Total Cases | Still Birth Rate per 1000 | ||||||
|---|---|---|---|---|---|---|---|---|---|---|---|
| Live | Still | Both Live | Both Still | One Live One Still | All Live | Two Live One Still | Single | Multiple | Single Cases | Multiple Cases | |
| * Including 1 case of quadruplets all live-born. | |||||||||||
| 1978 | 49,962 | 346 | 511 | 3 | 12 | 11 | – | 50,308 | 537 | 6.9 | 27.9 |
| 1979 | 51,240 | 334 | 503 | 1 | 12 | 7 | – | 51,574 | 523 | 65 | 24.9 |
| 1980 | 49,522 | 327 | 492 | 4 | 14 | 6 | – | 49,849 | 517* | 6.6 | 34.8 |
| 1981 | 49,761 | 292 | 492 | 9 | 22 | 9 | – | 50,053 | 532 | 5.8 | 8.3 |
| 1982 | 48,926 | 275 | 486 | 3 | 13 | 7 | 3 | 49,201 | 512 | 5.6 | 1 |
AGES OF PARENTS—Information on the relative ages of parents of nuptial living children whose births were registered in 1982 is shown in the following table. Registrations of births under section 14 of the Births and Deaths Registration Act 1951 are excluded.
| Age of Mother, in Years | Age of Father, in Years | ||||||||||
|---|---|---|---|---|---|---|---|---|---|---|---|
| Under 20 | 20–24 | 25–29 | 30–34 | 35–39 | 40–44 | 45–49 | 50–54 | 55–64 | 65 and Over | Total Cases | |
| * Including 8 cases of triplets, 5 cases all live born, and 3 cases where one was stillborn. | |||||||||||
| Single Births | |||||||||||
| Under 20 | 182 | 809 | 176 | 34 | 9 | 2 | 1 | 2 | – | – | 1,215 |
| 20–24 | 91 | 4,377 | 5,449 | 1,058 | 204 | 75 | 12 | 10 | 4 | 1 | 11,281 |
| 25–29 | 7 | 664 | 8,003 | 5,675 | 942 | 200 | 67 | 22 | 11 | 3 | 15,594 |
| 30–34 | – | 77 | 767 | 4,117 | 1,959 | 398 | 98 | 35 | 18 | 1 | 7,470 |
| 35–39 | – | 14 | 63 | 346 | 805 | 438 | 119 | 35 | 21 | 1 | 1,842 |
| 40–44 | – | 2 | 5 | 30 | 54 | 118 | 69 | 18 | 10 | 4 | 310 |
| 45 and over | – | – | 2 | – | – | 4 | 12 | 6 | 1 | – | 25 |
| Total | 280 | 5 943 | 14 465 | 11 260 | 3 973 | 1 235 | 378 | 128 | 65 | 10 | 37 737 |
| Multiple Births | |||||||||||
| Under 20 | 1 | 5 | 1 | 1 | – | – | – | – | – | – | 8 |
| 20–24 | 1 | 35 | 51 | 10 | 1 | – | – | – | – | – | 98 |
| 25–29 | 1 | 3 | 91 | 67 | 8 | 3 | 1 | – | – | – | 174 |
| 30–34 | – | – | 10 | 60 | 22 | 9 | – | – | – | – | 101 |
| 35–39 | – | – | 2 | 8 | 8 | 5 | 1 | 3 | – | – | 27 |
| 40–44 | – | – | – | – | – | 1 | – | 1 | – | – | 2 |
| 45 and over | – | – | – | – | – | – | – | – | – | – | – |
| Total | 3 | 43 | 155 | 146 | 39 | 18 | 2 | 4 | – | – | 410* |
| Grand Total | 283 | 5 986 | 14 620 | 11 406 | 4 012 | 1 253 | 380 | 132 | 65 | 10 | 38 147 |
PREVIOUS ISSUE OF PARENTS—The following table gives for 1982 the number of previous issue, i.e., children born alive, in conjunction with the age of mother.
| Age of Mother, in Years | Number of Previous Issue | Total Nuptial Cases | ||||||||
|---|---|---|---|---|---|---|---|---|---|---|
| 0 | 1 | 2 | 3 | 4 | 5 | 6–9 | 10–14 | 15 and over | ||
| Number of Mothers | ||||||||||
| Under 20 | 936 | 274 | 12 | 1 | – | – | – | – | – | 1,223 |
| 20–24 | 5,923 | 4,039 | 1,169 | 215 | 31 | 2 | – | – | – | 11,379 |
| 25–29 | 5,524 | 5,936 | 3,001 | 983 | 245 | 61 | 18 | – | – | 15,768 |
| 30–34 | 1,602 | 2,474 | 2,092 | 922 | 292 | 109 | 79 | 1 | – | 7,571 |
| 35–39 | 336 | 434 | 418 | 307 | 168 | 98 | 103 | 5 | – | 1,869 |
| 40–44 | 47 | 46 | 42 | 45 | 42 | 34 | 47 | 9 | – | 312 |
| 45 and over | 2 | 1 | 5 | 4 | – | 3 | 8 | 2 | – | 25 |
| Total | 14 370 | 13 204 | 6 739 | 2 477 | 778 | 307 | 255 | 17 | – | 38 147 |
In the following table the total issue and average issue are shown for mothers by age groups where a birth occurred in 1982.
| Age of Mother, in Years | Total Mothers | Total Issue | Average Issue |
|---|---|---|---|
| Under 20 | 1,223 | 1,532 | 1.25 |
| 20–24 | 11,379 | 18,634 | 1.64 |
| 25–29 | 15,768 | 32,230 | 2.04 |
| 30–34 | 7,571 | 19,351 | 2.56 |
| 35–39 | 1,869 | 6,007 | 3.21 |
| 40–44 | 312 | 1,342 | 4.30 |
| 45 and over | 25 | 149 | 5.96 |
| Total | 38 147 | 79 245 | 2.08 |
It should be stressed that the averages are no more than they purport to be—viz, the average number of children (including those registered in 1982) born up to the present time to those mothers of nuptial children whose births were registered during the year. They do not purport to represent, nor do they represent, the average issue of all women of the ages shown. Furthermore, they include issue resulting from existing marriages only. The averages for recent years have been as follows: 1976, 2.17; 1977, 2.13; 1978, 2.11; 1979, 2.11; 1980, 2.07; 1981, 2.08; and 1982. 2.08.
FIRST BIRTH—Statistics of nuptial first confinements show that, during the last 5 years, the percentages of first confinements during the first year and first 2 years after marriage have stabilised at a lower level than that prevailing in earlier periods.
| Year | Total Nuptial Cases | Total Nuptial First Cases | Percentage of First Cases to Total Cases | First Cases Within 1 Year After Marriage | First Cases Within 2 Years After Marriage | ||
|---|---|---|---|---|---|---|---|
| Number | Percentage to Total First Cases | Number | Percentage to Total First Cases | ||||
| 1978 | 40,339 | 14,792 | 36.66 | 3,812 | 25.77 | 6,804 | 45.99 |
| 1979 | 40,901 | 15,054 | 36.81 | 3,798 | 25.23 | 6,749 | 44.83 |
| 1980 | 39,274 | 14,989 | 38.17 | 3,783 | 25.24 | 6,750 | 45.03 |
| 1981 | 38,921 | 14,662 | 37.67 | 3,715 | 25.34 | 6,739 | 45.96 |
| 1982 | 38,147 | 14,370 | 37.67 | 3,512 | 24.44 | 6,532 | 45.46 |
The following table gives the duration-of-marriage factor in first confinements over a longer time series.
| Duration of Marriage, in Years | Percentage of Total First Confinements | ||||
|---|---|---|---|---|---|
| 1934 | 1954 | 1974 | 1981 | 1982 | |
| Under 1 | 46.25 | 42.64 | 32.38 | 25.34 | 24.44 |
| 1 | 26.79 | 30.56 | 23.21 | 20.62 | 21.02 |
| 2 | 10.24 | 11.56 | 18.48 | 15.44 | 16.01 |
| 3 | 6.16 | 5.95 | 11.92 | 11.44 | 12.04 |
| 4 | 3.96 | 3.30 | 6.94 | 9.38 | 8.36 |
| 5–9 | 5.49 | 5.05 | 6.52 | 16.77 | 16.88 |
| 10 and over | 1.11 | 0.94 | 0.55 | 1.01 | 1.25 |
| Total | 100.00 | 100.00 | 100.00 | 100.00 | 100.00 |
In the following table first confinements occurring to mothers in different age groups are expressed as a percentage of the total first confinements.
| Age of Mother, in Years | Percentage of Total First Confinements | ||||
|---|---|---|---|---|---|
| 1934 | 1954 | 1974 | 1981 | 1982 | |
| Under 20 | 8.90 | 9.08 | 17.96 | 7.77 | 6.51 |
| 20–24 | 40.39 | 47.71 | 48.14 | 42.56 | 41.22 |
| 25–29 | 32.79 | 27.79 | 26.74 | 36.79 | 38.44 |
| 30–34 | 13.10 | 10.39 | 5.51 | 10.36 | 11.15 |
| 35–39 | 3.79 | 3.92 | 1.34 | 2.13 | 2.34 |
| 40–44 | 0.99 | 1.02 | 0.30 | 0.38 | 0.33 |
| 45 and over | 0.04 | 0.09 | 0.01 | 0.01 | 0.01 |
| Total | 100.00 | 100.00 | 100.00 | 100.00 | 100.00 |
The average ages of mothers at the birth of their first child were as follows: 1964, 23.65; 1974, 23.29; 1979, 24.64; 1980, 24.76; 1981, 24.88; and 1982, 25.13 years. These figures refer to nuptial births only.
EX-NUPTIAL LIVE BIRTHS—The numbers of ex-nuptial births registered during each of the last 6 years are given in the following table. The ex-nuptial birth rate relates ex-nuptial births to the number of unmarried women aged 15–49 years and is a more relevant measure than the previously published percentage of ex-nuptial births to total births. Ex-nuptial births include children born to couples living in a de facto relationship.
| Year | Number | Rate* |
|---|---|---|
* Per 1000 mean number of not-married women aged 15–49 years. †Provisional. | ||
| 1978 | 10,254 | 36.97 |
| 1979 | 10,942 | 38.67 |
| 1980 | 10,857 | 37.53 |
| 1981 | 11,441 | 38.78 |
| 1982 | 11,386 | 36.87 |
| 1983 | 11,979 | 36.98† |
In 1982 the total number of ex-nuptial confinements resulting in live births was 11 288. Of these, 11 189 cases were single births, 97 cases were twins, and there were 2 cases of triplets. There were 3 cases of twins where 1 child was stillborn. The total number of ex-nuptial live births was 11 386. From the following table, it can be seen that of the 11 288 mothers, 3853 or 34.13 percent were under 20 years of age.
| Age | Number of Mothers |
|---|---|
| 11 | 1 |
| 12 | – |
| 13 | 6 |
| 14 | 33 |
| 15 | 151 |
| 16 | 435 |
| 17 | 885 |
| 18 | 1,131 |
| 19 | 1,211 |
| 20 | 1,143 |
| 21 | 966 |
| 22 | 830 |
| 23 | 767 |
| 24–29 | 2,584 |
| 30–34 | 808 |
| 35–39 | 274 |
| 40–44 | 57 |
| 45 and over | 6 |
| Total | 11 288 |
Reregistration—An ex-nuptial child whose parents have later married may be reregistered from birth. Applications for registration must be made within 3 months after the date of the marriage.
The number of reregistrations in each of the latest 6 years were as follows: 1976, 1478; 1977, 1284; 1978, 1288; 1979, 1075; 1980, 1328; 1981, 1473; and 1982, 1430.
Under the former provisions of section 10 of the Children and Young Persons Act 1974, social workers were required to make enquiries into all ex-nuptial births. The purpose of these enquiries was to establish the circumstances of both mother and child and offer help and advice where necessary.
The following table shows the outcome of the inquiries made in recent years. Inquiries relate to some births from the preceding year and do not cover all births in the year stated.
| Location of Infants | 1981 | 1982 | ||
|---|---|---|---|---|
| No. | % | No. | % | |
| Reregistered after marriage of parents | 111 | 1 | 185 | 2 |
| Remaining with mother (parents cohabiting) | 3,117 | 42 | 4,275 | 48 |
| Remaining with mother (parents not cohabiting) | 2,517 | 34 | 2,805 | 31 |
| Placed with relatives | 199 | 3 | 333 | 4 |
| Placed with strangers with view to adoption | 418 | 5 | 379 | 4 |
| Placed with strangers, no expressed wish to adoption | 12 | .. | 11 | .. |
| In children's home or other institution on a long-term basis | 8 | .. | 11 | .. |
| Committed to care of Social Welfare | 7 | .. | 9 | .. |
| Not traced | 1,018 | 14 | 875 | 10 |
| Died | 50 | 1 | 39 | .. |
| Total | 7 457 | 100 | 8 922 | 100 |
ADOPTIONS—The following table shows the number of adoptions which have been registered during recent years.
| Calendar Year | Total |
|---|---|
| 1977 | 2,523 |
| 1978 | 2,380 |
| 1979 | 2,050 |
| 1980 | 2,125 |
| 1981 | 1,885 |
| 1982 | 2,368 |
The following table, which relates only to cases handled by the Department of Social Welfare, shows the number and status of children adopted over the last 5 years ended 31 March.
| Status of Children Adopted | 1978 | 1979 | 1980 | 1981 | 1982 |
|---|---|---|---|---|---|
| * These are cases where, because one of the applicants is the child's natural parent, a social worker's report has not been called for. | |||||
| Ex-nuptial | 1,526 | 1,375 | 1,232 | 1,014 | 909 |
| Nuptial | 523 | 374 | 408 | 336 | 345 |
| Not known* | 81 | 205 | 317 | 297 | 328 |
| Total | 2 130 | 1 954 | 1 957 | 1 647 | 1 582 |
In 1982, 57 percent of the children adopted were born out of wedlock. Of these children born out of wedlock. 64 percent were aged less than 1 year at the time of placement for adoption.
The next table shows the age at placement according to the status of the children adopted in 1982.
| Age | Nuptial | Ex-nuptial | Not Known | Total |
|---|---|---|---|---|
| * These are cases where, because one of the applicants is the child's natural parent, a social worker's report has been called for. | ||||
| Under 1 year | 50 | 582 | 17 | 649 |
| 1–5 years | 24 | 51 | 3 | 78 |
| 6 years and over | 11 | 12 | 4 | 27 |
| Not known* | 260 | 264 | 304 | 828 |
| Total | 345 | 909 | 328 | 1 582 |
The following table shows the original relationship between adopted children and their new parents.
| Relationship | 1978 | 1979 | 1980 | 1981 | 1982 |
|---|---|---|---|---|---|
| Strangers | 1,067 | 845 | 715 | 556 | 478 |
| One parent and spouse | 782 | 773 | 894 | 763 | 782 |
| Relative or close friend | 281 | 336 | 348 | 328 | 322 |
| Total | 2 130 | 1 954 | 1 957 | 1 647 | 1 582 |
STILLBIRTHS—Although it is compulsory to effect a birth-registration entry for a still-born child, no entry is made in the register of deaths. Particulars of causes of still births will be found in Section 4C relating to deaths. A stillborn child is defined as one “which has issued from its mother after the expiration of the twenty-eighth week of pregnancy and which was not alive at the time of such issue”. Stillbirths are not included either as births or as deaths in the various numbers and rates shown in this subsection and in that relating to deaths.
The following table shows for the latest 6 years the numbers of still births and the rate per 1000 total births.
| Year | Number | Rate |
|---|---|---|
| 1978 | 364 | 7.08 |
| 1979 | 348 | 6.61 |
| 1980 | 349 | 6.86 |
| 1981 | 332 | 6.49 |
| 1982 | 297 | 5.91 |
| 1983 | 269 | 5.30 |
The death rate (by which is usually meant the crude death rate i.e: the number of deaths per 1000 of total mean population) is less subject to fluctuation than the birth rate. In the absence of wars, epidemics, and other large-scale disasters, it changes slowly. The New Zealand crude death rate was 8.80 in 1930 and 50 years later, in 1980, it was 8.48. In between, it had reached a peak of 11.05 in 1942, during the Second World War, and a low point of 7.85 in 1978. In contrast, the birth rate (19.30 in 1930 and 15.69 in 1982) had been as high as 27.64 in 1947 and is now below even the level of the 1930s Depression years. Depressions, wars, peace, prosperity, changing social attitudes, and the popularisation of improved methods of birth control have all left their mark on the birth rate.
Under normal conditions the most important factor affecting the crude death rate is the age structure of the population, which (like the death rate itself) changes slowly. An ageing population will tend to have a high death rate, while a young one (provided that infant mortality is not abnormally high) will have a low one.
The following table sets out the numbers of deaths and the crude death rates per 1000 of mean population. (Maoris are defined as persons with half or more Maori ancestory and the term non-Maori covers all other persons.)
| Year | Numbers | Crude Rate per 1000 of Mean Population | ||||
|---|---|---|---|---|---|---|
| Non-Maori | Maori | Total | Non-Maori | Maori | Total | |
| 1979 | 24,034 | 1,306 | 25,340 | 8.39 | 4.77 | 8.08 |
| 1980 | 25,337 | 1,339 | 26,676 | 8.84 | 4.83 | 8.48 |
| 1981 | 23,860 | 1,290 | 25,150 | 8.29 | 4.61 | 7.97 |
| 1982 | 24,214 | 1,318 | 25,532 | 8.35 | 4.65 | 8.02 |
| 1983 | 24,665 | 1,326 | 25,991 | 8.39 | 4.62 | 8.06 |
The chief merit of the crude death rate is that it is easily calculated, requiring only the number of deaths and the size of the population “at risk”. However, it is very misleading when comparisons are being made between two or more populations with different age structures, such as the Maori and non-Maori population of New Zealand. The Maori population is a “young” one, with a high proportion of children and young people in those age groups in which the death rate is normally very low, and relatively few elderly people in those age groups in which the death rate is normally high. The non-Maori population is older, with a considerably smaller proportion of children and young people and a larger proportion of elderly people. The result is that a comparison of crude death rates gives a false picture of Maori mortality as compared with non-Maori.
In the following table, based on 1982 figures, a comparison is supplied in age-specific rates for the two races in each sex (age-specific rates are the number of deaths per 10 000 or per 1000, etc. of the population in the specified age groups).
| Ethnic Group | Age-specific Death Rates per 10 000 of Population at Ages | |||||
|---|---|---|---|---|---|---|
| Under 5 Years | 5–14 Years | 15–24 Years | 25–44 Years | 45–64 Years | 65 Years and Over | |
| Males | ||||||
| Maori | 38.3 | 2.9 | 18.2 | 28.6 | 171.5 | 787.7 |
| Non-Maori | 30.4 | 3.1 | 15.5 | 16.7 | 110.0 | 652.5 |
| Females | ||||||
| Maori | 35.3 | 2.7 | 6.9 | 20.2 | 128.9 | 568.2 |
| Non-Maori | 24.5 | 2.2 | 5.5 | 9.4 | 65.1 | 471.3 |
| Both Sexes | ||||||
| Maori | 36.8 | 2.8 | 12.6 | 24.4 | 150.0 | 673.6 |
| Non-Maori | 27.5 | 2.7 | 10.6 | 13.1 | 87.6 | 547.5 |
For both Maoris and non-Maoris the death rate in males exceeds the death rate in females by a considerable margin. The following table sets out the number of deaths and the respective crude death rates for each sex separately for the latest 5 years.
| Year | Deaths of Males | Deaths of Females | Total Deaths | Male Deaths to Every 100 Female Deaths | |||
|---|---|---|---|---|---|---|---|
| Number | Rate* | Number | Rate* | Number | Rate* | ||
| * Deaths per 1000 of mean population. | |||||||
| 1979 | 13,942 | 8.93 | 11,398 | 7.23 | 25,340 | 8.08 | 122 |
| 1980 | 14,320 | 9.16 | 12,356 | 7.82 | 26,676 | 8.48 | 116 |
| 1981 | 13,670 | 8.71 | 11,480 | 7.23 | 25,150 | 7.97 | 119 |
| 1982 | 13,832 | 8.75 | 11,700 | 7.31 | 25,532 | 8.02 | 118 |
| 1983 | 13,978 | 8.72 | 12,013 | 7.40 | 25,991 | 8.06 | 116 |
DISTRIBUTION OF DEATHS OVER THE YEAR—In 1982 the months during which the greatest number of deaths occurred were July and August, with totals of 2427 and 2360 respectively. Excluding December (a proportion of deaths occurring in that month were not registered until January 1983), February had the least number of deaths, 1754, followed by January with 1898.
AGES AT DEATH—Deaths registered during the year 1982 are shown according to age in the following table.
| Age, in Years | Males | Females | Total |
|---|---|---|---|
| * Excludes adjustments by the National Health Statistics Centre as a result of analysis and collation of registration forms and death certificates. | |||
| Under 1* | 333 | 254 | 587 |
| 1–4 | 68 | 62 | 130 |
| 5–9 | 45 | 37 | 82 |
| 10–14 | 47 | 28 | 75 |
| 15–19 | 208 | 79 | 287 |
| 20–24 | 261 | 84 | 345 |
| 25–29 | 180 | 62 | 242 |
| 30–34 | 166 | 105 | 271 |
| 35–39 | 182 | 119 | 301 |
| 40–44 | 239 | 161 | 400 |
| 45–49 | 345 | 259 | 604 |
| 50–54 | 571 | 374 | 945 |
| 55–59 | 986 | 589 | 1,575 |
| 60–64 | 1,370 | 752 | 2,122 |
| 65–69 | 1,848 | 1,117 | 2,965 |
| 70–74 | 2,119 | 1,491 | 3,610 |
| 75–79 | 2,010 | 1,637 | 3,647 |
| 80–84 | 1,575 | 1,783 | 3,358 |
| 85–89 | 800 | 1,502 | 2,302 |
| 90–94 | 382 | 345 | 1,227 |
| 95–99 | 86 | 298 | 384 |
| 100 and over | 11 | 62 | 73 |
| Total | 13 832 | 11 700 | 25 532 |
In the following table is given a time series for rates of death per 1000 of mean population by age groups. Health measures in New Zealand have achieved an immense saving of young life and a prolongation of life, especially among elderly women.
| Year | Under 1* | 1–4 | 5–14 | 15–24 | 25–34 | 35–44 | 45–54 | 55–64 | 65–74 | 75 and Over |
|---|---|---|---|---|---|---|---|---|---|---|
* Per 1000 live births in this case. †Non-Maori figures only as Maori at ages not available for these years. | ||||||||||
| (Rates per 1000 of mean population in each age group) | ||||||||||
| Males | ||||||||||
| 1901† | 78.60 | 6.81 | 1.89 | 3.52 | 3.97 | 6.16 | 11.94 | 23.12 | 50.59 | 141.67 |
| 1921† | 53.10 | 4.78 | 1.85 | 2.44 | 3.56 | 5.55 | 9.61 | 19.96 | 46.17 | 128.60 |
| 1941 | 43.65 | 4.39 | 1.36 | 2.53 | 2.93 | 3.95 | 9.20 | 21.13 | 47.44 | 140.27 |
| 1961 | 25.86 | 1.34 | 0.49 | 1.28 | 1.47 | 2.68 | 7.39 | 19.65 | 47.33 | 126.31 |
| 1980 | 13.88 | 0.72 | 0.37 | 1.51 | 1.54 | 2.10 | 6.27 | 17.93 | 45.39 | 131.13 |
| 1981 | 13.01 | 0.95 | 0.35 | 1.53 | 1.35 | 2.26 | 6.57 | 17.30 | 43.38 | 114.08 |
| 1982 | 12.96 | 0.67 | 0.31 | 1.58 | 1.43 | 2.19 | 5.98 | 17.37 | 42.89 | 115.34 |
| Females | ||||||||||
| 1901† | 63.87 | 5.50 | 1.64 | 3.58 | 4.72 | 6.70 | 10.62 | 19.44 | 43.32 | 127.98 |
| 1921† | 42.31 | 4.49 | 1.31 | 2.34 | 3.38 | 4.46 | 8.00 | 14.88 | 36.81 | 120.23 |
| 1941 | 37.75 | 3.84 | 1.20 | 1.94 | 2.44 | 3.50 | 6.90 | 15.04 | 38.60 | 118.92 |
| 1961 | 19.50 | 1.16 | 0.35 | 0.53 | 0.87 | 1.95 | 4.59 | 11.22 | 29.89 | 104.74 |
| 1980 | 11.79 | 0.62 | 0.27 | 0.70 | 0.75 | 1.49 | 4.41 | 10.24 | 26.21 | 94.19 |
| 1981 | 10.22 | 0.64 | 0.23 | 0.67 | 0.64 | 1.51 | 3.94 | 9.19 | 23.73 | 84.67 |
| 1982 | 10.48 | 0.63 | 0.23 | 0.57 | 0.68 | 1.47 | 4.32 | 9.48 | 23.53 | 83.06 |
| Both Sexes | ||||||||||
| 1901† | 71.40 | 6.17 | 1.77 | 3.55 | 4.33 | 6.40 | 11.37 | 21.63 | 47.87 | 135.71 |
| 1921† | 47.82 | 4.64 | 1.58 | 2.39 | 3.47 | 5.10 | 8.85 | 17.59 | 41.90 | 124.84 |
| 1941 | 39.81 | 4.12 | 1.28 | 2.22 | 2.67 | 3.72 | 8.02 | 18.16 | 43.04 | 129.15 |
| 1961 | 22.76 | 1.25 | 0.42 | 0.91 | 1.18 | 2.31 | 6.00 | 15.41 | 37.67 | 114.01 |
| 1980 | 12.86 | 0.67 | 0.32 | 1.11 | 1.14 | 1.80 | 5.36 | 14.00 | 34.96 | 107.73 |
| 1981 | 11.65 | 0.80 | 0.29 | 1.11 | 0.99 | 1.89 | 5.29 | 13.14 | 32.67 | 95.40 |
| 1982 | 11.75 | 0.65 | 0.27 | 1.08 | 1.05 | 1.83 | 5.17 | 13.34 | 32.34 | 94.80 |
The average (arithmetic mean) age at death of the total population by sex is shown in the following table. Prior to 1974 the data relate to the non-Maori population only
| Year | Males | Females |
|---|---|---|
| Age (years) | ||
| 1901 | 41.64 | 37.68 |
| 1921 | 48.45 | 46.97 |
| 1941 | 58.65 | 59.60 |
| 1961 | 63.80 | 67.32 |
| 1971 | 64.75 | 70.04 |
| 1978 | 63.42 | 69.69 |
| 1979 | 64.12 | 70.36 |
| 1980 | 65.69 | 71.01 |
| 1981 | 65.02 | 71.26 |
| 1982 | 65.46 | 71.42 |
MAORI DEATHS—There were 1326 Maori deaths registered in 1983, compared with 1318 for 1982, and 1290 for 1981 (Maori ethnicity is defined as persons with half or more Maori ancestry). The crude death rate was 4.62 per 1000 mean population in 1983, compared with 4.65 in 1982, and 4.61 in 1981. Of the 1326 Maori deaths registered, 785 were males, and 541 females. The average age of death of Maoris in 1982 was 50.92 years and 52.54 years for males and females respectively. The younger age composition of the Maori population is an important factor to take into consideration when comparing figures on crude death rates and average age of deaths with other populations.
EXPECTATION OF LIFE—Life tables, which depict the pattern of mortality over the age span of life for particular calendar periods for the total New Zealand population, have been constructed at
regular intervals since 1950–52. The most recent tables prepared by the Department of Statistics are provisional tables based on mean populations together with mortality statistics for the calendar years 1980–82.
Life tables contain a measure of the degree of longevity of the population called the “expectation of life”. The expectation of life at any age is the average remaining lifetime for persons of this age, assuming that mortality rates at each age continue at the level shown by the life table. The life expectancy at selected ages at the present time, for the total population in New Zealand, is shown in the table below. The overall longer span of life enjoyed by females, compared with males, is evident.
Further details concerning life table methodology and construction and trends in New Zealand life expectancies can be obtained from New Zealand Life Tables 1975–77, obtainable from Government bookshops.
| Exact Age (Years) | Life Expectancy (Years)* | |
|---|---|---|
| Males | Females | |
| * Provisional. | ||
| 0 | 70.34 | 76.42 |
| 1 | 70.29 | 76.25 |
| 5 | 66.50 | 72.44 |
| 10 | 61.61 | 67.52 |
| 15 | 56.71 | 62.60 |
| 20 | 52.08 | 57.79 |
| 25 | 47.52 | 52.98 |
| 30 | 42.85 | 48.13 |
| 35 | 38.13 | 43.31 |
| 40 | 33.44 | 38.53 |
| 45 | 28.87 | 33.88 |
| 50 | 24.50 | 29.44 |
| 55 | 20.37 | 25.11 |
| 60 | 16.63 | 21.02 |
| 65 | 13.29 | 17.12 |
| 70 | 10.40 | 13.63 |
| 75 | 7.92 | 10.46 |
| 80 | 5.90 | 7.71 |
The trend since 1950–52 in the life expectancy of New Zealand's population has generally been a slow but steady improvement for both sexes. This improvement has been striking for the younger ages but less significant for the oldest ages, and only marginal for males. Between 1975–77 and 1980–82 there has been a sharp increase in life expectancy in all ages.
| Life Table | Life Expectancy (Years) | |||||
|---|---|---|---|---|---|---|
| Males Aged Exactly | Females Aged Exactly | |||||
| 0 | 20 | 60 | 0 | 20 | 60 | |
| * Provisional. | ||||||
| 1950–52 | 67.19 | 50.75 | 16.10 | 71.29 | 54.18 | 18.44 |
| 1955–57 | 68.20 | 51.29 | 16.11 | 73.00 | 55.40 | 19.07 |
| 1960–62 | 68.44 | 51.17 | 16.00 | 73.75 | 55.87 | 19.27 |
| 1965–67 | 68.19 | 50.62 | 15.74 | 74.30 | 56.09 | 19.58 |
| 1970–72 | 68.55 | 50.77 | 15.74 | 74.60 | 56.34 | 19.78 |
| 1975–77 | 69.01 | 51.17 | 16.09 | 75.45 | 57.01 | 20.42 |
| 1980–82* | 70.34 | 52.08 | 16.63 | 76.42 | 57.79 | 21.02 |
The expectation of life at various ages for the Maori population is shown in the following table, which is based on provisional life tables for 1980–82.
| Exact Age (Years) | Life Expectancy (Years)* | |
|---|---|---|
| Males | Females | |
| * Provisional. | ||
| 0 | 65.44 | 69.84 |
| 1 | 65.66 | 70.07 |
| 5 | 61.80 | 66.26 |
| 10 | 56.90 | 61.31 |
| 15 | 51.98 | 56.39 |
| 20 | 47.39 | 51.58 |
| 25 | 42.76 | 46.79 |
| 30 | 38.23 | 42.02 |
| 35 | 33.62 | 37.32 |
| 40 | 29.12 | 32.76 |
| 45 | 24.82 | 28.33 |
| 50 | 20.87 | 24.28 |
| 55 | 17.21 | 20.57 |
| 60 | 14.20 | 17.17 |
| 65 | 11.41 | 14.22 |
| 70 | 9.26 | 11.87 |
| 75 | 7.46 | 9.64 |
| 80 | 5.61 | 7.87 |
Life expectancy at birth for Maori males increased by 2.09 years between 1975–1977 and 1980–1982 while that for Maori females increased by 2.09 years. These increases in Maori life expectancy are, however, slightly understated because of problems of classification of ethnic origin and non-response to the relevant question at the 1976 Census of Population and Dwellings. These led to an overstatement of the Maori population exposed-to-risk of mortality during 1975–77, and Maori life-expectancy at all ages was consequently overstated. The opposite is true for non-Maoris.
The expectation of life of Maoris is shorter than that of non-Maoris at all except the highest ages. A comparison at age 0 shows that life expectancy is 5.22 years greater for non-Maori males and 6.97 years greater for non-Maori females. For the period 1975–77, the differences were 6.02 years and 8.13 years respectively.
The table below compares the life expectancy at birth for the total population of New Zealand with that for selected overseas countries. Source: United Nations Demographic Yearbook 1981.
| Country | Period | Life Expectancy at Birth (Years) | |
|---|---|---|---|
| Males | Females | ||
| Australia | 1979 | 70.79 | 77.76 |
| Canada | 1975–77 | 70.19 | 77.48 |
| Denmark | 1979–80 | 71.20 | 77.30 |
| England and Wales | 1977–79 | 70.20 | 76.40 |
| France | 1978–80 | 70.05 | 78.20 |
| Japan | 1930 | 73.32 | 78.83 |
| Netherlands | 1979 | 72.40 | 78.90 |
| New Zealand | 1980–82 | 70.34 | 76.42 |
| United States | 1979 | 69.90 | 77.80 |
REGISTRATION OF DEATH, BURIAL, AND CREMATION—Deaths are required to be registered by the funeral director within 3 days after the day of burial. The law governing burial and cremation in New Zealand is found in the Burial and Cremation Act 1974. The registration by local authorities of funeral directors and mortuaries operated by them is provided for in the Health (Burial) Regulations 1946. Local authorities are charged with ensuring that adequate provision exists for the disposal of the dead. Cremation may be carried out if the deceased is not known to have left any written direction to the contrary.
The rate of cremation for every 100 deaths registered doubled between 1950 and 1970, and has continued to increase, exceeding 50 percent in the past 3 years. The following table relates cremations to the number of deaths since 1950. Prior to 1970 the statistics concern deaths of non-Maoris only.
| Year | Deaths Registered | Cremations | Rate per 100 Deaths Registered | ||
|---|---|---|---|---|---|
| Males | Females | Total | |||
| 1950 | 16,715 | 1,799 | 1,454 | 3,253 | 19.46 |
| 1960 | 19,524 | 2,958 | 2,582 | 5,540 | 28.38 |
| 1970 | 24,840 | 5,418 | 4,474 | 9,892 | 39.82 |
| 1980 | 26,676 | 7,210 | 6,240 | 13,450 | 50.42 |
| 1981 | 25,150 | 7,069 | 5,969 | 13,038 | 51.84 |
| 1982 | 25,532 | 7,178 | 6,152 | 13,330 | 52.21 |
DEATHS BY CAUSES—The selection of cause of death recommended by the World Health Organisation's International Classification of Diseases is based on the concept of selecting the underlying cause of death.
The certifier's statement largely determines the cause but to obtain more accurate data the nosologists also refer to all autopsy reports received, cancer case registrations, coroners' reports, and hospital case summaries.
Medical practitioners certified 81 percent of deaths registered in 1981 and 19 percent were certified by coroners. Of the deaths certified by doctors, 13 percent were subject to autopsy whilst 99 percent of deaths certified by coroners were subject to autopsy. Overall, 29 percent of all deaths had autopsies performed.
Detailed information about causes of death is published annually by the National Health Statistics Centre in New Zealand Health Statistics Report—Mortality and Demographic Date.
The following table is a summary of causes of death, numbers and rate per million of mean population for the years 1979 to 1981. New Zealand adopted the Ninth Revision of the World Health Organisation's International Classification of Diseases in 1979. As a result, care must be taken when comparing figures since 1979 with those for previous years. Rates particularly affected are asterisked in the Cause of Death table.
The sharp increase in rates for “All other accidents” in 1979 and 1980 is chiefly attributable to the effects of the Mount Erebus air disaster in 1979. Over half of those deaths were not registered until 1980.
| Cause of Death | Number of Deaths | Rate per Million of Mean Population | ||||
|---|---|---|---|---|---|---|
| 1979 | 1980 | 1981 | 1979 | 1980 | 1981 | |
| * Data which is not comparable with years prior to 1979 is due to introduction of 9th Revision of WHO International Classification of Diseases. | ||||||
| Enteritis and other diarrhoeal diseases | 36 | 24 | 19 | 12 | 8 | 6 |
| Tuberculosis of respiratory system | 25 | 20 | 19 | 8 | 6 | 6 |
| Other tuberculosis including late effects | 31 | 44 | 30 | 10 | 14 | 10 |
| Infectious hepatitis | 14 | 12 | 13 | 4 | 4 | 4 |
| Syphilis and its sequelae | 3 | 2 | 4 | 1 | 1 | 1 |
| All other infective and parasitic diseases | 56 | 71 | 70 | 18 | 23 | 22 |
| Malignant neoplasm | 5,366 | 5,465 | 5,588 | 1,717 | 1,745 | 1,770 |
| Benign neoplasm and neoplasm of unspecified nature | 33 | 32 | 39 | 11 | 10 | 12 |
| Diseases of thyroid gland | 17 | 25 | 24 | 5 | 8 | 8 |
| Diabetes mellitus | 382 | 446 | 388 | 122 | 142 | 123 |
| Avitaminoses and other nutritional deficiency | 9 | 11 | 6 | 3 | 4 | 2 |
| Anaemia | 40 | 38 | 33 | 13 | 12 | 10 |
| Alcoholic psychosis and alcoholism* | 26 | 34 | 20 | 8 | 11 | 6 |
| Meningitis | 26 | 22 | 25 | 8 | 7 | 8 |
| Multiple sclerosis | 26 | 26 | 19 | 8 | 8 | 6 |
| Paralysis agitans | 85 | 67 | 61 | 27 | 21 | 19 |
| Epilepsy | 37 | 54 | 44 | 12 | 17 | 14 |
| Chronic rheumatic heart disease* | 162 | 156 | 128 | 52 | 50 | 41 |
| Hypertensive disease | 362 | 329 | 291 | 116 | 105 | 92 |
| Ischaemic heart disease | 7,113 | 7,459 | 7,142 | 2,277 | 2,382 | 2,262 |
| Other forms of heart disease* | 1,144 | 1,053 | 1,043 | 366 | 336 | 330 |
| Cerebrovascular disease | 3,027 | 3,158 | 2,920 | 969 | 1,009 | 925 |
| Diseases of arteries, arterioles, and capillaries | 634 | 713 | 623 | 203 | 228 | 197 |
| Acute respiratory infections including influenza | 52 | 241 | 62 | 17 | 77 | 20 |
| Pneumonia | 1,028 | 1,105 | 917 | 329 | 353 | 290 |
| Bronchitis, emphysema, and asthma* | 825 | 958 | 790 | 264 | 306 | 250 |
| Other diseases of respiratory system* | 559 | 720 | 642 | 179 | 230 | 203 |
| Peptic ulcer | 132 | 156 | 145 | 42 | 50 | 46 |
| Appendicitis | 6 | 6 | 7 | 2 | 2 | 2 |
| Intestinal obstruction and hernia | 98 | 74 | 79 | 31 | 24 | 25 |
| Cirrhosis of liver | 166 | 149 | 144 | 53 | 48 | 46 |
| Diseases of gallbladder | 45 | 44 | 45 | 14 | 14 | 14 |
| Nephritis, nephrotic syndrome and nephrosis* | 157 | 188 | 174 | 50 | 60 | 55 |
| Infections of kidney | 48 | 37 | 36 | 15 | 12 | 11 |
| Hyperplasia of prostate | 32 | 27 | 22 | 10 | 9 | 7 |
| Complications of pregnancy, childbirth, and puerperium | 6 | 7 | 3 | 2 | 2 | 1 |
| Rheumatoid arthritis | 55 | 58 | 51 | 18 | 19 | 16 |
| Congenital anomalies | 261 | 241 | 212 | 84 | 77 | 67 |
| Birth injury, difficult labour, other anoxic and hypoxic conditions, and other causes of perinatal mortality | 220 | 187 | 173 | 70 | 60 | 55 |
| All other diseases | 1,228 | 1,178 | 1,271 | 393 | 376 | 403 |
| Motor vehicle accidents | 594 | 622 | 707 | 190 | 199 | 224 |
| All other accidents | 914 | 1,012 | 730 | 293 | 323 | 231 |
| Suicide and self-inflicted injury | 302 | 337 | 320 | 97 | 108 | 101 |
| All other external causes | 100 | 80 | 68 | 32 | 26 | 22 |
| Total | 25 482 | 26 688 | 25 147 | 8 155 | 8 526 | 7 965 |
| Source: National Health Statistics Centre. | ||||||
PRINCIPAL CAUSES OF DEATH—Heart disease, malignant neoplasms (cancer), and cerebrovascular disease were again the leading causes of death in 1981 (the latest year for which data are available). These 3 causes accounted for approximately 68 percent of all deaths in 1981-ischaemic heart disease accounted for 28 percent of deaths, malignant neoplasms (cancer) for 22 percent, and cerebrovascular disease for approximately 12 percent.
Death rates per million of mean population from leading causes of death are shown in the following table.
| Cause of Death | 1977 | 1978 | 1979 | 1980 | 1981 |
|---|---|---|---|---|---|
| Deaths per million | |||||
| All heart disease | 2,815 | 2,630 | 2,781 | 2,845 | 2,699 |
| Malignant neoplasms (cancer) | 1,679 | 1,665 | 1,717 | 1,745 | 1,770 |
| Cerebrovascular disease | 1,011 | 957 | 969 | 1,009 | 925 |
| Accidental causes | 548 | 457 | 483 | 522 | 455 |
| Pneumonia | 295 | 343 | 329 | 353 | 290 |
Heart Disease—Heart disease as a group of diseases is still the leading cause of death in New Zealand. The standardised mortality ratios for all forms of heart disease show that between 1970 and 1981 rates for males have fallen by 18 percent and rates for females have fallen by 19 percent.
Numbers of deaths and standardised mortality ratios for heart disease, excluding acute rheumatic forms and congenital malformations, are shown below.
| Year | All Forms of Heart Disease | |||
|---|---|---|---|---|
| Males | Females | |||
| Number | Standardised Mortality Ratio* | Number | Standardised Mortality Ratio* | |
| * Base years 1950–52 = 100. | ||||
| 1965 | 4,710 | 100 | 3,394 | 79 |
| 1970 | 4,886 | 99 | 3,405 | 72 |
| 1975 | 4,845 | 92 | 3,315 | 64 |
| 1978 | 4,843 | 85 | 3,387 | 59 |
| 1979 | 5,101 | 88 | 3,589 | 61 |
| 1980 | 5,039 | 86 | 3,868 | 64 |
| 1981 | 4,890 | 81 | 3,631 | 58 |
The standardised mortality ratio shows the number of deaths registered in the year of experience expressed as a percentage of those which would have been expected in that year had there operated the sex-age mortality of a standard period (the 3 years 1950–52 were chosen). The standardised mortality ratio has been adopted to eliminate the distorting effect of the changes which take place over a period in the age-structure of the population.
Cancer—In New Zealand 1 death in 5 in 1981 was caused by cancer. The cancer crude death rate has increased over the latest 5 years for which figures are available from 167.9 per 100 000 population in 1977 to 177.0 in 1981.
A detailed report on cancer mortality and morbidity in New Zealand is published annually by the National Health Statistics Centre of the Department of Health. These reports cover mortality from cancer and also survey all cases reported to the National Cancer Registry.
A summary of numbers of deaths from cancer, crude death rates, and standardised mortality ratios is provided in the following table.
| Year | Number of Deaths from Cancer | Crude Death Rate per 100 000 | Standardised Mortality Ratios* | Number of Deaths from Cancer | Crude Death Rate per 100 000 | Standardised Mortality Ratios* |
|---|---|---|---|---|---|---|
| * Base years 1950–52 = 100. | ||||||
| Males | Females | |||||
| 1960 | 1,724 | 144.3 | 101 | 1,566 | 132.5 | 92 |
| 1970 | 2,436 | 173.0 | 126 | 2,024 | 143.5 | 99 |
| 1975 | 2,726 | 176.9 | 129 | 2,281 | 147.6 | 101 |
| 1978 | 2,801 | 179.2 | 125 | 2,410 | 153.9 | 102 |
| 1979 | 2,901 | 186.0 | 128 | 2,465 | 157.5 | 103 |
| 1980 | 2,952 | 188.9 | 128 | 2,513 | 160.2 | 103 |
| 1981 | 3,061 | 195.0 | 130 | 2,527 | 159.2 | 100 |
A classification of cancer deaths during 1981 according to age and sex is shown below. Ninety-three percent of deaths from cancer during 1981 were at 45 years of age or above, and 61 percent were at 65 years of age or above.
| Age Groups, in Years | Deaths of Males | Deaths of Females | ||||
|---|---|---|---|---|---|---|
| Numbers | Rate per 100 000 of Population at Ages Given | Percentage of Total Deaths at Ages Given | Numbers | Rate per 100 000 of Population at Ages Given | Percentage of Total Deaths at Ages Given | |
| * All ages crude rate. | ||||||
| Under 5 | 12 | 9.4 | 2.7 | 7 | 5.7 | 2.2 |
| 5–14 | 20 | 6.6 | 18.7 | 10 | 3.5 | 14.9 |
| 15–24 | 22 | 7.4 | 4.9 | 20 | 7.0 | 10.5 |
| 25–44 | 132 | 31.1 | 17.9 | 172 | 40.6 | 40.4 |
| 45–64 | 970 | 337.0 | 29.2 | 797 | 277.5 | 42.7 |
| 65 and over | 1,905 | 1 443.6 | 22.1 | 1,521 | 843.5 | 17.7 |
| All ages | 3 061 | 195.0 | 22.4 | 2 527 | 159.2 | 22.0 |
Cancer of the lung continues to be the major site in male deaths from cancer. Seven percent of all male deaths in 1981 were caused by lung cancer. Breast is the major cancer site in females and accounted for 4 percent of all female deaths.
The following table shows deaths from cancer (malignant neoplasms) by sex and selected sites, registered in New Zealand during 1979 to 1981.
| Site | Sex | Numbers | Rates per Million Mean Population | ||||
|---|---|---|---|---|---|---|---|
| 1979 | 1980 | 1981 | 1979 | 1980 | 1981 | ||
| Buccal cavity and pharynx | M | 56 | 57 | 68 | 36 | 36 | 43 |
| F | 26 | 31 | 24 | 17 | 20 | 15 | |
| Oesophagus | M | 65 | 75 | 86 | 42 | 48 | 55 |
| F | 62 | 40 | 43 | 40 | 25 | 27 | |
| Stomach | M | 228 | 198 | 227 | 146 | 127 | 145 |
| F | 122 | 130 | 133 | 78 | 83 | 84 | |
| Large intestine | M | 247 | 279 | 258 | 158 | 179 | 164 |
| F | 323 | 298 | 346 | 206 | 190 | 218 | |
| Rectum | M | 147 | 150 | 154 | 94 | 96 | 98 |
| F | 125 | 118 | 119 | 80 | 75 | 75 | |
| Bronchus, trachea, and lung | M | 859 | 868 | 889 | 551 | 556 | 566 |
| F | 256 | 265 | 298 | 164 | 169 | 188 | |
| Breast | M | 2 | 4 | 3 | 1 | 3 | 2 |
| F | 481 | 509 | 478 | 307 | 324 | 301 | |
| Cervix uteri | F | 79 | 94 | 95 | 50 | 60 | 60 |
| Corpus uteri | F | 55 | 52 | 42 | 35 | 33 | 26 |
| Ovary, fallopian tube, and broad ligament | F | 155 | 160 | 139 | 99 | 102 | 88 |
| Prostate | M | 278 | 311 | 293 | 178 | 199 | 187 |
| Bladder and other urinary organs | M | 136 | 147 | 193 | 87 | 94 | 123 |
| F | 73 | 80 | 56 | 47 | 51 | 35 | |
| Skin, all forms | M | 94 | 106 | 99 | 60 | 68 | 63 |
| F | 60 | 58 | 54 | 38 | 37 | 34 | |
| Brain | M | 97 | 85 | 84 | 62 | 54 | 54 |
| F | 65 | 61 | 72 | 42 | 39 | 45 | |
| Lymphosarcoma and reticulum-cellsarcoma | M | 43 | 32 | 34 | 28 | 20 | 22 |
| F | 33 | 34 | 40 | 21 | 22 | 25 | |
| Leukaemia | M | 109 | 113 | 118 | 70 | 72 | 75 |
| F | 80 | 81 | 80 | 51 | 52 | 50 | |
| All other and unspecified sites | M | 540 | 527 | 555 | 346 | 337 | 354 |
| F | 470 | 502 | 508 | 300 | 320 | 320 | |
| Total cancer deaths | M | 2 901 | 2 952 | 3 061 | 1 860 | 1 889 | 1 950 |
| F | 2 465 | 2 513 | 2 527 | 1 575 | 1 602 | 1 592 | |
Cerebrovascular Disease—Cerebrovascular disease, the third of the principal causes of death in New Zealand, affects mainly the late-middle-aged and the elderly. In 1981, 2920 persons died of the disease. Of these, only 119 were below 50 years of age, and 2801 were 50 years of age or above.
The World Health Organisation defines cerebrovascular disease as follows:
“Cerebrovascular diseases are diseases of the central nervous system (the brain and spinal cord) of vascular origin. The term covers a wide range of clinical manifestations, varying from subarachnoid haemorrhage resulting from a rupture of Berry aneurysm on the one hand to arteriosclerotic Parkinsonism and dementia on the other.”
The incidence of deaths from cerebrovascular disease over a series of years is shown in the following table. After reaching a peak in 1972 the rate has generally declined. The 1981 rate of 925 per million of mean population is a record low rate.
| Year | Deaths | Rate* |
|---|---|---|
| * Rate per million of mean population. | ||
| 1966 | 3,067 | 1,143 |
| 1967 | 2,825 | 1,035 |
| 1968 | 3,110 | 1,128 |
| 1969 | 3,070 | 1,104 |
| 1970 | 3,213 | 1,140 |
| 1971 | 3,310 | 1,156 |
| 1972 | 3,447 | 1,182 |
| 1973 | 3,513 | 1,179 |
| 1974 | 3,458 | 1,136 |
| 1975 | 3,235 | 1,048 |
| 1976 | 3,074 | 986 |
| 1977 | 3,162 | 1,011 |
| 1978 | 2,995 | 957 |
| 1979 | 3,027 | 969 |
| 1980 | 3,158 | 1,009 |
| 1981 | 2,920 | 925 |
INFANT AND PERINATAL MORTALITY—The following table shows New Zealand perinatal mortality numbers and rates for three recent years. An infant death is defined as a live-born infant dying before the first year of life is completed. A neonatal death is defined as the death of a live-born infant before the 28th day of life; a post neonatal death as the death of a live-born infant between the 28th day and the first year of life.
Perinatal Mortality—Perinatal deaths comprise still births and deaths in the first week of life. The late fetal death (still births) and the perinatal mortality rate are calculated per 1000 total births (still births plus live births), while the death rate for neonatal and infant death is calculated per 1000 live births.
| Death | Year | Maori | Non-Maori | Total Population | |||
|---|---|---|---|---|---|---|---|
| No. | Rate | No. | Rate | No. | Rate | ||
| Late fetal | 1980 | 53 | 8.2 | 313 | 7.0 | 366 | 7.2 |
| 1981 | 44 | 6.6 | 269 | 6.1 | 313 | 6.1 | |
| Early neonatal | 1980 | 36 | 5.6 | 221 | 5.0 | 257 | 5.1 |
| 1981 | 33 | 5.0 | 190 | 4.3 | 223 | 4.4 | |
| Perinatal | 1980 | 89 | 13.7 | 534 | 12.0 | 623 | 12.2 |
| 1981 | 77 | 11.6 | 459 | 10.3 | 536 | 10.5 | |
| Neonatal | 1980 | 42 | 6.5 | 260 | 5.9 | 302 | 6.0 |
| 1981 | 41 | 6.2 | 250 | 5.7 | 291 | 5.7 | |
| Post neonatal | 1980 | 86 | 13.4 | 269 | 6.1 | 355 | 7.0 |
| 1981 | 60 | 9.1 | 248 | 5.6 | 308 | 6.1 | |
| Infant | 1980 | 128 | 19.9 | 529 | 12.0 | 657 | 13.0 |
| 1981 | 101 | 15.3 | 498 | 11.3 | 599 | 11.8 | |
In a review of neonatal and postnatal deaths, issued by Department of Health in November 1976, it was shown that 8 countries, selected on the basis of their having one million or more population and on their reporting of data regarded by World Health Organisation as complete, had a lower mortality rate than New Zealand. These 8 were Sweden, Finland, Japan, Denmark, the Netherlands, Norway, France, and Switzerland. The following table shows infant mortality rates for selected countries (including some of the 8) during 1980. The figures represent deaths per 1000 live births.
| Country | Age of Child | ||||
|---|---|---|---|---|---|
| Under 1 Year | Under 1 Day | 1 and Under 7 Days | 7 and Under 28 Days | 1 Month and Under 1 Year | |
| Sources: World Health Statistics Annual 1982; Deaths, Australian Bureau of Statistics 1980; Childhood Mortality Statistics England and Wales 1980. | |||||
| Deaths per 1000 Live Births | |||||
| Australia | 10.7 | 4.0 | 1.9 | 1.2 | 3.6 |
| Denmark | 8.4 | 2.8 | 1.7 | 1.1 | 2.9 |
| England and Wales | 12.0 | 3.4 | 2.8 | 1.5 | 4.4 |
| Netherlands | 8.6 | 2.1 | 2.4 | 1.2 | 2.9 |
| Norway | 8.1 | 2.3 | 1.7 | 1.1 | 3.0 |
| Sweden | 6.9 | 1.8 | 2.4 | 0.8 | 2.0 |
| New Zealand | 13.0 | 3.3 | 1.7 | 0.9 | 7.0 |
Causes of Infant Mortality—Deaths from the principal causes of infant mortality, and the rate per 1000 live births, are shown for the Maori, non-Maori, and total population in the following table. The data refer to 1981.
| Cause of Death | Maori | Non-Maori | Total Population | |||
|---|---|---|---|---|---|---|
| Number of Deaths | Rate Per 1000 Live Births | Number of Deaths | Rate Per 1000 Live Births | Number of Deaths | Rate Per 1000 Live Births | |
| Source: National Health Statistics Centre. | ||||||
| Infectious and parasitic diseases | 2 | 0.3 | 4 | 0.1 | 6 | 0.1 |
| Malignant neoplasms | – | – | 3 | 0.1 | 3 | 0.1 |
| Diseases of the nervous system | 4 | 0.6 | 5 | 0.1 | 9 | 0.2 |
| Diseases of the circulatory system | – | – | 4 | 0.1 | 4 | 0.1 |
| Diseases of the respiratory system | 7 | 1.1 | 26 | 0.6 | 33 | 0.6 |
| Diseases of the digestive system | 1 | 0.2 | 3 | 0.1 | 4 | 0.1 |
| Congenital anomalies | 12 | 1.8 | 127 | 2.9 | 139 | 2.7 |
| Perinatal causes— | ||||||
| Birth injury | 4 | 0.6 | 7 | 0.2 | 11 | 0.2 |
| Hyaline membrane disease | 7 | 1.1 | 36 | 0.8 | 43 | 0.8 |
| Other anoxic and hypoxic conditions | – | – | 6 | 0.1 | 6 | 0.1 |
| Immaturity | 6 | 0.9 | 23 | 0.5 | 29 | 0.6 |
| Other perinatal causes | 10 | 1.5 | 69 | 1.6 | 79 | 1.6 |
| Sudden infant death syndrome | 40 | 6.1 | 168 | 3.8 | 208 | 4.1 |
| Accidents, poisonings, and violence (external causes) | 8 | 1.2 | 11 | 0.2 | 19 | 0.4 |
| Remainder (all other causes) | – | – | 6 | 0.1 | 6 | 0.1 |
| Total, all infant deaths under one year | 101 | 15.3 | 498 | 11.3 | 599 | 11.8 |
The data for infants shown in the previous table are not strictly comparable with those for years prior to 1979. The adoption in 1979 of the Ninth Revision of the WHO International Classification of Diseases has influenced coding practices. The main changes include a re-assignment of infectious and respiratory diseases from their specific categories into that of “Other perinatal causes” and an internal restructuring of the whole perinatal area. This latter modification is related to the recommendation by WHO of a restyled Medical Certificate of Causes of Fetal and Neonatal Death which was adopted by New Zealand in 1978. This provided for a dual emphasis on both the main disease or condition in the fetus or infant and on the main maternal disease or condition affecting the fetus or infant. In the table, the cause of death has been selected according to the main disease affecting the neonate.
Another change which is related to the use of the Ninth Revision is that there is now a specific code for sudden infant death syndrome.
MATERNAL DEATHS—The New Zealand Maternal Mortality Research Amendment Act of 1979, which replaced the Maternal Mortality Research Act of 1968, defines a maternal death as:
A death that occurs during pregnancy or within a period of 3 months after the date of the conclusion of a pregnancy;
A death of a woman who at the time of her death was suffering from chorionepithelioma or hydatidiform mole.
This definition is for national use only and covers a wider range of cases than the maternal mortality definition recommended by the World Health Organisation. Maternal deaths from complications of pregnancy, childbirth, and the puerperium numbered 3 in 1981, with a rate of 0.6 per 10 000 live births.
Maternal deaths occurring during pregnancy or within 3 months of delivery but not due to complications of pregnancy or childbirth or the puerperium numbered 13 in 1981 with a rate of 2.6 per 10 000 live births.
DEATHS OF PRE-SCHOOL CHILDREN—Recent Yearbooks have included a review of mortality rates among children aged 1 to 4 years in New Zealand and in selected overseas countries. New Zealand's ranking has been disappointingly low.
In 1981 New Zealand's age-specific mortality rate for children aged 1–4 was 79.6 per 100 000 compared with 36.1 per 100 000 in Sweden (1980), 51.1 per 100 000 in England and Wales (1980), and 68.8 per 100 000 in the United States (1977).
Various explanations have been attempted, but the fact remains that New Zealand pre-schoolers are at a higher risk of accidental death than pre-schoolers in many other countries with similar standards of living.
The following table shows the number of deaths of pre-school children from accidents and violence in New Zealand during 1981. The leading causes, accounting for 49 of the 72 deaths, were accidents involving drowning and motor vehicles.
| Causes of Death | Sex | Age (In Years) | Total | |||
|---|---|---|---|---|---|---|
| 1 | 2 | 3 | 4 | |||
| Drowning | M | 8 | 6 | 2 | 3 | 19 |
| F | 3 | 3 | 1 | 2 | 9 | |
| Motor vehicle accidents | M | 4 | 3 | 2 | 3 | 12 |
| F | 2 | 4 | 3 | – | 9 | |
| Falls | M | 2 | 1 | 1 | – | 4 |
| F | – | 1 | – | – | 1 | |
| Fires | M | 1 | 1 | 1 | 2 | 5 |
| Homicide | M | 1 | 1 | – | – | 2 |
| F | – | – | 1 | – | 1 | |
| Electric current | M | 2 | – | – | – | 2 |
| Scalds | M | 1 | – | – | – | 1 |
| F | 1 | – | – | – | 1 | |
| Mechanical suffocation | M | 1 | – | – | – | 1 |
| F | 1 | – | – | – | 1 | |
| Air transport accidents | M | – | – | – | 1 | 1 |
| Injury caused by animal | M | 1 | – | – | – | 1 |
| Machinery | M | – | – | 1 | – | 1 |
| Poisoning | M | 1 | – | – | – | 1 |
| Total | M | 22 | 12 | 7 | 9 | 50 |
| F | 7 | 8 | 5 | 2 | 22 | |
| Total | 29 | 20 | 12 | 11 | 72 | |
DEATHS AMONG TOTAL POPULATION FROM EXTERNAL CAUSES—Accidents, poisonings, and violence caused approximately 8 percent of the total deaths in each of the years 1976 to 1980, and 7 percent in 1981.
The following table shows deaths from external causes for the latest 3 years. In this table, falls on board ship and from horseback (if any) are classified as transport accidents.
The sharp increase in rates for “Other transport accidents” is influenced by the deaths of aircraft passengers and crew in the Mount Erebus air disaster of 1979. Over half of those deaths were not registered until 1980 so both 1979 and 1980 rates show an increase.
| Causes of Death | Number of Deaths | Rate per Million of Mean Population | ||||
|---|---|---|---|---|---|---|
| 1979 | 1980 | 1981 | 1979 | 1980 | 1981 | |
| * Includes drowning from water transport. | ||||||
| Motor-vehicle accidents | 594 | 622 | 707 | 190 | 199 | 224 |
| Other transport accidents | 179 | 204 | 65 | 57 | 65 | 21 |
| Accidental poisoning | 32 | 31 | 22 | 10 | 10 | 7 |
| Accidental falls | 359 | 413 | 320 | 115 | 132 | 101 |
| Accidents caused by machinery | 20 | 30 | 21 | 6 | 10 | 7 |
| Accidents caused by fire and explosion of combustible material | 46 | 34 | 44 | 15 | 11 | 14 |
| Accidents caused by firearms | 21 | 14 | 6 | 7 | 4 | 2 |
| Accidental drowning and submersion* | 131 | 143 | 114 | 42 | 46 | 36 |
| Suicide and self-inflicted injury | 302 | 337 | 320 | 97 | 108 | 101 |
| Homicide | 49 | 40 | 42 | 16 | 13 | 13 |
| All other external causes | 177 | 183 | 164 | 57 | 58 | 52 |
| Total deaths from accidents, poisoning, or violence | 1 910 | 2 051 | 1 825 | 611 | 655 | 578 |
An analysis of deaths registered during 1981 by the principal external causes and by sex and age group is given in the following table and in the notes following it.
| Age Group (In Years) | Motor Vehicle Accidents | Accidental Drownings | Accidental Poisonings | Accidental Falls | ||||
|---|---|---|---|---|---|---|---|---|
| M | F | M | F | M | F | M | F | |
| Under 15 | 35 | 35 | 25 | 10 | 2 | – | 8 | 4 |
| 15–24 | 218 | 76 | 19 | 3 | – | – | 16 | 1 |
| 25–34 | 77 | 23 | 19 | 1 | 5 | 1 | 6 | – |
| 35–44 | 39 | 15 | 8 | 3 | 2 | 1 | 8 | – |
| 45–54 | 31 | 10 | 12 | 2 | – | 1 | 4 | 1 |
| 55–64 | 32 | 20 | 6 | – | 1 | 2 | 7 | 2 |
| 65–74 | 22 | 26 | 3 | 2 | 5 | – | 15 | 10 |
| 75 and over | 22 | 26 | – | 1 | – | 2 | 60 | 178 |
| Total | 476 | 231 | 92 | 22 | 15 | 7 | 124 | 196 |
| Age Group | Suicide and Self-inflicted Injury | Homicide | All Accidents, Poisonings, and Violence* | |||
|---|---|---|---|---|---|---|
| M | F | M | F | M | F | |
| * Includes causes other than those shown in table. | ||||||
| Under 15 | 4 | – | 3 | 3 | 107 | 66 |
| 15–24 | 50 | 10 | 6 | 6 | 354 | 107 |
| 25–34 | 37 | 16 | 8 | 5 | 184 | 55 |
| 35–44 | 42 | 8 | – | 4 | 122 | 37 |
| 45–54 | 31 | 12 | 1 | – | 96 | 30 |
| 55–64 | 36 | 14 | – | – | 106 | 44 |
| 65–74 | 29 | 9 | 3 | 2 | 97 | 62 |
| 75 and over | 12 | 10 | 1 | – | 114 | 244 |
| Total | 241 | 79 | 22 | 20 | 1 180 | 645 |
Accidental Falls—There were 320 deaths from accidental falls in 1981. This is one accident area in which the total female mortality exceeds the male. However, as shown in the preceding table, there is an excess of male deaths over female deaths between the ages of 15 and 74 years. At 75 years of age and above, the higher life expectancy of females ensures that more elderly women than elderly men are exposed to the risk of fatal falls.
In 1981 the home was the place of occurrence of 40 percent of fatal accidental falls and, in fact, falls are the chief cause of death in home accidents.
Site of Non-transport Accidents—The place of occurrence of fatal non-transport accidents (excluding surgical and medical misadventure and late effects of accidental injury) is shown in the following table. As mentioned previously, falls are the chief cause of accidental fatalities in the home, exacting a heavy toll of the aged and infirm. Accidents occurring at home and in residential institutions (rest homes, hospitals, etc.) accounted for 65 percent of all fatal non-transport accidents in 1981.
| Place of Occurrence | Number of Accidents | Rate per Million of Mean Population | ||||
|---|---|---|---|---|---|---|
| 1979 | 1980 | 1981 | 1979 | 1980 | 1981 | |
| Home (including home premises and vicinity and any non-institutional place of residence) | 263 | 293 | 252 | 84 | 94 | 80 |
| Farm (including buildings and land under cultivation, but excluding farm and home premises) | 25 | 30 | 33 | 8 | 10 | 10 |
| Mine and quarry | 3 | 7 | 4 | 1 | 2 | 1 |
| Industrial places and premises | 25 | 23 | 18 | 8 | 7 | 6 |
| Places for recreation and sport | 10 | 13 | 13 | 3 | 4 | 4 |
| Street and highway | 24 | 17 | 7 | 8 | 5 | 2 |
| Public building (building used by the general public or a particular group of the public) | 16 | 14 | 13 | 5 | 4 | 4 |
| Residential institution (homes, hospitals, etc.) | 142 | 179 | 145 | 45 | 57 | 46 |
| Other specified places | 115 | 130 | 83 | 37 | 42 | 26 |
| Place not specified | 72 | 34 | 39 | 23 | 11 | 12 |
| Total | 695 | 740 | 607 | 222 | 236 | 192 |
Water Accidents by Location—The following table, prepared by the New Zealand Water Safety Council, shows provisional figures for drownings by location and age group during the year ended 31 December 1983. Included in the table are 9 possible suicides, and 2 suicides. One powerboat collision is not included in the table.
| Location | Aye in Years | ||||||||||
|---|---|---|---|---|---|---|---|---|---|---|---|
| Under 5 | 5–10 | 11–15 | 16–20 | 21–30 | 31–40 | 41–50 | 51–60 | Over 60 | Age Not Known | Total | |
| Board sailing | – | – | – | – | – | – | – | – | – | – | – |
| Boating— | |||||||||||
| Lake | – | – | – | 1 | 2 | – | – | – | – | – | 3 |
| River | – | 1 | – | 2 | 1 | 3 | – | – | – | – | 7 |
| Harbour | – | – | – | – | 1 | – | 2 | – | 1 | – | 4 |
| Sea | – | – | – | 2 | 9 | 4 | 3 | 2 | – | 4 | 24 |
| Ponds | – | – | – | – | – | – | – | – | – | – | – |
| Excavation site | – | – | – | – | – | – | – | – | – | – | – |
| Fishing off rocks | – | – | – | – | 1 | – | 2 | – | – | – | 3 |
| Harbours | – | – | – | 1 | 6 | 3 | 2 | 1 | 2 | – | 15 |
| Household (bath/bucket) | 3 | – | – | – | 1 | – | – | 1 | 1 | – | 6 |
| Lakes, dams, and ponds | 2 | – | – | 1 | 1 | 1 | – | – | – | – | 5 |
| Pools— | |||||||||||
| Motel/hotel | – | – | – | – | – | – | – | – | 1 | – | 1 |
| Private swimming | 10 | 1 | 1 | – | – | – | – | – | – | – | 12 |
| Public swimming | – | – | – | – | – | 1 | – | – | – | – | 1 |
| Rivers, streams, and other running waters | 6 | 2 | 1 | 5 | 11 | 2 | 3 | 2 | 8 | 2 | 42 |
| Scuba diving | – | – | – | – | 1 | 3 | 1 | – | – | – | 5 |
| Seas and beaches | – | 2 | 1 | 2 | 4 | 4 | 2 | 1 | 2 | 2 | 20 |
| Sheep and cattle troughs | 2 | – | – | – | – | – | – | – | – | – | 2 |
| Sludge pond | – | – | – | – | – | – | – | – | – | – | – |
| Snorkelling | – | – | – | 1 | 1 | – | – | – | – | – | 2 |
| Total | 23 | 6 | 3 | 15 | 39 | 21 | 15 | 7 | 15 | 8 | 152 |
Marriage may be solemnised in New Zealand either by a celebrant included in the list of marriage celebrants under the Marriage Act 1955, or before a duly appointed registrar or deputy registrar of marriages. A licence must be obtained from a registrar of marriages before a marriage by a marriage celebrant can be solemnised. Marriage by a marriage celebrant may be solemnised at any time between 6 o'clock in the morning and 8 o'clock in the evening. Marriage before a registrar can be solemnised at any time during the hours the office of the registrar is open for the transaction of public business; notice of intended marriage must be given to a registrar of marriages by one of the parties to the proposed marriage.
The Marriage Amendment Act 1976 extended the right of solemnising marriages to nominated members of approved organisations of a non-religious character. Justices of the Peace may also be nominated to act as marriage celebrants.
In the case of a person under 20 years of age, not being a widow or widower, the consent of parents or guardian is necessary. Consent of a District Court judge may be sought in cases of refusal by any person whose consent is required.
Since 1933 the minimum age for marriage has been 16 years of age. No marriage shall be deemed to be void, however, by reason only of an infringement of the minimum age.
Since 1 April 1952 it has been required under the Maori Purposes Act 1951 that every marriage to which a Maori is a party shall be solemnised in the same manner, and its validity shall be determined by the same law, as if each of the parties was a non-Maori.
NUMBERS AND RATES—The numbers of marriages and rates during recent years are shown below.
During the 1970s marriage rates declined (as did birth rates), but over the past 3 years marriage rates have increased slightly.
| Year | Number | Crude Marriage Rate* | General Marriage Rate† |
|---|---|---|---|
* Per 1000 mean population. †Per 1000 mean not-married population aged 16 years and over. | |||
| 1977 | 22,589 | 7.19 | 30.35 |
| 1978 | 22,426 | 7.13 | 29.43 |
| 1979 | 22,326 | 7.12 | 28.71 |
| 1980 | 22,981 | 7.31 | 28.84 |
| 1981 | 23,660 | 7.49 | 28.93 |
| 1982 | 25,537 | 8.02 | 30.08 |
| Country | Crude Rate per 1000 of Mean Population |
|---|---|
| * As at 1981. | |
| United States | 10.8 |
| New Zealand | 8.0 |
| Australia | 7.7 |
| Canada | 7.6 |
| United Kingdom* | 7.1 |
| Japan | 6.6 |
| Belgium* | 6.5 |
| West Germany | 5.9 |
| Netherlands | 5.8 |
| France* | 5.8 |
| Italy* | 5.5 |
| Sweden | 4.4 |
MARITAL STATUS PRIOR TO MARRIAGE—The following table gives marital status prior to marriage for the latest available 5 years.
| Year | Single | Widowed | Divorced | Total Persons Married | |||
|---|---|---|---|---|---|---|---|
| Bridegroom | Bride | Bridegroom | Bride | Bridegroom | Bride | ||
| 1978 | 18,206 | 18,383 | 842 | 919 | 3,378 | 3,124 | 44,852 |
| 1979 | 17,909 | 18,192 | 844 | 928 | 3,573 | 3,206 | 44,652 |
| 1980 | 18,400 | 18,696 | 851 | 876 | 3,730 | 3,409 | 45,962 |
| 1981 | 18,515 | 18,835 | 881 | 945 | 4,264 | 3,880 | 47,320 |
| 1982 | 18,908 | 19,412 | 887 | 1,022 | 5,742 | 5,103 | 51,074 |
The following table shows marriages by marital status of marriage partners prior to that event.
| Year | Marriages Between Bachelors and | Marriages Between Widowers and | Marriages Between Divorced Men and | ||||||
|---|---|---|---|---|---|---|---|---|---|
| Spinsters | Widows | Divorced Women | Spinsters | Widows | Divorced Women | Spinsters | Widows | Divorced Women | |
| 1978 | 16,607 | 215 | 1,384 | 153 | 408 | 281 | 1,623 | 296 | 1,459 |
| 1979 | 16,379 | 190 | 1,340 | 165 | 432 | 247 | 1,648 | 306 | 1,619 |
| 1980 | 16,823 | 181 | 1,396 | 157 | 411 | 283 | 1,716 | 284 | 1,730 |
| 1981 | 16,743 | 188 | 1,584 | 166 | 423 | 292 | 1,926 | 334 | 2,004 |
| 1982 | 16,833 | 186 | 1,889 | 138 | 411 | 338 | 2,441 | 425 | 2,876 |
In the period 1978–82 more male divorcees than female divorcees remarried. Over forty years ago during the 1938–40 period, remarriages of widows totalled only 67 to every 100 remarriages of widowers. In the changed social climate of 1978–82, 109 widows remarried to every 100 widowers who did so.
AGES OF PERSONS MARRIED—Until recently, the proportion of minors among persons marrying has been increasing over a fairly long period of years but it is now declining slightly. On 1 January 1971 the age of majority was lowered from 21 to 20 years of age. In 1982, 1 bride in every 8 was under 20 years of age. Bridegrooms were usually older than their brides; only 1 in every 42 was under 20 years of age.
Of the persons married in 1982, 4006 or 7.84 percent were under 20 years of age; 21 775 or 42.63 percent were returned as 20–24 years; 11 183 or 21.90 percent as 25–29 years; 8055 or 15.77 percent as 30–39 years; and 6055 or 11.86 percent as 40 years of age and over.
The following table relates to the year ended December 1982.
| Age of Bridegroom, in Years | Age of Bride, in Years | Total Bridegrooms | ||||||
|---|---|---|---|---|---|---|---|---|
| Under 20 | 20–24 | 25–29 | 30–34 | 35–39 | 40–44 | 45 and Over | ||
| Under 20 | 384 | 208 | 15 | – | 1 | 1 | – | 609 |
| 20–24 | 2,438 | 6,673 | 728 | 116 | 26 | 7 | 1 | 9,989 |
| 25–29 | 461 | 3,670 | 1,969 | 414 | 87 | 16 | 4 | 6,621 |
| 30–34 | 90 | 878 | 1,168 | 638 | 203 | 79 | 14 | 3,070 |
| 35–39 | 19 | 240 | 455 | 458 | 338 | 111 | 39 | 1,660 |
| 40–44 | 4 | 76 | 136 | 269 | 280 | 198 | 100 | 1,063 |
| 45 and over | 1 | 41 | 91 | 194 | 301 | 420 | 1,477 | 2,525 |
| Total brides | 3 397 | 11 786 | 4 562 | 2 089 | 1 236 | 832 | 1 635 | 25 537 |
The following table shows the percentage distribution by age group of males and females marrying. It refers to the 5-year period 1971–76 and to recent individual years.
| Period | Under 20* | 20–24* | 25–29 | 30–34 | 35–39 | 40–44 | 45 and Over | Total |
|---|---|---|---|---|---|---|---|---|
| * Under 21 and 21–24 respectively before 1971. | ||||||||
| Males | ||||||||
| 1971–76 | 8.15 | 51.70 | 20.62 | 6.60 | 3.25 | 2.28 | 7.40 | 100.00 |
| 1977 | 5.47 | 47.17 | 22.93 | 8.87 | 4.15 | 2.70 | 8.68 | 100.00 |
| 1978 | 5.25 | 46.68 | 23.31 | 9.16 | 4.59 | 2.72 | 8.30 | 100.00 |
| 1979 | 4.76 | 45.56 | 23.95 | 9.85 | 4.63 | 2.72 | 8.52 | 100.00 |
| 1980 | 4.11 | 44.28 | 25.05 | 10.48 | 4.76 | 3.04 | 8.28 | 100.00 |
| 1981 | 3.52 | 42.24 | 25.42 | 10.98 | 5.41 | 3.58 | 8.85 | 100.00 |
| 1982 | 2.38 | 39.12 | 25.93 | 12.02 | 6.50 | 4.16 | 9.89 | 100.00 |
| Females | ||||||||
| 1971–76 | 30.82 | 44.97 | 11.03 | 4.02 | 2.15 | 1.69 | 5.33 | 100.00 |
| 1977 | 24.69 | 44.86 | 13.53 | 5.71 | 3.08 | 1.98 | 6.12 | 100.00 |
| 1978 | 23.05 | 46.21 | 13.62 | 6.06 | 3.29 | 1.99 | 5.78 | 100.00 |
| 1979 | 21.27 | 46.79 | 14.54 | 6.15 | 3.35 | 2.26 | 5.63 | 100.00 |
| 1980 | 19.02 | 47.78 | 15.13 | 6.69 | 3.42 | 2.23 | 5.73 | 100.00 |
| 1981 | 16.51 | 47.48 | 16.17 | 7.32 | 3.96 | 2.63 | 5.93 | 100.00 |
| 1982 | 13.30 | 46.15 | 17.86 | 8.18 | 4.84 | 3.26 | 6.41 | 100.00 |
The average ages (arithmetic mean) at marriage for both males and females are shown in the following table.
| Year | Average Age at Marriage | |
|---|---|---|
| Bridegrooms | Brides | |
| 1977 | 27.90 | 24.93 |
| 1978 | 27.87 | 24.95 |
| 1979 | 28.06 | 25.07 |
| 1980 | 28.71 | 25.77 |
| 1981 | 29.20 | 26.25 |
| 1982 | 29.99 | 26.97 |
The average ages of bachelors and spinsters at marriage are considerably lower than those shown in the preceding table, which covers all parties and is naturally affected by the inclusion of remarriages of widowed and divorced persons. The average ages of grooms and brides for each of the latest 5 years according to marital status were as shown in the next table.
| Year | Bridegrooms | Brides | ||||
|---|---|---|---|---|---|---|
| Bachelors | Divorced | Widowers | Spinsters | Divorced | Widows | |
| Age in Years | ||||||
| 1978 | 24.51 | 38.58 | 57.74 | 21.94 | 34.94 | 51.17 |
| 1979 | 24.59 | 38.61 | 57.04 | 22.06 | 34.73 | 50.96 |
| 1980 | 25.22 | 39.23 | 57.87 | 22.71 | 35.80 | 51.87 |
| 1981 | 25.41 | 39.68 | 58.15 | 22.98 | 35.89 | 51.88 |
| 1982 | 25.69 | 39.70 | 58.76 | 23.23 | 36.09 | 52.31 |
The foregoing figures give the average age at marriage, but these do not correspond with the modal or most popular age, if the age at which the most marriages are celebrated may be so termed. The modal age for brides in 1982 was 20 years. In the case of bridegrooms the most popular age has varied and for recent years it has been 21 to 24; in 1982 it was 23 years.
Marriages of Minors—Of every 1000 men who married in 1982, 24 were under 20 years of age. Among brides, 133 in every 1000 were under 20. Since 1 January 1971 the age of majority has been 20 years. In 384 marriages in 1982 both parties were given as under 20 years of age, in 3013 marriages the bride was returned as a minor and the bridegroom as an adult, and in 225 marriages the bridegroom was a minor and the bride an adult.
There has been a substantial and steady increase in the proportion of minors (aged under 20 years) among persons marrying over the last decade. This decline maybe attributed chiefly to changes in nuptiality patterns.
In the table below figures are given for the latest available 5 years.
| Years | Age in Years | Total Minors and 20-Year-olds | |||||||
|---|---|---|---|---|---|---|---|---|---|
| 16 | 17 | 18 | 19 | 20 | 16–20 Years | 16–19 Years | Rate per 100 Marriages 16–20 Years | Rate per 100 Marriages 16–19 Years | |
| Bridegrooms | |||||||||
| 1978 | 15 | 74 | 308 | 781 | 1,606 | 2,784 | 1,178 | 12.41 | 5.25 |
| 1979 | 10 | 73 | 257 | 723 | 1,502 | 2,565 | 1,063 | 11.49 | 4.76 |
| 1980 | 10 | 55 | 256 | 624 | 1,433 | 2,378 | 945 | 10.35 | 4.11 |
| 1981 | 9 | 46 | 214 | 563 | 1,282 | 2,114 | 832 | 8.94 | 3.52 |
| 1982 | 6 | 24 | 169 | 410 | 1,163 | 1,772 | 609 | 6.94 | 2.38 |
| Brides | |||||||||
| 1978 | 244 | 686 | 1,661 | 2,577 | 3,037 | 8,205 | 5,168 | 36.58 | 23.04 |
| 1979 | 174 | 578 | 1,523 | 2,474 | 3,003 | 7,752 | 4,749 | 34.72 | 21.27 |
| 1980 | 160 | 457 | 1,351 | 2,404 | 3,099 | 7,471 | 4,372 | 32.51 | 19.02 |
| 1981 | 100 | 408 | 1,169 | 2,229 | 3,019 | 6,925 | 3,906 | 29.27 | 16.51 |
| 1982 | 60 | 278 | 979 | 2,080 | 2,975 | 6,372 | 3,397 | 24.95 | 13.30 |
MARRIAGES BY RELIGION OF OFFICIATING MINISTER—Of the 25 537 marriages performed in 1982, Anglican clergymen officiated at 4757, Presbyterian at 3966 and Roman Catholic at 2865. In addition 4059 were conducted by other clergymen, 4333 by registrars, and 5557 by marriage celebrants.
The number of marriages being performed by ministers of religion and registrars is declining and more couples are taking the opportunity to be married by a marriage celebrant.
The following table shows the proportions of marriages by ministers of the largest churches and before marriage celebrants and registrars in each of the 5 last years.
| Church | Percentage of Marriages | ||||
|---|---|---|---|---|---|
| 1978 | 1979 | 1980 | 1981 | 1982 | |
| * Including marriages performed by marriage celebrants for the years 1978 and 1979. | |||||
| Anglican | 20.68 | 19.54 | 20.04 | 19.16 | 18.63 |
| Presbyterian | 19.71 | 18.40 | 17.20 | 16.77 | 15.53 |
| Roman Catholic | 12.52 | 12.22 | 12.49 | 12.01 | 11.22 |
| Marriage Celebrant | .. | .. | 15.30 | 18.08 | 21.76 |
| Other* | 25.26 | 29.11 | 16.18 | 16.60 | 15.89 |
| Before registrars | 21.83 | 20.71 | 18.79 | 17.38 | 16.97 |
| Total | 100.00 | 100.00 | 100.00 | 100.00 | 100.00 |
The foregoing figures must not be taken as an exact indication of the religious professions of the parties married, as it does not necessarily follow that both (or even one) of the parties are adherents of the church whose officiating minister performed the ceremony, and persons married before registrars may belong, in greater or lesser proportion, to any or none of the churches. Of the total population at the 1981 Census of Population, 25.7 percent were recorded as adherents of the Anglican Church, 16.7 percent Presbyterian and 14.3 percent Roman Catholic, while 23.5 percent were of no religion, objected to stating their religious profession, or did not specify any religious profession.
DISSOLUTION OF MARRIAGE—Under the Matrimonial Proceedings Act 1963, a petition for divorce could be presented to the High Court on one or more of several grounds, which included adultery, desertion, separation by agreement for not less than 2 years, separation by decree or separation or separation order for not less than 2 years, and the parties living apart for 4 years and not likely to be reconciled. Where the parties were separated or living apart one of the parties must have been resident in New Zealand for at least 2 years immediately preceding the filing of the petition. The Court was required to give consideration to the possibility of reconciliation of the parties to the marriage.
The Family Proceedings Act 1980, which replaces the Matrimonial Proceedings Act, came into force on 1 October 1981. It lays down only one ground on which an order dissolving a marriage can be made—that is, that the marriage has broken down irreconcilably. The Act also makes provision for orders declaring a marriage void and for declarations of presumption of death. To establish that the marriage has broken down irreconcilably, the parties must be living apart, and have been doing so for the previous 2 years. The provisions for counselling and the promotion of conciliation have been strengthened.
Petitions filed in the High Court prior to 1 October 1981 proceed as formerly, but from that date applications for dissolution of marriage must be made to Family Courts. The following table gives the grounds for petitions and applications filed and for decrees absolute and orders granted during the 2 years 1981 and 1982.
| Ground | Petitions Filed | Applications Filed | Decrees Absolute | Orders Granted | ||||
|---|---|---|---|---|---|---|---|---|
| 1981 | 1982 | 1981 | 1982 | 1981 | 1982 | 1981 | 1982 | |
| Adultery | 647 | … | … | … | 721 | 317 | … | … |
| Desertion | 82 | … | … | … | 120 | 53 | … | … |
| Separation by agreement | 3,065 | … | … | … | 4,220 | 1,307 | … | … |
| Separation by Court Order | 986 | … | … | … | 1,351 | 452 | … | … |
| Having lived apart for 4 years or more | 533 | … | … | … | 683 | 278 | … | … |
| Non-consummation | 9 | … | … | … | 10 | 10 | … | … |
| Other and irreconcilable breakdown | 9 | … | 2,846 | 9,828 | 9 | – | 1,476 | 9,978 |
| Total | 5 331 | … | 2 846 | 9 828 | 7 114 | 2 417 | 1 476 | 9 978 |
The next table shows the duration of marriage by ages of husbands and wives at the time of marriage, for cases in which dissolution orders and decrees absolute were granted in 1982.
| Duration of Marriage (in Years) | Age (in Years) at Marriage | |||||||
|---|---|---|---|---|---|---|---|---|
| Under 20 | 20–24 | 25–29 | 30–34 | 35–39 | 40–44 | 45 and Over (including Not Stated) | Total | |
| Husbands (All Petitions and Applications) | ||||||||
| Under 5 | 80 | 384 | 172 | 72 | 26 | 21 | 67 | 822 |
| 5–9 | 462 | 1,852 | 618 | 239 | 114 | 60 | 153 | 3,498 |
| 10–14 | 449 | 1,712 | 460 | 165 | 75 | 41 | 106 | 3,008 |
| 15–19 | 246 | 1,179 | 404 | 120 | 58 | 31 | 31 | 2,069 |
| 20 and over | 172 | 1,635 | 843 | 209 | 71 | 29 | 39 | 2,998 |
| Total | 1 409 | 6 762 | 2 497 | 805 | 344 | 182 | 396 | 12 395 |
| Wives (All Petitions and Applications) | ||||||||
| Under 5 | 280 | 327 | 100 | 29 | 17 | 19 | 50 | 822 |
| 5–9 | 1,501 | 1,289 | 348 | 136 | 79 | 48 | 97 | 3,498 |
| 10–14 | 1,353 | 1,225 | 203 | 83 | 49 | 31 | 64 | 3,008 |
| 15–19 | 900 | 885 | 161 | 47 | 36 | 18 | 22 | 2,069 |
| 20 and over | 1,028 | 1,496 | 307 | 97 | 29 | 12 | 29 | 2,998 |
| Total | 5 062 | 5 222 | 1 119 | 392 | 210 | 128 | 262 | 12 395 |
MARRIAGE GUIDANCE—The aim of the National Marriage Guidance Council of New Zealand is to enhance people's ability to establish and maintain close personal relationships, particularly in the field of marriage and family life.
Education Service—The council has trained 164 tutors to lead courses in the community, including working with schools, prisons, hospitals and other agencies on such topics as “Couples communication”, “Making it Alone”, and “Pre-marriage”. In 1983, 690 courses were held involving 13 700 people. The tutors help individuals to identify feelings, values, and needs, and to practise new ways of behaving, either working with groups of people who wish to examine a particular aspect of marriage and family life, or through the use of the public media.
Counselling Services—During 1983, 10 943 cases involving 34 957 people were handled by the council's counselling services. Interviews totalled 35 650, and cases included community referral and Family Court and Social Welfare benefit referral.
The National Marriage Guidance Council operates in 50 centres within 35 local councils, with 300 volunteer counsellors and 293 supervisors. Local councils have an executive, and education and counselling committees to oversee their services, and a secretary to co-ordinate the daily activities. Large councils have a director. The national office based in Wellington provides a range of support services and co-ordinates all the training of volunteers.
FURTHER INFORMATION—Further information on vital statistics will be found in the following publications.
Department of Statistics publications—
Vital Statistics (Annual).
Monthly Abstract of Statistics.
Family Statistics of New Zealand 1978 (Bulletin, 1978).
New Zealand Children 1979 (Bulletin, 1979).
Justice Statistics 1978: Divorce and Domestic Proceedings (Bulletin, 1979).
Life Tables 1975- 77 (1979).
Demographic Bulletin.
Social Trends in New Zealand (1977).
New Zealand Males and Females: A Statistical Comparison (Bulletin, 1980).
Pocket Digest of Statistics (Annual).
Department of Health publications—
Trends in Health and Health Services (3-yearly).
Mortality and Demographic Data (Annual).
Cancer Data (Annual).
Hospital and Selected Morbidity Data (Annual).
Department of Health Special Report Series—
Infant and Foetal Loss in New Zealand (1964).
Occupational Mortality Among Male Population Other than Maori, 20 to 64 Years of Age (1967).
Maori-European Comparisons in Mortality (1972).
Cancer of the Lung in New Zealand (1973).
Bibliography of the Epidemiology of New Zealand and its Island Territories (1969).
Diseases of the Ear, Nose, and Throat in Maori Children (1965).
Trends in Notifiable Disease (1964).
Domestic Accidents (1970).
Lung Function and Chronic Bronchitis in New Zealand (1978).
Perinatal Mortality in New Zealand, 1972–73 (1977).
Parliamentary papers—
The Public Health (Annual Report of the Department of Health, Parl. paper E. 10).
Report of the Department of Social Welfare (Parl. paper E. 12).
Table of Contents
The nation's health services are the responsibility of a partnership of central and local government, private medical practitioners, para-medical workers, charitable and religious organisations, and private citizens, with the Central Government providing encouragement, financial assistance and incentives, and assuming final responsibility. This has been a deliberate policy of successive Governments, although emphases have varied from time to time according to political and economic conditions and demands for specific services.
REORGANISATION OF HEALTH SERVICES: Area Health Boards—For the past decade there have been continuing efforts to integrate and coordinate health care in the public, private and voluntary sectors. To this end, the Area Health Boards Act 1983 came into force on 1 April 1984. The Act integrates public health agencies (hospital boards and Department of Health district offices) to form area health boards, which are established on the request of hospital boards and by an Order-in-Council made on the recommendation of the Minister of Health. There is provision for 2 or more hospital boards to join together to form an area health board.
Private and voluntary sectors can become involved in health planning by participation in service development groups and community committees.
Health Service Personnel Commission—The Health Service Personnel Act 1983, which came into full effect on 1 April 1984, established the Health Service Personnel Commission. The commission is the employing authority for health services under the State Services Conditions of Employment Act 1977. Hospital boards and area health boards remain the legal employers of staff but exercise their authority in accordance with policies established by the commission.
The general functions, duties, and powers of the Health Service Personnel Commission include:
the provision of employment conditions for employees of area health boards and hospital boards;
the coordination of pay-fixing throughout the public sector health service;
the development of a nationwide career service within hospital boards, area health boards, and the commission by establishing consistent personnel policies and practices.
Board of Health—The Health Amendment Act (No. 2) 1982, which came into force on 3 December 1982, sets out the broad principles and framework by which the advisory machinery of the health services can be organised within a reconstituted Board of Health. It is intended that the board will rationalise the extensive network of existing statutory boards, committees and advisory bodies to within standing committees covering the range of health services. This will provide a permanent framework within which each major aspect of health services policy and operation can be kept under review.
ADMINISTRATION—The functions of local authorities are defined by statute and regulation. Elected local authorities must appoint a sufficient number of health inspectors qualified under the Health Inspectors Qualifications Regulations 1975. Where a local authority is too small to need a separate, full-time inspector, the Act permits two or more to combine to share the cost. In some smaller sparsely-populated districts where a local authority does not employ its own inspector, the departmental inspectors of health do the work and the authority pays for it. Only 25 percent of inspectors are employed by the department.
In each of the 18 health districts, the medical officer of health, who is a medical practitioner with special qualifications in community medicine, is the adviser to all local authorities in his/her district; in some cases his/her approval is required before action can be taken by a local authority, and in others he/she is the first line of appeal against its decisions. He/she is required to keep the Director-General of Health and the Board of Health informed of local authority deficiencies in their responsibilities under the Health Act.
Diseases which are scheduled in the Health Act 1956 must be notified by doctors and hospitals to the medical officer of health who is responsible for control measures; within this area the local authority health inspector is subject to his/her direct supervision and control. New programmes of immunisation are undertaken by the department and, when these have been established, vaccines are provided free to general practitioners who are encouraged in this work. Quarantine arrangements for both aircraft and ships comply with obligations under the International Health Regulations. Medical officers of health administer this service. The broad objective is the control of communicable and chronic diseases and keeping New Zealand free of quarantinable diseases.
Accident prevention and the health of industrial and agricultural workers is the responsibility of the Department of Health in conjunction with the Department of Labour. The aim is to prevent occupational disease, control toxic hazards, raise standards of first-aid services, and ensure the safe use of agricultural chemicals. Food and nutrition standards aimed at protecting the consumer are laid down. An extensive programme, backed by legislation, governs the packaging, labelling, storage, and sale of poisons. Special environmental problems, such as radiation protection, occupational health, and atmosphere pollution, are also the responsibility of the Department of Health.
Public health services in the Department of Health are organised to reflect 2 distinct and identifiable areas; viz, environmental factors affecting health, and the promotion of personal good health in the community. The Division of Public Health is responsible for environmental health, quarantine, occupational health and toxicology, radiation protection, and the quality of food. The Division of Health Promotion gives emphasis to disease prevention and better personal health through the expansion of family health, health education, nutrition, and public health nursing services.
The objectives of health education programmes are to increase understanding of the value of health, to inform people of health services available, and to equip them with knowledge and skills they can use to solve health problems.
Family health responsibilities include medical and nursing supervision of infant, pre-school, and school children; the inspection of schools and child care centres; and the immunisation of infants against poliomyelitis, etc.
A school dental service, staffed by dental nurses and directed by dentists, provides dental care and health education for all pre-school, primary and intermediate school children. Private dental practitioners provide treatment for teenagers until their sixteenth birthday, or if they remain dependent, until their eighteenth birthday.
The Department of Health is responsible for the organisation and control of nursing services to the public in general; in hospitals (public or private); in homes for the aged, incapacitated, or infirm; and in any other places where the Department of Health has responsibility. Considerable delegation has taken place, mainly to hospital boards whose chief nurse is responsible for the administration of the services provided. The department keeps its nursing services and those provided by hospital boards under continuous review. Basic nursing education is provided in 23 hospital schools of nursing and 12 technical institutes. Formal post-basic nursing education at diploma/degree level is available from Massey University, and 4 technical institutes have post-basic diploma courses. Short post-basic courses in learning and teaching are available from 2 teachers' colleges, and similar short courses in community health nursing are available from 4 technical institutes. “Bridging” courses to enable registered nurses to gain comprehensive registration are available from 3 technical institutes.
Within its public health nursing service, the department employs almost 500 qualified nurses. Their work includes supervising the health of babies and small children, taking part in child health (including health education) programmes, providing a service to small industries and people in “at risk” occupations, taking part in disease control programmes, and assisting elderly people and people with mental health problems.
The Department of Health works with and seeks the advice and help of boards, committees, and councils such as the Board of Health; the Medical Research, Hospitals Advisory, Pharmacy, Nursing, and Radiation Protection Advisory Councils; the Hospital Works and Medical Services Advisory Committees; and the Dietitians, Physiotherapy, Occupational Therapy, Opticians, Dental Technicians, and Plumbers, Gasfitters, and Drainlayers Boards. In all, officers of the department serve on over 100 boards, committees, and other organisations concerned with health.
In addition the Department of Health liaises with professional and other associations, voluntary health and welfare agencies, the universities, and other Government departments.
The department is responsible for the administration of a number of Acts dealing with health and social welfare. These will be found listed under Public General Acts in the Official section of this Yearbook.
Expenditure of the Department of Health in the 4 latest years is given in the following table.
| Activity Programme | 1979–80 | 1980–81 | 1981–32 | 1982–83 |
|---|---|---|---|---|
* Mostly grants to hospital boards. †From 1 April 1978 family health services have been combined with public health and environmental protection and medical and pharmaceutical services. | ||||
| $(thousand) | ||||
| Administrative services | 8,511 | 10,625 | 12,308 | 13,469 |
| Dental services | 28,824 | 30,864 | 33,145 | 35,045 |
| Hospital services* | 827,693 | 1,010,211 | 1,207,358 | 1,331,448 |
| Medical research | 5,037 | 6,723 | 6,716 | 8,308 |
| Medical and pharmaceutical services† | 213,497 | 238,184 | 273,128 | 303,380 |
| Public health and environmental protection† | 40,451 | 50,376 | 61,031 | 66,132 |
| Welfare services | 8,414 | 5,470 | 3,921 | 4,396 |
| Data processing services | 5,109 | 5,573 | 5,511 | 5,573 |
| Total | 1,137,536 | 1,358,026 | 1,603,118 | 1,767,751 |
| Less departmental receipts | 1,322 | 1,857 | 1,894 | 1,753 |
| Net expenditure | 1,136,214 | 1,356,169 | 1,601,224 | 1,765,998 |
ENVIRONMENTAL HEALTH: Local Authority Control—The provision and proper maintenance of public water supplies and sewerage systems, the disposal of refuse, the condition of dwellinghouses, the control of offensive trades, the control of noise nuisances, and the hygiene of premises (including eating houses) in which food is manufactured and sold, are primarily the responsibility of local authorities, but the Department of Health exercises general supervision. In the case of some of the smaller local authorities the necessary inspections are made by departmental inspectors on behalf of, and by arrangement with, the local authority. The department undertakes the basic training of health inspectors employed by local authorities and conducts specialist and refresher courses for them.
Department of Health Control—The objectives of the Department of Health in environmental health control are: (a) to create and maintain a healthy environment for the general public by the application of the principles of preventive medicine and the administration of legislation directly and indirectly related to this end; (b) to conserve hearing through the control of excessive noise from occupational and other environmental sources; (c) to control air pollution; (d) to provide scientific services and undertake research on all aspects of the use of ionising radiation with special emphasis on the medical applications and public health aspects; to monitor public exposure to radiation from all sources and to take action to reduce this where necessary; to promote general understanding of the nature of the hazards involved in radiation exposure in their current perspective.
Air Pollution Control—The Clean Air Act 1972 provides for the control of existing and potential sources of air pollution through a system of licensing processes known to emit air pollutants, and a requirement for all sources of emission to adopt the best practicable means for containment, thus minimising emissions to the atmosphere. Under the Clean Air Act the Clean Air Council gives advice directly to the Minister of Health and the Director-General of Health on clean air matters of concern to individuals or groups of individuals or the owners and operators of over 900 licensed premises throughout New Zealand. These licensed premises, particularly the larger ones, are monitored by Health Department officers to ensure they conform to the requirement for containment by meeting their licence conditions.
Clean air zones, the first of which has been established in Christchurch, can be required, under sections 12 and 14 of the Act, when a need arises to impose special controls on the emission of air pollutants. In Christchurch there is a particular problem with domestic coal smoke and the Act provides for tighter control of domestic heating appliances and the granting of financial assistance to certain householders with the object of reducing domestic smoke emissions from coal burning.
Air pollution monitoring programmes are conducted in some main centres, and particularly in Christchurch and Auckland. These surveys indicate that the winter-time pollution levels in Christchurch exceed the WHO recommended standards for particular concentrations on many occasions: and evidence of a significant contribution from motorcar exhaust emissions, in terms of carbon monoxide and lead, has been noted particularly in busy intersections. However, the low level of photochemical smog detected in the country reduces the need for legislation to control exhaust emissions beyond that already proposed for lead in petrol reductions when expanded refinery facilities become operative after 1984.
CONTROL OF DRUGS—The definitions of “drug” in the Food and Drug Act 1969 established groups to which differing provisions apply. Therapeutic drugs (that is, those substances or mixtures used internally or externally for the diagnosis, prevention, or treatment of any illness or injury of the human body or for modifying any physiological process or desires or emotions, and chemical contraceptives) are required, before being introduced commercially, to be “acceptable”, according to a procedure under the Food and Drug Act 1969. No new therapeutic drug may be distributed in New Zealand without the consent of the Minister of Health, under sections 12 and 13 of the Act.
This Act also requires that any drug which has been changed in any way in use, strength, or labelling must not be distributed until 90 days after notice of the change has been given to the Director-General of Health, who may consent to earlier distribution of a changed drug if he or she is satisfied of the drug's safety. If the Director-General considers the change to be of such character or degree that the drug ought not to be distributed without the consent of the Minister, the drug is referred to the Minister and may not be distributed until the Minister's specific consent has been obtained. A therapeutic drug is also restricted to sale from pharmacies only, unless special authority is given for general distribution in a schedule to the Therapeutic Drugs (Permitted Sales) Regulations 1978.
A cosmetic, dentifrice, detergent, disinfectant, or antiseptic does not have to be “cleared” for marketing unless claims in labelling or advertising bring it within the definition of a “therapeutic drug”.
The Food and Drug Act 1969 provides for the analysis of any drug which may be sold, offered for sale, or exposed for sale, and for the inspection of any place where there is any drug intended for sale. Measures provide for the prevention of adulteration and for the inspection of places where drugs are manufactured or packed. Control over medical advertisements is also incorporated in this legislation.
Under the Poisons Act 1960 and the Poisons Regulations 1964, certain drugs may not be sold to the public except on the prescription of a doctor, a dentist, or a veterinary surgeon. This legislation also requires specific warning statements to be included in the labelling of certain drugs such as the antihistamines, aspirin, paracetamol, and hexachlorophane.
Controlled Drugs—Under the Misuse of Drugs Act 1975 the import, export, cultivation, production, possession, distribution, supply, and administration of a wide range of narcotic and other drugs is strictly controlled. Except for medical practitioners, dentists, pharmacists, veterinary surgeons, those having the care of patients being lawfully supplied with drugs, the patients themselves, and other specified persons, or those who have been issued with a licence under the Act, the procuration, manufacture, possession, consumption, supply, or offer to supply controlled drugs is a serious offence.
Controlled drugs are divided into three classes. The heaviest penalties are for offences involving drugs in Class A, which include heroin, lysergide, desomorphine, and cantharidin. Offences involving the possession or use of drugs in Class C, which include cannabis plants, fruit, and seeds, are to be punished with fines but not by imprisonment unless by reason of previous convictions or exceptional circumstances.
Illegal dealing in controlled drugs is subject to heavy penalties.
To curb drug abuse, the Department of Health, Customs, and Police jointly set up a National Drug Intelligence Bureau in 1972.
FOOD AND NUTRITION—The Food and Drug Act 1969 provides for the analysis, by analysts appointed under the Act, of any articles of food or drink which may be sold, offered for sale, or exposed for sale, and for the inspection of any place where there is any food intended for sale. Stringent measures are provided for the prevention of adulteration and for the inspection of places where food is manufactured or packed. Regulations lay down minimum standards for many classes of food, control additives of all kinds, and deal with labelling of food packages. Control is also established over all utensils and appliances coming into contact with food. Regular sampling of foods is undertaken by departmental inspectors and the samples are analysed in the Chemistry Division (DSIR) or its branch laboratories.
An important provision of the Act controls all kinds of publicity whereby a purchaser of any food would possibly be deceived in regard to the properties of that food, whether or not it is standardised by regulations.
A new Food Act, which came into force on 1 August 1984, represents a further stage in the revision of the Food and Drug Act 1969 and the Poisons Act 1960. It follows the Toxic Substances Act 1979 and is a companion to the new Medicines Act. This new Food Act consolidates and amends the provisions of the Food and Drug Act 1969 that relate to food.
A Food Standards Committee, composed of highly qualified persons, meets regularly to discuss the latest technical advances in food production and to make appropriate recommendations for amendments to the legislation.
The nutrition section of the Department of Health provides advice on nutrition and dietetics to dietary departments of hospitals, and food service departments of welfare and other institutions. It is responsible for nutrition education programmes and provides a nutrition information service for Government departments, organisations concerned with the production and marketing of food, and the public. The section also carries out dietary research projects, generally in liaison with medical research teams concerned with nutrition research.
OCCUPATIONAL HEALTH AND TOXICOLOGY—Since 1957 medical officers of health have been directly responsible for occupational health within their own districts. The objective of the occupational health progammes is, in consultation with labour, management, the medical profession, and other groups, to assist in maintaining and where possible improving the health of workers.
The Department of Labour, which is responsible for accident prevention, hours of work, employment of women and children etc., calls to the attention of the Department of Health any health problems which factory inspectors may encounter. The Health Act 1956 gives to medical officers of health or other authorised officers of the Department of Health the same powers and authority as inspectors of factories with regard to the health and welfare sections of the Factories and Commercial Premises Act 1981. The Department of Health supplies information and advice on occupational health and related matters, approves respirators for use when abrasive blasting or when working with asbestos, arranges for any necessary medical examinations, and where necessary suspends workers where the work they are involved in is detrimental to their health.
A similar understanding has been established with the Waterfront Industry Commission and New Zealand Railways, and illustrates the general pattern of arrangements between the Department of Health and other Government departments. There are 3 occupational health laboratories in Auckland, Wellington, and Christchurch which provide facilities for the investigation of work hazards. Three teams of specialist doctors, nurses, and scientists reinforce the usual staff available to medical officers of health to investigate particular occupational health problems occurring in districts. These teams also study problems arising in industries such as forestry, which are to be found throughout the country.
Occupational Diseases—Notifiable occupational diseases are scheduled in the Health Act 1956 and details of diseases notified are published annually in the report of the Director-General of Health.
Commercial, Household, and Agricultural Poisons—The advertising, distribution, use, labelling, and packing of all poisons and toxic substances is controlled under the Toxic Substances Act 1979 and the Toxic Substances Regulations 1983.
The Toxic Substances Act and Regulations which came into effect on 1 August 1983 replaced provisions of the Poisons Act 1960 and Poisons Regulations 1964 which covered non-medicines.
Manufacturers, importers and packers must notify the Director of the Division of Public Health before manufacturing, importing, or packing in New Zealand any toxic substance which they have not previously dealt with. This includes any toxic substance bearing a common name, chemical name, or trade name which has not previously been distributed in New Zealand.
Control of Health Hazards—An increasing number of specific health hazards are formally controlled, namely: asbestos, lead processes, electroplating, spray painting, sand blasting (siliceous blasting agents in factories are prohibited), fumigation, aerial application of poisons (where, in conjunction with the Civil Aviation Division of the Ministry of Transport, a special rating is required by pilots), and agricultural chemicals. Occupational health guidelines have been issued to monitor organophosphate pesticide users, and to protect workers in the following areas: aluminium, spraypainting and lead industries.
Similar guidelines for the electroplating industry and those using formaldehyde or formaldehyde-based products are being prepared.
Medical and Nursing Services in Industry—The Department of Health encourages industry to develop preventive medical and nursing services and many industries employ an occupational health nurse. In some areas the department's occupational health centres serve as a base for a preventive service to small industries, and in others, visiting occupational health nursing services are provided.
First Aid—The statutory requirements concerning first aid in factories are set out in the Factories and Commercial Premises Act 1981 (Section 45) and the Factories (First Aid) Regulations 1966. This legislation is administered by the Department of Labour. In industries where more than 50 people are employed, the person responsible for first aid must be either a registered nurse or the holder of a valid certificate of the St John's Ambulance or the New Zealand Red Cross Society.
National Acoustics Centre—The National Acoustics Centre assists with the early detection of deafness and conservation of hearing. The centre conducts and promotes research into noisy industries, occupational deafness, and other forms of deafness. An advisory service is provided for those working with deaf people and training is given to those responsible for testing groups for hearing loss. Investigations into environmental noise are also undertaken by the regional noise engineers.
Radiation Protection—The National Radiation Laboratory provides the administrative and technical services required by the Radiation Protection Act 1965 and Regulations 1973 and the Transport of Radioactive Materials Regulations 1973. Prior approval must be obtained for the import or export of any radioactive material. Each owner of irradiating apparatus (source of X-rays) or radioactive material must ensure that they are used only under the control of a person specifically licensed for the purpose.
The laboratory provides the licensees with free monitoring, advisory, calibration, or other services which will assist in achieving radiation safety. Trained officers regularly visit all places where sources of ionising radiation are used. A service is available for measuring the exposures received by radiation workers.
The laboratory advises the requirements for the transport and disposal of radioactive materials and is responsible for monitoring a wide range of environmental samples for natural or man-made radioactivity.
FAMILY HEALTH—Medical practitioners give ante-natal, neo-natal, and post-natal attention under the Social Security Act. Free ante-natal clinics are established in connection with all public maternity hospitals and maternity wards. Ante-natal classes to prepare mothers for the baby's arrival are also available, and doctors can refer patients to these to supplement their own ante-natal instructions. In the case of women living far away from the main centres of population, ante-natal work is supplemented by the public health nurses employed by the Department of Health, or by district nurses employed by hospital boards.
Approximately 99 percent of confinements take place in maternity hospitals or in maternity units of public hospitals. The medical care of the mother and child is based on co-operation between the Department of Health, hospital boards, and the medical and nursing professions. All private maternity hospitals are licensed under the Hospitals Act 1957 and the Department of Health has responsibility for ensuring that regulations regarding buildings, equipment, and staff are observed. Medical officers of health, through their senior nursing staff, exercise general supervision over the work of private hospitals in the local areas.
Family Planning—Family planning advice can be obtained from general practitioners, private specialists, and from any one of the 40 clinics operated by the N.Z. Family Planning Association (Inc.) in various centres throughout the country. The Government provides a grant to meet the cost of salaries of doctors, nurses, and health assistants (clinical) employed by the association in approved clinics.
In addition, the Government also provides a grant to the N.Z. Association of Natural Family Planning (Inc.) to meet the payment of the salary of the national co-ordinator, an initial 1-week residential training course for up to 70 teachers each year, and an annual 3-day training course for up to 100 teachers.
A number of hospital boards have established family planning clinics within their obstetrics and gynaecology departments to provide additional facilities for the public and training for doctors, medical students, and nurses, and other boards are being encouraged to provide these facilities.
Child Health—The Department of Health offers a preventive child health service. Babies are normally examined by family doctors at about 6 weeks of age and again at 9 months. Additional examinations are given whenever there is anxiety over physical, mental, or emotional development. Public health nurses undertake supervision of some infants and pre-school children although the major proportion of this service is provided by the nurses of the Plunket Society. A comprehensive examination including vision and hearing testing is recommended for all children between the ages of 3 and 4 years. When necessary the children are referred to family doctors or medical officers of the Department of Health.
A consultative service is provided for schools, with special emphasis on the health supervision of handicapped children, both in the normal schools and in special education classes. Nursing staff make regular visits to all schools and, in consultation with teachers and parents, investigate children who appear to be in need of support and refer them if necessary for the appropriate services. All new entrants to school receive a health assessment and examination by the public health nurse. Parent participation is encouraged. Correspondence School children are kept under health supervision as necessary and any school child requiring treatment is referred to the appropriate family doctor. Vision and hearing testing is carried out by trained staff for preschool children, and again on school entry and in Form I. These tests are available on request to any child suspected of either defect. Vision tests are also carried out in secondary schools in Form IV.
The Government supports the Children's Health Camps Board which maintains 7 permanent camps for the short-stay placement of children convalescent after illness, for those whose physical health is unsatisfactory, and for those suffering from minor emotional disorders. Medical officers select children for admission and undertake general health supervision of the camps. Children derive benefit from the ordered routine of camp life which provides a diet designed to improve nutrition and a balance of free activity, rest, and sleep. The Department of Education maintains school classes with emphasis on remedial teaching.
Immunisation Programme—Immunisation, which is free, is usually done by the family doctor. The course of injections should be commenced as soon as possible after babies are 3 months old. Protection against diphtheria, whooping cough, and tetanus is a routine procedure and a triple vaccine is used at 3 months and 5 months of age together with an oral vaccine for poliomyelitis. Arrangements can be made for mothers who do not have family doctors to attend with their children at departmental clinics. If necessary, in country areas the public health nurse will visit the home to immunise the child. Booster doses (against diphtheria, tetanus, and polio) are given at 18 months and an additional polio vaccine at 5 years of age. Further booster doses against tetanus only are given at 15 years of age and recommended at 20-yearly intervals. Measles (Morbilli) vaccination is available from family doctors for infants from 12 months of age onwards. Rubella vaccination is available from family doctors for women and girls in the childbearing age groups. Rubella immunisation is also offered to 11-year-old girls at school.
HEALTH HAZARDS AND HEALTH EDUCATION: Alcoholism—In New Zealand alcoholism rates as a major public health problem. There is no accurate measure of the number of alcoholics but experts in the field suggest that there are at least 53 000 chronic alcoholics, and that an average of 10 people (family, friends, and working colleagues) are affected in each case. The figure for chronic alcoholics does not include excessive drinkers, estimated to number over 200 000.
The following table shows the estimated consumption of absolute alcohol per head of total population in New Zealand. The 1982 consumption is the equivalent of about 219 bottles of beer, 24 bottles of table wine, and eight 750 ml bottles of spirits for every citizen over the age of 15, including those who do not drink, or rarely drink, alcoholic beverages. Total per capita consumption of alcohol dropped during 1982 for only the second time since 1970.
| Year | Beer | Wine* | Spirits | Total |
|---|---|---|---|---|
| * Years ended June. | ||||
| litres | ||||
| 1960 | 3.996 | 0.336 | 1.008 | 5.340 |
| 1965 | 4.160 | 0.448 | 1.218 | 5.826 |
| 1970x | 4.670 | 0.789 | 1.070 | 6.530 |
| 1975x | 5.030 | 1.199 | 1.742 | 7.971 |
| 1980x | 4.818 | 1.848 | 1.919 | 8.585 |
| 1981x | 4.873 | 2.024 | 1.970 | 8.867 |
| 1982 | 4.843 | 1.848 | 1.939 | 8.631 |
The primary objectives of the Alcoholic Liquor Advisory Council, which was created in 1977, are to encourage and promote moderation in the use of liquor, to discourage its misuse, and to reduce the personal, social, and economic results of misuse of liquor.
In its first 6 years the council received an income of $1.4 million, $1.8 million, $1.65 million, $2.3 million, $2.6 million and $3.0 million, mainly from levies on alcohol, to meet its wide range of functions. During this period, the Alcoholic Liquor Advisory Council carried out surveys on the drinking habits and attitudes to alcohol of 10 000 adult New Zealanders, and the extent of (and attitudes to) alcohol use among 3000 school pupils. The findings of both surveys have been analysed and published. The council has also established a multi-disciplinary alcohol research unit in association with the Medical Research Council and the University of Auckland School of Medicine and supported independent research projects. It has established an alcoholism counsellor training course which has produced 90 graduates and it has aided in the establishment of 20 basic assessment and treatment facilities by hospital boards.
In association with the Department of Education the council has developed a Health Education Resources Project. This has now provided several kits of resource material on alcohol-related matters for use in secondary schools. Financial assistance and advice has been provided to a wide range of voluntary agencies working in alcohol-related fields; and a library and information resource centre has been established to provide pamphlets, posters, and films. The council has interested over 120 firms and organisations in developing programmes in industry for the treatment of alcohol problems. Handbooks have been developed for doctors and para-medical counsellors, and a series of education and awareness programmes has been promoted through T.V., radio, magazines, and newspapers. When applicable, the council has provided advice and statistical data to the Government, Government departments, and other agencies on control policies, treatment methods and facilities, and other alcohol-related matters. In October 1983 the council launched a major policy document entitled Living with Alcohol: Preventing Misuse which indicates future directions in reducing alcohol abuse and misuse.
Smoking—Smoking, especially cigarette smoking, is an acknowledged public health hazard. It is implicated as an important causative factor in lung cancer, chronic bronchitis, and emphysema, and it greatly increases the risk of heart disease and certain pregnancy-related and neo-natal disorders.
The following table indicates the smoking habits of New Zealand residents (excluding visitors) as recorded at the 1981 Census of Population and Dwellings. In calculating the percentages the relatively small numbers of unspecified cases were omitted.
The Census results indicated that approximately a third (32 percent) of New Zealanders of 15 years of age and over were regular smokers, and that 34.6 percent of males smoked as compared with 29.5 percent of females. The disparity in the percentages of male and female smokers was most marked in the older age groups—for example, 27.1 percent of men aged 60 or over were regular smokers compared with only 16.6 percent of women aged 60 or over. On the other hand, in the youngest age group surveyed, the 15 to 19 year olds, the percentage of girls who smoked regularly exceeded the percentage of boys, a fact that was also noted at the previous survey based on the 1976 Census.
| Smoking Practice | Age Groups (Years) | Total* | |||||
|---|---|---|---|---|---|---|---|
| 15–19 | 20–29 | 30–39 | 40–59 | 60 and over | 1981 | 1976 | |
*1981 figures relate to New Zealand residents aged 15 years and over, whereas 1976 figures relate to all persons (including visitors) in the same age groups. †Never smoked cigarettes regularly or never smoked them at all. ‡Do not smoke now, but used to smoke regularly (one or more cigarettes a day). §Smoke regularly (one or more cigarettes a day). | |||||||
| Percent Males | |||||||
| Never smoked† | 67.7 | 48.0 | 41.1 | 32.0 | 28.4 | 41.7 | 38.7 |
| Not smoking‡ | 5.4 | 13.0 | 21.2 | 30.8 | 44.5 | 23.7 | 21.7 |
| Smoking§ | 26.8 | 39.0 | 37.7 | 37.2 | 27.1 | 34.6 | 39.6 |
| Total | 100.0 | 100.0 | 100.0 | 100.0 | 100.0 | 100.0 | 100.0 |
| Females | |||||||
| Never smoked† | 63.7 | 49.0 | 50.9 | 54.2 | 67.3 | 56.4 | 56.7 |
| Not smoking‡ | 6.4 | 13.4 | 16.1 | 15.5 | 16.0 | 14.1 | 11.6 |
| Smoking§ | 29.9 | 37.6 | 33.0 | 30.2 | 16.6 | 29.5 | 31.7 |
| Total | 100.0 | 100.0 | 100.0 | 100.0 | 100.0 | 100.0 | 100.0 |
Cigarette smoking in New Zealand is probably less prevalent than in the past and in fact, the figures indicate a slight fall between the surveys taken in conjunction with the last two Censuses in 1976 and 1981. However, the high level of smoking among young people, particularly young women, is a major health problem.
Health Education and Information—It is becoming widely recognised that the individual must be encouraged to take an active interest in and responsibility for, his or her own health. This is particularly relevant in such areas as smoking, immunisation, sexually-transmitted diseases, and hearing protection. These and other topics are covered by the health education programmes of the Department of Health.
Medical and dental officers, public health nurses, dental nurses, and inspectors of health all devote some of their time to health education. The health education officer acts as a co-ordinator and stimulates and extends health teaching and health education in the district. Advertisements on health subjects are broadcast on radio or television and published in the press. Leaflets, pamphlets, and posters on many health topics are available from district health offices.
The Department of Health's magazine Health has a circulation of over 95 000 and is issued free on request to the public 4 times a year. It gives health information and publicises various aspects of the department's work.
Officers are available for lectures and discussions on health with schools and community groups.
DENTAL HEALTH—New Zealand's dental health service combines a school dental service for children, dental benefits for adolescents, and private practice for adults. Major hospitals also provide dental services for inpatients and other special groups. There are 15 dental districts, a school for dental nurses in Wellington, and the school of dentistry at the University of Otago.
School Dental Service—The objective of the service is to maintain a high standard of dental health of pre-school and school children by regular and systematic treatment at 6-monthly intervals, commencing at the age of 2½ and continuing through the highest class at primary or intermediate school.
The school dental nurse, after completing the two-year training course, is appointed to a school dental clinic where routine dental care for children is provided. Regular visits are made to the clinic by the Principal Dental Officer and Supervising Dental Nurse, who assist the dental nurse to maintain a high standard of performance in all aspects of the work. Five issues of the School Dental Service Gazette are published each year as a medium for continuing education.
The dental care comprises examination, application of disease prevention measures, fillings in deciduous and permanent teeth, extraction of deciduous teeth, and dental health education. Some children are referred to dentists for additional care which is beyond the scope of the school dental nurses. The cost of such care is usually met as a special dental benefit. Orthodontic treatment and some other specialist services are not provided as part of school dental service or dental benefits programmes.
During the year ended 31 March 1983, 1058 school dental nurses provided dental care for 554 963 children. The treatment included 844 728 fillings and 25 543 extractions. Indicators of the success of the service are the acceptance (71 percent of pre-school children aged 2½ to 5 and 95 percent of the primary school children are enrolled) and the small number of extractions.
Dental Services for Teenagers—Dental care for teenagers up to 16 years of age is provided by private dental practitioners as dental benefits under the Social Security Act, the dentist being reimbursed on a fee-service basis. Children who remain at school after their sixteenth birthday and qualify for the extended family benefit, or who are otherwise dependent upon parents for support, continue to receive dental benefits to their eighteenth birthday.
Treatment is essentially of a nature designed to conserve the natural teeth. There is free choice of dentists, and dentists have the right to decline patients.
At 31 March 1983, a total of 267 646 children were enrolled for general dental benefits. Private practitioners completed 378 306 treatments under the scheme during the year ended 31 March 1983.
Dental Health Education—Dental health education is an integral part of the school dental service and includes activities in the clinics and the classroom. Educational materials are produced by the Department of Health for the school dental service and for general use in the community. Materials specifically for dentists are produced by the Dental Health Committee of the New Zealand Dental Association.
Dental Research—The Dental Unit of the Medical Research Council carries out research in a wide range of dental problems. Further research is undertaken by the School of Dentistry at the University of Otago and there is also a small research unit within the Division of Dental Health of the Department of Health.
Fluoridation—Approximately 64 percent of all persons living in water-reticulated areas are drinking fluoridated water, which reduces the need for dental treatment. This represents approximately 54 percent of the population of New Zealand.
REHABILITATION OF DISABLED CIVILIANS—The rehabilitation of disabled persons has received increasing emphasis over recent years in New Zealand. Public hospitals provide a medical rehabilitation service, with co-operation from Government and other agencies.
Rehabilitation centres for the treatment of the severely disabled are established at Otara in Auckland, Palmerston North, and at the Queen Elizabeth Hospital in Rotorua. For the rehabilitation of persons suffering from spinal injuries, specialist spinal injury centres are provided at Auckland and Christchurch. Geriatric assessment and rehabilitation units have been established by a number of hospital boards. Rehabilitation activities are also carried out in the physical medicine departments of general hospitals, and in psychiatric and psychopaedic hospitals.
The Rehabilitation League is an agent of Government in vocational rehabilitation. The main function of the League is to provide facilities for work assessment and work experience for the disabled. Policy is decided by a central board of management and district committees administer the centres which are established in Auckland, Wellington, Christchurch, Dunedin, and Napier.
A Rehabilitation Co-ordinating Council, comprising senior representatives from the Departments of Labour, Social Welfare, Health, and Education, and the Accident Compensation Corporation, advises the Government on steps to co-ordinate and promote rehabilitation in New Zealand.
HEALTH STATISTICS—The National Health Statistics Centre is responsible for the annual publication of Health Statistics Reports on mortality, morbidity, mental health, cancer, and hospital management as well as the publication of Trends in Health and Health Services every 2 years.
The Centre also prepares special statistics for the various divisions of the Department and for research workers in different fields both in New Zealand and overseas. A constant liaison is maintained with the World Health Organisation (WHO), which is supplied with statistical material giving a picture of health trends in New Zealand. In addition, from time to time, special statistical investigations are made into important aspects of public health and diseases that warrant specific study.
Since July 1975 the Centre has been monitoring the incidence of selected congenital malformations reported by medical practitioners to the Department of Health, and a register of cardiac surgery patients was established in 1983.
NATIONAL HEALTH INSTITUTE—The National Health Institute is one of the science groups which make up the laboratory support services of the Department of Health. It is a unit of the department's Bureau of Public Health and Environmental Protection.
Its laboratories provide diagnostic and reference services in bacteriology, virology, serology and mycology for medical officers of health, hospital and private laboratories, general practitioners and for other sections of the institute. The institute is the national centre for those reference services which are organised on an international basis, such as salmonellosis, leptospirosis, texoplasmosis, influenza, and staphylococcal phage typing. In addition it carries out disease surveillance studies.
Public health laboratories have been established at 5 public hospitals in main centres to assist the department with examination of food, milk, and water, and of public health specimens.
MANAGEMENT SERVICES AND RESEARCH UNIT—This unit provides health care administration and health service managers with advice, where possible on a quantitative basis, for decision-making on the use of health care resources. Close liaison is maintained with operating divisions of the department and national advisory committees through a formal work planning cycle.
Survey research undertaken provides the means by which relative levels of needs and demands can be identified, as well as a basis for the promulgation of alternative proposals to meet those needs and demands. The unit is actively involved in health planning at national, local, and community levels, encouraging both providers and consumers of health care to participate in the development of their own services.
In the health services personnel are the major resource. Projections based on special surveys and regular statistical collections are being developed for many categories of health workers. The implications of these are evaluated so that action can be taken to meet identified needs. Reviews of the patterns of services provided are also undertaken, with increasing attention being paid to the distribution of resources and the use to which they are put.
MEDICAL RESEARCH COUNCIL—The Medical Research Council is the major organisation supporting medical research in New Zealand, and acts as the central coordinating body for this purpose. The council was established in December 1937 as a committee of the Department of Health. It became incorporated as an autonomous body by the Medical Research Council Act 1950 and has subsequently remained independent of the Government, though largely financed by a Government grant. It is also empowered to receive bequests and donations.
The functions of the council are:
To initiate, foster, and support medical research;
To furnish information, advice, and assistance to persons and organisations concerned with medical research;
To collect and disseminate scientific information, including the publication of reports.
The council supports research in its units (autoimmunity, virus, dental and toxicology groups) and in universities and hospitals. It also awards scholarships, fellowships, and travel grants to individuals and assists with the staging of scientific meetings. In 1983 the council supported the equivalent of about 375 full-time research workers. The financial resources available to the council in 1983 were $9.3 million. Support is currently being provided in most fields of medicine. The council's present priority research areas are respiratory disorders, health services, the health of Polynesian populations, paediatrics and child health, mental disorders, accidents, the use and misuse of therapeutic drugs, behavioural factors in health and disease, geriatric medicine and care of the aged, and health education. The council has responsibility to maintain a balance in the research supported throughout New Zealand and maintains a close liaison with other medical research funding bodies. It also represents the medical research community on other bodies and has links with overseas research funding organisations.
MEDICAL COUNCIL—The Medical Council of New Zealand, constituted under the Medical practitioners Act 1968, consists of the Director-General of Health, the deans of the faculties of medicine in the Universities of Otago and Auckland, and eight registered medical practitioners appointed on a representative basis.
The council deals with all applications for registration under the Act. Until an applicant is able to satisfy the council that he/she has obtained house officer experience, in a resident medical capacity, of not less than 12 months or has otherwise obtained comparable experience, registration is on a conditional basis. Persons registered conditionally may practise only in an approved hospital. A medical education committee responsible to the council exercises general supervision over the training of persons conditionally registered. The number of medical practitioners on the register at 30 June 1983 was 7597, but not all are in active practice in New Zealand.
The Medical Council is vested with certain disciplinary powers. Right of appeal to the High Court is provided.
DOCTORS AND DENTISTS—The following table, based on figures in UN World Statistics in Brief 1983, shows for selected countries the number of inhabitants per doctor and per dentist. Figures relating to dentists range from 1974 to 1979.
| Country | Inhabitants | |
|---|---|---|
| Per Doctor | Per Dentist | |
*1981 †1980 ‡1979 §1978 || 1977 | ||
| New Zealand | 635† | 2,920 |
| Australia | 559† | 2,460 |
| England and Wales | 654‡ | 3,460 |
| Denmark | 432§ | 1,150 |
| Sweden | 506§ | 1,160 |
| France | 580|| | 2,010 |
| Netherlands | 560§ | 2,990 |
| West Germany | 452‡ | 1,930 |
| Canada | 548‡ | 2,440 |
| United States | 524§ | 1,910 |
| Japan | 779‡ | 2,600 |
| U.S.S.R. | 261* | 2,510 |
| Iran | 2 282‡ | 16,410 |
| India | 3 586§ | 64,900 |
| Kenya | .. | 134,260 |
| Brazil | .. | 3,120 |
The definition of doctor (physician) used in compiling this table included all graduates of a medical school or faculty actually working in a country in any medical field (practice, teaching, administration, research, laboratory work, etc.). A similar definition referring to graduates or qualified personnel of a dental faculty or school applied to dentists.
REGISTRATION COUNCILS AND BOARDS: Dentists—The Dental Council was constituted under the Dental Act 1963. The functions of the council are to examine and approve of the qualifications of applicants desiring registration as dentists and to exercise disciplinary control over registered dentists.
The number of practising dentists holding annual practising certificates at 31 May 1983 was 1234. Under provisions of the Dental Technicians Regulations 1968, a Registration Board for Dental Technicians was constituted. In 1983 there were 443 registered dental technicians.
Nurses—The Nursing Council of New Zealand was constituted under the Nurses Act 1971. Its primary function is the registration and enrolment of nurses. In this connection it sets minimum standards for registration; makes recommendations on nursing programmes to be undertaken by candidates for examinations for registration; conducts examinations; approves schools of nursing subject to ministerial concurrence; enrols and registers nurses from other countries; and exercises disciplinary powers.
There have been several changes in legislation since 1971. The Nurses Amendment Act 1975 introduced the comprehensive nurse category of registration; and the 1977 Nurses Act required male students to undertake the obstetric nursing part of the general and obstetric nurse programme, thus allowing them to undertake a midwifery course. The Nurses Amendment Act 1983, effective from 1 April 1984, makes changes in the council membership; allows for the development of area health boards as employers of nurses and operators of schools of nursing; differentiates between nursing courses conducted by technical institutes and programmes conducted by hospital schools of nursing; substitutes the Preliminary Proceedings Committee for the Penal Cases Committee; and where a person is registered as a midwife only and not also as a general and obstetric or comprehensive nurse, limits that person's nursing practice to hospital situations.
Programmes and courses currently provided for registration or enrolment are as follows: 3-year student based courses at 12 technical institutes leading to comprehensive nurse registration; 3-year hospital based programmes leading to either general and obstetric, psychiatric, or psychopaedic nurse registration; 1-year hospital based programmes leading to enrolment as nurses; a 6-month hospital based obstetric nursing course for registered general nurses leading to general and obstetric nurse registration; 2-yers programmes leading to a second nursing registration; and in 3 technical institutes, student based bridging courses which allow nurses who already hold one nursing registration to bridge to registration as comprehensive nurses.
During the year 1982–83 there were 35 613 registered and enrolled nurses holding a valid annual practising certificate.
Psychologists—The Psychologists Board is constituted under the Psychologists Act 1981. The board is concerned with the registration and conduct of persons engaged in psychology. At 31 March 1984 there were 561 registered psychologists.
Physiotherapists—The New Zealand Physiotherapy Board is constituted under the Physiotherapy Act 1949. The board's functions are the examination and registration of candidates for physiotherapy practice, the issuing of special licences, and the conduct of those registered under the Act.
The training period for physiotherapists is 3 years. Full-time training is conducted at the Physiotherapy Department, Auckland Technical Institute, and at the School of Physiotherapy, Otago Polytechnic, Dunedin. From 1 February 1976 the control of this school was transferred from Otago Hospital Board to Otago Polytechnic Council. All students are required to pass the State Examination in Physiotherapy to qualify for registration.
During 1983, 119 physiotherapists were registered, bringing the total on the register to 3707. Some 1535 physiotherapists hold current annual practising certificates.
Occupational Therapists—The Occupational Therapy Board is constituted under the Occupational Therapy Act 1949. The board is concerned with the registration and conduct of persons engaged in the practice of occupational therapy.
The Central Institute of Technology, Upper Hutt, conducts the 3-year course of training and clinical experience is gained at hospitals. Students who successfully complete the course are awarded a diploma in occupational therapy and then registered. There are approximately 550 occupational therapists in active practice.
Dietitians—The Dietitians Board, constituted under the Dietitians Act 1950, is concerned with the training, examination, and registration of persons engaged in the practice of dietetics.
The training period for a dietitian is, in the case of the holder of a degree of bachelor of home science conferred by the University of Otago or of the holder of a diploma in home science of the University of Otago, 12 months in a hospital training school. In 1983 there were 678 registered dietitians. Annual Practising Certificates were issued to 256 dietitians.
Optometrists and Dispensing Opticians—The Optometrists and Dispensing Opticians Act 1976 provides for the constitution of an Opticians Board, consisting of four registered optometrists to be appointed on the nomination of the New Zealand Optometrical Association Incorporated, one registered optometrist who is actively engaged in teaching optometry to be appointed on the nomination of the Council of the University of Auckland, two registered dispensing opticians to be appointed on the nominations of the Association of Dispensing Opticians and Optical Dispensers of New Zealand Incorporated, two ophthalmological specialists who are registered in respect of that speciality under the Medical Practitioners Act 1968, to be appointed on the nomination of the New Zealand Medical Association, and one other person being an officer of the Public Service employed in the Department of Health.
By February 1984, 338 Annual Practising Certificates had been issued for the year ended 31 March 1984. This included optometrists and dispensing opticians.
Podiatrists—The Medical and Dental Auxiliaries Act 1966 provided for the constitution of a Podiatrists Board. The Podiatrists Regulations 1982 specify that the board shall consist of one officer of the Department of Health, and three persons entitled to registration as podiatrists who have been nominated by the New Zealand Society of Podiatrists, and a medical practitioner who has been nominated jointly by the Medical Association of New Zealand and the Executive Committee of the New Zealand Orthopaedic Association. The board's functions include the promotion of high standards of education and conduct among persons engaged or intending to become engaged in podiatry, the exercising of disciplinary powers in accordance with the Act in respect of registered podiatrists and the conducting of special examinations. The board also deals with all applications for registration under the Act.
There are approximately 270 registered podiatrists, but not all are engaged in active practice. A significant number of those in active practice work only part time. In pursuance of the Government's policy, a number of hospital boards are establishing community-oriented podiatry services, principally intended for the elderly.
Chiropractors—The Chiropractic Board is constituted under the Chiropractors Act 1982, and is concerned with the registration and conduct of persons engaged in the practice of chiropractic.
There is no training available in New Zealand. Qualifications approved by the board are obtained from Australia, England, Canada and USA. Graduates must pass a board examination to qualify for registration. In 1983 there were 102 chiropractors practising.
Plumbers, Gasfitters, and Drainlayers—The Plumbers, Gasfitters, and Drainlayers Board consists of 13 members including: representatives from the Municipal and Counties Association, the Gas Association, the New Zealand Drainlayers Association, the Master Plumbers Society (2), the Plumbers, Gasfitters, and Related Trades Industrial Union of Workers (2), Department of Labour, Department of Education, Department of Health, and an engineer employed by a local authority or drainage board, plus one other person, to be appointed by the Minister.
The board is concerned with the registration of plumbers, gasfitters, and drainlayers. It issues annual licences to craftsmen and registered plumbers, gasfitters, and drainlayers, and limited certificates. It has also authority and responsibility for disciplinary action against craftsmen plumbers and gasfitters if it is established they have done unsatisfactory work.
Drainlaying may be carried out only by registered drainlayers, and gasfitting may be carried out only by craftsmen gasfitters or by registered gasfitters and holders of limited certificates working in the employment, or under the supervision, of craftsmen gasfitters.
Except in specially exempted areas, all sanitary plumbing defined in the Plumbers, Gasfitters, and Drainlayers Act 1976 can be performed only by craftsmen and registered plumbers and holders of limited certificates working in the employment or under the supervision of craftsmen plumbers.
Specifications and standards of workmanship and materials in plumbing work are prescribed in the provisions of the Drainage and Plumbing Regulations enacted under the Health Act.
Pharmacists—In October 1983 there were 3127 names on the Pharmaceutical Register in New Zealand. All registered pharmacists, except those who notify the registrar that they have conscientious objection to membership, automatically become members of the Pharmaceutical Society of New Zealand, the society's affairs being managed by a council constituted by the Pharmacy Act 1970.
The council consists of 12 members, 11 being pharmacists, and 1 a barrister appointed by the Minister of Health. Seven members are elected on a district basis by registered pharmacists who are proprietors of pharmacies and 4 by members of the Pharmaceutical Society who are not in the previous category. The main function of the council of the Pharmaceutical Society is to administer the Pharmacy Act and generally to protect and promote the interests of the profession of pharmacy and the public interests.
It is a specific requirement of the Pharmacy Act that pharmacies in New Zealand be at all times maintained under the immediate supervision and control of a registered pharmacist.
The present system for pharmacy education requires a minimum of 3 years' attendance at the School of Pharmacy, Central Institute of Technology, Upper Hutt, at which the diploma in pharmacy is obtained. There is also a 4-year degree course in pharmacy at the University of Otago. Graduates from both courses are required to gain 52 weeks pre-registration experience before becoming eligible for registration as pharmacists.
Any pharmacist or company in which not less than 75 percent of the share capital is owned by a pharmacist or pharmacists may establish one pharmacy. Unqualified persons or companies in which less than 75 percent of the share capital is pharmacist-owned must, however, secure the consent of the Pharmacy Authority, set up under the Act, before commencing business, and in all cases the establishment of more than one pharmacy under the same ownership, or the holding of an interest in more than one pharmacy by any person, is subject to the consent of the authority. All pharmacies must be registered with the society.
In October 1982 there were 1142 community pharmacies in New Zealand employing about 2038 pharmacists. Some 260 pharmacists were working outside community pharmacies in hospitals, government departments, and the pharmaceutical industry.
Medical Radiation Technologists—The Medical Radiation Technologists' Board is constituted under the Medical and Dental Auxiliaries Act 1966. The board is concerned with the registration, education and conduct of persons engaged in the practice of medical radiation technology. It has representation from the New Zealand Society of Radiographers and Medical Radiation Technologists Inc., the New Zealand Branch of the Royal Australasian College of Radiologists, and the Departments of Health and Education.
There are 5 classes of medical radiation technology: diagnostic radiography; radionuclide imaging; therapeutic radiography; ultrasound imaging; and magnetic resonance imaging.
The training period for medical radiation technologists in diagnostic radiography is 3 years. There are 6 schools of Radiography undertaking the Conjoint Board Diploma of Qualification in Diagnostic Radiography in New Zealand. They are at Auckland, Christchurch, Dunedin, Palmerston North, Waikato and Wellington Hospitals.
The training period for therapeutic radiography is also 3 years. The course is conducted at the Central Institute of Technology, Heretaunga, and successful candidates obtain the diploma in Therapeutic Radiography issued by the Central Institute of Technology. There is a practical experience requirement.
The diploma in Nuclear Medicine Technology of the Royal Melbourne Institute of Technology is a 3-year correspondence course and requires appropriate work experience.
The Australian Society of Ultrasound in Medicine issues a Diploma in Medical Ultrasound. At present New Zealand candidates sit this by correspondence but efforts are being made currently to conduct the examinations in New Zealand. There are 2 examinations and 2 years work experience. Candidates for the second exam must go to Australia to sit the examination.
As at February 1984, there were 1273 registrations in total. Some 828 annual licences were issued to practitioners.
Medical Laboratory Technologists—The Medical Laboratory Technologists' Board is constituted under the Medical and Dental Auxiliaries Act 1966. The board is concerned with the training, examination, registration and conduct of persons engaged in the practice of medical laboratory technology. It has representation from the New Zealand Institute of Medical Laboratory Technology (Inc.), the New Zealand Society of Pathologists Incorporated, and the Departments of Health and Education.
The training period is 5 years. The first 3 years are spent studying for the New Zealand Certificate in Science (Medical Science) and, undertaking specified laboratory experience. Thereafter, study and laboratory work continues towards the board's certificate and specialist level examinations, which are offered in 10 disciplines. Only 1 subject and level may be attempted each year. On completion of 2 certificate level subjects, or the certificate and specialist levels in one discipline, the trainee gains the Diploma in Medical Laboratory Technology and is eligible for registration by the board.
Candidates with an appropriate New Zealand Certificate in Science in other than medical science may be permitted to sit the certificate and specialist level examinations in one discipline only to gain limited registration in that discipline. In addition, university graduates with appropriate degrees may train for 3 years and obtain limited registration in any disciplines in which they pass the examinations of the board.
By February 1984, there were 1337 full registrations, 70 of which were issued in 1983, and a total of 38 holding limited registration in specified disciplines. Annual licences for 1983–84 were issued to 791 practitioners and limited registration annual licences to 25 practitioners.
MEDICAL, HOSPITAL, AND OTHER RELATED BENEFITS—Part II of the Social Security Act 1964, administered by the Department of Health and dealing with medical and like benefits, is of general application to all persons ordinarily resident in New Zealand, and makes provision for medical, pharmaceutical, hospital, maternity, and other related benefits.
Medical Benefits—Medical benefits apply to such medical treatment as is ordinarily given by medical practitioners in the course of a general practice. Certain services are excluded, these being principally:
Medical services in maternity cases. (These services are covered by maternity benefits and are described under a later heading.)
Medical services involved in any medical examination of which the sole or primary purpose is the obtaining of a medical certificate.
Medical services other than anaesthetic services, involved in or incidental to the extraction of teeth by a medical practitioner.
Every general practitioner who renders any of the prescribed services is entitled, on behalf of the patient, to receive from the Department of Health a fee of $1.25 for a service provided in normal hours and up to $4.00 for a service rendered at night or on Saturdays, Sundays, or holidays; for Social Welfare beneficiaries, pensioners and their dependants, and for patients approved as “chronically ill”, the benefit ranges from $3 to $7; in the case of all children and young persons up to their sixteenth birthday, and those for whom family benefit continues to be paid, the benefit ranges from $4.75 to $8. For initial consultations with recognised psychiatrists, paediatricians, neurologists, and neuro-surgeons and general physicians, the department pays a benefit of $20; with all other specialists, the benefit paid for children and young persons is $10, and the benefit paid for all other patients is $5. These rates apply only to the first occasion on which a patient is referred by a general practitioner to a specialist, and, in the case of an inter-specialist referral, with prior concurrence of the original doctor. For subsequent visits, the fee paid by the department reduces to $1.25 for each visit, except in the case of Social Welfare beneficiaries and pensioners and their dependants, and the “chronically ill” for whom the fee is $3, and $4.75 in the case of children and young persons. In designated rural areas, an incentive bonus is payable to general practitioners. In 1981, the immunisation benefit was increased to $4 when the vaccine is administered by the doctor or a registered general nurse in his/her employ and under his/her direction. The immunisation benefit is in full settlement and no extra charge should be made. Most doctors make a claim directly from the Department of Health and ask patients for the balance of their fees. A minority require their patients to pay the whole fee and make personal claims on the Department of Health.
The number of medical practitioners providing general and specialist medical services in 1983 was 5403. For the year ended 31 March 1983, the cost per head of population was $17. The average population per active general practitioner in 1983 was 1641.
Pharmaceutical Benefits—Persons receiving medical attention under the Act are entitled, generally without cost to themselves, to those medicines, drugs, approved appliances and materials prescribed by their medical practitioners and which are included in the Drug Tariff.
Prescriptions passed for payment in the year ended 31 March 1983 totalled 27,057,000 or 8.4 per head of population. The average cost per prescription was $6.91, the cost per head of population for the year $57.91.
Hospital Benefits—Treatment is provided free by public hospitals where a patient is entitled to hospital benefits under the Act. In the case of private hospitals and other approved institutions benefits paid are in partial satisfaction of claims against the patients. The rates from 1 December 1981 are as follows:
For surgical treatment $26.50 a day, with a minimum of $30.00.
For medical (including psychiatric) treatment $20.50 a day.
For geriatric treatment $23.50 a day.
Hospital treatment for maternity patients $26.50 a day.
For long-stay medical patients, $23.50 per day.
Free treatment is accorded outpatients at public hospitals. There is provision for the supply of contact lenses for specific ocular conditions, artificial orthopaedic appliances, crutches, permanent splints, manual wheelchairs, plastic protective clothing, ileostomy and colostomy appliance urinals and components, oxygen cylinders, mist tents and similar nebulising equipment for children suffering from a specific complaint.
Hospital boards pay a subsidy for hearing aids, surgical footwear, some aids for daily living and electric wheelchairs. The Department of Health provides artificial larynx, larynx batteries and battery chargers, as well as understockings and limb socks (supplied by the New Zealand Artificial Limb Board). The department also subsidises payment for breast prostheses and wigs or hairpieces.
Patients in private hospitals may be supplied, by hospital boards, with intra-ocular lenses and orthopaedic implants.
A subsidy is also provided under the geriatric hospital special assistance scheme to assist geriatric patients in private hospitals where the patient requires hospital care and cannot be placed in a public hospital bed. The patient must contribute from his/her income to the payment of fees. In the case of a married patient in hospital for up to 13 weeks the income left in the hands of the spouse who is not hospitalised must be not less than the rate of National Superannuation for a married couple. After 13 weeks the income left in the hands of the spouse who is not hospitalised must not be less than the rate of National Superannuation for a single person plus $20 per week.
Psychiatric Hospitals—Treatment of patients in public psychiatric hospitals is also free. A licensed (private) psychiatric hospital may be recognised and approved by the Minister as a hospital for the purposes of the Act, and hospital benefits in respect of treatment are payable accordingly.
Maternity Benefits—Maternity benefits cover ante-natal and post-natal advice and treatment by medical practitioners, and the services of doctors and nurses at confinements in maternity hospitals or elsewhere. Recognised specialists may make a charge on the patient over and above the benefit. Licensed private maternity hospitals are entitled to receive fees of $26.50 in respect of the day of birth of the child and for each of the succeeding 14 days.
X-ray Diagnostic Services—These X-ray diagnostic services, on the recommendation of a medical practitioner, attract a health benefit:
The making of X-ray examinations with the aid of a fluorescent screen.
The taking of X-ray photographs.
The supply and administration of any drugs or other substances for the purposes of any such examination or photograph.
X-ray photographs or X-ray examinations made or taken for dental purposes or for the purposes of life insurance, visas, emigration permits, and examinations for the sole or primary purpose of obtaining medical certificates for production to some other person, are not included in the free services. Eligible X-ray examinations at public hospitals are free, but those undertaken by private radiologists are limited to a specified benefit. Additional charges are the patient's responsibility.
Laboratory Diagnostic Services—The benefits concerning laboratory diagnostic services comprise the supply of all materials or substances required for the purpose of providing laboratory diagnostic services, and associated medical services.
The following services are not included:
Examination of specimens for public health.
Post-mortem examinations.
Laboratory services for dental purposes or for the purposes of life insurance.
The preparation of sera and vaccines.
Physiotherapy Benefits—Physiotherapy treatment afforded by contracting physiotherapists is the subject of a benefit under the Social Security (Physiotherapy Benefits) Regulations 1951. The standard benefit is $1 for each recommended treatment, but a higher rate of $1.50 is payable for beneficiaries and their dependants who qualify for the higher medical benefit. Where patients are treated in groups the benefit is 40 cents per patient.
To qualify for the benefit, physiotherapy treatment must in all cases be recommended by a registered medical practitioner. Treatment is limited to 6 weeks on a single recommendation but in the case of certain specified illnesses the Director-General of Health may extend the period of treatment on any one recommendation up to 6 months.
Home-nursing Services—Under the Social Security (District Nursing Services) Regulations 1964, home-nursing services are provided free where the services are afforded by a registered nurse or midwife employed by the Department of Health, a hospital board, or an organisation recognised for the purpose.
Domestic Assistance—-Monetary assistance is given to approved incorporated associations formed for the purpose of providing domestic help in the home, where it is required because of age and infirmity, or to support family situations in which the mother is incapacitated or needs help on account of family commitments. Hospital Boards may also provide home aid services as part of a range of domiciliary services intended to minimise the need for in-patient hospital or residential home care.
Dental Services—The Social Security (Dental Benefits) Regulations 1983 provide for free dental treatment. These benefits are confined to persons who are under 16 years of age or under 18 years if still attending school or otherwise dependent. Treatment is provided by contracting dentists for whom there is a prescribed scale of fees, or in the dental department of a public hospital.
Artificial Aids—The Social Security (Hospital Benefits for Outpatients) Regulations 1947 made provision for the supply of artificial aids, such as artificial limbs, hearing aids, and contact lenses.
Breast Prostheses—Women undergoing a mastectomy are entitled to a benefit to assist with the cost of a breast form. With effect from 1 August 1983 the benefit was increased to $80 towards the cost of the initial prosthesis. The benefit paid to meet the cost of a replacement prosthesis remains at $40 per annum. Patients entitled to the benefit are required to have a certificate of eligibility from their doctor for presentation to the supplier.
Contact Lenses—These may be supplied in respect of the following optical disabilities; (a) conical cornea, (b) high myopia, where the degree of myopia present in the greatest axis of the better eye is not less than—10 diopters, (c) monocular aphakia, if the restoration of binocular vision is highly desirable by reason of the patient's occupation or other circumstances and binocular vision cannot be restored without the use of contact lenses. In each case the supply of such lenses must be recommended by an approved ophthalmologist.
Lenses may also be supplied in respect of any other ocular condition which cannot be corrected by ordinary spectacles; in these cases recommendation by two ophthalmologists is necessary.
Hearing Aids—A subsidy of $81 is payable towards the purchase of a hearing aid, where the patient suffers a hearing loss which renders the use of an aid necessary.
Eligibility on medical grounds for the provision of a hearing aid is to be determined by an otologist employed or engaged by a hospital board or the Department of Health.
Patients are eligible for the payment of the full benefit for a replacement hearing aid if in the opinion of the authorising otologist their existing aid is inadequate and a new aid is required to improve hearing ability.
Artificial Limbs—The free supply of artificial limbs is subject to the following conditions:
The patient has not obtained or is not entitled to obtain a limb as an ex-serviceman under the provisions of the War Pensions Regulations 1956 or under the provisions of the Accident Compensation Act 1972.
The supply of the limb is recommended by an approved orthopaedic surgeon.
The limb is of an approved type and can, in the opinion of the supplier's orthopaedic adviser, be satisfactorily fitted.
For the purposes of the regulations “artificial limb” includes artificial arms, artificial hands, artificial legs, and artificial feet, and includes limb socks for such limbs and for female amputees, replacement understockings.
Orthopaedic Implants—Artificial hips and similar implants also qualify for benefit under the arrangements for artificial aids.
Wheelchairs—Manually operated wheelchairs are available through hospital boards on a free loan basis to disabled persons who require them on medical grounds. Motorised wheelchairs are fully subsidised in approved cases.
Artificial Eyes—A benefit of up to $50 is available to all patients who have had an eye removed. For adults, the benefit is available towards the cost of the initial prosthesis only. Children and young persons are also entitled to a benefit of up to $50 towards the cost of replacement artificial eyes prior to their sixteenth birthday.
Wigs—A benefit of up to $100 is available to meet the cost of wigs required on cosmetic grounds by patients suffering from: (a) congenital dystrophy of the skin; (b) alopecia areata, severe and longstanding; or (c) in cases of illness or treatment of illness where baldness is not permanent but is likely to be prolonged. For adults the benefit is available towards the cost of the initial wig obtained. Children are entitled to “reasonable” replacements at intervals considered suitable by the medical officer of health.
The following table gives details of expenditure on the various classes of health benefits during the 5 latest financial years.
| Item | 1978–79 | 1979–80 | 1980–81 | 1981–82 | 1982–83 |
|---|---|---|---|---|---|
| $(thousand) | |||||
| Maternity benefits— | |||||
| Medical practitioners' fees | 5,952 | 6,832 | 7,800 | 9,331 | 10,565 |
| Medical practitioners' motor vehicle allowance | 198 | 205 | 258 | 317 | 365 |
| Obstetric nurses' fees | 33 | 40 | 69 | 87 | 84 |
| Obstetric nurses' motor vehicle allowance | .. | .. | .. | 13 | 58 |
| .. | 6,183 | 7,077 | 8,127 | 9,748 | 11,072 |
| Medical benefits— | |||||
| General medical services | 35,798 | 34,950 | 35,487 | 35,261 | 35,778 |
| GMS motor vehicle allowance | 200 | 188 | 199 | 197 | 193 |
| Specialist medical services | 4,360 | 4,416 | 4,626 | 4,464 | 4,629 |
| Rural practice bonus and other incentives | 764 | 740 | 741 | 755 | 764 |
| Immunisation benefit | 647 | 577 | 476 | 672 | 863 |
| Practice nurse subsidy | 4,183 | 5,985 | 7,979 | 10,667 | 12,614 |
| Social workers in general practice | 25 | 34 | .. | .. | .. |
| .. | 45,977 | 46,890 | 49,508 | 52,016 | 54,841 |
| Private practice and post-graduate grants | 59 | 55 | 64 | 65 | 60 |
| Special area and other arrangements— | |||||
| Section 117, Social Security Act | 156 | 149 | 8 | .. | .. |
| .. | 215 | 204 | 72 | 65 | 60 |
| Hospital benefits— | |||||
| Treatment in private hospitals—maternity benefits | 258 | 209 | 199 | 204 | 188 |
| Treatment in private hospitals—medical, surgical, and Karitane | 3,735 | 4,100 | 4,451 | 5,169 | 5,956 |
| Treatment in private hospitals—geriatric benefit | 13,658 | 20,178 | 24,585 | 30,840 | 35,219 |
| Treatment in private hospitals—long stay benefit | 216 | 449 | 516 | 697 | 591 |
| Treatment in approved institutions | 1,209 | 1,790 | 2,327 | 2,898 | 3,203 |
| .. | 19,076 | 26,726 | 32,078 | 39,808 | 45,157 |
| Pharmaceutical benefits— | |||||
| Drugs supplied— | |||||
| By chemists | 111,812 | 130,665 | 145,580 | 171,609 | 191,740 |
| By medical practitioners and Department of Health; | 185 | 204 | 170 | 166 | 135 |
| To institutions and private hospitals | 1,427 | 1,909 | 1,510 | 2,161 | 4,209 |
| Non-disposable syringes and needles for diabetics | 25 | 19 | 17 | 132 | 14 |
| .. | 113,449 | 132,797 | 147,277 | 174,068 | 196,098 |
| Supplementary benefits— | |||||
| Dental services | 6,359 | 6,082 | 7,846 | 8,188 | 8,331 |
| Laboratory services | 17,106 | 18,438 | 23,315 | 25,676 | 27,933 |
| Artificial aids | 83 | 105 | 133 | 168 | 211 |
| Physiotherapy services | 1,530 | 1,502 | 1,580 | 1,659 | 2,011 |
| Radiological services | 1,894 | 2,113 | 2,077 | 2,135 | 2,512 |
| Breast prostheses | 23 | 19 | 19 | 55 | 108 |
| Hair pieces | 31 | 48 | 50 | 56 | 64 |
| .. | 27,026 | 28,307 | 35,020 | 37,937 | 41,170 |
| Total | 211,926 | 242,002 | 272,084 | 313,642 | 348,398 |
WELFARE SERVICES—Government assistance is offered to religious and voluntary organisations and local authorities in providing housing, accommodation, and services for elderly people and others whom it is considered are in special need. Under this partnership with Government, the social service agencies of all the major religious bodies, as well as other welfare organisations, have established additional accommodation for the aged, frail, and sick who need residential care in either an old people's home or a geriatric hospital. Where it is not possible to meet the needs of elderly people either through these agencies or through private facilities, the provision of residential care for the aged becomes a hospital board responsibility. At 31 March 1983 religious and welfare or private organisations provided 16 145 home and hospital beds for the elderly. Hospital boards maintain 828 old people's home beds.
Other measures which are of importance in assisting elderly people to remain in their homes as long as possible are receiving increased attention. Chief amongst these are the provision of district nursing services, home aid, meals-on-wheels, laundry services, and occupational therapy. In general the services are provided by hospital boards with voluntary organisations and old people's welfare councils assisting in various ways. The importance of old people's clubs and social centres, with an adequate range of services, is also receiving increasing recognition. Government lottery funds are being used to assist in providing suitable premises and assisting welfare councils with administrative costs. During the year ended 31 March 1983 over 16 790 persons were delivered meals-on-wheels. An average of 94 meals were supplied to each person during the year. The service is operated by 28 hospital boards with the assistance of voluntary drivers.
Old People's Homes and Hospitals—As from 1 April 1981, subject to maximum subsidies of $21,000 per bed for old people's homes and $25,000 for geriatric hospital beds, and certain other conditions, religious or welfare organisations providing accommodation for old people may be granted 100 percent of the approved building cost. Since October 1974, the policy has been widened to provide an 80 percent subsidy towards the cost of approved improvements and the upgrading of existing accommodation, and 100 percent for fire protection work as required by the local authority. The administration of policy is a Department of Health responsibility.
During the year 1982–83, subsidies amounting to $4,257,357 were approved. From April 1950 to 31 March 1983 subsidies totalling $77,263,074 have been approved, and buildings erected as a result will accommodate 8746 old people.
VOLUNTARY WELFARE ORGANISATIONS—Over the years voluntary welfare organisations have made valuable contributions to certain aspects of the field of public health. In many cases they are encouraged and assisted in their work by grants from the public funds. Among the more important are the Royal N.Z. Plunket Society, the Children's Health Camps Board, the New Zealand Red Cross Society, the St. John's Ambulance Association, the New Zealand Crippled Children's Society, the Hearing Association, the Royal New Zealand Foundation for the Blind, the Family Planning Associations, the Neurological Foundation, the Rehabilitation League, the Laura Fergusson Trust for Disabled Persons, the New Zealand Society for the Intellectually Handicapped, the Cancer Society, and the National Heart Foundation. A fuller list of voluntary organisations in the field of health was published in the 1976 and earlier editions of the Yearbook.
HEALTH INCOMES AND EXPENDITURE—According to New Zealand's first Census of Services, the Central Government during the 12 months ended 31 March 1981 contributed more than $930 million in grants and subsidies to help meet the operating expenses of private health practitioners, public and private hospitals, and licensed old people's rest homes. These payments represent approximately $300 per head of population.
Private Practitioners' Incomes—The total income of the 3693 private practitioners in the census amounted to $230.7 million in 1980–81, of which $66.4 million was supplied by the Central Government.
The following table shows average gross incomes and cash grants received by type of private practice.
| Type of Private Practice | Average Gross Income* | Direct Government Grants/Subsidies† | Net Profit or Income‡ | |
|---|---|---|---|---|
* Per full-time equivalent. †In some instances statistical estimation was involved in arriving at total grants by type of practice. ‡After adjustments for changes in stocks and including any salary received by practitioners. Net profit or income is before tax. | ||||
| $ | $ | Percentage of Average Income | $ | |
| Medical specialist | 83,236 | 19,842 | 23.8 | 43,011 |
| General practitioner | 62,366 | 27,474 | 44.1 | 30,490 |
| Dentist | 70,891 | 10,879 | 15.3 | 29,540 |
| Optometrists and dispensing opticians | 113,906 | 1,534 | 1.3 | 34,460 |
| Physiotherapist | 40,756 | 14,477 | 35.5 | 18,663 |
| Chiropractor | 45,677 | 50 | 0.1 | 20,448 |
| Radiologist | 120,326 | 41,614 | 34.6 | 47,034 |
| All types of private practice | 69,459 | 19,991 | 28.8 | 31,312 |
Incomes of Hospitals and Rest Homes—Public hospitals comprised 62.4 percent of all hospital institutions in the census. Of the remainder, 12.1 percent were private non-profit, 18.5 percent incorporated private, and 7 percent non-corporate private establishments. In contrast 99.2 percent of all licensed old people's rest homes were privately owned, of which 53 percent were non-corporate and 33 percent were non-profit.
Central Government grants and subsidies provided 91.9 percent of the income of all public and private hospitals, and 16.9 percent of the non-capital receipts of old people's rest homes.
The following table shows gross income per establishment.
| Type of Establishment | Average Gross Income | Government Grants and Subsidies |
|---|---|---|
| $ | $ | |
| Hospitals— | ||
| Public | 3,913,414 | 3,736,838 |
| Private, non-profit | 633,047 | 225,674 |
| Private, other | 391,593 | 189,176 |
| All establishments | 2,616,949 | 2,405,890 |
| Rest Homes— | ||
| Public | 259,667 | 259,667 |
| Private, non-profit | 244,756 | 51,362 |
| Private, other | 74,256 | 5,156 |
| All establishments | 130,913 | 22,074 |
| NOTE—For further information on the Census of Services refer to pages 599–607, Section 22B of this Yearbook. | ||
FURTHER INFORMATION—Other publications dealing with health and medical services include the following:
The. Public Health (Parl. paper E. 10), Department of Health (Annual).
Health, Department of Health bulletin (Quarterly).
Report of the Medical Research Council of New Zealand (Parl. paper E. 11).
Trends in Health Services, Department of Health (2-yearly).
Health Expenditure in New Zealand—Trends and Growth Patterns, Department of Health (1976).
Health Manpower Resources 1978, Department of Health (1978)
Census of Population 1981; Bulletin—Cigarette Smoking, Department of Statistics.
Social Trends in New Zealand, Department of Statistics (1977).
Alcoholism: Challenge to Industry, Alcoholic Liquor Advisory Council (1979).
Miscellaneous Bulletin No. 12—New Zealand Children 1979, Department of Statistics (1979).
Annual Report of the Alcoholic Liquor Council (Parl. paper E. 26).
Report of the Clean Air Council (Parl. paper E. 22).
The Department of Health has published a considerable number of reports in its Special Report series in recent years. Inquiries concerning these should be addressed to:
Management Services and Research Unit,
Department of Health,
Private Bag,
Wellington.
The Hospitals Act 1957 and the Area Health Boards Act 1983 require the Minister of Health to ensure the provision and maintenance by hospital boards and area health boards of hospitals and hospital services, and to encourage the provision and maintenance of private hospitals. The Department of Health advises the Minister on, or determines in respect of boards, the extent and standard of hospital and allied services, the building requirements to provide these services, the numbers and levels of the main groups of professional staff to be employed, the appropriate annual financial grants, the salaries and conditions of employment of about 70 percent of staff, and the measure of financial assistance to be given to private hospitals, including loan finance. The department also licenses and supervises private hospitals, inspects the work of all hospitals, and compiles financial and statistical data about them. There are 29 hospital boards and 173 private hospitals. No area health boards have yet been established.
Since 1 April 1958, the cost of hospital treatment in public hospitals has been borne entirely by the State. Private hospitals, which provide about one-sixth of the available beds, receive partial payment from the Government for hospital treatment of patients; additional fees may be claimed from the patients. Hospital and home nursing services involve the Department of Health in establishing and assisting to maintain minimum standards of nursing service in general hospitals, in homes for the aged, etc.; in advising, inspecting, and reporting on such services in hospitals; and in generally advising the Minister on nursing.
Advisory boards, committees, and councils play a most valuable part in helping to formulate health policies and programmes, and in certain cases, in administering policies or programmes laid down by Government. The setting-up of such agencies enables the Minister and the Department of Health to draw upon expert advice and wide experience and ensures that non-departmental people with up-to-date knowledge, day-to-day working experience, and responsibility in particular areas of health play a worthwhile part in health administration. A partnership of this kind is particularly important in the case of public hospitals, which are run by democratically elected boards. Recognition of this is seen in the requirements of the Hospitals Act that the Minister of Health may not act in certain public hospital matters without a recommendation from the Hospitals Advisory Council.
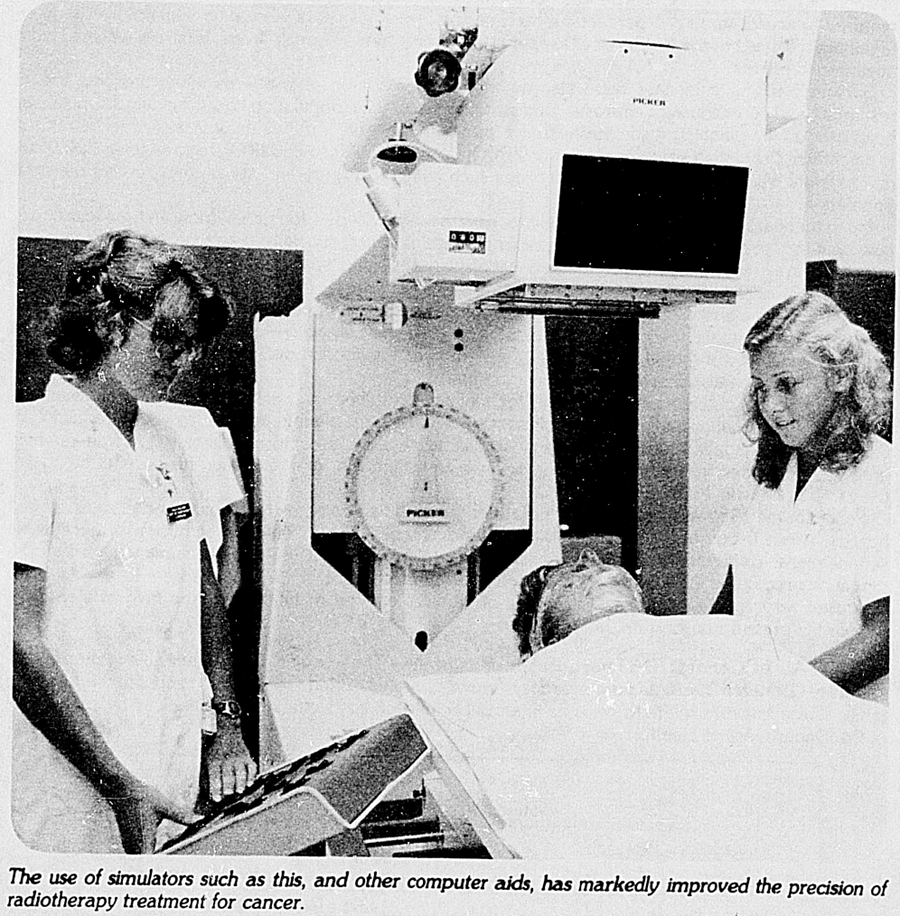
HOSPITAL BOARDS—General and psychiatric hospitals (except for Lake Alice Hospital) are controlled by locally elected hospital boards. A hospital board of 8 to 14 members is elected every 3 years for each hospital district. It is the duty of every hospital board to provide, maintain, and staff such institutions, hospital accommodation, and medical, nursing, and other services as the Minister of Health considers necessary.
The Director-General of Health is authorised to visit and inspect hospitals and to appoint assistant inspectors, and is required to report to Parliament through the Minister on the administration of the Hospitals Act.
Hospital boards are required to operate their own ambulance services unless they enter into some arrangement with a subsidised voluntary agency. In this regard the Order of St. John and organisations such as the Wellington Free Ambulance perform valuable services.
In recent years there has been a pressure of activity, replanning, and development in all medical services for which hospital boards are responsible. This replanning of medical services has been undertaken against a background of Governmental efforts to restrain the rapid growth in health expenditure. To this end, hospital boards were required to accept a 1-percent reduction in their allocation of funds in 1979–80, 1980–81, and again in 1981–82.
In 1982–83, the approach to reducing health expenditure changed. Although the population-based method of funding hospital boards was not formally implemented, financially advantaged boards were required to accept up to a 1 percent cut-back on their previous years' allocation. Financially disadvantaged boards could apply for Service Development Grants funded largely from resources withheld from advantaged boards.
Service planning guidelines were also developed to assist hospital boards make the best use of resources and to encourage equitable access to services. The population-based funding formula has been used in the planning guidelines with the provision that levels of health services are to be related to catchment population sizes: local (up to 30 000); district (30 000 to 250 000); regional (over 250 000); and national which covers specialised services such as neurosurgery and spinal units serving the total population.
Hospital board service planning guidelines have been developed for paediatrics, and guidelines are now being prepared for obstetrics, geriatric and dental services, specialised regional services (neonatal intensive care, renal dialysis and transplantation services), and specialised national services (cardiac surgery).
The population-based method of funding hospital boards was implemented from 1 April 1983, and will be reviewed annually by the Government. For 1983–84 cutbacks of not less than 1 percent were applied to each board shown by the funding system to be financially advantaged. A lower level cutback of under 1 percent also existed for advantaged boards.
Funds from the cutbacks were available for reallocation to boards which were shown to be disadvantaged, and which submitted an acceptable service development plan. In addition a general reduction of 0.5 percent was applied to all but the 8 most disadvantaged boards, to enable existing commissioning grants to be written into base allocations, while maintaining the total allocation for hospital boards at the same level as in 1982–83.
Policy for the 1984–85 financial year called for the continuation of restraints on financially advantaged boards. Again these funds are available for disadvantaged boards on the submission of acceptable service plans. The total allocation for grants to hospital boards for 1984–85 has been increased by 0.6 percent to recognise the effect of the service maintenance factor. This factor represents the need for increased resources, so that existing levels of services can be maintained in the face of increasing population pressure on hospital board services.
HOSPITAL ACCOMMODATION: Public Hospitals—The number of beds available in public institutions at 31 March 1983, and the average number occupied during the year are set out in the following table. These statistics relate to patients in all public institutions, including institutions under the control of the Department of Health.
| Type of Bed | Beds Available | Average Number of Occupied Beds per Day | ||
|---|---|---|---|---|
| Number | Proportion per 1000 of Population | Number | Proportion per 1000 of Population | |
| General | 14,608 | 4.5 | 11 340.2 | 3.5 |
| Maternity | 2,274 | 0.7 | 1 184.9 | 0.4 |
| Psychiatric and psychopaedic | 8,422 | 2.6 | 7 292.5 | 2.3 |
| Total hospital beds | 25,304 | 7.8 | 19 817.6 | 6.1 |
| Non-hospital beds | 919 | 0.3 | 814.4 | 0.3 |
| Total | 26 223 | 8.1 | 20 632.0 | 6.4 |
In addition to the 26 223 hospital beds in public institutions at 31 March 1983, there were 5700 beds in the 173 licensed private hospitals. If the beds in licensed private hospitals are included, the ratio of general beds per 1000 of population becomes 6.3.
A total of 428 369 inpatient and longstay admissions to public hospitals was recorded for the year ended 31 March 1983. This figure, which included persons in surgical, medical, maternity, psychiatric, and non-hospital beds in old people's homes, was equivalent to 13.3 percent of the population. The 1980–81 figure was 415 111 and the 1981–82 figure was 420 068.
Outpatient and daypatient attendances (excluding x-ray, laboratory and pharmacy diagnostic services) at public hospitals totalled 4 207 615 and 286 891 respectively for the year ended 31 March 1983, compared with 4 125 520 and 274 294 for the previous year.
Waiting Lists—As at 31 March 1983 there were 40 078 names on waiting lists for admission to public hospitals. This compares with 39 848 on waiting lists at 31 March 1982.
Private Hospitals—At 31 March 1983 there were 173 licensed private hospitals, providing a total of 5700 beds. Private hospitals are shown by type and by number of beds in the following table as at 31 March of the years stated.
| Type of Hospital | Number of Hospitals | Licensed Beds | ||||
|---|---|---|---|---|---|---|
| 1981 | 1982 | 1983 | 1981 | 1982 | 1983 | |
* Includes 3 hospitals with geriatric beds and 1 with children's beds. †Includes 2 hospitals with geriatric beds. ‡Includes 1 hospital with geriatric beds. §Includes 1 hospital with medical beds already included with medical-geriatric hospitals. | ||||||
| Maternity | 6 | 6 | 5 | 41 | 41 | 30 |
| Medical and surgical | 33* | 33* | 33† | 1 394* | 1 446* | 1 399† |
| Medical and/or geriatric | 121 | 127 | 132 | 3,746 | 3,932 | 4,124 |
| Medical and children's (Karitane) | – | – | – | – | – | – |
| Maternity, medical, and surgical | 1 | 1 | 1 | 102 | 102 | 102 |
| Psychiatric/geriatric | 3‡ | 3 | 3§ | 73‡ | 45 | 45 |
| Total | 164 | 170 | 173 | 5 356 | 5 566 | 5 700 |
The Government assists private hospitals by the provision of loan money for new hospitals and the upgrading and extension of existing hospitals. Amounts paid under this scheme during the last 3 years were as follows: 1980–81, $261,363; 1981–82, $150,000; and 1982–83, nil.
STAFF: All Hospitals—The numbers of staff employed by hospital boards and in hospitals under the control of the Department of Health as at 31 March in 4 recent years were as follows:
| Category of Staff | As at 31 March* | |||
|---|---|---|---|---|
| 1980 | 1981 | 1982 | 1983 | |
| * All figures based on full-time equivalents. | ||||
| Professional staff— | ||||
| Medical | 2 221.6 | 2 336.4 | 2 465.9 | 2 560.4 |
| Dietitians | 115.9 | 141.5 | 147.4 | 134.1 |
| Laboratory technologists | 549.4 | 598.0 | 616.8 | 531.9 |
| Occupational therapists | 295.6 | 322.6 | 376.2 | 399.1 |
| Physiotherapists | 460.6 | 469.4 | 535.7 | 515.6 |
| Radiographers | 380.6 | 407.5 | 433.0 | 440.4 |
| Hospital scientific officers | 79.6 | 64.7 | 67.6 | 94.8 |
| Other professional and technical | 2 423.5 | 2 503.0 | 2 588.7 | 2 757.7 |
| Social workers | 353.9 | 408.6 | 452.9 | 471.9 |
| Nursing staff (qualified) | 12 069.2 | 12 918.8 | 13 672.6 | 14 570.6 |
| Nursing staff (unqualified) | 4 374.0 | 4417.1 | 4 225.5 | 3 942.4 |
| Nursing students | 6 439.2 | 5 635.3 | 4 315.0 | 3 986.9 |
| Students, other | 720.3 | 654.1 | 632.6 | 615.8 |
| Administration, central offices | 4 025.5 | 4 324.0 | 4 133.6 | 4 103.4 |
| Clerical support | 892.3 | 951.2 | 1 100.8 | 1 115.8 |
| Managers/supervisors | 366.5 | 400.8 | 448.6 | 508.4 |
| Other | 12 763.9 | 13 049.3 | 12 643.7 | 12 092.2 |
| Total | 48 531.6 | 49 602.3 | 49 356.6 | 48 841.4 |
FINANCE: Loans—Boards are authorised by the Minister of Health to raise loans to cover the costs of approved building works and equipment. The position of loan liability is set out in the following table.
| Year | Amount Uplifted | Repayment* | Balance Owing |
|---|---|---|---|
| * Includes payments from sinking funds. | |||
| $(thousand) | |||
| 1979–80 | 78,985 | 19,910 | 407,103 |
| 1980–81 | 70,920 | 23,729 | 454,490 |
| 1981–82 | 41,993 | 24,879 | 471,832 |
| 1982–83 | 54,114 | 40,233 | 486,014 |
Payments—Hospital board expenditure is subject to control by the Minister of Health. The sum provided by Government for public hospital maintenance expenditure is allocated to the individual hospital boards on the basis of allocations made in the previous year, adjusted to take account of known increases in salary and wage rates and prices. A portion of the total is, however, held in reserve, to enable allocations to be made to boards having to meet the cost of commissioning major capital works reaching completion during the year. Additional grants are also made, when necessary, for general wage increases which may be approved after the basic allocation has been made. In general, major works over $20,000 are financed by loans raised by hospital boards, interest and principal repayments being met by Government grants.
Grants to hospital boards during recent years are set out in the following table.
| Grants to Hospital Boards | 1979–80 | 1980–81 | 1981–82 | 1982–83 |
|---|---|---|---|---|
* Included in operating grant, but no longer shown separately. †Added to operating grant in 1981–82. | ||||
| $(thousand) | ||||
| Grants Allocated Directly | ||||
| Operating grant— | ||||
| Salaries and wages | 482,129 | 576,448 | 744,960 | 895,229 |
| Other operating | 131,334 | 156,386 | 203,030 | 243,743 |
| Minor capital* | 12,205 | 16,645 | ||
| Total | 625,668 | 749,479 | 947,990 | 1,138,972 |
| Supplementary Grants | ||||
| Reserve for salary and wage increases | 91,149 | 123,533 | 115,546 | 24,860 |
| Loans—Repayments and payments into sinking fund | 19,958 | 26,214 | 29,948 | 40,457 |
| —Net interest | 30,874 | 38,222 | 44,466 | 47,974 |
| Community care— | ||||
| General† | 8,747 | 10,914 | ||
| Family health counselling services† | 448 | 606 | ||
| Health centres | 1,346 | 1,030 | 317 | 83 |
| Geriatric hospital patient assistance | 6,701 | 8,429 | 11,825 | 13,848 |
| Special capital | 65 | 2,658 | 572 | 1,054 |
| Other items (including wheelchairs, hearing aids, orthopaedic implants) | 2,733 | 3,160 | 567 | 1,414 |
| Total | 162,021 | 214,766 | 203,241 | 129,690 |
| Grand total | 787,689 | 964,245 | 1,151,231 | 1,268,662 |
PSYCHIATRIC HOSPITALS AND HOSPITALS FOR THE INTELLECTUALLY HANDICAPPED—Under the Mental Health Act 1969 the control of psychiatric hospitals and hospitals for the intellectually handicapped (with the exception of Lake Alice Hospital, Marton, which continues to make national provision for security patients) was transferred from the Department of Health to local hospital boards from 1 April 1972. From 1 April 1978 the funding of these hospitals was fully integrated with that of public hospitals. Separate data, therefore, are no longer available.
A detailed report Mental Health Data is published annually by the National Health Statistics Centre of the Department of Health. The report contains administrative and clinical data about first admissions and readmissions (including replacements from leave), discharges and deaths for all inpatients under psychiatric care. The report also presents information about psychiatric disorders in terms of age and sex, domicile, race, and length of stay.
The following table gives the annual averages and the rates per 100 000 mean population for those in psychiatric hospitals and hospitals for the intellectually handicapped, plus inpatients treated at the psychiatric units of public hospitals.
| Year | Patients in Psychiatric Hospitals and Hospitals for the Intellectually Handicapped | Patients in Psychiatric Units of Public Hospitals | ||||||
|---|---|---|---|---|---|---|---|---|
| Average Number Resident | Rate | Average Number On Leave* | Rate | Average Number Total | Rate | Average Number Resident | Rate | |
| * Refers only to committed and special patients. | ||||||||
| 1977 | 7,877 | 250.8 | 1,774 | 56.5 | 9,651 | 307.3 | 267 | 8.5 |
| 1978 | 7,619 | 243.5 | 1,809 | 57.8 | 9,428 | 301.3 | 246 | 7.9 |
| 1979 | 7,487 | 239.6 | 1,838 | 58.8 | 9,325 | 298.5 | 256 | 8.2 |
| 1980 | 7,321 | 232.5 | 2,202 | 69.9 | 9,523 | 302.5 | 248 | 7.9 |
| 1981 | 7,208 | 227.0 | 2,268 | 71.4 | 9,476 | 298.4 | 249 | 7.8 |
| 1982 | 7,129 | 224.0 | 2,353 | 73.9 | 9,482 | 297.9 | 279 | 8.8 |
| 1983 | 6,927 | 214.5 | 2,246 | 69.5 | 9,173 | 284.0 | 296 | 9.2 |
Maori Admissions—The numbers and crude rates of Maori first admissions to psychiatric hospitals, hospitals for the intellectually handicapped and psychiatric units in public hospitals are shown in the following table for 1979 and subsequent years. Between 1979–82 the first admissions rate has increased by 24 percent.
| Year | Number of First Admissions | Crude Rate per 100 000 Mean Maori Population* |
|---|---|---|
| * People of half or more Maori ancestry. | ||
| 1979 | 469 | 164 |
| 1980 | 432 | 156 |
| 1981 | 460 | 164 |
| 1982 | 577 | 204 |
Although the previous table gives a valid measurement of changes in the Maori first admission rate, it would be misleading to compare these rates with those for non-Maoris without making allowances for differences in the age-structure of the 2 populations. The following table, therefore, shows the age specific rates per 100 000 mean population for Maori and non-Maori first admissions.
| Year | Ages | ||||||
|---|---|---|---|---|---|---|---|
| 0–9 | 10–19 | 20–29 | 30–39 | 40–49 | 50–59 | 60 and Over | |
| 1979— | |||||||
| Maori | 28 | 131 | 358 | 273 | 186 | 143 | 98 |
| Non-Maori | 10 | 103 | 230 | 199 | 178 | 161 | 220 |
| 1980— | |||||||
| Maori | 17 | 133 | 341 | 226 | 175 | 99 | 168 |
| Non-Maori | 23 | 96 | 222 | 176 | 173 | 156 | 206 |
| 1981— | |||||||
| Maori | 29 | 149 | 311 | 287 | 190 | 116 | 119 |
| Non-Maori | 23 | 100 | 214 | 164 | 146 | 151 | 191 |
| 1982— | |||||||
| Maori | 28 | 166 | 441 | 326 | 203 | 146 | 178 |
| Non-Maori | 19 | 104 | 227 | 162 | 154 | 141 | 194 |
Admissions and Readmissions—The total admissions to psychiatric hospitals and hospitals for the intellectually handicapped during 1982 was 8672. This total was made up of 3060 first admissions and 5612 readmissions excluding replacements from leave. These figures exclude psychiatric units in general hospitals, and institutions set up under the Alcoholism and Drug Addiction Act.
A readmission is a person admitted as an inpatient for psychiatric or intellectual handicap treatment who has previously received care in a New Zealand psychiatric hospital or hospital for the intellectually handicapped.
The readmission rate is not necessarily an indication of therapeutic failure and may in many respects be a more accurate index of therapeutic vigour. It is still possible to encounter grossly over-simplified ideas with regard to the operations of psychiatric hospitals. For example, it is sometimes assumed that discharge from hospital is, or should be, an indication of final and complete cure.
In certain respects the long-established practice of publishing readmission rates for psychiatric hospitals (no similar figures appear for general hospitals) seems to perpetuate this misconception. Readmission figures are sometimes quoted as evidence that psychiatric hospitals “do not actually cure people”. As with many other types of illness, psychiatric disorders may require more than 1 hospital admission before the condition is stabilised.
General Trend—The average number of occupied beds in psychiatric hospitals in 1983 was about 2.1 per thousand of population. This is the lowest figure recorded since 1877. No absolute conclusions can be drawn from a low bed-occupancy rate; but a consistently falling rate, despite substantial admission rates, can fairly be assumed to indicate an active philosophy of treatment and successful therapeutic programmes.
Most patients (82 percent) entered psychiatric care in 1982 on an informal (voluntary) basis. However, the other 18 percent of patients were either special or committed (they may not discharge themselves). Almost all patients in psychiatric units of public hospitals were informal.
Discharges—All informal patients are discharged outright when they leave their hospital or unit. Committed patients may also be discharged outright or they may be given 'discharge on leave' which means that they are still legally committed and under the authority of the hospital. There is a further statistical category 'discharged not committed' which is equivalent to an outright discharge in that the patient is no longer legally under the authority of the hospital. The phrase simply indicates that although the patient entered hospital on a remand or 3 week basis, it was not found necessary to keep him or her for a longer period as a committed patient.
Diagnoses—In 1982 the leading cause of first admissions for men was all forms of alcoholism. For women the main category was neurotic depression and other depressive disorders.
In the readmission diagnostic groups the main causes of hospitalisation for women were schizophrenic psychoses and paranoid states. These conditions were the second ranking reason (after all forms of alcoholism) for men returning to inpatient care.
The following table shows admissions and readmissions to psychiatric hospitals for all forms of alcoholism.
| Year | First Admissions | Readmissions | Number of First Admissions in Each 100 Total Admissions for Alcoholism | ||
|---|---|---|---|---|---|
| Numbers | Rates* | Numbers | Rates* | ||
| * Rates per 10 000 mean population. | |||||
| 1977 | 777 | 2.5 | 2,106 | 6.7 | 27.0 |
| 1978 | 923 | 2.9 | 1,878 | 6.0 | 33.0 |
| 1979 | 1,005 | 3.2 | 1,954 | 6.3 | 34.0 |
| 1980 | 928 | 3.0 | 2,199 | 7.0 | 29.7 |
| 1981 | 940 | 3.0 | 2,271 | 7.2 | 29.3 |
| 1982 | 1,086 | 3.4 | 2,212 | 7.0 | 32.9 |
Numbers and rates of first admissions, readmissions, and discharges of patients under psychiatric care during 1982 are shown by diagnosis in the following table.
| Diagnosis | First Admissions | Readmissions (Includes Replacements From Leave) | Discharges | Total | ||
|---|---|---|---|---|---|---|
| Outright | Leave | Not Committed | ||||
| Senile and presenile organic psychotic conditions | 348 | 193 | 247 | 66 | – | 313 |
| Alcoholic psychoses | 27 | 85 | 68 | 56 | – | 124 |
| Drug psychoses | 26 | 36 | 48 | 16 | 3 | 67 |
| Other organic psychotic conditions | 74 | 157 | 132 | 87 | 3 | 222 |
| Schizophrenic psychoses | 351 | 2,570 | 1,647 | 1,327 | 14 | 2,988 |
| Affective psychoses | 428 | 1,592 | 1,552 | 476 | – | 2,028 |
| Paranoid states | 50 | 101 | 96 | 45 | 7 | 148 |
| Other psychoses | 165 | 202 | 267 | 96 | 3 | 366 |
| Neurotic depression and other depressive disorders | 860 | 963 | 1,631 | 71 | 9 | 1,711 |
| Other neurotic disorders | 163 | 192 | 342 | 17 | 1 | 360 |
| Alcohol dependence or abuse | 1,059 | 2,127 | 2,552 | 405 | 16 | 2,973 |
| Drug dependence or abuse | 86 | 124 | 158 | 38 | 15 | 211 |
| Other personality disorders | 408 | 843 | 1,025 | 204 | 60 | 1,289 |
| Stress and adjustment reactions | 283 | 183 | 471 | 21 | 4 | 496 |
| Non-psychotic disorders of childhood and adolescence | 22 | 10 | 34 | 1 | 1 | 36 |
| Non-psychotic mental disorders following brain damage | 19 | 37 | 29 | 22 | 51 | |
| Conditions associated with physical disorders | 9 | 10 | 16 | 1 | 17 | |
| Mental retardation | 138 | 847 | 777 | 247 | 6 | 1,030 |
| No psychiatric diagnoses | 169 | 188 | 167 | 7 | 106 | 280 |
| All cases | 4 685 | 10 460 | 11 259 | 3 203 | 248 | 14 710 |
Deaths—During 1982, 404 patients died in psychiatric hospitals and hospitals for the intellectually handicapped, compared with 458 in 1981.
PUBLIC HOSPITAL PATIENTS: Principal Diseases and Disabilities—Detailed statistical information is supplied to the Department of Health about all patients discharged from or dying in public hospitals in New Zealand.
The following summary shows the principal diseases and injuries treated in public hospitals in 1982, together with average days stay and conditions as a percentage of total cases. The disease headings are the subtitles of the International Classification of Diseases. More detailed information is available in Hospital and Selected Morbidity Data, Health Statistics Report.
Hospital returns show each disease for which the patient was treated while in hospital, but the classification for statistical purposes has been made on the basis of the principal condition for which the patient was admitted, regardless of what other unrelated diseases may have been present or developed during the stay in hospital. In mortality statistics, on the other hand, the underlying cause of death is of paramount importance. In the summary below a patient admitted on account of an injury is classified according to the nature of the injury. Should the patient die, however, the death would be classified in the mortality statistics according to the cause of the injury, e.g., motor-vehicle accident, accidental fall, etc.
| DISEASES AND DISABILITIES TREATED IN PUBLIC HOSPITALS DURING 1982 (INCLUDES READMISSIONS) | |||
|---|---|---|---|
| Disease or Disability | Total Discharges or Deaths in Public Hospitals | Percentage of all Cases | Average Stay (Days) |
| * Less than 0.05 percent. | |||
| Intestinal infectious diseases | 3,813 | 0.9 | 4.4 |
| Tuberculosis | 466 | 0.1 | 27.7 |
| Zoonotic bacterial diseases | 23 | * | 9.6 |
| Other bacterial diseases | 919 | 0.2 | 11.0 |
| Poliomyelitis and other non-arthropod-borne diseases of central nervous system | 400 | 0.1 | 5.9 |
| Viral diseases accompanied by exanthema | 714 | 0.2 | 9.5 |
| Arthropod-borne viral diseases | – | – | – |
| Other diseases due to viruses and chlamdiae | 1,938 | 0.5 | 3.8 |
| Rickettsioses and other arthropod-borne diseases | 50 | * | 3.4 |
| Syphilis and other venereal diseases | 188 | 0.1 | 8.7 |
| Other spirochaetal diseases | 67 | * | 6.1 |
| Mycoses | 72 | * | 18.5 |
| Helminthiases | 97 | * | 12.2 |
| Other infectious and parasitic diseases | 208 | 0.1 | 8.3 |
| Late effects of infectious and parasitic diseases | 64 | * | 21.1 |
| Malignant neoplasm of lip, oral cavity, and pharynx | 549 | 0.1 | 13.2 |
| Malignant neoplasm of digestive organs and peritoneum | 3,911 | 0.9 | 20.0 |
| Malignant neoplasm of respiratory and intrathoracic organs | 3,225 | 0.8 | 13.7 |
| Malignant neoplasm of bone, connective tissue, skin, and breast | 3,770 | 0.9 | 11.5 |
| Malignant neoplasm of genito-urinary organs | 4,528 | 1.1 | 13.2 |
| Malignant neoplasm of other and unspecified sites | 4,198 | 1.0 | 14.5 |
| Neoplasms of lymphatic and haematopoietic tissue | 2,939 | 0.7 | 11.0 |
| Benign neoplasms | 4,052 | 1.0 | 6.4 |
| Carcinoma in situ | 710 | 0.2 | 6.1 |
| Neoplasms of uncertain behaviour | 428 | 0.1 | 13.9 |
| Neoplasm of unspecified nature | 126 | * | 10.5 |
| Disorders of thyroid gland | 708 | 0.2 | 8.1 |
| Diseases of other endocrine glands | 3,679 | 0.9 | 18.4 |
| Nutritional deficiencies | 90 | 26.7 | |
| Other metabolic disorders and immunity disorders | 1,157 | 0.3 | 12.0 |
| Diseases of blood and blood-forming organs | 2,260 | 0.6 | 8.0 |
| Organic psychotic conditions | 1,250 | 0.3 | 127.1 |
| Other psychoses | 2,455 | 0.6 | 30.7 |
| Neuroses, personality and other non-psychotic mental disorders | 5,143 | 1.2 | 15.2 |
| Mental retardation | 112 | * | 93.0 |
| Inflammatory diseases of central nervous system | 456 | 0.1 | 27.7 |
| Hereditary and degenerative diseases of central nervous system | 1,298 | 0.3 | 62.4 |
| Other disorders of central nervous system | 2,965 | 0.7 | 32.2 |
| Disorders of the peripheral nervous system | 1,865 | 0.5 | 8.7 |
| Disorders of the eye and adnexa | 5,974 | 1.4 | 7.6 |
| Diseases of the ear and mastoid process | 5,744 | 1.4 | 3.5 |
| Acute rheumatic fever | 230 | 0.1 | 25.2 |
| Chronic rheumatic heart disease | 661 | 0.2 | 14.6 |
| Hypertensive disease | 1,232 | 0.3 | 12.5 |
| Ischaemic heart disease | 13,257 | 3.2 | 12.0 |
| Diseases of the pulmonary circulation | 571 | 0.1 | 14.2 |
| Other forms of heart disease | 7,404 | 1.8 | 16.9 |
| Cerebrovascular disease | 7,365 | 1.8 | 65.7 |
| Diseases of arteries, arterioles and capillaries | 3,654 | 0.9 | 23.6 |
| Diseases of veins and lymphatics, and other diseases of circulatory system | 5,829 | 1.4 | 8.2 |
| Acute respiratory infections | 4,950 | 1.2 | 4.0 |
| Other diseases of upper respiratory tract | 7,382 | 1.8 | 3.0 |
| Pneumonia influenza | 4,548 | 1.1 | 19.0 |
| Chronic obstructive pulmonary disease and allied conditions | 14,287 | 3.5 | 8.2 |
| Pneumoconioses and other lung diseases due to external agents | 52 | * | 11.0 |
| Other diseases of respiratory system | 1,972 | 0.5 | 12.6 |
| Diseases of oral cavity, salivary glands, and jaws | 2,844 | 0.7 | 4.2 |
| Diseases of oesophagus, stomach, and duodenum | 4,571 | 1.1 | 7.5 |
| Appendicitis | 5,196 | 1.3 | 5.7 |
| Hernia of abdominal cavity | 5,712 | 1.4 | 5.8 |
| Non infective enteritis and colitis | 894 | 0.2 | 12.8 |
| Other diseases of intestine and peritoneum | 5,668 | 1.4 | 9.0 |
| Other diseases of digestive system | 5,611 | 1.4 | 10.9 |
| Nephritis, nephrotic syndrome and nephrosis | 1,436 | 0.4 | 12.9 |
| Other diseases of urinary system | 5,064 | 1.2 | 8.3 |
| Diseases of male genital organs | 4,220 | 1.0 | 7.5 |
| Disorders of breast | 1,769 | 0.4 | 3.2 |
| Inflammatory disease of female pelvic organs | 2,599 | 0.6 | 4.3 |
| Other disorders of female genital tract | 12,626 | 3.1 | 5.2 |
| Pregnancy with abortive outcome | 7,584 | 1.8 | 2.3 |
| Complications mainly related to pregnancy | 14,605 | 3.5 | 6.9 |
| Normal delivery/indications for care-pregnancy/labour/delivery | 34,743 | 8.4 | 6.7 |
| Complications occurring mainly in labour and delivery | 10,750 | 2.6 | 6.6 |
| Complications of the puerperium | 429 | 0.1 | 6.6 |
| Infections of skin and subcutaneous tissue | 2,973 | 0.7 | 7.1 |
| Other inflammatory conditions of skin and subcutaneous tissue | 964 | 0.2 | 11.4 |
| Other diseases of skin and subcutaneous tissue | 1,947 | 0.5 | 11.1 |
| Arthropathies and related disorders | 7,548 | 1.8 | 20.2 |
| Dorsopathies | 4,357 | 1.1 | 11.5 |
| Rheumatism excluding the back | 3,383 | 0.8 | 5.0 |
| Osteopathies, chondropathies, and acquired m/skeletal deformities | 2,664 | 0.6 | 15.0 |
| Congenital anomalies | 6,588 | 1.6 | 9.0 |
| Certain conditions originating in the perinatal period | 7,240 | 1.8 | 10.2 |
| Symptoms | 20,958 | 5.1 | 4.9 |
| Non-specific abnormal findings | 279 | 0.1 | 4.9 |
| Ill-defined and unknown causes of morbidity and mortality | 709 | 0.2 | 131.1 |
| Fracture of skull | 3,042 | 0.7 | 7.4 |
| Fracture of spine and trunk | 1,971 | 0.5 | 19.3 |
| Fracture of upper limb | 4,330 | 1.1 | 5.3 |
| Fracture of lower limb | 8,246 | 2.0 | 23.9 |
| Dislocation | 1,091 | 0.3 | 6.0 |
| Sprains and strains of joints and adjacent muscles | 1,814 | 0.4 | 6.2 |
| Intracranial injury (excluding those with skull fracture) | 9,054 | 2.2 | 3.2 |
| Internal injury of chest, abdomen, and pelvis | 1,097 | 0.3 | 11.5 |
| Open wound of head, neck, and trunk | 1,845 | 0.5 | 4.5 |
| Open wound of upper limb | 2,523 | 0.6 | 4.2 |
| Open wound of lower limb | 1,817 | 0.4 | 9.2 |
| Injury to blood vessels | 50 | * | 8.3 |
| Late effects of injuries, poisonings, and other external causes | 4,687 | 1.1 | 13.9 |
| Superficial injury | 414 | 0.1 | 5.2 |
| Contusion with intact skin surface | 2,272 | 0.6 | 4.9 |
| Crushing injury | 257 | 0.1 | 6.3 |
| Effects of foreign body entering through orifice | 863 | 0.2 | 2.0 |
| Burns | 1,463 | 0.4 | 14.9 |
| Injury to nerves and spinal cord | 313 | 0.1 | 6.2 |
| Certain traumatic complications and unspecified injuries | 195 | 0.1 | 5.4 |
| Poisoning by drugs, medicaments, and biological substances | 2,981 | 0.7 | 3.3 |
| Toxic effect of substances chiefly non-medicinal as to source | 872 | 0.2 | 2.7 |
| Other and unspecified effects of external causes | 440 | 0.1 | 4.1 |
| Complications, surgical and medical care not elsewhere classified | 3,028 | 0.7 | 11.0 |
| Supplementary classification | 27,499 | 6.6 | 6.0 |
| All conditions | 414 100 | 100.0 | 10.9 |
Duration of Stay in Public Hospitals—The average duration of stay in public hospitals in 1982 was 10.9 days. Among sufferers from specified diseases, the longest average stays were made by those with organic psychotic conditions (127 days), followed by patients with cerebrovascular disease (66 days) and degenerative diseases of the central nervous system (62 days).
Abortion—In 1983 abortions were performed in 34 public hospitals and 10 private hospitals.
The following table gives the number of women having abortions according to age group.
| Age Group | 1980 | 1981 | 1982 | |||
|---|---|---|---|---|---|---|
| Percentage | Number | Percentage | Number | Percentage | Number | |
| Source: Abortion Supervisory Committee Report (Parl. paper E. 28). | ||||||
| 11 | 1.50 | 2 | 1.24 | 2 | 1.23 | – |
| 12 | 4 | 6 | 2 | |||
| 13 | 17 | 17 | 17 | |||
| 14 | 66 | 59 | 66 | |||
| 15 | 29.57 | 195 | 26.78 | 171 | 26.80 | 179 |
| 16 | 328 | 312 | 312 | |||
| 17 | 383 | 401 | 409 | |||
| 18 | 423 | 444 | 463 | |||
| 19 | 429 | 482 | 487 | |||
| 20–24 | 27.13 | 1,613 | 29.40 | 1,987 | 30.19 | 2,084 |
| 25–29 | 18.79 | 1,117 | 18.66 | 1,261 | 18.83 | 1,300 |
| 30–34 | 12.63 | 751 | 13.85 | 936 | 12.91 | 891 |
| 35–39 | 6.93 | 412 | 6.85 | 463 | 6.87 | 474 |
| 40–44 | 2.91 | 173 | 2.90 | 196 | 2.85 | 197 |
| 45 and over | 0.32 | 19 | 0.29 | 20 | 0.28 | 19 |
| Incomplete data | 0.22 | 13 | 0.03 | 2 | 0.04 | 3 |
| Total | 100.00 | 5 945 | 100.00 | 6 759 | 100.00 | 6 903 |
Accident Cases—Accident cases treated as inpatients in public hospitals during 1982 (including readmissions) are shown in the following table.
| Type of Accident | Total Cases | Percentage of All Accident Cases | Average Stay (Days) | Aggregate Stay (Days) | Aggregate Stay as Percentage of Total |
|---|---|---|---|---|---|
| Transport— | |||||
| Railway | 43 | 0.1 | 16.9 | 727 | 0.1 |
| Motor-vehicle traffic | 10,496 | 17.6 | 10.9 | 114,850 | 17.8 |
| Motor-vehicle non-traffic | 851 | 1.4 | 7.9 | 6,765 | 1.1 |
| Other road vehicles | 2,395 | 4.0 | 4.8 | 11,446 | 1.8 |
| Water | 171 | 0.3 | 6.0 | 1,029 | 0.2 |
| Air and space | 112 | 0.2 | 13.1 | 1,462 | 0.2 |
| Vehicle accidents not elsewhere classifiable | 8 | .. | 12.5 | 100 | .. |
| Total transport | 14 076 | 23.6 | 72.1 | 136 379 | 21.1 |
| Non-transport— | |||||
| Accidental poisoning | 1,337 | 2.2 | 2.2 | 2,988 | 0.5 |
| Accidental falls | 13,882 | 23.3 | 16.3 | 226,288 | 35.0 |
| Other accidents | 13,376 | 22.5 | 6.2 | 83,134 | 12.9 |
| Surgical and medical complications and misadventures | 6,222 | 10.5 | 14.2 | 98,928 | 15.3 |
| Late effects of accidental injury | 4,154 | 7.0 | 13.4 | 55,845 | 8.7 |
| Adverse effects of drugs, medicaments, and biological substances | 1,460 | 2.5 | 10.7 | 15,683 | 2.4 |
| Suicide and self inflicted injury | 2,537 | 4.3 | 5.0 | 12,788 | 2.0 |
| Homicide and injury purposely inflicted by other persons | 2,246 | 3.8 | 4.7 | 10,504 | 1.6 |
| Legal intervention | 13 | .. | 3.5 | 46 | .. |
| Injury undetermined whether accidentally or purposely inflicted | 246 | 0.4 | 5.8 | 1,423 | 0.2 |
| Injury resulting from operations of war | 7 | .. | 252.4 | 1,767 | 0.3 |
| Total non-transport | 45 480 | 76.4 | 334.4 | 509 394 | 78.9 |
| Grand total | 59 556 | 100.0 | 406.5 | 645 773 | 100.0 |
The 2 largest groups come under the heading “Non-transport accidents”—, “Accidental falls” beingslightly higher than “Other accidents” which includes accidents caused by cutting and piercing instruments, machinery, falling objects, fire and hot objects, and so on.
Victims of accidental falls also had the longest aggregate stay in hospital. This was because of the long period spent in hospital by elderly people who have sustained fractures of the femur in falls. More than 1 in every 4 patients had been injured in a fall of some kind.
Motor-vehicle traffic accidents comprised the third largest group and had the second largest aggregate stay. Traffic accidents on roads are analysed in tables in Section 14D Roads and Road Transport.
Accidents in the Home—A high percentage of non-transport accidents, especially those involving young children and elderly people, occur in the home. Accidents in the home in 1982 are included by type of accident in the previous section, but they are not separated out from accidents sustained elsewhere. The following table shows the number of patients discharged from, or dying, in public hospitals after treatment for accidents sustained in the home. It includes only inpatients in public hospitals; not, of course, the large numbers of home accident cases treated in outpatient departments, doctor's surgeries, and in the home itself.
| Cause of Accident | Total Patients | Aggregate Duration of Stay in Hospital (Days) |
|---|---|---|
| Accidental poisoning by— | ||
| Drugs and medicaments | 646 | 1,481 |
| Petroleum products and other solvents | 190 | 273 |
| Agricultural and horticultural preparations other than plant foods or fertilisers | 102 | 228 |
| Noxious foodstuffs and poisonous plants | 34 | 44 |
| Other solid and liquid substances | 38 | 121 |
| Gases and vapours | 10 | 80 |
| Accidental falls | 5,788 | 106,342 |
| Struck by falling objects | 100 | 912 |
| Accidents caused by cutting and piercing instruments | 1,608 | 6,613 |
| Accidental burns | 928 | 14,308 |
| Accidents caused by foreign bodies | 662 | 1,341 |
| All other and unspecified accidents | 1,799 | 10,543 |
| Total | 11 905 | 142 286 |
Deaths in Public Hospitals—The percentage of deaths in public hospitals to all deaths are shown in the following table.
| Year | Deaths in Public Hospitals | Total Deaths | Percentage of Deaths in Public Hospitals to Total Deaths |
|---|---|---|---|
| *1982 figure not available. | |||
| 1977 | 12,614 | 25,961 | 48.6 |
| 1978 | 11,958 | 24,669 | 48.5 |
| 1979 | 11,953 | 25,340 | 47.2 |
| 1980 | 12,693 | 26,676 | 47.6 |
| 1981 | 11,844 | 25,147 | 47.1 |
| 1982 | 12,119 | * | * |
Age and Sex of Patients—The age and sex of patients discharged from or dying in public hospitals during 1982 are shown below.
| Age Groups | Males | Females | Total |
|---|---|---|---|
| 0- 4 years | 23,826 | 17,292 | 41,118 |
| 5- 9 years | 10,120 | 7,300 | 17,420 |
| 10–14 years | 8,978 | 6,896 | 15,874 |
| 15–19 years | 12,093 | 19,239 | 31,332 |
| 20–24 years | 11,736 | 36,863 | 48,599 |
| 25–29 years | 8,204 | 37,969 | 46,173 |
| 30–34 years | 7,097 | 24,269 | 31,366 |
| 35–39 years | 6,325 | 12,668 | 18,993 |
| 40–44 years | 6,061 | 9,199 | 15,260 |
| 45–49 years | 6,355 | 7,574 | 13,929 |
| 50–54 years | 8,195 | 8,070 | 16,265 |
| 55–59 years | 10,390 | 7,916 | 18,306 |
| 60–64 years | 11,034 | 8,512 | 19,546 |
| 65–69 years | 11,646 | 9,438 | 21,084 |
| 70–74 years | 11,252 | 9,482 | 20,734 |
| 75–79 years | 8,666 | 8,548 | 17,214 |
| 80–84 years | 5,153 | 6,843 | 11,996 |
| 85 years and over | 2,978 | 5,913 | 8,891 |
| Total | 170 109 | 243 991 | 414 100 |
FURTHER INFORMATION—Other publications containing data on hospitals include the following:
Hospital Management Data—Department of Health (Annual).
Mental Health Data—Department of Health (Annual).
Organisation of the Work of Hospital House Surgeons—Department of Health.
Hospital and Selected Morbidity Data—Department of Health (Annual).
Survey of Occupied Psychiatric Hospital Beds and Psychiatric Day and Outpatients, 1976—Department of Health (1979).
Bed Occupation Survey, 1976—Department of Health (1979).
Trends in Health and Health Services—Department of Health (2 yearly).
The Public Health (Parl. paper E. 10)—Department of Health (Annual).
A Health Service for New Zealand (Parl. paper H. 23, 1974).
Table of Contents
Social services and the whole concept of state-supported or state-subsidised social welfare are continually evolving in response to the changing needs of society and the greater recognition of the responsibilities of that society towards its less fortunate or more vulnerable members.
The New Zealand social welfare system has grown pragmatically to meet local needs, and in the light of local experience, rather than under the influence of social or political theories. Even the 1938 Social Security Act, regarded as a landmark in the history of social welfare in New Zealand, did not introduce any sweeping theoretical changes, and since then ideas have been refined and enlarged rather than radically altered.
Nowadays the Department of Social Welfare, formed in 1972 from an amalgamation of the Social Security Department and the Child Welfare Division of the Department of Education, is the main Government agency in this field.
Also involved in social welfare are the Departments of Health, Education, Justice, Labour, Maori Affairs, and Internal Affairs.
DEPARTMENT OF SOCIAL WELFARE—The principal functions of the Department of Social Welfare are to:
Administer the Department of Social Welfare Act 1971; the Children and Young Persons Act 1974; Part I of the Social Security Act 1964; the Family Benefits Home Ownership Act 1964; and to provide for the effective administration and servicing of the War Pensions Act 1954; the Rehabilitation Act 1941; and the Disabled Persons Community Welfare Act 1975.
Advise the Minister on the development of social welfare policies for New Zealand.
Provide such social welfare services as the Minister may from time to time direct.
Provide for the training of persons to undertake social welfare activities in Government or voluntary organisations.
Maintain close liaison with, and encourage co-operation and co-ordination among, any organisations and individuals (including departments of State and other agencies of the Crown) engaged in social welfare activities.
Undertake and promote research into aspects of social welfare.
Provide administrative services to boards, councils, committees, and agencies.
The objects of the department's administrative services are to provide such administrative support, and advisory, training, and research services as are necessary for the efficient and effective administration of the department's functions. The department is a principal adviser to Government on matters of social welfare policy. It also has particular responsibilities to private and voluntary organisations. Units with special responsibilities for liaison with such organisations and for publicity and information have been established so that the public are kept informed of developments.
The objectives of the policy for benefits and pensions are:
To safeguard individuals in the community against loss of income or reduction in income brought about by age, incapacity, widowhood, orphanhood, unemployment, or other circumstances by providing income security at a level which will enable them to belong and participate in the community; and benefits for children as a contribution towards their maintenance.
To provide assistance towards housing finance for families of moderate means by an advance of family benefit.
To provide additional benefits for those whose income and financial resources are insufficient to meet their living costs and other commitments.
To provide pensions on the death or disablement of members of the forces as recompense for physical loss, at a level reviewed and set each year at 1 April in accordance with movements in the Consumers Price Index; and to provide other allowances and concessions according to the nature and extent of disablement.
To provide and maintain a service to ensure the rehabilitation and resettlement in civil life of former members of the forces.
The objectives of the policy for social work services are:
To make better provision for the maintenance, care, and control of children who are under the protection of the State and to provide generally for the protection and training of indigent, neglected, maltreated, and delinquent children.
To establish and maintain institutions, or arrange foster homes, for the care and control of children committed to the guardianship of the State.
To promote and maintain preventive work, social work, and general counselling services for persons and families facing social and economic difficulties.
To promote and maintain an effective rehabilitation service to ensure that disabled persons are given encouragement, counselling, and assistance to restore them to a fuller and more meaningful life.
The social work services involve individual and family casework and general welfare work. Emphasis is given to the care and control of children including those with emotional or behavioural problems.
The residential programme includes the inspection of children's homes run by voluntary organisations and the licensing and supervision of child care centres in order to ensure satisfactory standards are maintained. This division also has a responsibility for children in licensed foster homes.
Added emphasis is given in the programme to the rehabilitation of disabled persons. Co-ordination with other agencies which also have responsibilities in this work, such as the Department of Health and Department of Labour, is achieved through representation of the department on the National Civilian Rehabilitation Committee, which also acts as an advisory body to the Government on rehabilitation.
MAIN FEATURES OF SOCIAL WELFARE SYSTEM—The present system cannot be characterised according to any single principle, theory, or formula. As already stated, it has evolved from changing needs and experience in dealing with them. For example, it locks like a form of community insurance, but is not financed, funded, or administered on an insurance basis. It is financed from general taxation; but a person's benefit bears no relation to his/her tax contribution. While basically income-tested and selective as to need within classes of benefit, it is also universally applied without regard to other income or means in 3 main cases (national superannuation, family, and medical benefits) and in the lesser miners' benefit. It transfers income from the more to the less affluent, mainly on the basis of greatest help for those in greatest need. It reflects the traditional humanitarian, egalitarian, and pragmatic approach of New Zealanders and, most importantly, reflects an acceptance of community responsibility for social welfare.
The main features of the system are:
Eligibility for benefits (other than emergency) is based on residence for varying qualifying periods and not on the amount of tax paid.
Benefits (other than family, miners', national superannuation, and medical benefits) are subject to an income test with the amount of benefit being reduced if other income is over a prescribed level. Emergency benefits and additional benefits are subject to tests of both income and property.
In paying national superannuation and family benefit without any tests of income or need it is assumed that for everybody over 60 years of age, and for all families with dependent children, a community-financed income supplement is necessary and desirable, irrespective of actual financial need or resources. Miner's benefit is not income tested, on the accepted assumption that if a person is disabled by disease arising from mining he/she needs to be compensated for losing income and enjoyment of life and that the income loss does not require to be established or tested.
The concept of the family as the fundamental economic and social unit is recognised by the payments made in respect of the otherwise ineligible but dependent wife and children of a beneficiary; and the taking into account of the income of the husband or wife (legal or de facto) of a beneficiary when assessing the amount of those benefits subject to an income test.
Contribution under a graduated income tax system and payment of benefits at a flat rate irrespective of contributions (that is, taxes paid) distinguishes the New Zealand system from many of those of other countries.
The cash and medical benefits give a comprehensive coverage of need.
Beneficiaries are given incentives to selfhelp and to work. From the start, amounts payable from standard benefits have been set below the average wages of low-earner groups; and small incomes, and most property, have been disregarded in assessing an individual's benefit. Conversely, national superannuation for people over 60 years, and the benefits for widows and domestic purposes beneficiaries with dependent children, or over a prescribed age, recognise these people's right to stop working if they want to.
Funding is through taxation. The right to “contract out” on the grounds that the individual may not need, or qualify for, public aid is denied in the community interest, as it is with other State Services such as education, defence, and police.
The Social Security Commission has wide discretionary power to grant, withhold, or reduce benefits, and a general power of direction is given to the Ministers of Health and Social Welfare.
With certain exceptions no person is entitled to more than one analogous benefit from either New Zealand or overseas.
Standard rates with supplements, rather than differential rates according to the class of benefit, relate benefits to need rather than to the cause of need.
ADMINISTRATION—The Social Security Commission in the Department of Social Welfare administers, under the direction of the Minister of Social Welfare, Part I of the Social Security Act 1964 dealing with cash benefits, while matters concerning medical, hospital, and other related benefits are administered by the Department of Health under the direction of the Minister of Health (see Section 5A).
The War Pensions Act 1954 is also administered by the Department of Social Welfare, which likewise handles ex-servicemen's rehabilitation.
Child welfare activities are governed by the Children and Young Persons Act and other legislation detailed later in this section.
FINANCIAL PROVISIONS—From 1 April 1964, when the Social Security Fund was absorbed into the Consolidated Revenue Account (now the Consolidated Account), the payment of medical benefits has been made by the Department of Health from money appropriated by Parliament for this purpose. From 1 April 1958, the cost of public hospital administration has been borne directly by general taxation; treatment in public hospitals is free. Details of medical benefits are set out in Section 5A— Health and Medical Services.
Payments—The New Zealand system has developed the following types of social welfare assistance.
Cash benefits as of right for those eligible by category, residence, and income, paid at flat standard rates (plus allowance for dependants) without regard to taxes paid.
Emergency benefits for those who need help but who are not, for any reason, eligible for standard benefits.
Accommodation benefit is available to beneficiaries who have limited income and assets and who pay relatively high accommodation costs.
Medical and pharmaceutical benefits for all members of the community; free public (and subsidised private) hospital care.
Universally applied benefits (with no means test) for dependent children, and for those over 60 years of age.
Particulars of payments under the Social Security Act during the last 5 financial years are contained in the following table.
| Item | 1978–79 | 1979–80 | 1980–81 | 1981–82 | 1982–83 |
|---|---|---|---|---|---|
* Benefit on death prior to 28 September 1982. †Includes maternity benefits relating to private hospital treatment. ‡Excludes group practice loans. §Includes private hospital loans and grants to Royal N.Z. Plunket Society towards operating costs. ||Includes domestic assistance; grants to public servants and dependants in respect of medical expenses while stationed overseas; payments under section 117, Social Security Act 1964; grants to Intellectually Handicapped Children's Parents' Associations and other organisations. | |||||
| $(thousand) | |||||
| Cash Benefits— | |||||
| National superannuation | 1,162,889 | 1,334,115 | 1,556,818 | 1,895,845 | 2,418,930 |
| Widows | 47,218 | 53,342 | 57,815 | 62,164 | 73,954 |
| Domestic purposes | 143,533 | 169,449 | 198,053 | 252,654 | 333,617 |
| Orphans | 692 | 778 | 866 | 943 | 1,114 |
| Family | 153,555 | 220,854 | 306,773 | 297,705 | 293,044 |
| Invalids | 33,912 | 40,924 | 49,580 | 60,454 | 79,074 |
| Miners | 113 | 76 | 68 | 72 | 95 |
| Unemployment | 54,236 | 66,077 | 118,757 | 156,429 | 195,218 |
| Sickness | 30,326 | 33,236 | 38,553 | 43,529 | 52,355 |
| Payment after death* | 2,967 | 2,919 | 2,812 | 2,737 | 2,796 |
| Advances for repairs to homes | 286 | 265 | 350 | 347 | 404 |
| Aid to families caring for disabled persons | 614 | 894 | 1,213 | 1,599 | 1,767 |
| Employment subsidy for disabled civilians | – | – | – | – | – |
| Capitalisation of family benefit | 7,968 | 9,094 | 5,872 | 4,374 | 6,847 |
| Total cash benefits | 1,638,310 | 1,932,023 | 2,337,530 | 2,778,852 | 3,459,215 |
| Health benefits— | |||||
| Maternity† | 6,441x | 7,286x | 8,326x | 9,951x | 11,260 |
| Medical‡ | 46,192 | 47,094 | 49,581 | 52,081 | 54,901 |
| Hospital§ | 18,818x | 26,517x | 31,879x | 39,604x | 44,970 |
| Pharmaceutical | 113,449 | 132,797 | 147,278 | 174,068 | 196,098 |
| Supplementary|| | 27,026 | 28,307 | 35,020 | 37,937 | 41,170 |
| Total medical benefits | 211,926 | 242,001x | 272,084 | 313,641x | 348,399 |
Seventy-seven percent of the total expenditure on cash benefits (including supplementary assistance advances for repairs to homes, and employment subsidy for disabled civilians) is paid without an income test.
The following table summarises social welfare expenditure according to type of benefit and per head of mean population, and also relates expenditure to gross domestic product (GDP).
| Year Ended 31 March | Gross Domestic Product | Expenditure* | ||||
|---|---|---|---|---|---|---|
| Health Benefits | Family Benefit | Other Benefits | Total | Per Head of Mean Population | ||
| * Excluding capitalised family benefits. | ||||||
| $(million) | $ | |||||
| 1979 | 17,499x | 211.9 | 153.5 | 1,476.8 | 1,842.2x | 586.10x |
| 1980 | 21,092x | 242.0 | 220.9 | 1,702.1 | 2,165.0x | 689.99x |
| 1981 | 24,340x | 272.1 | 306.8 | 2,024.9 | 2,603.8x | 827.50x |
| 1982 | 29,117x | 313.6 | 297.7 | 2,472.0 | 3,083.3 | 975.08 |
| 1983 | 32,092 | 348.4 | 293.0 | 3,154.4 | 3,795.8 | 1,189.09 |
| Percentage of Expenditure to Gross Domestic Product | ||||||
| 1979 | 1.21 | 0.88 | 8.44 | 10.53 | … | |
| 1980 | 1.15 | 1.05x | 8.07x | 10.26x | … | |
| 1981 | 1.12x | 1.26x | 8.32x | 10.70x | … | |
| 1982 | 1.08x | 1.02x | 8.49x | 10.59x | … | |
| 1983 | 1.09 | 0.91 | 9.82 | 11.83 | … | |
Government expenditure on social services (including health and education) is shown in relation to total Government expenditure in a table in the Statistical Summary at the back of this Yearbook.
Benefits and Pensions in Force—The total number of social welfare cash benefits in force at 31 March 1983 was 1 068 186. Particulars of the various social welfare benefits in force at 31 March for the 5 latest years were as follows:
| Class of Benefit | 1979 | 1980 | 1981 | 1982 | 1983 |
|---|---|---|---|---|---|
| * Increase in family benefits is due to the inclusion of family benefits paid for children being cared for by people who were not their parents. At 31 March 1983, 21 588 family benefits were paid for children being cared for by guardians. | |||||
| Number in Force | |||||
| National superannuation | 397,010 | 405,834 | 418,901 | 430,175 | 441,789 |
| Widows' | 16,173 | 16,120 | 15,416 | 14,737 | 14,125 |
| Domestic purposes | 35,385 | 37,040 | 39,412 | 43,447 | 48,121 |
| Orphans' | 422 | 413 | 388 | 365 | 362 |
| family | 462,651 | 460,897 | 461,211 | 459,994 | 486 603* |
| Invalids' | 12,272 | 15,647 | 16,961 | 17,891 | 18,757 |
| Miners' | 26 | 21 | 16 | 16 | 16 |
| Unemployment | 17,894 | 20,850 | 35,666 | 32,596 | 50,744 |
| Sickness | 7,657 | 7,504 | 7,104 | 7,177 | 7,669 |
| Total | 949 490 | 964 326 | 995 075 | 1 006 398 | 1 068 186 |
CASH BENEFITS—The rates of benefits have been increased from time to time, mainly as a result of the increased cost of living. More recent increases for invalids', widows', and miners' benefits are shown in the following table.
| Date of Increase | Amount of Increase per Week | |
|---|---|---|
| Married Couples | Unmarried Beneficiaries | |
| $ | $ | |
| 22 Jul 1981 | 7.92 | 4.75 |
| 20 Jan 1982 | 9.36 | 5.62 |
| 21 Jul 1982 | 10.68 | 6.41 |
| 19 Jan 1983 | 8.80 | 5.28 |
| 20 Jul 1983 | 2.64 | 1.58 |
| 18 Jan 1984 | 2.64 | 1.58 |
The list below gives a summary of the weekly rates for cash benefits. The term unmarried includes those widowed or divorced.
| Benefit | Weekly Rate | ||
|---|---|---|---|
| 19 January 1983 | 20 July 1983 | 18 January 1984 | |
* Unemployment benefits are taxable where no child supplement is being paid for dependent children. Rates shown are gross. †Prior to 19 January 1983 the benefit was $260 a year ($5 a week). ‡National superannuation is not subject to an income test but is taxable. Rates shown are gross. | |||
| $ | $ | $ | |
| Invalids and sickness— | |||
| Unmarried— | |||
| 18 and over | 88.06 | 89.64 | 91.22 |
| Under 18 without dependants | 66.99 | 68.20 | 69.41 |
| Married— | |||
| Husband or wife separately | 73.38 | 74.70 | 76.02 |
| Spouse included | 146.76 | 149.40 | 152.04 |
| Widows | 88.06 | 89.64 | 91.22 |
| Domestic purposes— | |||
| Solo parent or woman alone | 88.06 | 89.64 | 91.22 |
| Caring for sick or infirm— | |||
| Unmarried and 18 or over | 88.06 | 89.64 | 91.22 |
| Unmarried and under 18 | 66.99 | 68.20 | 69.41 |
| Married | 73.38 | 74.70 | 76.02 |
| Unemployment*— | |||
| Unmarried person— | |||
| Twenty years and over | 88.06 | 89.64 | 91.22 |
| Under 20 years without dependants | 66.99 | 68.20 | 69.41 |
| Spouse included | 146.76 | 149.40 | 152.04 |
| Any of the above benefits with dependent children | |||
| Solo parent and 1 child | 140.76 | 143.40 | 146.04 |
| Solo parent and 2 children | 146.76 | 149.40 | 152.04 |
| Increased by $312 a year ($6 p.w.) for each subsequent child† | |||
| Married couple with 1 child | 182.76 | 155.40 | 158.04 |
| Increased by $312 a year ($6 p.w.) for each subsequent child† | |||
| Miners— | |||
| Unmarried person | 88.06 | 89.64 | 91.22 |
| Married man (wife included) | 146.76 | 149.40 | 152.04 |
| Miner's widow | 86.46 | 88.04 | 89.62 |
| Orphans | 43.50 | 44.25 | 45.00 |
| Family— | |||
| Each dependent child | 6.00 | 6.00 | 6.00 |
| Accommodation benefit is available to beneficiaries with limited incomes and assets to assist them with accommodation costs | |||
| Emergency Benefits—According to circumstances | |||
| (22 Mar 1982) | (20 Sep 1983) | (18 Sep 1984) | |
| National superannuation‡— | $ | $ | $ |
| Married person | 99.82 | 101.47 | 103.94 |
| Single person | 119.79 | 121.77 | 124.73 |
| Married couple | 199.64 | 202.94 | 207.88 |
Payment Whilst in Hospital—Married or unmarried applicants with no dependent children receive a benefit at the current rate for the first 13 weeks of hospitalisation. The benefit is then reduced to $10.
Entitlement to benefit following the initial 13 weeks is dependent on the beneficiary's financial and personal circumstances, his or her needs, and the capacity to appreciate and understand any payment that may be made. The benefit rate is not affected for applicants with dependent children.
Basic Income Exemptions—The basic income exemptions at the end of 1982 were as follows:
Widows', invalids and domestic purposes benefits, $1,300 a year.
Sickness, and unemployment benefits—$25 a week (but see below regarding unemployment benefits and personal earnings).
Orphans benefit—$260 a year.
National superannuation is taxable and is paid to qualified persons, regardless of income. If the inclusion of a non-qualified spouse is sought, an income test applies. The income exemption in this case is $1,300 a year.
Family and miners benefits are paid regardless of the financial circumstances of the beneficiary.
Adjustment of Benefit for Income Above Exemption—Invalids, widows, and domestic purposes benefits are reduced by 40c for every complete $1 a year of gross income over the appropriate income exemption of $1,300 a year and up to $2,080 a year, then 80c for every $1 a year.
Sickness benefits are reduced by 8c for every 20c over $25 a week up to $40 a week, then 16c for every 20c a week of income.
Unemployment benefits are reduced by 10c for every 10c of personal earnings in excess of $10 per week, the first $10 per week of any personal earnings being added to other income. The benefits are then reduced by 8c for every 20c of other income over $25 and up to $40 per week, then by 16c for every 20c of weekly income over $40.
Orphans benefits are reduced by $3 for every complete $4 a year of income over $260 a year.
National Superannuation—National superannuation, for persons aged 60 or over, replaced age and superannuation benefits from 9 February 1977. It is subject to a 10-year residence test and is taxable, but is not subject to an income test unless payment is claimed for unqualified spouse. There are no special contributions required as national superannuation is financed from ordinary government revenue.
The after tax rates of national superannuation represent a specified percentage of the average ordinary-time weekly wage after tax. At the introduction of the scheme on 9 February 1977, the after-tax rate for a married couple was 70 percent of the average weekly wage before tax, and rose to 80 percent from 30 August 1978. From 28 August 1979 the definition was altered so that the after-tax rate for a married couple was 80 percent of the average weekly wage after tax. The single rate before tax has been set at 60 percent of the married couple rate before tax. The review dates for national superannuation are different from those for other social welfare benefits.
Widows' Benefits—Subject to an income qualification every widow who is the mother of 1 or more dependent children under 16 years of age is entitled to a benefit in respect of widowhood. In addition, any widow not being the mother of a dependent child under 16 years of age who satisfies certain conditions is also entitled to the benefit.
The following table affords an analysis of widow's benefits in force at 31 March 1983, according to the number of dependent children. (Deserted wives are also included).
| Number of Dependent Children | Widows' Benefit |
|---|---|
| Nil | 9,328 |
| 1 | 2,681 |
| 2 | 1,304 |
| 3 | 542 |
| 4 | 179 |
| 5 or more | 91 |
| Total | 14 125 |
Domestic Purposes Benefits—Persons who qualify for domestic purposes benefit are:
A woman with a dependent child or children, who is living apart from, has lost the support of, or is inadequately maintained by, her husband, or who is divorced from her husband, or whose husband is a prisoner;
An unmarried mother of one or more dependent children;
A father of one or more dependent children who has lost his wife by death, divorce, or some other cause.
Women without dependent children who come within the definition of “a woman alone”, which is a woman who has never been married or who has lost the support of her husband, and who has cared for dependent children or for incapacitated relatives.
Other persons qualifying for the domestic purposes benefit are those required to give full-time care and attention at home to a person who would otherwise have been admitted to hospital.
In the case of both a solo parent and a woman alone, de facto marriages are considered as marriages.
Orphans' Benefits—A benefit in respect of orphanhood is payable in the case of a child under 16 years of age who was born in New Zealand or whose last surviving parent was ordinarily resident in New Zealand for a period of not less than 3 years preceding the date of his or her death.
The number of benefits in force at 31 March 1983 was 362 (in respect of 466 children).
Family Benefits—The rate of the benefit is $6 a week for each child, until he or she reaches 16 years, or, if a full-time school pupil, the end of the year in which 18 years is reached. The rate was increased to $6 a week from 17 October 1979.
A family benefit or portion of a family benefit may be paid in a lump sum in advance for a period not exceeding 52 weeks in respect of the first child or a child who has commenced his first year of intermediate or secondary education.
The total number of benefits in force at 31 March 1983 was 486 603 covering 943 684 children, compared with corresponding figures of 459 994 and 954 280 at 31 March 1982. At the end of the 1982 school year there were 83 405 children over 16 at school in respect of whom benefits were being paid.
The average number of children in respect of whom benefits were paid was 1.94 per family at 31 March 1983.
Under the provisions of the Family Benefits (Home Ownership) Act 1964, family benefits may be capitalised and paid in advance to assist parents with the erection or purchase of house properties, whether previously occupied or not, additions or alterations to existing homes, or in certain circumstances the repayment of mortgages and other obligations on family homes. In outline, the measure provides for the capitalisation of up to $6.00 of the weekly family benefit in respect of each of 1 or more children from the age of 1 year up to the age of 16 years, provided that the total of the advance or advances in the case of any one family is not less than $400 nor more than $4,000. The maximum income limit for eligibility is $275 a week for a family with 1 child, rising by $25 a week for each additional child.
Details of family benefit capitalisation in recent years are shown in the following table.
| Year Ended 31 March | Applications for Capitalisation Approved | Capitalised Value of Benefits |
|---|---|---|
| $(000) | ||
| 1979 | 6,591 | 7,968 |
| 1980 | 3,710 | 9,094 |
| 1981 | 2,278 | 5,872 |
| 1982 | 2,445 | 4,374 |
| 1983 | 3,977 | 6,847 |
Invalids' Benefits—An invalid's benefit is payable if persons aged 15 years or over—(a) are totally blind; or (b) are permanently and severely restricted in their capacity for work as the result of an accident or by reason of illness or of any congenital defect.
In computing the income of blind persons no account is taken of their personal earnings. In addition, the benefit of totally blind persons may within certain limits be increased by up to 25 percent of their personal earnings. The personal earnings of severely disabled beneficiaries may be disregarded in whole or in part in computing their benefits.
Miners' Benefits—A miner's benefit is payable to any person who, while engaged as a miner in New Zealand, contracted pneumoconiosis or any other occupational disease and is thereby permanently and seriously incapacitated for work, provided that compensation in respect of the same disability is not being received.
Unemployment Benefits—Applicants for unemployment benefits are required to satisfy the commission: (a) that they are unemployed; (b) that they are capable of undertaking and are willing to undertake suitable work; (c) that they have taken reasonable steps to obtain suitable employment; (d) that they have resided continuously in New Zealand for not less than 12 months at any time. People are not entitled to an unemployment benefit if they are full-time students, or if not employed because of a strike either individually, or by fellow members of their union at the same place of employment.
An unemployment benefit is not payable for the first 7 days of any period of unemployment for applicants with dependants, and the first 14 days for single people, except in special circumstances.
A further waiting period of up to six weeks is imposed on high income earners.
The commission may postpone, for a period not exceeding 6 weeks, the commencement of the benefit if the applicant: (a) has voluntarily become unemployed without good and sufficient reason; or (b) has lost his/her employment by reason of any misconduct as a worker. The benefit may be terminated if the beneficiary has refused or failed, without a good and sufficient reason, to accept any offer of suitable employment.
The benefit is payable so long as the beneficiary is unemployed or until he/she becomes eligible to receive another class of benefit, other than a family benefit—e.g., national superannuation.
If a beneficiary is not receiving a benefit in respect of a spouse, an allowance may be paid in respect of any person who has the care of his/her home.
Benefits were granted to 123 835 persons in 1981–82, and 150 897 persons in 1982–83.
The following table shows the position regarding unemployment benefits and emergency unemployment benefits during the year ended 31 March 1983. Emergency benefits may be granted on grounds of hardship to persons who do not qualify for the ordinary unemployment benefit. The average duration of unemployment benefits (not including emergency benefits) which ceased during the 1983 March year was 15.5 weeks (14.8 weeks for men and 16.8 weeks for women.)
| Unemployment | Emergency Unemployment | |||||
|---|---|---|---|---|---|---|
| Males | Females | Total | Males | Females | Total | |
| * Numbers obtained from a monthly count of benefits in force. | ||||||
| Benefits granted | 99,161 | 51,736 | 150,897 | 4,450 | 3,247 | 7,697 |
| Applications declined | 24,204 | 12,313 | 36,517 | 3,205 | 2,590 | 5,795 |
| Benefits in force at 31 March 1983 | 30,874 | 17,869 | 48,743 | 1,065 | 936 | 2,001 |
| Average number in force during year* | 23,160 | 13,473 | 38,611 | 1,267 | 1,108 | 2,374 |
Sickness Benefits—A person over the age of 15 years who is incapacitated for work through sickness or accident, and as a result suffers a loss of salary, wages, or other earnings, may apply for a sickness benefit.
The number of persons granted a sickness benefit was 30 151 in 1981–82, and 30 919 in 1982–83.
In the following table sickness benefits which ceased during the March year 1983 are shown according to the duration of the sickness benefit.
| Period on Benefit (Weeks) | Number of Benefits | ||
|---|---|---|---|
| Males | Females | Total | |
| Up to 5 | 6,640 | 4,100 | 10,740 |
| 5–8 | 2,320 | 1,560 | 3,880 |
| 9–12 | 1,760 | 1,530 | 3,290 |
| 13–25 | 2,580 | 3,240 | 5,820 |
| 26–38 | 930 | 1,220 | 2,150 |
| 39–51 | 480 | 290 | 770 |
| 52–77 | 650 | 370 | 1,020 |
| 78–103 | 310 | 160 | 470 |
| 104 and over | 600 | 330 | 930 |
| Total | 16 270 | 12 800 | 29 070 |
Continuation of Benefit after Death of Beneficiary—From 28 September 1982 benefits are paid for a period of 4 weeks following the death of beneficiaries, to dependants who are net entitled to lump sum payments (under section 82 of the Accident Compensation Act 1982).
Single Payments after Death—From 28 September 1982 dependants of any person who dies are eligible to receive a single payment of $1,000, subject to the net value of the deceased's estate being less than $6,000 and an income test.
A further $500 is paid for each dependent child. If the deceased was a national superannuitant or social security beneficiary, any amount paid after the date of death by way of 'continuation of benefit after the death of beneficiaries' will be deducted from the lump sum of $1,000.
In cases of deceased without dependants, a single payment not exceeding $500 may be paid to meet any funeral expenses which are not able to be paid from the deceased's estate before the payment of any other debts.
Following the death of a dependent child for whom family benefit was payable, a single payment of $500 may be paid to the parents or guardians subject to a means test.
Emergency Benefits—An emergency benefit may be granted on the grounds of hardship to any person who by reason of age, physical or mental disability, or any other reason is unable to earn a sufficient livelihood for herself/himself and those dependent on her/him and is ineligible for any other monetary benefit other than family benefit.
Accommodation Benefit—Accommodation benefit is for people whose income and cash assets are limited and who are paying accommodation costs in excess of a certain amount. The maximum amount of accommodation benefit is $32 a week for both married couples and single people.
Since 1973 a telephone rental concession equal to one-half of the amount of the rental may be granted to persons in receipt of invalids', widows', or related benefits.
Disability Allowance—A disability allowance of up to $14.00 a week is payable for disabled persons receiving an income tested benefit or for persons whose income is such that they could qualify for an income tested benefit. The allowance can also be paid in respect of the disabled wife or child of such a person. The purpose of the allowance is to meet special expenses arising from the person's disability, such as transport costs, special diet, domestic help, or medicines not on free list. etc.
Handicapped Child's Allowance—A non-taxable allowance of $14.00 a week to the parents of seriously physically or mentally handicapped children other than those already being cared for in full-time residential institutions.
DISABLED PERSONS COMMUNITY WELFARE ACT—In addition to the disability allowance and the handicapped child's allowance provided for under the Social Security Act, the following services and payments are available under the Disabled Persons Community Welfare Act 1975.
Alternative Care—The Department of Social Welfare will meet reasonable costs of alternative care of a seriously disabled child for 4 weeks in every year for the purpose of relieving the parents of the constant burden of caring. The cost of alternative care for disabled persons other than children may be met if it is justified by the circumstances of the case. During the year ended 31 March 1983, applications relating to 3844 children and 4724 adults were granted at a value of $1,767,000.
Medical Expenses—Travel and accommodation expenses are available to seriously disabled people when undergoing a course of medical treatment approved by a hospital board specialist, or undergoing educational, vocational, or psychological assessment. Where the disabled persons cannot travel alone and must be accompanied by an attendant, the reasonable travel costs of an attendant may be met.
The total expenditure for medical expenses for the year ended 31 March 1983 amounted to $139,513.
Loans for Home Alterations—Suspensory and interest-free loans are available for alterations to homes to accommodate a wheelchair or to provide handrails or to change plumbing and other fittings, having regard to the person's disability. During the year ended 31 March 1983, 952 loans were approved to the value of $1,339,596.
Disability Aids—Seriously disabled people may be assisted towards the cost of walking frames, prosthetic appliances or aids. Aids must be ambulatory and directly assist the disabled person's mobility. Total expenditure for the supply of disability aids for the year ended 31 March 1983 amounted to $184,318.
Suspensory Loans for Motor Vehicles—Suspensory loans may be granted to seriously disabled persons to assist in the purchase of a motor vehicle where such a vehicle is necessary to enable that person to obtain or retain employment or undergo training for suitable work.
The loans are also available to disabled people carrying out voluntary work for recognised community-based organisations. During the year ended 31 March 1983, a total of 83 car loans were approved at a total cost of $315,789.
Self-Employment—From December 1982 financial assistance has been available to disabled people to enable them to become self-employed. In the period up to 31 March 1983, 3 applications were granted to the value of $18,000, 2 applications were declined, and a decision is yet to be reached on 5 applications.
Driving Assessment Centres—From October 1982, financial assistance was available to disabled people and people assisting them, to attend driving assessment centres. The scheme is mainly intended for those whose conditions would preclude them from driving a normal car without modification. Up to 31 March 1983, no applications have been received.
Reciprocity with Australia—The Social Security (Reciprocity with Australia) Act 1948 provided for reciprocity in relation to a wide range of benefits between New Zealand and the Commonwealth of Australia. The Act came into force on 1 July 1949. (A similar Act was passed in Australia and came into force on the same date).
For the purpose of any application for a benefit (except the New Zealand miners, orphans, or domestic purposes benefits) residence in Australia or birth in Australia is regarded as residence or birth in this country.
Applicants for invalids' or widows' benefits must be qualified on residential grounds to receive the corresponding pensions under the Social Services Act (Australia) as if their residence in New Zealand had been residence in Australia. No male person is entitled to receive national superannuation unless he has attained the age of 65 years and, if under 70, he will be required to establish that he would have been able to qualify on income grounds for an Australian age pension had he remained in Australia. The Act also provides that the department shall treat blindness or permanent incapacity for work occurring in Australia as if it had occurred in New Zealand.
Reciprocal benefits in force in New Zealand at 31 March 1983 comprised 633 national superannuation benefits; 21 widows benefits; 58 invalids' benefits; 16 unemployment benefits; and 2 sickness benefits—a total of 730 compared with 727 a year earlier.
Reciprocity with United Kingdom—The Social Security (Reciprocity with United Kingdom) Act 1969 provides for reciprocity in a comprehensive range of benefits between New Zealand and the United Kingdom. The general principle of the convention is that persons migrating from one country to the other will be taken into the social security scheme of the receiving country and paid benefits by the receiving country under the laws and conditions applicable to other residents of that country. No male person applying for national superannuation under the convention is entitled to receive payment unless he has attained the age of 65. The qualifying age for women is 60 years.
Reciprocal benefits in force in New Zealand at 31 March 1983 comprised 13 253 national superannuation benefits; 58 widows' benefits; 3 orphans' benefits; 109 invalids' benefits; 6 unemployment benefits; 1 sickness benefit; and 1 domestic purposes benefit (beneficiaries transferred to domestic purposes benefits from age benefits on the introduction of national superannuation)—a total of 13 431 compared with 13 625 a year earlier.
New Zealand Residents in the United Kingdom—In the United Kingdom the convention applies to former residents of New Zealand who claim retirement pensions, widows' pensions, widowed mothers' and guardians' allowances, family allowances, sickness and unemployment benefits under the National Insurance Act.
The qualifying age for retirement pensions under the National Insurance Act is 60 years for women and 65 years for men.
It is to be noted that, although a man may have been in receipt of national superannuation when he left New Zealand, he is not entitled to retirement pension in the United Kingdom unless he is 65 years of age. Special provisions apply to married women arriving in the United Kingdom from New Zealand as far as entitlement to the United Kingdom retirement pension is concerned.
Statistics from Census of Population 1981—In addition to the traditional census question on taxable income, information was again sought at the 1981 Census of Population on social welfare benefits received by persons aged 15 years and over. Respondents were required to specify the nature of all cash welfare benefits or pensions received during the year ended 31 March 1981. A summary of the results is given below. The figures apply only to persons normally resident in New Zealand, i.e., temporary visitors have been excluded.
The table following indicates that 43.2 percent of the population aged 15 or over were in receipt of at least 1 social welfare cash benefit in the year ended 31 March 1981. It should be noted that these figures have been rounded, using simple random rounding to base three and, because of rounding procedures, totals are not necessarily the exact sum of the component parts.
| Class of Benefit or Pension | Total Beneficiaries* | Percentage of Total Population 15 years and over*† | ||||
|---|---|---|---|---|---|---|
| Male | Female | Total | Male | Female | Total | |
* New Zealand residents aged 15 years and over. †Excludes cases where benefits were not specified. ‡Includes War Veterans' Allowance. | ||||||
| None | 867,684 | 429,444 | 1,297,131 | 77.1 | 37.0 | 56.8 |
| Family only | 9,657 | 387,240 | 396,900 | 0.9 | 33.4 | 17.4 |
| National Superannuation only | 164,145 | 230,469 | 394,614 | 14.6 | 19.9 | 17.3 |
| Unemployment only | 31716 | 20,367 | 52,080 | 2.8 | 1.8 | 2.3 |
| Sickness only | 9,273 | 5,175 | 14,448 | 0.8 | 0.4 | 0.6 |
| Domestic Purposes only | 519 | 5,871 | 6,393 | – | 0.5 | 0.3 |
| Widow's only | 11,895 | 11,895 | 1.0 | 0.5 | ||
| Invalid's only | 8,841 | 6,372 | 15,216 | 0.8 | 0.5 | 0.7 |
| War Pension Allowance only‡ | 11,430 | 6,585 | 18,015 | 1.0 | 0.6 | 0.8 |
| Family and Domestic Purposes | 1,332 | 32,712 | 34,041 | 0.1 | 2.8 | 1.5 |
| Family and Widow's | 4,764 | 4,764 | 0.4 | 0.2 | ||
| Other | 20,772 | 19,269 | 40,044 | 1.8 | 1.7 | 1.8 |
| Not specified | 4,965 | 6,204 | 11,169 | … | ||
| Total, usually-resident population aged 15 years and over | 1 130 337 | 1 166 364 | 2 296 704 | 100.0 | 100.0 | 100.0 |
FRIENDLY SOCIETIES—Friendly societies or lodges had a membership of 49 442 at the end of 1982 compared with 113 000 in 1938 before the introduction of social security. They provide sickness and death benefits for members. The funds of the societies (including central bodies) totalled $67.6 million as at 31 December 1982.
Specially Authorised Societies—The majority of new societies registered under the Friendly Societies Act in recent years have been specially authorised societies in the form of credit unions; the number of such societies registered is now 286 and their funds totalled $68.8 million in 1982.
Medical Care Societies—The provisions of benefits to provide part or all of the costs of medical or surgical attendance in return for voluntary contributions may be administered through a separate fund of a traditional friendly society or through a society providing only such benefits, including the costs of private hospital treatment. The latter type of society may be registered under the Friendly Societies Act 1909, but at least 2 are known not to be so registered. It is, therefore, not possible to give comprehensive statistics of either membership or funds related to such benefits. The number of individuals covered for such benefits is approximately 460 000 in societies registered under the Friendly Societies Act solely for the purposes and could be in excess of this figure in respect of traditional societies.
SOCIAL WORK—The establishment of the Department of Social Welfare from 1 April 1972 resulted in a widening of the scope of social work formerly undertaken by the Child Welfare Division of the Department of Education and the Social Security Department. Although much of it is still concerned with the care, protection, and control of children and young persons, it now includes counselling work with the mentally and physically disabled, solo parents and their children, and the aged. The department now maintains a team of social workers and other staff who provide a general, individual, and family welfare counselling and guidance service for all age groups as well as undertaking general field investigation and inquiry work.
Services for Community Care—Assistance is given to community organisations providing care and training in the community for the handicapped, both physically and mentally, and for socially deprived children and pregnant women.
Financial assistance is given by way of subsidy to establish and operate residential homes, day care centres, and sheltered workshops. At 1 January 1984 the range and levels of available subsidies were as follows:
Socially deprived children (i) 66% percent of capital cost of establishing residential accommodation and $49.00 per week for each child in residence. (ii) 66% percent of capital cost of establishing day care centres and $12.00, $15.00, or $18.00 per week per child attending, depending on family income.
Mentally handicapped persons: $10.57 per day for each child in residence.
Physically and/or mentally handicapped persons: 80 percent of capital cost of establishing day care, sheltered workshop, and training facilities and 75 percent of cost of staff salaries.
Field services: Grants to organisations providing field services for disabled people, children at risk, and their families
Other assistance to organisations in this field include:
An advisory service covering a wide range of activities from forward planning to details of administration and design;
The engagement of Ministry of Works and Development in the search for, inspection of, and purchasing of suitable properties, on behalf of any organisation wishing to establish a subsidisable social welfare facility.
Standards of care and training are set by legislation, requiring residential and day care centres to be registered, and by periodic inspection to ensure that the standards are being maintained.
Social Work with Children and Young Persons—As at 31 March 1984, the number of permanent social work staff employed by the Department of Social Welfare included 653 social workers and 525 residential social workers. Casework duties include preventive work; investigations and reporting for the Children's and Young Persons Courts; supervision of children in their own homes; foster home, institutions, and work placement; adoption and ex-nuptial birth inquiry work; the licensing of foster parents defined in the Act; reporting to courts on matrimonial proceedings affecting custody of children; registration of child care centres; inspection of children's homes run by voluntary organisations and examination of requests made by them for financial subsidies; and the oversight of immigrant and refugee children. Social workers receive assistance from about 1200 social welfare volunteers who are members of the community. These people give their time and talent to receive brief training and to become involved, under the close supervision of the department, in giving support and assistance to individuals or families encountering difficulties.
Institutional care facilities include long-term training centres for difficult and delinquent children, short-term facilities providing classification, emergency, and temporary care for both infants and older children, and family homes which provide care for children of all ages either on a short-term or long-term basis.
Social workers undertake a wide variety of miscellaneous investigations and inquiries concerning the welfare of children. Cases may be referred by neighbours, police, teachers, employers, doctors, solicitors, etc., or by parents themselves who are seeking advice and guidance. Some of these cases will respond quickly to help. Others may need preventive oversight and guidance over several months or even 2 or 3 years. Financial help can be given in special cases. In a relatively small number of cases preventive help is not sufficient and court action is the outcome of inquiries.
Social workers, on receiving from the registrars notifications of ex-nuptial births, make confidential inquiries and assist single parents. Placements in adoption homes are made by social workers for children for whom placements have not been made by private persons and other organisations. The smaller proportion of children being offered for adoption reflects a changing pattern in society, with an increase in the proportion of single parents undertaking the sole care of children.
Adoption—Under the Adoption Act 1955 a social worker must give prior approval to the placement for adoption of a child or young person under 20 years of age, or alternatively, the applicants must apply for an interim order of adoption from the court. The court is required to obtain a social worker's report on such a placement before granting an order. A waiting period of at least 6 months is normally required during which the placement is supervised by a social worker, before a final order can be made. Any person who is not a close relative and who undertakes to care for a child under the age of 6 years apart from its mother for a period of more than 28 consecutive days for payment or reward must have her home licensed by a social worker. At 31 December 1982 social workers were visiting 55 children so placed.
Children's Homes and Child-Care Centres—Inspecting children's homes operated by private organisations and administering schemes of Government financial assistance to these homes is another important social welfare function. Financial assistance is given by payments of $49.00 per week for each child in care and subsidies of up to 66% percent on expenditure for extension or replacement of buildings or additions to facilities. A similar capital subsidy is available for private organisations to help in providing accommodation for unmarried mothers and their children.
Regulations for the registration and licensing of child care centres (e.g., day nurseries, creches, etc.), have been in force since 1961. A revision of these regulations has been undertaken, and it is expected that changes to the regulations will be promulgated in 1985.
The Department of Social Welfare has built up a considerable body of knowledge on new trends and methods in the fields of both residential and day care for children. As a result it has become an important point of reference for information and advice.
Detached Youth Workers—The Detached Youth Worker Funding Scheme, operated by the Department of Internal Affairs, provides community organisations and local authorities with grants for the employment of detached youth workers.
Detached youth workers generally work with young people whose educational, employment, health, housing and recreational needs are not adequately met by existing services. Further information on the funding of this scheme is available in Section 8E of this Yearbook.
Children and Young Persons Proceedings—The Children and Young Persons Act 1974, which came into effect on 1 April 1975, introduced substantial changes in the procedures under which the department carries out its functions in relation to juvenile offending and other problems concerning the welfare of children.
The main thrust of the Act was to extend the provisions for young offenders to be dealt with through care, protection, and control proceedings rather than through criminal prosecutions and to provide for such proceedings to be dealt: with by newly-created Children's Boards rather than by courts.
Prior to the coming into force of this Act, children or young persons coming to the notice of the police for offending were dealt with either by the Youth Aid section of the New Zealand Police or by prosecution in the Children's Court. Children and young persons considered to be in need of care, protection, or control were generally dealt with by way of complaint to the Children's Court under the provisions of the Child Welfare Act 1925.
Under the provisions of the Children and Young Persons Act 1974, a legal distinction is made between children (defined in the Act as persons under the age of 14 years) and young persons (defined as persons aged 14 years but less than 17 years).
Where a young person comes to notice for offending, the matter may be dealt with by the Youth Aid section of the New Zealand Police by way of consultation between the police and a social worker.
Children's Boards deal with children coming to official notice either for offending or because they are considered to be in need of care, protection, or control.
The Youth Aid section and Children's Boards can deal with cases coming to their attention in several ways. These include warnings by the board or Youth Aid section, oversight by a social worker or Youth Aid officer, counselling of the child or young person, and counselling of the parents or guardian.
Both the Children's Boards and the Youth Aid section have the option of referring any matter to a Children's and Young Persons Court.
Children's and Young Persons Courts—The Children's and Young Persons Courts were established by the Children and Young Persons Act 1974 and began operation on 1 April 1975. Figures in the following table are for the year ended 31 December 1982.
| Children's and Young Persons Courts | Number of Appearances |
|---|---|
| Appearances involving complaint under Children and Young Persons Act 1974 | 2,334 |
| Appearances involving charges for offences | 10,524 |
| Total appearances | 12 858 |
Total Cases Coming to Notice—The table below gives total numbers of cases coming to official notice each year during the period 1978 to 1982.
| Year | Youth Aid Cases Not Referred to Court or Children's Boards | Children's Board Cases Not Referred to Court | Court Appearances | Total Number | Increase Percentage Decrease on Previous Year |
|---|---|---|---|---|---|
| 1978 | 3,783 | 2,781 | 13,276 | 19,840 | −6.5 |
| 1979 | 2,628 | 2,721 | 14,151 | 19,500 | −1.7 |
| 1980 | 2,472 | 2,566 | 13,397 | 18,435 | −5.5 |
| 1981 | 2,274 | 2,311 | 12,942 | 17,527 | −4.9 |
| 1982 | 2,113 | 2,763 | 12,858 | 17,734 | +1.2 |
The Children and Young Persons Act 1974, by making legislative provision for the Youth Aid scheme and by creating the Children's Boards, has increased the range of formal provisions by which cases can be resolved without court action. It might be expected, therefore, that virtually all disposals not involving court action will now appear in the statistics while in the past there were undoubtedly a number of informal disposals which escaped the statistical net. Thus, even in the absence of any increase in the number of cases being dealt with, the new procedures might be expected to produce an increase in the statistics for disposals not involving the courts. This in fact is what is observed; while the number of court appearances remains essentially static at around 13 000 to 14 000, the number of non-court disposals at first increased, going from 12 588 in 1974 to 14 930 in 1975. Recent years, however, have shown a decline, especially in Youth Aid cases.
Appearances finalised in the Children's and Young Persons Court up to 31 December 1982 numbered 12 858.
Decisions of the Children's and Young Persons Court during 1982 are summarised in the following table.
| Decision | Number |
|---|---|
| Discharged, or admonished and discharged | 2,289 |
| Admonished with some other penalty (fine, costs, restitution, forfeiture of driving licence, etc.) | 3,028 |
| Admonished and returned to the care of Director-General | 237 |
| Placed under supervision of a social worker | 3,644 |
| Placed under guardianship of Director-General | 780 |
| Referred to District Court or High Court and given an adult sentence | 2,031 |
| Other order made | 849 |
| Total | 12 858 |
It can be seen from the table that the Children's and Young Persons Court resulted in a total of 780 children and young persons being placed under the guardianship of the Director-General during 1982. The corresponding figure for 1981 was 901. A further 3644 children and young persons were placed under the supervision of a social worker. This compares with 3397 in 1981.
Legal Representation—An interim report, Working Party on Access to the Law, published by the Justice Department in 1982, expressed concern over inadequate legal representation in the Children's and Young Persons Court. The limitations of the existing schemes were highlighted by the reduction in August 1981 of the duty solicitor scheme. It reverted to the original concept, which permitted only those in police custody or on police bail, charged with an imprisonable offence, to see the duty solicitor. The dispositions available under the Children and Young Persons Act mean that a large number of those appearing before the Children's and Young Persons Court face the possibility of guardianship orders, but are not eligible to see the duty solicitor. This possibility may be equally traumatic for the parents who may not be represented either. In fact their position is, in reality, worse, because being eligible for civil legal aid only, they are faced with applying for legal aid through a system which is not geared to the quicker disposal of cases in the Children's and Young Persons Court.
To overcome this, the working party recommended that a pilot scheme be established in the Auckland Children's and Young Persons Court. If successful the scheme would be extended to other major urban children's courts and children's courts in smaller centres. The scheme would restrict the number of lawyers paid by government schemes in the court, and would ensure a lawyer was always present. Major advantages of the scheme would be continuity in the child-lawyer relationship, higher and more consistent standards of representation and the establishment of contacts between advocates and other agencies involved with the court. The pilot scheme which is to operate for a period of 6 months, is likely to be set up in 1984.
The following table gives details of legal representation in the Children's and Young Persons Court during 1981 and 1982.
| Year | Complaints | ||
|---|---|---|---|
| Total Number of Appearances | Percentage with Legal Representation | Percentage with Legal Aid | |
| 1981 | 2,528 | 36.1 | 13.4 |
| 1982 | 2,389 | 31.9 | 12.4 |
| Year | Charges | ||
|---|---|---|---|
| Total Number of Appearances | Percentage with Legal Representation | Percentage with Legal Aid | |
| 1981 | 10,411 | 40.8 | 17.0 |
| 1982 | 10,524 | 36.3 | 17.9 |
| Penalty | Court Decisions | |||||
|---|---|---|---|---|---|---|
| Total Number | Percentage with Legal Representation | Percentage with Legal Aid | ||||
| 1981 | 1982 | 1981 | 1982 | 1981 | 1982 | |
| Minor | 7,076 | 7,035 | 39.4 | 34.2 | 14.7 | 15.5 |
| Supervision | 3,629 | 3,644 | 37.2 | 33.2 | 14.4 | 15.0 |
| Guardianship order | 901 | 780 | 37.3 | 36.3 | 15.3 | 15.8 |
| Probation | 462 | 469 | 49.1 | 46.3 | 25.8 | 27.7 |
| Adult sentence | 874 | 930 | 52.5 | 48.2 | 32.7 | 30.8 |
| Total, New Zealand | 12 942 | 12 858 | 39.9 | 35.5 | 16.3 | 16.9 |
State Wards—State wards are children and young persons who, for a variety of reasons, have been subject to an order made by the Children's and Young Persons Court placing them under the guardianship of the Director-General of Social Welfare. The events leading to the making of such orders are as diverse as the people concerned, but they can be roughly divided into 2 broad categories. The first is parental inability or failure to provide a stable, permanent home or to meet a particular child's special needs. This would include cases of neglect, ill treatment, and desertion as well as serious family problems beyond parent's control.
The second category is that of seriously disturbed or anti-social behaviour on the part of children and young persons which is beyond the capacity of their parents to amend or control.
The placement and oversight of wards is a major responsibility of social workers acting on behalf of the Director-General, and it is no light task. In addition to children placed under the Director-General's guardianship or his/her temporary custody by court order, there are increasing numbers coming into care by way of voluntary agreement with parents. Such children are treated in almost every way as though they were wards. Parents seeking the department's help in this way do so for a variety of reasons, such as their own serious ill health, family break-up, and other pressures within the family or their desire to seek special care for a disturbed or difficult youngster. In 1982 there were 5477 state wards and 572 children in care under voluntary agreements.
At 30 November 1982 a total of 6588 children and young persons were under the care and control of the department. The reasons for their being placed were as follows:
| Placed under guardianship of the Director-General by court order | 5,477 |
| Under control by virtue of an agreement with parents | 572 |
| On court remand, postponement, warrant, etc. | 539 |
| Total | 6 588 |
Children and young persons may come into care at any time from soon after birth to the age of 16 years. (Guardianship orders under the Children and Young Persons Act 1974 are not made in respect of young people over the age of 16 years.) Wards are automatically discharged at the age of 20 years but in practice, and depending on their circumstances, most are discharged with the approval of the Director-General at a much earlier age. Many return, after a period away from home, to the care of parents or members of their extended family and are discharged as soon as the Director-General is assured that they are no longer in need of supervision.
The majority of wards are cared for in the community and in 1982, 55.9 percent were living in foster homes, departmental family homes, or in the homes of relatives and friends. Just over 14.2 percent were with their own parents as a trial to possible discharge. Of the remainder, 9.8 percent were at work.
A proportion of wards, especially those in older age groups, come into care because of anti-social, even criminal, behaviour. With help and guidance, some of these settle in the community but some have to be admitted to the department's various training institutions, usually after assessment and trial in boys' and girls' homes. A proportion go on to institutions under the control of the Justice Department. In all, 15 percent of the wards in care are in institutions.
Details of children and young persons under the control and supervision of the department at 30 November 1982 are shown in the following table.
| Placement of Children | Number | Percentage |
|---|---|---|
| * Includes 281 (4.3 percent) children and young persons placed in social welfare national institutions, and 36 (0.5 percent) placed in youth prison or corrective training centres. | ||
| In foster homes | 2,727 | 41.4 |
| Placed with parents for trial period | 937 | 14.2 |
| Living with and supported by relatives | 131 | 2.0 |
| In employment (excluding those with relatives, etc.) | 645 | 9.8 |
| In residential colleges | 219 | 3.3 |
| Receiving tertiary education | 8 | 0.1 |
| In Social Welfare short-stay homes | 315 | 4.8 |
| In Social Welfare family homes | 822 | 12.5 |
| In private institutions | 278 | 4.2 |
| In Department of Education special schools | 57 | 0.9 |
| In hospitals | 14 | 0.2 |
| In psychiatric hospitals | 54 | 0.8 |
| On probation | 39 | 0.6 |
| In Social Welfare and Justice Department residential training centres* | 317 | 4.8 |
| Absent without leave | 16 | 0.2 |
| In police custody | 9 | 0.1 |
| Total | 6 588 | 100.0 |
Community Service For Maori People and Pacific island Polynesians—For information on the Maori Community Services Programme refer to Section 3B of this Yearbook.
FURTHER INFORMATION—Other publications dealing with social welfare include the following: Report of the Department of Social Welfare (Parl. paper E. 12)—(Annual).
The Public Health (Parl. paper E. 10)—Department of Health (Annual).
Accommodation and Service Needs of the Elderly—Department of Health (1976).
Home Help Services in New Zealand—Department of Health (1978).
The Welfare State?—Social Policy in the 1980s—New Zealand Planning Council (1979).
Family Statistics in New Zealand—Department of Statistics (1978).
Survey of Persons Aged 65 Years and Over, 1973–74—Departments of Social Welfare and Statistics.
Miscellaneous Bulletin No. 6—New Zealand Children and Young Persons Court Statistics—Department of Statistics (1979).
Justice Statistics—Department of Statistics (Annual).
Social Trends in New Zealand—Department of Statistics (1977).
Miscellaneous Bulletin No. 12—New Zealand Children 1979—Department of Statistics (1979).
The Prediction of Juvenile Offending: A New Zealand Study—Joint Committee on Young Offenders.
Trends in Health and Health Services—Department of Health.
Report of the Registrar of Friendly Societies (Parl. paper B. 18).
Report of the Department of Maori Affairs (Parl. paper E. 13).
Working Party on Access to the Law—Department of Justice (1982).
Census of Population and Dwellings 1981 (Vol. 5—Incomes)—Department of Statistics.
The war pensions programme is largely the outcome of New Zealand's participation in 2 World Wars in which large numbers of citizens served as members of the forces. It applies also to service in Korea, South-east Asia, and includes obligations undertaken under the charter of United Nations and service with the Regular Force prior to 1 April 1974.
The war pensions scheme has developed from one which initially gave limited compensation for those returned from active service to one of comprehensive coverage for ex-servicemen who are disabled or incapacitated at any time of their lives as a result of their service, and for their dependants and also for the dependants of those who have died as a result of service.
The war pensions legislation is designed to provide (a) basic pensions to compensate for disablement or death, which provide for physical loss and are therefore compensatory in character, and (b) supplementary pensions, in appropriate cases, to meet loss of income. The latter depend on the means of the pensioner and are economic in character, acting as income maintenance and being therefore similar to social security benefits.
ADMINISTRATION—For many years social security monetary benefits and war pensions have been administered by 1 department.
The authority for paying war pensions is vested in the War Pensions Board, an independent body appointed by the Minister in Charge of War Pensions, with a chairman, a medical member, and a representative of the members of the forces appointed on the nomination of the New Zealand Returned Services Association. The administration of the War Pensions Act is, however, the responsibility of the Secretary for War Pensions who acts under the general direction and control of the Minister.
It is laid down that the onus of proving that death or disablement was attributable to service, or that the condition which resulted in death or disablement was aggravated by such service, shall not be on the claimant and that the War Pensions Board and the War Pensions Appeal Board shall give claimants the full benefit of all presumptions in their favour. A member who was graded fit for service when he entered the forces is deemed to have been absolutely fit at that time unless any defects were noted then or within the first 2 months of service. This presumption does not operate if the member failed to disclose any material fact to the medical examiner. The boards are not bound by technicalities or legal forms or rules of evidence, but determine all claims in accordance with their merits.
RATES AND ALLOWANCES—The list below summarises the rates of war pensions and allowances. The pensions for war disablement and war widows are now adjusted annually on a cost of living basis.
| Pension | Weekly Rate | ||
|---|---|---|---|
| 19 January 1983 | 20 July 1983 | 18 January 1984 | |
* Adjusted annually at 1 April in relation to movements in the Consumers Price Index. †Subject to means test on income. ‡Increased to $6.00 from 19 January 1983. Prior to this date the rate was $5.00. | |||
| $ | $ | $ | |
| Disablement pension*— | |||
| Total disablement | 59.02 | 66.49 | 66.49 |
| Special additional pension for blindness or serious disablement | 35.42 | 39.90 | 39.90 |
| Economic pension†— | |||
| Unmarried person | 88.06 | 89.64 | 91.22 |
| Married person | 73.38 | 74.70 | 76.02 |
| Wife's pension† | 73.38 | 74.70 | 76.02 |
| War widow's pension— | |||
| Basic pension* | 43.54 | 49.05 | 49.05 |
| Economic pension† | 88.06 | 89.64 | 91.22 |
| Mother's allowance— | |||
| One dependent child | 52.70 | 53.76 | 54.82 |
| Two dependent children | 58.70 | 59.76 | 60.82 |
| Increased by $6.00 a week for each subsequent child‡ | |||
| Orphan's pension | 44.55 | 45.30 | 46.05 |
| Child's pension | 6.00 | 6.00 | 6.00 |
| Widowed mother's pension (totally dependent)— | |||
| Basic pension* | 43.54 | 49.05 | 49.05 |
| Economic pension† | 88.06 | 89.64 | 91.22 |
| Widowed mother's pension (partly dependent)— | |||
| Basic pension* | 4.00 | 4.00 | 4.00 |
| Economic pension† | 85.81 | 87.39 | 88.97 |
| War service pension and war veteran's allowance†— | |||
| Unmarried | 88.06 | 89.64 | 91.22 |
| Married male | 73.38 | 74.70 | 76.02 |
| Married female | 73.38 | 74.70 | 76.02 |
| Age supplement (each) | 1.50 | 1.50 | 1.50 |
| Gratuity (veteran's widow) | 131.60 | 138.69 | 140.27 |
| Dependent children (replacing the rates shown where there are dependent children)†— | |||
| Solo parent and one child | 140.76 | 143.40 | 146.04 |
| Solo parent and two children | 146.76 | 149.40 | 152.04 |
| Increased by $6.00 a week for each subsequent child‡ Married couple and one child | 152.76 | 155.40 | 158.04 |
| Increased by $6.00 a week for each subsequent child | |||
Economic pensions, war service pensions, and war veterans' allowances are subject to a means test on income and are reducible if income from other sources exceeds $25 a week or $1,300 a year. In the computation of a wife's pension, the income of the husband only is taken into account.
Travel grants and other concessions may be made to severely disabled persons.
The social security legislation permits basic war disablement and war widows' pensions to be paid concurrently with any social security benefit and to be entirely disregarded for income tests.
Pensions for Dependants—From 1 April 1971 wives' pensions have not been payable in respect of service on or after 3 September 1939 unless such pension was already payable at that date. From 1 April 1971 the wife of a member of the forces pensioned for total blindness in respect of service on or after 3 September 1939 may receive a war service pension but not an age supplement. In addition to pensions for wives and children, a pension may be granted to any member of a deceased or disabled serviceman's family.
Economic Pensions—An “economic pension” is defined as a supplementary pension granted on economic grounds and is in addition to any pension payable as of right in respect of death or disablement. In considering a claim for an economic pension a War Pensions Board is required to take into consideration the ability of the claimant to obtain and retain suitable employment, the personal income and ownership of any property, the cost of living, and other relevant matters.
Servicemen pensioned for minor disablement do not receive economic pensions.
Servicemen pensioned in respect of service on or after 3 September 1939 have not, from 1 April 1971, been eligible to receive an economic pension unless already in receipt of an economic pension at that date. At 31 March 1983 there were 2067 economic pensions in force.
War Veterans' Allowances—These make provision on economic grounds for ex-servicemen, mainly of the First World War, who have become unfit for permanent employment by reason of mental or physical incapacity. At 31 March 1983 there were 1911 allowances in force.
War Service Pensions—From 1 April 1971 the war service pension is payable on economic grounds in respect of overseas service in the Second World War or any subsequent war or emergency in which members of the New Zealand forces have served. Payable subject to an income test, the pension is designed for disabled or prematurely retired ex-servicemen who saw service overseas after 3 September 1939. Ex-servicemen of other Commonwealth countries may also qualify for the pension.
An applicant must also fulfil one of the following conditions: (a) be in receipt of a war disablement pension of not less than 70 percent of the maximum pension payable for total disablement or, (b) being in receipt of a war disablement pension of less than 70 percent satisfy the War Pensions Board he is unable by reason of physical or mental infirmity to undertake permanent employment or (c) not being in receipt of a disablement pension and not having attained the age of 65 years, satisfy the War Pensions Board he is unable by reason of physical or mental infirmity to undertake permanent employment.
There are residential qualifications of 5 years for an ex-member of New Zealand forces, or an ex-member of other Commonwealth forces, who was a bona fide resident of New Zealand at the commencement of the war or emergency in which he served, and 20 years for other applicants.
No account is taken of the amount of war disablement pension in determining the amount of the basic war service pension. A war service pension cannot be paid concurrently with a social security benefit other than a family benefit.
The war service pension will ultimately be the only war pension paid for economic reasons. The rates and income exemption for this pension are similar to social security benefits and, by agreement with the War Pensions Board, the same general rules of treatment of income and assets are applied. In most respects, therefore, the war service pension is similar to its civilian counterparts, the sickness or invalids' benefit as appropriate.
Where any war service pensioner and/or his wife has attained the age of 65 years, an age supplement of a maximum of $78 a year each is added to the basic war service pension. At 31 March 1983 there were 3137 war service pensions in force.
EMERGENCY RESERVE CORPS PENSIONS—These pensions are payable where death or disablement was suffered by a member of the Emergency Reserve Corps in the course of service (including training), or was directly attributable to such service.
MERCANTILE MARINE PENSIONS—Pensions and allowances are paid in respect of death or disablement of members of the mercantile marine which are directly attributable to the Second World War.
ACCOMMODATION BENEFIT—Accommodation benefit is available to recipients of income-tested pensions and allowances, on a similar basis to social security accommodation benefit. At 31 March 1983, 588 additional benefits were being paid to recipients of war pensions.
WAR BURSARIES—Bursaries for educational purposes are available to children of ex-servicemen in receipt of war service pension or 70 percent disablement pension and of deceased ex-servicemen in respect of whose deaths war pensions are paid.
During the year ended 31 March 1983, 303 bursaries were granted, expenditure being $42,435 for the year.
WAR PENSIONS MEDICAL RESEARCH TRUST BOARD—When a pensioner dies, any unpaid pension money not paid to dependants in the normal way may be paid to the War Pensions Medical Research Trust Fund for research into mental disorders or other fields of medical research beneficial to former members of the forces. This Medical Research Trust Fund is administered by a trust board which ensures that the money is applied to research beneficial to former members of the forces.
STATISTICAL REVIEW OF WAR PENSIONS, ALLOWANCES, ETC.—During the year ended 31 March 1983 the department dealt with 2764 applications for war pensions. Of these, 2524 applications were lodged by ex-servicemen in respect of their own disabilities, the balance being made up of claims by dependants, applications for economic pensions, war veterans' allowances, war service pensions, and pensions in respect of peacetime forces. The total for the previous year was 3199. Of these, 2800 were in respect of the applicant's own disability.
The number of appeals to the War Pension Appeal Board dealt with in 1982–83 was 312, of which 120 were upheld.
The following table shows for all classes of war pensions the number in force, except peacetime forces and war service pensions, at the end of March in each year and the expenditure during the years given.
| Year Ended 31 March | First World War (1914–18) | Second World War (1939–45) | K Force | War Veterans | Mercantile Marine | Emergency Reserve Corps | Total |
|---|---|---|---|---|---|---|---|
| Number in Force | |||||||
| 1980 | 3,560 | 22,069 | 274 | 3,874 | 20 | 4 | 29,801 |
| 1981 | 3,171 | 22,069 | 304 | 3,187 | 20 | 3 | 28,754 |
| 1982 | 2,806 | 22,148 | 310 | 2,500 | 21 | 6 | 27,791 |
| 1983 | 2,461 | 22,201 | 319 | 1,911 | 22 | 6 | 26,920 |
| Expenditure $(000) | |||||||
| 1980 | 9,202 | 47,078 | 298 | 16,957 | 40 | 14 | 73,589 |
| 1981 | 10,365 | 48,414 | 318 | 16,037 | 44 | 14 | 75,192 |
| 1982 | 9,394 | 52,326 | 348 | 14,424 | 52 | 10 | 76,554 |
| 1983 | 10,166 | 68,058 | 460 | 13,828 | 57 | 13 | 92,582 |
The foregoing figures of expenditure include the following:
Travelling allowances paid to 420 pensioners at 31 March 1983
Clothing allowances, of which 840 were being paid at 31 March 1983
Gallantry awards, of which 138 were being paid at 31 March 1983
The following are not included:
Costs of certain medical treatment not available under social security, amounting to $741,394 in 1982–83.
Railway and bus concessions to pensioners with severe disablement and locomotive disabilities, costing $46,843 in 1982–83.
Funeral grants, which cost $157,046 in 1982–83.
Administration costs in connection with war pensions and allowances are included in the administration costs of the Department of Social Welfare which are given in Section 6A.
Pensions in force at 31 March 1983 are shown by class and by war or type of service in the following table.
| War or Type of Service | Disablement Pensions | Dependants of Disabled Ex-members | Dependants of Deceased Servicemen | Total | |
|---|---|---|---|---|---|
| Widows | Parents and Others | ||||
| First World War 1914–18 | 773 | 25 | 1,662 | 1 | 2,461 |
| Second World War 1939—45 | 19,258 | 86 | 2,803 | 54 | 22,201 |
| Korean Force | 310 | 1 | 6 | 2 | 319 |
| Vietnam Force | 296 | 0 | 1 | 1 | 298 |
| Peacetime Forces | 1,589 | 1 | 60 | 7 | 1,657 |
| Other | 52 | 0 | 10 | 1 | 63 |
| Total in force | 22 278 | 113 | 4 542 | 66 | 26 999 |
Resettlement assistance is available to men who have served in South-east Asia for 6 months prior to 1 April 1972 and for 12 months after that date.
Application for housing loans, which attract a 3 percent concession rate of interest, must be lodged within 5 yea's from the date of return to New Zealand after qualifying service or 2 years after discharge from the forces whichever is the later. Application for interest-free furniture loans must be lodged within 5 years of date of return to New Zealand after qualifying service. These loans are now administered by the Housing Corporation of New Zealand.
Applications for subsidised trade training and education assistance must be lodged within 2 years of return to New Zealand. Limited preferences in farm ballots are also available to ex-servicemen with a farming background.
Special provisions exist to ensure that rehabilitation assistance will continue to be available to all ex-servicemen whose rehabilitation may at any time be interrupted or become necessary as a result of disability arising from service.
Expenditure—Rehabilitation expenditure for the 3 latest years ended 31 March was as follows:
| Item | Year Ended 31 March | ||
|---|---|---|---|
| 1981 | 1982 | 1983 | |
| $(000) | |||
| Educational facilities, including books, tuition fees, and subsistence allowance | 11 | 11 | 3 |
| Trade training— | |||
| Salary subsidy | 4 | – | – |
| Training of blinded ex-servicemen | 45 | 57 | 58 |
| Total | 60 | 68 | 61 |
Rehabilitation loan assistance, now administered by the Housing Corporation, is shown in the following table.
| Purpose of Loan | Year Ended 31 March | |||
|---|---|---|---|---|
| 1982 | 1983 | |||
| Number | Amount | Number | Amount | |
| $(m) | $(m) | |||
| Housing | 446 | 8.04 | 301 | 5.43 |
| Furniture | 152 | 0.12 | 169 | 0.17 |
| Total | 598 | 8.16 | 470 | 5.60 |
Further information on war pensions will be found in the annual report of the Department of Social Welfare (Parl. paper E. 12), and on rehabilitation loans in the annual report of the Housing Corporation of New Zealand (Parl. paper B. 13).
GENERAL—For many years the Government, local authorities, and increasing numbers of private employers have operated superannuation schemes to enable employees to make provision for their retirement in addition to the benefits provided under national schemes.
The Government Superannuation Fund in its present form was established on 1 April 1948, amalgamating funds which had been in existence since the early 1900s. Its revenues consist of members' contributions, subsidies from the Consolidated Account, trading departments, and other bodies, and interest earned on investments. The National Provident Fund was established on 1 March 1911, with the object of providing a superannuation scheme for the general public. It also provides superannuation for the employees of local authorities and other approved bodies, and maintains an investment pool in which local bodies invest their surplus funds and which provides an important source of their loan finance.
A scheme under which National Superannuation is payable to all New Zealanders over 60 years of age who meet a 10-year residential qualification was introduced from 9 February 1977. More details of this scheme are given in Section 6A—Social Welfare and Social Work.
GOVERNMENT SUPERANNUATION FUND—The Government Superannuation Fund is administered by a board comprising the Minister of Finance as statutory chairman, the Secretary to the Treasury as deputy chairman, the Chairman of the State Services Commission, the General Manager of Railways, the Directors-General of Education and the Post Office, the Commissioner of Police, and 5 members appointed on the nomination of various employee organisations and 1 on the nomination of the Minister of Defence.
Membership—All State employees may belong to the fund and this covers those in departments under the control of the State Services Commission, the Education Service, the New Zealand Railways Corporation, and the Post Office. Membership is compulsory for permanent members of the armed forces, the Police, the Prison Service, judges of the High Court, Maori Land Court judges, District Court judges, members of Parliament, and members of the Cook Islands, Niue, and Tokelau public services. In addition, from 1 January 1964 membership has been compulsory for permanent employees of the Government from age 17 to age 24 years.
Contributions—Deductions are made from basic salary on a sliding scale according to the age from which membership of the fund dates. These are at the rate of 6 percent for those joining when below 30 years of age, increasing by 1 percent steps each succeeding 5 years of age until a maximum rate of 11 percent is payable from the age of 50 years. From 1975 a flat rate contribution of 6 percent has been available for older members as an alternative to the standard rates. The benefit at retirement is proportionately reduced for these contributors.
Credit may be purchased in certain circumstances for periods of Government service not currently ranking and for full-time study or periods of training outside Government service and which resulted in a qualification being gained. Certain intervals in Government service may also be purchased for superannuation purposes. The costs of buying credit for these periods varies according to age and salary at the time of purchase.
Benefits—The principal objective of the fund is the payment of an allowance on retirement, which is usually between the ages of 60 and 65 years, but may be earlier with the consent of a contributor's controlling authority and of the board where retirement is because of medical unfitness for further duty. Standard retiring allowances are calculated at one one-hundred-and-twentieth of the average of a contributor's annual salary over the final 5 years of service, for each year of contributory service, plus an equal amount for the first 40 years of service. Up to a quarter of the annual allowance may be surrendered on retirement in return for a cash payment of 9 times the amount commuted.
On death before or after retirement, an allowance at the rate of half the allowance a contributor would have received had retirement occurred on the date of death, or half the allowance actually being paid at the time of death, is payable to any surviving spouse, for life or until remarriage. The surviving spouse, if under the age of 61, may also surrender up to one-quarter of the annuity for a cash payment. An allowance of $78 a year is paid for children below 16 years of age (or 18 years where schooling is extended) or possibly to a higher age in the case of inability to earn a living because of physical or mental reasons.
All allowances are paid in advance in instalments each 28 days and no recovery is made where an entitlement ceased during a benefit period.
A cost-of-living adjustment scheme was introduced in 1969 providing for allowances to be increased relative to movements in the Consumers Price Index. Those already retired at the time the scheme was introduced receive an ex gratia adjustment based on 70 percent of price movements. Those who were already contributors in 1969 receive the basic 70 percent adjustment plus the proportion of the remaining 30 percent that the period paying the extra contributions bears to their total superannuation service. The adjustments reflect price rises that occur from the age of 60 years for superannuitants and the age of 55 years for widows. A recent variation to this scheme provides for adjustments to be made before the age of 60 if the retired contributor has completed 40 years actual or notional service.
Special Conditions—Armed forces contributors may qualify for a retiring allowance after completing their engagements with not less than 20 years' service. A special variation of the cost-of-living adjustment scheme allows this group to receive adjustments following the fifth anniversary of their retirement. The cost is 1 percent more than that required under the main scheme.
Female contributors who were employed before the introduction of equal pay for women in the State Services in 1962 still retain some special conditions related to the former entitlement of women to retire on completion of 30 years' service or on reaching age 55 years. However those joining the fund since 1962 have the same conditions as males.
The Government Superannuation Fund Amendment Act 1980 provides a single superannuation scheme for all members of the Judiciary and the Solicitor-General. This replaces the 2 schemes previously provided under the Act, 1 for District Court Judges, Maori Land Court Judges, and the Solicitor-General; and 1 for High Court, Compensation Court, and Arbitration Court Judges. The 1980 scheme is compulsory with contributions ranging from 7 to 8 percent of salary, dependent upon age at appointment. The normal retirement age will be 68, though there are provisions for early retirement. The maximum retiring allowance payable is two-thirds of the final salary and a refund of contributions may be taken in lieu of a pension. The standard provision for spouses and children apply.
Members of Parliament contribute at the rate of 11 percent of an ordinary member's salary for an allowance based on one thirty-second of an ordinary member's salary at the point of retirement for each year of service, up to two-thirds after approximately 21 years' service. They qualify for an allowance from 50 years of age on retiring from Parliament after not less than 9 years' service or not less than 8 years if this covers the duration of at least 3 sessions. The standard provisions for spouses and children apply.
Police and Prison Service contributors are obliged to retire at 60 years of age, and to enable older entrants to attain additional superannuation service, their service is counted as 1 year and one-seventh if they join the fund after the age of 25 years. A lesser fraction is added for those joining between 20 and 24 years of age. Increased rates of contributions are payable by those whose service is scaled up. The standard benefits apply.
Statistics—As at 31 March 1983 there were 116 275 contributors to the Government Superannuation Fund. They paid $126,666,686 into the fund during the year. At 31 March 1983 there were 36 055 superannuitants who were entitled to $170,085,007 a year, made up as follows:
| Qualifications for Allowance | Males | Females | Total | Annual Allowances |
|---|---|---|---|---|
| Number | $(000) | |||
| Retired for age or length of service | 20,618 | 3,538 | 24,156 | 142,325 |
| Medically unfit | 947 | 217 | 1,164 | 4,702 |
| Total retiring allowances | 21 565 | 3 755 | 25 320 | 147,027 |
| Spouses | 67 | 9,643 | 9,710 | 22,978 |
| Children | 516 | 509 | 1,025 | 81 |
| Total allowances | 22 148 | 13 907 | 36 055 | 170,085 |
Total assets at 31 March 1983, which amounted to $950,659,249, included investments in Government stock, $921,953,570.
The average effective interest earning of the fund was 9.64 percent for the year ended 31 March 1983.
As at 31 March 1983, contributors to the Government Superannuation Fund were distributed as follows:
| Branch of Service | Number | Percentage of Total |
|---|---|---|
| Armed Services | 12,703 | 10.92 |
| Education Service | 26,321 | 22.64 |
| Police | 4,905 | 4.22 |
| Post Office | 18,914 | 16.27 |
| N.Z. Railways | 10,446 | 8.98 |
| Public Service | 39,520 | 33.99 |
| Other employers | 3,466 | 2.98 |
| Total | 116 275 | 100.00 |
The following table gives a summary of financial statistics, together with the numbers of contributors, for the latest available 4 years.
| Year Ended 31 March | Number of Contributors | Annual Contributions* | Interest Received From Investments | Subsidy From Government Trading Departments and Others | Annual†Value of Allowances | Accumulated Fund at 31 March |
|---|---|---|---|---|---|---|
* Includes transfers from National Provident Fund. †Based on retiring and other allowances at end of year. Actual total paid during year ended 31 March 1983 was $164,937,998, plus $28,706,976 for retiring allowances capitalised. | ||||||
| $(thousand) | ||||||
| 1980 | 127,524 | 86,737 | 40,480 | 93,563 | 102,390 | 602,499 |
| 1981 | 127,270 | 106,716 | 51.931 | 117,440 | 122,602 | 705,358 |
| 1982 | 122,371 | 120,383 | 63,925 | 139,907 | 144,690 | 824,766 |
| 1983 | 116,275 | 127,670 | 81,427 | 151,873 | 170,085 | 947,092 |
NATIONAL PROVIDENT FUND—The National Provident Fund is administered by a board comprising the Minister of Finance as statutory chairman, the Secretary to the Treasury, the Director-General of Health, the Valuer-General, the Superintendent of the Fund, and up to 3 other members appointed by the Governor-General.
The fund now provides services in a number of separate areas:
Public Fund—The 2 oldest pension schemes have catered for the general public on an individual basis, sometimes with encouragement from their employer or as members of a group.
Local Authorities Superannuation—Three schemes cover employees of all local bodies, quasi-government and other approved organisations, firemen, and nurses.
National Superannuation Schemes—Two employer-subsidised schemes are available, 1 for farm employees and the other for any employees of companies, firms, Government departments, or local authorities willing to become contributing employers. A further scheme is available for the self-employed.
Local Authorities Investment Pool—This ancillary activity enables local authorities to invest surplus funds at interest.
The State guarantees the benefits payable under all the schemes. There are some elements of State subsidy in the public fund and local authority schemes, and a guarantee of minimum interest earnings in the national schemes.
Public Fund—Membership was available to any resident of New Zealand over the age of 15 years.
The first scheme of the fund, the Level Premium Scheme, available since 1911 and now closed to new members, enables contributors to purchase a pre-determined weekly pension from age 60 years by paying fixed regular contributions according to age on joining. For the first $20 per week a State subsidy of 25 percent is built into the contribution rates and after 5 years' membership contributors qualify for incapacity, widows', and dependent children's allowances.
The Annual Single Premium Scheme, which has been available to individuals and the self-employed since 1958, accepts contributions of any amount from members at any time. The contributions paid during each year are applied at the end of that year towards the purchase of a pension from age 60 years according to the contributor's then age. Only the first $1,000 contributed each year attracts State subsidy and this ceases once the aggregate pension purchased reaches $20 per week. There is a widow's benefit.
These 2 schemes, along with the Post 60 Scheme introduced in 1965, are now being phased out in favour of the Cash Accumulation Scheme introduced in 1975.
Cash Accumulation Scheme—This scheme is being very widely used by individuals. It enables them to pay when and whatever amount of contribution they desire, and also allows them to choose their own date of retirement on superannuation. It is based on a cash accumulation principle and is highly regarded as the ultimate retirement benefit since it reflects the significance of changing interest rates and the impact of inflation. This scheme now provides the vehicle for superannuation previously provided by the Annual Single Premium, Level Premium, and Post 60 Schemes. As the result of legislative changes arising from the 1982 Budget, the Cash Accumulation Scheme has been divided into a lump sum scheme and a pension scheme.
Additional Benefit Plan—This provision was introduced in 1975. It allows an existing contributor to one of the fund's schemes to increase the estate or spouse benefit otherwise provided in the scheme by such amount as is required by paying an extra stipulated contribution. Most of the fund's schemes limit the benefit payable in the event of the contributor's death to a level no greater than the equity in the fund. This usually means that in the earlier years of a contributor's membership, the estate or spouse benefit could be much less than a prudent person would require. The Additional Benefit Plan satisfies this need.
National Superannuation Scheme—An employer-subsidised superannuation scheme was introduced in 1964 for farm workers, and in 1969 was expanded and made available to other employee organisations. It is now the largest single scheme in the land. During periods of non-employment it provides for the holding of credits and contains the modern facilities of portability.
Local Authorities Superannuation—The National Provident Fund continues to provide for superannuation for local authorities, employees of quasi-government organisations, and charitable and religious institutions. Under section 44 of the Act all local authorities are deemed contributors to the fund on behalf of their permanent employees who, qualified by age, elect to become contributing employees. Under section 58 of the Act other approved bodies are accepted under similar conditions by completing a special agreement with the board. The Standard Scheme is the main scheme, but variations thereof with special terms and conditions are available for use by firemen, nurses, harbourmasters and harbour board pilots, and aircrew employees of Air New Zealand. Contributory service is transferable between these schemes and with the Government Superannuation Fund, because of their great similarity.
Investment Pool—The local Authorities Investment Pool continues to be the main avenue for the temporary investment by local authorities, and other approved bodies, of surplus loan moneys and reserve funds. For the year ended 31 March 1983, the interest credited amounted to $24.6 million compared with $21.3 million for the year ended 31 March 1982. The balances of the pool account as at 31 March of 4 recent years are shown below.
| As at 31 March | Local Authorities Investment Pool |
|---|---|
| $(m) | |
| 1980 | 257.7 |
| 1981 | 280.4 |
| 1982 | 318.5 |
| 1983 | 343.1 |
Investments by Fund—The fund's lending to local authorities in recent years is shown below.
| Year Ended 31 March | No. of Applications | Amount Considered $(million) | Amount Approved $(million) |
|---|---|---|---|
| 1980 | 518 | 96.0 | 91.6 |
| 1981 | 450 | 78.3 | 78.1 |
| 1982 | 644 | 172.6 | 168.2 |
| 1983 | 735 | 199.8 | 196.3 |
Approvals to the various local authorities during the year ended 31 March 1983 were as follows:
| Class of Local Authority | Applications | Amount Applied For | Amount Approved | Amount Deferred or Declined |
|---|---|---|---|---|
| No. | $(thousand) | |||
| Cities and boroughs | 350 | 63,007 | 62,232 | 775 |
| Counties | 105 | 13,725 | 12,604 | 1,121 |
| Electric power boards | 67 | 20,164 | 18,766 | 1,398 |
| Harbour boards | 56 | 38,993 | 38,743 | 250 |
| Hospital boards | 43 | 28,763 | 28,763 | – |
| Sundry local authorities | 114 | 35,225 | 35,225 | – |
| Total, 1982–83 | 735 | 199,877 | 196,333 | 3,544 |
| Total, 1981–82 | 644 | 172,638 | 168,247 | 4,392 |
Comparative Survey—The following table provides a survey of financial and other statistics of the National Provident Fund for 4 recent years.
| Item | Year Ended 31 March | ||||
|---|---|---|---|---|---|
| 1980 | 1981 | 1982 | 1983 | ||
| New contributors during year | No. | 6,489 | 7,437 | 6,864 | 7,533 |
| Total contributors at end of year | No. | 124,707 | 123,745 | 121,437 | 119,264 |
| Local authority scheme— | |||||
| Contributors | No. | 15,235 | 14,635 | 13,674 | 12,498 |
| Contributions | $(000) | 39,640 | 45,914 | 57,011 | 58,294 |
| Public Fund— | |||||
| Contributors | No. | 109,472 | 109,110 | 107,763 | 106,766 |
| Contributions | $(000) | 32,564 | 40,044 | 50,081 | 56,403 |
| Pensions and allowances at end of year | No. | 12,378 | 13,335 | 14,193 | 15,151 |
| Income— | |||||
| Contributions | $(000) | 72,204 | 85,958 | 107,092 | 114,697 |
| Interest | $(000) | 53,078 | 65,993 | 85,820 | 112,885 |
| Government subsidy | $(000) | 7,775 | 8,792 | 10,145 | 10,421 |
| Total income | $(000) | 133,056 | 160,743 | 203,057 | 238,003 |
| Outgoings— | |||||
| Pensions and allowances | $(000) | 20,116 | 22,976 | 30,118 | 42,001 |
| Other benefits | $(000) | 9,310 | 11,584 | 17,939 | 24,247 |
| Administration costs | $(000) | – | – | – | 100 |
| Total outgoings | $(000) | 29,426 | 34,560 | 48,057 | 66,348 |
| Investment pool at end of period | $(000) | 257,724 | 280,358 | 318,480 | 343,067 |
| Funds at end of period | $(000) | 655,916 | 782,009 | 937,099 | 1,108,754 |
FURTHER INFORMATION—Further information for potential members is available on request from the boards of the 2 funds. Further financial data is included in the following 2 Parliamentary papers:
Report of the National Provident Fund Board (Parl. paper B. 19).
Report on the Government Superannuation Fund (Parl; paper B. 20).
Table of Contents
For a period of some 30 years from 1945 education in New Zealand was marked by rapid growth. In 1945, school, college, and university enrolments combined were 328 000 or 19.3 percent of the population. By 1983 the combined full-year enrolments totalled over 970 000, just over 30 percent of the population. This growth was because of increased births for the major part of the period; a marked tendency for pupils to stay on longer at school and also to undertake further education after leaving school; and the development of new educational services. An overall decline in the birth rate from the early 1960s, however, has resulted in falling rolls in primary schools, a reduced demand for teachers, and a consequent reduction in intake for teacher training starting in 1982. The smaller age cohorts have not yet affected secondary schools to the same extent as primary schools.
In recent years difficult economic conditions and restricted employment, as well as the impact of technological changes, have posed new problems for education. School leavers in New Zealand have been entering a more challenging and difficult labour market. Young people can no longer readily find work irrespective of their educational or other qualifications. This has affected the schools in many ways. A proportion of students anxious to leave but unsuccessful in finding a job, return or remain at school. Another significant development, often also motivated by a desire to improve employment prospects, is the return of adults, to secondary schools to improve their qualifications. In 1983 there were some 3700 of these people. In an attempt to adapt to these changes there is an increased emphasis on vocational guidance and career education programmes within secondary education. Work exploration (i.e., the opportunity for students to spend some time in the employment environment as part of their education) is rapidly increasing, with the support of employer and union groups. Over a third of State secondary schools provide special transition or pre-employment courses to cater for young people who have returned to school because they cannot get work, or for those the school considers could have difficulty in obtaining suitable employment.

The changed employment patterns are also necessitating changes to the traditional vocational training approaches which are expected to place new demands on the educational component of the programme. During 1983 secondary school rolls increased by over 3 percent mainly because of the retention of students in the higher form levels.
ADMINISTRATION OF EDUCATION—The Education Act 1964 provides for free and secular education in State primary and secondary schools. For all children between the ages of 6 and 15 years, education is compulsory. University education is provided under the Universities Act 1961, and funds for universities are distributed by the University Grants Committee.
The central administrative body directing education is the Department of Education, whose permanent head is the Director-General of Education. The head office is in Wellington and there are regional offices in Auckland, Wellington, and Christchurch, each under the control of a superintendent.
The Department of Education, in discharging its responsibility to the Minister of Education for the administration of the system, advises the Minister on policy and development, controls the expenditure of money voted, ensures that schools are built and equipped when and where required and that teachers are recruited and trained, checks that standards are maintained in all schools (both State and private), and assesses the efficiency of teachers. An important professional function of the department is to conduct curriculum revision and development and to recommend curriculum changes to the Minister.
The control and management of State primary schools is the responsibility of the 10 education boards. State secondary schools are controlled by local secondary school boards. These boards are the employing authorities of the teachers. They disburse the grants received from the Department of Education for the maintenance of schools and building of new schools and for equipment and teaching materials. No local rates are levied for education either by municipal or local education authorities.
The Department of Education directly administers the Correspondence School and State special schools. It controls the inspectorate, supervises the staffing of schools, and conducts the School Certificate Examination. All State and registered private schools are visited regularly by inspectors who give assistance and guidance to teachers in educational matters. The department also administers the capital expenditure voted for school buildings.
The Department of Education has official contacts with the National Council of Adult Education and the University Grants Committee but the universities are independent in their educational activities.
Education Boards and School Committees—The members of education boards have in the past been elected solely by members of school committees on a ward system, but provision has now been made for the appointment to each board of a teacher to represent all teachers employed by the board.
Each State primary school controlled by an education board has its school committee elected by the parents of pupils and adults resident in the school district. It is a statutory body charged with management of property and other matters on behalf of the board. The members of school committees form the electorates for electing education board members.
A school committee's essential function is the care of school buildings, grounds, and equipment, but, in addition to this, many interest themselves very keenly in the general activities of the school and provide, along with voluntary parent-teacher associations, a focusing point for local opinion on educational matters.
Secondary School Boards—Secondary schools are controlled and administered by their own boards of governors. The local boards controlling secondary schools (either singly or several schools in the same town) are made up of representatives of the parents of pupils, of the education board of the district, and of other local groups and organisations, and provision has recently been made for the election of teacher representatives. In some metropolitan areas, groups of secondary schools have been linked together for administrative purposes under secondary school councils, but each school still retains its own board of governors which has a large measure of autonomy in the control and management of its own school.
Technical Institute Councils—Technical institutes, including the Technical Correspondence Institute, are controlled by councils with members representing business and industry, local authorities, the universities, and governing bodies of secondary schools.
Community Colleges—Amendments to the Education Act in 1974 created a new category of institution, community colleges, designed to meet continuing education needs particularly in provincial centres. They are governed as technical institutes. The first community college was opened in Hawke's Bay in 1975. At the end of 1983 there were 8 community colleges following translation of the 2 remaining senior technical divisions into community colleges.
Teachers College Councils—Teachers college councils have the usual administrative functions, combined with some professional responsibility for the training of teachers. They include representatives of education boards, of the Department of Education, the universities, and of the teachers' organisations.
Private Schools—There are a substantial number of private primary and secondary schools conducted by religious bodies or private individuals. These schools are required by the Education Act 1964 to comply with defined standards of accommodation and teaching as a pre-requisite for compulsory registration. Finance and other assistance is provided by the State including 50 percent of teacher salaries. Government controls are applied before new private schools can be built and there is a requirement that after a transitional period, new teacher entrants to private schools must possess certain minimum qualifications.
In October 1975, the Private Schools Conditional Integration Act was passed to enable the voluntary integration of private schools into the State system. Most of the schools now integrated are Roman Catholic, and all the Catholic schools have integrated.
Co-education—Co-education applies at all stages of the school system. All State primary schools and some private primary schools teach boys and girls together. At the secondary level more than three-quarters of the State schools have both boys and girls on their rolls. The rest of the State schools and most of the private schools are single-sex. Over the last 2 decades, there has been a trend toward the provision of more co-educational than single-sex schools.
PUBLIC EXPENDITURE ON EDUCATION—The following table shows the net expenditure (actual expenditure less recoveries) from public funds on each branch or service of education for the years ended 31 March 1982 and 1983.
| Item | 1981–82 | 1982–83 | |
|---|---|---|---|
| Net Expenditure | Net Expenditure | Percentage of Total | |
| $(thousand) | % | ||
| Administration and general— | |||
| General administration | 16.250 | 16,858 | 1.0 |
| Examinations | 768 | 835 | 0.1 |
| Research | 1,444 | 1,543 | 0.1 |
| Subtotal | 18,462 | 19,236 | 1.2 |
| Pre-school education— | |||
| General administration | 824 | 928 | 0.1 |
| Free kindergartens | 18,574 | 20,087 | 1.2 |
| Playcentres | 1,491 | 1,780 | 0.1 |
| Other pre-school agencies | 472 | 479 | – |
| Subtotal | 21,361 | 23,274 | 1.4 |
| Education support services— | |||
| General administration | 2,334 | 2,573 | 0.1 |
| School inspection service | 6,251 | 6,342 | 0.4 |
| Advisory and guidance service | 18,415 | 20,648 | 1.3 |
| Curriculum development and resources | 4,928 | 5,143 | 0.3 |
| School transport | 37,549 | 44,461 | 2.7 |
| Recruitment of teachers | 193 | 235 | – |
| Subtotal | 69,670 | 79,397 | 4.8 |
| Operations of schools— | |||
| State primary schools | 451,647 | 536,052 | 32.7 |
| State secondary schools | 334,204 | 369,484 | 22.5 |
| Correspondence school | 10,182 | 11,371 | 0.7 |
| Integration of private schools | 41,898 | 24,433 | 1.5 |
| Assistance to private schools | 13,868 | 13,731 | 0.8 |
| Special education | 26,866 | 32,615 | 2.0 |
| School buildings | 74,918 | 71,767 | 4.4 |
| Subtotal | 953,583 | 1,059,453 | 64.6 |
| Teacher education— | |||
| General administration | 235 | 228 | – |
| Pre-service training | 56,411 | 47,489 | 2.9 |
| In-service training | 3,738 | 3,544 | 0.2 |
| Teachers college buildings | 2,013 | 597 | 0.1 |
| Subtotal | 62,397 | 51,858 | 3.2 |
| Senior technical and community education— | |||
| General administration | 856 | 864 | 0.1 |
| Technical institutes and community colleges | 89,610 | 101,934 | 6.2 |
| Assistance to students | 7,314 | 8,378 | 0.5 |
| Other continuing education agencies and programmes | 9,049 | 7,100 | 0.5 |
| Technical institute and community college buildings | 14,562 | 18,574 | 1.1 |
| Subtotal | 121,391 | 136,850 | 8.4 |
| University education— | |||
| Operations of universities | 182,068 | 196,237 | 12.0 |
| Assistance to students | 30,104 | 34,526 | 2.1 |
| University buildings | 23,943 | 24,947 | 1.5 |
| Subtotal | 236,115 | 255,710 | 15.6 |
| National Library— | |||
| Operation of National Library | 9,640 | 11,319 | 0.7 |
| National Library buildings | 582 | 1,717 | 0.1 |
| Subtotal | 10,222 | 13,036 | 0.8 |
| Total | 1,493,201 | 1,638,314 | 100.0 |
The following table shows Government net expenditure on education and relates it to net Government expenditure in national accounting terms.
| Year Ended 31 March | Net Education Expenditure | As Percentage of Net Government Expenditure | |||
|---|---|---|---|---|---|
| Current (Salaries, etc.)* | Buildings | Total | Current Education Expenditure | Total Education Expenditure | |
| * About 69 percent of current expenditure is on salaries of teachers, and other staff. | |||||
| $(million) | percent | ||||
| 1979 | 810.1 | 119.2 | 929.3 | 11.8 | 13.6 |
| 1980 | 905.6 | 103.7 | 1,009.3 | 11.9 | 13.3 |
| 1981 | 1,179.4 | 112.6 | 1,292.0 | 12.9 | 14.2 |
| 1982 | 1,376.0 | 117.2 | 1.493.2 | 12.3 | 13.3 |
| 1983 | 1,520.0 | 118.8 | 1,638.8 | 12.0 | 12.9 |
The following figures relate Government net expenditure on education to gross national product and mean population.
| Year Ended 31 March | Expenditure from Public Funds | Expenditure as Percentage of Gross National Product | Expenditure per Head of Mean Population |
|---|---|---|---|
| * Provisional. | |||
| $(000) | percent | $ | |
| 1978 | 807,537 | 5.4 | 256.89x |
| 1979 | 929,334 | 5.4 | 295.67x |
| 1980 | 1,009,293 | 4.9 | 321.64 |
| 1981 | 1,292,040 | 5.4* | 412.17 |
| 1982 | 1,493,201 | 5.3* | 471.25 |
| 1983 | 1,638,814 | 5.2* | 513.38 |
An international comparision of public expenditure on education as a percentage of gross national product is given in the following table for selected countries. Educational expenditure in many countries has been rising twice as fast as national income. These figures are taken from the UNESCO Statistical Yearbook.
| Country | Year | Public Expenditure on Education as Percentage of G.N.P. |
|---|---|---|
| Australia | 1980 | 5.9 |
| Austria | 1981 | 6.0 |
| Canada | 1980 | 7.7 |
| Denmark | 1980 | 7.0 |
| France | 1980 | 5.0 |
| Germany, West | 1979 | 4.7 |
| Italy | 1979 | 5.1 |
| Japan | 1980 | 5.8 |
| Netherlands | 1980 | 8.4 |
| New Zealand | 1981 | 5.4 |
| Switzerland | 1980 | 5.0 |
| United States | 1981 | 6.9 |
| United Kingdom | 1980 | 5.8 |
| USSR | 1981 | 7.0 |
International comparisons need to be treated with reserve because of the differing education systems and measures of expenditure.
EDUCATION BUILDINGS—Net expenditure on buildings for 1982–83 was as follows:
| $(m) | |
|---|---|
| Universities (including equipment) | 24.9 |
| School buildings | 71.8 |
| Technical institutes | 18.6 |
| Teachers colleges | 0.6 |
| Pre-school buildings | 1.2 |
| National Library | 1.7 |
Pre-School—As at December 1983 there were 541 kindergartens and 680 playcentres in operation. Eight new kindergartens were opened during 1983, including 1 centre housed in a vacant primary school classroom. A further 3 new kindergartens were programmed to commence during 1983. Three new playcentres are due for completion this year and the accommodation at several existing centres is currently being upgraded. The programme of assistance for pre-school buildings has been strengthened by extending the subsidy policy (Midway Subsidy Scheme), and an increased level of subsidy assistance introduced by the Government during 1983.
Primary—The programme of upgrading and replacing older school buildings has continued, with some emphasis on improving facilities at several special schools catering for handicapped children. Many of the projects undertaken have made use of surplus relocatable accommodation. Only 1 new school, at Thomas Road, East Tamaki, was commenced during the year. The new school uses buildings from the relocatable Sandbrook School at Otara, which closed at the end of 1983.
Secondary—The new Cromwell College and Mountainview High School, Timaru, are to open at the beginning of the 1984 school year. The replacement and upgrading of older school buildings continues with a contract let to rebuild Christchurch Girls High School on a new site. Major redevelopments are proposed at Christchurch Boys High School, to strengthen and upgrade the main block, and at Wellington East Girls' College to replace an old two-storey block. Progress has also been made in the provision of auditoriums, gymnasiums and other specialist facilities to bring schools up to code entitlement.
Area Schools—Major work was undertaken during the year to provide accommodation for newly established area schools at Panguru and Whangamata. In both cases maximum use has been made of existing relocatable buildings. The Takitimu Area School has also been approved for substantial upgrading. Completion of 3 projects will conclude the bulk of the area school buildings programme, initiated as a consequence of the Government's 1974 approval to the re-organisation of education in rural areas.
Tertiary—Projects completed in 1982–83 include an engineering workshop for Tairawhiti Community College, and a teaching complex for Wanganui Regional Community College. A student hostel village, a classroom, and a library lecture theatre complex at Waikato Technical Institute were also completed.
During 1982–83 construction began on teaching and laboratory accommodation for nursing training at Northland Community College, remodelling work to provide student amenities and facilities (partly funded by students) at Auckland Technical Institute, a building construction unit at Taranaki Polytechnic, and a library and resource centre at Christchurch Polytechnic. In 1983 building also began on a meat industry training centre at Christchurch Polytechnic.
Towards the end of 1982 a major accommodation survey was commenced to determine the effect of reduced student intakes at all teachers colleges. This survey carried on into 1983 and the findings demonstrated that a substantial amount of surplus teaching space could be made available by the colleges for other users. Agreement has now been reached with all college councils on the amount of accommodation they would need to retain for their teaching programmes at reduced roll numbers.
UNIVERSITY BUILDINGS—Building and other capital requirements of universities are handled through the University Works Committee. This committee prepares for the approval of the Government an annual programme of projected expenditure on university capital works—buildings, land purchase, furniture and equipment, and subsidies on halls of residence. Expenditure in recent March years has been as follows:
| $(m) | |
|---|---|
| 1979–80 | 24.7 |
| 1980–81 | 23.3 |
| 1981–82 | 23.9 |
| 1982–83 | 24.9 |
STUDENT NUMBERS—The numbers of full-year students receiving instruction in educational institutions are shown in the following summary. The table refers to roll numbers at 1 July.
| Type of Institution | 1981 | 1982 | 1983 |
|---|---|---|---|
* Includes technical institutes, community colleges, and senior technical divisions (S.T.Ds). †At secondary schools, various centres, and Correspondence School. ‡Teachers college students on studentships are included in university tables. | |||
| Pre-school— | |||
| Playcentres | 16,198 | 16,395 | 16,170 |
| Kindergartens | 39 791x | 40,009 | 40,895 |
| Pre-school classes at primary schools | 685x | 825 | 759 |
| Correspondence School | 341 | 505 | 495 |
| 57,015 | 57,734 | 58,319 | |
| Primary (Juniors to Form 2)— | |||
| Primary schools | 367,286 | 367,879 | 372,042 |
| Intermediate schools and attached Intermediate | 73,383 | 75,510 | 77,733 |
| Area and district high schools (Primers to Form 2) | 6,177 | 6,205 | 6,348 |
| Forms 1 and 2 at Form 1 to 7 schools | 6,215 | 7,501 | 7,421 |
| Correspondence School | 1,353 | 1,451 | 1,383 |
| Departmental special schools | 277 | 280 | 324 |
| Department of Social Welfare schools | 85 | 69 | 93 |
| Royal New Zealand Foundation for the Blind | 83 | 73 | 69 |
| Private primary schools | 38,997 | 27,199 | 10,670 |
| 493,856 | 486,167 | 476,083 | |
| Secondary (Form 3 to Form 7)— | |||
| State Form 3 to Form 7 schools | 181 760x | 186,328 | 201,685 |
| Forms 3 to 7 at State Form 1 to 7 schools | 11,028 | 13,517 | 13,948 |
| Area schools (Form 3 to Form 7) | 2,639 | 2,718 | 2,917 |
| Correspondence School | 989 | 937 | 885 |
| Departmental and board special schools | 215 | 279 | 290 |
| Department of Social Welfare schools | 315 | 346 | 388 |
| Private secondary schools | 27,980 | 19,376 | 10,635 |
| 224,926 | 223,501 | 230,748 | |
| Continuing— | |||
| Technical Correspondence Institute† | 30,091 | 29,837 | 29,899 |
| Institutes*— | |||
| Full-time students | 6,915 | 7,330 | 7,956 |
| Part-time students | 35,849 | 36,210 | 37,584 |
| Classes at other institutions† | |||
| Part-time students | 67,851 | 64,197 | 69,545 |
| 140,706 | 137,574 | 144,984 | |
| Teachers colleges— | |||
| Teacher training‡ | 5,844 | 4411 | 3,372 |
| Post graduate specialist courses | 57 | 53 | 57 |
| Other full-time courses | 39 | 75 | |
| 5,901 | 4,503 | 3,504 | |
| University institutions— | |||
| Full-time internal students | 31,549 | 32,076 | 33,144 |
| Part-time internal students | 13,187 | 13,235 | 13,326 |
| Extramural students | 8,028 | 8,838 | 10,043 |
| 52 764x | 54,149 | 56,513 | |
| Total | 975 168x | 963 628 | 970 151 |
| Percentage of population at 30 June | 31.2x | 30.5 | 30.3 |
Part-year Students Enrolled in Tertiary and Continuing Education Courses.
| Type of Institution | 1981 | 1982 | 1983 |
|---|---|---|---|
| Secondary Schools— | |||
| Short courses at evening classes | 25,347 | 38,441 | 48,806 |
| Technical Institutes— | |||
| Short courses | 45,624 | 51,465 | 64,250 |
| Seminars | 21,948 | 21,794 | 20,423 |
| Block courses | 29,592 | 35,299 | 38,363 |
| Teachers Colleges— | |||
| Diploma of Teaching | 915 | 1,222 | |
| Block courses | 350 | 444 | |
TEACHING STAFF—Statistics of entitlements and full-time teaching staff at all educational institutions are shown in the following table.
| Institution | Positions (Full-time Equivalents) | Full-time Staff 1983 | |||
|---|---|---|---|---|---|
| 1982 | 1983 | Male | Female | Total | |
* All staff is part-time. †Includes teachers at full and contributing primary schools, intermediates, board, special schools, attached intermediates, teachers of special classes and special needs teachers. ‡Includes advisers, psychologists, speech and reading teachers, and teachers not employed under staffing schedules such as visiting teachers, itinerant teachers, museum and zoo teachers, REAP, pool relief, physiotherapists, etc. §Includes all staff at F1–7 schools. ||Includes staff at Department of Education, Social Welfare and Justice special schools. ¶Excludes positions filled by part-time staff. ** ASTU means Advanced Studies for Teachers Unit. | |||||
| Pre-school— | |||||
| Playcentres* | 256 | 256 | * | * | * |
| Kindergartens | 184x | 1,187 | 14 | 1,147 | 1,161 |
| Primary— | |||||
| State† | 18 652x | 19,060 | 6,310 | 12,194 | 18,504 |
| Private | 1,095 | 553 | 202 | 275 | 477 |
| Supporting services‡ | 940x | 931 | 313 | 400 | 713 |
| Area schools | 516 | 531 | 287 | 234 | 521 |
| Manual training | 702 | 696 | 331 | 333 | 664 |
| Secondary— | |||||
| State§ | 12 693x | 13,106 | 7,285 | 4,816 | 12,101 |
| Private | 1 161 | 759 | 421 | 264 | 685 |
| Departmental special || | 178 | 183 | 75 | 87 | 162 |
| Tertiary— | |||||
| Technical institutes | 2,625 | 2,651 | 1,796 | 630 | 2,426 |
| Teachers colleges | 555 | 488 | 363 | 117 | 480 |
| Universities¶ | 3,071 | 2,999 | 2,595 | 404 | 2,999 |
| ASTU** | 14 | 14 | 7 | 7 | 14 |
NOTE—The table has been restructured to include all teaching staff.
The following graph gives a comparison of teacher-pupil ratios in State primary and secondary schools.
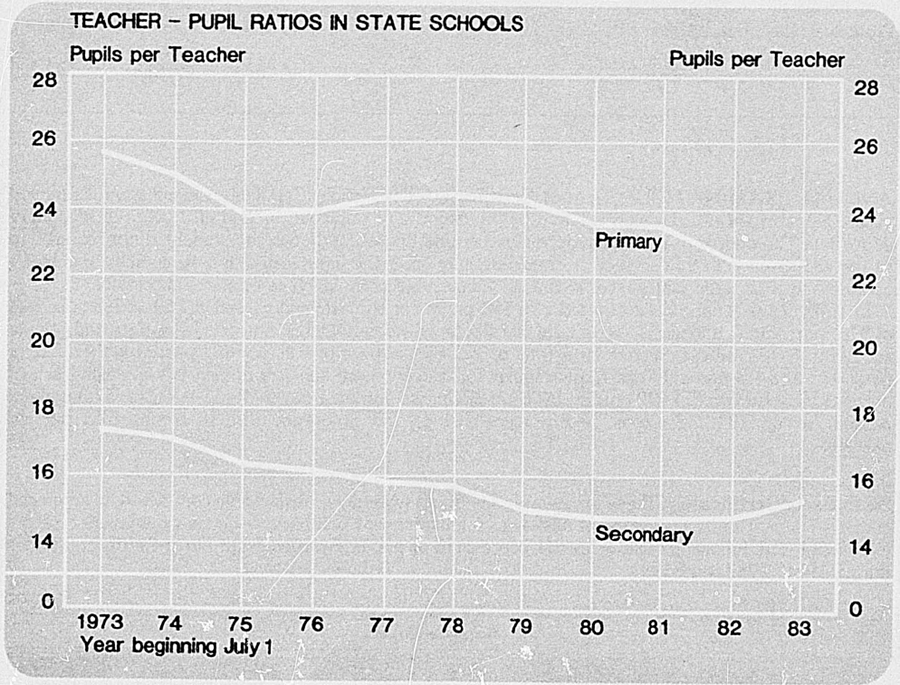
The teacher-pupil ratios are calculated by dividing the number of pupils at 1 July in each branch of education by the entitlement for teachers for the appropriate branch of the service. With primary schools the entitlement includes all classroom teachers plus support staff such as advisers, psychologists, speech therapists, itinerant teachers, etc.
The increase in State primary and secondary school staff in 1983 compared with 1982 is due to the integration of private schools.
Overseas Students—Overseas students attending teachers colleges, technical institutes, secondary schools, full-time, and universities full-time and part-time at 1 July 1983 totalled 3494, of whom 1210 were from the South Pacific area (excluding Australia) and 1545 from South-east Asia.
Projected Students—A projection of July education rolls, made in 1983 by the Department of Education and based on policies and trends at the time, is set out in the following table.
| Period | Rolls | |||
|---|---|---|---|---|
| Kindergarten | Total Primary | Total Secondary | ||
| Actual | 1983 | 40,895 | 476,083 | 230,748 |
| Projected (1983 base) | 1988 | 43,000 | 425,600 | 226,700 |
| 1993 | 44,000 | 420,800 | 194,200 | |
ANNUAL EXAMINATIONS: School Certificate—The School Certificate Examination conducted by the Department of Education is taken by the majority of pupils at the end of 3 years of secondary education. The course of each candidate must include English, although the student is not required to sit the examination in that subject. A candidate may enter the examination in any number of subjects up to 6 and is credited with passes in the individual subjects in which he or she is successful.
In 1982, 73 404 candidates entered 326 196 papers or subjects and passed in 169 107, a pass rate of 51.8 percent. This includes extramural and Pacific Island candidates. Entrants from state and private schools in New Zealand entered for a total of 271 804 papers or subjects and passed in 147 722, a pass rate of 54.3 percent. The most popular (or widely-taken) subjects among New Zealand school entrants were English (54 842 entries, 50.6 percent passed), mathematics (46 620 entries, 57.5 percent passed), science (34 938 entries, 58.8 percent passed), and geography (26 612 entries, 52.1 percent passed).
Sixth Form Certificate—These are awarded to pupils who have satisfactorily completed an advanced course of 1 year on a single-subject basis—to a maximum of 6 subjects—beyond the level of School Certificate. The following table gives the percentage of pupils awarded Sixth Form Certificate grades during 1981, 1982, and 1983.
| Year | Number of Subjects | |||||
|---|---|---|---|---|---|---|
| 6 | 5 | 4 | 3 | 2 | l | |
| 1981 | 6.2 | 71.0 | 10.2 | 2.3 | 2.9 | 7.2 |
| 1982 | 7.1 | 71.7 | 9.4 | 2.1 | 2.8 | 6.8 |
| 1983 | 9.0 | 68.5 | 9.3 | 2.5 | 3.1 | 7.7 |
University Entrance—Pupils attending certain approved schools may be accredited for matriculation purposes provided they have completed a 4 years' secondary school course. Pupils not accredited for entrance to university may qualify by passing the University Entrance Examination which is conducted by the Universities Entrance Board.
The University Bursaries Examination and the University Entrance Scholarship Examination, taken by secondary school pupils usually in Form 7, are also conducted by the University Entrance Board; they are competitive examinations for supplementary awards for study at a university.
Higher School Certificate—Higher School Certificates are awarded after a 5-year course to pupils who have been accepted for entry to the Sixth Form and satisfactorily completed an advanced course of 2 years; and to pupils who have obtained a qualification recognised by the University Entrance Board for admission to a university in New Zealand and satisfactorily completed an advanced course of 1 year.
Examination passes at other than university examinations are set out in the following table.
| Year | School Certificate* | Other† | University Entrance‡ | University Entrance Scholarship | University Bursaries A and B |
|---|---|---|---|---|---|
* The number of candidates passing one or more subjects. †The number includes Trained Teachers Certificate, Diploma of Teaching. Technical Teachers Certificates, City and Guilds of London Institutes Examination. Technological, Engineers, and Surveyors Assistants and Public Service Shorthand Typists Examination are not now administered by the Department. ‡Includes both accredited passes and passes by examination. | |||||
| 1979 | 54,692 | 1,146 | 19,277 | 202 | 5,286 |
| 1980 | 53,432 | 1,530 | 19,223 | 186 | 5,069 |
| 1981 | 53,229 | 1 698x | 18,898 | 187 | 5,225 |
| 1982 | 52 994x | 2 078x | 19,223 | 180 | 5 139x |
| 1983 | 54,938 | 1,982 | 20,304 | 187 | 5,760 |
| Year | Technician Certificate 3-stage Course | N.Z. Certificate 5-stage Course: Final | Certificates Issued | |||
|---|---|---|---|---|---|---|
| Trade | Advanced Trade | Industrial Practice | ||||
| 1979 | 622 | 1,032 | 2,580 | 785 | 258 | |
| 1980 | 434 | 1,075 | 2,440 | 976 | 622 | |
| 1981 | 452 | 1,042 | 3,026 | 965 | 686 | |
| 1982 | 587 | 1,059 | 3 509x | 945x | 546x | |
| 1983 | 561 | 1,272 | 3,337 | 859 | 869 | |
Comparative figures for the number of candidates for the University Entrance Examination and the number of passes by accrediting and by examination are given in the following table.
| Year | Candidates | Passes | |
|---|---|---|---|
| Accredited | By Examination | ||
| 1979 | 32,944 | 15,072 | 4,205 |
| 1980 | 32,958 | 14,969 | 4,254 |
| 1981 | 31,988 | 14,165 | 4,733 |
| 1982 | 32,641 | 14,417 | 4,806 |
| 1983 | 34,611 | 15,338 | 4,966 |
SPECIAL EDUCATION—Whenever possible, handicapped children are enrolled with other children at ordinary pre-school services and in ordinary classes at their local primary or secondary school. When necessary, buildings are modified, special equipment is provided, and ancillary staff are appointed to assist the teachers. The Department of Education inspectors, psychologists, and other specialist advisers also help the teachers with suitable teaching programmes.
A comprehensive range of special education services has been developed for those handicapped children whose special needs cannot be met in ordinary classes through these measures. Small part-time groups for handicapped pre-school children are attached to selected kindergartens and playcentres. Education boards provide special classes and resource centres at primary schools or separate special schools for pupils who are intellectually handicapped, deaf, visually handicapped, physically handicapped, maladjusted and those young children who need careful assessment of their teaching needs as they enter primary school.
The education boards also administer special classes in hospitals, special schools in psychiatric hospitals, speech clinics and reading clinics, and employ itinerant teachers to assist children in ordinary classes who have a hearing handicap or serious reading difficulties.
Special classes for deaf, backward, and maladjusted pupils are provided at selected secondary schools.
The Department of Education itself administers 7 residential schools—2 for deaf children (which also admit day pupils), 3 for backward children and 2 for maladjusted children. The Department also provides the teaching services in Department of Social Welfare institutions for socially maladjusted children, and the education service in penal institutions administered by the Department of Justice.
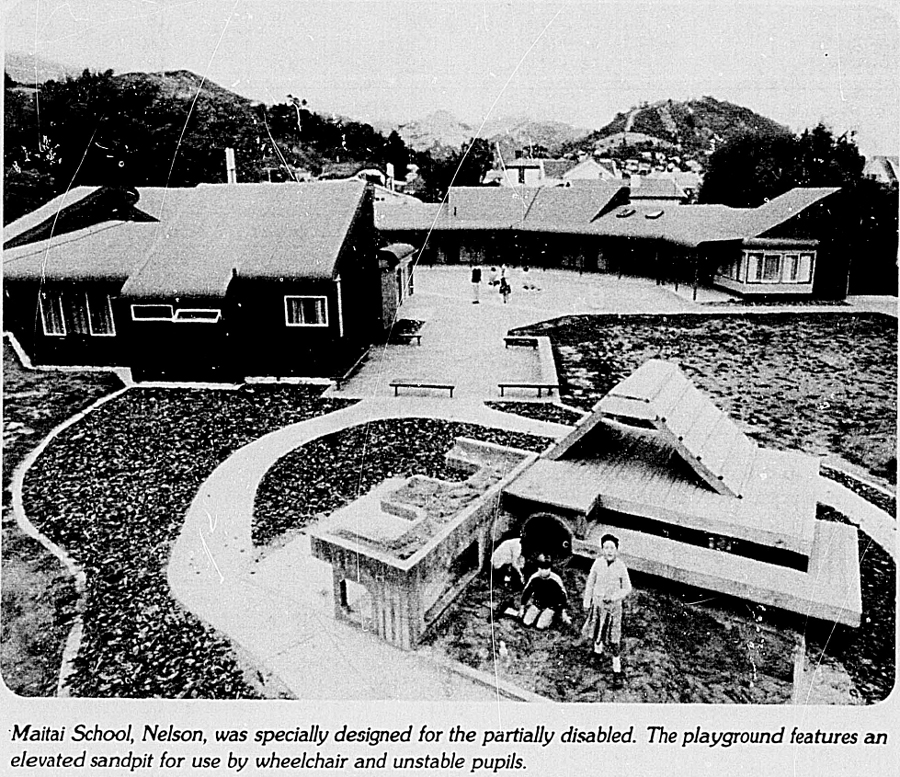
This network of special schools and classes is supported by 4 specialised guidance services which also assist children in ordinary classes. The Hearing Assessment and Guidance Service offers guidance to the parents and teachers of deaf children. The Visiting Teacher Service provides liaison between teachers and the parents of pupils whose progress at school may be hampered by home difficulties. Advisers on handicapped children provide guidance and advice for parents and teachers of handicapped children. The Psychological Service provides a comprehensive diagnostic and advisory service for children who have learning or social difficulties. It maintains a close liaison with all secondary school guidance staff and with all health, education, and welfare services for children. These 3 services assisted approximately 35 000 pre-school and school-age children in 1983.
Under the Community Education Initiatives Scheme, pilot groups in 3 areas of New Zealand continued a special relationship between the department, community groups, and other government agencies in helping young people with special educational needs.
In 1983 some 1981 State teachers were employed, either full-time or part-time, in the special education and guidance services. A total of 11 997 children were enrolled in special classes and schools, and 4901 children at speech or reading clinics.
The following table shows the number of school pupils (including pupils at Activity Centres) receiving special education at kindergartens, primary and secondary schools at 1 July 1983.
| Disability | Male | Female | Total |
|---|---|---|---|
| Full-time Special Education— | |||
| Visually handicapped | 43 | 37 | 80 |
| Hearing handicapped | 255 | 300 | 555 |
| Physically handicapped | 200 | 156 | 356 |
| In Health Camps | 184 | 151 | 335 |
| In general hospitals | 341 | 262 | 603 |
| Backward—in schools, classes | 1,761 | 863 | 2,624 |
| in experience classes | 818 | 499 | 1,317 |
| Intellectually handicapped | 1,145 | 790 | 1,935 |
| Educationally retarded—in assessment classes | 104 | 48 | 152 |
| in pre-school classes at primary schools, kindergartens | 436 | 399 | 835 |
| Maladjusted—in adjustment classes | 130 | 48 | 178 |
| at Activity Centres | 50 | 74 | 124 |
| in Social Welfare schools | 305 | 176 | 481 |
| in psychiatric institutions | 101 | 19 | 120 |
| Other | 25 | 53 | 78 |
| Total | 5 898 | 3 875 | 9 773 |
| Part-time Special Education— | |||
| Visually handicapped | 246 | 191 | 437 |
| Hearing handicapped | 153 | 154 | 307 |
| Speech handicapped—on speech clinic regular roll | 3,334 | 1,512 | 4,846 |
| —speech clinic periodic roll | 9,579 | 4,346 | 13,925 |
| Educationally retarded | 407 | 60 | 467 |
| Maladjusted | 68 | 23 | 91 |
| Correspondence School— | |||
| Hearing handicapped | 15 | 6 | 21 |
| Physically handicapped | 38 | 22 | 60 |
| Backward | 152 | 100 | 252 |
| Intellectually handicapped | 140 | 102 | 242 |
| Educationally retarded | 125 | 57 | 182 |
| Maladjusted | 19 | 15 | 34 |
| Gifted | 24 | 16 | 40 |
The Department of Education co-ordinates the administration and development of the special education services for handicapped children through the district senior inspectors of primary and secondary schools.
PRE-SCHOOL EDUCATION—Early childhood care and education is available to children below the age of 5 years through a wide range of services, most of which are eligible for and receive some form of Government assistance. Except in very special circumstances children below the age of 5 years may not be enrolled in a primary school.
The main organisations involved in the provision and administration of early childhood education services are the New Zealand Free Kindergarten Union, the New Zealand Playcentre Federation and the New Zealand Childcare Association. Other services available include: informal family playgroups; private and community based pre-school centres and child care groups; itinerant pre-school teachers and Department of Education services which include preschool classes in primary schools, pre-school groups for handicapped children in playcentres and kindergartens, and pre-school services of the Correspondence School.
Te Kohanga Reo Centres for pre-school children are a recent innovation to foster the growth of the Maori language. The number of centres is increasing rapidly. They are predominantly Maori speaking, offer a full day or sessional programme, and are in the care of the Department of Maori Affairs.
Funding and Assistance—Kindergartens and playcentres receive considerable financial assistance from the Government through the Department of Education. Grants are paid to assist with administration and operating costs and an equipment subsidy at $1.00-$2.00 is available. The cost of new buildings is subsidised on a $1.00-$4.00 basis and the costs of maintenance are met through education boards. In addition kindergarten teachers' salaries and the cost of their training are paid by the Government. Playcentre associations receive additional grants for training purposes. A number of small non-profit-making pre-school education groups are also eligible for funding from the Department of Education at the same sessional rate as for playcentres. All other groups registered with the Department of Social Welfare are eligible for grants from that department for sessions held with trained staff, or staff in training, and may also attract childcare and capital works subsidies.
The Department of Education has a staff of professional officers in each education board district to give advice and guidance to any group or individual involved in early childhood care and education. The district officer of early childhood education operates a pool of basic equipment in each district which may be borrowed by small pre-school education groups.
The Department of Social Welfare has a staff of social workers specialising in childcare who are also available for advice and guidance.
Training—Kindergarten teachers undertake a 2-year course of training in teachers colleges. Playcentre personnel are trained through the playcentre movement's own training schemes. For people working in childcare there are 1-year courses at Auckland, Wellington, and Christchurch Teachers Colleges and a field-based training scheme is operated by the New Zealand Childcare Association. The Correspondence School also offers courses in early childhood care and education. Advanced courses are available through the Advanced Studies for Teachers Unit and Massey University.
PRIMARY EDUCATION—Entry into a primary school is compulsory at 6 years of age, but it is common practice for children to start formal schooling at the age of 5 years. If living in an isolated area, a child may be enrolled with the primary department of the Department of Education's Correspondence School. The final 2 years of the primary course, Forms 1 and 2, may be taken at a full primary school, an intermediate school, an area school, or a Form 1–7 school depending on where a child lives. On completing Form 2, usually after 8 years school attendance, a child normally enters Form 3 of a secondary school, or alternatively Form 3 in an area school. All children are required to attend school until they reach the age of 15 years.
The curriculum of the primary and intermediate schools, as set out in the syllabuses of instruction, covers oral and written language (including reading and handwriting), mathematics, social studies, art and crafts, science, physical education (including swimming and outdoor education), health education, music, and, for some children in Forms 1 and 2, French. At the Forms 1 and 2 levels, creative crafts such as woodwork, metal work, homecraft, and sewing are available to both girls and boys. Maori language teaching is available in some schools. In some cases it is available only at the Form 1 and 2 level, and in others at an earlier stage.
Teachers have the assistance of advisers in a variety of fields, including science, physical education, art and crafts, reading, mathematics, music, Maori language programmes, and English language programmes for Maori and Pacific Island children. Itinerant advisers are also available to help teachers in small rural schools and teachers of infant classes. Specialist assistance in helping children with special needs is provided by the psychological service, speech therapists, visiting teachers, advisers on deaf children, and resource centres for the visually handicapped. In addition there are classes for physically handicapped, intellectually handicapped, educationally retarded, maladjusted and backward children. Primary schools receive grants for general running costs, e.g., cleaning and sanitation, administration, class materials, maintenance of buildings and equipment for library books, free textbooks, special purposes, swimming pools and manual training. Grants are paid to education boards which then distribute them in accordance with scales determined by them which provide for the particular needs of their area.
The basic equipment scheme provides grants to education boards to enable them to supply all schools with consumable items of art and craft and infant apparatus, equip new school accommodation and upgrade, repair and replace equipment.
State Primary Schools—The figures set out in the following table refer to the number of State primary schools and intermediates under education board control, and also pupils in attached intermediates under the control of Boards of Governors.
| Schools under Board Control (Plus attached Intermediates) | 1981 | 1982 | 1983 | |||
|---|---|---|---|---|---|---|
| No. of Schools at 1 Jul | Roll at 1 Jul | No. of Schools at 1 Jul | Roll at 1 Jul | No. of Schools at 1 Jul | Roll at 1 Jul | |
| * Includes 22 attached intermediate departments of integrated colleges. | ||||||
| Full primary | 1,047 | 122,141 | 1,085 | 127,524 | 1,142 | 138,168 |
| Contributing | 981 | 243,448 | 999 | 237,934 | 1,023 | 231,869 |
| Intermediate and attached intermediates | 149 | 73,383 | 161 | 75,510 | 170* | 77,733 |
| Area schools (Primers to Standard 4) | 34 | 4,547 | 34 | 4,675 | 35 | 6,348 |
| Special schools | 63 | 2,341 | 62 | 2,421 | 61 | 2,005 |
| Total | 2 274 | 445 860 | 2 341 | 448 064 | 2 431 | 456 123 |
Age Distribution of Primary and Secondary Pupils—The following table gives the ages of all pupils enrolled in New Zealand primary and secondary schools at 1 July 1982 and 1983.
| Age, in Years | 1982 | 1983 | ||||
|---|---|---|---|---|---|---|
| Boys | Girls | Total | Boys | Girls | Total | |
| Under 5 | 46 | 49 | 95 | 66 | 49 | 115 |
| 5 | 27,207 | 25,821 | 53,028 | 26,116 | 25,023 | 51,139 |
| 6 | 27,172 | 25,530 | 52,702 | 26,883 | 25,408 | 52,291 |
| 7 | 28,335 | 27,347 | 55,682 | 27,446 | 25,965 | 53,411 |
| 8 | 29,973 | 28,777 | 58,750 | 28,493 | 27,360 | 55,853 |
| 9 | 30,937 | 29,492 | 60,429 | 29,975 | 28,814 | 58,789 |
| 10 | 32,277 | 31,145 | 63,422 | 31,201 | 29,719 | 60,920 |
| 11 | 32,278 | 31,393 | 63,671 | 31,935 | 30,911 | 62,846 |
| 12 | 31,665 | 30,229 | 61,894 | 32,636 | 31,564 | 64,200 |
| 13 | 31,521 | 29,993 | 61,514 | 32,011 | 30,382 | 62,393 |
| 14 | 30,704 | 29,524 | 60,228 | 31,377 | 29,772 | 61,149 |
| 15 | 27,296 | 27,197 | 54,493 | 27,713 | 27,326 | 55,039 |
| 16 | 19,868 | 20,590 | 40,458 | 21,242 | 21,876 | 43,118 |
| 17 | 9,879 | 9,195 | 19,074 | 10,863 | 10,099 | 20,962 |
| 18 | 2,052 | 1,391 | 3,443 | 2,232 | 1,546 | 3,778 |
| 19 and over | 308 | 477 | 785 | 387 | 441 | 828 |
| Total | 361 518 | 348 150 | 709 668 | 360 576 | 346 255 | 706 831 |
Size of Classes—The sizes of ordinary classes at State primary schools at 30 September are shown in the following table.
| Year | Number of Pupils | ||||||||||||
|---|---|---|---|---|---|---|---|---|---|---|---|---|---|
| 0–19 | 20—24 | 25–29 | 30–34 | 35–39 | 40* | Total | |||||||
| Classes | % | Classes | % | Classes | % | Classes | % | Classes | % | Classes | % | ||
| * Includes ordinary classes at State full contributing, intermediate attached intermediate, and area schools. In 1983 there were 716 special classes at State schools: 696 with 0–19 pupils, 17 with 20–24 pupils and 3 with 25–29 pupils. | |||||||||||||
| 1977 | 1,162 | 7.0 | 2,052 | 12.5 | 4,426 | 26.9 | 6,840 | 41.5 | 1,960 | 11.9 | 31 | 0.2 | 16,471 |
| 1982 | 2,026 | 12.1 | 2,502 | 14.9 | 4,885 | 29.2 | 6,018 | 35.9 | 1,302 | 7.8 | 17 | 0.1 | 16,750 |
| 1983 | 2,156 | 12.9 | 2,378 | 14.2 | 4,644 | 27.6 | 6,129 | 36.5 | 1,458 | 8.7 | 10 | 0.1 | 16,775 |
Maori Pupils—At 1 July 1983 there were 80 674 Maori children attending State primary schools and 320 attending private primary schools. Staffing is more liberal in schools with a large proportion of Maori or Pacific Island children. For statistics on Maori school leavers' qualifications and years of attendance at secondary schools refer to Section 3B of this Yearbook.
Intermediate Schools—Pupils on the rolls of the 148 intermediate and 22 attached intermediate schools at the end of 1983 numbered 77 733. Of all children in Forms 1 and 2 at State primary schools at 1 July 1983, 61.4 percent were enrolled at the intermediate schools. The ages of pupils on the roll at 1 July of each of the latest 2 years were as follows:
| Age, in Years | 1982 | 1983 | ||||
|---|---|---|---|---|---|---|
| Boys | Girls | Total | Boys | Girls | Total | |
| 10 and under | 208 | 301 | 509 | 209 | 266 | 475 |
| 11 | 13,980 | 14,584 | 28,564 | 13,833 | 14,396 | 28,229 |
| 12 | 18,691 | 17,512 | 36,203 | 19,695 | 18,752 | 38,447 |
| 13 | 5,638 | 4,320 | 9,958 | 5,877 | 4,428 | 10,305 |
| 14 | 153 | 112 | 265 | 132 | 123 | 255 |
| 15 | 6 | 2 | 8 | 11 | 4 | 15 |
| 16 and over | 2 | 1 | 3 | 6 | 1 | 7 |
| Total | 38 678 | 36 832 | 75 510 | 39 763 | 37 970 | 77 733 |
Private Primary Schools—The following table contains the principal statistics of private primary schools, including primary departments in private secondary schools. The integration of private schools into the state system has resulted in a large reduction in their numbers.
| Year | Number of Schools | Pupils at 1 July | Teachers (Full-time) | ||
|---|---|---|---|---|---|
| Male | Female | Total | |||
| 1979 | 327 | 48,476 | 367 | 1,527 | 1,894 |
| 1980 | 314 | 45,746 | 380 | 1,358 | 1,738 |
| 1981 | 279 | 38,997 | 371 | 1,141 | 1,512 |
| 1982 | 204 | 27,199 | 308 | 699 | 1,007 |
| 1983 | 95 | 10,670 | 202 | 275 | 477 |
SECONDARY EDUCATION—The secondary syllabus is based on a common core, consisting of English, social studies, general science, elementary mathematics, music, arts and crafts, and physical education, to be followed by a degree of specialisation within a wide range of subjects that may be taken to the School Certificate and University Entrance stage. All types of secondary schools are required to give all pupils during the first 2 years of their secondary course a minimum number of units of instruction in the common core subjects.
The following table shows the number of schools providing secondary education for each of the latest 5 years (figures exclude the secondary department of the Correspondence School). The decrease in the number of private secondary schools and the increase in State secondary schools is due to integration.
| Year | Number of Schools with Secondary Pupils | Total | ||||
|---|---|---|---|---|---|---|
| Forms 1–7 | Forms 3–7 | Area Schools | Departmental and Board Special Schools | Private Schools | ||
| 1979 | 43 | 216 | 36 | 24 | 100 | 419 |
| 1980 | 44 | 218 | 35 | 24 | 96 | 417 |
| 1981 | 45 | 226 | 34 | 25 | 88 | 418 |
| 1982 | 52 | 241 | 34 | 25 | 64 | 416 |
| 1983 | 52 | 264 | 35 | 29 | 39 | 419 |
At 1 July 1983, 69 of the State secondary schools enrolled only boys and 74 schools only girls, with 268 schools co-educational. Most of the private schools are single-sex schools. At 1 March 1983 there were 80 secondary schools with over 1000 pupils.
The inspection of secondary schools is carried out by inspectors attached to the Department of Education. In 1983 there were 60 inspectors, plus 4 education officers who inspect primary and secondary schools. The numbers of each sex attending schools providing secondary education at 1 July 1983 were: State secondary schools, 108 167 boys and 107 466 girls; area schools, 1432 boys and 1485 girls; private secondary schools, 5 832 boys and 4 803 girls; full-time pupils in the secondary department of the Correspondence School numbered 326 boys and 559 girls. In addition, 417 boys and 261 girls received secondary education in 22 special schools.
Maori Pupils—At 1 July 1983, an estimated 31 479 Maori pupils were receiving secondary education. This number comprised 30 843 pupils attending State secondary schools and 636 pupils attending private secondary schools.
Secondary School Hostels—In 1983 there were 69 hostels for State secondary schools including 4 5-day hostels serving rural areas.
Attainment Levels of Pupils Leaving State and Private Secondary Schools—The following table gives particulars of pupils who left schools providing secondary education, classified according to years of attendance and attainments.
| Year of Attendance | Pupils | |
|---|---|---|
| 1981 | 1982 | |
| First | 548 | 589 |
| Second | 4,666 | 4,275 |
| Third | 16,115 | 14,639 |
| Fourth | 21,645 | 19,875 |
| Fifth | 15,160 | 14,365 |
| Sixth and over | 513 | 571 |
| Total | 58 647 | 54 314 |
| University Scholarship | 208 | 196 |
| University Bursary | 4,981 | 4,936 |
| Higher School Certificate | 3,554 | 3,385 |
| University Entrance | 9,224 | 8,679 |
| Sixth Form Certificate | 7,326 | 6,981 |
| School Certificate (three or more subjects) | 6,374 | 5,765 |
| School Certificate (one or two subjects) | 7,573 | 6,425 |
| No formal national academic attainment | 19,407 | 17,947 |
| Total | 58 647 | 54 314 |
Probable Destination of State and Private Secondary Pupils—An indication of the vocations intended to be followed by pupils who left secondary schools during 1982 is contained in the next table.
| Probable Destination | Boys | Girls | Total |
|---|---|---|---|
| Further full-time education at: | |||
| University | 3,608 | 2,886 | 6,494 |
| Teacher training: | |||
| Attending university full-time | 53 | 149 | 202 |
| Other (including kindergarten) | 46 | 393 | 439 |
| Technical institute | 1,483 | 3,478 | 4,961 |
| Other full-time education (business colleges, seminaries, ballet or drama school, agricultural college, e.g., Flock House) | 178 | 253 | 431 |
| To join labour force: | |||
| Technical or professional work requiring further part-time or directed education— | |||
| Health services | 88 | 932 | 1,020 |
| Technicians and other | 770 | 434 | 1,204 |
| Apprenticeships | 3,761 | 617 | 4,378 |
| Clerical, sales, or related work | 2,708 | 6,294 | 9,002 |
| Production, service industries, agricultural, or manual occupations | 7,138 | 3,253 | 10,391 |
| No occupation or unknown | 7,690 | 8,102 | 15,792 |
| Total | 27 523 | 26 791 | 54 314 |
CURRICULUM AND RESOURCES DEVELOPMENT—The principal functions of the Development Division of the Department of Education are to develop, co-ordinate, and revise curricula and syllabuses at all school levels; to provide handbooks and resource materials for teachers; to initiate pilot schemes of new courses and methods; to bring new or revised methods to the attention of teachers; and to assist teachers themselves in developing curricula at the local school level. Professional officers in the division have responsibility for development in subjects including science, mathematics, English, social studies, Maori language and studies, foreign languages, music, drama, physical education, reading, health education, technical education, home economics, arts and crafts, libraries, agriculture, audiovisual media evaluation, and computer education.
The division also contains the School Publications Branch, the Visual Production Unit, the National Film Library, and the Audio Production Unit.
MAORI LANGUAGE TEACHING—In 1983 a total of 175 secondary schools taught Maori to 13 456 pupils while more than 1956 candidates sat the School Certificate Maori Examination.
The 40 itinerant teachers of Maori continued their work as teacher-trainers in primary schools with 1163 teachers engaged in the training of 33 562 children. Work in bilingual education, which began in 1979, continued in 1983 in four rural schools situated in Maori communities.
RURAL EDUCATION: Consolidation of Schools—In order to give children in country districts the advantage of special equipment and more specialised teaching in larger schools, the consolidation of the smaller rural schools has been a feature of the last 30 years. Composite schools have been developed in recent years to bring together larger concentrations of children from Form 1 and above. These are known as Form 1 to 7 schools and area schools.
The first Form 1 to 7 school was opened in 1962 and by 1983 there were 52 of these schools. This type of school usually developed from the translation of the secondary department of a district high school with the addition of Form 1 and 2 pupils from neighbouring primary schools. They receive improved staffing, accommodation, and equipment in the endeavour to promote equality of educational opportunity for country children.
However, a large number of Form 1 and 2 children remain in the country districts too small to support a Form 1–7 school. In these districts, area schools have been established. The area school is a unified school providing education from the infant stage to Form 7 for all children in the immediate vicinity, and from Form 1 upwards for children from contributing schools over a wider area. The first area school was opened in 1969. At 1 July 1983 there were 35 of these schools.
Rural Education Activities Programmes (REAPs)—Since they were started in 1979, 13 Rural Education Activities Programmes (REAPs) have been established. These are intended to provide extra resources to certain rural areas which are relatively isolated and sparsely populated.
The resources provided in each district contain all or most of the following elements—ore-school staffing; guidance and visiting teachers; curriculum support for teachers through advisors or seconded teachers; an organiser to develop continuing education; additional staffing in rural secondary schools; and a time allowance to develop liaison between schools.
Each REAP has a different emphasis depending on local needs. In 1 area emphasis in the support services is on providing advisors in music, Maori and Polynesian education, and junior classes together with support for teachers in area schools, and smaller secondary schools in the district. In another a special feature is the establishment of an outdoor education co-ordinator with responsibility for developing programmes in outdoor education with particular emphasis on the skills associated with safety in hazardous outdoor education activities. Another district places emphasis on developing pre-school services and the planning of co-ordinated programmes to be used by the main school and those contributing to it.
District management committees have been established as an integral part of the programmes. They have representation from pre-school interests, teacher organisations, continuing education, school controlling authorities, service organisations, and other appropriate groups. As the committees represent the interest of their districts they take a significant part in identifying local educational requirements and in co-ordinating the use of resources.
The districts in which REAPs have been set up are the Far North, Eastern Bay of Plenty, East Coast, Central Plateau, Central King Country, Taihape-Ruapehu, South Hawke's Bay, Wairarapa, Marlborough, Westport-Buller, West Coast, Central Otago, and Southland.
Transport Assistance and Boarding Bursaries—During the 1983 school year nearly 17 percent of the total school population received transport assistance. Most pupils were conveyed by buses under contract to education boards or operated by the Department of Education.
The school transport service carried 112 151 students to and from school daily on 2830 separate transport services which covered over 43 million kilometres. A further 6192 children received private and public transport allowances. It is estimated that nearly $50 million will be spent on school transport in the 1983–84 financial year.
The value of school boarding and course bursaries will increase from $900 to $980 a year as from Term 1, 1984. The number of pupils receiving boarding bursaries during 1983 was 2892 compared with 2850 the previous year. A total of 561 course bursaries were awarded in 1983 compared with 710 in 1982.
The following table gives particulars of the number of children transported to school and the number in receipt of boarding bursaries as at 19 August 1983, according to the type of school attended.
| Type of School | Pupils Transported to School | Pupils Receiving School Boarding Bursaries | Pupils Receiving Course Boarding Bursaries |
|---|---|---|---|
| State primary schools | 64,225 | 58 | – |
| State secondary schools | 53,633 | 2,116 | 457 |
| Private primary schools | 133 | 61 | – |
| Private secondary schools | 352 | 657 | 104 |
| Total | 118 343 | 2 892 | 561 |
CORRESPONDENCE SCHOOL—The Correspondence School provides courses for students in 4 major categories:
full-time students obtaining all their education through the school.
students enrolled in New Zealand secondary schools but doing 1 or more subjects with the Correspondence School.
part-time adult students who wish to continue their basic education.
teachers who wish to obtain additional qualifications at a tertiary level.
The school roll on 1 October 1983 was 17 293 made up of 390 pre-school; 802 primary; 435 special-needs section (pupils with significant educational handicaps); 876 individual programme section (pupils needing remedial tuition); 992 secondary; 2791 students at secondary schools; 8546 part-time students; and 2461 undertaking advanced studies for teacher courses (including Diploma of Teaching and service increment courses, 2000; Trained Teachers Certificate, 80; early childhood and childcare courses, 282; and Certificate in Social Education and Training of the Handicapped, 99).
The 992 full-time secondary students were enrolled for a variety of reasons-365 for isolation, 121 medical, 134 New Zealand children living overseas, 141 pregnancy, 13 in institutions, 60 school suspensions, 52 school phobia, and 76 adult full time.
For full-time students the school provides daily radio lessons, club activities, the publication of a school magazine, periodical exhibitions of work, and active parents' and ex-pupils' associations.
The personal link between student and school is strengthened by 7 resident teachers, based in major centres, who visit families regularly. Visits are also made by teachers from the school. At a district level, school day, and school week gatherings are held periodically. A residential school for invited pupils is conducted each year to enable children to gain the opportunity for social education by taking part in group activities. This school is of 4 weeks' duration.
The total staff of the Correspondence School in 1983 was 467. Of this number, 293 were secondary teachers, 76 primary (including those in special-needs and individual programme sections), 13 preschool, 12 tutors for teaching diplomas and certificates, and 73 administrative staff.
AGRICULTURAL CLUBS—For many years a practical interest in agriculture has been featured in rural schools through the boys' and girls' agricultural clubwork movement. The pupils undertake home projects associated with livestock rearing and/or vegetable/flower growing. These projects frequently culminate in an annual school field day.
Efforts are now being made to foster the development of the clubwork movement in urban schools and particularly home garden projects. All pupils completing projects satisfactorily, are eligible for the award of a boys' and girls' agricultural clubs project certificate.
The advisers on school science employed by education boards play an important part in promoting the movement in schools. They encourage and assist teachers to establish the clubwork movement. They also provide guidance notes for the organisation, rearing activities and cultural details associated with a wide range of agricultural based projects.
The boys' and girls' agricultural clubwork movement receives a good deal of active, supportive involvement from parents, teachers, farmers, and others associated with agricultural/horticultural organisations.
HEALTH SERVICES—Information on the medical and dental inspection of school children and the dental-clinic system is given in Section 5A. Health and Medical Services.
TRAINING OF TEACHERS—In 1983 there were 7 teachers colleges: Auckland, Auckland Secondary, Hamilton, Palmerston North, Wellington, Christchurch (primary and secondary), and Dunedin, with full-time staffs totalling 480 (363 males and 117 females). At 1 July 1983 there were 4316 students in training. This number includes 618 holders of secondary teacher studentships (Division U) and 219 holders of primary teachers' studentships (Division S) who were attached to teachers colleges while attending universities as full-time students as part of their training for teaching, 343 graduates undertaking training for secondary teaching and 7 Division T undertaking full-time technical institute study.
Secondary training was also available in small Division C units at Hamilton, Wellington, and Dunedin Teachers Colleges.
The minimum entry qualification for admission to primary teacher training (Division A), is Sixth Form Certificate with acceptable grades in 4 subjects. University Entrance is required for the Division B course in general secondary subjects and the 1-year Division C course is for graduates.
The following table shows the number of students attending Teachers Colleges at 1 July.
| Year | Division A | Division B | Division C | Division E | Other Courses* | Total | |||||
|---|---|---|---|---|---|---|---|---|---|---|---|
| M | F | M | F | M | F | M | F | M | F | ||
| * Includes home economics, commercial, and special 1-year technical course. | |||||||||||
| 1979 | 882 | 3,366 | 153 | 153 | 263 | 344 | 6 | 288 | 78 | 287 | 5,820 |
| 1980 | 791 | 3,340 | 148 | 220 | 323 | 426 | 10 | 271 | 94 | 296 | 5,919 |
| 1981 | 750 | 3,471 | 134 | 184 | 303 | 387 | 7 | 282 | 87 | 294 | 5,899 |
| 1982 | 555 | 2,752 | 137 | 186 | 177 | 250 | 6 | 228 | 1 | 172 | 4,464 |
| 1983 | 418 | 2,121 | 96 | 143 | 133 | 210 | 4 | 209 | 4 | 91 | 3,429 |
The normal course of training for Division A students is a period of 3 years at a teachers college, followed by a further period of 1 year as a probationary assistant attached to a State primary school. Specialist training courses are available to selected students who wish to become speech therapists or teachers of deaf children.
Although the normal period of Division A training for teaching is 3 years, courses may be shortened to 2 years for students wholly or partway through degree courses. The Division E course for early childhood teachers is also available in all the teachers colleges except Auckland Secondary Teachers College: This is a 2-year course after which students must apply for positions in the kindergartens.
A concurrent secondary teacher training course (Division B) was introduced in 1966. The course provides for up to 4 years of concurrent training at a university or a technical institute and at a teachers college, and is available at Auckland Secondary Teachers College and at the secondary division of Christchurch Teachers College.
Under the provisions of this concurrent course a successful student may commence his/her career of teaching as a teacher-trained university graduate in 4 years. This is the same period of time taken by students who through Division U complete 3 years full-time university study followed by the 1-year course of teacher training for graduates in Division C.
The ages and classification of students at teachers colleges at 1 July 1983 are shown in the following table.
| Course | Age of Students (in Years) | Total | Total | ||||||||||||||
|---|---|---|---|---|---|---|---|---|---|---|---|---|---|---|---|---|---|
| Under | 17 | 17 | 18 | 19 | 20 | 21–24 | 25 and over | ||||||||||
| M | F | M | F | M | F | M | F | M | F | M | F | M | F | M | F | Combined | |
* Includes speech and Pacific Island trained teachers. †Education of deaf and handicapped. ‡Includes home economics, commercial and special 1-year technical course. | |||||||||||||||||
| Primary | |||||||||||||||||
| (Division A)— | |||||||||||||||||
| First year | – | – | 10 | 105 | 31 | 246 | 26 | 99 | 13 | 27 | 10 | 13 | 3 | 26 | 93 | 516 | 609 |
| Second year* | – | – | – | – | 6 | 94 | 34 | 188 | 18 | 93 | 45 | 90 | 17 | 56 | 120 | 521 | 641 |
| Third year* | – | – | – | – | 1 | 2 | 15 | 216 | 49 | 416 | 78 | 294 | 43 | 118 | 186 | 1,046 | 1,232 |
| Postgraduate | |||||||||||||||||
| Specialist† | – | – | – | – | – | – | – | – | – | – | – | 9 | 19 | 29 | 19 | 38 | 57 |
| Total primary | – | – | 10 | 105 | 38 | 342 | 75 | 503 | 80 | 536 | 133 | 406 | 82 | 229 | 418 | 2,121 | 2,539 |
| Secondary | |||||||||||||||||
| (Division B)— | |||||||||||||||||
| First year | – | – | 1 | 3 | 2 | 21 | 4 | 9 | 2 | 3 | 4 | 2 | 4 | 1 | 17 | 39 | 56 |
| Second year | – | – | – | – | 1 | 5 | 10 | 19 | 4 | 1 | 11 | 6 | 4 | 3 | 30 | 34 | 64 |
| Third year | – | – | – | – | – | – | 2 | 3 | 5 | 27 | 24 | 31 | 18 | 9 | 49 | 70 | 119 |
| Total division B | – | – | 1 | 3 | 3 | 26 | 16 | 31 | 11 | 31 | 39 | 39 | 26 | 13 | 96 | 143 | 239 |
| Division C total | – | – | – | – | – | – | – | – | – | 10 | 96 | 168 | 37 | 32 | 133 | 210 | 343 |
| Kindergarten | |||||||||||||||||
| (Division E)— | |||||||||||||||||
| First year | – | – | – | 17 | – | 46 | – | 19 | – | 13 | 1 | 10 | – | 13 | 1 | 118 | 119 |
| Second year | – | – | – | – | – | 12 | 1 | 34 | – | 17 | 1 | 15 | 1 | 13 | 3 | 91 | 94 |
| Total, Kindergarten | – | – | – | 17 | – | 58 | 1 | 53 | – | 30 | 2 | 25 | 1 | 26 | 4 | 209 | 213 |
| Other courses‡ | – | – | – | – | – | 9 | 1 | 30 | – | 26 | – | 10 | 3 | 16 | 4 | 91 | 95 |
| Total 1983 | – | – | 11 | 125 | 41 | 435 | 93 | 617 | 91 | 633 | 270 | 648 | 149 | 316 | 655 | 2 774 | 3 429 |
NOTE—The following students on studentships and bursaries were enrolled at teachers colleges in 1983.
| Division | M | F | T |
|---|---|---|---|
| Division S (primary teacher studentship) | 38 | 181 | 219 |
| Division U (secondary teacher studentship) | 265 | 353 | 618 |
| Division BS (secondary bursar studentship) | 17 | 26 | 43 |
| Division T (secondary teacher studentship for study at technical institutes) | 2 | 5 | 7 |
FREE TEXTBOOKS IN SCHOOLS—Free textbooks are supplied to all primary and secondary pupils in both State and private schools. Under the free textbooks scheme, the books remain the property of the school controlling authorities and are issued on loan to pupils. The school authorities have a wide discretion in their choice of suitable books.
SCHOOL LIBRARY SERVICE—For information on the School Library Service refer to page 263 of Section 8B, Libraries.
AUDIO PRODUCTION UNIT—With the transfer of the former Broadcasts-to-Schools function from Radio New Zealand to the Department of Education late in 1979, there has been a change in emphasis from live broadcasts to the development of a tape-bank service to schools.
Pre-school, current events, and Correspondence School programmes are contracted to Radio New Zealand. The department had 2 studios commissioned in the Correspondence School complex during 1981. These produce a wide range of audio cassettes, as part of learning packages in support of many curriculum subjects. The studios will also produce tapes for the Correspondence School.
NATIONAL FILM LIBRARY—The National Film Library was founded in 1942. It is now the responsibility of the Department of Education. Films are loaned to financial members and distributed to the north half of the North Island by the Auckland branch, to the South Island by the Christchurch branch, and to the remainder of the country by the Wellington branch. In addition, the Wellington office also offers a service to the Chatham Islands and to Western Samoa, Tokelau, Niue, Pitcairn, and the Cook Islands.
Each year the library spends substantial amounts on films, and stocks have been further augmented by valuable gifts from many of the diplomatic missions, from other Government departments, various organisations, and commercial enterprises. The National Film Library now holds some of the diplomatic film libraries, which are supplemented by the embassies from time to time.
In its 16 mm film section the library has approximately 47 000 prints of some 10 000 titles. In 1983 films were issued to 3000 educational institutions and over 700 community organisations. During 1984 educational video cassettes were available as well as 16 mm film. The Wellington branch also offers a record and cassette loan service, an audio-tape reel/cassette copying service, and a sample sheet music service. These services at present are limited to educational institutions only.
The audio library has in stock some 10 000 discs and 15 000 audio cassettes. Issues during 1983 totalled over 4243. The tape duplicating section in 1983 issued 41 639 units of audio tape.
MUSEUMS—Each year since 1977 over 300 000 school children have made museum visits. Fifteen full-time and 4 Dart-time museum education officers, funded by the Department of Education, assist schools to utilise the educational resources of the museum. Museum education services now cater for students from pre-school to tertiary.
SCHOOL PUBLICATIONS—The School Journal, an illustrated magazine, is published in 4 separate parts suitable for pupils in the various standard classes. Parts 1 and 2 are published 5 and 6 times a year, while Parts 3 and 4 for the senior classes appear 4 times a year. The School Journal celebrated its 75th year of publication in 1982. Bulletins dealing mainly with literature and language, social studies, science, history, and geography (particularly of New Zealand) are published occasionally for primary and secondary schools. These and other publications are prepared in the School Publications Branch of the Department of Education and issued free to all schools, both State and private.
A wide range of syllabuses, textbooks, and handbooks is published for secondary and primary schools.
Te Wharekura, a bulletin in the Maori language published 3 times a year, and Te Tautoko a supplementary reader, are issued free to secondary pupils studying the Maori language. He Purapura is a publication for primary pupils who are learning Maori.
The Education Gazette is published by the department twice a month. It is a medium for the dissemination of official information and for the advertisement of vacancies. Copies are distributed to educational authorities and to State and private schools.
VOCATIONAL GUIDANCE—On 1 April 1978 the Vocational Guidance Service was transferred to the Department of Labour and so became part of the new Employment and Vocational Guidance Service created to provide an educational, social, and occupational guidance and counselling service available to students and adults throughout the country (See Section 33—Employment).
UNIVERSITY EDUCATION—There are 6 separate universities and a university college of agriculture. These are the University of Auckland, the University of Waikato (at Hamilton), Massey University (at Palmerston North), the Victoria University of Wellington, the University of Canterbury (at Christchurch), and the University of Otago (at Dunedin), with Lincoln College a constituent agricultural college of the University of Canterbury.
Under the Universities Act 1961, the University Grants Committee was set up to advise the Government of the needs of New Zealand for university education and research. It determines the allocation of grants of money which it recommends for appropriation by Parliament to meet these needs, and reviews the expenditure by the universities of money appropriated by Parliament. The University Grants Committee is responsible for the award of scholarships, and through its statutory subcommittee, the Research Committee, for the distribution of a Government grant for research. Another statutory subcommittee of the University Grants Committee, the Curriculum Committee, has responsibility in respect of regulation of courses for degrees and diplomas. In the performance of its duties it is required to have regard to the equivalence of courses' standards.
The Universities Entrance Board was established on 1 January 1962 to maintain a common educational standard for admission to the universities. The board prescribes the conditions of examinations for University Entrance, University Bursaries and Entrance Scholarships. Students seeking admission to a university course can qualify for University Entrance from the Sixth Form, but the majority of students also complete a Seventh Form year before matriculating.
The special problems of legal education are the province of the Council of Legal Education which prescribes the examination requirements of candidates for admission as barristers and solicitors of the High Court.
Apart from the income from students' fees and the relatively small amounts now available to some of the universities from endowments, the block grants from the Government determine the income of the universities to meet their running costs for each 5 years. Under the block grant system, grants have been calculated and approved 5 years in advance to enable the universities to plan their activities ahead in the knowledge of what their income from the Government will be. They are block grants in the sense that they are not itemised and their detailed calculation is not disclosed to the universities. This has the effect of making the governing bodies—the university councils—not only responsible for arranging their budgets within their incomes, but also free to make their own decisions about the allocation of new expenditure among the many competing academic proposals which arise within the institutions. With these grants the university councils have an obligation to determine the numbers of students to be admitted to any class or faculty in the university, and to reallocate, where appropriate, existing staffing or accommodation resources in response to changes in demand for courses.
All universities offer courses in the usual faculties of arts; science, and commerce, whilst law and music courses are available at Auckland, Victoria, Canterbury, and Otago. Most universities specialise in certain fields. The University of Otago provides courses in medicine, dentistry, mineral technology, surveying, home science, physical education, and pharmacy; the University of Canterbury in forestry, engineering and fine arts, and Lincoln College in topics related to agriculture and horticulture; the University of Auckland provides courses in architecture, town planning, engineering, medicine, optometry and fine arts and Victoria University of Wellington in architecture, public administration, and social work. Massey University has courses in agriculture, horticulture, food technology, and veterinary science, as well as extramural tuition in a number of subjects to students throughout New Zealand. Joint courses leading to the degree of bachelor of education are available at Waikato, Massey, Canterbury, and Otago universities in association with the local teachers colleges.
University Scholarships—The most prestigious awards for those entering university are the University Junior Scholarships. These scholarships are tenable for 3 to 5 years, depending upon the minimum time in which the holder, studying full-time, could complete the recognised course taken under the scholarship. The University Junior Scholarship provides a scholarship allowance of $400 a year and is tenable with a tertiary study grant (see below). These scholarships, together with private endowed scholarships, are awarded on the results of the Entrance Scholarships Examination conducted by the Universities Entrance Board.
Scholarships awarded during degree courses include senior scholarships awarded by the individual universities and Lincoln College (and of a value to be determined by them). The various university institutions also have private scholarships for which their own students may compete. Scholarships awarded at the end of the university course are listed in full in the university calendars. Most of the post-graduate scholarships and post-doctoral fellowships are tenable in New Zealand.
University Bursaries—A and B Bursaries of $200 or $100 a year are awarded to students who gain A or B passes in the university bursaries examination.
All these grants are subject to strict rules as to terms and suspension. A student who in any year does not pass a prescribed number of units or subjects will have his/her grant suspended and it will not be reinstated unless in a subsequent year of study he/she is credited with a prescribed number of passes.
Tertiary Study Grants—The grant and bursary provisions for students entering upon tertiary courses of education were substantially revised for 1980.
Fees Grants are awarded to students following part-time or full-time courses who have qualified for entrance to the university. These bursaries provide payment for 75 percent of tuition fees.
Tertiary Study Grants are awarded to students who hold University Entrance and Higher School Certificate, or certain Sixth Form qualifications, and are tenable for any recognised course at a university in each year of the grant. Also, a student who is credited with 2 units in any year or 3 units over a period of years will qualify for a tertiary study grant.
A tertiary study grant may be held with a fees grant. It provides for a basic grant of $30 a week.
Accommodation Grants—Those awarded with a tertiary study grant and receiving payment under it, may be eligible for an Accommodation Grant of $25 a week if:
They are 20 or over on 31 January in the year they are applying and not living at home.
They will not be 20 until after 31 January in the year they are applying, their parents live outside the Accommodation Grant boundary around the nearest tertiary institution offering the course, and they will not be residing with parents during the academic year.
Hardship and Special Hardship Grants—Students awarded a tertiary study grant may also apply for either or both of these grants.
A Hardship Grant is available only to students who have abnormally high costs in certain specified areas (recognised as not generally borne by the majority of students), and who in addition, are able to demonstrate severe hardship.
There is provision for a student with dependants, or students in some exceptional circumstances, to receive a Special Hardship Grant of up to $47 a week. This will be paid in addition to the study grant and, if applicable, the Accommodation Grant.
The Tertiary Study Grant is also tenable for full-time courses at technical institutes and teachers colleges.
Further details of the amounts payable and other conditions for these grants and bursaries are available from university liaison officers and from the Head Office of the Department of Education, Wellington.
Students—At 1 July 1983 there were 46 470 students actually in attendance at the universities. In addition, there were 10 043 students attached to the various universities, but exempt from lectures. Comparable figures for the latest 5 years are given in the following table. Internal students now exceed 1.4 percent of the general population.
| Year | Internal Students | External Students | Total | ||
|---|---|---|---|---|---|
| Males | Females | Males | Females | ||
| 1979 | 25,082 | 17,456 | 2,838 | 3,774 | 49,150 |
| 1980 | 25,554 | 18,379 | 3,092 | 4,274 | 51,299 |
| 1981 | 25,673 | 19,063 | 3,212 | 4,816 | 52,764 |
| 1982 | 25,411 | 19,900 | 3,436 | 5,402 | 54,149 |
| 1983 | 25,600 | 20,870 | 3,795 | 6,248 | 56,513 |
The following table gives the details of courses (including degree, diploma and certificate courses) taken by all internal students at 1 July in 1982 and 1983.
| Course | 1982 | 1983 | ||||
|---|---|---|---|---|---|---|
| Males | Females | Total | Males | Females | Total | |
| Agricultural and Horticultural | 2,101 | 713 | 2,814 | 2,103 | 802 | 2,905 |
| Architecture and Town Planning | 542 | 168 | 710 | 601 | 200 | 801 |
| Arts | 4,191 | 8,199 | 12,390 | 4,192 | 8,216 | 12,408 |
| Commercial and Business Administration | 4,820 | 1,898 | 6,718 | 4,993 | 2,328 | 7,321 |
| Dentistry | 192 | 79 | 271 | 174 | 70 | 244 |
| Divinity and Theology | 92 | 26 | 118 | 80 | 30 | 110 |
| Education | 579 | 1,986 | 2,565 | 491 | 1,793 | 2,284 |
| Engineering | 2,342 | 116 | 2,458 | 2,306 | 130 | 2,436 |
| Fine Arts | 124 | 163 | 287 | 121 | 175 | 296 |
| Forestry Science | 127 | 13 | 140 | 127 | 20 | 147 |
| Home Science | 2 | 292 | 294 | – | 292 | 292 |
| Law and Jurisprudence | 2,035 | 1,339 | 3,374 | 2,091 | 1,533 | 3,624 |
| Librarianship | 7 | 39 | 46 | 12 | 35 | 47 |
| Medicine | 1,377 | 739 | 2,116 | 1,332 | 764 | 2,096 |
| Mineral Technology | 98 | 8 | 106 | 110 | 5 | 115 |
| Music | 127 | 203 | 330 | 132 | 210 | 342 |
| Optometry | 35 | 19 | 54 | 38 | 27 | 65 |
| Parks and Recreation | 58 | 40 | 98 | 61 | 37 | 98 |
| Pharmacy | 57 | 59 | 116 | 58 | 58 | 116 |
| Philosophy (Masters) | 58 | 30 | 88 | 49 | 34 | 83 |
| Physical Education | 136 | 165 | 301 | 138 | 183 | 321 |
| Regional and Resource Planning | 58 | 41 | 99 | 55 | 40 | 95 |
| Science | 4,892 | 2,319 | 7,211 | 4,875 | 2,443 | 7,318 |
| Social Sciences | 384 | 501 | 885 | 374 | 569 | 943 |
| Social Work | 65 | 223 | 288 | 79 | 268 | 347 |
| Surveying | 114 | 2 | 116 | 104 | 6 | 110 |
| Technology and Food Science | 522 | 120 | 642 | 526 | 141 | 667 |
| Valuation | 31 | 19 | 100 | 90 | 27 | 117 |
| Veterinary Science | 242 | 203 | 445 | 242 | 216 | 458 |
| Others | 1,129 | 973 | 2,102 | 1,266 | 1,122 | 2,388 |
| Total | 26 587 | 20 695 | 47 282 | 26 820 | 21 774 | 48 594 |
| Adjustment for students enrolled in more than 1 course | 1,169 | 756 | 1,925 | 1,220 | 904 | 2,124 |
| Total | 25 411 | 19 900 | 45 311 | 25 600 | 20 870 | 46 470 |
Students on the books of the university institutions at 1 July 1983 are shown in the following table.
| Auckland | Waikato | Massey | Victoria | Canterbury | Lincoln | Otago | All Universities | |||||||||
|---|---|---|---|---|---|---|---|---|---|---|---|---|---|---|---|---|
| M | F | M | F | M | F | M | F | M | F | M | F | M | F | M | F | |
* The sum of these figures is the 705 students referred to in the footnote below. †These figures include 705 students who are taking a course through Massey University but who are registered at their own university. To give the correct count per university these 705 students are shown twice in the body of the table, but to avoid a double count have been eliminated from the final totals. | ||||||||||||||||
| Internal students— | ||||||||||||||||
| Full-time | 5,300 | 3,490 | 1,259 | 10,23 | 2,972 | 2,003 | 2,637 | 2,130 | 3,344 | 1,925 | 1,194 | 429 | 3,021 | 2,417 | 19,727 | 13,417 |
| Part-time | 1,856 | 2,109 | 438 | 1,081 | 455 | 761 | 1,337 | 1,257 | 954 | 1,338 | 65 | 26 | 768 | 881 | 5,873 | 7,453 |
| All internal students | 7,156 | 5,599 | 1,697 | 2,104 | 3,427 | 2,764 | 3,974 | 3,387 | 4,298 | 3,263 | 1,259 | 455 | 3,789 | 3,298 | 25,600 | 20,870 |
| External students— | ||||||||||||||||
| Taking courses at Massey University | 57* | 105* | 20* | 46* | 3 598† | 6 075† | 66* | 131* | 61* | 90* | 5* | 5* | 42* | 77* | 3,598 | 6,075 |
| Taking courses at own university | 11 | 3 | – | – | – | – | 27 | 18 | 10 | 9 | – | – | 149 | 143 | 197 | 173 |
| All external students | 68 | 108 | 20 | 46 | 3,598 | 6,075 | 93 | 149 | 71 | 99 | 5 | 5 | 191 | 220 | 3,795 | 6,248 |
| All students | 7,224 | 5,707 | 1,717 | 2,150 | 7,025 | 8,839 | 4,067 | 3,536 | 4,369 | 3,362 | 1,264 | 460 | 3,980 | 3,518 | 29,395 | 27,118 |
| Overseas students included in total | 351 | 172 | 112 | 66 | 235 | 109 | 224 | 155 | 316 | 114 | 86 | 21 | 146 | 75 | 1,470 | 712 |
Internal students by years of university study at 1 July 1983 are shown in the following table.
| Year of University Study | Full-time Students | Part-time Students | All Internal Students | Of These, Overseas Students Numbered | ||||||||
|---|---|---|---|---|---|---|---|---|---|---|---|---|
| M | F | Total | M | F | Total | M | F | Total | M | F | Total | |
| First | 5,016 | 3,779 | 8,795 | 725 | 1,776 | 2,501 | 5,741 | 5,555 | 11,296 | 256 | 176 | 432 |
| Second | 4,411 | 3,060 | 7,471 | 632 | 1,302 | 1,934 | 5,043 | 4,362 | 9,405 | 293 | 181 | 474 |
| Third | 3,770 | 2,820 | 6,590 | 537 | 990 | 1,527 | 4,307 | 3,810 | 8,117 | 203 | 91 | 294 |
| Fourth | 2,981 | 1,852 | 4,833 | 724 | 929 | 1,653 | 3,705 | 2,781 | 6,486 | 207 | 94 | 301 |
| Fifth | 1,620 | 819 | 2,439 | 804 | 799 | 1,603 | 2,424 | 1,618 | 4,042 | 181 | 63 | 244 |
| Sixth or later | 1,929 | 1,087 | 3,016 | 2,451 | 1,657 | 4,108 | 4,380 | 2,744 | 7,124 | 330 | 107 | 437 |
| Total | 19 727 | 13 417 | 33 144 | 5 873 | 7 453 | 13 326 | 25 600 | 20 870 | 46 470 | 1 470 | 712 | 2 182 |
The ages of internal students at universities at 1 July 1983 are shown in the following table.
| Age, in Years at 1 July | Full-time Students | Part-time Students | All Internal Students | ||||||
|---|---|---|---|---|---|---|---|---|---|
| Men | Women | Total | Men | Women | Total | Men | Women | Total | |
| Under 18 | 311 | 400 | 711 | 26 | 116 | 142 | 337 | 516 | 853 |
| 18 | 2,881 | 2,500 | 5,381 | 132 | 408 | 540 | 3,013 | 2,908 | 5,921 |
| 19 | 3,519 | 2,708 | 6,227 | 225 | 515 | 740 | 3,744 | 3,223 | 6,967 |
| 20 | 3,527 | 2,445 | 5,972 | 254 | 466 | 720 | 3,781 | 2,911 | 6,692 |
| 21 | 2,963 | 1,664 | 4,627 | 434 | 482 | 916 | 3,397 | 2,146 | 5,543 |
| 22 | 2,058 | 957 | 3,015 | 476 | 413 | 889 | 2,534 | 1,370 | 3,904 |
| 23 | 1,181 | 500 | 1,681 | 506 | 340 | 846 | 1,687 | 840 | 2,527 |
| 24 | 779 | 330 | 1,109 | 409 | 277 | 686 | 1,188 | 607 | 1,795 |
| 25—29 | 1,570 | 876 | 2,446 | 1,472 | 1,236 | 2,708 | 3,042 | 2,112 | 5,154 |
| 30—34 | 559 | 429 | 988 | 812 | 1,026 | 1,838 | 1,371 | 1,455 | 2,826 |
| 35—39 | 239 | 293 | 532 | 500 | 831 | 1,331 | 739 | 1,124 | 1,863 |
| 40 and over | 140 | 315 | 455 | 627 | 1,343 | 1,970 | 767 | 1,658 | 2,425 |
| Total | 19 727 | 13 417 | 33 144 | 5 873 | 7 453 | 13 326 | 25 600 | 20 870 | 46 470 |
Information on direct government assistance to internal university students at 1 July 1982 and 1983 as supplied by universities are shown in the following table.
| Form of Assistance | No. of Awards | |
|---|---|---|
| 1982 | 1983 | |
| Tertiary fees grants (full time) | 899x | 966 |
| Tertiary fees grants (part time) | 1 158x | 1,120 |
| Tertiary study grants | 24,479 | 25,111 |
| Supplementary hardship grants | 6,480 | 70 |
| Special hardship grants | 90 | 225 |
| A Bursaries | 8,856 | 9,142 |
| B Bursaries | 5,451 | 5,551 |
| Teachers university studentships | 325 | 216 |
| Secondary teacher studentships | 455 | 485 |
| Teachers bursaries | 37 | 31 |
| Teachers college students fees | 2,450 | 1,681 |
| Rehabilitation and war bursaries | 4 | 13 |
| State Service study awards | 294 | 413 |
| Post Office study awards | 120 | 134 |
| Railway study awards | 12 | 4 |
| Armed Forces | 45 | 49 |
| Government employees on leave with pay to complete degrees (including teachers) | 159 | 156 |
| Medical bursaries | 13 | 10 |
| Maori and Polynesian scholarships | 45 | 53 |
| Other | 56 | 67 |
| Total number of awards | 51 428x | 45 497 |
NOTE—This table does not include overseas students. Students may receive more than one award. The nature of residence of full-time students at universities in 1983 is shown in the following table.
| Nature of Residence | Auckland | Waikato | Massey | Victoria | Canterbury | Lincoln | Otago | All Full-time Students | Of These, Overseas Students Numbered | |||
|---|---|---|---|---|---|---|---|---|---|---|---|---|
| M | F | Total | M | F | ||||||||
| Living in own home | 729 | 73 | 712 | 550 | 551 | 71 | 408 | 1,640 | 1,454 | 3,094 | 105 | 37 |
| Living in parents home | 4,164 | 460 | 383 | 1,899 | 1,946 | 223 | 739 | 6,129 | 3,685 | 9,814 | 45 | 20 |
| In hall of residence | 568 | 632 | 988 | 481 | 769 | 525 | 1,179 | 3,087 | 2,055 | 5,142 | 365 | 196 |
| Boarding | 627 | 132 | 306 | 132 | 547 | 66 | 85 | 1,195 | 700 | 1,895 | 150 | 84 |
| Sharing flat or house with others | 2,367 | 941 | 2,306 | 917 | 1,450 | 661 | 2,922 | 6,688 | 4,876 | 11,564 | 558 | 247 |
| Other or not known | 335 | 44 | 280 | 788 | 6 | 77 | 105 | 988 | 647 | 1,635 | 76 | 30 |
| Total | 8 790 | 2 282 | 4 975 | 4 767 | 5 269 | 1 623 | 5 438 | 19 727 | 13 417 | 33 144 | 1 299 | 614 |
Occupations of part-time university students at 1 July 1983 are shown in the following table.
| Occupation | Males | Females | Total |
|---|---|---|---|
| No occupation other than study | 793 | 645 | 1,438 |
| University staff | 499 | 387 | 886 |
| Teacher | 389 | 653 | 1,042 |
| Teachers college student | 307 | 1,256 | 1,563 |
| Government employee | 998 | 923 | 1,921 |
| Local body employee | 393 | 321 | 714 |
| Private employment | 1,912 | 1,242 | 3,154 |
| Self-employed person | 276 | 189 | 465 |
| Housewife or housekeeper | 27 | 1,453 | 1,480 |
| Full-time student at technical institute | 9 | 15 | 24 |
| Other occupations | 270 | 369 | 639 |
| Total | 5 873 | 7 453 | 13 326 |
Total of assisted overseas students at New Zealand universities at 1 July 1983, by the nature of the assistance, are shown in the following table.
| Nature of Assistance | Males | Females | Total |
|---|---|---|---|
| Assisted by the New Zealand Government— | |||
| Bilateral aid and assistance (Foreign Affairs) | 250 | 111 | 361 |
| Commonwealth Scholarships | 37 | 8 | 45 |
| Exchange Students | 1 | 4 | 5 |
| Government departments (other than Foreign Affairs) | 7 | – | 7 |
| Subtotal | 295 | 123 | 418 |
| Other assistance from— | |||
| Fijian Government | 27 | 1 | 28 |
| Malaysian Government | 20 | 8 | 28 |
| Other governments | 16 | 1 | 17 |
| Fulbright, Awards | 1 | 2 | 3 |
| Lee Foundation | 16 | 9 | 25 |
| World Bank | 4 | – | 4 |
| Rotary | 1 | 4 | 5 |
| Ford Foundation | 3 | 1 | 4 |
| Others | 29 | 16 | 45 |
| Subtotal | 117 | 42 | 159 |
| All assisted overseas students | 412 | 165 | 577 |
Graduates—The numbers of degree graduates from New Zealand universities for the years ended with the graduation ceremony in 1982 and 1983 are shown in the following table.
| Course | First Degree | Post-graduate | ||||
|---|---|---|---|---|---|---|
| 1981 | 1982 | 1983 | 1981 | 1982 | 1983 | |
| Agriculture | 232 | 247 | 261 | 43 | 40 | 53 |
| Architecture | 84 | 111 | 110 | 2 | – | 1 |
| Arts | 1,845 | 1,809 | 1,821 | 421 | 460 | 422 |
| Commerce and business administration studies | 945 | 987 | 1,058 | 63 | 92 | 73 |
| Dentistry | 53 | 57 | 55 | 3 | 3 | 3 |
| Divinity and theology | 7 | 4 | 16 | 7 | 9 | 11 |
| Education | 227 | 283 | 254 | 24 | 20 | 17 |
| Engineering | 411 | 446 | 426 | 63 | 40 | 30 |
| Fine arts | 16 | 15 | 28 | 4 | 4 | 3 |
| Forestry science | 20 | 18 | 25 | 6 | 2 | 2 |
| Home science | 30 | 22 | 25 | – | 1 | – |
| Horticulture | 35 | 50 | 68 | 4 | 2 | 5 |
| Law and jurisprudence | 398 | 380 | 393 | 16 | 17 | 17 |
| Management studies | 72 | 79 | 86 | – | – | – |
| Medicine | 366 | 424 | 393 | 6 | 3 | 10 |
| Mineral technology | 9 | 10 | 7 | 3 | 1 | 1 |
| Music | 55 | 61 | 58 | 7 | 17 | 10 |
| Optometry | – | – | 2 | – | – | – |
| Pharmacy | 23 | 23 | 21 | 3 | 3 | 1 |
| Philosophy | – | – | 1 | 165 | 163 | 178 |
| Physical education | 15 | 13 | 13 | 1 | 1 | – |
| Regional planning | 10 | 10 | 19 | – | – | – |
| Science | 1,161 | 1,207 | 1,277 | 234 | 285 | 274 |
| Social sciences | 90 | 87 | 121 | 25 | 29 | 23 |
| Social work | 33 | 44 | 34 | 1 | – | – |
| Surveying | 26 | 38 | 24 | – | 1 | – |
| Technology | 37 | 39 | 54 | – | – | 2 |
| Town planning | 31 | 24 | 19 | 2 | – | – |
| Veterinary science | 53 | 56 | 50 | – | – | 2 |
| Total | 6 284 | 6 544 | 6 719 | 1 103 | 1 193 | 1 138 |
Staff—The staffing of university institutions at 1 July 1983 is shown in the following table.
| Position | Full-time Staff | Part-time Staff | ||||
|---|---|---|---|---|---|---|
| Men | Women | Total | Men | Women | Total | |
| Filled teaching posts— | ||||||
| Professors | 362 | 11 | 373 | 36 | – | 36 |
| Senior lecturers (including readers, associate professors, lecturers-in-charge) | 1,592 | 133 | 1,725 | 370 | 39 | 409 |
| Lecturers | 473 | 121 | 594 | 28 | 20 | 48 |
| Junior or assistant lecturers | 100 | 83 | 183 | 50 | 23 | 73 |
| Instructors and demonstrators (if engaged in teaching) | 68 | 56 | 124 | 747 | 387 | 1,134 |
| Subtotal | 2 595 | 404 | 2 999 | 1 231 | 469 | 1 700 |
| Vacant teaching posts— | ||||||
| Filled by temporary staff | 28 | 28 | ||||
| Not filled at time of return | 52 | 14 | ||||
| Subtotal | 80 | 42 | ||||
| Total, established teaching posts | 3 079 | 1 742 | ||||
| Non-teaching staff— | ||||||
| Technicians, research assistants, and other technical staff not engaged in teaching | 877 | 288 | 1,165 | 27 | 108 | 135 |
| Library staff | 82 | 301 | 383 | 36 | 118 | 154 |
| Administrative staff, clerical and office staff | 371 | 926 | 1,297 | 13 | 230 | 243 |
| Others (groundsmen, tradesmen, cleaners, etc.) | 511 | 185 | 696 | 35 | 239 | 274 |
| Total, non-teaching staff | 1 841 | 1 700 | 3 541 | 111 | 695 | 806 |
TECHNICAL EDUCATION—In 1945 technical education was a variant form of secondary education. It was provided by separate technical high schools and technical departments in other secondary schools, and was avowedly vocational in purpose. During the past 15–20 years technical education has been subsumed under continuing education and has been transferred from the secondary to the tertiary sector of the educational system. Technical high schools as such no longer exist. Vocational education and training is now provided by 13 technical institutes and 8 community colleges.
This transformation is the result of a number of policy decisions which have catered for a demand for types of education and training in the post-secondary phase of a person's career.
The passing of the Apprenticeship Act 1948 made it compulsory for apprentices to undertake technical classes; the establishment, in 1949, of the Trades Certification Board and of national trades examinations gave direction to apprentice studies; the passing of the Technicians Certification Authority Act 1958 and the introduction of New Zealand Certificates gave encouragement to technician studies. In 1969 the Government established technical institutes in centres where there was sufficient technical work to occupy 10 full-time tutors and advanced the opening of minor institutes in provincial centres by several years. The approval by the Government, in 1972, of the establishment of community colleges allows traditional technical education to be provided for in conjunction with other educational needs which meet the specific circumstances of the local community, particularly in the non-metropolitan provincial centres. Apprenticeship training was upgraded to meet current industrial-commercial requirements by the 1983 Apprenticeship Act.
Continuing education in New Zealand is still developing and expanding. It is being developed through national and regional technical institutes as well as smaller technical institutes or community colleges in provincial centres. The Central Institute of Technology, at Heretaunga near Wellington, which gives a predominantly national block course service but also provides some special courses of a national character such as pharmacy, podiatry and occupational therapy, opened in 1960. Technical institutes have been opened in the 6 main centres of population, and, with the opening of Manukau Technical Institute in 1970, the first of a number of suburban institutes was opened to serve the Greater Auckland area. The second, Carrington, opened in 1976. Since 1971, technical institutes or community colleges have also been opened in the provincial centres.
The full list of technical institutes is as follows; Auckland, Manukau, Carrington, Waikato, Taranaki Polytechnic, Manawatu Polytechnic, Central Institute of Technology, Petone Technical Institute, Wellington Polytechnic, Nelson Polytechnic, Christchurch Polytechnic, Otago Polytechnic, and the New Zealand Technical Correspondence Institute. The first community college was Hawke's Bay Community College established at Napier in 1975. Since then, Northland (at Whangarei), Waiariki (at Rotorua), Tairawhiti (at Gisborne), and Bay of Plenty (at Tauranga) have been established. In 1978 Southland Polytechnic changed to a community college. From 1984 Wanganui and Timaru senior technical divisions were translated to become community colleges.
A standing committee on relationships in tertiary education exists to consider the problems of placement of courses and the rationalisation of tuition in the technician, semi-professional, and professional fields.
Technician Courses—The beginnings of technician training date from the early 1950s and were a result of the efforts of the engineering profession to specify a role for a highly-trained person whose qualifications were derived, not from study in a university school of engineering, but from theoretical studies taken in conjunction with industrial experience. The New Zealand Certificate of Engineering was introduced in 1954. This led, in 1960, to the establishment of the Technicians Certification Authority to prescribe courses and syllabuses and conduct examinations for technicians, and to grant diplomas or certificates. In 1979 further recognition of the scope of the work of the TCA was given, its base broadened and it was renamed the Authority for Advanced Vocational Awards (AAVA). Both 5-year New Zealand certificates and 3-year technicians certificates are offered in the following subjects.
New Zealand Certificate: advertising, building, commerce, computer technology, customs, data processing, draughting (architecture), draughting (survey/town and country planning), engineering, fire technology, hotel and catering administration, forestry, land surveying, local government administration, quantity surveying, science, statistics, and town planning certificates.
Technicians Certificates: garage management, automotive, civil, draughting, electrical, engineering, mechanical, radio, survey, telegraph and data, telephone, and hospital officers' certificates.
The instruction for New Zealand Certificate courses is part-time, or by regular intermittent periods in full-time classes (block courses), or by correspondence from the Technical Correspondence Institute supplemented in science and workshop subjects by short practical courses at an institute. In a few cases, study can be taken at full-time courses in a technical institute, but for the first 2 or 3 years only. All New Zealand Certificates require students to be suitably employed for 3 years with obligatory employment during the last 2 stages of the course.
During the last 15 years there has been a spectacular increase in the range of technician courses and the number of students studying for New Zealand Certificates.
Trade Courses—Apprenticeship training accounts for a significant percentage of the enrolment load of technical institutes. Examination prescriptions for a full range of trade courses are prescribed by the New Zealand Trades Certification Board (TCB), which conducts 2 qualifying and trade certificate examinations for apprenticeship, and usually an advanced trade certificate examination to be taken at about the end of the apprenticeship. Up to 31 March 1983, this board has issued 62 627 New Zealand Trade Certificates and 17 547 Advanced Trade Certificates.
Apprentices in almost all trades are obliged to spend at least 3 years in vocational part-time studies. However the long established pattern where apprentices attend evening theory classes and short block or day release courses for practical training is undergoing a radical change.
Other Courses—In addition to the national trade and technician courses, there are a large number of courses available which have been organised regionally to meet local demands. These include courses in commerce, work study, electronic data processing, journalism, and in industrial and commercial design. In addition, instruction is given on the examination syllabuses devised by independent organisations such as the New Zealand Society of Accountants, and the New Zealand Institute of Management.
Health Services Education—Health-related education accounts for approximately 34 percent of the full-time technical education load. There are currently 11 diploma and certificate programmes in the health-related areas, and of these the basic nursing courses account for 65 percent. There are now 2 technical institutes/community colleges offering 3-year comprehensive nursing courses.
In 1984 there were 874 places available for first year students. Planning approval has been given by the Government for further places in 1985 and 1986 which will bring the total first year places to 1168. Nationally there are currently 2005 students throughout the 3 years of the comprehensive nursing course.
In addition there are bridging courses, for already-registered nurses to become registered comprehensive nurses; a number of short courses for nurses who wish to further their knowledge in specific aspects of nursing; and, for those seeking advanced knowledge and skills, there are advanced diploma in nursing courses available.
Statistics of students taking full-year courses in technical education at 1 July in 1982 and 1983 are shown in the following table. Courses are classified according to the International Standard Classification of Education.
| Full-time Courses: As at 1 July | 1982 | 1983 | ||||
|---|---|---|---|---|---|---|
| Males | Females | Total Students | Males | Females | Total Students | |
| Level 3— | ||||||
| Education, science and teacher training | 1 | 19 | 20 | – | 19 | 19 |
| Fine and applied arts | 6 | 7 | 13 | 19 | 4 | 23 |
| Commercial and business administration | 12 | 1,848 | 1,860 | 5 | 1,809 | 1,814 |
| Mass communication and documentation | 7 | 25 | 32 | 4 | 36 | 40 |
| Service trades | 72 | 179 | 251 | 103 | 177 | 280 |
| Medical science and health related | – | 31 | 31 | – | 17 | 17 |
| Trade, craft, and industrial programmes | 243 | 66 | 309 | 293 | 89 | 382 |
| Transport and communications | 14 | – | 14 | 12 | 4 | 16 |
| Total | 355 | 2 175 | 2 530 | 436 | 2 155 | 2 591 |
| Level 5— | ||||||
| Education, science and teacher training | – | – | – | – | – | – |
| Fine and applied arts | 68 | 120 | 188 | 74 | 126 | 200 |
| Commercial and business administration | 443 | 532 | 975 | 499 | 668 | 1,167 |
| Mass communication and documentation | 29 | 56 | 85 | 33 | 57 | 90 |
| Natural science | 24 | 76 | 100 | 31 | 67 | 98 |
| Mathematics and computer science | 80 | 13 | 93 | 110 | 42 | 152 |
| Medical science and health related | 279 | 2,199 | 2,478 | 267 | 2,439 | 2,706 |
| Engineering | 422 | 28 | 450 | 499 | 20 | 519 |
| Architecture and town planning | 55 | 22 | 77 | 54 | 24 | 78 |
| Trade, craft, and industrial programmes | 185 | 159 | 344 | 179 | 149 | 328 |
| Agriculture, forestry and fishing | – | – | – | 4 | 9 | 13 |
| Humanities, religion, and theology | – | 10 | 10 | 3 | 11 | 14 |
| Total | 1 585 | 3 215 | 4 800 | 1 753 | 3 612 | 5 365 |
| Grand total | 1 940 | 5 390 | 7 330 | 2 189 | 5 767 | 7 956 |
Students enrolled in full-year part-time courses as at 1 July 1983 are shown by the type and level of course in the following table.
| Part-time Courses: As at 1 July 1982 | Males | Females | Total |
|---|---|---|---|
| Level 2 | 1,128 | 2,307 | 3,435 |
| Level 3— | |||
| Authority for Advanced Vocational Awards | 1,675 | 183 | 1,858 |
| Trade Cert. Course | 16,032 | 1,612 | 17,644 |
| Other | 9,787 | 17,592 | 27,379 |
| Level 5— | |||
| Authority for Advanced Vocational Awards | 9,022 | 3,183 | 12,205 |
| Trade Cert. Course | 3,045 | 43 | 3,091 |
| Other | 9,449 | 4,923 | 14,372 |
| Level 9— | |||
| Non-vocational | 16,486 | 42,239 | 58,725 |
| Total | 66 627 | 72 082 | 138 709 |
New Zealand Technical Correspondence Institute—The Department of Education established the Technical Correspondence School (now the Technical Correspondence Institute) in 1946, and from small beginnings, with a staff of approximately 12, this institute now employs almost 500 full-time staff. With a student roll of almost 30 000 the Technical Correspondence Institute is easily the biggest single educational institution in the country. The institute teaches one-third of all vocational students enrolled at technical institutes in New Zealand. The institute writes, illustrates, and prints the material for all the courses offered.
The Technical Correspondence Institute parallels the teaching standards of other technical institutes, and also provides instruction in many subjects not taught elsewhere. A significant number of the apprentices who sit the annual Trades Certification Board examinations are directed to enrol at the Technical Correspondence Institute.
The institute also prepares a large percentage of candidates for the Authority for Advanced Vocational Awards examinations in engineering, building, commerce, draughting, and science as well as for other professional and industrial examinations. Voluntary students studying for advanced trade, technician or professional qualifications comprise about two-thirds of the roll. The Technical Correspondence Institute offers over 900 subjects, from ladies' hairdressing, plumbing, and agriculture to airline pilots' licences and professional accountancy. To enrol at the Technical Correspondence Institute students must be engaged in the vocation relevant to their course of study, hence their correspondence studies are supported by practical experience. In some cases, laboratory work or practical instruction is required as part of the course. In such cases students attend block courses at the Central Institute of Technology or other institutes.
EDUCATIONAL LEVELS OF ADULT POPULATION—The 1981 Census of Population and Dwellings included a question on the highest level of education attended and two further questions on the highest qualification gained at school and on qualifications gained since leaving school.
The first of the following tables shows the educational levels of the usually resident population aged 15 years and over by:
attendance (current and past) at school;
past attendance (prior to 1981) at other places of education.
The second table shows, by age group, the highest school qualification gained. All figures in these tables have been subject to a process of random rounding. All cell values including row and column totals have been rounded, using simple random rounding to base three. Individual figures, therefore, will not necessarily sum to give the stated totals.
| Highest Level Attended | 1981 Census | ||
|---|---|---|---|
| Males | Females | Total | |
* Includes those still at school. †New Zealand residents aged 15 years and over. | |||
| School Attendance*— | |||
| No primary/secondary education | 10,962 | 11,460 | 22,419 |
| Primary up to Form 2 | 163,131 | 180,006 | 343,137 |
| 3rd, 4th or 5th Form | 610,581 | 632,700 | 1,243,281 |
| 6th Form | 192,969 | 222,228 | 415,197 |
| 7th Form | 113,406 | 79,872 | 193,275 |
| Not specified | 39,294 | 40,101 | 79,395 |
| Total† | 1 130 340 | 1 166 364 | 2 296 704 |
| Post Tertiary Attendance— | |||
| No past attendance at any place of tertiary education, or still attending primary or secondary school | 638,220 | 701,484 | 1,339,701 |
| University | 84,795 | 34,704 | 119,499 |
| Teachers college | 7,155 | 34,473 | 41,625 |
| Polytechnic, technical institute, or community college | 178,683 | 71,892 | 250,575 |
| University and teachers college | 15,702 | 23,496 | 39,198 |
| University and polytechnic, technical institute, or community college | 13,152 | 4,578 | 17,733 |
| Other tertiary | 29,442 | 107,997 | 137,436 |
| Not specified | 163,188 | 187,743 | 350,931 |
| Total† | 1 130 340 | 1 166 364 | 2 296 704 |
| School Qualifications | Age Group (Years) | |||||
|---|---|---|---|---|---|---|
| 15–19 | 20–24 | 25–44 | 45–59 | 60 and Over | Total | |
* University Scholarship or 'A' or 'B' Bursary. †Higher School Certificate or Higher Leaving Certificate. ‡Endorsed School Certificate or Sixth Form Certificate in 4 or more subjects. §In 1, 2 or 3 subjects. || School Certificate or 3 or more subject passes in School Certificate. ¶New Zealand residents aged 15 years and over. | ||||||
| No school qualification | 124,590 | 97,626 | 437,028 | 315,060 | 333,885 | 1,308,189 |
| University Scholarship* | 11,577 | 19,629 | 24,282 | 3,714 | 2,028 | 61,230 |
| Higher School Certificate† | 7,485 | 14,922 | 45,213 | 17,019 | 10,545 | 95,187 |
| University Entrance | 35,184 | 37,353 | 77,496 | 36,633 | 33,810 | 220,476 |
| Endorsed School. Certificate‡ | 12,420 | 12,276 | 34,575 | 6,390 | 2,352 | 68,013 |
| Sixth Form Certificate§ | 9,402 | 11,742 | 11,052 | 2,187 | 1,809 | 36,195 |
| School Certificate|| | 50,748 | 37,485 | 122,460 | 29,817 | 8,211 | 248,721 |
| Pass in 1 or 2 School Certificate subjects | 33,339 | 30,147 | 43,938 | 5,292 | 1,485 | 114,201 |
| Other qualifications | 252 | 177 | 2,946 | 3,006 | 1,695 | 8,076 |
| Not specified | 21,630 | 8,283 | 37,425 | 28,755 | 40,326 | 136,422 |
| Total¶ | 306 633 | 269 640 | 836 415 | 447 879 | 436 137 | 2 296 704 |
NEW ZEALAND COUNCIL FOR EDUCATIONAL RESEARCH—The Carnegie Corporation of New York was instrumental in founding the New Zealand Council for Educational Research in 1933 and supported it with grants for 10 years. Since 1945 the council has been supported principally by State funds, the remainder coming from contributions from educational bodies, philanthropic foundations, business organisations, and its own trading operations. It has remained, however, under independent control as provided for in the New Zealand Council for Educational Research Act 1945 (updated in 1972).
In its research programme, the council has concentrated on New Zealand problems, and its main publications (more than 60 research reports and numerous shorter studies in education) include critical surveys of major policy issues in New Zealand education and accounts of outstanding experiments in school practice. These have brought about or helped reshape major developments in such areas as secondary, university, and adult education, intermediate schools, consolidation of rural schools, and care of children with special needs. The council also publishes two periodical publications; the New Zealand Journal for Educational Studies, and a special research information package for teachers.
Since the 1930s, the council has served as the main source of supply for overseas and locally standardised educational and psychological tests used by universities, Government agencies, hospitals, business firms, and schools. In 1965 the council established a special Test Development Division to produce achievement tests designed specifically to suit the curricula of New Zealand schools. Known as the Progressive Achievement Tests, they are now used extensively in schools throughout this country, and also in Australia.
The council employs its own permanent research staff as well as temporary research fellows or project assistants, and it also assists honorary research workers in other institutions such as universities, teachers colleges, and schools. Its current research programme includes major projects related to educational planning, families, women and parents, the supply of qualified people in the community, teaching practices, Maori education, and adult education, early childhood education, and services for children with special needs. The council also acts as a clearing house for information on educational matters and maintains 7 local institutes for educational research in Auckland, Wellington, Christchurch, Dunedin, Palmerston North, Hamilton, and Suva (Fiji).
ADULT EDUCATION: National Council of Adult Education—The functions and powers of the National Council of Adult Education are set out in the Adult Education Act 1963. One of the council's most important functions is to take an overall view of the development of adult education in New Zealand. In practice the council seeks to encourage complementary activities, and provision in a wide and growing range of institutions, agencies, and organisations which provide learning opportunities to the community in the post-compulsory phase of learning.
The council advises the Director-General of Education and various organisations on adult education, co-ordinates and conducts pilot projects and experiments, maintains a national library and documentation centre on adult education and publishes magazines and occasional papers.
University Extension—Although full responsibility for and control of their continuing education activities rest with the universities, they use various systems to ascertain the views of (and in some cases to seek advice from) various community interests.
A typical centre for continuing education in a university has a director in charge and a staff of lecturers in a range of academic disciplines. In addition to teaching, the lecturers may plan and develop sections of the department's programme or have special responsibility for a geographical area and its programme. All 6 universities and Lincoln College now carry out extension work, but they show marked differences in their approaches and systems of organisation. A large number of university academic staff are co-opted in order to supplement the activity of the full-time staff (totalling over 40). The work is carried out by various methods—lecture courses, study conferences, seminars, schools of varying lengths (both residential and non-residential), and correspondence courses. While most universities continue to provide for the general public with substantial extension programmes in the liberal studies area, there has been a significant increase in programmes designed for specialised groups, largely occupational. Some of these are national in scope.
Secondary Schools—Most organised adult education is being done by evening classes in secondary schools. Since the revision of the School Certificate regulations to allow single subject passes, there has been some increase in adult classes leading to the School Certificate examination, but there is a very wide range of other examinable and non-examinable courses. A provision of the Education Act in 1975 allowed adults to return full-time or part-time to secondary schools, in day classes. There followed for the next few years a rapid increase in the number of adult admissions to day classes. In 1983 there were 734 full-time and 2924 part-time adult students. This is in addition to the evening class programmes.
CORRESPONDENCE EDUCATION—The main agencies in the field of education by correspondence are the Correspondence School (with over 10 000 adults students enrolled), the extramural studies of Massey University (9700), and the Technical Correspondence Institute (approximately 30 000 enrolments in 1983).
OTHER FORMS OF CONTINUING EDUCATION—Many voluntary organisations make some provision for continuing education. For most of them, such as the Play Centres Federation, and the Country Women's Co-ordinating Committee, continuing education is incidental to other purposes. However several organisations, such as the New Zealand Workers Educational Association, have continuing education as their primary purpose.
New Zealand Workers Educational Association—The WEA is an independent voluntary organisation which provides further educational opportunities for adults. District councils exist in Auckland, West Auckland, Waikato, New Plymouth, Kapiti Coast, Wellington, Canterbury, Otago, and Southland, and branches exist in Upper Hutt, Lower Hutt, and South-East Christchurch. District councils and branches run varied programmes, including seminars, courses, summer schools, public forums, and literacy programmes. Special courses are run for the elderly, the unemployed, and trade unions. The WEA Book Discussion Scheme has 112 groups throughout the country. The co-ordinating body is the New Zealand Workers Educational Association, located in Wellington. It publishes the WEA Review.
Workers Educational Association Trade Union Postal Education Service—This is an independent correspondence service administered by the trade unions and representatives from the Federation of Labour, the Workers Educational Association, and the National Council of Adult Education. It provides non-formal correspondence programmes for members of affiliated trade unions and their families.
Country Women's Co-ordinating Committee—The committee is involved with international affairs through the Associated Country Women of the World and in particular the South Pacific area, giving financial and practical aid, and assistance with the training of women in the Pacific Islands.
Community Centres—Community centres which opened experimentally some 40 years ago in Feilding, Christchurch, and Westport were the forerunners of the newly established school-based community learning centres. Generally the centres receive professional and ancillary staffing and an annual grant. In effect, 11 community learning centres have been established.
Several other schools which has developed large community programmes have been given lesser levels of support in the meantime.
Still another group of schools has developed successful programmes within their own resources, or with additional support from the Ministry of Recreation and Sport.
All these schools have developed community education programmes which aim at increasing the community involvement in continuing education by making a wider use of schools for expanded extension programmes and, by using the resources of the community, to enrich the programmes of pupils still at school.
The Community Action Programme (CAP) in the Wairarapa region has now merged with the Wairarapa REAP. Together they provide a range of continuing education programmes to meet a wide variety of learning needs in the area. The Community Education Service (CES) in the Nelson region has recently merged with the Nelson Polytechnic and together they provide for the continuing learning needs of people in the Nelson area.
INTERNATIONAL EDUCATION—The Department of Education provides technical advice to the Ministry of Foreign Affairs on education activities under New Zealand's Overseas Aid Programme. This includes advisory visits to Pacific Island schools preparing students for New Zealand examinations. In 1983, 148 such schools presented 10 463 candidates for School Certificate and 95 schools presented 5036 candidates for University Entrance. The department assists with the appointment of some 30 New Zealand teachers to Pacific Island schools each year.
In conjunction with the Ministry of Foreign Affairs, the Department of Labour and the University Grants Committee, the Department of Education provides advice to Government on policy for the admission of private foreign students to New Zealand educational institutions. It is also responsible for the placement in schools of students sponsored by their home governments. Since 1980, the department has administered the collection of the fee which foreign students are required to pay for their education in New Zealand universities and technical institutes.
The Department of Education administers a range of bilateral educational and cultural exchange activities. Each year, some 45 teacher exchanges are arranged between New Zealand and both the United Kingdom and Australia. The New Zealand-Japan Exchange Programme provides financial and administrative support for a wide range of activities for school teachers, artists and scholars and the Agreement for Industrial, Technological and Scientific Co operation (SINTESD) between New Zealand and Singapore enables activities with a commercial orientation in technical Education and training. Other activities concern overseas in-service training for teachers of French and German, the French Language Assistants Scheme, and courses for teachers of English and technical specialists in China.
New Zealand is a member of various intergovernmental organisations concerned with education. It thus participates in the education activities of the United Nations Educational, Scientific and Cultural Organisation (UNESCO), the Commonwealth, the South-east Asian Ministers of Education Organisation (SEAMEO), and the Organisation for Economic Co-operation and Development (OECD). New Zealand participates in the work of the Education Committee of OECD and is a member of the Centre for Educational Research and Innovation (CERI) and the Programme on Educational Building. The New Zealand Minister of Education also participates in the meetings of the Australian Education Council.
Organisation for Economic Co-operation and Development—Membership of the Organisation for Economic Cooperation and Development in 1973 enabled New Zealand to participate in the activities of its Education Committee. In 1975 New Zealand also became a member of OECD's Centre for Educational Research and Innovation (CERI) and the Programme on Educational Building.
Census of Services—The State has direct control, as the main supplier of funds, over 90 percent of all primary schools, 72 percent of all secondary schools, and more than 90 percent of tertiary educational establishments in New Zealand. In addition it controls private establishments, particularly the Catholic education system and other approved independent schools and pre-school facilities.
The following table gives a general summary of education statistics which were covered in the 1980–81 Department of Statistics' Census of Services. For further details, and definitions used in the Census of Services, refer to Section 22B in this Yearbook.
| Service | Enterprise Groups | Enterprises | Operating Units | Persons Employed | Salaries and Wages | |
|---|---|---|---|---|---|---|
| Establishments | Ancillary | |||||
| Number | $(000) | |||||
| Pre-school education* | 169 | 276 | 1,478 | 54 | 2,815 | 16,116 |
| Primary education | 269 | 269 | 2,513 | 1 | 31,512 | 373,920 |
| Secondary education | 265 | 265 | 361 | – | 20,659 | 319,563 |
| Tertiary education | 34 | 34 | 44 | 1 | 15,891 | 197,433 |
| Other education services† | 461 | 524 | 608 | 2 | 2,627 | 19,929 |
| Ancillary units servicing education | 7 | 7 | – | 8 | 47 | 714 |
| Total education services | 1 185 | 1 332 | 5 004 | 66 | 73 551 | 927,675 |
| Service | Purchases and Operating Expenses | Total Sales and Other Income | Value Added | Net Capital Additions |
|---|---|---|---|---|
* Includes kindergartens, playcentres, etc. †Includes special schools for the handicapped, private correspondence schools, and schools in art, business, driving, language, music, dancing, etc. | ||||
| $(000) | ||||
| Pre-school education* | 21,358 | 21,811 | 14,438 | 1,061 |
| Primary education | 427,582 | 431,263 | 382,063 | 43,435 |
| Secondary education | 368,532 | 372,637 | 328,359 | 42,367 |
| Tertiary education | 258,004 | 259,904 | 195,631 | 21,080 |
| Other education services† | 30,425 | 31,960 | 20,605 | 1,424 |
| Ancillary units servicing education | 1,430 | 1,173 | 696 | 10 |
| Total education services | 1,107,331 | 1,118,748 | 941,792 | 109,377 |
FURTHER INFORMATION—For statistics on Maori school leavers' qualifications and years of attendance at secondary schools, and the Maori Education Foundation, refer to Section 3B of this Yearbook. A small selection of the many books on education is included in the Bibliography near the back of this Yearbook.
The following official publications deal with statistics and administration rather than with pedagogy.
Report of the Department of Education (Parl. paper E.1).
Education Statistics of New Zealand—Department of Education.
Reports of the University Grants Committee and University Institutions (Parl. paper E.3).
Report of the Maori Education Foundation (Parl. paper E.24).
Report of the Pacific Islands Polynesian Education Foundation (Parl. paper E.21).
UN Statistical Yearbook—United Nations.
DEPARTMENT OF SCIENTIFIC AND INDUSTRIAL RESEARCH: Agricultural Production—Adverse terms of trade for meat and wool, and rising internal costs emphasise the importance of technological advances which enable the farming sector to increase outputs.
New Zealand's research in agriculture is undertaken by the DSR and the Ministry of Agriculture and Fisheries. Regular meetings are conducted between the two departments to ensure co-ordination of programmes and resources. Research in pastoral agriculture continued with the aim of increasing pasture production by breeding new pasture species, improving efficiency of fertiliser use, controlling pests and other products, and designing more productive pasture plant communities for environments such as Northland, Southland, moist North Island hill country and dryland.
A major breakthrough was made when it was discovered that the animal disease 'ryegrass staggers' is associated with an endophyte fungus in the ryegrass.
Plant breeding remains a dominating force in the development of New Zealand's land-based primary industries. It has the capability of creating new products, improving the quality of existing ones, and reducing costs associated with production.
Horticulture is a major area of research and development expansion, particularly in the fields of fruit crop propagation and tropical fruit breeding. Research is also being done on suitability of soils, control of pests and diseases, and improvement and retention of product quality by breeding and cultural techniques.
Processing of Primary Products—The processing and storage of primary products continues to be a high priority area of work, particularly in horticultural and fish-processing fields, and in ensuring adequate protection of quality during transport to market. Research is aimed at maintaining the product in the form it was picked or caught, and in modifying the produce through processing to improve its acceptability to the consumer, or to recover high value components as the final product.
The DSIR is currently investigating the production in New Zealand of orange roughy oil, as a substitute for sperm whale and jojoba plant oils, which are used in liquid wax. This work has included the production of derivatives of the oil for use in the cosmetic, pharmaceutical, and lubricant industries.
In Auckland DSIR scientists are also carrying out a programme of product and process development particularly for subtropical and berry fruits. Products such as fruit nectars, fruit “leathers”, and kiwifruit wine are being developed, in close association with New Zealand industry.
Since 1981 the DSIR has had responsibility for oenological (wine-making) research, but the Ministry of Agriculture and Fisheries is continuing viticultural work.
Energy—Substantial costs of imported energy have encouraged the search for economic sources of energy within New Zealand, and the development of techniques to make better use of the known resources. The department is investigating methods for prospecting new energy sources, developing knowledge for using natural gas, investigating the chemical reactions occurring in the conversion of methanol to gasoline, and studying the suitability of high methanol blends (M85) as a direct automotive fuel.
Work includes explorations for new coalfields, geothermal areas, and petroleum deposits. An investigation into the influence of water in the draw-off of gas from gas fields is of world-wide interest. Work on motor fuels continues, as does the production of gas cylinders, some alternative fuels, and methanol to gasoline catalysts. Studies for new methods for solar cells show promise for New Zealand's future.
Geological assistance continues to be provided to the Ministry of Works and Development and to the Ministry of Energy on hydro-electric power schemes.
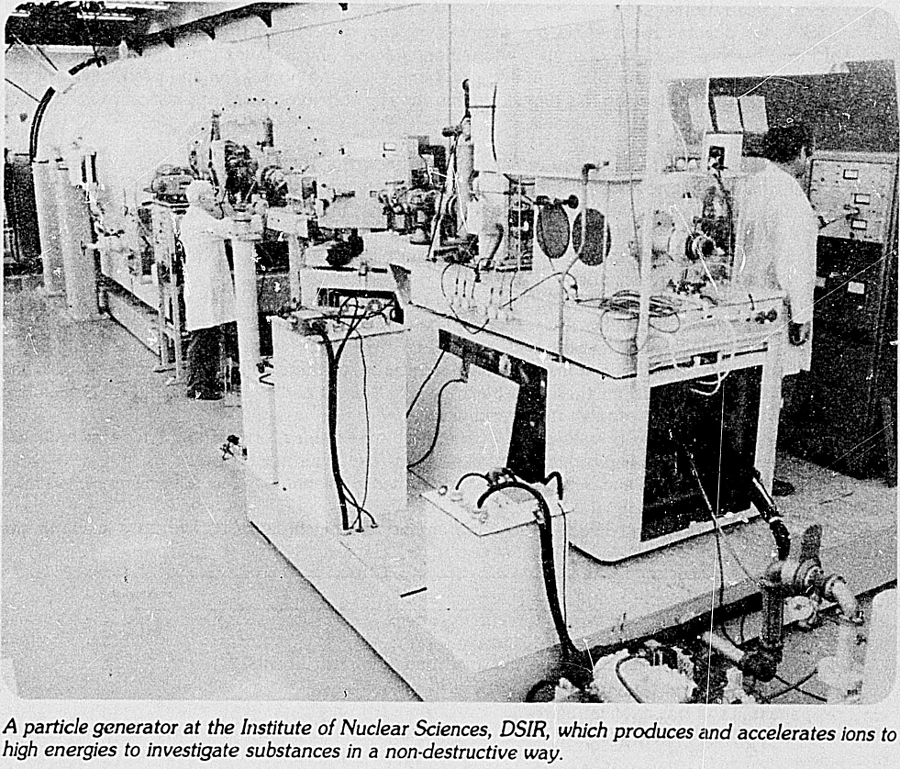
Manufacturing—Increasing pressure in overseas markets, the gradual freeing of import restrictions, and growing consumer awareness within New Zealand, are forcing manufacturers to place much more emphasis on the quality of their goods and services than in the past. Support by the DSIR for manufacturing industries has increased with particular emphasis on the electronics industry, including microprocessor and silicon chip developments.
Industrial divisions within the DSIR, both independently and in conjunction with the New Zealand Organisation for Quality Assurance, have been helping a wide range of industries to improve product quality at all stages of manufacture. Of particular importance has been the identification and correction of problem areas as early as possible in the manufacturing chain. This assistance has been in the form of assessment of companies' ability to produce to contracted quality levels, direct advice on specific quality problems, and the presentation of training sessions on quality control techniques and quality assurance methodology throughout New Zealand. Manufacturing categories in which direct assistance has been given include light and heavy engineering, electronics, meat, dairy, food processing, and pharmaceuticals.
Natural Environment—Development of New Zealand's natural resources has resulted in an increased demand for information and practical advice, which is provided by the DSIR. The department also contributes to studies on the prevention of environmental damage. The Biological Resources Centre, established in 1981 in the DSIR, supplies information used for environmental assessments. Oceanography work supports the fishing industry, and obtains scientific results relating to offshore mineral deposits such as the Chatham Rise phosphorite.
A National Civil Defence Planning Committee on Volcanic Hazards has been established. The aim of the committee is to review volcanic risk throughout New Zealand in the light of current knowledge, to present this in such a manner that Civil Defence contingency plans can be drawn up to be put into action in the event of eruption, and to recommend effective means of monitoring volcanic processes. Several of the department's geologists together with their colleagues in universities have been involved in producing these reports.
The DSIR has devoted most of its physical volcanology research to the volcanoes of Tongariro National Park, because they are obviously intermittently active and because large numbers of people now use their slopes as a winter playground. Since the last war the population and productivity of the rest of the central volcanic region has expanded enormously and some form of physical monitoring of potential eruptive centres is now desirable.
Scientific Services—The Department of Scientific and Industrial Research carries out work in a wide range of fields in addition to those within the preceding categories. For example, DSIR provides the scientific services required by many Government departments in administering their areas of responsibility (areas such as human health, transport, administration of justice, forestry, social science and communications). Centralised laboratory services are supplied to commissions of inquiry, to coroners, and to the police in their investigations of crime.
The DSIR publishes seven research journals, making available internationally the results from both Government department and university research. The department has also begun a series of popular publications, called Alpha, aimed at the better utilisation of research results within the community.
The DSIR maintains the primary measurement standards for the country, and the standardisation and calibration services based on these are being heavily utilised as the New Zealand manufacturing industry seeks to increase its product range and quality.
In collaboration with many private and Government organisations, advice and specialist technical assistance is given to the building, fishing, communications and mineral industries.
The department's activities and organisation are described in its annual report to Parliament, available from the Government Printer.
Grants and contracts paid in 1982–83 to research and allied institutions by DSIR are shown in the following table.
| Institution | Amount |
|---|---|
| $(000) | |
| Universities (grants, contracts and joint funding of instruments) | 588 |
| Research associations— | |
| Building Research Association | 766 |
| Coal Research Association | 366 |
| Concrete Research Association | 217 |
| Dairy Research Institute | 1,438 |
| Fertiliser Manufacturers' Research Association | 319 |
| Heavy Engineering Research Association | 304 |
| Leather and Shoe Research Association | 224 |
| Logging Industry Research Association | 205 |
| Meat Industry Research Institute | 1,280 |
| Pottery and Ceramics Research Association | 66 |
| Research Institute Textile Services | 61 |
| Wool Research Organisation | 958 |
| New buildings | 969 |
| Overseas institutions— | |
| Commonwealth Agricultural Bureaus | 160 |
| International Atomic Energy Agency | 283 |
| Others | 88 |
| New Zealand institutions— | |
| Carter Observatory | 212 |
| Cawthron Institute | 505 |
| Royal Society of New Zealand | 293 |
| Testing Laboratory Registration Council | 265 |
| Other (inc. NZ/US agreement) | 53 |
| Total | 9,620 |
Staff numbers and expenditure by DSIR for 1982–83 in scientific activity classifications are given in the following table.
| Activity | Staff at 31 March 1983 | Expended 1982–83 | ||
|---|---|---|---|---|
| Departmental | Grants | Total | ||
| $(000) | $(000) | $(000) | ||
| Agriculture—Production | 809 | 25,164 | 904 | 26,068 |
| Agriculture—Processing | 99 | 3,124 | 4,899 | 8,023 |
| Energy | 229 | 7,782 | 522 | 8,304 |
| Manufacturing | 298 | 10,263 | 689 | 10,952 |
| Natural environment | 379 | 14,866 | 715 | 15,581 |
| Other activities | 378 | 13,434 | 1,891 | 15,325 |
| Subtotal | 2,192 | 74,633 | 9,620 | 84,253 |
| Public building construction | .. | 10,140 | .. | 10,140 |
| Total | 2 192 | 84,773 | 9,620 | 94,393 |
MINISTRY OF AGRICULTURE AND FISHERIES: Agricultural Research Division—Almost all agricultural research within the Ministry of Agriculture and Fisheries is conducted by the Agricultural Research Division.
The division has 255 scientists, 577 science technicians, 256 other support staff and 9 trainees. The activities of the division are administered from its head office in Wellington by the director and 4 assistant directors through the 5 regional directors and the director of Wallaceville Animal Research Centre. Work is carried out at 7 main centres and stations, 34 smaller stations and areas, and on farmers' properties throughout the country.
The Agricultural Research Division's role is to provide the technical information needed for policy decisions, to help increase the quality and quantity of primary products, improve the economic efficiency of their production and increase the sustainable return from farming.
Increasing attention is being given to problems related to harvesting, processing, and marketing.
The following represent the main areas of research.
Animal—sheep, cattle, deer, goats, rabbits, and opossums (including genetics, reproduction, nutrition, management, and diseases).
Soil and plant nutrition—soil and plant chemistry, fertiliser and trace-element technology, soil and plant tissue testing techniques, fertiliser requirements, modelling, and growth substrates.
Pasture and crop—plant species and cultivar evaluation, management, microbiology, and weed and pest control.
Horticulture and viticulture—cultivar evaluation, cultural practices, management, pollination, water requirements, harvesting methods, quality evaluation and marketing (for most established crops and for a range of new ones, including floricultural and nursery crops).
Irrigation—pasture and crop water-use efficiency and response to irrigation.
Energy—evaluating crops for ethanol production.
The division is also involved in developing new products, production systems, means of harvesting, transport and marketing, and agricultural equipment; in evolving methods of measuring and monitoring product constituents and environmental contaminants, acceptable within New Zealand and internationally; and in providing producers with essential services such as comprehensive soil and plant analyses and the associated fertiliser advice.
Programmes are designed to accommodate local, regional, and national development objectives, as well as to integrate all aspects of crop production (including harvesting, processing, and marketing).
Pasture Research—Pasture research is aimed at achieving the maximum pasture response from the minimum inputs of energy, labour, fertiliser, and capital. Maximum use is made of this production by matching animal requirements as closely as possible to pasture growth. (The calving of dairy cows, for instance, is timed to ensure that maximum milk production coincides with maximum pasture growth, thus minimising the need for expensive conserved fodder, such as hay or silage.)
The use of nitrogen-fixing legumes (such as white clover) obviates the need for nitrogen fertilisers on pasture. Some urea fertiliser is used to stimulate pasture growth at the beginning of the season or to speed recovery from drought. Legumes get their nitrogen-fixing ability from rhizobia (bacteria which infect the roots of legumes). Research identifies the most efficient rhizobia strain for each legume species and ensures that each legume is infected with the right strain. There have been problems establishing new strains in the soil environment.
New legume cultivars, adapted to certain conditions may increase production without large inputs of fertiliser (for example, “Grasslands Maku” lotus will outproduce white clover on acid, low fertility soils). Scientists from the divisions are involved in evaluating new cultivars and species, and in developing management techniques for them.
New Zealand perennial-pasture species and lucerne produce large quantities of protein, surplus to the requirements of grazing ruminants. Techniques for utilising this have been developed at Ruakura Agricultural Research Centre and the process is now used on a commercial scale. Some protein and the associated pigments are extracted and dried into a concentrate that has a high biological value (particularly for egg and chicken production) and fetches a good price in the United States and Japan. The partially deproteinised forage residue is a suitable diet for growing and finishing cattle; or it can be converted into ethanol, for use as an energy source.
Insect pests cause large pasture and crop losses each year. Integrated pest-management systems offer the most effective and economical control—they are being developed for the major pests. The procedures include relating pest numbers and stages of development to plant damage; monitoring changes in pest populations; identifying, selecting, and propagating plant species which are either pest tolerant or resistant (for example, lotus is resistant to grass grub); screening insecticides and identifying the most cost-effective dose levels; identifying and evaluating the significance of natural pathogens; and establishing the extent to which varying farm management procedures can contribute to control.
Fertiliser is increasingly expensive. Concern over the falling quality of superphosphate fertilisers resulted in the adoption of citric-acid-soluble phosphate as a measure of agronomic effectiveness. Research emphasis is on investigating new types of fertiliser and more efficient ways of application.
A comprehensive chemical soil-testing service for farmers is provided by the division. A fertiliser-recommendations bulletin, for use by farm advisers, has been published. It includes many years of research information and produces models of nutrient cycling in New Zealand in order to predict nutrient requirements and thus to formulate its recommendations. Soil, crop, and stock types; rainfall; stocking density, the degree of pasture utilisation, and its carrying capacity are all taken into account, as well as the results of the soil tests.
Several of the division's scientists are researching chemical, cultural, and management systems of controlling weeds—gorse, thistles, ragwort, and hieracium (hawkweed) as well as weeds affecting crops.
Animal Production—Animal production can be improved by genetic selection. Selection research is being carried out at Ruakura, Templeton, Invermay, and Woodlands. A new animal-breeding research station has been established at Rotomahana. It aims to assess the genetic resources of sheep, and to develop breeding strategies by which they can best be exploited to improve the national production and our ability to market sheep products.
Improvement of stock can be achieved by selecting the best animals within a breed, or by crossing breeds (e.g. the high-fecundity Booroola Merino can be crossed with other breeds to increase their lambing percentage). The Ministry of Agriculture and Fisheries is exploring the possibilities of importing genetic material from overseas for use in cross-breeding programmes to improve lambing percentages and carcass composition (for lean-meat production).
The overfat-lamb problem can be overcome by selecting rams whose progeny are fast growing but lean. The division had a working party which made recommendations on problems facing the industry.
“Special interest” field days are organised on a variety of topics. They are a popular and effective way to communicate research results.
Animal Diseases—In the North Island, facial eczema continues to be a problem. Sheep vary in their resistance to it, and can thus be genetically selected for this factor. An enzyme has been identified as being produced by livers that have been damaged by facial-eczema toxin. Concentrations of the enzyme can be related to liver damage, and thus used as the basis for selecting the tolerant sheep.
Animal diseases still cause large losses and are under continuous study. Pneumonia and pleurisy, for example, cause death and carcass down-grading or rejection (perhaps even slower growth rates). A wide variety of micro-organisms have been isolated from field cases, but the exact causes of the diseases are unknown. Researchers at Wallaceville have now managed to reproduce the diseases in experimental animals. This has resulted in the development of vaccines and preliminary field tests are encouraging. Recently, Ruakura scientists have isolated and identified the apparent cause of ryegrass staggers among farm livestock—the toxin (the chemical structure of which was determined in 1983) is caused by an endophytic fungus which infects ryegrass. Fungus and toxin-free ryegrass has been obtained, but it is highly susceptible to attack by the Argentine stem weevil.
Irrigation—Winchmore Irrigation Research Station is investigating the large areas of potentially irrigable land in the South Island, some of which are already under irrigation. Elective use of the water is needed to achieve the most economic return on the investment. Programmed systems of cropping involve combinations of crops which have different peak-water requirements. Various crops are studied, as well as the efficiency of different methods of applying the water and the responses of different soil types to irrigation.
Locally grown crops and potential crops are studied at most of the division's stations. Cultivars are compared, and their fertiliser requirements, yields, and management systems are examined.
Horticulture—Horticulture is increasingly important in primary production. Northland has a particularly large potential horticultural production because of its climate and coils. The division has established a horticultural research and development station at Kerikeri which will focus on the development, culture, management, harvesting, processing, and marketing of existing and new crops in Northland.
The division's main horticultural research centre is established in Levin. The following aspects of horticultural production are at present being investigated: husbandry and management; pest, disease, and weed control; soil and plant analyses; harvesting; and post-harvest physiology. Regional horticultural research stations at Pukekohe, Manutake and Hastings also collaborate in this research.
Container-grown plants are increasing in popularity, necessitating research into plant-nutrient requirements and into soilless media (e.g. peat and sand) and timber wastes (e.g. sawdust and bark). Attempts are under way to gain export-market approval for processed bark as a soilless medium for potplants. A rapid “soil” test kit has been developed to enable growers to measure the nutrients in these soilless substrates, and to adjust the concentrations to get maximum plant growth.
Other Areas of Research—As well as the more traditional forms of farming, the division studies deer, opossum, and goat farming; rabbit farming and control; animal behaviour; beekeeping; environmental contamination; aquatic-weed control; energy farming; forest farming; greenhouse design and construction; fencing; and the development of agricultural and horticultural equipment.
OTHER GOVERNMENT DEPARTMENTS—The Department of Scientific and Industrial Research and the Ministry of Agriculture and Fisheries are responsible for about 70 percent of the total Government science expenditure.
Adding the N.Z. Forest Service (the Forest Research Institute at Rotorua), the Ministry of Transport (the Meteorological Service), and the Ministry of Works and Development (the Water and Soil Division Science Centres at Hamilton, Aokautere and Christchurch), brings this figure to 91 percent of Government research and development expenditure.
An increasing number of other departments do, however, undertake or sponsor research. The departments concerned and the expenditure involved are listed later in this section and more details of their research activities are contained in the appropriate departmental sections.
SCIENTIFIC RESEARCH OUTSIDE GOVERNMENT DEPARTMENTS—The bulk of university funding comes direct from the Department of Education's Vote but university research is funded through the University Grants Committee. A number of Government departments are, however, substantially increasing their contact with the universities by granting research contracts for specific programmes of research.
There are 12 industry research associations which are funded jointly by Government and the industry they serve. The present associations are the Building Research Association, the New Zealand Coal Research Association, the New Zealand Dairy Research Institute, the New Zealand Fertiliser Manufacturers' Research Association, Heavy Engineering Research Association, the Research Institute Textile Services (formerly Launderers, Drycleaners and Dyers), the New Zealand Leather and Shoe Research Association, the Logging Industry Research Association, the Meat Industry Research Institute of New Zealand, the New Zealand Concrete Research Association, the New Zealand Pottery and Ceramics Research Association, and the Wool Research Organisation of New Zealand. The total cost of the Government funding through the Vote—Scientific and Industrial Research for 1982–83 was $6,204,000.
The only major endowed research organisation in New Zealand is the Cawthron Institute at Nelson which was established in 1920 with a bequest of $500,000 under the will of Thomas Cawthron. As the value of the investment of the bequest has declined the institute has received increasing income from other bequests, chemical services earnings, and from a Government grant which comprises about 44 percent of the institute's income.
The organisation of medical research is described in Section 5A, Health and Medical Services, under the headings Medical Research Council and National Health Institute.
THE PRESENT ORGANISATION OF SCIENTIFIC RESEARCH—Decisions on national scientific policies are made by the Minister of Science and Technology, the Cabinet Committee on Science and Technology, and the Cabinet, subject to the guidance and control of Parliament during the annual consideration of the Estimates.
Scientific research in New Zealand is carried out by the research divisions of Government departments, universities, joint Government/industry-funded research associations and private organisations, some of which receive Government assistance. Accurate statistics on proportionate expenditure on research are not yet available but means of obtaining the necessary information are being studied, as the data are needed both for internal use and for OECD comparative purposes. It is certain, however, that the majority of research in New Zealand is funded by Government departments, of which 70 percent is expended by DSIR and the Ministry of Agriculture and Fisheries.
The National Research Advisory Council—Advising the Government on a co-ordinated national policy for scientific research, which takes into consideration the work of all these agencies, is the role of the National Research Advisory Council (NRAC), which was established on 1 April 1964 to advise the Minister of Science and Technology on;
the promotion and development of scientific research in New Zealand;
the planning and co-ordination of scientific research and services in New Zealand, including;
the determination of priorities among activities of Government departments having regard to research done by other organisations;
the provision of scholarships and fellowships and the promotion of the training of research workers;
the association of Government with industry in the promotion of fundamental and applied research, including the promotion of research associations;
the collection and dissemination of scientific information including the publication of reports and journals;
the promotion of co-operation with the governments of, or organisations in, other countries, or with international organisations, in scientific matters;
any other matters that are appropriate for the carrying out of any of the above-mentioned functions, or that are referred to it by the Minister.
The National Research Advisory Council Act 1963 provides for 6 to 9 members, including the chairman, to be appointed by the Governor-General and for 3 ex-officio members, the Director-General of Agriculture and Fisheries, the Director-General of Scientific and Industrial Research, and the Secretary to the Treasury. The council is assisted by 4 advisory committees (each chaired by a council member), covering the fields of primary production, manufacturing and processing, environment and energy, and social sciences research.
By Government directive, all departmental proposals involving the establishment of new scientific activities or the major expansion, reduction, or modification of existing activities are referred to the council for evaluation, as are proposals likely to make substantial demands on scientific manpower or other scientific resources.
Over the past 5 years there has been zero growth in Government-funded research and development. The council has therefore increased efforts to ensure effective use is made of the existing resources, to secure growth in research effort and to maintain a favourable climate for innovation.
In association with the Planning Council, which has undertaken a study of the economic prospects and development opportunities of New Zealand industries, NRAC has worked with a range of people, in the public and private sectors, to review the scientific and technological implications of these developments. While the main focus has been on research with potential economic benefits, the council has ensured that the environmental and social aspects are taken fully into account. This scientific and technological review, regularly updated, forms the basis for the publication of an annual plan for science and technology, which will provide a framework for the continuing adjustment of national scientific and technological policies, programmes, and priorities.
The following tables show the Government expenditure and staffing by department and scientific activity. Expenditure on research contracts ($1,948,000 in 1982–83) and on public buildings is excluded.
| GOVERNMENT EXPENDITURE ON SCIENCE BY DEPARTMENT | ||||||
|---|---|---|---|---|---|---|
| Department | Gross Expenditure on Science | Grants* | ||||
| 1980–81 | 1981–82 | 1982–83 | 1980–81 | 1981–82 | 1982–83 | |
| * Included in gross expenditure in previous columns. | ||||||
| $(thousand) | $(thousand) | |||||
| Agriculture and Fisheries | 35,368 | 44,307 | 46,626 | 1,200 | 1,535 | 1,514 |
| Defence | 3,023 | 3,531 | 3,699 | – | – | – |
| Education | 2,082 | 2,395 | 2,777 | 1,819 | 2,005 | 2,329 |
| Energy | 1,319 | 1,423 | 1,292 | 1,007 | 1,208 | 1,172 |
| Forest Service | 11,733 | 14,624 | 16,314 | 62 | 92 | 97 |
| Internal Affairs | 1,732 | 2,041 | 2,373 | 39 | 3 | 22 |
| Justice | 163 | 224 | 301 | 31 | 47 | 49 |
| Labour* | 1,050 | 329 | 294 | 46 | – | – |
| Lands and Survey | 489 | 526 | 673 | 402 | 423 | 511 |
| DSIR | 61,132 | 73,686 | 83,959 | 6,933 | 8,049 | 9,326 |
| Social Welfare | 352 | 558 | 640 | 54 | 169 | 205 |
| State Services Commission | 143 | 199 | 232 | – | – | – |
| Trade and Industry | 2,978 | 3,049 | 3,118 | 2,682 | 2,679 | 2,676 |
| Transport | 11,819 | 13,452 | 15,759 | – | 97 | 106 |
| Works and Development | 4,831 | 6,046 | 7,080 | – | – | – |
| Research Contracts | 1,164 | 1,882 | 1,948 | … | … | … |
| Total | 139,378 | 168,272 | 187,085 | 14.275 | 16,307 | 18,007 |
| GOVERNMENT EXPENDITURE ON SCIENCE BY SCIENTIFIC ACTIVITY | ||||||
|---|---|---|---|---|---|---|
| Scientific Activity | Gross Expenditure on Science | Grants* | ||||
| 1980–81 | 1981–82 | 1982–83 | 1980–81 | 1981–82 | 1982–83 | |
* Included in gross expenditure in previous columns. †Includes elements from other activities such as Manufacturing and Minerals. | ||||||
| $(thousand) | $(thousand) | |||||
| Agriculture | 54,136 | 66,195 | 72,236 | 4,558 | 5,160 | 6,396 |
| Forestry | 11,980 | 14,400 | 16,074 | 277 | 245 | 317 |
| Fisheries | 5,684 | 7,359 | 8,022 | 36 | 42 | 50 |
| Minerals | 1,144 | 1,352 | 1,466 | 10 | 14 | 12 |
| Manufacturing | 11,577 | 13,708 | 15,288 | 4,069 | 4,396 | 4,583 |
| Building and construction | 2,446 | 2,741 | 3,342 | 984 | 1,083 | 1,149 |
| Transport | 2,441 | 3,091 | 3,447 | 14 | 21 | 19 |
| Natural environment | 30,691 | 36,366 | 41,627 | 570 | 763 | 803 |
| Social sciences | 3,875 | 3,582 | 4,223 | 1,951 | 2,227 | 2,597 |
| Human health | 1,949 | 2,654 | 2,790 | 67 | 79 | 84 |
| Energy† | 8,372 | 10,576 | 11,364 | 1,454 | 1,979 | 1,694 |
| Other scientific services | 3,919 | 4,366 | 5,258 | 285 | 298 | 303 |
| Research contracts | 1,164 | 1,882 | 1,948 | … | … | … |
| Total | 139.378 | 168,272 | 187,085 | 14,275 | 16,307 | 18,007 |
NOTE—The Government expenditure on buildings solely for scientific use is not included in the above tables. The figure for 1980–81 was $4,316,700 for 1981–82, $11,580,700, and for 1982–83, $15,439,000.
| SCIENCE BUDGET STAFF CEILINGS | |||
|---|---|---|---|
| Activity | 1980–81 | 1981–82 | 1982–83 |
| Agriculture | 1,943 | 1,985 | 1,806 |
| Forestry | 461 | 454 | 441 |
| Fisheries | 139 | 149 | 154 |
| Minerals | 44 | 45 | 33 |
| Manufacturing | 327 | 336 | 267 |
| Building and construction | 62 | 56 | 48 |
| Transport | 111 | 110 | 97 |
| Natural environment | 1,048 | 1,058 | 958 |
| Social sciences | 108 | 71 | 71 |
| Human health | 80 | 91 | 70 |
| Energy | 276 | 281 | 240 |
| Other scientific services | 133 | 130 | 107 |
| DSIR Staff not apportioned by activity | … | … | 475 |
| Total | 4 732 | 4 766 | 4 767 |
| GOVERNMENT RESEARCH EFFORT | |||
|---|---|---|---|
| Year Ended 31 March | Gross Expenditure on Science* | Percentage of Total Government Expenditure | Total Staff Employed |
| * Including expenditure on public buildings for science. | |||
| $(000) | % | No. | |
| 1979 | 101,802 | 1.21 | 4,655 |
| 1980 | 116,225 | 1.23 | 4,674 |
| 1981 | 142,531 | 1.27 | 4,732 |
| 1982 | 179,853 | 1.29 | 4,766 |
| 1983 | 202,524 | 1.32 | 4,767 |
The figures of Government expenditure are not complete. They include expenditure on scientific, technical, and support staff of the main science units within the Public Service; grants by these departments to research associations and other agencies; and expenditure on the science buildings and equipment of these departments. They do not include expenditure on scientific research and servicing in the trading areas of the State services such as New Zealand Railways and the Post Office or by the Reserve Bank; in the universities; the grants made to the non-government sector by the New Zealand Energy Research and Development Committee; the assistance to industry for research provided by the Development Finance Corporation ($4,845,000 in 1982–83); the allocation of Golden Kiwi lottery funds for scientific research ($350,000 in 1982–83); and the revenue foregone through taxation concessions to individuals and companies for expenditure on research or donations to research foundations (Income Tax Act 1976).
From the most recent figures available, OECD has calculated research and development expenditure as a percentage of gross domestic product (GDP) to give the following country comparisons.
| Country | Year | Percentage of GDP |
|---|---|---|
| Australia | 1978–79 | 1.0 |
| Belgium | 1979 | 1.4 |
| Canada | 1982–83 | 1.7 |
| France | 1980 | 1.9 |
| Japan | 1980–81 | 2.2 |
| Netherlands | 1980 | 2.0 |
| New Zealand | 1979–80 | 0.9 |
| Norway | 1980 | 1.3 |
| United Kingdom | 1978–79 | 2.2 |
| United States | 1982 | 2.6 |
| West Germany | 1979 | 2.4 |
| Source: OECD Science Resources Newsletter, 1983 | ||
FURTHER INFORMATION—A number of publications in which research is published are mentioned in the text. Other information on Government-funded research is included in the annual reports to Parliament of the Government departments involved, and in the separate reports of some research divisions and institutions.
Report of the Department of Scientific and Industrial Research (Parl. paper G. 21).
Report of the National Research Advisory Council (Parl. paper G. 20).
DSIR's First Fifty Years—DSIR (1976).
Report of the Ministry of Agriculture and Fisheries (Parl. paper C. 5).
Report of the Director-General of Forests (Parl. paper C. 3).
See also the Forest Research Institute report and the annual reports of the research associations.
Table of Contents
In New Zealand, as in most other countries, both the Government and local authorities have recognised the importance of the arts in the life of the community and have provided increasing support.
The traditional sources of assistance to the arts in New Zealand are the Queen Elizabeth II Arts Council, which had its origins in 1947 as a cultural fund; the New Zealand Literary Fund, administered by the Department of Internal Affairs, which was established in 1946; the New Zealand Historic Places Trust; and the National Art Gallery and Museum. More recently established are the New Zealand Authors' Fund, which compensates authors for the loss of royalties through having their books loaned out by libraries; and lottery profits schemes to assist art galleries, museums, and cultural organisations with capital projects. The New Zealand Authors' Fund and the lottery profits schemes are administered by the Department of Internal Affairs.
The following table shows grants made in 1983–84 by the Government and from lottery profits.
| Group | Government Assistance | Lottery Grant |
|---|---|---|
| $(thousand) | ||
| Queen Elizabeth the Second Arts Council | 3,145 | 2,650 |
| New Zealand Literary Fund | 101 | 35 |
| National Art Gallery and Museum | 2,956 | 200 |
| New Zealand Historic Places Trust | 744 | 600 |
| New Zealand Authors' Fund | 240 | – |
| Cultural Facilities Scheme | – | 400 |
| Art Galleries and Museum Scheme | – | 350 |
| Crafts Council of New Zealand | – | 100 |
| Total | 7,186 | 4,335 |
A major contribution to cultural activity is the New Zealand Symphony Orchestra which is administered by the Broadcasting Corporation.
The Ministry of Foreign Affairs has been involved in fostering the arts through its Cultural Exchange Programme, established in 1974. Modest in financial terms, the programme's objective is to facilitate exchanges in all branches of the arts, including music, theatre, painting, crafts, sculpture, and writing, so as to enable New Zealanders to gain a closer first-hand knowledge of the culture of other countries. At the same time, it is hoped that the programme will stimulate the already active cultural scene in New Zealand and through tours and exhibits abroad extend overseas knowledge of New Zealand's cultural achievements. In planning and implementing the programme the Ministry of Foreign Affairs works closely with such organisations as the Queen Elizabeth II Arts Council, art galleries, and other groups and individuals.
Financial contributions are also made to arts organisations through the Ministry of Recreation and Sport. For a list of awards available in literature and the arts refer to pages 996–997 of this Yearbook.
QUEEN ELIZABETH II ARTS COUNCIL—The Queen Elizabeth the Second Arts Council was formed in 1964 to promote the practice and appreciation of the arts in New Zealand.
The council assists individuals working in the arts, and incorporated and non-profit making organisations, which have consistent levels of artistic achievement, maintain sound standards of management and promotion, and can offer career opportunities to trained and gifted people. Activities which are professional in character and standard thus receive priority for financial support.
In 1974 the Queen Elizabeth II Arts Council Act was amended and the Arts Council was expanded to include 3 regional councils and a national network of community arts councils. A council for Maori and South Pacific Arts was also established in 1978. These new statutory provisions have led to the introduction of a range of programmes which complements the existing pattern of arts support. Schemes designed to assist the arts at a community level including the preservation and extension of Maori and Polynesian cultural traditions now absorb 11 percent of the council's annual grant.
For the year ended 31 March 1984 the council received funds totalling $5,795,000, of which $2.65 million was provided from New Zealand Lottery Board profits. Forty-seven percent of these funds were used to support 6 professional theatres, 4 regional orchestras, 1 modem-dance, 1 ballet, and 1 professional opera company.
The maintenance of training schools and grants for individual artists absorbed a further 18 percent of the council's funds, and about 7 percent of the grant was used to assist touring exhibitions and performances, and a variety of practical support programmes.
NEW ZEALAND FILM COMMISSION—The New Zealand Film Commission was established in November 1978 and its functions, powers, and duties are defined in the New Zealand Film Commission Act 1978. Administration expenditure is met by the Department of Internal Affairs. The special allocation of $1.8 million announced in the 1982 Budget for film investment is being reduced proportionately over a 5-year period.
Each year, the Film Commission offers financial assistance to a considerable number of film projects, both for development and for production. Details are provided in its annual report.
INTERIM CONSERVATION COMMITTEE—In September 1979 an Interim Advisory Committee for the Conservation of Cultural Property was appointed to advise the Minister for the Arts on all conservation matters for cultural property. Specific areas include paintings and works of art, books and documents, films, photographs, machinery, and textiles.
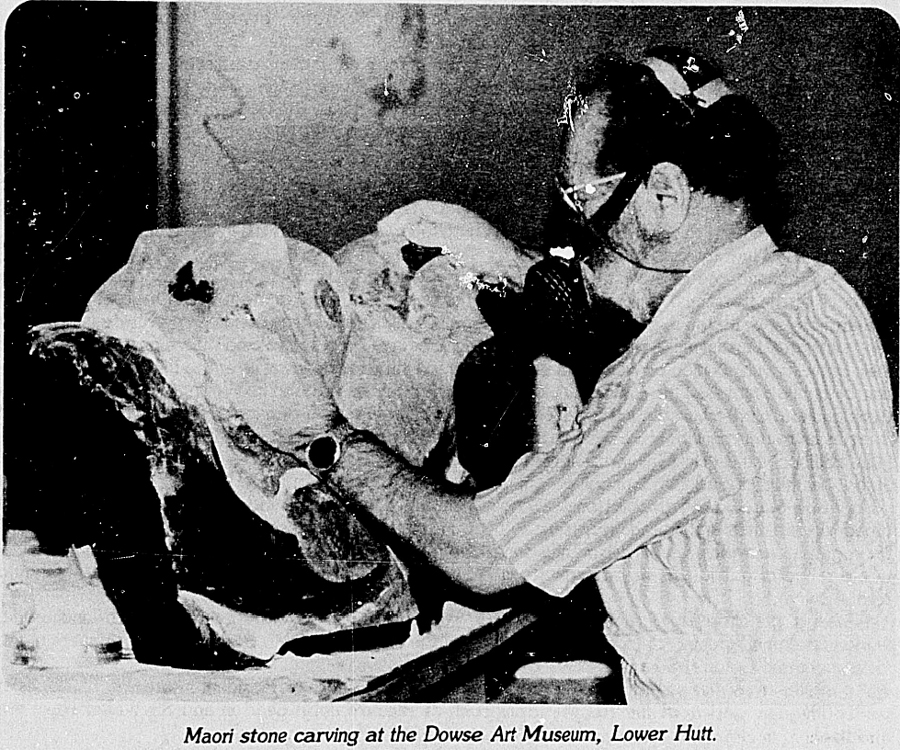
ART GALLERIES AND MUSEUMS—In 1973 a fund was set up to subsidise capital works of art galleries and museums. Subsidies are made available by the General Purposes Distribution Committee of the New Zealand Lottery Board on the recommendation of an advisory committee. A small proportion of the fund is made available each year to major metropolitan museums in Auckland, Wellington, Christchurch, and Dunedin, to enable them to assist smaller museums in their areas. Assistance is given to the New Zealand Art Gallery Directors Council to enable it to help smaller public galleries.
NATIONAL MUSEUM—Situated in Wellington, the National Museum was established in 1865 and is the only Government-financed museum in New Zealand. Under the National Art Gallery, Museum and War Memorial Act 1972, its functions are to acquire, preserve and display collections of material related to New Zealand and the Pacific.
The National Museum's collections specialise in Maori and Pacific culture, colonial history, entomology, plants, birds, and marine animals. There is also a large specialist research library and a photographic archive containing over 84 000 glass plate and other historical negatives.
Museum research staff provide a servicing function for other Government departments and the public in ethnological, biological and historical research (including antiquities under the 1976 Antiquities Act).
The museum publishes research results in National Museum Records, National Museum Bulletin, National Museum Miscellaneous Series, and other Government publications.
General booklets and brochures are also produced in connection with educative and display functions.
PROTECTION OF ANTIQUITIES AND ARCHAEOLOGICAL SITES—The Antiquities Act 1975 came into force on 1 April 1976 and includes provisions controlling the sale of Maori artifacts within New Zealand. All artifacts found after 1 April 1976 are deemed to be prima facie the property of the Crown. In addition, there are export controls on a wide range of items of historical significance; Maori artifacts; chattels relating to the European discovery, settlement or development of New Zealand; written and printed matter; works of art, reproductions, prints, films and sound recordings; type specimens of animals, plants and minerals; meteorites; remains of extinct fauna; and items of shipwreck.
Whereas the Antiquities Act is essentially concerned with “portable” objects, the Historic Places Act 1980, deals more specifically with the protection of archaeological sites. It is necessary to obtain the consent of the New Zealand Historic Places Trust before damaging, destroying, or modifying any archaeological site or undertaking a scientific archaeological investigation of any site.
To enable the purchase of Maori artifacts and historic paintings, the Government continues to make grants to the National Museum and to the National Art Gallery.
NATIONAL ARCHIVES—National Archives selects, preserves, and makes available records of state which are of permanent value to the people of New Zealand. These records are drawn from various areas of government; Parliament, Ministers of the Crown, departments, the armed services, the court, commissions of inquiry, and other agencies.
The prime purpose of keeping archives is set out in the Archives Act 1957. Archives preserve evidence of the functions, policies, transactions and decisions of government which have affected New Zealanders' lives, liberties, property, rights and status as citizens. These documents provide information on events, great and small, which have influenced the course of New Zealand's development. To ensure their preservation, National Archives has been granted statutory control over the disposal and destruction of public records. The National Archives headquarters is situated in Wellington, and branches in Auckland and Christchurch are to open soon. In other centres records are cared for by non-governmental libraries or museums which are designated as “official repositories”.
In addition the Local Government Act 1974 enables National Archives to advise and assist local authorities in preserving their archives.
As at 31 March 1984 the National Archives held an estimated 17 958 linear metres of written and typed documents, and in addition some 400 000 maps and plans as well as a large number of photographs and pictures. The holdings constitute the largest source of unpublished information on a whole range of public and private activity in New Zealand—political, social, economic, scientific, and technological.
Amongst the more significant and frequently consulted archives are those relating to land usage, works, foreign affairs and defence, immigration and the New Zealand Company, and the papers of the Governors and Colonial Secretaries.
An interesting series of historical records are those from the British Resident in the Bay of Islands in the 1830s. The papers of famous politicians such as Richard John Seddon and Sir Walter Nash are also held.
In carrying out its function of making archives available, National Archives arranges and describes the archives and provides reading and reference services. Those who make use of these services include public servants (in the course of their administrative duties), historians, geographers, economists, sociologists, scientists, students, lawyers, genealogists, and private citizens.
National Archives headquarters are located in the Air New Zealand building, 129–141 Vivian Street, Wellington. The postal address is National Archives, P.O. Box 6148, Te Aro, Wellington.
NEW ZEALAND HISTORIC PLACES TRUST—The New Zealand Historic Places Trust is empowered under the Historic Places Act 1980 to protect and foster public interest in historic places and areas, and to assist others in the preservation of such places.
The trust is governed by a board of trustees which includes representatives of various interested organisations. The board has the power to issue protection notices to prevent demolition or damage to buildings which have historical significance or architectural qualities which merit preservation.
Professional staff work in the trust headquarters in Wellington and regional archaeologists are employed in Auckland and Otago. More than 15 000 members provide financial and practical support, and regional committees operate locally to advance the trust's aims.
Over 3000 nineteenth century buildings have been classified by the trust's Building Classification Committee, and recently the committee has turned its attention to early twentieth century buildings.
Under the Historic Places Act 1980 the trust has responsibility for a number of historic buildings and sites, some of which are open to the public. In addition the trust administers properties owned by other organisations and a number of historic reserves. Technical advice and financial assistance is given to private owners to assist in the preservation of historic buildings and sites. The trust also maintains a register of archaeological sites, and has the authority to investigate sites and prohibit unauthorised tampering.
To stimulate public interest the trust has marked many historic places with plaques and noticeboards. It also publishes leaflets, a quarterly magazine on historic preservation in New Zealand and books, including 2 major works on historic buildings of the North and South Islands.
FURTHER INFORMATION—Further information on support for the arts and cultural activities will be found in the following publications.
Report of the Department of Internal Affairs (Parl. paper. G. 7).
Report of the Queen Elizabeth the Second Arts Council of New Zealand (Parl. paper G. 11).
Report of the New Zealand Historic Places Trust (Parl. paper G. 10).
Report of the Board of Trustees, National Art Gallery, National Museum, and National War Memorial (Parl. paper G. 12).
Report of the New Zealand Film Commission (Parl. paper G. 19).
Report of the New Zealand Lottery Board (Parl. paper G. 7B).
Directory of Official Information—(Department of Internal Affairs)—State Services Commission.
In general, New Zealand is well served with libraries and the book stocks and circulation figures compare favourably with those of other English-speaking nations. In most centres the local authority maintains a public library.
Under the auspices of the New Zealand Library Association, a comprehensive system of inter-library co-operation has been developed, particularly in the use of resources by means of inter-library loans.
NATIONAL LIBRARY OF NEW ZEALAND—By the National Library Act 1965, the Alexander Turnbull Library, the General Assembly Library, and the National Library Service were combined to form the National Library of New Zealand, which now operates from 12 centres throughout the country. A permanent National Library building of 23 800 square metres is now under construction near Parliament Buildings in Wellington, and is scheduled for completion later this decade. It will bring together the scattered Wellington units of the National Library and allow the development of additional services to the public.
The National Library is responsible for maintaining and developing a central reference and lending collection as a national resource in many subjects and as support stock for major subject collections, such as medicine where there is no national subject library. User Services hold major reference material and has access through OASIS to overseas data bases. The SATIS service, with regional offices in Auckland, Wellington, and Christchurch, has its headquarters in User Services and the National Library is steadily increasing its stock of technical material for business and industry. On 31 March 1983 the central collections of the National Library comprised over 531 000 volumes, together with 111 000 volumes of periodicals, and 800 000 microfiche.
The New Zealand Bibliographic Unit is responsible for producing New Zealand National Bibliography, a comprehensive microfiche listing of books, pamphlets, art prints, music scores, sound recordings, maps and serials, and Index to New Zealand Periodicals, as well as the maintenance of the national agencies for international standard serial and book numbers. The New Zealand Bibliographic Network is an on-line database containing descriptions of books published all over the world. The system was introduced into the National Library in 1982 and will begin networking to other libraries in 1984, allowing them to share the work of listing library materials.
The library also acts as purchasing agent for most Government department libraries operating within the Public Account and provides a cataloguing, reference, and library advisory service for departments.
The National Library operates a Conservation Unit for the preservation and restoration of items of intrinsic value. A Microfilm Production Unit within the library also carries out a programme of filming current and older, deteriorating newspapers to preserve their information content and make them more widely available.
General Assembly Library—The General Assembly Library was established in 1858 and provides library services for Parliament. The chief librarian is guided by a committee of members of Parliament headed by the Speaker.
Since 1903 the library has been the depository for books, periodicals, etc., published in New Zealand. It receives regularly copies of all New Zealand newspapers and about 1900 New Zealand periodicals. Back files of both are very extensive. It also has one of the largest collections in the country of books or pamphlets relating to New Zealand. Several New Zealand newspapers are indexed daily.
The library, which holds over 500 000 volumes, has its strongest collections in subjects necessary to provide information for members of Parliament in their legislative duties. These include economics, politics, administration and law, biography, and history. The National Documents Collection of overseas government publications, mainly from English-speaking countries, is available for public use. It is particularly strong in parliamentary papers and debates as well as publications of international organisations such as the United Nations, the OECD, and the EEC.
Alexander Turnbull Library—The Alexander Turnbull Library is a research library responsible for maintaining a comprehensive collection of library material relating to New Zealand, together with other specialist research collections. The original collection of 55 000 volumes bequeathed by Alexander Horsburgh Turnbull (1868–1918) has been increased to approximately 195 500 volumes of books and newspapers, 2000 metres of periodicals, 2300 metres of manuscripts, 39 000 pictures of which 20 000 are original paintings and drawings, 21 000 maps, 447 000 photographic prints and negatives, and 13 000 reels of microfilm. The collections are augmented regularly by purchases, bequests, and donations from individuals and organisations.
The Trustees of the National Library in 1966 designated the Turnbull Library as the national collection of printed materials relating to New Zealand, and the library now receives all New Zealand publications under the compulsory deposit provision of the Copyright Act. Supporting the collections of printed books, periodicals, and newspapers are extensive collections of private papers and archives, paintings, drawings and prints of historical and topographical interest, maps, photographs, and sound recordings. The library also possesses research collections on the Pacific and the Antarctic with particular emphasis on history, early voyages, and ethnology. The general collections are strong in English literature, early printed books, and the development of the art of printing. The collection on John Milton and the mid-seventeenth century, a particular interest of Alexander Turnbull, is of international standing.
Extension Service—Public libraries are assisted by the Extension Service, which was formed in 1979 from the Country Library Service. Extension Service centres are situated in Hamilton, Palmerston North, and Christchurch, supported by a Wellington headquarters unit.
Public libraries outside major metropolitan areas, which operate a free library service maintained at a reasonable standard of efficiency, are eligible for a variety of supplementary services. These include exchanges of books from bookvans, a request and information service, bulk loans of books from the centres, loan collections including large print books, spoken word cassettes for the disabled, books for adult new readers, advisory services, and the provision of seminars and workshops. People in rural areas, where no other library service is available, may use many of the above services at the annual rate of $25 for 50 books from one of the nine bookvans. Hospital patients and prison inmates also have access to many of the above services.
Libraries receiving books and services from the Extension Service at 31 March 1983 included 162 free public libraries, 669 small community libraries and groups, and 125 other libraries and institutions. The number of books lent to these libraries totalled 339 000 and 143 000 books were lent on request and in loan collections during the year.
School Library Service—Established in 1941 the School Library Service Division of the National Library is responsible for providing library support services for children and young people through the school system. It operates from a total of 12 district centres, of which the largest is in Auckland, and a head office in Tawa, Wellington. A request and information service for both fiction and non-fiction of a recreational and cultural nature, as well as for specific topics, is offered to all schools and long-term loans of books are made to enhance the collections in primary school libraries.
The objectives of the School Library Service are to provide all New Zealand children with access to library resources which stimulate them into reading further by meeting their individual needs, interests and abilities, and to facilitate the development of school-based library services.
Over two million books are circulated annually through the reference services which include an individual service to children enrolled with the primary section of the Correspondence School.
School Library Service advisers assist school staff with the development, promotion and use of school library resource centres.
Publications include School Library Review, a quarterly specialising in reviews of children's literature and articles on topics of interest to those working with children in school libraries, a variety of subject lists, and guides and manuals of a specialist nature.
Library Schools—Since 1980, library education has been given by 2 schools at Victoria University of Wellington and at Wellington Teachers College.
International Statistics on Libraries—The following tables compiled from published UNESCO and other statistics show New Zealand's position in relation to other English-speaking countries as regards library resources, borrowers, and book circulation.
| PUBLIC LIBRARIES | ||||||
|---|---|---|---|---|---|---|
| Country | Population in Year of Library Census* | Year | Number of Libraries | Book Stock, Number of Volumes | Microforms | Loans to Users |
* Mid-year estimates †199 Systems covering 276 libraries. ‡Source: UNESCO Statistical Yearbook 1983. §Source: United Nations Population and Vital Statistics Report. | ||||||
| (million) | (000) | (000) | (000) | |||
| New Zealand | 3.1 | 1979 | 199† | 6,314 | 29,389 | |
| Canada‡ | 23.9 | 1980 | 791 | 45,602 | 1,206 | 126,893 |
| United Kingdom‡ | 55.9 | 1980 | 160 | 131,338 | 835 | 637,367 |
| United States‡ | 218.1§ | 1978 | 8,456 | 439,486 | 15,286 | 986,715 |
| Sweden‡ | 8.3 | 1980 | 408 | 39,031 | 121 | 77,351 |
| NATIONAL, TERTIARY, SPECIAL, AND SCHOOL LIBRARIES | |||||||
|---|---|---|---|---|---|---|---|
| Country | Population in Year of Library Census* | Year | Type of Data | Category of Library | |||
| National | Tertiary | Special | School | ||||
* Midyear estimates. †Source: UNESCO Statistical Yearbook 1983. Population figures for Canada and United States were taken from the United Nations Population and Vital Statistics Report. ‡In 1981. §In 1979. ||In 1977. ¶In 1978. | |||||||
| (million) | |||||||
| New Zealand | 3.1 | 1979 | Libraries | 1 | 39 | 241 | 1,487 |
| Volumes (000) | 4,803 | 3,816 | 2,517 | 8,443 | |||
| Canada† | 23.3 | 1977 | Libraries | 1‡ | 255 | 8,692 | |
| Volumes (000) | 896‡ | 43,601 | 49,412 | ||||
| United Kingdom† | 55.9 | 1980 | Libraries | 1 | |||
| Volumes (000) | 14,550 | ||||||
| United States† | 218.1 | 1978 | Libraries | 3 | 3 122§ | 1 143|| | 70,854 |
| Volumes (000) | 20,799 | 519 895§ | 19 832|| | 531,470 | |||
| Sweden† | 8.3 | 1980 | Libraries | 1 | 10 | 13¶ | 413 |
| Volumes (000) | 2,000 | 27,919 | |||||
CENSUS OF LIBRARIES, 1979—The Census of Libraries for the year ended 31 March 1979 covered a total of 2044 libraries. These comprised 276 public libraries, of which 67 were suburban branches; the National Library; 39 libraries of tertiary education institutions; special libraries comprising 88 libraries of Government departments, 12 special/public libraries of the Armed Forces, and 141 other libraries attached to local bodies (mostly medical libraries), commercial firms, learned societies, interest groups, and charitable organisations; and finally, 1487 school libraries.
The 1979 Census recorded the establishment of computer technology in New Zealand library services. This has brought new dimensions to these services, with the facilities for computerising various facets of library administration and for accessing overseas and local bibliographic data bases.
In the period 1974 to 1979, the number of volumes held by public libraries increased by 37 percent, membership by 11 percent, and circulation by 32 percent. During the year 1978–79, public libraries had an average of 5 books in stock per member and an average circulation of 23 books per member. In addition to books and periodicals, public libraries had gramophone records, tapes, cassettes, art prints, and music scores available to borrowers. The number of library staff increased to 2469 from 1860 in 1974, and those holding library qualifications numbered 409 compared with 353 five years previously.
Tertiary institution libraries included the libraries of 6 universities (with 1 closely associated special library), 8 teachers' colleges, 7 theological colleges, and 12 technical institutes, of which 4 were polytechnics, and 4 community colleges. The number of books and periodicals held by these libraries increased by 39 percent to 3.8 million in the intercensal period, and staff from 819 to 988.
The number of books and periodicals held by Government department libraries increased only slightly from 1.4 to 1.5 million in the 5-yearly period and staff from 271 to 281.
The remaining special libraries held a similar-sized stock of books and periodicals to that in the 1974 Census, but their staff numbers showed an increase of 78 percent to 453, nearly half of them working part-time.
In addition to books and periodicals, the National Library, tertiary institution libraries, and special libraries held stocks of microforms, photographs, maps, research reports, pamphlets, filmstrips, films, and slides. Some libraries held items specific to the function of their controlling body, such as patents, standards, and art originals.
In 1979 the coverage of school libraries was extended to smaller primary schools, those designated Grade VA (minimum 156 pupils). As in 1974, Grade VI and above primary schools, as well as intermediate and secondary schools were surveyed. Coverage was extended because Grade VA primary schools had become entitled to a library/multi-purpose room under the Department of Education building code in the intercensal period. The number of primary schools surveyed increased to 963 from the 1974 figure of 581. Similarly, there were more intermediate schools (141 compared with 126) and secondary schools (383, up from 360). Books and periodicals held by schools numbered 8.2 million at 31 March 1979 compared with 4.8 million at the same date in 1974. As well as books, library stock of schools included tapes, cassettes, gramophone records, films, and filmstrips.
The census of book clubs or commercial libraries carried out in 1973–74 was not repeated in 1979, mainly because of response difficulties and the comparatively small number of volumes recorded.
Although previously the Census of Libraries has been taken at 5-yearly intervals, it will not be taken in 1984.
The following tables summarise the results of the 1979 Census. The full results are given in a report Census of Libraries 1979 available from the Government Printing Office.
| PUBLIC LIBRARIES—BOOK STOCK AT 31 MARCH 1979 | |||||||||
|---|---|---|---|---|---|---|---|---|---|
| Class of Library | Number of Library Systems | Own Stock | Total* | For Reference Only (included in Own Stock) | Country Library Service Stock | ||||
| Adult | Junior | ||||||||
| Rental | Free Fiction | Free Non-fiction | Fiction and Non-fiction | Adult | Junior | ||||
* A number of libraries could not separately identify categories of adult and junior bookstock and their holdings are represented in the total column only. †Includes only the recreational sections of special/public libraries located at RNZAF bases. ‡199 library systems covering 276 libraries. | |||||||||
| In centres with an estimated population served of— | (thousand) | ||||||||
| 50 000 and over | 12 | 405 | 381 | 1,537 | 780 | 3,384 | 66 | 17 | 1 |
| 20 000–49 999 | 22 | 148 | 165 | 515 | 346 | 1,228 | 49 | 36 | 13 |
| 10 000–19 999 | 31 | 106 | 112 | 274 | 200 | 693 | 7 | 37 | 8 |
| 5 000–9 999 | 44 | 135 | 64 | 115 | 98 | 412 | 3 | 55 | 13 |
| 3 000–4 999 | 23 | 41 | 22 | 30 | 27 | 128 | – | 21 | 4 |
| Under 3 000 | 41 | 77 | 36 | 26 | 27 | 168 | – | 19 | 5 |
| Subtotal | 173 | 911 | 780 | 2,497 | 1,478 | 6,012 | 128 | 185 | 44 |
| Armed forces† and penal institutions | 26 | 36 | 14 | 6 | 2 | 64 | 2 | 7 | – |
| Grand total | 199‡ | 948 | 793 | 2 503 | 1 480 | 6 077 | 130 | 192 | 45 |
| PUBLIC LIBRARIES—CIRCULATION DURING YEAR ENDED 31 MARCH 1979 | |||||||||||
|---|---|---|---|---|---|---|---|---|---|---|---|
| Class of Library | Number of Libraries | Issues from Own Stock | Issues from Country Library Service Stock | Library Interloans | |||||||
| Adult | Junior | Total* | |||||||||
| Rental | Free Fiction | Non-fiction | Periodicals | Adult | Junior | Lent to Other Libraries | Borrowed from Other Libraries | ||||
* A number of libraries could not break down circulation figures into categories shown and these are absorbed into total circulation figures. †199 library systems covering 276 libraries. | |||||||||||
| In centres with an estimated population served of— | (thousand) | ||||||||||
| 50 000 and over | 12 | 2,301 | 1,082 | 2,139 | 188 | 3,265 | 15,095 | 36 | – | 6 | 24 |
| 20 000–49 999 | 22 | 1,350 | 785 | 1,650 | 192 | 1,861 | 6,733 | 109 | 23 | 22 | |
| 10 000–19 999 | 31 | 977 | 641 | 920 | 124 | 1,102 | 3,765 | 181 | 35 | 1 | 19 |
| 5 000–9 999 | 44 | 730 | 341 | 373 | 37 | 474 | 2,030 | 213 | 71 | 1 | 14 |
| 3 000–4 999 | 23 | 207 | 72 | 87 | 4 | 137 | 520 | 76 | 18 | 2 | 5 |
| Under 3 000 | 41 | 159 | 39 | 40 | 1 | 80 | 336 | 63 | 21 | 4 | |
| Subtotal | 173 | 5,724 | 2,959 | 5,209 | 547 | 6,920 | 28,480 | 677 | 168 | 11 | 88 |
| Armed forces and penal institutions | 26 | 40 | 6 | 2 | 2 | 1 | 53 | 12 | 4 | ||
| Grand total | 199† | 5 764 | 2 966 | 5 211 | 549 | 6 921 | 28 532 | 689 | 168 | 11 | 92 |
| NATIONAL, TERTIARY. AND SPECIAL LIBRARIES—BOOK STOCK AND CIRCULATION | |||||||
|---|---|---|---|---|---|---|---|
| Class of Library | Number of Libraries | Book Stock at 31 March 1979 | Circulation During Year Ended 31 March 1979 | ||||
| Books | Periodicals | Total | Items Lent to Library Users | Items Lent to Other Libraries | Items Borrowed From Other Libraries | ||
| * Special and public libraries located at army camps and navy bases and technical sections of libraries located at RNZAF bases were classified as special libraries. | |||||||
| (thousand) | |||||||
| National Library | 1 | 4,486 | 317 | 4,803 | 2,584 | 21 | 1 |
| Libraries in universities, etc. 39 | 2,874 | 942 | 3,816 | 2,421 | 38 | 36 | |
| Special libraries— | |||||||
| Learned societies, local bodies, commercial firms, etc. | 141 | 518 | 357 | 875 | 447 | 13 | 24 |
| Government departments and associated organisations | 88 | 604 | 880 | 1,484 | 293 | 60 | 46 |
| Armed forces* | 12 | 152 | 6 | 158 | 84 | 1 | 3 |
| Total | 281 | 8 633 | 2 502 | 11 135 | 5 829 | 133 | 111 |
| SCHOOL LIBRARIES—BOOK STOCK AND CIRCULATION | ||||||
|---|---|---|---|---|---|---|
| School Type | Number Of Schools | Book Stock at 31 March 1979 | Circulation During Year Ended 31 March 1979 | |||
| Books | Periodicals | Education Department Publications | Total | |||
| (thousand) | ||||||
| Primary (Grade VA and above) | 963 | 4,434 | 18 | 140 | 4,592 | 13,968 |
| Intermediate | 141 | 884 | 4 | 21 | 909 | 2,934 |
| Secondary | 383 | 2,924 | 12 | 6 | 2,942 | 4,295 |
| Total | 1 487 | 8 243 | 33 | 167 | 8 443 | 21 197 |
NOTE: Because of rounding, totals in the previous 4 tables may differ slightly from the sum of the individual items.
FURTHER INFORMATION—Further information on libraries will be found in the following publications. The select bibliography of New Zealand books, at the end of this Yearbook, may also be found informative.
Census of Libraries 1979—Department of Statistics.
Report of the Trustees of the National Library of New Zealand (Parl. paper G. 13).
UNESCO Statistical Yearbook.
The Broadcasting Corporation of New Zealand was created by the Broadcasting Act 1976 and came into existence on 1 February 1977. It united under 1 central board, 4 independent statutory bodies—TV1, TV2, Radio New Zealand, and the Broadcasting Council of New Zealand—which had been established by the Broadcasting Act 1973. In their place, 3 programme services (TV1, TV2, and Radio New Zealand) and a Central Services Division were established. Under the Broadcasting Amendment Act 1979 the 2 television services were amalgamated on 16 February 1980 into a single television service—Television New Zealand, which is responsible for producing and scheduling programmes on both the TV1 and TV2 networks of the corporation. The Central Services Division has since been redesignated the Corporate Services Division. In the exercise of its duties and functions the Act stipulates that the corporation “acts as a trustee of the national interest” and “operates its services with the maximum independence”, and provides programmes which “inform, educate, and entertain”. The announced intention of the 1976 legislation was to restore the ultimate accountability of the broadcasting system to Parliament through the Minister of Broadcasting, to improve administrative efficiency and financial viability, and to establish a tribunal with powers to control some aspects of broadcasting, including the establishment of further private radio stations. At the same time it was intended to preserve those features of the preceding system which were thought to be advantageous to listeners and viewers in general.
Earlier forms of control dating back to the introduction of the first “wireless” stations in New Zealand were the Radio Broadcasting Company of New Zealand Ltd. (1925–31); the Broadcasting Board (1931–36); the National Broadcasting Service and the National Commercial Broadcasting Service (1936–45); the New Zealand Broadcasting Service (1945–62); and the New Zealand Broadcasting Corporation (1962–75). Information on these organisations appears in the relevant Yearbooks.
BROADCASTING CORPORATION OF NEW ZEALAND—The corporation consists of not less than 7 and not more than 9 members appointed by the Governor-General on the recommendation of the Minister of Broadcasting. Since 1977 the chairman of the corporation has served in the capacity of an executive chairman. There are Directors-General for Radio New Zealand and Television New Zealand. The secretary of the corporation is in executive charge of all centralised functions.
In general terms the corporation's responsibility is to carry on public broadcasting services and to develop, extend, and improve them in the public interest. In doing so, it must have regard for the general broadcasting policy of the Government. The Minister may direct the corporation in writing although not on specific programmes or complaints, the gathering and presentation of news and current affairs material, the editorial content of the New Zealand Listener, and personnel matters. Any such direction by the Minister must subsequently be gazetted and laid before Parliament.
The corporation is required to maintain standards of accuracy, impartiality, decency, and good taste; and to this effect must promulgate rules governing programmes and advertising. The Independent Broadcasters' Association is represented on the committee formulating these rules. Additionally the corporation is charged with maintaining a New Zealand identity in its programmes, with respecting the privacy of the individual, and with avoiding the coincident presentation on the 2 television channels of programmes of a like nature. Formal complaints from the public alleging breaches of the prescribed programme standards, may be laid with the corporation or private radio stations. Cases of alleged unfair treatment or invasion of privacy are referred to the Complaints Committee, which was established by the 1982 Broadcasting Amendment Act. All complaints must receive proper consideration, and complainants dissatisfied with the decisions of these bodies may refer to the Broadcasting Tribunal for final adjudication.
The corporation is responsible for the publication of the New Zealand Listener and for the administration of the New Zealand Symphony Orchestra. Up to two-thirds of the cost of operating the orchestra may be met by Government appropriation.
The corporation is empowered and expected to promote and encourage artistic, cultural, and educational development in the community.
BROADCASTING TRIBUNAL—A tribunal of 3 members, appointed by the Governor-General on the recommendation of the Minister of Broadcasting, is empowered to consider applications and grant warrants for additional radio stations, public or privately-owned, and to renew existing warrants. The tribunal has no authority over any shortwave station. Neither may it grant a warrant for any television station additional to TV1 and TV2 without the express permission of the Minister of Broadcasting. In October 1982, the Government authorised the tribunal to call applications for a private television warrant to operate during morning hours on the TV1 network.
The tribunal is also empowered to consider and determine complaints which in the opinion of the complainant have not been satisfactorily dealt with by the Broadcasting Corporation, a private radio station or the Complaints Committee. The tribunal must have regard for Government policy on broadcasting and must comply with any written direction from the Minister which does not derogate from its duty to act judicially. Any such direction must subsequently be gazetted and laid before Parliament.
RADIO—Radio New Zealand provides programmes for 67 medium-wave broadcasting stations, and 2 short-wave transmitters of the External Services Division, the latter having a number of assigned frequencies. Of the 60 medium-wave stations, 40 broadcast advertising material. No advertising is broadcast on Sundays, Christmas Day, or Good Friday. All Radio New Zealand stations maintain a daily 24-hour service, apart from shutdowns for maintenance purposes once a month, between 11.15 p.m. and 5.30 a.m. The shutdowns are staggered to give the minimum loss of coverage to listeners.
Coverage of Short-wave Service—The External Services Division of Radio New Zealand broadcasts the National (Home Service) Programme (including news and magazine programmes in Maori, Tongan, Samoan, Niuean and Cook Island Maori) to the South Pacific from 1800 to 2100 hours Universal Coordinated Time (U.C.T.) daily.
One frequency beams the National Programme to Australia and Melanesian countries, and another beams it to the South Pacific Islands until 1200 hours U.C.T.
Radio New Zealand's Overseas Programme Unit supplements this with weekly dispatches of taped programmes; news, current affairs, talks and comment including vernacular programmes.
Local Broadcasting—Whereas in many Commonwealth countries local broadcasting has only recently begun, in New Zealand it is in many ways the most important part of the national system. Local stations not only provide a wide range of entertainment and information programmes, but also play a valuable social role through new community services and participation in cultural activities. Decentralisation of administration enables local radio stations to be highly responsive to the communities they serve.
Private Broadcasting Stations (Non-commercial)—Four private non-commercial stations are now in operation. One (Pioneer Radio) is operated by the Otago Radio Association Incorporated and has been broadcasting since 1922 from studios located in Dunedin. It broadcasts nightly from 1800–2230 hours and on Sunday mornings from 0900–1230. The other three stations are owned by Radio Rhema Inc. with studios in Christchurch, Wellington, and Nelson. Broadcasting hours are 0600–2400 hours daily.
Private Broadcasting Stations (Commercial)—The first warrants for private commercial broadcasting stations were issued on 30 June 1970 to Radio Hauraki and Radio i, both located in Auckland, and transmissions began on 26 September 1970 and 31 October 1970 respectively. Radio Waikato was issued with a warrant on 31 July 1970 and began transmission on 2 November 1970, followed by Radio Whakatane with a warrant dated 24 November 1970 which began transmission on 30 June 1971, and Radio Otago with a warrant dated 8 June 1971 which came into operation on 20 November 1971. Later warrants enabled Radio Avon in Christchurch and Radio Windy in Wellington to begin operations late in 1973, Radio Pacific in Auckland in April 1979, Radio Central Otago in mid-1980, and Radio Foveaux (Invercargill) and Radio Manawatu (Palmerston North) in mid-1981. With the introduction of FM broadcasting in 1983, 4 private FM stations were granted warrants to broadcast: 2 in Auckland (Magic FM and Stereo FM) and 2 regional stations, Radio Hawke's Bay and Waikato/Bay of Plenty FM. Advertisements are not permitted to be broadcast on Sundays, Christmas Day, or Good Friday. If Anzac Day falls on other than a Sunday, advertisements are not permitted before 1300 hours.
Independent Broadcasters Association—In 1970, holders of warrants for private commercial radio stations formed a federation which was subsequently approved by the Broadcasting Authority in August 1971. The general objects of the federation are to conserve the rights and interests of the members in broadcasting. The name was subsequently changed to the Independent Broadcasters Association (Incorporated).
TELEVISION—In August 1958 the Government decided that the 625-line system would be the standard for any television service in New Zealand. The service began regular transmissions in Auckland in 1960, in Christchurch and Wellington in 1961, and in Dunedin in 1962.
Colour telecasts (using the PAL system) began in a limited way in October 1973, and conversion of the remaining transmission equipment was completed by March 1975. By March 1984 approximately 88 percent of licensed television sets were colour sets.
Extension to Coverage—Television coverage has been steadily extended to all areas of New Zealand. By the end of 1983 the first television programme (the TV1 Network) was being disseminated by six 100 kW transmitters, 1 50 kW, 18 of from 1 to 25 kW, and 393 installations of less than 1 kW. These transmissions reach 99.9 percent of the population.
Transmission of the second television programme (the TV2 Network) began from 300 kW transmitters at Auckland and Christchurch on 30 June 1975. By the end of 1983 it was carried by five 300 kW transmitters, two 100 kW, 11 of from 1–25 kW, and 150 installations of less than 1 kW. Approximately 97.5 percent of the population was covered by second programme transmitters.
Second programme transmitters for other areas are to be provided progressively until identical coverage is achieved for both programmes.
At the 1981 Census of Population over 67 percent of households in permanent private dwellings had colour T.V., and 34 percent had black and white T.V.—in some cases, as a second set.
Television Programmes—The BCNZ Television New Zealand Service operates 2 national networks in colour—the TV1 network which originates programmes from the Avalon television complex in Lower Hurt and the TV2 Network which originates programmes from the Auckland studios. TV1 transmits some 88 hours of programmes per week and TV2 some 75 hours. Five days are commercial. Sundays are non-commercial on each network. Fridays are non-commercial on TV1 and Saturdays are noncommercial on TV2.
Television New Zealand (TVNZ) has production studios at Auckland (3), Avalon (3), Christchurch (2), and Dunedin (2). Colour outside-broadcast units are stationed at each of the 4 main centres (Auckland 3, Wellington 2, Christchurch 1, Dunedin 1) and are deployed for live coverage of sport and programme production from towns and cities in both islands. Comprehensive film facilities are installed at each centre. Electronic news gathering equipment is available in Auckland and Wellington, and is being installed in Christchurch and Dunedin.
The change in the administrative organisation of TV1 and TV2 into a unified 2-channel operation from 16 February 1980 provided the opportunity to give a wider range of programming to viewers and to rationalise the use of facilities by the channels. The specific BCNZ objectives were to provide the kind of complementary programming which a two-channel co-operative system could offer the public; offer wider scope for regional television; eliminate competitive practices which annoy viewers; cater to minority and cultural audiences at more suitable times than had previously been possible; and to fulfil the social, cultural, and educational potential of television. Local output for the 1982–83 financial year provided 2584-hours of transmission time. This content included drama, news, and current affairs, light entertainment, religion, service programmes, and sport. The balance of programme output is purchased from overseas, mainly from Britain, the United States, and Australia. The use of satellite links permits same-day presentation of world news items and live telecasts of significant overseas events, particularly in the field of sport.
NEW ZEALAND SYMPHONY ORCHESTRA—The New Zealand Symphony Orchestra was formed in 1946 as the National Orchestra and adopted its present title in 1975. It is a full symphony orchestra widely known for the high standard of its public concerts as well as its performances over the air. Distinguished guest conductors and celebrity artists from other countries, along with resident soloists and New Zealand choirs, appear regularly with the orchestra. As a national orchestra, its tour programme is one of the most extensive in the world, involving some 15 000 miles of internal travel annually. The playing strength is 89 players, which enables the orchestra to undertake the complete symphonic repertoire.
In 1974 the orchestra undertook its first overseas tour to 3 Australian cities. Its second, in February 1980 was to Hong Kong. As well as presenting nationwide concerts the orchestra has given many studio recordings for both radio and television. It has also made several commercial recordings. There is also a small training orchestra of string players which was established in 1961 as a scheme to develop promising students wishing to gain experience of the orchestral profession. The NZSO also organises an annual season by the National Youth Orchestra which was established in 1959.
NEW ZEALAND LISTENER—Programmes and advance information for national television channels and radio stations are published in the weekly journal, the New Zealand Listener, first issued on 30 June 1939. The circulation of the Listener as at the end of March 1984 was 364 940. The readership is estimated to be 1,200,000. As well as containing programme information the Listener occupies a special place in New Zealand journalism as a leading periodical dealing with the current scene. It publishes interviews, articles, and reprints of broadcasts as well as fiction, poetry, and criticisms. Through its editorial and correspondence columns, the Listener provides a forum for serious public discussions on important issues.
FINANCES—There are two principal sources of revenue, licence fees and radio and television advertising. Since 1975 the proportion of total revenue contributed by licence fees has been steadily diminishing, and at the end of the 1983 financial year it accounted for only 21.3 percent of the total. Under the 1976 Broadcasting Act, licence fees are collected by the New Zealand Post Office and paid by the Post Office into the Broadcasting Account, established under the Act, through which all the BCNZ's income and payments are handled. The corporation subsequently repays to the Post Office the costs which the latter has incurred in collecting the fees.
Gross revenue from licence fees and from advertising for the latest 5 financial years is shown in the following table.
| Item | 1978—79 | 1979–80 | 1980–81 | 1981–82 | 1982–83 |
|---|---|---|---|---|---|
| $(thousand) | |||||
| TV licence fees | 31,719 | 33,600 | 35,404 | 38,083 | 38,572 |
| Radio advertising | 16,621 | 20,493 | 25,958 | 33,338 | 40,462 |
| TV advertising | 43,749 | 55,310 | 68,805 | 90,997 | 115,617 |
| Total | 92,089 | 109,403 | 130,167 | 162,418 | 194,651 |
LICENCES—As from 1 October 1971 the radio licence, which stood at $3 a year, was abolished and the monochrome television licence raised from $13 a year to $20. A colour television licence fee of $35 was introduced on 1 November 1973. On 1 January 1975 licence fees were increased to $27.50 (monochrome) and $45 (colour).
The following table summarises licences for television receivers issued by districts.
| At 31 March | Auckland | Wellington | Christchurch | Dunedin | Total* | Number of Sets Covered by Hirers' Licences† |
|---|---|---|---|---|---|---|
* Including other. †Included in preceding figures. ‡Includes 499,210 colour sets in 1979, 583 183 in 1980, 655 348 in 1981, 733 447 in 1982, and 784 483 in 1983. | ||||||
| 1979 | 298,516 | 222,356 | 119,360 | 69,035 | 859 885‡ | 150,618 |
| 1980 | 300,340 | 228,738 | 116,883 | 70,121 | 883 021‡ | 166,939 |
| 1981 | 295,218 | 223,316 | 118,955 | 69,270 | 887 463‡ | 180,704 |
| 1982 | 302,656 | 229,501 | 117,278 | 69,296 | 913 837‡ | 195,106 |
| 1983 | 303,156 | 227,427 | 121,324 | 67,837 | 921 724‡ | 201,980 |
FURTHER INFORMATION—Data collected on radio and television broadcasting in the 1980–81 Census of Services is available in Section 22B of this Yearbook. Further information on broadcasting will be found in the following publications.
Report of the Broadcasting Corporation of New Zealand (Parl. paper F. 3).
Report of the Broadcasting Tribunal (Parl. paper F. 4).
Monthly Abstract of Statistics—Department of Statistics.
Directory of Official Information—State Services Commission.
NEWSPAPERS—Although printing in New Zealand began peacefully enough with the production of hymns in the Maori language, the early years of the New Zealand press appear to have been stormy, acrimonious, and marked by frequent shortages of the basic necessities of newspaper production. The first newspaper to be printed in New Zealand was the New Zealand Gazette of 18 April 1840, but like most early New Zealand newspapers it was short-lived. Much of the newspaper writing of early days was powerful, dogmatic, sometimes virulent and irresponsible, and the Government or other target of attack reacted with equal force. One way of closing down a rival or too-critical newspaper was to buy up the press on which it was printed. When this method of silencing was used against the Auckland Times in 1842 the proprietor continued publication with the aid of a job-lot of assorted old type, a load of coarse paper, and a mangle. Another paper appeared for some weeks printed on red blotting paper, and others appeared on occasion on green or blue paper or in varying paper sizes or qualities. Appeals for supplies of paper sometimes appeared in advertisements and one paper made a despairing appeal for treacle, apparently an essential ingredient in inking-rollers. One Auckland paper was made to yield to a unique form of forceful persuasion. In 1865 the New Zealander published an article which gave offence to the Navy, whereupon a large number of sailors passed a hawser through the newspaper office and back over the roof, and threatened to overturn the building unless there was a full retraction.
Since 1840 about 500 different newspapers have appeared in New Zealand, but relatively few have survived. The oldest surviving newspaper is the Taranaki Herald, started in 1852. A number of the large metropolitan dailies still in existence were started in the 1860s.
By world standards, New Zealand has had (and continues to have) a large number of newspapers for the size of population. In the past, difficulties of geography and the scattered nature of the centres of population prevented any daily newspaper achieving a national circulation. Today, aided by distribution during the dead hours before dawn, the morning papers published in Auckland and Wellington are, between them, able to cover much of the North Island, while the Christchurch morning paper covers much of the South Island. Nevertheless, the provincial press remains fairly strong. New Zealand still has a relatively large number of local papers published daily, weekly, or 2, 3, or 4 times a week which, by offering a detailed coverage of local news, are complementary to the newspapers published in the main centres rather than in competition with them. Most of the provincial dailies are evening papers.
There are 7 daily newspapers in the 4 main metropolitan areas, with a total circulation of approximately 722 412. In the smaller cities and provincial towns there are 25 daily newspapers, and 2 published 5 days a week. New Zealand also has about 116 other newspapers, of which 99 publish 1 to 3 times a week.
There are 590 magazines, journals, and newsletters that accept advertising published in New Zealand. Of these, 93 specialise in agriculture, dairy products, farming, horticulture, fishing and forestry; 52 specialise in banking, finance, economics, commercial, data processing, local government, legal, office equipment, and insurance; 44 specialise in architecture, building, construction, engineering, environment, real estate and transport; 37 specialise in medical, dental, and health; 27 specialise in industrial, manufacturing, refrigeration, printing, publishing, packaging, fuel and energy; and 41 are consumer-oriented or of general interest. (Source of these 2 paragraphs: Media Planner 1984—85).
In the following table, based on the UN Statistical Yearbook, the total circulation of daily and non-daily (including Sunday) newspapers is shown per 1000 inhabitants for selected countries.
| Country | Year | Copies per 1000 Inhabitants | |
|---|---|---|---|
| Dailies | Non-dailies | ||
*1978 †1976. | |||
| Australia | 1979 | 336 | 619 |
| Canada | 1979 | 241 | 553 |
| Denmark | 1979 | 367 | 31* |
| France | 1977 | 205 | 291 |
| Germany, West | 1979 | 517 | 545 |
| Italy | 1977 | 97 | .. |
| Japan | 1979 | 569 | .. |
| Netherlands | 1979 | 325 | 67† |
| New Zealand | 1979 | 345 | .. |
| USSR | 1977 | 396 | 261 |
| United Kingdom | 1977 | 410 | .. |
| United States | 1979 | 282 | 192 |
Advertising—The advertising revenue of newspapers and periodicals is shown in the following table for the latest available years.
| Type of Publication | 1975–76 | 1976–77 | 1978–79 | 1981–82 |
|---|---|---|---|---|
| $(thousand) | ||||
| Newspapers, daily | 58,561 | 69,876 | 87,074 | 152,306 |
| Newspapers, other than daily | 6,640 | 8,056 | 10,367 | 21,323 |
| Magazines, journals, and periodicals | 3,237 | 2,784 | 4,446 | 6,897 |
CINEMAS—The Census of Cinemas for the year ended 31 March 1981 formed part of the Department of Statistics' 5 yearly series of integrated economic censuses. For this reason, any comparison with previous censuses, the last of which was for the year ended 31 March 1975, should be treated with caution.
Previous censuses covered the activities of all motion pictures screened in New Zealand and included many small operators, such as clubs, associations, religious societies, etc., whose main activities are now classified to other areas within the New Zealand Standard Industrial Classification. Most of these small operators were previously classified as screening “odd-days per week”.
Included in the latest Census of Cinemas were 154 cinemas with a total seating capacity of 89 364. During the year ended 31 March 1981 there were 84 775 performances at these cinemas and admissions totalled 12 177 305, or approximately 3.87 per head of mean population. The total income of the cinemas, plus that of the ancillary units servicing them, amounted to $37.4 million, of which $26.5 million represented admissions. The term “ancillary unit” covers administrative and general servicing units such as head offices, stores, and laboratories, and also the activities of confectionery bars at many cinemas.
The coverage of the census is summarised in the following table and this is followed by tables giving census values in accounting and economic terms. Further information on motion picture distribution and projection collected in the 1980–81 Census of Services is available in Section 22B of this Yearbook.
| Census Coverage | |
|---|---|
| Cinemas— | No. |
| 250 seats or less | 19 |
| 251 to 500 seats | 57 |
| 501 to 750 seats | 40 |
| 751 to 1 000 seats | 27 |
| over 1 000 seats | 11 |
| Total establishments (cinemas) | 154 |
| Total seating accommodation | 89,364 |
| Average seating accommodation per cinema | 580 |
| Total performances during the year | 84,775 |
| Average attendance per performance | 144 |
| Ancillary units servicing cinemas | 70 |
| Paid employees and working proprietors or partners | 1,617 |
| Census Values in Accounting Terms | ||
|---|---|---|
| Expenditure— | $(000) | |
| Materials, including fuel and power | 8,923 | |
| Employers contributions to pension and welfare schemes and accident compensation levies | 447 | |
| Salaries and wages | 8,227 | |
| Depreciation | 333 | |
| Indirect taxes (land tax, road user charges, licence fees, and rates) | 616 | |
| Insurance | 137 | |
| Interest, etc. | 103 | |
| Other expenditure | 13,232 | |
| Total expenditure | 32,018 | |
| Stocks— | ||
| Closing stocks | 429 | |
| Less opening stocks | 339 | |
| 90 | ||
| Income— | ||
| Interest, etc. | 470 | |
| Rents, etc. | 2,794 | |
| Admissions | 26,484 | |
| Other income | 7,565 | |
| Total income | 37,313 | |
| Net Profit— | ||
| Total income adjusted for stock change | 37,403 | |
| Less total expenditure | 32,018 | |
| 5,385 | ||
| Less salaries of working proprietors or partners | 238 | |
| Net profit | 5,147 | |
| Census Values in Economic Terms (NZSNA) | ||
|---|---|---|
| Operating surplus— | $(000) | |
| Total income adjusted for stocks | 37,403 | |
| Less interest, etc., received | 470 | |
| 36,933 | ||
| Total expenditure | 32,018 | |
| Less interests, etc., paid | 103 | |
| 31,915 | ||
| Operating surplus | 5,018 | |
| Value added— | ||
| Operating surplus | 5,018 | |
| Employer contribution | 447 | |
| Salaries and wages | 8,227 | |
| Depreciation | 333 | |
| Indirect taxes | 616 | |
| Total value added | 14,641 | |
Classification by Statistical Areas—In the following table, cinemas have been classified by statistical areas; further information has been withheld to avoid disclosure of confidential information.
| Statistical Area | Number of Cinemas | Seating Accommodation | Average Seating Capacity Per Cinema | Performances During the Year | Attendances During the Year | Average Attendance Per Performance | Admission Charges | Average Admission Charge |
|---|---|---|---|---|---|---|---|---|
| No. | No. | No. | No. | No. | $(000) | $ | ||
| Northland | 6 | 3,062 | 510 | 2,333 | 295,837 | 127 | 607 | 2.05 |
| Central Auckland | 36 | 20,864 | 580 | 26,259 | 3,758,296 | 143 | 9,124 | 2.43 |
| South Auckland-Bay of Plenty | 27 | 13,401 | 496 | 11,890 | 1,688,988 | 142 | 3,291 | 1.95 |
| East Coast | 2 | 9 227 | 659 | 7 467 | 1 148 034 | 154 | 2,214 | 1.93 |
| Hawke's Bay | 7 | |||||||
| Taranaki | 5 | |||||||
| Wellington | 27 | 18,367 | 680 | 15,349 | 2,332,496 | 152 | 5,139 | 2.20 |
| Marlborough | 1 | 14 111 | 543 | 14 436 | 1 965 364 | 136 | 4,122 | 2.10 |
| Nelson | 4 | |||||||
| Westland | 1 | |||||||
| Canterbury | 20 | |||||||
| Otago | 12 | 6,178 | 515 | 4,852 | 615,444 | 127 | 1,352 | 2.20 |
| Southland | 6 | 4,154 | 692 | 2,189 | 372,845 | 170 | 635 | 1.70 |
| Total | 154 | 89 364 | 580 | 84 775 | 12 177 304 | 144 | 26,484 | 2.18 |
Classification by Urban Areas—Statistics for the principal urban areas have, where necessary, been combined to avoid disclosure of confidential information.
| Urban Area | Number of Cinemas | Seating Accommodation | Average Seating Capacity Per Cinema | Performances During the Year | Attendances During the Year | Average Attendance Per Performance | Admission Charges | Average Admission Charge |
|---|---|---|---|---|---|---|---|---|
| No. | No. | No. | No. | No. | $(000) | $ | ||
| Northern Auckland | 2 | 16 744 | 644 | 21 350 | 3 333 459 | 156 | 8,101 | 2.43 |
| Western Auckland | 3 | |||||||
| Central Auckland | 21 | |||||||
| Southern Auckland | 6 | 2,730 | 455 | 3,708 | 329,011 | 89 | 783 | 2.38 |
| Upper Hutt Valley | 1 | 17 866 | 616 | 20 702 | 3 189 650 | 154 | 7,523 | 2.36 |
| Lower Hutt Valley | 1 | |||||||
| Wellington | 9 | |||||||
| Christchurch | 13 | |||||||
| Dunedin | 5 | |||||||
| Total | 61 | 37 340 | 612 | 45 760 | 6 852 120 | 150 | 16,408 | 2.39 |
New Zealanders are fortunate in living in a country which provides a wide choice of recreation and sporting activities in a relatively small area.
Many competitive recreational activities are organised through local clubs, some of which are affiliated to national organisations. Promising players, performers, and artists have opportunities to reach national levels in their activities. In many sports the ultimate level to be reached is to represent New Zealand at the Olympic and Commonwealth Games.
Opportunities and facilities exist for those interested in outdoor education and recreation. The Youth Hostels Association of New Zealand operates hostels in centres ranging from Kaitaia in the north to Invercargill in the south. In the more remote areas the New Zealand Forest Service and several tramping clubs have built huts.
Short courses in outdoor recreation are run by the Outward Bound School in Queen Charlotte Sound, and the Outdoor Pursuits Centre near Turangi. Educational authorities and some voluntary organisations have established outdoor recreation and education camps throughout the country where young people are encouraged to enjoy and make use of the natural environment.
Social education programmes have been introduced into many secondary schools and this has involved the introduction of a wider range of recreational activities, with encouragement to students to continue with these activities after leaving school.
Most of the tertiary education institutions have facilities and staff available to serve the physical recreation needs of the students.
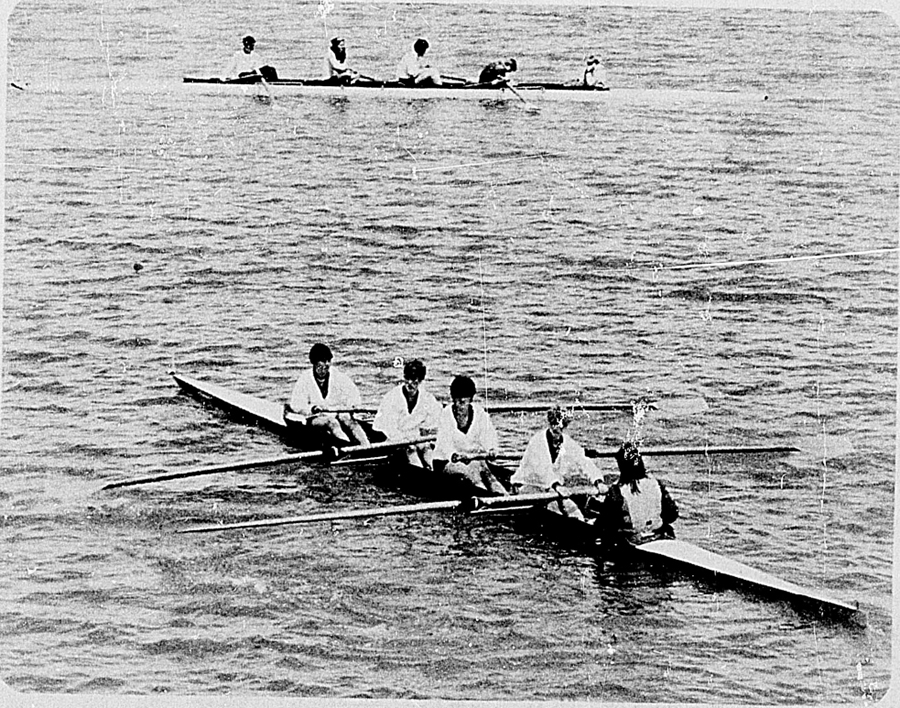
Council for Recreation and Sport—In November 1972 a Minister of Recreation and Sport was appointed. The Recreation and Sport Act 1973 provided for the establishment of a Ministry of Recreation and Sport and a New Zealand Council for Recreation and Sport. The general functions of the council are to promote the total wellbeing of, and the fullest use of leisure by, New Zealanders; to advise the Government on matters relating to recreation and sport; to investigate developments in recreation and sport, and disseminate knowledge and information about such developments. The sum of $5.1 million was expended through the ministry during 1982–83 to support community recreational activities, together with an additional $3.15 million made available by the New Zealand Lottery Board to provide funds for community development activities and community facilities.
During 1982–83 Government moneys provided for the recreation and sport programme, $3,172,310 was distributed through local authorities to assist local activities, and $1,126,000 was allocated to national recreational organisations. Subsidy assistance was provided for the salaries of 8 new recreation advisors employed by local authorities and $219,500 was provided to national youth organisations by way of capitation and physical welfare grants. A further $66,580 was provided to assist special recreational and sport projects.
Youth Assistance—The Youth Branch of the Department of Internal Affairs' Recreation, Arts and Youth Division administers the following programmes which are designed to assist young people in practical ways.
Detached Youth Worker Funding Scheme—During 1982–83 community organisations and local authorities were provided with grants amounting to $455,000 to employ and train detached youth workers.
Detached youth workers generally work with young people whose basic needs are not adequately met by existing services.
Youth Initiatives Fund—The fund is administered by a national advisory panel comprising 7 young people, and provides financial assistance for projects which are of a social, cultural, recreational or community nature.
During 1982–83 the fund attracted 82 applications and grants totalling $122,000.
Youth Services Distribution Committee—Administered by the New Zealand Lottery Board, the committee makes money available to youth organisations and other groups of young people. During 1982–83 the committee was allocated $500,000, 40 percent of which was distributed as salaries for youth workers.
New Zealand is party with other Commonwealth nations in the Commonwealth Youth Programme. Established in 1973 the Commonwealth Youth Programme is a six-point plan of practical action: operating regional youth development centres, administering youth bursaries and study fellowships, investigating applied research, developing youth information services, assisting local youth projects, and supporting youth programmes. In New Zealand the Commonwealth Youth Programme is administered by a National Liaison Committee serviced by the Department of Internal Affairs. The National Liaison Committee is composed of representatives from the Department of Internal Affairs, the Ministry of Foreign Affairs, the Department of Education, the Department of Maori Affairs, and the National Youth Council.
The New Zealand Mountain Safety Council and the New Zealand Water Safety Council, which are also serviced through the Ministry of Recreation and Sport, received allocations from lottery profits of $306,000 and $400,000 respectively in 1982–83. These councils work closely with 41 local mountain safety committees and 54 local water safety committees in promoting the safe use of New Zealand's mountain, bush, and water areas.
Fishing—A wide variety of salt-water fish abound around the coasts, in bays and harbours, and in both North and South Islands many streams, rivers, and lakes provide excellent rainbow and brown trout fishing.
Sizes of trout vary from district to district depending on environment, climate, food available, and angling pressure. Average trout weights are as follows:
North Island—rainbow 1 kg and brown 2 1/4; kg in the Rotorua lakes, rainbow 2 1/4; kg and brown 2 kg in Lake Taupo, rainbow and brown 1 kg in river systems;
South Island—rainbow and brown 1–1 1/2; kg in lake systems, sea-run brown 2 1/4; kg in West Coast rivers, sea-run “Quinnat” salmon 5 1/2; kg in the east coast rivers, land-locked salmon 1–1 1/4; kg.
Big-game Fishing—The warm waters off the east coast of the North Island provide some of the best surf, line, and scuba fishing in the world. The main bases for line fishing from charter boats are at Whangaroa, Bay of Islands (Russell, Otehei Bay, and Waitangi), Tutukaka, Mercury Bay (Whitianga), and Tuaranga (Mayor Island).
The most prized catches are broadbill, black marlin, striped marlin and blue marlin, while other types of big-game fish found in New Zealand waters are mainly tiger shark, hammerhead shark, mako shark, thresher shark, kingfish (yellow tail), and tuna. The best catches are usually made in February but fishing is good from December to April.
Shooting and Hunting—The principal game birds are duck, swan, pheasant, quail, geese, and chukor, but the sport is limited, the main season usually extending for about 6 weeks from early May.
There are fewer restrictions on stalking—no limit on the number of game animals that can be taken, no licence required, and the season is open all year round. However, commercial hunting operations have severely limited the numbers of some game animals (deer of several species, elk, chamois, and thar) that once abounded in the forest and alpine regions. Wild pigs, goats, and wallaby are still numerous in several areas of the country. For tourists and inexperienced hunters, a guide is essential for the success of a hunting expedition.
Skiing—The skiing season in New Zealand extends from mid-July to late October in the North Island and from early July to late September in the South Island. With the operation of ski planes and helicopters in the Mount Cook region, very good spring skiing is available to experienced skiers in the alpine snowfields in and around the Mount Cook National Park.
In the North Island the main skiing centre is Mount Ruapehu in the Tongariro National Park. Equipment and instruction is available for skiers, and facilities include 4 chairlifts, 2 T bars, and many rope tows. A new ski field has been developed at Turoa on the southwest slopes of Mount Ruapehu and facilities include 3 chairlifts and 1 T bar. Mount Egmont is the North Island's other principal ski area.
In the South Island the principal areas are Coronet Peak (Queenstown), Mount Hutt, Tekapo, Lake Ohau, Porter Heights, Treble Cone (Wanaka), and the Mount Cook region (access by ski plane or helicopter). Coronet Peak, 19 km from Queenstown, has the best powder snow conditions in New Zealand, lying on extensive undulating slopes of varying gradients. Facilities at commercial ski fields are of a high standard and equipment and professional instruction is available at reasonable rates.
Mountaineering and Tramping—The proximity of mountain and forest to the main centres of population encourages tramping in New Zealand. Both North and South Islands have appealing tramping routes and parties can set out to enjoy the beauty and challenge of lonely country.
In the Waitakere and Hunua Ranges near Auckland, the central ranges of the North Island, at Mount Egmont, Tongariro National Park, and the Urewera Area, and in the South Island's Fiordland and Golden Bay, there are numbers of tracks with high mountain traverses and passages through beautiful scenery.
Walking—Since the New Zealand Walkway Commission was established in 1976 considerable emphasis has been placed on the opening up and development of walking tracks in both urban and rural areas. While priority is given to walkways near urban centres, the commission is also developing long-distance routes including a 3-day hutted walk from Taranaki to the Wanganui River already open and proving very popular, an east-west walkway across the North Island, and long-distance routes in Nelson and Southland. The growing number of pleasant walks in urban and rural settings is designed to provide enjoyment for both the casual stroller and the more dedicated walker.
Horse Racing—Horse racing is a popular sport and is a source of interest and excitement to the punter; of income to the racing clubs; and of taxation to the government. Private bookmaking is illegal. On course betting is by totalisator and off-course betting through the Totalisator Agency Board (TAB), which has branches in every centre.
The following table shows numbers of racing days, races, and other data for the latest 3 years. The racing year ends on 31 July, although horse racing takes place throughout the year. Fuller information, including totalisator duty, etc. is included in Section 27, Public Account Taxation.
| Item | Galloping | Trotting | |||||
|---|---|---|---|---|---|---|---|
| 1981 | 1982 | 1983 | 1981 | 1982 | 1983 | ||
| Racing days | No. | 321 | 322 | 325 | 193 | 194 | 200 |
| Races | No. | 3,113 | 3,151 | 3,155 | 1,916 | 1,933 | 1,993 |
| Stakes | $(000) | 11,261 | 12,007 | 13,083 | 6,162 | 6,970 | 7,610 |
| Average per race | $3,617 | 3,810 | 4,146 | 3,216 | 3,605 | 3,818 | |
| Totalisator turnover— | $(million) | ||||||
| On Course | 94.8 | 100.8 | 103.5 | 53.7 | 60.4 | 66.4 | |
| With TAB | 265.6 | 309.6 | 346.7 | 118.5 | 131.9 | 152.5 | |
| 360.4 | 410.4 | 450.2 | 172.2 | 192.3 | 218.9 | ||
| Amount paid in dividends | 289.4 | 328.0 | 359.5 | 138.3 | 153.7 | 174.8 | |
Greyhound Racing—Greyhound racing is growing in popularity and the Racing Amendment Act 1980 extended off-course betting through the TAB to greyhound meetings. Thirty full totalisator meetings for greyhounds were held during the year ended July 1983. Data on greyhound racing are shown in the following table.
| Item | Year Ended 31 July | ||
|---|---|---|---|
| 1981 | 1982 | 1983 | |
| Number of racing days | 85 | 81 | 80 |
| Number of races | 847 | 801 | 789 |
| $(thousand) | |||
| Amount of stakes | 127 | 156 | 180 |
| Totalisator turnover— | |||
| Win and place | 3,100 | 3,029 | 2,605 |
| Other | 1,627 | 1,656 | 1,786 |
| Total | 4,727 | 4,685 | 4,391 |
| Amounts paid in dividends | 3,795 | 3,749 | 3,509 |
| Government taxes— | |||
| Totalisator duty | 269 | 329 | 304 |
| Amount of totalisator turnover retained by clubs | 608 | 403 | 360 |
| Unpaid fractions | 25 | 25 | 21 |
Gaming and Lotteries—Lotteries and raffles are popular both with participants and as a means of fund-raising for sports bodies and other organisations. Financial results of the New Zealand lotteries. the net profits of which are distributed for purposes beneficial to the community, are shown below. Housie remains the most popular of the licensed games of chance. From time to time the idea of establishing gambling casinos in New Zealand has been advanced. The long-standing Government policy of not permitting casino gambling has been reviewed twice in recent years but on each occasion has been reaffirmed.
The Gaming and Lotteries Act 1977, which came into force on 1 April 1978, discarded many of the former restrictions. The basic principle that gambling may not be conducted for private gain was retained, but for minor forms of gambling it is not necessary to obtain licences or permits provided conditions laid down in the Act are met. Provision has also been made for the authorisation of additional forms of gambling if the public demand for them becomes sufficient. Some prohibitions are considered necessary in the public interest. Where large numbers of participants and substantial amounts of money could be involved, licences continue to be required.
The 1977 Act identifies, and provides for the control of, four forms of gambling: games of chance (such as housie); bookmaking and betting (other than betting on horse racing and greyhound racing); prize competitions (such as football pools); and lotteries (previously called raffles). It is a self-contained body of New Zealand statute law on gambling with the exception of betting on horse racing and greyhound racing which is still controlled through the Racing Act 1971.
New Zealand Lotteries—During the year ended 31 March 1983 a total of 66 Golden Kiwi Jackpot Lotteries, 13 Golden Kiwi 5 + 5 Lotteries, and 4 $20 Lotteries were drawn. The aggregate financial results of New Zealand lotteries are shown in the following table.
| Item | 1980–81 | 1981–82 | 1982–83 |
|---|---|---|---|
| Number of lotteries | 88 | 83 | 71 |
| $(thousand) | |||
| Gross sales | 62,249 | 68,345 | 69,994 |
| Commission on sales | 4,623 | 5,260 | 5,504 |
| Expenses | 2,510 | 3,320 | 3,492 |
| Prizes | 36,550 | 40,838 | 41,619 |
| Lottery duty | 6,225 | 6,835 | 6,999 |
| Direct profit | 12,341 | 12,092 | 12,443 |
The net profits from the lotteries are required by the Gaming and Lotteries Act 1977 to be distributed for charitable, philanthropic, or cultural purposes, or for other purposes beneficial to the community. The New Zealand Lottery Board has the responsibility of apportioning profits of lotteries to various distributing authorities which consider applications for assistance and make grants. Allocations made by the board in recent years are shown in the following table.
| Recipient | 1981–82 | 1982–83 | 1983–84 |
|---|---|---|---|
| $ | $ | $ | |
| Welfare of Aged Persons Distribution Committee | 1,350,000 | 1,000,000 | 800,000 |
| Welfare Services Distribution Committee | 2,000,000 | 1,850,000 | 2,100,000 |
| Youth Services Distribution Committee | 250,000 | 500,000 | 750,000 |
| Medical Research Distribution Committee | 450,000 | 750,000 | 450,000 |
| Scientific Research Distribution Committee | 450,000 | 350,000 | 300,000 |
| General Purposes Distribution Committee | 6,831,000 | 7,464,000x | 7,045,000 |
| Queen Elizabeth the Second Arts Council | 1,725,000 | 2,180,000 | 2,650,000 |
| Minister of Internal Affairs (S. 93) | 1,280,000 | 665,000x | 550,000 |
| New Zealand Film Commission | 800,000 | 800,000 | 550,000 |
| Total | 15,136,000 | 15,559,000 | 15,195,000 |
FURTHER INFORMATION—Data collected on recreational and cultural services in the 1980–81 Census of Services are available in Section 22B of this Yearbook. Some information on recreation and sport will be found in the following official publications.
Report of the New Zealand Council for Recreation and Sport (Parl. paper E. 20).
Report of the Department of Internal Affairs (Parl. paper G. 7).
Report of the New Zealand Lottery Board (Parl. paper G. 7B).
Report of the Department of Lands and Survey (Parl. paper C. 1).
Report of the Queen Elizabeth the Second National Trust (Parl. paper C. 2).
Report of the Director-General of Forests (Parl. paper C. 3).
Outdoor Recreation Planning Symposium Proceedings—N.Z. Council for Recreation and Sport (1978).
New Zealand Recreation Survey—N.Z. Council for Recreation and Sport (1977).
Recreation Studies in New Zealand: A Bibliography—Ministry of Recreation and Sport (1977).
Social Trends—Department of Statistics.
Outdoor-recreation Planning: Marlborough Pilot Study—Department of Lands and Survey (1977).
Directory of Official Information (State Services Commission).
The N.Z. Council for Recreation and Sport has been associated with a number of publications mainly offering guidance on club administration, etc., and also produces 3 regular newsletters.
New Zealand's natural assets have made it possible to build an international image as one of the world's most beautiful countries. The National Parks system and undeveloped areas, relatively unpolluted air and water, open spaces, and distinctive plants and animal life are becoming increasingly desirable to international visitors.
The recent world-wide expansion of tourism, and changing visitor demands have, however, resulted in changes to what New Zealand offers as a destination. More travel-experienced visitors, coming from a wider range of countries have interests that now encompass skiing, tramping, walking, white-water rafting, and a variety of other activities. Visitors are more interested in getting off the beaten track, seeing how New Zealanders live and finding out more about the distinctive features of New Zealand.
The rural landscape and farm-life, the towns and the pace of life, art and craft activity, and the multicultural mix all contribute to New Zealand's distinctive appeal. Emphasis is now placed on aspects of cultural and historical value, and there is interest in the development of the agricultural, pastoral, and horticultural industries.
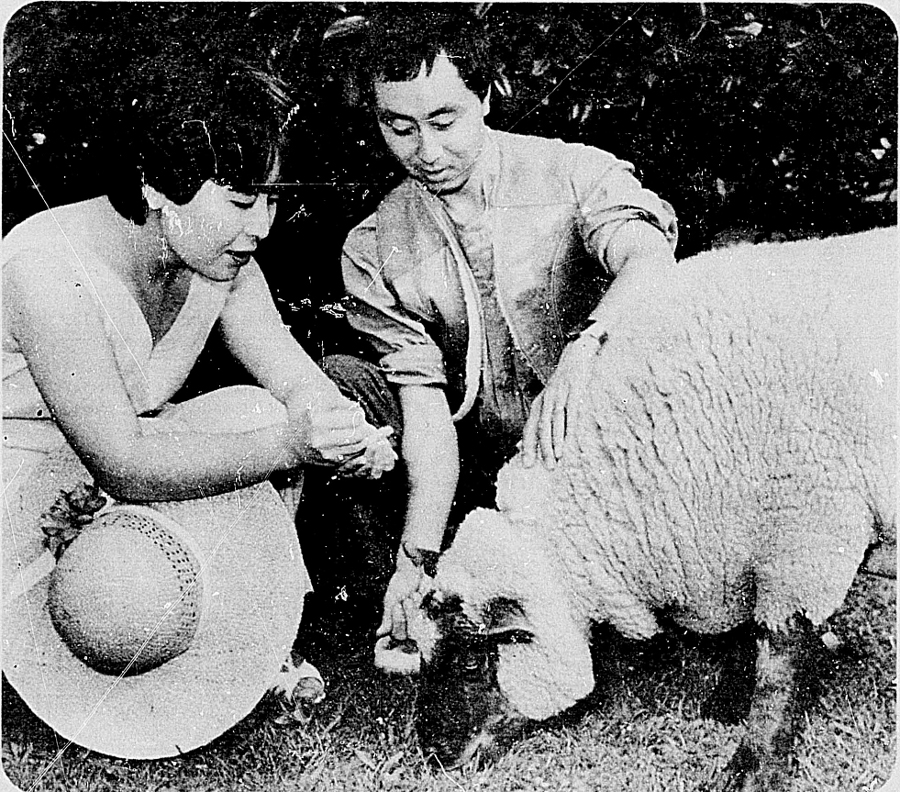
VISITOR ARRIVALS: International—More than half a million overseas visitors arrive in New Zealand annually. Visitor arrival numbers grew by 6.3 percent in the year ended 31 March 1984, compared with 3.2 percent in the previous year. There has been a growing diversification of countries from which overseas visitors originate. The following table shows overseas visitors to New Zealand during the last 5 years.
| Year Ended 31 March | Holiday | Stay with Friends and Relatives | Business | Other* | Total† |
|---|---|---|---|---|---|
* Includes work or working holiday, formal education, stopover, and unspecified. †Excludes through passengers (defined as passengers who do not stay ashore in New Zealand). | |||||
| 1980 | 243,229 | 96,236 | 46,742 | 58,988 | 445,195 |
| 1981 | 246,520 | 102,440 | 50,714 | 63,782 | 463,456 |
| 1982 | 248,150 | 108,988 | 56,128 | 59,315 | 472,581 |
| 1983 | 257,910 | 114,759 | 58,074 | 56,915 | 487,658 |
| 1984 | 285,845 | 116,793 | 61,250 | 54,553 | 518,441 |
Although arrivals into New Zealand reflect Pacific region growth (up 13.7 percent between 1979–80) as well as international growth (up 4.5 percent between 1979–80), the Pacific did not escape the economic downturn between 1980 and 1983. In 1982, world tourism declined for the first time in recent years (–1 percent) and New Zealand growth fell to 2 percent. Stronger growth has now returned and the New Zealand Tourism Council expects an average growth rate of 6.75 percent to be achieved by the end of the 1980s.
The following table gives the 25 main originating markets for overseas visitors (other than through passengers) for the year ended 31 March 1984.
| Rank | Market | Visitors |
|---|---|---|
| 1. | Australia | 223,946 |
| 2. | U.S.A. | 93,992 |
| 3. | Japan | 34,661 |
| 4. | England | 27,595 |
| 5. | Canada | 22,193 |
| 6. | Germany, Fed. Rep. of | 9,200 |
| 7. | United Kingdom (not otherwise specified) | 9,097 |
| 8. | Singapore | 6,423 |
| 9. | Netherlands | 5,064 |
| 10. | Fiji | 4,592 |
| 11. | Switzerland | 4,392 |
| 12. | Hong Kong | 3,864 |
| 13. | Western Samoa | 3,736 |
| 14. | Papua New Guinea | 3,697 |
| 15. | New Caledonia | 3,384 |
| 16. | Malaysia | 2,544 |
| 17. | Taiwan | 2,528 |
| 18. | Scotland | 2,308 |
| 19. | South Africa | 2,100 |
| 20. | Tonga | 2,041 |
| 21. | Sweden | 1,988 |
| 22. | France | 1,960 |
| 23. | Cook Islands | 1,945 |
| 24. | Indonesia | 1,640 |
| 25. | Tahiti (French Polynesia) | 1,588 |
Domestic—Total domestic visitor numbers are very difficult to estimate. However, New Zealanders regard holidays as part of their lifestyle. Relaxation, socialising, new experiences, nostalgia, visiting friends and relatives and participation in sports and other special events are all reasons for a holiday, and New Zealanders often travel for a combination of these reasons.
ECONOMIC IMPACT—Tourism has a beneficial direct and indirect impact on the economy. International visitors, in particular, make the industry a relatively high user of labour, a high earner of foreign exchange and a relatively low user of imports. Tourism is also relatively capital intensive. Domestic visitors account for about half the expenditure on tourism, and nearly all this is spent on transport and accommodation.
Reserve Bank Travel Receipts—Travel receipts as recorded by the Reserve Bank of New Zealand are shown in the following table. These figures are for origin of currency, and are not necessarily representative of receipts from visitors from the same countries.
| Year Ended 31 March | Australia | United States | Canada | United Kingdom | Japan | Other | Total |
|---|---|---|---|---|---|---|---|
| NZ$(million) | |||||||
| 1980 | 105.5 | 47.3 | 3.1 | 24.4 | 3.5 | 13.4 | 197.2 |
| 1981 | 119.0 | 61.5 | 4.7 | 30.9 | 4.6 | 18.4 | 239.1 |
| 1982 | 145.1 | 76.9 | 6.3 | 37.3 | 8.7 | 24.2 | 298.5 |
| 1983 | 135.1 | 91.8 | 8.7 | 29.8 | 12.5 | 26.2 | 304.2 |
| 1984 | 164.9 | 120.5 | 14.8 | 35.2 | 17.0 | 31.9 | 384.3 |
The combined value of domestic and international tourism, at $1,190 million for the year ended 31 March 1983, contributes 3.43 percent of Gross Domestic Product. The present level of tourism employment amounts to 90 000 jobs in the total economy.
SOCIAL AND CULTURAL IMPACT—The social consequences of tourism are largely beneficial, creating employment and stimulating a diversity of activities and facilities. The nature of New Zealand tourism encourages wide-ranging contact between residents and visitors, and this contact contributes to the current high acceptance of tourism by New Zealanders.
ENVIRONMENTAL IMPACT—The largely unspoiled and unpolluted environment is a major attraction for visitors, and protection and wise management of resources ensures that tourism has a positive impact. Tourism increasingly provides an alternative economic justification for protection of the environment.
TRANSPORT—In order of use, bus/coach (57 percent), private (41 percent), and rental (33 percent) vehicles are the three most favoured means of internal transport for international visitors. Holiday visitors favour coach travel (46 percent) or rental cars (24 percent). Those visiting friends and relatives make much greater use of private cars (60 percent) compared to holiday visitors (6 percent). Business travellers prefer air transport (21 percent) and rental cars (21 percent). A small but significant proportion of holiday visitors use campervans (5 percent) and aircraft (5 percent) as their main transport type. Most visitors use several modes of transport.
Public transport is now highly developed within New Zealand, with scheduled air services to most areas and an extensive network of coach operations. Limited rail transport, passenger, and vehicular ferry services are also available. However, there is a trend for visitors to choose forms of transport offering greater flexibility, such as campervans. In 1982, regulations were amended to increase the maximum weight limitation on standard driving licences to 3500 kgs for overseas visitors. As a consequence, campervan operators were able to increase vehicle sizes and provide greater safety and comfort for campervan users. Rental cars are used at some stage by 33 percent of all visitors to New Zealand.
Several major rental car firms operate in New Zealand and the number has been increasing. The average size of rental cars has decreased in recent years.
Japanese travellers' use of transport varies considerably from other markets. The more structured style of holiday preferred is seen in the high use of air transport and coaches and low rental car use. German holiday visitors' liking for outdoor activities is reflected in their high use of campervans (13 percent) and hitchhiking (34.5 percent). American holiday visitors make greater use of aircraft (53 percent) and coaches (70 percent) during their visits.
Domestic travellers and international visitors staying in private homes usually choose private transport. The Cook Strait appears to be a major physical and psychological barrier to North and South Islanders who mainly holiday within their own island.
ACCOMMODATION—Commercial accommodation has undergone several distinct stages of development resulting in today's wide variety of facilities. It includes private hotels, guest houses, tavern/hotels, tourist flats, motels, camping grounds, motor lodges, international standard hotels, cabins, chalets, skiing, hunting and fishing lodges, and farm/home-hosting.
Accommodation patterns vary greatly between regions, depending on local population, terrain and climate as the table on pages 284–285 shows.
International visitors make up 41 percent of hotel guests and 17 percent of motel guests. New Zealand business travellers are the major domestic users of hotel accommodation of those surveyed (86 percent). Resort hotels attract a high proportion of overseas visitors. The trend is towards visitors using several types of accommodation, with substantial increases in the use of camping, hotel and home-hosting facilities. The main forms of accommodation used by international visitors are:
| Licensed Hotel | 27.5% |
| Friends/Relatives | 25.5% |
| Motel | 25.0% |
| Camping Ground | 7.0% |
| Source: Tourist and Publicity Department, 1983. | |
International visitors here to visit friends and relatives do not use much commercial accommodation, 87 percent stay mainly in private homes.
Most forms of commercial accommodation, especially in smaller centres, are subject to very seasonal occupancy rates. Queenstown commercial accommodation occupancy rates varied from below 20 percent in June to 70 percent in March (1982–83). Fiordland, West Coast, and Bay of Islands (30 percent June; 80 percent March) show similar fluctuations. Overall occupancy rates for hotels and motels in New Zealand are low by international standards, but increased marginally in a number of regions between 1982 and 1983. Other forms of accommodation such as home-hosting, campervans and hostels are attracting a larger proportion of visitors and there is an ample supply of medium and lower range hotel and motel accommodation. Alternative forms are more actively promoted than in the past and the competition they provide has led to increased pressure on hotels and motels to form chains for marketing and forward reservations. Seasonal price variations are also becoming evident and the consumer is benefitting from the increased competition between and within the different forms of accommodation.
HOLIDAY PATTERNS AND FACILITIES FOR VISITORS—In recent years, there has been a marked trend toward more active, participatory holidays. Two elements contribute to this. Visitors want new experiences, and there is also a much greater diversity of things to do. The impetus for the development of new activities is provided by New Zealanders, both as domestic visitors and residents. As visitors now expect activities and amenities to complement New Zealand's scenic attractions, and are also looking for an insight into another culture and lifestyles, attractions and facilities developed primarily for the local or national community are increasingly used by visitors.
| Accommodation Inventory | ||||||
|---|---|---|---|---|---|---|
| Regions | Caravan Power Points | Tourist Flats | Cabins | Caravans | Farm/Home Host Beds | |
| Bunks | Beds | |||||
| Northland | 2,140 | 35 | 161 | 39 | 36 | 156 |
| Auckland (incl. Gt. Barrier Is) | 2,391 | 34 | 75 | 18 | – | 265 |
| Waikato | 1,006 | 5 | 117 | 10 | – | 646 |
| Thames Valley | 2,210 | 36 | 154 | 33 | – | 30 |
| Bay of Plenty | 2,954 | 84 | 284 | 49 | 16 | 469 |
| East Cape | 622 | 4 | 109 | 6 | – | 41 |
| Tongariro | 907 | 15 | 267 | 18 | 248 | 54 |
| Taranaki | 840 | 10 | 81 | – | – | 73 |
| Hawke's Bay | 1,218 | 70 | 148 | 14 | – | 176 |
| Wanganui | 266 | 8 | 35 | 126 | – | 38 |
| Horowhenua | 711 | 11 | 82 | – | – | 18 |
| Manawatu | 508 | 3 | 19 | 2 | – | 91 |
| Wairarapa | 330 | 2 | 50 | – | – | 61 |
| Wellington | 45 | – | 61 | – | – | 59 |
| Nelson Bays | 1,346 | 33 | 138 | 6 | 12 | 84 |
| Marborough | 681 | 17 | 145 | 8 | 72 | 50 |
| West Coast | 278 | 12 | 134 | 8 | – | 28 |
| Canterbury | 1,466 | 38 | 233 | 10 | 109 | 251 |
| Aorangi | 870 | 38 | 160 | – | – | 238 |
| Coastal/North Otago | 548 | 4 | 148 | – | 22 | 80 |
| Clutha/Central Otago | 1,911 | 15 | 308 | 4 | 256 | 73 |
| Southland | 476 | 7 | 140 | 7 | 18 | 140 |
| Chatham Islands | – | – | – | – | – | – |
| Total, New Zealand | 23 724 | 481 | 3 049 | 358 | 789 | 3 121 |
These community facilities include:
Community centres (including meeting venues, hobby facilities and recreation areas); theatres, art galleries (including associated theatre companies, amateur dramatic groups); choirs, national, regional, and local orchestras, and dance companies; collectives (such as the Arts Centre in Christchurch); libraries, display centres for items/news of local interest; radio and television stations; movie theatres; churches and events organised by church groups; local parks and gardens; playgrounds, reserves, zoos; botanical gardens; racecourses (and associated refreshment and entertainment facilities); sports facilities including golf courses, public swimming pools, bowling alleys, sportsfields, and major sports stadiums such as Queen Elizabeth II Park and Mt Smart Stadium; shopping centres; university and other open educational institutions; youth, sports, cultural or hobby grounds and their facilities; organised sport; and maraes.
A second category are dual purpose facilities, either consciously developed for use by residents and visitors, or developed into tourism attractions:
Historic buildings and sites (including memorials, pa and battle sites, and famous buildings such as the Waitangi Treaty House); coffee shops, restaurants, bars, cabarets and nightclubs in non-resort areas; wildlife parks (such as Orana Park and the Lion Safari Park); reserves (such as the gannet sanctuary at Cape Kidnappers); recreation parks (such as Fantasyland in Hastings, Rainbows End at Auckland), and small complexes with minigolf and bumper boats; local recreational facilities (such as canoeing on the River Avon, waterslides); horseriding, walkways and tracks (within urban green belts and in National and Forest Parks and reserves); museums (regional, historical or theme); certain churches (in particular those of architectural or historical significance such as Old St Pauls, Wellington, First Church, Dunedin, St Pauls Memorial Church, Putiki); scenic drives in urban areas (marked for the benefit of residents and visitors); lookout towers or peaks (maintained by the local community); skifields and facilities; tramping huts and shelters; local industries which open to the public (but for which tourism is a sideline—often not charged for); airports, railway and bus stations, and marinas; local festivals and competitions such as Golden Shears (Masterton), Cherry Blossom Festival (Alexandra), Round the Bays Run (Auckland); local identities (such as the Wizard of Christchurch, and the Duke of Wellington) and casual buskers, street dancers, actors and other performers.
| Guest House Beds | Young Men's Christian Association (YMCA) Beds | Youth Hostel Association (YHA) Beds | Hotel Rooms | Motel Units (Unlicensed) | Total | Bach (Holiday) | |
|---|---|---|---|---|---|---|---|
| Established | Licensed | ||||||
| 101 | – | 124 | 717 | 72 | 985 | 1,067 | 2,385 |
| 813 | 128 | 174 | 2,511 | 226 | 1,587 | 1,813 | 5,671 |
| 173 | – | 24 | 437 | 87 | 638 | 725 | 959 |
| 8 | – | 36 | 163 | 26 | 350 | 376 | 3,737 |
| 76 | – | 123 | 1,280 | 62 | 1,407 | 1,469 | 2,304 |
| 111 | – | 38 | 294 | 36 | 177 | 213 | 263 |
| 70 | – | – | 451 | 41 | 686 | 727 | 1,879 |
| 65 | – | 42 | 434 | 14 | 400 | 414 | 357 |
| 177 | 30 | 30 | 531 | – | 675 | 675 | 693 |
| 43 | – | 40 | 405 | 32 | 212 | 244 | 209 |
| - | – | – | 43 | 25 | 127 | 152 | 1,873 |
| 38 | – | – | 340 | – | 329 | 329 | 742 |
| - | – | – | 105 | 21 | 76 | 97 | 477 |
| 575 | – | 67 | 1,210 | 281 | 469 | 750 | 150 |
| 94 | 20 | 32 | 420 | 51 | 322 | 373 | 642 |
| 85 | – | 60 | 402 | 33 | 381 | 414 | 1,218 |
| 32 | – | 101 | 733 | 101 | 316 | 417 | 634 |
| 343 | 68 | 131 | 1,465 | 229 | 764 | 993 | 2,574 |
| 62 | – | 73 | 541 | 57 | 382 | 439 | 982 |
| 65 | 50 | 108 | 1,085 | 144 | 298 | 442 | 1,637 |
| 75 | – | 146 | 1,217 | 136 | 584 | 720 | 2,817 |
| 127 | – | 99 | 1,012 | 44 | 319 | 363 | 915 |
| 5 | – | – | 9 | – | 9 | 9 | 9 |
| 3 138 | 296 | 1 148 | 15 805 | 1 718 | 11 493 | 13 221 | 33 127 |
| Source. Tourist and Publicity Department, 1982. | |||||||
Some facilities have been developed specifically for tourism (whether international or domestic):
Souvenir shops; guided tours and sightseeing trips by all means of transport (including coach, taxi, jetboat, raft, plane); agricultural demonstrations (such as the Rotorua Agrodome and Queenstown Cattledrome); large-scale heritage and theme parks with entrance fees, such as MOTAT (Auckland), Shantytown (Greymouth), Ferrymead (Christchurch) and often a high degree of community involvement; duty free shopping facilities; rides (such as Shotover River jet, helicopter flights, glacier excursions, steamer cruises, river rafting); guided hunting, fishing and tramping excursions; activities such as gold panning (Shantytown), 3D Maze (Wanaka); carving, glassblowing, greenstone jewellery demonstrations; hiring of gear for all types of outdoor recreation (including yacht charters, ski hire, fishing and hunting equipment, camping gear, horses, bikes, hang-gliding); information centres (especially in National Parks or resorts areas); guided walks (such as the Milford, Heaphy, Routeburn walks).
ASSISTANCE TO THE TOURISM INDUSTRY—Since 1978 the Development Finance Corporation has been a major source of loans and guarantees to encourage the building of new accommodation and facilities of an acceptable modern standard and the extension of existing hotels and motels where there is a significant shortage of accommodation. There are special depreciation allowances for taxation purposes which apply to approved accommodation projects.
The development of New Zealand tourism is encouraged by the Export Marketing Development Incentive, which provides a 67.5 percent tax rebate for certain types of expenditure incurred in promoting New Zealand tourism internationally, and by the Export Performance Incentive and the Export Promotion Grants Scheme, which provide tax rebates or grants to approved projects.
The Tourist and Publicity Department has produced a booklet on the assistance available for tourism development and marketing initiatives.
Tourist and Publicity Department—Tracing its origins back to 1901, the Tourist and Publicity Department is the oldest national tourist office in the world. It is responsible for the co-ordinated promotion of New Zealand overseas as a tourism destination, and encourages and stimulates domestic tourism. A comprehensive travel service, and information and advisory services for the tourism industry are provided.
Domestic offices are located at Auckland, Rotorua, Wellington, Christchurch, Dunedin, and Queens-town. International offices are located at Sydney, Melbourne, Brisbane, Perth, Singapore, Tokyo, Frankfurt, London, New York, Los Angeles, San Francisco and Vancouver.
Through the National Publicity Studios and National Film Unit, the department also supplies general New Zealand publicity material, publications, films, photographs and displays for use within New Zealand and overseas to create a background knowledge of New Zealand.
New Zealand Tourism Council—Established in 1982, the council is a 12-member advisory body to the Government. It has an independent chairman, with members drawn largely from the private tourism sector. A permanent subcommittee of the council, the Tourism Marketing Group, widens industry involvement in the review of marketing policies and initiatives. The secretariat is provided by the Tourist and Publicity Department.
Tourist Industry Federation—Established in 1984, the Tourist Industry Federation represents a wide range of national associations, industry members, and regional groups connected with the tourism industry. It serves as the united voice of the New Zealand tourism industry.
Further Information—Books, guides and other publications on visitor attractions in New Zealand are numerous. The following publications are concerned with the present and future development and marketing of the tourism industry.
Tourist and Publicity Department “Red Series”
Education and Training for the New Zealand Tourism Industry.
Tourism Incentive New Zealand 1984.
A Survey of the 'Discover New Zealand' Campaign 1981.
Tourism in the New Zealand Economy.
The Non-economic Benefits of Tourism.
New Zealand Visitor Statistics 1981/1982.
Holiday Destination New Zealand 1981—New Zealand Perceptions.
New Zealand Hotel/Motel Inventory and Room Occupancy Rates (Licensed) 1981/1982.
A Survey of the 'Discover New Zealand' Campaign 1982.
Motel Accommodation Survey April 1981—March 1982.
New Zealand International Visitors Travel Survey 1982, Volumes 1 and 2.
Hotel Accommodation Survey April 1981—March 1982.
New Zealand Visitor Statistics 1982/83.
New Zealand Hotel/Motel Inventory and Room Occupancy Rates (Licensed) 1982/1983.
Tourist and Publicity Department Annual Report (Parl. Paper G. 25).
Tourist Hotel Corporation Annual Report (Parl. Paper G. 24).
New Zealand Tourism: Issues and Policies (March 1984)—New Zealand Tourism Council/Tourist and Publicity Department.
A full list of research and other publications is available from the Tourist and Publicity Department, Private Bag, Wellington.
Table of Contents
SOURCES OF LAW—The law of New Zealand consists of the common law, certain statutes of the United Kingdom Parliament, statutes of the New Zealand Parliament, and regulations, bylaws, and other forms of subordinate legislation made under statutory authority.
The Common Law—The common law, sometimes referred to as case law or judge-made law, has been built up over the centuries by the courts in England and, later, in New Zealand and other countries where it was introduced. Like any living law, the common law continues to develop.
In New Zealand the policy of the courts has been to preserve uniformity with the common law in England. This is partly for reasons of convenience and partly because of the assumption prevailing in New Zealand that there is a single common law, the law of England, and that there are not separate, though similar, common laws in different countries.
United Kingdom Statutes—United Kingdom statutes in force in New Zealand comprise those passed before 1840 which were applicable to the circumstances of the colony at that date, and those passed between 1840 and 1947 which extended to New Zealand expressly or by necessary implication. Many of these statutes have, of course, since been repealed.
New Zealand Statutes—In 1947 New Zealand adopted the Statute of Westminster, and our Parliament has since been the sole authority with inherent power to legislate for the country. There are no constitutional restrictions on the laws Parliament can pass.
LAW REFORM—In any progressive society the law requires alteration from time to time if it is to reflect the life of the community and adequately give effect to the needs of the people. As in other countries in modern times, legislation is by far the most important means by which the law of New Zealand is adapted to changing circumstances. The responsibility for bringing before Parliament proposals for the revision of the common law and that part of the statute law not administered by other departments of State is in the hands of the Minister of Justice. The Minister is assisted in carrying out his/her responsibilities by the Law Reform Division of the Department of Justice and by 5 standing committees, each specialising in a particular area of the law. These committees consider topics referred to them by the Minister and report thereon to him/her. Until recent years the Law Revision Commission, also assisted the Minister of Justice. In 1975 it was replaced with a smaller and more informal Law Reform Council. The council comprises the Minister of Justice, the chairmen of the 5 standing committees, the Solicitor-General, the Secretary for Justice, and the Chief Parliamentary Counsel. Its aim is to provide a means of communication among the committees and with those involved in the implementation of their reports
Public Acts and regulations are drafted in the Parliamentary Counsel Office.
COURTS: Hierarchy of Courts—The hierarchy of courts in New Zealand comprises the Court of Appeal, the High Court, and the District Courts. All exercise both civil and criminal jurisdiction. The Family Courts are divisions of the District Courts with jurisdiction over most family law matters. The Children and Young Persons' Courts hear cases against those under 17 years of age.
Court of Appeal—As constituted by the Judicature Amendment Act 1957, the Court of Appeal consists of the Chief Justice by virtue of office as head of the judiciary and of a president and 4 judges of the Court of Appeal appointed by the Governor-General. An additional judge or judges of the High Court may be nominated by the Chief Justice to sit on the Court of Appeal. The judges of the Court of Appeal are also judges of the High Court, but have seniority over all other judges of that court except the Chief Justice or the acting Chief Justice.
The Court of Appeal may from time to time appoint ordinary or special sittings or may sit in divisions and may make rules in respect of places and times for sittings and similar matters. This court, unlike other courts, exercises an appellate jurisdiction only. In addition to ordinary appeals from the High Court, certain other proceedings in inferior courts may, on an order from the High Court, be removed into the Court of Appeal for argument. The Court of Appeal also determines criminal appeals under the Crimes Act 1961.
All decisions of the Court of Appeal are final except where an appeal lies to Her Majesty in Council (the Privy Council). In cases where the amount at issue exceeds $5,000 there is an appeal as of right. In other cases leave to appeal is required. This leave may in most cases be granted either by the Court of Appeal or by the Privy Council itself. The Privy Council thus remains the final court of appeal in almost all civil cases and may also occasionally hear appeals in special criminal cases.
High Court—The High Court, which was first established by the Supreme Court Ordinance 1841, is now constituted under the Judicature Act 1908. The members of the court are a Chief Justice and 26 other judges, the number being fixed by statute. An additional judge or judges may be appointed whenever the Governor-General deems it necessary by reason of absence or anticipated absence of any of the judges on leave prior to retirement, each appointment being a permanent one from the time when it is made. The fixing of the number of judges, together with the provision that the salary of a judge shall not be diminished during the term of office, is an important safeguard for the principle of judicial independence. Judges are appointed to hold office during good behaviour and may be removed only by the Queen upon an Address by the House of Representatives. The retirement age for judges is now 68 years, with the exception that those appointed before 2 January 1981 may continue to 72 years. The High Court exercises jurisdiction with respect to major crimes, the more important civil claims, appeals and reviews.
In 1968 a separate administrative division of the High Court was created. It consists of not more than 6 judges of the High Court assigned to the administrative division by the Chief Justice. The administrative division hears appeals from many administrative tribunals including those constituted under the following Acts: War Pensions Act, Sale of Liquor Act, Animal Remedies Act, Medical Practitioners Act, Pharmacy Act, Nurses Act, Commerce Act, Distillation Act, Mining Act, Coal Mines Act, Town and Country Planning Act, Soil Conservation and Rivers Control Act, Accident Compensation Act, and Clean Air Act. It also hears and determines such proceedings, other than appeals, where legislation confers jurisdiction on the division, e.g., Citizenship Act 1977. Other classes of application, including applications for review under the Judicature Amendment Act 1972, may be referred to it by the Chief Justice.
District Courts—Under the District Courts Act 1947 District Courts possess an extensive jurisdiction in both civil and criminal cases and domestic proceedings. The jurisdiction of the court is exercised by District Court judges, whose number is limited by statute to 75. A Chief District Court Judge has been appointed to oversee the running of the District Courts, in addition to sitting in court. District Court judges hear civil claims up to $12,000. Certain District Court judges are specially warranted to preside over jury trials, although trials on charges of murder, rape, drug-trafficking and other more serious offences must be heard in the High Court.
Justices of the Peace can sit as a District Court to hear a limited number of minor criminal charges. Justices of the Peace now deal with many prosecutions brought under the minor offences scheme. This is limited to offences that do not carry any liability to imprisonment, nor to a fine of more than $500.
Family Courts, which are established as a division of the District Courts, have jurisdiction over most family matters, including dissolution of marriage, and are presided over by specially warranted District Court judges known as Family Court judges.
District Court judges must have been qualified as barristers and solicitors of the High Court for at least 7 years. They are appointed by the Governor-General, and may be removed by the Governor-General for inability or misbehaviour only. They retire at 68 years of age.
Other Courts—Apart from these courts of general jurisdiction there are in New Zealand several courts with specialist functions. These include the Maori Land Court and Maori Appellate Court, which have jurisdiction in respect of questions relating to Maori land.
There are also numerous administrative tribunals exercising functions of a judicial nature and performing an important and increasing role in the legal system.
JURIES—The institution of the jury is regulated in New Zealand by the Juries Act 1981, which substantially revised the previous Act of 1908. The change of major significance is the abolition of special juries, talesmen, and pretrial views.
The Crown's unilateral right to stand aside is altered to an ability by either party to stand aside with the consent of the other party.
Every person between the ages of 20 and 65 is eligible for jury service subject to the exceptions set out in the following paragraphs.
The list of persons not eligible for jury service and grounds for excusal has been substantially revised. Only those persons who because of their occupation are not appropriate to serve on a jury are ineligible and a person may be excused if jury service would cause serious inconvenience or hardship to some other person or members of the public generally.
The following persons are not qualified to serve on a jury in any Court on any occasion.
Anyone who, at any time, has been sentenced to imprisonment for life or for a term of 3 years or more, or to preventive detention:
Anyone who, at any time within the preceding 5 years, has been sentenced to imprisonment for a term of 3 months or more, or to borstal training.
The list of persons who will continue to be automatically ineligible is:
Members of the Executive Council of New Zealand;
Members of the House of Representatives;
Judges of the High Court, Judges and members of the Arbitration Court, Judges and Commissioners of the Maori Land Court, and District Court Judges;
Visiting Justices and members of the Prisons Parole Board;
Justices who have agreed to make themselves available from time to time to exercise the summary jurisdiction of District Courts;
Barristers and solicitors holding current practising certificates under the Law Practitioners Act 1955;
Members of the Police, and Traffic Officers;
Officers of the Public Service who are—
Employed in the Head Office of the Department of Justice;
Officers of the High Court or a District Court;
Officers of any penal institution or pre-release hostel or work centre; or
Probation Officers;
Mentally disordered persons; and
Persons who are incapable of serving because of blindness, deafness, or any other permanent physical infirmity.
PENAL SYSTEM—The penal system exists to protect the community against those who would break the laws which are laid down so that citizens may live harmoniously together and the common good be promoted. This purpose is achieved principally through the processes of deterrence and reformation; in modern times in New Zealand as in other countries emphasis is placed wherever possible on the rehabilitation of the offender.
The paramount consideration is to ensure first that those who are a serious danger to society by reason of the nature of their offences or character of their offending are removed from the community. Apart from that, wherever possible, sanctions are imposed that do not involve imprisonment. Where prison or other forms of detention are necessary the aim is to provide resources to assist offenders to live within the law. The interest of the community as well as of the offender is promoted by his/her successful resettlement on release.
Treatment of Offenders Within the Community—The principal penalties available to the courts in dealing with offenders outside prison are fines, probation, periodic detention, and community service.
Fines—Fines are by far the most common sentence imposed by the courts in New Zealand, even if traffic offences are not taken into account. For very minor offences the imposition of a fine is the only sanction available to the courts, but even where there is power to sentence the offender to a term of imprisonment the courts often content themselves with fining him.
Probation—The legislation on probation is contained in Part I of the Criminal Justice Act 1954. The court may release on probation any offender guilty of an offence punishable by imprisonment either on indictment or summarily. Probation is a conditional suspension of punishment and provides the opportunity for an offender to rehabilitate himself or herself in the community. An offender may be released on probation for a period of not less than 1 year or more than 3 years and during this time he/she must accept the supervision of a probation officer and observe conditions imposed regarding employment and residence, associates, and general behaviour. These conditions are automatic, but the courts have power to impose further conditions at their discretion on granting probation. This power makes probation a very flexible type of treatment and it is coming to be more freely and imaginatively used. Where the offence consists of the destruction or damage of property, restitution of the whole or part of the loss is commonly required as a condition of probation. Some courts have in suitable cases made it a condition of probation that the offender do particular work of value to the community in his/her spare time. The probation method is widely used.
Persons on probation at 31 December of recent years were as follows: 1976, 7299; 1977, 7349; 1978, 7734; 1979, 9533; 1980, 9253; 1981, 8403; 1982, 8909; and 1983, 9154.
Community Service—The Criminal Justice Amendment Act 1980 provided the court with power to impose a sentence of community service on convicted offenders instead of sending them to prison. The offender so sentenced continues to live and work in the community, but during leisure hours gives unpaid service to some community group. The sentence can be from 8 to 200 hours service. Before imposing this sentence the court takes into account the character and history of the offender and the public interest.
For community service to succeed there are two other elements needed—
The offender must agree to do community service.
The community must produce a number of groups prepared to guide an offender into useful community activities for the number of hours required by the court.
Community service is an addition to the existing range of non-custodial sentences, such as fines, probation, and periodic detention. The court may impose a fine or probation in addition to community service.
The emphasis is on the active participation of the local community, and on the benefits to both sponsor and offender. The offender works not only for but with the local sponsor group. The group accepts the services of the offender and treats the offender as a member of the group. As at 31 December 1981, 1833 persons had been sentenced to community service. During 1982 the number released to this sentence was 1997, while in 1983 the figure was 1598.
Periodic Detention—The Criminal Justice Amendment Act 1962 made provision for sentences of periodic detention. Pursuant to this legislation, work centres have been set up in Auckland, Otahuhu, Hamilton, Lower Hutt, Wellington, Christchurch, and Dunedin. These are available for offenders of all ages. Where the Act applies, any person of the ages specified who is convicted of an offence punishable by imprisonment or who wilfully refuses to pay a fine may be sentenced to periodic detention for any term up to 12 months. Under the sentence the offender is required to attend a work centre on a certain number of occasions each week and while in custody must attend classes or groups, undergo physical training, or perform work either in the centre or outside it. Work outside a centre may be at a hospital or school, at the home of an elderly or infirm person, or on Crown or local authority property. Centres have also been opened at New Plymouth, Papakura, North Shore, Taupo, Hastings, Levin, Masterton, Whangarei, Tokoroa, Rotorua, Gisborne, Napier, Palmerston North, Wanganui, Tauranga, Nelson, Dunedin, Invercargill, Whakatane, Greymouth, Blenheim, and Timaru. At 31 December 1981 there were 2254 detainees reporting. The figure for 31 December 1982 was 3121, and at 31 December 1983 the number was 3338.
Other Powers of the Court—Although not sentences in the strict sense, various other means are available to the courts in dealing with offenders whose offences are not serious. They include conviction and discharge, the effect of which is that the offender has a conviction recorded against him/her but no sanction is imposed, and conviction coupled with an order that the offender come up for sentence if called upon within a specified period. This is a suspension of punishment conditional upon good behaviour but is not subject to the positive conditions of a probation order.
Finally the court, although it may find an offender guilty, may discharge him/her without conviction if it considers the offence to be of a trivial or technical character.
Detention in Penal Institution—The sentences of detention which the courts may impose are as follows;
Corrective training, the term fixed by statute being 3 months. The offender must be between 15 and 20 years of age, and he or she may be eligible for early release after serving two thirds of his or her sentence. After his or her release the offender is on probation for 12 months.
Imprisonment for a stated period or for life. An offender sentenced to imprisonment for a fixed term may be eligible for early release after serving three quarters of his or her sentence, or in some cases two-thirds.
Preventive detention, which means detention in prison for an indefinite term to be decided by the Minister of Justice on the recommendation of the Prisons Parole Board, but in any event not less than 7 years. This sentence may be imposed on conviction for certain sexual offences if the offender has been convicted for a sexual offence on at least one previous occasion. The offender must be 25 years of age or over. After serving 7 years of his sentence the offender may be released on probation on the recommendation of the Prisons Parole Board, provided the board is of the opinion that he is not likely to continue to commit sexual crimes. The period of probation in each case extends for life. Preventive detention was restricted to sexual offenders by the Criminal Justice Amendment Act 1967. Hitherto, it had been available for persistent offenders in a number of other cases.
Restrictions on Imprisonment—The policy is to restrict the use of detention of offenders in an institution as far as is practicable, consistent with the protection of the community from dangerous criminals.
In 1975 a restriction on detention prohibited a sentence of detention (other than a sentence of periodic detention) being imposed on any person not legally represented at some time before conviction unless he/she had the means to pay for legal representation but declined to employ a solicitor, or he/she was offered legal aid and refused it.
A court, in dealing with anyone convicted of an offence punishable by imprisonment, is now required in each case to have regard to the desirability of keeping the offender in the community so far as is practicable and consistent with the safety of the community.
CRIMINAL JURISDICTION: Court of Appeal—This court hears appeals against convictions and sentences imposed in the High Court and in District Court trial courts.
If it allows an appeal, the Court of Appeal may quash the conviction, vary the sentence, or order the case to be retried.
Applications lodged in criminal cases in the latest 5 years and the results of the appeals are shown in the following table.
| Year | Appeals Lodged | Appeals Heard | |||
|---|---|---|---|---|---|
| Allowed | Refused | Other* | Total | ||
| * Reserved decisions or cases adjourned. | |||||
| 1979 | 230 | 51 | 175 | 1 | 227 |
| 1980 | 299 | 35 | 197 | 3 | 285 |
| 1981 | 272 | 56 | 239 | 5 | 300 |
| 1982 | 316 | 90 | 216 | 2 | 308 |
| 1983 | 291 | 67 | 196 | 1 | 264 |
Trial Courts—Until 1 May 1981, criminal trials were held only in the High Court. From that date District Court trial courts, located in 17 centres, may hear cases for all except the most serious of indictable offences, thus relieving the High Court of a heavy work load.
Criminal cases in the trial courts are of 2 classes—those in which the accused person has pleaded guilty in the lower courts and has been committed to the High Court or to a District Court trial court for sentence or has been committed for trial and subsequently changed the plea to guilty, and those actually tried in the trial courts.
The following tables show summaries of criminal cases dealt with in the High Court (formerly the Supreme Court) during each of the latest available 5 years, and for the District Court trial courts for 1981 and 1982. Frequently a series of charges is preferred against the one offender and this serves to explain the distinction between total counts and charges, and distinct persons.
| Year | Tried in High Court | ||||||||
|---|---|---|---|---|---|---|---|---|---|
| Indictments and Informations | Convictions | Sentences in Case of Committal for Sentence | Total Sentences | ||||||
| M | F | M | F | M | F | M | F | Total | |
| Total Counts and Charges | |||||||||
| 1978 | 1,858 | 189 | 1,116 | 117 | 468 | 59 | 1,584 | 176 | 1,760 |
| 1979 | 2,109 | 174 | 1,317 | 110 | 637 | 31 | 1,954 | 141 | 2,095 |
| 1980 | 2,550 | 275 | 1,543 | 156 | 763 | 19 | 2,306 | 175 | 2,481 |
| 1981 | 1,776 | 346 | 1,049 | 126 | 848 | 42 | 1,897 | 168 | 2,065 |
| 1982 | 1,185 | 76 | 712 | 40 | 668 | 42 | 1,380 | 82 | 1,462 |
| Distinct Persons | |||||||||
| 1978 | 702 | 77 | 528 | 47 | 135 | 15 | 663 | 62 | 725 |
| 1979 | 732 | 63 | 514 | 41 | 148 | 11 | 662 | 52 | 714 |
| 1980 | 915 | 74 | 643 | 47 | 221 | 13 | 864 | 60 | 924 |
| 1981 | 673 | 62 | 490 | 43 | 229 | 20 | 719 | 63 | 782 |
| 1982 | 413 | 46 | 324 | 31 | 225 | 19 | 549 | 50 | 599 |
| Year | Tried in District Court Trial Courts | ||||||||
|---|---|---|---|---|---|---|---|---|---|
| Indictments and Informations | Convictions | Sentences in Cases of Committal for Sentence | Total Sentences | ||||||
| M | F | M | F | M | F | M | F | Total | |
| Total Counts and Charges | |||||||||
| 1981 | 901 | 100 | 535 | 46 | 8 | 2 | 543 | 48 | 591 |
| 1982 | 1,494 | 375 | 907 | 240 | 27 | 6 | 934 | 246 | 1,180 |
| Distinct Persons | |||||||||
| 1981 | 327 | 48 | 229 | 19 | 3 | 2 | 232 | 21 | 253 |
| 1982 | 691 | 124 | 485 | 92 | 21 | 6 | 506 | 98 | 604 |
Of the 1274 distinct persons indicted in all trial courts during 1982, 932 were convicted, 4 were still awaiting trial at the end of the year, 198 were acquitted, 10 were found insane, and the prosecution was not proceeded with in the remaining 130 cases.
The next table summarises the offences of persons convicted and sentenced in the High Court during each of the latest 5 years, and in District Court trial courts in 1981 and 1982.
| Year | Total Convictions and Sentences* | Distinct Persons Convicted and Sentenced | ||||||
|---|---|---|---|---|---|---|---|---|
| Offences Against the Person | Offences Against Property, and Forgery | Other Offences | Total | Offences Against the Person | Offences Against Property, and Forgery | Other Offences | Total | |
| High Court | ||||||||
| 1978 | 530 | 873 | 357 | 1,760 | 339 | 205 | 181 | 725 |
| 1979 | 642 | 930 | 523 | 2,095 | 311 | 172 | 231 | 714 |
| 1980 | 641 | 1,334 | 505 | 2,480 | 404 | 255 | 264 | 923 |
| 1981 | 603 | 836 | 626 | 2,065 | 372 | 164 | 246 | 782 |
| 1982 | 523 | 567 | 372 | 1,462 | 335 | 91 | 173 | 599 |
| District Court Trial Courts | ||||||||
| 1981 | 85 | 386 | 120 | 591 | 54 | 135 | 64 | 253 |
| 1982 | 212 | 627 | 341 | 1,180 | 119 | 254 | 231 | 604 |
The table which follows shows the number of distinct persons sentenced in the trial courts during each of the latest 5 years classified according to the principal types of offences.
| Type of Offence | 1978 | 1979 | 1980 | 1981 | 1982 |
|---|---|---|---|---|---|
| * Includes persons charged with murder but convicted of manslaughter. | |||||
| Murder | 14 | 10 | 7 | 16 | 5 |
| Attempted murder | 6 | 3 | 1 | 2 | 3 |
| Manslaughter* | 21 | 16 | 19 | 28 | 35 |
| Traffic offences involving death or injury | 3 | 9 | 6 | 10 | 10 |
| Assaults and wounding | 199 | 164 | 262 | 285 | 292 |
| Sexual offences | 93 | 108 | 108 | 78 | 106 |
| Other offences against the person | 3 | 1 | 1 | 7 | 3 |
| Burglary and breaking and entering | 65 | 50 | 54 | 86 | 99 |
| Theft, receiving, and fraud | 115 | 92 | 166 | 171 | 134 |
| Other offences against property | 23 | 24 | 25 | 36 | 107 |
| Forgery and uttering | 2 | 6 | 10 | 6 | 5 |
| Drug offences | 121 | 163 | 182 | 226 | 213 |
| Other offences | 60 | 68 | 82 | 84 | 191 |
| Total | 725 | 714 | 923 | 1 035 | 1 203 |
| Per 10 000 mean population | 2.31 | 2.29 | 2.95 | 3.28 | 3.78 |
Sentences imposed in the trial courts during each of the latest 5 years were as follows:
| Sentence | 1978 | 1979 | 1980 | 1981 | 1982 |
|---|---|---|---|---|---|
* Also includes persons committed into the care of the Department of Social Welfare. Community service is a new penalty operative from 1 February 1981. †Detention centre and borstal training abolished on 1 April 1981. Corrective training is a new penalty from that date. | |||||
| Probation or community service* | 70 | 56 | 93 | 116 | 145 |
| Ordered to come up for sentence | 17 | 21 | 22 | 39 | 33 |
| Discharged | 2 | 4 | 10 | 12 | 12 |
| Fined | 90 | 68 | 87 | 103 | 180 |
| Imprisoned | 443 | 468 | 533 | 583 | 630 |
| Detention centre or corrective training† | 3 | 4 | 13 | 15 | 11 |
| Periodic detention | 66 | 63 | 134 | 154 | 185 |
| Borstal training† | 26 | 28 | 28 | 8 | … |
| Preventive detention | 4 | – | 1 | – | 1 |
| Detained in psychiatric hospital | 4 | 2 | 2 | 5 | 6 |
| Total | 725 | 714 | 923 | 1 035 | 1 203 |
The death sentence for murder was abolished in 1961. On conviction for murder a mandatory sentence of the imprisonment is imposed.
District Courts—District Court judges deal with the majority of indictable offences. They have jurisdiction over all crimes against property and all but the most grave of other crimes, such as treason, homicide, rape, and perjury. A District Court judge may, however, decline to deal with an offence summarily, in which case the accused is committed for trial in the High Court in the ordinary way. The accused person has, moreover, the right to claim jury trial if he or she is charged with any offence, indictable or summary, punishable by imprisonment for more than 3 months.
A defendant may be prosecuted at a court hearing for several charges of one or more offences. All are included in “total charges”, which will therefore exceed the number of persons charged. The principal charge (i.e., that for which the heaviest sentence is imposed), for each person at each court appearance is selected to arrive at the “distinct case” classification. As a person may appear before a court on more than one occasion during the year, the number of distinct cases will not necessarily correspond with the number of individual persons involved.
With the introduction in 1977 of a centralised computer source for criminal and traffic offence data, offence and other variable groupings were revised to provide information in a form for which there is now a demand.
Because of the revised groupings, data in the following District Courts table, are not directly comparable with those in the corresponding table shown as a time series in earlier Yearbooks. The figures refer to total charges convictions for each offence group, followed by total distinct case convictions.
| Type of Offence | 1978 | 1979 | 1980 | 1981 | 1982 |
|---|---|---|---|---|---|
* From 1 February 1982 people found drunk in a public place are no longer convicted. †Includes breaches of the Road User Charges Act (effective 1 March 1978) and careless driving. From 1 October 1981 the infringement procedure, formerly restricted to parking breaches and speeding, was extended to include a number of minor traffic offences. ‡Counting only the principal offence in cases where a person was charged simultaneously with 2 or more offences. | |||||
| Offences involving violence or threats of violence | 5,184 | 4,579 | 5,201 | 5,180 | 5,907 |
| Sex offences | 469 | 428 | 457 | 386 | 455 |
| Other offences against the person | 2,191 | 2,194 | 2,621 | 2,773 | 2,813 |
| Unlawful taking of property (includes conversion of vehicles) | 23,745 | 17,742 | 23,459 | 22,182 | 26,417 |
| Fraud and false pretences | 6,466 | 6,000 | 7,682 | 8,885 | 10,265 |
| Wilful damage and trespass | 3,188 | 2,827 | 3,572 | 3,566 | 3,944 |
| Forgery, uttering, and currency offences | 1,544 | 963 | 1,270 | 1,615 | 1,536 |
| Drug offences | 3,385 | 3,982 | 6,297 | 5,941 | 7,984 |
| Offences against the administration of justice | 2,781 | 2,394 | 3,045 | 3,107 | 4,056 |
| Drunkenness and drunken driving offences* | 16,560 | 17,185 | 21,359 | 21,212 | 20,555 |
| Other imprisonable traffic offences | 6,736 | 6,647 | 7,987 | 8,603 | 10,806 |
| Other offences against good order | 7,128 | 7,710 | 8,693 | 8,014 | 6,678 |
| Offences against decency | 231 | 186 | 325 | 310 | 348 |
| Maintenance and Social Welfare offences | 1,478 | 785 | 1,156 | 736 | 86 |
| Offences against the Sale of Liquor Act. | 8,265 | 7,299 | 9,246 | 8,266 | 9,098 |
| Other offences | 16,968 | 13,495 | 17,531 | 18,018 | 23,147 |
| Subtotal | 106,319 | 94,416 | 119,901 | 118,794 | 134,095 |
| Minor traffic offences† | 242,464 | 264,371 | 261,340 | 194,944 | 188,879 |
| Total | 348 783 | 358 787 | 381 241 | 313 738 | 322 974 |
| Distinct cases‡ | 276,199 | 325,469 | 306,272 | 245,404 | 242,380 |
The next table classifies distinct-case results of hearings for the latest available 3 years.
From 1 November 1981 minor traffic breaches excluded from the infringement procedure do not carry a conviction, but an order may be made for payment of a fine, towage fee, and costs. All have been included under the 'convicted and discharged (or pay costs)' category in this table.
| Result of Hearing | 1980 | 1981 | 1982 |
|---|---|---|---|
* New penalty effective from 1 April 1981. From that date detention centres and borstal training were abolished. †Includes suspended imprisonment. ‡ Mainly for traffic offences which don't involve imprisonment. §New penalty effective from 1 February 1981. For 1981 these cases have been included with orders made. | |||
| Imprisonment | 4,319 | 4,375 | 5,146 |
| Detention in detention centre | 555 | 102 | – |
| Corrective training* | – | 602 | 753 |
| Periodic detention | 6,141 | 5,919 | 7,357 |
| Detention in borstal institution | 634 | 124 | – |
| Probation (under Criminal Justice Act) | 4,062 | 2,677 | 2,468 |
| Convicted and ordered to come up for sentence if required† | 2 882x | 2,473 | 2,288 |
| Fined‡ | 275,569 | 217,343 | 214,478 |
| Convicted and discharged (or pay costs) | 10,476 | 9,179 | 7,402 |
| Community service§ | – | 1,466 | |
| Orders made | 1,634 | 2,610 | 1,022 |
| Dismissed, withdrawn, or struck out | 32,609 | 40,274 | 44,988 |
| Discharged under section 42 of Criminal Justice Act | 3,006 | 3,320 | 3,332 |
| Total, distinct cases | 341 887 | 288 998 | 290 700 |
Traffic Offences—Traffic offences form a large proportion of summary convictions. The most frequent traffic offences dealt with are breaches of parking regulations and excessive speed. Since 1 April 1969 parking infringements which result merely from overstaying a time limit have been dealt with outside the criminal law and from 1 July 1971 some local authorities and the Ministry of Transport have imposed speeding infringement penalties. From late 1981 a number of traffic breaches formerly classified as offences have also been dealt with by infringement notice.
The following table analyses all traffic convictions dealt with in District Courts for the latest available 3 years. A list of traffic offences reported by officers of the Ministry of Transport will be found in Section 14D, Roads and Road Transport.
| Offence | 1980 | 1981 | 1982 |
|---|---|---|---|
| * Includes breaches of heavy vehicle licensing and from 1978 also includes breaches of the Road User Charges Act. | |||
| Reckless, dangerous, or careless use or driving of motor vehicle causing death | 70 | 97 | 111 |
| Reckless, dangerous, or careless use or driving of motor vehicle causing injury | 619 | 733 | 881 |
| Driving, or in charge of, motor vehicle under the influence of drink or drugs causing death | 13 | 22 | 23 |
| Driving, or in charge of, motor vehicle under the influence of drink or drugs causing injury | 38 | 63 | 67 |
| Failing to stop motor vehicle after accident involving bodily injury | 50 | 63 | 86 |
| Driving, or in charge of, motor or other vehicle under the influence of drink or drugs | 13,556 | 16,336 | 19,791 |
| Exceeding speed limits | 70,433 | 26,198 | 28,485 |
| Reckless, dangerous, careless, or inconsiderate use or driving of motor vehicle | 41,980 | 37,455 | 35,373 |
| Offences relating to the registration, or licensing of motor vehicles* | 13,175 | 11,993 | 9,865 |
| Offences relating to driver's licence | 20,384 | 16,598 | 15,297 |
| Breaches of parking regulations | 32,535 | 34,462 | 78,142 |
| Other traffic offences | 90,881 | 76,907 | 32,600 |
| Total | 283 734 | 220 927 | 220 721 |
Disqualifications of drivers by length of disqualification are shown in the following table for the latest 3 years.
| Period | 1980 | 1981 | 1982 |
|---|---|---|---|
| Under 3 months | 1,023 | 928 | 1,120 |
| 3 months and under 6 months | 2,379 | 2,606 | 3,032 |
| 6 months and under 1 year | 14,384 | 16,889 | 21,760 |
| 1 year and under 2 years | 6,533 | 7,442 | 8,703 |
| 2 years and under 3 years | 1,108 | 1,249 | 1,290 |
| 3 years and under 4 years | 357 | 908 | 384 |
| 4 years and under 5 years | 55 | 77 | 45 |
| 5 years and over | 154 | 204 | 111 |
| Total disqualifications | 26,493 | 30,303 | 36,445 |
Drunkenness—The following table shows the number of total charge convictions for drunkenness for 1979, 1980, and 1981. From 1 February 1982, people found drunk in a public place are no longer convicted. These do not include drunken driving offences.
| Year | Convictions for Drunkenness | ||
|---|---|---|---|
| Males | Females | Total | |
| 1979 | 5,482 | 573 | 6,055 |
| 1980 | 7,123 | 676 | 7,799 |
| 1981 | 4,452 | 424 | 4,876 |
Offences by Women—Of the 374 625 charges dealt with in the District Courts in 1981, 52 281 or 13.96 percent were preferred against females. Most of the offences for which summary convictions are entered against females are of a relatively trivial nature, such as minor breaches of traffic regulations. Convictions for more serious offences are set out in the following table.
| Offence | 1980 | 1981 | 1982 |
|---|---|---|---|
| Violent offences | 420 | 386 | 434 |
| Burglary, breaking and entering, etc. | 352 | 362 | 533 |
| Theft and receiving | 3,066 | 2,906 | 3,766 |
| Fraud and false pretences | 2,737 | 2,430 | 2,977 |
| Forgery and uttering | 408 | 422 | 576 |
| Offensive conduct or language | 668 | 591 | 472 |
| Drug offences | 836 | 806 | 1,130 |
Women received into prison under sentence during 1982 numbered 312, compared with 260 in 1981.
Totals for each offence group in 1982 (with 1981 figures in parentheses), were: offences against the person, 38 (28); property offences, 193 (142); drug offences, 18 (26); offences against good order, 3 (3); traffic offences, 6 (2); breach of probation or periodic detention, 16 (22); breaches of Immigration Act, 12 (1); breaches of Social Security Act, 3 (5); and all other offences, 23 (21).
Assessment of Crime—One important index of crime in the community is the number of those who are convicted of offences. This gives a useful guide to the amount of crime, providing the proportion of crime reported and the proportion of known crime whose perpetrators are detected remains more or less constant. This, of course, may not be a justified assumption. A greater number of court convictions might mean merely more efficiency by the police and a greater willingness on the part of the public to report offences that previously went unreported. Care should therefore be taken to avoid reading too much into figures for court convictions.
History and current experience alike testify that crime almost invariably flourishes in large cities, particularly those that are growing rapidly and drawing large numbers of young people from a less sophisticated environment. This is less a penal problem than a social one. In New Zealand it has occurred to a marked degree only in recent years.
The following table shows the ages of persons sentenced to custodial detention. In each year represented in the table, over 30 percent of all prisoners were aged 15 to 19. At the time of the 1981 Census of Population the 15 to 19 age group formed 13.2 percent of the total population aged 15 years and over.
| Age, in Years | 1977 | 1978 | 1979 | 1980 | 1981 | 1982 |
|---|---|---|---|---|---|---|
| Number of Persons Sentenced | ||||||
| 15 | 56 | 56 | 66 | 58 | 87 | 94 |
| 16 | 278 | 240 | 250 | 248 | 267 | 289 |
| 17 | 473 | 382 | 391 | 409 | 394 | 432 |
| 18 | 421 | 418 | 406 | 433 | 426 | 466 |
| 19 | 434 | 376 | 399 | 424 | 396 | 488 |
| 20 | 357 | 339 | 378 | 394 | 405 | 409 |
| 21–24 | 1,138 | 1,122 | 1,191 | 1,140 | 1,047 | 1,188 |
| 25–29 | 679 | 660 | 708 | 725 | 697 | 746 |
| 30–34 | 327 | 367 | 350 | 336 | 380 | 409 |
| 35–39 | 211 | 225 | 217 | 207 | 182 | 195 |
| 40–44 | 118 | 149 | 162 | 127 | 141 | 142 |
| 45–49 | 111 | 111 | 104 | 85 | 100 | 79 |
| 50–54 | 67 | 72 | 65 | 69 | 56 | 38 |
| 55–59 | 51 | 47 | 41 | 40 | 34 | 26 |
| 60–64 | 18 | 26 | 18 | 17 | 9 | 10 |
| 65–69 | 9 | 4 | 6 | 6 | 4 | 6 |
| 70 and over | 3 | 3 | 2 | 2 | 3 | 1 |
| Total | 4 751 | 4 597 | 4 754 | 4 720 | 4 628 | 5 018 |
| Prisoners aged 19 or younger as a percentage of all prisoners | 35.0 | 32.0 | 31.8 | 33.3 | 33.9 | 35.3 |
PROBATION—The following figures show the number of persons placed on probation during the latest 5 years.
| Year | Males | Females | Total |
|---|---|---|---|
| 1979 | 5,103 | 1,597 | 6,700 |
| 1980 | 5,472 | 1,689 | 7,161 |
| 1981 | 4,972 | 1,356 | 6,328 |
| 1982 | 6,087 | 1,330 | 7,417 |
| 1983 | 4,730 | 1,030 | 5,760 |
PRISONS AND PRISONERS—A new sentence of corrective training, effective 1 April 1981, applies to both males and females aged 15 to 20 years. Borstal and detention centre training were abolished from that date. The New Zealand prison population is accommodated in 28 institutions comprising 20 prisons, 5 corrective training centres, and 2 police jails. Any person serving a sentence of not more than 8 days may be detained at any police station, which is also deemed to be a prison for that period. The prison population during the year 1982 is shown in the following table.
| Category | Males | Females | Total |
|---|---|---|---|
| Persons in prison at 1 January 1982 | 2,374 | 90 | 2,464 |
| Receptions during the year (including multiple receptions of the same person, but excluding transfers) | 11,303 | 736 | 12,039 |
| Discharges during the year (including multiple discharges of the same person, but excluding transfers) | 11,164 | 696 | 11,860 |
| Persons in prison at 31 December 1982 | 2,513 | 130 | 2,643 |
| Daily average number of prisoners | 2,480 | 104 | 2,584 |
Not all prisoners received were actually persons undergoing sentence on conviction for criminal offences. Of the 12 039 receptions, 6295 referred to persons who were remanded in custody pending a court hearing and who were later released after acquittal or on a successful application for bail, given a sentence not involving custodial detention, or sent after sentence to an instutiton other than that in which they were remanded. In 1982, 129 debtors were also received for non-payment of civil debt and 30 persons were transferred to mental institutions.
Persons received into penal institutions under sentence during 1982 are shown by age group and type of offence in the following table.
| Age. in Years | Offences Against the Person | Burglary, Theft and Fraud* | Conversion, Wilful Damage, etc.† | Drunkenness‡ | Other Offences | Total | ||
|---|---|---|---|---|---|---|---|---|
| Sexual Offences | Violent Offences | Other | ||||||
* Includes forgery and currency offences. †Includes all other property offences. ‡Includes driving with excess blood alcohol or excess breath alcohol concentration. | ||||||||
| Under 21 | 36 | 290 | 20 | 928 | 304 | 30 | 570 | 2,178 |
| 21–24 | 28 | 167 | 18 | 386 | 84 | 57 | 448 | 1,188 |
| 25–29 | 20 | 109 | 11 | 205 | 31 | 48 | 322 | 746 |
| 30–39 | 29 | 82 | 10 | 168 | 24 | 60 | 231 | 604 |
| 40–49 | 19 | 26 | 3 | 60 | 8 | 29 | 76 | 221 |
| 50–59 | 3 | 4 | 2 | 13 | 1 | 10 | 31 | 64 |
| 60 and over | 3 | 4 | – | 4 | – | 1 | 5 | 17 |
| Total | 138 | 682 | 64 | 1,764 | 452 | 235 | 1,683 | 5,018 |
The next table gives particulars of ages and length of sentence of distinct persons received into penal institutions under sentence during 1982.
| Age. in Years | Length of Sentence | Total | |||||
|---|---|---|---|---|---|---|---|
| Under 1 Month | 1 Month and Under 3 Months | 3 Months*and Under 12 Months | 1 Year and Under 3 Years | 3 Years and Under 5 Years | 5 Years†and Over | ||
* Includes corrective training. †Includes 4 with life imprisonment, and 1 with preventive detention. | |||||||
| Under 21 | 130 | 219 | 1,540 | 252 | 25 | 12 | 2,178 |
| 21–24 | 112 | 234 | 574 | 217 | 35 | 16 | 1,188 |
| 25–29 | 70 | 162 | 325 | 146 | 22 | 21 | 746 |
| 30–39 | 69 | 138 | 250 | 110 | 26 | 11 | 604 |
| 40–49 | 29 | 47 | 97 | 38 | 4 | 6 | 221 |
| 50–59 | 15 | 11 | 29 | 8 | 1 | – | 64 |
| 60 and over | 5 | 1 | 8 | 2 | – | 1 | 17 |
| Total | 430 | 812 | 2 823 | 773 | 113 | 67 | 5 018 |
The following table shows corrective training sentences by age of detainee when received into custody.
| Sentence | Age, in Years | Total | ||||
|---|---|---|---|---|---|---|
| 15 | 16 | 17 | 18 | 19 | ||
| Corrective training— | ||||||
| Males | 61 | 169 | 193 | 167 | 104 | 694 |
| Females | 1 | 14 | 21 | 12 | 14 | 62 |
Of the total of distinct persons received into penal institutions in 1982, 81 percent had been convicted for an offence on at least 1 previous occasion, and 60 percent had been convicted more than 6 times.
The number of prisoners received to serve a sentence imposed during the year 1982 for criminal offences was 5580, but deducting multiple receptions of the same prisoner, the number of distinct persons was 5018 (4706 males and 312 females). The corresponding total for 1981 was 5025, involving 4628 distinct persons (4368 males and 260 females).
An analysis of distinct persons received into penal institutions according to nature of sentence is given below for the 5 latest years.
| Nature of Sentence | 1978 | 1979 | 1980 | 1981 | 1982 |
|---|---|---|---|---|---|
| Imprisonment | 3,452 | 3,638 | 3,583 | 3,737 | 4,261 |
| Detention centre | 460 | 456 | 527 | 100 | – |
| Borstal training | 682 | 660 | 609 | 123 | – |
| Preventive detention | 3 | – | 1 | – | 1 |
| Corrective training | – | – | – | 668 | 756 |
| Total | 4 597 | 4 754 | 4 720 | 4 628 | 5 018 |
| Rate per 10 000 of mean population | 14.69 | 15.22 | 15.07 | 14.66 | 15.77 |
The following table shows the number of persons in prison at 31 December in each of the latest 5 years.
| At 31 December | Persons in Prison | Proportion per 10 000 of Population as at 31 December | |||
|---|---|---|---|---|---|
| Undergoing Sentence | On Remand and Awaiting Trial, etc. | Total | Undergoing Sentence | Total in Prison | |
| 1978 | 2,424 | 170 | 2,594 | 7.69 | 8.23 |
| 1979 | 2,593 | 149 | 2,742 | 8.23 | 8.70 |
| 1980 | 2,625 | 176 | 2,801 | 8.30 | 8.85 |
| 1981 | 2,300 | 164 | 2,464 | 7.20 | 7.71 |
| 1982 | 2,474 | 169 | 2,643 | 7.77 | 8.30 |
Prisoners by Ethnic Origin—Of the 5018 distinct persons received into penal institutions during 1982, there were 2218 Europeans, 2538 Maoris; 239 Pacific Island Polynesians, and 23 from other ethnic groups.
Classification—To assist the prisons administration, classification committees operate in the main reception prisons (Mt. Eden, Wanganui, Wellington, and Christchurch) and at Auckland Maximum and Auckland Medium Security Prisons. Similar committees also function at the reception youth institutions. An important objective is to ensure that prisoners are held in humane conditions and in the minimun degree of security consistent with public safety.
Classification and Treatment of Inmates—Wherever possible inmates are put to work on some form of constructive employment, whether it be industrial production in a secure institution or food production on a prison farm. In addition and particularly for the younger offender, an attempt is made to teach some particular skills. A variety of evening activities have been introduced into the prisons and training benefit is derived from these activites, whether they be recreational, educational, cultural, individual, or collective.
There are 17 full-time teachers serving in Auckland Maximum Security Prison, Mount Eden Prison, Christchurch Prison, Tongairo Prison Farm, Rangipo Prison Farm, Christchurch Women's Prison, Wellington Prison, Wi Tako Prison; and in Waikeria, Manawatu, and Invercargill Youth Institutions. Part-time teachers supplement the work in these institutions and also provide a service for all other institutions. Teachers seek to help those inmates whose eductional moment is such that they are disadvantaged in the community. They also assist those who are undertaking further education or technical courses either by correspondence or in prison classes. Such courses may be at any level ranging from illiteracy to university degree work. The interest thus shown by inmates is encouraging, as in many cases it gives an inmate better social and employment skills thereby aiding the chances of resettlement.
All institutions receive at regular intervals a supply of well-chosen books from the National Library Service and, in addition, inmates are permitted free use of the library's request service.
Psychological Services—Psychologists from the Department's Psychological Service provide advice and evaluation for the Penal Division on policy planning, institution programme development and implementation, individual programme development and implementation, psychological treatment for individuals and groups, and in-service training for prison officers.
Advice is given on the best way to provide continuing psychological services. A public or private psychological agency, private practitioner, or the Department's own Psychological Service may be suggested. Where psychological work is undertaken for the Penal Division by another agency or individual, the Department's Psychological Service gives them advice and assistance, and monitors and evaluates the service provided.
Earnings—All prisoners are credited with modest earnings based on a system of marks assessed according to diligence. A portion of the earnings may be spent on tobacco, confectionery, and toilet necessities in a prison canteen, and this provides an incentive to good work and conduct. At the same time the loss of this privilege is a useful disciplinary measure. The balance of the earnings is paid to the inmate upon his or her release to help meet financial commitments during the first few days of freedom.
Punishments—An inmate charged with one of the less serious offences against discipline appears before the superintendent, who may impose a penalty or at his discretion refer the case to a visiting justice or to the court. A visiting justice may deal with all cases of offences against discipline and must deal with those which are outside the jurisdiction of the superintendent, unless he thinks they should be brought before the court. The justice's powers of punishment are wider than those of a superintendent. The provisions as to offences and punishments are the same for both prisons and youth institutions.
Pre-release Hostels—The setting up in 1961 of the first pre-release hostel at Invercargill for male borstal inmates was an important step forward toward the goal of bridging the gap between the wholly controlled life of the penal institution and the responsibilities and temptations of free society. As at 31 December 1983 there are 5 such pre-release hostels. This facility is gradually being phased out as release-to-work from prison is increasingly used.
Release to Work—Inmates may be released during the day to engage in private employment. The selection of inmates for this privilege is made, on the recommendation of the superintendent of a penal institution, by a special committee chaired by a district court judge. The inmates are required to contribute part of their wages towards the cost of their maintenance in the institution and part may also be withheld in satisfaction of outstanding fines or debts. The balance is made available to their dependants or is held by the Department of Justice for payment upon final release.
Post-release Care—Offenders serving a sentence of corrective training, preventive detention, or imprisonment for 12 months or more are discharged on probation. For a period of time they must be under the supervision of a probation officer and, during any part of that period falling within the maximum period they could have been detained in an institution, are subject to recall if their behaviour on release is not satisfactory. The period of supervision has a dual purpose—it is for the protection of the community against further offending and it is at the same time an aid to the prisoner to re-establish himself or herself. The step from custody to freedom is a difficult one for prisoners, many of whom require assistance, advice, and guidance during this period.
An offender serving a sentence of imprisonment of less than 12 months is on probation after release if the sentencing court so orders.
Parole System—The introduction of types of long sentences designed to protect society against the hardened criminal has created the need for a procedure to enable a person serving one of these sentences to be released as soon as he/she shows that he/she is fit to be returned to society.
This need is filled by the Prisons Parole Board which has the responsibility of reviewing the cases of all persons sentenced to imprisonment for 5 years or more, preventive detention, or life imprisonment.
The Prisons Parole Board consists of a judge of the High Court as Chairman, the Secretary for Justice, and at least 1 but no more than 5 other members, all except the Secretary for Justice are appointed by the Governor-General for 3 years and are eligible for reappointment.
Categories of persons whose cases were considered by the Prisons Parole Board during each of the latest 5 years were as follows:
| Year | Imprisonment | Preventive Detention | Life Imprisonment |
|---|---|---|---|
| 1978 | 88 | 16 | 23 |
| 1979 | 97 | 16 | 15 |
| 1980 | 81 | 9 | 20 |
| 1981 | 78 | 11 | 23 |
| 1982 | 98 | 9 | 27 |
International Comparison—The following table provides a comparison of numbers and rates of people on probation, parole and held in prisons for selected countries within Asia and the Pacific as at 1 April 1983.
| Country | Prisoners* | Probationers | Parolees | Proportion, per 100 000 Population | ||
|---|---|---|---|---|---|---|
| Total in Prison | Total on Probation | Total on Parole | ||||
* During 1982 the average number of people in prison in United Kingdom was 43 707. †Based on the daily average number of prisoners for March 1983. ‡Federal prisoners only. §Released to serve Extramural Punishment and Compulsory Supervision Orders. ¶Figures as at 1 January 1983. ||Release on licence. | ||||||
| Australia† | 10,029 | 21,535 | 4,896 | 65.4 | 140.4 | 31.9 |
| Canada | 11 459‡ | – | 6,551 | 47.5 | – | 27.2 |
| Fiji | 810 | – | 336§ | 124.6 | – | 51.7 |
| Hong Kong | 5,951 | 3,036 | 2,872 | 112.5 | 57,4 | 54.3 |
| Japan | 54,174 | 23,160 | 6,384 | 45.5 | 19.5 | 5.4 |
| Macau | 448 | – | 12 | 112.0 | – | 3.0 |
| Malaysia | 13,631 | – | – | 97.4 | – | – |
| New Zealand | 2,860 | 6,950 | 1,910 | 88.5 | 215.2 | 59.1 |
| Papua New Guinea¶ | 4,673 | – | – | 147.7 | – | – |
| Singapore | 2,619 | – | – | 107.2 | – | – |
| Sri Lanka | 10,179 | – | 108|| | 67.0 | – | 0.7 |
| Thailand | 75,377 | 5,883 | 1,362 | 158.7 | 12.4 | 2.9 |
| Western Samoa | 206 | 211 | 46 | 130.4 | 133.5 | 29.1 |
JUVENILE OFFENDERS—Children's Courts were originally established in New Zealand under the Child Welfare Act 1925. The Children and Young Persons Act 1974, which came into force on 1 April 1975, renamed these Children and Young Persons Courts.
All offences except murder or manslaughter and minor traffic offences committed by those under 17 years of age are dealt with in Children and Young Persons Courts, the procedure and rules of which differ widely from those of the ordinary courts. In addition, when an offender between 17 and 18 years of age comes before a regular court, the court may order his or her case to be heard in the Children and Young Persons Court.
Unless no other suitable room is available, sittings of the Children and Young Persons Court are not held in a courtroom. Proceedings in Children and Young Persons Courts are not open to the public, and no report of them may be published except with the consent of the presiding judge.
When a child or young person is in need of care, protection or control, the matter is dealt with by way of complaint. This category includes offending by children under 14 years, except where a child over the age of 10 years is charged with murder or manslaughter.
When a young person is brought before a Children and Young Persons Court and charged with any offence, it is not necessary to record a conviction even if the charge is proved. The court has power without recording a conviction to impose any penalty or make any order as if a conviction has been recorded.
In the tables which follow, “Distinct Cases” relate to court appearances, the most serious or most heavily penalised of the charges against each person at one court hearing being selected as the distinct case.
Further information concerning the Children and Young Persons Courts will be found in Section 6A, Social Welfare and Social Work.
The following table shows court appearances for offending for the latest 3 years.
| Decision | Total Charges | Distinct Cases | ||||
|---|---|---|---|---|---|---|
| 1980 | 1981 | 1982 | 1980 | 1981 | 1982 | |
* Includes periodic detention. †Includes probation, ordered to come up for sentence, convicted and discharged and also, from 1 February 1981, community service. | ||||||
| Dismissed or withdrawn | 2,368 | 2,209 | 2,519 | 1,308 | 1,191 | 1,410 |
| Admonished and/or discharged | 3,348 | 2,967 | 4,021 | 2,080 | 1,869 | 2,314 |
| Committed to care of Department of Social Welfare | 1,137 | 832 | 844 | 352 | 247 | 269 |
| Placed under supervision | 6,040 | 5,198 | 5,981 | 2,513 | 2,280 | 2,485 |
| Committed to an institution* | 3,163 | 3,503 | 4,232 | 958 | 1,078 | 1,294 |
| Fined | 3,839 | 3,410 | 4,066 | 2,806 | 2,454 | 2,901 |
| Otherwise dealt with† | 5,377 | 5,031 | 4,670 | 2,387 | 2,315 | 2,174 |
| Total cases, offending | 25 272 | 23 150 | 26 333 | 12 404 | 11 434 | 12 847 |
| Males | 21,536 | 19,855 | 22,631 | 10,268 | 9,507 | 10,766 |
| Females | 3,736 | 3,295 | 3,702 | 2,136 | 1,927 | 2,081 |
Detailed statistics for Children's Court and Children and Young Persons Court offence cases during each of the latest available 4 years are as follows:
| Type of Offence | 1979 | 1980 | 1981 | 1982 |
|---|---|---|---|---|
* Includes forgery and uttering. †Includes traffic offences. | ||||
| Total Charges | ||||
| Sexual offences | 74 | 112 | 60 | 67 |
| Assaults | 835 | 873 | 788 | 911 |
| Other offences against the person | 200 | 228 | 246 | 255 |
| Burglary, and breaking and entering | 5,575 | 5,685 | 5,411 | 6,890 |
| Theft, receiving, and fraud | 5,950 | 6,984 | 6,172 | 7,073 |
| Unlawful conversion | 4,286 | 4,666 | 4,207 | 4,696 |
| Wilful damage and arson | 1,121 | 819 | 905 | 912 |
| Other offences against property* | 185 | 163 | 265 | 219 |
| Offences against good order† | 3,226 | 3,361 | 3,078 | 3,171 |
| Other offences | 1,817 | 2,381 | 2,018 | 2,139 |
| Total | 23 269 | 25 272 | 23 150 | 26 333 |
| Distinct Cases | ||||
| Sexual offences | 53 | 77 | 44 | 39 |
| Assaults | 679 | 736 | 528 | 638 |
| Other offences against the person | 163 | 160 | 168 | 165 |
| Burglary, and breaking and entering | 2,449 | 2,500 | 2,003 | 2,649 |
| Theft, receiving, and fraud | 2,768 | 3,350 | 3,026 | 3,357 |
| Unlawful conversion of vehicles | 1,572 | 1,646 | 1,765 | 1,958 |
| Wilful damage and arson | 519 | 433 | 493 | 515 |
| Other offences against property* | 43 | 54 | 68 | 69 |
| Offences against good order† | 2,015 | 2,020 | 1,948 | 1,915 |
| Other offences | 1,257 | 1,428 | 1,391 | 1,542 |
| Total | 11 518 | 12 404 | 11 434 | 12 847 |
The following table shows court appearances by type of complaint and court decisions for 1981 and 1982. The totals exclude complaints dismissed, withdrawn or struck out.
| Type of Complaint* | 1981 | 1982 | ||||
|---|---|---|---|---|---|---|
| Males | Females | Total | Males | Females | Total | |
* Source: Department of Social Welfare. †Includes failure to exercise parental duty. ‡Includes offending by children. §Includes orders to come up for sentence if called upon and referrals to Children's Boards or District Courts. | ||||||
| Neglect or ill treatment† | 497 | 427 | 924 | 340 | 340 | 680 |
| Beyond control‡ | 903 | 480 | 1,383 | 959 | 472 | 1,431 |
| Truancy | 90 | 76 | 166 | 71 | 77 | 148 |
| Breach of supervision order | 38 | 20 | 58 | 62 | 13 | 75 |
| Total | 1 528 | 1 003 | 2 531 | 1 432 | 902 | 2 334 |
| Court decision | ||||||
| Admonished and/or discharged | 297 | 153 | 450 | 308 | 119 | 427 |
| Admonished and returned to care or supervision | 16 | 12 | 28 | 22 | 6 | 28 |
| Supervision order | 725 | 472 | 1,197 | 665 | 452 | 1,117 |
| Committed to care of Department of Social Welfare | 439 | 342 | 781 | 374 | 304 | 678 |
| Others§ | 51 | 24 | 75 | 63 | 21 | 84 |
| Total | 1 528 | 1 003 | 2 531 | 1 432 | 902 | 2 334 |
CIVIL JURISDICTION: High Court—The jurisdiction of the High Court (previously the Supreme Court) is twofold, original and appellate. It has by statute a general jurisdiction to administer the laws of New Zealand. One important aspect of this original jurisdiction is an inherent power to control inferior courts and judicial tribunals through the writs of certiorari and prohibition. This is essentially a power to determine the limits of jurisdiction of other courts and is to be distinguished from its appellate function by which the High Court reviews a case which was properly heard and determined by a lower court. An appeal to the High Court lies only where it is provided for by statute. With certain exceptions, all cases determined in the District Courts are subject to appeal to the High Court.
The next table shows the number of actions commenced, cases tried, and judgements entered, together with the amounts for which judgments were recorded in the civil jurisdiction of the High Court in the latest 5 years.
| Year | Number of Actions Commenced | Cases Tried | Judgment Recorded (Entered or in Cases Tried) | |||
|---|---|---|---|---|---|---|
| With Jury | Without Jury | Number | Amount Claimed | Amount of Judgments | ||
| $(000) | $(000) | |||||
| 1978 | 4,011 | 35 | 484 | 853 | 11,742 | 8,389 |
| 1979 | 4,399 | 36 | 485 | 990 | 17,242 | 12,891 |
| 1980 | 3,069 | 17 | 481 | 701 | 11,364 | 10,030 |
| 1981 | 2,902 | 8 | 380 | 604 | 21,958 | 18,457 |
| 1982 | 3,292 | 3 | 433 | 709 | 35,799 | 16,816 |
Court of Appeal—During 1983, 109 civil appeals were heard, of which 41 were allowed.
District Courts—Since 1 April 1980, District Courts have been able to hear civil claims cases up to $12,000, whereas previously Magistrates' Courts could only hear claims up to $3,000. However, if the parties agree in writing that the court shall hear their case it has jurisdiction whatever the amount claimed. In the exercise of this jurisdiction it may grant the same remedies, legal and equitable, as the High Court.
The following table shows the number of plaints entered, cases disposed of, amounts sued for, and amounts for which judgement was recorded in the District Courts during the latest 5 years.
| Year | Plaints Entered | Cases Disposed of | |||
|---|---|---|---|---|---|
| Number | Total Amount Sued for | Number | Total Amount Claimed | Total Amount for Which Judgment Entered | |
| $(000) | $(000) | $(000) | |||
| 1978 | 142,262 | 45,775 | 83,085 | 28,947 | 19,892 |
| 1979 | 123,515 | 49,290 | 71,812 | 23,766 | 20,539 |
| 1980 | 127,904 | 73,788 | 70,199 | 29,835 | 26,435 |
| 1981 | 125,061 | 79,622 | 70,659 | 35,235 | 30,795 |
| 1982 | 117,953 | 98,662 | 61,103 | 29,427 | 34,978 |
COMPENSATION FOR VICTIMS OF CRIME—The Criminal Injuries Compensation Act 1963 introduced the first statutory scheme in the world for compensation by the State to persons injured by crimes of violence and to the dependants of persons killed by such acts.
The Accident Compensation Scheme, administered by the Accident Compensation Corporation, now caters for all personal injury by accident in New Zealand, and thus covers the whole range of listed criminal injuries, including pregnancy by rape and criminal infection with disease. This scheme is designed as a fund of first resort.
LEGAL AID—The Legal Aid Act 1969 introduced from 1 April 1970 gave effect to the principle that no persons should be prevented by lack of means from having their grievances heard and determined fairly by the courts of the land. The aid is available for almost all civil proceedings other than dissolution of marriage. In order to receive legal aid the applicant must have a sufficiently meritorious case. Except in special cases of hardship, every aided person is required to make a contribution of $25 towards the cost of proceedings, and is also liable to make an additional contribution proportionate to his or her income and capital resources.
The Department of Social Welfare is responsible, in accordance with the Act, for investigating the resources of persons applying for legal aid; for assessing their “disposable income” and “disposable capital” within the statutory limits and reporting to district committees on the maximum contribution, if any, that applicants should be expected to pay towards the cost of the proceedings in respect of which legal aid is sought.
THE LAW AND THE FAMILY—The main features of principal family law statutes are set out below.
Matrimonial Property Act 1976—This Act reforms the law of matrimonial property. It recognises the equal contribution of husband and wife to the marriage partnership and provides for a just division of the matrimonial property between the spouses when their marriage ends by separation or dissolution.
Domestic Protection Act 1982—This Act aims to mitigate the effects of domestic violence by providing for non-molestation orders, non-violence orders, and emergency occupation and tenancy orders.
Family Proceedings Act 1980—This Act establishes one ground only for the dissolution of marriage (formerly divorce)—that “the marriage has broken down irreconcilably”. However, the Act requires that the dissolution of marriage is to be preceded by 2 years living apart. A counselling referral service is provided. Husband or wife can ask a Registrar of a Family Court to arrange counselling if they have marriage problems. The Act aims to help couples to come to agreement over disputes without going to a formal court hearing. The Act recognises that husband and wife have equal rights and responsibilities in maintenance matters.
Guardianship Amendment Act 1980—This Act requires custody applications to be heard in a Family Court and requires the judge to appoint a lawyer to represent children's interests. The concept is emphasised that the more suitable parent is to be given custody of a child or children irrespective of the sex of the parent or age of the children. An offence of wilfully hindering access to children is created by the Act and the court is given power to require medical, psychiatric, or psychological reports on children. The Act also gives to Family Courts a power to call witnesses.
Family Court Act 1980—This Act provides for the establishment of Family Courts. The courtrooms are less formal; the usual court procedures and ritual are simplified; and the judges do not wear wigs and gowns. In addition, the sittings are in private and are confidential.
Social Security Amendment Act 1980—This Act introduces a scheme known as the Liable Parent Contribution Scheme which aims to provide a fair and uniform method of deciding the contributions a liable parent must make to support his or her children if the other parent is receiving a Domestic Purposes Benefit.
Counselling and mediation provisions of the Family Proceedings Act have already affected the numbers of separation, maintenance and custody orders made by the courts. Maintenance orders, particularly for ex-nuptial children, have also been affected by the liable parent contribution legislation operative from 1 April 1981.
The following tables give statistics for the year ended 31 December 1982 of orders made under the provisions of the Family Proceedings Act and the Guardianship Act The Domestic Protection Act did not come into force until 1 March 1983.
| Nature of Order | Orders Made |
|---|---|
| * Custody, 1451, guardianship, 20; Custody order in favour of mother, 1058; in favour of father, 214, in favour of other parties and divided, 179. | |
| Separation | 848 |
| Maintenance (married parties) | 565 |
| Custody or guardianship* | 1,471 |
| Non-molestation | 291 |
| Occupation of matrimonial home | 352 |
| Maintenance (extra-marital) | 341 |
| Paternity | 891 |
Relative ages of parties when separation orders were made in 1982 are given below.
| Age of Husband (in Years) | Age of Wife (in Years) | |||||||
|---|---|---|---|---|---|---|---|---|
| 16–19 | 20–24 | 25–29 | 30–34 | 35–39 | 40 and Over | Not Known | Total | |
| 16–19 | – | 2 | – | – | 1 | – | – | 3 |
| 20–24 | 5 | 60 | 7 | – | 1 | – | 2 | 75 |
| 25–29 | 3 | 67 | 72 | 8 | 2 | 2 | – | 154 |
| 30–34 | 1 | 12 | 74 | 65 | 10 | 3 | – | 165 |
| 35–39 | – | 3 | 11 | 75 | 47 | 9 | – | 145 |
| 40 and over | – | 2 | 6 | 22 | 57 | 129 | – | 216 |
| Not known | – | 1 | 5 | 2 | 3 | 3 | 76 | 90 |
| Total | 9 | 147 | 175 | 172 | 121 | 146 | 78 | 848 |
The next table shows, in the case of separation orders for 1982, the age of wife at separation and duration of marriage.
| Duration of Marriage (in Years) | Age of Wife (in Years) at Date of Separation Order | |||||||
|---|---|---|---|---|---|---|---|---|
| 16–19 | 20–24 | 25–29 | 30–34 | 35–39 | 40 and Over | Not Known | Total | |
| Under 1 | – | 2 | 2 | – | – | 1 | 1 | 6 |
| 1 | 2 | 10 | 4 | 1 | 3 | – | 2 | 22 |
| 2 | 4 | 32 | 13 | 2 | 1 | 3 | 1 | 56 |
| 3 | 3 | 31 | 7 | 4 | 1 | 4 | 7 | 57 |
| 4 | – | 33 | 7 | 4 | 2 | 4 | 3 | 53 |
| 5 | – | 18 | 15 | 5 | 1 | 4 | 7 | 50 |
| 6 | – | 13 | 19 | 4 | 5 | 5 | 4 | 50 |
| 7 | – | 4 | 30 | 6 | 3 | – | 2 | 45 |
| 8 | – | 4 | 24 | 6 | 2 | 4 | 4 | 44 |
| 9 | – | – | 17 | 10 | 2 | 2 | 2 | 33 |
| 10–14 | – | – | 37 | 108 | 27 | 9 | 10 | 191 |
| 15–19 | – | – | – | 20 | 59 | 24 | 13 | 116 |
| 20–24 | – | – | – | – | 15 | 38 | 5 | 58 |
| 25 and over | – | – | – | – | – | 48 | 3 | 51 |
| Not known | – | – | – | – | – | 14 | 16 | |
| Total | 9 | 147 | 175 | 172 | 121 | 146 | 78 | 848 |
Numbers of children involved in custody orders granted in 1981 are shown below.
| Item | Number of Children Involved | Total | ||||||||
|---|---|---|---|---|---|---|---|---|---|---|
| 1 | 2 | 3 | 4 | 5 | 6 | 7 | 8 | 9 and Over | ||
| Numbers of orders | 519 | 541 | 264 | 90 | 27 | 10 | – | – | – | 1,451 |
| Total children | 519 | 1,082 | 792 | 360 | 135 | 60 | – | – | – | 2,948 |
Appeals to the High Court against decisions in the Domestic Proceedings Courts were tabulated for the first time in 1978. The following table shows the number of appeals heard and allowed in 1978 and subsequent years.
| Year | Appeals Heard | Appeals Allowed |
|---|---|---|
| 1979 | 234 | 91 |
| 1980 | 165 | 76 |
| 1981 | 198 | 70 |
| 1982 | 103 | 34 |
FURTHER INFORMATION—Further information on justice, crime, the Police, and related subjects will be found in the following publications:
Justice Statistics—Department of Statistics (annual).
Report of the Department of Justice (Parl. paper E. 5).
Report of the New Zealand Police (Parl. paper G. 6).
Crime in New Zealand—Department of Justice, 1974.
Juvenile Crime in New Zealand—Department of Social Welfare, 1973.
Royal Commission on the Courts (1978).
The New Zealand Policeman—N.Z. Institute of Public Administration.
N.Z. Supreme Court Criminal Statistics: Time Series to 1976 (Department of Statistics bulletin).
Report of the Prisons Parole Board (Parl. paper E. 5A).
Reports of Borstal Parole Boards (Parl. paper E. 5B).
Annual Report of the Legal Aid Board (Parl. paper E. 7).
Social Trends in New Zealand—Department of Statistics, 1977.
Family Statistics in New Zealand—Department of Statistics, 1978.
The Prediction of Juvenile Offending: A New Zealand Study—Joint Committee on Young Offenders.
NEW ZEALAND POLICE—New Zealand's national police service was established as a civil law-enforcement body, following the passing of the Police Force Act in 1886. Previously police work had been in the hands of the New Zealand Armed Constabulary and provincial police forces.
The Armed Constabulary were raised in 1846 and 1867 to fight in the Maori-Pakeha Wars and to maintain civil order. The abolition of the provincial police forces because of a requirement for centralised control coincided with the demise of the Armed Constabulary.
Today the Police service is controlled under the Police Act 1958.
Organisation—The national administrative and operational control of the Police service is vested in a Commissioner who is responsible to the Government through a Minister of Police.
For operational purposes New Zealand is divided into 16 police districts. Auckland District, by virtue of its greater population, is controlled by an assistant commissioner. Other districts, because of their varying size, are commanded by officers ranging in rank from chief inspector to deputy assistant commissioner. Police district commanders are responsible for the general preservation of peace and order, for the prevention of offences, and for the detection of offenders in their areas of command.
Policing is maintained by a system of mobile patrols and foot “beats” co-ordinated by a communications network.
In addition to the enforcement of the criminal law and the Police Offences Acts, there are various statutes of a regulatory nature which members of the Police are called upon to administer, wholly or partly, such as the Arms Act, Sale of Liquor Act, Gaming and Lotteries Act, Misuse of Drugs Act, Transport Act, Pawnbrokers Act, and the Secondhand Dealers Act. They also undertake certain inquiries and other duties on behalf of other departments of the Government service.
Police in country districts in some cases hold additional appointments such as registrars and bailiffs at District Courts, probation officers, and honorary fishery officers.
Recruiting—Recruit applicants for the police must be between 19 and 34 years of age. All applicants must meet certain minimal physical qualifications, otherwise they are ineligible to lodge an application. Different physical requirements are made for female applicants, but otherwise all applicants must meet the same strict educational, character, and medical standards.
On appointment, recruit trainees attend an 18-week training course at the Police College. This course was recently extended to include additional training to assist police officers to cope with the changing role of society.
The large recruit intakes of 3 a year have now been replaced by a “trickle” system. This new scheme allows for the recruitment of smaller numbers of new trainees on a more regular basis as and when required.
Examinations for promotion to non-commissioned and commissioned ranks are aimed at selecting members who have shown the necessary potential to become effective supervisors and administrators.
Members who show a particular aptitude for the various specialist sections within the Police receive additional training at the Police College and in the field.
Strength—The effective strength of the Police at 31 March 1983 was 5014 sworn personnel, including 204 female members who have equal status and opportunity with their male counterparts. In addition to these members the department employed 707 civilian staff.
Transport—At 31 March 1983 the Police vehicle fleet totalled 923, including 725 cars, 124 vans of various types, 31 landrovers, 43 station sedans, estate cars, command vehicles, omnibuses, trucks, and other vehicles.
Crime Situation—For the year ended 31 December 1982, 383 841 offences were reported to the Police. This was 6 percent more than for 1981 when 362 010 offences were reported. The overall clearance rate was 48.4 percent compared with 47.8 percent in 1981.
Violent offences increased by 10.4 percent from 16 860 reported during 1981 to 18 621 reported during 1982. During the year 35 murders were reported which was 14 less than for 1981. One murder reported during 1982 is still uncleared. While the number of murders reported has declined, attempted murder and manslaughter offences have increased greatly. Manslaughter has increased from 11 offences reported during 1981 to 27 reported in 1982, an increase of 145 percent.
In terms of overall offending, drug offences not involving cannabis increased during 1982 by 4.6 percent. However, this increase is mainly in the area of stimulants and depressants. Hard drugs such as cocaine, heroin, LSD, opium and morphine all show a strong decline in reported offending. However cannabis offending has shown a strong upward trend, and increased 32 percent during 1982 to 10 775 offences. This reflects both the increased local cultivation and the willingness on the part of the public to report sightings.
Offences involving dishonesty, which comprise 63 percent of all reported offences, rose by 8.3 percent from 233 554 in 1981 to 242 128 reported during 1982. The clearance rate improved to 30.1 percent compared with 28.6 percent in 1981. Burglary increased 14.6 percent and this increase was especially marked in the area of major burglaries where property over the value of $1,000 was involved. Property damage offences increased by only 0.5 percent during 1982. Property abuses, however, increased by 6.4 percent with 19 146 offences reported during 1982 as compared with 17 993 for 1981.
During 1981, children under 17 years were responsible for 27 percent of cleared offences and 60 percent of all offenders were in the under 20 age group. Some 83 percent of offenders were male and the remaining 17 percent female.
Property to the value of $125,603,431 was criminally appropriated during the year, of which $58,013,891 worth was recovered representing a recovery rate of 46.1 percent. Motor vehicles formed the largest group with 22 599 vehicles valued at $57,833,877 stolen. Of those stolen, 20 701 valued at $47,287,423 were recovered, which is a recovery rate of 81.7 percent.
Police attended 32 608 burglar alarms, 17 465 domestic disputes, 26 680 persons acting suspiciously, 3784 noisy parties; 5694 sudden deaths, 3717 vehicle collisions, and 16 365 other requests by the public for assistance. Overall, the number of incidents dealt with by the Police increased by 9.4 percent.
National Drug Intelligence Bureau—During 1982 a total of 10 423 persons were charged with drug related offences, an increase of 2406 over the previous year. While the total number of drug offences overall increased by 30 percent there was a significant drop in prosecutions involving hard drug abuse. Offences involving cocaine, heroin, LSD, morphine and opium, were reduced to very low levels. Cannabis offending has increased greatly in all areas, and during 1982 the largest number of offences ever were reported in this area. Seizures of cannabis plants numbered 46 959 and of leaf, 479.780 kilos, making these the largest since figures were first compiled in 1973.
Seizures of heroin and morphine continue to remain low due to the overall scarcity throughout the year of these drugs. A total of 556.293 gms of heroin and only 1.915 gms of morphine were seized which supported intelligence indicating supplies were at a low level. During the last quarter however, indications were that more heroin was available.
Lysergic acid diethylamide (LSD) seizures were low with tabs totalling 1227. While the general popularity of the substance continues to fluctuate, there was a marked increase in its use in the latter part of the year when LSD was readily available in the main centres throughout the country.
One seizure of over a thousand tabs of 4 Bromo DMA from a ship in December accounted for much of the total of 2482 tabs recovered.
Considerable advances were made during 1981 in disrupting the flow of class A and B drugs into New Zealand. This continued throughout 1982 with several major investigations resulting in the arrest of those responsible for importing and dealing in these drugs. Three police officers based overseas have contributed to the success in drug enforcement throughout the year.
The power of search without warrant under the Misuse of Drugs Act 1975 was used on 484 occasions during the year. On 358 of the occasions drugs were seized. During 1982, 25 drug-related deaths occurred.
Interception Warrants—In accordance with the Misuse of Drugs Amendment Act 1975, 21 interception warrants were issued during 1982 (4 of these were multiple warrants involving several locations at one time) and 7 were renewed.
The average duration in which listening devices were used was 24 days, with the longest individual period being 68 days. Twenty-four prosecutions have resulted through evidence obtained directly or indirectly from the use of listening devices.
Armed Offenders Squads—Since the formation of armed offenders squads in 1964, weapons have been fired at individuals on 6 occasions. Deaths resulted in 4 of these incidents. On 2 occasions the 357 Smith and Wesson revolver with semi-jacketed ammunition (soft-nosed bullets) was used during squad operations. In 1 case a person was injured, and death resulted in the other. A total of 177 members throughout the country now perform armed offenders squad duties. During 1982 armed offenders squads attended 130 incidents compared with 131 in 1981. The number of callouts to gang-related incidents in 1982 was 15, compared to 14 in 1981.
Anti-Terrorist Squad—The anti-terrorist squad of 30 selected members of armed offenders squads are provided with specialised training to enable them to deal with a terrorist situation. They exercise with highly trained police hostage negotiators. During 1982 training was carried out in Auckland, Wellington, and Christchurch, where sections of the squad are based. Training has also been carried out with Ministry of Defence Forces.
Search and Rescue—There were 858 police-controlled search and rescue operations during 1982–83, compared with 762 in 1981–82. In 769 of the 1982–83 operations the police were assisted by volunteers.
General—To ensure that they keep abreast with developments in other law enforcement agencies throughout the world the Police continuously review and experiment with new policing concepts and organisational changes.
The following table shows figures of crimes and offences during 1980, 1981, and 1982.
| Offence | Year Ended December | ||
|---|---|---|---|
| 1980 | 1981 | 1982 | |
| * Includes burglary (54 462 in 1980, 58 829 in 1981, and 67 447 in 1982) and theft (101 983 offences in 1980, 102 021 in 1981, and 108 548 in 1982). | |||
| Violence | 15,612 | 16,860 | 18,621 |
| Sexual offences | 2 552x | 2 693x | 2,953 |
| Drugs and anti-social behaviour | 48 665x | 53 228x | 49,670 |
| Dishonesty* | 191 407x | 215 582x | 242,128 |
| Property damage | 20 497x | 22 016x | 23,762 |
| Property abuses | 15 037x | 16 608x | 19,146 |
| Administrative | 1 299x | 1 871x | 1,783 |
| Traffic | 19 386x | 21 581x | 25,778 |
| Total | 349 193 | 362 010 | 383 841 |
Youth Aid Section—The total staff employed on youth aid work throughout the country, as at 31 March 1983, was as follows:
| General youth aid officers | 70 |
| General youth aid officers (part-time) | 45 |
| Police education officers | 25 |
| Youth liaison officers | 6 |
| National Headquarters | 4 |
| Total | 150 |
With the introduction of the law-related education programme, the role of police education officers has changed. Formerly they were involved mainly in giving talks to children. Now their work involves acting as a resource for teachers, planning and helping teach units of work, and liaising with schools.
General youth aid officers have also continued their involvement in schools, youth organisations, and adult groups.
Further Information—Further information on the police and crime will be found in the following publications.
Report of the New Zealand Police (Parl. paper G. 6.).
Report of the Department of Justice (Parl. paper E. 5).
Justice Statistics—Department of Statistics.
Crime in New Zealand—Department of Justice, (1974).
Juvenile Crime in New Zealand—Department of Social Welfare (1973).
The New Zealand Policeman—New Zealand Institute of Public Administration.
Directory of Official Information—State Services Commission.
Section 8A Justice may also be consulted.
NEW ZEALAND FIRE SERVICE—An integrated fire service controlled directly by the New Zealand Fire Service Commission was established by the Fire Services Act 1975. One of the main aims of the Act was to avoid the divided control which was a feature of the previous system. However, the volunteer system remains a central feature of the reorganisation.
The New Zealand Fire Service is organised in a 4-tier structure as follows:
The New Zealand Fire Service Commission: The successor of the Fire Service Commission has 3 commissioners, one (the chairman) with a special knowledge of administration, while the other 2 have senior operational experience in the fire service. The Secretary for Internal Affairs is also a member of the Commission.
Fire Regions: There are 6 administrative regions based in Auckland, Hamilton, Palmerston North, Wellington, Christchurch, and Dunedin. Their primary task is to co-ordinate their operational units to work in a close-knit organisation.
Fire Areas: The fire regions are divided into fire areas, of which there are 20 in all. They are responsible for developing the fire fighting resources of their areas and for the training and operational efficiency of the brigades in districts within them.
Fire Districts: Every united urban fire district, urban fire district, and secondary urban fire district which existed immediately prior to the commencement of the Fire Service Act 1975, was declared a fire district under the new Act. There has been some adjustment of fire districts since 1976. As at 1 November 1983 they numbered 269.
The New Zealand Fire Service Since 1 April 1976—From 1 April 1976 the operation and administration of the New Zealand Fire Service became the total responsibility of the New Zealand Fire Service Commission dealing through duly appointed commanders of regions, areas, and districts. Twenty of the 269 fire districts are served mainly by permanent firemen but with a leavening of nearly 1000 volunteers. The remaining 249 fire districts are manned by volunteer firemen who are an essential part of the New Zealand Fire Service. During 1983 there were 2539 employees and 7309 volunteer firemen and fire policemen. Two women are now employed as operational firemen in Auckland, and facilities for women are provided at all permanently manned fire stations.
The New Zealand Fire Service Commission currently owns 1265 vehicles and 570 buildings.
The Fire Service Act 1975 revised the apportionment of costs for the annual estimates of the New Zealand Fire Service between the insurance industry (including the levy on fire insurance policies) and the Government in the ratio of almost 3:1. This aspect is being reviewed at present by the Government.
Fire Safety—Under Part II of the Fire Service Act the Fire Service Commission is required to take an active and co-ordinating role in the promotion of fire safety. Giving effect to this is a Fire Safety Division at National Headquarters, with Fire Safety Departments in each of the fire districts served by permanent firemen providing a New Zealand-wide fire safety survey and advisory service.
Fire Calls—The total number of incidents attended by brigades throughout New Zealand during 2 recent years are shown below.
| Incidents | 1981 | 1982 |
|---|---|---|
| * An exposure fire is where a fire originating in 1 property spreads to another property. Because exposure fires are included in property call details, but refer to 1 incident only, they are subtracted from total fire incidents to reflect a clear total number of incidents attended to by the New Zealand Fire Service. | ||
| Fires— | ||
| Structure fires | 5,209 | 5,407 |
| Vehicle fires | 2,465 | 2,458 |
| Other property fires | 545 | 469 |
| Oven fires | 845 | 730 |
| Chimney fires | 2,907 | 3,058 |
| Rubbish fires | 4,190 | 4,885 |
| Tree, grass, and scrub fires | 4,488 | 5,691 |
| Other fires | 228 | 354 |
| 20,877 | 23,052 | |
| Less exposure fires* | 166 | 164 |
| Total, fire incidents | 20 711 | 22 888 |
| Non-fire incidents— | ||
| Flammable liquid spills (under 30 litres) | 3,373 | 3,192 |
| Overpressure or rupture (no fire) | 43 | 30 |
| Emergency medical calls (assistance to other agencies) | 181 | 246 |
| Rescues (vehicle extraction, etc.) | 1,008 | 1,015 |
| Chemical, hazardous substances, and major spills | 1,037 | 1,049 |
| Special services (pump out, lock in/out, etc.) | 1,277 | 1,217 |
| Good intent calls (no action required at scene) | 5,662 | 6,265 |
| Total, non-fires | 12 581 | 13 014 |
| False alarms— | ||
| Malicious | 1,886 | 1,767 |
| Defective apparatus or installation | 5,623 | 5,730 |
| Accidental | 2,601 | 2,705 |
| Total, false alarms | 10 110 | 10 202 |
| Total, incidents attended | 43 402 | 46 104 |
Loss of Life—Thirty-six people died as a result of property fires during 1982, compared with 52 in 1981, and 44 in 1980. In 1982 the most common suspected cause of fires resulting in fatalities were vehicle accidents (6 deaths), falling asleep (3 deaths), children playing with matches (3 deaths) and cases where the victim was unconscious, drugged, drunk or suffering from a physical or mental impairment (3 deaths). Seven deaths resulted from fires of which the cause was unknown. Twenty-two of the fatalities occurred in private houses or flats, and 9 in private cars.
Further Information—Further detailed fire statistics are contained in the New Zealand Fire Service Commission's Annual Report to Parliament (Parl. paper G. 8).
CIVIL DEFENCE—The planning, organisation, co-ordination, and implementation of the measures necessary for the safety of the public (except for those emergencies which can be dealt with by the normal emergency services) are described as civil defence. Communities using their own resources and drawing upon volunteers have an obligation to take the steps necessary to prevent or reduce loss of life or distress. Assistance to territorial local authorities in meeting their obligations and the co-ordination of the support of Government planning and resources are the responsibilities of the Ministry of Civil Defence. The declaration of a state of “civil defence emergency” grants special powers to territorial local authorities, to civil defence controllers appointed by them, to the Police, and to the Director and Commissioners of the Ministry of Civil Defence.
The Ministry of Civil Defence was established in April 1959 as an integral part of the Department of Internal Affairs. The current concept of civil defence dates from December 1983 when the Civil Defence Act came into force, and replaced the Civil Defence Act 1962.
Every territorial local authority has an obligation to prepare a civil defence plan to set up a civil defence organisation, and to appoint a Local Controller of Civil Defence for the purpose of dealing with a disaster in its district should the use of civil defence measures be warranted. Neighbouring territorial authorities may unite for civil defence purposes and then together they have an obligation to prepare a combined district civil defence plan, to set up a combined civil defence organisation, and to appoint a Controller of Civil Defence. At 31 December 1983 there were 125 local and combined district civil defence organisations (i.e., excluding regional organisations).
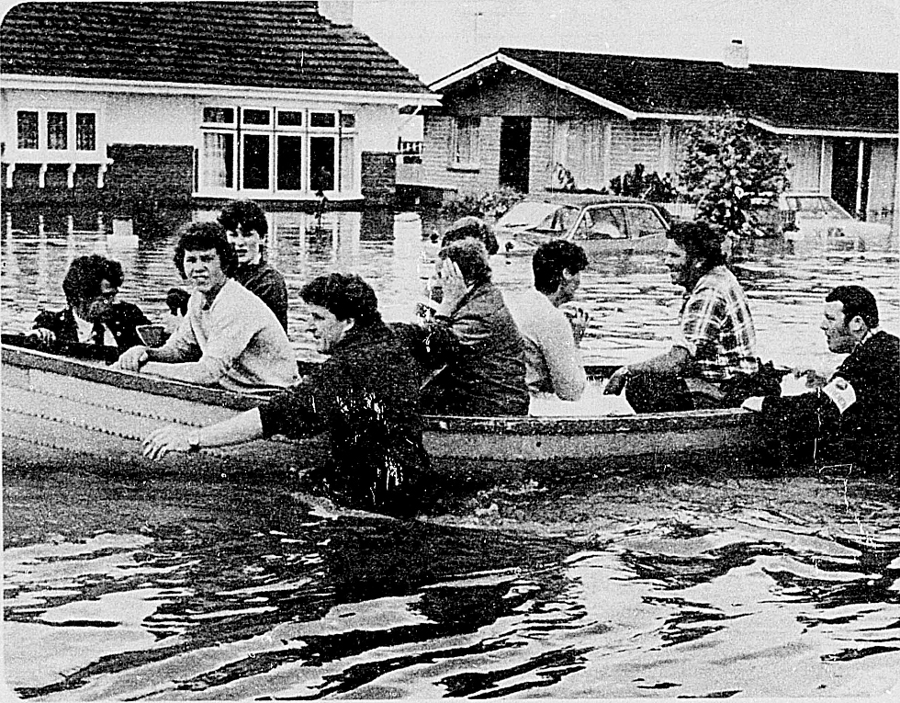
Every regional or united council has an obligation to prepare a civil defence plan, to appoint a Regional Controller of Civil Defence, and to set up the organisation necessary for dealing with a disaster in its region beyond the capability of any one particular local or combined district civil defence organisation. The Ministry appoints a Commissioner of Civil Defence for each civil defence region. Each commissioner has several civil defence regions in his charge grouped for administrative convenience into the Northern, Central or Southern Civil Defence Zone.
Each commissioner exercises powers and functions established in the Civil Defence Act 1983 under the general direction of the Director of Civil Defence in Wellington. The National Civil Defence Committee comprising the permanent heads of 14 Government departments most closely involved in disaster relief measures, together with the Chief of Defence Staff and the Chairman of the Fire Service Commission, has a responsibility to advise and assist the Minister and Director of Civil Defence in the planning and implementation of civil defence measures. Representatives appointed by members of this committee form regional civil defence advisory groups at Auckland, Palmerston North, Wellington, and Christchurch to provide a like service for Civil Defence Commissioners.
A National Civil Defence Operational Headquarters is established in the sub-basement of the executive wing of Parliament Buildings and is in the charge of the Director of Civil Defence. This headquarters is ready for use but is activated only when required. It provides the means for co-ordinating the use of all Governmental and non-Governmental resources and, where necessary, for the control of the overall civil defence effort where a disaster situation makes demands which cannot be met by a Regional or United Council and the appropriate Civil Defence Commissioner. Each commissioner has an established operational headquarters (Auckland, Palmerston North, and Christchurch) to enable him to meet his operational responsibilities towards each civil defence region in his zone.
The civil defence regions are; Northland, Auckland, Waikato, Thames Valley, Bay of Plenty, Tongariro, East Cape, Hawke's Bay, Wairarapa, Taranaki, Wanganui, Manawatu, Horowhenua, Wellington, Nelson Bays, Marlborough, West Coast, Canterbury, Aorangi, Coastal-North Otago, Clutha-Central Otago, and Southland.
Further Information—The Report of the Department of Internal Affairs (Parl. Paper G. 7) contains further information on the Civil Defence.
Table of Contents
Prior to 1 January 1964 there were 3 separate departments—Navy, Army, and Air—each responsible directly to the Ministry of Defence. Although this system was effective in the immediate post-war period, it became clear by the early 1960s that there was a need for a more fully co-ordinated system.
Following the passing of the Defence Act 1971 administration of the Armed Forces became more centralised.
For further information on the evolution of the Ministry of Defence refer to the 1982 Yearbook.
CONTROL AND CO-ORDINATION OF DEFENCE—The Governor-General as Commander-in-Chief is empowered to raise and maintain the Royal New Zealand Navy, the New Zealand Army, and the Royal New Zealand Air Force. These forces, together with public servants appointed under the State Services Act 1962, constitute the Ministry of Defence, which is responsible under the Minister for the central control of the whole field of national defence.
The Secretary of Defence is permanent head of the ministry and principal civilian adviser to the Minister, responsible in particular for co-ordinating the business of the ministry as a whole, including long-term financial planning as well as supervision of defence expenditure. In accordance with the State Services Conditions of Employment Act 1977, the Secretary of Defence prescribes the pay, allowances, expenses, and other conditions of employment of all servicemen.
The Chief of Defence Staff is principal military adviser to the Minister; he is convenor and chairman of the Chiefs of Staff Committee and conveys its advice to the Minister. Like the Secretary of Defence, he carries out inspections of the services and reports to the Minister.
Defence Council—The Defence Council is responsible for the administration and, through the officers appointed for the purpose, the command of the New Zealand Armed Forces. The Defence Council consists of the Minister as chairman, the Secretary of Defence and the Chief of Defence Staff as deputy chairmen, and the Chiefs of Staff of the 3 services. The Secretary to the Treasury and the Secretary of Foreign Affairs are associate members. In addition, the council may from time to time co-opt officers of other departments of State. Without limiting the duties of the Secretary of Defence or the Chief of Defence Staff, the Defence Council assists the Minister in formulating defence policy or recommendations thereon.
DEFENCE POLICY—The objectives of New Zealands' defence policy as outlined by the 1983 Defence Review are:
To preserve the security and integrity of New Zealand and its 200-mile Exclusive Economic Zone.
To promote security and stable development in the South Pacific by providing, on request, practical assistance in defence matters (including training, exchanges and exercises) to the countries of the region.
To be able to respond militarily to low-level emergencies within the South Pacific, e.g., in response to requests for assistance from countries in the region.
To maintain and strengthen the defence relationships with our ANZUS partners.
To develop further our defence co-operation with Australia, including defence supply and mutual logistic support.
To demonstrate a commitment to the maintenance of peace and stability in South-east Asia by continuing the mutually beneficial military training assistance arrangements, exchange programmes and exercises with the countries of the region.
International Defence Relationships: ANZUS—Under this tri-partite security treaty which came into force on 29 April 1952, Australia, New Zealand, and the United States undertook to defend each other against attack. Meetings of the ANZUS Council, which consists of the foreign ministers of the treaty partners, are generally held once a year. At the 31st annual meeting of the ANZUS Council held in Canberra in June 1982, Ministers reaffirmed their commitment to the ANZUS Treaty and confirmed the high priority each partner placed upon a regular programme of naval visits to each other's ports in the Asia-Pacific region.
The Five Power Defence Arrangements—The basis of the Five Power Defence Arrangements is not a formal treaty but a statement incorporated in the communique of the meeting of Ministers of the 5 powers (Britain, Malaysia, Singapore, Australia, and New Zealand) held in London in April 1971. At that meeting the Ministers declared, in relation to the external defence of Malaysia and Singapore, “that in the event of any form of armed attack externally organised or supported or the threat of such attack against Malaysia or Singapore, their governments would immediately consult together for the purpose of deciding what measures should be taken jointly or separately in relation to such attack or threat”.
Under these arrangements the Australian Government maintains an RAAF presence in Malaysia, while the New Zealand Government maintains a contingent in Singapore (known as New Zealand Force South-east Asia).
The New Zealand Government has decided that, although the Singapore Government has indicated that the Force is welcome to remain, as a matter of principle the Force should return home to New Zealand as soon as practicable. No date has been set however.
Manila Treaty—Australia, Britain, France, New Zealand, Pakistan, the Philippines, Thailand, and the United States signed the South-east Asia Collective Defence Treaty, or the Manila Treaty, on 8 September 1954. Although the South-east Asia Treaty Organisation (SEATO) established under the treaty was phased out in 1977, the treaty was not abrogated.
Missions of the New Zealand Armed Forces—To achieve the objectives of New Zealand's defence policy, the armed forces have the following missions:
To provide forces capable of quick response to any threat to New Zealand itself, of controlling the Exclusive Economic Zone, and at the same time of upholding New Zealand's wider national interests in the area of prime concern—the New Zealand region and the South Pacific.
To demonstrate the force of New Zealand's commitment to ANZUS by participating effectively alongside allied units in military exercises
To maintain trained, mobile, and self-sufficient forces to provide, on request, military assistance, technical aid, surveillance of outside activities, search and rescue, and disaster relief services in the South Pacific.
To maintain a capability for limited support of national research and other interests in Antarctica.
To undertake limited joint training and exercises by invitation in South-east Asia, as a demonstration of continuing interest in stability and security in that region, and to continue to respond to requests from the ASEAN and South Pacific countries for limited military training in New Zealand.
To provide a capability to contribute to international peacekeeping operations.
To provide assistance to the New Zealand community.
CO-OPERATION WITH OTHER COUNTRIES—To facilitate exchanges on military matters, New Zealand defence liaison staffs are maintained in London, Canberra, Washington, Kuala Lumpur, Singapore, Jakarta, and Bangkok. In addition, some members of these staffs are also accredited to other countries. The United Kingdom, Australia, and Malaysia have service representatives attached to their respective High Commissions in Wellington and there are service attachés on the staffs of the French, Indonesian, and United States Embassies in Wellington. Several other countries have service attachés accredited to, but not resident in, New Zealand.
DEFENCE SCIENCE—Co-ordination of defence science policy is carried out by the Ministry of Defence in conjunction with the Department of Scientific and Industrial Research, and the National Research Advisory Council. Commonwealth and allied co-ordination is achieved by membership of specialised bodies.
The Defence Scientific Establishment in Auckland is the main research centre in the Ministry of Defence and carries out research in fields which involve all 3 services. The establishment also undertakes metallurgical and other specialised studies, such as underwater acoustics, electronics and computer science, related mainly to the adaption of equipment to the New Zealand environment.
ARMED FORCES OVERSEAS: Five Power Defence Arrangements—The Anglo-Malaysian Defence Agreement, under which New Zealand had maintained forces in Malaysia as part of a Commonwealth Strategic Reserve was terminated in October 1971. It was replaced by the Five-power Defence Arrangements, effective November 1971, by which Australia, New Zealand, and the United Kingdom separately concluded agreements with Malaysia and Singapore. Within the framework of these arrangements, andat the request of the governments of Malaysia and Singapore, the 3 first-mentioned nations agreed to station elements of their armed forces in these countries. These elements were initially grouped into the ANZUK force, but the decision by Australia in 1973 to withdraw a substantial portion of its ground forces from the region led to a decision by New Zealand and the United Kingdom to establish separate national command arrangements. Accordingly, with effect from 31 January 1974, command of the New Zealand elements of the ANZUK force was transferred to the Commander, New Zealand Force South-east Asia. This New Zealand contribution to stability in the area currently comprises an infantry battalion, a utility helicopter support unit, a headquarters, periodic deployment of RNZAF strike aircraft to the area, and sundry supporting units. The withdrawal of British Forces from the area was completed in 1976.
United Nations Observers—New Zealand currently has 4 United-Nations observers stationed in the Middle East.
Sinai Multinational Force and Observers—New Zealand is a contributor to the Multinational Force and Observers (MFO) in Sinai which was set up to verify compliance with the terms of the Peace Treaty between Egypt and Israel. Australia and New Zealand are jointly providing the helicopter element of the MFO Aviation Support Group. New Zealand's contribution is 35 military personnel and 2 Iroquois helicopters.
MUTUAL ASSISTANCE PROGRAMME—New Zealand maintains a Mutual Assistance Programme with 8 Pacific and ASEAN countries (Fiji, Indonesia, Malaysia, Papua New Guinea, Philippines, Singapore, Thailand, and Tonga). The programme aims to support New Zealand foreign policy objectives by strengthening bilateral relations in defence with countries which share common strategic interests with New Zealand, and to increase the effectiveness of the Armed Forces. In return, New Zealand seeks access to training facilities and deployment opportunities in these countries. Training is given in New Zealand in a wide range of military activities from individual training courses to company-sized joint exercises. In addition, training teams are regularly deployed overseas to conduct courses to provide advice and practical assistance, and a small number of New Zealand military officers are sent to other countries for periods of up to 2 years as instructors. Senior officers are invited to this country for familiarisation and planning visits and, where opportunity offers, items of minor equipment are supplied from New Zealand stocks.
Antarctica Support—During November-December 1982–83 the RNZAF made 13 return trips to McMurdo Sound transporting 278 579 lbs of freight and 142 passengers. RNZAF and Army personnel provided cargo handling assistance at Harewood and McMurdo Sound in support of United States National Science foundation operations in Antarctica during October 1982-February 1983. A cargo handling team of 23 Army personnel deployed to Antarctica during the first week of October 1982, was replaced by a similar team in early December. In addition a team of 15 Territorial Force personnel was deployed to Antarctica over January 1983 to help with the unloading of sea cargoes at McMurdo Sound. During September 1982-January 1983, 16 Royal New Zealand Engineer personnel assisted with the accommodation rebuild at Scott Base.
COMMUNITY ASSISTANCE: Hydrographic Survey—The RNZN has undertaken marine surveys since 1949 and is the sole authority for the production of nautical charts in New Zealand. The area of charting responsibility covers a wide area of the South-west Pacific from Tuvalu in the north to the Ross Sea in Antarctica. To undertake this task HMNZS Monowai which entered service in 1978 carries out oceanic and off-shore surveys, and the 2 inshore survey craft, Takapu and Tarapunga carry out inshore and minor surveys around the New Zealand coast. HMNZS Monowai also regularly conducts surveys on behalf of South Pacific countries.
Fishery Protection—The introduction of the 200-mile Exclusive Economic Zone on 1 April 1978 increased the need to maintain a surveillance and policing effort. To undertake this task, the frigates are employed part-time and the 4 patrol craft are employed full-time on fishery protection patrols. Surveillance flights are undertaken by RNZAF Orion, Andover, and Friendship aircraft.
Search and Rescue (SAR)—The RNZAF flew a total of 353 hours in search and rescue operations during the year ended 31 March 1983. The RNZAF, in conjunction with the Army and the Police, provided SAR training assistance during the year in the form of demonstrations, lectures, and static displays to local SAR organisations. RNZN vessels also took part in SAR operations, most of which were mounted for missing vessels.
Miscellaneous—Other assistance provided to the community includes fire-fighting and co-operative tasks with the Forest Service, New Zealand Railways Corporation, NZED, and Meteorological Service; explosive ordnance disposal; assistance in civil emergencies; participation in ceremonial occasions; and the carriage of supplies and personnel to New Zealand's offshore islands on behalf of other Government departments. The services provided assistance to Fiji following Hurricane Oscar.
NEW ZEALAND CADET FORCES—The Cadet Forces were established under the Defence Act 1971 and comprise the Sea Cadets, Air Training Corps, and School Cadet Corps.
The Cadet Forces are primarily community-based youth training groups aimed at teaching leadership, comradeship, self confidence, and good citizenship to boys and girls between the ages of 13 and 18 years. The Cadet Forces are a community-based organisation supported by the Navy, Air Cadet Leagues, and schools. The Ministry of Defence assists only to the extent necessary to preserve the special military character of the organisation.
On 30 June 1983 the Cadet Forces comprised 510 sea cadets led by 94 officers in 17 town units, 1133 Army school cadets led by 95 officers in 16 units, and 2082 Air Training Corps cadets led by 204 officers in 50 town units.
DEFENCE EXPENDITURE—Expenditure on defence in the 4 latest years ended 31 March was made up as follows:
| Item | Year Ended 31 March | |||
|---|---|---|---|---|
| 1980 | 1981 | 1982 | 1983 | |
| $(million) | ||||
| Personnel | 203.32 | 252.43 | 306.65 | 333.64 |
| Travel, transport, and communications | 13.07 | 16.68 | 20.36 | 21.39 |
| Maintenance, operation, upkeep, and rental | 27.03 | 33.22 | 38.68 | 41.61 |
| Materials and supplies | 61.36 | 90.53 | 116.09 | 124.32 |
| Services | 8.32 | 9.43 | 10.93 | 13.44 |
| Other operating expenditure | 2.68 | 3.85 | 6.54 | 4.89 |
| Grants, contributions, subsidies | 0.78 | 0.90 | 0.62 | 0.48 |
| Capital works | 9.15 | 11.35 | 15.55 | 18.94 |
| Capital equipment | 20.38 | 37.55 | 78.23 | 93.42 |
| Total | 346.09 | 455.94 | 593.65 | 652.13 |
About 79 percent of the Defence Vote is spent within New Zealand, mainly on salaries, capital works, servicing, and general operating costs. There is a deliberate policy to encourage greater logistic self-sufficiency both within New Zealand and in conjunction with Australia.
Defence expenditure is related to Government expenditure and gross domestic product in the following table.
| Year Ended 31 March | Defence Expenditure | Percentage of Government Expenditure* | Percentage of Gross Domestic Product |
|---|---|---|---|
| * Excludes repayment of pubic debt. | |||
| $(m) | percent | percent | |
| 1979 | 299.51 | 4.1 | 1.7 |
| 1980 | 346.09 | 4.2 | 1.7 |
| 1981 | 455.94 | 4.6 | 1.9 |
| 1982 | 593.65 | 4.8 | 2.0 |
| 1983 | 652.13 | 4.8 | 2.0 |
STRENGTH OF ARMED FORCES—The following table gives the strengths of the regular forces of the 3 services over the last C years.
| As at 31 March | Navy | Army | Air Force | Total |
|---|---|---|---|---|
| 1978 | 2,825 | 5,722 | 4,217 | 12,764 |
| 1979 | 2,827 | 5,670 | 4,242 | 12,739 |
| 1980 | 2,756 | 5,666 | 4,219 | 12,641 |
| 1981 | 2,811 | 5,723 | 4,334 | 12,868 |
| 1982 | 2,861 | 5,676 | 4,271 | 12,808 |
| 1983 | 2,857 | 5,590 | 4,409 | 12,856 |
THE ROYAL NEW ZEALAND NAVY—The Government in New Zealand has since the earliest days made provision for naval forces in its defence measures. Royal Navy vessels regularly visited New Zealand waters but these were soon supplemented by a number of Government-owned vessels, the first of which was the Australia, a schooner purchased from India in 1842. In addition, in 1877 the New Zealand Government began regular financial contributions towards maintaining Royal Navy ships in New Zealand waters. In 1921 the naval forces became the New Zealand Division of the Royal Navy, and in 1941 they became the Royal New Zealand Navy.
Command and Administration—The Chief of Naval Staff exercises command and control of the Royal New Zealand Navy assisted in the performance of his functions by the Naval Staff as well as the integrated staff of Defence Headquarters.
State of the Navy—Seagoing ships:
| * On loan from U.S. Navy. | ||
|---|---|---|
| Frigates (Leander class) | Wellington | 11th Frigate Squadron. |
| Southland | ||
| Waikato | ||
| Canterbury | ||
| Survey ship | Monowai | |
| Research ship | Tui* | |
| Patrol craft | Hawea | First New Zealand Patrol Craft Squadron. |
| Taupo | ||
| Rotoiti | ||
| Pukaki | ||
| Inshore survey craft | Takapu | |
| Moa | ||
| Tarapunga | ||
| RNZNVR motor launches | Paea | |
| Kuparu | ||
| Diving tender | Manawanui | |
| Dockyard service craft | Arataki | |
Shore Establishments—The naval base at Devonport, Auckland, consists of the office of the Commodore Auckland (the operational authority of the RNZN), HMNZS Philomel (the naval barracks and base support establishment), the Royal New Zealand Naval Hospital, the Naval Supply Depot, and the Dockyard.
HMNZS Tamaki is the training establishment for the Navy and is located at Narrow Neck, Devonport, Auckland.
The Dockyard is under the charge of a Captain Superintendent and is capable of refitting all units of the RNZN. The RNZN Armament Depot is situated at Kauri Point and the RNZN Hydrographic Office is at Takapuna.
HMNZS Irirangi is the naval radio receiving and transmitting station and is situated at Waiouru.
HMNZS Wakefield is the administrative unit for RNZN personnel in the Wellington area.
| Strength of the Navy | ||||
|---|---|---|---|---|
| Category | At 31 March | |||
| 1980 | 1981 | 1982 | 1983 | |
| Regular Forces— | ||||
| Officers (male and female) | 316 | 325 | 347 | 405 |
| Ratings (male and female) | 2,440 | 2,486 | 2,514 | 2,452 |
| Total | 2 756 | 2 811 | 2 861 | 2 857 |
| Non-regular Forces— | ||||
| Royal New Zealand Naval Reserve (Officers) | 60 | 39 | 4 | 5 |
| Royal New Zealand Naval Volunteer Reserve (all ranks) | 293 | 377 | 452 | 407 |
| Royal New Zealand Navy Emergency List (officers) | 46 | 39 | ||
| Royal New Zealand Naval Fleet Reserve (ratings) | 1,712 | 945 | 785 | 780 |
Royal New Zealand Naval Volunteer Reserve—There is a division of the Royal New Zealand Naval Volunteer Reserve in each of the 4 main centres—Auckland, Wellington, Christchurch, and Dunedin—where reservists are given the basic elements of naval training.
THE NEW ZEALAND ARMY—The Army is raised, maintained, and organised under the authority of the Defence Act 1971, and the policy outlined in the 1983 Defence Review. It comprises a Regular Force, Territorial Force, and Reserve elements.
The army is structured to provide operational forces as follows:
A Ready Reaction Force of an infantry battalion group consisting of Regular Force personnel.
An Integrated Expansion Force of brigade group size, made up of Regular and Territorial Force personnel.
A deployable Force Maintenance Group, comprising Regular and Territorial Force personnel.
A capability based on additional existing units to be expanded when required.
New Zealand has maintained militia forces since the passing of the Militia Act of 1845. The first regular forces were the Armed Constabulary formed in 1846. The oldest continuously serving unit in the Army traces its history to February 1864.
Formed Army units have been dispatched overseas on active service in the South African War, World War I, World War II, occupation forces in Japan, plus Korea, Malaya and Borneo and subsequently Malaysia, and Viet Nam. Units have been stationed in Malaysia and subsequently Singapore since the termination of active service in Malaysia in 1966.
Command and Administration—The Chief of General Staff commands the Army, assisted by the General Staff and the staffs of Defence Headquarters.
As a result of restructuring carried out in early 1984, command is now exercised as follows:
A Headquarters Land Force Command is responsible for operational Forces, Territorial Force manpower management, collective training and Army input into any deployed national headquarters.
A Headquarters Support Command is responsible for individual training, force logistic support and base ('home') support.
Major Regular Force Units—
2 infantry battalions (1 in Singapore) Major Integrated Regular Force/Territorial Force Units—
6 infantry battalions
2 artillery regiments
4 armoured squadrons (1 light tank, 1 reconnaissance, 1 armoured personnel carrier, 1 anti-armoured).
1 field engineer regiment
5 signals squadrons
1 SAS.squadron
3 transport regiments
3 field workshops
3 supply companies
3 field ambulances
2 field hospitals
Major Weapons and Armoured Fighting Vehicles—
26 combat reconnaissance vehicles (tracked)
72 M113 armoured personnel carrier-type vehicles
10 5.5 inch medium guns
44 105 mm guns/howitzers
19 106 mm recoiless rifles
| Strength of the Army | ||||
|---|---|---|---|---|
| Category | At 31 March | |||
| 1980 | 1981 | 1982 | 1983 | |
| * Class A and Class B Reserves. | ||||
| Regular Forces— | ||||
| Officers (male and female) | 717 | 723 | 712 | 786 |
| Other ranks (male and female) | 4,949 | 5,000 | 4,964 | 4,804 |
| Total | 5 666 | 5 723 | 5 676 | 5 590 |
| Non-regular Forces— | ||||
| Territorial Force (all ranks) | 6,004 | 6,150 | 6,289 | 6,101 |
| Officers Reserve | 631 | 629 | 636 | 598 |
| Other ranks* | 1,412 | 1,582 | 1,389 | 1,257 |
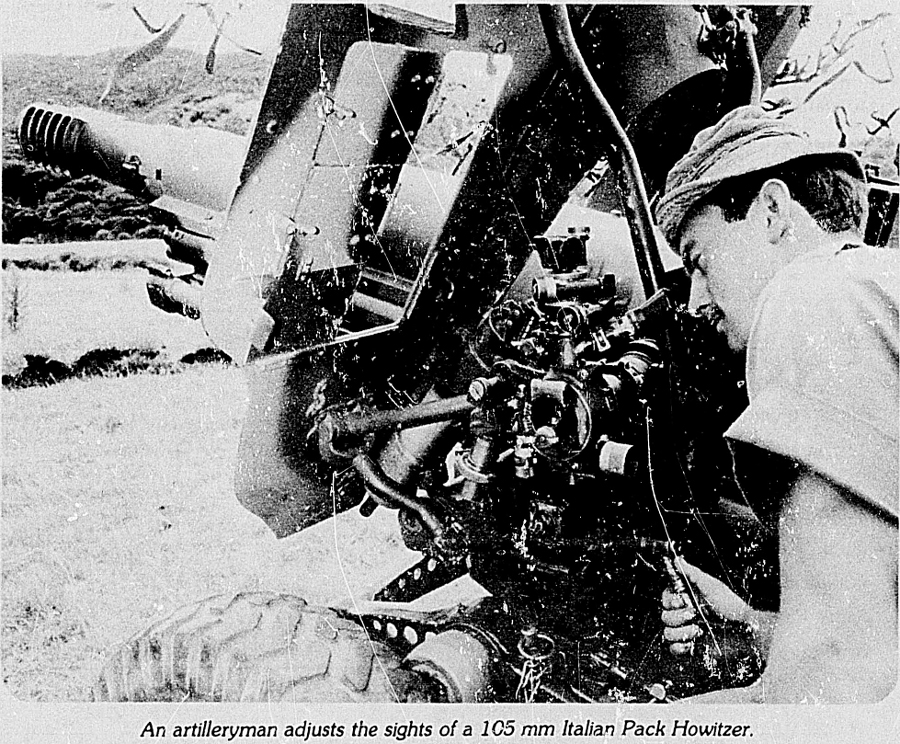
THE ROYAL NEW ZEALAND AIR FORCE—The Royal New Zealand Air Force was constituted as a separate armed service by the Air Force Act 1937 and its administration was vested in an Air Department which was responsible for military aviation and the regulation of civil aviation in New Zealand. With the passing of the 1964 Defence Act the Air Department was absorbed into the Ministry of Defence.
Command and Administration—The Chief of Air Staff exercises command and administration of the Royal New Zealand Air Force assisted in the performance of his functions by the air staff as well as the integrated staff of Defence Headquarters.
Organisation—The RNZAF in New Zealand is divided into 2 groups and 1 independent base; in addition, 1 support unit with rotary winged aircraft forms part of the New Zealand forces based in Singapore and a small helicopter element is serving with the Multinational Force and Observers in Sinai. The Operations Group with Headquarters at RNZAF Base Auckland, is responsible for all operational functions and operational flying training, and Support Group, with Headquarters at RNZAF Base, Wigram, is responsible for all formal individual training (except advanced pilot training) and certain support functions. RNZAF Base, Shelly Bay, acts as the supporting administrative and domestic base for all RNZAF personnel assigned to Wellington for duty in Air Staff and Defence Headquarters.
The RNZAF provides support for the search and rescue organisations in New Zealand and the South Pacific area, and for the New Zealand civil defence organisation. In addition, the RNZAF provides support to civil and government agencies, which cannot be provided by civil aviation facilities.
The operational units of the RNZAF comprise: a utility helicopter support unit based in Singapore as part of the New Zealand Force, South-east Asia; maritime, long and medium-range transport and helicopter squadrons based at RNZAF Base Auckland; fighter and medium-range transport communications squadrons at RNZAF Base, Ohakea. Flying training units are located at RNZAF Bases, Wigram and Ohakea, while ground training is carried out at RNZAF Bases, Auckland, Woodbourne, and Wigram. The RNZAF Museum is also located at Wigram.
Engineering—Direction of RNZAF aircraft technical services is co-ordinated by Air Staff, Defence Headquarters. Specific levels of aircraft maintenance are assigned to bases and squadrons. A range of overhaul and repairs and some manufacture of aeronautical equipment is carried out at No. 1 Repair Depot, RNZAF Base Woodbourne. A proportion of repair and overhaul work is contracted to civil industry in New Zealand and overseas.
| Strength of the Air Force | ||||
|---|---|---|---|---|
| Category | At 31 March | |||
| 1980 | 1981 | 1982 | 1983 | |
| Regular Forces— | ||||
| Officers (male and female) | 662 | 657 | 711 | 754 |
| Airmen and airwomen | 3,557 | 3,677 | 3,560 | 3,655 |
| Total | 4 219 | 4 334 | 4 271 | 4 409 |
| Non-regular Forces— | ||||
| Territorial Air Force | 147 | 189 | 205 | 208 |
| Active Reserve | 1,009 | 1,069 | 947 | 903 |
| General Reserve | 314 | 285 | 238 | 266 |
| Total | 1 470 | 1 543 | 1 390 | 1 377 |
| State of the RNZAF— | ||
|---|---|---|
| Aircraft | Primary Role | |
| 16 | Strikemasters | Advanced flying training, strike-role training |
| 12 | Skyhawks | Offensive air-support operations |
| 2 | Boeing 727 | Air transport |
| 5 | Hercules | Air transport |
| 10 | Andovers | Air transport |
| 3 | Cessna 421C | Air transport |
| 5 | Orions | Maritime operations |
| 14 | Iroquois helicopters | Utility helicopter operations |
| 9 | Sioux helicopters | Light observation helicopter operations |
| 3 | Wasp helicopters | Shipborne helicopters |
| 4 | Airtourers | Initial pilot training |
| 15 | Airtrainers | |
| 3 | Friendships | Navigation training |
STRENGTHS OF ARMED FORCES IN WAR: South African War—Approximately 6500 troops from New Zealand served in the South African War.
First World War, 1914–18—A total of 124 211 persons (including 91 941 volunteers) were called up for overseas and home service prior to 12 November 1918. Of these, 100 444 went overseas.
Second World War, 1939–45—The net intake of men to the armed forces—i.e., exclusive of transfers between the services and of re-entries—during the Second World War was 194 000, equivalent to 67 percent of the male population between the ages of 18 and 45 years. In addition, approximately 10 000 women served in the forces. It is estimated that approximately 140 000 persons served overseas.
Korean War, 1950–53—During the period of hostilities June 1950 to July 1953, a total of 3271 army personnel, almost all volunteers, served in Korea.
In addition the RNZN maintained 2 frigates continuously in Korean waters, involving 1310 RNZN personnel.
Vietnam War, 1964–1972—Armed forces involved in active service in Vietnam included 3760 New Zealand Army, 24 RNZN and 58 RNZAF personnel.
SECURITY INTELLIGENCE SERVICE—The New Zealand Security Intelligence Service Act 1969 gave statutory recognition to the New Zealand Security Service, which was established on 28 November 1956.
Subject to the control of the Minister in Charge of the Security Intelligence Service, the functions of the service are to obtain, correlate, and evaluate intelligence relevant to security; to advise Ministers on security matters; to co-operate as far as practicable as necessary with State Services and other public authorities in New Zealand and abroad in the performance of its functions; and to inform the New Zealand Intelligence Council on any new area of potential espionage, sabotage, terrorism, or subversion in respect of which the Director has considered it necessary to institute surveillance.
It is not a function of the Security Intelligence Service to enforce measures for security nor to institute surveillance of any person or class of persons by reason only of his, her, or their involvement in lawful protest or dissent in respect of any matter affecting the Constitution, laws, or the Government of New Zealand.
There is a Commissioner of Security Appeals, to whom complaints may be made in writing at the office of the High Court in Wellington.
During the year ended 31 March 1984, 3 interception warrants were issued for the “detection of activities prejudicial to security” (section 4A(1)(a)(i) of the New Zealand Security Intelligence Service Act 1969). The average length of time for which these warrants were in force was 5 months and 22 days. The method of interception used in respect of each warrant involved the use of a listening device. During the year ended 31 March 1983 no interception warrants were issued.
Expenditure on the Security Intelligence Service for the 5 latest years is shown in the following table.
| Year Ended 31 March | Gross Expenditure | Increase Over Previous Year | Increase in Total Government Expenditure |
|---|---|---|---|
| $(000) | Percent | percent | |
| 1979 | 1,674 | 38 | 18 |
| 1980 | 2,215 | 32 | 13 |
| 1981 | 3,341 | 51 | 22 |
| 1982 | 3,879 | 16 | 21 |
| 1983 | 4,426 | 14 | 16 |
FURTHER INFORMATION—Further information will be found in the following publications.
Report of the Ministry of Defence (Parl. paper G. 4).
Report of the Department of Internal Affairs (Parl. paper G. 7).
Report of the Commission of Inquiry into the Abbotsford Landslip Disaster (Parl. paper H. 7).
Report of the New Zealand Security Intelligence service (Parl. paper G. 35).
Table of Contents
Planning for economic development and growth is the concern of a wide range of sectors, including agriculture, manufacturing, transport, forestry, building, mineral development, and energy production. New Zealand is at present undergoing complex structural change with high resource costs and pressure on financial resources, and therefore a need for more careful selection of investment, even though demand has slackened. Within the urban areas themselves, competing demands for industrial, commercial, residential and recreational land have arisen as proponents of each particular use have sought their most suitable available location. Left unchecked, these conflicts of interest could lead to unsatisfactory and uneconomic patterns of development. This has necessitated a planning framework within which competing demands can be resolved.
In recent years, world opinion has had forced upon it an appreciation of the damage to the environment, in the form of pollution and the destruction of natural resources, that can result from uncontrolled economic development. New Zealand, during the early years of the last century, suffered what is now recognised to have been irreparable damage from the destruction of native forests and wildlife. However, during the last decade New Zealand has taken warning from the unfortunate experiences of some more highly developed countries. Concern for possible future effects of economic growth on the environment led to the holding of the Physical Environment Conference in May 1970 and has resulted in the enacting of what is, by world standards, advanced environmental legislation.
LAND USE—With almost 27 million hectares of land and a population of 3.2 million, New Zealand has not in the past been conscious of the problems of resource utilisation experienced in the more densely settled countries. An extensive coastline (approximately 11 000 km), great variety of landscape and responsive soils, and a generally favourable climate at lower altitudes are some of the assets which, because of the small population, have been utilised without any serious detrimental effects on the social and economic fabric. In retrospect, however, it is apparent that some of the land and other resources have been wastefully exploited. Maori settlement brought significant ecological changes, largely through fires and hunting. The impact of European settlement was much greater, measured by the large areas of indigenous forest cover destroyed, the extensive native grasslands burnt for sheep grazing and ploughed for crops and sown pasture, the wetlands drained and reclaimed, the unsightly tailings left after gold mining, the increase in soil erosion, and the general loss of wildlife habitats.
The growth and changing distribution of the population have been strongly influenced by the distribution of the most productive soils. In the nineteenth century, when the population was small, the ultimate results of preferential settlement of the best agricultural land were not appreciated. Generally, the most productive areas became the most prosperous when the towns within them grew, and it was at the expense of the most productive soils. Later, manufacturing and tertiary industries tended to be located in these towns because of the labour, markets, and services they offered.
The focus of land use policy debates has shifted through time with the rate of economic and demographic change, changes in the structure of the economy, changing scientific knowledge of New Zealand's resources, and shifts in public perception of these changes and their implications. There was considerable public debate during the 1960s focussed on the issue of urban encroachment onto high quality agricultural land. This was understandable given the limited area of high quality soils (there are about 500 000 hectares of first class cropping land and 8 300 000 hectares of first class pastoral land), the rate of urban expansion (up to 45 000 hectares of farming land changed to urban use during the period 1949 to the early 1980s), and the location of many urban areas. With the reduction of economic and population growth rates in the mid-1970s these pressures eased. At the same time district and regional planning under the Town and Country Planning Act matured as a means of controlling and directing the form of urban expansion and making trade-offs between competing land uses. Other land use policy issues have arisen with varying intensity of debate. These include competition between different types of farming (including the position of small-holders generally), such as farming and forestry, commercial and indigenous forestry, and reserves and commercial exploitation.
The general purpose of regional or district planning schemes under the Town and Country Planning Act 1977 is the wise use and management of the resources, and the direction and control of the development of a region, district, or area for the overall benefit of the whole community.
Emphasis is given to the conservation protection, and enhancement of the physical, cultural, and social environment, the wise use and management of New Zealand's natural resources, and the preservation of the natural character of the environment.
In New Zealand the provision of extensive national parks and smaller reserves has done much to preserve (at least in selected areas) the characteristic beauty and ecological values of the landscape, and to make it accessible to the general public for recreation and enjoyment.
Development schemes causing modification of natural features can, in the planning stage, make provision for restraint, restoration, and even the addition of compensating amenities. The rate of development in New Zealand must make this an essential ingredient of planning. But it must be stressed that there will be no more completely unmodified or true wilderness country. Once it is destroyed, wilderness is gone forever. Wilderness is extremely fragile, and soil erosion, degradation of vegetation, and destruction of animal species can come about through any alteration of the environment, even the most innocent access road.
Scientific investigations and research have reinforced the validity of the beliefs based on sentiment and aesthetics that there are dangers in any disturbance of natural equilibrium of air, water, soil, plants, animals, and stabilised land-forms, or in the pollution of any of them. Changes in the balance of dominance of even obscure organisms or a slowly declining water-table can be factors in the deterioration of countryside. It is essential to retain reference areas from which the changes in soils, plants, and animals resulting from man's activities can be assessed. A whole catchment will usually be the desirable minimum effective area.
Conservation, however, means much more than the preservation of scenic and scientific values. It implies the maintenance without diminution of the basic land resources on which New Zealand's economy and way of life are so largely based. Of these resources the most important are soil, water, and vegetation, the last both natural and introduced, and both forests and grasslands. The concept of conserving soil, water, forest, and grassland resources is dynamic rather than static, and embodies the principle of preservation through wise use.
The problems are capable of solution provided there is a sufficient understanding by administrators and by the public of the importance (and often the interdependence) of the different values involved and of the ecological implications of any decision affecting land use. Conflicts between different demands on the countryside are inevitable, but with adequate planning and management they are mostly capable of resolution. For example, an agriculturally productive landscape can provide such rich and satisfying contacts with the diversity of nature that in many ways the man-made landscape based on agriculture or forestry need be little less interesting and satisfying than the wild one. Likewise, soil conservation practices not only restore vitality and health to the soil but also create pleasing patterns in the landscape.
Land Use Advisory Council—The Land Use Advisory Council was established to develop criteria on which sound land use decisions could be made. Its terms of reference required it to have regard to physical, ecological, economic, social, environmental, and other relevant factors. Members of the council represented Maori, departmental, farming, scientific, and geographic interests. As its name implies, the council was an advisory body to the Government. The criteria were intended to guide the use of lands of the Crown but these and related guidelines also assisted all who were required to make rural land use decisions. The council reviewed the experiences of a number of overseas countries in planning land development, use, and management. Consideration was also given to the various legitimate uses of the nation's land, including such non-productive use (in terms of food or goods) as recreation, soil conservation and water management, the preservation of wildlife, and historic and ecological management; and some thought went into the means for determining which use should take priority in the event of there being strong competing claims.
The council sponsored a series of seminars aimed at encouraging wider community awareness of the physical, biological, economic, social, and environmental values which influence (or should influence) rural land use decisions. The findings from the seminars have assisted in developing a national land use policy and guidelines. This was published in a report entitled Land Use in New Zealand—A National Goal. The report summarises the state of rural land use in New Zealand, identifies opportunities for future direction and offers suggestions for immediate action. The report is currently being considered by the Government.
The revision of the Town and Country Planning Act also provided an opportunity for greater emphasis on environmental matters, and for the implementation of the Government's policy of integrating the procedures laid down in the various “environmental” statutes such as the Reserves Act, the Forests Act, and the Historic Places Act.
Matters to be dealt with in district schemes in particular include (to quote the Schedule to the Act):
“The preservation or conservation of—
Buildings, objects, and areas of architectural, historic, scientific, or other interest or of visual appeal;
Trees, bush, plants, or landscape of scientific, wildlife, or historic interest, or of visual appeal;
The amenities of the district.”
In the administration of district planning schemes, there must be regard to section 3 of the Act which includes specific reference to the protection and enhancement of the environment as a matter of national importance.
In considering appeals against any public work the Planning Tribunal is required to have regard to criteria whether the site is suitable for the proposed work, and the economic, social, and environmental effects of the proposal.
All public bodies, including the Crown, are now required to adhere to the provisions of any approved regional planning scheme. All public works are subject to the procedures laid down in Part VI of the Act, which requires that all Crown proposals which are not in conformity with the provisions of the relevant district scheme are to be advertised and to be subject to rights of objection and appeal. In the case of Crown works, the Minister of Works and Development can (as an alternative to an appeal) request the tribunal to conduct a public inquiry which must take into account the “economic, social, and environmental effects of the proposal and such other matters as the Minister may determine”.
National Planning—In the preparation, implementation, and administration of regional, district, and maritime planning schemes the following matters, which are declared to be of national importance, must be recognised and provided for:
the conservation, protection, and enhancement of the physical, cultural, and social environment;
the wise use and management of New Zealand's resources;
the preservation of the natural character of the coastal environment and the margins of lakes and rivers, and the protection of them from unnecessary subdivision and development;
the avoidance of encroachment of urban development on, and the protection of, land having a high actual or potential value for the production of food;
the prevention of sporadic subdivision and urban development in rural areas;
the avoidance of unnecessary expansion of urban areas into rural areas in or adjoining cities;
the relationship of the Maori people and their culture and traditions with their ancestral land.
The first two and the last two of these considerations were introduced under the 1977 Town and Country Planning Act.
Regional Planning—Regional planning is concerned with establishing policies and programmes at all levels of government which reflect the needs and desires of the people of each region, and which are reconciled with the national interest and competing demands for national resources. Urban centres and rural areas cannot be planned in isolation from each other or from the nation as a whole.
Under the 1977 Town and Country Planning Act regional planning has 4 main features, all of which are new:
Regional planning is the responsibility of united and regional councils.
Regional planning schemes are to be approved by the Government before they come into operation.
Approved regional planning schemes must be adhered to by the Crown and every local and public authority.
District and maritime planning schemes must conform with approved regional planning schemes.
Matters to be dealt with in regional planning schemes have been greatly expanded under the Act to embrace social, economic, and environmental policies. Reference is made for example to “natural resources and environment—the identification, preservation, and development of the regions' natural resources including water, soil, air and other natural systems, farmlands, forests, fisheries, minerals … and areas of value for the enjoyment of nature and the landscape”.
Under the Local Government Act 1974 regional or united councils have been established for all regions of New Zealand, and all have regional planning responsibilities and powers under the Town and Country Planning Act 1977. The combined effect of these Acts is a major constitutional innovation. The regional planning process offers a means by which local and central government, representing the regional communities and the national interest respectively, can reach agreement on development and welfare policies and priorities for the allocation of resources for each region. Agreement can be expressed in the regional planning scheme, and changes of policy can be worked out within the process of changing the scheme.
The new system does not introduce another tier of government, rather it is aimed at giving a regional dimension to Central Government programmes and a common policy base to local government activity.
Regional Planning Process—The key provision of the legislation is the requirement that once regional schemes have been agreed to by the central government, all public authorities, both central and local, are required to give effect to their provisions. The significance of this step lies in the practical necessity it creates for local and central government agencies to take a constructive part, along with the regional community, in the formulation of the objectives, policies, programmes, and other provisions of each scheme. Responsibility for initiating regional planning action lies with the regional and united councils, which operate through regional planning committees that include a representative of the Crown.
The new regional planning legislation aims to provide a process that allows for the public evaluation of options and alternatives—the determination of objectives and policies, and the adoption of a programme of implementation that is related to community priorities and the resources available.
National policies, or changes in policy, on such matters as energy development, transportation, afforestation, or housing finance can have marked regional implications and significantly affect regional prosperity and well being. It is important therefore that expressed regional preferences and priorities are considered as an integral part of national policy formulation, and that the regional consequences of national policies are understood before they are adopted. Two-way communication between the central government and the regions are a vital element in the new process. The new regional bodies and the regional planning system provide the opportunity for this, and for expressing agreed measures in regional planning schemes.
District Planning—Every district scheme under the Act is required to have as its general purpose the wise use and management of the resources of the district, and the direction and control of its development, in such a way as will most effectively promote and safeguard the economic, cultural, social, and general welfare of the people and the preservation of the amenities of the district. It must also recognise and provide for matters of national importance defined in the Act. Every city, borough, and county councilor other authority responsible for the general administration of a district must provide and maintain a district scheme unless exempted by the Minister of Works and Development. Any such exemptions are likely to apply only to districts of small population where little change is expected.
Councils are now beginning to recognise the potential of the district planning scheme as an effective instrument for bringing about innovative change not only in land use control but also in environmental management and local administration in general. The key to this is the greater emphasis being placed on the scheme statement as a means of expressing policies which have been subjected to the formal approval procedures, including objection and appeal, that the Town and Country Planning Act provides. A renewed concern for a more humane basis to planning has focussed on the destruction of areas of natural beauty near urban areas, the loss of historic areas of cities, and the destruction of neighbourhood communities as past errors which must not be repeated. With this in mind, a number of councils have recently made provision for Special Character Zones. These are zones which have a special character derived from the age, condition, or character of the buildings or general layout. In these zones the aim is to preserve the special character (using controls where necessary) by encouraging new buildings designed in sympathy with the existing environment, and by more liberal approaches to the rehabilitation and use of existing properties. Currently there are also moves towards allowing far greater social and economic diversity in rural areas.
Maritime Planning—The need to plan for areas below mean high water mark, which are subject to increasing pressures from various demands, led to the introduction of maritime planning under Part V of the Town and Country Planning Act 1977. The provisions provide a statutory procedure to establish maritime planning areas on the joint recommendation of the Minister of Works and Development and the Minister of Transport; and to appoint maritime planning authorities. Four maritime planning areas have been established covering the Waitemata, Manukau, and Wellington Harbours, and the Marlborough Sounds. In each case the respective harbour board has been appointed the maritime planning authority.
If the maritime planning area is within harbour limits, the appropriate harbour board becomes the authority, unless it declines the appointment. The authority is required to set up a maritime planning committee with representation on it from the regional or united council, the regional water board, territorial local authorities, and the central government. Maritime planning schemes are not expected to cover the whole of the coast, but only those areas where there are problems of conservation and management or conflict between the use of the water and adjacent land areas.
In addition, under Part I of the Town and Country Planning Act 1977, the Minister of Works and Development may extend regional boundaries to include adjacent water areas and this provides for the planning of land and water to be brought together under the same administration. Many united or regional councils are having their regional boundaries extended to include harbours and coastal waters.
National Development Act 1979—The National Development Act provides for “the prompt consideration of proposed works of national importance by the direct referral of the proposals to the Planning Tribunal for an inquiry and report and by providing for such works to receive the necessary consents” (preamble to Act).
Under the Act, application can be made to the Minister of National Development for the status of national importance to be applied to a proposed work. The procedures which follow are initiated by Order in Council which may be made by the Governor-General if he considers that the work is major and likely to be in the national interest, and that it is essential that a decision be made promptly as to whether or not the consents sought should be granted. The Governor-General must also be satisfied that the work is essential to the development of New Zealand's resources, or self-sufficiency in energy, or expansion of exports, or import substitution, or to the development of significant employment opportunities.
Following the Order in Council the application is referred to the Planning Tribunal. Details of the proposal are sent to all authorities who might normally grant approvals under the terms of 22 statutes listed in the schedule to the Act, notably the Town and Country Planning Act 1977 and the Water and Soil Conservation Act 1967. These authorities send a report to the Planning Tribunal. At the same time an environmental impact report, prepared by the applicant, is submitted to the Commissioner for the Environment who calls for public comments. The report is audited by the commissioner and the audit is made available to the public.
The Planning Tribunal then considers, at a public inquiry, the matters concerning consents being sought by the applicant. Any body or person affected by the work or representing some relevant aspect of the public interest have a right to be present and heard at the inquiry, as of course does the applicant himself. The Minister of Works and Development, the Commissioner for the Environment, and every statutory authority which would otherwise grant consents (and had earlier reported to the tribunal) must be represented and available for cross examination at the inquiry.
Following the inquiry, the tribunal reports and makes recommendations to the Minister of National Development. The report is made available to the public. After taking into account the tribunal's report and recommendations and the criteria to which a work of national importance must conform, the Governor-General by Order in Council may then declare the work to be of national importance, granting the consents sought in the application, with such modifications, conditions, restrictions, or prohibitions as he thinks appropriate. The effect of the Older in Council is therefore to apply consents to the construction and operation of a particular work as if the consent had been granted under the provisions of the various Acts which would have applied.
The Act includes provisions and procedures for the variation or cancellation of such conditions as might be specified in the Order in Council. Any legal proceedings arising from any consents relating to work approved under the Act are subject to priority proceedings in the courts.
The National Development Amendment Act 1981 clarifies the power of the Planning Tribunal to award costs to any party and empowers the Tribunal to order an applicant to pay costs incurred by statutory authorities in investigating and reporting on consents sought. The Act also clarifies that the Planning Tribunal's power to consider the consents sought is the same as under other legislation and that all legal challenges are referred directly and finally to the Court of Appeal.
The Act is administered by the Ministry of Works and Development.
RECREATIONAL LAND—New Zealand is fortunate in that a large area of native forests was set aside in the early days in reserves of various types (climatic reserves, scenery preservation reserves, reserves for the preservation of flora and fauna, and reserves for the growth and preservation of timber). As a result New Zealand is well endowed with forested wilderness and with other native forests having scenic, recreational, and wildlife values. Per head of population, New Zealand probably has a larger area of forests of this type than any other developed country. Early land administrators laid the basis for a national park, a forest park, and a protection forestry system which is widely envied.
Many indigenous State forests offer scope for leisure pursuits in surroundings of great natural beauty—for the study of wildlife (plant and animal); for walking and tramping; and for shooting and fishing. Most of the attractive forested hill country is managed primarily for soil and water conservation; recreational use can be allowed in almost all such protection forests without interfering with the main management objectives. In fact, private hunting can be of benefit through its contribution in destroying wild animal pests. The New Zealand Forest Service is developing State forest parks in which management planning incorporates provision for recreation. Such provision includes the improvement of access from main roads to forest boundaries; clearing and maintaining tracks: erecting bridges; making camp sites and picnic places; and (sometimes in co-operation with tramping and alpine clubs) building and maintaining shelter huts, assets also of use to Forest Service personnel. Entry is unrestricted except that, in the interests of safety, persons carrying firearms require permits from the Forest Service.
In order to avoid the mistakes inherent in haphazard development, the National Parks and Reserves authority has for some years been encouraging national park boards to prepare management plans for their respective parks. These plans establish concepts and guidelines for the preservation and use of national parks, and afford the means by which park use and management can be reconciled with the preservation in perpetuity of the park's scenic beauty, and natural and historic features.
The older exotic forests also offer the attractions that only a sylvan setting can provide and have the advantage of accessibility. In many places, walks and picnic spots have been prepared for use by the public, and selected areas will be preserved from felling for their scenic value.
A related topic is the protection and conservation of bush and trees within urban areas. Not only do trees and areas of bush provide beauty and additional amenities in urban surroundings, but they provide habitats for birds and other wildlife, encourage the cycling of water and nutrients, and assist with erosion control. Local authorities have the power to require that, when land is subdivided, trees and bush areas shall be preserved.
Until recently little was done to secure in public ownership those areas where most New Zealanders take their holidays—by the water. Along the north and north-east coasts, where the climate is best and the population densest, many of the most desirable areas of coastline have already been subdivided, notably on the North Auckland, Bay of Plenty, and Coromandel coasts. Besides limiting public access, this can destroy scenic values. Similar considerations apply in respect of lakes, rocks, and offshore islands. In recent years the Crown has purchased a number of islands or parts of islands for reserve purposes. Some of these are grouped in the Hauraki Gulf and Marlborough Sounds Maritime Parks. Moves are being made to control subdivision in coastal and lakeshore areas.
Access along rivers 3 metres wide, lakes in excess of 8 hectares, and foreshores has usually been provided: on all alienations of Crown land since 1886, on private subdivision for towns near rivers or the sea coast since 1923, and on partitions of Maori land in counties since 1967.
The Land Act has provided since 1948 that around every lake with an area of 8 hectares or more there shall be laid off a strip not less than 1 chain in width.
In addition to the Government departments with responsibilities for administering a diversity of legislation for the protection of the physical environment, there are several authorities with responsibilities for the physical and social environment. Some of the more prominent of these are discussed below.
COMMISSION FOR THE ENVIRONMENT—The ministerial portfolio for the environment and the Commission for the Environment were established in 1972. The Minister's responsibility is to ensure that the Government has before it the best information available on the environmental aspects of projects and policies under consideration and on the possible effects of current trends on the future environmental well-being of the country.
The commission functions as a small investigatory and advisory agency without executive or management responsibility apart from the administration of the Lake Wanaka Preservation Act 1973. It undertakes studies for the Minister and investigates and makes recommendations on the environmental implications of proposed Government projects and policies. It can have an initiating and co-ordinating role on environmental issues which are assuming new importance in a changing society, or for which responsibility is shared by several management agencies. The commission's overall role is to assist in the development of policies designed to promote sound physical and social environmental management.
A major responsibility of the commission is to audit environmental impact reports. These are written appraisals of the environmental consequences expected from new developments or policies. The Environmental Protection and Enhancement Procedures which have been in force since 1 March 1974 and which were revised in 1981 require environmental impact reports for all major projects of the central government and for all other projects that need Government approvals or funds. Petro-chemical plants, options for transporting iron sand concentrate, a marine park at Mimiwhangata, the development of an LPG depot at Seaview, and 2 natural gas pipelines have been among the projects recently reported on. Ninety such reports have been subject to commission audit since the procedures came into being.
The procedures which the commission administers provide for the critical examination of environmental effects expected from the projects or alternatives to them and include provision for public submissions to the commission, which produces a written audit of the environmental impact report and the project. The audit is sent to the authority responsible for promoting the project and is published before a decision is taken on the proposal. The effectiveness of the administration of the procedures was reviewed in 1983.
The National Development Act 1979 and its 1981 amendments require an environmental impact report to be prepared on all Government and private projects which follow the approval procedures of that Act. Under the Act, the Commissioner for the Environment is required to audit such reports and is given independent standing to appear in subsequent hearings. The Petralgas methanol plant, the synthetic petrol plant (both in Taranaki) and the Aramoana aluminium smelter (now indefinitely postponed) are projects so far audited by the commissioner under this legislation.
Aside from its role under these procedures, in which it is largely reacting to the proposals of others, the commission also initiates studies aimed at drawing attention to important environmental questions facing the country. The possible environmental effects of land use options in the Hokianga, the protection of sections of wild water in the river systems of the country, community noise, landscape quality, waste disposal, packaging, and the recycling of paper and waste plastics, are some examples of studies initiated by the commission. Other initiatives are taken in organising discussion groups and seminars on a wide range of issues that often involve bringing together representatives from Government departments, agencies, industry, and environment groups. The commission has spearheaded the production of a New Zealand coastal atlas, and participated in the formulation of a proposed New Zealand conservation strategy. In addition to the development and production of education resource material for school and community use, the commission has taken part in developing the theory of environmental education, formulating a proposal for a national strategy, and designing education courses.
The Commission for the Environment also services the independent guardian groups established to advise the Government on the ways in which areas of important environmental interest should be safeguarded. Three such groups have been appointed—the Guardians of Lakes Manapouri and Te Anau, the Guardians of the Rotorua Lakes, and the Guardians of Lake Wanaka.
Liaison between New Zealand and international agencies concerned with environmental matters is a further function of the commission. At the Government's invitation the OECD Environment Committee undertook a review of New Zealand's environmental policies and management and published its report, Environmental Policies in New Zealand. The other major liaison role is with United Nations Environment Programme (UNEP). The commission functions as the national focal point for information requests channelled through INFOTERRA, an environmental information network established by UNEP. New Zealand also participates in a number of other UNEP activities and helped to establish the South Pacific Regional Environment Programme (SPREP) which became operative in 1980. In 1983 a commission officer joined a working party of the Group of Experts on Scientific Aspects of Marine Pollution (GESAMP). The group was charged with the task of evaluating environmental assessment methods in relation to pollution in the coastal environment. The commission is also New Zealand's link with UNESCO's Man and the Biosphere (MAB) programme. The commission has recently devoted special attention to environmental issues that might arise on the Antarctic continent.
The commission's staff cover a wide range of environmental disciplines but an important feature of its operations is collaboration with other agencies for the expertise required for the evaluation of particular aspects of projects under study.
ENVIRONMENTAL COUNCIL—The Environmental Council was established in 1970 following the Physical Environment Conference held in May of that year. It reports to the Government through the Minister for the Environment.
The constitution of the council provides for 16 members, including the chairman who is not a serving Government official. Five Government departments are represented—Treasury, Health, New Zealand Forest Service, Works and Development, and Lands and Survey. Three positions are drawn from those with experience in municipal and county local government, and regional planning; the remaining positions are filled by private citizens with knowledge and experience in environmental matters or appropriate qualifications.
The council has no executive powers. Its terms of reference are:
To advise the Minister for the Environment on such matters as she/he may refer to it and on such matters as the council may raise itself on the state and trend of the environment and on measures to be taken to manage it.
To publish from time to time such information upon environmental problems as the council considers necessary to serve the public interest.
To co-operate with other sector councils in matters of mutual interest; in particular, to provide the Planning Council with information, forecasts, and data arising from the above, and requisted by the council to enable it to carry out its functions.
The main role of the council is to advise on general matters of policy and principle rather than to examine the environmental consequences of specific projects. It has however, alluded to specific developments to illustrate its concerns. Examples of the policy issues in which the council has been involved are the environmental implications of wetland use and management, energy policy and mining developments.
NATURE CONSERVATION COUNCIL—The Nature Conservation Council was set up by statute in 1962. It can enquire into the effects of any proposed public or private works in areas of scenic, scientific, or recreational interest, and it makes recommendations to the Government through the Minister of Lands. The council's concerns include electric power schemes, location of power and telephone lines, roading, harbour reclamations, native forests, rare plant conservation, mining applications, geothermal resources, air and water pollution, recommendations for reserves, and aspects of town and country planning. Although it has access to Government information, it speaks with an independent voice, and is able to make public any of its reports or recommendations.
The council frequently advises non-Government conservation groups and co-ordinates their views. It also keeps the general public informed through its environmental publications, and through its sponsorship of Conservation Week each year. The Government grant for Conservation Week activities was withdrawn in 1982.
As a member of the International Union for Conservation of Nature and Natural Resources (which held is 15th General Assembly in Christchurch in October 1981) the council has published the Red Data Book of New Zealand, which describes rare and endangered species of endemic terrestrial vertebrates and vascular plants.
A technical sub-committee set up under the council in 1981 prepared a proposal for a New Zealand Conservation Strategy. Published under the title, Integrating Conservation and Development, the strategy proposal examines priorities for achieving a balance between resource use and conservation.
Of particular concern to the council is the wise use of New Zealand's natural resources. An example is the use of geothermal resources, where competing uses—private, tourist, and power production—make their long-term future uncertain. The council liaises with the various parties involved with geothermal fields.
Another area of concern to the council is the conservation of rare and endangered native plants. A committee set up by the council in 1983 is looking at how best to promote the cultivation, propagation and survival of rare species.
CONTROL OF MINERAL EXPLOITATION—Mining has in the past left small areas of the landscape so scarred that their visual impact today suggests that mining in general produces only perpetual devastation. In fact most areas where mining has ceased need show no sign that they were ever mined.
To ensure that the land is maintained in a suitable condition, the Minister of Energy is empowered under the Mining Act 1971 to impose whatever conditions he thinks fit on a mining licence and he may impose or vary these conditions at any time, even after the grant of the licence. Over public reserves and foreshore a condition may be attached in exchanging a prospecting licence for a mining licence that the licensee should provide a contribution towards a community asset.
Problems can occur where mineral exploitation takes place on freehold land. Local authorities have the necessary power to make regulations to control these activities, and they may use this power to maintain the long-term quality of the environment.
REAFFORESTATION MEASURES—In recent years Government-sponsored loans and grants have encouraged afforestation on private land, which has assisted in restoring the balance of forests on induced grasslands. In addition the Forest Service has embarked on a programme of revegetating eroded upland areas in important river catchments and also establishing dual-purpose forests where production of wood may be complementary to the protective nature of forests, for example, in East Cape-Poverty Bay where over 100 000 hectares will be planted over the next 40 years.
The New Zealand Forest Service prepares regional development plans for major timber supply regions throughout New Zealand, covering both State and private forestry. These plans set out the potential of the regions. For those forests under State control the Forest Service prepares regional management plans which describe and prescribe State forest activities in both indigenous and exotic production forests as well as protection forests in the mountains.
SCIENTIFIC STUDY—About one-fifth of the staff of the Department of Scientific and Industrial Research is engaged on research on physical environment matters including ecological studies of national parks investigations into beech forest ecosystems, and identification of marine animals and plankton. The department has undertaken bathymetric studies of lakes and the ocean floor around New Zealand. Basic geological, soil, and botanic surveys provide information for the land use surveys which guide urban development. Further information is given in the Science and Scientific Services section of this Yearbook.
The National Water and Soil Conservation Authority (NWASCA) has statutory responsibility for integrating research and survey activities in the field of water and soil conservation. The work is carried out by the Water and Soil Directorate of Ministry of Works and Development (MWD) and catchment authorities throughout New Zealand.
Three MWD science centres at Aokautere, Christchurch, and Hamilton carry out investigations in land resources, physical water resources, and water quality respectively.
The NWASCA land resource inventory, published as 1 inch to the mile worksheets and available as computer-stored data, is a major milestone in assisting land development planning providing, as it does, the first such inventory with truly national coverage.
WATER RESOURCES AND MANAGEMENT—Recent estimates put New Zealand's consumption of water at 1900 million cubic metres per year, of which agriculture uses 60 percent. The remaining 40 percent is split nearly equally between industrial and domestic use.
Approximately 87 percent of the population are supplied by public water supply systems. The remainder rely on an independent domestic supply (rainwater collecting, aquifer bores, etc). Industry obtains about 33 percent of its requirements from public supply systems and 66 percent from its own independent sources.
While the country has, on the whole, abundant water resources these are by no means evenly distributed. As may be seen from the rainfall map and statistics provided in the Geography section of the Yearbook, high mountains, especially in the South Island, create substantial rain shadow areas. In a few areas, annual falls of over 10 000 mm have been measured, while in others as little as 340 mm may fall in a year.
National Water and Soil Conservation Authority—The heavy consumption of water, combined with the geographical spread of water resources, demands careful management. This is achieved largely through the Water and Soil Conservation Act 1967, with protection against flooding provided by the Soil Conservation and Rivers Control Act 1941. These acts are administered by a central policy-making organisation, the National Water and Soil Conservation Authority (NWASCA), and a complementary regional structure.
The National Water and Soil Conservation Authority (NWASCA) includes representatives of counties, municipalities, and catchment authorities; Maori farming, manufacturing, and recreational interests; and appropriate departments of Government. The main functions of the national authority are to set broad national policy on water management and soil conservation and to advise the Government through the Minister of Works and Development, who is the chairman of the authority, on water and soil matters. Some 20 catchment authorities administer the 1941 Act throughout the country and, as regional water boards, administer the 1967 Act.
Water Allocation—By the 1967 Act all rights for the use of natural water were vested in the Crown and in general the management and administration of these rights was given to regional water boards to carry out on behalf of the Crown. Those wishing to use water for any except domestic and stock purposes, or requiring to discharge wastes into natural waters, require a water right from the regional water board. The boards are thus able to ensure that available supplies are not overtaxed. Several boards have commenced studies of the total water resource in major catchments within their districts to assess the availability of the water resources and present and future demands on the resource.
In this process of water allocation planning, the public is given the opportunity to participate. The goal is the preparation of a water allocation plan for each region. This provides a framework within which a regional water board will operate when considering applications for rights to water. It also provides a guide to existing and prospective users of water regarding the manner in which their rights to water may be reduced in times of water shortage.
Maintenance of water quality also comes within the purview of regional water boards. Some waters of New Zealand have been classified. A classification fixes the minimum standards of water quality and provides a permissible range of water quality within which regional water boards must operate when controlling discharges of waste.
The exercising of water rights may be restricted or suspended in order to maintain minimum standards of quality and, if a minimum flow in a river has been fixed, water rights may also be restricted or suspended to maintain that flow. If there is a serious temporary shortage of water a regional water board may issue an order restricting, apportioning, or suspending rights to take and use natural water.
A 1981 amendment to the 1967 Act provides for water conservation orders to be placed on rivers, streams, or lakes. They may preserve wild and scenic characteristics of rivers and protect other natural features and instream uses of the country's natural water. Recreational, wildlife, fishery, scenic, or scientific interests can apply under these provisions for protection of water uses and the retention of natural conditions.
Underground Water—In some parts of the country, including the Canterbury Plains, the Heretaunga Plains in Hawke's Bay, and the Waimea Plain near Nelson, underground water is an important resource. The cities of Christchurch, Lower Hutt, Napier, and Hastings draw at least some of their domestic and industrial supplies as well as irrigation water from such sources. In the Heretaunga Plains, there are 2000 registered irrigation bores. Management of underground water, and its protection from contamination, is an increasing part of regional water board work in these areas.
Irrigation—Irrigation was initially practised in New Zealand early this century as a drought protection measure. It was not until the 1940s that the benefits of irrigation as a farm management tool were realised. Most of the earlier irrigation was concentrated in areas of Central Otago and South Canterbury. In both areas a high soil moisture deficit is experienced during summer, with hot drying winds. More recently, irrigation schemes have been promoted in North Canterbury and in Nelson and in parts of the North Island suitable for horticulture, particularly Northland and the Bay of Plenty.
Pastoral irrigation is predominant in the South Island and was traditionally centred around major rivers, drawing from them on a run-of-the-river basis. More recent schemes include storage for better water management for the needs of crops. In total, about 180 000 hectares are now irrigated, but a substantial potential still exists.
The promotion of community irrigation schemes is the responsibility of the Minister of Works and Development. While several irrigation schemes are still being constructed under previous policies and different levels of Government assistance, from November 1982 a revised irrigation policy has been in force. The new policy avoids differentiation between Government and private irrigation development. The Government provides a 70 percent grant for approved community irrigation scheme headworks to take or store water, and also for the distribution works which deliver the water to the individual farm boundaries. The landholder's 30 percent share of these expenses is recovered by water charges. Support for on-farm irrigation development costs is provided through Rural Banking and Finance Corporation loans.
Private irrigation undertaken by individuals or groups of farmers is practised over much of the country. Private development normally qualifies for Rural Banking and Finance Corporation loans. Water for these schemes is generally drawn from underground sources, or pumped from rivers and drains and applied by spray or trickle methods. Private flood irrigation is limited to small gravity supply schemes, which are comparatively few in number.
Irrigation Schemes—Throughout the country 20 irrigation schemes involving 74 000 hectares of land have recently been completed or are under construction.
Five horticultural schemes in the North Island have been completed: the Kerikeri and adjacent Puketotara schemes in Northland serving 2930 hectares for 263 orchardists; the Tebbutts Road Scheme in the Bay of Plenty serving 90 hectares for 6 orchardists, and the Tablelands and Waiau irrigation schemes near Opotiki serving 412 hectares for 54 orchardists.
In the South Island the Waiau Scheme for 17 000 hectares is now serving 95 percent of the area for water, although on-farm development will not be completed for several years. The Glenmark Scheme in North Canterbury has been temporarily stopped, with 10 of the planned 26 dams completed. The Maniototo Scheme in Central Otago which was to irrigate an area of 9300 hectares has been reduced to 3800 hectares because of increasing costs. The Lower Waitaki Scheme for 14 500 hectares and the Morven-Glenavy Scheme for 12 150 hectares have been completed after 12 years construction, and private on-farm development is reaching an advanced stage.
In addition there are 20 older irrigation schemes (5 in mid Canterbury and 15 in Central Otago) which have been operating for many years. Three of these (the Levels Plain in mid Canterbury, the Eamscleugh in Manuherikia, and the Arrow River Scheme in Central Otago) are currently under review and may be upgraded.
In 1983 only 1 irrigation scheme (the Eiffelton for 2750 hectares of pasture) was approved. A further 15 irrigation proposals are currently being planned for 8800 hectares of horticultural land and 30 000 hectares of land for pasture and cropping.
Rural Water Supply Schemes—To provide reliable water supplies in rural areas, especially for stock water in drier pastoral districts, the Government has subsidised 96 rural water supply schemes, providing water to 970 000 hectares. A further 33 schemes are currently in train.
SOIL CONSERVATION—The changes in vegetation consequent on land development have been reflected in disturbed soil conditions in many parts of New Zealand. The protective, stabilising, and water-controlling combination of vigorous native vegetation, litter, and spongy soil has given way to a shallow-rooted, less protective carpet of grass on a compacted, impervious, and often exhausted soil. Natural erosion, caused by climatic factors (such as high-intensity rainfall and frost heave) combined with the geological instability of much of the country, has thus been aggravated by man-made effects. Soil erosion now occurs on more than 8 million hectares of hill country and mountain land, about one-third of the total area of New Zealand.
The Soil Conservation and Rivers Control Council began in the 1940s a number of measures to control soil erosion and to rehabilitate eroded catchments with the help of catchment authorities. Successful techniques that have been developed to control erosion include control of burning and animal pests, oversowing, topdressing, strict grazing control, soil conservation, fencing, stock-water ponds, gully control, contour ploughing, terraces, grassed waterways, and open and close tree planting. Grants at varying rates are available to farmers carrying out these control practices.
In the 1970s the New Zealand Land Resource Inventory was completed for the main islands of New Zealand This lists the physical factors of rock type, soil, slope, erosion and vegetation and describes, in coded form, land parcels or units in terms of those combined factors. The inventory then identifies the land use capability of each unit. Coverage at a scale of 1:63360 has been completed and 89 000 land management units have been mapped. The national coverage, coupled with its computer storage of both boundaries and codes, is a very effective and flexible physical base for soil conservation and general land use at regional through to local levels. Information on stock carrying capacity, fertiliser requirements, and potential for exotic forestry have now been added to the inventory, and national map series on erosion and vegetation are now in preparation.
Information from the inventory is also compiled at more detailed scales by catchment authorities for small catchments and individual farm properties, allowing soil conservators to recommend the best conservation practices and management of particular areas of land to ensure sustained permanent production. A plan is formulated by a soil conservator and then discussed with the landowner concerned. The plan may then be adjusted to suit the landowner's ability to carry it out over several years.
Planning—Soil conservation and water management activities are increasingly involved in planning. Catchment authorities make submissions to regional territorial local authorities, providing land and water resource information and soil conservation and water management objectives and policies, so that physical risks to development can be considered when social and economic factors are evaluated at the planning stage. Consideration of physical risks to development is required under the Town and Country Planning Act. This will help prevent some of the costly mistakes made in the past.
In particular, the identification of land of physical suitability for urban development, and the calculation and identification of areas susceptible to coastal erosion are making positive contributions to improved land planning.
Coastal Erosion—The coastlines of New Zealand total about 11 000 km in length, of which 80 percent is exposed to the open sea. For the exposed part, about 56 percent is static, 25 percent is eroding, and 19 percent is accreting. History has shown that even the accreting section of coastline may revert to erosion, so that, in total, almost half of New Zealand's coastline has a high susceptibility to erosion.
Coastal erosion has proved expensive in the past. The planning section of the Water and Soil Division, Ministry of Works and Development, is providing a coastal planning service through the department's works districts and the catchment authorities. Based on geological data, coastal hazard zones delineating land highly susceptible to erosion processes are being identified to assist planners.
River Control—The Soil Conservation and Rivers Control Act 1941 provides for the prevention of damage by erosion and the protection of property from damage by floods. The river control projects carried out by the 20 catchment authorities around the country often serve both these objectives. River training works are designed to give the river channel a stable alignment that will prevent bank erosion. Stopbanks are constructed to provide flood relief to low lying and mostly highly-productive agricultural lands.
The Soil Conservation and Rivers Control Council encourages a catchment-wide approach to water and soil problems. Comprehensive catchment control schemes embrace land retirement from grazing and protection planting of trees in the upper catchment, bank protection works in the middle reaches, and flood alleviation and drainage works in the lower reaches of a river. The Government, through the council, made $34,795,000 in grant assistance available to catchment authorities for schemes to meet these purposes in the 1983–84 financial year.
Grants are given to schemes that are in the national interest but which for some reason would not be implemented or would only be carried out partially or inadequately without Government incentives. Riparian landowners, for example, may not be able to afford isolated bank protection works defending individual properties whereas an integrated river control scheme bringing in a larger benefit area, and with a Government contribution in recognition of the wider community benefits of such a scheme, would enable sufficient local funds to be raised.
Most major and many smaller rivers in New Zealand are now covered by control schemes for at least part of their length. As natural river systems change continually in response to variations in average rainfall and sediment supply, a sustained works programme is required on many rivers so that the standards of protection can be maintained. In addition, some areas may require augmented schemes or even new and more comprehensive river control schemes offering higher standards of protection and control to prevent unacceptable levels of damage to increasing assets and to intensified patterns of land use which would otherwise be at risk.
POLLUTION—Public concern for the environment has led to an increased awareness of pollution problems. Organisations have responded by involving the public: in the decision-making processes and by amending legislation to provide the appropriate controls.
At present, different parts of the physical environment are protected by different organisations, with co-ordination provided by the Commission for the Environment. The problems of water pollution are being controlled by the Water Resources Council and the regional water boards and, as might be expected, the Ministry of Agriculture and Fisheries, through the Fisheries Act, and the Department of Internal Affairs, through the Wildlife Act, also have statutory powers to control water pollution; those of air pollution by the Department of Health under the provisions of the Clean Air Act 1972; and many local authorities have introduced bylaws to control noise problems in their areas.
Within the territorial sea and harbours, the Marine Pollution Act 1974 controls the discharge or dumping of oil or any other substance declared a pollutant. New Zealand also has a contingency plan for dealing with oil pollution in coastal waters and on the shore.
Pollution of our rivers and lakes can be caused by soil erosion, farm run-off, industrial waste, or domestic sewage. The Water and Soil Conservation Act 1967 provides for the control of waste discharges through water rights. These include conditions ensuring that the discharge has had adequate treatment sufficient to protect the receiving waters.
Diffuse forms of pollution like soil erosion and fertiliser run-off, require different approaches, such as through changing land use practices.
Sewage and farm run-off add nutrients to the water which in some lakes (e.g., Lakes Rotorua and Horowhenua) has caused excessive growth of weeds and algal blooms, to the detriment of water quality. Waste disposal from cities and the forestry and meat industries are also major contributors to pollution.
Urban solid-waste disposal is largely by the land-fill technique, and most major cities are establishing tip sites planned to last up to 50 or 100 years. Until recently large amounts of wood were left in the forest during logging or dumped near sawmills. Now, much of this waste wood is chipped for use in pulp mills, either within the country or overseas.
Organic chemical pesticides and herbicides are widely accepted as essential for efficient agriculture and horticulture. The use of such chemicals is controlled by the Agricultural Chemicals Board under the auspices of the Ministry of Agriculture and Fisheries. The board controls the import of chemicals and has an approved list of proprietary herbicides and pesticides for use in different situations such as in or near water, and also gives guidance on the application of those chemicals.
Several divisons of the Department of Scientific and Industrial Research are concerned with monitoring pollution. The Chemistry Division conducts surveys of mercury contamination of fish and water, arising from geothermal outflows. Nitrate concentration in ground waters, and insecticides in water are measured, and checks are kept on heavy metals in foods. The Oceanographic Institute traces the biological effects of heated water discharges from thermal power stations. The Physics and Engineering Laboratory participates in the Earth's Resources Technology Satellite programme. The department also assists such organisations as the Dairy Research Institute, the Meat Industry Research Institute, the Wool Research Organisation, and the Leather and Shoe Research Association, which are industrial research groups all supporting projects to reduce pollution and increase the use of by-products from their industrial processes which have in the past been wasted.
New Zealand's geographical shape and location is, in general, favourable to the dispersal of air pollutants, although some areas, such as Christchurch, suffer from air pollution problems. The Clean Air Act 1972, the first part of which came into effect on 1 April 1973, established the principle of air pollution control on industry by the best practicable means. Provision was also made for the establishment of smokeless zones. The first clean air zone under the Act has been established in Christchurch.
The Clan Air Council was established under the Clean Air Act 1972 to advise the Minister of Health on all aspects of air pollution. It advises local authorities on their work under the Act and co-ordinates the work of control authorities and voluntary organisations. It publishes reports from time to time, and is undertaking research work through four committees studying respectively clean air zones and domestic heating, motor vehicles and air pollution, rural pollution, and planning co-ordination.
FURTHER INFORMATION—Further information on the relationship of the environment and economic growth will be found in the following publications.
Report of the Department of Lands and Survey (Parl. paper C. 1).
Report of the Commission for the Environment (Parl. paper C. 7).
Report of the Queen Elizabeth the Second National Trust (Parl. paper C. 2).
Report of the Director-General of Forests (Parl. paper C. 3).
Report of the Nature Conservation Council (Parl. paper C. 4).
Report of the National Water and Soil Conservation Authority (Parl. paper D. 2).
Report of the National Parks and Reserves Authority (Parl. paper C. 10).
Ministry of Works and Development Statement (Parl. paper D. 1).
Proceedings of Soil and Plant Water Symposium 1976—DSIR (1977).
Land Application of Treated Sewage Effluent—DSIR (1976).
Research into Aquatic Weeds in New Zealand Waterways—DSIR (1976).
Slope Stability in Urban Development—DSIR (1977).
Eutrophication of Lake Rotorua—DSIR (1977).
The Physical Environment Conference 1970: Reports, Papers and Proceedings.
See also the special article The New Zealand Environment and Changes in Environmental Management Since 1970 m the 1980 Yearbook.
CROWN LAND—There are 5.5 million hectares of Crown land which are held under lease or licence by individuals for farming or other purposes. Land permanently set aside for national parks and public reserves comprises 2.7 million hectares. The Department of Lands and Survey is also developing 0.61 million hectares of land, of which 0.35 million hectares is intended for subdivision and settlement as individual farms.
Administration—Crown land is administered under the authority of the Land Act 1948. The Minister of Lands is charged with the administration of the Land Act, and his executive officer is the Director-General of Lands. New Zealand is divided into 12 land districts, the executive officer for each district being a Commissioner of Crown Lands.
The central authority under the Land Act is the Land Settlement Board consisting of the Minister of Lands (chairman), the Director-General of Lands (deputy chairman), the Secretary to the Treasury, the Director-General of Agriculture and Fisheries, the Valuer-General, a representative of the Rural Banking and Finance Corporation, the Deputy Director-General of Lands, the Fields Director of the Department of Lands and Survey, and not more than 4 other persons appointed by the Minister.
The Land Settlement Board is required to appoint 1 or more land settlement committees for each land district, and 20 of these committees have been set up. Each committee consists of 3 members with the Commissioner of Crown Lands for the land district as chairman and 2 private farmer members.
The Land Settlement Board, through the Department of Lands and Survey, disposes of Crown land for farming, residential, commercial, and industrial purposes. The demand for this land, particularly farm land, is considerable.
DISPOSAL OF CROWN LAND—Crown land is normally offered to the public at valuation and the successful applicant decided by ballot, although in exceptional circumstances preferential allotment can be made. Any land may, however, be offered for disposal by tender at an undisclosed minimum price or rental value or by public auction at an unset price.
Crown land may be acquired on the following tenures:
Farm land, urban land, commercial, or industrial land—(a) On renewable lease; (b) for cash; (c) on deferred payments. A renewable lease is for a term of 33 years with a perpetual right of renewal for the same term and, except where otherwise provided for, with a right of acquiring the fee simple. Annual rent is reviewed at 11-yearly intervals.
Pastoral land—(a) On pastoral lease for a term of 33 years with a perepetual right of renewal for the same term, but with no right of acquiring the fee simple; (b) on pastoral occupation licence for a term not exceeding 21 years, with no right of renewal or of acquiring the fee simple.
Short tenancies for grazing or other purposes for a term not exceeding 5 years.
Land Allocation—The following table shows details of land allocated during the year 1982–83.
| Tenure | Number | Total Area Allocated | Purchase Price or Annual Charges |
|---|---|---|---|
| * Area and rent not shown. Licence on royalty basis only. | |||
| hectares | $(000) | ||
| Freehold | 218 | 1,218 | 948 |
| Renewable leases | 75 | 20,345 | 436 |
| Pastoral leases and licences | 1 | 440 | – |
| Deferred-payment licences | 212 | 23,103 | 787 |
| Special leases (s. 67 Land Act) | 33 | 1,624 | 12 |
| Licences to occupy | 271 | 4,745 | 190 |
| Licences for removal of minerals* | – | – | – |
| Leases of endowment and other lands | 132 | 3124 | 70 |
| Former mining tenures (over Crown land) | 4 | – | 3 |
| Total 1982—83 | 946 | 54 599 | 2 446 |
| Total 1981—82 | 1 045 | 45 210 | 2 608 |
Leases and Licences—The following table shows the total number of leases and licences under the Land Act 1948 current as at 31 March 1983.
| Tenure | Leases and Licences | Area | Annual Rent | Annual Instalments* |
|---|---|---|---|---|
| * Including improvement loading. | ||||
| No. | hectares (000) | $(000) | $(000) | |
| Renewable leases | 4,581 | 485,560 | 2,778 | 49 |
| Pastoral leases and licences | 415 | 2,709,583 | 179 | 2 |
| Special leases | 780 | 76,352 | 356 | 7 |
| Deferred-payment licences | 10,559 | 1,310,378 | – | 13,020 |
| Miscellaneous leases and licences | 1 | 34 | – | – |
| Licences to occupy | 4,026 | 139,312 | 703 | – |
| Leases of endowment and other lands | 520 | 101,716 | 412 | 24 |
| Licences for removal of minerals | 19 | – | – | – |
| Total 1982—83 | 20 901 | 4 822 935 | 4 428 | 13 102 |
| Total 1981—82 | 21 701 | 4 648 | 3 739 | 11 584 |
Freeholdings—The following table shows the number of leases and licences under the Land Act 1948 freeholded, either for cash or on deferred payments, during the year ended 31 March 1983.
| Method of Payment | Crown Lands | Area | Purchase Price |
|---|---|---|---|
| No. | hectares | $(000) | |
| Cash | 53 | 3,674 | 895 |
| Deferred payments | 252 | 65,687 | 10,911 |
| Total 1982—83 | 305 | 69 361 | 11,806 |
| Total 1981—82 | 389 | 106 189 | 18,367 |
Further details on other leases and licences may be obtained from the annual report of the Department of Lands and Survey, Parliamentary paper C. 1.
LAND DEVELOPMENT AND SETTLEMENT—The Land Settlement Board was constituted in 1948 and is responsible for the administration of land policy and the development and settlement of Crown land through the Department of Lands and Survey. The development of land in preparation for ultimate subdivision and settlement of farm units involves clearing, cultivation, grassing, fencing, the erection of essential improvements, and the installation of water supplies under a development programme undertaken annually. As at 31 March 1983 some 354 007 hectares were under development by the Department of Lands and Survey for eventual settlement. It is expected to yield an estimated 910 farms for settlement by landless farmers before the turn of the century. The major development districts as at 31 March 1983 were Southland with 122 662 hectares; Rotorua-Taupo district, 40 268 hectares; North Auckland, 56 368 hectares; Te Kuiti, 38 163 hectares; Gisborne, 26 539 hectares; and Otago, 23 370 hectares.
Despite the state of the economy and the need to reduce expenditure, the Government has maintained a settlement programme over recent years. Where suitable properties are available consideration will be given to purchase for medium- or long-term development in conjunction with adjoining Crown land. The policy of making funds available annually for the purchase of sheep and cattle properties has been discontinued, but the situation is likely to be reviewed when the existing land bank has been reduced.
From the inception of the settlement programme in 1941 to 31 March 1983 a total of 4736 ex-servicemen and civilian settlers have been settled on farms of their own. The aggregate area of the farms has totalled 806 204 hectares.
The Department of Lands and Survey is continuing to pursue its policy of heavy culling of stock to improve stock quality and to establish top class flocks and herds with proven genetic background. The main concentration on breeding is at Waihora Farm Settlement near Taupo where results to date have been impressive. High fertility rams are still being made available for use in the department's development programmes in other districts, and a limited number are sold annually to the public. This large-scale programme is the biggest of its kind in New Zealand and the department's involvement in this field is of interest to the farming industry generally both in this country and overseas. Starting in 1979 the department has also sold a limited number of surplus angora goats to the public from its flock at Waitangi.
The Department of Lands and Survey in association with the New Zealand Forest Service has established joint farm/forestry ventures operating in North Auckland, Hawke's Bay, Canterbury and Otago. This is a relatively new concept in New Zealand, involving the grazing of stock among widely spaced trees. Indications are that it could be a profitable one.
Over recent years the Department of Lands and Survey has continued to diversify its farming operations. The fields in which it is currently involved include angora goat farming, deer farming, exotic sheep and cattle breeding, citrus fruit growing, grape growing, raising olive trees, and similar operations.
NATIONAL PARKS AND RESERVES: History—Royal Instructions issued to New Zealand's first governor—Captain William Hobson—who reached this country in 1840, included the concept of reserving land for public use and enjoyment. Natural areas retained at a time when much of the country was relatively unmodified are still available today in the form of national parks, and scenic and allied types of reserves.
National Parks—The national park system in New Zealand had its origin in 1887 when Te Heuheu Tukino and other Maori chiefs gifted to the Crown the summits of their sacred mountains of Ruapehu, Ngauruhoe, and Tongariro. The gifted area provided the nucleus of the first national park—Tongariro—which was formally constituted by Act of Parliament in 1894. Special legislation in 1900 established Egmont as a second national park, while Fiordland had its beginning in 1905 with the reservation of over 800 000 hectares as a public reserve for “a national park”.
The Public Reserves, Domains, and National Parks Act 1928 and the National Parks Act 1952, which have been the stepping stones for national park legislation, have now been superseded by the National Parks Act 1980.
The 1980 Act established a National Parks and Reserves Authority as an independent statutory body comprising 10 people representing private organisations and the public. Four members are appointed by the Minister of Lands from public nominations; 1 member representing the Royal Society of New Zealand, the Royal Forest and Bird Protection Society, and Federated Mountain Clubs of New Zealand (Incorporated) on the recommendation of each organisation; and 3 members are appointed after consultation with the Minister of Tourism and the Minister of Local Government. The authority has general oversight and responsibility for the formulation of policy and management planning for national parks and reserves of national importance, and the Department of Lands and Survey looks after the day-to-day administration as well as servicing the authority and boards.
At district level, 12 National Parks and Reserve Boards have been set up to have general oversight for the management of national parks and reserves of national importance within their specific region. Each board has 10 members appointed by the Minister of Lands after public nomination and consultation with the authority. Nominations are considered on the basis of the individual's special knowledge or interest in matters connected with the policy for, and management of, national parks and reserves. Also taken into consideration are the nominated individual's interest in regional or community affairs, tourism, recreation or conservation.
Rangers employed in the Public Service for the Department of Lands and Survey are responsible for development, protection, interpretation, and management in each park.
The status of national park land cannot be changed except by Act of Parliament.
Description—New Zealand's 10 national parks, cover 2 178 338 hectares (or one-thirteenth of the country's land area) of beautiful or unique natural features and scenery. Accommodation, transport, and other services in or near the parks are provided by the Department of Lands and Survey, Government agencies, private enterpise, and voluntary organisations. Although the National Parks Act provides for freedom of entry and access by the public, this is subject to conditions and restrictions “necessary for the preservation of the native plants, and animals or for the welfare in general of the parks”. Access to “special areas” constituted under the Act is (if the circumstances warrant) by permit only. The Act also requires parks to be administered and maintained so that they are preserved as far as possible in their natural state that their value as soil, water, and forest conservation areas is maintained; and that as far as possible, native plants, and animals are preserved, and introduced plants and animals exterminated.
Development permitted by the National Parks Act includes the erection of houses for rangers and park staff, and the provision of camping grounds, huts, hostels, accommodation houses and other buildings, ski tows and similar facilities, parking areas, roading and tracks. In “wilderness areas”, established in terms of the Act, development is restricted to foot-track access and the erection of huts for essential wild animal control operations or to facilitate scientific research. Authority policy and park management plans provide guidelines and criteria for the extent of acceptable development in national parks.
Virtually all the finance for national parks is provided by the Government but cash donations by private individuals and organisations are encouraged: these earn a $2 for $1 subsidy from the Government.
Of the 10 national parks, 3 are in the North Island and the remainder are in the South Island. Brief descriptions of the national parks are given below.
Urewera National Park (207 462 hectares, established in 1954), surrounds the beautiful Lakes Waikaremoana and Waikareiti. As the traditional home of the Tuhoe, “the Children of Mist”, it is rich in Maori folklore. The park protects the largest remaining area of native forest in the North Island and provides a home for many species of native birds.
Tongariro National Park (76 504 hectares, established in 1894), includes the 3 active volcanic cones of Ruapehu, Ngauruhoe, and Tongariro. Ruapehu's snowfields are the winter playground of the North Island. Lake Rotopounamu, still free from exotic fish, and Mount Pihanga are 2 other focal points of the park.
Egmont National Park (33 540 hectares, established in 1900), contains 1 of the world's most symmetrical mountains, known to the Maoris as “Taranaki”, and preserves magnificent scenery and vegetation within a 9-kilometre radius of the summit. Dominating Taranaki province in the west of the North Island, the near perfect cone varies from heavily-forested lower slopes to the bare scoria, rock, snow, and ice at the upper levels.
Abel Tasman National Park (22 509 hectares, established in 1942), with a broken coastline and rich in historical significance, has numerous tidal inlets and beaches of golden sand fronting Tasman Bay. Botanically, the park is unique as its bush-clad slopes show a blending of the natural cover of both the North and South Islands, a phenomenon of nature not found elsewhere in the country.
Nelson Lakes National Park (57 508 hectares, established in 1956), is named after the chief focal points for visitors, the beautiful Lakes Rotoiti and Rotoroa. These nestle in rugged mountainous country with extensive beechforest-clad lower slopes. The Mount Robert area, with its magnificent views, provides visitors with winter recreational opportunities on its ski fields.
Arthur's Pass National Park (94 422 hectares, established in 1929), is a rugged and mountainous area straddling the main divide of the Southern Alps. It is an area of high peaks (at least 30 over 1800 metres), snowfields, deep-cut valleys, snowgrass-clad ridges, forest-clad hillsides, high waterfalls, wide shingle riverbeds, and rushing torrents, all providing endless scope for physical endeavour or quiet appreciation.
Mount Cook National Park (69 958 hectares, established in 1953) and Westland National Park (117 547 hectares, established in 1960) share a common boundary along the main divide of the Southern Alps. Their magnificent alpine scenery, containing almost all of the 27 peaks over 3050 metres in height, includes New Zealand's highest mountain, the 3764-metre Mount Cook, known to the Maoris as “Aorangi”—freely translated as “Cloud Piercer”. Their attractions are as varied as their altitude, ranging from well known glaciers such as Tasman (at 29 km in length one of the longest outside polar regions), Franz Josef and Fox, to hot springs, placid lakes, and the subtropical luxuriance of the rain forests.
Mount Aspiring National Park (287 311 hectares, established in 1964), is a complex of impressive glaciated mountain scenery which includes the headwaters of 7 major rivers. The park's distinctive character is enhanced by bush-covered mountainside and pleasant river flats and valleys. Its focal point, often referred to as the Matterhorn of New Zealand, is the 3036-metre Mount Aspiring, a 4-ridged peak rising from the Bonar Therma-Volta ice shelf, and the country's highest peak outside Mount Cook National Park.
Fiordland National Park (1 211 578 hectares, established in 1952), is one of the largest national parks in the world, and is renowned for the rugged grandeur of its scenery which includes fiords, mountains, forests, waterfalls, and lakes. The better known lakes are Manapouri, backed by snowcapped peaks, and Te Anau. The park is the only known habitat of 2 flightless birds, the takahe (notornis) and (except for a small colony on Stewart Island) the kakapo.
In addition to the national parks there are large numbers of reserves including scenic reserves, recreation reserves (many of these are designed primarily for organised sport), historic reserves, and nature reserves. There are also 3 maritime parks.
Forest parks, under development by the New Zealand Forest Service, are briefly described in Section 16, Forestry.
RESERVES—The main legislation providing for the setting aside of land for public use, e.g., for the preservation of flora and fauna, scenery preservation, or recreation, are the Land Act 1948 and the Local Government Act 1974 and its subsequent amendments. The Land Act enables land owned by the Crown, including foreshore areas, to be reserved for any purpose desirable in the public interest, while under the Local Government Act local authorites are charged with ensuring that adequate provision is made for public reserves on subdivisions of land.
The current legislation governing the administration, management, and control of reserves is the Reserves Act 1977. This Act established 7 distinct categories of reserves, each with its own management requirements. The 7 categories are: recreation, historic, scenic, nature, scientific, Government purpose, and local purpose. In addition there is provision to declare any reserves of national or international significance to be national reserves which can be revoked only by Act of Parliament. All reserves are currently being classified into the above categories. The classification process will take some time to complete but considerable progress has been made. Until finally classified, all reserves are to be administered for the purpose of their existing reservation.
Scenic Reserves—Scenic reserves, of which there are 1134 with an overall area of 345 247 hectares, are set aside to preserve features or areas of scenic interest such as native forest, limestone and glowworm caves, thermal areas, sea coasts, lakes, rivers, waterfalls, scenic vantage points, and forested areas with considerable conservation value. Some of these reserves are mainly of local or regional significance while many of the larger ones, which are in the nature of small national parks, are of national importance. Public use of scenic reserves varies greatly, ranging from off-road parking and picnicking to camping, tramping, and hunting (subject to written permit).
Scenic reserves in excess of 2000 hectares include Lewis Pass, Wanganui River, Buller Gorge, Rakeahua, South Cape (Stewart Island), Lake Kaniere, Gouland Downs, Glenhope, Lake Brunner, Rahu (Reefton), Mangamuku Gorge, Tangarakau, Te Tapui (Cambridge), and Waioeka Gorge.
Improved maintenance, management, and control of scenic reserves has been accomplished through the classification of their principal values and most appropriate usage. The appointment of salaried reserves rangers in the Public Service to ensure that the reserves are preserved as far as possible in their natural state “in the public interest” and for the “benefit, enjoyment, and use of the public” has also been of considerable assistance. In addition, native trees and shrubs are being propagated at the Department of Lands and Survey's Taupo Nursery to promote scenic restoration activities in reserves throughout the North Island with particular emphasis on the Taupo basin in the wake of power scheme works. A nursery has also been established at Home Creek in Southland to service requirements for the South Island.
Land of special scenic interest may, while remaining in private ownership, receive the benefits of preservation and protection of the Reserves Act 1977 through being declared private protected land. Areas which have received such protection include White Island in the Bay of Plenty, where petrels and gannets nest in large numbers annually, and a large area of the Pukeiti Rhododendron Trust property, near New Plymouth, and adjoining Egmont National Park, which is in native bush.
Historic Reserves—One hundred and forty one areas of historic interest totalling 2354 hectares are set aside as historic reserves. The Department of Lands and Survey co-operates closely in the administration and investigation of historic sites with the New Zealand Historic Places Trust. Historic reserves mark the landfall and landing places of early voyagers such as Tasman and Cook, the site of missionary Samuel Marsden's first sermon on New Zealand soil, sites of early fortifications, of engagements during the Maori wars, and buildings of historic value. (The Treaty House area at Waitangi, administered by the Waitangi National Trust is not a historic reserve in the strict sense.) Sites of Maori rock drawings and places of significance in New Zealand's early constitutional history are also preserved.
Nature Reserves—Land is reserved for bird sanctuaries, for the preservation of flora and fauna, or some similar purpose in cases where the land provides a habitat for bird or plant life of such importance that some control on public access is desirable. In all there are 49 reserves in this category with a total area of 184 603 hectares. Some of them are mainland areas, but most are off-shore and outlying islands. Major areas of particular public interest include Little Barrier Island in Hauraki Gulf, the only known habitat of the stitch bird, and now part of the Hauraki Gulf Maritime Park; Cape Kidnappers gannet colony in Hawke's Bay; Kapiti Island off Wellington's west coast; the white heron colony in South Westland; and Taiaroa Head albatross colony near Dunedin.
All New Zealand's subantarctic islands, except for a small area surrounding the meteorological station on Campbell Island, are reserved for nature purposes and provide a habitat for marine mammals and millions of sea birds. As well as Campbell Island, the reserves include the Auckland Islands, Bounty Islands, Antipodes Islands, and Snares Islands. To the north of New Zealand, most of the land in the Kermadec Islands is similarly reserved.
Access to these reserves is by permit only, a policy followed solely in the interests of preservation of the plant and animal life to ensure an absolute minimum of human interference to anything living and growing naturally there. The reserves are administered by the Department of Lands and Survey.
Hauraki Gulf Maritime Park—This park was established under the Hauraki Gulf Maritime Park Act in 1967. The park may include reserves of any type on or off the east coast of the North Island from Whangamata Harbour to Home Point at the northern end of Bland Bay. It includes such well-known islands as Motuihe, Rangitoto, Browns, Motutapu, Motuora, Poor Knights, Little Barrier, and part of Kawau containing the historic Mansion House. The park is administered by a board of 8 members.
Marlborough Sounds Maritime Park—This park was established in 1973 under the Reserves Act 1977 and is administered by a 14-member board. The park provides for co-ordinated management of existing scenic, historic, recreation, and other public reserves located within the coastal region stretching from Cape Soucis in the west to Rarangi in the south-east. Appropriate island reserves are also included.
Bay of Islands Maritime and Historic Park—This park was established in 1978 under the provisions of the Reserves Act 1977. The park provides for co-ordinated management of existing scenic, historic, recreation, and other reserves located within the coastal region, stretching from the Whangaroa Harbour in the north to the Whangamumu Harbour in the south, and includes many reserves on the mainland in and around Kerikeri and Russell and on many of the adjacent islands. The park is administered by a board of 10 members.
Wildlife Reserves—There are 3 classes of wildlife reserves, namely wildlife sanctuaries, wildlife refuges, and wildlife management reserves. These may be proclaimed over land of any tenure, and any such proclamation prohibits only certain actions in respect of wildlife but does not affect the land ownership. In addition, any of the 3 classes may be declared in respect of lands of the Crown. In such cases the declaration is made pursuant to the Land Act 1948, thus conferring upon the lands reserve status pursuant to the Reserves Act 1977.
Wildlife Sanctuaries—The role of Wildlife Sanctuaries is to protect fragile wildlife habitats from the effects of entry by humans or animals; and protection of wildlife species which are low in numbers regionally or nationally, or are confined within a small number of habitats which are sensitive to disturbance.
The major administrative and management objective is the total or partial exclusion of the public from such areas. Written permits to enter a sanctuary are required from the Secretary for Internal Affairs.
At present there are 16 wildlife sanctuaries, all but 3 of which are on off-shore islands.
Wildlife Refuges—This status is given to wildlife habitats which require protection to ensure the well-being of the habitats and to maintain the natural regional or local distribution and presence of wildlife.
The primary management functions are to carry out habitat maintenance, and to allow the public freedom of access, except that firearms and domestic animals are prohibited.
Wildlife Management Reserves—The objective for this class of reserve is similar to that of wildlife refuges, but the primary management functions are to manipulate and improve the habitat for wildlife, and to allow freedom of public entry together with a variety of activities, including the hunting of game species of wildlife.
Recreation Reserves—Recreation reserves, including public domains which are now categorised as recreation reserves administered by the Department of Lands and Survey, number 817 covering 26 434 hectares. These provide for the recreational needs of the people as a whole. While many such reserves are designed primarily to provide for organised sport there are a large number which preserve for public use attractive and natural areas, particularly along the coastline, and provide facilities for camping. Some outstanding examples of coastal reserves are Orewa, near Auckland, Ohope Beach, near Whakatane, Queen Elizabeth Park, near Wellington, Momorangi Bay in the Marlborough Sounds, Kaiteriteri and Pohara in the Nelson district, and Waikuku Beach in Canterbury. Widely known city reserves are the Auckland Domain and Hagley Park, Christchurch. Native bush is protected on reserve land.
Summary of Areas Reserved—The following table records the main classes of reservations at 31 March 1983.
| Type of Reservation | No. | Hectares |
|---|---|---|
| National parks | 10 | 2,178,338 |
| Scenic reserves | 1,134 | 345,247 |
| Historic reserves | 141 | 2,354 |
| Nature reserves | 49 | 184,603 |
| Recreation reserves | 817 | 26,434 |
| Scientific reserves | 38 | 3,664 |
QUEEN ELIZABETH THE SECOND NATIONAL TRUST—The Queen Elizabeth the Second National Trust was established by Act of Parliament in December 1977 to encourage and promote the provision, protection, and enhancement of open space for the benefit and enjoyment of the people of New Zealand. The formation of the trust commemorates the Silver Jubilee of Her Majesty the Queen.
The trust was set up to fill a growing need for an independent body to oversee the development of an overall open space plan and policy.
The main functions of the trust are to advise the Minister of Lands, other ministers, Government departments, and other bodies on all matters concerning open space; to investigate, identify, and classify potential reserves and recreation areas; to promote research into open space; to co-ordinate the activities of interested Government departments and other bodies or persons; to negotiate open space convenants; and to acquire open space.
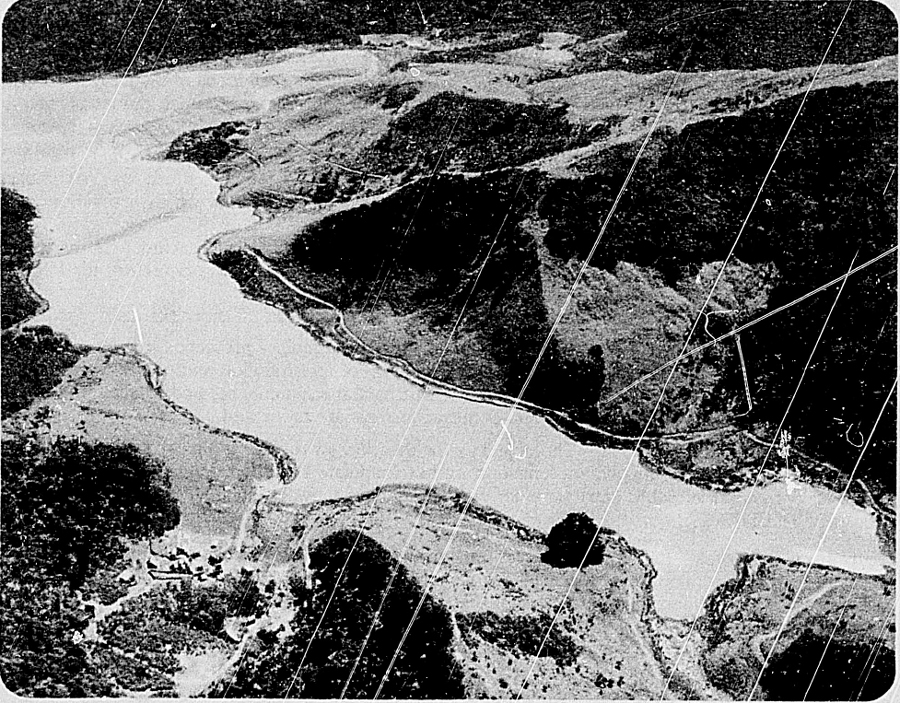
The trust is administered by a board of 10 directors, 3 of whom (including the chairman) are appointed by the Minister of Lands, 2 by election by the members, and 5 by the minister after consultation with Federated Farmers of New Zealand Inc., the New Zealand Maori Council, the New Zealand Counties Association Inc., and the Municipal Association of New Zealand Inc.
Board meetings are attended by the permanent heads of the Departments of Lands and Survey, Internal Affairs, Maori Affairs, the New Zealand Forest Service, the Ministry of Works and Development, and the Commission for the Environment.
An essential part of the trust is the membership. There is individual, corporate, and life membership. As well as electing 2 directors, the members form an integral part of the trust's operation, particularly on a local level.
The promotion of open space covenants is an important aspect of the trust's work. An open space covenant is a means by which landowners can protect their land or features of it such as forest remnants or wetlands. A covenant can be in perpetuity or for a specified time. The landowner retains title to the land; it does not become the property of the trust or the State.
Major landscape features such as river valley can be protected by a number of covenants with the different landowners.
Donations, bequests, and gifts of land are accepted by the trust. It now owns several properties of valuable open space such as Hollard Gardens in Taranaki, and the Jackson farm in the Wairarapa.
The trust is also able to purchase open space, such as the Lake Wainamu Scenic Reserve in the Waitakeres, Auckland, which was purchased in co-operation with other organisations.
Other activities include landscape awareness projects, establishing demonstration farms to show how landscape design and planning can be combined productively with farm management, protection of wild and scenic rivers, and the publication of the Revegetation Manual.
NEW ZEALAND WALKWAYS—The purpose of the New Zealand Walkways Act 1975 is to establish “… walking tracks over public and private land so that the people of New Zealand (can) have safe, unimpeded foot access to the countryside for the benefit of physical recreation, as well as for the enjoyment of the outdoor environment and the natural and pastoral beauty and historical and cultural qualities of the areas through which they pass”.
To promote, supervise and co-ordinate this development, the Act constituted the New Zealand Walkway Commission and charged it with the responsibility for walkway administration, with power to delegate duties to 12 district walkway committees, 1 for each land district constituted under the Land Act 1948, and also to other controlling authorities. In recognition that public, local authority, Government agency, and private lands would be used for walkways, the composition of the commission was structured accordingly, with the members of the commission being the Director-General of Lands (chairman), and the Director-General of Forests, and a representative each of the Municipal Association of New Zealand, the Counties Association of New Zealand, the New Zealand Council for Recreation and Sport, the Federated Mountain Clubs of New Zealand, and the Federated Farmers of New Zealand. Similar representation composes each district walkway committee.
Between the commission's inception in 1976, and 31 March 1983, a total of 90 walkways having a combined length of 905 km were opened for public use. There are also numerous urban walks established by local authorities which are regarded as being complementary to the New Zealand Walkways System. These will not be brought under the provisions of the New Zealand Walkways Act 1975 unless it is the wish of the local authority.
FURTHER INFORMATION—The Government Printer has produced a number of publications dealing with the National Parks, both individually and in total, and with scenic reserves. Other publications dealing with public lands include the following:
Report of the Department of Lands and Survey (Parl. paper C. 1).
Report of the Queen Elizabeth the Second National Trust (Parl. paper C. 2).
Report of the Department of Internal Affairs (Parl. paper G. 7).
Report of the National Parks and Reserves Authority (Parl. paper C. 10).
The Department of Lands and Survey is the national survey and mapping organisation. Its major functions include the maintenance and extension of the survey control system, examination of all land title surveys, regulation of survey standards, land planning, co-ordination of aerial photography requirements of the Government, and the publication of all topographic, cadastral, and special maps of New Zealand.
SURVEYING—The New Zealand survey control system, in the form of trigonometrical and other geographically located stations, provides the basis for effective integration of surveys executed by all sectors for land title definition, land development and utilisation, engineering construction, communications, mapping production, scientific studies, and the location of marine and air navigation aids.
Examination and approval by the department of all land title surveys ensures the security of tenure essential to development, and the maintenance of all survey records on a microfilm system provides for ready access and utilisation of data. The control of survey standards, maintenance of discipline, and training of professional surveyors is effected through the statutorily constituted Survey Board under the chairmanship of the Surveyor-General.
Other departmental services provided to Government include surveys for land title, land development, navigational purposes, earth deformation studies, administration of justice, land and environmental planning, draughting services related to local government administration, census and electoral activities, and mining applications.
The practising surveyors in the private sector play a major role in surveys of private lands under the Land Transfer Act 1952, the planning and development of housing projects, and the execution, under contract, of some government surveys.
AERIAL PHOTOGRAPHY—Extensive use is made of aerial photography in the production of photogrammetric mapping and in the annual provision of basic physical resource and planning data. Photography is undertaken by private aerial survey firms under contract to the Department of Lands and Survey, which maintains a comprehensive library of air photos for all national purposes and general public usage.
Under agreement with the authorities in the USA the department now receives and holds multispectral imagery collected by earth resources satellites for use in studies associated with land use and management, regional planning, and scientific research in New Zealand.
MAPPING—Both the imperial maps and the basic metric topographical and cadastral maps now under production provide a reliable inventory of physical resources and an up-to-date identification of land parcels and legal situations. They are in constant demand for planning, construction, development of land, extension of public and social services, protection of the environment, the general use and guidance of the public, administration of central and local government, and defence.
Regularly updated street maps cover all significant urban areas.
The Department of Lands and Survey also produces and publishes a wide range of other maps for various purposes including recreation, national parks, and miscellaneous and general maps of New Zealand, the Pacific, and Antarctica. As the mapping agency for the Government in New Zealand, the department produces maps needed to service the activities of other departments, particularly aeronautical charts for military and civil use, meteorological maps and charts, and maps for the Ministry of Works and Development, the New Zealand Forest Service, and other Government departments.
Topographic and orthophoto mapping produced by photogrammetric methods for projects and special purposes is executed at larger scales to provide an essential base for investigation and design of energy, irrigation, forestry, and communications projects.
Map sales agencies are maintained at each of the district offices except Wellington and at the Head Office of the Department of Lands and Survey which also holds bulk map supplies and maintains a world reference library of maps at its Map Centre. In addition, a large number of private selling agents have been appointed throughout New Zealand and overseas. All maps for sale are listed in the Catalogue of Maps published by the department.
Maps for the New Zealand Land Inventory are being produced with first priority being given to areas where land use change can be anticipated. These maps are produced from authoritative data and are published to uniform standards and presentation. They show the physical and cultural data about land, and overlays can be prepared to assess physical suitability for appropriate land uses.
REGISTRATION OF LAND OWNERS—Title to land in private ownership in New Zealand is a matter of public record. The keeping of these records is the function of the Land and Deeds Division of the Department of Justice.
Almost all privately owned land in New Zealand is held under the land transfer system, presently embodied in the Land Transfer Act 1952. The system was introduced to New Zealand by the passing of the Land Transfer Act 1870. This Act was based on legislation enacted in South Australia in 1858, largely at the instigation of Sir Robert Torrens. Today the principles enunciated by Torrens are the basis of land registration throughout Australasia. The principal features of the system are registration of title and guarantee of that title by the State.
The objects of the Land Transfer Acts since 1870 have been to provide security of title by means of state guarantee, simplicity by use of standardised forms in language readily understood by the layman, accuracy by the use of precise survey data, the reduction of costs by simplification of conveyancing procedures, expedition by streamlining and constantly revising recording procedures, and suitability to circumstances by relating our land registration system directly to our social and economic structures.
Under the land transfer system, land and interests in land do not pass by the execution of an instrument of transfer but by the registration of that instrument. A person acquires a legal interest in land not because he has entered into an agreement to purchase the land, but because he has registered the instrument of transfer and it is recorded on the register that he is the owner.
The certificate of title is the pivot on which the whole land transfer system turns. A certificate of title is issued under the hand and seal of the District Land Registrar which guarantees to the registered proprietor of the Hand described in that certificate his rights of use, occupation, and enjoyment, the extent and position of his boundaries, and the nature of any encumbrances or interests affecting his land, such as mortgages or rights of way. Two copies of the certificate of title are issued; 1 copy forms the Land Transfer register, and the duplicate is held by the owner. This duplicate must be presented to the Land Registry Office for noting whenever documents affecting the estate for which it was issued are submitted for registration. Any change in the registered proprietorship which occurs through transfer, death, or other devolution, and the encumbrances to which the land is subject may be entered on the register by the registration of the appropriate documents in the manner prescribed by the Land Transfer Act.
Interests in, and charges against, land arising from many other statutes may be noted against the Land Transfer register. Successive governments have charged the Land and Deeds Division with duties of surveillance under the laws relating to the subdivision and aggregation of land, disposition of public reserves, anti-slumming requirements of local authorities, and many other aspects of land use and occupation.
Certain leases and licences of Crown land may be registered under the provisions of the Land Transfer Act, and Maori land when vested in any person for a freehold estate comes automatically under the land transfer system.
Settlement of matrimonial homes as joint-family homes has been a widely used procedure since its inception over 30 years ago and, until recent years, there was a steady increase in the number of settlements registered (see Section 20).
Certificates of Title Issued—The following table shows the number of certificates issued for the latest 6 years.
| Year Ended 31 March | Total |
|---|---|
| 1978 | 49,516 |
| 1979 | 42,176 |
| 1980 | 43,816 |
| 1981 | 34,332 |
| 1982 | 36,472 |
| 1983 | 38,910 |
ACQUISITION OF LAND—Safeguards have been made for long-term planning in the use of land, whether publicly or privately owned, in order to ensure that it and its resources are used to the best advantage of the community as a whole. Legislation introduced in 1968 and 1969 (by amendment to the Land Settlement Promotion and Land Acquisition Act 1952) prevents, where there is an operative regional plan or district scheme, the acquisition by overseas interests of land of 4000 sq metres or over designated or zoned as reserves for recreation or other purposes, and all islands or parts of islands within 150 kilometres of the mainland, and the Chatham Islands. The legislation covers rural land and farmland of 2 hectares or over. Here a purchase may be approved if specified conditions, directed to ensuring beneficial use of the land from a national viewpoint, or permanent Suture residence, are met.
The court shall grant its consent where the purchaser or lessee is a person ordinarily resident in New Zealand, i.e., who has resided in New Zealand for 2 1/2 years and the court is satisfied that he intends to continue to reside in New Zealand. Where the purchaser or lessee is not a person ordinarily resident in New Zealand or is an overseas company, the court shall not grant its consent unless it is satisfied that the land is not required for any reserve purpose and that the land is not an island or forms part of the Chatham Islands. In the case of farmland, the court must be assured that the purchaser or lessee intends to conduct experimental or research work on the land which will benefit agricultural industries in New Zealand or the community generally, or that the land will be used for purposes other than agricultural with greater advantage to the community, or in the case of an individual that he/she intends to reside permanently in New Zealand and farm the land exclusively for his/her own use and benefit and has the ability and means to do this.
Part I of the Land Settlement Promotion and Land Acquisition Act authorises the Minister of Lands to take in certain circumstances any farmland that is suitable for settlement, and is, or when subdivided and developed will be, capable of substantially increased production.
Part II deals with the control of sales and also leases (for 3 years or more) of farmland to prevent undue aggregation. The consent of the court is required unless the purchaser or lessee owns no farmland, has no interest in any estate or trust owning farmland, has not since the passing of the Act transferred any farmland to any person as trustee or created any trust in respect of farmland, and has entered into the transaction solely on his own behalf.
The Act prevents the purchase of farmland, without the consent of the court, by a trustee for any person under the age of 17 years, or the purchase by a company or trustee for a company to be formed where the shareholders are fewer than 10 in number and any member of such company is under the age of 17 years (or where shares will be held in trust for any person under that age at the date of the transaction).
Land Transfers—The following table shows property transfers registered under the Land Transfer Act during the latest available years.
| Year Ended 31 March | Total Transfers | Total Consideration | ||
|---|---|---|---|---|
| Number | Percentage Change* | Amount | Percentage Change* | |
| * On the previous year's figures. | ||||
| $(m) | ||||
| 1979 | 91,229 | +6.4 | 2,964.6 | +16.8 |
| 1980 | 100,176 | +9.8 | 3,575.9 | +20.6 |
| 1981 | 110,282 | +10.1 | 4,400.2 | +23.0 |
| 1982 | 135,460 | +22.8 | 6,575.6 | +49.4 |
| 1983 | 99,356 | −26.7 | 5,712.1 | −13.1 |
During 1983 there was a significant decrease of almost 27 percent in the total number of land transfers, and a drop of just over 13 percent in the consideration involved. This contrasts sharply with the preceding years during which there were increases in both land transfers and total consideration.
The following table shows all land transfers by consideration group for the year ended 31 March 1983. The division into freehold and leasehold demonstrates the relatively small percentage of land transfers involving leasehold property.
| Consideration Group | Freehold | Leasehold | All Transfers | ||||||
|---|---|---|---|---|---|---|---|---|---|
| Number | Total Consideration | Average Consideration | Number | Total Consideration | Average Consideration | Number | Total Consideration | Average Consideration | |
| $ | $(m) | $(000) | $(m) | $(000) | $(m) | $(000) | |||
| Under 4,000 | 2,742 | 5.1 | 1.9 | 110 | 0.2 | 1.8 | 2,852 | 5.3 | 1.9 |
| 4,000–7,999 | 4,544 | 272 | 6.0 | 158 | 0.9 | 5.7 | 4,702 | 28.1 | 6.0 |
| 8,000–9,999 | 3,316 | 29.2 | 8.8 | 60 | 0.5 | 8.3 | 3,376 | 29.7 | 8.8 |
| 10,000–14,999 | 7,706 | 92.8 | 12.0 | 181 | 2.2 | 12.2 | 7,887 | 94.9 | 12.0 |
| 15,000–19,999 | 5,898 | 100.0 | 17.0 | 157 | 2.6 | 16.6 | 6,055 | 102.6 | 16.9 |
| 20,000–49,999 | 36,389 | 1,266.9 | 34.8 | 786 | 26.7 | 34.0 | 37,175 | 1,293.6 | 34.8 |
| 50,000–199,999 | 32,896 | 2,620.4 | 79.7 | 568 | 47.0 | 82.7 | 33,464 | 2,667.4 | 79.7 |
| 200,000 and over | 3,728 | 1,441.6 | 386.7 | 117 | 48.7 | 416.2 | 3,845 | 1,490.3 | 387.6 |
| All groups | 97 219 | 5,583.2 | 57.4 | 2 137 | 128.9 | 60.3 | 99 356 | 5,712.1 | 57.5 |
Land transfers by size groups during 1982–83 are shown in the following table for both islands and for New Zealand as a whole.
| Size Group (hectares) | North Island | South Island | New Zealand | ||||||
|---|---|---|---|---|---|---|---|---|---|
| Number | Area | Total Consideration | Number | Area | Total Consideration | Number | Area | Total Consideration | |
| hectares | hectares | hectares | |||||||
| (000) | $(m) | (000) | $(m) | (000) | $(m) | ||||
| Under 2 | 65,068 | 8.2 | 3,148.4 | 24,411 | 2.8 | 947.5 | 89,479 | 11.0 | 4,096.0 |
| 2 and under 6 | 1,990 | 7.3 | 183.0 | 734 | 2.7 | 57.2 | 2,724 | 10.0 | 240.2 |
| 6 and under 11 | 843 | 6.7 | 109.5 | 399 | 3.3 | 30.3 | 1,242 | 9.9 | 139.7 |
| 11 and under 20 | 678 | 10.1 | 82.0 | 277 | 4.1 | 29.7 | 955 | 14.2 | 111.7 |
| 20 and under 50 | 1,326 | 43.5 | 227.7 | 474 | 15.4 | 54.0 | 1,800 | 58.9 | 281.7 |
| 50 and under 75 | 583 | 35.6 | 145.0 | 174 | 10.8 | 26.7 | 757 | 46.3 | 171.6 |
| 75 and under 100 | 338 | 28.9 | 82.9 | 179 | 15.4 | 35.7 | 517 | 44.3 | 118.6 |
| 100 and under 200 | 511 | 70.9 | 135.7 | 425 | 58.9 | 95.6 | 936 | 129.8 | 231.4 |
| 200 and over | 529 | 303.2 | 181.0 | 417 | 223.4 | 140.1 | 946 | 526.7 | 321.1 |
| Total | 71 866 | 514.4 | 4,295.2 | 27 490 | 336.8 | 1,416.8 | 99 356 | 851.1 | 5,712.0 |
This table includes both urban and rural land transfers. The majority of the urban transfers are in the “under 2 hectares” size-group, which includes 90 percent of the total number. Besides normal residential properties, this size-group will include many business, commercial, and industrial properties, and high-density residential properties (such as blocks of flats) in urban centres.
The following table shows all land transfers during the 2 latest available years by land registration districts. The urban areas of Auckland are in the North Auckland Land Registration District.
| Land Registration District | 1981–82 | 1982–83 | ||||
|---|---|---|---|---|---|---|
| Number | Area | Total Consideration | Number | Area | Total Consideration | |
| hectares | hectares | |||||
| (000) | $(m) | (000) | $(m) | |||
| North Auckland | 46,898 | 167.1 | 2,396.9 | 29,358 | 88.3 | 1,824.7 |
| South Auckland | 21,882 | 140.3 | 1,172.4 | 15,917 | 117.4 | 992.8 |
| Gisborne | 1,660 | 65.0 | 94.9 | 1,121 | 42.9 | 75.9 |
| Hawke's Bay | 5,313 | 82.4 | 306.4 | 3,524 | 61.7 | 219.8 |
| Taranaki | 4,262 | 61.7 | 203.3 | 3,321 | 51.4 | 192.3 |
| Wellington | 20,554 | 145.9 | 887.0 | 18,625 | 152.4 | 989.7 |
| Marlborough | 1,537 | 32.0 | 71.1 | 1,405 | 24.3 | 66.1 |
| Nelson | 3,164 | 39.2 | 138.5 | 2,547 | 17.0 | 126.0 |
| Westland | 719 | 11.8 | 19.9 | 737 | 13.6 | 23.2 |
| Canterbury | 18,351 | 106.2 | 785.1 | 13,691 | 135.6 | 740.5 |
| Otago | 6,814 | 94.5 | 286.3 | 5,564 | 68.0 | 251.9 |
| Southland | 4,306 | 73.5 | 213.9 | 3,546 | 78.4 | 209.1 |
| Total | 135 460 | 1 019.6 | 6,575.7 | 99 356 | 851.0 | 5,712.0 |
Figures of average consideration, and indeed all land transfer data, should be used with caution owing to the great diversity of property transactions covered by the figures. These transactions include, for example, sales of residential properties, farms and farmland, all classes of commercial, industrial, and business properties, sections, and parcels of land bought for such purposes as large-scale manufacturing, forestry, recreation, reserves, and later subdivision. Movements in prices of individual types of properties are better indicated elsewhere. The Building and Construction section of this Yearbook includes an urban house property and section index, compiled by the Department of Statistics and designed to measure changes in the average level of prices paid for house properties and sections sold during each half year. Recent figures for freehold open market sales of farmland, compiled by the Valuation Department, are shown below. Family sales are excluded, as are leasehold sales and sales for uses other than primary production. The base is half year ended June 1980 (= 1000).
| Half Year Ended | No. of Sales | Total Sale Price | Index Number | Percentage Change From Previous Half Year |
|---|---|---|---|---|
| $(m) | ||||
| Jun 1982 | 2,058 | 443.5 | 1828 | +19.4 |
| Dec 1982 | 1,704 | 369.0 | 2014 | +10.2 |
| Jun 1983 | 1,130 | 227.5 | 1989 | −1.2 |
| Dec 1983 | 1,386 | 268.2 | 2005 | +0.8 |
FURTHER INFORMATION—The Monthly Abstract of Statistics shows monthly data on land transfers and also publishes an annual supplement. Other information on land registration and titles will be found in the Parliamentary reports of the Department of Maori Affairs (E. 13), the Department of Justice (E. 5), and the Valuation Department (G. 26).
Equitable land values are a basis for many of the relations of the Central Government and local authorities with the individual. In particular they are required in connection with the following: (a) the levying of land tax; (b) the apportionment of rating levies over contributory local authorities; (c) the levying of rates by local authorities; (d) the advancing of money on mortgage by Government departments and by trustees under the Trustee Act; (e) the assessing of stamp, estate, and gift duties; (f) the fixing of prices payable to the Crown or by the Crown for transfers of land.
SYSTEM AND PROCEDURE—The Government Valuation of Land Act 1896 set up a separate Government department charged with the duty of assessing the values of real estate for taxation and other purposes of the Central Government and for local rating purposes. The present law relating to the valuation of land is contained in the Valuation of Land Act 1951, and in the Land Valuation Proceedings Act 1948.
The work of the Valuation Department is directed by the Valuer-General, the actual work of valuing being done by district valuers and valuers. The duty of a valuer is to examine each property and to estimate (a) the value of the land; (b) the value of the buildings (if any) and other improvements (if any) upon such land; and (c) the capital value of the property.
Valuers are enjoined not to strain after high values, not to accept special prices paid for land in exceptional circumstances, but to determine the value neither above nor below the fair selling value in view of the many and diverse purposes for which the values are used.
Generally, under the New Zealand law, the increased value attaching to any piece of land which is due to the successful working of other lands in the district, or to State or local authority expenditure on public works, or to the general prosperity and development of the country, is incorporated in the “land value”. “Improvements” on land are defined, with certain provisos, as any work done or materials used on or for the benefit of the land by any owner or occupier resulting in an increase in the value of the land. With the introduction of land value in 1970 (in place of unimproved value) the term “improvements”, correctly speaking, includes only those items of work done or material used which result in structural additions to the property.
The “capital value” is, broadly speaking, the unencumbered market value of the land at date of valuation, and the “value of improvements” is the added value given by the “improvements”.
THE VALUATION ROLL—A valuation roll is prepared for each district over which a territorial local authority has rating jurisdiction, setting forth the ownership, description, and valuation of each property, including rates postponement and special rateable values where these are required to be determined.
Revision of Rolls—District valuation rolls are revised by the Valuer-General at intervals of not more than 5 years unless for good reason he decides otherwise.
The Supplementary Roll—There is, in addition to the district valuation roll for each district, a supplementary roll for that district. Generally, all special valuations of land made during the currency of a district roll for particular purposes—e.g., the granting of loans by Government departments or trustees on the security of lands, the assessment of stamp, gift, and estate duties—form the supplementary roll.
Objections to Valuations—In the case of a revision of a district valuation roll, the Valuer General, any local authority, or any owner whose name appears on the roll, may object to any valuation thereon. Where a particular property only is revalued, the owner and any local authority affected by the alteration in the valuation have a right of objection. If, after the Valuer-General has reconsidered the matter, the objector is still dissatisfied he may ask for the objection to be heard by the Administrative Division of the High Court.
ADMINISTRATIVE DIVISION OF THE HIGH COURT—The Land Valuation Proceedings Act 1948 as amended in 1968 and 1977 provides for objections under the Valuation of Land Act to be determined by the Administrative Division of the High Court. In addition to its jurisdiction under the Land Valuations Proceedings Act 1948, the division hears claims for compensation under the Public Works Act 1928 and determines values under the Land Settlement Promotion and Land Acquisition Act 1952. Land valuation tribunals for particular localities operating under the general jurisdiction of district courts exercise prime jurisdiction in all matters except those where provision is made for them to be heard in the first instance by the Administrative Division. There is a right of appeal from a tribunal's decision to the Court with a further right of appeal to the Court of Appeal in certain cases. If any owner who has objected to a valuation made at a revision of a district roll is not satisfied with the value of the land as fixed by the Court's order, he may, within 14 days of the sealing of the order, give notice to the Valuer-General that he requires the capital value to be reduced to the value which he (the owner) considers to be the fair selling value as specified in his notice (but not less than the aggregate amount owing on mortgages or other charges on the land), or the land to be acquired on behalf of Her Majesty, or sold, at that value. There is also provision that if the Valuer-General is of the opinion that the value has been fixed by the Court at less than the capital value, he may, within 14 days after the sealing of the Court's order require the owner to consent to what he (the Valuer-General) considers is the fair capital value, and, failing such consent being given within 30 days after notice is delivered, he may, with the approval of the Governor-General in Council, acquire the property at that value on behalf of Her Majesty.
VALUATIONS IN RELATION TO RATING—The district valuation roll, so long as it continues in force, is by law the roll from which the valuation roll of every local authority rating on the capital or on the land value is framed.
The third major rating system is the annual (rental) value system, where the annual values are assessed by valuers appointed by the local authorities concerned. The Valuer-General may be so appointed. The annual value is defined as the rent at which a property would let from year to year reduced by 20 percent in the case of houses, buildings, and other perishable property, and by 10 percent in the case of land, but it may not be less than 5 percent of the value of the fee simple. A new valuation roll in this regard is prepared either annually or triennially.
Parts IV and V of the Rating Act 1967 provide for local authorities to grant applications for rates postponement in respect of certain residences in commercial and industrial zones and for farmlands in counties with valuations reflecting potential use for urban development. Rates postponement values are determined either under the Valuation of Land Act or the Rating Act, according to the system of rating in force. Special rateable values for non-conforming commercial or industrial land in residential or rural zones are also provided for in order that these classes of properties will not enjoy a rating advantage. Likewise special rateable values may be determined for rural or residential land in commercial or industrial areas, for single or double unit dwellinghouses in areas where values are influenced by demand for multi-unit housing, and for “existing use” properties, i.e., properties used for any purpose for which the owner or occupier is entitled to use the land pursuant to section 90 of the Town and Country Planning Act 1977.
Part VI of the Rating Act provides for rating relief for farmlands subject to rates levied by borough (or city) councils, independent town councils, and county councils in respect of county towns. The Act provides that these local authorities may assess valuations for rating purposes for such farmlands lower than the normal rateable values.
Equalisation of Values—The Rating Act, Part IX, provides for an equitable adjustment of rates and of levies based on rateable values as between the several constituent districts comprising the district of an ad hoc local authority where those constituent districts have been revalued by the Valuer-General at different times. Provision is also made for equalisation to be done where the several ridings of a county have been revalued at different dates.
CAPITAL VALUE AND VALUE OF LAND—The figures in the following table show valuations over a period of years for the whole of New Zealand; they are gross values and include the value not only of rateable properties but also of churches, schools, unoccupied Crown lands, and other lands exempt from local rating. Valuation figures back to 1878 were given in the 1976 and earlier Yearbooks.
| As at 31 March | Capital Value (Land and Improvements) | Value of Land* |
|---|---|---|
* Included in previous column. †Includes the districts revalued after 1 March 1971 on the “land value” basis provided for by the Valuation of Land Amendment Act (No. 2) 1970, which came into effect on that date. Earlier figures are on the basis of unimproved values only. | ||
| $(million) | ||
| 1966 | 9,085.0 | 2,865.5 |
| 1967 | 9,836.1 | 3,184.2 |
| 1968 | 10,631.6 | 3,487.0 |
| 1969 | 11,349.7 | 3,705.2 |
| 1970 | 12,515.6 | 4,170.7 |
| 1971† | 13,305.7 | 4,489.0 |
| 1972† | 14,331.3 | 5,046.3 |
| 1973† | 15,657.2 | 5,704.1 |
| 1974† | 17,871.7 | 6,778.3 |
| 1975† | 24,383.5 | 10,433.6 |
| 1976† | 30,011.5 | 13,386.7 |
| 1977† | 35,575.2 | 15,981.5 |
| 1978† | 41,228.7 | 18,696.5 |
| 1979† | 45,650.7 | 20,651.8 |
| 1980† | 50,040.5 | 22,367.2 |
| 1981† | 54,227.2 | 23,942.6 |
| 1982† | 63,220.8 | 27,899.1 |
| 1983† | 73,457.1 | 31,811.6 |
In the following table the gross values and net values for the latest years are analysed in more detail. Net values include all rateable property and all properties on which local authorities recover grants in lieu of rates. In interpreting these figures it is essential to realise that substantial boundary changes take place from time to time.
| As at 31 March | Gross Values | Net Values | ||
|---|---|---|---|---|
| Capital Value (Land and Improvements) | Value of Land* | Capital Value (Land and Improvements) | Value of Land* | |
| * Included in previous column. | ||||
| $(million) | ||||
| Counties | ||||
| 1981 | 21,274.8 | 11,529.4 | 19,896.4 | 11,167.9 |
| 1982 | 26,806.1 | 14,893.5 | 25,315.9 | 14,483.1 |
| 1983 | 32,336.4 | 18,097.1 | 30,446.6 | 17,602.1 |
| Cities and Boroughs | ||||
| 1981 | 32,924.6 | 12,406.2 | 30,266.4 | 11,607.9 |
| 1982 | 36,383.5 | 12,998.2 | 33,395.3 | 12,204.7 |
| 1983 | 41,083.6 | 13,705.5 | 37,787.3 | 12,907.0 |
| Town Districts | ||||
| 1981 | 27.8 | 7.0 | 25.5 | 6.5 |
| 1982 | 31.2 | 7.4 | 27.7 | 6.9 |
| 1983 | 37.1 | 9.0 | 33.2 | 8.4 |
| Grand Totals | ||||
| 1981 | 54,227.2 | 23,942.6 | 50,188.4 | 22,782.3 |
| 1982 | 63,220.8 | 27,899.1 | 58,738.9 | 26,694.7 |
| 1983 | 73,457.1 | 31,811.6 | 68,267.2 | 30,517.5 |
The fact that land valuations are not continuously up-to-date has the effect in the preceding tables of delaying the appearance of other than the steepest movements and of reducing their apparent magnitudes.
With the present resources at the Valuation Department's disposal, an up-to-date revaluation of all properties in New Zealand would be an impossible task but by using the principle of valuation equalisation mentioned earlier, it is possible to compile up-to-date gross values by local body districts for the whole country. The gross capital value figures shown below have been compiled on the level of values as at 31 March for the latest 3 years.
| Territorial Areas | Gross Equalised Capital Value | ||
|---|---|---|---|
| 1981 | 1982 | 1983 | |
| $(million) | |||
| Counties and islands | 31,010.1 | 43,250.5 | 47,846.5 |
| Cities and boroughs | 39,094.1 | 50,695.9 | 59,768.7 |
| Town districts | 32.7 | 38.5 | 45.2 |
| Total | 70,136.9 | 93,984.9 | 107,660.4 |
A comparison of these figures with the gross values given previously, illustrates the point that valuation statistics tend to have the effect of delaying the appearance of current movements in the property market.
VALUERS REGISTRATION BOARD—The Valuers Act 1948 provides for the registration of land valuers and for some control of their work. There is a Registration Board under the chairmanship of the Valuer-General, which issues certificates for registration to all valuers and annual practising certificates to public valuers. The main objects of the Act are to secure a high standard of valuation work throughout the country and to encourage competent valuers. Of the 1579 valuers registered as at 31 March 1983, 559 have taken out annual practising certificates for the current year. The majority of the remaining 1020 registered valuers are either employed in Government departments or do not make valuations for members of the public and thus are not required to hold annual practising certificates.
FURTHER INFORMATION—Particulars of values for each county, borough, and town district in considerable detail are contained in the research publication, The Real Estate Market in New Zealand published by the Valuation Department and in the annual report, Local Authority Statistics, published by the Department of Statistics. The parliamentary report of the Valuation Department (Parl. paper G. 26) may also be consulted.
The need for long-term planning in order to achieve a faster, more balanced, economic growth rate coupled with consideration for environmental, social, and other non-material factors first came to the fore in the early 1950s. Following a number of “key sector” conferences on growth and development during the 1950s and 1960s, the Government called a National Development Conference, with plenary sessions in August 1968 and May 1969, to examine the question of economic planning on a national basis. The planning structure which succeeded the National Development Conference consisted of a National Development Council and eventually 16 sector councils, including 7 bodies already in existence before the conference.
Considerable changes were made during succeeding years (for example, the National Development Council was abolished and its functions taken over by the Cabinet Committee on Policy and Priorities, and the Targets Advisory Group was renamed the Planning Advisory Group), but by the mid-1970s there was a general feeling that momentum had been lost and a major overhaul or replacement of the central planning organisation was necessary.
During 1976 the Government established a task force on social and economic planning. The objectives were to review past planning activities in New Zealand, to advise on major trends and issues, and to recommend a planning mechanism that would assist in the development of New Zealand's economy and society. As a result of its recommendations a New Zealand Planning Council was set up in March 1977 as a first step towards the development of a national planning system as envisaged by the task force.
THE NEW ZEALAND PLANNING COUNCIL—In selecting the council members the Government was influenced by a task force recommendation that membership should reflect wide experience in many fields rather than represent particular sectional interests. Other notable departures from the NDC experience include a full-time chairman and secretariat, and the presence on the council of a senior Minister of the Crown with portfolio responsibilities directly relevant to the council's work (the Minister of National Development). The first chairman, Sir Frank Holmes, was succeeded at the end of his term in September 1982, by Mr Ian G. Douglas.
Although the council had been in operation since April 1977, a Statute (the New Zealand Planning Act 1977) was enacted in December 1977 to formally establish the council.
The New Zealand Planning Act 1982 redefined the council's functions and powers, and its main role now is to monitor and report on trends, prospects, issues, and options in relation to the social, economic, and cultural development of New Zealand.
In carrying out this function the council may:
Assist and advise the Government in the process of consultative planning.
Foster discussion among Government and private planning agencies.
Prepare reports and submit them to the Minister, as it sees fit.
Encourage public understanding and discussion by publishing documents and reports on planning topics.
Before the New Zealand Planning Council was established, the Government was assisted in its long-term economic planning and the development of natural resources by the Planning Advisory Group and a number of councils with a wide coverage of economic, social, and cultural affairs.
Most of these were originally sector councils under the National Development Council. Although the Planning Council maintains close links with those that still exist, they are not part of its formal structure; and it has also developed a wide network of consultation with many other individuals and agencies involved in planning.
In February 1978 the Monetary and Economic Council was disbanded and its role in monitoring economic trends and policies was assigned to the Planning Council. An Economic Monitoring Group (E.M.G.), which works independently of the council, was set up in April 1978. It produced a number of reports in a series entitled Economic Trends and Policies. In 1983, the E.M.G. was reconstituted and its independence of publication reaffirmed by the Planning Council. Its first report, Foreign ExchangeConstraints, Export Growth and Overseas Debt was published in December 1983 in the New Zealand Planning Council Monitoring Report Series. Reports of other monitoring groups will also be published in this series.
The Commission for the Future was formally disbanded in October 1982 and its work on social and economic planning was assigned to the Planning Council.
Planning Council Publications—During 1983 the New Zealand Planning Council published the following documents.
| NZPC Monitoring Report Series— | |
| Foreign Exchange Constraints, Export Growth and Overseas Debt; | |
| Economic Monitoring Group Report No. 1 | December, 1983 |
| Planning Papers— | |
| No. 17. Issues in Equity | March 1983 |
| No. 18. Towards 1990: A Framework for Discussion | December 1983 |
Fuller information on the work of the Planning Council is given in Parliamentary paper D. 9 Report of the New Zealand Planning Council.
THE SOCIAL ADVISORY COUNCIL—In July 1982 it was announced that the Social Development Council and the New Zealand Council of Social Service were to be replaced by a single social advisory body.
The new body, the Social Advisory Council, was established to strengthen advice to the Government on social policies and social services. It met for the first time in December 1982, and has 4 members representing Government departments, and 8 private members chosen from the community.
The function of the council is to advise the Minister of Social Welfare and the Chairman of the Cabinet Committee on Family and Social Affairs on social policy issues, including the effects of urbanisation on family and community welfare.
Other duties include:
Undertaking specific tasks at the request of the Minister, concerning advice on welfare problems and social policy issues;
Providing a link between Government departments and other advisory and statutory planning bodies, including the New Zealand Planning Council;
Identifying priorities in social policy issues for monitoring, evaluation or research;
Promoting co-ordination of social services and liaison with district councils of social services;
Making public statements which are considered in the public interest.
OTHER PHASES OF NATIONAL PLANNING—Other phases of national planning are dealt with in other sections of this Yearbook. Land development and use, and the sometimes conflicting claims of economic growth and the preservation of the natural environment, are discussed and described in Section 12A—Physical Environment and Economic Growth. Energy planning comes into Section 21—Energy; industrial planning into Section 19—Manufacturing; and the scientific, agricultural, and industrial research that provides the essential background information for meaningful planning is briefly described in Section 7B—Science and Scientific Services. The question of finance for development comes into the Finance sections, especially sections 30 and 31.
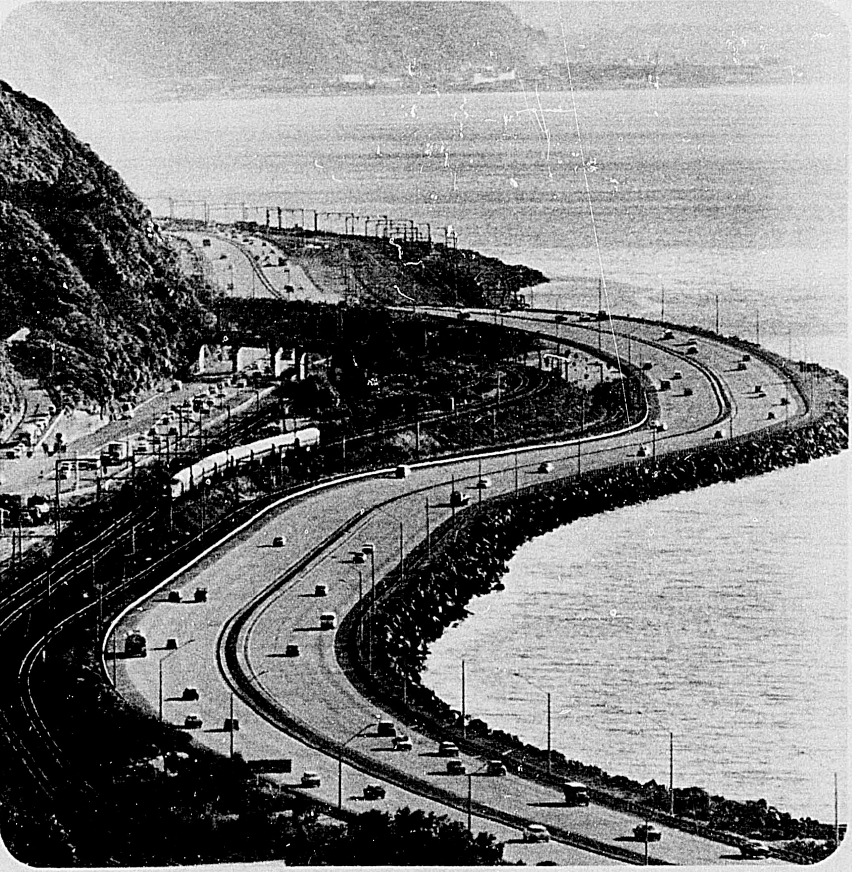
Table of Contents
New Zealand is heavily dependent on transport and communication links. As a nation dependent on overseas trade, and geographically remote from many of its trading partners, it relies more heavily on sea transport than do many other countries.
The establishment of rail-road links to coastal ports and a regular service of refrigerated cargo ships enabled New Zealand to evolve from a subsistence economy to one of the world's major exporters of meat and dairy produce. However, the country is still largely dependent on overseas shipping companies to carry exports to overseas markets and bring in imports.
The Census of Transport, Storage, and Communication surveys industries involved predominantly in land, sea, and air passenger, and freight transport services; the operation of storage and warehousing facilities; communications services operated by the Post Office and other private organisations, such as telephone answering services.
The first census was taken for the year 1979–80 and is one of the Department of Statistics 5-yearly series of integrated economic censuses.
Industries are classified under the New Zealand Standard Industrial Classification:
Railway transport
Road transport and supporting services
Water transport and supporting services
Air transport and supporting services
Storage and warehousing
Communications
The statistical tables which follow give summaries of these activities. The definitions used in the tables are the same as listed in the Census of Manufacturing statistics (see Section 19), with the following exceptions.
Establishments—The actual depots have been classified as establishments for the larger enterprises; whilst home-addresses form establishments for many of the one-man operations in the general carrier and taxi industries.
Persons Engaged—Numbers of people employed, including working proprietors, in the establishments and ancillary units on 28 February 1980.
The following table gives a general summary of the results of the 1979–80 Census of Transport, Storage, and Communication.
| Item | 1 979–80 Census | |||
|---|---|---|---|---|
| Unit | Transport and Storage | Communications | Total | |
| Establishments and ancillary units | No. | 8,402 | 116 | 8,518 |
| Persons engaged at 28 February 1980, including working. proprietors | No. | 70,456 | 35,770 | 106,226 |
| Salaries and wages paid | $(000) | 709,009 | 360,795 | 1,069,804 |
| Depreciation | $(000) | 142,779 | 29,915 | 172,695 |
| Purchases and other expenses | $(000) | 1,514,570 | 115,783 | 1,630,354 |
| Turnover | $(000) | 2,582,182 | 634,052 | 3,216,234 |
| Value added | $(000) | 1,058,765 | 548,013 | 1,606,778 |
| Capital expenditure less disposals | $(000) | 180,723 | 28,698 | 209,421 |
In the following 2 tables, statistics are given at industry (subgroup) level.
| Industry | Operating Units | Persons Engaged at End of February | Salaries and Wages Paid During Year | |
|---|---|---|---|---|
| Establishments | Ancillary Units | |||
| * Suppressed to avoid disclosure of confidential information. | ||||
| Number | $(000) | |||
| Railway transport | 35 | – | 8,249 | * |
| Urban passenger bus services | 93 | 6 | 4,002 | 34,196 |
| Route passenger bus services | 55 | 1 | 1,407 | 15,833 |
| Total, scheduled road passenger transport | 148 | 7 | 5,409 | 50,028 |
| Taxi services | 2,295 | – | 3,365 | 4,008 |
| School bus contractors | 204 | – | 941 | 2,842 |
| Bus tour operators | 69 | – | 763 | 6,953 |
| Other road passenger transport | 13 | – | 30 | * |
| Total, other road passenger transport | 2,581 | – | 5,099 | * |
| Logging haulage | 93 | 1 | 342 | 2,717 |
| Stock haulage | 137 | 3 | 1,285 | 11,800 |
| Refrigerated haulage | 56 | – | 391 | 3,896 |
| Heavy haulage | 97 | 4 | 1,262 | 10,410 |
| Bulk haulage | 591 | 5 | 2,555 | 17,975 |
| Furniture removal | 72 | – | 408 | 3,001 |
| Route haulage | 49 | 3 | 503 | 3,821 |
| General carrier | 2,394 | 26 | 11,166 | 74,971 |
| Other freight transport by road | 491 | – | 945 | 1,723 |
| Total, freight transport by road | 3,980 | 42 | 18,857 | 130,315 |
| Car and truck rental services | 179 | 2 | 796 | 5,895 |
| Vehicle parking facilities | 68 | – | 171 | 1,543 |
| Other supporting services to land transport | 43 | 1 | 508 | 5,628 |
| Total, supporting services to land transport | 290 | 3 | 1,475 | 13,066 |
| Total, land transport | 7 034 | 52 | 39 089 | 295,558 |
| Ocean and coastal water transport | 20 | 8 | 3,027 | 45,831 |
| Inland water transport | 42 | – | 232 | 1,764 |
| Harbour board operations | 46 | 3 | 3,854 | 56,455 |
| Stevedoring | 72 | 10 | 6,667 | 95,004 |
| Other supporting services to water transport | 12 | – | 219 | 3,107 |
| Total, supporting services to water transport | 130 | 13 | 10,740 | 154,566 |
| Total, water transport | 192 | 21 | 13 999 | 202,162 |
| Air transport carriers | 131 | 2 | 7,207 | 107,516 |
| Aero clubs | 54 | 1 | 182 | 1,324 |
| Airport operations | 42 | – | 1,655 | 26,796 |
| Other supporting services to air transport | 17 | – | 20 | 65 |
| Total, supporting services to air transport | 113 | 1 | 1,857 | 28,184 |
| Total, air transport | 244 | 3 | 9 064 | 135,700 |
| Travel agencies | 402 | 9 | 2,307 | 17,169 |
| Freight agents | 288 | 33 | 3,850 | 36,308 |
| Other services incidental to transport | 48 | – | 260 | 1,587 |
| Total, services incidental to transport | 738 | 42 | 6,417 | 55,063 |
| Storage and warehousing | 58 | – | 495 | 4,320 |
| Total, services allied to transport | 796 | 42 | 6 912 | 59,383 |
| Total, transport and storage | 8 266 | 118 | 69 064 | 692,803 |
| Post Office | 40 | – | 35,094 | * |
| Other communication activities | 76 | – | 676 | * |
| Total, communication | 116 | – | 35 770 | 360,795 |
| Total, establishments and single industry ancillary units | 8 382 | 118 | 104 834 | 1,053,598 |
| Ancillary units servicing transport | – | 18 | 1,392 | 16,205 |
| Grand total | 8 382 | 136 | 106 226 | 1,069,804 |
| Industry | Depreciation | Purchases and Other Expenses | Turnover | Value Added | Capital Expenditure Less Disposals |
|---|---|---|---|---|---|
| * Suppressed to avoid disclosure of confidential information. | |||||
| $(000) | |||||
| Railway transport | 18,648 | 208,944 | 377,658 | 102,403 | * |
| Urban passenger bus services | 2,638 | 25,444 | 51,503 | 26,561 | 15,418 |
| Route passenger bus services | 2,117 | 14,211 | 35,358 | 20,555 | 2,320 |
| Total, scheduled road passenger transport | 4,755 | 39,655 | 86,861 | 47,116 | 17,738 |
| Taxi services | 2,053 | 21,323 | 43,213 | 22,322 | 2,016 |
| School bus contractors | 1,339 | 5,915 | 13,479 | 7,988 | 2,109 |
| Bus tour operators | 1,365 | 32,435 | 44,635 | 12,863 | 2,079 |
| Other road passenger transport | 64 | 170 | 470 | 311 | * |
| Total, other road passenger transport | 4,821 | 59,843 | 101,797 | 43,485 | * |
| Logging haulage | 1,797 | 10,075 | 17,582 | 9,071 | 2,957 |
| Stock haulage | 4,466 | 24,343 | 46,687 | 25,662 | 6,733 |
| Refrigerated haulage | 1,204 | 9,331 | 17,029 | 8,707 | 1,579 |
| Heavy haulage | 4,809 | 17,230 | 35,076 | 19,667 | 4,019 |
| Bulk haulage | 7,143 | 52,226 | 93,826 | 46,881 | 9,192 |
| Furniture removal | 547 | 7,986 | 13,132 | 5,464 | 890 |
| Route haulage | 840 | 5,507 | 11,801 | 7,055 | 1,766 |
| General carrier | 25,636 | 152,070 | 303,417 | 167,756 | 34,568 |
| Other freight transport by road | 874 | 7,963 | 16,501 | 8,743 | 1,202 |
| Total, freight transport by road | 47,315 | 286,731 | 555,051 | 299,006 | 62,907 |
| Car and truck rental services | 5,587 | 18,889 | 37,535 | 19,586 | 11,718 |
| Vehicle parking facilities | 46 | 3,288 | 7,313 | 4,370 | 2,959 |
| Other supporting services to land transport | 90 | 3,445 | 9,084 | 5,842 | 866 |
| Total, supporting services to land transport | 5,724 | 25,623 | 53,932 | 29,798 | 15,544 |
| Total, land transport | 81,262 | 620,796 | 1,175,299 | 521,808 | 102,520 |
| Ocean and coastal water transport | 18,130 | 200,068 | 269,465 | 67,000 | −21,933 |
| Inland water transport | 478 | 4,834 | 8,268 | 3,543 | 344 |
| Harbour board operations | 12,359 | 48,366 | 146,488 | 99,910 | 31,124 |
| Stevedoring | 1,695 | 51,604 | 142,687 | 98,730 | 4,252 |
| Other supporting services to water transport | 298 | 1,207 | 4,535 | 3,335 | 3,223 |
| Total, supporting services to water transport | 14,353 | 101,178 | 293,710 | 201,975 | 38,600 |
| Total, water transport | 32,961 | 306,080 | 571,443 | 272,517 | 17,011 |
| Air transport carriers | 18,974 | 383,694 | 493,348 | 121,007 | −18,053 |
| Aero clubs | 518 | 3,907 | 5,671 | 1,856 | 455 |
| Airport operations | 2,437 | 13,874 | 38,529 | 25,438 | 13,034 |
| Other supporting services to air transport | 119 | 623 | 923 | 312 | −39 |
| Total, supporting services to air transport | 3,074 | 18,404 | 45.123 | 27,606 | 13,449 |
| Total, air transport | 22,048 | 402,098 | 538,470 | 148,613 | -4,604 |
| Travel agencies | 790 | 30,881 | 56,106 | 25,658 | 1,477 |
| Freight agents | 2,387 | 126,248 | 181,950 | 57,902 | 4,904 |
| Other services incidental to transport | 615 | 2,710 | 6,752 | 4,091 | 624 |
| Total, services incidental to transport | 3,792 | 159,839 | 244,809 | 87,651 | 7,005 |
| Storage and warehousing | 1,798 | 7,365 | 18,490 | 11,432 | 2,927 |
| Total, services allied to transport | 5,590 | 167,204 | 263,299 | 99,083 | 9,932 |
| Total, transport and storage | 141,861 | 1,496,178 | 2,548,511 | 1,042,022 | 124,860 |
| Post Office | 29,724 | 102,633 | 613,503 | 540,404 | 28,253 |
| Other communication activities | 191 | 13,150 | 20,549 | 7,609 | 444 |
| Total, communication | 29,915 | 115,783 | 634,052 | 548,013 | 28,698 |
| Total establishments and single industry ancillary units | 171,776 | 1,611,961 | 3,182,564 | 1,590,035 | 153,557 |
| Ancillary units servicing transport | 918 | 18,392 | 33,671 | 16,743 | 55,860 |
| Grand total | 172,695 | 1,630,354 | 3,216,234 | 1,606,778 | 209,421 |
A regional summary of the census as a whole is shown in the statistical area table which follows.
| Statistical Area | Operating Units | Persons Engaged at End of February | Salaries and Wages Paid During Year | Capital Expenditure Less Disposals | |
|---|---|---|---|---|---|
| Establishments | Ancillary Units | ||||
| No. | No. | No. | $(000) | $(000) | |
| Northland | 288 | 3 | 2,800 | 24,980 | 4,857 |
| Central Auckland | 2,699 | 44 | 31,112 | 321,241 | 22,719 |
| South Auckland - Bay of Plenty | 1,241 | 15 | 11,672 | 108,978 | 32,121 |
| East Coast | 122 | – | 1,012 | 8,296 | 2,010 |
| Hawke's Bay | 352 | 5 | 3,728 | 36,149 | 11,143 |
| Taranaki | 185 | 2 | 2,467 | 22,236 | 5,118 |
| Wellington | 1,368 | 39 | 26,173 | 274,554 | 70,531 |
| Total. North Island | 6 255 | 108 | 78 964 | 796,436 | 148,498 |
| Marlborough | 85 | 1 | 1,320 | 13,867 | 2,317 |
| Nelson | 166 | 4 | 2,294 | 23,769 | 6,513 |
| Westland | 71 | – | 816 | 7,554 | 1,795 |
| Canterbury | 998 | 14 | 13,806 | 140,241 | 25,798 |
| Otago | 502 | 6 | 5,775 | 55,718 | 14,920 |
| Southland | 305 | 3 | 3,251 | 32,220 | 9,579 |
| Total, South Island | 2 127 | 28 | 27 262 | 273,368 | 60,923 |
| Total, New Zealand | 8 382 | 136 | 106 226 | 1,069,804 | 209,421 |
FURTHER INFORMATION—Publications dealing with shipping, railways, roads and road transport, and civil aviation are listed at the ends of the appropriate sections. Two publications discussing transport policy in general are listed below, together with the report on the Census of Transport, Storage, and Communication.
A New Direction for New Zealand Transport (Parl. paper F. 13, 1974).
Interim Report on Transport (Parl. paper F. 14, 1975).
Transport, Storage, and Communication 1980 (Department of Statistics, 1982).
The annual report of the Ministry of Transport (Parl. paper F. 5) should also be consulted.
The development of the container ship, the unitised cargo ship, the roll-on roll-off ship, and barge-carrying systems such as the “lash” (lighter aboard ship) system have brought about a world-wide revolution in the handling of maritime cargos, and a new concept of the co-ordination of transport through the substitution of capital-intensive for labour-intensive operations. There is no sign that this revolution is coming to an end. The continuing increase in capital and operating costs, particularly the cost of fuel, has intensified the search for improved efficiency in vessels and cargo handling methods.
Recent innovations include the hybrid vessel, combining for example lift-on and roll-on capability for greater flexibility and speed of turn around, and improved hull and propellor design, as well as more fuel-efficient propulsion units.
New Zealand, as a country that lives by overseas trade, has had to adapt to such technological changes which extend throughout the entire transport chain from factory to port.
PORT DEVELOPMENT—The New Zealand Ports Authority was established by statute in 1968. Its major function is to co-ordinate nationally harbour development arising from proposals submitted by harbour boards or other bodies. Besides this primary function, the authority also promotes an efficient and integrated ports network. When the cost of port development exceeds specific capital expenditure limits, the approval of the authority is required. Consents granted during the year ended 31 March 1983 amounted to $26.9 million.
Development of specialised container-handling facilities at the 4 container terminals of Auckland, Wellington, Lyttelton, and Port Chalmers is virtually complete. However an increasing trend for cargo to be handled by conventional shipping has justified provision of additional facilities at other ports. Competition within the cement industry has resulted in duplication of cement-handling facilities at several ports, while at Port Taranaki, major developments have been authorised to enable the handling of hydrocarbon products arising from oil and gas finds in the region.
CARGO TRAFFIC—The number of containers handled at cellular container terminals during the calendar year 1983 was 237 700, comprising 115 683 inward and 122 017 outward. This figure was slightly below the total handled in 1982 (242 145). By ports, Auckland handled 104 887 (100 309 in 1982), Wellington 63 274 (73 533), Lyttelton 23 251 (21 420) and Port Chalmers 46 288 (51 225).
The number of containers handled at cellular container terminals during 1983 for Pacific Island and trans-Tasman trade totalled 9994 (1658 the previous year).
SHIPPING SERVICES—New Zealand's heavy dependence on overseas trade and isolation from principal population centres and principal markets combine, to make us more reliant on shipping than most other developed countries. Over 90 percent of New Zealand exports by value are carried by sea. A similar proportion of imports travel the same way.
OVERSEAS LINER SERVICES—United Kingdom/Europe: The New Zealand European Shipping Association and the New Zealand and United Kingdom Shipowners' Committee continued to play a pre-eminent role in the carriage of New Zealand exports to Europe. The New Zealand European Shipping Association serves Mediterranean and north continental ports, and comprises 4 British and 8 continental lines, the Australian National Line, and the Shipping Corporation of New Zealand; whilst the New Zealand and United Kingdom Shipowners' Committee serves the United Kingdom and comprises 3 British lines, the Australian National Line, and the Shipping Corporation. Competition from independent lines operating outside conference arrangements remained strong, and as in 1982, the independent ABC Container Line of Belgium and the Zim Israel Navigation Company successfully tendered to supply a portion of the Wool Board's annual shipping requirements. At the same time, the Meat and Dairy Boards' past preference for exclusive roll-over contracts with the conference lines has also been under review.
East Asia/South-East Asia—New Zealand's outward liner trade to East Asia/South-East Asia is served by one conference, a joint service, and a number of independent operators. SCNZ is a member of the Australian and New Zealand/Eastern Shipping Conference, the New Zealand arm of which provides a direct container service between New Zealand and Japan.
Americas—United Kingdom, West German, Belgian and New Zealand carriers continued to supply most of the tonnage employed in liner services to these areas. In the U.S.A. the ability of shipowners to provide rationalised services (thereby minimising vacant shipping space) is severely restricted by antitrust laws and legislation regulating liner shipping. Integrated services to other areas are also affected because the U.S.A. is New Zealand's biggest market in the Americas.
Trans-Tasman—A joint service agreement between the Shipping Corporation of New Zealand and the Australian National Line led in mid-1983 to the introduction of a single Australian-manned vessel which was operated in competition with the established Union Company roll-on roll-off services. Plans for the introduction of a second joint service vessel were announced and the Shipping Corporation purchased a new container ship for this purpose. While 1 of the Union Company's largest trans-Tasman vessels remained in lay-up, the company replaced 2 of its operational ships and rationalised its sailing schedule. Tasman Pulp and Paper's specialised product carriers continued their services, at reduced frequencies, and some general cargo was carried by BHP's steel product carriers.
The Shipping Corporation, Australian National Line, and Pacific Forum Line vessels continued to carry some trans-Tasman cargo in the course of their participation in other trades.
Middle East—Direct container services to Middle East ports were provided by 2 United Kingdom flag carriers operating a joint service, and by a Japanese shipowner. Container services were also offered by some of the lines involved in the New Zealand—United Kingdom/Europe conference trade while a number of other operators supplied container trans-shipment services. As in previous years, chartered conventional tonnage continued to play an important part in this trade.
SOUTH PACIFIC—Pacific Forum Line (PFL): A regional shipping venture established in June 1977 under the auspices of the South Pacific Forum (the PFL) continued to operate 3 modern container vessels (1 of which is contributed by New Zealand) in a liner service linking ports in New Zealand, Fiji, Tonga, Western Samoa, American Samoa, Vanuatu, the Solomon Islands, Papua New Guinea, and Australia. A feeder service to Tuvalu and Kiribati was established in 1982.
Other Services—The Governments of the Cook Islands, Niue and New Zealand maintained a shipping service between their countries using two small conventional vessels. The joint service also traded to Tahiti.
Other liner services from New Zealand to the South Pacific were provided by New Zealand, French, Norwegian and Tongan flag vessels.
Overseas Bulk Services—In tonnage terms most of New Zealand's external trade is carried in bulk vessels. While a certain amount of bulk tonnage is dedicated to the trade—such as the two trans-Tasman forest product carriers owned by Tasman Pulp and Paper and the bulk ore vessel used to carry alumina from Queensland to the Tiwai Point aluminium smelter—New Zealand's bulk shipping needs are served in the main by a fluid mix of vessels.
Cargos carried by these vessels (frequently registered in open registry countries like Liberia and Panama) include crude oil, phosphate rock and petroleum coke inwards, and ironsands, coal and forest products outwards.
Coastal Liner Services—A regular and frequent ferry service across Cook Strait between Wellington and Picton, at the head of the Marlborough Sounds, was provided by rail ferries operated by the Railways Corporation. Three of the ferries, the Arahura, Aranui and Aratika carry both passengers and freight; a fourth vessel, the Arahanga is confined to the carriage of freight and provides passenger accommodation only for truck drivers and others whose vehicles are carried. In March 1983 the Aramoana, the oldest of the ferries, was withdrawn from service because of a decline in inter-island traffic and early in 1984 was put up for sale. The corporation has also indicated that the Aranui, the oldest of the ferries now in service, could also be withdrawn due to the additional capacity provided by the new vessel the Arahura, which entered service in December 1983.
During the year ended March 1983 the rail ferries gross revenue amounted to $67.7 million and expenditure totalled $60.8 million, resulting in a profit of $6.9 million. The total number of round trips made by the ships declined from 2250 in the previous year to 2153.
The capacity of the Shipping Corporation vessel Coastal Trader was substantially increased after modifications early in the year, and continued to provide a regular roll-on roll-off service between the ports of Auckland, Lyttelton and Dunedin. The Union Company container vessel Union Nelson continued to service Onehunga, Nelson, and Lyttelton. Union Company vessels engaged in trans-Tasman trade also carried some cargo between New Zealand ports. Late in 1982 the Coastal Shipping Limited conventional vessel Onehunga, which had operated between Onehunga, New Plymouth, Lyttelton, Timaru and Nelson since December 1981, was withdrawn because of a decline in trade. In June 1983 Pacifica Shipping Limited, a joint-venture of New Zealand and Norwegian interests, introduced a new freight-only shipping service between Wellington and Lyttelton using a roll-on roll-off vessel, The Spirit of Free Enterprise.
The Government continued to subsidise a freight only shipping service to the Chatham Islands and a passenger freight ferry service to Stewart Island.
Coastal Bulk Shipping—Bulk cement distribution was handled by 5 small cement carriers operated by New Zealand Cement Holdings Ltd. (2), the Tarakohe Shipping Company Ltd. (2), and Wilsons (NZ) Portland Cement Ltd. (1), and 4 product tankers operated by the Union Company on behalf of the oil industry distributed petroleum products from the Marsden Point Oil Refinery.
Other dedicated coastal bulk tonnage includes 4 oil product tankers operated by the USSCO on behalf of the oil industry. One of the tankers, the 20 year old Erne, was replaced in mid-1984 by the Taiko, a new 30 000 deadweight tonne vessel.
Shipping Corporation of New Zealand (SCNZ)—The corporation was set up pursuant to the Shipping Corporation of New Zealand Act 1973 and commenced trading in 1974 as a wholly Government-owned national shipping line. SCNZ's objectives are set out in the 1974 Memorandum of Association and include:
Establishing, maintaining, and operating shipping services both on the New Zealand coast and in foreign trades;
Promoting, encouraging, and improving New Zealand's import/export trades;
Participating in negotiations and conferences within the shipping industry, particularly in connection with freight rates.
LINER SERVICES—United Kingdom/Europe: SCNZ is a member of the liner conference serving the New Zealand/UK-Europe trade. The corporation is also a member of the Australia/New Zealand/Europe Container Services (ANZECS) and its flagship, New Zealand Pacific, is chartered to the ANZECS consortium. In return, the corporation has a 15 percent slot share in all ANZECS vessels.
Americas—SCNZ is a member of a joint service serving the trade between New Zealand and South and Central America, the Caribbean and the Gulf and East Coasts of the United States. The corporation's geared containership, New Zealand Caribbean, is one of 3 purpose-built ships employed by the service partners.
East Asia—The corporation is a member of the Australian and New Zealand/Eastern Shipping Conference, the New Zealand arm of which provides a direct container service between New Zealand and Japan. SCNZ serves its 12 percent trade share by chartering container space aboard the 2 container ships Godwit (Japanese flag) and Aotea (U.K. flag) and the supplementary tonnage chartered to cover seasonal peaks.
South Pacific—SCNZ manages the Cook Islands/Niue/New Zealand Joint Shipping Service on behalf of the governments of the 3 countries. Two corporation vessels, Tiare Moana and Fetu Moana, serve the trade under charter to the New Zealand Ministry of Foreign Affairs.
The corporation also provides and administers the port agency operations in New Zealand in support of the Pacific Forum Lines (PFL). Solomon Islands-Papua New Guinea service and timecharters the Forum New Zealand to the PFL with financial help from the New Zealand Government.
Coastal Trade—SCNZ's roll-on/roll-off vessel, Coastal Trader, operates a weekly service between Auckland/Lyttelton and Dunedin.
Other Activities—Under a joint venture arrangement with Norwegian shipowner Kristian Jebsen Rederi, SCNZ man and manage 1 of Jebsen's 35 000 deadweight tonne bulk carriers. The vessel, renamed the New Zealand Alliance, operates internationally within a pool of 35 similar sized bulk ships and is not confined to New Zealand trades.
SCNZ also manages the seagoing crews for the Stena Constructor, a diving support vessel chartered from Stena Line AB to assist offshore natural gas recovery activities.
The corporations's Container Services Division offers a terminal agency service to operators at each of the 4 container terminals.
The container terminal at Wellington is operated by Container Terminals Limited, a 51 percent owned subsidiary of SCNZ.
The corporation is involved in various forms of broking activity in the international charter market, including ship broking and cargo broking, and acts as the New Zealand agent for a number of overseas shipping lines.
SHIPPING ON NEW ZEALAND REGISTER—At 31 December 1983 there were 1885 ships on the New Zealand Register, the total gross tonnage being 307 783 and net tonnage, 164 164.
Most of the vessels on the register are relatively small. Vessels where net tonnage does not exceed 15 employed in trade solely on the coast or inland waters, are not required to register under the Shipping and Seamen Act 1952. These small trading vessels, along with yachts and other pleasure craft, may be registered at the request of the owners.
The following table shows registered trading vessels. Ships in overseas trade are mainly engaged in trans-Tasman and Pacific Islands trading movements.
| Year | Number of Vessels | Net Registered Tonnage* | Number of Crew |
|---|---|---|---|
| *1 ton equals 2.83 cubic metres. | |||
| 1979 | 15 | 44,288 | 540 |
| 1980 | 14 | 43,811 | 516 |
| 1981 | 14 | 43,811 | 516 |
| 1982 | 14 | 44,054 | 517 |
| 1983 | 15 | 46,260 | 586 |
| Overseas Trade | |||
| 1979 | 19 | 84,870 | 553 |
| 1980 | 16 | 75,609 | 466 |
| 1981 | 15 | 75,313 | 439 |
| 1982 | 15 | 75,808 | 441 |
| 1983 | 13 | 72,488 | 356 |
PORT STATISTICS—Demands made on ports by overseas and coastwise vessels are illustrated in the following table. Included are arrivals and departures of overseas and coastwise vessels. If a vessel calls at more than 1 New Zealand port during a single voyage, it has been recorded as having entered and cleared at each port visited. The imbalance in arrivals and departures at minor ports is caused by the difficulty in recording all barge traffic and fishing vessels. All figures are provisional for the 1983 December year.
| Port | Arrivals | Departures | Total | |||
|---|---|---|---|---|---|---|
| Number | Net Tonnage | Number | Net Tonnage | Number | Net Tonnage | |
| Parengarenga | 49 | 1,7047 | 104 | 36,990 | 153 | 54,037 |
| Houhora | 9 | 3,288 | 5 | 1,430 | 14 | 4,718 |
| Mangonui | 11 | 3,663 | 4 | 1,858 | 15 | 5,521 |
| Awanui | 1 | 150 | – | – | 1 | 150 |
| Opua | 7 | 28,324 | 7 | 28,324 | 14 | 56,648 |
| Whangarei | 370 | 2,606,413 | 378 | 2,624,146 | 748 | 5,230,559 |
| Auckland | 1,080 | 7,707,056 | 1,086 | 7,729,617 | 2,166 | 15,436,673 |
| Onehunga | 145 | 151,748 | 144 | 151,048 | 289 | 302,796 |
| Tauranga | 466 | 2,880,516 | 467 | 2,894,343 | 933 | 5,774,859 |
| Taharoa | 14 | 473,666 | 15 | 499,004 | 29 | 972,670 |
| Gisborne | 71 | 197,248 | 71 | 197,248 | 142 | 394,496 |
| Port Taranaki | 609 | 1,612,156 | 605 | 1,612,987 | 1,214 | 3,225,143 |
| Napier | 303 | 1,581,727 | 298 | 1,550,999 | 601 | 3,132,726 |
| Waverley | 9 | 416,504 | 9 | 416,504 | 18 | 833,008 |
| Wanganui | 37 | 14,219 | 37 | 14,219 | 74 | 28,438 |
| Wellington | 3,092 | 7,392,359 | 3,092 | 7,405,961 | 6,184 | 14,798,320 |
| Other North Island ports | 16 | 14,394 | 16 | 14,394 | 32 | 28,788 |
| Total, North Island | 6,289 | 25,100,478 | 6,338 | 25,179,072 | 12,627 | 50,279,550 |
| Tarakohe | 122 | 107,420 | 122 | 107,420 | 244 | 214,840 |
| Nelson | 455 | 1,132,215 | 457 | 1,117,628 | 912 | 2,249,843 |
| Picton | 1,944 | 2,923,960 | 1,946 | 2,926,336 | 3,890 | 5,850,206 |
| Westport | 128 | 158,371 | 129 | 159,632 | 257 | 318,003 |
| Greymouth | 61 | 4,142 | 60 | 4,103 | 121 | 8,245 |
| Lyttelton | 839 | 3,120,731 | 836 | 3,127,015 | 1,675 | 6,247,746 |
| Timaru | 169 | 791,410 | 170 | 796,945 | 339 | 1,588,355 |
| Otago | 356 | 2,361,440 | 356 | 2,355,617 | 712 | 4,717,057 |
| Invercargill (Bluff) | 398 | 1,516,906 | 396 | 1,488,917 | 794 | 3,005,823 |
| Halfmoon Bay | 161 | 46,851 | 161 | 46,851 | 322 | 93,702 |
| Chatham Islands | 10 | 3,940 | 10 | 3,940 | 20 | 7,880 |
| Total, South Island | 4,643 | 12,167,386 | 4,643 | 12,134,404 | 9,286 | 24,301,790 |
| Total, New Zealand ports | 10 932 | 37 267 864 | 10 981 | 37 313 476 | 21 913 | 74 581 340 |
COASTWISE ARRIVALS AND DEPARTURES—Included are arrivals and departures of overseas and coastwise vessels on coastwise movements. If a vessel calls at more than 1 New Zealand port during a single voyage it has been recorded as having entered and cleared at each port visited. The following tables relates to the 1983 December year. All figures are provisional.
| Port | Arrivals | Departures | Total | |||
|---|---|---|---|---|---|---|
| Number | Net Tonnage | Number | Net Tonnage | Number | Net Tonnage | |
| Parengarenga | 49 | 17,047 | 104 | 36,990 | 153 | 54,037 |
| Houhora | 9 | 3,288 | 5 | 1,430 | 14 | 4,718 |
| Mangonui | 11 | 3,663 | 4 | 1,858 | 15 | 5,521 |
| Awanui | 1 | 150 | – | – | 1 | 150 |
| Opua | 4 | 6,100 | 5 | 22,648 | 9 | 28,748 |
| Whangarei | 312 | 1,757,243 | 318 | 1,721,778 | 630 | 3,479,021 |
| Auckland | 476 | 2,855,398 | 622 | 4,116,843 | 1,098 | 6,972,241 |
| Onehunga | 108 | 124,572 | 106 | 123,693 | 214 | 248,265 |
| Tauranga | 335 | 2,007,709 | 183 | 1,228,608 | 518 | 3,236,317 |
| Gisborne | 38 | 121,853 | 47 | 137,559 | 85 | 259,412 |
| Port Taranaki | 210 | 1,037,675 | 206 | 1,039,325 | 416 | 2,077,000 |
| Napier | 227 | 1,186,936 | 218 | 1,160,645 | 445 | 2,347,581 |
| Wanganui | 17 | 11,130 | 17 | 11,131 | 34 | 22,261 |
| Wellington | 2,373 | 5,920,781 | 2,456 | 6,460,997 | 4,829 | 12,381,778 |
| Other North Island ports | 16 | 14,394 | 16 | 14,394 | 32 | 28,788 |
| Tarakohe | 113 | 94,305 | 105 | 85,808 | 218 | 180,113 |
| Nelson | 190 | 622,237 | 184 | 600,064 | 374 | 1,222,301 |
| Picton | 1,938 | 2,868,776 | 1,943 | 2,902,084 | 3,881 | 5,770,860 |
| Westport | 123 | 154,924 | 126 | 157,225 | 249 | 312,149 |
| Lyttelton | 510 | 2,066,287 | 543 | 2,148,682 | 1,053 | 4,214,969 |
| Timaru | 95 | 641,032 | 78 | 443,914 | 173 | 1,084,946 |
| Otago | 225 | 1,822,311 | 190 | 1,187,714 | 415 | 3,010,025 |
| Invercargill (Bluff) | 294 | 839,199 | 257 | 606,435 | 551 | 1,445,634 |
| Halfmoon Bay | 161 | 46,851 | 161 | 46,851 | 322 | 93,702 |
| Chatham Islands | 10 | 3,940 | 10 | 3,940 | 20 | 7,880 |
| Total, all ports | 7 845 | 24 227 801 | 7 904 | 24 260 616 | 15 749 | 48 488 417 |
OVERSEAS ARRIVALS AND DEPARTURES—Included are first arrivals from overseas and final departures overseas only. The table relates to the 1983 December year. All figures are provisional.
| Port | Arrivals | Departures | Total | |||
|---|---|---|---|---|---|---|
| Number | Net Tonnage | Number | Net Tonnage | Number | Net Tonnage | |
| Opua | 3 | 22,224 | 2 | 5,676 | 5 | 27,900 |
| Whangarei | 58 | 849,170 | 60 | 902,368 | 118 | 1,751,538 |
| Auckland | 604 | 4,851,658 | 464 | 3,612,774 | 1,068 | 8,464,432 |
| Onehunga | 37 | 27,176 | 38 | 27,355 | 75 | 54,531 |
| Tauranga | 131 | 872,807 | 284 | 1,665,735 | 415 | 2,538,542 |
| Taharoa | 14 | 473,666 | 15 | 499,004 | 29 | 972,690 |
| Gisborne | 33 | 75,395 | 24 | 59,689 | 57 | 135,084 |
| Port Taranaki | 99 | 574,481 | 399 | 573,662 | 798 | 1,148,143 |
| Napier | 76 | 394,791 | 80 | 390,354 | 156 | 785,145 |
| Waverley | 9 | 416,504 | 9 | 416,504 | 18 | 833,008 |
| Wanganui | 20 | 3,089 | 20 | 3,088 | 40 | 6,177 |
| Wellington | 719 | 1,471,578 | 636 | 944,964 | 1,355 | 2,416,542 |
| Tarakohe | 9 | 13,115 | 17 | 21,612 | 26 | 34,727 |
| Nelson | 265 | 509,978 | 273 | 517,564 | 538 | 1,027,542 |
| Picton | 6 | 55,184 | 3 | 24,252 | 9 | 79,436 |
| Westport | 5 | 3,447 | 3 | 2,407 | 8 | 5,854 |
| Greymouth | 61 | 4,142 | 60 | 4,103 | 121 | 8,245 |
| Lyttelton | 329 | 1,054,444 | 293 | 978,333 | 622 | 2,032,777 |
| Timaru | 74 | 150,378 | 92 | 353,031 | 166 | 503,409 |
| Otago | 131 | 539,129 | 166 | 1,167,903 | 297 | 1,707,032 |
| Invercargill (Bluff) | 104 | 677,707 | 139 | 882,482 | 243 | 1,560,189 |
| Total, all ports | 3 087 | 13 040 063 | 3 077 | 13 052 860 | 6 164 | 26 092 923 |
CARGO STATISTICS—Both overseas and coastal cargo is recorded in gross tonnes which is the actual weight of cargo including packaging but not including the weight of any re-usable containers.
For the year ended December 1983, overseas cargo was—inwards 7 363 294 gross tonnes outwards 8 808 047 gross tonnes. Coastal cargo for the same period was—inwards 5 768 025 gross tonnes, outwards 5 642 648 gross tonnes. It should be noted that coastal cargo figures are provisional. With the rise of ports handling specialised cargoes and major ports mechanically handling bulk loads and goods in containers on and off cellular container ships, the pattern of cargo movements has changed rapidly. Technical developments in packaging (containers, pallets) and transport (bulk loading) has tended to concentrate mechanised handling of cargo through a few ports with the consequent displacement of the manual labour of waterside workers.
The following table shows the tonnage of major items of coastal cargo handled during the year ended December 1983. AH figures are provisional.
| Commodity | Inwards | Outwards | Total |
|---|---|---|---|
| gross tonnes | |||
| Cement | 653,436 | 650,632 | 1,304,068 |
| Coal and coke | 202 | 213 | 415 |
| Petroleum products | 3,450,108 | 3,349,668 | 6,799,776 |
| Sand and shingle | 33,813 | 50,783 | 84,596 |
| Grain | 43,868 | 55,075 | 98,943 |
| Motor vehicles | 296,840 | 296,848 | 593,688 |
| Container goods | 269,513 | 265,097 | 534,610 |
| Other goods | 1,020,245 | 974,332 | 1,994,577 |
| Total | 5 768 025 | 5 642 648 | 11 410 673 |
The next table shows for each port inward and outward cargo in 1983. Loadings of bunker fuels are not included. A large proportion of the coastal movement concerns oil tankers working from the Whangarei refinery, while the movements of cars by tourists build up the Wellington and Picton tonnages.
| Port | Overseas | Coastal* | ||
|---|---|---|---|---|
| Loaded | Unloaded | Loaded | Unloaded | |
| * Provisional | ||||
| gross tonnes | ||||
| Parengarenga | – | – | 47,511 | 4,965 |
| Houhora | – | – | 298 | 1,510 |
| Mangonui | – | – | – | 1,917 |
| Awanui | – | – | – | 313 |
| Whangarei | 28,409 | 1,858,210 | 2,609,823 | 816,657 |
| Auckland | 1,112,784 | 1,945,051 | 97,751 | 849,452 |
| Onehunga | 42,244 | 4,030 | 48,009 | 163,571 |
| Tauranga | 1,577,649 | 611,290 | 19,052 | 514,083 |
| Taharoa | 1,527,483 | – | – | – |
| Gisborne | 27,648 | 6 | – | 18,302 |
| Port Taranaki | 236,516 | 258,873 | 843,121 | 284,155 |
| Napier | 604,593 | 315,513 | – | 328,268 |
| Waverley | 934,309 | – | – | – |
| Wanganui | – | 1,591 | 8,053 | |
| Wellington | 497,480 | 753,156 | 645,153 | 931,072 |
| Other North Island ports | 796 | – | 313 | – |
| Total, North Island | 6,589,911 | 5,746,129 | 4,312,622 | 3,922,318 |
| Tarakohe | 73,662 | 5,600 | 175,444 | 13,296 |
| Nelson | 521,801 | 45,034 | 30,303 | 222,698 |
| Picton | 9,900 | 41 | 582,127 | 572,677 |
| Westport | 14,730 | 3 | 290,185 | 7,133 |
| Lyttelton | 467,029 | 527,747 | 172,441 | 449,002 |
| Timaru | 204,425 | 113,344 | 10,292 | 109,670 |
| Otago | 421,270 | 146,596 | 38,393 | 255,285 |
| Invercargill (Bluff) | 505,319 | 779,088 | 28,061 | 206,648 |
| Halfmoon Bay | – | – | 759 | 2,813 |
| Other South Island ports | – | – | 2,021 | 6,485 |
| Total, South Island | 2,218,136 | 1,617,453 | 1,330,026 | 1,845,707 |
| Total, New Zealand ports | 8 808 047 | 7 363 582 | 5 642 648 | 5 768 025 |
Inward Overseas Cargo—The following table shows the tonnage and value of major S.I.T.C. sections of inward overseas cargo handled during the year ended December 1983.
| Port | Crude Materials | Fuels | Animal Oils | Chemicals | Machinery Transport |
|---|---|---|---|---|---|
| gross tonnes | |||||
| Whangarei | 96,690 | 1,713,711 | – | 33,021 | 11,959 |
| Auckland | 101,420 | 473,433 | 44,146 | 290,243 | 144,755 |
| Tauranga | 295,489 | 146,731 | 72 | 136,030 | 1,318 |
| Napier | 171,898 | 41,378 | 51 | 76,864 | 2,269 |
| Taranaki | 94,705 | 4,994 | 161 | 86,658 | 26,215 |
| Wellington | 13,055 | 370,130 | 1,797 | 111,467 | 66,823 |
| Nelson | 18,976 | 12,436 | 16 | 6,811 | 3,853 |
| Lyttelton | 136,593 | 216,887 | 2,560 | 51,900 | 14,647 |
| Timaru | 63,666 | 19,368 | 676 | 20,744 | 2,559 |
| Otago | 63,157 | 22,098 | 293 | 15,941 | 8,834 |
| Bluff | 611,439 | 134,631 | 17 | 25,867 | 1,341 |
| All other ports | 5,914 | 17 | 32 | 9 | 83 |
| Total | 1 673 004 | 3 155 814 | 49 823 | 855 556 | 284 660 |
| Port | Crude Materials | Fuels | Animal Oils | Chemicals | Machinery Transport |
|---|---|---|---|---|---|
| c.i.f. $(000) | |||||
| Whangarei | 14,582 | 662,866 | – | 18,795 | 82,445 |
| Auckland | 57,333 | 244,775 | 36,460 | 454,489 | 1,026,116 |
| Tauranga | 47,209 | 63,744 | 75 | 30,581 | 12,183 |
| Napier | 25,677 | 33,117 | 57 | 29,128 | 20,198 |
| Taranaki | 21,156 | 2,090 | 266 | 24,435 | 181,273 |
| Wellington | 25,793 | 204,278 | 2,547 | 152,572 | 493,653 |
| Nelson | 1,237 | 6,439 | 23 | 1,988 | 24,162 |
| Lyttelton | 36,703 | 118,742 | 717 | 58,680 | 101,162 |
| Timaru | 9,053 | 9,218 | 584 | 7,871 | 19,361 |
| Otago | 17,836 | 10,521 | 489 | 20,799 | 58,838 |
| Bluff | 184,851 | 34,650 | 14 | 13,748 | 14,667 |
| All other ports | 463 | 26 | 49 | 24 | 874 |
| Total | 441,893 | 1,390,466 | 41,282 | 813,110 | 2,034,932 |
Outward Overseas Cargo—The following table shows how the various ports participated in the handling of the volume of the main items in the outward overseas cargo during the year ended December 1983, and the value of those goods.
| Port | Food | Beverages, Tobacco | Crude Materials | Mineral Fuels | Animal Vegetable Oils | Manufactured Goods |
|---|---|---|---|---|---|---|
| gross tonnes | ||||||
| Whangarei | 28,355 | – | 25 | – | – | |
| Auckland | 635,654 | 9,106 | 125,780 | 2,664 | 31,635 | 61,011 |
| Onehunga | 11,860 | 386 | 2,736 | 1,099 | 837 | 2,835 |
| Tauranga | 224,720 | 156 | 793,566 | 4 | 8,131 | 6,813 |
| Gisborne | 27,385 | – | 60 | – | 200 | 1 |
| Napier | 158,575 | 57 | 344,090 | 60 | 36,047 | 87 |
| Taranaki | 115,032 | 3,366 | 8,788 | 25 | 4,640 | 9,014 |
| Wellington | 348,774 | 2,473 | 99,326 | 55 | 1,440 | 16,383 |
| Picton | 1,805 | – | 6,629 | – | 1,467 | – |
| Nelson | 79,472 | 162,038 | 4 | 853 | 244 | |
| Lyttelton | 146,597 | 54 | 90,849 | 187,383 | 9,101 | 1,069 |
| Timaru | 176,474 | 23 | 10,671 | – | 14,419 | 55 |
| Otago | 198,953 | 13 | 159,643 | 1,009 | 1,539 | 241 |
| Bluff | 133,833 | 1 | 40,201 | 935 | 17,282 | 58 |
| All other ports | 796 | – | 2,461,792 | – | – | – |
| Total | 2 288 283 | 15 634 | 4 306 193 | 193 236 | 5.27 592 | 97 811 |
| Port | Food | Beverages, Tobacco | Crude Materials | Mineral Fuels | Animal Vegetable Oils | Manufactured Goods |
|---|---|---|---|---|---|---|
| f.o.b. $(000) | ||||||
| Whangarei | 47,263 | – | 95 | – | – | 5 |
| Auckland | 1,190,164 | 14,200 | 281,766 | 1,830 | 16,548 | 204,107 |
| Onehunga | 11,494 | 911 | 1,013 | 1,128 | 564 | 8,398 |
| Taharoa | – | – | 25,036 | – | – | – |
| Tauranga | 355,075 | 348 | 183,137 | 5 | 4,287 | 9,274 |
| Gisborne | 10,906 | – | 26 | – | 97 | 1 |
| Napier | 196,780 | 44 | 210,628 | 13 | 18,496 | 633 |
| Taranaki | 227,006 | 88 | 30,572 | 5 | 2,472 | 1,480 |
| Waverley | – | – | 13,420 | – | – | – |
| Wellington | 793,196 | 1,388 | 309,296 | 69 | 762 | 61,351 |
| Picton | 1,923 | – | 499 | – | 797 | – |
| Nelson | 92,137 | 13,129 | 7 | 575 | 1,032 | |
| Lyttelton | 212,391 | 66 | 203,890 | 17,918 | 4,524 | 3,064 |
| Timaru | 169,374 | 22 | 36,545 | – | 8,203 | 168 |
| Otago | 352,247 | 13 | 369,077 | 198 | 705 | 591 |
| Bluff | 135,157 | 1 | 44,052 | 189 | 9,210 | 82 |
| All other ports | 1,512 | – | – | – | – | – |
| Total | 3,796,624 | 17,080 | 1,722,181 | 21,362 | 67,239 | 290,187 |
MERCHANT NAVY QUALIFICATIONS—The Marine Division of the Ministry of Transport conducts regular examinations for merchant service personnel who wish to obtain certificates of competency as master, mate, or engineer. There are different standards of certificates for foreign-going, home trade, and restricted limits ships. The foreign-going certificates as master, first mate, second mate, and first- and second-class steam and motor engineer, are valid in most Commonwealth countries. Examinations are also conducted for skippers, mates and engineers of deep sea, coastal, and inshore fishing boats. Voluntary examinations are held for yachtsmen.
NAUTICAL SCHOOLS—The Marine Division of the Ministry of Transport maintains nautical schools in Wellington and Auckland. Courses leading to the examinations for all grades of masters and mates certificates are available. Courses are also held for able seamen and ordinary seamen, for yachtsmen, and in radar.
SHIP SURVEY STATISTICS—The Marine Division of the Ministry of Transport carries out surveys of ships as required by the Shipping and Seamen Act 1952. In the calendar year 1983, 1243 certificates of survey were issued, compared with 1301 in 1982 and 1294 in 1981.
Seventy-seven foreign-flag joint venture fishing vessels were surveyed and issued with an exemption certificate and certifying letter in lieu of a certificate of survey for the 1983–84 season, compared with 72 for the 1982–83 season.
During 1983, 49 certificates were issued under the International Convention for the Safety of Life at Sea 1960, to which New Zealand is a signatory, compared with 112 in 1982. In addition, 58 surveys were carried out on overseas registered ships towards the issue of certificates under the International Convention for the Safety of Life at Sea 1974 and the 1978 Protocol to that convention.
Special surveys are made for seaworthiness after damage, for efficiency of equipment, and for tonnage measurement.
LIGHTHOUSE SERVICE—On headlands, capes, reefs, and shoals around some 7000 kilometres of coastline and the waters in harbours and lakes controlled by the Ministry of Transport there are 211 navigational aids. These aids comprise 15 manned lighthouses, 105 automatic lights, 71 day beacons, 7 navigational buoys, 1 fog signal, and 12 radio beacons. Their provision, maintenance, and servicing is a responsibility of the Marine Division of the Ministry of Transport, and involves an expenditure of approximately $2 million annually. Lighthouse tenders, aircraft, helicopters, and road transport, along with a number of workshops, are used to maintain this service to give the mariner reliable aids to navigation. Light dues collected from overseas and coastal ships meet most of the running costs of the service.
WRECKS—The Ministry of Transport investigates the circumstances of any wreck or shipping casualty which occurs in New Zealand waters. In cases which involve loss of life or serious damage, a Superintendent of Mercantile Marine, or other person appointed for the purpose, carries out a preliminary inquiry into the cause and circumstances of the wreck or casualty. The report of a preliminary inquiry is sent to the Minister of Transport, who may order a formal investigation to be held. Such an investigation is usually held by a judge, assisted by technical assessors, who has the power to cancel or suspend the Certificate of Competency of any officer whose wrongful act or default has resulted in or contributed to loss or damage.
In the case of any wreck on coasts, rivers or lakes, a Receiver of Wreck for that district has extensive powers for the preservation of life and protection of property. Contrary to popular belief a wreck or any article belonging to it remains the property of the owner until disposed of by that person, and it is illegal to plunder or purloin any items of wreckage.
Shipping Casualties—During the year ended December 1983, 355 shipping casualties were reported to the Ministry of Transport. The table below shows the type of ship involved and the nature of the casualty.
| Type of Ship | Machinery Breakdown and Miscellaneous | Capsizing and Collision | Stranding and Grounding | Foundering | Fire | Total |
|---|---|---|---|---|---|---|
| Passenger | – | 3 | – | 1 | 2 | 6 |
| Cargo | 7 | – | 1 | – | 5 | 13 |
| Fishing | 9 | 15 | 14 | 10 | 2 | 50 |
| Dredges, tugs, etc | 1 | 2 | – | – | – | 3 |
| Pleasure | 169 | 53 | 38 | 13 | 10 | 283 |
| Total | 186 | 73 | 53 | 24 | 19 | 355 |
Fishing boat accidents resulted in the loss of 11 vessels but no lives were reported lost. Pleasure boat accidents resulted in 37 deaths, including 4 deaths in river rafting mishaps.
Major casualties included the loss of the Japanese fishing vessel Minato Maru No. 102 which ran aground on Shearer Rock near Tiritiri Matangi Island in the approach to Auckland Harbour on 6 September 1983. The 17 crew members were rescued but the vessel subsequently drifted clear of Shearer Rock and sank.
Early in June 1983 a number of yachts returning to New Zealand after the Auckland-Suva Yacht Race got into difficulties in bad weather. Two yachts were lost and 8 yachtsmen died. The circumstances were investigated and a report made public. Fifteen preliminary inquiries were carried out by superintendents (including inquiries into the above casualties) but no formal investigations were ordered.
SAFETY OF SHIPS—The Shipping and Seamen Act 1952, administered by the Ministry of Transport, is primarily concerned with the safety of ships and those who sail in them. This Act contains the necessary authority for implementing the provisions of several international conventions to which New Zealand is a signatory and also contains provisions relating to the safety of all ships plying in New Zealand coastal waters, and all New Zealand registered ships on international voyages.
MARINE POLLUTION—The Marine Pollution Act 1974 gives effect to a number of international conventions relating to oil pollution, the most important of which is the International Convention for the Prevention of Pollution of the Sea by Oil 1954, as amended in 1962 and 1969.
This Act is currently being revised to give effect to Marpol 73/78 (International Convention for the Prevention of Pollution from Ships 1973 as modified by its Protocol in 1978).
The 1954 convention is concerned with the prevention of oil pollution resulting from normal shipping operations. Marpol 73/78 not only strengthens the 1954 convention but also introduces measures to mitigate the effects of pollution resulting from tanker accidents and deals with pollution of the sea by substances other than oil.
There is a contingency plan to deal with a major spillage of oil in New Zealand waters and oil pollution control equipment, including dispersants, is stockpiled in New Zealand to deal with such an eventuality.
The Marine Pollution Act also contains provisions for controlling the dumping of waste at sea from ships, and whilst prohibiting the dumping of substances known to be harmful to the marine environment allows the Ministry of Transport to issue permits for the dumping of other wastes, such as dredging spoil, under appropriate conditions and in approved sites.
FURTHER INFORMATION—Further information on shipping, ports, and cargo may be found in the following publications.
Transport Statistics—Department of Statistics.
Monthly Abstract of Statistics—Department of Statistics.
Report of the Waterfront Industry Commission (Parl. paper G. 2).
Report of the Ministry of Transport (Parl. paper F. 5).
Report of the New Zealand Ports Authority (Parl. paper F. 5A).
Report of the Shipping Corporation of New Zealand Ltd. (Parl. paper F. 13).
Turnround of Overseas Shipping—Waterfront Industry Commission (4-monthly).
The New Zealand Railways Corporation is responsible for a network of railways extending over 4400 kilometres and linking almost all the principal centres of population in New Zealand. The corporation also operates road services over more than 10 000 route kilometres of highway, and a rail and road vehicle and passenger ferry service across Cook Strait between Wellington and Picton. More than 20 000 people are employed by the corporation.
The title New Zealand Railways is used for trading purposes.
RAILWAYS DEVELOPMENT—Recent years have seen notable progress in the development of the railway system and a steady increase in the carrying capacity of its main lines. Extensive use is being made of the latest developments in railway-transport technology, including diesel and electric traction, transistorised equipment for centralised traffic control, computerised monitoring of freight wagons and rail traffic, mechanised equipment for freight handling and track-maintenance work, and electronic data-processing machines to assist with accounting and statistical operations. Many new types of goods wagons have been and are being introduced, and numerous station buildings, goods sheds, bridges, etc., are being replaced by up-to-date structures in a continuing programme.
The completion of the 9.5 km Mangaweka-Utiku deviation on the North Island Main Trunk line in 1981, and the opening of the Porootarao tunnel in 1980, have resulted in improved clearances and greater speed for modern railway rolling stock through the North Island Main Trunk line. Since a Traffic Monitoring System (TMS) was established nationwide in 1980, the system has performed to expectations and other stages are being implemented in a continual programme.
One of the most important decisions made in recent years has been the approval in December 1981 to start design work for electrification of the North Island Main Trunk railway between Te Rapa and Palmerston North. The 6-year electrification programme will cost an estimated $180 million, and tenders have been called internationally and locally for contracts covering locomotives, traction, overhead and power supplies, signals and communications, earthworks and tunnelling. As a third of all New Zealand main rail traffic passes over the main trunk line, electrification will result in reduced fuel costs and faster travelling times.
In the suburban passenger area, work has been completed on the extension of the suburban electrification from Paekakariki to Paraparaumu.
The $1.9 million project was opened in May 1983. The first of the new multiple units, built by Ganz-Mavag of Hungary, went into service in 1982. The 44 2-car Hungarian units will improve suburban rail operations in the Wellington area.
The total route length of railways vested in the New Zealand Railways Corporation and open for traffic at 31 March 1983 was 4332 kilometres—2554 kilometres in the North Island and 1778 in the South Island. In addition, the corporation was working traffic over a further 7 kilometres of railways owned by Government departments. Double line was worked over a total of 254 route kilometres, of which 208 kilometres were in the North Island. A total of 107.3 route kilometres of railways electrified on the 1500-volt direct current overhead contact system was in use at 31 March 1982.
RAILWAY CONSTRUCTION AND ENGINEERING—In most instances, Government railways in New Zealand were constructed by the Public Works Department, now the Ministry of Works and Development, and handed over to the then Railways Department upon completion. Recent practice has been for the Ministry of Works and Development to construct the earthworks, bridges, tunnels, and buildings and for the Railways Department (or, now, the Railways Corporation) to lay the tracks and install signals.
Track—All track is laid to a gauge of 1067 mm. The major routes are laid with rails 85 or 91 lb per yard (42.2 or 45.1 kg/m) but these lines will be progressively relaid with rails weighing 50 kg per metre. Secondary and branch lines have generally been laid with rails weighing 55, 70, and 72 lb per yard (27.3, 34.7, and 35.7 kg/m) and the practice is to re-lay these lines with heavier rails from the main lines. Treated Pinus radiate sleepers, laid about 1480 per kilometre, have gradually replaced Australian hardwood sleepers, and locally manufactured concrete sleepers are also being used on selected areas on the main routes. Track with fishplates and bolts at every joint is progressively replaced with rails welded at the joints on all major routes and on some secondary lines.
Bridges—To carry the railways across gorges, rivers, and streams in New Zealand, about 2600 bridges and viaducts have been built with an aggregate length of 90 kilometres. The longest railway bridge is that over the Rakaia River, 55 kilometres south of Christchurch. Completed in 1939 to replace an original timber structure of the 1870s, it is 1743 metres in length.
The highest viaduct is the Mohaka, completed in 1937 to carry the Napier-Gisborne railway 97 metres above the bed of the Mohaka River. Twenty-one New Zealand railway viaducts carry the rails more than 33 metres above the streams they cross.
Tunnels—There are 183 railway tunnels in New Zealand. The 3 longest tunnels are Kaimai (8.9 km), between Tauranga and Hamilton; Rimutaka (8.8 km), between Wellington and Masterton; and Otira (8.5 km), between Otira and Arthur's Pass.
Cook Strait Rail/Air Freight Service—An air freight service across Cook Strait was commenced in February 1947. In recent years this service has been considerably affected by the alternative service offered by the rail ferries, and has operated at a loss. The contract has now been withdrawn.
Cook Strait Rail/Ferry Service—Three ferries carrying road and rail vehicles and passengers are operated by the Railways Corporation between Wellington and Picton: The Arahura, Aranui, and Aratika. A fourth vessel, Arahanga, carries rail wagons and road freight vehicles.
The 20 year old Aramoana was replaced by the Arahura, which was built by the Danish firm Aalborg Vaerft. A contract for the $45 million ferry was signed in January 1982, and it arrived in New Zealand in November 1983.
The new ferry virtually doubles the payload of the Aramoana and is capable of carrying 60 railway wagons, 100 cars and 800 passengers. There is room for 232 cars or commercial vehicles if no railway wagons are aboard.
It makes the Wellington-Picton crossing in 3 hours, compared to 3 hours 20 minutes taken by the other Cook Strait ferries.
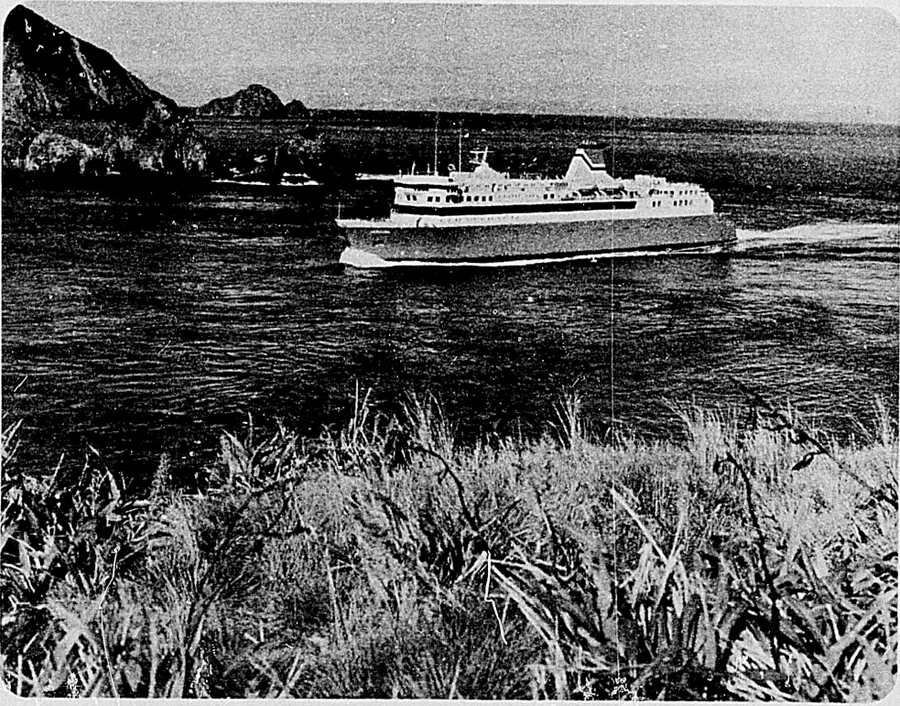
ROLLING STOCK:Wagons—The Railways Corporation's fleet of goods and livestock wagons at 31 March 1983 totalled 25 754, with a total carrying capacity of 506 302 640 kg. In recent years thousands of new wagons have been introduced, including long, covered bogie wagons with wide doorways for mechanical loading of palletised freight, for use on express goods trains. Special-purpose wagons include those designed for log traffic, packaged timber, and bulk commodities such as cement, flour, plaster, heated tallow, sulphuric acid, and aluminium sulphate, and wagons for coal traffic for the Mission Bush steel mill. Many bogie flat-top wagons have also been built or modified for the ever-increasing volume of container traffic. In addition to the wagons owned by the corporation another 242 privately-owned wagons are also in use, mainly for petrol and cement traffic.
PASSENGER SERVICES—In addition to the normal suburban services, New Zealand Railways Corporation run 3 prestige passenger trains. These are the Silver Fern, Northerner, and Southerner.
The Silver Fern daylight express railcar runs 5 days a week, between Auckland and Wellington. This service is licensed, air conditioned, and has hostesses.
The Northerner express runs nightly between Auckland and Wellington, and has both day and sleeping cars. The train, which has a licensed dining car, stops at many of the smaller towns not served by the Silver Fern.
The Southerner runs 6 days a week between Christchurch and Invercargill. This train has hostesses and a buffet car. A service also runs daily between Wellington and Gisborne, Christchurch and Picton, and Christchurch and Greymouth. Provincial passenger services to other districts are operated by Railways Road Services.
The following table sets out the numbers of rail passenger journeys and the corresponding receipts.
| Year Ended 31 March | Number of Journeys | Passenger Revenue | ||||
|---|---|---|---|---|---|---|
| Suburban | Non-suburban | Total | Suburban | Non-suburban | Total | |
| (000) | $(000) | |||||
| 1979 | 15,742 | 1,007 | 16,749 | 5,519 | 6,087 | 11,606 |
| 1980 | 15,012 | 999 | 16,011 | 6,532 | 6,437 | 12,970 |
| 1981 | 13,948 | 986 | 14,934 | 7,234 | 7,551 | 14,786 |
| 1982 | 13,440 | 899 | 14,339 | 8,626 | 9,098 | 17,724 |
| 1983 | 12,817 | 880 | 13,697 | 10,504 | 10,119 | 20,624 |
GOODS TRAFFIC—The following table shows the volume of goods traffic in tonnes and tonne-kilometres, and the revenue received from goods and parcels traffic consigned by rail.
| Year Ended 31 March | Goods Carried (Excluding Parcels) | Total Revenue from Goods and Parcels Traffic | |||
|---|---|---|---|---|---|
| Tonnes | Net Tonne-kilometres | North Island | South Island | Total | |
| •Revenue from rail parcels traffic was $5,313,513 in 1978–79, $5,770,594 in 1979–80, $6,866,810 in 1980–81, $8,970,928 in 1981–82, and $10,458,288 in 1982–83. | |||||
| (000) | (million) | $(thousand) | |||
| 1979 | 11,722 | 3 281.0 | 157,541 | 64,230 | 221,771* |
| 1980 | 12,760 | 3 225.9 | 178,060 | 75,782 | 253,842* |
| 1981 | 12,311 | 3 152.5 | 214,982 | 92,863 | 307,846* |
| 1982 | 12,468 | 3 264.5 | 259,555 | 111,963 | 371,518* |
| 1983 | 12,006 | 3 163.8 | 298,703 | 122,066 | 420,769* |
MOTIVE POWER—Dieselisation of New Zealand Railways was begun in 1949 and completed by 1971. The most powerful diesel-electric locomotives in service are the American-built “DX” class.
The rebuilding and modernising of earlier “DA” and “DB” class locomotives under contract by the Clyde Engineering Company in South Australia has been completed. All 90 locomotives having returned to New Zealand are now in service as “DC” or “DBR” classes.
All 18 units of the “DSG” class shunting locomotives built by the Toshiba Corporation of Japan are in service, and the prototype of a single engined version of these locomotives to be known as the “DSJ” has arrived. Designed to replace the remaining rigid wheelbase shunters still in service, the “DSJ” will be a joint project with Toshiba and New Zealand Railways. Toshiba will be supplying engine-generator sets and other components. The NZR will do the assembly work and build the structures.
A new programme for overhauling the electric multiple unit coaches (English stock) at Wanganui East Town Railway Workshops was introduced in 1983 and is continuing.
The number of locomotives in service at 31 March 1983 totalled 623, comprising 428 main line diesel-electric, 189 diesel shunters of various types, 6 electric, and 2 steam locomotives. As with previous years the locomotive rebuilding programme has necessitated about 12 locomotives being either in transit to or from Australia or under conversion at any one time, and as a consequence on some occasions during the year there were short term locomotive shortages.
REVENUE AND EXPENDITURE—Gross revenue and expenditure on the railways (including subsidiary services) are shown in the following table.
| Year Ended 31 March | Gross Revenue | Expenditure | Net Revenue |
|---|---|---|---|
| * Deficit recovered from Vote: Stabilisation. | |||
| $(thousand) | |||
| 1979 | 299,513 | 346,786 | −47,274* |
| 1980 | 349,126 | 404,931 | −55,805* |
| 1981 | 420,461 | 471,498 | −51,036* |
| 1982 | 507,347 | 563,977 | −56,630* |
| 1983 | 534,447 | 644,921 | −110,474 |
The chief items of expenditure for 1982–83 were: wages, $380,832,141; fuel (including electricity) for locomotives, $64,703,229; stores and materials, $82,662,147; depreciation, $26,385,578; miscellaneous, $72,023,194; and financing costs, $18,336,026.
The revenue and expenditure for recent years, distinguishing between railway operation and other items, are given in the following table.
| Year Ended 31 March | Gross Revenue | Expenditure | Net Revenue or Loss | |||
|---|---|---|---|---|---|---|
| Railway Operation | Subsidiary Services, etc. | Railway Operation | Subsidiary Services, etc. | Railway Operation | Subsidiary Services, etc. | |
| * Figure does not include financing costs. | ||||||
| $(thousand) | ||||||
| 1979 | 237,266 | 62,247 | 287,241 | 59,545 | −49,975 | +2,702 |
| 1930 | 274,369 | 74,756 | 331,360 | 73,570 | −56,991 | +1,186 |
| 1981 | 331,783 | 88,677 | 384,477 | 87,020 | −52,693 | +1,657 |
| 1982 | 399,335 | 108,012 | 459,300 | 104,678 | −59,965 | +3,334 |
| 1983 | 446,403 | 127,509 | 510,875 | 115,710* | −64,472 | +11,800 |
The separate Island figures of revenue and expenditure for railway operation only (i.e., omitting subsidiary services) are given below for the 1982–83 year.
| Section of Railway | Revenue | Expenditure | Operating Deficit |
|---|---|---|---|
| $(thousand) | |||
| North Island | 319,584 | 345,161 | 25,577 |
| South Island | 126,819 | 165,714 | 38,895 |
| New Zealand | 446,403 | 510,875 | 64,472 |
The revenue and expenditure of the various subsidiary services conducted by the Railways Corporation are set out in the following table. Full working costs are charged against these services, and interest which is debited to road services and rail ferries is credited to miscellaneous receipts as revenue.
| Service | Revenue | Expenditure | ||||||
|---|---|---|---|---|---|---|---|---|
| 1979–80 | 1980–81 | 1981—82 | 1982–83 | 1979–80 | 1980–81 | 1981–82 | 1982–83 | |
| $(thousand) | ||||||||
| Advertising | 420 | 532 | 741 | 921 | 442 | 478 | 598 | 669 |
| Corporation houses | 2,443 | 2,535 | 2,621 | 2,702 | 5,931 | 6,335 | 7,684 | 6,474 |
| Road services— | ||||||||
| Passenger and goods | 25,955 | 30,882 | 36,437 | 42,519 | 28,811 | 34,540 | 40,344 | 45,794 |
| Cook Strait rail ferry service | 40,596 | 49,042 | 60,862 | 67,756 | 38,384 | 45,666 | 56,051 | 62,773 |
| Miscellaneous | 5,340 | 5,687 | 7,351 | 13,611 | – | – | – | – |
| Total | 74,756 | 88,678 | 108,012 | 127,509 | 73,570 | 87,020 | 104,677 | 115,710 |
Revenue—In the following table the railway operating revenue is classified according to the class of traffic, etc., from which it was derived.
| Year Ended 31 March | Passenger Traffic | Goods and Parcels | Catering Services | Total |
|---|---|---|---|---|
| $(thousand) | ||||
| 1979 | 11,606 | 221,771 | 3,888 | 237,266 |
| 1980 | 12,970 | 257,116 | 4,283 | 274,369 |
| 1981 | 14,785 | 312,440 | 4,558 | 331,783 |
| 1982 | 17,724 | 376,950 | 4,660 | 399,334 |
| 1983 | 20,624 | 420,769 | 5,010 | 446,403 |
Expenditure—The railway operating expenditure is shown under various heads in the following table.
| Year Ended 31 March | Maintenance of Way and Works | Maintenance of Rolling Stock | Locomotive Transportation | Traffic Transportation | Head Office and General Charges* | Catering Services | Total |
|---|---|---|---|---|---|---|---|
| * Includes superannuation subsidy. | |||||||
| $(thousand) | |||||||
| 1979 | 75,294 | 63,086 | 45,043 | 79,915 | 15,855 | 8,048 | 287,241 |
| 1980 | 84,688 | 71,654 | 55,443 | 93,504 | 18,014 | 8,057 | 331,360 |
| 1981 | 99,797 | 74,975 | 68,036 | 108,748 | 24,815 | 8,106 | 384,477 |
| 1982 | 121,125 | 89,386 | 83,383 | 127,490 | 29,332 | 8,584 | 459,300 |
| 1983 | 130,755 | 106,172 | 98,860 | 131,703 | 34,488 | 8,898 | 510,876 |
Expenditure has been influenced by progressively higher rates of pay and improved conditions of employment, as well as higher costs of fuel and materials.
Capital Expenditure—Expenditure on capital works and new equipment is set out in the following table.
| Item | Year Ended 31 March | ||||
|---|---|---|---|---|---|
| 1979 | 1980 | 1981 | 1982 | 1983 | |
| * Includes Capital Equipment Credits. | |||||
| $(thousand) | |||||
| North Island main trunk electrification | – | – | – | – | 1,658 |
| Plant and equipment | 3,998 | 3,242 | 3,004 | 7,159 | 4,471 |
| Works programme | 19,828 | 20,557 | 19,898 | 23,433 | 23,595 |
| Rolling stock | 27,392* | 36,361* | 40,439* | 64,874* | 26,905 |
| Motor vehicles | 4,414 | 2,328 | 3,250 | 2,893 | 6,480 |
| Rail ferries | 4,095* | 404 | 32 | 180 | 43,358 |
| Total | 59,729 | 62,891 | 66,625 | 98,590 | 106,467 |
This capital expenditure has been met from the department's own depreciation reserves, the Loans Account, and overseas credits.
The relative proportions of capital funded from these sources during the latest 3 years were as follows:
| Source | Year Ended 31 March | |||||||
|---|---|---|---|---|---|---|---|---|
| 1980 | 1981 | 1982 | 1983 | |||||
| $(000) | percent | $(000) | percent | $(000) | percent | $(000) | percent | |
| Railway depreciation | 26,074 | 39 | 22,259 | 34 | 23,751 | 24 | 26,635 | 25 |
| Loans Account | 21,163 | 36 | 20,191 | 30 | 51,324 | 52 | 16,208 | 15 |
| Overseas credits | 15,654 | 25 | 24,175 | 36 | 23,515 | 24 | 63,624 | 60 |
| Total | 62,891 | 100 | 66,625 | 100 | 98,590 | 100 | 106,467 | 100 |
RAIL FERRY TRAFFIC—Traffic statistics for the rail ferry service across Cook Strait between Wellington and Picton are given in the following table.
| Year Ended 31 March | Number of Return Crossings | Total Passenger Journeys | Motor Vehicles (of all kinds) | Freight in Railway Wagons | ||
|---|---|---|---|---|---|---|
| Number | Manifest Tonnes | Deadweight Tonnes | Manifest Tonnes | |||
| 1979 | 1,906 | 691,615 | 153,410 | 843,755 | 956,584 | 1,725,334 |
| 1980 | 2,126 | 684,742 | 144,689 | 795,789 | 968,963 | 1,732,936 |
| 1981 | 2,005 | 705,114 | 147,840 | 813,120 | 910,492 | 2,395,605 |
| 1982 | 2,250 | 777,101 | 158,295 | 870,622 | 944,127 | 2,522,955 |
| 1983 | 2,154 | 768,568 | 152,073 | 836,402 | 918,160 | 1,589,503 |
Financial statistics for the Cook Strait ferry service are as follows:
| Year Ended 31 March | Revenue | Expenditure, Total | ||||
|---|---|---|---|---|---|---|
| Passenger | Catering | Passengers Motor Vehicles | Goods (Rail and Road) | Total | ||
| $(thousand) | ||||||
| 1979 | 4,648 | 874 | 4,424 | 23,336 | 33,282 | 30,040 |
| 1980 | 5,570 | 939 | 4,923 | 29,164 | 40,596 | 38,384 |
| 1981 | 6,840 | 1,096 | 6,441 | 34,663 | 49,042 | 45,666 |
| 1982 | 8,957 | 1,305 | 8,988 | 41,612 | 60,862 | 56,051 |
| 1983 | 10,966 | 1,411 | 9,923 | 45,456 | 67,756 | 62,773 |
RAILWAY EMPLOYEES—The number of persons employed by the New Zealand Railways at 31 March 1983 was 20 865 (including 656 sea-going staff employed on the Cook Strait rail ferries), compared with 21 610 a year earlier.
ACCIDENTS AT LEVEL CROSSINGS—Accidents at level crossings resulted in the death of 12 people and injury to 56 others in 1982–83; in the previous year 10 were killed and 19 injured.
PRIVATE RAILWAYS—There are a number of short private railways in New Zealand, principally lines serving collieries and other industrial undertakings. The 11-km line of the Ohai Railway Board, extends from Wairio (north-west of Invercargill) to coal mines at Ohai. The Whakatane Board Mills Ltd., in the North Island, operates a 10-km private line from Awakeri to its mill at Whakatane in the Bay of Plenty.
RAILWAY OPERATED ROAD SERVICES—There is a network of railway-operated road services, the origin of which dates back to November 1926 when a bus service between Napier and Hastings was purchased. Others were acquired in the following years (notably the services within the Hutt Valley and between the Hutt Valley and Wellington in 1927 and 1928), but it was 1934 before the first long distance coach service was taken over. The main development of the network took place between 1936 and 1951, when the route distance over which licences were held rose from 418 to 9641 km. Now the Railways Corporation maintains in its fleet almost 68 percent of all the vehicles used to provide road passenger services throughout the country. At 31 March 1983, the Railways Corporation's road services branch employed a staff of 1441.
Suburban bus services at Auckland, Rotorua, Hastings, Hutt Valley, Wellington-Khandallah, Titahi Bay, Paraparaumu, Dunedin, Westport, and Greymouth, with a fleet of 333 vehicles at 31 March 1983, carried 10 628 000 passengers and earned a total revenue of $12,124,741. All the other road passenger services, both long and short distance, with 421 coaches, carried 6 984 000 passengers and earned a revenue of $34,280,117. The routes of the services in operation at 31 March 1983 covered 10 044 km of highway.
In addition to the road passenger services, a small number of road goods services were operated. Goods traffic on these services, for which 35 motor vehicles were maintained, produced a further $1,411,170 in 1982–83. A rail ancillary goods service is operated by the corporation's Traffic Branch for the carriage of goods consigned to or from wayside stations.
The following selected statistics illustrate the development of the New Zealand Railway's road services operations.
| Year Ended 31 March | Route Kilometres at 31 March* | Number of Passenger Vehicles at 31 March | Number of Other Vehicles at 31 March | Total Passenger Journeys | Total Passenger and Goods Revenue | Total Expenditure, Including Interest Charges |
|---|---|---|---|---|---|---|
| * Route kilometres for which licences are held. | ||||||
| (000) | $(000) | $(000) | ||||
| 1979 | 10,144 | 774 | 378 | 19,740 | 21,619 | 23,870 |
| 1980 | 10,144 | 775 | 366 | 19,825 | 25,955 | 28,811 |
| 1981 | 10,144 | 780 | 386 | 18,429 | 30,882 | 34,540 |
| 1982 | 10,144 | 780 | 358 | 17,969 | 36,437 | 40,344 |
| 1983 | 10,044 | 754 | 384 | 17,612 | 47,816 | 45,794 |
FURTHER INFORMATION—Further information will be found in the following publications.
Report of the Railways Department (Parl. paper F 7).
Transport Statistics—Department of Statistics.
Monthly Abstract of Statistics—Department of Statistics.
Capital investment in New Zealand's roading and road transport system exceeds that of all other forms of transport services. There are 92 909.3 kilometres of formed roads and streets, and over 1.8 million motor vehicles. The 1979–80 Census of Transport, Storage, and Communication showed that, at the end of February 1980, 10 508 persons were engaged in the provision of road passenger transport services, 18 857 in providing freight transport by road, and 1475 in supplying supporting services to land transport such as car and truck rental services and vehicle parking facilities.
ROADS AND BRIDGES—The cost of providing adequate roads in New Zealand as a proportion of annual investments is relatively high in comparison with many other countries, largely because of the nature of the country and the wide variety of terrain frequently encountered within relatively short distances. In most years the cost of repairing rein and flood damage is a heavy item under road maintenance.
Annual roading expenditure by central and local government is now over $500 million. Maintenance comprises over half the expenditure.
With increased financial stringency, the main emphasis of State highway activities in recent years has been on the maintenance and improvement of existing roading assets. There are 14 213 bridges of 3 metres and over with a total length of 322 797 metres.
Details of formed roads and streets at 31 March 1983 are given in the following table.
| Nature of Surface | Urban Areas | Town Districts | Rural Areas | District Councils | State Highways and Motorways | Total |
|---|---|---|---|---|---|---|
| Kilometres | ||||||
| Paved or sealed | 11 996.5 | 27.4 | 22 538.8 | 3 472.7 | 10 913.2 | 48 948.6 |
| Metal or gravel | 661.4 | 0.5 | 39 458.8 | 3 222.1 | 617.9 | 43 960.7 |
| Total, maintained roads | 12 657.9 | 27.9 | 61 997.6 | 6 694.8 | 11 531.1 | 92 909.3 |
Auckland Harbour Bridge Traffic—From May 1959, when the toll bridge opened, to March 1983, the Auckland harbour bridge has carried 417 million vehicles.
With the abolition of the Auckland Harbour Bridge Authority on 1 April 1984, the bridge became toll free. On that date responsibility for traffic control was handed over to the Ministry of Transport and the Ministry's specialised Motorways Unit was expanded to cover the bridge area. The responsibility for maintaining the structure, roading, signs and associated equipment of the bridge, which became part of the State Highway network, was handed over to the Ministry of Works and Development, as agent for the National Roads Board.
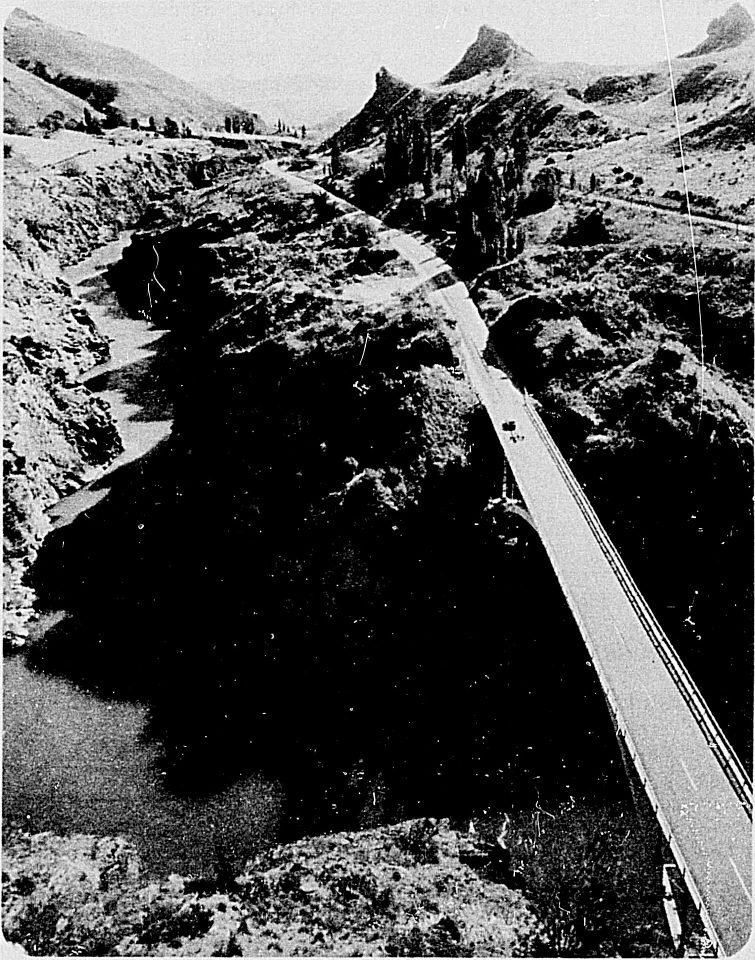
In the 1982–83 year the bridge had a daily average of 81 226 vehicles crossing it. The highest daily figure recorded was 108 156 in 1982–83.
Traffic totals for March years are shown in the following table.
| Class of Vehicle | 1978–79 | 1979–80 | 1980–81 | 1981–82 | 1982–83 |
|---|---|---|---|---|---|
| * Estimated. | |||||
| (thousand) | |||||
| Cars | 12,440 | 12,370 | 12,962 | 13,511 | 13,990 |
| Motor cycles, etc. | 243 | 251 | 275 | 288 | 286 |
| Commercial vehicles | 271 | 270 | 283 | 311 | 323 |
| Exempt vehicles | 221 | 224 | 228 | 234 | 238 |
| Southbound* | 13,164 | 13,117 | 13,729 | 14,332 | 14,811 |
| Total | 26 339 | 26 232 | 27 477 | 28 676 | 29 648 |
ROADS ADMINISTRATION—The main statutes covering roads administration in New Zealand are the Public Works Act 1981, the Local Government Act 1974, and the National Roads Act 1953. Administration of the country's roading system is exercised by municipalities in respect of streets, by county councils in respect of county roads, and by the National Roads Board in respect of State highways.
The National Roads Board is charged with the responsibility of providing an adequate roading system balanced to meet the country's needs. In 1954 the board was formed following the passing of the National Roads Act. This same Act provided for the establishment of the National Roads Fund. Under the chairmanship of the Minister of Works and Development, the National Roads Board is an organisation of 10 members, representative of private motorists, commercial vehicle owners, counties, municipalities, the Ministry of Works and Development, and the Ministry of Transport. It is of interest to note that Government members are in a minority. The representative nature of the board ensures that the widest possible background of knowledge and experience is brought to bear on roading matters. Essentially the board is a politically-orientated policy-making body; it is required to think nationally and to act nationally. The most important functions of the board are:
To administer the National Roads Fund;
To provide a roading system adequate for New Zealand's needs;
To advise Government on all matters concerning roading including the provision of finance;
To assist and advise local authorities on roading problems;
To undertake at intervals of not more than 5 years a comprehensive survey of the roading position in New Zealand.
The money in the National Roads Fund is derived from road taxation paid by the users, the private motorist and the commercial vehicle operator. Through the fund the money is returned to the road user in the form of safer, smoother, more economical travel. Under the legislation by which it was brought into operation on 1 April 1954, all taxation paid into it must be immediately available and be used for roading purposes. In effect the National Roads Act provided for an independent fund at the disposal of an independent board: nevertheless, opportunity is provided for Parliament to debate the board's activities.
The National Roads Board can be likened to a board of directors with the Minister of Works and Development as chairman and the Director of Roading as chief executive officer. The board meets regularly once a month. Most of the business is conducted in open meeting with representatives of the press in attendance.
No staff are employed directly, but the Ministry of Works and Development provides an engineering and administrative service for which it is paid 6.8 percent of total National Roads Board expenditure. The Roading Directorate of the Ministry of Works and Development carries out the executive functions of the board and in servicing the board calls on the specialist services of other divisions and branches of the Ministry of Works and Development as required, e.g., bridge design, land purchase, accounts, legal, etc.
For State highways and motorways, the board meets the full cost of construction and maintenance, while the maintenance and construction of county roads and municipal streets are subsidised by the board. Some 95 percent of the State highways are now sealed. The National Roads Board is the controlling authority for State highways. As the board's agent, the Ministry of Works and Development has responsibility for financial and technical control. In certain cases, the board has delegated its powers of construction and/or maintenance to local authorities.
In the case of county roads and municipal streets, responsibility lies with the local authority concerned. Apart from the question of standards on major works, there are no strings and no over-riding control by central government.
Under the National Roads Act, in December of each year the board is required to estimate its income for the following year and to make its primary allocations of funds expected to be available. The board then prepares a final programme of road works for the coming year. At the present time there are 2 sectors and funds are allocated on the following basis: for local authorities—not less than 39 percent of motor revenue; for State highways—not less than 47 percent of motor revenue: this leaves 14 percent of motor revenue for allocation to any or all of the above, at the discretion of the board.
For purposes of roading administration, New Zealand is divided geographically into 22 roads districts, and funds are allocated by the board to each sector in each district as fairly and equitably as possible having regard to particular needs.
In each roads district there is an advisory body known as a District Roads Council. These councils are representative of the same interests as the board itself. Although they have no executive powers, their recommendations concerning relative priorities have considerable influence on board decisions. In addition to its regular meetings the board makes visits of inspection to several roads districts each year.
These visits afford an opportunity for board members to get a better appreciation of local problems, needs, and conditions through observation and discussion, and to maintain personal contact with District Roads Councils. The board is thus able to keep in close touch with the reading problems of New Zealand, and is better able to discharge its responsibility of providing an adequate reading system balanced to meet the country's needs.
Finance—A National Roads Fund has been established within the Public Account, the revenue of the fund being derived mainly from motor taxation with an annual contribution from the Government. Expenditure from the fund is for the purpose of developing State highways to modern standards and of subsidising the roading programmes of local authorities.
Fuel tax equal to 6.4c per litre from all lightweight petrol, LPG, and CNG powered vehicles using public roads is paid into the National Roads Fund. All heavy motor vehicles, including trailers, and all remaining lightweight vehicles (mainly diesel powered), are required to purchase distance licences at a cost that varies according to their nominated maximum gross weight, their axle configuration, and the distance they travel. The income from these road user charges is all credited to the National Roads Fund.
Following is a statement of receipts and expenditure of the National Roads Fund for the latest 2 March years. Receipts are less collection expenses.
| Item | 1982–83 | 1983–84 |
|---|---|---|
| $(thousand) | ||
| Receipts— | ||
| Petrol tax (net) | 128,535 | 131,958 |
| Road user charges | 82,533 | 96,948 |
| CNG/LPG | 3,200 | |
| Fees and charges— | ||
| Contribution from Consolidated Account | 35,000 | 34,000 |
| Miscellaneous receipts— | ||
| Repayments of advances to local authorities | 254 | 261 |
| Rents | 2,708 | 1,312 |
| Sales of land and buildings | 1,688 | 1,413 |
| Interest on advances to local bodies | 16 | – |
| Heavy traffic fees and fines | – | 909 |
| Interest on investments | 179 | 222 |
| Miscellaneous | 965 | 2,204 |
| Total receipts | 251,878 | 272,427 |
| Item | 1982–83 | 1983–84 |
|---|---|---|
| $(thousand) | ||
| Expenditure— | ||
| Highways maintenance | 81,330 | 95,911 |
| Highways construction | 45,419 | 43,932 |
| Local authority roading subsidies and grants | 98,991 | 109,715 |
| Special purpose roads | 2,108 | 2,229 |
| Administration and general expenses— | ||
| Ministry of Works administration | 16,256 | 17,435 |
| Fees and travelling expenses | 124 | 137 |
| Miscellaneous expenses | 3,021 | 3,156 |
| Bridging expenses— | ||
| Bailey bridging, etc. | 236 | 457 |
| Unauthorised expenditure | 4 | 3 |
| Total expenditure | 247,489 | 272,975 |
| Balance in fund at end of year | 9,054 | 8,464 |
State Highways—The National Roads Act provides for the declaration of loads as State highways with the approval of the Minister of Works and Development. In 1969, the National Roads Board reviewed the State highway system and re-affirmed the principle that the network must continue to be based on the pattern of national development, needs of defence, and directness of route and main travel desire lines. The most important principles in designing a State highway system are that the total length of the system must be based on routes of primary importance; that routes must be equitably distributed in relation to the pattern of national development; and that routes must be confined to those which have characteristics in keeping with the function of the system.
Although urban development with its growing industrialisation is a predominant problem, the National Roads Board is also aware of the need for continued development of a fully effective inter-regional network with adequate rural feeder roads. Balanced development of the total network is essential if primary production is to increase and production costs are to be restrained.
In the following table are shown the amounts which have been expended on motorways and State highways construction, renewal, or maintenance during the last 5 years. Maintenance figures include the cost of flood damage restoration when applicable.
| Class of Expenditure | 1978–79 | 1979–80 | 1980–81 | 1981–82 | 1982—83 |
|---|---|---|---|---|---|
* Excludes motorway structures. †Totals may not add because of rounding. | |||||
| $(thousand) | |||||
| Construction and improvement | 34,783 | 27,805 | 29,812 | 33,852 | 32,610 |
| Bridges and other structures* | 6,525 | 7,828 | 10,670 | 11,567 | 11,322 |
| Maintenance, repairs, etc. | 43,656 | 50,867 | 68,082 | 81,330 | 95,910 |
| Total† | 84,964 | 86,500 | 108,564 | 126,749 | 139,843 |
Motorways—The Public Works Act makes provision for the declaration of motorways. Motorways provide efficient and economic means of communication, while the control of access and the total elimination of ribbon development will go far to improve road safety and prevent obsolescence.
The estimated total length of motorways in use at 31 March 1984 was 121.8 kilometres.
New Sealing—During the year ended 31 March 1983, 3.8 kilometres of new sealing on highways was completed, giving an aggregate of 10 943.6 kilometres of sealed highway, 94.6 percent of the total length.
Roading Standards—In order to qualify for roading subsidies local authorities are required to carry out works to a standard approved by the National Roads Board. Subsidies are not payable unless the approved standard is observed, although work of a higher standard may be undertaken provided that the additional expenditure involved is found by the local authorities concerned. From time to time the board's standards are revised to meet the latest developments in highway practice and engineering design and. also to cater for the requirements of increasing traffic. The National Roads Board also produces complementary guides to good practice, and standard specifications for roading materials and construction methods.
Local Authority Roading—The National Roads Board pays a basic subsidy at the rate of $1.50 for each $2 that is spent by local authorities out of their own funds on such programmes of subsidised works as have been accepted for a financial year by the board, and approves grants in special cases.
In recognition of the urgency and importance of the country's bridge renewal problem, the board makes generous grants for local authority bridge replacements. Wooden bridges built 50 and 60 years ago, which have served the country well, continue to deteriorate at a greater rate than replacements can be built. In 15 years to March 1983 there were 2989 bridges completed, totalling 70 000 metres.
For the year ended 31 March 1983, $109,552,400 was paid to local authorities from the National Roads Fund for roading.
Loan Assistance—To assist counties and municipalities with their planning the National Roads Board meets 30 percent of the cost of approved transportation surveys in urban areas. Plans have been completed or are in the course of preparation in all city areas with a population in excess of 30 000 people.
Needs studies have been made for county and municipal roading and the board has carried out regional surveys to assess relative needs.
It is envisaged that more comprehensive and co-ordinated surveys will become necessary as development increases in complexity, and that the board's criteria will need to extend further into the field of productive economics.
Development Roading—In addition to the expenditure on roading from the National Roads Fund, money is provided annually by the Consolidated Account (Programme: Developmental Roading) for development of road construction. Under this heading subsidies are paid to local authorities for the construction of new roads giving access to farmlands being brought into production. This programme also finances access roads to lands being prepared for farm settlement by the Lands and Survey and Maori Affairs Departments, as well as certain new roading of a national development character and the upgrading of existing roads to meet the requirements of major industries, e.g. forestry, tourism, or energy.
New roads constructed for farm access are handed over to the care of local authorities, while national roading normally becomes the responsibility of the National Roads Board for maintenance as part of the State highway system.
Government roading expenditure from the Consolidated Account (Programme: Developmental Roading) for the year ended 31 March 1983 was $7,528,700.
National Roading Expenditure—Details of New Zealand public roading expenditure financed from the National Roads Fund, the Consolidated Account, and local authority funds (both from revenue and loans) are summarised as follows:
| Item | 1981–82 | 1982–83 | ||
|---|---|---|---|---|
| $(thousand) | ||||
| State highways expenditure | 126,748 | 139,843 | ||
| Special purpose roads | 2,108 | 2,229 | ||
| Local Authority roading expenditure— | ||||
| From local authority funds | 120,026 | 144,942 | ||
| From National Roads Fund | 98,991 | 109,552 | ||
| From Consolidated Account (Developmental Roading) | 6,576 | 7,528 | ||
| 225,593 | 262,022 | |||
| Total | 354,449 | 404,094 | ||
NOTE—Table above includes subsidies paid under section 12A of the National Roads Act to the Auckland Harbour Bridge Authority ($1,000,000).
Roading expenditure over the last 5 years is related to Gross National Product in the following table.
| Year Ended 31 March | Roading Expenditure: Central and Local Gov't. | Gross National Product | Roading Expenditure as Percentage of G.N.P. |
|---|---|---|---|
| * Provisional. | |||
| $(million) | percent | ||
| 1979 | 244.55 | 17,090x | 1.43 |
| 1980 | 251.54 | 20,632x | 1.22x |
| 1981 | 326.46 | 23,829x | 1.37x |
| 1982 | 374.09 | 28,488x | 1.31x |
| 1983 | 425.33 | 31,235* | 1.36 |
REGISTRATION AND LICENSING OF MOTOR VEHICLES—The amounts for initial registration fees are: motorcars, from $39 to $193 according to age or engine capacity; motor cycles over 60cc, trailers, and traction engines, $39; mopeds and other motorcycles, $23; heavy trucks, $193; light trucks and vans, $116; tractors, $8; and any other motor vehicle, $77.
Annual licence fees are as follows: motor vehicles $39 (except veteran or vintage motor vehicles, for which there are special rates); trailers (2 tons or less loaded), $23; motor cycles (over 60cc), $23; power cycles and mopeds, $15; tractors, $31; trade licences for motor cycles are $23, and trade licences for other motor vehicles $39. Other fees include drivers' licences, $2.50 and changes of ownership, $19.
All such fees, except those for drivers' licences which are payable to the local authorities, have been credited to the Consolidated Account since 1 July 1967. Additional to these fees are the Accident Compensation levies ($14.20 for cars and motor cycles) which replaced compulsory third-party insurance. The various types of motor vehicles licensed as at 31 March in each of the last 5 years are itemised below.
| Type of Vehicle | 1979 | 1980 | 1981 | 1982 | 1983 |
|---|---|---|---|---|---|
| * Class 3 vehicles under these headings are now listed on their own under Miscellaneous. | |||||
| Cars | 1,244,751 | 1,283,661 | 1,319,305 | 1,360,477 | 1,394,109 |
| Rental cars | 5,484 | 5,945 | 6,127 | 6,247 | 7,133 |
| Private taxicabs | 114 | 119 | 174 | 265 | 223 |
| Light goods service vehicles (i.e., gross laden weight 2 tonnes and under) | 173,468 | 176,692 | 186,827 | 200,342 | 207,199 |
| Heavy goods service vehicles (i.e., gross laden weight over 2 tonnes) | 74,424 | 76,872 | 77,721 | 80,893 | 80,829 |
| Contract vehicles | 1,268 | 1,396 | 1,282 | 1,331 | 874 |
| Omnibuses | 2,659 | 2,556 | 2,575 | 2,452 | 2,730 |
| Public taxicabs | 2,951 | 3,015 | 2,996 | 2,852 | 2,669 |
| Service coaches | 757 | 841 | 953 | 973 | 1,050 |
| Motor cycles | 104,570 | 123,071 | 136,722 | 144,327 | 143,894 |
| Power cycles | 1,890 | 2,001 | 1,748 | 1,591 | 1,479 |
| Total, motor vehicles | 1 612 336 | 1 676 169 | 1 736 430 | 1 801 750 | 1 842 189 |
| Trailers, including trailers exempted from payment of annual licence fees and caravans* | 367,335 | 374,490 | 379,525 | 390,052 | 386,510 |
| Dealers' cars | 3,716 | 4,513 | 4,361 | 4,623 | 4,848 |
| Dealers' motor cycles | 302 | 294 | 341 | 335 | 294 |
| Vehicles including cycles exempted from payment of annual licence fees (farm tractors etc.)* | 89,104 | 90,345 | 89,435 | 88,743 | 80,193 |
| Miscellaneous | 12,376 | 11,705 | 10,898 | 11,384 | 11,352 |
| Total, all vehicles | 2 085 169 | 2 157 516 | 2 220 990 | 2 296 887 | 2 325 386 |
Registrations of new vehicles and those vehicles previously registered only in another country are as follows for the 4 latest years.
| December Year | New Cars and Station Wagons—c.c. Rating | Cars Previously Registered Overseas* | New Motor Cycles | ||||||
|---|---|---|---|---|---|---|---|---|---|
| 850 and Under | 851 to 1300 | 1301 to 1600 | 1601 to 2000 | 2001 to 5000 | 5001 and Over | Total | |||
| * Included in previous column. | |||||||||
| 1980 | 25 | 29,434 | 16,988 | 24,363 | 7,170 | 391 | 78,371 | 2,701 | 29,957 |
| 1981 | 896 | 29,982 | 22,804 | 31,719 | 5,780 | 192 | 91,373 | 1,907 | 24,571 |
| 1982 | 742 | 25,825 | 24,038 | 29,286 | 5,387 | 201 | 85,479 | 1,812 | 22,306 |
| 1983 | 704 | 20,977 | 22,899 | 26,116 | 4,984 | 171 | 75,851 | 1,766 | 16,938 |
| December Year | New Commercial Vehicles By Gross Weight in Kilograms | Total Commercial Vehicles | |||||
|---|---|---|---|---|---|---|---|
| 2500 or Less | 2501 to 4500 | 4501 to 9000 | 9001 to 14 500 | 14 501 and Over | Omnibus and Service Coaches | ||
| 1980 | 16,462 | 1,716 | 823 | 859 | 934 | 237 | 21,031 |
| 1981 | 20,924 | 1,617 | 1,150 | 805 | 934 | 167 | 25,597 |
| 1982 | 25,485 | 1,950 | 1,310 | 904 | 876 | 187 | 30,712 |
| 1983 | 19,628 | 2,133 | 1,249 | 946 | 917 | 151 | 25,024 |
Not included in the previous tables are new tractors, of which 2600 were registered in 1980, 2747 in 1981, 2449 in 1982, and 2201 in 1983.
Motor vehicles exempted from the annual licence fee include a miscellaneous collection of machines such as farmers' motor vehicles used solely on the farm and only venturing on roads to proceed from one part of the farm to another, or from farm to garage for repair, etc., excavators, scoops, trench diggers, cranes, and logging trucks (used on private roads), etc.
The following table shows the changes in relationship between the number of licensed vehicles and population as at 31 March in the latest 6 years.
| As at 31 March | Number of Persons in Population per Car | Number of Persons in Population per Motor Vehicle* |
|---|---|---|
| * Excluding trailers and caravans. | ||
| 1978 | 2.6 | 1.9 |
| 1979 | 2.5 | 1.8 |
| 1980 | 2.4 | 1.8 |
| 1981 | 2.4 | 1.7 |
| 1982 | 2.3 | 1.7 |
| 1983 | 2.3 | 1.7 |
Motor spirit usage in New Zealand during the latest March years is shown in the following table by grade. The grades shown are regular (83 and 91 octane), premium (96 octane), and other, which may include some non-petroleum based racing fuels. The figures are based on returns made by oil companies to the Customs Department in connection with the assessment of motor spirit duty. However, they include motor spirit used for farming purposes and in industrial engines for which the purchaser can claim a rebate of duty.
| Year Ended March | Motor Spirits—Oil Company Deliveries* | |||
|---|---|---|---|---|
| Premium | Regular† | Others | Total | |
* Based on deliveries by oil companies to resellers, bulk sales, and use in own fleet. †In May 1983 the octane of regular petrol changed from 83 to 91. Figures from that date are for the new 91 octane regular. ‡1 April 1978 to 30 March 1979. | ||||
| litres (000) | ||||
| 1979† | 2,228,538 | 100,929 | 643 | 2,330,110 |
| 1980 | 2,121,857 | 79,657 | 726 | 2,202,241 |
| 1981 | 2,165,620 | 73,724 | 1,557 | 2 240 904x |
| 1982 | 2,216,324 | 52,723 | 516 | 2,269,563 |
| 1983 | 2,230,576 | 44,087 | 262 | 2,274,927 |
Diesel fuel is widely used by heavy trucks and buses, but actual figures of consumption by these vehicles are not available.
Road Transport—The Transport Act 1962 is the main legislation governing road transport and the road transport operations of the Ministry of Transport; attendant regulations set out the rules of the road, the requirements as to motor vehicle equipment, and the obligations of motor drivers and owners and pedestrians.
Transport Licensing—Major changes to the transport licensing system contained in the Transport Amendment Act (No. 2) 1983 were implemented on 1 June 1984.
The Act established a new system of transport licensing based on the suitability of the licensee to operate in the field rather than a demonstrated need for the licence to be issued (“qualitative” rather than “quantitative” licensing).
The new licences are unrestricted as to area. Applicants must meet criteria relating to the nature of the service and their professional competence, financial arrangements and good repute to obtain a licence. The new provisions apply to goods-service, passenger-service and harbour ferry-service licences, but exclude taxicab-service licences which continue under the present system. Some protection is provided for scheduled passenger-services and harbour ferry-services over specified routes. A further provision in the Act provides for the removal of area and commodity restrictions from existing goods-service licences from 1 November 1983.
The Transport Licensing Authorities and Regional Transport Licensing Authority will continue to hear licence applications. The Licensing Appeal Authority will determine appeals from decisions of Licensing Authorities, and the Charges Appeal Authority will determine appeals in relation to taxicab-service charges.
Maximum rates will no longer be set by the Secretary for Transport. However the Secretary for Transport is expected to issue suggested rates as a guideline only. Public bodies will continue to fix charges for their public passenger services.
A further major change relates to the 150 km rail limit. Prior to 1 November 1983 most goods could not be carried by road between places where a route was available which included at least 150 km of rail. The restriction did not apply to certain exempt goods such as livestock, fresh meat, and fresh fruit and vegetables, or where exemptions were granted by the Transport Licensing Authorities. The 150 km restriction also ceased to apply where use of the railway would increase the journey by more than one-third of the shortest road route available. However, since the Transport Amendment Act (No. 2) 1983 came into force on 1 November 1983, it is possible for goods-service operators to compete with rail (in cases where the rail restriction did apply) by payment of a long distance fee based on tonne-load capacity. The permit can be purchased for periods of from 24 hours to 1 year. The fee reduces in equal steps on 1 November 1984 and 1 November 1985, and is completely abolished from 1 November 1986. From this date there will be open competition between rail and road.
Transport to Work—The following table shows the principal means of transport to work used by the full-time usually-resident labour force in 1981. The figures in this table have been rounded, using simple random rounding to base three. Individual figures in this table will therefore not necessarily sum to give the stated totals.
Significant changes since previous censuses are the continued fall in the use of public transport, and the increase in the percentage of the labour force using bicycles. Ten years earlier, at the 1971 Census, 11.8 percent of the labour force were going to work by public bus and 2.3 percent by train. In 1981 the percentage travelling by bus had fallen to 7.2 and by train to 1.7. Bicycles were used by 3.8 percent of the work force in 1971 and by only 3.0 percent in 1976, but by 1981 the percentage of the work force using them had risen to 4.7 percent.
| Means of Transport | Occupational Grouping | Percentage of Full-time Workforce | |||||
|---|---|---|---|---|---|---|---|
| Professional, Technical, Administrative, Managerial, Clerical, and Related | Sales and Service Workers | Agricultural, Animal Husbandry, and Forestry Workers. Fishermen and Hunters | Production Workers and Related Workers, Transport Equipment Operators, and Labourers | Others* | 1976 | 1981 | |
* New workers seeking employment, workers reporting occupations unidentifiable or inadequately described, and workers not reporting any occupation. †Includes unemployed persons. ‡New Zealand residents aged 15 years and over occupied full-time in the labour-force. | |||||||
| Drive car, truck, or van | 237,537 | 124,599 | 28,245 | 226,605 | 7,647 | 48.3 | 46.9 |
| Passenger in car, truck, van, or firm's bus | 44,301 | 20,247 | 11,652 | 62,637 | 2,226 | 9.9 | 10.6 |
| Public bus | 46,029 | 16,908 | 951 | 30,552 | 1,740 | 9.0 | 7.2 |
| Train | 13,503 | 2,166 | 96 | 6,162 | 390 | 2.2 | 1.7 |
| Motor cycle or power cycle | 14,367 | 7,125 | 5,790 | 30,090 | 585 | 3.8 | 4.4 |
| Bicycle | 23,865 | 8,928 | 2,265 | 26,595 | 717 | 3.0 | 4.7 |
| Walk | 42,861 | 30,228 | 12,660 | 43,041 | 2,268 | 11.2 | 9.8 |
| Other means | 1,824 | 1,221 | 1,182 | 2,313 | 174 | 0.5 | 0.5 |
| Work at home | 11,289 | 14,688 | 78,006 | 12,435 | 2,787 | 8.8 | 8.9 |
| Not applicable or not specified† | 9,144 | 7,617 | 5,448 | 17,502 | 31,131 | 3.3 | 5.3 |
| Total‡ | 444 720 | 233 730 | 146 292 | 457 935 | 49 662 | 100.0 | 100.0 |
TRAFFIC ACCIDENTS ON ROADS—Motor-vehicle accidents involving death or personal injury are required by law to be reported to the Police. During the year ended 31 December 1982, there were 11 173 reported accidents resulting in 674 fatalities, and injuries to 16 068 other people.
Details of the nature of road accidents for the calendar year 1982, which have been compiled by the Ministry of Transport, are set out in the following table.
| Classification of Accidents | Fatal | Injury | Total |
|---|---|---|---|
| Overtaking | 34 | 280 | 314 |
| Head on (not overtaking) | 110 | 751 | 861 |
| Lost control or ran off road on straight | 73 | 985 | 1,058 |
| Lost control or ran off road while cornering | 165 | 1,821 | 1,986 |
| Collision with obstruction | 15 | 654 | 669 |
| Rear end | 15 | 532 | 547 |
| At intersections or driveways— | |||
| Vehicles moving in same direction, one turning | 13 | 878 | 891 |
| Vehicles crossing paths, not turning | 34 | 1,027 | 1,061 |
| Vehicles crossing paths, one turning | 15 | 780 | 795 |
| Vehicles merging | 5 | 174 | 179 |
| Vehicles moving in opposite directions, one turning right | 17 | 966 | 983 |
| Vehicles manoeuvring | 10 | 591 | 601 |
| Pedestrian crossing road | 72 | 924 | 996 |
| Pedestrian—other | 15 | 135 | 150 |
| Miscellaneous | 10 | 72 | 82 |
| Unknown | – | – | – |
| Total | 603 | 10 570 | 11 173 |
The ages of persons killed and injured in motor accidents is shown in the following table.
| Age Groups (Years) | Killed* | Injured | ||||
|---|---|---|---|---|---|---|
| 1980 | 1981 | 1982 | 1980 | 1981 | 1982 | |
| * Killed immediately or died within 30 days of accident. | ||||||
| Under 5 | 19 | 17 | 16 | 353 | 308 | 305 |
| 5–9 | 28 | 24 | 21 | 665 | 519 | 567 |
| 10–14 | 16 | 19 | 23 | 768 | 766 | 817 |
| 15–19 | 121 | 151 | 139 | 5,018 | 4,594 | 4,838 |
| 20–24 | 120 | 118 | 148 | 3,011 | 3,133 | 3,283 |
| 25–29 | 72 | 49 | 70 | 1,252 | 1,316 | 1,336 |
| 30–34 | 28 | 41 | 53 | 873 | 850 | 866 |
| 35–39 | 25 | 23 | 28 | 531 | 546 | 606 |
| 40–44 | 10 | 29 | 22 | 478 | 450 | 438 |
| 45–49 | 17 | 19 | 22 | 365 | 396 | 383 |
| 50–54 | 13 | 21 | 24 | 384 | 361 | 346 |
| 55–59 | 26 | 18 | 23 | 374 | 310 | 301 |
| 60–64 | 22 | 22 | 18 | 293 | 269 | 282 |
| 65–69 | 18 | 25 | 17 | 262 | 259 | 210 |
| 70 and over | 55 | 92 | 42 | 558 | 1,401 | 416 |
| Unknown age | 1 | 2 | 8 | 718 | 5 | 1,074 |
| Total | 596 | 670 | 674 | 15 903 | 15 483 | 16 068 |
A classification of road users killed and injured during December year 1982 is given in the following table.
| Type of Casualty | Killed | Injured | Total |
|---|---|---|---|
| Driver of— | |||
| Car | 222 | 4,782 | 5,004 |
| Rental car | 8 | 61 | 69 |
| Taxi | – | 33 | 33 |
| Van | 21 | 528 | 549 |
| Truck | 6 | 133 | 139 |
| Articulated truck | 1 | 19 | 20 |
| Bus | – | 7 | 7 |
| Other | – | – | – |
| Motor cyclist | 99 | 3,069 | 3,168 |
| Passenger | 178 | 4,884 | 5,062 |
| Pillion rider | 14 | 479 | 493 |
| Cyclist | 30 | 881 | 911 |
| Pedestrian | 89 | 1,125 | 1,214 |
| Other | 6 | 67 | 73 |
| Total | 674 | 16 068 | 16 742 |
Of particular concern is the number of school children and pre-school children killed or injured on the roads while cycling or on foot. During 1982, 5 child pedestrians under school age were killed. Among child pedestrians and cyclists of school age, 29 were killed in 1982 compared with 23 in 1981, and 708 were injured in 1982 compared with 637 during the previous year.
Total road traffic casualties and rates for the latest available years are shown in the following table.
| December Year | Persons Killed | Killed per 10 000 Vehicles on Road | Persons Injured | Injured per 10 000 Vehicles on Road | Casualties (Killed and Injured) per 10 000 Vehicles |
|---|---|---|---|---|---|
| 1978 | 654 | 3.90 | 15,178 | 90.6 | 94.5 |
| 1979 | 554 | 3.20 | 13,903 | 80.2 | 83.4 |
| 1980 | 596 | 3.33 | 15,957 | 89.2 | 92.5 |
| 1981 | 670 | 3.60 | 15,483 | 83.7 | 87.4 |
| 1982 | 674 | 3.58 | 16,068 | 83.4 | 88.9 |
NOTE: Figures after 1980 are no longer comparable with previous years as the school age prior to 1981 was 5 years and under 16 years. It is now 5 years and under 15 years.
The following table shows motor accident death and injury rates in 1980 for New Zealand in comparison with recent annual figures for Australia and Great Britain.
| Country | Persons Killed | Persons Injured | Killed per 10 000 Vehicles | Killed per 100 000 Population | Injured per 10 000 Vehicles | Injured per 100 000 Population |
|---|---|---|---|---|---|---|
| New Zealand | 596 | 15,903 | 3.3 | 18.8 | 88.9 | 502.6 |
| Australia | 3,705 | 96,962 | 5.2 | 26.0 | 135.1 | 681.0 |
| Great Britain | 6,831 | 342,964 | 3.8 | 12.6 | 188.4 | 631.6 |
ROAD SAFETY: Enforcement of Traffic and Other Laws—Traffic on roads in 5 cities and boroughs is controlled by local authorities. Elsewhere throughout the country it is controlled by the Ministry of Transport which is also responsible for traffic on motorways. In national emergencies or major disasters, all traffic control comes under the supervision of the Ministry of Transport.
In addition to regulation of traffic and standards of driving, traffic officers enforce the laws relating to heavy traffic, and the allowable weights of vehicles and loads on different classes of road. They also enforce the legislation concerning the licensing of road transport services.
Traffic officers are not part of the Police and do not engage in criminal investigations. They form, however, a uniformed and disciplined enforcement body and a close liaison is maintained with the Police. A traffic officer now has a wide range of tests available to him/her where he/she suspects that a driver is affected by alcohol or drugs or a combination of the two.
Those persons a traffic officer suspects are driving while under the influence of alcohol or who commit a driving offence may be required to give a breath screening test. If this proves to be positive the person may be required to give an evidential breath test. If this is positive, the person then has the option of either accepting the breath test reading or providing a blood sample for analysis.
Under legislation introduced on 1 December 1978 a person commits an offence and is liable for prosecution if either:
His/her breath-alcohol concentration as recorded on an evidential breath testing device exceeds 500 micrograms of alcohol per litre of breath; or
His/her blood-alcohol concentration exceeds 80 mg of alcohol per 100 ml of blood.
Wearing of seat belts is now compulsory for drivers and front-seat passengers in most classes of light vehicles registered after January 1955. As from 1 November 1979 all new cars registered must have seat belts fitted in the rear passenger seats and it is compulsory for rear-seat passengers to wear these. For all people 8 years old and over it is law that they wear seat belts where fitted. Children under 8 years old should be restrained in a proper child restraint, but this is not required by law.
From 1 December 1973 it has been compulsory for all motor cyclists and pillion riders to wear safety helmets at all speeds.
Offences—Penalties are awarded by Courts for driving and other offences under the Transport Act 1962 and attendant regulations. There is also a system in operation whereby points are automatically registered according to a fixed scale against persons convicted of driving offences.
The Secretary for Transport has authority to suspend drivers' licences for 6 months where 100 or more demerit points are received in less than 1 year, or for 3 months where this number of points are received within 2 years. Official warnings are issued and compulsory interviews take place before these levels are reached.
Breaches of certain laws are dealt with under an infringement system. A motorist is able to pay an infringement fee within a certain time and thus avoid court proceedings if he/she so desires.
Speed Limits—The maximum speed for highways generally is 80 kilometres an hour. However, lower limits are prescribed for certain vehicles, e.g., 70 kilometres an hour for heavy goods vehicles.
A general speed limit of 50 km/h is fixed in cities, boroughs, town districts, or other localities declared to be closely populated localities. Areas with a speed limit of 70 km/h may also be specified by the Minister of Transport; and limited speed zones may be established for which the maximum permitted speed may be either 80 km/h or 50 km/h depending on conditions and circumstances.
Inspection of Motor Vehicles—All vehicles using the roads must be inspected every 6 months to ensure that their mechanical and structural fitness is of a satisfactory standard. Most lightweight vehicles are required to have a warrant of fitness which can be issued at approved garages, or at testing stations operated by local authorities or the Ministry of Transport. All heavy vehicles, with minor exceptions, undergo a more exacting examination for a certificate of fitness, which, in respect of passenger service buses, has special regard for the safety and comfort of passengers. Taxicabs and rental vehicles also require a certificate of fitness.
The design and standard of construction of vehicles manufactured, assembled, or modified in New Zealand are also regulated to ensure safety.
Insurance—Under the Accident Compensation Act 1972 a motor vehicle scheme provides cover for everyone in respect of personal injury caused by motor accidents. There is a Motor Vehicle Fund financed by premiums paid with the annual licence fee. The legislation came into effect on 1 April 1974, replacing the compulsory third-party scheme previously operating.
Road Safety Education—Publicity directed towards road safety is carried out through the press, radio, and television and by means of posters, etc. Special road safety campaigns and traffic improvement courses are held from time to time.
The main emphasis in schools and teachers' colleges centres around integrating traffic education into the current social education programmes. Traffic Education Units are co-operatively planned and implemented by traffic instructors and teachers and are based on the special social and traffic needs of the students.
The New Zealand Defensive Driving Council provides a safety course for all licensed drivers.
Traffic safety advice is given to the Government by a permanent parliamentary select committee, by the Road Traffic Safety Research Council, and by a number of other bodies, including the 46 local road safety committees.
TRAFFIC OFFENCES—The following table shows the nature of offences reported during 3 years ended December. The table covers only offences reported by officers of the Ministry of Transport; in addition traffic prosecutions are taken by the police, particularly for serious offences, following accidents or other police investigations. Some city councils employ their own traffic control staff and total offences are therefore rather higher than shown.
| Type of Offence | 1980 | 1981 | 1982 |
|---|---|---|---|
| Accident-promoting offences— | |||
| Driving or attempting to drive under the influence of drink or drugs | 267 | 240 | 232 |
| Failing to surrender keys | 114 | 32 | 29 |
| Breath blood-alcohol offences | 6,325 | 7,974 | 9,157 |
| Evidential excess alcohol | 5,876 | 6,591 | 7,366 |
| Failure to fulfil duties after accident | 1,123 | 1,271 | 1,226 |
| Reckless driving | 335 | 380 | 363 |
| Driving in a dangerous manner | 1,551 | 1,707 | 1,750 |
| Driving at a dangerous speed | 894 | 987 | 923 |
| Driving without reasonable consideration | 938 | 654 | 561 |
| Careless use of a motor vehicle | 10,825 | 11,845 | 12,449 |
| Overtaking offences | 1,909 | 1,386 | 1,058 |
| Failure to keep to the left | 6,690 | 6,149 | 6,013 |
| Failure to yield right of way | 3,237 | 2,828 | 2,932 |
| Failure to stop in half clear road | 2,690 | 2,737 | 3,034 |
| Exceeding 50 km/h | 40,860 | 79,585 | 100,140 |
| Exceeding 70 km/h | 1,423 | 1,888 | 2,893 |
| Exceeding 80 km/h | 25,806 | 40,947 | 52,679 |
| Breaches of limited speed zone | 16 | 12 | 23 |
| Exceeding temporary speed limits | 1,018 | 1,878 | 2,075 |
| Exceeding by-law, etc. | 46 | 44 | 128 |
| Failure to stop at traffic lights | 7,623 | 7,310 | 7,856 |
| Failure to stop at compulsory stop sign | 8,983 | 11,836 | 13,433 |
| Failure to give way at give way sign | 1,530 | 1,480 | 1,554 |
| Failure to yield right of way at pedestrian crossing | 733 | 578 | 589 |
| Failure to stop/or give way for siren | 354 | 359 | 374 |
| Failure to comply with road signs | 3,181 | 3,631 | 4,934 |
| Failure to wear safety helmet | 2,116 | 2,261 | 2,517 |
| Provisional motor cyclist exceeding 50 km/h | 262 | 165 | 154 |
| Exceeding 70 km/h with trailer | 967 | 961 | 1,181 |
| Exceeding 70 km/h with heavy motor vehicle | 429 | 600 | 1,023 |
| Exceeding 80 km/h (omnibus) | 21 | 11 | 3 |
| Exceeding other limits | 257 | 147 | 45 |
| Defective brakes | 739 | 465 | 282 |
| Lighting offences | 13,863 | 8,514 | 7,597 |
| Failure to dip lights | 390 | 278 | 169 |
| Mechanically defective or unsafe vehicle | 15,458 | 11,088 | 10,493 |
| Trailer offences | 633 | 420 | 328 |
| Total (accident-promoting offences) | 169 482 | 219 239 | 257 563 |
| Type of Offence | 1980 | 1981 | 1982 |
|---|---|---|---|
| Non accident-promoting offences— | |||
| Failure to obey officer | 2,428 | 2,399 | 2,569 |
| Certificate of loading offences | 1,134 | 910 | 650 |
| Owner failing to supply information | 2,102 | 1,826 | 766 |
| Failure to pay parking infringement fee | 436 | 191 | 53 |
| Failure to pay overloading infringement fee | 169 | 279 | 394 |
| Failure to pay speeding infringement fee | 89 | 2,083 | 1,141 |
| Failure to pay instruction course fee | 7 | 3 | 6 |
| Exceeding certificate of loading | 267 | 291 | 207 |
| Non-attendance of witnesses | – | 3 | 5 |
| No distance licence carried | 2,257 | 1,956 | 1,735 |
| Hubodometer offences | 5,020 | 4,612 | 4,295 |
| Driving without a time licence | 242 | 200 | 150 |
| Exceeding maximum gross weight—distance—time | 5,105 | 4,758 | 4,611 |
| Display of road user licence offences | 118 | 66 | 37 |
| Altered or defaced road user licence | 1,131 | 1,316 | 947 |
| Driver's licence offences | 115,654 | 47,282 | 21,218 |
| Driving whilst disqualified | 2,058 | 2,755 | 3,413 |
| Probationary driver's offences | 1,391 | 940 | 761 |
| Vehicle licences and registration offences | 13,366 | 11,649 | 11,978 |
| Breaches of driver's hours regulations | 39 | 9 | 87 |
| Warrant of fitness offences | 50,294 | 45,331 | 52,563 |
| Other miscellaneous offences | 6,507 | 4,104 | 3,451 |
| Safety-belt offences | 11,512 | 15,041 | 17,402 |
| Noisy motor vehicles | 3,710 | 2,459 | 1,975 |
| Emitting excessive smoke | 251 | 232 | 200 |
| Loading offences | 2,266 | 2,039 | 2,230 |
| Other nuisances | 379 | 511 | 660 |
| Certificate of fitness offences | 2,255 | 1,808 | 1,713 |
| Stock offences | 68 | 28 | 46 |
| Other by-law offences | 219 | 271 | 977 |
| Unlicensed goods service | 366 | 465 | 428 |
| Breach of goods service licence | 1,073 | 393 | 684 |
| Exceeding rail restriction limit | 751 | 687 | 539 |
| Unlicensed passenger service | 46 | 11 | 12 |
| Breach of passenger service licence | 77 | 38 | 37 |
| Rental vehicle offences | 186 | 141 | 110 |
| Taxicab offences | 125 | 145 | 59 |
| No vehicle authority or not carried | 533 | 450 | 386 |
| Other transport licence offences | 982 | 826 | 583 |
| Failure to display carless day sticker | 674 | 66 | |
| Operating motor vehicle on chosen carless day | 1,685 | 106 | |
| Carless day offences tending to mislead | 87 | 8 | |
| Fuel sale restrictions | 34 | 4 | |
| Cycling offences | 3,121 | 3,018 | 2,831 |
| Pedestrian offences | 216 | 155 | 140 |
| Passenger offences | 399 | 338 | 268 |
| Horse traffic offences | 99 | 1 | 1 |
| Total (non accident-promoting offences) | 240 928 | 162 204 | 142 318 |
| Parking offences | 126,202 | 112,485 | 150,549 |
| Total—all offences | 536 612 | 493 928 | 550 430 |
| Parking infringement—notices issued | 396,612 | 292,507 | 343,099 |
| Speeding infringement—notices issued | 63,083 | 28,969 | |
| Overloading infringement—notices issued | 9,037 | 10,174 | 11,911 |
URBAN PASSENGER SERVICES OPERATED BY LOCAL AUTHORITIES—The Urban Transport Act 1980 established the Urban Transport Council (UTC) and provided for the centralisation under this single agency of responsibility for the allocation of financial assistance from central government sources for urban transport. The UTC is also responsible for urban transport research, and advice to the Minister of Transport and local authorities on urban transport matters.
The UTC's detailed expenditure proposals are submitted to the Minister of Transport each October as a National Implementation Programme for the following financial year, with expenditure projections for the following 2 years. The National Implementation Programme comprises subsidies for approved urban transport expenditure by local authorities.
The National Implementation Programme for the 1983/84 financial year provided for the expenditure of $64.54 million. Of this total, $5.03 million was designated for residual parts of the Bus Replacement Programme, which was initiated prior to the establishment of the UTC.
FURTHER INFORMATION—Further information on roads and road transport will be found in the following publications:
Transport Statistics—Department of Statistics, Annual.
Road Transport Statistics—Department of Statistics Bulletin, Annual.
Monthly Abstract of Statistics—Department of Statistics.
Local Authority Statistics—Department of Statistics, Annual.
Report of the Ministry of Transport (Parl. paper F. 5).
Report of the National Roads Board (Parl. paper F. 8).
Roading Statistics—National Roads Board (Annual).
Urban Transport in New Zealand (Parl. paper F. 5B, 1977).
Breath Tests in New Zealand—Ministry of Transport, Annual.
Motor Accidents in New Zealand—Ministry of Transport, Annual.
Traffic Research Reports—Ministry of Transport (Inquiries to M.O.T.).
Road Traffic Safety Research Council—Annual report and research projects.
Report of the Working Party on Road User Charges (Parl. paper F. 5B. 1979).
Report of the Urban Transport Council (Parl. paper F. 9).
Report of the New Zealand Police (Parl. paper G. 6).
Survey on Driving Practices and Opinions 1975—Department of Statistics Bulletin, 1979.
Report of the Road Safety Committee (Parl. paper 1. 1 7A).
Statistics of the Licensed Road Transport Industry—Ministry of Transport, Annual.
New Zealand ranks amongst the leading nations of the world in terms of air transport per head of population. Modern aircraft provide regular flights on a network of internal air services operated by the domestic division of Air New Zealand supplemented by private operators, while the international division of Air New Zealand competes with other international airlines and provides links with London, Los Angeles, and various nations in the Pacific and South-east Asian regions.
Early days of commercial aviation in New Zealand, and the growth and development of the international service, are described briefly in the 1976 and earlier Yearbooks.
AIR TRANSPORT SERVICES—The state-owned airline, Air New Zealand (Domestic) and the wholly-owned subsidiary Safe Air Ltd., the air freight carrier, are the major domestic air service operators. Safe Air provides a passenger and freight service to the Chatham Islands. Mount Cook Airlines, a division of the Mount Cook Group Ltd., provides mainly tourist-orientated passenger services. There is also an increasing number of commuter operators providing regular services throughout the country. In addition, at most aerodromes there are light aircraft operators licensed for air charter and air taxi services. Aero clubs and flying schools provide facilities for training and private flying.
International air services are operated by Air New Zealand, together with QANTAS, Pan American World Airways, UTA French Airlines, Singapore Airlines, British Airways, Continental Airlines, Japan Airlines, Air Pacific, Polynesian Airlines and Air Nauru. Air Niugini has operated services to New Zealand from February 1984, replacing those operated by Cathay Pacific.
LEGISLATION—The principal legislation affecting civil aviation in New Zealand is the Civil Aviation Act 1964. This Act established the Department of Civil Aviation which later, under the Ministry of Transport Act 1968, became a division of the Ministry of Transport.
Air Services Licensing—The Air Services Licensing Act 1983 came into effect on 1 December 1983, replacing the 1951 Act. It established a new Air Services Licensing Authority, a 3-person independent body, with the primary function of receiving and determining applications for air service licences. Under the Act, an air service licence is essential for any air transport or aerial work service conducted for hire or reward. There is a right of appeal against the decisions of the Air Services Licensing Authority to the Administrative Division of the High Court. The new legislation implements qualitative licensing for all domestic air services and reflects the Government's desire to maximise efficiency by removing quantitative constraints upon competition.
International air services are governed by intergovernmental air transport agreements and the International Air Services Licensing Act 1947.
New Zealand is a party to the Warsaw Convention of 1929, as amended at The Hague in 1955, and these conventions define the financial liabilities of international air carriers towards their passengers. New Zealand has signed but has yet to ratify the Guatemala City Protocol which, although not in force, raises the limits of liability from $15,000 to $100,000. Air New Zealand is also a party to the airline agreement known as the Montreal Agreement, which for travel to and from the United States of America imposes a limit of US$75,000. This limit is now being extended world-wide in its application, pending the entry into force of the Guatemala City Protocol. Liabilities of domestic air carriers are governed by the Carriage by Air Act 1967 and the Carriage of Goods Act 1979.
The Airport Authorities Act 1966 empowers local authorities, with the consent of the Governor-General in Council, to establish, improve, operate, or manage airports. In pursuit of these objectives, local authorities have entered into 24 separate joint-venture agreements with the Crown.
In June 1983 the Ministry of Transport released a discussion document entitled A Review of the Financing of Airport and Airways Facilities in New Zealand. It presented options for the future funding of these facilities and sought comment. Ninety-four submissions were received, and recommendations will be formulated for consideration by Government.
The Aviation Crimes Act 1972, which came into full force in March 1974, gave effect to the Tokyo Convention 1963 relating to offences committed on board aircraft, the Hague Convention 1970 relating to hijacking, and the Montreal Convention 1971 relating to aerial sabotage.
In 1976 an amendment to the Civil Aviation Act 1964 established the Aviation Security Service as a branch of the Civil Aviation Division of the Ministry of Transport. The Aviation Security Service was charged with the screening of passengers and baggage and, where necessary, the searching of passengers, baggage, cargo, aircraft, aerodromes, and navigational installations. It was also to carry out security patrols, and in general, review, investigate, and inquire into security techniques, systems, devices, etc., co-operating where necessary with the Police, airport officials, Government departments, and other responsible authorities.
The Civil Aviation Amendment Act 1982 revoked the International Air Tariff Regulations 1978, and provided for the issue of specific tariffs and commission regimes by the Minister of Civil Aviation and Meteorological Services by notice in the Gazette, and for the issue of fare pricing rules and general tariff conditions by the Governor-General by Order in Council. It is an offence to advertise, arrange, provide or sell international carriage by air otherwise than in accordance with a relevant tariff. Provision is made for the inspection of travel records by the Secretary for Transport.
AIR NAVIGATION SERVICES AND FACILITIES—The Civil Aviation Division of the Ministry of Transport is responsible for the provision of all civil aviation air navigation facilities in New Zealand and at Rarotonga, Cook Islands.
Air navigation facilities include electronic aids such as non-directional medium frequency beacons (NDB), very high-frequency omni-directional radio ranges (VOR), instrument landing systems (ILS), surveillance radar equipment (SRE), distance measuring equipment (DME), and also visual aids such as visual approach slope indicator systems (VASIS).
To promote the safe, orderly, and expeditious flow of air traffic the Civil Aviation Division has an extensive ground services organisation comprising air traffic services, aeronautical communication services, airport rescue fire services, and aviation security services. The Ground Services Branch also plays a major role in the search and rescue and aerodrome emergency organisations. Elements of the Ground Services Branch are located at all aerodromes served by Air New Zealand's scheduled air transport services in New Zealand. In addition to control towers and flight service stations at aerodromes, area control and flight information centres are established at Auckland, Wellington, and Christchurch airports and provide services to en route aircraft throughout the country. Rescue co-ordination centres are established at Auckland, Wellington, and Christchurch and are responsible for co-ordinating search and rescue operations in their respective regions.
The Flight Standards Branch is responsible for airworthiness, flight supervision and standards and is also responsible for the licensing of all categories of aircrew and aircraft ground personnel. A calibration flight with specially equipped aircraft is continuously engaged on the checking and calibration of all air navigation facilities.
An Aeronautical Information Service Section prepares and publishes a New Zealand aeronautical information publication, notices to personnel, and information circulars, and collaborates with the Lands and Survey Department in the production of aeronautical maps and charts.
An aeronautical training college is established at Christchurch International Airport and regular courses are conducted in air traffic services, meteorology, telecommunications engineering, aeronautical communications, and rescue fire procedures.
AIR NEW ZEALAND: Domestic Air Services—Air New Zealand provides regular services to centres throughout the North and South Islands with a fleet consisting at 31 March 1983 of 10 Boeing 737s and 15 Fokker Friendships.
Statistics of the operations for the domestic services of Air New Zealand in the years ended 31 March 1981, 1982, and 1983 are shown in the following table.
| Item | Year Ended March | Percentage Change | ||
|---|---|---|---|---|
| 1981 | 1982 | 1983 | 1982–83 | |
| Revenue passengers carried | 2,241,365 | 2,118,768 | 2,029,920 | −4.2 |
| Passenger kilometres created | 1,604,000 | 1,555,000 | 1,527,000 | −1.8 |
| Revenue passenger kilometres | 1,086,000 | 1,048,000 | 1,013,000 | −3.3 |
| Revenue passenger load factor (%) | 67.7 | 67.4 | 66.3 | −1,6 |
| Revenue tonne-kilometres created (000) | 187,000 | 186,000 | 180,000 | −3.2 |
| Overall tonne-kilometres used (000) | ||||
| Passenger and baggage | 124 000 | 120 000 | 114 000 | −5.0 |
| Freight | ||||
| Overall revenue load factor (%) | 66.5 | 64.6 | 63.3 | −2.0 |
| Source: Air New Zealand Annual Report 1983. | ||||
AIR NEW ZEALAND: International Air Services—In the international field Air New Zealand provides services to Sydney, Brisbane, Melbourne, Hobart, Perth, Norfolk Island, New Caledonia, Tahiti, Cook Islands, Western Samoa, Fiji, Tonga, Hong Kong, Singapore, Japan, Honolulu, Los Angeles and London. Its international fleet comprises 2 Douglas DC 10–30s, 1 Douglas DC 8–52F, and 5 Boeing 747–200s, while Boeing 737200s are used on short-haul Pacific operations. The 2 DC 10s are currently on lease to Lan Chile.
Some data on Air New Zealand's international operations during the latest available 3 years are shown in the following table.
| Item | Year Ended March | ||
|---|---|---|---|
| 1981 | 1982 | 1983 | |
| Passengers carried | 1,047,402 | 991,766 | 944,905 |
| Passenger kilometres flown (million) | 4,531 | 4,506 | 5,043 |
| Seat kilometres available (million) | 6,625 | 7,387 | 8,105 |
| Revenue passenger load factor (percent) | 68.4 | 61 | 62.2 |
| Cargo and airmail tonne-kilometres (million) | 168 | 185 | 217 |
| Total revenue tonne-kilometres (million) | 598 | 613 | 696 |
| Total revenue load factor (percent) | 68.0 | 62.3 | 63.5 |
The following statement shows Air New Zealand's revenue and expenditure for both domestic and international operations during the year ended 31 March 1983.
| Item | Domestic Operations | International Operations | Total |
|---|---|---|---|
| * Includes aircraft lease rentals, depreciation and amortisation, interest charges, and exchange losses. | |||
| $(thousand) | |||
| Revenue— | |||
| Traffic revenue | 215,400 | 462,566 | 677,966 |
| Charter revenue | 334 | 8,181 | 8,515 |
| Contract revenue | 20,659 | 39,873 | 60,532 |
| Other revenue | 1,878 | 21,070 | 22,948 |
| Total revenue | 238 271 | 531 690 | 769 961 |
| Expenditure— | |||
| Flying operations | 73,064 | 179,736 | 252,800 |
| Engineering maintenance | 36,084 | 43,673 | 79,757 |
| Aircraft and traffic servicing | 62,356 | 65,182 | 127,538 |
| Passenger services | 6,099 | 62,026 | 68,125 |
| Sales and marketing | 20,745 | 105,600 | 126,345 |
| Administration and general | 18,937 | 33,317 | 52,254 |
| Other* | 12,368 | 83,504 | 95,872 |
| Total expenditure | 229,653 | 573,038 | 802,691 |
| Profit or Loss from year's operations before extraordinary items and tax credits | 8,618 | −41 348 | −32 730 |
| Source: Air New Zealand Annual Report 1983. | |||
SUMMARY OF OPERATIONS: Domestic—The following table gives the summarised result of the operations of all scheduled domestic air services during recent years.
| December Year | Kilometres Flown | Passengers Carried | Passenger-kilometres | Freight Carried (Tonnes) | Freight (Tonne-kilometres) | Mail (Tonne-kilometres) |
|---|---|---|---|---|---|---|
| Thousand | ||||||
| 1978 | 28,212 | 2,520 | 1,179,105 | 61.0 | 28,047 | 1,496 |
| 1979 | 27,282 | 2,628 | 1,234,457 | 47.5 | 31,558 | 1,624 |
| 1980 | 26,105 | 2,478 | 1,171,884 | 49.1 | 36,603 | 1,668 |
| 1981 | 25,608 | 2,356 | 1,134,238 | 44.9 | 25,198 | 1,378 |
| 1982 | 26,362 | 2,248 | 1,084,899 | 38.6 | 22,462 | 1,397 |
International—The following table shows passengers, freight (including excess baggage), and mail carried by international scheduled air services on scheduled routes.
| December Year | Passengers Carried | Freight Carried | Mail Carried |
|---|---|---|---|
| (000) | tonnes | tonnes | |
| 1978 | 1,400 | 49,210 | 2,361 |
| 1979 | 1,690 | 57,725 | 2,677 |
| 1980 | 1,814 | 62,267 | 2,890 |
| 1981 | 1,773 | 63,567 | 3,017 |
| 1982 | 1,664 | 70,485 | 3,099 |
INTERNATIONAL AIR SERVICES—Air New Zealand's international services have already been described. Other services through New Zealand include: Pan American World Airways—from the United States through Honolulu, to Auckland and beyond to Sydney; British Airways—from the United Kingdom via Melbourne to Auckland; Union de Transport Aeriens—from Tahiti to Auckland and beyond to Noumea; QANTAS—a full range of trans-Tasman services; Singapore Airlines—direct from Singapore; Polynesian Airlines—from Apia via Tonga to Auckland; Continental Airlines—from the United States via Honolulu to New Zealand and beyond to Sydney; Air Nauru from Nauru to Auckland; Japan Air Lines from Tokyo to Auckland via Nadi; and Air Niugini from Hong Kong to Auckland via Port Moresby.
A minority financial interest is retained by Air New Zealand in the regional South Pacific operators: Polynesian Airlines Ltd. (PAL) and Air Pacific Ltd. Cook Islands Airways is a subsidiary company of Air New Zealand.
International scheduled air services are shown by sector groupings in the following table, which shows figures for the latest available December years.
| Sector and Traffic | 1980 | 1981 | 1982 | |||
|---|---|---|---|---|---|---|
| In | Out | In | Out | In | Out | |
* Auckland, Wellington, or Christchurch to Melbourne or Brisbane (and vice versa), Wellington or Christchurch to Sydney (and vice versa); Christchurch to Hobart (and vice versa); and Auckland to Perth (and vice versa). †Other Pacific short-haul sectors are Auckland to Noumea, Norfolk Island, Tonga, Suva, Papeete, Pago Pago, Rarotonga, or Apia (and vice versa). ‡Long-haul sectors are Auckland to Honolulu, Singapore, San Francisco, Los Angeles, Hong Kong (and vice versa). | ||||||
| Trans-Tasman— | ||||||
| Auckland-Sydney-Auckland— | ||||||
| Flights | 1,110 | 1,134 | 1,019 | 1,082 | 1,122 | 1,084 |
| Passengers | 224,847 | 229,924 | 200,871 | 207,092 | 196,562 | 190,209 |
| Freight and mail (tonnes) | 9,463 | 10,438 | 9,661 | 10,584 | 9,269 | 12,863 |
| Kilometres flown (000) | 2,395 | 2,447 | 2,199 | 2,335 | 2,421 | 2,339 |
| Other trans-Tasman*— | ||||||
| Flights | 2,192 | 2,201 | 2,132 | 2,136 | 1,729 | 1,699 |
| Passengers | 394,612 | 415,918 | 393,240 | 408,271 | 353,142 | 368,724 |
| Freight and mail (tonnes) | 8,129 | 12,296 | 8,642 | 13,587 | 9,414 | 14,789 |
| Kilometres flown (000) | 5,223 | 5,229 | 5,040 | 5,051 | 4,283 | 4,205 |
| Pacific short-haul— | ||||||
| New Zealand–Nadi–New Zealand— | ||||||
| Flights | 661 | 660 | 637 | 634 | 600 | 598 |
| Passengers | 64,007 | 63,866 | 59,588 | 61,746 | 61,204 | 64,989 |
| Freight and mail (tonnes) | 1,490 | 2,721 | 1,493 | 2,495 | 1,692 | 2,698 |
| Kilometres flown (000) | 1,425 | 1,419 | 1,373 | 1,367 | 1,294 | 1,289 |
| Other sectors†— | ||||||
| Flights | 1,347 | 1,348 | 1,103 | 1,105 | 941 | 974 |
| Passengers | 109,746 | 109,348 | 81,680 | 81,149 | 67,001 | 63,041 |
| Freight and mail (tonnes) | 2,276 | 7,430 | 1,815 | 4,440 | 1,613 | 3,116 |
| Kilometres flown (000) | 2,985 | 2,985 | 2,151 | 2,161 | 1,636 | 1,728 |
| Long-haul‡— | ||||||
| Flights | 1,033 | 1,015 | 1,073 | 1,009 | 1,033 | 1,071 |
| Passengers | 168,626 | 152,125 | 177,313 | 161,451 | 183,302 | 167,298 |
| Freight and mail (tonnes) | 4,524 | 8,777 | 6,019 | 10,447 | 6,677 | 13,321 |
| Kilometres flown (000) | 8,268 | 7,747 | 8,523 | 7,634 | 7,209 | 7,480 |
Traffic on international scheduled services is shown by airport in New Zealand in the following table. Passengers and freight in transit are excluded.
| Airport and Type of Traffic | 1980 | 1981 | 1982 | |||
|---|---|---|---|---|---|---|
| Into New Zealand | Out of New Zealand | Into New Zealand | Out of New Zealand | Into New Zealand | Out of New Zealand | |
| Auckland International Airport— | ||||||
| Passengers | 713,164 | 708,861 | 668,234 | 664,000 | 654,093 | 632,589 |
| Freight (tonnes) | 20,421 | 34,772 | 21,779 | 33,396 | 22,602 | 37,323 |
| Mail (tonnes) | 1,607 | 924 | 1,634 | 995 | 1,796 | 993 |
| Wellington— | ||||||
| Passengers | 87,615 | 84,846 | 84,317 | 85,248 | 70,392 | 71,780 |
| Freight (tonnes) | 1,141 | 1,353 | 1,588 | 2,324 | 2,006 | 3,086 |
| Mail (tonnes) | 153 | 81 | 165 | 83 | 115 | 76 |
| Christchurch International Airport— | ||||||
| Passengers | 161,059 | 177,474 | 160,141 | 170,461 | 136,726 | 149,892 |
| Freight (tonnes) | 2,484 | 4,480 | 2,380 | 4,699 | 2,083 | 5,253 |
| Mail (tonnes) | 74 | 51 | 83 | 56 | 62 | 56 |
Distances from Auckland Airport overseas destinations are given below. These are airport-to-airport great circle distances.
| Destination | Distance |
|---|---|
| km | |
| Apia | 2,893 |
| Brisbane | 2,293 |
| Hong Kong | 9,145 |
| Honolulu | 7,086 |
| Los Angeles | 10,480 |
| Melbourne | 2,635 |
| Nadi | 2,156 |
| Norfolk Island | 1,091 |
| Noumea | 1,859 |
| Pago Pago | 2,902 |
| Papeete | 4,093 |
| Rarotonga | 3,013 |
| San Francisco | 10,503 |
| Singapore | 8,410 |
| Suva | 2,141 |
| Sydney | 2,158 |
| Tokyo | 8,837 |
| Tonga | 2,004 |
Distances to the Australian cities from the airports at Wellington and Christchurch differ slightly from the Auckland figures given above: Wellington-Sydney is 2235 km; Wellington-Melbourne, 2589 km; and Wellington-Brisbane, 2508 km; Christchurch-Sydney is 2124 km; Christchurch-Melbourne, 2413 km; Christchurch-Brisbane, 2495 km; and Christchurch-Hobart is 2024 km.
AIR FREIGHT—Air freight involves mostly exports and imports to and from Australia and U.S.A. Exports are mainly made-up textiles, meat, fish and live animals, notably racehorses. Air-freighted imports consist mainly of machinery, scientific instruments, pharmaceutical products, and textiles.
The following tables summarise the value of exports and imports transported by air during the 1983 calender year according to commodity category in the Standard International Trade Classification, and by countries.
| OVERSEAS CARGO TRANSPORTED BY AIR* | ||||
|---|---|---|---|---|
| Commodity | Loaded | Unloaded | ||
| Gross tonnes | f.o.b. | Cross tonnes | f.o.b. | |
* Year ended December 1983. †Not elsewhere specified. | ||||
| $(000) | $(000) | |||
| Food and live animals | 25,032 | 147,300 | 2,169 | 35,727 |
| Beverages and tobacco | 117 | 402 | 163 | 440 |
| Crude materials | 967 | 26,839 | 245 | 6,024 |
| Mineral fuels | 16 | 45 | 11 | 131 |
| Animal and vegetables oils, fats | 5 | 29 | 6 | 233 |
| Chemicals and related products n.e.s.† | 3,078 | 37,037 | 2,419 | 105,704 |
| Manufactured goods | 9,116 | 110,385 | 6,661 | 138,580 |
| Machinery and transport | 5,496 | 272,728 | 8,756 | 530,796 |
| Miscellaneous manufactured articles | 9,085 | 180,891 | 5,163 | 264,070 |
| Commodities n.e.s.† | 27 | 5,713 | 116 | 44,421 |
| Total | 52 939 | 781,369 | 25 710 | 1,126,125 |
| Country of Destination* | Loaded | Unloaded | ||
|---|---|---|---|---|
| Gross tonnes | f.o.b. | Gross tonnes | f.o.b. | |
* Year ended December 1983. †Includes other countries. | ||||
| $(000) | $(000) | |||
| Australia | 29,696 | 367,146 | 13,480 | 383,353 |
| Canada | 697 | 12,952 | 178 | 17,832 |
| Chile | 42 | 12,569 | 2 | 73 |
| Cook Islands | 461 | 9,763 | 803 | 5,001 |
| Fiji | 1,375 | 18,139 | 228 | 3,351 |
| United Kingdom | 931 | 24,731 | 1,883 | 126,240 |
| Hong Kong | 1,550 | 48,514 | 401 | 20,883 |
| Japan | 3,623 | 23,009 | 1,173 | 72,816 |
| Korea (Republic) | 361 | 7,028 | 33 | 1,330 |
| Malaysia | 342 | 9,645 | 18 | 1,522 |
| New Caledonia | 371 | 2,545 | 2 | 810 |
| Papua New Guinea | 261 | 7,952 | 13 | 1,199 |
| French Polynesia | 2,413 | 19,287 | 31 | 161 |
| Singapore | 1,453 | 21,004 | 268 | 15,112 |
| U.S.A. | 6,982 | 139,777 | 3,613 | 279,218 |
| Total† | 52 939 | 781,369 | 25 710 | 1,126,125 |
AERIAL WORK—Aerial topdressing as a means of improving hill pastures and checking and preventing soil erosion began commercially in 1949. The industry developed rapidly and is a major activity in spring and autumn. The extent of aerial topdressing in any particular year is largely a reflection of the level of farm incomes. Approximately 40 percent of the total fertiliser and lime applied to farms in New Zealand is spread by means of aircraft.
Aerial spraying (i.e. the release from the aircraft of agricultural chemicals in liquid form such as insecticides and weedicides) and aerial liquid topdressing have also been developed. The volume of this work is over 40 million litres a year, and more than 70 percent of aerial spraying is performed by helicopter.
A summary of aerial work operations follows.
| Aerial Work | Year Ended 31 December | ||||
|---|---|---|---|---|---|
| 1978 | 1979 | 1980 | 1981 | 1982 | |
| * March year. | |||||
| Hours flown | 153,507 | 140,750 | 144,048 | 128,406 | 114,775 |
| Number of operators | 101 | 107 | 107 | 64 | 75 |
| Material distributed— | |||||
| Fertiliser and lime (tonnes) | 1,213,387 | 1,226,201 | 1,205,309 | 1,034,067 | 879,150 |
| Seed (tonnes) | 2,302 | 4,176 | 2,189 | 4,386 | 2,763 |
| Spray (litres) | 53,026,645 | 52,130,143 | 49,284,639 | 41,292,887 | 38,823,173 |
| Animal poison (tonnes) | 6,542 | 6,474 | 4,537 | 6,025 | 2,696 |
| Supplies (tonnes) | 3,534 | 3,385 | 4,922 | 4,983 | 5,047 |
| Fencing (tonnes) | 1,481 | 2,049 | 2,701 | 5,180 | 3,550 |
| Dusts (tonnes) | 58 | 173 | 385 | 419 | 327 |
| Prills (tonnes) | 106 | 203 | 202 | 83 | 193 |
| Miscellaneous (tonnes) | 7,039 | 6,103 | 9,133 | 7,784 | 17,391 |
| Flight training (hours flown)* | 122,500 | 137,900 | 132,300 | 114,500 | 107,700 |
CIVIL AIRCRAFT ACCIDENTS—Civil aircraft accidents are investigated by the Office of Air Accidents Investigation, headed by the Chief Inspector of Air Accidents who has statutory powers in respect of investigative duties and responsibilities.
During the year ended December 1983, 130 aircraft accidents were reported in New Zealand. Eight fatal accidents claimed the lives of 7 crew members and 5 passengers. Twenty-one persons suffered serious injury, and the remaining 141 crew members and 301 passengers involved received minor or no injuries. Twenty-seven helicopter accidents included 6 aircraft engaged in agricultural aviation, 6 in venison recovery, 5 in other aerial work, 9 in private flights and 1 in a flying school.
FURTHER INFORMATION—Further information may be found in the following publications:
New Zealand Civil Aviation Statistics—Ministry of Transport, annual.
Report of the Ministry of Transport (Parl. paper F. 5).
Transport Statistics—Department of Statistics.
Air New Zealand Annual Report—Air New Zealand.
Monthly Abstract of Statistics—Department of Statistics.
New Zealand Civil Aircraft Accidents—Office of Aircraft Accident Investigation (Aircraft accident
reports, briefs, and summaries are also available on subscription from the Office of Air Accidents
Investigation, care of Ministry of Transport).
External Civil Aviation Policy of New Zealand—December 1979 (Parl. paper H. 30).
Domestic Air Services Policy of New Zealand—November 1982 (Parl. paper F. 10).
Following the arrival of Governor Hobson in 1840 the first post office was set up at Kororareka (now Russell). In the same year overland mail routes were begun, and offices were established in the north and at Port Nicholson (Wellington). In 1858 a Post Office Act was passed which made the Post Office an independent department of State. By this time 73 post offices had been opened to provide communication services for the settlers.
The system of communication by telegraph was inaugurated in the 1860s. A separate department, the Telegraph Department, was created by Act of Parliament in 1865 to take responsibility for the erecting of telegraph lines and opening of morse telegraph offices. The North and South Islands were linked by telegraph cable in 1866 and by telephone cable in 1926.
In 1881 the telegraph and postal services were amalgamated. Under the Post Office Act 1959, the name of the department became the Post Office, and the Minister's title became Postmaster-General.
At 31 March 1983 there were 1283 post offices in New Zealand. The following table shows the number of articles posted during the latest 4 years.
| Year Ended 31 March | Letters (Standard and Non-Standard) | Other Articles (Including Packets, Newspapers, etc.) | Parcels | Total |
|---|---|---|---|---|
| million | ||||
| 1980 | 541.2 | 102.7 | 10.4 | 654.3 |
| 1981 | 545.0 | 104.2 | 9.5 | 658.7 |
| 1982 | 529.8 | 120.5 | 9.9 | 660.2 |
| 1983 | 564.5 | 86.0 | 9.9 | 660.4 |
The average numbers of items posted in New Zealand per head of population during the year ended 31 March 1983 were: letters, 178.6; other articles (printed papers, commercial papers, newspapers, and magazines), 27.2; and parcels, 3.1.
Chartered air services are used to convey the bulk of surface mail between the North and South Islands.
Private boxes installed as at 30 September 1983 totalled 147 569.
Postal Delivery Service—There are just over 1400 postal deliveries throughout. New Zealand serving 940 000 delivery points (890 000 private houses and 50 000 business premises). Delivery is made once daily, Monday to Saturday. The majority (1100) of the deliveries are made by bicycle whilst the remainder, mainly in cities and larger towns, are by foot.
Rural Mail Delivery—In addition to the delivery and collection of mail, the rural mail delivery system enables country residents to obtain other Post Office services such as postal notes, money orders and stamps at or near their gates.
Deliveries are generally performed by contractors who handle the mail in conjunction with the carriage of goods, and thus the rural mail delivery is in many areas the medium by which country residents obtain their newspapers, bread, parcels, etc. At 31 March 1983 a total of 97 730 boxholders and bagholders received service in this way. The cost to the Post Office to provide the rural delivery service is approximately $12 million a year.
Inland Airmails—Particulars of letter class articles carried by air within New Zealand during the latest 4 years are shown below.
| Year Ended 31 March | Weight |
|---|---|
| kg | |
| 1980 | 1,030,404 |
| 1981 | 977,883 |
| 1982 | 1,157,383 |
| 1983 | 1,283,450 |
Overseas Airmails—The weight of airmail dispatched from New Zealand was about 44 percent of the total amount of mail forwarded overseas for 1982–83. In 1982–83, 497 898 kg of letters, 175 207 kg of newspapers and packets, and 321 125 kg of parcels were posted by overseas airmail.
Trans-Tasman Air Services—The first flight of the regular trans-Tasman service linking Auckland and Sydney took place on 30 April 1940, connection being made at Sydney with the Empire service to London. The existing service provides for flights between New Zealand (Auckland, Wellington, and Christchurch) and Australia (Sydney, Melbourne, Brisbane, Hobart, Adelaide and Perth).
New Zealand – United Kingdom Air Service—This service operates daily to London, the transit time New Zealand to the United Kingdom being normally 27 hours.
At London Airport, airmails for 15 European countries are transferred to the first available flights to destination and the majority normally arrive within 45 hours of departure from New Zealand.
New Zealand – Hong Kong, Japan, and Singapore Air Services—There are direct services from Auckland to Hong Kong via Port Moresby, Japan, and Singapore. Airmail to countries in the Far East is dispatched to Hong Kong, Singapore, or Sydney for reforwarding.
Trans-Pacific Services—The trans-Pacific service operating between New Zealand and North America commenced on 20 July 1940. Airlines now operate a daily service to the United States.
Pacific Island Services—Airmails are forwarded by various air services operating from Auckland to the Cook Islands, Fiji, French Polynesia, Hawaii, Nauru, New Caledonia, Niue, Norfolk Island, Solomon Islands, Tonga, and Western Samoa (Apia). Local air services provide connections from Apia or Noumea to American Samoa, Kiribati, Vanuatu, Niue, and the Solomon Islands. There is a weekly air service run by Air Nauru from Auckland.
Overseas Parcel Post—Particulars of overseas parcels received and dispatched in each of the latest 5 years are contained in the following table.
| Year Ended 31 March | Overseas Parcels Received | Overseas Parcels Dispatched | ||
|---|---|---|---|---|
| Number | Weight | Number | Weight | |
| kg | kg | |||
| 1979 | 553,708 | 2,038,083 | 354,651 | 1,188,069 |
| 1980 | 606,858 | 2,233,237 | 356,059 | 1,192,797 |
| 1981 | 625,334 | 2,288,711 | 346,123 | 1,156,051 |
| 1982 | 582,801 | 1,953,876 | 374,949 | 1,185,625 |
| 1983 | 498,535 | 1,695,018 | 344,490 | 1,102,367 |
Philatelic Services—The New Zealand Post Office Philatelic Bureau in Wanganui handles thousands of mail orders for stamps, and services a large number of customers' Standard Deposit and Standing Order accounts.
Philatelic Sales Centres are situated in Auckland, Wellington, Christchurch, Dunedin, Hamilton, Rotorua and Gisborne, as well as Auckland and Christchurch International Airport Post Offices.
| Year Ended 31 March | Deposit Accounts | Philatelic Revenue | Mailing List Subscribers | ||
|---|---|---|---|---|---|
| Inland | Overseas | Total | |||
| $ | |||||
| 1981 | 20,857 | 18,445 | 39,302 | 3,929,780 | 82,574 |
| 1982 | 22,645 | 19,356 | 42,001 | 5,694,127 | 96,143 |
| 1983 | 23,945 | 19,931 | 43,876 | 5,092,866 | 94,178 |
New Stamps—The following new stamps were released during 1983.
| Date | Issue | Denominations |
|---|---|---|
| 2 February | Commemorative | 24c, 30c, 35c, 40c, 45c. |
| 14 March | Commonwealth Day | 24c, 35c, 40c, 45c. |
| 6 April | Rita Angus Paintings | 24c, 30c, 35c, 45c. |
| 1 June | Scenic—Beautiful New Zealand | 30c, 40c, 45c, 70c. |
| 3 August | Health | 24c + 2c (×2), 30c + 2c. |
| 5 October | Christmas | 18c, 35c, 45c. |
| 7 December | Definitives—Fruit | 10c, 20c, 30c, 40c, 50c. |
Money Orders—Inland postal money orders for amounts exceeding $7 (for $7.00 and lesser amounts postal notes are generally used) and telegraphic money orders for any amount may be purchased to send money within New Zealand, the Cook Islands, and Niue. Postal money orders may also be issued in New Zealand for payment by many foreign administrations, and an overseas telegraphic money order service is available to Australia, Fiji, Great Britain and Northern Ireland, the Irish Republic, Norfolk Island, and Western Samoa. For remittances exceeding $4 to foreign countries a permit is required.
A special rate or commission applies to money order payable in foreign countries, except to the Cook Islands, Niue, and Western Samoa to which the inland rate applies. In addition to commission, telegraph fees are also payable for money-order telegrams.
Postal Notes—Postal Notes for 10c, 50c, $1, $2, $3, $4, and $5 are available for payment within New Zealand, Niue, and the Cook Islands.
Postal notes are negotiable, and their period of validity is unlimited. They are a popular medium for making small inland remittances by post. During the year ended 31 March 1983, 592 277 postal notes valued at $1,729,518 were purchased by the public.
British Postal Orders—British postal orders are both issued and paid in New Zealand. Denominations sold are 25p, 50p, 75p, £1, and £2 sterling. Commission is payable. For all remittances exceeding £2 per day a permit is required. As these orders are payable in several British Commonwealth countries they are a popular medium for making small postal remittances to overseas countries, especially the United Kingdom. During the year ended 31 March 1983 the Post Office sold 415 624 British postal orders valued at $1,986,886 and paid 88 126 orders valued at $1,226,193.
POST OFFICE SAVINGS BANK—Details on the Post Office Savings Bank are given in Section 30, Banking and Currency.
TELEPHONE SERVICES—The first telephone exchange was installed in 1881. The telephone system has since then been expanded to over 800 exchanges serving 1 192 809 subscribers at 31 March 1983.
Telephone exchanges are grouped into 223 toll-free-calling areas within which there is no charge for local calls. The long-term objective is to reduce the number of toll-free-calling areas to about 80. Toll fees are charged for calls between different toll-free-calling areas, at rates varying according to distance.
About one-fifth of the main telephones are business telephones. At 31 March 1983 there were 7130 applicants awaiting service.
According to the latest comparative data available (January 1982), compiled by the American Telephone and Telegraph Co., New Zealand ranks sixth in the number of telephones per 100 of population, the leading countries being Sweden (82.8 percent), U.S.A. (78.7 percent), Switzerland (74.9 percent), Denmark (68.0 percent), Canada (64.7 percent), and New Zealand (58.8 percent).
Subscriber Toll Dialling (STD) service is in operation in Auckland, Hamilton, Palmerston North, Rotorua, Tauranga, Wellington, Christchurch, and Dunedin, and in several smaller centres. It is being progressively extended as new telephone exchange equipment is brought into service. At 31 March 1983, STD service was available to 58.1 percent of subscribers.
A broadband toll link, comprising microwave, radio, and co-axial cable systems, connects main centres from Kaikohe to Invercargill.
The following table indicates the growth of telephone installations (the figures are as at 31 March).
| Item | 1979 | 1980 | 1981 | 1982 | 1983 |
|---|---|---|---|---|---|
* Amended figures as a consequence of a review of 1979–80 statistical records. †Included in main telephones. | |||||
| Main telephones— | |||||
| Automatic | 1 023 099* | 1,050,173 | 1,084,521 | 1,123,257 | 1,151,779 |
| Manual | 46 746* | 47,548 | 46,927 | 45,119 | 41,030 |
| Extension telephones | 602 089* | 627,176 | 663,075 | 702,262 | 741,762 |
| Public telephones | 5,165 | 5,019 | 5,005 | 4,900 | 4,917 |
| Private line telephones | 180 | 83 | † | † | † |
| Toll offices | † | † | † | † | † |
| Total telephones | 1 677 279* | 1 729 999 | 1 799 528 | 1 875 538 | 1 939 488 |
| Telephones (all types per 1000 population) | 533* | 549 | 569 | 592 | 600 |
| Applicants awaiting installations | 22,410 | 17,189 | 12,795 | 11,925 | 7,130 |
| Number of toll calls (inland and outward international) | 86,204,129 | 89,454,723 | 98,233,085 | 105,455,227 | 113,815,142 |
TELEGRAPH AND TELECOMMUNICATIONS SERVICES: Telegrams—In line with world experience there is a continuing downtrend in inland telegram traffic. In the year ended 31 March 1983, 2.0 million messages were lodged compared with 2.3 million in the preceding year. Of these, 63 percent were lodged by telephone, 17 percent by telex, and 20 percent handed in over Post Office counters. At the delivery end, 49 percent were delivered by messenger, 39 percent telephoned to the addressee, and 12 percent telexed.
The public telegraph network comprises 96 teleprinter offices which interwork through Gentex (automatic circuit switching).
Bureaufax Service—A Bureaufax service was introduced between Auckland and Wellington in 1980, and is now available in all chief post offices, Lower Hutt, Otahuhu, and the Wellington Postal Centre. This electronic document transfer service produces a facsimile of documents, including typewritten or handwritten manuscripts, charts and graphs. Documents are transmitted to both internal and overseas destinations, and use of the service is increasing steadily. The following table shows number and volume of messages handled for the year ended 31 March 1983.
| Messages | Pages | |
|---|---|---|
| Between New Zealand— | ||
| Bureaufax terminals and private equipment— | ||
| Inland | 884 | 3,439 |
| International | 4,259 | 35,079 |
| Between bureaufax terminals— | ||
| Inland | 11,327 | 45,781 |
| International | 3,416 | 18,005 |
| Total | 19 886 | 102 304 |
Telex Service—Telex service is a subscriber-to-subscriber teleprinter communication service, operated through a worldwide network of automatic telex exchanges.
A manual international telex service with 16 subscribers commenced in New Zealand in 1960. Automatic inland and international service was introduced in 1964. Demand for telex service has increased steadily and, as at 31 March 1983, there were 4756 subscribers in New Zealand.
Computer-controlled telex exchanges were introduced in Auckland in June 1980 and in Wellington in May 1981. In addition to meeting the demand for new connections, the new exchanges enabled a reduction in the inland call charge because of reduced operating costs and the introduction of several special services.
Data Communication Services:Datel—This service provides for data communication over the switched telephone network at speeds of up to 2400 bits per second (measure of information flow). Subscribers' privately-owned terminals are connected to telephone lines through Post Office modems which convert the data signals to a form suitable for transmission over telephone circuits. Datel calls are charged at the same rates as normal telephone calls.
Datex—Datex, a 300 bits per second data and text communication service, was introduced in November 1981.
Leased Data Circuits—A service was introduced in June 1981 providing for the direct connection of subscribers' data terminal equipment by means of leased data circuits operating at speeds of 300, 1200, 2400, 4800, and 9600 bits per second.
Subscribers may also lease full voice-grade circuits for the transmission of data if they wish.
Leased Circuit Service—In addition to circuits leased for data communication purposes, circuits are available for lease for private voice, teleprinter and facsimile communication networks and music distribution and fire alarm systems.
International Telecommunications:Cable Links—Telegraphic communication overseas was first established between New Zealand and Australia by means of the Eastern Extension Telegraph Company's cable from Wakapuaka (Nelson) to Sydney in 1876, and between Auckland and Canada via Norfolk Island, Suva and Fanning Island in 1902. In 1945, the Commonwealth's external telecommunications system was brought under Government control. In accordance with the Commonwealth Telegraphic Agreement 1948, the New Zealand Post Office purchased the New Zealand assets of Cable and Wireless Ltd. (the private company previously controlling these services), and took over the operation of the overseas cable services.
In July 1962, a submarine cable with a capacity of 80 telephone channels was brought into operation between New Zealand and Australia as part of a Commonwealth round-the-world cable project. The cable was extended from New Zealand to Fiji in December 1962, and in December 1963 was further extended, via Hawaii, to Canada. From Canada it links up with the trans-Atlantic telephone cables, to connect with Britain, and provide high-quality circuits for telephone, telegraph and telex communication between New Zealand, Australia, Fiji, Canada, the United States of America, Britain, and Europe. This cable system, known as the COMPAC cable links New Zealand with most of the world's major countries. COMPAC will reach the end of its design life during 1984. In March 1967 it was supplemented by the bringing into service of the South-East Asia Commonwealth Telephone Cable (SEACOM), which extended the system from Australia to Papua New Guinea, and (via Guam) to Malaysia, Hong Kong, and Singapore.
An additional high capacity trans-Tasman submarine cable, a joint New Zealand – Australia project was brought into service in early 1976. Known as TASMAN, this cable has a total capacity of 640 telephone circuits.
The new 15 000 km cable, called ANZCAN, will have 20 times the capacity of COMPAC and is planned to begin operation in 1984.
It will link New Zealand, Australia, Norfolk Island, Fiji, Hawaii, and Canada, and will be the largest single international submarine telecommunications cable project ever undertaken.
Satellite Communications—To keep abreast of the rapid increase in international telecommunication traffic, an earth station was opened in 1971 at Warkworth, near Auckland, for communicating with other countries via satellites in space. A second antennae is planned to be brought into service in 1984. This will allow Warkworth to communicate with the larger capacity satellite due to be positioned over the Pacific Ocean at that time.
In addition to providing additional international telecommunication facilities, the earth station is used for both “live” and recorded television relays. The earth station works through a satellite positioned over the Pacific Ocean.
High Frequency Radio Links—With the introduction of satellite communications, services provided by HF (high frequency) radio have progressively been converted to satellite operation. However, HF radio links are still maintained with Niue, Ross Dependency (Scott Base), Chatham Islands, Raoul and Campbell Islands.
International Telephone Service—Telephone communication by cable, satellite, and radio is now available to almost all countries of the world.
An International Gateway telephone exchange in Auckland handles all New Zealand's outgoing and incoming international telephone calls. International Subscriber Dialling (ISD) enabling New Zealand subscribers to dial overseas subscribers directly was introduced on 1 December 1979. The facility which is presently available to 58.1 percent of New Zealand subscribers is being progressively extended as is the number of countries to which the service is available.
International Data Service—Datel service (operated via the switched telephone network) is available to a number of countries. Operation at speeds of 2400 bits per second is permitted.
Overseas Access Service for Information Systems (Oasis)—OASIS is a 300 bits per second data communication service enabling subscribers in New Zealand to access computer data bases in overseas countries. Subscribers use a Datel installation (telephone and data modem) and a data terminal and overseas access is provided via dedicated international circuits.
OASIS was introduced in September 1979 to the United States and to Australia in December 1980.
International Telex Service—Since its inception in 1960 the international telex service has continued to grow steadily and at the present time is available with 183 countries. An important development in New Zealand's international telex service was the introduction in July 1968 of automatic subscriber-to-subscriber calling. Telex subscribers in New Zealand can now call most overseas subscribers automatically without the aid of the international assistance operator. In August 1977 automatic telex service became available to ships at sea.
International Bureaufax Service—The international bureaufax service, which opened in September 1980, has continued to grow. For figures on the number and volume of messages sent overseas refer to the table on page 405.
International Telegram Service—Telegrams are an important part of international communications and a worldwide service is available although the traffic volume is diminishing in line with the world trend.
Radio Services to Shipping—The first wireless-telegraph station in New Zealand for communication with ships at sea was opened at Wellington on 26 July 1911. Other stations are located at Auckland, Awarua, and Chatham Islands. These stations provide a service for the exchange of radio telegrams with ships at sea, and special rates operate for vessels registered in New Zealand and Australia. A free radio-medical service also operates for ships at sea and lighthouses on the New Zealand coast. The number of ships licensed to operate radio equipment is 8882. The drop in the number of licensees is due to the change over to Single Side Band Radio—and the reluctance of licensees to re-equip.
INLAND RADIO SERVICES—The use of radio as a means of communication continues to grow. In the Post Office very-high-frequency service 7538 subscribers are provided with radiotelephone service to 60 843 mobile units through 110 base stations throughout the country. A further 18 913 mobile units are provided with service through 4608 Government and private owner-operated base stations. The number of citizen sets licensed now totals 43 241. The amateur service provides facilities for experimental communications between people interested in radio as a hobby, and 5987 stations are operated by qualified amateur operators. There are now 156 096 radio transmitting stations of all types licensed compared with 151 666 in 1982.
REVENUE—The revenue of the Post Office for the latest financial year is shown in the following table.
The revenue figures for each of the 4 businesses of agency, banking, postal and telecommunications, totalling $1,256.0 million include transfer revenues of $15.8 million, i.e., revenues earned for services rendered by each business for the other 3 businesses.
When these revenues (and expenditures) are consolidated to show the result for the Post Office as a single entity, all transfer revenues and expenditure are eliminated.
| Item | 1982–83 | |
|---|---|---|
| $(000) | ||
| Agency Business— | ||
| Fees from Government departments— | ||
| Motor Registration | 10,336 | |
| Broadcasting Corporation of New Zealand | 5,455 | |
| Other Government departments | 10,229 | |
| Vehicle hires | 4,311 | 30,331 |
| Other— | ||
| Sale of motor plates | 1,075 | |
| Miscellaneous | 2,850 | 3,925 |
| Agency Revenue | 34,256 | |
| Banking Business— | ||
| Interest on Investments— | ||
| Government stock | 175,063 | |
| Housing Corporation of New Zealand stock | 13,095 | |
| Rural Banking Finance Corporation stock | 8,039 | |
| Personal and housing loans | 26,513 | 222,710 |
| Other— | ||
| Service charges | 2,684 | |
| Money orders and postal note commission | 717 | |
| Banking Revenue | 226,111 | |
| Postal Business— | ||
| Postage | 188,181 | |
| Other— | ||
| Private box, bag rents and rural delivery fees | 5,166 | |
| Philatelic sales | 5,093 | |
| Overseas traffic settlements | 5,295 | |
| Miscellaneous | 2,051 | 17,605 |
| Postal Revenue | 205,786 | |
| Telecommunications Business— | ||
| Telephone | 406,399 | |
| Tolls | 271,900 | |
| Overseas telecommunications | 68,576 | |
| Other— | ||
| Telex | 17,213 | |
| Telegraph | 11,773 | |
| Radio | 2,351 | |
| Leased circuits | 2,374 | |
| Miscellaneous | 9,275 | 42,986 |
| Telecommunications Revenue | 789,861 | |
| Total, Post Office Revenue | 1,256,014 | |
Revenue and expenditure for the latest 6 years are shown in the following table.
| Year Ended 31 March | Revenue | Expenditure |
|---|---|---|
| $(000) | ||
| 1978 | 439,999 | 402,344 |
| 1979 | 514,473 | 464,851 |
| 1980 | 604,288 | 533,433 |
| 1981 | 710,678 | 622,116 |
| 1982 | 816,477 | 740,402 |
| 1983 | 1,240,193 | 1,042,541 |
CAPITAL—Capital expansion necessary to meet demand requires substantial provisions for new telecommunications systems and the replacement of those which have become obsolete. Accommodation to house this equipment, to provide post offices in newly-developed areas, and to replace old and inadequate offices is an important part of Post Office capital development.
Capital expenditure on telecommunications development and buildings is financed partly by the Post Office, and partly from the Loans Account, on which interest is paid at the rate of 10 percent. The interest payment amounted to $50.8 million in 1982–83.
Implementation of the Wage-Price Freeze, early in the 1983 financial year resulted in Post Office costs, particularly in the personnel area, being lower than had been budgeted for.
This enabled the capital development programme to be funded without the need to borrow from the Loans Account.
In 1982–83, $135.9 million was spent on telecommunications development and $27.6 million on land and buildings. In addition, $40.6 million was invested in other assets such as motor vehicles, tools and plant, and office equipment. The capital liability of the Post Office is now $563.0 million and liability under capital equipment credit arrangement is $13.6 million.
WORK PERFORMED FOR OTHER DEPARTMENTS—Because it has numerous offices readily accessible to the public, the Post Office also undertakes agency work for other Government departments. Among the principal activities in this connection are the receipt and payment of moneys on behalf of the various departments, the more important of which are enumerated below.
Receipts—For the following departments: Health, Lands and Survey, National Roads Board (Road User Charges), Public Trust Office, Electricity (some electric-power receipts), Ministry of Transport, Customs (collection of Customs duty and sales tax), Treasury (Government Superannuation, National Provident Fund receipts, and motor vehicle registration and licence fees), and Reserve Bank (Kiwi Savings Stock).
Payments—Departments of Social Welfare (emergency benefits, family benefits, unemployment, sickness benefits, etc.), Health (refunds of medical expenses), Defence, Police (witness warrants), and Ministry of Works and Development (refunds of Road User charges).
Other services performed by the Post Office are the issue of licences in respect of motor vehicles and radio apparatus, and assistance to the Marine and Civil Aviation Divisions of Ministry of Transport on radio matters. In some of the smaller centres postmasters act as registrars of births, deaths, and marriages. In each of the 92 electorates a postmaster or senior officer is appointed registrar of electors with responsibilities for the compilation, maintenance, and production of electoral rolls as directed by the Chief Registrar of Electors.
Other activities include the receipt of levies under the Motor Vehicle Accident Scheme as provided for under the Accident Compensation Act 1972, the issue of fishing and game licences on behalf of acclimatisation societies, organising and selling health stamps, and collecting television licence fees.
STAFF—The actual number employed as at 31 March are shown in the following table.
| Classification | 1979 | 1980 | 1981 | 1982 | 1983 |
|---|---|---|---|---|---|
| Permanent staff | 33,234 | 33,178 | 33,615 | 33,128 | 33,110 |
| Temporary and non-classified staff | 6,161 | 6,287 | 6,024 | 6,151 | 6,645 |
| Total staff | 39 395 | 39 465 | 39 639 | 39 279 | 39 755 |
Business Staff—Staff employed in various branches of the Post Office undertake a range of activities either directly related to or in support of the main business operations. Where branch activities involve more than a single business, survey results are applied to produce the business staff figures.
| Full-time Equivalent Staff | 1979* | 1980* | 1980–81† | 1981–82† | 1982–83† |
|---|---|---|---|---|---|
* Figures for March 1979–80 show total number of staff as at 31 March for each year. †Figures for 1980–81, 1981–82, and 1982–83 show the average staff level for each year. | |||||
| Telecommunication services | 24,912 | 24,895 | 24,957 | 24,582 | 24,253 |
| Postal services | 6,990 | 7,069 | 7,142 | 7,322 | 7,682 |
| Banking services | 4,114 | 4,095 | 3,951 | 4,387 | 4,545 |
| Agency services | 1,875 | 1,902 | 1,895 | 1,693 | 1,387 |
| Electoral | 49 | 49 | 222 | 165 | 112 |
| Total | 37 940 | 38 010 | 38 167 | 38 149 | 37 979 |
Vehicles—The Post Office fleet as at 31 March 1983 consisted of 6777 vehicles, 950 trucks, 3825 vans, 1999 cars, and 3 motor scooters. Of this fleet, 681 vehicles are used for hire to other departments, 1179 on postal, telegram delivery and other general work, 4873 for engineering work, and 41 for the banking business.
A programme of converting Post Office vehicles to operate on compressed natural gas (CNG) continued during the year with a total of 2240 vehicles being converted as at 31 March 1983. It is proposed to install 28 refuelling stations at large line depots and Public Service Garages of which 8 were operational.
FURTHER INFORMATION—For further information see Parliamentary paper F.1. Report of the Post Office.
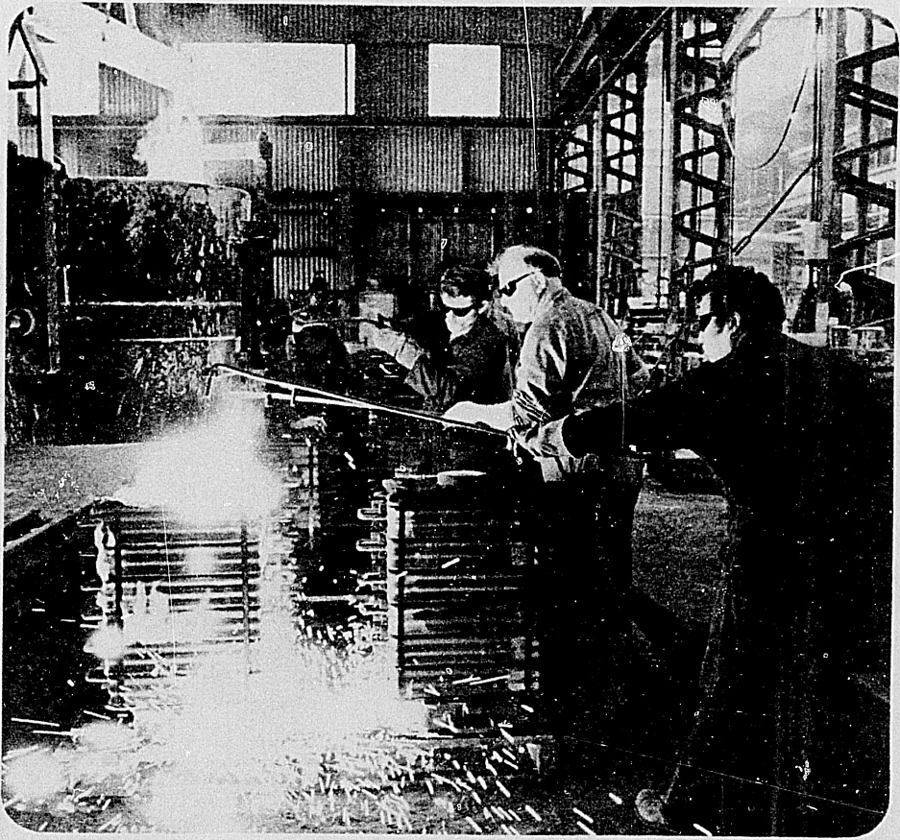
Table of Contents
Table of Contents
Most of New Zealand's dairy farms are in lowland areas of the North Island, where naturally fertile or improved soils make for good grass growth. Approximately 80 percent of the total dairy stock in the country are grazed on the flat and undulating land of Northland, South Auckland-Bay of Plenty, Taranaki, and Wellington. Pastures of high feeding value form the basis of the industry. Carrying capacity may be as high as 2.5 cows per hectare, and annual production as high as 400–450 kg of milkfat per hectare. The main winter supplementary feed is hay and silage made from the surplus spring and early summer growth of the pastures. In most of the dairying areas lamb raising is also undertaken.
On the less steep country, particularly in the North Island where there is surface-sown grassland, both store sheep and cattle are raised.
Sheep finishing farms are generally located on land which is of high fertility, either naturally or as a result of topdressing. Country of this type is usually flat to undulating in topography, and tends to be concentrated on the coastal plains and river valleys of both islands, e.g., the Waikato basin, the Hawke's Bay, Manawatu, Canterbury, and Southland plains. In the North Island it is normal to rely on pasture as a sole diet, while in the drier and colder areas of the South Island it is necessary to grow special crops for supplementing the ewe flock feeding over the winter.
Finishing farms vary considerably in area and in the size of flock carried. A flock of 2000 to 2500 ewes is commonly regarded as a 1- person unit. The average range in carrying capacity is from 7 to 15 ewes wintered to the hectare. Lambing percentages are variable but average from 100 to 110 lambs per 100 ewes mated. The aim of the farmer is to sell a high proportion of these lambs, straight off their mothers, at carcass weights around 12–14 kg. In the North Island, cattle are normally purchased in the spring and in the autumn, and are finished, if possible, by the following autumn. On some properties, store wether lambs from the hill-breeding flocks may also be brought in for finishing. The amount of meat produced on finishing farms averages about 160–180 kg per hectare.
Hill country sheep farming covers extensive areas in both islands. The stock carried consists of mixed-age flocks of breeding ewes, ewe hoggets for replacements, and rams. Where part of the property is underdeveloped, wethers may also be carried. Wool yield from these farms averages 4.5 to 5.5 kg/su (kilograms per stock unit) and usually represents about 40 percent of the total farm income. Other products sold are prime wether lambs, store lambs for finishing, and breeding ewes.
A large proportion of the beef cattle are also run on hill-country properties.
On the plains and downlands of Canterbury and in parts of Marlborough, Otago, and Southland, where the climate and soils are suitable, arable mixed farming is a feature. The bulk of New Zealand's wheat, oats, and barley production comes from these districts. The majority of the cereal-producing farms also finish sheep and lambs.
SOILS—Soil is a product of its environment: its composition depends on the parent ingredient, the climate, the length of time it has weathered, the topography, and the vegetation under which it has formed. The complex soil pattern of New Zealand is a result of the many different kinds of rock, and the various conditions under which the soils have formed.
New Zealand includes such extremes as the subtropical climate of North Auckland, the cold uplands of the alpine regions, and the semi-arid basins of Central Otago.
The country's topography is also varied—50 percent of the land is classifiable as steep, 20 percent is moderately hilly, and only 30 percent is rolling or flat.
The natural vegetation ranges from kauri forest to subalpine scrub, and from tussock grassland to broadleaf forest. From time to time, occurrences such as river floods on alluvial plains, sand drifts, or a volcanic ash eruption interrupt and alter the pattern of soil development.
Regional differences in New Zealand's soils result mainly from the effects of climate on topography. Soils develop more rapidly under high temperatures and a heavy rainfall. In New Zealand, distinct soil gradations are found, both from north to south and from west to east. These closely follow the isohyets (lines connecting places that receive the same amount of rain) on a climatic map.
Increased knowledge of the soils of New Zealand has brought about a change in approach to soil management. Soils have been mapped and their properties and uses determined. This has stimulated the rapid conversion of large areas of “problem” land into good farms and has raised land use to a new pitch of efficiency, which reflects the modern changes to farming as an up-to-date science.
Farmers have exploited the use of certified strains of grasses and clovers, phosphatic fertilisers, lime, and trace elements. The use of aircraft for topdressing and oversowing of grass is resulting in considerable improvements to hill pasture, with a consequent increase in carrying capacity and production.
New Zealand soils may be classified on a regional basis as follows:
| Region | Soils | Vegetation and Land Use |
|---|---|---|
| North Auckland Peninsula and Auckland region | Northern yellow-brown earths and podzols left by kauri forest. Loams and clays from volcanic rocks. Soft-rock uplands with volcanic outcrops. | Heavily forested (high rainfall and humidity). Patches of rich dairy land on formerly swampy organic soils. Some wool and store sheep. Dairying, fat lambs near Auckland. Patchy land use. |
| Bay of Plenty-Waikato-Thames-Hauraki Plains | Volcanic ash covers much of area. Most soils intrazonal or azonal. Yellow-brown pumice soils in Bay of Plenty. Peaty soils with high ground water on Hauraki Plains. | Intensively-farmed dairying region. Land use almost entirely based on grass and clover, with great reliance on topdressing. Some fat lambs. Extensive exotic forests in Bay of Plenty region. |
| Volcanic Plateau | Pumice soils, lacking in essential trace elements. Yellow-brown pumice soils from volcanic material. | Largely undeveloped scrub and native forest. Extensive exotic forests. Topdressing of former manuka and scrub area for farming. |
| East Coast | Southern and central yellow-brown earths. Patches of recent alluvial soils along rivers. Yellow-grey earths on rolling land south of Hawke Bay. | Semi-extensive sheep farming (wool and store sheep). Intensive fat-lamb production on flat to rolling plains. Market gardens and orchards near Napier and Hastings. Some pip fruit. Pockets of dairying close to main ranges from Norsewood south. |
| Taranaki | Ring plain consists of yellow-brown loams, with granular clay from volcanic ash. Overlay of fertile ash and sediment from Mount Egmont. Soft-rock uplands away from coast. | Distinct contrast between rich. closely-farmed dairying ring plain, and inland country with its steep ridges mainly covered in second-growth forest or dense gorse and severely eroded. |
| Manawatu-Horowhenua Coast Plain | Sand dunes and swampy hollows common along coast. Steep-land yellow-brown earths inland. Extensive young soils from dune sands along coast. | Many hollows contain native flax (Phormium tenax). Pockets of dairying and fat-lamb production. |
| Nelson | Pockets of fertile, recent alluvial soils in yellow-grey and yellow-brown earths. | Orchards and market gardens. Hops and tobacco also grown on flat, rolling land. |
| Marlborough-Kaikoura Coast | Yellow-brown earths with pockets of alluvial soils. | Where land is developed, mainly sheep or cash cropping. |
| West Coast | Extensive grey podzols. with recent swamp soils on alluvial flats. | Mostly undeveloped scrub and native bush. Some dairying. |
| Canterbury Plains | Very thick layer of gravel deposited by rivers—thickest and coarsest near mountains from which rivers flow. Soils range from stony gravel to fine silts. | Deep layer of fine sediment provides fertile soil for cereals and fodder crops, and makes good sheep pasture. Cash cropping on former swamp near Christchurch. |
| Otago | High-country yellow-brown earths on ranges, yellow-grey earths, often stony, in basins. | Sheep farming for wool and fat lambs plus some cattle and some orchards. Irrigation necessary in low-rainfall area. |
| Southland and Fiordland | Southland Plain has extensive deposits of gravel and silt. Fiordland has mostly subalpine grey soils and grey podzols. | Fat lamb production in Southland. Fiordland agriculturally undeveloped and unproductive. Scenic attractions. |
OCCUPIED LAND: Tenure—The tenure of occupied land in recent years is shown in the following table.
| Year | Number of Farms | Freehold Land | Crown Land | Leasehold Land | Other Land | Total Land Occupied |
|---|---|---|---|---|---|---|
| hectares (000) | ||||||
| 1978 | 69,401 | 10,199 | 9,625 | 1,319 | 110 | 21,254 |
| 1979 | 70,452 | 10,535 | 9,193 | 1,330 | 123 | 21,231 |
| 1980 | 71,505 | 10,559 | 9,029 | 1,457 | 192 | 21,237 |
| 1981 | 72,515 | 10,951 | 8,849 | 1,326 | 124 | 21,250 |
| 1982 | 73,925 | 10,820 | 8,853 | 1,340 | 250 | 21,264 |
Land Usage—Land usage and occupation at 30 June 1982 by statistical area is given in the following table.
| Statistical Area | No. of Farms | Grassland and Lucerne | Crops, Fruit, or Nursery | Plantations of Exotic Trees | Tussock or Danthonia Used for Grazing | Total Area of Farms* | |
|---|---|---|---|---|---|---|---|
| Established Before 30/6/81 | Established During Year Ended 30/6/82 | ||||||
| * Including “Other”. | |||||||
| hectares (000) | |||||||
| Northland | 6,683 | 691 | 17 | 7 | 64 | 19 | 1,077 |
| Central Auckland | 7,164 | 296 | 3 | 11 | 30 | 5 | 418 |
| South Auckland-Bay of Plenty | 17,769 | 1,798 | 34 | 42 | 451 | 38 | 3,421 |
| East Coast | 1,583 | 538 | 10 | 9 | 39 | 27 | 725 |
| Hawke's Bay | 4,338 | 890 | 23 | 19 | 60 | 55 | 1,304 |
| Taranaki | 4,552 | 444 | 7 | 3 | 5 | 11 | 619 |
| Wellington | 8,004 | 1,394 | 33 | 39 | 51 | 156 | 1,998 |
| North Island | 50 093 | 6 051 | 127 | 130 | 700 | 312 | 9 561 |
| Marlborough | 1,334 | 213 | 10 | 11 | 21 | 495 | 1,140 |
| Nelson | 2,468 | 172 | 9 | 10 | 85 | 60 | 1,431 |
| Westland | 816 | 108 | 4 | 1 | 18 | 37 | 931 |
| Canterbury | 9,161 | 1,156 | 103 | 186 | 50 | 1,430 | 3,370 |
| Otago | 4,902 | 943 | 38 | 71 | 62 | 1,826 | 3,265 |
| Southland | 5,151 | 702 | 28 | 62 | 28 | 366 | 1,567 |
| South Island | 23 832 | 3 294 | 191 | 340 | 263 | 4 214 | 11 703 |
| New Zealand | 73 925 | 9 345 | 318 | 470 | 963 | 4 526 | 21 264 |
Farm Type—Land usage and occupation at 30 June 1982 is shown by farm type in the following table.
| Farm Type | Number of Farms | Grassland and Lucerne | Land In or Prepared for Fruit. Grain. Crops. Vegetables, etc. | Plantations of Exotic Trees | Tussock or Danthonia Used for Grazing | Other Land on Farm | Total Area of Farms |
|---|---|---|---|---|---|---|---|
* Seventy-five percent or more is derived from stated activity. †From 51 to 74 percent of gross income is derived from first named activity, and between 20 and 40 percent from second activity. ‡More than 50 percent of gross income is derived from stated activity. §Two or more activities of roughly equal proportions. ||Includes deer and goat farming; small animal breeding; mushroom, grape, berryfruit, hop and flower growing; beekeeping and other fruit and vegetables; land farmed by agricultural contractors; and farms not elsewhere classified. | |||||||
| hectares (000) | |||||||
| Dairy farming: factory supply* | 12,604 | 933 | 9 | 4 | 14 | 63 | 1,023 |
| Dairy farming: town milk supply* | 1,383 | 113 | 3 | – | 1 | 4 | 123 |
| Sheep farming* | 20,786 | 4,239 | 151 | 57 | 2,953 | 565 | 7,963 |
| Beef farming* | 6,354 | 483 | 3 | 11 | 263 | 150 | 911 |
| Pig farming* | 456 | 6 | 1 | – | – | 1 | 9 |
| Cropping* | 1,268 | 30 | 53 | – | 1 | 3 | 86 |
| Dairy farming with sheep† | 348 | 52 | 1 | 1 | 5 | 6 | 65 |
| Dairy farming with beef† | 576 | 70 | 1 | – | 2 | 8 | 81 |
| Dairy farming with other† | 446 | 42 | 3 | – | 1 | 4 | 50 |
| Sheep farming with dairy† | 143 | 32 | 1 | – | – | 2 | 35 |
| Sheep farming with beef† | 5,818 | 2,305 | 33 | 37 | 965 | 398 | 3,737 |
| Sheep farming with cropping† | 1,151 | 165 | 49 | 1 | 13 | 7 | 234 |
| Sheep farming with other† | 634 | 102 | 7 | 2 | 78 | 12 | 200 |
| Beef farming with dairy† | 91 | 10 | – | – | 1 | 1 | 13 |
| Beef farming with sheep† | 1,269 | 289 | 2 | 10 | 75 | 116 | 492 |
| Beef farming with other† | 327 | 14 | 2 | – | 1 | 1 | 18 |
| Cropping with sheep† | 709 | 58 | 44 | – | 1 | 3 | 107 |
| Cropping with other† | 214 | 8 | 8 | – | – | 1 | 16 |
| Pig farming with other† | 190 | 6 | 1 | – | – | 1 | 9 |
| Horse breeding‡ | 739 | 16 | 1 | – | – | 1 | 18 |
| Mixed livestock§ | 2,353 | 369 | 21 | 9 | 80 | 75 | 555 |
| Broiler chicken production | 87 | 1 | – | – | – | – | 2 |
| Poultry farming‡ | 348 | 3 | 1 | – | – | 1 | 6 |
| Market gardening‡ | 1,593 | 12 | 19 | – | – | 2 | 34 |
| Orchards including citrus‡ | 2,001 | 6 | 16 | – | 1 | 3 | 27 |
| Tobacco growing‡ | 107 | 2 | 1 | – | – | 1 | 4 |
| Nurseries‡ | 431 | 2 | 3 | 6 | – | 4 | 14 |
| Plantations‡ | 795 | 16 | 1 | 813 | 8 | 2,201 | 3,038 |
| Other farming|| | 5,656 | 184 | 34 | 10 | 55 | 117 | 400 |
| Idle land | 5,048 | 95 | 2 | – | 8 | 1,890 | 1,995 |
| Total, all farm types | 73 925 | 9 663 | 470 | 963 | 4 526 | 5 642 | 21 264 |
FARM EMPLOYMENT SURVEY—The following table shows persons working on farms by farm type at 30 June 1982. Figures are comparable with 1981, but not with earlier years.
| Farm Type | Working Owners, Leaseholders, and Sharemilkers | Unpaid Members of Family Assisting on Farm | Paid Permanent Employees | Casual Workers at 30 June | |
|---|---|---|---|---|---|
| Full-time | Part-time | ||||
* Gross income of 75 percent or more is derived from stated activity. †From 51 to 74 percent of gross income is derived from first-named activity and between 20 and 40 percent from second activity. ‡Two or more activities of roughly equal proportions. §More than 50 percent of gross income is derived from stated activity. || Includes deer and goat farming; small animal breeding: mushroom, grape, berryfruit, hop and flower growing; beekeeping; other fruit and vegetables; land farmed by agricultural contractors; and farms not elsewhere classified. | |||||
| Dairy farming: factory supply* | 22,348 | 6,176 | 2,208 | 999 | 466 |
| Dairy farming: town milk supply* | 2,356 | 640 | 528 | 177 | 99 |
| Sheep farming* | 26,182 | 10,038 | 4,882 | 2,043 | 2,026 |
| Beef farming* | 7,714 | 2,064 | 363 | 230 | 106 |
| Pig farming* | 642 | 181 | 180 | 53 | 26 |
| Cropping* | 1,555 | 405 | 156 | 87 | 90 |
| Dairy farming with sheep† | 637 | 213 | 81 | 23 | 35 |
| Dairy farming with beef† | 1,112 | 313 | 176 | 99 | 36 |
| Dairy farming with other† | 821 | 258 | 178 | 80 | 42 |
| Sheep farming with dairy† | 210 | 57 | 65 | 6 | 8 |
| Sheep farming with beef† | 7,478 | 2,483 | 3,836 | 890 | 1,115 |
| Sheep farming with cropping† | 1,591 | 591 | 294 | 166 | 118 |
| Sheep farming with other† | 837 | 410 | 214 | 78 | 59 |
| Beef farming with dairy† | 162 | 37 | 16 | 5 | 4 |
| Beef farming with sheep† | 1,622 | 594 | 489 | 116 | 140 |
| Beef farming with other† | 449 | 146 | 45 | 23 | 17 |
| Cropping with sheep† | 931 | 342 | 211 | 105 | 104 |
| Cropping with other† | 300 | 116 | 35 | 35 | 91 |
| Pig farming with other† | 257 | 123 | 73 | 16 | 13 |
| Horse breeding‡ | 903 | 271 | 228 | 52 | 22 |
| Mixed livestock§ | 3,397 | 1,202 | 822 | 245 | 231 |
| Broiler chicken production‡ | 133 | 50 | 20 | 29 | 7 |
| Poultry farming‡ | 570 | 120 | 341 | 383 | 82 |
| Market gardening‡ | 2,447 | 550 | 657 | 349 | 699 |
| Orchards including citrus‡ | 2,954 | 850 | 949 | 311 | 1,021 |
| Tobacco growing‡ | 125 | 15 | 62 | 27 | 78 |
| Nurseries‡ | 658 | 88 | 1,191 | 244 | 350 |
| Plantations‡ | 508 | 68 | 3,818 | 59 | 248 |
| Other farming || | 7,152 | 1,799 | 1,256 | 548 | 1,712 |
| Total, all farm types | 96 051 | 30 200 | 23 374 | 7 478 | 9 045 |
CAPITAL EXPENDITURE ON FARMS—An annual survey of capital formation in the farming industry is made by the Department of Statistics. For the year ended 30 June 1982 capital expenditure was reported by 61 percent (45 094) of the 73 925 farms and plantations surveyed.
The following table shows capital expenditure by type during the latest available 3 years. For each type of expenditure the figure given is net, i.e., receipts from “trade-ins” or sales have been deducted from the gross expenditure.
| Item | Year Ended June | ||
|---|---|---|---|
| 1980 | 1981 | 1982 | |
| * Includes construction of permanent yards, airstrips, bridges, roading, and stock or dairy water supply systems. | |||
| $(thousand) | |||
| Buildings— | |||
| Owners' houses | 72,233 | 108,971 | 137,889 |
| Houses for employees | 14,933 | 18,107 | 20,578 |
| Other employee accommodation | 2,890 | 3,392 | 5,551 |
| Other buildings | 60,184 | 75,880 | 96,649 |
| Total, all buildings | 150,240 | 206,349 | 260,667 |
| Construction* | 30,983 | 37,258 | 50,102 |
| Land development— | |||
| Land clearing | 41,296 | 54,030 | 68,856 |
| Fencing | 43,961 | 56,900 | 68,109 |
| Drainage | 12,498 | 18,471 | 21,003 |
| Irrigation | 5,636 | 9,301 | 13,398 |
| Other land development | 10,757 | 12,954 | 18,555 |
| Total, land development | 114,148 | 151,656 | 189,920 |
| Transport vehicles— | |||
| Cars | 52,178 | 64,476 | 87,482 |
| Other farm vehicles | 53,830 | 57,981 | 79,220 |
| Other forest vehicles | 2,606 | 4,242 | 3,589 |
| Total, transport vehicles | 108,614 | 126,698 | 170,291 |
| Machinery— | |||
| Farm tractors | 63,181 | 75,679 | 94,816 |
| Logging equipment | 632 | 1,128 | 960 |
| Other machinery | 46,423 | 49,190 | 74,287 |
| Total, machinery | 110,236 | 125,997 | 170,063 |
| Working animals | 2,430 | 3,330 | 3,190 |
| Total capital expenditure | 516,701 | 651,289 | 844,234 |
The following table shows capital expenditure, net of sales, by farm type during the year ended 30 June 1982. It includes farms given over wholly to plantations of exotic timber.
| Farm Type | buildings | Construction | Transport Vehicles | Farm Machinery | Other Improvements and Developments* | Total Capital Expenditure |
|---|---|---|---|---|---|---|
* Includes working animals. †Seventy-five percent or more of gross income is derived from stated activity. ‡From 51 to 74 percent of gross income is derived from first named activity, and between 20 and 49 percent from second activity. §More than 50 percent of gross income is derived from stated activity. ||Two or more activities of roughly equal proportions. ¶Includes deer and goat farming; small animal breeding; mushroom, grape, berryfruit, hop and flower growing; beekeeping, and other fruit and vegetables. The land is farmed by agricultural contractors. | ||||||
| $(thousand) | ||||||
| Dairy farming: factory supply† | 44,145 | 9,459 | 34,112 | 37,510 | 18,633 | 143,859 |
| Dairy farming: town milk supply† | 5,088 | 947 | 4,372 | 5,863 | 2,626 | 18,896 |
| Sheep farming† | 75,578 | 13,172 | 53,091 | 38,287 | 71,967 | 252,095 |
| Beef farming† | 17,294 | 1,385 | 8,732 | 5,374 | 7,569 | 40,855 |
| Pig farming† | 2,511 | 130 | 1,098 | 614 | 386 | 4,741 |
| Cropping† | 3,496 | 353 | 2,342 | 7,698 | 2,215 | 16,104 |
| Dairy farming with sheep‡ | 1,215 | 283 | 1,143 | 1,216 | 885 | 4,743 |
| Dairy farming with beef‡ | 2,648 | 454 | 2,007 | 2,169 | 1,597 | 8,875 |
| Dairy farming with other‡ | 2,533 | 642 | 1,363 | 1,836 | 1,116 | 7,490 |
| Sheep farming with dairy‡ | 826 | 303 | 346 | 318 | 663 | 2,456 |
| Sheep farming with beef‡ | 21,294 | 6,949 | 18,615 | 12,700 | 32,983 | 92,541 |
| Sheep farming with cropping‡ | 4,244 | 479 | 3,309 | 6,215 | 3,314 | 18,061 |
| Sheep farming with other‡ | 2,234 | 410 | 1,825 | 2,058 | 2,538 | 9,065 |
| Beef farming with dairy‡ | 298 | 49 | 230 | 157 | 168 | 901 |
| Beef farming with sheep‡ | 4,848 | 1,087 | 3,126 | 2,050 | 4,262 | 15,374 |
| Beef farming with other‡ | 1,017 | 75 | 543 | 658 | 648 | 2,942 |
| Cropping with sheep‡ | 2,435 | 459 | 2,216 | 6,017 | 1,674 | 12,801 |
| Cropping with other‡ | 626 | 66 | 551 | 1,297 | 584 | 3,093 |
| Pig farming with other‡ | 808 | 100 | 468 | 325 | 169 | 1,870 |
| Horse breeding§ | 3,125 | 166 | 1,220 | 619 | 1,140 | 6,269 |
| Mixed livestock || | 9,518 | 1,731 | 6,317 | 6,203 | 6,834 | 30,603 |
| Broiler chicken production§ | 1,415 | 18 | 148 | 138 | 19 | 1,739 |
| Poultry farming§ | 1,624 | 198 | 1,048 | 828 | 116 | 3,814 |
| Market gardening | 8,539 | 399 | 3,940 | 6,851 | 2,434 | 22,164 |
| Orchards including citrus§ | 9,125 | 705 | 3,430 | 6,400 | 5,317 | 24,977 |
| Nurseries§ | 2,198 | 383 | 1,251 | 1,140 | 1,281 | 6,252 |
| Plantations§ | 3,209 | 6,619 | 3,295 | 1,066 | 5,679 | 19,867 |
| Other farming¶ | 28,776 | 2,582 | 9,680 | 14,456 | 16,291 | 71,784 |
| Total | 260,667 | 50,102 | 170,291 | 170,063 | 193,108 | 844,234 |
AGRICULTURAL PRODUCTION ACCOUNT—For information on the Agriculture Production Account refer to section 26A of this Yearbook.
DAIRY PRODUCTION—The following table shows milk production and utilisation of milkfat during each of the last 5 seasons, year ending 31 May. (Source: New Zealand Dairy Board.)
| Product | 1978–79 | 1979–80 | 1980–81 | 1981–82 | 1982–83* |
|---|---|---|---|---|---|
* Provisional. †Includes milk fed to stock and waste, but excludes separation loss. | |||||
| Production† | |||||
| Milk, litres (million) | 6,304 | 6,629 | 6,483 | 6,578 | 6,692 |
| Milkfat, tonnes (000) | 301.3 | 318.0 | 308.1 | 312.1x | 315.0 |
| Liquid milk, cream, and ice cream, litres (million) | 518 | 504 | 487x | 487x | 482 |
| Utilisation of Milkfat Processed (00 tonnes) | |||||
| Butter | 217.1 | 216.1 | 215.1 | 200.8x | 209.9 |
| Cheese | 33.6 | 40.4 | 32.3 | 41.8 | 42.7 |
| Other wholemilk products | 23.5 | 34.4 | 34.6 | 39.8x | 37.8 |
| Total | 274.2 | 290.9 | 282.0 | 282.4 | 290.3 |
Production by dairy factories during the latest 5 seasons is set out in the following table.
| Product | 1978–79 | 1979–80 | 1980–81 | 1981–82 | 1982–83* |
|---|---|---|---|---|---|
| * Provisional. | |||||
| tonnes (000) | |||||
| Creamery butter | 231.1 | 217.2 | 200.2 | 221.6x | 238.9 |
| Whey butter | 2.6 | 3.3 | 1.9 | 2.9x | 2.8 |
| Anhydrous milkfat (AMF) | 21.0 | 34.4 | 45.0 | 14.6 | 8.5 |
| Frozen cream | 7.7 | 6.1 | 4.6 | 5.3 | 6.1 |
| Cheese | 90.3 | 105.7 | 84.3 | 111.9x | 114.0 |
| Condensed and evaporated milk | 4.6 | 6.0 | 4.8 | 4.4x | 3.1 |
| Whole-milk powder | 58.8 | 65.8 | 88.8 | 103.6x | 102.2 |
| Infant food | 11.2 | 10.7 | 8.0 | 10.0x | 16.1 |
| Skim-milk powder | 173.9 | 168.5 | 180.9 | 199.8x | 165.3 |
| Buttermilk powder | 22.9 | 24.1 | 25.0 | 23.7x | 24.0 |
| Casein products | 63.3 | 66.2 | 59.6 | 47.4 | 65.1 |
| Lactose | 10.8 | 11.4 | 10.9 | 11.8x | 11.0 |
| Whey powders | 10.3 | 11.5 | 10.0 | 13.6 | 10.8 |
Most of the butter produced in New Zealand is of a salted “sweet cream” type and, because the cows are fed almost entirely on grass, it has a high carotene content which makes it yellower than the butter from countries where cows are fed indoors for much of the year. The predominant cheese variety produced is cheddar. Whole-milk powder is made from the whole milk, while skim-milk powder is made from the separated milk following the removal of the milkfat for buttermaking. Buttermilk powder is made from a by-product of the butter manufacturing process. Lactose is made from whey, a by-product of cheesemaking. At one time skim-milk, buttermilk, and whey were fed to pigs, but in recent years they have almost entirely been processed to produce powders and specialised dairy products.
The following table gives average milkfat and milk production per cow “at factory”.
| Season | Dairy Cows in Milk | Average Production per Cow | |
|---|---|---|---|
| Milkfat | Milk | ||
| * Provisional. | |||
| (000) | kg | litres | |
| 1978–79 | 2,040 | 142 | 2,936 |
| 1979–80 | 2,046 | 151 | 3,105 |
| 1980–81 | 2,027 | 147 | 3,037 |
| 1981–82 | 2,061 | 144 | 3,038 |
| 1982–83* | 2,124 | 143 | 3,012 |
Herd sizes have increased as suppliers with small herds have ceased production and as dairy farms have been amalgamated. The number of suppliers to dairy factories and milkfat production per supplier is shown in the following table. (Source: N.Z. Dairy Board.)
| Season | Dairy Company Suppliers* | Average Size of Herd | Milkfat per Supplier |
|---|---|---|---|
* Does not include town milk suppliers (about 1700). †Provisional. | |||
| kg | |||
| 1978–79 | 15,774 | 123 | 17,536 |
| 1979–80 | 15,424 | 126 | 18,985 |
| 1980–81 | 15,020 | 129 | 18,856 |
| 1981–82 | 14 483x | 133 | 19,090 |
| 1982–83† | 14,861 | 137 | 19,600 |
Tanker collection of milk by the dairy factories began in 1951. By 1960, 55 percent of the milkfat supplied to dairy factories was received as milk (instead of cream as previously); this had increased to 79 percent by 1966 and by 1977–78 was 99 percent.
New Zealand Dairy Board—The New Zealand Dairy Board, which consists of 14 directors, functions under the Dairy Board Act 1961. Apart from 2 Government representatives, all are producer members— 3 are appointed by the New Zealand Co-operative Dairy Company, 8 are elected by other dairy companies, with voting proportionate to the quantity of milkfat received by those companies from their suppliers in 6 geographically-defined wards. One director is appointed by the New Zealand Milk Board to represent the interests of town milk producers.
The Dairy Board's work is divided broadly into 2 sections; one concerned with the development of the dairy industry and the other with marketing of dairy produce. (This latter activity is described in Section 22A, Marketing of Farm Produce.) It is a further function of the board to promote the bobby calf and pig industries.
The Dairy Board has the broad function of linking manufacturing plans and growth with export market requirements. It is responsible by statute for the purchase and sale of export dairy products and for the development, in all respects, of the dairy industry. Since the board is the sole purchaser of produce for export, this purchasing power helps to link manufacturing plans with commercial reality.
MILK PRODUCTION—The administration and organisation of the town milk supply is the responsibility of the New Zealand Milk Board (see Section 22A).
During the year ended August 1983, town milk suppliers provided 660.0 million litres of milk. Of this, 435.0 million litres went to the milk stations and eventually reached the consumer in the form of 352.8 million litres of pasteurised milk and 10.07 million litres of sweet cream. The balance of the total production went to dairy factories (192.3 million litres), and to the manufacture of ice cream, flavoured milk, yoghurt, and cottage cheese (32.7 million litres).
MEAT PRODUCTION—The following table shows meat production in summary form. Figures are shown at estimated bone-in weights for years ended September.
| Product | Year Ended September | ||||
|---|---|---|---|---|---|
| 1979 | 1980 | 1981 | 1982x | 1983 | |
| *Source: Department of Statistics. | |||||
| tonnes (000) | |||||
| Beef | 490.5 | 478.8 | 480.8 | 519.4 | 518.2 |
| Veal | 21.1 | 16.9 | 17.3 | 20.8 | 17.4 |
| Mutton | 162.8 | 168.5 | 200.5 | 203.9 | 212.9 |
| Lamb | 351.1 | 391.2 | 425.7 | 454.7 | 510.2 |
| Pig meat | 35.7 | 34.5 | 32.5 | 34.3 | 37.8 |
| Total | 1 061.2 | 1 089.9 | 1 156.8 | 1 233.2 | 1 296.5 |
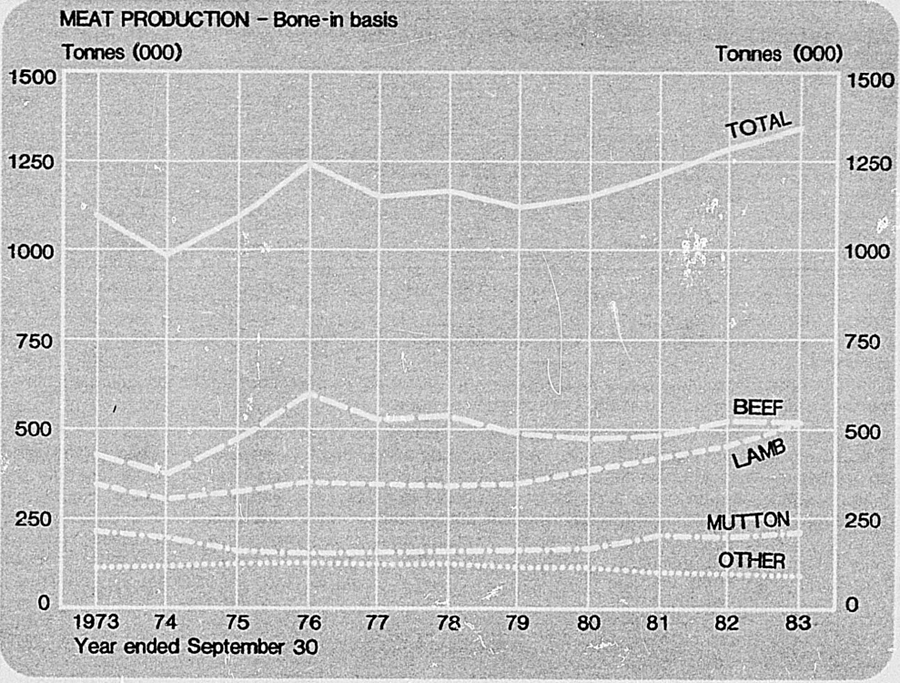
Production for Export—Export meat production for years ended September is shown in the following table. Measured on a product weight basis, export meat production increased sharply in the 1982–83 season to a record level. The major increase was in lamb production which has increased by 12 percent, while beef and veal production showed little change. Mutton production has declined by 6 percent. The decline in mutton production is due to the increase in boning as carcase weight production increased.
| Type of Meat | Year Ended September | ||||
|---|---|---|---|---|---|
| 1979 | 1980 | 1981 | 1982 | 1983 | |
| tonnes (000) shipping weight | |||||
| Lamb—carcasses | 257.5 | 295.3 | 335.1 | 325.3 | 366.7 |
| —cuts | 59.8 | 63.3 | 62.2 | 73.3 | 78.4 |
| Mutton—carcasses | 86.8 | 92.2 | 117.0 | 99.3 | 75.2 |
| — cuts | 8.4 | 7.2 | 9.4 | 14.2 | 31.7 |
| Beef—manufacturing | 161.1 | 159.1 | 164.4 | 175.8 | 173.1 |
| —other | 49.0 | 51.5 | 51.2 | 50.1 | 53.8 |
| Veal | 8.2 | 7.8 | 8.5 | 8.4 | 7.3 |
| Pig meat | 0.1 | 0.1 | 0.1 | – | – |
| Other meats | 0.9 | 0.4 | 0.3 | 0.4 | 0.1 |
| Variety meats | 44.3 | 47.3 | 50.0 | 50.9 | 53.9 |
| Inedible meat and offal | 18.0 | 21.8 | 22.6 | 19.8 | 19.0 |
| Total | 694.1 | 746.0 | 820.8 | 817.5 | 859.0 |
| Source: N.Z. Meat Producers Board. | |||||
Lamb export slaughterings during the 1982–83 season increased to 35 million, up 12.5 percent on the previous season's figure. Adult sheep slaughterings for export increased by 6.1 percent, while beef export slaughterings declined 0.9 percent.
The following table gives livestock slaughter statistics at meat export works and abattoirs, omitting killing on farms and in rural slaughterhouses, for years ended September.
| Animals | Year Ended September | ||||
|---|---|---|---|---|---|
| 1979x | 1980x | 1981x | 1982x | 1983* | |
| * Provisional. | |||||
| head of stock (000) | |||||
| Lambs | 26,051 | 28,692 | 32,306 | 32,115 | 35,995 |
| Sheep | 7,410 | 7,460 | 9,143 | 9,021 | 9,234 |
| Cattle | 2,133 | 2,015 | 2,056 | 2,172 | 2,156 |
| Calves | 1,074 | 965 | 997 | 1,069 | 963 |
| Pigs | 728 | 718 | 714 | 716 | 720 |
| Source: Ministry of Agriculture and Fisheries. | |||||
About two-thirds of lambs tailed are killed during the season, and over 90 percent of the lamb meat is exported.
Meat consumed in New Zealand represents approximately 25 percent of total production; quantities per head are shown in Section 25, Consumption of Food.
Producer Control—The principle of producer control of the export meat industry was established in 1922. A system was created in which the processing and exporting companies—public, private, and co-operative—worked under the overall direction of the Meat Producers Board. This system over the years has given the producer a choice of the people to do business with and a choice of methods of selling his stock. That choice for the producer meant that he obtained full benefit from a competitive situation. The system has also given the producer, through his representatives on the Meat Producers Board, the chance to influence through sales promotion the sale of his meat right down to the retail shops half a world distant. The board has controlled shipping to place supplies and has advertised widely, especially in Britain; it controls its own system of grading export meat; and it is general spokesman for the industry. In recent years the board has been increasingly involved in the marketing of sheepmeats as a result of its decision to purchase lamb and mutton under the industry stabilisation scheme rather than paying supplements.
The Meat Producers Board and the Wool Board are in the position of having to make not only long-term decisions but also to meet day-to-day situations as they occur. This they do with the aid of their own technical staff and through an economic service which is in close and constant contact with the sheep farming industry throughout New Zealand.
WOOL PRODUCTION—Although New Zealand's sheep flock ranks fourth in the world the country's raw wool production is second only to Australia on a clean mass basis. This is due to the high clip yields and lower quantities of grease and other contaminants in the wool.
The following table demonstrates the great variability of clip weights and clean yields internationally.
| Country | Flock Size* | Estimated Production† | |||
|---|---|---|---|---|---|
| Number | Percentage of Total | Greasy Basis | Clean Basis | Percentage of Clean Total | |
* In 1982. †In 1982–83. | |||||
| million | tonnes(000) | ||||
| Soviet Union | 142.4 | 13.1 | 471 | 188 | 11.6 |
| Australia | 137.9 | 12.7 | 704 | 444 | 27.5 |
| China | 109.5 | 10.1 | 195 | 78 | 4.8 |
| New Zealand | 70.3 | 6.5 | 371 | 274 | 17.0 |
| Turkey | 49.6 | 4.6 | 64 | 26 | 1.6 |
| India | 40.0 | 3.7 | 35 | 14 | 0.9 |
| Iran | 34.3 | 3.2 | 16 | 6 | 0.4 |
| United Kingdom | 33.0 | 3.0 | 50 | 35 | 2.2 |
| Argentina | 32.5 | 3.0 | 165 | 107 | 6.6 |
| Pakistan | 30.9 | 2.8 | 50 | 20 | 1.2 |
| All others | 406.6 | 37.4 | 749 | 424 | 26.2 |
| Total, world | 1 087.0 | 100.0 | 2 870 | 1 616 | 100.0 |
| Source: Commonwealth Secretariat/IWTO. | |||||
NOTE: Because of rounding, individual figures in this table do not always add to give the stated total. Over the years New Zealand wool production has increased more than in other countries; between 1960–80 world wool production increased only 8 percent whereas New Zealand production rose by over 40 percent. The only other countries to significantly increase production have been the USSR and China—the latter at a faster rate than any other country according to available sources, although there is some doubt over the reliability of earlier estimates.
The following table shows trends in wool production and value over the last 5 seasons compared with earlier years.
| Season Ended 30 June | Total Wool Production | Average Auction Price (Greasy Basis) | Price in 1982–3 | F.O.B. Value of Exports |
|---|---|---|---|---|
| * The prices have been expressed in terms of their purchasing power in 1982–83 dollars. | ||||
| tonnes(000) | cents/kg | cents* | $(m) | |
| 1950 | 177 | 69.8 | 743.4 | 149.3 |
| 1960 | 262 | 82.0 | 545.2 | 207.5 |
| 1970 | 328 | 56.5 | 268.5 | 204.2 |
| 1979 | 321 | 218.8 | 388.6 | 684.3 |
| 1980 | 357 | 265.1 | 402.3 | 942.1 |
| 1981 | 381 | 247.5 | 324.7 | 875.0 |
| 1982 | 363 | 255.7 | 289.2 | 925.5 |
| 1983 | 371 | 255.9 | 255.9 | 1,013.1 |
Note: Wool quantities are measured at point of sale rather than at source, and are therefore not strictly measures of production.
New Zealand Wool—New Zealand sheep are dual purpose meat/wool animals and their wool is predominantly coarse; 60 percent of the clip is greater than 33 microns in diameter. This contrasts sharply with Australian wool of which over 90 percent is less than 28 microns. New Zealand is therefore by far the largest supplier of coarse wools, contributing over 40 percent of the world total and 5 times as much as the USSR, the next significant supplier. When the quantity of coarse wool entering world trade is considered New Zealand's share becomes even greater: over 70 percent of traded coarse wools originate in New Zealand.
Wool Products—The coarse nature of the New Zealand clip predisposes it to manufactured products such as carpets, handknitting yarns, and blankets. Probably less than a quarter of production ends up as apparel.
An approximate breakdown by end-use is:
| Carpets | 55–60% |
| Apparel | 20–25% |
| Hand-knitting yarn | 10% |
| Blankets | 5% |
| Other | 5% |
Carpets have not always been the major wool product. It is only since about 1960 that increasing amounts of New Zealand wool have been used in the manufacture of carpets.
The expansion coincided with a worldwide increase in production of carpets of all types. Between 1970–80 consumption of carpets in industrialised countries increased by almost 70 percent. The enduse with the next highest rate of expansion was sweaters with a 30 percent increase during the same period.
Uses to which New Zealand wool is put vary markedly from country to country as well. A good example is the production of handknitting yarns in China where an unusually high proportion of quite coarse New Zealand wool is used.
Destinations of New Zealand Wool—It is important to distinguish between initial and final destinations of New Zealand wool exports. Initial destinations have changed substantially over the years, and there are sometimes very large changes from year to year. In general there has been a steady decline in the share going to UK, Europe and USA, compared with a steady increase in the share going to China, East Asia, and the USSR.
Final destinations of end-products made from New Zealand wool have in contrast been rather more stable. Much of the wool tends to be used in the same countries as it did years ago even though the location of the early stage processing may have changed. Countries such as USA and West Germany use less raw wool but import made-up carpets from other countries.
The notable exceptions are China and the USSR where exports of New Zealand wool have risen significantly, and most is used in products that remain within these countries, which represents a real shift in the use of the product.
The proportion of New Zealand's total export value from raw wool has been relatively stable over the last 10 years. From 1960 to 1970 New Zealand exports of raw wool dropped from about one-third to one-sixth and since 1970 has remained at that level. The current value of wool exports exceeds New Zealand $1 billion (f.o.b.).
The following table shows the initial export destinations of New Zealand wool.
| Country | 1977–78 | 1978–79 | 1979–80 | 1980–81 | 1981–82 | 1982–83 |
|---|---|---|---|---|---|---|
| * Includes exports to other countries. | ||||||
| tonnes | ||||||
| China | 7,301 | 10,948 | 14,685 | 34,389 | 25,460 | 41,688 |
| Japan | 17,436 | 31,325 | 26,468 | 22,529 | 35,575 | 32,607 |
| Netherlands | 22,975 | 17,226 | 15,960 | 18,096 | 18,150 | 22,455 |
| Soviet Union | 22,455 | 31,414 | 39,004 | 27,925 | 36,316 | 34,190 |
| United Kingdom | 45,099 | 37,690 | 29,991 | 27,993 | 32,766 | 39,959 |
| United States | 8,530 | 9,399 | 11,101 | 10,253 | 9,246 | 9,208 |
| West Germany | 19,792 | 20,665 | 17,974 | 15,893 | 14,086 | 14,109 |
| Belgium | 10,352 | 9,251 | 7,877 | 8,216 | 9,932 | 12,744 |
| France | 17,478 | 19,410 | 26,298 | 20,502 | 19,148 | 15,769 |
| Italy | 8,373 | 13,491 | 15,042 | 11,665 | 12,492 | 10,416 |
| Australia and Pacific Islands | 7,664 | 8,004 | 8,457 | 7,245 | 9,436 | 8,360 |
| Total exports* | 242 782 | 159 122 | 285 243 | 280 252 | 284 817 | 321 956 |
The following table shows the amounts of raw wool purchased by New Zealand mills during the past 6 seasons.
| Item | 1977–78 | 1978–79 | 1979–80 | 1980–81 | 1981–82 | 1982–83 |
|---|---|---|---|---|---|---|
| tonnes (greasy equivalent) | ||||||
| Wool purchased | 18,773 | 24,390 | 20,804 | 22,674 | 27,774 | 25,550 |
| Source: New Zealand Wool Board, Manufacturers' Monthly Levy Returns. | ||||||
New Zealand Wool Board—The New Zealand Wool Board was originally set up under the Wool Industry Act 1944 and amalgamated with the New Zealand Wool Marketing Corporation in 1978. The board has 6 representatives of woolgrowers, elected by an electoral committee of 26 (the members of the committee are in turn elected by sheep farmers. The same committee elects the grower representatives on the Meat Producers Board). Representatives have a 3-year term and are eligible for re-election. The Wool Board also has 2 members appointed by the Governor-General on the nomination of the Minister of Agriculture. The Director-General of Agriculture is automatically a member, and the tenth member, chosen for her/his commercial experience, is appointed by the Governor-General on the nomination of the board.
The general objective of the board is to obtain, in the interests of growers, the best possible longterm returns for New Zealand wool. Among its functions are: to promote the use of New Zealand wool in existing or new markets; to develop and maintain a marketing system for New Zealand wool suited to the requirements of the world's textile industry; to market wool to the best possible advantage; to bring about the greatest possible efficiencies in the preparation, handling, distribution, shipping, and selling of wool; to encourage the production in New Zealand of types of wool suited to market requirements; to promote research into wool and sheep; and to set minimum prices for wool and operate a minimum price funding scheme.
The main sources of income for the board are: a levy on gross wool receipts ($34.2 million in the 1982–83 season) which is used exclusively for promotion and research; and interest on investments ($9.1 million for the 1982–83 season).
In November 1983, legislation was passed to allow the board to raise the levy from the existing 3 percent to 5 percent in 1984–85.
The board is active in all aspects of the wool industry from production through to advertising wool products overseas. Its production section is engaged in the promotion of breeding practices suited to today's market, proper wool handling and clip preparation, and co-operation with wool and sheep research organisations throughout the country. The field service trains shearers in the Wool Board shearing technique. In the 1982–83 season 2763 shearers of varying levels of skill attended Wool Board courses.
Perhaps the board's biggest role is in the New Zealand marketing system and the operation of its market support schemes. It values all wool offered at auction and intervenes in the market according to its commercial judgment. In doing this it may buy wool. During the 1982–83 season, there was support buying in the early part of the season, although by the end of the year the board was a net seller. The board sells from the stockpile of bought-in wool, normally through the established wool trade in New Zealand. The wool is also valued for the purpose of ensuring a minimum return to growers (the minimum floor price). In the 1983–84 season the floor price was set at an average of 250 cents per kilogram, greasy weight. When the sale price for a lot at auction falls below the appropriate minimum price, the board pays the difference to the grower as a supplementary payment. Supplement is also paid on privately sold wool, provided the buyers display it under specified conditions for appraisal by the board.
The board's market support operations are funded by its general capital and reserves which totalled $108 million at 30 June 1983 and which had their origin in profits on the sale of wool accumulated during World War II. Supplementary payments under the minimum prices scheme are funded by a minimum price funding levy introduced on 1 July 1976. Currently the levy is 1 percent of gross proceeds from all shorn wool sold for the first time.
A wool auction sales committee, comprising representatives of the board, the New Zealand Wool-brokers Association, and the New Zealand Woolbuyers Association, set up under provision of the Wool Industry Act 1977, draws up and supervises the roster of wool auction sales.
The board is also empowered to grant or revoke licences to export wool. Under the regulations the board has to keep a list of registered private buyers, registered wool exchange operators, and scourers.
It is involved in the development of market innovations, such as the sale of wool by sample, it is a negotiator of freight rates, and operates a number of wool stores for its own use. Board economists conduct a market intelligence service covering production, disposal, and market prices.
The board provides a technical service to wool processors and textile manufacturers, both in New Zealand and overseas, and is extensively involved in the promotion of wool textiles, on its own account and in co-operation with garment and carpet manufacturers and the retail trade throughout New Zealand. It also supports New Zealand manufactured wool products in export markets.
In the 1982–83 season the board's share of the budget of the International Wool Secretariat was $36.2 million. This was about 27 percent of IWS costs. The IWS is a partnership with Australia, South Africa, and Uruguay. It has its headquarters in London and operates in almost all countries with a substantial consumer market.
It offers technical and fashion advice in menswear, womenswear, and furnishing to manufacturers, administers the Woolmark and the Woolblendmark (maintaining quality control in more than 15 000 factories), and promotes wool through campaigns with manufacturers and retailers. Extensive research and development is also undertaken.
The board provides about 50 percent of the revenue of the Wool Research Organisation of New Zealand (WRONZ). In 1982–83 this was $1.57 million. Established in 1960 at Lincoln, Christchurch, the organisation has a professional staff of about 35. It conducts fundamental research on the wool fibre and applied research on scouring, processing, and performance of New Zealand wools. It is also developing the measurement of wool characteristics as an aid in marketing. The board is represented on the WRONZ executive.
The board is also represented on the Wool Testing Authority. Wool testing, which has been carried out in New Zealand since the 1940s, is used by buyers and processors as a basis for trading. Certificates are provided for yield, vegetable matter, fibre diameter, and moisture content.
With the Meat Producers Board, the Wool Board maintains the New Zealand Meat and Wool Board's Economic Service, which provides economic data for both boards and outside organisations through a survey of a representative 500 pastoral farms.
The board administers on behalf of the Government the Individual Grower Income Levy Retention Scheme. Under this scheme a proportion of the gross proceeds from the sale of wool is retained when the adjusted weighted average sale price at auction exceeds a “trigger price” set by the Minister of Agriculture (400 cents per kilogram, greasy, in the 1981–82 season). The proceeds so retained are credited to individual growers accounts and are refundable to growers after 5 years, or in special circumstances as described in the regulations. Funds are held by the Reserve Bank. In February 1978 the Government authorised the repayment of all funds held in these accounts (amounting to $26 million in more than 40 000 accounts). Funds in the Reserve Bank at the end of the 1982–83 season were nil.
The board also administers, on behalf of the Government, the supplementary minimum floor price scheme introduced in 1978. This provides a Government-backed minimum price to growers at a level higher than the board's minimum price of 250 cents per kilogram (average greasy basis). For the 1983–84 season this has been set by the Government at 320 cents per kilogram (greasy basis).
During the 1982–83 season, the supplementary minimum price was set at 320 cents per kilogram. The market remained below this level throughout the season and a Government supplement of $177 million was paid.
Supplementary payments are calculated on a percentage basis—using the adjusted weighted average sale price (AWASP) for each auction sale. In cases where the sale AWASP is below the supplementary minimum price level, the percentage difference between the AWASP and the supplementary floor price is added on to the realised price by the broker. In the 1982–83 season the supplement averaged 25 percent. For private sales the buyer completes an application on behalf of each grower, on the basis of which the board pays the supplement direct to the grower, based on the AWASP at the last auction.
AGRICULTURAL TRAINING COUNCIL—The Agricultural Training Council was gazetted as an industry training board in 1971 under the Vocational Training Act following recommendations of the 1970 Training in Agriculture Conference. The role of the council is to develop, co-ordinate and promote organised training in those sectors of the primary industry for which it is responsible and at the same time work closely with those agencies and other industry training boards having responsibilities in other sectors of the primary industry. The Agricultural Training Council has a Regional Agricultural Training Officer Scheme comprising 16 agricultural training officers in 16 regions, each with a regional training committee. The role of the regional scheme is to carry out the training functions of the council at a regional level.
The council comprises representatives from Federated Farmers of N.Z. Inc., N.Z. Federation of Young Farmers, Farm Workers' Association, the farming industry, the horticultural industry, the equine industry, Ministry of Agriculture and Fisheries, Vocational Training Council, Department of Education, Lincoln and Massey Universities, Department of Labour, the Technical Institutes Association, and the New Zealand Workers' Union.
MINISTRY OF AGRICULTURE AND FISHERIES—The Ministry of Agriculture and Fisheries was formed in 1972 by grafting the fisheries management and research divisions of the former Marine Department on to the Department of Agriculture. The principal functions of the ministry are to promote and to encourage the development of all phases of the agricultural, pastoral, horticultural and fishing industries in New Zealand, including the stock, poultry, fruit, vegetable, flax (Phormium tenax), tobacco, hops, and honey production industries, with a view to maintaining and improving the quality of the products derived from those industries and increasing the production of those products; and to promote, control and encourage the marketing and sale of those products.
The Ministry of Agriculture and Fisheries provides a service of which the main object is the advancement of the interests of agriculture and fisheries. Under a Director-General of Agriculture and Fisheries there are divisions of animal health, meat, dairy, advisory services, agricultural research, fisheries research, fisheries management, economics, management services, and administration. Though the service is primarily advisory, the ministry administers a number of Acts and regulations.
Animal Health—The Animal Health Division's major functions are to eradicate endemic animal diseases, to prevent or control exotic diseases, to promote animal welfare, to help farmers to improve animal health, and to ensure that the animals' and animal products for export meet the importing countries' requirements. Since the 1960s, the main thrust of the disease-eradication efforts has been against bovine tuberculosis and brucellosis. A scheme against mannosidosis in registered Angus and Murray Grey cattle herds is almost completed. The division supports the National Hydatids Council and hydatids-control authorities in eradicating Echinococcus granulosus infection (hydatids) in dogs and controlling Taenia ovis in sheep.
The division also maintains contingency plans to ensure a quick response in the event of an outbreak of serious exotic disease.
Animal-welfare has become increasingly important in the last few years. The division promotes it by advising the Government, developing codes of practice for the care and husbandry of animals, and by investigating instances of alleged- cruelty.
The division is made up of a field service and a laboratory service. The field service is based on 6 regions subdivided into 25 veterinary districts. This service employs 55 veterinary officers and approximately 290 livestock officers.
The laboratory service has 6 regional animal health laboratories with a central animal health laboratory. The laboratories employ 39 veterinary investigation officers and about 145 scientists and technicians.
Meat—The Meat Division is responsible for the inspection of animals before and after they are slaughtered at abattoirs, export slaughterhouses, and deer-slaughtering premises. It is also responsible for the standard of hygiene at these establishments, and for the hygiene and inspection of meat-packing houses, game-packing houses, export-fish-packing houses, and export stores. The division ensures that the products and by-products from all these premises meet the legal and overseas-market requirements.
Veterinary health export certificates for meat, game, farmed venison, poultry, rabbits, fish, and some inedible by-products are issued by the veterinary staff of the division. The hygiene of the rural slaughterhouses, custom killing premises, and by-products premises of all kinds is also overseen by the division, whose meat-inspection staff are responsible for grading the meat produced in abattoirs and for supervising the grading of the meat for local consumption at export slaughterhouses.
Dairy Produce—Although the quality control of all aspects of dairy-food production is essentially the job of the industry itself, the Dairy Division is responsible for assuring all buyers of New Zealand dairy produce that mandatory manufacturing procedures and test methods are maintained.
To this end, the division monitors and gives advice on all aspects of the manufacture of dairy produce. This supervision starts on the farm and extends through the food-processing plants to storage facilities and to loading out for shipment.
Farm-dairy instructors regularly inspect all dairy farms and give advice. Milk is graded according to quality standards set by Government and the milk tankers that transport it are inspected regularly. All the processing plants, too, are inspected and classified—the division licenses and registers each plant and must approve its equipment and building design. Specialist advisory officers are available to help solve problems, or to give general support on farms or in dairy-food manufacturing plants.
The division also monitors the town-milk industry in a similar way, but its milk and produce standards are the responsibility of the Department of Health.
Samples from each batch of dairy produce manufactured are examined by officers who assess its flavour, texture, and body, as well as its presentation. Chemical analyses and microbiological assessments are carried out in dairy-company laboratories authorised to certify the quality of the produce. These laboratories are monitored by Dairy Division laboratories at Auckland, Mount Maunganui, New Plymouth, Wallaceville, and Christchurch. This network is supported by the National Dairy Laboratory at Hamilton, which evaluates milking equipment and cleaning materials for their hygienic suitability, studies methods of milking cows to produce the maximum yield and quality, develops analytical methods for milk and dairy products, and operates an interlaboratory comparison programme which monitors the accuracy of the analyses performed by both the dairy company and the Dairy Division laboratories.
Whenever possible, a proportion of dairy-produce exports is examined at its overseas destination.
Advisory Services—The role of the Advisory Services Division is to improve the range, quality, volume, and value of New Zealand's agriculture and horticulture industries. An extension service within the division employs advisers, field officers, and scientists to advise farmers and horticulturalists, and prevent the introduction of exotic plant pests and diseases.
A quality assurance scheme is administered by the division to ensure that New Zealand plant and crop exports meet the requirements of importing nations.
In addition the division is responsible for controlling noxious plants; administering the Plant Varieties Rights Office, which processes applications for new plant varieties and species; certification and testing of herbage and cereal seeds; and agricultural education and training.
Agricultural Research—All research stations of the ministry are under control of the director of agricultural research, with headquarters at Wellington. Regional directors at Hamilton, Palmerston North, Christchurch, and Invermay control the 4 research regions into which the country is divided. Research activities are more fully discussed in Section 7B Science and Scientific Services.
Economics—The Economics Division deals with all aspects of agricultural policy including international trade and trade negotiations in relation to agriculture, international quality standards, liaison with international agencies, the analysis of national production and marketing policies, the social implications of agricultural policies, and the periodic evaluation of the general economic position of farmers. Other functions include the economic appraisal of projects associated with agricultural development and resource use, the economics of the fishing industry, and the economic evaluation of research proposals.
Port Agriculture Service—The Port Agriculture Service is a uniformed branch of the ministry under the control of a superintendent. Its chief responsibility is to prevent the introduction into New Zealand of serious animal and plant diseases and pests. Officers of this service are located at ports and international airports, and deal with all items from overseas of concern to agriculture.
TOPDRESSING—Topdressing with artificial fertilisers has been an important factor in the intensification of grassland farming. Most New Zealand soils need fertilisers, especially phosphates. Superphosphate has been produced in New Zealand in increasing quantities since the 1880s, using rock phosphates from Nauru and Ocean Islands, Christmas Island is now an increasingly important source of supply. Over the years there has been a marked changeover from straight superphosphate as the principal fertiliser for grassland and crops—usual variants are serpentine superphosphate or aerial superphosphate, or a mixture of superphosphate with potash, additional sulphur or a trace element. Production of chemical fertilisers in superphosphate manufacturing works during the year ended 30 June 1983 totalled 1 669 000 tonnes. Approximately halt of the sown grassland receives fertiliser annually, with about half the fertilised area covered by aerial distribution; about 30 percent of the quantity is distributed by aeroplanes from 8000 airstrips.
The use of lime to correct soil acidity and increase the availability of trace elements grew steadily from 1890 to a peak of 1.5 million tonnes in 1945. Over the next 2 decades usage fell away, but it recovered during the 1970s and over recent years has been from 1.5 million to 1.7 million tonnes annually, dropping to 1.4 million tonnes in 1982.
The following table gives particulars of areas of grassland topdressed during the latest available years. From 1975 to 1978 this information was collected triennially. From 1981 a new series was commenced and will be collected annually.
| Year Ended 30 June | Area Topdressed | Quantity of Fertiliser and Lime Spread | ||||
|---|---|---|---|---|---|---|
| Fertiliser Only | Lime Only | Fertiliser and Lime Together | Total Area Topdressed | By Ground Spread | By Air | |
| ha (000) | ha (000) | ha (000) | ha (000) | tonnes(000) | tonnes(000) | |
| 1975 | 4 143.4 | 226.6 | 555.2 | 4 925.2 | 1 819.5 | 747.1 |
| 1978 | 4 835.3 | 337.9 | 737.5 | 5 910.8 | 2 049.4 | 1 163.1 |
| 1980 | 5 400.6 | 324.6 | 760.3 | 6 485.5 | 2 336.4 | 1 260.2 |
| Year Ended 30 June | Area Topdressed | Quantity Spread | ||
|---|---|---|---|---|
| Phosphatic Fertilisers | Other Fertilisers | By Ground Spread | By Air | |
| ha (000) | ha (000) | tonnes (000) | tonnes (000) | |
| 1981 | 5 730.1 | 1 201.8 | 2 422.1 | 1 085.9 |
| 1982 | 6 628.1 | 1 404.7 | 2 393.6 | 1 016.3 |
Information on fertiliser and lime applied from the air is obtained from aerial topdressing operators by the Civil Aviation Division of the Ministry of Transport. Figures for the latest available June years are shown below.
| Year Ended 30 June | Fertiliser Only | Lime Only | Total Fertiliser and Lime |
|---|---|---|---|
| tonnes (000) | |||
| 1978 | 1,100 | 141 | 1,241 |
| 1979 | 1,105 | 146 | 1,251 |
| 1980 | 1,106 | 163 | 1,269 |
| 1981 | 853 | 182 | 1,035 |
| 1982 | 822 | 175 | 997 |
| 1983 | 669 | 133 | 802 |
IRRIGATION—Most New Zealand soils have a seasonal moisture deficiency and require irrigation to reach their maximum productivity. Many soils presently farmed under dry land conditions are capable of substantially increased production under irrigation.
The area and type of land irrigated during the year ended 30 June 1982 is analysed by statistical area in the following table.
| Statistical Area | No. of Farms Irrigated | Grassland and Lucerne | Commercial | Other Crops | Other Land | Total | |
|---|---|---|---|---|---|---|---|
| Fruit | Vegetables | ||||||
| hectares | |||||||
| Northland | 228 | 265 | 844 | 191 | 77 | 22 | 1,399 |
| Central Auckland | 434 | 1,038 | 700 | 1,095 | 150 | 19 | 3,002 |
| South Auckland-Bay of Plenty | 624 | 1,092 | 2,015 | 314 | 241 | 16 | 3,678 |
| East Coast | 97 | 53 | 286 | 192 | 57 | 6 | 594 |
| Hawke's Bay | 546 | 1,886 | 2,396 | 1,288 | 340 | 9 | 5,919 |
| Taranaki | 57 | 616 | 29 | 13 | 24 | 12 | 694 |
| Wellington | 324 | 3,024 | 462 | 590 | 202 | 10 | 4,288 |
| North Island | 2 310 | 7 974 | 6 732 | 3 683 | 1 091 | 94 | 19 574 |
| Marlborough | 191 | 2,161 | 863 | 570 | 739 | 45 | 4,379 |
| Nelson | 503 | 1 830 | 1 718 | 593 | 1 120 | 16 | 5 277 |
| Westland | |||||||
| Canterbury | 1,901 | 98,805 | 856 | 2,198 | 27,780 | 617 | 130,256 |
| Otago | 839 | 55,160 | 1,034 | 235 | 1,477 | 234 | 58,140 |
| Southland | 15 | 170 | 6 | 10 | 19 | 1 | 206 |
| South Island | 3 449 | 158 126 | 4 477 | 3 606 | 31 135 | 913 | 198 257 |
| New Zealand | 5 759 | 166 100 | 11 209 | 7 289 | 32 226 | 1 007 | 217 831 |
Further information on irrigation is included in Section 12A Physical Environment and Economic Growth.
SUBSIDIES, GRANTS, ETC.—For many years a number of grams and subsidies have bean paid to the farming industry and allied organisations from public funds.
The following table shows the pattern of major payments in recent years.
| Subsidy, Grant, etc. | 1978–79 | 1979–80 | 1980–81 | 1981–82 | 1982–83x | 1983–84* |
|---|---|---|---|---|---|---|
* Estimates. †Includes estimated subsidies of $2,667,000 to county councils and nassella tussock areas, and $5,000,000 to Noxious Plants Control Scheme for 1983–84. | ||||||
| $(thousand) | ||||||
| Sulphuric acid transport subsidy | – | 381 | 610 | 610 | 750 | 750 |
| Fertiliser and lime transport subsidy | 23,427 | 28,771 | 25,306 | 24,101 | 21,549 | 20,000 |
| Fertiliser price subsidy | 70,178 | 40,550 | 30,833 | 28,211 | 26,929 | 24,500 |
| Fertiliser bounty | 7,846 | 2,371 | 1,965 | 1,672 | 1,433 | 1,550 |
| Supplementary minimum prices Scheme— | ||||||
| Wool | 1,348 | 91 | – | – | 134,961 | 180,000 |
| Dairy | – | 15,037 | – | – | – | – |
| Meat | – | – | – | 51,920 | 106,278 | 175,000 |
| Sharemilkers' suspensory loan scheme | 314 | 400 | 366 | 407 | 367 | 389 |
| Emergency expenditure | 6,054 | 341 | 689 | 67 | 87 | 100 |
| Control and eradication of animal diseases | 1,968 | 2,737 | 4,540 | 6,938 | 4,695 | 5,180 |
| Agricultural pests control | 6,267 | 6,867 | 7,413 | 7,003 | 7,002 | 7,000 |
| Noxious weeds eradication† | 10,718 | 10,739 | 9,002 | 9,259 | 9,817 | 7,838 |
| Assistance to hydatids authorities† | 591 | 687 | 830 | 970 | 1,179 | – |
| Agricultural Engineering Institute | 602 | 728 | 886 | 1,119 | 900 | 1,546 |
| Herd Improvement Council | 223 | 249 | 291 | 378 | 297 | 158 |
| Dairy beef scheme | 3,869 | 676 | – | – | – | – |
| Farm cadet training scheme | 205 | 381 | 502 | 477 | 1,020 | 962 |
| Agricultural research grants | 45 | 69 | 100 | 120 | 76 | 78 |
| Livestock Incentive Scheme | 2,297 | 7,009 | 11,513 | 19,127 | 18,328 | 18,830 |
| Special payment, sheep and cattle | 58,571 | 79 | 13 | – | – | – |
| Artificial breeding incentive | 416 | 735 | 55 | – | – | – |
| Grants to Dairy Products Development Centre | 235 | 251 | 273 | 351 | 204 | |
| Land development loans: interest subsidy | 1,024 | 3,424 | 6,595 | 9,648 | 11,620 | |
| Grant to New Zealand Wool Board | 2,000 | 2,000 | – | – | – | – |
| Cartage grants to dairy companies | 213 | – | – | – | – | – |
| Special payment to freezing industry | 1,880 | – | – | – | – | – |
| Meat industry hygiene grant | 408 | 1,402 | 2,313 | 1,752 | 2,053 | 1,500 |
| Rural export suspensory loans | 54 | 31 | 288 | 579 | 1,211 | 1,694 |
| Subsidy for control of potato cyst nematode | – | – | – | 5 | 22 | 40 |
NOTE—Subsidies and grants which have appeared previously but which are consistently less than $100,000, or have appeared only once (for example, the Veterinary Services Council, the Feed Storage Construction Subsidy, and the Lucerne Establishment Grant) have been deleted. Similarly, subsidies and grants of more than $100,000 that have not previously appeared in this table (for example, the Sulphuric Acid Transport Subsidy, the assistance to hydatids authorities, and the Farm Cadet Training Scheme) have been included.
Fertiliser and Lime Transport Subsidy—Since 1965, a subsidy on the transport of fertiliser has been payable. Since 6 August 1982, the rate has been 6c per tonne-kilometre for up to 40 km, 7c per tonne-kilometre for between 40 and 250 km, and 8c per tonne-kilometre for over 250 km.
Fertiliser and Lime Bounty—This bounty was introduced on 24 January 1975 to encourage the application of fertiliser and lime. The rates for spreading fertiliser have been altered several times since then. From 1 June 1978, the bounty for air-spread fertiliser has been $2 per tonne. The bounties for ground-spread fertiliser and for fertiliser that was spread by the farmer have been abolished.
For lime, the original bounty of $2 per tonne when spread by a contractor and $1 per tonne when spread by a farmer remained unchanged until 1 June 1978, when it was abolished.
Supplementary Minimum Prices Scheme—In June 1978, the Government introduced this scheme which was designed to create greater long-term confidence in the profitability of pastoral farming. The scheme established new minimum prices for meat, wool, and milkfat for the 1978–79 season. It has continued in force since then. It also guarantees that the supplementary minimum prices set at the beginning of each season will be at least maintained for the following season. The new “minimum prices” supplement those set under the stabilisation schemes that are operated by various producer boards. When market returns fall short of the set prices, the 'support payments' are met by the Government. The producer boards administer the scheme and are still responsible for the cost of any price- or market-support arrangements up to their own minimum prices.
The following table shows details of payments to farmers under the Supplementary Minimum Prices Scheme.
| 1981 | 1982 | 1983 | 1984* | |
|---|---|---|---|---|
* Agricultural Review Committee estimate. †Year ended 30 June. ‡Year ended 30 September. | ||||
| $(million) | ||||
| Wool† | – | 184 | 210 | 60 |
| Meat‡— | ||||
| Lamb | – | 94 | 135 | 185 |
| Mutton | – | 9 | 12 | 50 |
| Beef | 2 | 53 | 25 | – |
| Source: Ministry of Agriculture and Fisheries. | ||||
Other Items—Most of the remaining items are the Government's contribution toward the running costs of particular organisations (such as the Agricultural Engineering Institute), or have been introduced to deal with a specific problem (such as the eradication of brucellosis or of bovine tuberculosis) which is of importance to the whole community and would impose a serious burden on the small group directly affected.
Technological Developments in Agriculture—Current research and investigations being undertaken by the Ministry of Agriculture and Fisheries and the DSIR are described in Section 7B, Science and Scientific Services.
Farm Machinery—The following table shows details of machinery employed on New Zealand farms at the time of the 1977, 1980, and 1983 surveys.
| Type of Machine | 1977 | 1980 | 1983 |
|---|---|---|---|
| Agricultural tractors | 90,152 | 92,349 | 85,926 |
| Milking machines | 18,917 | 17,110 | – |
| Shearing stands | 70,621 | 69,849 | – |
| Pick-up balers | 17,770 | 13,488 | 12,535 |
| Hay conditioners | 28,539 | 28,619 | – |
| Harvesters— | |||
| Forage | 4,861 | 4,964 | 3,922 |
| Header | 4,409 | 4,315 | 3,825 |
| Electric fence units | 68,384 | 71,587 | 71,629 |
| Field mowers | 40,787 | 40,376 | – |
| Ploughs | 30,710 | 29,073 | – |
| Disc harrows | 52,493 | 48,641 | – |
| Cultivators | 20,402 | 21,664 | – |
| Grain drills | 13,573 | 12,902 | 9,946 |
| Spray irrigation plants | 5,119 | 5,639 | 6,611 |
| Weed and crop sprayers | 30,556 | 29,105 | – |
| Lime and fertiliser spreaders | 20,504 | 20,001 | – |
| Potato planters | 954 | 943 | – |
| Potato harvesters | 1,383 | 1,278 | 1,006 |
| Grain silos or bins | 19,424 | 18,517 | 19,658 |
| Grain capacity (tonnes) | 722,943 | 704,763 | 774,981 |
| Effluent disposal units | 7,344 | 6,862 | – |
| Water pumps | 60,423 | 60,695 | – |
| Chainsaws | 49,721 | 57,785 | – |
| Bikes | 32,299 | 38,345 | 42,516 |
| Farm trucks | 33,798 | 35,266 | 36,585 |
The second Census of Agricultural Contracting Services was taken for the year 1979–80, and was the first fully integrated economic census covering the activities of establishments and ancillary units predominantly engaged in that activity.
The census formed part of the Department of Statistics' 5-yearly series of integrated economic censuses and for this reason any comparisons made with the restricted census carried out previously should be treated with caution.
In 1979–80 the agricultural contracting servicing industries were reclassified under the New Zealand Standard Industrial Classification covering:
Farm and land improvement services
Livestock services
Cropping, etc., services
Topdressing and spraying services
Other agricultural contracting services.
The statistical tables which follow show summaries of these classifications. The definitions used in these tables are the same as listed for the Census of Manufacturing (see Section 19), with the following exceptions.
Establishments—Location addresses form the establishments for many of the 1-man operations in the land and livestock industries; whilst operation addresses form the establishments of larger businesses in other contracting industries.
Persons Engaged—Numbers of people employed, including working proprietors, in the establishments and ancillary units on 28 February 1980.
The following table gives the general summary of the results of the 1979–80 Census of Agricultural Contracting Services.
| Item | Unit | Total |
|---|---|---|
| Establishments and ancillary units | No. | 2,570 |
| Persons engaged at 28 February 1980, including working proprietors | No. | 12,833 |
| Salaries and wages paid | $(000) | 55,331 |
| Depreciation | $(000) | 15,655 |
| Purchases and other expenses | $(000) | 96,124 |
| Turnover | $(000) | 204,304 |
| Value added | $(000) | 107,439 |
| Capital expenditure less disposals | $(000) | 28,184 |
In the following 2 tables, statistics are given at industry (subgroup) level.
| Industry | Operating Units | Persons Engaged At End of February | Salaries and Wages Paid During Year | |
|---|---|---|---|---|
| Establishments | Ancillary Units | |||
| No. | No. | No. | $(000) | |
| Land clearing | 296 | – | 1,264 | 3,143 |
| Fencing and stockyard construction | 310 | – | 533 | 730 |
| Drain-maintaining and clearing | 186 | – | 404 | 1,487 |
| Other physical improvement of land | 176 | – | 382 | 1,659 |
| Total, Physical improvement of land | 968 | – | 2 583 | 7,019 |
| Herd testing, dipping, drenching, etc. | 85 | 1 | 579 | 5,171 |
| Sheep shearing | 422 | – | 4,396 | 22,883 |
| Other livestock contracting services | 17 | – | 220 | 1,171 |
| Total, Livestock contracting services | 524 | 1 | 5 195 | 29,225 |
| Cultivation and planting | 148 | – | 427 | 1,227 |
| Harvesting crops, hay and silage making | 408 | – | 1,261 | 2,064 |
| Grain drying and seed dressing | 61 | – | 188 | 970 |
| Other horticultural contracting services | 25 | – | 1,297 | 1,201 |
| Total, Horticultural contracting services | 642 | – | 3 173 | 5,462 |
| Aviation topdressing | 69 | 5 | 707 | 7,580 |
| Groundspread topdressing | 99 | – | 300 | 1,561 |
| Aviation spraying | 45 | 1 | 218 | 2,665 |
| Groundspread spraying | 180 | – | 485 | 1,183 |
| Total, Topdressing and spraying | 393 | 6 | 1 710 | 12,988 |
| Other agricultural contracting services | 36 | – | 172 | 637 |
| Total, Agricultural contracting services | 2 563 | 7 | 12 833 | 55,331 |
| Industry | Depreciation | Purchases and Other Expenses | Turnover | Value Added | Capital Expenditure Less Disposals |
|---|---|---|---|---|---|
| $(thousand) | |||||
| Land clearing | 2,571 | 7,249 | 16,863 | 9,080 | 3,569 |
| Fencing and stockyard construction | 422 | 1,967 | 5,965 | 4,003 | 580 |
| Drain-maintaining and clearing | 1,720 | 5,117 | 12,112 | 7,074 | 3,189 |
| Other physical improvement of land | 773 | 3,857 | 7,993 | 2,646 | 5,984 |
| Total, Physical improvement of land | 5,486 | 18,190 | 42,933 | 22,803 | 13,323 |
| Herd testing, dipping, drenching, etc. | 615 | 10,299 | 17,358 | 7,310 | 1,430 |
| Sheep shearing | 599 | 5,326 | 35,026 | 29,779 | 1,127 |
| Other livestock contracting services | 278 | 7,019 | 10,161 | 3,330 | 182 |
| Total, Livestock contracting services | 1,491 | 22,643 | 62,546 | 40,419 | 2,740 |
| Cultivation and planting | 1,105 | 3,898 | 8,159 | 4,102 | 1,293 |
| Harvesting crops, hay and silage making | 2,268 | 6,490 | 14,659 | 8,289 | 3,178 |
| Grain drying and seed dressing | 450 | 4,004 | 6,642 | 2,651 | 1,073 |
| Other horticultural contracting services | 136 | 1,575 | 3,804 | 2,399 | 262 |
| Total, Horticultural contracting services | 3,960 | 15,968 | 33,264 | 17,441 | 5,807 |
| Aviation topdressing | 1,836 | 17,525 | 29,368 | 11,997 | 3,053 |
| Groundspread topdressing | 973 | 5,539 | 10,146 | 4,843 | 1,032 |
| Aviation spraying | 994 | 8,584 | 12,769 | 4,220 | 681 |
| Groundspread spraying | 667 | 6,401 | 10,641 | 4,275 | 1,101 |
| Total, Topdressing and spraying | 4,471 | 38,050 | 62,923 | 25,335 | 5,866 |
| Other agricultural contracting services | 248 | 1,273 | 2,637 | 1,441 | 449 |
| Total, Agricultural contracting services | 15,655 | 96,124 | 204,304 | 107,439 | 28,184 |
Regional summaries of the census as a whole are shown in the 2 statistical area tables which follow.
| Statistical Area | Operating Units | Persons Engaged At End of February | Salaries and Wages Paid During Year | |
|---|---|---|---|---|
| Establishments | Ancillary Units | |||
| No. | No. | No. | $(000) | |
| Northland | 173 | 2 | 562 | 2,415 |
| Central Auckland | 155 | 1 | 446 | 1,908 |
| South Auckland-Bay of Plenty | 486 | 1 | 1,818 | 8,509 |
| East Coast | 85 | – | 473 | 1,833 |
| Hawke's Bay | 260 | – | 1,269 | 6,821 |
| Taranaki | 113 | – | 389 | 2,235 |
| Wellington | 375 | 1 | 2,490 | 10,322 |
| Total, North Island | 1 647 | 5 | 7 447 | 34,043 |
| Marlborough | 45 | – | 219 | 1,204 |
| Nelson | 65 | – | 1,402 | 1,646 |
| Westland | 18 | – | 64 | 179 |
| Canterbury | 408 | 1 | 1,385 | 7,404 |
| Otago | 176 | 1 | 994 | 5,227 |
| Southland | 204 | – | 1,322 | 5,628 |
| Total, South Island | 916 | 2 | 5 386 | 21,288 |
| Total, New Zealand | 2 563 | 7 | 12 833 | 55,331 |
| Statistical Area | Depreciation | Purchases and Other Expenses | Turnover | Value Added | Capital Expenditure Less Disposals |
|---|---|---|---|---|---|
| $(thousand) | |||||
| Northland | 852 | 4,870 | 10,233 | 5,401 | 1,220 |
| Central Auckland | 765 | 9,577 | 14,787 | 5,365 | 1,029 |
| South Auckland-Bay of Plenty | 3,063 | 17,803 | 36,180 | 18,588 | 4,883 |
| East Coast | 575 | 2,132 | 6,710 | 3,810 | 883 |
| Hawke's Bay | 1,145 | 6,871 | 19,081 | 11,237 | 1,542 |
| Taranaki | 649 | 4,417 | 9,428 | 4,766 | 1,002 |
| Wellington | 2,744 | 17,622 | 34,510 | 19,676 | 3,888 |
| Total, North Island | 9,793 | 63,293 | 130,929 | 68,844 | 14,446 |
| Marlborough | 268 | 1,185 | 3,543 | 1,926 | 548 |
| Nelson | 573 | 3,056 | 6,467 | 3,528 | 651 |
| Westland | 247 | 832 | 1,644 | 840 | 575 |
| Canterbury | 2,257 | 14,214 | 28,836 | 14,172 | 4,118 |
| Otago | 1,090 | 6,433 | 15,336 | 7,743 | 3,587 |
| Southland | 1,428 | 7,111 | 17,547 | 10,387 | 4,259 |
| Total, South Island | 5,862 | 32,831 | 73,374 | 38,595 | 13,738 |
| Total, New Zealand | 15,655 | 96,124 | 204,304 | 107,439 | 28,184 |
New Zealand's requirements of temperate-zone fruits and berries are normally supplied from local orchards. In 1981–82, 57 000 tonnes of bananas and 12 000 tonnes of oranges were imported to supplement the local crop of 7000 tonnes.
The domestic market for horticultural produce is largely satisfied by local production, so emphasis is now on developing crops for export markets.
For many years, the pip fruits have been our major horticultural crop, but kiwifruit has recently replaced them as the single biggest export-earner. Kiwifruit production continues to increase rapidly as new plantings come into production. Most kiwifruit is grown in the Bay of Plenty, although large areas in Nelson, Gisborne, Northland, Auckland, and Hawke's Bay have also been planted.
Exports of berryfruit have also increased recently, especially blackcurrents, blueberries, and boysenberries.
Large areas of wine grapes have been planted, and the main areas in which they are grown (in order of importance) are Gisborne, Hawke's Bay, Marlborough, Auckland, and Waikato.
The commercial production of subtropical fruits is gaining popularity in the northern areas of the North Island, and kiwifruit, tamarillos, avocados, feijoas, and passionfruit are now being cultivated.
Onions are New Zealand's biggest export-earning vegetable and rank third (after kiwifruit and pip fruits) as export earners.
GEOGRAPHIC DISTRIBUTION—Grain growing is localised to a considerable extent. The Canterbury Statistical Area, with its fertile plains, supplies more than one-half of New Zealand's wheat yield, over one-third of the threshed oats, and over one-half of the barley yield. In recent years, however, the North Island and Southland have been growing higher proportions than previously of the wheat and the barley crops.
Maize growing is largely confined to certain parts of the East Coast (notably, Cook County) and to the South Auckland, Waikato, and Bay of Plenty areas.
Peas for threshing are grown extensively in Canterbury (which produces three-quarters of the total yield) and, to a lesser extent, in Marlborough and Wellington. More than two-thirds of the area that is closed off for the production of grass seeds is also in the Canterbury district.
New Zealand's potato production is mainly centred on 3 areas—Pukekohe, near Auckland, which is relatively frost free, produces mainly early potatoes; the Manawatu-Opiki region (North Island) produces main-crop and some early potatoes; and Canterbury produces main-crop potatoes.
The Pukekohe district also provides the Auckland area with a considerable share of its vegetable requirements, as well as being the North Island's main onion-growing area.
Wellington City draws most of its vegetable supplies from the Otaki and Levin districts; while Ohakune (in the centre of the North Island), with a climate and soils suitable for the production of cabbages, carrots, and broccoli, supplies them to both Auckland and Wellington.
Hastings, in Hawke's Bay, has become a centre for the canning and processing of many vegetables.
In the South Island, market gardening is carried on near the cities, on the rich soils near Christchurch, to the south of Oamaru, and on the Taieri Plains, just south of Dunedin. Nelson, too, produces considerable quantities of fresh and processed vegetables, most of which are marketed in Wellington.
Commercial orchards in New Zealand are largely confined to certain areas suited by climatic and soil conditions. The Nelson and Hawke's Bay districts are notable for their apple and pear orchards, a high percentage of the crops from these districts normally being exported. Central Otago is well suited to the growing of stone fruits, particularly apricots and nectarines. Hawke's Bay is also noted for its peach and nectarine production. Citrus fruits are grown in warm areas of the North Island which have suitable soils (principally Kerikeri, Tauranga, and Gisborne). Increasing quantities of kiwifruit for local consumption and export are being grown, particularly in the Bay of Plenty, but also in other areas of the North Island and in Nelson, which also grows a lot of berryfruit.
Grape growing is of importance in the Auckland area, in Hawke's Bay and Gisborne, and more recently in Marlborough. Hop growing is concentrated in the Nelson district.
GRAIN AND SEED CROPS—Details of areas of grain and peas threshed and of total yields by statistical areas are shown in the following table. This applies to the year ended 30 June 1982.
Detailed statistics of crops are contained in the annual report Agricultural Statistics issued by the Department of Statistics.
| Statistical Area | Wheat | Oats | ||
|---|---|---|---|---|
| Area Threshed | Total Yield | Area Threshed | Total Yield | |
| hectares | tonnes | hectares | tonnes | |
| Northland | – | – | 18 | 40 |
| Central Auckland | – | – | 6 | 20 |
| South Auckland-Bay of Plenty | 67 | 258 | 158 | 589 |
| East Coast | – | – | 7 | 26 |
| Hawke's Bay | 209 | 976 | 224 | 602 |
| Taranaki | 412 | 1,868 | 28 | 97 |
| Wellington | 5,354 | 23,472 | 487 | 1,621 |
| North Island | 6,042 | 26,574 | 928 | 2,995 |
| Marlborough | 1,258 | 5,672 | 174 | 484 |
| Nelson | 18 | 77 | 28 | 101 |
| Westland | 1 | 4 | 27 | 57 |
| Canterbury | 39,933 | 144,499 | 6,628 | 20,528 |
| Otago | 7,570 | 34,475 | 2,215 | 9,549 |
| Southland | 16,684 | 80,751 | 5,854 | 27,225 |
| South Island | 65,464 | 265,478 | 14,926 | 57,944 |
| New Zealand | 71 506 | 292 052 | 15 854 | 60 939 |
WHEAT—Control of the distribution of both imported and locally produced wheat rests with the New Zealand Wheat Board, which is also responsible for the distribution of flour and associated offal. The operations of this board, which consists of representatives of flourmillers, wheat growers, bread bakers, the poultry industry, the grain seed and produce business, the Department of Trade and Industry, and the Ministry of Agriculture and Fisheries, with the Minister of Trade and Industry as chairman, and 1 person with no direct association with any of 'he above industries as deputy chairman, are governed by the Wheat Board Act 1965.
All New Zealand milling wheat is purchased from farmers by the Wheat Board through the agency of grain merchants acting as brokers for the board. The board is responsible for the distribution of all imported wheat and its functions also include arrangements for the processing of wheat by flourmillers and the sale of the resultant flour and offal to merchants, bakers, pastry cooks, grocers, and others.
The annual consumption of wheat in New Zealand for flour and cereal foods approximates 300 000 tonnes. Wheat is also required, for poultry foods and seed. Research is assisted by a levy on wheat and flour on the recommendation of the Wheat Research Committee.
MAIZE—Maize is principally grown on the east coast of the North Island, Hawke's Bay, and South Auckland-Bay of Plenty. During the last decade the area threshed has greatly increased from 7138 hectares in 1969 to 22 287 hectares in 1980 (the 1981 figure showed a slight fall to 17 224 hectares, but in 1982 the figure increased to 18 750 hectares). The introduction of improved hybrid maize varieties has considerably increased the yield of grain threshed. Maize is used as poultry feed and is becoming a more important feature of supplementary feed for pigs and other livestock.
BARLEY—Barley is used mainly in the manufacture of stock feeds, and for malting. The production of barley is increasing steadily, mainly because of the growing demand for stock feeds.
OATS—Most of the oats are grown for threshing and green feed and not for chaff. From the grain milled, rolled oats, oatmeal, and proprietary oaten foods are produced, along with feed for animals and fowls.
Potato and onion production is normally adequate.
Wheat production fluctuates in keeping with price variations and imports are sometimes necessary.
| Barley | Peas | Maize | |||
|---|---|---|---|---|---|
| Area Threshed | Total Yield | Area Threshed | Total Yield | Area Threshed | Total Yield |
| hectares | tonnes | hectares | tonnes | hectares | tonnes |
| 65 | 207 | – | – | 344 | 1,846 |
| 149 | 467 | – | – | 201 | 1,686 |
| 797 | 2,904 | 4 | 10 | 12,086 | 110,397 |
| 273 | 1,116 | 53 | 331 | 2,650 | 26,348 |
| 2,996 | 11,983 | 428 | 1,578 | 1,319 | 11,677 |
| 683 | 2,626 | 8 | 20 | 383 | 3,713 |
| 13,422 | 58,625 | 1,269 | 4,483 | 1,614 | 13,344 |
| 18,385 | 77,928 | 1,762 | 6,422 | 18,597 | 169,011 |
| 2,398 | 9,407 | 927 | 2,783 | 77 | 494 |
| 693 | 2,566 | 54 | 165 | 76 | 566 |
| 4 | 12 | – | – | – | – |
| 51,164 | 192,458 | 13,801 | 39,542 | – | – |
| 8,781 | 38,718 | 504 | 1,670 | – | – |
| 7,109 | 34,698 | 642 | 2,021 | – | – |
| 70,149 | 277,859 | 15,928 | 46,181 | 153 | 1,060 |
| 88 534 | 355 787 | 17 690 | 52 603 | 18 750 | 170 071 |
Animals can be grazed in open pasture for the full 12 months of the year, but the winter growth of grass, except in certain favoured localities, requires to be supplemented in order to keep stock in good condition during the colder months, and in some districts supplementary fodders are necessary in the drier summer months. Hay and silage crops are grown almost exclusively on the farms where they are consumed, though some districts specialise in the growing of certain other supplementary fodder crops. The bulk of the supplementary fodders, other than grass and clover, hay, and silage, is grown in the South Island, since the colder climate necessitates more extensive supplementary feeding than in the North Island.
The renewal and extension of pastures require the annual supply of very considerable quantities of grass seed. There is an appreciable export trade in some species of grass seeds.
The following table shows the varieties of wheat, oats, barley, and peas threshed during the year ended 30 June 1982. It should be noted that some farms grow more than 1 variety of a crop and that if, for example, a farm grows 3 varieties of wheat it appears 3 times in the “Number of Farms” column. As a result, the aggregates of farms by individual varieties may exceed the totals of farms under particular crops.
| Variety | Number of Farms | Area Threshed | Total Yield | Average Yield Per Hectare | Percentage of Surveyed Area | Percentage of Total Yield |
|---|---|---|---|---|---|---|
| hectares (000) | tonnes (000) | tonnes | percent | percent | ||
| Wheat— | ||||||
| Rongotea | 1,213 | 22,395 | 85,502 | 4 | 10.51 | 9.15 |
| Hilgendorf | 354 | 4,739 | 15,857 | 3 | 2.22 | 1.70 |
| Arawa | 123 | 1,486 | 4,927 | 3 | 0.70 | 0.53 |
| Oroua | 478 | 5,935 | 22,816 | 4 | 2.78 | 2.44 |
| Kopara | 826 | 12,084 | 48,264 | 4 | 5.67 | 5.16 |
| Takahe | 852 | 14,506 | 69,880 | 5 | 6.81 | 7.48 |
| Karamu | 535 | 6,937 | 29,954 | 4 | 3.25 | 3.21 |
| Other | 296 | 3,424 | 14,852 | 4 | 1.61 | 1.59 |
| Total | 4 677 | 71 506 | 292 052 | 4 | 33.55 | 31.25 |
| Oats— | ||||||
| Onward (Oware) | 339 | 1,496 | 6,033 | 4 | 0.70 | 0.65 |
| Mapua (Makaru) | 1,393 | 9,603 | 38,816 | 4 | 4.51 | 4.15 |
| Taiko | 232 | 1,176 | 4,010 | 3 | 0.55 | 0.43 |
| Other white | 282 | 1,381 | 4,806 | 3 | 0.65 | 0.51 |
| Other coloured | 176 | 966 | 3,394 | 4 | 0.45 | 0.36 |
| Amuri | 323 | 841 | 2,573 | 3 | 0.39 | 0.28 |
| Black supreme | 87 | 391 | 1,307 | 3 | 0.18 | 0.14 |
| Total | 2 832 | 15 854 | 60 939 | 4 | 7.44 | 6.52 |
| Barley— | ||||||
| Mata | 809 | 12,666 | 47,282 | 4 | 5.94 | 5.06 |
| Hassan | 1,159 | 13,501 | 54,142 | 4 | 6.33 | 5.79 |
| Manapou | 193 | 2,204 | 8,011 | 4 | 1.03 | 0.86 |
| Kaniere | 862 | 9,522 | 35,927 | 4 | 4.47 | 3.84 |
| Magnum | 718 | 9,964 | 42,099 | 4 | 4.67 | 4.51 |
| Zephyr | 1,325 | 15,956 | 61,233 | 4 | 7.49 | 6.55 |
| Other | 2,021 | 24,721 | 107,093 | 4 | 11.60 | 11.46 |
| Total | 7 087 | 88 534 | 355 787 | 4 | 41.54 | 38.07 |
| Peas— | ||||||
| Field varieties— | ||||||
| Maple | 419 | 5,464 | 15,205 | 3 | 2.56 | 1.63 |
| White | 218 | 2,076 | 6,554 | 3 | 0.97 | 0.70 |
| Blue Boiling | 267 | 3,752 | 11,695 | 3 | 1.76 | 1.25 |
| Other | 197 | 2,142 | 6,146 | 3 | 1.00 | 0.66 |
| Garden varieties | 431 | 4,256 | 13,003 | 3 | 2.00 | 1.39 |
| Total | 1 532 | 17 690 | 52 603 | 3 | 8.30 | 5.63 |
| Other grain crops— | ||||||
| Maize | 1,113 | 18,750 | 170,071 | 9 | 8.80 | 18.20 |
| Other grain | 105 | 806 | 3,021 | 4 | 0.38 | 0.32 |
| Total | 1 218 | 19 556 | 173 092 | 9 | 9.18 | 18.52 |
VEGETABLES—The following table shows vegetable production for the fresh market and for processing during the latest 3 seasons for which figures are available.
| Vegetable | 1980 | 1981 | 1982 | |||
|---|---|---|---|---|---|---|
| Fresh Market | For Processing | Fresh Market | For Processing | Fresh Market | For Processing | |
| * Does not include production in glasshouses. | ||||||
| tonnes | ||||||
| Asparagus | 463 | 682 | 655 | 917 | 733 | 1,150 |
| Beans: green* | 672 | 10,284 | 664 | 8,207 | 530 | 10,208 |
| Beans: broad | 191 | 690 | 153 | 823 | 115 | 1,103 |
| Beetroot | 1,177 | 3,420 | 903 | 2,895 | 901 | 2,538 |
| Brussel sprouts | 1,382 | 316 | 1,693 | 370 | 1,158 | 217 |
| Cabbage | 31,072 | 1,442 | 32,186 | 1,167 | 29,922 | 307 |
| Capsicums/peppers | 315 | 190 | 312 | 232 | 248 | 259 |
| Carrots | 27,313 | 7,790 | 25,716 | 2,576 | 22,848 | 7,392 |
| Cauliflower (incl. broccoli) | 23,201 | 1,056 | 23,230 | 2,542 | 17,405 | 630 |
| Celery | 4,589 | 274 | 4,319 | 153 | 4,992 | 250 |
| Courgettes/zucchini | 1,034 | 14 | 833 | 42 | 457 | 14 |
| Cucumbers* | 498 | – | 236 | 9 | 284 | 6 |
| Garlic | 1,330 | – | 962 | – | 1,346 | 200 |
| Gherkins | 201 | 5 | 69 | 265 | 43 | 210 |
| Kumera | 15,768 | – | 10,301 | – | 6,796 | – |
| Lettuce | 17,897 | – | 19,100 | – | 20,982 | – |
| Leeks | 1,329 | – | 1,274 | 320 | 1,205 | 98 |
| Marrow | 332 | 350 | 325 | – | 317 | – |
| Melon: rock (cantaloupe) | 378 | – | 650 | – | 624 | – |
| Melon: water | 2,506 | – | 4,386 | – | 3,916 | – |
| Onions | 76,817 | 2,336 | 66,416 | 2,458 | 78,599 | 731 |
| Parsnips | 13,889 | – | 6,975 | – | 13,647 | – |
| Peas | 319 | 36,963 | 1,050 | 26,525 | 305 | 40,451 |
| Pumpkin/squash | 19,753 | – | 29,257 | 125 | 35,633 | 340 |
| Rhubarb | 354 | 30 | 344 | 30 | 315 | – |
| Silverbeet | 1,298 | – | 1,242 | – | 1,354 | – |
| Sprouting broccoli | 712 | 101 | 1,083 | 120 | 1,239 | 113 |
| Sweet corn | 5,394 | 32,331 | 4,494 | 31,932 | 3,299 | 31,340 |
| Turnips: white | 206 | – | 286 | – | 103 | – |
| Turnips: swede | 2,856 | – | 4,560 | – | 3,901 | – |
| Tomatoes (outdoor)* | 9,528 | 29,454 | 9,523 | 20,185 | 7,372 | 35,929 |
| Source: Ministry of Agriculture and Fisheries. | ||||||
The major areas producing vegetables for processing are the alluvial plains around Hastings, Palmerston North, Gisborne, Christchurch, and Timaru. Onions and cabbages are the biggest crops, followed by sweetcorn, tomatoes, pumpkin/squash, and carrots.
The total net area of land devoted to the production of outdoor vegetables (excluding potatoes) during the October 1982 year was some 28 800 hectares. The aggregate area of the fresh-market crops was estimated at 12 500 hectares. An estimated 16 300 hectares were growing vegetable crops for processing.
For the June 1983 year, the principal fresh-vegetable exports were onions (50 839 tonnes), and potatoes (12 894 tonnes).
POTATOES—The production of potatoes is usually adequate to meet home market requirements.
Potato yields have risen to such an extent that a population of 3 million is now supplied from the same area as were 1¾ million people 30 years earlier. Most of this increased production has been the result of research, the introduction of new varieties, and better farming practice.
Figures for area and yield of potatoes for the latest available 5 years are as follows:
| Season | Area Dug | Yield | Yield per Hectare Dug | ||||
|---|---|---|---|---|---|---|---|
| For Table | For Processing | For Seed | For Pig Food | Total | |||
| hectares | tonnes | ||||||
| 1977–78 | 9,285 | 170,940 | 35,860 | 24,406 | 6,085 | 237,291 | 25.56 |
| 1978–79 | 7,501 | 146,493 | 31,436 | 19,567 | 5,789 | 203,285 | 27.10 |
| 1979–80 | 7,626 | 151,782 | 32,803 | 22,599 | 6,373 | 213,557 | 28.00 |
| 1980–81 | 7,646 | 148,475 | 31,498 | 21,736 | 7,066 | 208,775 | 27.31 |
| 1981–82 | 8,795 | 165,853 | 44,375 | 22,874 | 5,623 | 238,725 | 27.14 |
ONIONS—Approximately 85 percent of the onion crop is normally grown in the North Island, principally in the Pukekohe district. The following table shows the area and yield of onions for the latest available 5 seasons.
| Season | Area | Total Yield | Yield per Hectare |
|---|---|---|---|
| * Onion yield is no longer collected. | |||
| hectares | tonnes | tonnes | |
| 1977–78 | 1,893 | 61,441 | 32.46 |
| 1978–79 | 2,122 | 69,025 | 32.53 |
| 1979–80 | 2,289 | 79,153 | 34.58 |
| 1980–81 | 2,137 | 68,874 | 32.23 |
| 1981–82 | 1,920 | * | * |
GLASSHOUSES—The following table shows the area and yield of glasshouses (heated and cold) given over to the production of vegetables and grapes.
| Vegetable or Fruit | 1980 | 1981 | ||
|---|---|---|---|---|
| Area | Yield | Area | Yield | |
| m2(000) | tonnes | m2(000) | tonnes | |
| Tomatoes | 1 215.6 | 18,306 | 1 218.3 | 18,266 |
| Cucumbers and gherkins | 110.9 | 2,027 | 122.8 | 1,991 |
| Beans | 22.9 | 73 | 30.5 | 84 |
| Capsicums and peppers | 13.5 | 100 | 13.6 | 66 |
| Grapes | 51.1 | 217 | 50.3 | 221 |
| Source: Ministry of Agriculture and Fisheries. | ||||
LINSEED—Most of the linseed is grown under contract for the production of linseed oil. About 3500 hectares are sown each year. The oil is extracted mainly for use in paints, and the residue provides a valuable concentrate for stock food.
SEED CERTIFICATION—The Ministry of Agriculture and Fisheries operates a seed certification scheme covering the more important herbage species, cereals, brassicas, and potatoes. Bred varieties of these species are produced by the Grasslands and the Crop Research Divisions of the DSIR. These are then reproduced under the control of the Ministry of Agriculture and Fisheries which releases them as Breeder's seed which in turn produces Basic seed. The final stages in the multiplication of certified seed are known as 1st and 2nd Generation seeds. Basic and Certified seed, 1st and 2nd Generation, are sold through the usual commercial channels.
MACHINE-DRESSED SEED—The production of machine-dressed grass, clover, brassica, and other seed for the year ended 31 December 1983, is set out in the following table together with the corresponding totals for 1982. The figures are taken from returns from seed dressing plants.
| Type of Seed | 1982 | 1983 |
|---|---|---|
| tonnes | ||
| Ryegrass— | ||
| Hybrid | 942 | 1,260 |
| Italian ryegrass (including Western Wolths) | 344 | 1,114 |
| Perennial ryegrass | 11,534 | 9,080 |
| Tetraploid | 369 | 966 |
| Other grasses— | ||
| Browntop | 74 | 34 |
| Chewing fescue | 12 | 11 |
| Cocksfoot | 751 | 571 |
| Crested dogstail | 88 | 29 |
| Prairie grass | 35 | 69 |
| Timothy | 132 | 84 |
| Yarrow | 2 | 2 |
| Yorkshire fog | 23 | 9 |
| Tall fescue | 27 | 6 |
| Clovers— | ||
| Lotus | 64 | 41 |
| Mixed clovers | 133 | 137 |
| Suckling clover | 232 | 17 |
| White clover | 4,855 | 7,714 |
| Red clover | 458 | 266 |
| Other— | ||
| Lucerne | 94 | 89 |
| Kale | 284 | 221 |
| Maize | 1,474 | 1,610 |
| Peas— | ||
| Garden | 11,963 | 16,858 |
| Field | 21,872 | 23,387 |
| Rape | 814 | 474 |
| Turnip | 100 | 44 |
| Barley | 12,627 | 17,261 |
| Oat | 5,473 | 6,259 |
| Ryecorn | 822 | 1,028 |
| Wheat | 12,872 | 11,796 |
| Linseed | 271 | 367 |
Large quantities of grass and clover seed have been exported during recent years, especially to the United Kingdom, Australia, and the United States of America. Details of the volume and value of exports during recent years will be found in Section 23B of this Yearbook.
HORTICULTURAL LAND USE—The following data, supplied by the Ministry of Agriculture and Fisheries, give an indication of the net areas of land devoted to the main horticultural crops in 1982.
| Crops | hectares |
|---|---|
| Outdoor vegetables (includes process crops, but not potatoes) | 28,818 |
| Pip fruits | 6,883 |
| Vineyards | 5,901 |
| Kiwifruit | 9,451 |
| Stone fruits | 3,207 |
| Citrus fruits | 2,945 |
| Other subtropical fruits | 1,718 |
| Hops | 202 |
ORCHARDS AND THE FRUIT INDUSTRY—Pip and stone fruits are grown commercially throughout New Zealand, whereas citrus and subtropical fruits are largely confined to the coastal strip from North Auckland through the Bay of Plenty to Poverty Bay.
The following table compares the areas planted in various fruits in 1982 with the situation at the 1978 survey. The main producing areas for the various fruits are also given.
| Fruit | 1978* | 1982† | Main Districts |
|---|---|---|---|
* Figures collected by the Ministry of Agriculture and Fisheries. †Figures collected by the Department of Statistics' Agriculture Census. | |||
| hectares | |||
| Pip fruit— | |||
| Apples | 5,596 | 6,208 | Nelson, Hawke's Bay. |
| Pears | 446 | 675 | Hawke's Bay, Nelson. |
| Stone fruit— | |||
| Apricots | 552 | 571 | Otago. |
| Cherries | 110 | 182 | Otago, Marlborough. |
| Nectarines | 364 | 706 | Otago, Hawke's Bay. |
| Peaches | 1,031 | 1,202 | Hawke's Bay, Auckland, Otago. |
| Plums | 341 | 546 | Hawke's Bay, Auckland. |
| Citrus fruit— | |||
| Grapefruit | 445 | 510 | Bay of Plenty. |
| Lemons | 114 | 257 | Bay of Plenty. |
| Mandarins | 278 | 504 | Bay of Plenty, Northland. |
| Oranges (sweet) | 519 | 902 | Northland, Poverty Bay. |
| Tangelos | 489 | 766 | Bay of Plenty, Northland, Poverty Bay. |
| Subtropical fruit— | |||
| Kiwifruit | 2,195 | 9,451 | Bay of Plenty. |
| Tamarillos | 225 | 571 | Northland, Bay of Plenty. |
| Avocados | 126 | 741 | Bay of Plenty, Poverty Bay. |
| Feijoas | 70 | 406 | Bay of Plenty. |
GRAPE GROWING AND WINE PRODUCTION—The estimated net area of the vineyards throughout New Zealand as at June 1982 was 5901 hectares The main grape-growing areas are Poverty Bay, Hawke's Bay, Marlborough, and Auckland.
In the following table the figures of wine production and sales are based on an annual census of New Zealand winemakers licensed under the Wine Makers Act 1981 and producing fruit-wine or grape-wine during the current June year.
New wine put down during the 1982–83 season increased from 47.2 million litres the previous year to 58.0 million litres, a 22.9 percent rise. Disposals increased by 0.1 percent.
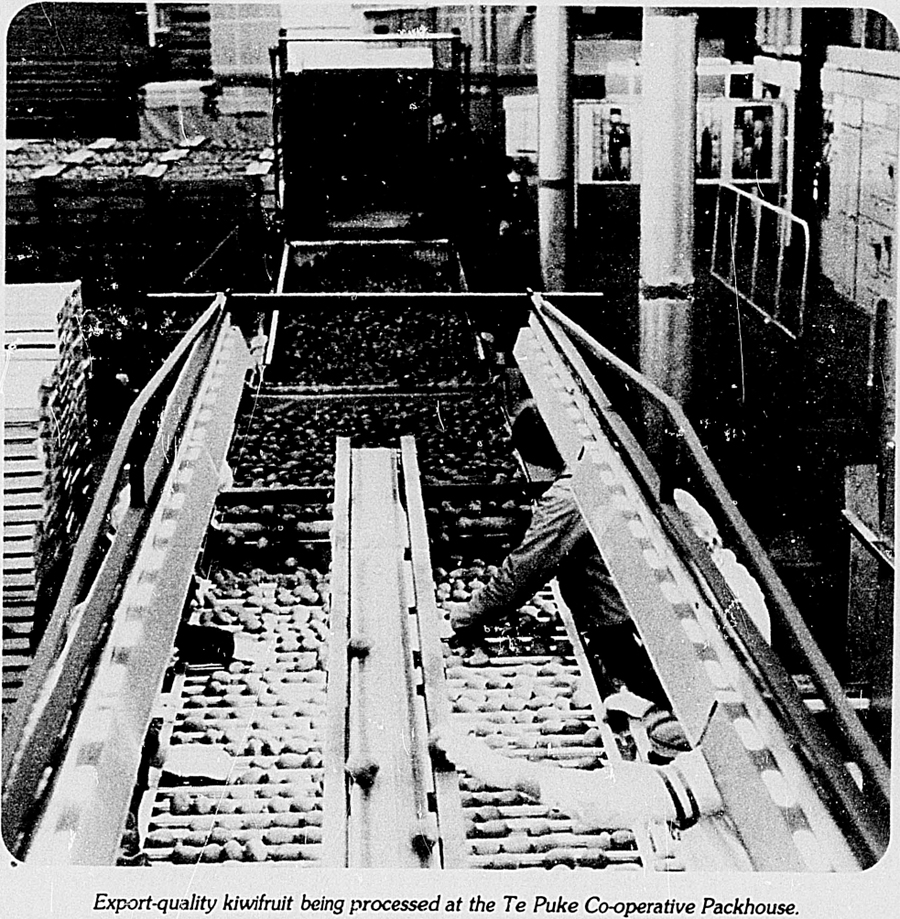
| Item | Year ended June | ||
|---|---|---|---|
| 1981 | 1982 | 1983 | |
| * Differences between closing stocks one year and opening stocks the next are caused by changes in the numbers of licence holders operating. | |||
| litres(000) | |||
| Winery stocks at start of season* | 55,547 | 51,521 | 58,109 |
| Production during season | 44,353 | 47,229 | 58,026 |
| Disposals during season | 43,456 | 39,135 | 39,186 |
| Winery stocks at end of season* | 53,623 | 57,781 | 75,355 |
| Losses during season, samples, spillages, own-consumption, etc. | 2,821 | 1,834 | 1,751 |
For the 1981–82 season data on grape wines by type were collected for the first time. Production, sales, and closing stocks for the 1981–82 and 1982–83 seasons are shown in the following table.
| Crape Wines | Year ended June | |
|---|---|---|
| 1981–82 | 1982–83 | |
| * Includes cocktails and liqueurs. | ||
| Production— | litres (000) | |
| Table wines—White still | 27,388 | 35,081 |
| Red and rose still | 3,396 | 4,748 |
| Sparkling | 5,640 | 4,837 |
| Total, table wines | 36 424 | 44 666 |
| Fortified wines (including all cocktail liqueurs) | 10,577 | 13,077 |
| Total, production | 47 002 | 57 743 |
| Sales— | ||
| Table wines—White still | 20,538 | 21,075 |
| Red and rose still | 2,767 | 2,779 |
| Sparkling | 4,745 | 4,850 |
| Total, table wines | 28,049 | 28,704 |
| Fortified (including all cocktail liqueurs) | 10,662 | 10,085 |
| Total, sales | 38 711 | 38 789 |
| Stocks at 30 June— | ||
| Table | 44,034 | 57,878 |
| Fortified | 13,153 | 16,824 |
| Total | 57 187 | 74 702 |
APPLES AND PEARS—A summary of the activities of the New Zealand Apple and Pear Marketing Board appears in Section 22A. Over 1000 orchardists consistently sell apples and pears to the board. Over 80 percent of the total crop received comes from Nelson and Hawke's Bay.
The following table shows the quantities of the main varieties of fresh apples and pears received by districts by the Apple and Pear Marketing Board during the 1982–83 season.
| Variety | Hawke's Bay | Nelson | Other Districts | Total |
|---|---|---|---|---|
| Apples— | cartons (000) | |||
| Granny Smith | 2,400 | 1,192 | 510 | 4,102 |
| Sturmer Pippin | 200 | 493 | 165 | 858 |
| Golden Delicious | 200 | 438 | 144 | 782 |
| Red Delicious | 1,250 | 662 | 308 | 2,220 |
| Cox's Orange Pippin | 125 | 510 | 103 | 738 |
| Other | 721 | 571 | 317 | 1,609 |
| Total apples | 4 896 | 3 866 | 1 547 | 10 309 |
| Pears— | ||||
| Packham's Triumph | 40 | 58 | 9 | 107 |
| Winter Cole | 57 | 24 | 6 | 87 |
| Winter Nelis | 62 | 9 | 17 | 88 |
| Other | 33 | 29 | 16 | 78 |
| Total pears | 192 | 120 | 48 | 360 |
HOPS—The whole of the hop gardens are located in Waimea County in Nelson and all the requirements of hops for New Zealand are produced. Production per hectare usually ranges between 1600 kilograms and 2000 kilograms.
The total crop produced in the 1983 season was 367 895 kilograms. All the crop is picked by machines. Hop gardens in production covered 201.66 hectares in 1983, the same as the previous year. The yield for the 1983 season averaged 1824 kilograms per hectare. A total of 181 674 kilograms of hops was exported to West Germany. The balance was used in this country. The average alpha acid for the seasons' crop was 13 percent.
A Hop Marketing Committee of 6 members (1 Government and 5 producers) was established by the Hop Marketing Regulations 1939 to regulate and control the marketing, either locally or overseas, of all hops produced in New Zealand and to assist the industry generally.
TOBACCO—Tobacco is grown mainly in the Motueka district. Most of the tobacco produced is flue-cured, producing a yellow-leaf tobacco which is largely used for the manufacture of cigarettes, the balance, burley, being used mainly in the manufacture of smoking mixtures and pipe tobacco. Some 3650 tonnes of raw tobacco leaf was imported during 1975–76, 3500 tonnes during 1976–77, 4320 tonnes during 1977–78, 2657 tonnes during 1978–79, 3483 tonnes during 1979–80, 3410 tonnes during 1980–81, 3555 tonnes during 1981–82, and 3232 tonnes during 1982–83. About 38 percent of imported leaf comes from the USA.
| Season | Number of Growers | Area Planted* | Production | Estimated Value of Crop |
|---|---|---|---|---|
* Contract area amended after planting operations completed. †Area not measured in 1981–82. | ||||
| hectares | kg(000) | $(000) | ||
| 1978–79 | 310* | 1,718 | 3 750* | 14,340 |
| 1979–80 | 269 | 1,513 | 3,250 | 13,604 |
| 1980–81 | 237 | 1,027 | 2,290 | 10,148 |
| 1981–82 | 122 | † | 1,530 | 7,350 |
| 1982–83 | 135 | 657 | 1,583 | 8,279 |
The production figures represent the weight of the leaf purchased from growers before redrying. Flue-cured leaf accounted for 98 percent and burley leaf for 2 percent of the 1982–83 crop.
Approximately half the tobacco used by New Zealand manufacturers in the production of cigarettes and cut tobacco is New Zealand grown. The actual average percentages used during recent years ended 30 June has been as follows: 1971, 49.3 percent; 1972, 49.1 percent; 1973, 49.2 percent; 1974, 48.3 percent; 1975, 47.1 percent; 1976, 45.9 percent; 1977, 44.2 percent; 1978, 41.6 percent; 1979, 44.7 percent; 1980, 44.8 percent; 1981, 44.7 percent; 1982, 42.6 percent; and 1983, 43.4 percent.
The above table reflects the dramatic change brought about in 1981 by the Government's package of measures to restructure the industry, at which time some 1830 hectares was licensed to grow tobacco. Growers surrendered the whole or part of their licence against the payment to them by the Government of an Adjustment Assistance Grant, which had the effect of reducing the area planted in tobacco by almost two-thirds. Because of higher yields and increased efficiency, this area is able to produce the present requirements of the manufacturing sector. For the future some degree of flexibility is planned to allow for expansion or contraction and to avoid any danger of over-production. The tobacco growing industry is administered by the Tobacco Board under the jurisdiction of the Minister of Trade and Industry, and tobacco growing remains a licensed industry with its production controlled by means of individual grower quotas, which relate to the needs of tobacco manufacturing companies.
Agriculture is a major industry upon which much of New Zealand's prosperity depends. It has the capacity to expand provided circumstances are favourable for development. The lines of development are influenced by overseas prices received for farm products in the form of meat, wool, butter, cheese, milk powder, casein, etc. Although there is a time-lag associated with livestock breeding, the livestock numbers are an indication of the response of farmers to financial incentives, although weather factors, such as drought, are also involved.
Livestock numbers over a 50-year period are shown in the Statistical Summary near the back of this Yearbook.
New Zealand has more than 20 times as many sheep as people: this ratio is probably not exceeded in any country in the world. Grasslands have been developed to the extent that the best dairy farms can carry 2½ cows to the hectare, and the best sheep farms can support up to 25 sheep to the hectare throughout the year.
The first sheep stations in the 1840s were stocked with Merinos from Australia. During the 1850s and 1860s several English breeds of sheep were imported, notably Southdowns, Leicesters, Lincolns, and Romneys. In 1855 there were 761 700 sheep in the country; by 1870 there were 9 700 000. Until 1882, the year of the successful introduction of cargo refrigeration when mutton and lamb exports were sent to London, the Merino and its crosses were predominant, because the only sheep products of any importance for export were wool and a little tallow, obtained by boiling down carcasses. Then the Merino was superseded in the North Island by breeds more suited to the climate and conditions. Today the flock sheep of the North Island are nearly all predominantly of Romney blood. In the South Island, Merino blood in varying degree continued to play an important part in the flock structure but Merino crosses are now restricted to the foothills of the Southern Alps, while Corriedales are more profitable in the better hill country, and crossbreeds and long-woolled British breeds at lower levels.
In 1851 there were 193 000 cattle in New Zealand and by 1897 the number had reached 1 138 000. Cattle raising and fattening are usually associated with hill-country sheep farming and fat-lamb farming respectively, and beef stock are grazed chiefly in the North Island.
The growth of dairy herds was related to the availability of refrigeration for the export of butter from 1882, and the development of butter and cheese factories. There were 300 000 dairy cows by 1897, 185 000 of them in the North Island and 115 000 in the South Island. Now the North Island has more than 12 times as many dairy cows as the South Island. The slowdown in the rate of increase in sheep numbers and the decline in the beef cattle herd reflect the impact of less favourable climatic conditions in recent seasons, uncertainty over market prospects and declining real net incomes. These factors result in lower levels of on-farm investment, and a reduction in the rate of expansion of livestock numbers.
Over the six years to June 1981 sheep numbers increased by about 4 percent per annum. In the year to June 1982 sheep numbers increased by only 0.6 percent to 70.3 million.
Beef numbers have continued to decline, a trend first evident in 1976, and at 30 June 1982 total beef cattle were estimated at 5 million compared to 6.3 million in 1975. A further decline to 4.5 million is forecast over the year to June 1983.
In the following table, livestock numbers are shown by farm-type category as at 30 June 1982.
| Farm Type* | Beef Cattle | Dairy Cattle | Sheep | Pigs |
|---|---|---|---|---|
*75 percent or more of gross income is derived from stated activity. †From 51 to 74 percent of gross income is derived from first named activity and between 20 and 40 percent from second activity. ‡Two or more activities of roughly equal proportions. §More than 50 percent of gross income is derived from stated activity. || Broiler chicken production units included in “other farming”. | ||||
| (thousand) | ||||
| Dairy farming: factory supply* | 121 | 2,277 | 241 | 20 |
| Dairy farming: town milk supply* | 18 | 247 | 33 | 2 |
| Sheep farming* | 1,403 | 26 | 42,518 | 10 |
| Beef farming* | 733 | 17 | 402 | 4 |
| Pig farming* | 5 | 2 | 29 | 233 |
| Cropping* | 5 | 2 | 275 | 1 |
| Dairy farming with sheep† | 14 | 54 | 255 | 1 |
| Dairy farming with beef† | 62 | 102 | 36 | 1 |
| Dairy farming with other† | 10 | 88 | 42 | 13 |
| Sheep farming with dairy† | 8 | 16 | 227 | – |
| Sheep farming with beef† | 1,693 | 14 | 17,462 | 4 |
| Sheep farming with cropping† | 21 | 1 | 2,202 | 1 |
| Sheep farming with other† | 35 | 3 | 978 | 7 |
| Beef farming with dairy† | 14 | 9 | 4 | – |
| Beef farming with sheep† | 335 | 4 | 1,430 | 1 |
| Beef farming with other† | 28 | 2 | 15 | 3 |
| Cropping with sheep† | 7 | – | 801 | 2 |
| Cropping with other† | 8 | 2 | 38 | 3 |
| Pig farming with other† | 3 | 7 | 31 | 57 |
| Horse breeding§ | 7 | 2 | 24 | – |
| Mixed livestock‡ | 317 | 88 | 2,476 | 33 |
| Poultry farming§|| | 2 | 1 | 21 | 3 |
| Market gardening§ | 11 | 3 | 62 | 1 |
| Orchards including citrus§ | 3 | – | 50 | – |
| Tobacco growing§ | 1 | – | 14 | – |
| Other farming|| | 44 | 38 | 636 | 5 |
| Total, all farm types | 4 906 | 3 007 | 70 301 | 406 |
Figures as at 30 June 1982 gave a total of 4 905 639 for beef cattle (of which, breeding cows and heifers totalled 1 576 035 compared with 1 782 193 the previous year), and a total of 3 006 664 for dairy cattle, of which 2 313 024 (compared with 1 976 057 the previous year) were dairy cows in milk.
The 1982 figures showed a 4.1 percent decrease in beef cattle, and a 2.9 percent increase in dairy cattle. The beef cattle herd has been increasingly supplemented in recent years by dairy-bred cattle reared for beef production, as indicated by the declining calf kill.
The dairying and beef-production industries are both largely concentrated in the North Island which, in 1982, had 78 percent of the total cattle and 92 percent of the dairy stock. Localising the dairying industry still further, it is found that 66 percent of the milking cows of New Zealand are in the northern half of the North Island.
Beef cattle are fairly evenly spread over the North Island, except Taranaki and areas close to Auckland.
If the number of beef breeding cows 2 years old and over are taken as a guide to beef production, South Auckland - Bay of Plenty and Wellington statistical areas easily lead with 33 percent of the New Zealand total between them. Northland is next, followed by Hawke's Bay and East Coast in that order. These 5 districts together pasture 69 percent of breeding cows.
Northland, Central Auckland, and South Auckland - Bay of Plenty statistical areas account for 42 percent of the pig population and Wellington and Taranaki for 22 percent. The number of pigs kept in the Nelson and Canterbury areas has increased considerably in recent years and 22 percent of the pig population is now in these areas. In recent decades tanker collection of whole milk from dairy farms has reduced the rearing of pigs as a sideline but major developments have taken place in the rearing of grain-fed pigs in large units.
Sheep farming is more evenly distributed between the North and South Islands. The statistical areas of major importance are Canterbury, Wellington, South Auckland - Bay of Plenty, Otago, Southland, and Hawke's Bay in that order. These 6 districts accounted for 84 percent of the total sheep population in 1982.
The following table shows the distribution of livestock at 30 June 1982.
| Statistical Area | Dairy Cattle | Beef Cattle | Sheep | Pigs |
|---|---|---|---|---|
| (000) | ||||
| Northland | 333 | 627 | 2,340 | 12 |
| Central Auckland | 226 | 257 | 1,105 | 54 |
| South Auckland - Bay of Plenty | 1,416 | 1,098 | 9,991 | 102 |
| East Coast | 4 | 395 | 3,046 | 3 |
| Hawke's Bay | 50 | 565 | 7,853 | 11 |
| Taranaki | 492 | 185 | 1,719 | 33 |
| Wellington | 246 | 722 | 10,954 | 56 |
| North Island | 2,768 | 3,850 | 37,008 | 272 |
| Marlborough | 20 | 104 | 1,686 | 15 |
| Nelson | 60 | 82 | 1,097 | 14 |
| Westland | 34 | 62 | 297 | 1 |
| Canterbury | 69 | 327 | 11,997 | 76 |
| Otago | 29 | 387 | 9,220 | 17 |
| Southland | 26 | 194 | 8,997 | 12 |
| South Island | 239 | 1,056 | 33,294 | 134 |
| New Zealand | 3 007 | 4 906 | 70 301 | 406 |
Detailed statistics of livestock are contained in the annual report Agricultural Statistics, published by the Department of Statistics.
SHEEP—The following table analyses categories of sheep.
| At 30 June | Rams | Wethers | Breeding Ewes | Other Sheep | Hoggets | Total | ||
|---|---|---|---|---|---|---|---|---|
| Ram | Wether | Ewe | ||||||
* Includes dry ewes †Included with wether hoggets. | ||||||||
| (thousand) | ||||||||
| 1978 | 954 | 2 166* | 44,515 | 345 | 2,363 | 11,821 | 62,163 | |
| 1979 | 937 | † | 46,108 | 342 | 3,258 | 12,880 | 63,523 | |
| 1980 | 958 | 1,144 | 48,245 | 1,099 | 460 | 2,905 | 13,960 | 68,772 |
| 1981 | 993 | 1,582 | 50,059 | 421 | 2,844 | 13,985 | 69,884 | |
| 1982 | 964 | 1,388 | 51,560 | 446 | 2,423 | 13,520 | 70,301 | |
Data on sheep breeds collected in 1979 indicate that, of the 63.5 million sheep in New Zealand at the end of June 1979, 28.4 million (44.6 percent) were Romneys, 11.4 million (17.9 percent) were Perendale, 11.3 million (17.8 percent) were Coopworth, 5 million (7.9 percent) were Corriedale, 3.7 million (5.8 percent) were Merino and half-bred, and 3.8 million (6 percent) were other breeds. Sheep breed data are collected every 5 years.
In the 1978 Budget the Government announced a livestock subsidy scheme of 50c per head for sheep and this could be reflected in the returns for that year.
The following table shows numbers of flocks by size of flock.
| Size of Flock | 1978 | 1979* | 1980 | 1981 | 1982 |
|---|---|---|---|---|---|
| * Up to 1979, official sheep statistics were derived from Sheep Returns (Ministry of Agriculture and Fisheries). Thereafter, official statistics were taken from the annual June Census of Farm statistics (Department of Statistics). | |||||
| 1–99 | 5,484 | 4,758 | 8,808 | 8,926 | 10,214 |
| 100–199 | 2,211 | 2,154 | 2,604 | 2,517 | 2,724 |
| 200–499 | 3,806 | 3,776 | 4,087 | 3,996 | 4,066 |
| 500–999 | 4,243 | 3,976 | 3,774 | 3,702 | 3,699 |
| 1 000–1 499 | 4,114 | 3,962 | 3,524 | 3,400 | 3,397 |
| 1 500–1 999 | 4,292 | 4,093 | 3,811 | 3,638 | 3,492 |
| 2 000–2 499 | 3,694 | 3,633 | 3,518 | 3,474 | 3,469 |
| 2 500–4 999 | 6,359 | 6,525 | 7,219 | 7,329 | 7,428 |
| 5 000–9 999 | 1,597 | 1,733 | 2,108 | 2,137 | 2,170 |
| 10 000 and over | 318 | 356 | 456 | 522 | 531 |
| Total flocks | 36 118 | 34 966 | 39 909 | 39 641 | 41 190 |
| Average flock size | 1,721 | 1,816 | 1,723 | 1,763 | 1,707 |
CATTLE—Numbers of cattle at 30 June of the 3 latest available years are given by categories in the following table.
| Category | 1980 | 1981 | 1982 |
|---|---|---|---|
* Heifers not yet in milk, and cows not in milk during season but intended to be used again for dairying. †Includes bobby calves. ‡Includes cows culled from dairy herds (20 520 in 1980, 19 870 in 1981 and 21 162 in 1982). | |||
| Dairy stock— | |||
| Cows and heifers, 2 years old and over— | |||
| Cows in milk or calf | 1,999,227 | 1,976,057 | 2,005,389 |
| Others* | 49,439 | 57,179 | 75,505 |
| Heifers— | |||
| One and under 2 years old | 453,618 | 435,092 | 436,381 |
| Under 1 year old | 400,902 | 394,809 | 434,715 |
| Bulls and bull calves intended for dairy breeding | 57,319 | 56,996 | 52,757 |
| Total dairy stock† | 2 968 953 | 2 922 049 | 3 006 664 |
| Beef stock— | |||
| Breeding cows and heifers, 2 years old and over | 1,688,358 | 1,623,677 | 1,576,035 |
| Cows, 2 years old and over, not used for breeding | 172,183 | 163,603 | 197,373 |
| Heifers— | |||
| One and under 2 years old | 583,356 | 552,504 | 422,806 |
| Under 1 year old | 625,363 | 644,611 | 620,611 |
| Steers, bulls of all ages, and other beef cattle | 2,072,481 | 2,109,154 | 2,088,814 |
| Total beef stock‡ | 5 162 261 | 5 113 419 | 4 905 639 |
| Total cattle | 8 131 214 | 8 035 468 | 7 912 303 |
PIGS—Pig numbers fell in the late sixties as farmers began increasingly to supply whole milk to dairy factories instead of separating off the skim milk, which was frequently used to feed pigs. There was increased emphasis on grain-feeding, and a significant increase in pig numbers in the grain-producing areas of the South Island. After falling throughout the first half of the present decade, pig numbers showed a small increase in 1976 and a very substantial increase in 1977, which was followed by further falls during the latest 5 years.
| At 30 June | Breeding Sows One Year Old and Over | Other Pigs of All Ages (Including Boars) | Total Pigs |
|---|---|---|---|
| 1978 | 55,686 | 415,613 | 471,299 |
| 1979 | 51,761 | 391,691 | 443,452 |
| 1980 | 52,147 | 381,937 | 434,084 |
| 1981 | 49,495 | 370,764 | 420,259 |
| 1982 | 46,830 | 358,941 | 405,771 |
DEER—A type of livestock farming which is of growing importance is deer-farming. Venison finds a ready overseas market and almost all the meat produced is exported. (In 1981–82 venison exports totalled 1248 tonnes valued at $6.6 million. The principal markets were the German Federal Republic, which took over three-quarters of the export total, followed by Switzerland, and the United States.) Because wild deer are a noxious animal, deer farming is controlled by the New Zealand Forest Service, and all farms have to be approved and registered. Deer farming is generally permitted in most regions, but some species may be farmed only in specified areas.
The first deer-farm licence was issued in March 1970. By December 1982 some 2000 properties holding 180 000 deer were involved. Red deer are the predominant farm species.
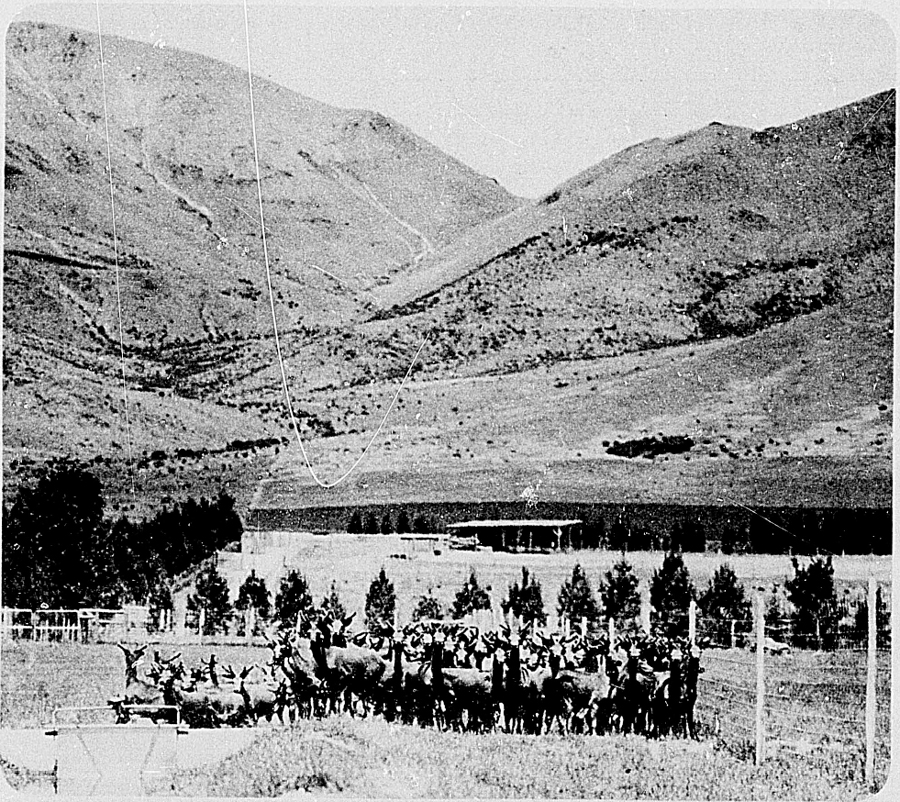
GOATS—In the 1970s there was a marked increase in the number of goats being farmed commercially in New Zealand for their milk, mohair, and meat production, as well as for weed control. It is estimated that at present there are about 360 000 feral does and about 30 000 farmed does being used for weed control and meat production. In addition, there are probably about 7000 does being milked commercially for the production of goat-milk powder, and another 2500 Angora goats being farmed for their mohair.
OPOSSUMS—Export of feral opossum pelts earned $13.5 million in 1981–82. As with deer farming, there is a large indigenous population from which to establish a commercial opossum-farming industry. A systematic organisation of the industry will result in consistency of supply, improved fur quality, and superior matching characteristics of furs. Heritability of fur characteristics, breeding performance, management, housing, nutrition, and other matters of concern to a potential opossum-fur industry are being studied in an experimental opossum farm which has been set up at Ruakura Animal Research Station.
At 31 January 1983, a total of 53 permits had been issued for opossum farming.
POULTRY—Data on commercial poultry production derived from the annual Census of Agriculture carried out by the Department of Statistics are shown in the following table. Flocks of less than 25 birds are excluded.
| At 30 June | Hens and Pullets for Egg Production | Hens and Cockerels For Breeding* | Chickens for Meat | Ducks, Turkeys, and Other Poultry | Total Poultry |
|---|---|---|---|---|---|
| 1980 | 3,681,006 | 227,489 | 2,515,804 | 204,376 | 6,628,675 |
| 1981 | 3,889,707 | 196,130 | 3,147,079 | 311 421x | 7 544 337x |
| 1982 | 3,740,187 | 199,083 | 3,552,176 | 219,690 | 7,711,136 |
As at 30 June 1983, there were 440 poultry farmers licensed to run more than 100 birds. Farms comprising 100 birds or less are exempt from having to have a licence.
The following table shows licensed poultry flocks at 30 June 1983 by flock size and the number of birds.
| Flock Size (Birds) | Number of Runs | Number of Birds |
|---|---|---|
| 101–1 000 | 74 | 53,056 |
| 1 001–5 000 | 109 | 330,342 |
| Over 5 000 | 257 | 2,856,838 |
| Total | 440 | 3 240 236 |
Until December 1980 occupiers of poultry farms had to register their farms under the Poultry Board Act 1976 but, with the introduction of the Poultry Board Act 1980 which came into effect on 1 January 1981, registration no longer applied.
Eggs—The commercial groups sell most of their eggs through licensed egg marketing agents and are therefore mainly responsible for supplying eggs to retail shops in the cities and larger towns.
Commercial poultry farms are distributed over both Islands, but there are concentrations around Auckland, Tauranga, Christchurch, and Oamaru. The egg industry does not cater for overseas markets, though limited quantities of frozen egg pulp and dried powder surplus to local requirements are exported.
The following table shows eggs handled by licensed marketing agents for years ended 30 June.
| Year | Eggs |
|---|---|
| doz(m) | |
| 1977–78 | 51.8 |
| 1978–79 | 50.7 |
| 1979–80 | 48.9 |
| 1980–81 | 51.3 |
| 1981–82 | 51.5 |
| 1982–83 | 51.9 |
Table Poultry—The Poultry Board has continued to maintain a close liaison with the New Zealand Poultry Processors' Association (Inc.), an active organisation comprising the majority of processors of all types of poultry for table meat consumption. The main basis of concern to the board in this area
has been that of ensuring and maintaining an economic outlet for the egg producing industry's byproduct—the roasting fowl—some 3 million hens that have completed their 13–15-month laying cycle.
The continuing expansion throughout New Zealand of various “takeaway” retail establishments has been a notable feature of the table poultry industry in very recent years, and has had a vast influence on the changing eating habits of the country's population. It is estimated that over 60 percent of all meat chicken marketed are sold through these increasingly popular outlets, and it is difficult to foresee any slowdown in these activities while red meats are inclined to become a less competitive source of foodstuff.
Production of meat chicken during the year ended December 1983 totalled 14 171 tonnes of fresh meat and 18 313 tonnes of frozen meat.
BEES—The rich pasture lands of New Zealand and some of its bush areas are favourable for apiculture and produce high-grade honey. Although clover is still the principal type, a number of other New Zealand native honey sources do have wide national and international consumer appeal. Honeydew honey, for example, which is produced from the beech forests of the northern half of the South Island, offers considerable export possibilities.
New Zealand's average honey production is approximately 7000 tonnes, but significant variations in the amount take place from year to year. About 2000 tonnes are exported annually. Traditionally this has been in bulk form, but equal quantities of cut comb and of extracted retail-pack honey are now being exported as well.
Approximately 120 tonnes of cappings wax are produced annually, and the industry's other products include pollen and queen bees (many thousands of which are now exported).
There is also a rapidly increasing demand for bees for pollination. More than 30 000 colonies were transported in 1983 specifically for the purpose of orchard pollination (mainly for kiwifruit, blackcurrants, and apples).
The following table gives a summary of registrations under the Apiaries Act 1969 at 31 May 1983.
| Group | Hives | ||||||
|---|---|---|---|---|---|---|---|
| 1–5 | 6–50 | 51–250 | 251–500 | 501–1000 | 1000+ | Total | |
| Beekeepers | 4,317 | 1,583 | 275 | 129 | 90 | 51 | 6,445 |
| Apiaries | 4,888 | 3,677 | 3,700 | 2,493 | 3,735 | 5,011 | 23,504 |
| Hives established | 9,621 | 23,446 | 36,386 | 37,873 | 66,958 | 90,758 | 265,042 |
Fewer than 300 beekeepers are completely dependent on honey production and bee-keeping for their livelihood.
FURTHER INFORMATION ON THE FARMING INDUSTRY—There are numerous publications dealing with aspects of the farming industry and only a selection can be given here.
Report of the Ministry of Agriculture and Fisheries (Parl. paper C. 5).
N.Z. Horticulture Statistics—Ministry of Agriculture and Fisheries (Annual).
Report of the Department of Lands and Survey (Parl. paper C. 1).
Sheep Returns (Parl. paper C. 5A).
Agricultural Statistics—Department of Statistics (Annual).
Monthly Abstract of Statistics—Department of Statistics.
Economic Review of New Zealand Agriculture—Ministry of Agriculture and Fisheries (1978).
N.Z. Fertiliser Statistics—Ministry of Agriculture and Fisheries (Annual).
Productivity Statistics of New Zealand Agriculture, 1960–1975—Ministry of Agriculture and Fisheries.
Annual Reports of Producer Boards (N.Z. Wool Board, N.Z. Dairy Board, N.Z. Meat Producers Board, N.Z. Milk Board, N.Z. Potato Board, Wheat Board, Tobacco Board, N.Z. Poultry Board, N.Z. Apple and Pear Marketing Board, etc.).
The Future for New Zealand Agriculture—N.Z. Planning Council (published by Fourth Estate Books).
The N.Z. Meat Producer — N.Z. Meat Producers Board (monthly).
Dairy Industry: Information at a Glance—N.Z. Dairy Board (Annual).
N.Z. Pork Industry Council (Annual Report).
The New Zealand Beekeeper (Annual).
Table of Contents
Until the early nineteenth century extensive evergreen forests covered some two-thirds of the country, the remaining third being the low-rainfall zones in the east of the South Island (carrying only tussock grasses) and the rocky high country above 1100–1400 metres. Because of the abundance, use of timber during the early days of European settlement was wasteful, and in clearing land for farms large areas of forest were felled and burnt, often going well beyond the limits now considered desirable by extending into steep terrain unsuited to development. It was not until towards the end of the nineteenth century that the need to conserve forests of the high mountain watersheds was recognised.
Today, in addition to forest set aside in national parks, about 4 million hectares of land valuable either for timber production, recreation, or forest growth vital to soil and water conservation have been constituted State forest, and there is also a large private forest estate. Resources have been built up by afforestation with introduced species, mainly conifers, which produce usable wood in 25–30 years, a much shorter time than the slow-growing indigenous species.
The following table shows the present area of forested land in relation to other categories of land.
| Type of Land | Area | Percentage of Total Area |
|---|---|---|
| hectares (million) | ||
| Total forested land | 7.2 | 26.8 |
| Pasture and arable land | 14.4 | 53.5 |
| Other non-forested land | 4.9 | 18.2 |
| Minor islands | 0.1 | 0.4 |
| Lakes, rivers, etc. | 0.3 | 1.1 |
| Total area of New Zealand | 26.9 | 100.0 |
FORESTS TODAY—About three-quarters of the forest area is classed as unmerchantable. This is mainly Crown-owned indigenous forest which, because it covers much of the remote and mountainous high-rainfall country, has as its primary function soil protection and water regulation. The limited production possibilities it offers must be subordinated to its protective role.
Of the 6.2 million hectares of indigenous forests only about a million hectares are merchantable by today's standards. Greatly increased use of exotic timber has enabled the rate of cutting in State indigenous forests to be reduced, allowing emphasis to be placed on the management of indigenous forests for sustained wood yield or as reserved natural stands. A lower cutting level is also evident in privately-owned indigenous forests.
Merchantable forests also include almost all the planted (exotic) forests, about half of which were established and are owned privately or by local authorities. There are about 992 000 hectares of productive exotic forest, over half of which is in the Bay of Plenty - Taupo region, where very large plantings were made from 1923 to 1936. The distribution of the planted forests was influenced mainly by availability of cheap undeveloped land at that time. The output of timber from the exotic forests greatly surpasses that from the indigenous forests.
The exotic conifers, particularly radiata pine, have high growth rates, ease of establishment and ease of re-establishment on cut-over areas, and they produce wood that has many uses. Plantings of such trees are being extended and developed to provide for increasing domestic and export demand.
The distribution by area of forest land is shown in the table below.
| Forested Land | Indigenous Forests | Exotic Forests | All Forests |
|---|---|---|---|
| * Because of rounding, individual figures in this table do not always add to give the stated total. | |||
| hectares (thousand) | |||
| State forest | 2,993 | 526 | 3,519 |
| National parks and reserves | 1,550 | – | 1,550 |
| Unoccupied Crown land | 361 | – | 361 |
| Other tenures | 1,342 | 467 | 1,809 |
| Total* | 6 246 | 992 | 7 239 |
BOTANICAL COMPOSITION OF FORESTS: Indigenous Forests—These can be broadly grouped into podocarp/broad-leaved forest (which includes kauri forest) and beech forest, but there are also many subgroups and transition zones.
Podocarp/broad-leaved forests are found at all latitudes in the 3 main islands, more particularly those of the north and of the warm wet lowlands and lower mountain slopes, and there is a general increase in luxuriance and in numbers of species from south to north. This type of forest has suffered severely by destruction in land clearing or from heavy logging. There are still some large areas on steep country, such as the Ureweras, but these are essentially protection forests. Fairly extensive areas in the centre of the North Island and on the West Coast of the South Island contain most of the remaining indigenous softwood supplies. However, large portions of the forests in these regions were recently set apart as ecological reserves and in a national park. The residual production areas will be managed for low levels of cutting only. Otherwise, the remaining forest of this type consists of pockets, some of which may be worked out in a few decades.
The principal podocarp is rimu (Dacrydium cupressinum) and important secondary ones are totara (Podocarpus totara), matai (P. spicatus), and miro (P. ferrugineus). Important species at higher elevations are Hall's totara (P. hallii) and kaikawaka (Libocedrus bidwillii). Kahikatea (Dacrycarpus dacrydioides), once common on low-lying swampy river silts now cleared for farming, is becoming scarce. The smaller podocarps of the silver pine group (Dacrydium biforme, D. colensoi, and D. intermedium) are dominant in bog forests occupying limited areas in the central North Island and scattered widely over the South Island although concentrated largely on the West Coast, where they have been largely cut over for posts and sleepers.
The main broad-leaved species associated with the podocarps are kamahi (Weinmannia racemosa), rata (Metrosideros umbellata and M. robusta), and tawa (Beilschmiedia tawa) in the North Island and western Nelson.
Kauri forests are found in the north of the North Island. In them, kauri (Agathis australis) either occurs frequently or is locally dominant—otherwise they are akin to the podocarp/broad-leaved forest, though with many additional hardwoods. They have been almost destroyed by logging and fire, and only limited stands now remain.
Beech forests, in which one or more of the southern beech (Nothofagus) species are dominant, are the forests of the south, of the mountains, and of the dry lowlands; but the species are absent from some localities where their presence might be expected, e.g., Mt. Egmont, the region 160 km south of the Taramakau River in Westland, and Stewart Island. In the main, these forests are protection forests, but there are large areas in accessible regions that have been cut over and are regenerating, and others that have not yet been logged and will be reserved for sustained-yield management or replacement by fast-growing exotics.
Scrub and second-growth broad-leaved species occupy much of the land now classified as forest. There were, before European settlement, limited transition areas carrying manuka (Leptospermum scoparium and L. ericoides) between tussock grassland and forest proper. With deliberate destruction by fire of much tussock and forest these manuka belts have extended, and manuka even occupies extensive areas of destroyed forest remote from its own original stands. In this respect it is important, for it is often a stage in succession back to forest proper.
Exotic Forests—Introduced conifers form the bulk of the large and valuable exotic-forest estate; and among these radiata pine (Pinus radiata) is the supreme multi-purpose tree. Radiata pine grows rapidly in New Zealand (reaching saw-log size in 25–30 years), produces a large volume of usable wood, and is remarkably adapted to a variety of sites. Other major species are Douglas fir (Pseudotsuga menziesii), Corsican pine (Pinus nigra (laricio)), and ponderosa pine (P. ponderosa). In recent years, planting of the last two species has declined because they have proved less versatile and slower growing than radiata pine.
The largest exotic forests are in the centre of the North Island, but medium and small plantations are distributed throughout most of the country. Radiata pine constitutes about three-quarters of the area of State plantations and about 95 percent of private plantations.
MANAGEMENT OF STATE FORESTS—The management activities of the New Zealand Forest Service are directed towards protecting, conserving, and perpetuating the remaining indigenous forests of the country, and creating an exotic forest estate large enough and sufficiently diverse to supply the future needs of New Zealand in timber and other forest produce and to provide for large exports.
Spreading awareness among the general public of the human and physical environment has brought the management of the remaining indigenous forests under critical examination. In 1976 a new policy covering State indigenous forests was approved by Government. It provides principles to guide the future use and management of these forests, giving due regard to sound forestry practices, the wishes of the public, and social and economic welfare on a regional and national basis. To manage forest land on the basis of balanced use, dominant forest values (whether they are of protection, amenity, production, or otherwise) must be identified and defined. Recognising forest zones is a sound basis for reconciling numerous objectives. The values identified first in forest zoning are soil and water conservation and biological significance. Scenic appeal, potential for recreation, and wood production values are considered subsequently. This policy was given specific effect in 1978 with the release by the Government of more detailed policies covering the two most important remaining indigenous forest regions—the West Coast, and the Central North Island—and these have been followed by detailed management plans for both regions. In both instances, reductions in allowable cut have been made to provide for ecological reserves and management of the productive forests on a sustained or long-term periodic-yield basis.
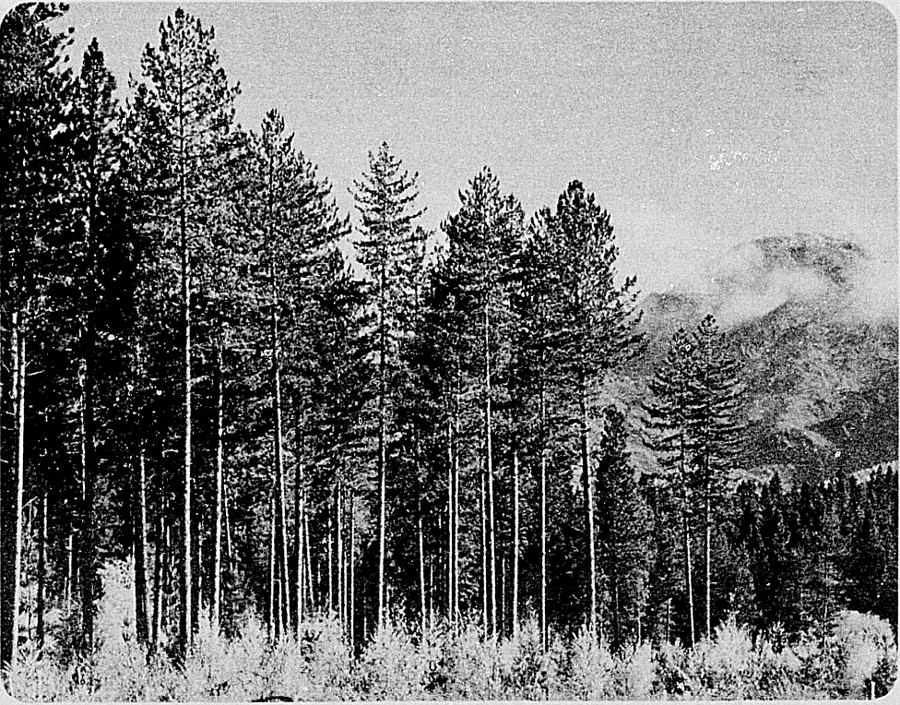
Exotic special purpose species have been evaluated and these are planted on suitable sites. Uses for these timbers are furniture, cabinet work, turnery, joinery, veneer, and boat-building.
Indigenous Production Forests—Conservation measures in indigenous production forests involve restriction of the annual cut, rigid insistence on full utilisation, and block sales of carefully measured standing timber.
The ecology of the natural forest associations and the silvicultural characteristics of the individual species are being studied. Past work has shown the importance of preserving a forest climate. Selective logging of terrace rimu forests in south Westland provides a favourable forest environment for the regeneration and growth of rimu. A sustained-yield policy, based on experience of both large-scale operations and selective logging trials, has been developed for central North Island forests. The policy allows mature trees, which are likely to die and decay within a few decades, to be identified and carefully harvested. The forest's natural regeneration is enriched by planting native seedlings.
In many districts, forests of mixed podocarps and tawa have been logged for rimu, leaving tawa behind. Recently, however, tawa has been found useful as a hardwood pulp and, in the Bay of Plenty, wood unsuitable for saw logs is being used for this purpose. Studies on the long-term management potential for sawlog production are being made in tawa forests.
The kauri forests, now only remnants, are owned principally by the State. Management has the objective of perpetuating kauri as a species in the interests of science and public enjoyment, in natural stands and as managed forests. Large representative areas of mature and immature kauri have been set aside as sanctuaries, programmes of research and artificial establishment intensified, and the annual cut reduced to the lowest level consistent with economic, social, and legal constraints.
The prospects of improving and perpetuating the beech forests on a sustained-yield basis are good. Both major species, red and silver beech, when given the right conditions, will regenerate freely; both grow sufficiently rapidly to produce saw logs in 100–130 years. Many large areas of beech forests are still intact and, in the case of red beech, there are extensive stands of young forest which have originated after fire, wind throw, or mining activities. Against these favourable circumstances must be set the presence in many localities of red deer and other feral animals, the browsing of which may check or even prevent effective regeneration, and difficulties associated with the utilisation of the non-sawlog component of the forest crop.
Exotic Forests—State exotic forests date from 1896, when an Afforestation Branch of the Lands Department was formed and forest-tree nurseries were established at Tapanui and Eweburn in the South Island and at Rotorua in the North Island. Planting began in 1898 and proceeded slowly until 1922, by which time 19 000 hectares had been established. From 1923 to 1936 there was a boom in afforestation, with no less than 150 000 hectares being planted by the State and 120 000 hectares by commercial companies. After the boom period, planting continued on a more modest scale, but in 1961, State planting was increased and the Government provided for financial inducements to encourage planting by private landholders and local authorities—with the aim of doubling the exotic-forest estate by the end of the century. The annual rate of new planting by the State has increased considerably since 1961 and since 1974 has averaged some 20 334 hectares per annum, over 5 times the rate achieved in 1961. Private sector afforestation continues at a high rate, with 29 980 hectares planted in 1983.
Now that the stage of large-scale utilisation has been reached, there are opportunities to increase productivity by correcting the deficiencies in the distribution of age classes, replacing uneconomic plantations, and improving the quality of the trees, and at the same time, meeting the demand for forest products and ensuring continuity of supplies. The diversity of marketable products now permits utilisation of trees of a wide range of sizes and aids the operations needed in management practice.
Present policy is to concentrate new exotic forests in areas where there is scope for building up integrated wood-based industries to supply markets both in New Zealand and overseas. The planted forests (both State and private) already supply nearly 94 percent of the total wood production.
Stabilisation of Sand Dunes—This aspect of the Forest Service's work has a twofold objective—the stabilisation of dunes for the protection of agricultural and pastoral land, and the establishment of exotic production forests. The Forest Service plants marram grass and lupin, and later establishes trees on certain protective zones. Fight schemes are in operation—at Aupouri, Mangawhai, Woodhill, Waiuku, Tainui-Kawhia, Waitarere, Santoft, and Pouto—embracing around 60 000 hectares. A further 1487 hectares were planted in 1981, bringing the total stocked area of protection forest to almost 32 000 hectares.
A most successful co-operative venture is under way in 2 Northland localities, where the Crown has leased large areas of Maori-owned coastal sand dunes (adjacent to Aupouri and Woodhill forests) for stabilisation and afforestation.
Stabilisation of Eroding Farmlands—A consequence of past forest clearing for farm land on some unsuitably steep areas has been accelerated water run-off and erosion. Widespread landslipping, aggradation of riverbeds, and subsequent flooding have been sufficiently severe to require remedial works in which reafforestation plays a major part. Afforestation commenced in the East Coast-Poverty Bay area in 1962 following detailed land use studies. To date, 21 000 hectares have been established in critical headwater areas. Carefully managed, these can fulfil a productive role for timber supply and also maintain a protective cover.
Afforestation of Maori Land—In addition to the 2 areas of Maori-owned coastal sand country mentioned above, the Crown has also leased 14 other areas of Maori land for co-operative forestry ventures. These total 77 000 hectares, of which 25 000 hectares have been planted to date.
Protection Forests—The vegetation of the mountainous areas—forest, scrub, and alpine grassland—is of the highest importance to the welfare of New Zealand. Many rivers that bring water to low-lying farmlands or provide the domestic water supply of cities and towns have their headwaters in the mountainous back country. The mountains receive frequent heavy rain and are mostly formed of rock that erodes easily when exposed to rain, wind, and frost. The blanket of montane vegetation protects the thin soil layer and stabilises rocky slopes. This prevents soil and rock from reaching streams and altering their flow characteristics. Settled flood plains can be protected by a combination of river-training works and a good cover of vegetation on catchments to ensure the most stable stream flow possible.
Browsing animals that were introduced into the forest and mountain lands many years ago (and, in the absence of natural enemies and limiting climate, multiplied excessively) are the major threat to the continued protective function of the vegetation of these areas. Consequently the first step in the effective management of these areas is control of the numbers of these animals to a level that will allow an adequate vegetative cover to grow and persist.
Techniques to assess the condition and trends of vegetation, alpine climate, rates of erosion, the possibility of introducing new forest and scrub species into badly depleted areas, and changes in animal populations and methods of control are undertaken by the Forest Service and other agencies in support of management of protective forest lands.
Recreation in State Forests—Over 1.6 million hectares of State forest is set aside in 19 forest parks which, although mainly protection forests, provide scope for recreation. In addition, a further 111 558 hectares of State forest land has been set apart in 20 recreation areas and another 1.4 million hectares have been gazetted open indigenous forest to enable public entry without permit except when carrying a firearm.
Many indigenous State forests offer scope for recreation in surroundings of great natural beauty—for study of plant and animal life; for challenging tramping; and for shooting and fishing. Most of the forested hill country is managed primarily for soil and water conservation and recreational use can be allowed in almost all such forests without interfering with the main management objectives. In fact, private hunting, for instance, can be of benefit in destroying wild animal pests. Six recreational hunting areas have been gazetted and several more areas are in the process of being established. The New Zealand Forest Service is developing State forest parks in which management planning incorporates provision for recreation. Such provision includes improvement of access from main roads to forest boundaries; clearing and maintaining tracks; erecting bridges; making camp sites and picnic places; and (sometimes in co-operation with tramping and alpine clubs) building and maintaining huts. Entry on foot is unrestricted except that, in the interests of public safety, persons carrying firearms require permits from the Forest Service.
The older exotic forests, 2 of which are forest parks, also offer many attractions and have the advantage of accessibility. In many there are walks and picnic spots for the public and selected areas are reserved from felling for their scenic value.
Conservation and Protection of Scientific Values—In 1982 State Forests Scientific Reserves Advisory Committees were established following a review of the Scientific Coordinating Committee. These committees advise the Director-General of Forests on the selection of reserves in State forests and their subsequent management and research.
There are 14 sanctuaries (16 300 ha) created to preserve indigenous flora and fauna in their natural state for their scientific values. The basic aim in administering forest sanctuaries is that natural processes dominate management, no plants may be taken or destroyed, no leases or privileges over the land or over the forest produce can be assigned, and public use is restricted whenever entry is likely to affect the value for which the sanctuary was created.
There are 71 dedicated areas, totalling 115 054 hectares, set apart for the purposes of protection and maintenance of the land for specific purposes. Dedicated areas are State forest land which have some special natural value or management objective which needs to be protected. Many are ecological areas set apart as being representative of regional forest ecosystems.
Safeguarding Forests and Timber:Fire Prevention—Fire is the greatest single menace to forests; within a few hours it can destroy a valuable timber crop or undo the work of decades in building up a soil and vegetation balance. Indigenous forests are fairly fire resistant but can become fire-risks in drought conditions, however the major risk occurs in the plantations of exotic conifers.
The fire-protection organisation of the New Zealand Forest Service operates over the entire country, covering State forests, forests on other Crown lands, scenic reserves, national parks, and all other State areas. The Forest Service also gives support to other rural fire authorities, particularly those with high country fire hazards. A fire-fighting service is maintained wherever the department has fire-fighting responsibilities, and well-equipped fire-fighting crews can be brought into action at short notice and controlled through a radio network. Aerial fire-detection patrols operate when and where required, and aerial fire-fighting in the form of helicopters fitted with special monsoon buckets, has been adopted to deal with fire outbreaks.
In the central North Island trials have begun using fixed wing agricultural aircraft for fire-fighting.
When weather or other conditions may lead to the start of forest or rural fires and endanger life and property, the Forest Service may issue a warning of fire hazard conditions, impose a total ban on lighting fires in the open, and take charge of an area so endangered by declaring a regional fire emergency. Fire danger ratings are assessed by the use of the Fire Weather Index, a system adapted from Canada and put into effect in New Zealand from 1980–81. The Forest Service also has infrared equipment which can detect hidden hot spots when used from either a helicopter or ground vehicle. Once hot spots are found, following fires or controlled burns, they are dealt with by ground crews, thus preventing the sudden reactivation of fires.
The Forest and Rural Fires Act and Regulations, which became law on 1 April 1979, provides for a nationwide fire control system (involving all fire authorities), affords private forest owners the opportunity for protection identical with State areas, and sets up a mediator to deal immediately with any controversy.
Wild Animals—Under the Wild Animal Control Act 1977 the Forest Service is responsible for the control of deer, goats, chamois, thar, and other introduced wild animals on all lands where the damage they cause is detrimental to the welfare of the country. On pastoral land, control of opossums and wallabies is the responsibility of the Agricultural Pests Destruction Council.
. The widespread populations of many of these animals have a serious effect on the growth of trees and ground cover in exotic production forests as well as in protection forests. The forest floor of ferns, mosses, and shrubs has been extensively damaged by deer and goats, while the upper storey is adversely affected by the canopy feeding opossum. For information on goat, deer and opossum farming refer to Section 15c.
Control of Insects and Disease—In conjunction with private enterprise, the New Zealand Forest Service has organised joint spraying operations to control the pine needle blight Dothistroma pini. Aerial spraying of a copper fungicide is an effective means of dealing with the disease. Pinus radiata has been bred in a seed orchard programme to resist Dothistroma. Increasing research is being directed towards the debilitating effect of Swiss needle cast (Phaeocryptopus gaeumannii) on the growth of Douglas fir.
Pathologists and entomologists of the Forest Research Institute maintain a constant watch on forests, woodlots, and shelter belts to detect incipient epidemics in time for effective control measures to be taken. Much information is accumulated to elucidate the relationships between the organisms and the forests.
Timber Inspection and Quarantine—Forest Service timber inspection and quarantine cover all sawn, hewn, and natural round timber, wooden manufactured items, wooden packing, and ship's dunnage entering or leaving the country.
FINANCE OF STATE ACTIVITIES—More money is spent on establishing and tending State forests than is obtained in revenue from these forests. Expenditure by way of general administration of forestry is met in full from taxation, as distinct from the development of State forests, which is financed from national development loans.
The sources of finance are shown in the following table.
| Source | 1978–79 | 1979 80 | 1980–81 | 1981–82 | 1982–83 |
|---|---|---|---|---|---|
| $(thousand) | |||||
| Consolidated Account expenditure | 133,301 | 152,835 | 193,877 | 236,084 | 258,833 |
| Less receipts | 59,908 | 77,754 | 101,501 | 111,262 | 115,806 |
| Required from Consolidated Account | 73,393 | 75,081 | 92,376 | 124,822 | 143,027 |
| Net finance required from Government funds | 73,393 | 75,081 | 92,376 | 124,822 | 143,027 |
PRIVATE FORESTRY: Private Forest Estate—Exotic forest holdings other than State forests amount to 467 000 hectares.
Forestry Incentives—In 1982, 7193 hectares of new planting was carried out under the Government's forestry encouragement loans scheme (for local authorities) or forestry encouragement grants scheme (for individuals, trusts and partnerships, and small companies). Also, 11 442 hectares of established planting was pruned and thinned under both schemes. The total area planted since the schemes' inception now totals 87 400 hectares.
As an added incentive standing trees do not incur land tax, death duties, or local body rates. However income tax concessions to forest companies are no longer available.
Extension Services—In addition to the financial assistance provided under the encouragement schemes, the Forest Service also provides guidance in all plantation matters. Because of the high interest in private forestry, increasing emphasis is being given to providing information and training services. Handbooks are available, a correspondence course is offered through the Technical Correspondence Institute, and short residential courses are held periodically.
Farm forestry associations also assist in promoting the schemes and advising on the management of woodlots.
FOREST UTILISATION: Removals of Roundwood—By the 1930s the easy abundance of indigenous timber had gone, whereas some of the exotic forests had reached the stage where harvesting could begin. By 1939, of the 1 700 000 cubic metres per annum of roundwood cut for industrial use, some 280 000 cubic metres came from the exotic forests. By 1948 the total annual removals of roundwood had increased to 2 300 000 cubic metres, with 820 000 cubic metres from the exotic forests. The exotic forests are now by far the more important source of wood. In 1982–83 they supplied 9 019 000 cubic metres, or 94 percent of the total supply from exotic and indigenous forests.
At 30 June 1982 the North Island contained 5337 exotic timber plantations with a total stocked area of 699 742 hectares. Of this total, 450 988 hectares were in the South Auckland - Bay of Plenty statistical area, principally in the counties of Rotorua, Taupo, Matamata, Whakatane, and Tauranga.
At the same date there were 3660 exotic timber plantations with a total stocked area of 262 827 hectares in the South Island. Waimea County in the Nelson statistical area contained 79 370 hectares of exotic timber plantations, over a quarter of the South Island total.
The table below shows the quantities of timber produced by the forests of New Zealand to supply the forest industries, which comprise 394 sawmills, 9 plywood and veneer plants, 3 particle board mills, 7 pulp and paper mills, and 2 fibreboard mills. This roundwood production does not include firewood.
| Year Ended 31 March | Indigenous Wood | Exotic Wood | Total |
|---|---|---|---|
| cubic metres (thousand) | |||
| 1979 | 581x | 8,391 | 8 972x |
| 1980 | 559 | 9,372 | 9,931 |
| 1981 | 557 | 9,688 | 10,245 |
| 1982 | 514x | 9 446x | 9 960x |
| 1983 | 608 | 9,019 | 9,627 |
Sawn-timber Production—Radiata pine and other pines account for about 90 percent of the total cut of exotics; Douglas fir provides most of the remainder. Only 9 percent of the country's timber requirement comes from the indigenous forests, and this proportion is being reduced to the point where a small sustained yield in indigenous timber can be maintained for special purposes.
The table below gives the production of rough-sawn timber in recent years.
Total sawn-timber production by years over a 50-year period is included in the Statistical Summary at the back of the Yearbook.
| Year Ended 31 March | Softwoods | Hardwoods | Grand Total | ||||
|---|---|---|---|---|---|---|---|
| Indigenous | Exotic | Total | Indigenous | Exotic | Total | ||
| cubic metres (thousand) | |||||||
| 1979 | 173 | 1,654 | 1,827 | 35 | 3 | 38 | 1,865 |
| 1980 | 156x | 1 812x | 1,968 | 39x | 3x | 42 | 2,010 |
| 1981 | 140 | 2,004 | 2,144 | 35 | 3 | 38 | 2,182 |
| 1982 | 130 | 2,103 | 2,233 | 34 | 3 | 37 | 2,270 |
| 1983 | 117 | 1,982 | 2,099 | 33 | 4 | 37 | 2,136 |
The following graph shows the production of exotic and indigenous rough-sawn timber over a series of years.
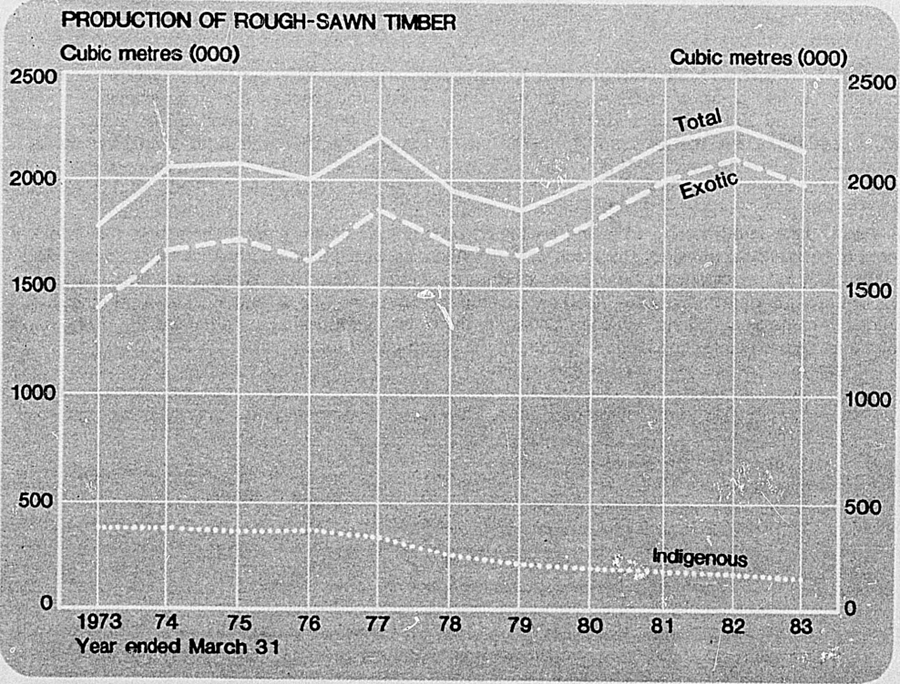
The following table gives details of timber production by species for the past 5 years.
| Species | Year Ended 31 March | ||||
|---|---|---|---|---|---|
| 1979 | 1980 | 1981 | 1982 | 1983 | |
| cubic metres (thousand) | |||||
| Rimu and miro | 152 | 137 | 122 | 112 | 101 |
| Matai | 3 | 3 | 3 | 2 | 2 |
| Totara | 2 | 2 | 2 | 2 | 1 |
| Kahikatea | 14 | 10 | 11 | 12 | 11 |
| Tawa | 15 | 15 | 14 | 12 | 11 |
| Beech | 19 | 23 | 19 | 18 | 17 |
| Other indigenous | 3 | 5 | 4 | 6 | 7 |
| Total, indigenous | 208 | 195 | 175 | 164 | 150 |
| Exotic pines | 1,479 | 1,609 | 1,798 | 1,886 | 1,777 |
| Douglas fir | 131 | 163 | 168 | 173 | 164 |
| Eucalypts | 3 | 2 | 2 | 2 | 3 |
| Other exotic | 44 | 41 | 39 | 45 | 42 |
| Total, exotic | 1 657 | 1 815 | 2 007 | 2 106 | 1 986 |
| Total (ail species) | 1 865 | 2 010 | 2 182 | 2 270 | 2 136 |
Export Wood-chip Industry—The industry originated in 1969 in the Nelson region where 2 mills now produce both indigenous and exotic wood chips for export. They use trees unsuitable for sawn-timber production, enabling replanting with more productive species, and also provide outlets for forest and sawmill residues which would normally be wasted. Nelson remains the principal chip export port, handling about 50 percent of the country's total chip exports. Japan is the principal export destination. Wood chips have been exported through the port of Mount Maunganui since 1972, through Lyttelton since 1975, and through Port Chalmers since 1977. Chip exports during the year ended June 1983 totalled 263 136 bone dry units. A new operation is commencing through the port of Bluff.
Pulp and Paper Industry—Over the last 10 years, total production of pulp has risen at an average annual rate of 4 percent, and production of paper at 3 percent. Production of pulp has risen from 455 000 tonnes in 1968–69 to 1 042 000 tonnes in 1982–83. The industry is mainly concentrated near the big exotic forests on the volcanic plateau of the North Island. There are 7 pulp and paper plants in New Zealand, 6 of which are in the North Island. Of these 6, 4 are integrated with sawmills to utilise fully the total input of wood. The 7 companies are:
Tasman Pulp and Paper Co. Ltd.—This company, which was formed in 1952 to utilise wood from Kaingaroa State Forest, is now part of the Fletcher Challenge Corporation, the largest New Zealand company in terms of shareholders' funds. The company's plant is at Kawerau, Bay of Plenty. The pulp and paper mill began operation late in 1955. The annual rated capacity is 335 000 tonnes of newsprint and 165 000 tonnes of market chemical pulp. The company is now planning to install a fourth newsprint machine. Tasman Timber Ltd.'s sawmill on the same site has an annual rated capacity of 200 000 cubic metres of sawn timber.
New Zealand Forest Products Limited.—This public company utilises about 3 000 000 cubic metres of logs a year from its own radiata pine forests, and also small quantities of hardwood (tawa) from State forests. The integrated pulp mill, paper mill, sawmill, plywood mill, and reprocessing plant is situated at Kinleith, near Tokoroa. Annual production capacities are about 500 000 cubic metres of sawn timber (including NZFP subsidiaries), 39 000 cubic metres of plywood, 408 000 tonnes of kraft pulp and 260 000 tonnes of paper. Wallboard products and multiwall bag plants are located at Penrose, Auckland, with annual production capacities of 11 million square metres of wallboard products and 100 million multiwall paper bags.
The company has a 40 percent shareholding in UEB Industries Ltd., and is a joint owner with UEB of Fibre Products New Zealand Ltd., a firm which makes a range of moulded pulp products, including 40 million fruit trays a year. In April 1982 production of a new moulded pulp egg carton commenced, of which 30 million are manufactured each year. A corrugating medium machine at Penrose, which became operational in late 1982, is producing 25 000 tonnes of corrugating medium paper from waste paper collected in the Auckland area. The establishment of a pulp and paper mill in Northland is being investigated.
Whakatane Board Mills Ltd., a subsidiary of New Zealand Forest Products Ltd., manufactures paperboard from ground wood and from semi-chemical and waste paper pulp produced on site. Total annual capacity is 110 000 tonnes. Wood supplies are drawn from its radiata pine forest at Matahina and hauled 42 km to the mill by road. A sawmill operates adjacent to the board mill.
Caxton Paper Mills Ltd., at Kawerau, manufactures a wide range of tissues and lightweight merchant and processing papers for domestic and export markets. Three machines are operating and annual production capacity exceeds 50 000 tonnes.
New Zealand Paper Mills Ltd., at Mataura, also a subsidiary of New Zealand Forest Products Ltd., has been in operation for more than 100 years. It has 2 machines producing a range of papers from kraft wrapping grades to specialty printing copy, and writing papers. The company uses New Zealand made sulphate pulp and supplements this with wastepaper and small quantities of imported specialty pulp. Annual production capacity is 20 000 tonnes of paper.
Carter Oji Kokusaku Pan Pacific Ltd.—In 1969 the Government invited tenders for the processing of 9 million cubic metres of wood from Kaingaroa State Forest. After examining the proposals received, the Government awarded the sale of roughly two-thirds of the volume to Carter Consolidated Ltd. This led to the formation of the company, which has built an integrated sawmill and refiner groundwood mill at Whirinaki in the Napier district.
The company has now converted the plant to thermo-mechanical pulp processing. Present productive capacity is about 240 000 tonnes of thermo-mechanical pulp and 100 000 cubic metres of sawn timber annually.
Winstone Samsung Industries Ltd.—The company's thermo-mechanical pulpmill at Tangiwai produced its first pulp in the latter part of 1978. The plant, which uses exotic wood from Karioi State Forest, as well as sawmill residues, has a rated capacity of about 85 000 tonnes annually. By the end of 1984 the capacity is to be increased to 120 000 tonnes annually.
The basic products of the pulp and paper industry are mechanical and chemical pulp, which are converted into such products as newsprint, kraft, and other paper and paperboard.
The following table gives the production of wood pulp in New Zealand in recent years.
| Year Ended 31 March | Wood Pulp | |
|---|---|---|
| Chemical* | Mechanical† | |
* Chemical pulp includes semi-chemical pulp. †Mechanical pulp includes groundwood pulp and thermo-mechanical pulp. | ||
| tonnes | ||
| 1978 | 606,759 | 490,083 |
| 1979 | 578,615 | 464,195 |
| 1980 | 556,488 | 565,968 |
| 1981 | 640,583 | 565,478 |
| 1982 | 602,976 | 530,813 |
| 1983 | 571,183 | 470,730 |
Production figures for paper in New Zealand in recent years are as follows:
| Year Ended 31 March | Newsprint | Other Printing and Writing Paper | Other Paper and Paperboard | Total Paper and Paperboard |
|---|---|---|---|---|
| tonnes | ||||
| 1979 | 260,311 | 33,075 | 337,635 | 631,021 |
| 1980 | 319,044 | 33,165 | 321,644 | 673,853 |
| 1981 | 322,565 | 40,671 | 360,299 | 723,535 |
| 1982 | 322,070 | 36,834 | 364,110 | 723,014 |
| 1983 | 268,792 | 34,931 | 367,096 | 670,819 |
Production of paper and pulp products is shown in the following graph.
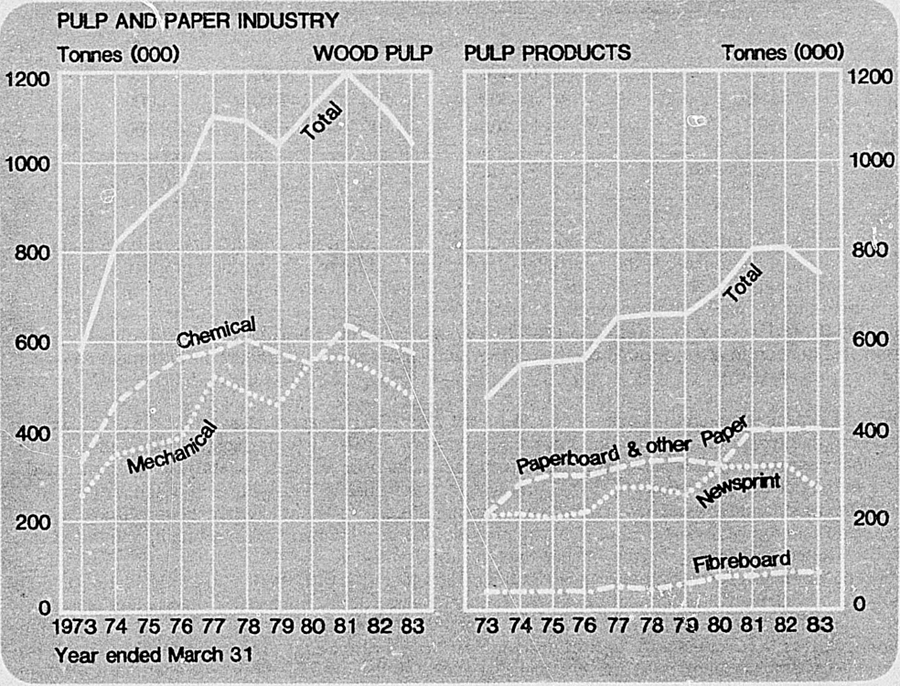
Wood-based Panel Products Industries:Plywood—Five factories manufacture plywood, and the total output for the year ended 31 March 1983 was 55 000 cubic metres. Total production of veneer in the industry in 1982–83 was 85 000 cubic metres.
New Zealand Forest Products plywood plant at Kinleith began production of industrial and structural grades of plywood for both domestic and export markets in 1976. The annual plant capacity is 45 000 cubic metres.
Radiata pine has become increasingly important as a species for peeler log supply because of the demand for industrial plywood, and now constitutes about 96 percent of total peeler log production. Now that the indigenous forests have become depleted, the production of peeler logs for veneer and plywood manufacture is regarded by the Forest Service as having a first claim on the State forests; hence, in its own logging activities the Forest Service aims at producing the maximum amount of peeler logs, and has recently also adopted a policy of requiring sawmillers logging State indigenous forests to reserve logs suitable for peeling and divert them to the veneer factories.
Fibreboard—Manufactured from wood pulp, the different forms of fibreboard (hardboard, softboard, and medium density fibreboard) have different properties and end uses. Production started in 1943 and has increased steadily. A new mill in Canterbury began producing medium-density fibreboard by a dry process in 1976. This product has now established itself on domestic and export markets.
Particle Board—Particle board is manufactured from roundwood and sawmill residues. There has over recent years been a rapid expansion in the domestic market for this product for interior panelling and flooring as well as furniture manufacture.
Production of veneer, plywood, fibreboard, and particle board is shown in the following table.
| Year Ended 31 March | Veneer | Plywood | Particle Board | Fibreboard |
|---|---|---|---|---|
| cubic metres | tonnes | |||
| 1979 | 60,300 | 42,000 | 120,600 | 61,800 |
| 1980 | 76,300 | 53,700 | 147,000 | 74,000 |
| 1981 | 87,300 | 60,400 | 156,200 | 78,400 |
| 1982 | 90,300 | 59,500 | 157,300 | 85,400 |
| 1983 | 85,400 | 55,200 | 142,000 | 80,300 |
Production of Round and Split Produce—Considerable quantities of native timbers have been used in the past to meet the needs for mining, fencing timbers, and firewood, and for a proportion of sleeper, pole, and bridge-timber requirements, but as with forest products in general, most post and pole requirements are now met from exotic resources. A dramatic increase in the volume of posts and poles treated (from 19 000 cubic metres in 1955 1o 429 000 cubic metres in 1982–83) indicates the switch from indigenous to exotic roundwood, together with the effective introduction and maintenance of timber preservation.
Wood Preservation—In the year ended 31 March 1983, 45 percent of all sawn timber produced was preservative treated: by world standards the porportion treated is very high, partly because of the relative ease with which otherwise non-durable exotic softwoods such as radiata pine can be treated.
Features of the preservation industry are: the very wide use in house building of timber treated by diffusion or vacuum-pressure methods with water-borne preservative at low retentions to prevent insect borer attack; the wide dispersal of small treating plants specialising in such treatment; and the quality-control function exercised by the Timber Preservation Authority.
Timber Preservation Authority specifications prescribe the preservative treatments for different service conditions. For treatment of exterior timbers against decay, multi-salt preservatives (essentially solutions of copper, chromium, and arsenic compounds) at high loadings are widely used, but oil-type preservatives (e.g., creosote) are also acceptable. The usual method of application of multi-salt preservatives is by vacuum pressure, but such variations as the oscillating-pressure method (OPM), the Lowry process, and the alternating-pressure method (APM) have been introduced. Oil-based preservatives are applied by pressure, hot and cold bath, and cold soak, and are used for poles, posts, and sleepers. For timber out of contact with the ground and protected from the weather, lighter treatment with water-soluble preservatives is acceptable. Two basic formulations of alkyl ammonium compounds and 3 light organic solvent preservatives have recently been approved for certain uses.
The following table shows the quantities of sawn timber treated.
| Year | Open Tank | Diffusion Impregnation* | Pressure Impregnation | Total |
|---|---|---|---|---|
| * Mainly boron. | ||||
| cubic metres | ||||
| 1978–79 | 1,400 | 308,045 | 532,169 | 841,614 |
| 1979–80 | 20 | 277,244 | 536,534 | 813,798 |
| 1980–81 | 13 | 312,113 | 585,518 | 897,644 |
| 1981–82 | 10 | 369,660 | 628,751 | 998,421 |
| 1982–83 | 2 | 351,157 | 618,682 | 969,841 |
In addition, 428 900 cubic metres of other timber, such as sleepers, poles, and fence posts, were treated by 1 of the preservation methods in 1982–83.
OVERSEAS TRADE—Forest products are important earners of overseas funds. For the year ended June 1983 exports of forest products were valued at about $502 million; Australia was the largest customer, taking 37 percent (by value) of exports, mainly in the form of pulp and paper, and Japan
was the next largest, taking 28 percent, mainly pulp and logs. For the same period, imports of forest products into New Zealand were valued at $140 million.
Timber Exports—There is an established market in Australia for sawn radiata pine and Douglas fir. Japan takes large volumes of logs, and a significant quantity of sawn timber. Logs have also been sold to the Republic of Korea and the People's Republic of China. There are restrictions on the export of indigenous timber.
Timber Imports—The main categories of sawn timber imports are tropical hardwoods, Australian hardwoods, and North American softwoods. Imported sawn timbers generally have specialist applications such as weatherboards with a natural finish, decorative furniture, pannelling, and boat building. Durable Australian hardwoods are imported for use as large poles, crossarms, wharf, bridge, and constructional timbers, etc. Douglas fir, redwood, and western red cedar from North America are imported for structural uses, exterior joinery, and weatherboards.
Pulp and Paper Exports—These are now established exports of great value to New Zealand. Australia takes significant volumes of pulp and paper, and Japan takes large volumes of pulp. Both chemical and mechanical pulp are exported. Newsprint accounts for 65 percent of all paper exports.
Pulp and Paper Imports—Short-fibred pulp and special papers are imported and constitute over 66 percent of the value of our total forest products imports.
The value of external trade in forest products during the latest 5 years is shown in the following table.
| Year Ended 30 June | Wood Products | Pulp | Paper and Paper Products | All Forest Products |
|---|---|---|---|---|
| Imports $(000) c.i.f. | ||||
| 1979 | 17,476 | 2,725 | 52,008 | 72,209 |
| 1980 | 24,608 | 2,636 | 65,454 | 92,698 |
| 1981 | 25,826x | 6,188x | 63,794x | 95,808x |
| 1982 | 37,029 | 6,655 | 100,819 | 144,503 |
| 1983 | 35,870 | 7,588 | 96,525 | 139,983 |
| Exports $(000) f.o.b. | ||||
| 1979 | 111,439 | 86,291 | 101,553 | 299,283 |
| 1980 | 184,671 | 120,227 | 140,824 | 445,722 |
| 1981 | 205,662 | 151,303 | 175,849 | 532,814 |
| 1982 | 185,084 | 154,704 | 209,570 | 549,358 |
| 1983 | 176,806 | 161,326 | 163,778 | 501,910 |
The following table shows New Zealand's imports of timber by categories for the latest 5 years.
| Year Ended 30 June | Sawn Timber | |||
|---|---|---|---|---|
| Hardwoods | Softwoods | Total | Logs and Poles | |
| cubic metres (thousand) | ||||
| 1979 | 13 | 7 | 20 | 5 |
| 1980 | 17 | 9 | 26 | 3 |
| 1981 | 17x | 9 | 26x | 5 |
| 1982 | 17x | 13 | 30x | 4 |
| 1983 | 16 | 11 | 27 | 3 |
Timber exports are shown by categories in the following table.
| Year Ended 30 June | Indigenous Timber | Radiata Pine | Douglas Fir | Other Exotic | Total Exotics | Total, All Sawn Timber | Logs and Poles |
|---|---|---|---|---|---|---|---|
| cubic metres (thousand) | |||||||
| 1979 | 7 | 358 | 46 | 18 | 422 | 429 | 1,049 |
| 1980 | 9 | 445 | 81 | 18 | 544 | 553 | 1,247 |
| 1981 | 6 | 497 | 75 | 17 | 590 | 596 | 803 |
| 1982 | 6 | 442x | 53 | 14 | 509x | 515x | 473x |
| 1983 | 4 | 369 | 48 | 17 | 434 | 438 | 440 |
| NOTE—Small quantities of roundwood are included in the exports. | |||||||
The following table gives New Zealand's external trade in pulp and paper for the latest 5 years.
| Year Ended 30 June | Wood Pulp | Fibreboard* | Paper and Paperboard | ||
|---|---|---|---|---|---|
| Newsprint | Other Paper and Paperboard† | Total | |||
* In cubic metres. †Excludes manufactures of paper and paperboard; excludes minor items for which no quantities are given. | |||||
| Imports (tonnes) | |||||
| 1979 | 6,413 | 8 | 7,156 | 35,600 | 42,756 |
| 1980 | 4,741 | 70 | 356 | 43,954 | 44,310 |
| 1981 | 8,916 | 53x | 1 950x | 32 627x | 34 577x |
| 1982 | 10,825 | 40 | 2,638 | 43,777 | 46,415 |
| 1983 | 11,567 | 3 | 6,221 | 38,797 | 45,018 |
| Exports (tonnes) | |||||
| 1979 | 433,231 | 13,948 | 206,511 | 99,958 | 306,469 |
| 1980 | 478,739 | 11 128x | 223 290x | 94,266 | 317 556x |
| 1981 | 515,262 | 30,943 | 230,974 | 97,328 | 328,302 |
| 1982 | 422,372 | 24 918x | 199 000x | 110,217 | 309,217 |
| 1983 | 450,877 | 25,211 | 116,826 | 126,829 | 243,655 |
RESEARCH—The Forest Service undertakes and co-ordinates its forestry and forest-product research through the Forest Research Institute, which has 2 divisions at Rotorua and a third at Christchurch, employing 158 scientists, 198 technicians, and a servicing staff. An advisory committee for each division of the institute ensures that the research programmes are relevant to the needs of the forestry and forest-based industries.
The institute maintains a continuous exchange of scientific information with other research organisations in New Zealand and overseas, and provides opportunities for research fellowships under the National Research Advisory Council's fellowship scheme, as well as some finance for universities to undertake contract research.
The institute produces its own annual report. The work of the 3 divisions is described below.
Production Forestry—This division is responsible for research into all aspects of growing forests for productive purposes. Its research programme includes forest establishment, genetics and tree improvement, silviculture and the economics of silviculture, soils and site productivity, mensuration, entomology, pathology, tree physiology, forest health survey, the ecology, management of indigenous forests, and the social implications of forestry.
A large research nursery and tree improvement trial area has been established within the Institute's grounds at Rotorua, as well as a comprehensive network of research trials in State and private forests throughout the country.
Wood Technology—This division undertakes research aimed at making the best use of wood. Its research includes: wood structure and quality; sawmilling; drying, and preservation; timber engineering; adhesives and composite wood products; pulp and paper; wood chemistry; and the production of
ethanol by wood hydrolysis and fermentation. In carrying out its work, this division maintains close contacts with the timber and building industries and is therefore represented on numerous agencies associated with building standards and timber use and preservation.
Protection Forestry—Located in the grounds of the University of Canterbury in Christchurch, this division undertakes research into methods of protecting and restoring the soil, water, and other values of forests. It studies the ecology of mountain-land forests, the biology and control of introduced animals such as deer and opossum, the influence of forest operations on slope stability and erosion, and the revegetation of eroded areas.
Industry, the universities, and the Department of Scientific and Industrial Research also carry out research into many aspects of forestry and forest products.
TRAINING IN FORESTRY—The Forest Service recruits school leavers up to 20 years of age as forestry trainees. They work and train for 12 months in the field while continuing their education, often by correspondence, to gain prerequisites for further study. Management-orientated trainees wishing to obtain the New Zealand Certificate in Forestry undertake 3 years of block study courses at the Forestry Training Centre as well as practical training in forests to gain a balanced education in forest management. Research and technical trainees are also catered for with course alternatives for the certificate, and an increasing number of Forest Research Institute technician recruits are studying for the New Zealand Certificate in Forestry rather than the New Zealand Certificate in Science.
Planning- or technically-orientated trainees wishing to do university study attend a 4-year degree course in forestry at the University of Canterbury, doing practical work during vacations. Private students may also study for a bachelor of forestry science degree and take post-graduate courses leading to a master of forestry science degree and Ph.D. in forestry.
Each year the Forestry Training Centre in Rotorua holds about 50 in-service management courses for forest industry personnel. The Timber Industry Training Centre, also in Rotorua, provides courses in sawmill practice, sawdoctoring, and timber machining. Accommodation, catering, and recreational facilities of a high standard are available at the Forest Training Centre Hostel for those attending courses.
EMPLOYMENT—Because the major manufacturing units are logically located near their raw material supplies, there is a concentration of employment in the forestry and wood products industries near the largest forest areas. This is seen in the central North Island where over half the country's exotic forests are located, and where one-quarter of the regional labour force is engaged in forest industries. In fact, the forest industries have had a very marked effect on regional development. The current prosperity and the fast growth of population in the Rotorua - Bay of Plenty area is due in no small measure to the expansion of the forest industries. Apart from the expansion of the established towns such as Rotorua, the industrial development of New Zealand Forest Products Ltd., Tasman Pulp and Paper Co. Ltd., and Caxton Paper Mills Ltd. led to the establishment of the completely new town—Kawerau—and the rapid growth of another—Tokoroa. The development of these industrial complexes has also stimulated other industries, especially transport, vehicle repair, and building and construction. Similarly, the expansion of exports of forest products was partly responsible for the increased tonnages that have passed through the ports of Tauranga and Napier over the last decade.
The following table shows the number of employees and working proprietors in the forest industries in recent years.
| As at February | Forestry* | Logging† | Sawmilling‡ | Timber Merchanting | Pulp, Paper, and Paperboard | Other§ | Total |
|---|---|---|---|---|---|---|---|
* Includes silviculture, nurseries, etc. †Includes felling, cutting, and haulage. ‡Includes planing mills. §Includes other wood industries, plywood and veneer factories, manufacture of furniture and fittings, wooden and cane containers, and wood and cork products. ||At 15 May. | |||||||
| 1980|| | 5,311 | 3,133 | 6,693 | 3,309 | 12,586 | 14,523 | 45,555 |
| 1981 | 5,179 | 3,008 | 6,999 | 3,305 | 12,520 | 14,767 | 45,778 |
| 1982 | 5,200 | 2,927 | 7,097 | 3,577 | 12,388 | 16,068 | 47,257 |
| 1983 | 5,055 | 2,773 | 6,582 | 3,526 | 12,346 | 14,589 | 440,871 |
THE OUTLOOK—The State manages about 75 percent of the country's indigenous forests and half of the exotic forests.
The contribution of indigenous forests to timber supply has steadily declined from the mid 1950s, and will continue to be reduced to a level which can be sustained by areas targeted for long-term production. However the future of State indigenous forests lies more in soil and water conservation, the protection of ecological systems and recreation, than in timber production.
The exotic forest resource continues to increase, and although harvestable volumes of wood are unlikely to exceed current levels in the 1980s, in the next decade there will be a marked expansion in the supply of exotic timber.
As domestic demand for forest products is expected to grow slowly, virtually all of the increase in wood supply will be available for export.
Approximately 40 percent of all exotic softwood harvested in New Zealand is used in export products, providing a sound basis for future expansion of the wood processing industry.
The first 5-yearly Census of Forestry and Logging was taken by the Department of Statistics for the year 1979–80 as an integrated economic census covering the activities of establishments and ancillary units engaged in those 2 activities, with the exception of forests of less than 100 hectares which were excluded from the census. The census formed part of the Department of Statistics 5-yearly series of integrated economic censuses and classified the industries under the New Zealand Standard Industrial Classification.
The statistical tables which follow give summaries of these activities. The definitions used in the tables are the same as listed in the Census of Manufacturing Statistics (see Section 19), with the following exceptions.
Establishments—For forestry activities, forests of 100 hectares or more were classified as well as the depots or offices from which forestry activities were organised. For logging activities, the office or home address of the logger was the establishment.
Persons Engaged—Numbers of people employed, including working proprietors, in the establishments and ancillary units on 28 February 1980.
Operating Surplus—In the forestry industry, the opening and closing value of “standing forests” are included.
The following table gives a general summary of the results of the 1979–80 Census of Forestry and Logging.
| Item | Unit | Total |
|---|---|---|
| Establishments and ancillary units | No. | 908 |
| Persons engaged at 28 February, including working proprietors | No. | 8,479 |
| Salaries and wages paid | $(000) | 74,365 |
| Depreciation | $(000) | 6,361 |
| Purchases and other expenses | $(000) | 166,496 |
| Turnover | $(000) | 227,924 |
| Value added | $(000) | 184,030 |
| Capital expenditure less disposals | $(000) | 26,402 |
| Values of standing forests— | ||
| Opening values | $(000) | 1,935,543 |
| Closing values | $(000) | 2,052,363 |
In the following 2 tables, statistics are given at industry (subgroup) level.
| Industry | Operating Units | Persons Engaged at End of February | Salaries and Wages Paid During Year | |
|---|---|---|---|---|
| Establishments | Ancillary Units | |||
| No. | No. | No. | $(000) | |
| Forestry | 370 | 31 | 4,989 | 44,825 |
| Services to forestry | 83 | – | 482 | 2,858 |
| Total, forestry | 453 | 31 | 5 471 | 47,683 |
| Felling and cutting of trees and bush hauling of logs | 354 | – | 2,715 | 24,718 |
| Other logging | 70 | – | 293 | 1,964 |
| Total, togging | 424 | – | 3 008 | 26,682 |
| Total, forestry and logging | 877 | 31 | 8 479 | 74,365 |
| Industry | Depreciation | Purchases and Other Expenses | Turnover | Value Added | Capital Expenditure Less Disposals |
|---|---|---|---|---|---|
| $(thousand) | |||||
| Forestry | 1,211 | 55,385 | 54,694 | 124,966 | 15,298 |
| Services to forestry | 306 | 4,389 | 8,846 | 4,533 | 613 |
| Total, forestry | 1,517 | 59,774 | 63,540 | 129,499 | 15,910 |
| Felling and cutting of trees and bush hauling of logs | 4,288 | 103,296 | 157,018 | 50,552 | 9,365 |
| Other logging | 556 | 3,425 | 7,366 | 3,979 | 1,127 |
| Total, logging | 4,844 | 106,721 | 164,384 | 54,531 | 10,492 |
| Total, forestry and logging | 6,361 | 166,496 | 227,924 | 184,030 | 26,402 |
Regional summaries of the Census as a whole are shown in the 2 statistical area tables which follow.
| Statistical Area | Operating Units | Persons Engaged at End of February | Salaries and Wages Paid During Year | |
|---|---|---|---|---|
| Establishments | Ancillary Units | |||
| No. | No. | No. | $(000) | |
| Northland | 63 | – | 548 | 4,590 |
| Central Auckland | 40 | 4 | 249 | 1,779 |
| South Auckland - Bay of Plenty | 318 | 6 | 4,022 | 38,673 |
| East Coast | 16 | – | 310 | 2,658 |
| Hawke's Bay | 44 | 5 | 314 | 2,240 |
| Taranaki | 14 | – | 64 | 440 |
| Wellington | 87 | 5 | 520 | 3,903 |
| Total, North Island | 582 | 20 | 6 027 | 54,283 |
| Marlborough | 26 | – | 30 | 44 |
| Nelson | 92 | 4 | 723 | 5,893 |
| Westland | 28 | 4 | 293 | 2,480 |
| Canterbury | 63 | 2 | 531 | 4,626 |
| Otago | 40 | 1 | 469 | 3,705 |
| Southland | 46 | – | 406 | 3,334 |
| Total, South Island | 295 | 11 | 2 452 | 20,082 |
| Total, New Zealand | 877 | 31 | 8 479 | 74,365 |
| Statistical Area | Depreciation | Purchases and Other Expenses | Turnover | Value Added | Capital Expenditure Less Disposals |
|---|---|---|---|---|---|
| $(thousand) | |||||
| Northland | 216 | 4,722 | 7,636 | 11,616 | 1,314 |
| Central Auckland | 278 | 2,643 | 3,671 | 4,873 | 1,042 |
| South Auckland - Bay of Plenty | 4,199 | 127,453 | 177,619 | 96,110 | 14,260 |
| East Coast | 72 | 1,792 | 857 | 5,521 | 442 |
| Hawke's Bay | 120 | 2,871 | 2,324 | 7,405 | 787 |
| Taranaki | 69 | 686 | 1,084 | 1,065 | 253 |
| Wellington | 200 | 4,941 | 5,986 | 8,756 | 1,235 |
| Total, North Island | 5,155 | 145,108 | 199,177 | 135,345 | 19,333 |
| Marlborough | 6 | 428 | 235 | 2,425 | 387 |
| Nelson | 466 | 8,933 | 12,563 | 15,967 | 3,472 |
| Westland | 45 | 2,674 | 2,633 | 4,817 | 900 |
| Canterbury | 305 | 3,832 | 5,757 | 10,642 | 835 |
| Otago | 239 | 3,370 | 4,902 | 7,893 | 1,027 |
| Southland | 145 | 2,151 | 2,657 | 6,941 | 448 |
| Total, South Island | 1,206 | 21,388 | 28,747 | 48,684 | 7,069 |
| Total, New Zealand | 6,361 | 166,496 | 227,924 | 184,030 | 26,402 |
FURTHER INFORMATION—Additional information will be found in the following publications:
Report of the Director-General of Forests (Parl. paper C. 3).
Statistics of the Forests and Forest Industries of New Zealand (N.Z. Forest Service, updated periodically).
New Zealand Census of Forestry and Logging 1979–80 (Department of Statistics).
Table of Contents
Food from the sea figured prominently in the diet of the Polynesian inhabitants of New Zealand for over a thousand years. Fish was also important to' white settlers, but it is only within the last two decades that fishing has attained status as a significant industry.
Whalers and sealers were the first Europeans to tap the potential of New Zealand waters. In 1844 whale oil and other products were fetching more than £50,000 on London markets.
Fishing had existed as a way of life among the European inhabitants of New Zealand for more than a century before, in 1945, the Government of the day introduced a system of licensing of fishing vessels which provided for the vessels to land catches only at their port of registration. This was designed to maintain a sensible distribution of vessels, fishing effort, and catches around New Zealand's long coastline. The fishing vessels were mainly small and local, and any surplus fish were exported. There was, however, no steady export trade. In 1962 a Parliamentary Select Committee was appointed to examine the prevailing restrictive licensing system and review practices. It recommended the, abolition of the system which, with the advent of larger vessels and the discovery of new resources, restricted the expansion and diversification of the industry.
At this time there was a mounting world-wide demand for protein foods. Russian and Japanese fishing boats were penetrating into the hitherto unexploited south-west Pacific, including New Zealand waters, where of the 42 food fishes known to be caught locally, only 7 were being marketed regularly.
Restrictive licensing was abolished in 1964 and the Fishing Industry Board was established to help promote the industry.
From 1964 onwards, the industry has not only expanded, but also diversified into rock oyster and mussel cultivation and begun to employ different catching methods to land tuna and other pelagic species, which previously represented a largely untapped resource in New Zealand waters.
The establishment of new processing plant principally to export quality wet fish, larger and more regular supplies, the development of attractive packaging, and the introduction of Government-controlled quality standards are now resulting in expanding export markets.
In 1977 the Minister of Fisheries was empowered to declare any fishery controlled. The basic objective of the controlled fisheries legislation is to enable fisheries management measures to be introduced to match fishing effort in a particular fishery to the ability of the resource to provide a sustained yield. A number of fisheries have been declared controlled. In 1982 a moratorium was placed on the issue of additional permits for inshore fisheries.
The advent of the 200-mile Exclusive Economic Zone in 1978 provided the incentive for a considerable increase in investment in larger fishing vessels to fish the deeper water outside the 200-metre isobath and in fish processing facilities. It also, through Government policy, led to the replacement of some licensed foreign fishing effort by co-operative fishing ventures between foreign and New Zealand companies.
The primary aims of current government fisheries policy are to:
ensure a continuing harvest of high quality fish for an economically sound industry contributing to export earnings and supplying the local market;
encourage the development of aquaculture (fish farming);
protect and where possible improve the fisheries environment;
enhance the natural stocks where this is practicable and economically feasible;
conserve and enhance the opportunities for recreational fishing and the study of marine life.
RESOURCES: The 200-Mile Exclusive Economic Zone (EEZ)—New Zealand's 200-mile Exclusive Economic Zone was implemented on 1 April 1978 and with an approximate area of 1.2 million square nautical miles is one of the world's largest.
The Act establishing the EEZ does not extend territorial limits. It gives control over conservation and management of resources, but no claim, in real terms, to ownership. Control over all activities in the zone must be in accord with international law.
The zone is divided into 8 fisheries management areas. In spite of the relatively large size of the zone some two-thirds of its area is too deep for bottom fishing methods such as trawling and longlining.
The fish resources of the zone, although substantial, are not rich by world standards. The inshore fisheries of New Zealand's territorial waters are, for the most part, fully exploited and future development depends largely on fishing the deeper waters of the zone.
The sustainable biological yields in the New Zealand territorial sea and EEZ waters are currently estimated at about 400 000 tonnes of wetfish, 91 000 tonnes of squid, and over 20 000 tonnes of tuna. The domestic industry is estimated to have the capacity to harvest over 130 000 tonnes of this, with the remainder (mainly squid and deep-water species) being apportioned amongst co-operative fishing ventures and any balance to foreign nations.
Estimates of fish stocks are based mainly on catch data from commercial fishing vessels and research vessels, and are being constantly refined as new information becomes available.
Marine Farming—There is scope for increasing the natural stocks of some species through aquaculture (fish farming). The species actively farmed are rock and Pacific oysters and mussels. Development projects are underway for scallops, and since the change in the Marine Farming Act in 1083, also for salmon in sea cages.
Controlled Fisheries—In 1977, legislation was introduced to give the Minister of Fisheries the power, when necessary, to declare a controlled fishery, and so to regulate, among other things, the species, quantity, and size of fish that could be taken from the fishery, the type of fishing method used, the areas that could be fished, and the persons who could be engaged in the fishery.
A controlled fishery allows a tight regulation of total effort and the fishing activity of each person with a licence to fish in the fishery.
The issue of licences to fishermen in a controlled fishery is the prerogative of the Fisheries Licensing Authority. This is independent of the Ministry of Agriculture and Fisheries but receives advice and administrative services from it.
In 1978, three fisheries were declared fully controlled—the Tasman Bay scallop fishery, the Coromandel scallop fishery, and the Lake Ellesmere eel fishery.
The rock lobster fishery, which has been under a moratorium, has now been brought under control. The coastline has been divided into 10 areas and the implementation of control in all areas was completed by mid-1981. The Hauraki Gulf wet-fish fishery was also brought under control early in 1983.
Fisheries Act 1983—In October 1983, the Fisheries Act 1983 was passed to replace the Fisheries Act 1908. The aim of the new Act is to reform the law relating to management and conservation of fisheries and fishery resources within New Zealand. The Act introduces the concept of fishery management plans. The purpose of these plans will be to conserve, enhance, protect, allocate, and manage the fisheries resources within New Zealand's fisheries waters.
The Fisheries Act continues the concept of controlled fisheries and expands the role of the Fisheries Licensing Authority, which was created in 1977, but under the new name of Fisheries Authority. The Authority will consider fishery management plans as well as controlled fishery licences.
Catch—The landings of fish (including shellfish and Crustacea) by domestic fishermen in 1982 was an estimated 116 181 tonnes.
Composition of the catches is extremely varied and most species are landed whole. About 50 species of wetfish are landed, but many only in small quantities. In 1982, three dominant species contributed 32.4 percent of the total landings. These were barracouta (10.5 percent) and snapper (11.0 percent) and orange roughy (10.9 percent).
Catches during the latest available 4 years are shown by class of fish or shellfish, landed weight, and value in the following table.
| Class of Fish or Shellfish | 1980 | 1981 | 1982 | 1983 | ||||
|---|---|---|---|---|---|---|---|---|
| Tonnes | Value | Tonnes | Value | Tonnes | Value | Tonnes | Value | |
* Includes bass. †Includes joint venture catches, otherwise statistics refer to domestic coastal fishing fleet. ‡1000 tonnes landed outside New Zealand. | ||||||||
| (000) | $(000) | (000) | $(000) | (000) | $(000) | (000) | $(000) | |
| Barracouta | 8.8 | 999 | 12.2 | 1,578 | 10.3 | 1,859 | 11.0 | .. |
| Flounder | 1.8 | 1,673 | 2.2 | 2,418 | 1.8 | 2,506 | 1.9 | .. |
| Gurnard | 3.4 | 1,544 | 3.9 | 2,061 | 3.4 | 1,923 | 3.2 | .. |
| Hapuku | 2.2 | 2,541 | 2.3 | 2,584* | 1.7 | 2,734 | 2.1 | .. |
| Hoki | 2.7 | 996 | 5.4 | 1,373 | 6.4 | 2,047 | 7.3 | .. |
| Mackerel | 4.5 | 450 | 5.4 | 532 | 3.9 | 662 | 3.8 | .. |
| Orange Roughy | .. | .. | .. | 333 | 10.3 | 9,774 | 17.1 | .. |
| Red Cod | 2.6 | 617 | 2.3 | 708 | 4.0 | 1,476 | 5.4 | .. |
| Shark | 5.0 | 2,603 | 5.7 | 4,159 | 6.7 | 4,992 | 7.0 | .. |
| Skipjack | 9.1† | 4,809† | 3.5 | 2,521‡ | 3.7 | 3,276 | 3.9 | .. |
| Snapper | 11.9 | 11,257 | 11.9 | 14,912 | 10.7 | 17,390 | 7.9 | .. |
| Sole | 1.3 | 997 | 1.8 | 1,799 | 1.5 | 1,927 | 2.2 | .. |
| Tarakihi | 4.7 | 3,338 | 4.8 | 3,965 | 4.2 | 3,994 | 3.6 | .. |
| Trevally | 4.3 | 2,249 | 4.6 | 2,783 | 4.8 | 3,486 | 3.3 | .. |
| Other | 18.3 | 7,505 | 21.4 | 10,147 | 22.6 | 13,213 | 23.7 | .. |
| Total, wetfish | 80.6 | 41,578 | 87.4 | 51,873 | 96.0 | 71,259 | 103.4 | .. |
| Eels | 1.4 | 1,431 | 1.0 | 1,037 | 0.9 | 851 | 1.2 | .. |
| Rock lobster | 4.3 | 22,575 | 4.6 | 24,815 | 4.9 | 34,665 | 4.8 | .. |
| Oysters (dredge and rock) | 10.7 | 6,647 | 9.5 | 5,822 | 11.1 | 9,759 | 9.7 | .. |
| Mussels (wild) | 3.5 | 1,750 | 1.4 | 662 | 0.9 | 442 | 0.4 | .. |
| Paua | 0.7 | 490 | 1.3 | 1,335 | 0.8 | 1,290 | 1.1 | .. |
| Scallops | 1.2 | 1,220 | 1.5 | 935 | 1.8 | 2,087 | 3.6 | .. |
| Squid | 0.3 | 143 | 1.0 | 506 | 0.6 | 519 | 1.3 | .. |
| Other | 0.6 | 180 | 0.2 | 88 | 0.3 | 104 | 0.6 | .. |
| Total, all fish | 103.3 | 76,014 | 107.9 | 87,073 | 117.3 | 120,976 | 126.1 | .. |
The value of fisheries products is shown in the following graph.
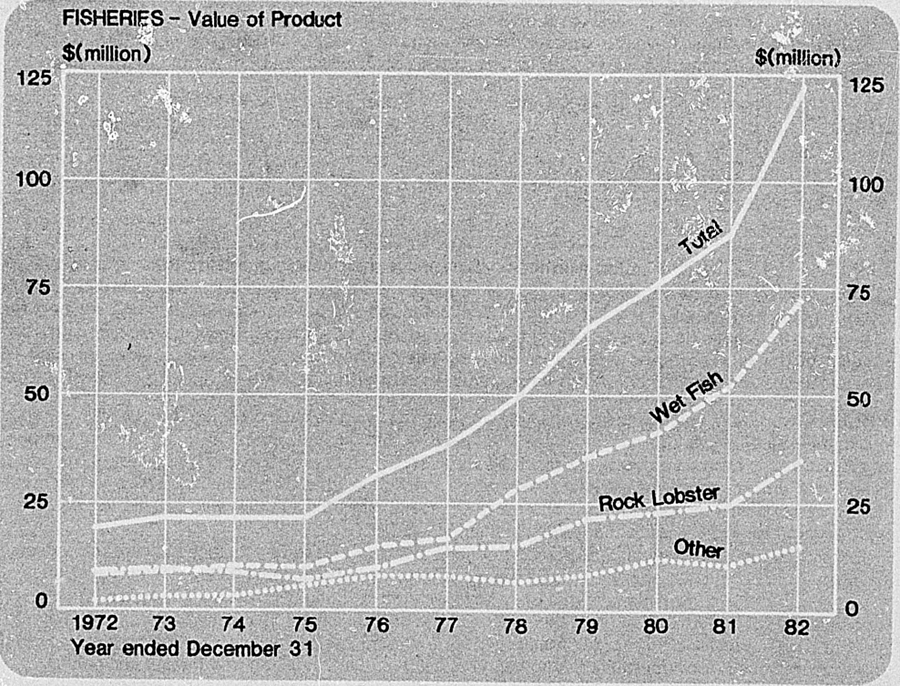
EXPORTS—The total value of New Zealand's fisheries exports during the year ended June 1983 increased by $55.2 million, an increase of 24 percent over the figure for the previous June year, to a record total of $285.5 million.
Exports of rock lobsters have been a valuable source of overseas earnings since the 1950s and 1960s, but in recent years there have been significant increases in exports of wetfish and shellfish. Squid, almost all of it the product of co-operative fishing ventures, has made up the bulk of the shellfish exports, although farmed mussels and oysters are of increasing importance.
The following table shows the main categories of fisheries exports for the two latest December years.
| Commodity Exported | Year Ended December | |||
|---|---|---|---|---|
| 1982 | 1983 | |||
| Quantity | Value | Quantity | Value | |
| * Excludes quantities of oysters (amounting to 793 522 dozen). | ||||
| $(000) | $(000) | |||
| tonnes | f.o.b. | tonnes | f.o.b. | |
| Finfish or wetfish | 79,140 | 135,099 | 86,842 | 169,729 |
| Rock lobster | 2,684 | 48,119 | 2,737 | 53,548 |
| Shellfish (squid, mussels, oysters, etc.)* | 41,760 | 69,881 | 41,064 | 86,188 |
| Total | 123 584 | 253,099 | 130 643 | 309,465 |
Rock Lobsters—The development of a market for rock lobsters in the United States in 1948 provided a major stimulus for the export industry. In 1962 rock lobster landings totalled 4572 tonnes, and by 1968 they had risen to 10 909 tonnes valued at $7,433,006. This was the peak year of the fishery at the Chatham Islands, where prolific rock lobster grounds had been discovered.
From 1968 landings showed a general downward trend until the mid-1970s, when they began to climb again. Exports in 1981 were 2286 tonnes worth $35.7 million and appear to have stabilised.
Finfish—Between 1964 and 1983 the production of finfish increased 240 percent (from just under 30 000 tonnes to 103 000 tonnes) and since 1978 the value of finfish exports has exceeded that of rock lobsters. During the year ended December 1983 finfish exports increased by almost 26 percent in value but only increased 10 percent by volume over the previous year's total. Finfish exports made up 55 percent of the total value of fisheries exports compared with 53 percent the previous December year.
FISHING INDUSTRY: Fishing Methods—Trawling is the principal method of taking demersal or bottom dwelling fish. All types of trawling accounted for 62 percent of the total wetfish catch of the domestic fleet in 1981. Various line methods accounted for 9.2 percent of the catch and set nets for 10.7 percent. Pelagic or surface dwelling fish are being increasingly caught by purse seining and 14.4 percent of the total domestic catch was taken by this method in 1981. This excludes the catch of chartered foreign super seiners, which have greatly increased the landings of skipjack in recent years.
Fishing Grounds—The continental shelf, to which coastal vessels have confined their activity, extends out to a depth of about 200 metres, but is fairly narrow. Although in some areas, such as the Taranaki Bight, it extends for a considerable distance off shore and in others, such as the south-west of the South Island, it is almost contiguous with the coast line, its average width is 20 kilometres. There are 36 trawl-fishing ports, including 16 of major importance. These are located fairly evenly around the coastline, with trawlers having access to the whole continental shelf.
Coastal fishing vessels work throughout the year, with no marked fluctuations except for seasonal changes to fish particular species. A full-time coastal trawler averages between 100 and 160 days at sea a year, but there are regional variations due to weather limitations. Trawling is more intensive along eastern coasts of both islands. The deeper waters of the Exclusive Economic Zone beyond the continental shelf are currently fished by larger fishing vessels (over 35 metres) which are operated by licensed foreign companies or co-operative fishing ventures between New Zealand and foreign companies.
Main Fishing Ports—Nelson is New Zealand's largest port in teams of tonnes of wetfish landed. During 1983, 22 933 tonnes were landed with the major species being orange roughy (6613 tonnes) and hoki (5124 tonnes).
Other ports where significant tonnages were landed were: Timaru, 7914 tonnes (3202 tonnes of barracouta, and 1985 tonnes of red cod); Tauranga, 7701 tonnes (1493 tonnes of skipjack tuna, and 1035 tonnes of jack mackerel); Auckland, 6874 tonnes (2691 tonnes of snapper, and 698 tonnes of gurnard); Gisborne, 6802 tonnes (1940 tonnes of skipjack tuna, and 942 tonnes of tarakihi); Greymouth, 6575 tonnes (1396 tonnes of barracouta, and 822 tonnes of red cod); and Manukau, 6180 tonnes (1479 tonnes of trevally, and 1197 tonnes of snapper).
Fishing Permits—Following me introduction of the Fisheries Act 1983 on 1 October 1983 a definition for “Commercial Fisherman” was introduced, and persons were no longer able to obtain a fishing permit as of right. As a result the number of fishing permits were considerably reduced because many of the applicants did not meet the requirements of the definition. Each individual and company operating commercially must have a permit and each fishing vessel must be registered. Numbers of registered vessels are provided in the following table.
| Registered Vessels | 1981 | 1982 | 1983 |
|---|---|---|---|
| Domestic vessels | 5,094 | 4,824 | 2,747 |
| Foreign charter vessels | 92 | 63 | 75 |
| Shore fishing permits | 794 | 806 | 250 |
Fisheries Development—Responsibility for the optimum development of fishery resources rests with three divisions of the Ministry of Agriculture and Fisheries; the Fisheries Research Division, the Fisheries Management Division, and the Economics Division. Promotion of industrial development is a responsibility of the New Zealand Fishing Industry Board.
Most of the marine research programme is controlled from the Fisheries Research Laboratory in Wellington. Freshwater research is carried out mainly at Christchurch and also at Rotorua. Two research vessels are operated by the Fisheries Research Division; the 42-metre James Cook is used all round New Zealand from her base in Nelson, and the 28-metre vessel Kaharoa is based in Wellington but works on all coastal fishing grounds.
Many of the commercially important species of demersal and pelagic fish in New Zealand waters are being studied by the Fisheries Research Division. Work has already resulted in the establishment of safe biological yields for some coastal and deepwater fisheries. Considerable effort is being applied to redefining estimates of total allowable catches in the 200-mile Exclusive Economic Zone.
Commercially important species of shellfish are also being studied, both in the wild and as subjects for aquaculture. Because of pressure on some shellfish resources, the number of shellfisheries is being controlled. Research work has provided valuable information for controlling these fisheries, particularly that for rock lobsters, which is New Zealand's most valuable inshore fishery.
Development until recent years has in the main been influenced by a traditionally small and highly selective domestic market, which has not encouraged diversification in processing methods for fish which did not meet the normal domestic demand for a white-fleshed, bland, non-oily, relatively bone-free type of fish.
There are changes in the world-wide demand for fish as the more popular species reach the point of over exploitation. Thus, fish species which in the past had little or no value on either the domestic or the export market are now acquiring a new value internationally. The time is appropriate for the expansion and development of certain types of fisheries, but a great deal will depend upon the economics of these operations.
The governing legislation for the fishing industry is the Fisheries Act 1983, the Marine Farming Act 1971, and the Marine Reserves Act 1971. The Territorial Sea and Exclusive Economic Zone Act 1977, which redefined the territorial sea and established a 200-mile Exclusive Economic Zone, is the legislation under which foreign vessels are licenced.
NEW ZEALAND FISHING INDUSTRY BOARD—The New Zealand Fishing Industry Board was formed In 1964 to promote the interests of all sectors of the fishing industry, It is a statutory organisation deriving income from an industry levy and Government sources. Outside its major responsibilities of aiding an orderly and profitable development of the industry, the board deals with specialised problems at the request of individual fishermen, processors, retailers, and fish farmers, as well as on behalf of the entire industry where, for example, liaison with the Government is required.
Practical involvement with the industry is maintained by the presence on the board of two fishermen representatives, two fish processors, and a fish retailer. These are elected by their respective organisations. An independent chairman, the Director-General of the Ministry of Agriculture and Fisheries or his nominee, and one other member appointed by the Minister of Fisheries complete board membership.
Continual communication with fishing and governmental organisations in many other countries is fostered. The resultant exchange of information enables the board to bring to the industry a great diversity of developments in technology and fisheries policy areas.
A staff of 34, stationed in Wellington, are involved in fishing methods, aquaculture, processing, marketing, and the economics of the industry. Board staff liaise closely with the Fishing Industry Training Council, whose current chairman is also general manager of the board, in the area of industry training at all levels.
ASSISTANCE TO THE FISHING INDUSTRY—The Rural Banking and Finance Corporation provides financial assistance to the fishing industry. This includes loans for vessel replacement and improvements to vessels, and for the development of mussel and rock oyster farms. Loans are also made for cold storage and processing facilities. A summary of loan authorisations during the last three years is shown in the following table.
| Loans | 1981–82 | 1982–83 | 1983–84 | |||
|---|---|---|---|---|---|---|
| Number | Value | Number | Value | Number | Value | |
| $(m) | $(m) | $(m) | ||||
| Loans for catching | 160 | 10.45 | 100 | 4.77 | 60 | 3.92 |
| Loans for processing facilities | 14 | 2.60 | 9 | 2.95 | 11 | 2.62 |
| Rural export suspensory loans | 4 | 0.33 | – | – | 4 | 0.22 |
| Total | 178 | 13.38 | 109 | 7.72 | 75 | 6.76 |
Foreign Licensed Fishing—Since the Territorial Sea and Exclusive Economic Zone Act came into effect on 1 April 1978, foreign trawling activity has been strictly controlled and catch limits enforced. Quotas have been issued and licensed access agreements have been negotiated between New Zealand and the Republic of Korea, the Soviet Union, and Japan. Applications by foreign countries to fish must include plans showing areas to be fished, numbers and sizes of vessels, target species, and other details. Apportionments are made to countries for special quantities by area. By-catch levels can be set for selected species. In the case of tuna caught by longline and purse seine and for squid caught by jigging, no catch allocation has been made, but the total number of vessels is limited.
All countries licensed to fish in the EEZ are charged fees based on the landed market value of the species caught.
The following allocations for trawl and bottom line were made in 1983, the wetfish allocations to apply until 30 September 1984 and the squid allocation to 30 September 1984.
| Country | Wetfish | Squid |
|---|---|---|
| tonnes (000) | ||
| Korea, Republic of | 18.2 | 2.8 |
| USSR | 2.0 | 10.0 |
| Japan | 66.0 | 9.9 |
In addition, the Republic of Korea was authorised to operate 6 squid jigging vessels and Japan, 92 such vessels, with no tonnage restriction. Authorisations were also given for the Japanese to operate 93 tuna longliners without tonnage restriction in the southern bluefin tuna fishery, and for an unlimited number of vessels from Japan, Taiwan, and Korea to operate in the albacore fishery in the northern regions of the EEZ (Taiwan was subject to the arrangement of acceptable insurances and bonds).
DEEPWATER FISHERIES—To enable local fishing interests to gain more knowledge of advanced fishing techniques, fish handling, and fish processing, the Government encouraged the operation of cooperative fishing ventures with foreign partners during the 5 years to March 1983. This development phase is ending.
In the deepwater trawl fishery a system of allocation of high value species is now in place under which 12 companies and other groups have rights for 10 years to take specified quantities of fish. A review of the squid fishery, using data obtained during co-operative venture fishing, is also being conducted with a view to instituting similar longer term operations. Only in the squid jigging and skipjack tuna fields is the co-operative venture system continuing.
Japan, USSR and the Republic of Korea continue to fish some areas of the 200-mile zone.
The following table gives details of deepwater trawling allocations to New Zealand companies during 1983–84.
| Species | Allocation |
|---|---|
| tonnes | |
| Barracouta | 27,650 |
| Hake | 2,400 |
| Hoki | 40,400 |
| Ling | 8,000 |
| Oreo dory | 20,600 |
| Orange roughy | 34,700 |
| Silver warehou | 6,000 |
| Squid | 27,300 |
Deepwater trawling allocations of finfish and squid to foreign nations during 1983–84 are shown in the following table.
| Country | Allocation | |
|---|---|---|
| Finfish | Squid | |
| tonnes | ||
| Japan | 66,100 | 9,900 |
| USSR | 20,000 | 10,000 |
| Republic of Korea | 18,185 | 2,800 |
The 1983–84 squid jigging allocation for co-operative ventures and other countries is shown below.
| Species | Allocation |
|---|---|
| tonnes | |
| Co-operative ventures | 17,160 |
| Japan | 20,240 |
| Republic of Korea | 1,320 |
SPECIES OF FISH AND SHELLFISH: Demersal Fisheries—Of the inshore species of demersal fish the most important is the snapper (Chrysophrys auratus), which is the principal species in trawl catches off the north-east and west coasts of the North Island and the north-west corner of the South Island. Other important species are barracouta (Thyrsites atun) and red cod (Pseudophycis bachus), taken by trawlers mainly round the South Island; tarakihi (Nemadactylus macropterus) caught round the South Island and the east coast of the North Island; gurnard (Chelidonichthys kumu) taken by trawlers in the North Island and east coast of the South Island; trevally (Caranx georgianus), which is taken by trawlers and purse seiners round the North Island; and jack mackerel (Trachurus spp.) trawled for on the north-eastern and western North Island shelf. Flounders and soles are taken in shallower waters, mainly by trawl and set net.
The principal species taken by longline are snapper, particularly in the north-east of the North Island; groper (Polyprion oxygeneios) and ling (Genypterus blacodes) in most areas, though blue cod (Parapercis colias) is the main line-caught species around Stewart Island and the Chatham Islands.
Further offshore, deeper water species such as hoki (Macruronus novaezealandiae) and silver warehou (Seriolella punctata) are caught on the Chatham Rise and off the east coast of the South Island. Off the west coast of the South Island hoki and hake (Merluccius australis) are the principal deepwater species and on the Campbell Plateau to the south of New Zealand, catches are dominated by southern blue whiting (Micromesistius australis). In deeper water still, at around 1000 metres and particularly on the Challenger Plateau and the Chatham Rise, catches consist largely of oreo dories (Allocyttus and Neocyttus) and orange roughy (Hoplostethus atlanticus). Hoki, hake, and orange roughy are increasingly important species for the domestic trawl fleet.
Pelagic Fisheries—A number of species including trevally, kahawai (Arripis trutta), blue mackerel (Scomber japonicus) and jack mackerel (Trachurus spp.) are taken by purse seining. There are also a number of smaller species such as pilchards (Sardinops neopilchardus), sprats (Sprattus antipodum) and anchovy (Engraulis australis) which are being evaluated as bases for commercial fisheries.
Three species of tuna are fished commercially in New Zealand waters. Skipjack (Katsuwonus pelamis) are caught by purse seiners round the north of the North Island in summer, and albacore (Thunnus alalunga) mainly by trolling off the east coast of the North Island and the west coasts of both islands. The southern bluefin tuna (Thunnus maccoyii) is caught mainly by Japanese longline vessels off the east coasts of both islands, but is also caught by New Zealand vessels off the west coast of the South Island. Fisheries for all 3 species are being carefully monitored.
The squid fishery is another substantial fishery in New Zealand waters, with some 80 000 tonnes being caught annually, by squid jigging vessels around the main islands and by trawlers round the Auckland Islands.
Shellfisheries—The fishery for rock lobsters (mainly Jasus edwardsii) is New Zealand's most important and valuable inshore fishery. Other valuable shellfisheries are oysters (Tiostrea lutaria) in Foveaux Strait, scallops in Tasman Bay and off the north-east coast of the North Island, and paua, the New Zealand abalone (Haliotis iris). In addition, the green-lipped mussel (Perna canaliculus) and rock oysters and Pacific oysters (Saccostrea glomerata and S. gigas) are the basis of thriving aquaculture enterprises.
Oyster Farming—The oyster farming industry is primarily situated in northern waters with both tray and stick cultivation being employed. A recent trend is the industry preference for the pacific oyster which reaches maturity in approximately half the time required for rock oysters.
A total of 597 tonnes of oysters, valued at $1,096,000 was exported to 28 countries during the year ended December 1983. The largest markets were Australia, Hong Kong, New Caledonia, and French Polynesia. Local consumption for the same period was approximately 681 tonnes, valued at $1,500,000.
Mussel Farming—At present the farming of green-lipped mussels is primarily undertaken in the Marlborough Sounds. The Coromandel region is also a popular location. In the year ended December 1983, 854 tonnes of mussels, valued at $3,655,000 were exported to 30 countries. The largest markets were Japan, the U.S.A. and Australia. Domestic consumption for the same period was approximately 650 tonnes, valued at $2,600,000.
Rock Lobsters—Rock Lobsters (Jasus edwardsii and J. verreanxi) occur off many parts of the New Zealand coast. Some of the catch of rock lobsters is sold in local markets for domestic consumption but most is exported as frozen rock lobster tails and whole rock lobsters.
With the development of the export of frozen tails to the United States of America and the productive fishing in the Chatham Islands, the catch of rock lobsters increased until 1968. The boom period, however, has now passed and the aim of all concerned is to ensure that this valuable fishery continues to provide a stable production. It now operates as a controlled (limited entry) fishery, and all fishermen are licensed. The most valuable fishery now lies between East Cape and Kaikoura.
| Year | Production (whole) | Exports | ||
|---|---|---|---|---|
| Quantity | Value | Quantity | Value | |
| tonnes | $(000) | tonnes | $(000) | |
| 1978 | 3,752 | 14,952 | 2,174 | 25,397 |
| 1979 | 4 575x | 22,357x | 2,133 | 26,937 |
| 1980 | 4 615x | 24,450x | 2,480 | 29,481 |
| 1981x | 4,553 | 24,814 | 2,276 | 35,692 |
| 1982 | 4,790 | 32,093 | 2,684 | 48,119 |
| 1983 | 5,003 | 43,776 | 2,737 | 53,548 |
Dredge Oysters (Tiostrea Lutaria)—The principal oyster beds around the coasts of New Zealand are those situated in Foveaux Strait, between the South Island and Stewart Island. A catch quota of 115 000 sacks (each containing 79 kilograms) has been imposed on these beds since 1975, but, from 1976 to 1979, the total catch was increased by 22 107 sacks, landed from the experimental fishing of one bed. During 1982, 113 700 sacks, valued at $8,410,000 were dredged from these beds, and Tasman Bay yielded a further 19 600 sacks (each containing 25 kilograms).
Dredge oyster catches during the latest 6 seasons for which figures are available are shown in the table below.
| Season | Foveaux Strait | Tasman Bay | Totalx | |||
|---|---|---|---|---|---|---|
| Sacks (79kg) | Value | Sacks (25kg) | Value | Tonnes | Value | |
| (000) | $(000) | (000) | $(000) | $(000) | ||
| 1978 | 124.5 | 4,080 | 1.6x | 68x | 9,875 | 4,148 |
| 1979x | 124.7 | 4,675 | 3.3x | 39x | 9,933 | 4,714 |
| 1980 | 114.2 | 5,505 | 7.8x | 94x | 9,216 | 5,599 |
| 1981 | 115.0 | 5,542x | 17.7x | 288x | 9,527 | 5,830 |
| 1982 | 113.7 | 6,560x | 19.6x | 372x | 9 472x | 6,932x |
| 1983 | 115.1 | 6,641 | 23.7 | 498 | 9,605 | 7,139 |
Paua—The New Zealand abalone, commercially exploited since the 1970s, is Haliotis iris, the black-foot abalone. It is harvested mainly from Bluff-Stewart Island, Marlborough Sounds and the Chatham Islands. The meat is bleached, processed, and canned for export (primarily to South-east Asia, where a steady market has been developed). About 10 percent of the catch is sold on the domestic market. Paua landed in 1982, totalled 849 358 kg. There is an export market for the shell being developed in Korea.
Scallops—From the initial development in the early 1960s, the scallop (Pecten novaezelandiae) fishery in Nelson and Marlborough reached peak landings of about 9900 tonnes in 1975. The fishery declined to a level which necessitated the closing of the season in 1981 and 1982. Total landings in New Zealand have been partly maintained by the development of fisheries in the Coromandel-Bay of Plenty area and on the east coast of Northland. A two-month season in 1983 in Nelson and Marlborough indicated a significant recovery of stocks.
Scallop landings during the last six seasons, for which figures are available, are shown below.
| Season | Northland | Coromandel | Nelson/Marlborough | Total | |
|---|---|---|---|---|---|
| Tonnes | Value | ||||
| * Closed season. | |||||
| (000)kg | (000)kg | (000)kg | $(000) | ||
| 1977–78 | 100 | 750 | 4,575 | 5,425 | – |
| 1978–79 | 129 | 1,213 | 1,338 | 2,680 | 1,072 |
| 1979–80 | 759 | 156 | 950 | 1,865 | – |
| 1980–81 | 1,040 | 238 | 377 | 1,655 | 1,043 |
| 1981–82 | 560 | 1,126 | * | 1,686 | 1,079 |
| 1982–83 | 790 | 1,041 | * | 1,831 | 1,483 |
FRESHWATER FISHERIES: Salmon Farming—Commercial farming of quinnat salmon (Oncorhynchus tshawytscha) is being undertaken in New Zealand with encouragement from the Government. Government policy emphasises the development of ocean ranching rather than pond rearing of salmon. The main areas for farming are on the east coast of the South Island, where natural stocks of salmon exist in the braided shingle rivers, such as the Waitaki.
Whitebait—This fishery is based on 5 Galaxias species. Whitebait fishing is carried out in the tidal reaches of many rivers, from August to November in the North Island and from September to November in the South Island. The most productive fishing grounds are near the mouths of the rivers of the West Coast of the South Island and in the lower reaches of the Waikato River. With improved transport from the more remote rivers, in which aircraft have played an important part, a substantial whitebait industry has been developed, particularly on the West Coast of the South Island. The large number of itinerant buyers makes it increasingly hard to collect catch data. Whitebait fishermen are not required to hold a fishing permit and therefore are not required to furnish fishing returns.
Acclimatised Species— Acclimatised species include quinnat or chinook salmon, brown trout (Salmo trutta), rainbow trout (Salmo gairdnerii). and perch. The local administration and management of these species is delegated to acclimatisation societies and to the Department of Internal Affairs for the Rotorua and Taupo fishing districts and for the Southern Lakes Acclimatisation District, where it acts as an acclimatisation society. The Ministry of Agriculture and Fisheries assists with management investigations, and provides technical advice based on research, to acclimatisation societies.
A fishing licence is required for the taking of acclimatised fish. The revenue from angling licences in the 1981–82 fishing season exceeded $1.5 million.
Indigenous Species—Eels (longfin, Anguilla dieffenbachii and shortfin, Anguilla australis) are the only indigenous species of which a significant commercial harvest is taken from New Zealand's freshwaters. Most eels are exported. In 1982 these totalled 873 tonnes valued at $2.34 million f.o.b. compared with 1123 tonnes valued at $2.59 million in 1981.
Research—The research programme concentrates on introduced fish but native species are also studied. Two species of Chinese carp—grass carp (Ctenopharyngoden idella) and silver carp (Hypothalmichthys molotrix)—are being evaluated as agents for weed and algal control in lakes and waterways. Studies on quinnat salmon are aimed at enhancing natural runs and evaluating the commercial potential of these salmon.
The effects of such river developments as hydro-electric and irrigation schemes on freshwater fisheries are also being studied. Manipulated-flow regimes and their effects are being investigated through projects undertaken in conjunction with the Ministry of Works and Development, and in experimental channels in the Waitaki River.
Native species under investigation include eels, which support considerable commercial fisheries.
Studies are also carried out on diseases offish, including parasites, and a diagnostic service is provided.
BIG GAME FISHING—Swordfish (striped and black marlin, and occasionally blue marlin and broad-bill), mako shark, and other big-game fish occur principally off the north-east coast of the North Island. They attract both New Zealand and visiting big-game fishermen. The principal centres for this sport are Whangaroa, Russell (Bay of Islands), Whitianga (Mercury Bay), Whakatane, and Tauranga, where specially designed and equipped launches may be hired. The season lasts from December to May, the best months usually being February and March.
The first economic Census of Fishing formed part of the series of integrated economic censuses of business activities in New Zealand being carried out by the Department of Statistics over a 5-year cycle. The census covered all operations carried out by establishments and ancillary units in the fishing industry during the year ended 31 March 1981 (those with different balance dates submitted data for the year ended within the period 1 April 1980 to 31 March 1981).
The Census of Fishing included joint fishing ventures and covered the activities of all firms whose predominant activity was the landing of wetfish, whether from the ocean, coastal waters, or inland waters. Fish farming (including oyster and mussel farming) and the gathering of molluscs and seaweed by hand were also within the scope of the census. The actual activities covered ranged from the purchase of materials and supplies, to the sale of the caught fish.
Establishment—A separate operating unit (for example, a fishing vessel or fleet of vessels) in New Zealand in one or predominantly one kind of economic activity from a single location (e.g. from a single port).
Ancillary Unit—An administrative or general servicing unit such as a head office, storage unit, laboratory, etc., the prime function of which is to provide services for other locations of the enterprise.
New Zealand-based Paid Employees, Working Proprietors, and Partners—The total number of people engaged, full-time and part-time, in the establishments and ancillary units at or on the nearest pay day to 28 February 1981. Foreign crews on joint venture fishing boats are excluded.
The following table shows census data at individual industry level.
| Industry | Establishments and Ancillary Units | Working Proprietors and Partners | Paid Employees | Total Expenditure | Net Profit | ||
|---|---|---|---|---|---|---|---|
| Number | Salaries | Number | Salaries | ||||
* Suppressed to avoid disclosure of confidential information. †Comprises 52 mussel farms and 1 salmon farm. | |||||||
| No. | $(000) | $(000) | $(000) | $(000) | |||
| Ocean and Coastal Fishing— | |||||||
| Bottom trawling, single | 211 | 205 | 906 | 443 | 8,261 | 65,644 | 1,989 |
| Bottom trawling, pair | 43 | 50 | 416 | 116 | 1,040 | 3,954 | 297 |
| Mid-water trawling, single | 13 | 6 | * | 136 | 4,551 | 16,920 | −6,594 |
| Dredging | 49 | 46 | 67 | 128 | 1,755 | 6,524 | 1,995 |
| Danish seining | 19 | 20 | * | 24 | 197 | 650 | 290 |
| Purse seining | 9 | 6 | * | 61 | 752 | 9,706 | 45 |
| Other mobile gear | 7 | 6 | * | 10 | 91 | 330 | −18 |
| Gill netting | 224 | 243 | 435 | 118 | 682 | 3,703 | 811 |
| Potting | 422 | 455 | 1,254 | 385 | 2,960 | 14,987 | 3,237 |
| Lining, snapper | 123 | 136 | 197 | 49 | 627 | 2,125 | 474 |
| Lining, other | 90 | 97 | 209 | 85 | 646 | 3,334 | 351 |
| Squid jigging | 13 | – | – | 32 | 940 | 20,550 | 801 |
| Hand gathering | 35 | 37 | 41 | 7 | 24 | 200 | 102 |
| Inland Water Fishing and Fish Farming— | |||||||
| Inland water fishing | 57 | 60 | 30 | 17 | 46 | 459 | 327 |
| Oyster farming | 34 | 42 | 79 | 47 | 488 | 1,944 | −205 |
| Other farming† | 53 | 68 | 35 | 48 | 307 | 1,808 | −478 |
| Total | 1 402 | 1 477 | 3,797 | 1 706 | 23,366 | 152,839 | 3,424 |
The following table shows aggregate census values in accounting terms.
| $(000) | ||
| Expenditure— | ||
| Fuel and power | 19,631 | |
| Employer contributions to pension and welfare schemes, superannuation, and accident compensation levies | 369 | |
| Salaries and wages- | ||
| Paid to foreign crews | 6,000 | |
| Other | 17,366 | |
| Depreciation | 8,736 | |
| Indirect taxes | 873 | |
| Insurance | 2,633 | |
| Interest, bad debts, donations, royalties, and patent fees | 5,123 | |
| Other costs, excluding salaries and drawings by working proprietors and partners, and expenses of a capital nature | 92,106 | |
| Total expenditure | 152,839 | |
| Stocks— | ||
| Closing stocks | 6,969 | |
| Less opening stocks | 1,752 | |
| 5,217 | ||
| Income— | ||
| Sales and transfers | 151,636 | |
| Subsidies | 89 | |
| Interest, etc. | 593 | |
| Other | 2,526 | |
| Total income | 154,842 | |
| Total income adjusted for change in stocks | 160,060 | |
| Net Profit— | ||
| Total income, adjusted for stocks | 160,060 | |
| Less total expenditure | 152,839 | |
| Less salaries of working proprietors or partners | 3,797 | |
| Net profit | 3,424 | |
The figures in the above table are taken from the annual accounts of the establishments and ancillary units covered by the census.
On the income side, transfer values have been substituted for sales values where landed catches have been transferred to a fish processing factory operated by the same fishing company.
On the expenditure side, the figures for salaries and wages exclude drawings by, or salaries paid to, working proprietors or partners, but these amounts have been deducted to arrive at the net profit figure.
Fuller definitions of some other terms used in this table are given below.
Sales and Transfers—The combined sales and transfers of processed and unprocessed fish, shellfish, Crustacea, etc.
Subsidies—Government cash grants and subsidies received, other than those of a capital or tax incentive nature. The same definition is used in the N.2. System of National Accounts (NZSNA).
Interest, etc.—Interest, dividends, royalties, patent fees, and insurance claims received.
Other—Income from other activities of the establishments, e.g. rents, sales of packaging materials, towing charges, etc.
Fuel and Power—Purchases of all kinds of fuels and oils and electricity charges.
Employer Contributions—Payments to superannuation, pension and welfare schemes, and accident compensation levies.
Salaries and Wages—Gross earnings during the accounting year of all paid employees in the establishments or ancillary units included in the census. Included are such items as overtime, sick pay, holiday pay, bonuses, payments under piece-rate schemes, all benefit allowances, severance pay, value of free supplies, and sales commission paid to own employees.
Depreciation—As charged in the books of account on fixed tangible assets owned by the establishments and ancillary units.
Indirect Taxes—Covers Fishing Industry Board levies, boat registration, licence fees, and rates. This is the same definition used in NZSNA.
Insurances—Business insurance premiums paid.
Interests, etc.—Interest, bad debts, donations, royalties, and patent fees paid.
Other Costs—All other purchases including any transfers-in and operating expenses, e.g. packaging materials, boat-hire, etc.
A final table shows census values in economic terms in accordance with the N.Z. System of National Accounts (NZSNA).
| $(000) | |||
| Of Which Joint Ventures Comprised | |||
| Operating Surplus— | |||
| Total income, adjusted for stocks | 160,060 | ||
| Less interest, etc., received | 593 | ||
| 159,467 | 82,212x | ||
| Total expenditure | 152,839 | ||
| Less joint venture charter fees (capitalised) | 13,115 | ||
| Less interest, etc., paid | 5,123 | ||
| 134,601 | 69,291 | ||
| Operating surplus | 24,866 | 12,921x | |
| Value Added— | |||
| Operating surplus | 24,866 | 12,921x | |
| Salaries and wages to foreign crews | 6,000 | 6,000 | |
| Salaries and wages—other | 17,366 | 1,937 | |
| Employer contributions | 369 | 23 | |
| Depreciation | 8,736 | 912 | |
| Indirect taxes | 873 | 96 | |
| 58,211 | 21,888x | ||
| Less subsidies received | 89 | – | |
| Value added | 58,122 | 21,888x | |
FURTHER INFORMATION—Further information on fishing and fisheries will be found in the following publications.
Report of the Ministry of Agriculture and Fisheries (Parl. paper C. 5).
Report of the New Zealand Fishing Industry Board (Parl. paper C. 6).
Report of the Rural Banking and Finance Corporation of New Zealand (Parl. paper B. 25).
Catch—Ministry of Agriculture and Fisheries (monthly).
New Zealand Journal of Marine and Freshwater Research—DSIR (quarterly).
New Zealand Census of Fishing 1980–81—Department of Statistics.
Table of Contents
The mineral industry in New Zealand began with the discoveries of gold in the 1850s and 1860s. Gold production reached a peak in 1873 when it earned 75 percent of all export earnings. Coal mining also began about 1850 and early this century the value of coal produced exceeded that of gold for the first time.
In 1982 coal, ironsand, limestone, clays and building aggregate, sand, and gravel were the main minerals mined. Total production of non-energy minerals in 1982 was $184.1 million. Total production for coal in the same year was $87 million. In 1982 private company expenditure on the prospecting for minerals was recorded at $8.6 million and Government expenditure on the Coal Resources Survey in the same year was $4 million.
New Zealand has substantial deposits of coal in both the North and South Islands. Since 1975, when the Government-funded Coal Resources Survey was begun, reserves of recoverable coal have increased by over 5 times. Reserves now total approximately 6400 million tonnes, of which South Island lignites comprise some 5519 million tonnes.
Expansion in the coal mining industry within the next 10 years will meet increased demands for coal for electricity generation and steel production. A 1000 MW power station is being commissioned at Huntly and it is expected that up to 1.7 million tonnes of coal per year will be required at this station by 1993. Another 500 MW coal-fired power station (North Island Thermal No. 1) is expected to be installed in the Maramarua Coalfield and commissioned in the late 1990s and an oil-fired thermal station (Marsden B) is to be converted to coal with an expected consumption of 300 000 tonnes per year from 1995.
Work is continuing on the expansion of the steel industry, which is planned to increase annual demand for sub-bituminous coal from 150 000 tonnes per year in 1982 to 450 000 tonnes per year in 1985, and 920 000 tonnes per year in 1990.
Coal from the Buller coalfield is exported to Japan and Korea. Export tonnages range between 250 000 tonnes and 300 000 tonnes per year. The recession in the international market has slowed plans to increase exports. However, 500 000 tonnes per year is still an immediate objective.
The following table shows the production of minerals and metals from mines and quarries. The values are assessed at pit mouth and refer to December years.
| Mineral | 1981 | 1982 | ||
|---|---|---|---|---|
| Quantity | Value | Quantity | Value | |
* Tonnes unless otherwise stated. †An additional total of approximately 2.95 kg of gold/silver bullion was produced in 1981. | ||||
| Fuels | tonnes* | $ | tonnes * | $ |
| State coal | 1,345,729 | 40,321,948 | 1,411,934 | 54,719,071 |
| Private coal | 851,165 | 25,503,375 | 832,450 | 32,257,438 |
| Metals | ||||
| Gold (kg) | 188.8† | 3,000,910 | 241.8 | 3,799,477 |
| Silver (kg) | † | – | 1.9 | – |
| Iron ore | 197 | 9,783 | 166 | 3,990 |
| Ironsand (exported) | 2,816,738 | 32,427,495 | 2,386,318 | 36,820,887 |
| Ironsand (sold locally) | 209,183 | 2,223,615 | 234,807 | 2,484,258 |
| Ironsand (stockpiled) | 227,035 | 2,613,724 | 380,407 | 5,869,680 |
| Tungsten Ore (scheelite) | 19.6 | 105,350 | 14.4 | 198,136 |
| Non-metals | ||||
| Basalt for industry | – | – | 180 | 7,832 |
| Bentonite | 1,885 | 45,919 | 6,220 | 64,626 |
| Clay for bricks, tiles | 132,226 | 2,774,694 | 129,924 | 1,304,905 |
| Clay for pottery, etc. | 49,307 | 1,771,714 | 23,957 | 3,652,357 |
| Dimension stone | 30,791 | 756,881 | 22,493 | 824,926 |
| Dolomite for agriculture | 17,224 | 534,805 | 10,338 | 368,967 |
| Dolomite for industry | 7,888 | 249,024 | 4,562 | 151,779 |
| Greenstone | 5.9 | 36,110 | 8.1 | 16,200 |
| Limestone for agriculture | 1,829,381 | 12,011,586 | 1,591,945 | 11,121,731 |
| Limestone for roads | 311,579 | 1,289,722 | 375,482 | 1,835,048 |
| Limestone for industry | 178,111 | 2,075,990 | 184,421 | 2,390,595 |
| Lime and marl for cement | 1,457,644 | 4,647,477 | 1,482,793 | 4,492,314 |
| Magnesite | 308 | 21,489 | – | – |
| Perlite | 999 | 4,615 | 2,163 | 12,545 |
| Pumice | 33,834 | 170,233 | 50,183 | 355,492 |
| Rock for reclamation | 2,890,699 | 4,581,812 | 2,324,825 | 7,674,657 |
| Salt | 55,500 | 7,500,000 | 70,000 | 9,800,000 |
| Sand, rock for building | 4,084,238 | 22,337,666 | 4,169,302 | 25,131,973 |
| Sand, rock for roads and ballast | 13,548,000 | 51,383,291 | 14,153,591 | 62,520,186 |
| Sand for industry | 363,446 | 1,385,549 | 245,349 | 1,417,750 |
| Serpentine | 65,714 | 893,558 | 45,644 | 687,877 |
| Silica sand | 129,146 | 987,442 | 160,009 | 1,127,219 |
| Sulphur | 90 | 3,700 | 156 | 10,140 |
LEGISLATION—Legislative control of mineral production is contained in the Mining Act 1971, the Coal Mines Act 1979, the Iron and Steel Act 1959, the Quarries and Tunnels Act 1982, the Atomic Energy Act 1945, and the Continental Shelf Act 1964. The administrative agency is the Mines Division of the Ministry of Energy.
COAL—Coal occurrences in New Zealand are widespread. The major areas of coal formation have been divided into 7 coal regions (Northland, Waikato, Taranaki, Nelson-Westland, Canterbury, Otago and Southland). The important coal producing regions are Waikato, Westland, and Southland.
Coal mined in New Zealand ranges from high-heat value bituminous coal to low-heat value lignite. The majority of coal is won for heat-raising purposes and is consumed within New Zealand. Some coal in Westland has coking properties. Between 250 000 and 300 000 tonnes of this coal are exported to Japan each year for steel-making.
The more important producing coalfields with the class of coal found in each are:
Bituminous coal—Greymouth, Buller. Garvey Creek.
Sub-bituminous—Maramarua, Huntly, Rotowaro, Ohai.
Lignite—Eastern Southland.
Other coalfields which will become major producers are Waikare, (sub-bituminous), Mokau (sub-bituminous) and potentially, Central Otago coalfields (lignite) and Kaitangata coalfield (lignite).
For location of coalfields, refer to the maps on pages 488 and 490.
New Zealand coals are young by world standards (15–75 million years) and the geological conditions that allowed coal formation continue to the present day (e.g., peats in the Waikato). Coals of this age are not common and are only found in countries such as Japan and New Zealand which have an active geological environment.
The young age of New Zealand's coking grade coals has given rise to some valuable properties which, together with low to exceptionally low ash contents, makes them attractive to world markets. The active geological history during the time of coal formation and since has resulted in difficult mining conditions.
The table on page 489 sets out the reserves of recoverable coal in New Zealand as assessed in 1982. The table indicates that New Zealand reserves consist mainly of lignite (86 percent). Sub-bituminous reserves are 11 percent and bituminous reserves less than 3 percent. This is in contrast to current production, which is lignite 10 percent, sub-bituminous 70 percent and bituminous 20 percent.
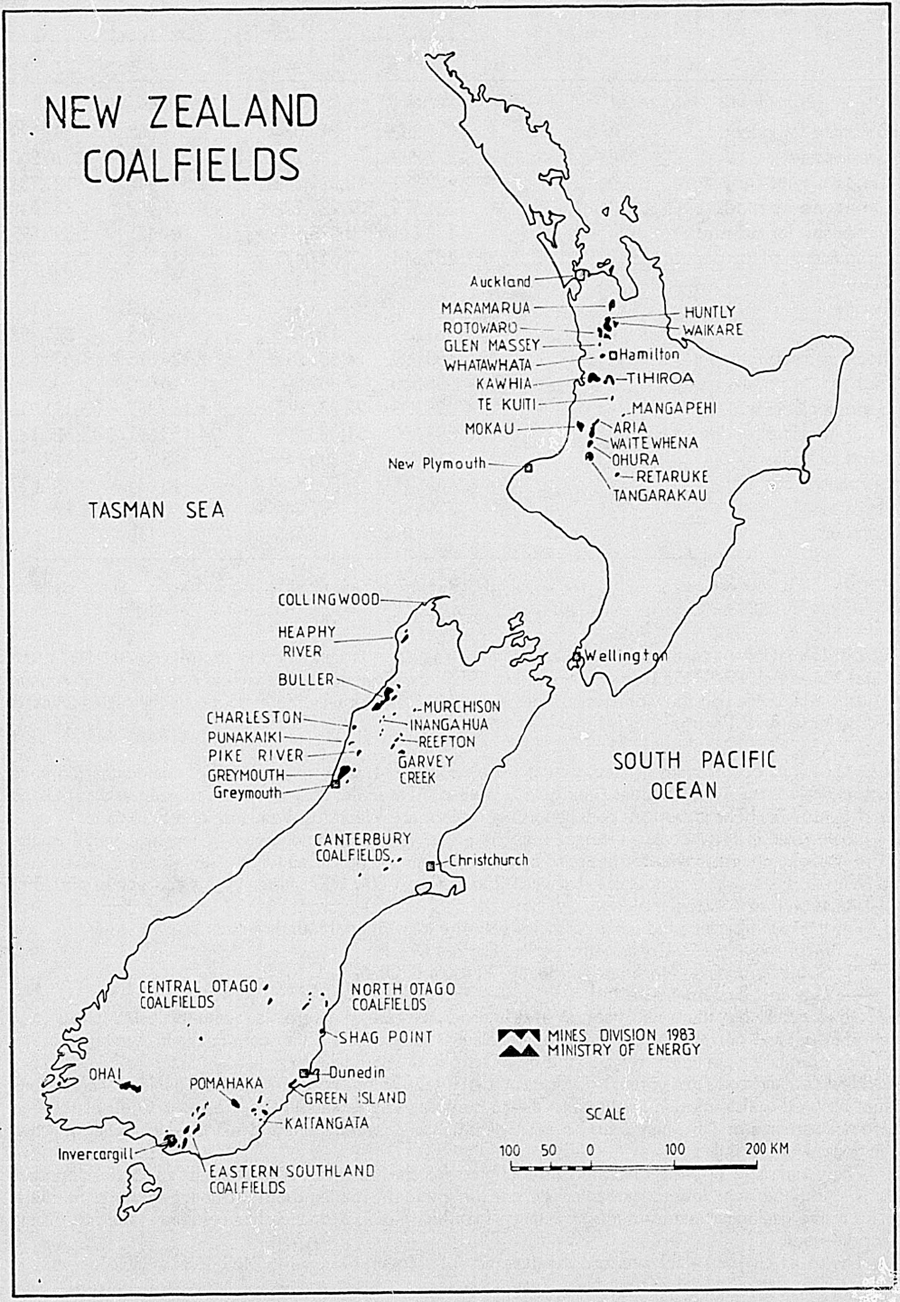
| Locality | Recoverable Coal Reserves | |||
|---|---|---|---|---|
| Measured | Indicated | Inferred | Total | |
* Assumed 50 percent extraction and 400 metres maximum mining depth for underground coal. †Technically recoverable lignite as identified in preliminary mining feasibility assessment. Indicated reserves contain some lignite that could be classified as measured. | ||||
| Bituminous | tonnes (million) | |||
| Buller Coalfield | 30.0 | 9.4 | 12.1 | 51.5 |
| Murchison Coalfield | – | 0.3 | 1.4 | 1.7 |
| Garvey Creek Coalfield | 4.0 | 0.4 | 1.7 | 6.1 |
| Reefton Coalfield | 0.6 | 0.3 | 5.4 | 6.3 |
| Greymouth Coalfield | 1.1 | 20.2 | 56.0 | 77.3 |
| Pike River Coalfield | – | – | 15.0 | 15.0 |
| Collingwood Coalfield | 0.1 | 0.1 | 0.1 | 0.3 |
| Total | 35.8 | 30.7 | 91.7 | 158.2 |
| Sub-bituminous | ||||
| Kiripaka Coalfield | – | 0 | 1.9 | 1.9 |
| Maramarua Coalfield | 22.0 | 64.9 | – | 86.9 |
| Huntly Coalfield | 116.3 | 120.4 | 5.3 | 242.0 |
| Waikare Coalfield* | 52.0 | 18.6 | 8.0 | 78.6 |
| Rotowaro Coalfield | 11.4 | 3.3 | 0.1 | 14.8 |
| Glen Massey Coalfield* | 0 | 0.1 | 2.5 | 2.6 |
| Whatawhata Coalfield | 0.1 | – | 1.5 | 1.6 |
| Mangapehi Coalfield* | 1.2 | – | – | 1.2 |
| Kawhia Coalfield* | 0.8 | 4.6 | 68.3 | 73.7 |
| Te Kuiti Coalfield* | – | – | 6.0 | 6.0 |
| Mokau Coalfield | 0.2 | 73.6 | – | 73.8 |
| Waitewhena Coalfield* | 0.7 | 27.5 | – | 28.2 |
| Ohura, Tangarakau, Retaruke, Aria | – | 0.6 | 8.6 | 9.2 |
| Heaphy River Coalfield | – | – | 1.0 | 1.0 |
| Charleston Coalfield | 0 | – | 11.7 | 11.7 |
| Punakaiki Coalfield | 0.1 | 0.1 | 2.0 | 2.2 |
| Inangahua Coalfield | 0.1 | 1.0 | 5.6 | 6.7 |
| Canterbury Coalfields | 0 | 0 | 22.4 | 22.4 |
| Shag Point Coalfield | 0 | – | 0.8 | 0.8 |
| Kaitangata Coalfield | 0.9 | 0.8 | 3.3 | 5.0 |
| Ohai Coalfield | 1.9 | 3.5 | 45.7 | 51.1 |
| Total | 207.7 | 319.0 | 194.7 | 721.4 |
| Lignite | ||||
| Green Island Coalfield | 0.5 | 3.8 | 2.3 | 6.6 |
| Kaitangata Coalfield | 23.9 | 67.0 | 32.0 | 122.9 |
| Pomahaka Coalfield | – | 8.8 | 16.2 | 25.0 |
| North Otago Coalfields | 19.3 | – | – | 19.3 |
| Central Otago Coalfields† | – | 853.0 | 4.3 | 857.3 |
| Eastern Southland Coalfields† | 8.9 | 4 479.2 | – | 4 488.0 |
| Total | 52.6 | 5 411.7 | 54.8 | 5 519.1 |
| Grand Total | 296.1 | 5 761.4 | 341.2 | 6 398.7 |
| NOTE: This table incorporates State Coal Mines estimates as at 30 September 1982 and reserves of private coal mines as at 30 December 1982. | ||||
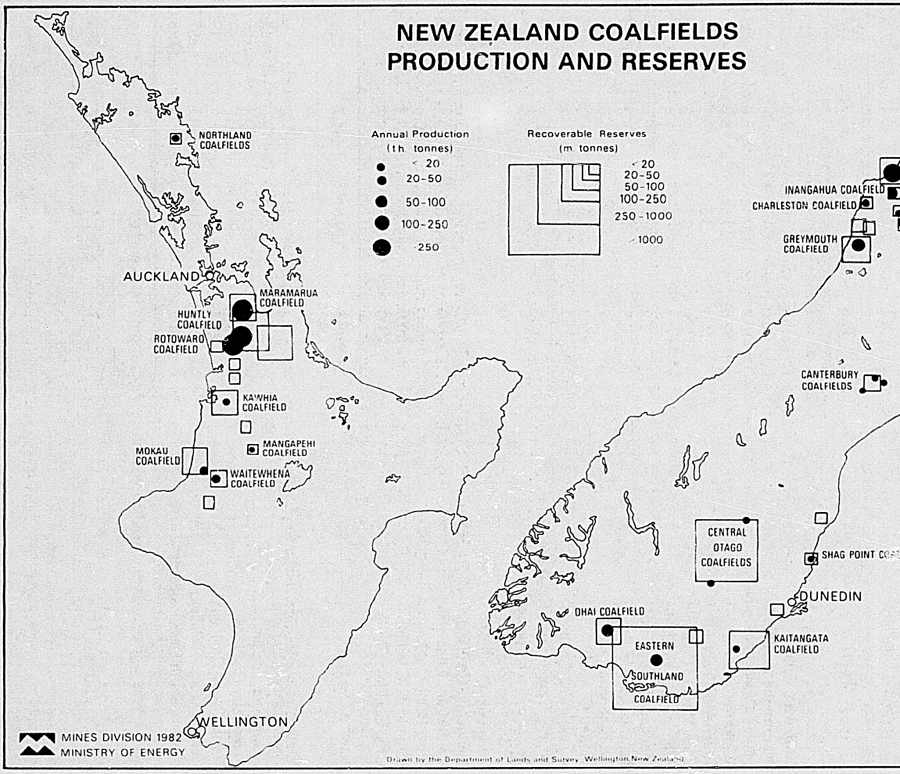
RECOVERABLE COAL—Recoverable coal is the quantity of coal estimated to be able to be actually mined and delivered to the mine head. The figures are based on existing mining technology which may or may not be currently practised in a given mine in New Zealand. Estimation of recoverable coal requires consideration of such factors as: geology (e.g., faulting, fracturing, seam thickness), geotechnology (e.g., coal seam roof and floor conditions, groundwater conditions, slope stability), mining feasibility (e.g., mining methods, development costs, mining productivity, mine boundaries, economics) plus safety considerations and environmental constraints. The extent to which these have been evaluated in calculating recoverable coal quantities varies considerably.
As well as a varying knowledge of mining considerations there is also varying geological understanding of coal reserves. This is expressed as “measured”, “indicated” and “inferred” according to the following definitions:
Measured Coal—This is coal for which the tonnage is computed from dimensions revealed in outcrops, trenches, workings, and drillholes, and for which the ash content is computed from the results of detailed sampling. The sites for inspection, sampling, and measurement are so closely spaced and their geological character is so well defined that the size and shape of the coalfield are well established.
Indicated Coal—This is coal for which the tonnage and ash content are computed partly from specific measurements, samples or production data, and partly from projection for a reasonable distance on geological evidence. The sites available for inspection, measurement and sampling are too widely spaced or otherwise inappropriately spaced to determine the geology or ash content well enough to classify it as “measured”.
Inferred Coal—This is coal for which the tonnage estimates are based largely on a broad knowledge of the geological character of the deposit and for which there are fewer samples or measurements than required to place the deposit in a higher category. The estimates are based on an assumed continuity or repetition for which there is geological evidence. This evidence may include comparison with other deposits in similar type.
Two useful references for information on New Zealand coalfields and reserves are Introduction to the Geology of the Coalfields of New Zealand, available from the New Zealand Geological Survey (Report M95) and New Zealand Coal Reserves 1983, available from Mines Division, Ministry of Energy (Report CG83002).
NEW ZEALAND COAL RESOURCES SURVEY—This Government exploration programme, managed by the Mines Division of the Ministry of Energy, is exploring all New Zealand's major coalfields to provide information on the geology, reserves, possible mining methods and costs, coal properties and uses, as well as environmental considerations. The information is freely available and is used by the coal industry and energy planners. The survey began in 1975 and will continue for some years.
During 1983 exploration took place in the following coalfields: Northland, Maramarua, Waikare, Kawhia, Te Kuiti, Mokau, Buller, Greymouth and Kaitangata.
Some of the more notable successes of the programme are:
Waikato Coal Region Steaming Coal—Extensive reserves of opencastable and underground recoverable coal have been located. This has allowed the construction of a 1000 MW thermal power station in Huntly that will eventually require 1.9 million tonnes of coal per annum. Coal is also to be supplied to NZ Steel for steel manufacture at a rate of 920 000 tonnes per annum. Planning is also well advanced for a second major thermal power station.
Taranaki Coal Region—The Mokau Coalfield has been explored in detail and found to be an attractive mining prospect for both opencastable and underground coal mining. Coal from this region has also been considered as a supply source for a future major thermal power station.
Westland Coal Region—In the Greymouth Coalfield an extensive reserve of good quality steaming coal has been discovered. This is now the subject of a Government-private sector joint venture to study the feasibility of mining for export of up to 2 million tonnes per annum.
Southland and Central Otago Coal Regions—Extensive exploration has discovered 9 major opencastable lignite deposits which compare well with many overseas deposits and mining operations. The use of large-scale mining techniques will be necessary to mine these deposits. Potential uses are for power generation and conversion to liquid fuels.
The Liquid Fuels Trust Board will commence its second stage evaluation of the lignite resources during 1984. In order to evaluate the financial viability of converting the lignite to liquid fuels, geological, mining, and lignite properties, environmental and social implications, and process technologies must be investigated in more detail.
COAL CONSUMPTION—Coal has always been important to New Zealand's mineral industry. It had a higher production value than any other mineral between the First and Second World Wars. Usage slumped in the late 1960s but with the increased price of oil, and prospects of oil shortages, coal consumption prospects have risen, especially as industries have in some cases reconverted their heating and steam plants for coal firing.
The distribution of State Coal sales during recent years is shown in the following table:
| Use | Year Ended September | ||||
|---|---|---|---|---|---|
| 1979 | 1980 | 1981 | 1982 | 1983 | |
| tonnes (000) | |||||
| Gasworks | 58 | 61 | 45 | 11 | 8 |
| Electric power | 159 | 127 | 167 | 210 | 397 |
| Dairy factories | 86 | 101 | 95 | 97 | 93 |
| Freezing works | 75 | 71 | 69 | 74 | 82 |
| Cement and lime works | 188 | 179 | 225 | 238 | 197 |
| Brick, tiles and pottery | 6 | 6 | 5 | 4 | 2 |
| Paper mills | 51 | 47 | 46 | 57 | 68 |
| Steel production | 151 | 132 | 121 | 130 | 123 |
| Hospitals | 126 | 112 | 110 | 111 | 120 |
| Carbonising | 17 | 23 | 18 | 18 | 16 |
| Central heating | 56 | 56 | 52 | 62 | 58 |
| Domestic | 166 | 161 | 150 | 136 | 138 |
| Export | 11 | 35 | 162 | 272 | 226 |
| Other | 67 | 63 | 68 | 65 | 59 |
| Total | 1 217 | 1 174 | 1 333 | 1 485 | 1 587 |
| NOTE: This table omits figures for the distribution of privately-mined coal. | |||||
The total production of private coal mines during recent calendar years was as follows:
| 1979 | 840 000 tonnes |
| 1980 | 856 000 tonnes |
| 1981 | 851 000 tonnes |
| 1982 | 853 000 tonnes |
| 1983 | 866 000 tonnes |
Summary of Operations—The following table summarises private and State coal mining operations during recent years.
| Year | Annual Outputs | Persons Ordinarily Employed | |||||
|---|---|---|---|---|---|---|---|
| Underground | Opencast | Total | Surface | Underground | Opencast | Total | |
| tonnes (000) | Number | ||||||
| 1979 | 601 | 1,347 | 1,948 | 585 | 567 | 499 | 1,651 |
| 1980 | 675 | 1,488 | 2,163 | 496 | 659 | 498 | 1,653 |
| 1981 | 720 | 1,476 | 2,197 | 456 | 659 | 465 | 1,580 |
| 1982 | 802 | 1,442 | 2,244 | 454 | 707 | 498 | 1,659 |
| 1983 | 857 | 1,616 | 2,473 | 504 | 785 | 505 | 1,794 |
In 1983, the State operated 10 of the 32 underground mines. These produced 330 000 tonnes of coal. Seven of the 45 opencast mines were operated by the State and they produced 788 000 tonnes of coal.
Coal By-products—Low temperature carbonisation works at Rotowaro (100 km south of Auckland) use the Lurgi process to include a range of products derived from coal taken from local State coal mines. During the year ended 31 March 1983, the works produced 6829 tonnes of carbonettes, 335 473 litres of tar and oil, 2227 tonnes of char, 213 tonnes of pitch and 417 549 litres of creosote.
Meremere Power Station—The refurbishing of Meremere power station is underway. This entails closing down each of the units in turn and means that the station will have a lower generating capacity until 1986. This is a low-cost addition to capacity of 970 Gwh per annum (170 MW) until 1994 for a capital cost of only $31 million, despite the age of the station.
Huntly Power Station—This station (1000 MW capacity) is now being commissioned and coal will be increasingly used there, with the allocation of natural gas coming on stream later this decade. It is expected that up to 1.7 million tonnes of coal per annum will be required at this station by 1993.
Iron—New Zealand's largest resource of potential iron ore is contained in the black sands of the western beaches, from Westport southwards in the South Island and from Wanganui to Muriwai in the North Island. Titanomagnetite sands make up most of the black sands in the North Island, but from Waikato Heads northwards the beach deposits also contain ilmenite in varying proportions. In the South Island beach sands ilmenite is the chief iron-bearing material. These beach sands have been estimated to contain some 800 million tonnes of titanomagnetite, with a further 8.6 million tonnes of ilmenite in the North Island, and 43 million tonnes in the South Island.
A process has been developed whereby the titanomagnetite sands can be economically smelted on a large scale to produce a good grade of steel. A steelworks has been constructed at Glenbrook, 58 km south of Auckland, by New Zealand Steel Limited and the plant began production late in 1969 using ironsand deposits from the north head of the Waikato River 19 km away. Production of steel billets from ironsand commenced in November 1969.
New Zealand Steel Limited is expanding its Glenbrook plant to increase its output of steel from the present 120 000 tonnes to 750 000 tonnes by 1988–89. Coal consumption will increase from the present 250 000 tonnes per year to 1.5 million tonnes per year with the expansion. Slag from the steel contains vanadium and titanium. The vanadium will be extracted when the expansion is completed.
Near Waverley, 32 km north of Wanganui, an ironsands mining unit produces titanomagnetite concentrates for direct export to Japan through offshore bulk loading facilities. In 1982 some 914 903 tonnes were exported.
New Zealand Steel Limited has developed a similar undertaking at Taharoa near Kawhia and 1 471 475 tonnes were exported in 1982.
These 2 operations exported ore to the value of $36.8 million in 1982. The recent economic climate in Japan has led to some reductions in these levels.
Gold—The gold mining industry in its early stages contributed greatly to the progress and settlement of New Zealand. Gold has been mined in the past from the Hauraki, West Coast, Marlborough and Otago goldfields.
Gold occurs in three different ways:
Alluvial gold is gold that has been eroded from its original source and carried away by a river. It is found on beaches, in streams, rivers and gravels, mostly in the South Island. Alluvial gold is mined by panning, sluicing, washing through screens or by dredging.
Lode gold occurs in quartz veins. The Hauraki goldfield produced over 44 million ounces of gold/silver bullion from quartz veins over the period from 1861–1933.
Disseminated gold is finely dispersed in some volcanic rocks.
Both of the latter hard rock forms of gold can be mined by underground as well as opencast methods. Most present day New Zealand goldmining is of alluvial gold.
High international gold prices make re-examination of bypassed areas and the tailings of former workings attractive. Past gold producing areas of New Zealand are currently being reassessed using modern prospecting techniques and refined geological concepts.
The main areas of interest for gold in the North Island are Northland, the Coromandel Peninsula and the central volcanic zone. Companies are looking for lode and disseminated gold mineralisation associated with fossil geothermal systems. The Coromandel Peninsula has always been a gold mining area and currently the Martha Mine at Waihi is being evaluated as are several other smaller mining proposals. Should the Martha Mine proposal proceed, an $80 million investment is envisaged. Currently there is only a very small gold recovery from the North Island (2.4 kg in 1982).
In the South Island, the main areas of interest for alluvial gold are Marlborough, northwest Nelson, West Coast, Westland, Central Otago, and West Southland. Almost all of the gold recovered from the South Island in 1982 (239.41 kg) was from small alluvial operations. The Reefton Goldfield and several other areas are being investigated for hard rock gold.
Wide ranging mineral exploration programmes (primarily for gold) are currently being undertaken in these regions and a high level of activity is likely to be maintained over the next few years.
The Kanieri gold dredge on the Taramakau River on the West Coast produced 145 kg of gold valued at $3.6 million in 1980. This fell to 105.2 kg in 1981 and 26.94 in 1982 when the dredge ceased operation in March of that year.
The Kanieri Gold Dredging Company has been granted a mining licence for further dredging operations in the bed of the Grey River, also on the West Coast. Construction work on the dredge, estimated to cost $18–20 million, has been suspended.
A joint venture has commissioned the design of a bucket ladder dredge for the Mikonui River Valley, south of Hokitika, and has undertaken preliminary environmental studies. This new dredge will be of a similar scale of operation to the Kanieri dredge and will involve an estimated investment of $30 million.
Small mining operations are rapidly surpassing the gold production levels of the Kanieri Gold Dredging Company. There are at least 40 small land-based or pontoon-mounted washing plants fed by hydraulic diggers working on the West Coast and more in Otago. This number is increasing as more mining licences are granted. There are also a number of smaller screen and riffle box operations in both areas, fed by front-end loaders. In addition, the black sand mining operations on the West Coast beaches are of considerable interest to small-scale miners.
Tungsten—The principal ore of tungsten in New Zealand is scheelite. Some wolfram is found in Otago and Stewart Island but not in economic quantities.
The scheelite-bearing quartz veins are generally small and broken, and the scheelite is erratically distributed in the veins. Access and transport present difficulties and production costs are relatively high.
Scheelite is mined on a small scale at Glenorchy and Macraes Flat in Otago and at Top Valley in Marlborough. In 1982, 14.379 kg were mined at a value of $198,136. These areas and also the West Coast and Southern Alps are currently being evaluated by large companies for large scale mining potential.
Ilmenite Sands—Beaches on the West Coast of the South Island, south of Greymouth, contain reserves of ilmenite containing 45 percent titanium dioxide and often economic grades of gold.
The major use of ilmenite is as titanium dioxide as a pigment in paint, paper, plastics, and rubber. A secondary use is as titanium, a strategic metal widely used in the aerospace industry.
In its crudest form as titanium sponge this valuable mineral can fetch $20 per kg, and in a milled form can fetch up to $42 per kg.
Areas of the West Coast are currently subject to prospecting and development proposals. The ilmenite is of marginally low grade and any major development of these resources can be expected to be a minimum of 5–10 years away. Earlier work undertaken by the Department of Scientific and Industrial Research (DSIR) has provided the basis for further company evaluation. The ilmenite has some unusual properties however, and the production of titanium pigment or titanium sponge would probably involve specially developed processes which have yet to be tested commercially. Total resources as assessed in 1976 at Barrytown are 12.77 million tonnes.
The world market is currently being flooded with titanium from rutile deposits. In the New Zealand context, assessment of its association with other minerals is needed. The problems in developing this project further are those of metallurgical rather than mining technology.
Copper, Lead, Zinc—Some areas of Northland, Coromandel, Nelson and Westland have potential for base metals and are currently being prospected. At Te Aroha, the Tui Mine closed in 1973 but is still held under a mining licence. Copper has also been mined at Parakao and Pupuke in Northland.
Silver—In the North Island, silver almost always occurs with gold in various proportions. The Hauraki goldfield has produced most of the silver mined in New Zealand but no major mining is being carried out at present. Silver has been found at Puhipuhi in Northland, northwest Nelson, South Westland, and Central Otago and most of these areas are being prospected at present.
Uranium—Uranium is known to occur in 2 parts of the Buller Gorge, but the reserves have never been fully assessed.
Manganese—Manganese ores are found in many localities, chiefly in the older sedimentary rocks. Prior to 1960 there was some production from deposits at Bombay, Moumoukai and Otau, all in the Auckland district. Deposits are, however, generally small and shallow, and capable of producing only limited tonnages of ore.
Mercury—Cinnabar, the principal ore of mercury, is widely distributed in New Zealand. No mining is at present being carried out. Past production has been limited, the main bulk came from the sinter deposits in Northland, at Puhipuhi and Ngawau Springs.
Molybdenite—Molybdenite occurrences in northwest Nelson have attracted several mineral exploration companies. However, due to the decline in the price of molybdenum, drilling in these areas has been discontinued. The molybdenum areas are virtually unexplored and further detailed drilling will have to be carried out before their full potential can be assessed.
Other Metallic Minerals—Iron ore, antimony, arsenic, chromium, monazite, nickel and rutile have been mined in the past and some are presently being investigated. Platinum is found in New Zealand and is a minor byproduct of gold mining in Southland. Tin is known on Stewart Island, where less than 1 tonne has been mined. The aluminium ore, bauxite, is found in Northland where 20 million tonnes have been indicated by the DSIR.
Aggregates—The term 'aggregates' is used to describe a variety of rocks, gravels, and sands. They are found throughout New Zealand and are usually mined by small operators to supply local needs. Hundreds of firms from Kaitaia to Invercargill extract more than 20 million tonnes of aggregates, worth more than $80 million annually. Major uses are for roading, reclamation and construction.
Clays—Clays are found throughout New Zealand and include bentonite, halloysite, and kaolin. They are used in the manufacture of bricks, tiles, pipes, and pottery, and as fillers in the manufacture of paper, paint, pharmaceutical, and animal health products. Nearly 200 000 tonnes of clays, worth about $5 million, are extracted every year in New Zealand, some for export.
Bentonite—Bentonite is used as a bonding agent and for 'drilling mud'. It is found in Hawke's Bay and in substantial quantities in Canterbury. The latter is finely ground and processed into pellet form for bulk export and milled for local and overseas markets. Although bentonite is still being imported for drilling operations because long established and reliable overseas sources are often preferred, New Zealand bentonite is now being used as well.
Halloysite—Halloysite has been mined in Northland for more than 30 years. It is used in New Zealand and exported for use as industrial fillers and in the ceramic industry.
Dolomite—Dolomite rock is found near Collingwood. It is used in agriculture and home gardening and shipped to Whangarei for use in glassmaking. About 25 000 tonnes are extracted each year and are worth around $0.8 million.
Greenstone—The mineral nephrite, more popularly known as one of the varieties of “greenstone”, occurs as rounded aggregations in the talc or talc-serpentine rocks of the Griffin Range of north Westland. The principal supply was previously obtained from the gravels of the Arahura and Taramakau Rivers near Hokitika, and from gold sluicing claims of the Kumara and Marsden districts. At the present time, the main source is a deposit of greenstone boulders in Olderog Creek, a tributary of the Arahura River. The boulders are reduced in size by a portable diamond trepan saw and airlifted by helicopter. Some of the greenstone recovered in this way has been cut and polished in New Zealand for jewellery and small ornaments for the tourist trade. With the decline in sluicing operations this material has been in short supply.
The best known occurrences of bowenite, the serpentine variety of greenstone, are in Fiordland, but these are not systematically or commercially exploited.
Limestone—Limestone is found throughout New Zealand. More than 50 firms mine about 4 million tonnes, worth about $20 million each year. Limestone is used in cement manufacture, roading, pottery, and agriculture. High-quality limestone from Te Kuiti and Nelson is processed for export. It is also used in New Zealand as a filler in paint, glass, rubber, plastic, and paper industries. Marble, a pure form of limestone, is mined in Nelson. It is used as a filler and in building construction.
Perlite—Perlite is a volcanic glass which expands when heated. About 1000 tonnes of perlite are recovered each year from Atiamuri, north of Taupo. The perlite is used in Auckland to manufacture insulating boards, potting mix, and lightweight concrete.
Pumice—Most New Zealand pumice was formed during volcanic eruptions in the Rotorua-Taupo area during the last 10 000 years. More than 30 000 tonnes of pumice, worth around $180,000, are dredged and separated from the river sands at Mercer and Hamilton each year. Pumice is used in Auckland and the Waikato areas to manufacture wallboard, plaster, and concrete.
Salt—At Lake Grassmere in Marlborough, salt is produced by the solar evaporation of sea water. Low rainfall, long hours of sunlight, and the right wind conditions make this locality the most suitable one in New Zealand for salt production.
Salt was first harvested in 1952. About 70 000 tonnes are produced annually. It is harvested once a year, and used in New Zealand.
Serpentine—Serpentine is a magnesium-rich rock used as a fertiliser additive. Deposits are mined at Piopio near Te Kuiti, North Cape in the North Island and Collins Valley, and Mossburn in the South Island. About 65 000 tonnes, worth almost $0.7 million, are mined each year.
Silica Sand—Northland, North Auckland, Nelson, and Canterbury have deposits of silica sand. About 160 000 tonnes, worth over $1 million, are mined each year. Approximately 60 000 tonnes are dredged off the spit at Parengarenga Harbour, Northland each year. The sand is barged to Auckland for use in container glass manufacture, and to Whangarei for use in window glass manufacture.
At Glorit and Kaukapakapa in North Auckland about 50 000 tonnes of sand are extracted each year for use as foundry sand and as filler in the building industry. There is also a silica sand deposit northwest of Glorit at Tapora. This deposit could be processed to yield a very high quality sand. In the South Island high quality silica sand found in Canterbury and Otago is used in the manufacture of table glassware.
Considerable amounts of lump silica are found near Ida Valley and Kaitangata in Otago and near Pebbly Hills in Southland. These deposits are suitable for use in the ferrosilicon industry. They are not mined at present but are under investigation.
Asbestos—Asbestos was mined at Takaka, Nelson, about 20 years ago, and substantial reserves of high quality (chrysotile) asbestos are known to be in the Pyke River area of Otago. However further prospecting is required before mining can be considered. Asbestos is used in the building industry.
Diatomite—Diatomite occurs in the Kaimai, Oamaru, Rotorua, Taieri. and Whangarei regions, but is not being mined at present. It is used in nearly all industrial filtration.
Phosphate—The only deposit of phosphate ever to have been worked in New Zealand is that in Claredon, Otago. Mining ceased in this area in 1944. Phosphate is known to occur offshore on the Chatham Rise as nodules on the sea floor. This deposit is currently being investigated.
Sulphur—A small amount of low-grade sulphur is currently extracted from Rotokawa, near Taupo, and used as a fertiliser additive. Investigation into the extraction of high-grade sulphur from the same deposit for use in the chemical industry is continuing.
Other Non-Metallic Minerals—The following non-metallic minerals, some of which have been mined in the past, are also found in New Zealand. They are barite (industrial uses include glassmaking and fillers), feldspar (glassmaking, ceramics, enamels), magnesite (used in agriculture), mica (used in electronics), and wollastonite (insecticide, paper and plastics production).
The fourth 5-yearly Census of Mining and Quarrying was taken for the year 1978–79, and was the first fully integrated economic census covering the activities of establishments and ancillary units predominantly engaged in that activity.
All activities from exploration or production to the point at which the goods are sold are within the scope of the census, which was for the year ended 31 March 1979 or the last accounting year prior to 31 March.
The census formed part of the Department of Statistics' 5-yearly series of integrated economic censuses and for this reason any comparisons with the Censuses of Mining, Quarrying, and Prospecting prior to 1978–79 should be treated with caution.
In 1978–79 the mining and quarrying industries were reclassified under the New Zealand Standard Industrial Classification covering:
Coal mining.
Crude petroleum and natural gas production, etc.
Ferrous and non-ferrous ore, etc., mining.
Other mining and quarrying.
The statistical tables which follow give summaries of these 4 divisions. The definitions used in these tables are the same as listed for the Census of Manufacturing statistics (see section 19, Manufacturing), with the following exceptions.
Establishments—Productive units, engaged predominantly in mining and quarrying operations.
Ancillary units—Servicing units, usually head offices, laboratories, workshops, etc., engaged in predominantly servicing these establishments.
The following table gives a general summary of the results of the 1978–79 Census of Mining and Quarrying.
| Item | 1979–80 |
|---|---|
| Number | |
| Establishments | 463 |
| Ancillary units | 16 |
| Total persons engaged at 15 April 1979 | 4,409 |
| $(000) | |
| Salaries and wages paid (excluding working proprietors remuneration) | 40,134 |
| Depreciation | 14,847 |
| Purchases and other expenses | 201,944 |
| Turnover | 358,652 |
| Value added | 170,138 |
| Capital expenditure less disposals | 79,793 |
In the following 2 tables statistics are given at industry (subgroup) level.
| Industry Classification | Establishments | Ancillary Units | Total Persons Engaged at Mid-April 1979 | Salaries and Wages Paid During Year |
|---|---|---|---|---|
| * n.e.c.—not elsewhere classified | ||||
| Number | $(000) | |||
| Coal mining | 65 | 7 | 1,369 | 12,763 |
| Exploration, drilling and extraction of crude petroleum and natural gas | 13 | 3 | 610 | 7,211 |
| Ironsand mining | 3 | – | 255 | |
| Non-ferrous ore mining | 31 | – | 133 | 4,675 |
| Marble and building stone extraction | 8 | – | 47 | 341 |
| Limestone quarrying | 80 | 1 | 384 | 3,028 |
| Quarrying and other extraction of road metals, gravel, sand, shingle, etc. | 243 | 5 | 1,519 | 11,422 |
| Extraction of stone, clay, gravel, sand, etc. n.e.c.* | 14 | – | 74 | 580 |
| Mining and quarrying, n.e.c.* | 6 | – | 18 | 115 |
| Total mining and quarrying | 463 | 16 | 4 409 | 40,134 |
| Industry Classification | Depreciation | Purchases and other Expenses | Turnover | Value Added | Capital Expenditure Less Disposals |
|---|---|---|---|---|---|
| * n.e.c.—not elsewhere classified. | |||||
| $(thousand) | |||||
| Coal mining | 1,390 | 19,010 | 41,203 | 26,350 | 3,207 |
| Exploration, drilling and extraction of crude petroleum and natural gas | 6,196 | 112,823 | 203,534 | 97,856 | 67,967 |
| Ironsand mining | 2,596 | 26,577 | 39,202 | 14,086 | 1,925 |
| Non-ferrous ore mining | |||||
| Marble and building stone extraction | 116 | 2,277 | 3,249 | 262 | 147 |
| Quarrying and other extraction of road metals, gravel, sand, shingle, etc. | 3,472 | 30,296 | 53,444 | 24,200 | 4,630 |
| Extraction of stone, clay, gravel, sand, etc., n.e.c* | 138 | 1,694 | 2,588 | 983 | 232 |
| Mining and quarrying, n.e.c.” | 47 | 236 | 661 | 423 | 56 |
| Total, mining and quarrying | 14,847 | 201,944 | 358,652 | 170,138 | 79,793 |
Regional summaries of the census as a whole are shown in the 2 statistical area tables which follow:
| Statistical Area | Operating Units | Persons Engaged at Mid-April 1979 | Salaries and Wages Paid During Year | |
|---|---|---|---|---|
| Establishments | Ancillaries | |||
| Number | $(000) | |||
| Northland | 48 | – | 194 | 1,143 |
| Central Auckland | 47 | 2 | 439 | 3,931 |
| South Auckland - Bay of Plenty | 87 | 4 | 1,077 | 10,521 |
| East Coast | 5 | 1 | 33 | 288 |
| Hawke's Bay | 15 | 1 | 103 | 883 |
| Taranaki | 27 | 1 | 640 | 7,151 |
| Wellington | 59 | 3 | 473 | 4,233 |
| North Island total | 288 | 12 | 2 959 | 28,150 |
| Marlborough | 11 | – | 50 | 277 |
| Nelson | 40 | 1 | 365 | 3,154 |
| Westland | 24 | 1 | 408 | 3,368 |
| Canterbury | 38 | – | 119 | 948 |
| Otago | 38 | 1 | 144 | 1,053 |
| Southland | 26 | 1 | 364 | 3,183 |
| South Island total | 175 | 4 | 1 450 | 11,983 |
| New Zealand total | 463 | 16 | 4 409 | 40,134 |
The following table shows additional statistics at statistical area level.
| Statistical Area | Depreciation | Purchases and Other Expenses | Turnover | Value Added | Capital Expenditure Less Disposals |
|---|---|---|---|---|---|
| $(thousand) | |||||
| Northland | 297 | 2,682 | 4,999 | 2,469 | 397 |
| Central Auckland | 896 | 12,183 | 20,263 | 8,347 | |
| South Auckland Bay of Plenty | 4,117 | 40,938 | 72,753 | 33,143 | 4,614 |
| East Coast | 186 | 686 | 1,253 | 592 | 638 |
| Hawke's Bay | 288 | 3,238 | 5,039 | 1,906 | 377 |
| Taranaki | 3,082 | 47,235 | 83,302 | 25,762 | 7,751 |
| Wellington | 4,039 | 75,965 | 136,406 | 80,265 | 62,342 |
| North Island total | 12,906 | 182,927 | 324,016 | 152,485 | 76,593 |
| Marlborough | 106 | 490 | 1,086 | 620 | 131 |
| Nelson | 421 | 5,216 | 8,959 | 4,499 | 712 |
| Westland | 178 | 3,007 | 5,530 | 2,895 | 325 |
| Canterbury | 280 | 2,853 | 4,412 | 1,637 | 423 |
| Otago | 502 | 2,751 | 5,214 | 2,500 | 993 |
| Southland | 453 | 4,700 | 9,435 | 5,503 | 617 |
| South Island total | 1,941 | 19,017 | 34,636 | 17,653 | 3,200 |
| New Zealand total | 14,847 | 201,944 | 358,652 | 170,138 | 79,793 |
In the following table the turnover of the mining and quarrying industry has been analysed by the principal components.
| Item | Turnover |
|---|---|
| Sales of products— | $(thousand) |
| Coal | 41,195 |
| Clay | 460 |
| Limestone | 10,016 |
| Rock, sand, gravel, etc. | 48,475 |
| Other mining, etc., products | 233,343 |
| Total | 358,652 |
FURTHER INFORMATION—Further information on minerals and mineral production will be found in the following publications:
Report of the Ministry of Energy (Parl. paper D. 6).
Census of Mining and Quarrying 1978–79—Department of Statistics.
Annual Returns of Production from Quarries and Mineral Production Statistics—Mines Division, Ministry of Energy.
Report of the Department of Scientific and Industrial Research (Parl. paper G 21).
The Geology of New Zealand—N.Z. Geological Survey.
Monthly Abstract of Statistics—Department of Statistics (Production figures for coal and gas are published monthly).
Industrial Minerals and Rocks—DSIR (occasional).
Details of N.Z. Geological survey map coverage and publications are available from N.Z. Geological Survey, P.O. Box 30 368, Lower Hurt.
Table of Contents
HISTORICAL DEVELOPMENT—The function of the early manufacturing industries in New Zealand was to supply locally the immediate needs of the small scattered communities for food, clothing, building materials, and home furnishings, and to provide shipping with ropes, spars, and repairs. These handicraft activities grew into factories as the settlements expanded and as more opportunities developed for the organisation and specialisation of labour, and for the more complex processing of domestic or imported raw materials. Flour mills, flax mills, ropewalks, and sawmills appeared in the early 1840s followed by breweries, brick kilns, and cooperages in the mid forties and, later in that decade, lime kilns, ship and boat yards, soap and candle works, and tanneries.
By 1867, the first year in which statistics of factory production were collected in conjunction with the Population Census, manufacturing establishments included grain mills, breweries, biscuit factories, a bone-manure works, brick and tile yards and potteries, candle and soap works, coachbuilding workshops, fellmongeries, tanneries, wool-scouring works, flax works, aerated water and cordial factories, iron and brass foundries, lime kilns, malt kilns, engineering workshops, a patent slip, a petroleum works, rope and cordage works, sawmills, sash and door factories, ship and boat yards, and a woollen mill. The factories of this period were still primarily concerned with the satisfaction of the needs of the limited local markets.
The development boom of the 1870s, the rapid rise in population, and the better communications between internal markets, encouraged further factory expansion. Them was to some extent a natural protection from overseas competition in the high freight rates on imports. Other factors which assisted in this expansion were the admission of certain raw materials free of duty, the imposition of a tariff on some finished goods, and the granting of bounties for new factories by central and provincial governments. These were followed by a wider imposition of tariffs in 1888 when the home market was shrinking and capital and labour were beginning to leave the colony. Footwear and clothing factories, the manufacture of machinery, and metal industries were protected by this tariff. A wider protective Customs tariff was imposed in 1895. During the depressed years of the 1880s low wage costs enabled some New Zealand manufacturers to export their products, but this was partly attributable also to the special suitability of some New Zealand products, such as farm implements, to the needs of other developing communities overseas.
The first shipment of refrigerated meat in 1882 opened the way for the establishment and growth of the meat-freezing and dairy industries. Ten years after this first shipment, 21 meat-freezing works and 104 dairy factories had been established.
The recovery from the long depression, the resumption of large-scale immigration at the beginning of the present century, the spectacular development of meat-freezing and dairy factories, and the breaking in of new land, especially in the North Island, all contributed to the revival of a strong internal demand which stimulated manufacturing growth.
Auckland established itself as the predominant manufacturing province in New Zealand at an early stage, but in the general prosperity following the gold boom of the 1860s, there was a spectacular increase in manufacturing activity in Otago, which led Auckland until the 1890s. Canterbury was the next most important manufacturing province. Today, however, Auckland has clearly re-established its predominance and is followed by Wellington and Canterbury.
With the rising population and increased export income during the first decade of this century, manufacturing continued to expand at a steady rate. The growth continued to be concentrated on industries processing farm products for export and those supplying the more simple goods, housing materials and equipment, repairs, and supplies for farmers. In this period the electrical, wire-working, sheet-metal, and motor-vehicle industries had their beginnings.
Developments in the 1920s included the expansion of the vehicle industry (particularly motor and cycle assembly), sawmilling, and the metalworking, furnishings, and apparel industries. These developments carried forward the tendency for industries processing farm products to be less dominant in value of production and employment compared with other types of industry.
During the depression of the 1930s the total volume of factory output declined with the contraction of New Zealand's export income and the drop in internal demand. While prices fell, the output of factories processing farm products rose, but not sufficiently to offset the loss in volume from other manufacturing industries. The rapid fall in purchasing power caused the fanner to produce more, but the impact of the depression on the factories processing “non-farm” materials meant a heavy reduction in the output of consumer goods, building materials, and agricultural and dairy machinery and implements. By 1934–35, however, the volume of factory production had been restored to the 1929–30 level.
Apart from metalworking and vehicle factories, which had improved their position significantly, industry emerged from the depression in much the same pattern as before.
The recovery of manufacturing after the depression was primarily the result of better export prices, more public development, and an expansionist monetary policy, all of which resulted in the re-engagement of most of the unemployed.
There had been little time for any protective effect of exchange control and import selection to stimulate industrial expansion between the date these measures were introduced (December 1938) and the outbreak of war in September 1939. It was the war and its shortages which changed the manufacturing pattern and gave great encouragement to industrial development. The engineering and apparel industries, which contributed so much to war needs, made the greatest progress.
Production expanded in response to the need to replace imports which the United Kingdom and other countries could no longer supply and to provide uniforms, weapons, equipment, and provisions for New Zealand and allied armed forces.
One protective effect of the war and post-war periods and their restricted supply of imports was that domestic industry was often enabled to attain its optimum (New Zealand) output quickly without a difficult competitive struggle with imports.
Post-war Development—In the period immediately after the war, development in the manufacturing sector continued steadily. Factory expansion was sustained by a high level of internal demand, by the production of new products, and by the continued restriction on the importation of a wide range of goods. In the years following, the volume of production in the food, footwear, wearing apparel, and made-up textile goods groups increased slowly in response to population growth, while leather industry production fell as a result of competition from imports and synthetics. Spectacular increases in production came from new developments in the pulp and paper and rubber industries. However the major contribution to the growth in manufacturing in this period came from the engineering sector. The expansion in this field was stimulated by increasing mechanisation on farms, high levels of investment, the rising demand for consumer durables, and the increased importation of motor vehicle components for assembly in New Zealand.
A notable feature of the period 1945–80 was the continual widening of the range of products being made within the manufacturing sector. While the sector produces goods mainly for domestic consumption, the level of exports has risen consistently since the early 1970s when the level of exports was very small. This signifies a significant change in outlook by the sector.
New Zealand production now covers a diverse range of goods including chemicals and plastics, machinery, textiles and apparel, building materials, electrical equipment, metals, transport equipment, tanning, and packaging.
In the chemical and allied industries, New Zealand factories process PVC compounds and dry blends, besides producing such PVC products as sheeting, flooring, roofing, and rainwater goods; a range of formaldehyde resins used in the manufacture of adhesives and related products; acrylic emulsions and compounds; many industrial and domestic materials including synthetic detergents; various weed killers and insecticides; and a range of drugs and cosmetics.
The metals and electrical industries produce steel, aluminium, copper tube, wire rope, telephone and underground cable, switchgear, electric hoists, electric motor starters and fractional horsepower electric motors, as well as telecommunications equipment, colour television sets, and electronic controls for a variety of equipment.
The manufacture of transport equipment and machinery covers items such as agricultural aircraft, bicycles, pneumatic and steel-tyred road rollers, self-propelled hydraulically operated excavators, posthole diggers, hydraulic equipment and attachments, and cargo containers. The engineering trade produces control valves, thermostats, oil-fired kilns, press brakes, disc brake pads, high-speed twist drills, and numerous other items and pieces of equipment.
The packaging industry makes moulded pulp products as well as several types of plastic film, including projects involving cast polypropylene and the manufacture of irradiated polyethylene (shrink film).
In addition to carpet and apparel, texture synthetic yarns and warp-knitted, transfer-printed, and foambacked fabrics are now made by the textile industry.
MAJOR DEVELOPMENTS IN THE POST-WAR ERA—During the last 30 years there has been a continued diversification in New Zealand's industrial development, which has incorporated a number of major developments.
Forestry Industrial Developments—Since the war 5 companies have commenced production of pulp and paper and production of fibreboard, particleboard and plywood. Details about these industries are given in Section 16, Forestry.
Cement—New Zealand Cement Holdings plan to construct a new cement plant at Weston near Oamaru. The plant will have an annual production capacity of 500 000 tonnes per annum, and will utilise lignite, limestone, and marl deposits located near Oamaru, with silica sand being brought in from Winton.
Steel Industry—In 1959 the Government set up the New Zealand Steel Investigating Company to determine the viability of establishing an iron and steel industry using indigenous raw materials—titanomagnetite ironsands, sub-bituminous coal, and limestone. New Zealand Steel Ltd., the company formed in 1966 as the successor to the New Zealand Steel Investigating Company, commissioned a direct reduction kiln and electric ore steel-making facilities at Glenbrook, 60 km from Auckland, in 1970. A period of growth and consolidation followed in the 1970s. Items currently manufactured are galvanised products, pipe, rectangular hollow sections, and billets. In 1980 the company decided to proceed with the installation of a production line for the prepainting and laminating of flat steel products. This plant was commissioned in early 1982.
New Zealand Steel Limited is currently involved in a large expansion project at Glenbrook, which will increase iron and steel-making capacity 5-fold, and convert the plant into a fully integrated steelworks.
Pacific Steel Ltd. was established in 1960 by New Zealand and British interests. Production of wire rod, reinforcing and flat bar and angles and channels commenced in 1962. The company utilises scrap metal collected through Pacific Scrap Ltd., and in addition purchases steel billets from New Zealand Steel Ltd.
Aluminium—New Zealand Aluminium Smelters Ltd., owned by Comalco Industries Pty. Ltd., of Australia, and Showa Aluminium KK and Sumitomo Aluminium Smelting Company Ltd., of Japan, established a primary aluminium smelter at Tiwai Point, near Bluff, early in 1971. The first furnace was commissioned in April 1971. Three full potlines are now in operation, and production is 240 000 tonnes rated annual capacity. Approximately four-fifths of the primary aluminium produced at the smelter is exported. All the partners take their percentage of the smelter's output in proportion to their ownership.
Oil Refinery—The Marsden Point oil refinery commenced production in 1964. The refinery company was established by the 5 major oil companies, with government and private sector equity participation. Due to the demand for refined products, which exceeded production capacity, the refinery is now being expanded. A hydrocracker is being installed to allow more middle-distillate oils (diesel and kerosene, aviation fuels and lubrication oils and solvents) to be extracted, thus reducing imports of both oil and refined products. Construction is now under way and over 1000 staff are employed on the site.
Maui Gas Developments: Ammonia-Urea Plant—Gas from the Maui field, which was discovered in 1969, has been allocated to a number of projects. These projects include a synthetic petrol plant which will provide one-third of New Zealand's estimated petrol requirements after 1985, a methanol plant, and an ammonia-urea plant. Proposals for the extraction and processing of certain gas liquids are also being evaluated.
Engineering—The engineering industry sector in New Zealand has a history stretching back to the early days of the colony. From simple beginnings it now plays a vital role in the growth of our industry. The industry has developed a capacity in both the heavy and light engineering sectors.
New Zealand's heavy engineering industry has been concerned with fabrication, installation, maintenance, and resource development in areas such as the development of primary processing facilities, and fertiliser plants. It has also been involved with major civil engineering projects such as hydro-electric dams (radial gates, draft tubes, scroll cases), oil refining (heat exchangers, pressure vessels), and forestry developments.
The light engineering industry has developed on the basis of import substitution policies and the postwar road and house-building programmes. Its role has been to provide materials for light industry, e.g., supplying the house-building and motor-vehicle componentry trades. It has also supplied the agricultural, horticultural and animal husbandry sectors with implements and products.
In the immediate post-war era, isolation led to the development of ingenious solutions to repair and maintenance problems. The industry grew through the 1950s and 1960s, as import substitution policies resulting from balance of payment constraints were developed in depth. In the 1955–65 period the engineering industry's capacity to utilise equipment to produce short production runs emerged. Since 1965 the drive for exports has resulted in increasing specialisation of equipment, though the heavy engineering industry did not show the growth expected in the early 1970s. From 1975 to the present day the effect of the oil shock and inflation has speeded the introduction of numerically-controlled machines.
Although most of the fabrication, installation and maintenance industry uses imported raw materials, local casting and machining, and the rod and wire-making industries use local raw materials. Planned major projects will provide work for the whole of the engineering sector in the next decade.
Aircraft Manufacture and Maintenance—Aircraft manufacture is carried out by Pacific Aerospace Corporation Ltd. (a member of the Agricultural Corporation Group which took over the assets of New Zealand Aerospace Ltd.) at Hamilton. The company is concentrating on production of the Fletcher FU24 Agricultural Aircraft and 'Cresco', a stretched turbo-engined version of the FU24 with a substantially increased payload. Production of the CT4 military airtrainer formerly produced by New Zealand Aerospace Industries Ltd., has ceased. Manufacture of componentry for the Australian Government Aircraft Factories' “Nomad” aircraft, carried out by a number of New Zealand companies, particularly Safe Air Ltd. in Blenheim, is also winding down.
Safe Air Ltd. services aircraft propellers for the RAAF and a number of New Zealand and overseas airlines. Helicopter overhaul is carried out by Alexander Helicopters Ltd., Hamilton and Airwork New Zealand Ltd., Christchurch. Major airframe and engine overhauls of Air New Zealand and other Pacific airlines are carried out by Air New Zealand in Auckland and Christchurch.
Electronics Manufacture—The New Zealand electronics industry has 3 sectors: consumer electronics; industrial electronics including telecommunications; and electrical components.
The largest sector is consumer electronics, which accounts for about two-thirds of output and employment. It primarily produces television sets along with some audio and radio products, games and kitsets.
The industrial electronics sector is, however, becoming increasingly important. It is undergoing a rapid expansion and now produces nearly 80 percent of the industry's exports. Its products are used in agriculture, industry, medicine, and science.
The main electronic components produced in New Zealand are printed circuit boards, loudspeakers, antennas, transformers, and coils.
Textile Industry—The textile industry, 1 of New Zealand's oldest manufacturing activities, developed rapidly from the late 1950s and throughout the following decade, largely on the basis of import substitution. To the traditional processes of weaving cloth and cutting and sewing clothes were added the production of knitted fabrics and garments, the weaving and tufting of carpets, the extrusion and texturing of synthetic yarns, and the manufacture of a greatly diversified range of other textile products.
In contrast to the woollen mills, which had been established close to wool-growing centres, the knitting factories, using predominantly synthetic yarns, tended to be set up close to major urban markets. Market proximity also influenced the location of the carpet plants, but manufacturers of less bulky textile products often built factories near sources of available labour, being encouraged by various regional development incentives.
Most of the new textile factories, particularly knitwear and clothing units, were very small, typically employing only 10 to 20 people. Although some were independently operated, a great many in outer suburbs and provincial towns functioned as satellites for large plants based in the main urban centres. Such units became established rapidly in the late 1960s and early 1970s with buoyant markets and labour scarcity in the major cities, but closed with similar speed in the middle and late 1970s when demand fell and transport and overhead costs rose sharply.
Economic strains during the middle and late 1970s brought about a considerable degree of rationalisation in the textile industry. Most severely affected were some of the traditional activities, particularly woollen milling, suffering since the late 1950s from market changes which saw demand move steadily away from the heavier woven wool fabrics towards light-weight easy-care materials, often knitted synthetics. From 16 companies operating 18 mills in 1960, the sector has declined and, as a result of rationalisation within the woollen milling sector, there were only 5 companies controlling 8 mills by 1982.
Some other processes begun during the 1960s to substitute for imports and to provide employment became increasingly uncompetitive. Synthetic yarn extrusion is a notable example, where technological advances necessitated even longer production runs which the relatively small New Zealand market could not sustain, and which could not be maintained by exporting from a high-cost domestic base. When frontier protection was reduced in 1980 to allow the knitting and apparel sectors access to more competitive yarns, the domestic extrusion plants closed.
That change was part of the Textile Industry Plan, implemented on 1 July 1980 following Government acceptance of recommendations based on the review of the textile industry by the Industries Development Commission. The plan featured a liberalisation of access to materials, and increased imports of finished goods under the protection of a revised tariff structure, with the object of improving competitiveness and developing textile industry exports. Between 1 July 1980 and 30 June 1984 the production efficiency of the woollen milling industry improved as a result of extensive rationalisation and payment of a bounty on woven woollen fabric.
The apparel import licence tendering scheme has provided access to a greater range of imported garments. This has created a more competitive environment for domestic manufacturers, greater consumer choice and a mechanism for testing the level of Customs tariffs set in accordance with the Textile Industry Development Plan.
In its review of the Textile Industry Development Plan, the Industries Development Commission in 1983 reported on the carpet sector and measures to improve and maintain the momentum of the plan until its expiry in June 1984. The commission proposed measures for the controlled introduction into the New Zealand market of both imported and locally made synthetic carpets, taking into account New Zealand's obligations under the Australia-New Zealand Closer Economic Relations Agreement. The commission will present another report during 1984.
INDUSTRIAL DEVELOPMENT IN 1983: Aluminium—The third potline at New Zealand Aluminium Smelter's Tiwai Point aluminium smelter reached full production in June 1983, and has increased the total smelter capacity from 155 000 tonnes to 244 000 tonnes. In November, representatives of the proposed Pechiney-Fletcher Challenge consortium met with the Government to review proposals for a second aluminium smelter at Aramoana. The parties decided not to resume negotiations at that time in light of the current world aluminium market and electricity costs.
Steel—The first stage of the New Zealand Steel Limited expansion at Glenbrook is proceeding. Stage One involves an increase in iron and steel-making capacity from 150 000 to 770 000 tonnes per annum. International tenders were let for Stage Two, the hot and cold rolling mills. In November, the contract for the design, engineering, manufacture, construction and commissioning of the rolling mills was awarded to Ishikawajimi-Harima Heavy Industries Co. Ltd (IHI) of Japan.
Natural Gas Based Developments—Construction was completed and the first methanol was produced from Petrolgas' methanol plant late in the year. The construction of the synthetic petrol plant progressed well. Proposals to manufacture plastics from durene (a by-product of synthetic fuel) were considered. The Gas Liquids Investigating Company (GLICO), which was set up in 1982 to evaluate options for processing gas liquids, carried out a study during the year but decided that more research was required. A decision on whether to proceed is unlikely to be made until at least mid-1984. Further progress was made in establishing a nationwide LPG distribution system. Port facilities have been completed in Dunedin and delivery by coastal tanker began in early 1984. Deliveries to Christchurch are expected to commence later in 1984. Wellington and Auckland will be fed by road and rail.
Coal—Export contracts for steaming and coking coal continued at levels comparable with the previous year, about 250 000 tonnes, although prices gained were lower.
Lignite—The Liquids Fuels Trust Board released a report drawing together the information currently available on 9 deposits of lignite in the South Island, and reviewing the possibility of using lignite to produce transport fuels. The board is continuing research to determine the most suitable site and process for a liquid fuels project.
TRENDS IN INDUSTRIAL DEVELOPMENT: Indigenous Resources—Those trends in industrial development of which the above examples are illustrative appear certain to continue through the decade of the eighties, with priority being given to the development of new industries based on natural resources such as forests, fish stocks, and energy. The rapid development of the forest industries was a major turning point and these are now significant export earners, principally through export of pulp, paper
board, and newsprint but also through exports of logs, sawn timber, chips, and building boards. Intensive forest planting programmes since the early 1960s will result in a surplus for export about 3 to 4 times greater than current levels by the year 2000, and this will present opportunities for substantial future processing developments.
The establishment of the 200-mile Exclusive Economic Zone in 1977 has stimulated the rapid development of the fishing industry. The levels of both catching and processing have risen significantly with the introduction of large deep-water vessels, a substantial increase in on-shore processing facilities, and the establishment of co-operative ventures between New Zealand and foreign fishing companies.
Following the introduction of a strategy for the development of New Zealand's deep-water trawl fishery, which came into effect on 1 April 1983, the Government has focussed on options for the future management of the inshore fishery. During 1983, a discussion paper on possible options was released for comment by the industry.
Research is continuing into the potential of New Zealand coals as fuel and industrial feedstocks. The task force set up by the Minister of Energy in 1981 to investigate the feasibility of producing anode carbon (used in aluminium smelting) from Buller coal completed its report in 1983. The task force concluded that local production of anode carbon is not viable at present.
Overseas Investment—In June 1979 the Government publicly stressed its welcoming attitude to overseas investment, in particular where such investment is allied to the introduction of new technology and increased net foreign exchange earnings. The full development of New Zealand's resources will require both technology and capital from overseas during the eighties. Cases will continue to be assessed on their individual merits by the Overseas Investment Commission, under a liberal investment policy.
Resource Conservation—The Department of Trade and Industry provides support for existing reclamation industries, and encouragement to the establishment of new resource management ventures. The Waste Recycling Bulletin which is published by the department indexes usable industrial and commercial wastes throughout the country, and provides a free exchange service to a growing number of firms and organisations.
An increasing number of municipalities and some counties are setting up at-source separation systems for recoverable materials in domestic waste, especially glass, reusable glass bottles, textiles, paper, and metals. A survey of local authorities in late 1982 reported 47 recycling depots, 26 kerbside collections, and 7 centralised composting schemes on trial or in operation.
The twice-yearly meetings of the Local Authority and Industry Recycling Group, which is convened by the Department of Trade and Industry to bring together local authorities and recycling industry representatives, holds discussions on resource recovery potential, and has helped to encourage new recycling schemes. The meetings are held in different areas, to facilitate regional participation. At the end of 1983, the 13th meeting in this series was held at Tauranga.
Since 1979, a Resource Recovery Grants Scheme has been operated by the Department of Trade and Industry to assist new or expanding recycling ventures. For the most part, grants have gone to local authorities or community groups, but small recycling collection firms have also received help. Usually the grants reimburse some of the expenses incurred for publicity needed to support a recycling scheme, or for other setting-up costs. By the end of 1983–84, 65 grants had been made since the Grants Scheme's inception, with a total expenditure of $131,000. Grants for 1983–84 encouraged some innovative schemes, including use of industrial offcuts for school crafts and recycling waste bark and paper into seedling pots. Also funded were several multi-material recycling depots, work skills and rehabilitation projects involved in recycling, a hydraulic compactor for scrapped “white-ware” appliances, and a pilot composting project.
Waste paper collection continues and in 1982 NZ Forest Products Limited opened a new mill for waste paper processing at Otahuhu. A second mill at Te Papapa was opened in 1983 and a new plant to handle waste fibre is scheduled to open at Kinleith in 1984. A pilot paper-save programme was tested in 3 Wellington Government buildings in 1982, in co-operation with NZ Forest Products Limited, and demonstrated that clean office papers could be obtained successfully from commercial buildings. The programme was continued in 1983, and the Department of Internal Affairs has appointed a coordinator. Whether the paper-save programme can be continued and expanded will depend partly on whether a waste paper processing plant is opened by Caxton Mills at Kawerau. The proposed input of this plant would be some 20 000 tonnes per year of white wood-free printed office waste; proposed output would be 40 000 tonnes per year, and processing would employ a new de-inking technology.
A car-crusher owned by Pacific Metal Industries Limited completed cleaning up municipal car hulk stockpiles in the South Island late in 1982, and in the North Island from Wellington to Auckland in late 1983. By February 1984, 60 000 cars will have been processed since the car-crusher started operation. In 1983, 50 000 tonnes of old cars and white-ware, and 200 tonnes of tin cans were recycled by Pacific Metal Industries Limited at the plant in Otahuhu. Tin cans are collected from the public at 13 recycling centres in the Auckland region. The company expects to recycle a total of 170 000 tonnes of steel for the year ending September 1984.
New Zealand continues to have one of the world's most successful reusable bottle systems for beer and milk.
The Associated Bottlers Company Limited standardised beer bottles achieve a 92 percent return rate, with an additional 3 percent being recycled as broken glass. Milk bottles in New Zealand have a high “trippage” rate, and each bottle is used from 70 to 120 times before being recycled into new bottles. Overall in New Zealand, some 19 000 tonnes of glass were recycled into new glass products for the March 1983–84 year, with recycled glass making up approximately 33 percent of total glass feedstock.
In March 1983 the Minister for the Environment announced that a Team on Packaging would be convened because of concern expressed over the increase of one-way packaging in New Zealand. Prior to the convening of the Team on Packaging a report was prepared by the packaging and beverage industries to quantify the impact of packaging in the waste stream. The report and submissions from the public will be reviewed in 1984.
During 1983 the Department of Trade and Industry published the results of commissioned research under the titles: A Survey of Fish and Shellfish Waste in the South Island, A Study of the Regional Arisings of Post-Consumer Plastic Waste, and A Feasibility Study of the Possible Production of Methane from Landfill Sites. Also published in 1983 was The New Zealand Recycling Guide, a comprehensive summary designed for the use of individuals and organisations interested in recycling as a fund-raising or business operation.
To date 14 research studies have been published in the Resource Conservation Series. Research to be published during 1984 includes: a survey of local authority recycling projects around the country; guides for local authority coordination of recycling and small businesses based on recycling; an update of data on refuse composition and energy conservation from recycling; and results from a nationwide survey of wood wastes.
REGIONAL DEVELOPMENT—The regional development programme offers measures designed to reduce disparities between regions by encouraging the development of their resources. The main emphasis of the programme is on manufacturing. Eleven designated priority regions are: Northland, King Country, East Coast, Taranaki, Wanganui, Wairarapa, Marlborough, West Coast, South Canterbury, Otago, and Southland.
Incentives exist to encourage the expansion of existing industry, the establishment of new manufacturing ventures, and the development of resource-based activities.
Financial assistance includes: suspensory loans (which convert to grants on the fulfilment of conditions), concessional loans (which include a period of up to 5 years before interest payments and repayments of principal begin), preliminary investigation grants, regional studies assistance grants, the South Island electricity concession, and the Unit Rate Scheme (a freight concession for freight sent from the South Island).
The 1983 Budget extended the coverage of the suspensory and concessional loan schemes to horticulture and tourism projects which have not been introduced to the region, and are not eligible for other concessional Government-funded assistance.
Preliminary investigation grants are available for new activities in agriculture, horticulture, forestry, fishing, mining, tourism, and manufacturing.
Regional development councils are appointed in each of the 11 priority regions, while the 1983 Budget provided for the establishment of councils in non-priority regions. While these receive Government administrative support, they do not have access to regional development funds.
AIDS TO DEVELOPMENT—The Department of Trade and Industry compiles and distributes annually the publication Government Incentives and Assistance to Industry which lists the services available from Government departments and Government-funded organisations. Described very briefly below are some of the programmes which provide assistance of various types to manufacturing industries.
Development Finance Corporation—A description of the Development Finance Corporation, which was established as an independent body in 1964, is included in pages 798–799, Banking and Currency Section. The Development Finance Corporation also administers on behalf of the Department of Trade and Industry: the Government's Applied Technology Programme, which provides incentives for industrial research and development; the Export Suspensory Loan Scheme, which offers suspensory loans for eligible exporters; the Small Business Venture Capital Fund, which provides equity assistance for eligible small businesses; and the regional development suspensory and concessional loan schemes. The corporation, through its Hamilton branch, also administers the Youth Entrepreneurship Pilot Scheme which has been established for a 1-year trial period to assist school leavers to become self-employed.
Small Business Agency—The Government-funded Small Business Agency, which operates as a division of the Development Finance Corporation, was established as an advisory and counselling service to encourage and promote the efficient operation of the small business sector. The agency also operates for the Government the Loan Guarantee Scheme which is designed to assist eligible small businesses in obtaining finance.
Otago Business Development Centre—The Government-assisted Otago Business Development Centre provides a management consultancy service for businesses in the South Island.
Manufacturing Development Council—The council was established in 1969 as a sector council of the National Development Council. Since that time it has acted as a link between the industrial private sector and the Government on a range of matters concerning the development of the manufacturing sector. It has been involved in a number of studies of the business sector, the most recent being a report it commissioned from the New Zealand Institute of Economic Research on business investment in New Zealand.
In 1980, following a suggestion by the Government, the council redefined its role and agreed to a future work programme which would enable it to formulate a development strategy, compatible with overall economic and social development objectives, for the manufacturing sector in the 1980s. The council has now completed this work programme which culminated in the publication in July 1983 of its public document entitled Development Strategy for the Manufacturing Sector.
The council is serviced by the Department of Trade and Industry.
Industries Development Commission—The Industries Development Commission has the role of advising the Government on measures to assist industrial development (see section 23A, External Trade).
The Investment Unit—In 1979 an Investment Unit was established within the Department of Trade and Industry. The functions of the unit are to:
Assist investors with consent procedures administered by Government departments;
Facilitate a close understanding between investor and agency;
Liaise with the Overseas Investment Commission in the preparation and distribution of publicity material;
Co-operate with Government departments in the promotion of investment opportunities arising from Government-funded research;
Develop proposals for streamlining consent procedures.
Pacific Islands Industrial Development Scheme—The Pacific Islands Industrial Development Scheme (PUDS), introduced on 30 November 1976, provides financial assistance and incentives for New Zealand companies developing approved manufacturing or processing operations in Fiji, Tonga, Western Samoa, the Cook Islands, Niue, Papua New Guinea, the Solomon Islands, Kiribati, Tuvalu, Nauru, and Vanuatu. The objective is to foster economic development opportunities in those countries and furthering the growth of employment.
Standards Association of New Zealand—The Standards Association of New Zealand (SANZ) was established under the Standards Act 1965. In accordance with this Act, SANZ formulates standard specifications, codes of practice and other documents as guides to industry. These are designed to maintain minimum or desirable standards of safety, quality, and performance for industrial processes and products. The association also operates a Certification Mark Scheme to specified New Zealand standards.
In addition, the Standards Association represents New Zealand on the International Organisation for Standardisation (ISO), the International Electrotechnical Commission (IEC) and the Pacific Area Standards Congress (PASC).
New Zealand Export/Import Corporation—Established early in 1974, the corporation has a responsibility for co-ordinating and expanding overseas trading opportunities. By providing assistance to small and medium-sized companies to go into the export field, the corporation aims at increasing and diversifying New Zealand's range of exports.
Other Bodies—A number of liaison committees have been established to promote development in particular fields of industry. These include the Advisory Committee on the Heavy Engineering Industry, the New Zealand Metal Casting Industry Association (previously the Foundry Industry Advisory Committee), and the National Electronics Development Association (NEDA). Several bodies exist principally to promote exports: ENEX (previously the Engineering Export Association of New Zealand Inc.) continues to be prominent in this field, while the Export Guarantee Office facilitates the export of manufactured goods by removing some of the financial uncertainties involved in export trade. The Industrial Design Council (IDC) exists to promote and encourage good design. There are also several bodies providing technical and advisory services for industry. Further details of these organisations are to be found under Section 7, Education and Science.
RESEARCH AND DEVELOPMENT—Engagement in research and development by manufacturing enterprises is shown in the following table.
Details published in all but the last column exclude single-establishment enterprises employing less than 10 persons and ancillary units servicing more than one industry.
| Manufacturing Census (Year) | Persons Engaged on Research and Development | Percentage of Total Number Engaged in Manufacturing | Expenditure on Research and Development | Percentage to Total Value Added in Manufacturing |
|---|---|---|---|---|
| No. | % | $(000) | % | |
| 1975–76 | 1,408 | 0.47 | 15,445 | 0.66 |
| 1976–77 | 1,344 | 0.43 | 15,403 | 0.54 |
| 1978–79 | 1,341 | 0.45 | 22,436 | 0.64 |
| 1981–82 | 1,488 | 0.51 | 44,044 | 0.75 |
SCOPE OF STATISTICS—The first integrated economic Census of Manufacturing applied to the 1974–75 year. The census covers establishments (factories, workshops, etc.) in New Zealand, the predominant activity of which is manufacturing, processing, assembly, or repair, plus the activities of ancillary units (head offices, etc.) which service or predominantly service those establishments. Single establishment firms having an average of less than 2 persons engaged full time are, however, not included in the census.
All activities of the manufacturing operations, from the purchase of material and supplies to the point at which the products are sold, are within the scope of the census, which is for the year ended 31 March, or the last accounting year prior to 31 March.
The integrated economic census classifies all the manufacturing industries according to the revised New Zealand Standard Industrial Classification (NZSIC), which is based on the 1968 United Nations International Standard Industrial Classification of All Economic Activities.
Because of the major changes introduced there was an unavoidable break in the continuity of manufacturing statistics. To provide some link with the previous census series, a limited number of main aggregates were collected for the 1973–74 year on the same basis as those collected for 1974–75. This link information has been published in a series of industry bulletins.
In the statistical tables which follow, the results of the 1981–82 manufacturing census are published.
Enterprise Group—An independent business unit operating in New Zealand as a single business entity, or a group of business entities under common ownership or control.
Enterprise—A single business entity operating in New Zealand as a legally constituted body such as a company, partnership, trust, local or central government trading organisation, incorporated society, or self-employed individual.
Establishment—A separate operating unit engaged in New Zealand in 1 or predominantly 1 kind of economic activity from a single location.
Ancillary Unit—An administrative or general servicing unit such as a head office, storage unit, laboratory, etc., the prime function of which is to provide services for other locations of the enterprise.
Paid Employees—The total number of people engaged full-time and part-time in the establishments and ancillary units at or on the nearest payday to 28 February 1983.
Accounting Values: Expenditure—These figures are taken from the “Annual Accounts” for the establishments and ancillary units covered in the census.
Purchases—Purchases of materials, supplies, goods for resale, fuels, and electricity.
Employer Contributions—Payments to superannuation, pension and welfare schemes, and accident compensation levies.
Salaries and Wages—Gross earnings during the accounting year of all paid employees in the establishments or ancillary units included in the census. Included are such items as overtime, sick and holiday pay, bonuses, payments under piece rate schemes, all benefit allowances, severance pay, value of free supplies and sales commission paid to own employees.
Rent and Leasing—Total expenditure on the rent and leasing of land and buildings and of plant, equipment and vehicles.
Insurances—Business insurance premiums paid.
Indirect Taxes—Covers land tax, road user charges, licence fees and rates.
Depreciation—As charged in the books of account on fixed tangible assets owned by the establishments and ancillary units.
Interest, etc.—Interest, bad debts, donations, royalties and patent fees paid.
Other Expenditure—All other operating expenses excluding salaries and drawings by working proprietors/partners and expenses of a capital nature.
Income:Sales—Sales of manufactured goods and services provided, including sales of goods purchased for resale without any further processing.
Rent and Leasing—Total income from the renting and leasing of land and buildings.
Subsidies—Direct Government cash grants and subsidies, other than for capital purposes.
Interest, etc.—Interest, dividends, donations, grants, royalties, patent fees, and insurance claims received.
Other Income —Income from rental of plant and equipment, service connection charges, etc.
Economic Values—These figures are derived from the accounting values for the establishments and ancillary units covered in the census.
Operating Surplus—Interest, etc. paid/received are deducted from the respective accounting value totals to arrive at the “operating surplus” measurement used in the value added calculation.
Value Added—The amount added to goods and services by the contributions of capital and labour (i.e., the cost of bought-in materials and services has been deducted from the total value of output).
A general statistical summary of the results of the 1981–82 integrated economic Census of Manufacturing is given in the following table.
| Census Coverage— | Number | |
|---|---|---|
| Enterprise groups | 7,478 | |
| Enterprises | 8,282 | |
| Establishments and ancillary units | 11,064 | |
| Working proprietors/partners and paid employees | 296,751 | |
| Capital Assets— | $(000) | |
| Purchased during the year | 1,248,108 | |
| Sold during the year | 149,556 | |
| Census Values in Accounting Terms— | $(000) | |
| Income— | ||
| Sales of manufactured goods plus sales of goods purchased for resale | 18,000,594 | |
| Other income— | ||
| Subsidies | 65,933 | |
| Interest, etc. | 122,110 | |
| Other | 193,726 | |
| Total income | 18,382,363 | |
| Stocks— | Number | |
| Value at end of year | 3,207,917 | |
| Value at beginning of year | 2,773,912 | |
| Increase in stocks | 434,005 | |
| Total income plus increase in stocks | 18,816,368 | |
| Expenditure— | ||
| Purchase of materials, etc., plus cost of goods purchased for resale | 10,381,973 | |
| Other expenditure— | ||
| Salaries and wages | 3,798,032 | |
| Employer contributions | 117,032 | |
| Indirect taxes | 40,276 | |
| Depreciation | 390,984 | |
| Interest, etc. | 462,380 | |
| Other | 2,385,044 | |
| Total expenditure | 17,575,722 | |
| Net profit | 1,240,646 | |
| Census Values in Economic Terms— | $(000) | |
| Operating surplus— | ||
| Total income, plus increase in stocks | 18,816,368 | |
| Less interest, etc., received | 122,110 | |
| 18,694,257 | ||
| Total expenditure | 17,575,722 | |
| Less interest, etc., paid | 462,380 | |
| 17,113,342 | ||
| Operating surplus | 1,580,916 | |
| Value added— | ||
| Operating surplus | 1,580,916 | |
| Salaries and wages | 3,798,032 | |
| Employer contributions | 117,032 | |
| Depreciation | 390,984 | |
| Indirect taxes | 40,276 | |
| 5,927,240 | ||
| Plus capitalised salaries and wages, etc. | 17,251 | |
| Less subsidies received | 65,933 | |
| Value added | 5,878,564 | |
| Fixed Tangible Assets— | ||
| Additions during the accounting year | 1,248,108 | |
| Disposals during the accounting year | 149,556 | |
CENSUS OF MANUFACTURING 1981–82—The following tables show statistical data by industry major group and sub-group.
| Industry | Enterprise Groups | Enterprises | Location Units | Persons Engaged at 28 February | |
|---|---|---|---|---|---|
| Establishments | Ancillary Units | ||||
| Number | |||||
| Export meat works and abattoirs | 18 | 23 | 51 | 8 | 33,952 |
| Other abattoirs and rural slaughterhouses | 24 | 25 | 27 | 1 | 1,468 |
| Meat packers and canners | 24 | 24 | 29 | 6 | 551 |
| Ham, bacon, and smallgoods | 48 | 52 | 58 | 16 | 1,856 |
| Poultry slaughter-houses | 18 | 18 | 21 | 2 | 1,212 |
| Slaughtering, preparing and preserving meat not elsewhere classified (n.e.c.) | 33 | 36 | 40 | 4 | 913 |
| Co-operative dairy factories | 35 | 35 | 66 | 16 | 6,939 |
| Milk processing plants | 38 | 39 | 41 | 13 | 1,028 |
| Ice cream factories | 9 | 10 | 14 | 7 | 564 |
| Manufacture of dairy products n.e.c. | 5 | 5 | 7 | 6 | 664 |
| Canning and preserving of fruit and vegetables | 33 | 33 | 43 | 5 | 5,051 |
| Land-based fish, etc., factories | 67 | 69 | 87 | 16 | 2,312 |
| Vegetable and animal oils and fats | 21 | 21 | 23 | 5 | 549 |
| Grain milling and prepared breakfast foods | 11 | 17 | 20 | – | 807 |
| Bread bakeries | 77 | 95 | 104 | 39 | 2,633 |
| Cake, pastry, and pie (other than meat) factories | 64 | 64 | 69 | 15 | 1,015 |
| Cake and pastry kitchens | 249 | 250 | 253 | 33 | 1,792 |
| Biscuit factories | 9 | 9 | 13 | – | 895 |
| Uncooked pasta products and pastry | 6 | 6 | 7 | – | 77 |
| Sugar, cocoa, chocolate, and sugar confectionery | 37 | 37 | 43 | 10 | 2,515 |
| Food products n.e.c. | 51 | 56 | 63 | 17 | 2,548 |
| Prepared animal feeds | 43 | 48 | 60 | 7 | 771 |
| Food manufacturing | 856 | 954 | 1,139 | 226 | 70,112 |
| Distilling, rectifying, and blending spirits | 6 | 6 | 7 | 1 | 142 |
| Wine | 49 | 49 | 54 | 12 | 1,018 |
| Brewing and malting, and tobacco manufacturers | 7 | 11 | 19 | 12 | 2,815 |
| Soft drinks | 20 | 20 | 29 | 10 | 1,177 |
| Beverage and tobacco manufacturing | 79 | 86 | 109 | 35 | 5,152 |
| Total, food, beverage, and tobacco manufacturing | 931 | 1 039 | 1 248 | 261 | 75 264 |
| Wool scouring | 26 | 31 | 34 | – | 960 |
| Woollen fibres, spinning, and weaving | 21 | 21 | 32 | 6 | 2,864 |
| Man-made fibres, spinning, and weaving | 9 | 10 | 11 | 1 | 557 |
| Dyeing, printing, and finishing yarns and textiles | 14 | 15 | 16 | – | 276 |
| Canvas goods and similar articles of other fabrics | 93 | 94 | 99 | 1 | 1,079 |
| Other made-up textile goods | 94 | 96 | 99 | 5 | 1,793 |
| Knitting mills | 92 | 96 | 110 | 11 | 4,654 |
| Carpets and rugs | 21 | 22 | 29 | 2 | 2,309 |
| Textiles n.e.c. including cordage, rope, and twine | 17 | 19 | 24 | 7 | 665 |
| Manufacturing textiles | 366 | 395 | 454 | 33 | 15,157 |
| Leather gloves and clothing | 28 | 28 | 32 | 6 | 674 |
| Natural and artificial fur clothing | 15 | 15 | 15 | 3 | 157 |
| Clothing other than leather and fur | 493 | 519 | 636 | 78 | 18,057 |
| Manufacturing clothing (except footwear) | 536 | 562 | 683 | 87 | 18,888 |
| Tanneries and leather finishing | 18 | 19 | 24 | 7 | 1,641 |
| Fellmongery | 7 | 7 | 10 | 2 | 205 |
| Fur dressing and dyeing, fur and | 16 | 16 | 18 | 2 | 222 |
| Leather and leather substitute products (excluding footwear and clothing) | 101 | 103 | 108 | 3 | 1,520 |
| Manufacturing leather and products of leather, leather substitutes, and fur (except footwear and clothing) | 140 | 145 | 160 | 14 | 3,588 |
| Footwear (excludes footwear manufactured out of rubber, plastic or wood) | 81 | 85 | 118 | 7 | 4,948 |
| Total, textile, wearing apparel, leather industries | 1 101 | 1 180 | 1 415 | 141 | 42 581 |
| Sawmills | 167 | 195 | 226 | 15 | 6,085 |
| Planing, preserving, and seasoning timber | 40 | 44 | 54 | – | 1,380 |
| Builders, carpentry, and builders joinery | 325 | 337 | 344 | 12 | 3,285 |
| Prefabricated and precut buildings | 30 | 30 | 47 | 5 | 848 |
| Plywood, veneer, and board | 33 | 37 | 39 | 5 | 1,791 |
| Sawmills, planing, and other wood mills n.e.c. | 38 | 38 | 39 | 1 | 441 |
| Wooden and cane containers, small caneware | 27 | 28 | 30 | 1 | 424 |
| Cork products and wood products n.e.c. | 106 | 107 | 112 | 4 | 1,037 |
| Manufacturing wood, and wood and cork products (excludes furniture) | 709 | 777 | 891 | 43 | 15,291 |
| Wooden furniture and upholstery | 435 | 440 | 484 | 22 | 6,412 |
| Mattress making | 6 | 6 | 10 | 1 | 303 |
| Furniture and fixtures (excludes furniture and fixtures manufactured primarily of metal) | 23 | 23 | 28 | 4 | 314 |
| Manufacturing furniture and fixtures (excludes furniture and fixtures manufactured primarily of metal) | 462 | 469 | 522 | 27 | 7,029 |
| Total, wood and wood products (including furniture) | 1 162 | 1 243 | 1 413 | 70 | 22 320 |
| Pulp, paper, and paperboard | 8 | 11 | 13 | – | 5,656 |
| Corrugated board, paperboard and corrugated board boxes, cases, containers, and boxes of paper and paperboard n.e.c. | 23 | 23 | 47 | 2 | 2,601 |
| 12 | 13 | 13 | – | 580 | |
| Wallpaper factories | 5 | 5 | 5 | – | 309 |
| Pulp, paper, and paperboard articles n.e.c. | 35 | 35 | 42 | 10 | 1,840 |
| Manufacturing paper and paper products | 74 | 85 | 120 | 12 | 10,986 |
| Printing and publishing newspapers, periodicals, books | 70 | 83 | 102 | 59 | 8,232 |
| Job and general printing | 382 | 395 | 413 | 48 | 7,822 |
| Servicing industries for printing trade printing, publishing, and allied industries n.e.c. | 102,34 | 103,34 | 107,34 | – | 1,177,255 |
| Printing, publishing, and allied industries | 579 | 614 | 656 | 107 | 17,486 |
| Total, paper and paper products, printing and publishing | 644 | 697 | 776 | 119 | 28,472 |
| Basic industrial chemicals except fertilisers | 19 | 20 | 29 | 4 | 521 |
| Chemical fertilisers | 7 | 10 | 15 | 7 | 1064 |
| Pesticides | 7 | 8 | 8 | – | 351 |
| Fertilisers and pesticides n.e.c. | 7 | 7 | 7 | – | 64 |
| Synthetic resins, plastic materials, and man-made fibres (excludes glass) | 48 | 54 | 78 | 18 | 3,118 |
| Manufacturing industrial chemicals | 83 | 99 | 137 | 29 | 5,118 |
| Paints, varnishes, and lacquers | 31 | 31 | 34 | 43 | 1,473 |
| Drugs and medicines | 25 | 25 | 29 | 18 | 1,758 |
| Soap and cleaning preparations | 13 | 13 | 21 | 7 | 1,043 |
| Perfumes, cosmetics, and other toilet preparations | 33 | 35 | 35 | 10 | 1,259 |
| Cleaning preparations n.e.c. | 10 | 10 | 11 | 2 | 324 |
| Ink | 8 | 8 | 15 | 7 | 492 |
| Chemical products n.e.c. | 47 | 47 | 63 | 24 | 1,184 |
| Manufacturing other chemical products | 158 | 166 | 208 | 111 | 7,533 |
| Petroleum refining | 9 | 9 | 13 | 3 | 514 |
| Manufacturing products of petroleum and coal | 11 | 15 | 21 | 4 | 343 |
| Manufacturing rubber tyres and tubes | 18 | 20 | 55 | 44 | 2,842 |
| Rubber products n.e.c. | 26 | 32 | 41 | 8 | 1,911 |
| Manufacturing rubber products | 41 | 50 | 96 | 52 | 4,753 |
| Manufacturing plastic products n.e.c. | 202 | 208 | 227 | 7 | 6,068 |
| Total, chemicals and chemical, petroleum, coal, rubber, and plastic products | 479 | 536 | 702 | 206 | 24 329 |
| Manufacturing pottery, china, and earthenware | 33 | 35 | 36 | 19 | 1,273 |
| Manufacturing glass and glass products | 81 | 82 | 91 | 2 | 2,369 |
| Structural clay products | 15 | 18 | 25 | 2 | 697 |
| Manufacture of cement, lime, and plaster | 6 | 8 | 11 | 8 | 915 |
| Precast concrete | 87 | 93 | 131 | 6 | 1,302 |
| Concrete masonry | 28 | 31 | 53 | 6 | 865 |
| Ready-mixed concrete | 48 | 52 | 95 | 6 | 908 |
| Plaster and fibrous plaster products | 22 | 22 | 26 | – | 380 |
| Monumental masonry and stone masonry | 34 | 34 | 42 | 1 | 242 |
| Non-metallic mineral products n.e.c. | 19 | 21 | 22 | 5 | 933 |
| Manufacturing other non-metallic mineral products | 237 | 270 | 405 | 34 | 6,242 |
| Total, non-metallic mineral products (except petroleum and coal products) | 348 | 386 | 532 | 55 | 9 884 |
| Iron and steel basic industries | 41 | 43 | 47 | 7 | 3,294 |
| Non-ferrous basic metal products | 22 | 25 | 30 | 6 | 2,680 |
| Non-ferrous forgings and castings | 49 | 51 | 51 | 3 | 808 |
| Non-ferrous metal basic industries | 68 | 76 | 81 | 9 | 3,488 |
| Total, basic metal industries | 109 | 119 | 128 | 16 | 6 782 |
| Cutlery and hand tools | 25 | 25 | 28 | 1 | 338 |
| Builders, joiners, etc., hardware | 39 | 40 | 43 | 1 | 1,375 |
| Furniture and fixtures (primarily of metal) | 67 | 70 | 78 | 10 | 1,393 |
| Metal joinery, fixtures, and fittings | 259 | 266 | 283 | 9 | 3,166 |
| Sheet metal roofing and related products | 138 | 139 | 162 | 10 | 2,272 |
| Structural steel, plate metal, and boiler shop products | 159 | 165 | 209 | 20 | 3,956 |
| Wireworking | 57 | 59 | 82 | 3 | 1,558 |
| Nail and fastener manufacturing | 9 | 11 | 13 | 2 | 273 |
| Household and kitchen utensils | 19 | 19 | 19 | 2 | 336 |
| Servicing industries to the metal trades | 126 | 131 | 140 | 4 | 1,281 |
| Fabricated metal products (excludes machinery and equipment n.e.c.) | 293 | 302 | 328 | 25 | 7,193 |
| Manufacturing fabricated metal products, machinery, and equipment | 1,150 | 1,220 | 1,385 | 87 | 23,141 |
| Manufacturing and reconditioning of engines and turbines | 103 | 110 | 136 | 2 | 1,094 |
| Manufacturing agricultural machinery and equipment | 204 | 206 | 223 | 5 | 2,818 |
| Tool, die, and jig making | 76 | 76 | 78 | 3 | 869 |
| Metal and woodworking machinery n.e.c. | 35 | 35 | 35 | 1 | 673 |
| Specialised industrial machinery and equipment (excludes metal and woodworking) | 98 | 99 | 131 | 11 | 3,420 |
| Office, computing, and accounting machinery | 14 | 14 | 42 | 2 | 386 |
| Industrial machinery and equipment (excludes electrical) n.e.c. | 350 | 356 | 443 | 31 | 7,505 |
| Manufacturing machinery (except electrical) | 862 | 891 | 1,088 | 55 | 16,765 |
| Electrical industrial machinery and apparatus | 107 | 115 | 126 | 10 | 2,855 |
| Radio, television, and communication equipment and apparatus | 104 | 106 | 114 | 18 | 4,616 |
| Household durables and ranges | 16 | 18 | 23 | 5 | 3,161 |
| Other electrical appliances and housewares n.e.c. | 27 | 28 | 30 | 4 | 1,204 |
| Electrical cables and wires | 8 | 8 | 10 | 7 | 1,087 |
| Other electrical apparatus and supplies | 61 | 63 | 69 | 12 | 2,657 |
| Manufacturing electrical machinery, apparatus, appliances, and supplies | 305 | 333 | 372 | 56 | 15,580 |
| Ship building and repairing | 140 | 143 | 152 | 1 | 3,162 |
| Motor vehicle assembly plants | 16 | 17 | 26 | 2 | 6,841 |
| Motor vehicle body building, caravans, and trailers | 85 | 87 | 90 | 5 | 1,430 |
| Motor vehicle parts n.e.c. | 78 | 82 | 95 | 2 | 2,963 |
| Aircraft | 23 | 25 | 34 | – | 2,102 |
| Other transport equipment n.e.c. | 24 | 25 | 48 | 1 | 5,569 |
| Manufacturing transport equipment | 359 | 376 | 445 | 11 | 22,067 |
| Medical and surgical equipment and supplies n.e.c. | 12 | 12 | 12 | – | 246 |
| Laboratory, scientific, measuring and controlling equipment, n.e.c. | 22 | 22 | 22 | 3 | 394 |
| Photographic and optical goods | 15 | 16 | 21 | 5 | 435 |
| Manufacturing professional, scientific, measuring and controlling equipment n.e.c, and photographic and optical goods | 48 | 50 | 55 | 8 | 1,075 |
| Total, fabricated metal products, machinery and equipment | 2 659 | 2 853 | 3 345 | 217 | 78 628 |
| Jewellery and related articles | 91 | 92 | 97 | 2 | 787 |
| Musical instruments | 5 | 5 | 6 | – | 55 |
| Sporting and athletic goods | 42 | 43 | 45 | 1 | 427 |
| Brushes and brooms | 11 | 11 | 13 | 6 | 432 |
| Toys and games | 33 | 34 | 35 | 3 | 652 |
| Other manufacturing industries n.e.c. | 110 | 113 | 115 | 8 | 1,497 |
| Other manufacturing industries | 290 | 298 | 311 | 20 | 3,850 |
| Total, other manufacturing industries | 290 | 298 | 311 | 20 | 3 850 |
| Manufacturing (excluding ancillary units servicing more than one industry) | 7,478 | 8,276 | 9,870 | 1,105 | 292,110 |
| Ancillary units servicing more than one industry | 47 | 65 | – | 89 | 4,641 |
| Grand total, manufacturing | 7 478 | 8 282 | 9 870 | 1 194 | 296 751 |
The following table shows additional statistics.
| CENSUS OF MANUFACTURING 1981–82 | ||||
|---|---|---|---|---|
| Industry | Purchases and Operating Expenses | Sales and Other Income | Value Added | Additions to Fixed Tangible Assets |
| $(thousand) | ||||
| Export meat works and abbattoirs | 1,211,950 | 1,254,048 | 636,235 | 93,100 |
| Other abattoirs and rural slaughterhouses | 51,585 | 52,295 | 29,327 | 6,891 |
| Meat packers and canners | 55,904 | 59,876 | 11,652 | 3,025 |
| Ham, bacon, and smallgoods | 150,447 | 153,150 | 29,415 | 3,405 |
| Poultry slaughterhouses | 97,616 | 100,917 | 22,503 | 17,045 |
| Slaughtering, preparing, and preserving meat n.e.c. | 61,684 | 63,627 | 14,211 | 2,598 |
| Co-operative dairy factories | 1,448,618 | 1,479,296 | 218,426 | 192,263 |
| Milk processing plants | 137,459 | 142,084 | −2,908 | 6,858 |
| Icecream factories | 52,670 | 53,562 | 8,580 | 1,609 |
| Manufacture of dairy products n.e.c. | 66,324 | 67,967 | 15,795 | 4,400 |
| Canning and preserving of fruit and vegetables | 194,605 | 195,631 | 56,061 | 7,476 |
| Land-based fish, etc., factories | 161,206 | 164,160 | 38,282 | 7,796 |
| Vegetable and animal oils, and fats | 60,349 | 64,938 | 16,421 | 3,676 |
| Grain milling and prepared breakfast foods | 108,037 | 113,702 | 20,080 | 6,264 |
| Bread bakeries | 177,149 | 189,292 | 53,680 | 8,982 |
| Cake, pastry, and pie (other than meat) factories | 31,455 | 33,517 | 12,460 | 2,896 |
| Cake and pastry kitchens | 38,365 | 43,981 | 18,305 | 2,682 |
| Biscuit factories | 46,156 | 54,746 | 19,444 | * |
| Uncooked pasta products and pastry | 2,621 | 3,117 | 1,139 | * |
| Sugar, cocoa, chocolate, and sugar confectionery | 242,053 | 264,609 | 62,742 | 6,154 |
| Food products n.e.c. | 260,955 | 277,807 | 67,931 | 9,919 |
| Prepared animal feeds | 153,348 | 158,171 | 24,032 | 2,766 |
| Food manufacturing | 4,810,557 | 4,990,495 | 1,373,811 | 392,300 |
| Distilling, rectifying, and blending spirits | 18,083 | 20,091 | 4,553 | * |
| Wine | 86,216 | 86,273 | 28,535 | 14,268 |
| Brewing and malting, and tobacco manufacturing | 288,466 | 323,385 | 110,415 | * |
| Soft drinks | 79,893 | 82,830 | 23,116 | 5,169 |
| Beverage and tobacco manufacturing | 72,657 | 512,579 | 166,619 | 32,398 |
| Total, food, beverage, and tobacco manufacturing | 5,283,214 | 5,503,074 | 1,540,430 | 424,698 |
| Wool scouring | 98,635 | 102,288 | 27,038 | 7,203 |
| Woollen fibres, spinning, and weaving | 158,442 | 163,744 | 59,399 | 5,757 |
| Man-made fibres, spinning, and weaving | 19,598 | 21,767 | 9,729 | 530 |
| Dyeing, printing and finishing yarns, and textiles | 13,060 | 13,988 | 5,399 | 959 |
| Canvas goods and similar articles of other fabrics | 38,316 | 40,640 | 14,749 | 837 |
| Other made-up textile goods | 79,593 | 89,348 | 27,777 | 2,632 |
| Knitting mills | 170,998 | 186,894 | 72,895 | 8,371 |
| Carpets and rugs | 140,589 | 152,625 | 42,858 | 3,041 |
| Textiles n.e.c. including cordage, rope and twine | 36,130 | 41,797 | 12,883 | 1,608 |
| Manufacturing textiles | 755,361 | 813,090 | 272,728 | 30,939 |
| Leather gloves and clothing | 22,218 | 21,491 | 7,135 | 671 |
| Natural and artificial fur clothing | 4,631 | 5,162 | 1,830 | 180 |
| Clothing other than leather and fur | 444,024 | 466,663 | 210,723 | 11,040 |
| Manufacturing clothing (except footwear) | 470,873 | 493,316 | 219,688 | 11,891 |
| Tanneries and leather finishing | 104,592 | 107,775 | 29,337 | 5,575 |
| Fellmongery | 10,853 | 12,447 | 3,135 | 167 |
| Fur dressing and dyeing, fur and skin articles n.e.c. | 8,214 | 7,933 | 2,408 | 273 |
| Leather and leather substitute products (excludes footwear and clothing) | 45,713 | 49,551 | 19,323 | 1,037 |
| Manufacturing leather and products of leather, leather substitutes and fur (except footwear and clothing) | 169,372 | 177,705 | 54,203 | 7,052 |
| Footwear (except rubber, plastic, or wooden) | 159,427 | 165,539 | 66,038 | 2,835 |
| Total, textile, wearing apparel, leather industries | 1,555,034 | 1,649,651 | 612,657 | 52,716 |
| Sawmills | 327,504 | 355,496 | 121,236 | 18,350 |
| Planing, preserving, and seasoning timber | 93,255 | 100,554 | 29,990 | 4,251 |
| Builders carpentry and builders joinery | 125,434 | 137,196 | 49,789 | 4,856 |
| Prefabricated and precut buildings | 67,577 | 71,689 | 17,536 | 1,069 |
| Plywood, veneer, and board | 114,951 | 123,605 | 39,724 | 6,637 |
| Sawmills, planing, and other wood mills n.e.c. | 31,844 | 34,249 | 9,393 | 1,620 |
| Wooden and cane containers, small caneware | 22,805 | 24,684 | 6,597 | 417 |
| Cork products and wood products n.e.c. | 37,539 | 40,980 | 15,151 | 1,549 |
| Manufacturing wood and wood and cork products (except furniture) | 821,009 | 888,453 | 289,416 | 38,749 |
| Wooden furniture and upholstery | 227,181 | 242,035 | 95,756 | 8,957 |
| Mattress making | 22,144 | 23,672 | 6,406 | 497 |
| Furniture and fixtures (excludes furniture manufactured primarily out of metal n.e.c.) | 13,086 | 13,678 | 3,800 | 353 |
| Manufacturing furniture and fixtures (excludes furniture manufactured primarily of metal) | 262,411 | 279,385 | 105,962 | 9,808 |
| Total, wood and wood products (including furniture) | 1,083,420 | 1,167,838 | 395,378 | 48,556 |
| Pulp, paper, and paperboard | 703,383 | 776,837 | 192,903 | 40,156 |
| Corrugated board, paperboard and corrugated board boxes, cases, containers, and boxes of paper and paperboard n.e.c. | 194,430 | 217,214 | 64,354 | 8,179 |
| 39,013 | 44,108 | 10,269 | 3,747 | |
| Wallpaper factories | 21,488 | 24,999 | 10,622 | 2,702 |
| Pub, paper, and paperboard articles n.e.c. | 152,624 | 167,564 | 52,946 | 5,181 |
| Manufacturing paper and paper products | 1,110,938 | 1,230,723 | 331,094 | 59,965 |
| Printing and publishing newspapers, periodicals, and books | 312,081 | 348,236 | 187,632 | 20,317 |
| Job and general printing | 307,478 | 333,699 | 141,624 | 22,381 |
| Servicing industries for printing trade | 33,336 | 37,573 | 20,650 | 3,750 |
| Printing, publishing, and allied industries n.e.c. | 7,595 | 8,580 | 3,628 | 477 |
| Printing, publishing, and allied industries | 660,490 | 728,088 | 353,534 | 46,925 |
| Total, paper and paper products, printing and publishing | 1,771,428 | 1,958,810 | 684,629 | 106,890 |
| Basic industrial chemicals except fertilisers | 52,649 | 50,585 | 16,354 | 59,555 |
| Chemical fertilisers | 230,316 | 245,530 | 41,502 | 39,889 |
| Pesticides | 29,357 | 28,258 | 8,922 | * |
| Fertilisers and pesticides n.e.c. | 8,939 | 7,989 | 991 | * |
| Synthetic resins, plastic materials, man-made fibres (excludes glass) | 284,436 | 300,075 | 83,578 | 11,009 |
| Manufacturing industrial chemicals | 605,696 | 632,437 | 151,347 | 111,260 |
| Paints, varnishes, and lacquers | 129,630 | 140,878 | 39,483 | 2,636 |
| Drugs and medicines | 145,536 | 146,319 | 36,534 | 5,458 |
| Soap and cleaning preparations | 104,059 | 106,734 | 28,977 | 2,820 |
| Perfumes, cosmetics, and other toilet preparations | 68,777 | 73,337 | 25,500 | 2,685 |
| Cleaning preparations n.e.c. | 25,629 | 26,850 | 7,264 | 1,031 |
| Ink | 37,996 | 38,893 | 10,694 | 1,262 |
| Chemical products n.e.c. | 106,068 | 109,916 | 27,991 | 4,509 |
| Manufacturing other chemical products | 617,695 | 642,927 | 176,443 | 20,399 |
| Petroleum refining | 84,864 | 114,869 | 39,783 | 80,899 |
| Manufacturing products of petroleum and coal | 31,716 | 35,714 | 9,701 | 1,826 |
| Manufacturing rubber tyres and tubes | 160,356 | 174,816 | 67,777 | 6,517 |
| Rubber products n.e.c. | 89,897 | 91,364 | 37,768 | 1,981 |
| Manufacturing rubber products | 250,253 | 266,181 | 105,545 | 8,498 |
| Manufacturing plastic products n.e.c. | 306,998 | 326,800 | 123,114 | 19,626 |
| Total, chemicals and chemical, petroleum, coal, rubber, and plastic products | 1,897,222 | 2,018,927 | 605,934 | 242,508 |
| Manufacturing pottery, china, and earthenware | 30,652 | 33,178 | 18,414 | 2,114 |
| Manufacturing glass and glass products | 134,457 | 142,472 | 59,541 | 5,270 |
| Structural clay products | 28,189 | 32,624 | 14,541 | 1,553 |
| Manufacture of cement, lime, and plaster | 63,941 | 77,223 | 31,938 | 29,203 |
| Precast concrete | 61,137 | 67,444 | 23,328 | 3,006 |
| Concrete masonry | 67,603 | 72,394 | 14,659 | 1,619 |
| Ready-mixed concrete | 92,819 | 101,092 | 20,867 | 6,902 |
| Plaster and fibrous plaster products | 29,178 | 33,822 | 11,201 | 448 |
| Monumental masonry and stone masonry | 7,169 | 8,460 | 3,192 | 566 |
| Non-metallic mineral products n.e.c. | 48,080 | 63,270 | 29,042 | 6,394 |
| Manufacturing other non-metallic mineral products | 398,117 | 456,329 | 148,768 | 49,690 |
| Total, non-metallic mineral products (excludes products of petroleum and coal) | 563,227 | 631,980 | 226,723 | 57,075 |
| Iron and steel basic industries | 358,497 | 386,056 | 108,518 | 40,932 |
| Non-ferrous basic metal products | 274,017 | 273,710 | 89,425 | 78,160 |
| Non-ferrous forgings and castings | 56,382 | 58,051 | 16,394 | 2,498 |
| Non-ferrous metal basic industries | 330,400 | 331,761 | 105,819 | 80,659 |
| Total, basic metal industries | 688,896 | 717,817 | 214,338 | 121,591 |
| Cutlery and hand tools | 12,757 | 15,083 | 6,654 | 1,073 |
| Builders, joiners, etc., hardware | 58,098 | 62,565 | 25,887 | 2,770 |
| Furniture and fixtures (primarily of metal) | 64,366 | 67,294 | 25,614 | 1,788 |
| Metal joinery, fixtures, and fittings | 163,087 | 175,514 | 52,050 | 4,766 |
| Sheet metal roofing and related products | 163,296 | 172,187 | 45,372 | 5,438 |
| Structural steel, plate metal, and boiler shop products | 196,312 | 205,169 | 73,035 | 6,561 |
| Wireworking | 121,244 | 127,483 | 31,104 | 4,117 |
| Nail and fastener manufacturing | 25,114 | 27,939 | 7,896 | 1,042 |
| Household and kitchen utensils | 11,591 | 13,520 | 5,734 | 289 |
| Servicing industries to the metal trades | 37,675 | 41,979 | 20,506 | 3,509 |
| Fabricated metal products (excludes machinery and equipment n.e.c.) | 372,671 | 405,029 | 151,493 | 26,794 |
| Manufacturing fabricated metal products, machinery, and equipment | 1,226,211 | 1,313,762 | 445,349 | 58,145 |
| Manufacturing and reconditioning engines and turbines | 44,024 | 46,672 | 17,644 | 2,437 |
| Manufacturing agricultural machinery and equipment | 141,597 | 146,484 | 48,083 | 5,105 |
| Tool, die, and jig making | 24,898 | 26,436 | 13,153 | 1,635 |
| Metal and woodworking machinery n.e.c. | 27,437 | 28,564 | 11,378 | 801 |
| Specialised industrial machinery and equipment (excludes metal and woodworking machinery) | 198,047 | 206,361 | 68,944 | 5,463 |
| Office, computing, and accounting machinery | 22,591 | 21,579 | 7,554 | 936 |
| Industrial machinery and equipment (excludes electrical) n.e.c. | 365,117 | 374,189 | 128,525 | 11,894 |
| Manufacturing machinery (excludes electrical) | 823,712 | 850,284 | 295,280 | 28,271 |
| Electrical industrial machinery, and apparatus | 123,580 | 128,645 | 52,100 | 4,799 |
| Radio, television, and communication equipment, and apparatus | 249,725 | 258,064 | 80,498 | 6,576 |
| Household durables and ranges | 184,476 | 189,172 | 61,826 | 7,736 |
| Other electrical appliances and housewares n.e.c. | 51,553 | 54,741 | 17,880 | 2,171 |
| Electrical cables and wires | 84,066 | 92,346 | 29,492 | 3,307 |
| Other electrical apparatus and supplies | 138,262 | 139,863 | 51,522 | 5,725 |
| Manufacturing electrical machinery, apparatus, appliances, and supplies | 831,664 | 862,830 | 293,317 | 30,314 |
| Ship building and repairing | 95,161 | 95,681 | 47,263 | 2,548 |
| Motor vehicle assembly plants | 777,775 | 761,411 | 134,444 | 11,873 |
| Motor vehicle body building, caravans, and trailers | 70,054 | 70,883 | 22,476 | 2,760 |
| Motor vehicle parts n.e.c. | 125,990 | 138,743 | 53,016 | 7,081 |
| Aircraft | 137,394 | 115,399 | 56,674 | 16,145 |
| Other transport equipment n.e.c. | 141,988 | 146,296 | 79,248 | 6,369 |
| Manufacturing transport equipment | 1,348,362 | 1,328,414 | 393,121 | 46,776 |
| Medical and surgical equipment and supplies n.e.c. | 11,589 | 12,544 | 4,051 | 350 |
| Laboratory, scientific, measuring and controlling equipment n.e.c. | 13,211 | 13,127 | 5,571 | 407 |
| Photographic and optical goods | 17,134 | 18,455 | 7,469 | 416 |
| Manufacturing professional, scientific, measuring and controlling equipment n.e.c, and photographic and optical goods | 41,934 | 44,125 | 17,091 | 1,172 |
| Total, fabricated metal products, machinery and equipment | 4,271,883 | 4,399,417 | 1,444,158 | 164,678 |
| Jewellery and related articles | 31,905 | 34,967 | 11,903 | 1,534 |
| Musical instruments | 2,787 | 2,623 | 757 | * |
| Sporting and athletic goods | 15,902 | 17,140 | 5,858 | * |
| Brushes and brooms | 17,058 | 17,004 | 6,512 | 1,016 |
| Toys and games | 25,718 | 27,240 | 9,616 | 607 |
| Other manufacturing industries n.e.c. | 47,840 | 54,032 | 22,596 | 1,706 |
| Other manufacturing industries | 141,210 | 153,006 | 57,243 | 5,302 |
| Total, other manufacturing industries | 141,210 | 153,006 | 57,243 | 5,302 |
| Manufacturing, excluding ancillary units servicing more than one industry | 17,255,534 | 18,200,521 | 5,781,488 | 1,224,014 |
| Ancillary units servicing more than one industry | 320,188 | 181,842 | 97,076 | 24,094 |
| Grand total, manufacturing | 17,575,722 | 18,382,363 | 5,878,564 | 1,248,108 |
GEOGRAPHICAL DISTRIBUTION OF MANUFACTURING INDUSTRY—The following tables show the distribution of the manufacturing industry by statistical area in 1981–82. The tables illustrate the high degree of concentration of industry in the 4 main centres and very noticeably in the Central Auckland and South Auckland-Bay of Plenty Statistical Areas.
| Statistical Area | Enterprise Groups | Enterprises | Location Units | Persons Engaged at 28 February | |
|---|---|---|---|---|---|
| Establishments | Ancillary Units | ||||
| Number | |||||
| Northland | 217 | 229 | 230 | 31 | 5,932 |
| Central Auckland | 3,098 | 3,414 | 3,622 | 401 | 105,461 |
| South Auckland-Bay of Plenty | 1,045 | 1,118 | 1,232 | 129 | 35,056 |
| East Coast | 75 | 79 | 78 | 7 | 3,164 |
| Hawke's Bay | 321 | 339 | 360 | 48 | 13,697 |
| Taranaki | 228 | 240 | 259 | 23 | 8,544 |
| Wellington | 1,365 | 1,508 | 1,581 | 255 | 49,178 |
| Total, North Island | 5,747 | 6,324 | 7,362 | 894 | 221,032 |
| Marlborough | 80 | 84 | 98 | 9 | 2,001 |
| Nelson | 179 | 189 | 211 | 17 | 5,018 |
| Westland | 62 | 67 | 66 | 6 | 1,392 |
| Canterbury | 1,277 | 1,415 | 1,441 | 178 | 41,487 |
| Otago | 388 | 417 | 435 | 69 | 14,820 |
| Southland | 232 | 248 | 257 | 21 | 11,001 |
| Total, South Island | 2,030 | 2,252 | 2,508 | 300 | 75,719 |
| Total, New Zealand | 7 478 | 8 282 | 9 870 | 1 194 | 296 751 |
Additional financial statistics of manufacturing by statistical area during 1981–82 are shown in the following table.
| Statistical Area | Total Purchases and Operating Expenses | Total Sales and Other Income | Value Added | Additions to Fixed Tangible Assets |
|---|---|---|---|---|
| $(thousand) | ||||
| Northland | 400,743 | 439,387 | 137,314 | 130,937 |
| Central Auckland | 6,390,867 | 6,625,322 | 2,111,382 | 305,308 |
| South Auckland-Bay of Plenty | 2,645,588 | 2,782,314 | 757,134 | 249,209 |
| East Coast | 121,041 | 137,729 | 55,931 | 9,049 |
| Hawke's Bay | 798,932 | 819,984 | 263,566 | 65,964 |
| Taranaki | 675,108 | 682,538 | 180,460 | 123,863 |
| Wellington | 2,849,032 | 2,951,871 | 944,246 | 102,515 |
| Total, North Island | 13,881,310 | 14,439,145 | 4,450,034 | 986,844 |
| Marlborough | 80,870 | 85,404 | 29,957 | 14,780 |
| Nelson | 265,385 | 274,724 | 91,149 | 12,271 |
| Westland | 71,250 | 74,279 | 24,359 | 2,656 |
| Canterbury | 1,949,320 | 2,107,268 | 772,459 | 94,581 |
| Otago | 651,336 | 702,707 | 268,557 | 33,726 |
| Southland | 676,250 | 698,836 | 242,049 | 103,250 |
| Total. South Island | 3,694,412 | 3,943,218 | 1,428,530 | 261,264 |
| Total, New Zealand | 17,575,722 | 18,382,363 | 5,878,564 | 1,248,108 |
A similar summary of manufacturing during 1981–82 is given by employment districts in the following table.
| Employment District | Enterprise Groups | Enterprises | Location Units | Persons Engaged at 28 February | |
|---|---|---|---|---|---|
| Establishments | Ancillary Units | ||||
| Number | |||||
| Whangarei | 217 | 229 | 230 | 31 | 5,932 |
| Auckland | 2,493 | 2,720 | 2,839 | 338 | 75,171 |
| Manukau | 708 | 768 | 783 | 63 | 30,290 |
| Hamilton | 613 | 648 | 666 | 81 | 17,026 |
| Rotorua | 268 | 287 | 309 | 33 | 13,588 |
| Tauranga | 239 | 249 | 259 | 15 | 4,452 |
| Gisborne | 75 | 79 | 78 | 7 | 3,164 |
| Napier | 158 | 170 | 169 | 25 | 4,343 |
| Hastings | 155 | 160 | 162 | 21 | 8,969 |
| New Plymouth | 221 | 233 | 250 | 23 | 7,643 |
| Wanganui | 147 | 158 | 172 | 9 | 5,818 |
| Palmerston North | 370 | 404 | 406 | 45 | 11,492 |
| Masterton | 117 | 120 | 126 | 5 | 3,642 |
| Lower Hutt | 405 | 443 | 424 | 76 | 16,625 |
| Wellington | 516 | 547 | 489 | 122 | 12,877 |
| Total. North Island | 5,747 | 6,324 | 7,362 | 894 | 221,032 |
| Blenheim | 80 | 84 | 98 | 9 | 2,001 |
| Nelson | 154 | 161 | 179 | 14 | 4,224 |
| Greymouth | 85 | 92 | 98 | 9 | 2,186 |
| Christchurch | 1,171 | 1,294 | 1,294 | 168 | 37,491 |
| Timaru | 132 | 143 | 147 | 10 | 3,996 |
| Dunedin | 388 | 417 | 435 | 69 | 14,820 |
| Invercargill | 232 | 248 | 257 | 21 | 11,001 |
| Total, South Island | 2,030 | 2,252 | 2,508 | 300 | 75,719 |
| Total. New Zealand | 7 478 | 8 282 | 9 870 | 1 194 | 296 751 |
Additional financial statistics of manufacturing during 1981–82 are shown by employment districts in the following table.
| Industry | Purchases and Operating Expenses | Sales and Other Income | Value Added | Additions to Fixed Tangible Assets |
|---|---|---|---|---|
| $(thousand) | ||||
| Whangarei | 400,743 | 439,387 | 137,314 | 130,937 |
| Auckland | 4,330,304 | 4,455,800 | 1,462,550 | 183,723 |
| Manukau | 2,060,562 | 2,169,522 | 648,831 | 121,585 |
| Hamilton | 1,247,210 | 1,321,509 | 332,375 | 157,010 |
| Rotorua | 1,128,317 | 1,170,628 | 341,510 | 77,772 |
| Tauranga | 270,239 | 290,364 | 83,362 | 14,447 |
| Gisborne | 121,041 | 137,729 | 55,931 | 9,049 |
| Napier | 275,895 | 301,432 | 110,042 | 13,377 |
| Hastings | 487,836 | 477,827 | 147,056 | 38,592 |
| New Plymouth | 631,294 | 640,335 | 167,197 | 122,611 |
| Wanganui | 287,844 | 283,231 | 96,726 | 14,303 |
| Palmerston North | 630,827 | 663,539 | 214,365 | 40,961 |
| Masterton | 157,985 | 164,440 | 66,515 | 7,906 |
| Lower Hutt | 1,135,548 | 1,186,818 | 338,944 | 30,303 |
| Wellington | 715,664 | 736,582 | 247,315 | 24,267 |
| Total, North Island | 13,881,310 | 14,439,145 | 4,450,034 | 986,844 |
| Blenheim | 80,870 | 85,404 | 29,957 | 14,780 |
| Nelson | 228,747 | 233,842 | 74,236 | 11,573 |
| Greymouth | 107,889 | 115,161 | 41,272 | 3,354 |
| Christchurch | 1,771,538 | 1,906,046 | 691,802 | 85,896 |
| Timaru | 177,782 | 201,222 | 80,657 | 8,685 |
| Dunedin | 651,336 | 702,707 | 268,557 | 33,726 |
| Invercargill | 676,250 | 698,836 | 242,049 | 103,250 |
| Total, South Island | 3,694,412 | 3,943,218 | 1,428,530 | 261,264 |
| Total, New Zealand | 17,575,722 | 18,382,363 | 5,878,564 | 1,248,108 |
NOTE—For further information on the 1981–82 Census of Manufacturing, refer to the 1981–82 Census of Manufacturing volume, and the 1981–82 Census of Manufacturing bulletins, series C.
PRODUCTION OF SELECTED GOODS—The following table shows the volume of production of selected goods. It should be noted that the figures refer to December years (except where otherwise stated) and not to production years as in most tables in this section. Quarterly or (in some cases) monthly production figures for these commodities will be found in the Monthly Abstract of Statistics, published by the Department of Statistics.
| Commodity | Unit | 1981 | 1982 | 1983 |
|---|---|---|---|---|
* Publication of figures discontinued to avoid disclosure of confidential information. †Includes knitted dresses. ‡Excludes gumboots and thongs. §See also Section 15A Farming (General) and Section 25 Consumption of Food. ||Year ended May. ¶From June 1980 includes infant and dietary foods. ** Year ended June. †† From April 1980 figures represent beer produced for sale. ‡‡ Figures related only to operations of superphosphate manufacturing works. §§Provisional. | ||||
| Deep freeze, display cabinets, etc. | No. | 81,731 | 69,015 | * |
| Electric ranges and rangettes | No. | 54,789 | 55,966 | 57,203 |
| Lawn mowers | No. | 91,575 | 98,682 | 63,973 |
| Television sets | No. | 126,311 | 129,786 | 99,556 |
| Records | No. (000) | 5,901 | 6,297 | 6,805 |
| Cassette tapes (prerecorded) | No. (000) | 2,906 | 3,158 | 3,545 |
| Cassette tapes (blank) | No. (000) | 1,411 | 1,330 | 1,427 |
| Textiles and Clothing— | ||||
| Woollen and worsted yarn | tonnes | 19,595 | 20,207 | 19,307 |
| Piece goods | sq metres (000) | 2,733 | 3,192 | 2,765 |
| Carpets | sq metres (000) | 9,069 | 10,091 | 8,924 |
| Women's and girls'— | ||||
| Underpants and briefs | (000) | 5,575 | 6,048 | 5,822 |
| Nightwear | (000) | 1,853 | 2,231 | 1,529 |
| Pantyhose | prs (000) | 12,984 | 12,660 | 16,105 |
| Other hosiery | prs (000) | 2,443 | 2,339 | 2,296 |
| Cardigans, pullovers, and jerseys | (000) | 2 778.5 | 2 427.0 | 1 918.1 |
| Skirts | (000) | 1 671.4 | 1 512.2 | 1 656.2 |
| Slacks and jeans | (000) | 2 132.9 | 2 483.1 | 2 409.2 |
| Dresses† | (000) | 2 089.5 | 1 976.4 | 2 001.1 |
| Blouses and shirts | (000) | 2 033.5 | 2 057.9 | 1 899.0 |
| Men's and boys'— | ||||
| Underpants and briefs | (000) | 3,201 | 3,737 | 3,363 |
| Nightwear | (000) | 690 | 686 | 526 |
| Hosiery | prs (000) | 5,130 | 5,825 | 5,610 |
| Cardigans, jerseys, and pullovers | (000) | 1 582.2 | 1 569.7 | 1 703.3 |
| Trousers and jeans | (000) | 3 376.8 | 3 461.3 | 3 896.2 |
| Shorts | (000) | 2 215.4 | 2 552.3 | 2 228.2 |
| Shirts | (000) | 6,037 | 6,889 | 6,231 |
| Footwear (total)‡ | prs (000) | 7,152 | 7,552 | 7,433 |
| Foodstuffs§ | ||||
| White milk sales subject to subsidy | litres (million) | 367.4x | 361.0 | 352.1 |
| Butter || | tonnes (000) | 264.9 | 247.1 | 254.0 |
| Cheese || | tonnes (000) | 84.3 | 110.9 | 114.4 |
| Skim-milk powder || | tonnes (000) | 181.0 | 194.0 | 164.6 |
| Powdered whole milk§||¶ | tonnes (000) | 100.2 | 114.5 | 117.8 |
| Casein || | tonnes (000) | 59.6 | 47.0 | 65.1 |
| Flour | tonnes (000) | 223.6 | 221.0 | 220.1 |
| Wheatmeal and wholemeal | tonnes (000) | 5.7 | 6.4 | 8.0 |
| Refined sugar | tonnes (000) | 125.0 | 121.0 | 118.3 |
| Prepared dry cereal foods | tonnes (000) | 20.1 | 20.2 | 21.0 |
| Biscuits | tonnes (000) | 25.7 | 27.5 | 30.5 |
| Jam** | tonnes (000) | 6.5 | 5.5 | 6.0 |
| Fruit (canned, bottled, or dehydrated)” | tonnes (000) | 24.1 | 21.5 | 18.4 |
| Ice cream | litres (million) | 53.5 | 51.3 | 50.1 |
| Beer†† | litres (million) | 382.6 | 376.0 | 368.0 |
| Carbonated drinks | litres (million) | 102.8 | 106.8 | 104.0 |
| Vegetables (canned, bottled, or dehydrated)** | tonnes (000) | 25.2 | 27.4 | 24.2 |
| Chocolate confectionery | tonnes (000) | 10.9 | 12.1x | 12.7 |
| Sugar confectionery | tonnes (000) | 10.3 | 9.9 | 11.2 |
| Transport— | ||||
| Passenger cars (up to 2000c.c.) | No. | 90,024 | 82,853 | * |
| Passenger cars (over 2000c.c.) | No. | 5,434 | 4,177 | * |
| Trucks, vans, and buses | No. | 20,133 | 24,217 | 19,030 |
| Tyres | No. (000) | 1 583.4 | 1 737.3 | 1 235.8 |
| Tubes | No. (000) | 981.2 | 965.2 | 857.7 |
| Miscellaneous— | ||||
| Paper | tonnes (000) | 711.2 | 702.6x | 668.7 |
| Wood pulp | tonnes (000) | 1 150.5x | 1 039.4x | 1 073.2 |
| Chemical fertilisers‡‡ | tonnes (000) | 1 991x | 1 757x | 1 664§§ |
| Cigarettes | million | 6 168x | 6 112x | 6,089 |
QUARTERLY ECONOMIC SURVEY OF MANUFACTURING—In 1974–75 the Department of Statistics introduced an enterprise-based economic Census of Manufacturing. Following completion of the first 2 annual censuses on the new basis, a quarterly survey of the main indicators for the manufacturing sector was developed, and this commenced with the June 1977 quarter.
The survey replaced the previous short-term survey of manufacturers' stocks (now discontinued) and was designed to provide rapidly more comprehensive economic indicators for the use of the Government, trade organisations, and business people, as well as providing data for use in the quarterly national accounts. With the co-operation of manufacturers, and because the survey is a sample one only, it is possible to publish results in a much more timely manner than is possible in the case of a full census.
The survey, which is a sample one, is based on approximately 1500 firms selected from the 1979 Census of Manufacturing. It was revised in June 1982. All manufacturing divisions of the New Zealand Standard Industrial Classification are represented. Allowance is made in the survey for the opening of new factories and the closure of established ones.
In order to provide a consistent long-term historical series, figures have been revised back to 1977 to conform to the new survey coverage.
Sales of Goods, Services, and all other income—This is the actual value of sales (whether in New Zealand or overseas) and all other income during the quarter. It includes sales of goods without processing or assembly, processing of other firms' materials, and all other income except direct Government cash grants, subsidies, interest, dividends, royalties, patent fees, and insurance claims received.
Stocks—Stocks are as at the end of each quarter. They are grouped under 2 headings:
Stocks of materials includes components, stores, fuels, containers, and other packaging materials.
Stocks of finished goods and work in progress. This section also includes goods purchased for resale without further processing.
Additions to Fixed Assets—This includes the purchase of new and secondhand fixed assets and the cost of work done by a firm's own employees, in producing, constructing and installing fixed assets for its own use. The revised survey extends the coverage of statistics to include additions to fixed assets of non-operating units.
Salaries and Wages—This is the gross salaries and wages of all employees (full-time, part-time, and casual) during the quarter. It does not include drawings of working partners.
Purchases and Other Operating Expenses—This figure includes the value of purchases of all materials, components, supplies, containers and other packaging materials, fuels, electricity, and water. It also includes payments for commission and contract services, purchases for resale without processing or assembly, and all other operating expenses except interest, bad debts, donations, royalties, and patent fees paid.
Hours Worked—Hours worked during the quarter relate to paid employees only and include overtime hours.
All-industry totals for a series of quarters are shown in the following table. Annual figures (where given) are for the year ended 31 March. Stocks are as at the end of each period.
| Period | Sales and Other Income | Stocks | Additions to Fixed Assets | |
|---|---|---|---|---|
| Materials | Finished Goods* | |||
* Includes work in progress. †Includes other operating expenses except interest, bad debts, and donations. | ||||
| March year— | $(million) | |||
| 1982 | 18,936.9 | 1,716.6 | 1,595.3 | 1,383.3x |
| 1983 | 20,660.6 | 1,845.2 | 1,714.6 | 2,323.8 |
| 1984 | 21,896.4 | 1,923.1 | 1,630.6 | 2,430.0 |
| Quarter— | ||||
| 1983—Mar | 4,889.8 | 1,845.2 | 1,714.6 | 669.3 |
| Jun | 5,139.6 | 1,767.4 | 1,670.0 | 609.7 |
| Sep | 5,154.1 | 1,746.7 | 1,642.3 | 501.6 |
| Dec | 5,776.6 | 1,838.5 | 1,560.9 | 718.0 |
| 1984—Mar | 5,826.0 | 1,923.1 | 1,630.6 | 600.8 |
| Period | Salaries and Wages | Purchases and Other Operating Expenses† | Hours Worked |
|---|---|---|---|
* Includes work in progress. †Includes other operating expenses except interest, bad debts, and donations. | |||
| March year— | $(m) | $(m) | (000) |
| 1982 | 3,931.7 | 13,886.5 | 540,639 |
| 1983 | 4,270.4 | 15,135.8 | 533,302 |
| 1984 | 4,179.1 | 15,872.1 | 511,055 |
| Quarter— | |||
| 1983—Mar | 1,033.1 | 3,450.6 | 123,797 |
| Jun | 1,073.8 | 3,617.8 | 129,414 |
| Sep | 982.6 | 3,790.8 | 124,800 |
| Dec | 1,060.5 | 4,169.2 | 128,579 |
| 1984—Mar | 1,062.3 | 4,294.3 | 128,262 |
The following table gives an analysis of the quarterly economic survey of manufacturing by industry divisions for the year ended 31 March 1983. The industry divisions are in accordance with the New Zealand Standard Industrial Classification. 'Primary food' covers the processing of meat and dairy products.
| Industry Division | Sales and Other Income | Stocks | Additions to Fixed Assets | |
|---|---|---|---|---|
| Materials | Finished Goods* | |||
| * Includes work in progress. | ||||
| $(thousand) | ||||
| Primary food | 3,966,483 | 94,316 | 179,321 | 277,674 |
| Other food | 2,527,496 | 245,041 | 243,532 | 116,136 |
| Textiles, clothing | 1,886,404 | 181,488 | 178,387 | 56,298 |
| Wood and furniture | 1,293,645 | 94,707 | 135,191 | 46,087 |
| Paper and printing | 2,122,240 | 163,702 | 140,034 | 149,939 |
| Chemical | 2,269,054 | 269,216 | 230,191 | 1,158,753 |
| Non-metallic mineral | 725,825 | 45,785 | 51,371 | 69,971 |
| Basic metal | 830,587 | 95,144 | 64,678 | 314,374 |
| Fabricated metal | 4,829,173 | 631,276 | 469,266 | 127,899 |
| Other manufacturing industries | 209,716 | 24,550 | 22,629 | 6,692 |
| Total, all industries | 20,660,623 | 1,845,225 | 1,714,600 | 2,323,823 |
| Industry Division | Salaries and wages | Purchases and other Operating Expenses | Hours Working |
|---|---|---|---|
| * Includes work in progress. | |||
| $(000) | $(000) | $(000) | |
| Primary food | 857,342 | 2,818,343 | 86,040 |
| Other food | 354,713 | 1,971,113 | 49,534 |
| Textiles, clothing | 460,707 | 1,250,713 | 72,995 |
| Wood and furniture | 320,670 | 931,706 | 43,429 |
| Paper and printing | 489,997 | 1,445,863 | 56,581 |
| Chemical | 387,908 | 1,742,528 | 47,967 |
| Non-metallic mineral | 152,436 | 488,394 | 18,822 |
| Basic metal | 139,270 | 611,991 | 13,423 |
| Fabricated metal | 1,062,412 | 3,721,781 | 137,253 |
| Other manufacturing industries | 44,923 | 153,374 | 7,256 |
| Total, all industries | 4,270,379 | 15,135,806 | 533 302 |
SOURCES OF INFORMATION—The results of recent Censuses of Manufacturing have been published in a series of bulletins covering individual statistical areas and individual industries. These are available from the Department of Statistics. Other information on manufacturing industries will be found in the following publications:
Monthly Abstract of Statistics.
Department of Statistics.
Census of Manufacturing 1978–79 (Volume)—Department of Statistics.
Census of Manufacturing 1981–82 (Volume)—Department of Statistics.
Report of the Department of Trade and Industry (Parl. paper G. 14).
Pocket Digest of Statistics.
The Department of Trade and Industry is also responsible for a number of relevant periodicals.
Table of Contents
During the year ended March 1983 the demand for new houses and flats continued to decrease. Building permits issued for new houses and flats totalled 15 999 compared with 19 006 during the previous March year and the peak of 34 300 during the 1974–75 March year. A total of 14 800 new houses and flats were completed during 1982–83 compared with 16 300 during the previous year. The decrease was entirely in private and local body completions. The number of State rental dwellings built for the Housing Corporation has continued to fall sharply in the last 2 years. Only 298 were completed during 1982–83 and 267 during 1981–82, compared with 825 during 1980–81 and 1173 during 1979–80.
The number of alterations and additions to dwellings has steadily increased. The indications are that the number of people adding to or altering existing homes, rather than taking out permits to build new dwellings, has increased in recent years. In 1978–79, 49 906 permits valued at $138.7 million were issued for alterations and additions to dwellings. The number and value have increased to 64 347 and $294.0 million for 1982–83.
Although the housing position as measured by the traditional indicators appeared to be improving in 1981–82, the Housing Corporation pointed out in a review of the situation in its Annual Report that there were signs that an increasing number of households were facing problems over housing. The number of people applying for state rental units was increasing while the turnover of tenancies was declining. In addition, local authorities and social service groups were reporting growing numbers of calls from people looking for affordable housing or seeking financial and material assistance to enable them to meet existing housing commitments.
A number of factors were contributing to current housing problems. Among the main ones were:
Changes in the geographical distribution of the population—Results from the 1981 Census of Population and Dwellings indicated a continued movement of population towards the northern part of the North Island and particularly towards the Auckland area.
Between the censuses of 1976 and 1981, when the total population of New Zealand rose by 46 354 (incidentally by far the smallest intercensal increase recorded during this century), nearly 70 percent of the increase (32 113 out of the 46 354) was in the population of Auckland Statistical Division. The population of the second and third largest statistical divisions—Wellington and Christchurch—fell by 5 646 and 3 990 respectively. Urbanisation, the drift of population from rural areas to cities and towns or their vicinity, continues and, although the rate appears to be stabilising, brings its own housing problems. From this, it appears likely that a disparity exists between the geographical distribution of the population and the distribution of the existing housing stock.
Cost of housing accommodation—House prices in recent years have tended to more or less keep pace with average weekly earnings, but the very uncertain employment position and the worsening economic situation, with high inflation and continued rises in mortgage interest rates, have made it increasingly difficult for potential house owners to accumulate the necessary capital or undertake the loan servicing charges associated with home-ownership. At the same time traditional attitudes to the level of rents which a tenant could be expected to bear and other factors have made private sector rental housing an unattractive investment. During the period 1976–1981 the proportion of rental houses in the total housing stock dropped from 28 to 25 percent, and the rental stock increased by only 4600 units.
Demographic and social changes in the population—During the intercensal period 1976–1981, when the total population increased by 46 000, the number in the principal household-forming age groups, the 18–34 year-olds, increased by nearly 63 000. In addition, the numbers of single-person and incomplete-family households continued to increase. In many instances, a broken family means that members of the family occupy two dwellings where one was necessary before the break.
Obviously there is a disparity between the current housing situation as described by traditional indicators and that being experienced by an increasing number of New Zealand households. Better utilisation of the total existing stock of private and public housing remains a priority and, at a time of heavy demand on a limited pool of new investment capital, that which is available for housing must be targeted efficiently and effectively to areas of greatest need.
The value of building permits and authorisation in the “other buildings and construction” sector of the building and construction industry in 1982–83 rose substantially as compared with recent years. For new buildings the total value was $633.4 million compared with $580.0 million in 1981–82, $430.9 million in 1980–81, and $400.8 million in 1979–80. Permits and authorisation for total work on “other buildings and construction”, which included alterations and additions, showed an increase in value, from $881.9 million in 1981–82 to $910.9 million in 1982–83.
During the year the Major Projects Advisory Group, previously linked to the Building Industry Advisory Council, was restructured by the Government to place greater emphasis on maximising New Zealand participation in projects. The administrative servicing of the group was transferred from the Ministry of Works and Development to the Department of Trade and Industry. The Ministry of Works and Development participates as a member of the group, advising on the capacity of local industry and capabilities of firms to undertake specialist engineering work on projects.
Within the residential field, the sixties and seventies witnessed a trend in housing construction away from houses to flats. This reached a peak in 1973–74, when just over 40 percent of permits for new dwellings applied to flats, but fell away in the late seventies. The position now appears to be stabilising, with flats making up about a quarter of new dwellings.
Town houses, a type of compact construction which combines some of the advantages of both houses and flats, have proved popular in recent years. In these statistics, single-unit town houses are included with houses, and multi-unit town houses with flats. Flats also include apartments, semi-detached units, row houses, pensioners' flats, maisonettes, and duplex units.
BUILDING INDUSTRY ADVISORY COUNCIL—The functions of the Building Industry Advisory Council are: (a) to give advice to Government through the Minister of Works and Development on matters affecting the building and construction industries; (b) to maintain an overall and continuing review of the industries; and (c) to give advice to the industries on the likely effects of building trends. The membership of the council consists of 9 representatives from sectors of the industries, namely building and civil engineering contractors, architects, professional engineers workers, and suppliers, plus 1 representative each from Treasury and Ministry of Works and Development. Members have been appointed by the Minister of Works and Development on the recommendation of organisations within the building industry.
BUILDING PERFORMANCE GUARANTEE CORPORATION—The Building Performance Guarantee Corporation was established early in 1978 to offer an insurance scheme designed to protect the buyers of new homes against the consequences of poor workmanship, the use of inferior building materials, the bankruptcy of the builder, or other failures to complete a house in accordance with the contract.
NATIONAL HOUSING COMMISSION—The National Housing Commission, established in 1974, is a body whose principal functions are to advise the Minister of Housing on all matters relating to housing in New Zealand and to inquire into and keep under review the housing needs of the population. In addition, it is charged with assisting in the co-ordination of all persons, bodies, and agencies, both public and private, concerned with housing in New Zealand and promoting co-operation between them.
Currently there are 6 appointed members, comprising the chairman (the general manager of a lending institution), an architect, an emeritus professor of economics, a builder, a barrister and solicitor, a real estate agent; and 2 official members, 1 from the Housing Corporation and 1 from the Treasury.
The second of the commission's 5-yearly reports on the present and future position of housing in New Zealand was published in mid-1983.
Up to the end of 1983 the commission had issued 60 publications based on its continuing programme of research into a variety of aspects of housing.
TRENDS IN AVERAGE COSTS—The following table illustrates trends in the cost of building activity over a period. (Source: Housing Corporation.)
| Type of Building | Cost at End of March Year | ||||||
|---|---|---|---|---|---|---|---|
| 1950 | 1960 | 1970 | 1980 | 1981 | 1982 | 1983 | |
| * Area 102 sq metres. Cost comparability is affected by design changes from year to year. | |||||||
| Dollars | |||||||
| State rental house (976 sq ft) | 4,344 | 5,528 | 7,450 | 27,715* | 33,310* | 45,170* | 52,723* |
CENSUS OF BUILDING AND CONSTRUCTION 1978–79—The fourth 5-yearly Census of Building and Construction was taken for the year 1978–79, and was the first fully integrated economic census covering the activities of establishments and ancillary units predominantly engaged in that activity. It excluded the activities of owner-builders and labour-only contractors to the building and construction industries, as well as the building activities of New Zealand electric power boards.
All activities from production to the point at which the goods or services are sold were within the scope of the census, which was for the year ended 31 March 1979 or the last accounting year prior to 31 March.
The census formed part of the department's 5-yearly series of integrated economic censuses and for this reason any comparisons with the Censuses of Building and Construction prior to 1978–79 should be treated with caution.
In 1978–79, the building and construction industries were reclassified under the New Zealand Standard Industrial Classification covering:
Buildings, residential and non-residential.
Construction, other than buildings.
Services to building and construction.
The statistical tables which follow give summaries of these 3 divisions. The definitions used in these tables are the same as listed in the Census of Manufacturing statistics (see Section 19), with the following exceptions.
Establishments—Productive units, engaged predominantly in building and construction operations.
Ancillary Units—Servicing units, usually head offices, laboratories, workshops, etc., engaged in predominantly servicing those establishments.
The following table gives a general summary of the results of the 1978–79 Census of Building and Construction.
| Item | Unit | Total |
|---|---|---|
| Establishments | No. | 10,754 |
| Ancillary units | No. | 52 |
| Total persons engaged at 15 April 1979 | No. | 73,217 |
| Salaries and wages paid (excluding working proprietors' remuneration) | $(000) | 545,993 |
| Depreciation | $(000) | 41,031 |
| Purchases and other expenses | $(000) | 1,895,241 |
| Turnover | $(000) | 2,667,143 |
| Value added | $(000) | 794,833 |
| Capital expenditure less disposals | $(000) | 106,266 |
In the following 2 tables statistics are given at industry (subgroup) level.
| Industry Classification | Operating Units | Total Persons Engaged at 15 April 1979 | Salaries and Wages Paid | |
|---|---|---|---|---|
| Establishments | Ancillary Units | |||
| No. | No. | No. | $(000) | |
| Buildings, residential | 2,941 | 7 | 9,740 | 49,660 |
| Buildings, non-residential | 774 | 16 | 17,912 | 176,666 |
| Construction, other than building | 1,273 | 24 | 23,248 | 192,667 |
| Bricklaying | 284 | – | 750 | 2,783 |
| Concrete blocklaying | 117 | – | 324 | 1,526 |
| Other stone work | 17 | – | 86 | 401 |
| Concrete work | 127 | – | 416 | 2,041 |
| Solid plastering | 153 | – | 434 | 1,790 |
| Fibrous plastering | 68 | – | 376 | 2,717 |
| Job carpentry | 390 | – | 828 | 2,796 |
| Glazing | 58 | – | 175 | 921 |
| Roofing, tile | 56 | – | 239 | 1,475 |
| Roofing, metal | 64 | – | 381 | 2,517 |
| Roofing, fabric | 10 | – | 102 | 852 |
| Electrical | 1,035 | 2 | 4,169 | 24,007 |
| Plumbing and drainlaying | 1,378 | 1 | 5,395 | 28,298 |
| Heating and air-conditioning | 108 | – | 1,267 | 10,007 |
| Painting and paperhanging | 1,134 | – | 4,059 | 21,786 |
| Flooring | 198 | – | 611 | 2,641 |
| Insulating | 39 | – | 219 | 1,504 |
| Demolition work | 25 | – | 104 | 712 |
| Scaffold erection | 22 | – | 291 | 2,293 |
| Structural steel erection | 18 | – | 148 | 1,516 |
| Reinforced steel bending and placing | 17 | – | 68 | 578 |
| Other services to building and construction | 443 | 2 | 1,875 | 13,840 |
| Total, building and construction industries | 10 754 | 52 | 73 217 | 545,993 |
| Industry Classification | Depreciation | Purchases and Other Expenses | Turnover | Value Added | Capital Expenditure Less Disposals |
|---|---|---|---|---|---|
| $(000) | |||||
| Buildings, residential | 4,011 | 343,565 | 445,461 | 101,829 | 4,652 |
| Buildings, non-residential | 4,569 | 697,805 | 900,445 | 212,096 | 31,369 |
| Construction, other than building | 22,768 | 516,138 | 766,647 | 259,312 | 55,278 |
| Bricklaying | 255 | 8,021 | 14,275 | 6,336 | 353 |
| Concrete blocklaying | 98 | 4,334 | 7,252 | 3,012 | 130 |
| Other stone work | 32 | 1,372 | 2,081 | 819 | 30 |
| Concrete work | 371 | 6,028 | 9,992 | 3,970 | 604 |
| Solid plastering | 118 | 2,683 | 6,426 | 3,768 | 187 |
| Fibrous plastering | 76 | 4,134 | 7,877 | 3,779 | 110 |
| Job carpentry | 315 | 13,120 | 20,409 | 7,068 | 577 |
| Glazing | 95 | 2,702 | 4,430 | 1,812 | 187 |
| Roofing, tile | 116 | 9,859 | 12,301 | 2,653 | 134 |
| Roofing, metal | 151 | 10,647 | 14,584 | 3,990 | 134 |
| Roofing, fabric | 39 | 2,107 | 3,182 | 1,108 | 43 |
| Electrical | 1,472 | 61,489 | 102,335 | 41,339 | 2,021 |
| Plumbing and drainlaying | 2,652 | 81,702 | 132,753 | 51,778 | 3,992 |
| Heating and air-conditioning | 348 | 29,189 | 42,135 | 13,499 | 409 |
| Painting and paperhanging | 1,204 | 26,520 | 63,981 | 38,001 | 2,199 |
| Flooring | 295 | 6,379 | 12,206 | 5,996 | 473 |
| Insulating | 90 | 3,400 | 5,675 | 2,366 | 128 |
| Demolition work | 225 | 1,400 | 2,870 | 1,528 | 340 |
| Scaffold erection | 156 | 1,853 | 4,953 | 3,141 | 207 |
| Structural steel erection | 96 | 2,853 | 5,262 | 2,425 | 105 |
| Reinforced steal bending and placing | 37 | 520 | 1,231 | 728 | 12 |
| Other services to building and construction | 1,441 | 57,420 | 78,380 | 22,477 | 2,594 |
| Total, building and construction industries | 41,031 | 1,895,241 | 2,667,143 | 794,833 | 106,266 |
Regional summaries of the census as a whole are shown in the 2 statistical area tables which follow. The first shows operating units, persons engaged, and salaries and wages paid.
| Statistical Area | Operating Units | Persons Engaged At Mid-April | Salaries and Wages Paid During Year | |
|---|---|---|---|---|
| Establishments | Ancillaries | |||
| No. | No. | No. | $(000) | |
| Northland | 313 | – | 2,447 | 15,142 |
| Central Auckland | 2,660 | 10 | 16,709 | 128,544 |
| South Auckland-Bay of Plenty | 1,627 | 5 | 11,302 | 84,154 |
| East Coast | 140 | 2 | 1,042 | 6,706 |
| Hawke's Bay | 492 | 1 | 3,229 | 21,581 |
| Taranaki | 418 | 3 | 2,746 | 22,841 |
| Wellington | 2,123 | 20 | 15,587 | 121,100 |
| North Island total | 7 773 | 41 | 53 062 | 400,068 |
| Marlborough | 146 | – | 698 | 4,097 |
| Nelson | 280 | – | 1,726 | 11,821 |
| Westland | 89 | – | 703 | 4,623 |
| Canterbury | 1,227 | 5 | 9,176 | 71,780 |
| Otago | 815 | 4 | 5,765 | 40,374 |
| Southland | 424 | 2 | 2,087 | 13,230 |
| South Island total | 2 981 | 11 | 20 155 | 145,925 |
| New Zealand total | 10 754 | 52 | 73 217 | 545,993 |
The second regional summary shows other financial statistics.
| Statistical Area | Depreciation | Purchases and Other Expenses | Turnover | Value Added | Capital Expenditure Less Disposals |
|---|---|---|---|---|---|
| $(000) | |||||
| Northland | 1,293 | 54,787 | 73,239 | 21,170 | 2,990 |
| Central Auckland | 9,591 | 446,643 | 635,702 | 189,024 | 20,159 |
| South Auckland-Bay of Plenty | 6,480 | 252,454 | 366,989 | 122,735 | 18,092 |
| East Coast | 410 | 21,004 | 29,411 | 10,164 | 1,273 |
| Hawke's Bay | 1,550 | 82,486 | 115,849 | 31,737 | 3,928 |
| Taranaki | 3,022 | 68,052 | 102,494 | 34,050 | 2,468 |
| Wellington | 7,762 | 483,636 | 643,179 | 173,509 | 22,319 |
| North Island total | 30,108 | 1,409,062 | 1,966,863 | 582,388 | 71,230 |
| Marlborough | 447 | 10,488 | 16,858 | 6,515 | 907 |
| Nelson | 958 | 34,285 | 51,087 | 17,274 | 2,186 |
| Westland | 586 | 15,252 | 21,513 | 6,576 | 2,343 |
| Canterbury | 4,196 | 245,757 | 349,605 | 98,604 | 16,928 |
| Otago | 3,302 | 129,200 | 187,308 | 60,263 | 9,115 |
| Southland | 1,433 | 51,196 | 73,908 | 23,211 | 3,557 |
| South Island total | 10,923 | 486,178 | 700,280 | 212,445 | 35,036 |
| New Zealand total | 41,031 | 1,895,241 | 2,667,143 | 794,833 | 106,266 |
In the following table the turnover for the industry has been analysed by the principal components.
| Item | Turnover |
|---|---|
| $(000) | |
| Building and construction sales— | |
| Repairs and maintenance | 359,225 |
| Construction of new buildings | 1,263,389 |
| Construction, other than buildings | 945,532 |
| Hire of plant | 46,238 |
| Total sales | 2,614,384 |
| Other income | 47,961 |
| Total sales and other income | 2,662,345 |
| Capital work done by own employees | 4,797 |
| Total turnover | 2,667,143 |
HOUSING—As at 31 March 1984 more than half of New Zealand's estimated 1 124 700 dwellings have been built during the past 25 years. The average house is about 125 square metres in area, is single-storeyed, and normally built of timber; fittings are of a reasonably high standard, especially in the kitchen.
Approximately 90 percent of the dwellings completed annually are built for private home ownership, with most of the balance being erected by Government agencies for rental purposes. There is relatively little housing built for private rental. Rapidly rising property costs have made it difficult for persons on modest incomes to finance their way into home ownership.
Since 1937 the State, using the services of private contractors, has been building rental dwellings. By March 1983, 88 514 of these houses and flats had been built and since 1950, 31 943 of them had been sold to the occupiers. Rental dwellings are let to applicants in difficult housing circumstances.
GOVERNMENT CAPITAL ASSISTANCE FOR NEW HOUSING—The following table shows the bulk of the Government's capital expenditure on new housing during the latest available 3 years. It does not include expenditure on residential properties by the Departments of Maori Affairs or Lands and Survey, expenditure by the Housing Corporation for other departments, or advances under the scheme for the capitalisation of family benefits.
| Expenditure | 1980–81 | 1981–82 | 1982–83 |
|---|---|---|---|
| $(000) | |||
| Land purchase and development, State house construction, etc. | 45,767 | 36,686 | 45,876 |
| Advances for new urban houses | 111,620 | 66,210 | 77,330 |
| Advances for new rural houses | 9,540 | 9,323 | 9,785 |
| Loans to local authorities for rural housing, pensioners' housing, etc. | 8,404 | 6,896 | 13,809 |
| Subsidies paid to local authorities, and religious or welfare organisations for housing of elderly | 4,160 | 2,790 | 4,180 |
HOUSES AND FLATS COMPLETED—Statistics of completions are given in the following table. They include flats created by conversion of existing dwellings. The statistics are dependent on the supply of information by local authorities and indications are that they have been understated.
| Year Ended 31 March | Government | Private and Local Authority† | Total New Houses and Flats | Flats Created by Conversion‡§ | Total Housing Units§ | |
|---|---|---|---|---|---|---|
| State Rental | Tenancies* | |||||
* Includes Education and Hospital Boards. †City, borough and county councils, etc., comprising pensioner units, staff housing, etc. ‡Additional dwelling units created by conversation of existing buildings, e.g., one house converted into two flats. §From 1982 figures are no longer collected. | ||||||
| 1979 | 1,180 | 504 | 17,500 | 19,200 | 110 | 19,300 |
| 1980 | 1,173 | 287 | 14,500 | 16,000 | 130 | 16,100 |
| 1981 | 825 | 45x | 13,400 | 14,300 | 130 | 14,400 |
| 1982 | 267 | 58 | 15,900 | 16,300 | 130 | 16,400 |
| 1983 | 298 | 88 | 14,400 | 14,800 | ||
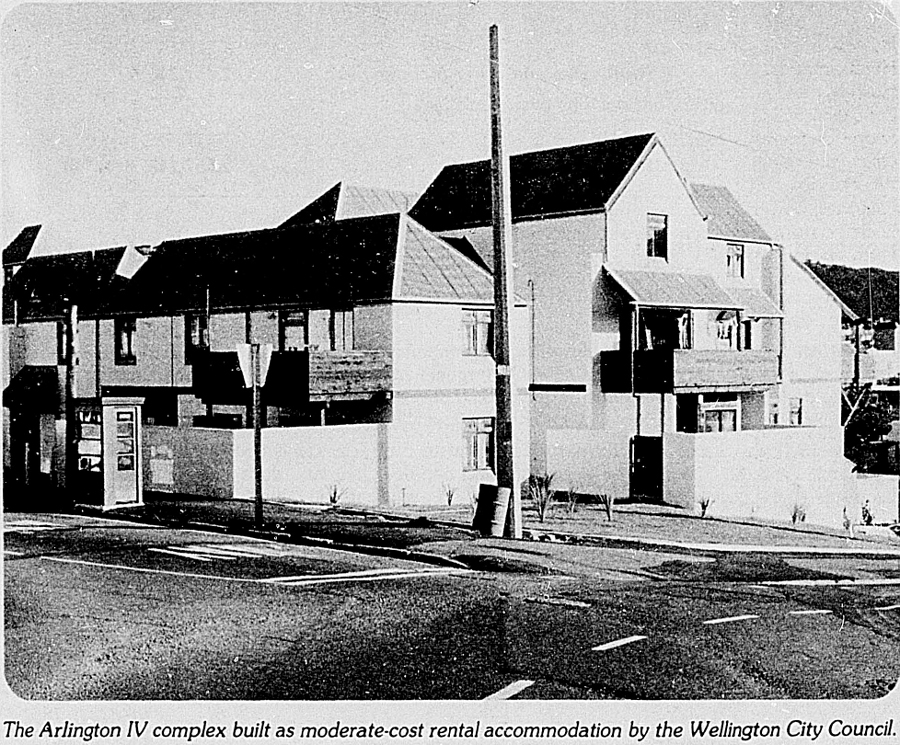
DEMOLITIONS—According to notifications received, the totals of dwellings demolished in recent years have been: 1978–79, 1625; 1979–80, 1576; 1980–81, 1357; 1981–82, 1170; 1982–83, 878.
BUILDING STATISTICS—The principal official building statistics are the Department of Statistics' monthly analyses of building permits and its quarterly analyses of the value of work put in place. Other building information is available from the 5-yearly Census of Building and Construction, the 5-yearly Census of Population and Dwellings, and inter-industry statistics.
The prime source of the following statistics is building permits issued by local authorities. To enable a complete picture of building activity to be shown, construction commenced by Government departments, hospitals, education and harbour boards are included, even though permits may not actually be taken out.
The permit value shown represents in the majority of instances the contract price or estimated cost of the building prior to the commencement of construction. The finished cost may be higher because of wage increases, the rising cost of materials, etc. This applies particularly to large buildings which usually take a considerable time to complete.
The values of building permits for the latest 5 years are analysed by types of building in the following table. Permits cover alterations and additions as well as new buildings. Government and other buildings not requiring building permits are included.
| Type of Building | Year Ended 31 March | ||||
|---|---|---|---|---|---|
| 1979 | 1980 | 1981 | 1982 | 1983 | |
* Includes alterations and additions. †Includes ancillary buildings. | |||||
| Dwellings | $(million) | ||||
| Houses | 390.3 | 378.8 | 424.9 | 669.9 | 628.6 |
| Flats | 108.6 | 83.5 | 96.1 | 180.4 | 166.5 |
| Alterations and additions | 138.7 | 153.5 | 199.8 | 269.6 | 294.0 |
| Other Buildings* | |||||
| Hostels, boardinghouses | 12.8 | 13.0 | 16.3 | 25.8 | 15.6 |
| Hotels, motels, etc. | 15.3 | 15.0 | 24.7 | 49.3 | 27.1 |
| Hospitals and nursing homes† | 31.8 | 26.6 | 18.6 | 28.9 | 23.4 |
| Education buildings† | 54.4 | 59.5 | 93.7 | 66.1 | 60.3 |
| Shops, restaurants, taverns | 34.2 | 42.7 | 50.2 | 59.5 | 65.6 |
| Office and administrative | 127.1 | 127.2 | 123.5 | 189.1 | 188.9 |
| Warehouses | 46.8 | 45.4 | 60.1 | 68.6 | 70.9 |
| Factories, powerhouses, etc. | 104.1 | 126.6 | 127.4 | 269.9 | 305.6 |
| Social, cultural, and recreational buildings | 45.4 | 38.9 | 57.0 | 51.1 | 72.1 |
| Farm buildings | 34.5 | 47.9 | 61.2 | 69.9 | 74.0 |
| Miscellaneous buildings | 5.4 | 2.3 | 2.4 | 3.7 | 7.3 |
| All buildings | 1,149.4 | 1,160.9 | 1,356.1 | 2,001.8 | 2,000.0 |
The following tables show the value, and a percentage analysis of the value, of building permits and authorisations during 1982–83 by type of building and sector of ownership. The high percentage of the total value of building permits represented by houses and flats built by the private sector (“Households”) highlights the importance of private investment in residential buildings as a key to stability in the building industry.
| Type of Building | Producer Enterprises | Financial Intermediaries | General Government | Private Non-profit Organisations | Rest of World and Households | Total |
|---|---|---|---|---|---|---|
* Includes alterations and additions. †Households only. ‡Rest of world only. §Includes ancillary buildings. | ||||||
| $(000)* | ||||||
| Houses and flats | 39,822 | 801 | 11,611 | 796 | 1,036,068† | 1,089,097 |
| Hostels and boardinghouses | 5,668 | – | 5,434 | 3,939 | 522‡ | 15,562 |
| Hotels, motels, etc. | 26,910 | – | 65 | 159 | – | 27,134 |
| Hospitals and nursing homes | 2,962 | – | 17,206 | 3,206 | – | 23,373 |
| Education buildings§ | 262 | – | 51,572 | 8,510 | – | 60,344 |
| Social, cultural, and recreational | 4,681 | – | 25,689 | 41,774 | – | 72,144 |
| Shops, restaurants, taverns | 61,796 | 3,271 | 474 | 67 | – | 65,608 |
| Office and administrative | 71,536 | 81,828 | 31,645 | 2,181 | 1,743‡ | 188,933 |
| Warehouses | 68,229 | 1,318 | 1,164 | 203 | – | 70,913 |
| Factories, powerhouses, etc. | 288,859 | 1,060 | 15,275 | 419 | – | 305,614 |
| Farm buildings | 73,678 | – | 215 | 74 | – | 73,967 |
| Miscellaneous | 5,072 | 2 | 2,030 | 177 | – | 7,280 |
| All buildings | 649,474 | 88,280 | 162,379 | 61,503 | 1,038,333 | 1,999,970 |
| Percentage of Total Value | ||||||
| Houses and flats | 2.0 | – | 0.6 | – | 51.8† | 54.5 |
| Hostels and boardinghouses | 0.3 | – | 0.3 | 0.2 | – | 0.8 |
| Hotels, motels, etc. | 1.3 | – | – | – | – | 1.4 |
| Hospitals and nursing homes | 0.1 | – | 0.9 | 0.2 | – | 1.2 |
| Education buildings§ | – | – | 2.6 | 0.4 | – | 3.0 |
| Social, cultural, and recreational | 0.2 | – | 1.3 | 2.1 | – | 3.6 |
| Shops, restaurants, taverns | 3.1 | 0.2 | – | – | – | 3.3 |
| Office and administrative | 3.6 | 4.1 | 1.6 | 0.1 | 0.1‡ | 9.4 |
| Warehouses | 3.4 | 0.1 | 0.1 | – | – | 3.5 |
| Factories, powerhouses, etc. | 14.4 | 0.1 | 0.8 | – | – | 15.3 |
| Farm buildings | 3.7 | – | – | – | – | 3.7 |
| Miscellaneous | 0.3 | – | 0.1 | – | – | 0.4 |
| All buildings | 32.5 | 4.4 | 8.1 | 3.1 | 51.9 | 100.0 |
The total for houses and flats during 1982–83 includes 15 999 permits or authorisations to a total value of $795.1 million for new dwellings. This includes authorisations by the Central Government for 384 new houses (value $18.6 million) and 139 new flats (value $5.8 million).
Compared with the previous year, in 1982–83 the value of permits and authorisations for houses and flats made up a slightly lower percentage of the aggregate (54.5 percent as compared with 55.9 percent).
Some categories of buildings used in this and other building permit tables require additional explanation. Hostels and boardinghouses, for example, include barracks, orphanages, nurses' homes, and boarding school accommodations; hotels and motels include private and licensed hotels, but exclude taverns; education buildings include primary and secondary schools, teachers colleges, technical institutes, university buildings, kindergartens, and play centres; and the broad category of 'Social, cultural, recreational buildings' includes churches, halls, theatres, cinemas, clubrooms, community centres, and grandstands.
In the following table the numbers of permits for new houses and flats over a period of 5 years are shown along with permit values. Figures for the latest year are included in the Latest Statistical Information section.
| Year Ended 31 March | New Houses | New Flats | Total Dwelling Permits* | Total Permits All Buildings* | ||||
|---|---|---|---|---|---|---|---|---|
| Dwelling Units | Value | Area | Dwelling Units | Value | Area | |||
| * Includes the value of permits for alterations and additions. | ||||||||
| No. | $(m) | sq metres (000) | No. | $(m) | sq metres (000) | $(m) | $(m) | |
| 1979 | 13,670 | 390.3 | 1 732.9 | 5,380 | 108.6 | 466.0 | 637.6x | 1,149.4 |
| 1980 | 11,687 | 378.8 | 1 551.4 | 3,510 | 83.5 | 326.0 | 615.8 | 1,160.9 |
| 1981 | 11,108 | 424.9 | 1 518.7 | 3,334 | 96.1 | 334.4 | 720.8 | 1,356.1 |
| 1982 | 13,996 | 669.9 | 1 980.0 | 5,010 | 180.4 | 508.1 | 1,119.9 | 2,001.8 |
| 1983 | 11,854 | 628.6 | 1 616.3 | 4,145 | 166.5 | 396.7 | 1,089.1 | 2,000.0 |
The average permit value for new houses and flats in 1982–83 was $49,695, compared with $44,739 in 1981–82, $36,072 in 1980–81, $30,415 in 1979–80 and $26,190 in 1978–79.
The following diagram illustrates building permit figures for new houses and flats.
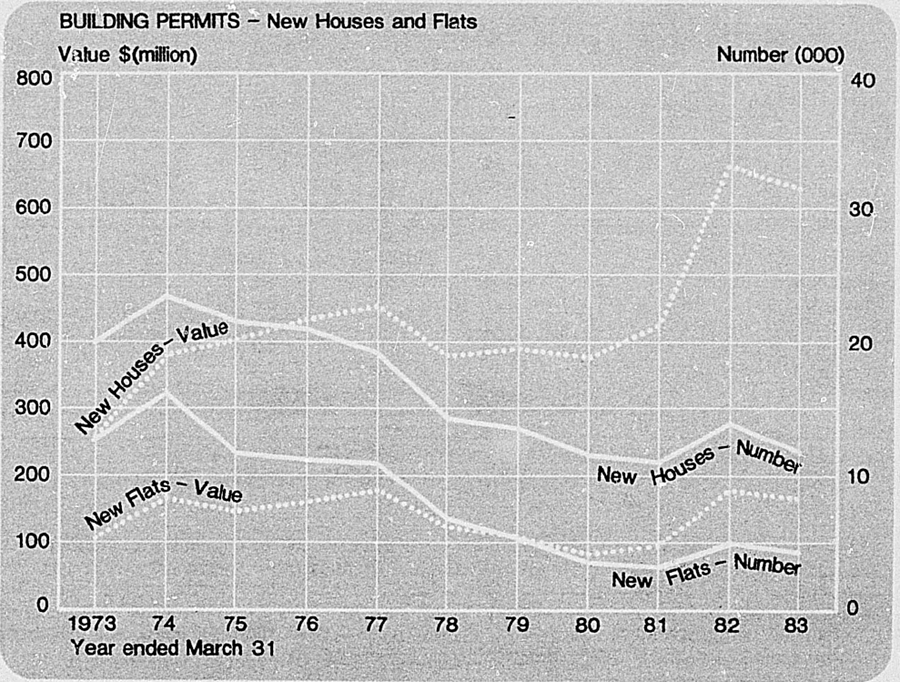
GEOGRAPHICAL LOCATIONS—The following table shows building permit values and dwelling completions for the March year 1982–83 for main urban areas and statistical divisions. Where applicable the main urban areas are included in the relevant statistical division.
| Area | New Houses and Flats | Total (All Permits) Value | Dwelling Completions* | |
|---|---|---|---|---|
| Number | Value | |||
* Figures for completions of dwellings are rounded to indicate that exact numbers are not always available and are dependent on notifications from local authorities. †Includes rural and other housing not listed in the foregoing locations. | ||||
| $(m) | $(m) | No. | ||
| Whangarei U.A. | 475 | 19.7 | 39.8 | 350 |
| Northern Auckland U.A. | 1,023 | 53.1 | 97.8 | 770 |
| Western Auckland U.A. | 717 | 30.2 | 56.1 | 580 |
| Central Auckland U.A. | 597 | 33.6 | 185.7 | 490 |
| Southern Auckland U.A. | 1,028 | 56.4 | 118.6 | 1,260 |
| Auckland Stat. Div. | 3,971 | 202.6 | 623.8 | 3,530 |
| Hamilton U.A. | 435 | 21.8 | 54.0 | 550 |
| Hamilton Stat. Div. | 790 | 39.5 | 94.2 | 870 |
| Tauranga U.A. | 531 | 25.1 | 45.9 | 850 |
| Rotorua U.A. | 279 | 12.6 | 26.5 | 290 |
| Gisborne U.A. | 103 | 5.3 | 14.9 | 80 |
| Napier U.A. | 291 | 13.0 | 27.6 | 130 |
| Hastings U.A. | 276 | 12.4 | 31.3 | 240 |
| Napier-Hastings Stat. Div. | 600 | 27.4 | 63.6 | 390 |
| New Plymouth U.A. | 356 | 18.0 | 38.3 | 440 |
| Palmerston North U.A. | 306 | 15.6 | 35.4 | 310 |
| Palmerston North Stat. Div. | 432 | 22.1 | 48.9 | 440 |
| Lower Hutt U.A. | 188 | 10.7 | 26.7 | 180 |
| Upper Hutt U.A. | 74 | 4.2 | 8.9 | 60 |
| Porirua Basin U.A. | 190 | 10.1 | 17.1 | 200 |
| Wellington U.A. | 368 | 22.6 | 128.6 | 410 |
| Wellington Stat. Div. | 1,064 | 60.4 | 200.5 | 1,010 |
| Wanganui U.A. | 148 | 6.6 | 17.4 | 180 |
| Masterton U.A. | 43 | 2.3 | 5.5 | 30 |
| Nelson U.A. | 230 | 10.8 | 23.9 | 230 |
| Christchurch U.A. | 1,022 | 54.5 | 120.2 | 1,140 |
| Christchurch Stat. Div. | 1,225 | 65.1 | 140.4 | 1,310 |
| Timaru U.A. | 77 | 3.8 | 12.1 | 60 |
| Dunedin U.A. | 255 | 13.0 | 37.2 | 200 |
| Dunedin Stat. Div. | 281 | 14.3 | 40.4 | 240 |
| Invercargill U.A. | 266 | 11.8 | 27.1 | 220 |
| Total, New Zealand† | 15 999 | 795.1 | 2000.0 | 14 800 |
WORK PUT IN PLACE—The Department of Statistics makes a quarterly survey of building work put in place. In contrast to the statistics based on building permits, these figures show the gross value of actual work done. It should be noted that there are varying time lags between the issue of the building permit and the commencement of building. The actual work for which a permit is issued can be extended over a number of time periods. Also, the total value of this work may differ considerably from the value estimated on the building permit, especially in times of relatively rapid inflation.
| Year Ended 31 March | Dwellings | ||||
|---|---|---|---|---|---|
| New Houses and Flats | Alterations and Additions | Total | |||
| Government | Other | Total | |||
| $(million) | |||||
| 1979 | 53.1 | 450.4 | 503.5 | 139.2 | 642.7 |
| 1980 | 45.5 | 438.1 | 483.6 | 162.6 | 646.2 |
| 1981 | 33.8 | 490.3 | 524.1 | 204.4 | 728.5 |
| 1982 | 20.8 | 697.7 | 718.5 | 258,4 | 976.9 |
| 1983 | 25.3 | 782.9 | 808.3 | 304.4 | 1,112.7 |
| Year Ended 31 March | Other Buildings* | Grand Total | ||||||
|---|---|---|---|---|---|---|---|---|
| Hotels, Boarding-houses† | Hospitals† | Factories | Commercial Buildings | Schools† | Miscellaneous‡ | Total | ||
* Includes alterations and additions. †And ancillary buildings. ‡Includes churches and sports entertainment buildings. | ||||||||
| $(million) | ||||||||
| 1979 | 33.8 | 62.7 | 126.7 | 210.4 | 56.4 | 74.3 | 564.2 | 1,207.0 |
| 1980 | 38.1 | 61.5 | 141.4 | 255.3 | 51.2 | 88.8 | 636.3 | 1,282.5 |
| 1981 | 41.8 | 47.1 | 155.6 | 274.5 | 72.4 | 114.0 | 705.4 | 1,433.9 |
| 1982 | 59.4 | 45.8 | 218.8 | 360.3 | 77.3 | 142.7 | 904.2 | 1,881.2 |
| 1983 | 67.2 | 43.0 | 274.5 | 399.3 | 72.5 | 138.3 | 994.7 | 2,107.4 |
BUILDING MATERIALS—Production of some principal building materials during the 4 latest December years is shown in the following table.
| Item | Unit | December Year | |||
|---|---|---|---|---|---|
| 1980 | 1981 | 1982 | 1983 | ||
| Ready-mixed concrete | cu metres (000) | 994 | 1,137 | 1,204 | 1,252 |
| Paint and varnish— | |||||
| Paints (not water) and enamels, lacquers, varnishes, and reaction clears | litres (000) | 18,218 | 19,100 | 18,921 | 18,131 |
| Water paints, including aqueous emulsions | litres (000) | 9,617 | 11,447 | 11,639 | 11,425 |
| Fibre board | tonnes (000) | 81.9 | 83.5 | 83.8x | 86.2 |
| Sawn timber | cu metres (000) | 2 180x | 2 247x | 2 195x | 2,045 |
| Particle board | cu metres | 141,413 | 161,040 | 142,630 | 148,967 |
| Plywood | cu metres | 53,508 | 60,465 | 58,973 | 47,177 |
| Cement | tonnes (000) | 720 | 759 | 781 | 760 |
HOUSING FINANCE—The Housing Corporation, a wholly Government-owned institution described in detail in Section 31c, generally provides finance to first home seekers receiving a modest income. Some second and subsequent home seekers who demonstrate a special need may also be assisted. For the year ended 31 March 1983, the Housing Corporation authorised 2064 loans valued at $55.25 million for new urban dwellings. Of the total of 9372 housing loans authorised, 7308 were authorised for the purchase of existing houses. Other important sources of housing finance are building societies, life insurance offices, trustee savings banks, and solicitors' trust funds.
The Family Benefit (Home Ownership) Act 1964 provides for payment in a lump sum of the social welfare family benefit. The capitalised benefit can be used either to build a family home, or for essential alterations, or to repay mortgages. The scheme became operative on 1 April 1959. Benefits in respect of any number of children may be capitalised provided the aggregate advance does not exceed $4,000. Family benefit advances totalling $7.66 million were authorised during 1982–83 by the Housing Corporation to applicants holding eligibility certificates issued by the Department of Social Welfare.
The Housing Corporation operates a Housing Mortgage Guarantee Scheme in respect of housing loans on first or subsequent mortgages granted by approved lenders, including trustee lenders, where the amount advanced does not exceed 90 percent of value. Under the present scheme, amended in April 1977, the corporation guarantees the full amount of the loan advanced. The loans must be for the purpose of building, buying, altering, or refinancing a house or flat. There is no charge for this service. Home lay-by accounts in the Post Office Savings Bank and trustee and private savings banks qualify for subsidy, and Home Ownership accounts qualify for subsidy and preferential loan finance (see Section 30).
Expenditure of the Housing Corporation for the 4 latest years is shown in the following table.
| Year Ended 31 March | Gross Expenditure | Increase or Decrease Over Previous Year | Increase in Total Government Expenditure |
|---|---|---|---|
| $(000) | percent | percent | |
| 1980 | 284,631 | −1 | 13 |
| 1981 | 264,965 | −7 | 22 |
| 1982 | 175,577 | −34 | 21 |
| 1983 | 222,017 | +26 | 10 |
COSTS OF NEW AND EXISTING HOUSES—Costs of new and existing houses bought by income earners who meet Housing Corporation requirements and receive finance from the corporation are set out in the following table. The information comes from a 1 in 5 sample of loans authorised.
| Branch Area | Year Ended 31 March | New Houses (including Section) | Existing Houses | ||
|---|---|---|---|---|---|
| Number | Average Cost | Number | Average Cost | ||
| $ | $ | ||||
| Auckland/Manukau | 1982 | 1,190 | 51,300 | 770 | 32,600 |
| 1983 | 525 | 54,700 | 1,020 | 45,700 | |
| Hamilton | 1982 | 160 | 45,000 | 300 | 29,800 |
| 1983 | 110 | 47,900 | 325 | 38,800 | |
| Wellington/Lower Hutt | 1982 | 145 | 47,300 | 485 | 27,100 |
| 1983 | 105 | 50,900 | 565 | 34,800 | |
| Christchurch | 1982 | 180 | 44,200 | 705 | 25,900 |
| 1983 | 175 | 49,500 | 925 | 33,600 | |
| Dunedin | 1982 | 30 | 44,700 | 205 | 23,500 |
| 1983 | 50 | 49,900 | 350 | 28,500 | |
Statistics compiled by the Valuation Department illustrate the trend in residential prices in 39 urban areas throughout New Zealand. The following figures of average sale prices for sections, houses, and owner-occupier flats exclude family sales, sales of leasehold property, and other sales not subject to normal market forces.
| Item | December Years | |||||
|---|---|---|---|---|---|---|
| 1978 | 1979 | 1980 | 1981 | 1982 | 1983 | |
| $ | $ | $ | $ | $ | $ | |
| Average sale price of— | ||||||
| Sections | 11,495 | 11,985 | 12,626 | 14,396 | 15,755x | 17,849 |
| Houses | 30,189 | 31,820 | 34,374 | 40,667 | 50,923 | 57,582 |
| Owner-occupier flats | 28,046 | 29,578 | 31,742 | 36,867 | 48,589 | 54,717 |
URBAN RESIDENTIAL PROPERTY AND SECTION PRICE INDEX—This index is designed to measure changes in the average level of prices paid for residential properties and urban sections sold during each half-year. Variations in the average age of properties transferred, as an indicator of the average quality of such properties, are eliminated in the index methodology in order to arrive at a valid index of price level changes.
The following table shows the latest available index numbers for individual centres (Base: Each centre separately 1973 = 1000).
| Centre | Residential Properties | Sections | ||
|---|---|---|---|---|
| July-December 1982 | January-June 1983 | July-December 1982 | January-June 1983 | |
| * A substantial increase occurred in the volume of section sales in Porirua. | ||||
| Whangarei | 4,290 | 4,344 | 4,588 | 4,812 |
| Auckland | 3,457 | 3,551 | 3,297 | 3,654 |
| Hamilton | 3,598 | 3,633 | 3,184 | 3,496 |
| Tauranga | 3,342 | 3,382 | 3,458 | 3,858 |
| Rotorua | 3,682 | 3,848 | 3,308 | 3,383 |
| Gisborne | 3,889 | 3,972 | 4,368 | 3,997 |
| Napier-Hastings | 3,346 | 3,390 | 2,885 | 3,641 |
| New Plymouth | 3,454 | 3,718 | 2,786 | 3,170 |
| Wanganui | 3,762 | 3,805 | 3,589 | 3,549 |
| Palmerston North | 3,560 | 3,681 | 3,305 | 3,588 |
| Masterton | 2,753 | 2,878 | 2,500 | 1,900 |
| Wellington-Hutt | 2,882 | 3,030 | 2,374 | 2,595 |
| Nelson | 4,018 | 4,186 | 3,832 | 4,438 |
| Christchurch | 3,101 | 3,217 | 2,779 | 3,081 |
| Timaru | 3,472 | 3,702 | 3,819 | 3,789 |
| Dunedin | 2,935 | 3,040 | 3,320 | 3,473 |
| Invercargill | 3,373 | 3,478 | 3,195 | 3,293 |
| All 17 centres combined | 3 339 | 3 447 | 3 181 | 3 503 |
The following table provides index numbers for 17 principal market centres combined (Base: Weighted average 17 centres combined). The long-term series is obtained by linking the revised urban house property price index to the index which it supersedes.
| Six Months Ended | Residential Properties | Sections |
|---|---|---|
| 1976—Jun | 1,565 | 1,981 |
| Dec | 1,608 | 20,069 |
| 1977—Jun | 1,681 | 2,110 |
| Dec | 1,689 | 2,245 |
| 1978—Jun | 1,701 | 2,306 |
| Dec | 1,740 | 2,212 |
| 1979—Jun | 1,795 | 2,241 |
| Dec | 1,834 | 2,164 |
| 1980—Jun | 1,934 | 2,217 |
| Dec | 2,062 | 2,292 |
| 1981—Jun | 2,333 | 2,412 |
| Dec | 2,717 | 2,650 |
| 1982—Jun | 3,192 | 2,931 |
| Dec | 3,339 | 3,181 |
| 1983—Jun | 3,447 | 3,503 |
HOUSE MORTGAGES—Most of the housing advances made by institutions are in the form of table mortgages, being made initially for terms of usually up to 30 years with the Housing Corporation, about 15 years with building societies, and about 10 years with the private savings banks. The general experience of these institutions is that most house mortgages are redeemed in 7 to 12 years. Interest rates and the methods of calculating them vary from one institution to another. Some institutions prefer to lend on new houses, others cater for the purchase of older dwellings. Information on mortgages is given in Section 31A, Mortgages, and Section 31c, State Finance for Housing.
ROLE OF LOCAL AUTHORITIES—The housing policy of the Government includes the provision of loans to local authorities through the Housing Corporation for pensioner, rural, and community housing, including urban renewal.
Housing of the Elderly—Since 1951 Government policies have encouraged local authorities, religious and welfare organisations to meet the housing needs of elderly persons. A low-interest loan of up to $17,250 is available for up to 30 years on each pensioner unit built. All other costs can be met by Government subsidies. The maximum total assistance is $28,000. This combination of low-interest loans and generous subsidies is directed at keeping rents at a level that tenants can afford.
The policy is administered by the Housing Corporation, which after the Health Department has established the need for pensioner accommodation in a particular locality, provides technical services, approves and administers the loan and subsidy.
The amount of subsidy approved in 1982–83 was $4.66 million to provide housing for 401 persons. Since the inception of the policy in 1950, subsidy assistance has totalled $76,184 million for the accommodation of 13 097 persons.
A policy to assist the rehousing of elderly home owners in owner-occupier flats is proving popular with local authorities, and religious and welfare organisations. A particular feature of this policy is the bridging finance which is made available, so that elderly home owners can sell their existing home before contributing towards the cost of the new flat. The Housing Corporation has also assisted in funding the upgrading of older units and the construction of wardens' residences for large complexes.
Relocatable 'Granny Flats'—In August 1980 the Government approved of the Housing Corporation making flats available to both local authorities and religious and welfare organisations to provide relocatable 'granny flats' for housing elderly persons on a home owner's property, with the same eligibility applying as for pensioner flats.
Total finance available to build the flats is $25,000 per unit—$10,750 subsidy plus a low-interest loan of up to $14,250.
The corporation is also able to make available an additional loan of $2,000 per unit at an interest rate of 8½ percent reviewable annually and with a maximum term of 10 years.
This additional loan is for the specific purpose of meeting the costs of installation of the unit on the site, connection of services, and removal back to the base depot.
Rural Housing—The Rural Housing Act 1939 has as its object the provision of more houses on farm properties. Loans are made to county councils (and other local bodies within whose boundaries farmlands are situated) for readvancing to farmers for the erection of, or additions or alterations to, dwellings. The Housing Corporation is responsible for the supervision and general administration of the Act. Persons receiving loans (743 in 1982–83) are principally owners of economic farms.
Community Housing—The Housing Corporation has authority to grant loans for general housing purposes, i.e., for the benefit of the community in general. The substantial proportion of assistance provided has been in the metropolitan areas with the emphasis on moderate-cost accommodation.
The Housing Corporation through the Community and Housing Improvement Programme (CHIP) has offered Government assistance for a wide range of activities in Neighbourhood Improvement Areas (NIAs) selected by local authorities as areas in need of special renewal attention including community housing.
Since 1975 just over $58 million has been authorised for community housing and urban renewal schemes. However this programme was discontinued in September 1983.
Local authorities are authorised under the Local Government Act to provide loans for housing purposes, to subdivide for such purposes any land vested in a council and not held by it in trust for any particular purpose other than housing, and to sell or lease allotments for housing purposes. Local authorities may also apply to the Local Authorities Loan Board for authorities to purchase land for subdivision for housing. Local authorities are encouraged to play a prominent part in the housing of their citizens.
Maori Housing—For information on financial assistance towards the building of houses, the purchase of building sites and repairs and additions to existing dwellings available to Maoris and other Polynesians, refer to Section 3B of this Yearbook.
WELFARE ORGANISATIONS: Hostels for Young People—Since 1951, religious and welfare organisations have been assisted to establish hostels for young people by subsidies of establishment costs. Since November 1973, the subsidy has been 80 percent, with a limit of $5,000 per young person accommodated. The purpose is to assist young men and women who are working or studying away from their homes, and find it difficult to obtain suitable living accommodation. Subsidies of 50 percent may also be granted for authorised improvements to existing hostels and 75 percent for fire protection work required by the local authority.
From the introduction of the scheme up until 31 March 1983, subsidies totalling $3,049 million have been approved to assist in providing hosted accommodation for 1693 young people, and for upgrading purposes.
The Government also helps with substantial subsidies for university halls of residence established by religious and welfare agencies. Administration is handled by the University Grants Committee.
CORPORATION RENTAL HOUSE CONSTRUCTION—Housing Corporation rental houses and flats (formerly known as State rental houses and flats) have been built since March 1937. These are allocated to tenants on the basis of need. The Housing Corporation acquires and develops land to provide sites for houses and flats and arranges contracts for their construction. The “design-and-build” scheme, whereby the Housing Corporation arranges contracts with private builders or organisations for the construction of houses on land owned by the builders or organisations, was introduced during 1974–75. The scheme provides for the construction of the houses and the purchase of the land within the one contract, and has proved a successful means of achieving integration of rental accommodation in privately-owned and developed subdivisions.
The totals of rental units completed and handed over for occupation during the latest 6 years are shown in the following table. Up to 31 March 1983 there were 88 757 units completed.
| Year Ended 31 March | Rental Units |
|---|---|
| 1978 | 1,611 |
| 1979 | 1,346 |
| 1980 | 1,394 |
| 1981 | 933 |
| 1982 | 420 |
| 1983 | 467 |
Current Policy—The corporation is directing an increasing proportion of its rental programme away from peripheral development into renewal and redevelopment, particularly in the main centres, in order to encourage better utilisation of the existing housing stock and provide greater diversity in the type of accommodation offered. The emphasis on this and other developments remains with smaller schemes where the social and economic impact on the existing urban pattern is less marked. Also, in recognising the need for social diversification in corporation-developed areas, it has been the corporation's policy since the mid-70s to make 50 percent of the sections in new sub-divisions available for sale to the public for private housing.
State Services Housing—State Services houses are houses for Government departments and the armed forces. The total number of such houses erected by the Housing Corporation to 31 March 1983 was 16 350. This includes houses built at the sites of major construction jobs, such as electric power schemes.
Corporation Rental Housing Tender Prices—The following table shows typical tender prices being accepted in the 4 main centres at the ends of a series of years for similar types of 3-bedroom corporation rental houses. In each year the statistics relate to a typical single-unit house of weatherboard and tile roof construction on a flat site, and prices include ancillary improvements such as fences, paths, etc., but exclude land cost. There is no strict comparability year to year in the sample, as new designs have modified floor areas and fittings. Bracketed figures show the cost per square metre including ancillary improvements.
| Year Ended 31 March | Auckland | Wellington | Christchurch | Dunedin | ||||
|---|---|---|---|---|---|---|---|---|
| $ | $ | $ | $ | |||||
| 1978 | 24,209 | (236.88) | 26,356 | (257.89) | 20,801 | (203.54) | 26,565 | (259.94) |
| 1979 | 27,446 | (268.55) | 28,624 | (280.80) | 24,290 | (237.67) | 31,885 | (311.99) |
| 1980 | 34,669 | (339.89) | 33,005 | (322.58) | 29,093 | (285.23) | 33,287 | (326.34) |
| 1981 | 39,246 | (384.76) | 38,861 | (380.99) | 34,951 | (342.66) | 40,079 | (392.93) |
| 1982 | 45,254 | (443.66) | 47,072 | (461.49) | 42,299 | (413.91) | – | – |
| 1983 | 51,812 | (507.96) | 54,158 | (530.96) | 48,525 | (475.74) | 55,482 | (543.94) |
With the reduced demand for housing, building costs have risen markedly. Builders' overhead costs appear to have been spread over a smaller number of units.
JOINT FAMILY HOMES—The Joint Family Homes Act 1964 was designed to encourage the stability of marriage and family life. It provided for a form of ownership in which a husband and wife enjoy equal rights of use, possession, and enjoyment of the family home. While a settlement subsists, neither party may deal separately with his or her interest in the property, but on the death of 1 of them the home becomes wholly the property of the survivor. There are considerable benefits arising from settlement under the Act. Settlements are exempt from gift and stamp duty, and on the death of one spouse an exemption from estate duty may be claimed. In the event of claims by creditors, or the Official Assignee in bankruptcy, the property is protected to the extent of $21,500. Own-your-own flats may be settled under the Act, and an amendment passed in 1974 enables the benefits of settlement to be transferred from one family home to another purchased for the same purpose.
In the latest years the numbers of joint family homes registered have declined sharply. It has been suggested that this is an effect of the Matrimonial Property Act 1976 and its social and legal ramifications.
Joint family homes under the Joint Family Homes Act registered during the latest 6 years are shown in the following table.
| Year Ended 31 March | Homes Settled |
|---|---|
| 1978 | 18,143 |
| 1979 | 15,061 |
| 1980 | 12,515 |
| 1981 | 10,071 |
| 1982 | 8,769 |
| 1983 | 8,152 |
CENSUS INFORMATION: Type of Dwelling—The following table shows the type of dwellings in existence at the Censuses of Population and Dwellings of 1976 and 1981, together with total and average occupancy for each category.
| Type of Dwelling | Number of Dwellings | 1981 Number of Occupants | ||
|---|---|---|---|---|
| 1976 | 1981 | Aggregate | Average | |
* This was included as a separate category at the 1981 Census and will include “Flat (in house)” at the 1976 Census. Also includes house/flat with shared cooking. †Flats attached to shops, etc., were not classified separately for 1981 and will therefore be included in the figure shown for houses with shops. | ||||
| Occupied dwellings— | ||||
| Permanent private dwellings— | ||||
| Detached house | 742,768 | 792,285 | 2,578,740 | 3.25 |
| Row, cluster, terrace, or town houses linked together | 34 945* | 23,946 | 52,131 | 2.18 |
| House with other private dwelling | 14,370 | 74 724* | 175,650 | 2.35 |
| House and shop/business premises | 4,673 | 7 833† | 23,229 | 2.97 |
| Total houses | 796 756 | 898 788 | 2 829 750 | 3.15 |
| Flat (in single or multi-storey block) | 98,736 | 100 536 | 175 071 | 1.74 |
| Flat (in house) | 19,234 | |||
| Flat and shop/business premises | 3,605 | |||
| Total flats | 121 575 | 100 536 | 175 071 | 1.74 |
| Bach, crib, hut | 4,926 | 3,789 | 7,251 | 1.91 |
| Total permanent private dwellings | 923 257 | 1 003 110 | 3 012 072 | 3.00 |
| Temporary private dwellings— | ||||
| Mobile residence (caravan, etc.) | 2,869 | 1,878 | 4,095 | 2.18 |
| Other (tent, shed, etc.) | 358 | 501 | 1,287 | 2.57 |
| Total temporary private dwellings | 3 227 | 2 376 | 5 382 | 2.27 |
| Non-private dwellings— | ||||
| Hotel, motel, guesthouse | 2,416 | 2,307 | 41,430 | 17.96 |
| Boarding/rooming house | 778 | 468 | 5,094 | 10.88 |
| Private or public hospital | 454 | 456 | 27,960 | 61.32 |
| Education institution | 350 | 387 | 23,433 | 60.55 |
| Other | 2,778 | 2,775 | 60,363 | 21.75 |
| Total non-private dwellings | 6 776 | 6 393 | 158 280 | 24.76 |
| Total occupied dwellings | 933 260 | 1 011 882 | 3 175 737 | 3.14 |
| Unoccupied dwellings— | ||||
| Occupants temporarily away | 23,945 | 30,224 | ||
| Empty habitable dwellings (to let, for sale, etc.) | 27,518 | 28,695 | ||
| Holiday residence | 33,143 | 38,192 | ||
| Total unoccupied dwellings | 84 606 | 97 111 | ||
| Dwellings in course of erection | 14,284 | 6,836 | ||
NOTE: 1981 Census figures in tables have been rounded using simple random rounding to base three. Individual figures may not necessarily sum to give the stated totals.
Between the 1976 and 1981 Censuses of Population and Dwellings the total number of dwellings occupied on the night of the census increased from 933 260 in 1976 to 1 011 882 in 1981, a rise of 78 622, or 8.4 percent. This rate of increase was considerably in excess of that for population. In addition, unoccupied dwellings increased from 84 606 to 97 111.
In 1981 the average number of occupants per permanent private dwelling was 3.00, compared with 3.22, five years earlier.
Unoccupied dwellings are restricted to buildings intended for human habitation, e.g., houses, flats, cottages, etc., and the category omits unoccupied caravans, tents, etc.; it also excludes unoccupied dwellings which are both deserted and dilapidated.
Tenure of Dwelling—The following table classifies the occupied permanent private dwellings according to tenure. Figures in these tables have been rounded using simple random rounding to base three. Individual figures therefore will not necessarily sum to give the stated totals.
| Tenure | 1976 | 1981 | ||
|---|---|---|---|---|
| Permanent Private Dwellings | Percent of Total Specified | Permanent Private Dwellings | Percent of Total Specified | |
| Owned without mortgage | 253,567 | 27.6 | 287,343 | 28.8 |
| Owned with mortgage | 387,078 | 42.1 | 423,459 | 42.4 |
| Rented or leased | 248,356 | 27.0 | 253,386 | 25.4 |
| Free with job | 22,678 | 2.5 | 21,213 | 2.1 |
| Free not with job | 8,649 | 0.9 | 12,321 | 1.2 |
| Not specified | 2,929 | 5,388 | ||
| Total | 923 257 | 100.0 | 1 003 110 | 100.0 |
Amenities of Dwellings—The following tables present the various amenities, as at the 1976 and 1981 Censuses of Population and Dwellings used by the occupants of permanent private dwellings.
| Amenities | 1976 | 1981 | ||
|---|---|---|---|---|
| Households | Percentage of Households | Households | Percentage of Households | |
| Caravan | 48,772 | 5.3 | 80,646 | 8.0 |
| Deep freeze | 647,687 | 70.2 | 729,417 | 72.7 |
| Electric clothes dryer | 351,042 | 38.0 | 454,194 | 45.3 |
| Fully automatic clothes washing machine | 354,715 | 38.4 | 514,893 | 51.3 |
| Garage or carport | 668,943 | 72.5 | ||
| Telephone | 829,786 | 89.9 | 918,609 | 91.6 |
| Television set— | ||||
| Black and white only | 625,500 | 67.7 | 231,276 | 23.1 |
| Colour only | 159,698 | 17.3 | 564,741 | 56.3 |
| Both | 40,225 | 4.4 | 109,830 | 10.9 |
| Means of Cooking | 1976 | 1981 | ||
|---|---|---|---|---|
| Households | Percent | Households | Percent | |
| Electricity | 829,940 | 89.9 | 925,404 | 92.3 |
| Gas, including rock gas | 61,737 | 6.7 | 56,760 | 5.7 |
| Wood, coke, coal | 23,562 | 2.6 | 16,773 | 1.7 |
| Other | 1,240 | 0.1 | 285 | |
| No means | 162 | 186 | ||
| Not specified | 6,616 | 0.7 | 3,702 | 0.4 |
| Total | 923 257 | 100.0 | 1 003 110 | 100.0 |
| Means of Heating | 1976 | 1981 | ||
|---|---|---|---|---|
| Households | Percent | Households | Percent | |
| Electricity only | 288,476 | 31.2 | 319,455 | 31.8 |
| Electricity and coal, coke, or wood | 334,946 | 36.3 | 314,769 | 31.4 |
| Electricity and gas | 17,990 | 1.9 | 19,869 | 2.0 |
| Electricity and oil and/or kerosene | 46,766 | 5.1 | 31,056 | 3.1 |
| Electricity and other combinations | 61,428 | 6.7 | 38,751 | 3.9 |
| Gas only, including rock gas | 14,520 | 1.6 | 27,726 | 2.8 |
| Oil or kerosene only | 24,887 | 2.7 | 19,629 | 2.0 |
| Wood, coke, coal only | 100,166 | 10.8 | 174,237 | 17.4 |
| Other | 21,473 | 2.3 | 26,385 | 2.6 |
| Not specified and no means | 12,605 | 1.4 | 31,236 | 3.1 |
| Total | 923 257 | 100.0 | 1 003 113 | 100.0 |
| Hot Water Service* | 1976 | 1981 | ||
|---|---|---|---|---|
| Households | Percent | Households | Percent | |
| * Principal means. | ||||
| Electric | 848,944 | 92.0 | 919,398 | 91.7 |
| Gas | 25,862 | 2.8 | 34,023 | 3.4 |
| Wood, coke, or coal range | 24,962 | 2.7 | 31,905 | 3.2 |
| Wet back | 8,187 | 0.9 | ||
| Other | 7,401 | 0.8 | 11,775 | 1.2 |
| No hot water service | 1,720 | 0.2 | 1,329 | 0.1 |
| Not specified | 6,181 | 0.7 | 4,586 | 0.5 |
| Total | 923 257 | 100.0 | 1 003 113 | 100.0 |
NOTE: Figures in these tables have been rounded using simple random rounding to base three. Individual figures will not necessarily sum to give stated totals.
New questions asked at the 1981 Census revealed that 79.9 percent of households (801 030) had one or more private cars, and 13.3 percent (133 488) had the use of a business car.
Households with one or more motor vehicles available for use by household members (that is vehicles owned privately or by a company or business firm) numbered 832 857, or 83.0 percent of households compared with 79.1 percent of households at the 1971 Census when the question was last asked.
Boats were present in 12.5 percent of households in 1981.
Materials of Outer Walls and Roofs—The following table analyses the composition of outer walls of permanent private dwellings in 1981 by their roofing material. Each unit of a block of flats constitutes a separate dwelling for census purposes. The roofing category “Not Applicable” comprises those dwellings (mainly flats) which had a second dwelling overhead.
NOTE: Changes to the census question on building materials for 1981 have meant that the categories given below are not directly comparable with classifications published for previous censuses.
| Main Material of Outer Walls | Roof Material | Total | |||||
|---|---|---|---|---|---|---|---|
| Galvanised Iron or Tin | Pressed Metal Tiles | Tiles of Clay or Concrete | Asbestos, Cement, etc. | Other or Not Specified* | Not Applicable | ||
| * Includes 13 695 dwellings with aluminium roofs, 6879 with two or more types of roofing materials, and 3489 dwellings with types of roofing materials other than those specified here. | |||||||
| Wood, timber | 350,817 | 32,298 | 77,250 | 9,564 | 13,902 | 4,530 | 488,358 |
| Brick, clay | 71,223 | 28,212 | 65,829 | 2,139 | 4,092 | 1,860 | 173,355 |
| Roughcast, stucco | 30,063 | 2,205 | 7,749 | 1,230 | 1,947 | 294 | 43,488 |
| Poured concrete | 14,874 | 1,329 | 6,138 | 1,053 | 1,365 | 3,111 | 27,870 |
| Exterior wallboard | 74,055 | 17,199 | 23,793 | 3,525 | 3,738 | 1,026 | 123,336 |
| Artificial stone or concrete blocks | 57,333 | 28,263 | 26,958 | 1,860 | 3,819 | 6,699 | 124,929 |
| Galvanised iron | 3,786 | 183 | 126 | 39 | 135 | 42 | 4,311 |
| Aluminium | 2,529 | 1,917 | 420 | 75 | 243 | 15 | 5,202 |
| Other | 2,259 | 1,236 | 1,101 | 63 | 225 | 45 | 4,926 |
| Not specified | 2,391 | 411 | 816 | 96 | 3,366 | 252 | 7,332 |
| Total | 609 327 | 113 247 | 210 180 | 19 641 | 32 844 | 17 877 1 | 1 003 113 |
NOTE: Figures in these tables have been rounded using simple random rounding to base three. Individual figures will not necessarily sum to give stated totals.
Easily the most popular type of house construction in New Zealand is wooden walls and a roof covered with galvanised iron. This description applied to 350 817 permanent private dwellings in 1981, or 35.4 percent of those specifying both wall and roof type, but it should be noted that this was a decrease on the equivalent figure of 374 797 at the 1976 Census.
Insulation of Walls and Ceilings—The 1981 Census included a question on the presence of heat-insulation materials in outer walls and ceilings of permanent private dwellings. An analysis of the data obtained follows. The inquiry was restricted to those material specifically installed as insulation—in most cases fibreglass pads or loose-fill or aluminium foil.
| Outer Wall Insulation | Ceiling Insulation | Total* | |||
|---|---|---|---|---|---|
| Present | Not Present | Not Known | Not Specified or Not Applicable | ||
| * Permanent private dwellings. | |||||
| Houses | |||||
| Present | 151,776 | 7,737 | 1,137 | 1,770 | 162,426 |
| Not present | 226,986 | 257,049 | 6,099 | 3,591 | 493,734 |
| Not known | 62,424 | 14,334 | 72,939 | 4,041 | 153,741 |
| Not specified | 49,698 | 11,871 | 3,177 | 15,003 | 79,743 |
| Total | 490 884 | 290 991 | 83 352 | 24 405 | 889 644 |
| Other Dwelling Types | |||||
| Present | 8,457 | 411 | 234 | 408 | 9,513 |
| Not present | 8,625 | 32,139 | 2,034 | 5,490 | 48,288 |
| Not known | 6,198 | 3,006 | 29,721 | 6,897 | 45,822 |
| Not specified | 3,048 | 1,596 | 1,155 | 4,047 | 9,849 |
| Total | 26 328 | 37 152 | 33 144 | 16 842 | 113 472 |
A total of 517 203 dwellings at census date had insulated ceilings and of these 160 230 (31.0 percent) also specified insulated walls. In all, wall insulation was present in 171 939 dwellings.
TENANCY—Under the Rent Appeal Act 1973 (administered by the Housing Corporation), Rent Appeal Boards have been appointed to determine an application, by either a landlord or tenant, to set an equitable rent for a dwellinghouse. The Act limits the amount of rent in advance and bond that can be demanded, as well as prohibiting a landlord demanding consideration other than rent or refusing to grant a tenancy because the prospective tenant has children. The Tenancy Act 1955 governs rents and conditions of possession of certain private tenancies in existence before 18 November 1961. All private tenancies since that date and all business premises without exception are no longer governed by the Act. Where the Act applies, a landlord or tenant may apply to a rents officer or the District Court to fix a fair rent, effect certain repairs, prevent oppressive conduct, or have the tenancy freed from controls under the Act.
FURTHER INFORMATION—Publications dealing with housing include the following. Report of the Housing Corporation of New Zealand (Parl. paper B. 13).
Report of the National Housing Commission (Parl. paper G. 30).
Report of the Building Performance Guarantee Corporation (Parl. paper B. 13A).
Department of Statistics publications—
Building Activity Bulletin BC/MP/00—(Annual).
Building Activity Bulletin BC/QP/00—(Quarterly and annual).
Monthly Abstract of Statistics—(Monthly).
Building Statistics—(Annual).
Census of Population 1976—Vol. 8 Maori Population and Dwellings.
Census of Population 1976—Vol. 9 Dwellings.
Census of Population 1981 Volumes.
Census of Population 1981 Bulletins—Series of 10 on Regional Statistics.
Census of Building and Construction 1978–79—(5-yearly). Results of the 1978–79 Census of
Building and Construction were also published in Bulletin form.
National Housing Commission Publications—
Housing in New Zealand (Report of Commission of Inquiry 1971).
Housing in New Zealand (1983).
The Demand for Housing in New Zealand Vol. 1 and 2. (1979).
Housing Preferences in New Zealand (1979).
New Zealand's Housing Requirements, 1976–86 (1976).
Housing Finance—Seminar Proceedings (1979).
Ministry of Works and Development Statement (Parl. paper D. 1).
Housing Corporation of New Zealand Annual Accounts and Statistics.
Report of the Valuation Department (Parl. paper G. 26).
Urban Real Estate Market in New Zealand—Valuation Department.
National Housing Commission publications, which include a considerable number of other research papers and reports, are available from the National Housing Commission, P.O. Box 1789, Wellington.
Table of Contents
DEMAND AND SUPPLY TODAY—From the end of World War II until recent years the demand for energy in New Zealand grew on average by 4 percent annually. This was a result of the expansion and diversification of the economy, rising living standards, increasing population, and the falling price of energy in real terms. Energy policies were aimed principally at providing reliable and cheap supplies to keep up with the demand. From late 1973 the emerging energy crisis brought about a new emphasis on conservation.
The table below illustrates the trends in the consumption of primary energy since 1924. The term “primary energy” refers to energy as it is first obtained from natural resources. Broadly, this means that coal is accounted for as it is mined, oil products as they are imported in various degrees of refinement, and natural gas as it is taken from the wells at Kapuni and Maui. Thirteen percent of our primary oil requirements were derived from Maui and Kapuni condensate in 1981, and in 1982, 20 percent came from the Kapuni and Maui field. This decreased in 1983 to 17.6 percent from Kapuni and Maui crude oil.
Primary electricity is electricity generated from hydro and geothermal sources. For these operation efficiencies are ignored, and the measure of the primary energy is the electricity generated. This is justifiable in the case of hydro-electricity, where the generation efficiency is high, but a large quantity of energy is wasted in producing electricity from geothermal heat. However, the wasted energy is low grade, and for the sake of simplicity is not shown in the table.
In a number of tables in this section, energy is measured in petajoules. The joule is the metric unit of energy and makes comparisons among the different forms of energy possible. For convenience, the petajoule (PJ) or 1015 joules is often used.
| Calendar Year | Coal | Wood | Oil | Natural Gas | Primary Electricity | Total* | Imported Oil as Percentage of Total | |
|---|---|---|---|---|---|---|---|---|
| Imported | Indigenous | |||||||
* Because of rounding, totals may differ slightly from sums of individual figures. †Do not include figures for international transport. ‡Provisional. | ||||||||
| Petajoules | ||||||||
| 1924 | 75 | 10 | – | – | 0.5 | 86 | 11 | |
| 1934 | 56 | 19 | – | – | 3 | 78 | 24 | |
| 1944 | 72 | 30 | – | – | 7 | 109 | 28 | |
| 1954 | 66 | 59 | – | – | 14 | 139 | 42 | |
| 1964 | 66 | 103 | – | – | 34 | 203 | 51 | |
| 1974 | 62 | 193 | 8 | 14 | 55 | 332 | 58 | |
| 1978 | 49 | 166 | 26 | 59 | 60 | 360 | 46 | |
| 1979 | 47 | 175 | 18 | 47 | 70 | 357 | 49 | |
| 1980 | 54 | 184 | 16 | 37 | 73 | 364 | 51 | |
| 1981† | 56x | 1 | 139 | 21 | 46 | 74 | 337 | 42 |
| 1982† | 46x | 23 | 127x | 32x | 81 | 69 | 378 | 34 |
| 1983†‡ | 51 | 23 | 117 | 33 | 87 | 74 | 385 | 30 |
The following table illustrates the trends in consumer energy consumption over the same period as in the previous table. Consumer energy is accounted for in the form and quantity in which it is distributed to the consumer. “Electricity” includes the electricity which is generated in thermal stations burning coal, oil, or natural gas, and “gas” included the small quantity of gas manufactured from coal, naphtha, and natural gasoline.
| Calendar Year | Solid* | Oil | Gas | Electricity | Total |
|---|---|---|---|---|---|
* Includes wood. †Provisional. | |||||
| Petajoules | |||||
| 1924 | 59 | 5 | 2 | 1 | 66 |
| 1934 | 49 | 19 | 2 | 3 | 73 |
| 1944 | 62 | 30 | 2 | 8 | 102 |
| 1954 | 55 | 59 | 2 | 16 | 132 |
| 1964 | 48 | 90 | 2 | 30 | 170 |
| 1974 | 41 | 151 | 7 | 58 | 257 |
| 1979 | 40 | 149 | 11 | 67 | 267 |
| 1980 | 38 | 158 | 15 | 70 | 281 |
| 1981 | 51 | 143 | 23 | 69 | 286 |
| 1982 | 59x | 142 | 26x | 76x | 303x |
| 1983† | 60 | 134 | 38 | 80 | 312 |
The supply and demand of energy in 1983 is shown in detail in the following table. Figures are provisional.
| Supply and Demand of Energy | Source of Energy | Total | |||
|---|---|---|---|---|---|
| Solid Fuel | Oil | Gas | Electricity | ||
* Decreases in stock levels appear as negative stock changes. Such decreases in stocks have to be added to indigenous production (+ imports – exports) in order to obtain figures of energy consumed. Increases in stocks have to be deducted from production in order to obtain figures of energy consumed. †Includes fuel used in gas manufacture, and production of solid fuels such as cones from carbonisation plants, etc. Market shares of the various energy resources in different sectors of the economy during 1983 are shown on a percentage basis in the following table. | |||||
| Petajoules | |||||
| Indigenous production | 83.18 | 32.98 | 87.29 | 74.44 | 277.89 |
| Plus Imports | 0.01 | 142.65 | – | – | 142.66 |
| Less Exports | 6.21 | 3.20 | – | – | 9.41 |
| Less International Transport | – | 17.32 | – | – | 17.32 |
| Stock changes* | 3.73 | 4.81 | – | – | 8.54 |
| Primary energy consumed | 73.25 | 150.28 | 87.29 | 74.44 | 385.26 |
| Less Used in electricity generation | 8.89 | 0.80 | 44.60 | – | 54.29 |
| Less used in liquid fuel production | – | 114.95 | – | 0.15 | 115.10 |
| Plus secondary production | 0.40 | 109.49 | 1.11 | 17.46 | 128.46 |
| Total energy available | 64.76 | 144.02 | 43.80 | 91.75 | 344.33 |
| Less— | |||||
| Consumption by energy sector and losses† | 5.92 | 3.30 | 5.80 | 11.55 | 26.57 |
| Non-energy use | – | 4.64 | – | – | 4.64 |
| Total consumer energy (calculated) | 58.84 | 136.08 | 38.00 | 80.20 | 313.12 |
| Total consumer energy (observed) | 59.83 | 134.22 | 38.00 | 80.20 | 312.25 |
| Energy demand— | |||||
| Industry | 37.67 | 24.64 | 21.75 | 30.41 | 114.48 |
| Transport | – | 101.08 | 2.41 | 0.11 | 103.60 |
| Domestic | 17.98 | 1.27 | 3.60 | 33.09 | 55.93 |
| Commercial and other uses | 4.18 | 7.23 | 10.23 | 16.59 | 38.24 |
| Source | Industry and Commerce | Transport (Incl. International Transport) | Households | Thermal Electricity Generation |
|---|---|---|---|---|
| Percent | ||||
| Oil | 20.87 | 97.91 | 2.27 | 1.48 |
| Coal | 27.41 | – | 32.14 | 16.37 |
| Gas (natural and manufactured) | 20.94 | 2.00 | 6.43 | 82.15 |
| Electricity | 30.78 | 0.09 | 59.16 | – |
| Total | 100.00 | 100.00 | 100.00 | 100.00 |
Oil Usage—Until the oil crisis in 1973 and the 4-fold increase in the price of oil, there had been a rapid growth in the use of oil in New Zealand. This had been a result of its declining cost in real terms, its versatility, its convenience and the increasing affluence of the population.
In the year ended 31 December 1983, New Zealand used a total of 3 390 000 tonnes of petroleum products. This figure for the internal consumption of petroleum products in 1983 is broken down in the following table. Figures for the 2 previous years are included for purposes of comparison.
| Petroleum Product | 1981 | 1982 | 1983 | |||
|---|---|---|---|---|---|---|
| * Provisional. | ||||||
| Tonnes (000) | Percent | Tonnes (000) | Percent | Tonnes (000) | Percent | |
| Light flash distillate naphtha | 4 | 0.1x | 3 | 0.1x | 5 | 0.2 |
| Premium gasoline | 1,608 | 44.5x | 1,637 | 49.2x | 1,582 | 50.4 |
| Regular gasoline | 40 | 1.0x | 47 | 1.4x | 83 | 2.6 |
| Aviation gasoline | 21 | 0.6 | 18 | 0.5x | 18 | 0.6 |
| Aviation turbine kerosene | 100x | 3.0x | 104x | 3.1x | 111 | 3.5 |
| Kerosene | 15 | 0.4 | 15 | 0.5x | 14 | 0.4 |
| Light diesel oil | 981 | 27.1x | 924x | 27.8x | 912 | 29.1 |
| Marine diesel | 27 | 0.7 | 7x | 0.2x | 7 | 0.2 |
| Fuel oils (all types) | 579 | 16.0x | 357x | 10.7x | 191 | 6.1 |
| Bitumen | 97 | 2.7x | 88 | 2.6x | 90 | 2.9 |
| Lubricants | 53 | 1.5x | 45 | 1.4x | 45 | 1.4 |
| White spirits | 15 | 0.4 | 5 | 0.2x | 5 | 0.2 |
| Paraffin waxes | 4 | 0.1 | 5 | 0.2x | 5 | 0.2 |
| Petroleum coke | 70 | 1.9x | 70 | 2.1x | 70 | 2.2 |
| Total | 3 614x | 100.0 | 3 325x | 100.0 | 3 138 | 100.0 |
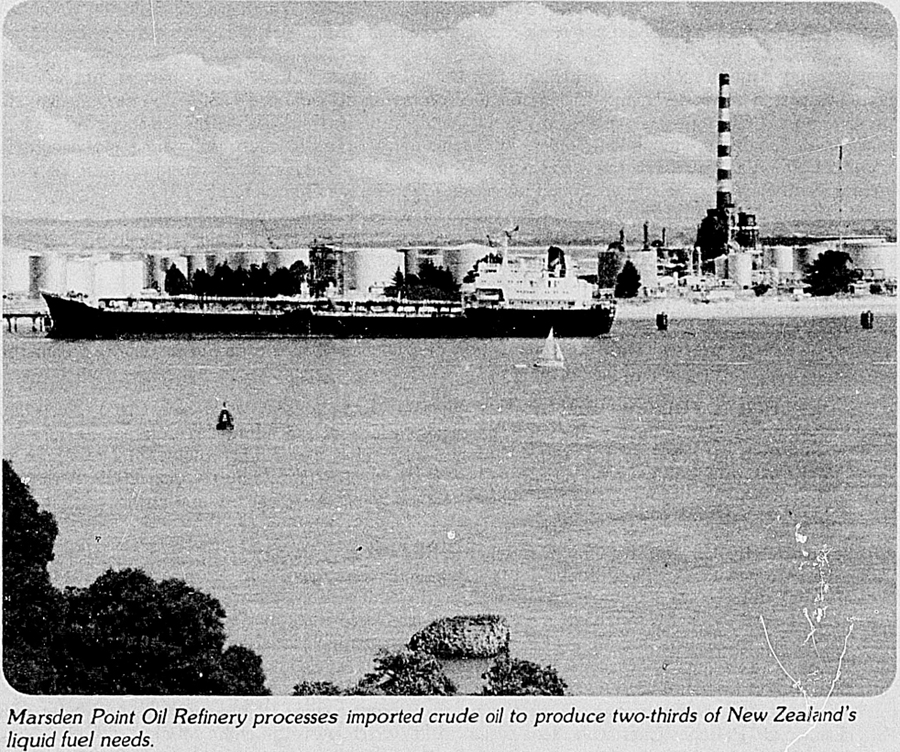
In 1983, 55 percent of New Zealand's imports of oil came in as crude and partly refined feedstocks for refining at the Marsden Point refinery, while the remainder was imported as refined products because of a lack of refining capacity. Most of the latter came from Australia, Singapore, and Bahrain. The main sources of supply for crude petroleum are Saudi Arabia and Indonesia. (See Section 23c Imports.)
In 1983, 51 percent of the Marsden Point refinery's annual output was petrol, 25 percent was diesel, 19 percent light and heavy fuel oils, and 5 percent was bitumen.
Oil Stockholding—Pursuant to its membership of the International Energy Agency, New Zealand is required to hold 100 days' gross stock cover for oil imports. This is held by the oil industry (at main ports, the refinery, and up-country depots) and the Government (at Electricity Division oil-fired power stations and as a National Strategic Petroleum Reserve of 25 days' diesel cover at the uncommissioned Marsden B power station).
Oil stocks at the main ports are maintained within a Target Planning Zone (TPZ) of efficiency under normal operations, which range from 22–31 days' cover for motor gasoline, 33–41 days' cover for automotive diesel, and 95–162 days for aviation gasoline.
Development of the Maui Field—The Maui field is being developed in 2 stages: Stage One consists of the installation of Maui Platform A, drilling of production wells, the installation of separate submarine pipelines for gas and condensate, and the on-shore processing facilities for the Maui production station at Oaonui. Treated gas is distributed by transmission pipelines to the New Plymouth and Huntly power stations. Maui gas is available for direct use by domestic and industrial consumers.
Commissioning of Stage One commenced in May 1979.
Stage Two of the development provides for a second platform, Maui Platform B, additional and independent submarine pipelines, and an expansion of the on-shore processing facilities.
Stage One Development—The first drilling and production platform, Maui Platform A, was installed some 37 km from the Taranaki coast, close to the Maui 3 exploration well, in a water depth of some 110 metres. Fourteen production wells have been drilled from the platform. The tower base of the platform was fabricated in Japan and was upended on location in early January 1976. Difficulties arose during the 1975–76 construction season as a consequence of severe weather and installation work was suspended in June 1976. Installation work recommenced with a larger construction vessel in December 1976.
The piling of the tower to the sea bed and the installation of the modules, living quarters, and helideck were completed late in 1977 and drilling operations commenced early in 1978. A 254 mm condensate pipeline and a 610 mm gas pipeline carry the condensate and the gas to the on-shore processing facilities at the Maui Production Station at Oaonui. The laying of these submarine pipelines also commenced in January 1976 but was suspended in June 1976, again as a consequence of the very severe weather. Work recommenced in December 1976 and was completed in 1977.
At Oaonui, 2 gas refrigerator trains, each with a capacity of approximately 7 million cubic metres a day, process the gas stream to meet the gas delivery specifications, and 2 stabiliser trains, each with a capacity of 1500 tonnes per day, stabilise the condensate to enable subsequent sea shipment to the Whangarei refinery.
The Maui A platform, submarine pipelines,' and onshore gas processing station were commissioned in May 1979.
The decision to proceed with the construction of a second platform has been deferred until the demand for supplies of natural gas increases.
GAS DEPLETION POLICY—Gas has been allocated to reticulation (including CNG), electricity generation, methanol manufacture, synthetic gasoline production, and ammonia/urea manufacture.
The projects listed below, if they all proceed, will fully utilise the field up to Government's present depletion policy, that is, to have 50 percent of the reserves in the ground by the year 2000, A change to this depletion policy will be needed, or the present programme cut back, if any further gas projects are to be contemplated.
Organisations for Developing Gas/Condensate Resources—On 31 March 1978, the State-owned Petroleum Corporation of New Zealand Ltd. (Petrocorp) was formed to take responsibility for the Government's interests in petroleum and natural gas. Present subsidiaries are: Natural Gas Corporation Ltd. (NGC), responsible for purchase, transport, and wholesale marketing of natural gas and liquefied petroleum gas (LPG); Offshore Mining Co. Ltd. (OMC), responsible for the Government's participation in the Maui field through its 50 percent shareholding in Maui Development Ltd. (MDL), which manages the Maui project for extraction and onshore delivery of gas and condensate; Petrochemical Corporation of New Zealand Ltd. (Petrochem), which owns the ammonia/urea plant, jointly with Alberta Gas Chemicals Ltd., Petragas Chemicals New Zealand Ltd., which owns the chemical methanol plant; and
Petroleum Corporation of New Zealand (lixploration) Ltd. (Petrocorp Exploration), which holds the Government's interests in offshore petroleum exploration and also conducts its own onshore exploration programme. Petrocorp holds a 60 percent interest in the Gas Liquids Investigating Company Limited. The company was formed with Shell BP and Todd in September 1982 to establish the economic viability of producing petrochemicals from gas liquids (ethane, propane and butane) extracted from the Maui and Kapuni gas streams. Liquigas has been formed to distribute LPG nationally to bulk installations. It consists of 6 participants: Rockgas, NZIG, Offshore Mining Company, Shell, BP, and Todd Petroleum.
ENERGY PLANNING FOR THE FUTURE—Until late 1973 there seemed to be little difficulty in meeting the expanding demand for energy from a combination of indigenous resources and imported petroleum, although New Zealand had been readily moving into a position of increased dependence on imported fuel. The oil supply embargo announced in October 1973 by the Organisation of Arab Petroleum Exporting Countries sounded a clear warning of the danger this entailed. As well as dramatically illustrating the fact that oil was no longer a reliable form of energy in terms of supply, the four-fold price increases that followed the lifting of the embargo meant that oil was no longer a cheap commodity.
New Zealand's oil import bill rose from $114 million in 1973 to an estimated $1,405.4 million in 1983, and is now 5 percent of the gross national product.
The rising cost of imported petroleum, coupled with uncertainty about the reliability of future supplies, has made it necessary for New Zealand to adopt policies aimed at reducing petroleum consumption and decreasing its dependence on imported energy. This is being achieved on several broad fronts: by oil and gas exploration; by accelerating the development of all indigenous energy resources, especially those that can substitute for petroleum; by developing and promoting energy conservation programmes; and by expansion of refining facilities to diversify sources of imported oil. Supporting these strategies is a research and development effort which is spearheaded by the New Zealand Energy Research and Development Committee (NZERDC) established in 1974, and the Liquid Fuels Trust Board, established in 1978. In the international sphere, New Zealand, as a member of the International Energy Agency (IEA), is committed to a policy consistent with sound economic and social planning to reduce dependence on imported oil.
Ministry of Energy—Even before the outbreak of the oil crisis, concern had been felt about the lack of co-ordination in New Zealand's energy policy making. This concern led to the formation of the Ministry of Energy Resources in 1972.
A further development in the co-ordination of energy policy took place in May 1977 when the Government announced that the Ministry of Energy Resources, the New Zealand Electricity Department, and the Mines Department were to be merged into a single department responsible for all energy policy, planning, and operations. The new Ministry of Energy came into being on 1 April 1978.
The Ministry's principal function is the formulation, implementation, co-ordination, and continuing review of effective and efficient energy policies for New Zealand. It achieves this through an organisation consisting of a central planning/policy group and 3 operating divisions for electricity (Electricity Division), coal production and supply (Mines Division), and oil and gas (Oil and Gas Division).
Public Participation in Planning—In May 1978 Goals and Guidelines: An Energy Strategy for New Zealand — Public Discussion Draft was published by the Minister of Energy Resources, setting out for public comment the goals and guidelines for an energy policy for New Zealand. This document was the starting point for public discussion and submissions were summarised in Digest of Public Debate. Subsequently, seminars were held on Transport Fuels, Energy Distribution, Environmental Perspectives, and Energy Forecasting. This has led to an annual energy plan.
Annual Energy Plan—Since 1980 the Ministry of Energy has prepared an overall energy plan. The plan presents forecasts and developments for liquid fuels, electricity, gas, coal and conservation sectors. Development of the energy plan is co-ordinated by the Planning Division of the Ministry, with consultation with appropriate private sector, local body, and Government agency interests. Public input into the energy plan is made both through the Energy Advisory Committee and directly to the Ministry of Energy.
Energy Advisory Committee—To provide a basis for continued public involvement in energy planning, the Energy Advisory Committee was established in 1980. The prime role of the committee is to review each annual Energy Plan and make recommendations for future planning. It provides public input into the energy planning process.
The committee has the following terms of reference:
To examine the current process of forecasting and planning energy supply and demand.
To assess the social, environmental, economic, and technical implications of current energy planning.
To collect relevant opinion from the wider public through submission and representation.
To advise the Secretary of Energy on these matters and to subsequently make these findings public.
To carry out other such investigations as the Secretary of Energy may from time to time agree. It consists of 12 members who are selected as representatives of consumers, environmental and social interests, and professional and academic interests.
Indigenous Energy Resource Development Policies—There are 2 main goals to planning of future energy supplies.
The promotion of the development of indigenous energy resources both to contribute to national energy supply and to produce export-led economic growth;
The reduction of New Zealand's dependence on imported oil by the steady introduction of substitutes selected to minimise increases in the cost of energy supply and use.
One of the main sectors where this policy is being implemented is the development of natural gas. The use of CNG as a vehicle fuel and the conversion of Maui gas to gasoline will displace imported oil and, along with coal, reticulated gas will provide an increasing proportion of industrial heat. These developments, together with increased condensate supplies resulting from the higher gas offtakes, should make New Zealand 50 percent self-sufficient in liquid fuels by 1987.
The policy is also being pursued in the coal sector, with plans to more than double New Zealand's coal production by 1996. Most of the new production in the South Island will go to exports, and in the North Island to electricity generation and steel manufacture.
ENERGY RESOURCES—The following table sets out New Zealand's estimated recoverable fossil fuel resources. The oil and gas reserves are estimated as at 1 April 1983 and include the Maui, Kapuni, and McKee fields. As can be seen, the major resources deficiency is in liquid petroleum fuels, and the country will continue to be a net petroleum importer. It will, however, become relatively less dependent on imports for a decade or so as natural gas is brought into greater use.
| Fuel | Reserves | |
|---|---|---|
| * Year ended 31 March. | ||
| Coal | Measured | 4 881 PJ (220 million tonnes) |
| Indicated | 17 210 PJ (2 170 million tonnes) | |
| Inferred | 19 767 PJ (1 308 million tonnes) | |
| Total | 41 858 PJ* (3 698 million tonnes) | |
| Oil | Proven and probable reserves with a 65% probability level: 1009 PJ (21.7 million tonnes) | |
| Gas | Proven and probable reserves with a 65% probability level: 5864 PJ (163 000 million m3) | |
The geothermal resource as it is known at present is restricted geographically to the thermal belt which extends from Mt. Ruapehu to White Island, Tauranga, and Northland.
Geothermal energy is used for electricity generation; process heat in industry; for industrial, commercial, and domestic space heating; and hot water heating.
Petroleum Demand Restraint Regulations—Up to the present time the Government had used the authority of the Economic Stabilisation Act 1948 to institute petroleum demand restraint measures. However, regulations made under this Act must directly relate to the economic stability of New Zealand and are therefore always prone to action in the Court. Other Acts which could have been used are the Public Safety Conservation Act 1932 (in emergency situations) and the International Energy Agreement Act 1976 (for long-term shortages; and only with the agreement of the International Energy Agency).
Parliament agreed on the need for a separate Act to cover all petroleum demand restraint regulations. As a result the Petroleum Demand Restraint Act 1981 was passed. The Act makes provision for the imposition of measures restraining the demand for petroleum products or ensuring equitable distribution of petroleum products that are, or are likely to be, in short supply in New Zealand.
The Minister of Energy must consult representatives of oil suppliers and users of petroleum products before giving directions. The Ministry would therefore under normal circumstances discuss the proposed regulations with members of the 3 Demand Restraint Advisory Committees.
Prospecting and Mining—Prospecting and mining tor petroleum in New Zealand is governed by the Petroleum Act 1937. This gives the Minister of Energy the authority to grant petroleum prospecting and mining licences over land and marine areas including the New Zealand continental shelf.
Licensing activity accelerated considerably in 1981 as a result of the block offers accompanied by extensive advertising. As at 31 December 1983 there were 39 petroleum prospecting licences covering 269 400 km2 of New Zealand land, territorial sea, and continental shelf. Four petroleum mining licences covered 1045.04 km2, which is made up of the Kapuni McKee, Kaimiro onshore fields, Maui offshore field, and the 2 small licences in Hawke's Bay and New Plymouth.
Activity in the search for petroleum is being maintained. Nine on-shore wells were drilled in 1983: 5 wells drilled on overthrust structures north of the McKee field, indicating the presence of oil and gas; 2 wells in the Kapuni field; the Stratford 1 well, which was also tested for oil and gas; and Tuateka 1, which was dry. At the end of the year, drilling of Ngatoro 1 was taking place.
The McKee licence has been extended to include part of the structure drilled by Pouri 1 and further extensions are anticipated. Initial production from this field is now estimated to be 4800 barrels a day. Offshore drilling programmes were initiated in 1983 and at the end of the year 3 rigs were drilling in New Zealand waters. Two offshore wells were completed: Raikura 1 in the Great South Basin, which was dry; and Moki 1 offshore Taranaki, which produced 600 barrels of oil a day during testing. The 3 offshore wells being drilled at the end of the year were Pukaki 1 in the Great South Basin, and Ariki 1 and Taimana 1 offshore Taranaki.
Geothermal Development—The Geothermal Energy Amendment Act 1977 implemented 2 new policies relating to geothermal energy. In general, the Crown will develop and operate geothermal fields. A new pricing policy stated that the price is to reflect the worth of the resource to the user, taking account of the costs of alternative energy sources, and the costs of adapting geothermal energy to the user's requirements. When geothermal energy is supplied other than by the Crown, a rental is payable to the Crown based on the same principle.
By far the largest user of geothermal energy is the Electricity Division of the Ministry of Energy, which owns and operates the Wairakei goethermal power station, a baseload station supplying 1200 ± GWh of electricity per year. A second geothermal power station is planned for Ohaki with an initial capacity of 102 MW (80 MW from intermediate and pressure turbines and 22 MW from high-pressure turbines) probably rising to 150 MW.
Investigations of possible uses for energy from existing unused wells, including installations of small generating sets, is continuing. The Ngawha field investigations have been postponed indefinitely, but a lower level of exploration will be maintained to provide base data for any future geothermal power development.
Energy Pricing—Government and private sector pricing procedures generally allow for recovery of the financial costs of supply, plus a surplus as a return on investment and contribution towards future plant development. Other considerations which Government may take account of in the setting of controlled energy prices include: efficiency, fairness, price relativities, macro-economic issues (e.g., balance of payments), income distribution, and social, environmental and self-sufficiency concerns.
A substantial change in price relativities between the various energy forms has occurred over the decade up to 1983.
The following table shows average changes of energy prices in real terms (excluding inflation).
| Fuel | Price Change Percent |
|---|---|
| Petrol | 75 |
| Diesel | 255 |
| Fuel oil | 290 |
| Electricity | 8 |
| Natural gas | 44 |
| Coal | 42 |
ENERGY CONSERVATION—Energy conservation is defined as the more effective use of energy through reduction of waste and implementation of more efficient means of energy production and use by:
Improving the efficiency of energy supply systems;
Improving the efficiency of final demand systems without amenity loss;
Decreasing the energy intensiveness of a given standard of living through acceptable and voluntary lifestyle changes;
Encouraging the more appropriate matching of energy supply to energy use.
The following strategies are being employed:
Pricing policy and energy taxes;
Loans;
Regulations and legislative measures;
Information programmes;
Technology development.
Major policy measures either under development or in place for the major sectors include the following—
TRANSPORT: Differential Sales Tax on New Cars—This system was introduced in 1974 to encourage a trend towards smaller vehicles and hence better fuel consumption. Coupled with rising petrol prices the Differential Sales Tax has resulted in the average size of a new car dropping from 2200 cc in 1974 to 1628 cc in 1981.
The sales tax is as follows:
| 0–1350 cc = 30 percent |
| 1351–2000 cc = 37.5 percent |
| 2001–2700 cc = 50 percent |
| 2701 and over = 60 percent |
Petrol Consumption Labelling of New Cars—As from 1 March 1983 the Motor Vehicle Manufacturers' Association agreed that all new New Zealand-assembled cars with sales of over 250 in any one year, will display at point of sale a fuel consumption label giving both urban and steady 80 km/hour fuel consumption figures. This information, while not predicting actual onroad fuel consumption, will enable intending new car buyers to compare the relative fuel consumptions of different makes and models of cars in the same cc range. The Petrol Consumption Guide is available from car franchisers, automobile associations, the Consumers Institute, and the Ministry of Energy.
Testing of Petrol Saving Devices—A programme was established in 1980 to test devices which are claimed to produce fuel economy benefits when fitted to motor vehicles. The programme is in 2 sections. Firstly, the Department of Scientific and Industrial Research conducts an engineering appraisal to ensure that the device is based on sound engineering principles and has the potential to reduce petrol consumption of motor vehicles. If the above criteria are met, the device then goes to the Automobile Association Auckland (AAA) for testing in a vehicle. So far 18 devices have been submitted for testing, 8 of which have been rejected by the DSIR, and 1 out of 9 tested by the AAA showed fuel consumption savings of 4 percent. The DSIR is still testing 1 device.
Community Based Petrol Economy Programmes—A prototype programme to encourage motorists to practise known fuel-economy driving techniques held in Tauranga is being evaluated. Depending on results the method will be extended to other centres.
Diesel Conservation in Heavy Transport—A fuel conservation driver-training package is currently being developed to fit in with the Road Transport Industry Training Boards' Driver Assessor Training Programme.
Petrol Conservation in Fleets—The Ministry of Energy and AAA are jointly developing Fleetsave, a fleet management programme based on fuel efficiency and reduced lifecycle costs for light vehicle fleets.
Diesel Use in Fishing—The Fishing Industry Board will administer a comprehensive fuel monitoring and fuel conservation education programme for fishing crews, co-funded by the Ministry of Energy.
Carpooling—The Ministry of Energy has provided money to subsidise the Auckland Regional Authority's carpooling scheme since it began in 1978. Responsibility for total funding has now been transferred to the ARA itself via the Urban Transport Council.
A trial community-based carpooling scheme was run in the Kapiti area near Wellington by the Ministry of Energy during 1981 and may be repeated at a later date if funding permits.
INDUSTRY AND COMMERCE: Loans Scheme for Energy Conservation—This scheme, which replaced the tax incentive scheme for energy conservation and use on 1 April 1982, is designed to encourage businesses, non-tax paying organisations and individuals to undertake capital expenditure on energy conservation and the use of indigenous energy resources. Loans at 10 percent are provided by the Development Finance Corporation on behalf of the Ministry of Energy for projects with expenditures between $5,000 and $500,000.
Details are given in Energy Conservation Guide No. 6 which is available from the Ministry of Energy.
Energy Advisory Service (EAS)—This service was set up within the Ministry of Works and Development in 1976, and provides expert engineering advice on all aspects of energy conservation. It was originally a totally free service but its operations basis was changed in 1982. The EAS now provides an initial on-site service, free of charge, culminating in a brief written report. Part of this report can outline further or more detailed work which may be necessary to identify specific costs and benefits of any suggested energy conservation measures. The detailed work can also be carried out by the EAS at an appropriate charge-out rate.
Energy Efficiency in Non-residential Buildings—Incentives exist for retrofitting or refurbishing existing buildings with more energy-efficient materials, controls, or equipment. A publication, Energy Use in Non-Residential Buildings, sets out energy performance targets for various types of buildings for architects, builders, and building owners.
Publicity—The Energy Conservation Loans Scheme has been widely publicised. Speakers are provided for in-house and business groups. A range of pamphlets is available including a tabloid, Energy Conservation News and Conservation Planning—A Background Report to the 1983 Energy Plan. A booklet, Energy Effective Lighting Manual, is being prepared in co-operation with Phillips N.Z. Ltd.
Energy Managers' Groups—The Auckland Energy Group was formed in 1978. Based on its success, the Ministry of Energy intends to set up groups in other centres.
Education: Energy Education Programme—In 1979 the Ministry of Energy and Department of Education jointly commenced a curriculum development programme to provide energy education relevant to primary and secondary schools. To date 15 resource units have been completed.
Households: Interest-Free Loans for Home Insulation—This scheme commenced in May 1975 and applied to all housing. On 1 April 1978 insulation in new homes became mandatory. The scheme was withdrawn on 31 December 1982. Approximately 133 250 loans were issued.
Interdepartmental Committee on Heating of Public Buildings (ICHPB)—This committee decides which fuels are to be used in public buildings (defined as receiving a Government subsidy of 50 percent of the capital cost, or $150,000 when the capital cost exceeds $300,000). The Government has authorised ICHPB to include energy conservation in its brief. Applicants must now conduct an initial survey to identify and list energy conservation opportunities, which are given detailed cost/benefit appraisals if the committee regards them as being promising.
Interest-Free Loans for Domestic Solar Water Heaters—Introduced in 1978, the scheme provides loans up to $500 repayable over 4 years.
Energy Labelling of Household Appliances—Standards have been established for labelling. An energy-related standard is being developed for horizontal water heaters. A voluntary standard for refrigerators has been distributed.
Insulation of Government-owned Housing—A programme to insulate ceilings was introduced in 1978 and is substantially completed:
Cogeneration—Cogeneration is a means by which electricity is produced as a by-product of large scale, low grade heat production. For instance, in dairy factories large quantities of hot water are a principal energy requirement. The water must first be raised as steam in a boiler and then lowered to the required temperature. In the cogeneration process the steam is first passed through a turbine coupled to an electricity generator, before being condensed to produce low grade heat, i.e., hot water.
A proposal to the Government to remove or alleviate financial and institutional impediments to cogeneration is being prepared.
Solid Fuel Heaters—Two standards have been prepared covering subjects such as durability, safety and installation. Current research is determining performance, costs, and efficiency improvement prospects of burners which are currently available, and costs of redesign and performance of burners relative to other fuels.
Building and Solar Energy Service (BASES)—This is a 5-year programme to promote energy efficiency techniques and passive solar design, and educate supply and demand sectors for the building market in their use. The service provides information relevant to New Zealand conditions, professional advice, demonstrations and educational programmes, and test results. The booklet How to Heat Your Home is available from the Ministry of Energy.
Standards—Under the special programme for the development of energy-related standards announced in the 1978 Budget, standards have been published covering the use of LPG and CNG fuels in internal combustion engines, the storage and location of equipment at CNG refuelling stations, and methods of testing the petrol consumption of passenger cars. The latter, and a standard for a label showing the results of the tests now nearing completion, are the prelude to the introduction of energy-consumption labelling of vehicles in New Zealand. This will enable the potential car purchaser to take petrol usage into account when considering buying a vehicle, thus helping to promote energy conservation.
Basically, the New Zealand standard (NZS 54–22) for the use of LPG and CNG in internal combustion engines has been incorporated by the Government into the new regulations, i.e., Traffic Regulations 1976, Amendment No. 7, 1981/311. The CNG refuelling station standard is widely accepted as the basis for setting up these stations.
Standards are in operation for compressors for CNG refuelling stations, metering of CNG, thermal insulating materials for buildings, and equipment for determining the carbon monoxide and hydrocarbons concentrations in vehicle exhausts. It is well established that high concentrations of these gases in exhausts indicate poor combustion and therefore inefficient fuel use. In addition, they pollute the air. The problem can generally be reduced to a reasonable level by tuning the engine. Work is proceeding on standards for the energy consumption labelling of household appliances, and for solid fuel space heaters covering such aspects as efficiency, safety, pollution, and robustness.
Once the results of tests on hot-water cylinders with insulation of differing types and thickness are available, a review of the standard for the cylinders, particularly the standing losses, will begin.
Alternative Transport Fuels—At December 1983, approximately 51 700 vehicles had been converted to operate on CNG and approximately 7000 vehicles were operating on LPG. The use of these fuels has been encouraged by Government grants and loans to establish refuelling facilities and assist with the conversion of vehicles to alternative fuels.
At the beginning of 1984 there were approximately 210 CNG refuelling stations in the reticulated area (North Island only), and 170 LPG refuelling stations nationally. Most areas in the North Island now have access to CNG. Liquid petroleum gas is available throughout the North Island, and will be available in the South Island during 1984 with the arrival of a bulk tanker.
Energy Research and Development—New Zealand is able to obtain the results of much overseas energy research work through its international scientific contacts and its membership of the International Energy Agency (IEA). Many of this country's energy problems are, however, unique and can only be solved by our own efforts.
New Zealand has a varied energy research programme with work on a wide range of topics being conducted in Government departments, and by universities, private companies, and individuals. About $20.9 million was spent on energy research, development and demonstration projects in 1982–83. Of this, $17.7 million was provided by the Government. Particular emphasis is being placed on coal research, both resource assessment and utilisation aspects. Other programmes involve alternative liquid and gaseous fuels, including those produced by biomass, opportunities for conservation and demonstrations of efficient use of energy, geothermal energy, and the interaction of the energy system with other aspects of New Zealand society.
New Zealand Energy Research and Development Committee—The New Zealand Energy Research and Development Committee (NZERDC) was formed in 1974. It funds energy research in universities, research associations, and the private sector. The Chairman is Prof. R. F. Meyer.
The Government provides a grant to the committee ($1.39 million in 1983–84) and the committee selects contractors to carry out specific projects. Expenditure by the committee from its inception to 31 March 1984 was $8.75 million. The committee has published about 170 reports and has some 60 current contracts.
Recent research covers technical aspects of CNG, coal slurry fuels, heat pumps, thermophilic bacteria, energy, and a number of conservation-related topics.
Liquid Fuels Trust Board—The utilisation of natural gas is in the implementation phase now and the board's involvement in this area has largely wound down as a consequence. However, it is still prepared to undertake ad hoc studies on matters that crop up from time to time.
Most of the board's expenditure is used to investigate potential uses of the South Island's lignite deposits, which are one of New Zealand's major energy resources.
In the biomass area, the board is currently studying the possibility of converting part of New Zealand's exotic forest resource to either methanol or hydrocarbon fuels.
The board has investigated the production of ethanol from beet, but has now brought this work to a close as it seems ethanol from agricultural biomass is unlikely to be an economic option in the foreseeable future, unless the feedstock used is extremely cheap.
One option in the biomass area that the board sees as promising is the possibility of producing a diesel substitute from inedible tallow. The tallow would first need to be converted to an organic salt or ester to improve its qualities as a fuel, and would probably then be blended with conventional diesel fuel if it came into everyday use.
As well as the development of alternative fuels the board is interested in ways in which they might be more effectively utilised (e.g., by engine modifications) and in identifying possible impediments to their distribution and commercial use.
In the year ended 31 March 1983 the board's programme expenditure totalled $1,965,000.
POLICIES FOR ENERGY USE—Consumer energy is provided by oil (50 percent), electricity (25 percent), coal (13 percent), and gas (12 percent).
The largest end-use sector is industry (35 percent), followed by transport (32 percent), commerce/agriculture (20 percent) and domestic (13 percent). Energy policies aim to promote energy conservation, encourage the use of renewable resources, achieve an adequate level of security of energy supply, and promote the use of indigenous rather than imported energy sources.
These goals are pursued in the demand sector by pricing and incentive schemes. Expansion of the Marsden Point oil refinery is now under way and scheduled to be operational by mid-1986. This will increase the refinery's throughput, and in particular increase production of diesel and aviation turbine fuel. With the recent decision to shelve plans for a new aluminium smelter the demand for new power stations has eased, and potential supply problems in the mid-1980s are no longer expected.
COMPARATIVE ENERGY-USE STATISTICS—Comparative statistics of per-head consumption of commercial energy in selected countries and geographical areas in 1980 are given in the following table. The figures, taken from the 1980 UN Yearbook of World Energy Statistics, are expressed in gigajoules per head. That publication should be consulted for fuller information including detailed notes and definitions. In addition to stages of economic and social development, climatic conditions in the various countries should also be borne in mind.
| Gigajoules per Head | Average Percentage Growth per Year* | |
|---|---|---|
* Average growth between 1976 and 1980. †Customs Union of South Africa. ‡Except Middle East. §Includes that part of Russia in Asia. | ||
| Africa— | ||
| Congo | 2.5 | −1.4 |
| Egypt | 13.9 | 5.7 |
| Ethiopia | 0.8 | 11.2 |
| Nigeria | 4.2 | 10.4 |
| South Africa‡ | 76.1 | 0.8 |
| America, North— | ||
| Canada | 300.1 | 1.0 |
| United States | 305.1 | −1.5 |
| Mexico | 51.9 | 9.2 |
| Asia‡— | ||
| Bangladesh | 1.3 | 7.1 |
| India | 5.6 | 3.1 |
| Indonesia | 6.4 | 4.7 |
| Japan | 108.1 | 0.5 |
| Pakistan | 6.4 | 5.8 |
| Philippines | 9.6 | 1,7 |
| Singapore | 123.6 | 6.0 |
| China | 18.1 | 4.5 |
| America, South— | ||
| Argentina | 53.3 | 1.4 |
| Brazil | 22.3 | 1.7 |
| Middle East— | ||
| Iran | 36.5 | −2.9 |
| Iraq | 17.8 | −4.2 |
| Israel | 69.4 | 2.1 |
| Turkey | 21.6 | 0.4 |
| Kuwait | 196.9 | 3.6 |
| Saudi Arabia | 49.1 | 5.5 |
| Europe— | ||
| France | 127.5 | 0.9 |
| Italy | 97.2 | 1.3 |
| Germany, West | 167.8 | −0.3 |
| Spain | 74.1 | 2.3 |
| United Kingdom | 141.7 | — |
| U.S.S.R.§ | 164.0 | 1.7 |
| Oceania— | ||
| Australia | 176.1 | 1.2 |
| New Zealand | 101.3 | 0.3 |
| World | 57.3 | 0.3 |
FURTHER INFORMATION—Sources of further information on the electricity and gas industries will be found listed at the end of the appropriate subsections. Further information on energy demand and supply in general will be found in the following publications: Energy Plan (Parl. paper D. 6A).
Report of the Ministry of Energy (Parl. paper D. 6).
Report of the Liquid Fuels Trust Board of New Zealand (Parl. paper D. 8).
Report to the New Zealand Government of the Fact Finding Group on Nuclear Power (Parl. paper D. 9 1977).
Nuclear Power Generation in New Zealand (Parl. paper H. 4 1978).
Monthly Abstract of Statistics—Department of Statistics.
World Energy Supplies 1973–78—United Nations.
Report of the New Zealand Gas Council (Parl. paper D. 7).
White Paper on Petrolgas Supply Contract (Parl. paper D. 13).
White Paper on Liquigas Assurances (Parl. paper P. 12).
White Paper on Export Coal-Sales Contract (Parl. paper D. 11).
White Paper on New Zealand Synthetic Fuels Corporation Limited Venture Contracts (Parl. paper D. 11).
Background Reports to the 1982 Energy Plan—Ministry of Energy 1982.
EP 82/1 Guidelines and Priorities for Energy Research, Development and Demonstration.
EP 82/2 Energy Demand Forecasting.
EP 82/3 Electricity Forecasting and Planning.
EP 82/4 Gas Forecasting and Planning.
EP 82/5 Construction Workforce Demands and Implications.
Other sections in this Yearbook which may be found useful are:
21 E—Electric Power.
21 C—Gas.
18—Minerals.
7 B—Science and Scientific Services.
Since early this century New Zealand's lakes and rivers have provided the raw materials for a systematic programme of hydro-electric development.
During the year ended 31 March 1983, hydro energy produced 74 percent of the nation's electricity. A further 5 percent came from geothermal steam, and the balance from fossil fuels: coal, oil, and natural gas.
Wairakei Power Station is the country's only geothermal station. At Meremere, near Auckland, coal is burnt to produce steam, while at Marsden Point (Marsden A Power Station), heavy oil is used. A large dual-fuel steam station at New Plymouth relies on natural gas (with some heavy oil) and a coal natural gas installation is being commissioned at Huntly. Gas turbines are used to generate electricity at Otahuhu (diesel oil and natural gas fuel), Stratford (natural gas), and Whirinaki (diesel oil).
HISTORICAL DEVELOPMENT—Electricity supply in New Zealand was pioneered by local bodies and private enterprise. Reefton had hydro-electric supply as early as 1888. In the following year Wellington opened a water-powered plant, using water from the city mains, but later switched to steam generation. Auckland and Christchurch, using steam-generating stations, and Dunedin, using hydro plant, all had supplies extensively developed before the advent of Government supply. Many smaller communities also had local supply, mostly produced from local steam stations, although in some cases hydro plant was installed to take advantage of local water resources.
The first Government station was opened in 1914 at Lake Coleridge, and its capacity was increased in 4 stages up until 1930. In the North Island, the Government purchased in 1919 the Waihi Goldmining Company's plant at Horahora, on the Waikato River. By 1927 this had been enlarged and was supplying power as far north as Henderson and Takapuna. Horahora operated successfully until flooded by the Karapiro development in 1947.
Other early North Island stations were Mangahao, near Shannon (opened 1924) and Arapuni (1929). Also in 1929 the first of the series of Waikaremoana stations was commissioned. This plant, Tuai, was followed during the war by Piripaua, and in 1948 by Kaitawa.
Between 1920 and 1930 the number of consumers in New Zealand increased fourfold, and the capacity of the Government generating system was uprated by 135 590 kW. In the early 1920s steam stations were still producing about 60 percent of all electricity. However during the decade they were gradually relegated to standby stations, and by 1930 produced only 1 percent of the national total.
The 1930s were lean times for capital-intensive developments and the only new project was the Waitaki scheme (1930). Two small hydro stations were acquired by the Government, one at Arnold, from the Grey Electric Power Board, and the other at Monowai, from the Southland Electric Power Board. Along with Monowai the Government took over responsibility for distribution in Southland and to this day supplies the Southland areas as the Southland Electric Power Supply. Development plans were further disrupted by the Second World War, but some stations were built and some existing ones extended. New stations included Cobb in North-west Nelson, Highbank in Canterbury, and the second Waikaremoana Station at Piripaua. At Lake Taupo, gates were built in 1941 to control the outflow of water. After the war, plans were pushed ahead for the development of the Waikato River, the North Island's main potential power source. Karapiro was opened in 1947 and in 1952 Maraetai, the largest station on the river, began producing electricity. Maraetai's capacity was doubled when 5 new turbines were commissioned in 1970–71. Although yearly output did not increase, much useful peak-time capacity was added. Other stations followed Maraetai. The third station of the Waikaremoana scheme (Kaitawa) was commissioned in 1948. Whakamaru was commissioned in 1956, followed by Atiamuri (1958), Ohakuri and Waipapa (1961) and Aratiatia (1964).
In the South Island, similarly large projects were under way. Waitaki was enlarged and new control systems at Lakes Pukaki and Tekapo gave it a more adequate flow of water in winter. Incorporated in the control works at Tekapo was a single-turbine power station which was commissioned in 1951. This has recently become known as Tekapo A. Another major project was completed at Roxburgh, on the Clutha River, in 1956. At the time it was the largest station in the country.
A large chain of Waitaki River stations began with the completion of Benmore, in 1966 and Aviemore in 1968. On the Upper Waitaki, Tekapo B was followed by the country's most recent hydro station, Ohau A, which was commissioned in 1980.
The Manapouri scheme, which uses the waters of Lake Manapouri to currently produce 590 MW of electricity, arose out of a 1960 agreement between the Government and Comalco. Statutory authority to make use of land within the Fiordland National Park was conferred in 1963 by the Te Anau-Manapouri Development Act.
A further agreement in 1966 provided for the raising of Lake Manapouri from a natural level of 178 m above sea level to an operating level of 185–190 m. However, a strong campaign by conservationists opposed to the raising of the lake led, in 1970, to the institution of a Government-appointed commission of inquiry. The outcome was the construction of a dam at Mararoa which allowed the control of the lake within a normal range of levels. Lake Te Anau, which feeds Lake Manapouri through the Upper Waiau River, is controlled at natural levels between 199 and 202 m by a dam near its outlet.
Construction at Manapouri was carried out by the Government as a result of a 1969 agreement with Comalco. The scheme was designed to make use of the 177 m head between Lake Manapouri and the sea. Intakes at the west arm of the lake lead the water via vertical penstocks to the turbines, which are 213 m underground. From there the water is discharged through a tunnel almost 10 km long into Doubtful Sound at Deep Cove.
In the North Island, most development is centred around the Waikato. However, the Matahina scheme on the Rangitaiki River was completed in 1967, and a major project in the Tongariro area is nearing completion. The Tongariro scheme is a complex development which draws upon the headwaters of various rivers, and diverts part of their flow from 1 watershed to another.
Water from the headwaters of the Wanganui and some of its tributaries is collected by the western diversions and transferred into Lake Rotoaira. From there, it passes through a 6100 m tunnel to the power station at Tokaanu and then into Lake Taupo. Tokaanu was the first of the Tongariro scheme stations. It was commissioned in 1974 and has four 50 MW generators.
The eastern diversions collect water from the Moawhango River and the eastern slopes of Mount Ruapehu. The water then passes through the Moawhango Tunnel and joins water from the Tongariro River before feeding through Rangipo Power Station (currently being commissioned), to join waters from the western diversions in Lake Rotoaira. Finally, the water is discharged into Lake Taupo via Tokaanu Power Station.
Much restorative planting and landscaping work is being carried out throughout the whole development, as are special measures to preserve fishing and fish spawning grounds in the area.
THERMAL GENERATION—New Zealand's first Government-built thermal plant began operating at Meremere in 1958. It burns coal, most of which is carried by aerial cableway from the Maramarua opencast mines. The remainder comes by road and rail from Huntly.
In the same year, New Zealand became only the second country in the world to generate power commercially from geothermal steam. Thirteen turbines were installed at Wairakei, a few kilometres north of Taupo, between 1958 and 1963. Bores of 102, 152, and 203 mm in diameter extending to depths varying from 174 m to 1220 m. Late in 1982, 4 generating units were removed from service. At 31 March 1983 the capacity of the station was 135 MW.
Marsden A Power Station, which uses heavy oil from the nearby refinery, first produced electricity in 1967. A year later, 4 natural gas-diesel oil fuelled gas turbines were in operation at Otahuhu and by 1979 that number had risen to 6. Another natural-gas-fuelled gas turbine station was completed at Stratford in 1976.
The 600 MW thermal station at New Plymouth with its 198 m chimney began generating in 1974, and the last turbine was commissioned early in 1977. Until the Maui gas wells off the Taranaki coast were in production, the energy source was Kapuni natural gas, supplemented by some oil.
At Whirinaki near Napier, a 216 MW diesel-oil fuelled gas turbine station was completed in 1977 but could not be operated commercially until oil pipeline and storage facilities were completed in 1978.
THERMAL PROJECTS—The 1000 MW Huntly station is expected to be fully commissioned by the end of 1984. When it first, produced electricity, Huntly was fired by Maui gas, but the Ministry of Energy is opening up nearby a large coal mine which will eventually provide most of the fuel.
The oil-fired intermediate load Marsden B station was completed in 1980, but never commissioned. Present plans are for conversion from oil to coal fuelling, with commissioning in 1992.
When the Maui gas field development was planned, a contract was drawn up which required a large guaranteed gas demand. As a result, almost all the gas from the Maui field initially went to gas-fired power stations. Since then, that emphasis has changed, and a large proportion of the gas is to be used for petro-chemical industries such as fertiliser and synthetic petrol manufacture. The Government expects that little more will be allocated for electricity generation than is used by existing stations.
The Ohaki Power Station, which is being built on the Broadlands geothermal field, will initially produce 80 to 100 MW. This may rise to 165 MW once more is known about the potential of the field. Ohaki's first generating unit is due to be commissioned in 1988.
CONSTRUCTION PROJECTS—In July 1968 the Government approved in principle the total development for hydro use of the Upper Waitaki Valley. The plan involves controlling the outflows of Lakes Tekapo and Pukaki, and to some extent Lake Ohau, and directing them through canals to power stations Tekapo B, Ohau A, Ohau B and Ohau C. The diverted water will eventually flow into the Waitaki River at Lake Benmore. Total capacity of the new stations will be about 850 MW, and the extra storage given by the scheme means output from the existing Waitaki River stations will be increased.
The Upper Waitaki project began with the construction of both the Twizel hydro town and the Tekapo B project. Then came Ohau A, which was fully commissioned during 1980. The first turbine at Ohau B was commissioned in 1983, while the second and last is planned for completion during 1984. It is planned to commission the last station, Ohau C, during 1984–85.
UPPER CLUTHA HYDRO-ELECTRIC DEVELOPMENT—The following stations are planned for the Upper Clutha:
| Clyde (under construction) | 412 MW | planned commissioning commencing 1988 |
| Luggate | 90 MW | planned commissioning commencing 1992 |
| Queensberry | 180 MW | planned commissioning commencing 1994 |
| Kawarau Gorge | 172 MW | planned commissioning commencing 1998 |
Investigations are also progressing on development plans for the Lower Waitaki and Lower Clutha rivers, but no commencing dates have yet been set.
INTER-ISLAND TRANSMISSION—In 1965 the North and South Islands were linked by high voltage, direct current (HVDC) transmission lines and undersea cables. 1 his allowed the transmission of electricity from the South Island to the North, where there was a greater demand.
Forty kilometres of submarine cable were laid across Cook Strait, and 570 km of 500 KV transmission line had to be constructed between Benmore and Fighting Bay in the South Island, and Oteranga Bay and Haywards Substation in the North.
The inter-island link, at the time of its construction, was the largest scheme of its type outside the U.S.S.R., and it attracted a good deal of overseas interest. The World Bank lent $23.2 million to meet the overseas costs of the project.
In April 1976, the scheme was modified to allow transmission of electricity in both directions between the 2 islands.
PLANNING FOR ELECTRICAL ENERGY—Forecasting and forward planning of electricity, and other fuels, is part of an overall energy strategy.
The Electrical Supply Authorities Association prepares 5 year estimates of consumption based largely on local knowledge of industrial and housing development plans. These are incorporated by the Electricity Sector Forecasting Committee with wider long-term considerations to produce a 15-year forecast. This is submitted to the Secretary of Energy and co-ordinated with the reports of other energy sectors to formulate the Energy Plan.
Such co-ordination prevents the various energy forms from competing for the same markets, and it allows careful assessment of factors such as price changes and conservation measures.
The Energy Plan (Parliamentary Paper D. 6A) is tabled in the House of Representatives.
Electricity forecasting is 1 of the country's most long-term planning processes, and it is vital to both the electrical industry and the national economy. If estimates are too low, or if generating stations are not ready on time, supply difficulties could occur. On the other hand, if estimates are too high there may be a premature commitment of resources and capital which could seriously affect the funds available for other development and social programmes.
Forecasting Committee predictions are used by the Electricity Sector Planning Committee to help produce a power development plan for the next 15 years. This contains recommendations on what projects are required in order to meet estimated needs. Although plans for 15 years are made, only those for the first 7 years are fixed—the others can be adjusted as is required by changing circumstances.
In its 1983 report, the Electricity Sector Forecasting Committee gave a schedule of 3 sets of estimates, each reflecting different assumptions of population and economic growth for the 1983–84, 1997–98, and 2002–03 financial years. The following table shows these estimates.
| Year Ended 31 March | 1983 Electricity Sector Forecasting Committee Estimates | ||
|---|---|---|---|
| 1983 | Gwh | ||
| Actual | 24 301 | ||
| Estimates | |||
| Low | Middle | High | |
| 1984 | 24,800 | 25,500 | 26,200 |
| 1985 | 25,600 | 26,400 | 27,700 |
| 1986 | 26,500 | 27,500 | 29,000 |
| 1987 | 27,300 | 28,400 | 29,900 |
| 1988 | 28,400 | 29,700 | 31,200 |
| 1989 | 28,800 | 30,200 | 32,000 |
| 1990 | 29,300 | 30,800 | 33,000 |
| 1991 | 29,700 | 31,400 | 33,800 |
| 1992 | 30,000 | 31,900 | 34,400 |
| 1993 | 30,300 | 32,300 | 35,400 |
| 1994 | 30,800 | 33,000 | 36,300 |
| 1995 | 30,800 | 33,200 | 37,300 |
| 1996 | 31,100 | 33,600 | 37,900 |
| 1997 | 31,300 | 34,400 | 38,600 |
| 1998 | 31,600 | 34,900 | 39,300 |
| 2003 | 33,200 | 37,500 | 43,300 |
FINANCE FOR ELECTRICITY—Expenditure on generation, transmission and distribution of electricity has risen from $1,596 million in 1973 to $4,803 million in 1983. These figures do not take into account depreciation. The Government's share of this expenditure was $3,550 million in 1983, which means the electrical supply authorities have an investment in generation and distribution systems of $1,253 million.
Continuing capital expenditure is required if both the Government's generating and distribution network and the supply authorities' distribution systems are to be strengthened and expanded.
The electricity supply industry's level of dependence upon loans is reduced by the structure of bulk supply and retail tariffs, which allow up to 50 percent of capital requirements to be funded from revenue.
LEGISLATION—Under the Ministry of Energy Act 1977, the Ministry is obliged to prepare plans both to meet the expected demand for electric power, and for controlling the Government generating and transmission systems. Other responsibilities include the efficient use of electricity and the promotion of conservation.
The Electricity Division has various responsibilities, including the functional design of stations, the detail design and installation of turbines, generators and associated equipment; design and installation of substation equipment, transmission line survey, design and construction; and operation and maintenance of the electricity bulk supply network.
In general the hydraulic investigations and civil engineering aspects are carried out by the Ministry of Works and Development to the requirements of the Electricity Division.
SUPPLY AUTHORITIES—Electricity distribution is the responsibility of the Ministry of Energy and 61 supply authorities. The authorities are licensed to supply electricity to particular areas under the terms of the Electricity Act, 1968. They buy electricity in bulk from the Electricity Division of the Ministry of Energy and then sell it to individual consumers.
Thirty-six of the supply authorities are electric power boards and 1 an area electric authority, all these are ad hoc local bodies with the sole function of providing electricity and related services in their districts. One other ad hoc authority is known as an Energy Board and distributes both gas and electricity. Of the remainder, 22 are territorial authorities (municipalities or counties) which are responsible for electricity supply as well as a range of other services.
The Southland Electric Power Board falls outside both the above categories. The board suffered heavy financial losses in its early years and was taken over by the Government in 1936. Distribution in the area is now the responsibility of the Southland Electric Power Supply, a part of the Electricity Division.
Some supply authorities have generating plants of their own. At 31 March 1983, 13 power boards had a generating capacity of 109 607 KW, and 5 territorial local bodies had stations with a combined capacity of 97 197 KW.
THE RURAL ELECTRICITY RETICULATION COUNCIL—Although the vast majority of the country is supplied with electricity, there are still a few areas without it, such as the offshore islands and remote rural districts.
The Rural Electricity Reticulation Council was established in 1945 and now operates under the terms of the Electricity Act 1968. It has the responsibility of providing annual subsidies towards the cost of supplying electricity to areas which could not by themselves meet the expense of reticulation.
These subsidies are funded by annual levies (set at 0.05 percent during 1982–83) on all Electricity Division and supply authority electricity sales.
The council subsidises not only transmission lines but also private generating facilities where they are a more viable alternative. Until recently the total generating plant subsidies has been small.
During the 1983 financial year there was a large increase in the number of people seeking an electricity supply. This was probably a result of the increased costs of private diesel generation, and policy changes adopted by the council as a result of changes to its empowering legislation.
In 1983 the subsidy programme allowed the completion of a further 124 km of electric line, and this took the total of subsidised line to 16 595 kilometres. During the same period 124 new consumers were connected to the electricity supply. Subsidy payments added up to $912,780 and of this $9,660 went towards private generation.
PUBLIC SUPPLY STATIONS—The following table covers all stations whose output is fully or partially available to the public supply system as at 31 March 1983, their installed capacity, static head where applicable, and annual electrical energy generation. Stations are State-owned unless otherwise indicated.
| Station | Installed Capacity at 31 March 1983 | Static Head | Annual Energy Generation Year Ended 31 March 1983 | Annual Load Factor Year Ended 31 March 1983 | |
|---|---|---|---|---|---|
| Number of Units | MW* | ||||
*“In-situ maximum” rating. †Net import of electricity into station during year to maintain station viability and system voltage stability. ‡Includes 539.8 GWh generated at Huntly power station which had not been commissioned at 31 March 1983. | |||||
| metres | million kWh | percent | |||
| Hydro | |||||
| Arapuni | 8 | 156 | 53 | 730.3 | 53.37 |
| Aratiatia | 3 | 84 | 34 | 299.6 | 41.11 |
| Atiamuri | 4 | 81 | 25 | 268.7 | 38.11 |
| Karapiro | 3 | 90 | 30 | 474.8 | 59.83 |
| Mangahao | 5 | 20 | 273 | 82.7 | 44.75 |
| Maraetai | 10 | 360 | 61 | 739.3 | 28.09 |
| Matahina | 2 | 72 | 61 | 215.5 | 33.20 |
| Ohakuri | 4 | 112 | 35 | 366.4 | 36.63 |
| Tokaanu | 4 | 200 | 208 | 579.0 | 31.38 |
| Waikaremoana— | |||||
| Kaitawa | 2 | 32 | 135 | 98.0 | 42.62 |
| Piripaua | 2 | 40 | 113 | 128.5 | |
| Tuai | 3 | 52 | 206 | 180.4 | |
| Waipapa | 3 | 51 | 16 | 234.1 | 49.76 |
| Whakamaru | 4 | 100 | 38 | 458.6 | 50.63 |
| Arnold | 2 | 3 | 13 | 23.8 | 82.30 |
| Aviemore | 4 | 240 | 37 | 938.6 | 45.29 |
| Benmore | 6 | 540 | 92 | 2 267.9 | 45.66 |
| Cobb | 6 | 32 | 594 | 93.0 | 37.78 |
| Coleridge | 9 | 35 | 149 | 168.3 | 49.78 |
| Highbank | 1 | 25 | 101 | 87.9 | 39.37 |
| Manapouri | 7 | 590 | 177 | 4 626.8 | 87.45 |
| Monowai | 3 | 6 | 47 | 41.1 | 72.27 |
| Ohau 'A' | 4 | 264 | 54 | 1 155.9 | 50.31 |
| Roxburgh | 8 | 320 | 46 | 1 627.2 | 56.19 |
| Tekapo 'A' | 1 | 25 | 30 | 130.5 | 56.01 |
| Tekapo 'B' | 2 | 160 | 146 | 798.5 | 55.51 |
| Waitaki | 7 | 105 | 21 | 505.9 | 63.11 |
| North Island Supply Authorities | 38 | 81 | 323.2 | ||
| South Island Supply Authorities | 34 | 116 | 342.8 | ||
| Subtotal | 189 | 3,992 | 17 987.1 | – | |
| Thermal | |||||
| Marsden | 2 | 230 | 1.7† | 76.04 | |
| Meremere | 6 | 170 | 451.4 | 46.39 | |
| New Plymouth | 5 | 600 | 3 509.2 | 58.51 | |
| Otahuhu | 6 | 259 | 33.1 | 59.36 | |
| Stratford | 4 | 208 | 643.1 | 81.51 | |
| Wairakei | 9 | 135 | 1117.9 | 77.16 | |
| Whirinaki | 4 | 216 | 1.6 | 90.64 | |
| North Island Supply Authorities | 3 | 8 | 0.1 | ||
| South Island Supply Authorities | 3 | 2 | – | ||
| North Island private plant | 14.4 | ||||
| South Island private plant | 1.8 | ||||
| Subtotal | 42 | 1,828 | 6 314.2‡ | ||
| Total | 231 | 5 820 | 24 301.3‡ | ||
GENERAL STATISTICS—A summary of statistics from all supply authorities and the Electricity Division of the Ministry of Energy in 1982–83 is shown in the following table.
| Item | Unit | 1982–83 |
|---|---|---|
*“In-situ maximum” rating. †Electricity Division only. ‡Includes starting oil. §Excluding stocks and materials. | ||
| Generating stations | No. | 82 |
| Capacity of generators* | kW (000) | 5,820 |
| Fuel used†— | ||
| Coal | tonnes | 361,828 |
| Light oil‡ | tonnes | 4,564 |
| Heavy oil | tonnes | 27,263 |
| Natural gas | terajoules | 51,233 |
| Staff employed | No. | 15,780 |
| Capital expenditure (less provision for depreciation)§ — | ||
| During year (net outlay) | $(m) | 491.3 |
| To date | $(m) | 4,116.1 |
| Generation and sales— | ||
| Generation per head of mean population | kWh | 7,613 |
| Retail sales per head of mean population | kWh | 6,695 |
| Domestic consumption per domestic consumer | kWh | 7,544 |
| Income from total retail sales of electricity per kWh sold to consumers | cents | 4.879 |
INCOME AND EXPENDITURE—Financial operations during 1982–83 are summarised in the following table.
| Item | 1982–83 |
|---|---|
| * These figures represent transfers within the electrical supply industry and therefore do not represent additional income or expenditure to the industry. | |
| Income— | $(thousand) |
| Gross income (including bulk sales and standby charges, excluding rates) | 1,763,200 |
| Income from bulk sales to supply authorities' | 641,177 |
| Net income (excluding rates, bulk sales, and standby charges) | 1,122,023 |
| Expenditure— | |
| Operating (including cost of energy purchased in bulk) | 947,180 |
| Cost of energy purchased in bulk* | 641,177 |
| Operating (excluding cost of energy purchased in bulk) | 306,003 |
| Trading, administration and general | 163,402 |
| Loan interest and depreciation | 359,989 |
| Net annual expenditure (excluding cost of energy purchased in bulk) | 829,394 |
| Surplus | 292,629 |
GENERATION—Means of generation of electrical energy for public supply is given in the following table.
| Year Ended 31 March | Generated by Means of | Total | ||
|---|---|---|---|---|
| Hydro | Steam | Oil/Gas | ||
| kWH (million) | ||||
| 1979 | 16 209.5 | 4 928.3 | 555.0 | 21 692.8 |
| 1980 | 18 692.3 | 2 808.9 | 106.0 | 21 607.2 |
| 1981 | 18 927.9 | 3 050.0 | 132.7 | 22 110.6 |
| 1982 | 19 538.8 | 3 106.8 | 317.0 | 22 962.7 |
| 1983 | 17 987.1 | 5 636.3 | 678.0 | 24 301.3 |
The following table sets out generation and disposal by type of authority. The excess generation of certain local organisations, which is bought for public supply, is given in the column “other sources”.
| Year Ended 31 March | Generated for Public Supply by | Sold Retail | Non-productive | |||
|---|---|---|---|---|---|---|
| Electricity Division | Supply Authorities | Other Sources | Total | |||
| kWh (million) | ||||||
| 1979 | 21,215 | 456 | 22 | 21,693 | 18,963 | 2,730 |
| 1980 | 21,050 | 539 | 18 | 21,607 | 19,040 | 2,567 |
| 1981 | 21,539 | 556 | 15 | 22,111 | 19,540 | 2,570 |
| 1982 | 22,239 | 710 | 14 | 22,963 | 20,104 | 2,858 |
| 1983 | 23,619 | 666 | 16 | 24,301 | 21,371 | 2,930 |
SALES—The following table gives a classification of power retailed according to the various purposes for which it was sold. “Domestic” includes domestic water-heating units.
| Year Ended 31 March | Domestic | Industrial | Commercial | Farming | Public Lighting | Rail and Bus Traction | Total | Number of Consumers |
|---|---|---|---|---|---|---|---|---|
| kWh (million) | ||||||||
| 1979 | 8,181 | 7,263 | 2,963 | 405 | 119 | 32 | 18,963 | 1,327,547 |
| 1980 | 7,909 | 7,466 | 3,104 | 408 | 122 | 30 | 19,040 | 1,345,330 |
| 1981 | 8,035 | 7,703 | 3,193 | 457 | 123 | 30 | 19,540 | 1,363,165 |
| 1982 | 8,265 | 7,781 | 3,427 | 476 | 126 | 29 | 20,104 | 1,377,682 |
| 1983 | 8,733 | 8,231 | 3,734 | 516 | 128 | 29 | 21,371 | 1,396,783 |
The following graph shows the growth in the use of electric power, and the principal purposes for which the power was used.
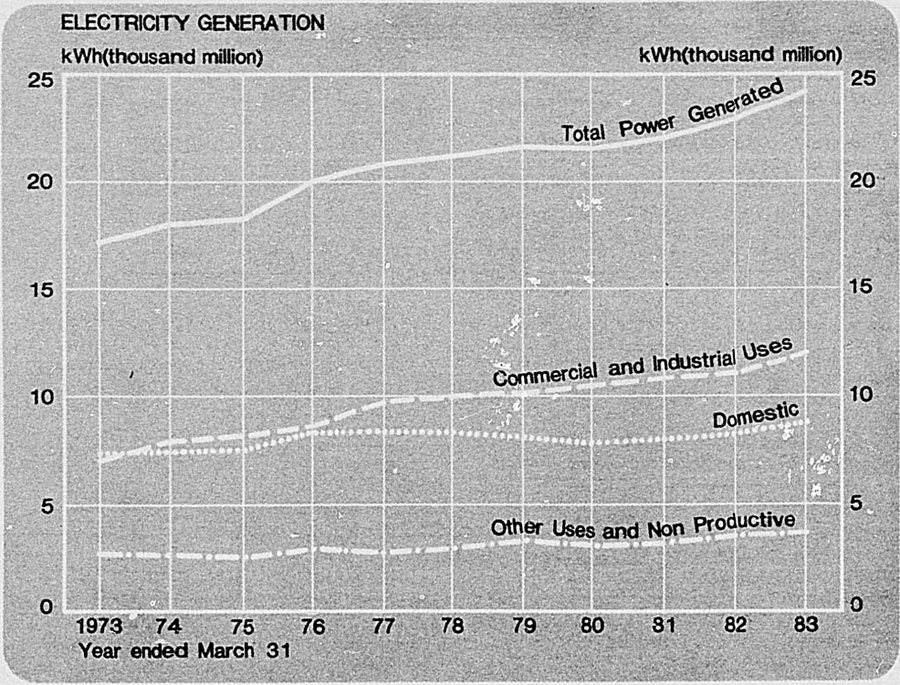
The distribution of the expenditure per kWh sold retail during 1982–83 was as follows: operating expenses 1.432 cents; trading, administration and general 0.765 cents; and loan interest and depreciation 1.684 cents giving a total expenditure of 3.881 cents per kWh sold retail.
The income per kWh sold in 1982–83 was, by categories; domestic 4.693 cents; commercial 7.646 cents; industrial 3.640 cents; farming 7.536 cents; public lighting 5.417 cents; railway traction 7.032 cents; urban traction 5.394 cents.
FURTHER INFORMATION—Additional information on electric power will be found in the following publications:
Report of the Ministry of Energy (Parl. paper D. 6).
Energy Plan (Parl. paper D. 6A).
Report of the Electricity Sector Forecasting Committee.
Report of the Electricity Sector Planning Committee.
Annual Statistics in Relation to Electric Power Development and Operation in New Zealand—Electricity Division, Ministry of Energy.
Gas was produced from coal as an early source of light and heating in New Zealand and by 1916 there were 56 undertakings engaged in the marketing of gas to the public. From that date the number of manufacturing gas undertakings steadily declined because of the growth in the use of electricity as a cheaper source of energy. There are now only 3 manufactured gas plants operating. These are in Gisborne, Dunedin and Invercargill. Since 1970 the gas industry has been rejuvenated by the reticulation of gas in the North Island.
The oil consortium, Shell B.P. and Todd Oil Services Ltd., discovered natural gas at Kapuni in 1959. In 1967, further investigations confirmed that the field was sufficiently large to justify exploitation and the Natural Gas Corporation (N.G.C.) was set up by the Government to develop this new energy resource. The N.G.C. constructed a pipeline to supply gas treated at the Kapuni processing plant to Auckland, Hamilton, New Plymouth, Hawera, Wanganui, Palmerston North, Levin, Hutt Valley, and Wellington. Natural gas was supplied to these centres by 1971. A pipeline to supply untreated natural gas to the Stratford and New Plymouth electricity generating stations was completed in 1975.
A second and larger natural gas field was discovered by Shell B.P. and Todd Oil Services Limited in 1969. Named the Maui field, situated off the Taranaki coast, it was brought into production in 1979, with the first gas coming onshore in May of that year. The increased reserves of natural gas, coupled with a further increase in oil prices, resulted in the construction of new natural gas pipelines to service areas outside the Kapuni system. By 1985 it is expected that all the major regions in the North Island will be supplied with natural gas. The N.G.C. has constructed pipelines to Te Awamutu, Otorohanga, Kinleith, Te Kuiti, Tokoroa, Huntly, Tirau, Morrinsville, Kawerau, Cambridge, Putaruru, Tauranga, Te Puke, Opunake, Edgecumbe, Hawke's Bay, Rotorua, and Northland. It is planned to supply Gisborne and Wairarapa in 1985. A study into the supply of natural gas to the South Island showed it was uneconomic and that an alternative to imported oils would be provided by liquid petroleum gas (LPG). The Liquigas consortium is setting up depots in the South Island and a tanker will be supplying LPG to bulk depots in Dunedin and Christchurch by late 1984.
The Natural Gas Corporation's income from sales of gas during the year ended 31 March 1982 was $49.9 million, from which must be deducted gas purchases, treatment and distribution costs, etc., leaving a gross profit from trading of $20.6 million and, after deduction of expenses, a net operating profit of $5.8 million.
Those gasworks not receiving natural gas continue to receive financial incentives provided by the Government: in 1981–82 subsidies on coal prices and gas sales totalled $2,369,000 compared with $2,535,000 in the previous year.
GAS INDUSTRY—In 1975–76 the gas industries were reclassified under the New Zealand Standard Industrial Classification covering:
The manufacture and distribution of gas by gasworks.
The distribution of natural gas by gas undertakings.
This reclassification also introduced an integrated economic census of the gas industry, based on the year ended 31 March or the last accounting year prior to that date.
The 1983 Census of Gas covered the activities of:
8 gasworks: 3 in the North Island manufacturing gas from natural gasoline and distributing to users in Gisborne, Napier and Hastings; and 5 in the South Island manufacturing gas from coal or oil and distributing to users in Nelson, Blenheim, Christchurch, Dunedin, and Invercargill.
9 gas-undertakings and 2 partnerships: all in the North Island purchasing natural gas from the Natural Gas Corporation of New Zealand and distributing to users in Wellington, Hutt Valley, Levin, Palmerston North, Wanganui and Huntly, and adjacent areas, Hawera, New Plymouth, Hamilton and Auckland.
Enterprise Group—An independent business unit operating in New Zealand either as a single business entity, or a group of business entities under common ownership or control.
Enterprise—A single business entity operating in New Zealand either as a legally constituted body such as a company, partnership, trust, local or Central Government trading organisation, incorporated society, or self-employed individual.
Establishment—A separate operating unit engaged in New Zealand in 1 or predominantly 1 kind of economic activity from a single location.
Ancillary Unit—An administrative or general servicing unit such as a head office, storage unit, laboratory, etc., the prime function of which is to provide services for other locations of the enterprise.
Paid Employees—The total number of people engaged, full-time and part-time, in the establishments and ancillary units at or on the nearest payday to 28 February 1983.
Purchases—Purchases of materials, supplies, goods for resale, and fuels and electricity.
Employer Contributions—Payments to superannuation, pension and welfare schemes, and accident compensation levies.
Salaries and Wages—Gross earnings during the accounting year of all paid employees in the establishments or ancillary units included in the census. Included are such items as overtime, sick and holiday pay, bonuses, payments under piece rate schemes, all benefit allowances, severance pay, value of free supplies and sales commission paid to own employees.
Rent and Leasing—Total expenditure on the rent and leasing of land and buildings and of plant, equipment and vehicles.
Insurances—Business insurance premiums paid.
Indirect Taxes—Covers land tax, road user charges, licence fees and rates.
Depreciation—As charged in the books of account on fixed tangible assets owned by the establishments and ancillary units.
Interest, etc.—Interest, bad debts, donations, royalties and patent fees paid.
Other Expenditure—All other operating expenses excluding salaries and drawings by working proprietors/partners and expenses of a capital nature.
Sales—Sales of manufactured and natural gas including compressed natural gas (CNG) and liquified petroleum gas (LPG); sales of the by-products of manufactured gas; and other sales including all kinds of gas appliances.
Rent and Leasing—Total income from the renting and leasing of land and buildings.
Subsidies—Direct Government cash grants and subsidies, other than for capital purposes.
Interest, etc.—Interest, dividends, donations, grants, royalties, patent fees and insurance claims received.
Other Income—Income from rental of plant and equipment, service connection charges, etc.
Operating Surplus—Interest, etc. paid/received are deducted from the respective accounting value totals to arrive at the 'operating surplus' measurement used in the value-added calculation.
Value Added—The amount added to goods and services by the contributions of capital and labour (i.e. the costs of bought-in materials and services has been deducted from the total value of output).
The following table gives statistics of the gas industry covering the last 2 years.
| INDUSTRY STATISTICS | ||||
|---|---|---|---|---|
| Item | Gasworks | Natural Gas Distributors | ||
| 1981–82 | 1982–83 | 1981–82 | 1982–83 | |
| Census coverage— | Number | |||
| Enterprise groups | 7 | 7 | 10 | 11 |
| Enterprises | 8 | 8 | 10 | 11 |
| Establishments and ancillary units | 16 | 16 | 18 | 19 |
| Paid employees (full and part-time) | 241 | 157 | 853 | 881 |
| Registered gas fitters | 12 | 11 | 84 | 85 |
| Census values in accounting terms— | ||||
| Purchases— | $(000) | |||
| Natural gas | 32,022 | 38,697 | ||
| Feedstocks | 6,131 | 3,978 | ||
| Fuel and power | 563 | 282 | 501 | 522 |
| Goods for resale | 1,348 | 1,205 | 8,037 | 9,740 |
| Other purchases | ||||
| Operating expenses— | ||||
| Employer contributions | 133 | 97 | 411 | 496 |
| Salaries and wages | 4,738 | 3,431 | 12,339 | 14,021 |
| Rent and leasing | 90 | 84 | 503 | 578 |
| Insurances | 77 | 99 | 236 | 281 |
| Indirect | 226 | 248 | 286 | 283 |
| Depreciation | 540 | 194 | 2,217 | 2,741 |
| Interest, etc. | 104 | 164 | 2,228 | 2,632 |
| Other expenditure | 974 | 1,280 | 5,089 | 6,296 |
| Total purchases and operating expenses | 14,923 | 11,063 | 63,871 | 76,286 |
| Stocks—Opening | 2,554 | 1,813 | 4,529 | 5,208 |
| — Closing | 1,826 | 1,126 | 5,091 | 5,521 |
| Sales— | ||||
| Gas | 11,044 | 7,947 | 58,364 | 69,415 |
| By-products | 1,778 | 1,149 | ||
| LPG | 669 | 795 | 2,334 | 4,166 |
| CNG | ||||
| Gas appliances | 442 | 505 | 6,556 | 6,752 |
| Other sales | 779 | 613 | 1,054 | 1,177 |
| Other income— | ||||
| Rent and leasing | 38 | 32 | 99 | 137 |
| Subsidies | 1,172 | 666 | 714 | 496 |
| Interest, etc. | 240 | 446 | 191 | 651 |
| Other income | 141 | 198 | 1,201 | 1,384 |
| Total sales and other income, adjusted for stocks | 15,575 | 11,663 | 71,075 | 84,490 |
| Net profit— | ||||
| Total sales and other income, adjusted for stocks | 15,575 | 11,663 | 71,075 | 84,490 |
| Less Total purchases and operating expenses | 14,923 | 11,063 | 63,871 | 76,286 |
| Net profit | 652 | 600 | 7,204 | 8,204 |
| Census values in economic terms— | ||||
| Operating surplus— | ||||
| Total income, adjusted for stocks less interest, etc. received | 15,335 | 11,217 | 70,883 | 83,839 |
| Less Total expenditure less interest, etc. paid | 14,819 | 10,899 | 61,643 | 73,655 |
| Operating surplus | 516 | 318 | 9,241 | 10,184 |
| Value added— | ||||
| Operating surplus | 516 | 318 | 9,241 | 10,184 |
| Employer contributions | 133 | 97 | 411 | 496 |
| Salaries and wages | 4,738 | 3,431 | 12,339 | 14,021 |
| Indirect taxes | 226 | 248 | 286 | 283 |
| Depreciation | 540 | 194 | 2,217 | 2,741 |
| Plus Capitalised salaries and wages | 7 | 13 | 1,246 | 1,235 |
| Less Subsidies | 1,172 | 666 | 714 | 496 |
| Value added | 4,987 | 3,635 | 25,026 | 28,464 |
| Fixed assets— | ||||
| Purchases during the year | 308 | 822 | 9,981 | 12,372 |
| Sales during the year | 28 | 62 | 229 | 173 |
| Value at end of the year | 8,267 | 8,653 | 52,717 | 62,310 |
| PRODUCTION AND DISPOSAL STATISTICS GAS MANUFACTURED AND DISTRIBUTED BY GASWORKS | |||
|---|---|---|---|
| Item | 1980–81 | 1981–82 | 1982–83 |
| * Includes production from “natural gasoline” reformed by 3 gasworks operating in the North Island. | |||
| megajoules (million) | |||
| Production— | |||
| Quantity manufactured by gasworks* | 858.4 | 738.7 | 440.5 |
| Less Internal consumption | 3.4 | 9.3 | 0.5 |
| Quantity available for distribution | 854.9 | 729.4 | 440.1 |
| Distribution— | |||
| Losses | 88.0 | 101.0 | 80.6 |
| Sales—domestic | 220.1 | 161.9 | 148.7 |
| — industrial and commercial | 546.8 | 466.4 | 210.8 |
| Total distribution by gasworks | 854.9 | 729.4 | 440.1 |
| DISTRIBUTION OF NATURAL GAS GAS PURCHASED AND DISTRIBUTED BY GAS UNDERTAKINGS | |||
|---|---|---|---|
| Item | 1980–81 | 1981–82 | 1982–83 |
| * Includes “natural gas” reformed by 1 gas undertaking in the North Island; excludes production of treated natural gas delivered from the natural gas treatment plant and the production of all untreated natural gas. | |||
| megajoules (million) | |||
| Purchases— | |||
| Quantity purchased by gas undertakings* | 14,022.5 | 16,593.6 | 18,764.6 |
| Less Internal consumption and sales of C.N.G. | 64.6 | 479.3 | 947.5 |
| Quantity available for distribution | 13,958.0 | 16,114.3 | 17,817.1 |
| Distribution— | |||
| Losses | 1,352.4 | 1,280.6 | 1,197.0 |
| Sales—domestic | 1,731.9 | 1,899.8 | 2,190.0 |
| —industrial and commercial | 10,873.6 | 12,933.8 | 14,430.2 |
| Total distribution by gas undertakings | 13,958.0 | 16,114.3 | 17,817.1 |
FURTHER INFORMATION—Other information on the gas industry will be found in the following reports.
Report of the Ministry of Energy (Parl. paper D. 6).
Report of the New Zealand Gas Council (Parl. paper D. 7).
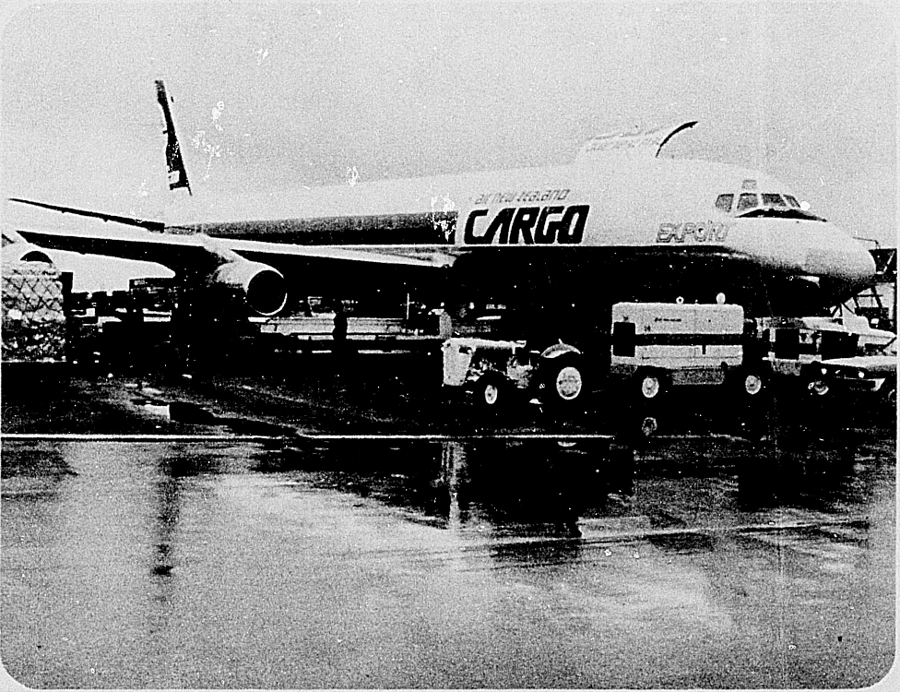
Table of Contents
Table of Contents
Despite the rise in the last decade in exports of timber, wood pulp, and paper and of manufactured products in general, products of animal origin still average annually over 60 percent of the total value of New Zealand exports, and agricultural exports of grass seed and fruit can be added to raise even higher the value of exports of farm produce. New Zealand remains one of the largest exporters in the world of butter and also (in some years) of meat, and is also one of the leading exporters of wool and cheese.
The following table of exports by value indicates the relative importance of farm products.
| Year Ended 30 June | Dairy Produce | Meat | Wool | Hides. Pelts, and Skins | Total Exports* | ||||
|---|---|---|---|---|---|---|---|---|---|
| Butter | Cheese | Milk and Cream | Casein | Total | |||||
| * Of New Zealand produce. | |||||||||
| $(million) | |||||||||
| 1979 | 277.2 | 75.5 | 130.3 | 62.3 | 545.3 | 1,094.0 | 683.3 | 181.8 | 3,946.0 |
| 1980 | 360.6 | 105.8 | 219.5 | 112.5 | 798.4 | 1,192.3 | 930.8 | 180.1 | 5,012.5 |
| 1981 | 398.0 | 137.7 | 315.2 | 117.2 | 968.1 | 1,520.9 | 892.6 | 129.9 | 5,830.0 |
| 1982 | 556.4 | 181.5 | 408.5 | 142.0 | 1,288.3 | 1,564.1 | 918.8 | 152.9 | 6,527.8 |
| 1983 | 657.7 | 193.5 | 436.3 | 199.0 | 1,486.5 | 1,870.7 | 1,017.1 | 185.2 | 7,427.7 |
The countries of destination for some of the main exports for 1982–83 are shown in the following table on a percentage basis. (Proportions are expressed as a percentage of the value of exports of the relevant commodity.)
| Country of Destination | Butter | Cheese | Lamb Carcasses and Cuts | Beef and Veal | Mutton Carcasses and Cuts | Wool |
|---|---|---|---|---|---|---|
| Australia | – | 8.9 | – | 1.7 | 0.8 | 0.3 |
| United States of America | 0.6 | 26.3 | 2.4 | 68.2 | 2.9 | |
| Japan | 1.0 | 25.3 | 3.5 | 4.0 | 16.4 | 6.1 |
| United Kingdom | 45.0 | 12.6 | 41.3 | 0.9 | 23.2 | 14.6 |
| Iran | – | 0.1 | 32.1 | – | – | 1.4 |
| U.S.S.R. | 29.1 | – | – | – | 38.6 | 16.9 |
| China, People's Rep. of | 0.7 | – | – | 0.1 | – | 21.1 |
| Germany, Fed. Rep. of | – | 6.2 | 1.6 | – | 2.0 | 3.8 |
| Canada | – | 2.2 | 3.4 | 10.6 | 1.5 | 0.1 |
| France | – | – | 1.6 | – | 0.2 | 6.5 |
| Netherlands | – | 0.4 | 0.5 | – | 0.9 | 8.1 |
| Greece | – | – | 2.2 | – | 1.9 | 0.2 |
| Others | 23.6 | 18.0 | 11.4 | 14.5 | 14.5 | 18.0 |
| Total | 100.0 | 100.0 | 100.0 | 100.0 | 100.0 | 100.0 |
In recent years New Zealand's continued access to European markets for its agriculture based products has been subject to continued negotiation with the European Economic Community (EEC). As a result of these negotiations the United Kingdom remains New Zealand's main export market for farm products especially butter and lamb, although the total value of these exports is gradually declining. With the EEC agricultural policy limiting the amount of such products into its member countries in order to protect the local producers, New Zealand is having to develop other markets, for example Iran and the U.S.S.R.
GENERAL MARKETING SITUATION: Meat—Most meat produced in the world is supplied to domestic markets, and only about 8 percent of world output enters into international trade. Among the few countries with significant levels of exports are Australia, New Zealand, Argentina, the Netherlands, Denmark, and the Irish Republic. The principal importers are the countries of western Europe (in particular, the United Kingdom), the United States, Russia, and Japan. It is significant, however, that although the Common Market countries are substantial meat importers, much of the current trade now takes place between member countries of the Community as governed by the Common Agricultural Policy regulations.
During 1983–84 total lamb exports increased by 22 percent. Exports to the United Kingdom dropped by 16 percent but were more than offset by a virtual doubling of exports to the Middle East.
Currently about 90 countries import New Zealand meat. Of these, six may be regarded as major markets. These are the United Kingdom and Iran, which in 1982–83 accounted for 39 and 29 percent respectively of New Zealand lamb exports; Russia and Japan which took 55 and 17 percent respectively of New Zealand mutton exports last season; and the United States and Canada which dominated the beef and veal trade at 70 and 11 percent respectively.
New Zealand's beef trade with North America developed in the late 1950s, as a result of a decline in the American dairy herd and a subsequent drop in output of manufacturing-type beef. The American beef herd is grain-fed and produces carcasses with a greater amount of external fat than the consumer requires. This fat is trimmed when the carcasses are being dressed. The trimmings which are used in the manufacture of processed meat products need to be supplemented with the lean type of beef that New Zealand (and Australia among others) can provide. Imports of beef into the United States are subject to “voluntary restraint” agreements under the counter-cyclical meat import law. If “voluntary restraints” are not agreed by the supplying countries then quotas may be imposed. Under this system New Zealand along with other suppliers, agrees to restrict the quantity of quota meat shipped for arrival in the United States during the calendar year, to a negotiated tonnage if the global estimate of US imports exceeds a 'trigger' level. In the first 6 months of 1983, the United States Department of Agriculture estimated that imports for the calendar year would be below the 'trigger' level. However it became apparent later in the year that the 'trigger' would be exceeded and voluntary restraints were negotiated with New Zealand, Australia and Canada. New Zealand's restraint level was set at 165 340 tonnes.
A counter-cyclical beef import law was introduced by Canada from 1 January 1982, replacing the system of quota control which had operated since 1976. Quotas were not imposed in 1983.
Imports of beef and sheepmeats into the United States are shown in the following table.
| Country of Export | Imports Subject to Meat Import Law* | Lamb | ||||||
|---|---|---|---|---|---|---|---|---|
| 1979 | 1980 | 1981 | 1982 | 1979 | 1980 | 1981 | 1982 | |
| * Includes beef, veal, mutton, and goat meat. | ||||||||
| tonnes (000) product weight | ||||||||
| New Zealand | 162 | 149 | 161x | 158 | 14 | 13 | 13 | 7 |
| Australia | 399 | 366 | 266x | 324 | 5 | 2 | 1 | 1 |
| Canada | 35 | 42 | 55 | 57 | – | – | – | – |
| Mexico | 2 | – | 1 | – | – | – | – | – |
| Nicaragua | 31 | 21 | 8 | 11 | – | – | – | – |
| Costa Rica | 30 | 20 | 29 | 21 | – | – | – | – |
| Other countries | 46 | 47 | 40 | 28 | – | – | – | – |
| Total imports | 705 | 645 | 560x | 599 | 19 | 15 | 14 | 8 |
| United States production | 9 925 | 9 999x | 10 353 | 10 425 | 128.8 | 140.6 | 148.3x | 161.5 |
Shipments of beef and veal to Canada totalled 24 975 tonnes in the year ended September 1983, while lamb shipments were 10 037 tonnes.
In Japan imported mutton is used mainly for processing in sausage-type foods. Shipments of New Zealand mutton in the year ended September 1983, including those to South Korea (where almost all is processed and reshipped to Japan) totalled 23 513 tonnes, about the same level as the previous season. Shipments to the U.S.S.R. decreased 18 percent to 52 297 tonnes.
It has been the policy of the Meat Board to diversify exports of lamb. The original initiative for this was the likelihood of Britain joining the EEC and, with that, the possibility of more comprehensive regulations covering imports of sheepmeats from outside the community than the Common Customs Tariff of 20 percent. It was also considered that there was a need to reduce the continued dependence on one market.
In 1960 the Meat Export Development Company was established, an organisation charged with the responsibility for the orderly development of New Zealand lamb marketing in the United States and Canada. All New Zealand lamb sales to these countries are controlled by this company, the directorate of which is composed of nominees of the New Zealand Meat Producers Board and representatives of the freezing companies. The head office of the company is in Wellington, while the North American operations are controlled from Toronto and New York.
The Market Development Committee, which consists of representatives of the Meat Board and the meat export trade, has each year set a percentage of lamb exports to be sold in markets other than the United Kingdom. A levy was struck, payable per kilogram on any shortfall in sales below the target figure. However, because of the high level of diversification performance in recent years the scheme was suspended in 1980.
Iran continues to be the largest diversionary market for New Zealand lamb, recovering to 122 184 tonnes in 1982–83, after falling sharply in the previous season. Other principal markets were the U.S.S.R. (35 800 tonnes), Japan (17 117 tonnes), Saudi Arabia (10 901 tonnes), Canada (10 037 tonnes), Greece (6716 tonnes) and United States (6512 tonnes).
Sale of Wool—The most common way of selling wool is by open auction in New Zealand. About two-thirds of the clip is sold this way. The auction season runs from August to the following June. Sales are held at 8 centres around the country and they attract buyers representing all the main wool importing countries. Growers can also sell their wool to merchants privately in New Zealand, and the New Zealand Wool Board buys certain types of wool direct under its Extra Choice Scheme. Small quantities of wool are also shipped to Britain for sale at auction.
Prices fluctuate from season to season. The Wool Board operates a floor price scheme which assures growers of a minimum income each season. In addition to this, the board administers a separate minimum supplementary price scheme on behalf of the Government. The board's market intervention and strata price control policies help to steady the market in times of uncertainty. By March 1984 average prices in the 1983–84 season had risen almost 20 percent compared with the previous season, enabling a rundown in Wool Board stocks. The stockpile, which stood at 286 thousand bales at the beginning of the 1983–84 season, had declined to 145 thousand bales by late March 1984.
The following table shows the number of bales purchased by New Zealand mills during the past 5 seasons. (Sources: New Zealand Wool Board, Manufacturers' Monthly Levy Returns.)
| 1978–79 | 1979–80 | 1980–81 | 1981–82 | 1982–83 | |
|---|---|---|---|---|---|
| Tonnes (Greasy equivalent) | |||||
| Wool purchased | 24,390 | 20,804 | 22,674 | 27,774 | 25,500 |
Dairy Produce—The international market for dairy products is characterised by its small size relative to the total world production of milk, with approximately 3 percent to 4 percent of production entering international trade. Because of this it is very vulnerable to fluctuations from external conditions, such as climate, commerce, and politics. It only takes marginal production changes in the major producers, transferred via shortages or surpluses on to the international market, for severe shifts to occur in the international supply position and international prices.
There are only 4 main dairy exporters (the EEC; New Zealand; Australia; and Canada), who provide about four-fifths of all exports. Relatively smaller quantities are exported by the Nordic countries and East Europeans.
The New Zealand Dairy Board exports annually over 600 000 tonnes of manufactured dairy products, of which around half go to the affluent countries in Europe, North America, and Japan, and the other half to the developing countries, with a heavy emphasis on South-east Asia and Latin America. New Zealand now relies on the United Kingdom for only one-fifth of the value of its dairy export exchange earnings, although the United Kingdom still remains the principal market for butter.
Developed countries have a tendency to express social and political policies towards their farmers through price support mechanisms: high prices which are fixed with little regard to commercial reality encourage production but discourage consumption, thus creating surpluses. It is the disposal of these surpluses, by means of heavy Government export subsidies, which undermines the stability of the international market.
New Zealand is almost the only country for which dairy exports are economically important. For most other countries, dairy exports are a question of surplus disposal, and therefore inconsequential to national economics. Consequently, New Zealand maintains strong and consistent pressure in international councils to achieve a stable balance between supply and demand in international trade. While attempts in General Agreement on Tariffs and Trade (GATT) or other international organisations to negotiate improved access conditions in developed countries have met with a minimum of success, international arrangements covering consultative procedures and minimum prices have contributed to stabilising markets.
The “Tokyo Round” of GATT Multilateral Trade Negotiations (MTN) resulted in the negotiation of the International Dairy Arrangement to replace the OECD agreement on wholemilk powder and the GATT agreements on skim-milk powder and anhydrous milkfat. The new arrangement (signed by New Zealand in December 1979), as well as extending the product coverage and providing for an annual review of the minimum prices, established the International Dairy Products Council to evaluate the international market situation and provide a forum for seeking solutions to problems in international dairy trade.
Since October 1981 the minimum prices per tonne established under the arrangement are:
| US$ | |
|---|---|
| Whole-milk powder | 950 |
| Skim-milk powder | 600 |
| Buttermilk powder | 600 |
| Anhydrous milkfat (AMF) | 1,440 |
| Butter | 1,200 |
| Cheese (certain types only) | 1,000 |
Coincident with the multilateral negotiations GATT bilateral access negotiations made some progress with the EEC agreement to allow the import of 9500 metric tonnes per annum of New Zealand cheese, from 1980. Additionally, access for cheese into the United States was secured at a higher level, with New Zealand's quota rising from 7447 tonnes to 17 442 tonnes per annum.
The following tables compare production and exports of butter, cheese, and skim-milk powder by selected countries. (Source: New Zealand Dairy Board.)
| PRODUCTION | |||||||||
|---|---|---|---|---|---|---|---|---|---|
| Country | Butter* | Cheese | Skim-milk Powder | ||||||
| 1980* | 1981 | 1982† | 1980 | 1981 | 1982† | 1980 | 1981 | 1982† | |
* Includes butter equivalent of AMF. †Provisional. ‡Twelve months ended 30 June of following year. §Twelve months ended 31 May of following year. | |||||||||
| tonnes (000) | |||||||||
| Australia‡ | 79 | 76 | 88 | 135 | 141x | 160 | 70x | 87x | 91 |
| Canada | 102 | 113 | 123 | 177 | 177 | 170 | 109 | 137 | 163 |
| EEC | 1,964 | 1 909x | 2,058 | 3,689 | 3 830x | 3,922 | 2,080 | 2 057x | 2,204 |
| Denmark | 113 | 109 | 121 | 221 | 243 | 245 | 36 | 32 | 45 |
| France | 618 | 599x | 628 | 1,146 | 1 163x | 1,195 | 736 | 738x | 750 |
| Ireland | 127 | 122 | 135 | 49 | 53 | 56 | 136 | 142 | 151 |
| Netherlands | 179 | 183 | 216 | 454 | 475x | 492 | 172 | 177 | 213 |
| United Kingdom | 169 | 172 | 216 | 237 | 243x | 244 | 237 | 251 | 296 |
| West Germany | 578 | 546 | 557 | 776 | 814 | 839 | 639 | 592 | 611 |
| New Zealand§ | 257 | 242 | 252 | 84 | 112x | 114 | 181 | 200x | 165 |
| U.S.A. | 519 | 557x | 571 | 1,807 | 1 918x | 2,010 | 527 | 596x | 634 |
| EXPORTS | |||||||||
|---|---|---|---|---|---|---|---|---|---|
| Country | Butter* | Cheese | Skim-milk Powder | ||||||
| 1980 | 1981 | 1982† | 1980 | 1981 | 1982† | 1980 | 1981 | 1982† | |
* Includes butter equivalent of AMF. †Provisional. ‡Twelve months ended 30 June of following year. §Excludes trade between member countries. | |||||||||
| tonnes (000) | |||||||||
| Australia‡ | 11 | 8 | 18 | 54x | 61x | 47 | 15x | 53x | 47 |
| Canada | – | – | – | 3 | 4 | 4 | 60 | 62 | 119 |
| EEC§ | 589 | 489x | 398 | 307 | 364x | 380 | 580 | 503x | 352 |
| New Zealand‡ | 214 | 207 | 234 | 80 | 81x | 75 | 163 | 135x | 144 |
| U.S.A. | – | 54 | 67 | 6 | 6 | 18 | 101 | 113x | 126 |
Butter—World butter production in the period 1978 to 1980 averaged around 6.9 million tonnes. Excluding trade between the member states of the EEC and New Zealand's special Protocol 18 arrangement, international commercial trade in butter and anhydrous milkfat (AMF) for the period averaged 488 000 tonnes. In addition, 173 000 tonnes of anhydrous milkfat were given as food aid. The relatively small size of international trade compared with production illustrates the vulnerability of the international market to distortions resulting from the disposal by large producing countries via export subsidies.
The access level to the United Kingdom market has been progressively reduced since the U.K. entered the European Community. The U.K. was permitted to import 94 000 tonnes of butter from New Zealand in 1981, 92 000 tonnes in 1982, 87 000 tonnes in 1983, 83 000 tonnes in 1984, 81 000 tonnes in 1985, and 79 000 tonnes in 1986. Access for 2 years thereafter will be reviewed before the end of 1984. Currently access is being granted in monthly quotas based on a total of 83 000 tonnes.
Skim-milk Powder—World production of skim-milk powder has stabilised at around 4.0 million tonnes per annum. This follows a 25 percent growth in production during the early 1970s.
The surplus stock situation of the mid-1970s eased significantly by 1979 and a run-down in EEC stocks, enabling lower EEC export subsidies, resulted in a gradual improvement in international prices. Increased milk production in both the EEC and U.S.A. resulted in stock levels increasing rapidly in 1982 and 1983. By late 1983 EEC stocks had reached more than one million tonnes, and U.S.A. stocks had stabilised in excess of 600 thousand tonnes.
Casein—Casein, which is produced from skim milk, was originally chiefly used in industrial products such as the manufacture of coatings for high quality paper. In the past 10 years, however, the nutritional value of caseins and their derivatives has been realised, and they are now being put to use in an increasing range of edible products. Caseins are used as high-grade protein in food manufacture, where their nutritional and functional properties make them desirable ingredients in bakery goods, speciality high protein foods, coffee creamers, snack foods, and other products.
New Zealand is the largest exporter of casein, with most of the production going to the United States of America, EEC, and Japan.
The major countries producing casein are shown in the following table.
| Producing Country | Casein | ||||
|---|---|---|---|---|---|
| 1978 | 1979 | 1980 | 1981 | 1982* | |
* Provisional. †Twelve months ended 31 May following year. ‡Twelve months ended 30 June following year. | |||||
| tonnes (000) | |||||
| New Zealand† | 63.3 | 66.2 | 59.6x | 47.4x | 65.1 |
| Australia‡ | 17.2 | 15.1 | 15.1 | 8.4 | 11.4 |
| Poland | 30.0 | 34.0 | 28.0 | 25.0 | … |
| France | 22.2 | 31.7 | 38.7 | 30.3 | 40.0 |
| West Germany | 14.8 | 16.3 | 19.2 | 15.7 | 17.0 |
| Netherlands | 15.0 | 18.0 | 15.0 | ||
| Irish Republic | 11.2 | 12.9 | 16.9 | 14.5 | 19.0 |
| Argentina | 3.0 | 2.7 | 3.8 | 3.0 | |
| Source: New Zealand Dairy Board. | |||||
DIVERSIFICATION OF MARKETS—The value of New Zealand's dairy exports to markets outside the United Kingdom has markedly increased over the last 3 decades. In 1955 only 13 percent of the value of New Zealand's total dairy exports went to markets outside the United Kingdom. In 1972, for the first time, more than half of the dairy exchange earnings came from these other markets. Since then dairy exchange earnings from the United Kingdom market have slowly declined to about one-quarter of the total.
The rate of diversification away from the United Kingdom in exchange earnings terms has now stabilised. The United Kingdom continues to be the most important outlet for New Zealand butter, taking still over 50 percent of total butter exports. Continued diversification successes are restricted by limited market opportunities for milkfat products. Sales of butter to the Soviet Union and Japan are conducted on an ad hoc basis when these countries have domestic shortages, and as such they do not represent long-term secure markets. The growth in cheese exports to Japan has slowed, while cheese exports to the United States—which had rapidly increased in recent years—have stabilised under new import quota provisions.
The following table shows the changing direction of New Zealand's dairy export earnings in the period since 1970.
| Product | 1970 | 1975 | 1983 | |||
|---|---|---|---|---|---|---|
| United Kingdom | All Markets | United Kingdom | All Markets | United Kingdom | All Markets | |
| $(million) | ||||||
| Butter | 104.0 | 113.2 | 121.0 | 146.8 | 296.1 | 480.1 |
| Cheese | 35.7 | 47.9 | 20.2 | 73.7 | 30.1 | 182.4 |
| Casein | 3.2 | 33.5 | 0.4 | 19.4 | 9.7 | 233.7 |
| Other dairy products | 8.8 | 47.8 | – | 151.6 | 26.6 | 762.7 |
| All dairy products | 151.7 | 242.5 | 141.6 | 391.5 | 362.5 | 1,658.8 |
The percentage of dairy export earnings obtained from the United Kingdom in 1970, 1975, and in recent years is shown in the following table.
| Product | Percentage from United Kingdom | |||
|---|---|---|---|---|
| 1970 | 1975 | 1932 | 1983 | |
| * Including other dairy products. | ||||
| Butter | 91.9 | 82.4 | 63.3 | 61.7 |
| Cheese | 74.5 | 27.4 | 11.4 | 16.5 |
| Casein | 9.6 | 2.1 | 1.8x* | 3.6* |
| Other dairy products | 18.4 | – | ||
| All dairy products | 62.6 | 36.2 | 24.5 | 21.9 |
In March 1975, in the context of Britain's renegotiation of its terms of entry to the community, the Common Market Heads of Government set guidelines for the quantities of butter for which New Zealand would have access to the British market for the first 3 years after 1977. They also agreed to periodic adjustments to the Protocol 18 prices taking into account, among other things, prices paid to EC farmers, production costs in New Zealand, and trends in freight charges. In addition, they left the way open for further access for New Zealand cheese after 1977.
In the Tokyo Round of the General Agreement on Tariffs and Trade (GATT), which was concluded in 1979, New Zealand was successful in obtaining the Agreement of the European Community to an annual quota of 9500 tonnes of New Zealand cheese. Compared with the 70 000 tonnes of cheese which New Zealand exported to the Community prior to Britain's accession, the new quota is not large, but nevertheless it has enabled New Zealand to resume the marketing of cheese throughout the European Community.
Improved access to the EC was also negotiated for beef. The EC's annual global tariff quota was increased from 38 500 tonnes of 50 000 tonnes, thus providing some additional access opportunity in which New Zealand might share.
In June 1976 the Community's Council of Agriculture Ministers agreed on the arrangements for the import of New Zealand butter into Britain in the years 1978–80. The quantities agreed for those years were 125 000, 120 000, and 115 000 tonnes respectively.
In September 1980 New Zealand agreed under an arrangement with the Community that it would reduce its 1980 butter quota by 20 000 tonnes in return for an increase in New Zealand's c.i.f. price to the level of 75 percent of the European Community's intervention price. Agreement on New Zealand's butter exports to Britain during 1982–83 was reached at the beginning of April 1981. Under this arrangement, Britain was allowed to import 94 000 tonnes of New Zealand butter in 1981 and 92 000 tonnes in 1982. The access level for 1983 was subsequently agreed at 87 000 tonnes. The Commission of the EC has proposed that the access level for 1984 be set at 83 000 tonnes, reducing by 2000 tonnes per annum to 75 000 tonnes in 1988.
Although efforts continue to be made by the New Zealand dairy industry to diversify butter exports, market opportunities outside Europe are limited and therefore continued access to Britain for substantial quantities of butter remains essential.
Although the Treaty establishing the European Community included provision for a common market organisation for sheepmeat, this was not considered necessary because the Community was by no means self-sufficient in sheepmeat production. Member states operated national controls on sheepmeat imports from third countries and the introduction of a Community regulation only became necessary when French restrictions on imports of sheepmeats from European Community members other than Ireland became an issue between the United Kingdom and France in 1978.
In May 1980 the European Community Agriculture Council agreed on the regulation of the sheepmeat sector and that such regulation would come into effect only when voluntary restraint agreements had been concluded with third-country suppliers. In October 1980 New Zealand formerly entered into an agreement by which the European Community agreed on guaranteed access for New Zealand of 245 500 tonnes of sheepmeat per annum in return for which the European Community reduced the 20 percent ad valorem tariff to 10 percent.
UNITED KINGDOM MARKET: Butter—New Zealand continues to retain an important supply position in the United Kingdom butter market, as the following table illustrates. Domestic production of butter in the United Kingdom has dramatically increased in recent years and, with the decreasing level of consumption, is becoming a relatively larger influence on the market.
| Country of Origin | Butter | |||
|---|---|---|---|---|
| 1979 | 1980 | 1981 | 1982 | |
| tonnes (000) | ||||
| New Zealand | 120.0 | 108.0 | 100.5 | 99.2 |
| Belgium/Luxembourg | 0.2 | 0.3 | – | 1.7 |
| Denmark | 43.5 | 39.8 | 43.2 | 37.3 |
| West Germany | 9.1 | 11.2 | 9.0 | 6.1 |
| France | 1.6 | 1.3 | 1.3 | 1.0 |
| Ireland | 40.0 | 30.0 | 31.0 | 27.5 |
| Netherlands | 24.9 | 13.0 | 21.9 | 10.6 |
| Other countries | – | – | – | 0.2 |
| Total imports | 239.3 | 203.5 | 207.0 | 183.6 |
| United Kingdom production | 157.7 | 168.6 | 171.6x | 215.5 |
| Source: Milk Marketing Board, U.K. | ||||
The following table shows the comparative figures for consumption of butter and margarine per head in the United Kingdom in 1970, 1975, and in recent years.
| Product | 1970 | 1975 | 1980 | 1981 | 1982 |
|---|---|---|---|---|---|
| kilogram per head | |||||
| Butter | 8.8 | 8.4 | 6.1 | 5.7x | 5.4 |
| Margarine | 5.4 | 5.0 | 7.1 | 7.2x | 7.6 |
| Source: Milk Marketing Board, U.K. | |||||
Meat—The following table shows the imports of fresh, chilled, or frozen meat into the United Kingdom from the principal countries, by country of export. (Source: Commonwealth Secretariat.)
| Country of Export | Mutton and Lamb | Beef and Veal | ||||||
|---|---|---|---|---|---|---|---|---|
| 1979 | 1980 | 1981 | 1982 | 1979 | 1980 | 1981 | 1982 | |
| tonnes (000) | ||||||||
| New Zealand | 200 | 189 | 156x | 217 | 4 | 6 | 6 | 4 |
| Australia | 7 | 2 | 1 | 4 | 10 | 6 | 3 | 8 |
| Argentina | – | – | – | – | 11 | 13 | 15 | 7 |
| Denmark | – | – | – | – | 18 | 5 | 5 | 4 |
| Ireland, Republic of | – | – | – | – | 149 | 159 | 102 | 97 |
| Botswana | – | – | – | – | 15 | 1 | 5 | 9 |
| France | – | – | – | – | 18 | 14 | 10 | 8 |
| West Germany | – | – | – | – | 29 | 14 | 17 | 10 |
| Other countries | – | – | 1x | 1 | 22 | 15 | 23 | 29 |
| Total imports | 207 | 191 | 158x | 222 | 276 | 233 | 186 | 176 |
| United Kingdom production | 230x | 278x | 263 | 263 | 1 042x | 1 102x | 1 058 | 965 |
The Meat and Livestock Commission estimated that in 1982 the inhabitants of the United Kingdom consumed per head 19 kilograms of beef and veal, 7 kilograms of mutton and lamb, 21 kilograms of pigmeats, 4 kilograms of offal, and 15 kilograms of poultry.
THE ORGANISATION OF MARKETING—In a country such as New Zealand, which is very dependent upon overseas trade, the efficient organisation of marketing of primary produce takes on a special importance.
Marketing Authorities—Since about 1950 the principle has been accepted that producers should be predominantly responsible for the marketing of their products. The major statutes under which specific marketing authorities operate are the Dairy Board Act 1961, the Meat Export Control Act 1921–22 and the Amendment Acts 1956, 1971, and 1980 (for the Meat Producers Board), and the Meat Export Prices Act 1955, the Wool Industry Act 1977, the Milk Act 1967, the Apple and Pear Marketing Act 1971, the Poultry Board Act 1980, and the Primary Marketing Act 1953 (safeguards citrus fruit, and honey).
Dairy Produce—The New Zealand Dairy Board acquires and markets all dairy products intended for export and regulates the marketing of butter and cheese in New Zealand. The New Zealand Dairy Board is a statutory authority operating under the Dairy Board Act 1961 and acts as the administrative body for the industry and as its export marketing agency. Of the board's directors, 11 are elected by the co-operative companies, 2 are appointed by the Government, and 1 by the New Zealand Milk Board. The board acquires all export dairy products from the manufacturing companies, sells the goods overseas, and returns the proceeds, less marketing costs, to the companies.
The board sells its products throughout the world, and is currently exporting to over 100 countries. Sales are made in the United Kingdom through the board's own sales organisation. In other markets, the board either sells through its own local companies, or through local agents, or in the case of some buyers it sells direct on a contract basis. Increasingly the board is posting its own personnel overseas in key markets as liaison representatives and, where warranted, subsidiary trading companies have been established.
Meat—The New Zealand Meat Producers Board was constituted in 1922 under the provisions of the Meat Export Control Act 1921–22 to protect the national and producers' interests. Up to 31 January 1981, the board obtained funds by the imposition of a levy on all meat exported (except canned meats and offals). However from 1 February 1981, the levy was extended to cover meat for both domestic and export consumption (excluding pigmeat) and collected as a per head charge at time of slaughter.
The current levy rates are—
| Cents per Head | |
|---|---|
| Lambs | 20 |
| Other sheep and goats | 29 |
| Bobby calves (under 27 kg) | 24 |
| Vealers | 150 |
| Other adult cattle | 330 |
Funds from the levy and interest on investments totalled $17.8 million in the year ended September 1983. Expenditure exceeded income by $0.8 million.
The board's main responsibilities are:
Meat export licensing;
The grading, storage, and shipment of meat;
Market research;
The promotion of New Zealand meat;
Improvement in the quality of New Zealand meat;
Meat price stabilisation.
The board has engaged in most activities in the export trade in the interests of the producer.
The board has had a major influence on meat marketing policy through the regulation of shipments, control over quality, and the development of markets through promotion, in which it is investing some $10.2 million a year.
In its market support activities the board promotes the sale of meat on an international scale. To this end it has established in its major markets a network of market consultants assisting the board through its overseas offices, which are in London, New York, Tokyo, Brussels, Tehran, and Bahrain.
Prior to 1971 the board's power to participate in the purchase and sale of meat in any country outside New Zealand was limited under the terms of the Act to the establishment of markets in those countries where no substantial market for New Zealand meat previously existed and to the expansion and maintenance of those markets. An amendment to the Act passed in October 1971 extended the board's power to enable it to buy any meat derived from sheep and sell in or export to any country. These powers were further extended in 1974 by an Order in Council which enables the board to buy and sell beef. In the 1971–72 season the board purchased a sizeable proportion of lambs slaughtered for export, while, at one stage in the 1974–75 season, it was purchasing mutton, beef, and iamb. During the 1975–76 season and again in 1976–77 and 1977–78, the board intervened and purchased a significant proportion of the export mutton produced.
The board again intervened in the mutton and lamb markets in the 1981–82 season, purchasing about 90 percent of the season's mutton production and 16 percent of the season's lamb production. At the beginning of the 1982–83 season, continued uncertainty in the outlook for both lamb and mutton exports resulted in the New Zealand Meat Exporters Council agreeing that the board offer to buy all export lamb and mutton from 1 October 1982 at the Government supplementary minimum price levels.
This arrangement continued for the 1983–84 season. As a result of growing concern on the part of the industry and the Government regarding problems associated with sheepmeat marketing, the Minister of Agriculture appointed a task force in June 1983 to examine marketing organisation and structure. The task force recommendations were approved by Government with some modifications. Under the new arrangements the Meat Board will take control of all sheepmeat at the works. A new body, the Meat Industry Council, has been set up to formulate, in co-operation with the board, a long-term strategic plan for all branches of the industry as well as to provide input into the preparation of annual marketing plans. It will also monitor industry (including the board's) performance and lay down dispute procedures.
The administrative and promotional work of the board has served to ensure that the long-term interests of the industry are not ignored. This function embraces all activities in moving meat from producer to consumer in the quickest and most efficient manner with due regard to the stability of prices and markets.
A Pork Industry Council functions under the Pork Industry Act 1974. Its principal functions are to promote and organise the orderly development of the pork industry; to assist in the marketing of pigs, to maintain and improve quality; to increase production; to promote efficiency; and to ensure a supply of foodstuffs for pigs. The council is now amalgamated with the Pork Marketing Board.
Wool—The New Zealand Wool Board—an amalgamation of the old Wool Board and the Wool Marketing Corporation—was established on 7 February 1978 by the Wool Industry Act 1977. The board is a grower-controlled authority which has as its object to obtain, in the interest of growers, the best possible long-term returns for New Zealand wool. Currently the board is involved in a number of activities associated with the marketing of wool including the operation of a minimum prices scheme and a market intervention scheme aimed at reducing fluctuations in prices and cushioning declines in the market. It is also deeply involved in the research and promotion of New Zealand wool and is a partner in the International Wool Secretariat.
Apples and Pears—Apples and pears are purchased from growers by the New Zealand Apple and Pear Marketing Board. This board was set up in 1948, in terms of the Apple and Pear Marketing Act 1971, to acquire and market the apple and pear crop. Under the Apple and Pear Marketing Amendment Act 1967 there has been set up an Apple and Pear Prices Authority whose function it is to determine each season the average price to be paid for apples and pears. This price is a New Zealand average, and within it prices to growers vary for the different varieties, grades, and sizes. Most apples and pears of standard grade are purchased by the board, with private sales by growers limited by regulations. Growers may sell direct to consumers in lots of not more than 2 cases, or with permission of the board, to retailers in specified localities. Manufacturers may be licensed by the board to purchase their requirements direct from growers (although in some cases the board itself purchases fruit and resells it to the factory).
The board decides what proportion of the fruit is to remain in New Zealand and what proportion is to be exported, and arranges for the storage and release of varieties according to their condition and keeping capacity, in order to make fruit available for as long a period as possible during the year. The board determines the wholesale prices at which fruit is sold in New Zealand by authorised wholesalers to retailers.
Apart from its fresh fruit activities, the board is also extensively involved in the processing of apples and pears with over 30 percent of the total crop handled being processed into fruit juices and other apple products for both domestic and export sales.
A defined mechanism exists for the distribution of any surplus achieved in the board's trading in any year. The first call on any surplus is to cover a declared capital charge for the year which is set prior to commencement of harvest. Any balance remaining up to a declared seasonal supplementary price is paid in full to the growers.
Should the board's trading provide a surplus in excess of the declared supplementary price, 50 percent of this further surplus is paid to growers and 50 percent is retained within a Stabilisation Account. This Stabilisation Account is used to fund losses sustained in any trading year.
Financial results for recent seasons are shown in the following table:
| Season | Profit or Loss | Retained by Board | Distributed to Growers | Stabilisation Account |
|---|---|---|---|---|
| $(000) | ||||
| 1977–78 | 12,382 | 6,322 | 6,060 | 12,138 |
| 1978–79 | 9,991 | 5,135 | 4,856 | 17,273 |
| 1979–80 | 14,561 | 5,443 | 9,118 | 22,716 |
| 1980–81 | −12,042 | −12,042 | – | −130 |
| 1981–82 | 17,289 | 11,173 | 6,116 | 5,986 |
| 1982–83 | 8,108 | 4,393 | 3,715 | 7,750 |
Potatoes—The New Zealand Potato Board was reconstituted by the Potato Industry Act 1977 as predominantly a producer organisation. It consists of 9 members—a member appointed by the Minister of Agriculture representing the interests of the consumer, 6 grower members (3 nominated by the New Zealand Potato Growers Federation and 3 by the New Zealand Vegetable and Produce Growers Federation), and 2 merchant members representing the New Zealand Agricultural Merchants Federation and the New Zealand Fruit and Produce Merchants and Auctioneers Federation.
The principal functions of the Potato Board are to promote and assist in the orderly development of the potato industry in New Zealand, and to ensure as far as practicable an adequate supply of potatoes. It maintains a register of potato plantings and charges a registration fee. The board has the power to administer a legal minimum quality standard scheme for potatoes; to specify standards for table and seed potatoes; to foster, arrange, or undertake the disposal of, surplus potatoes or sub-standard potatoes or the export or import of potatoes where necessary; to further sales by publicity or otherwise; to maintain statistics and disseminate information to growers; and to foster research and development in the industry.
Milk—The New Zealand Milk Board was set up in 1953. It operates the national milk scheme and engages in other activities for the purpose of ensuring an adequate supply and efficient distribution of milk. The legislation is contained in the Milk Act 1967.
The board, with the approval of the Minister of Agriculture, may make a levy on milk to finance its operations and retail prices are fixed by Order in Council. The price for the milk to the producer is fixed by the Minister of Agriculture after consultation with the Milk Board. Intermediate margins, such as those for treating milk and to vendors for its delivery, are fixed by the Secretary of Trade and Industry. The total cost at the present time exceeds the amount paid by the consumers, the balance being met by subsidy. It is the function of the Milk Board to administer the whole town milk scheme on behalf of the Government which, however, retains a direct interest by virtue of the substantial sum paid in subsidy.
Eggs and Poultry—Under the Poultry Board Act 1980 the Egg Marketing Authority, which was established in 1953, was dissolved and its functions merged with those of the New Zealand Poultry Board.
The functions of the New Zealand Poultry Board are—
in general, to promote, organise, and develop the poultry industry;
to regulate and control the production, marketing, and distribution of eggs and egg products within New Zealand and elsewhere; and
to assist, foster, and promote efficiency in the production, marketing, and distribution of poultry and poultry products.
The board has 8 members, of whom 3 are appointed as representatives of the Government and 5 as representatives of poultry farmers.
The board operates principally through licensed egg marketing agents in the various districts who, on commission, receive and resell eggs or, as directed by the board, manufacture egg pulp for the use of bakers and pastrycooks. Eggs are subject to price control.
Imported Citrus Fruits, Bananas, Pineapples, and Grapes—The importation and marketing of imported citrus fruits, bananas, pineapples, and grapes are the responsibility of a public company, Fruit Distributors Ltd, representing trade interests. The operations of the company are defined and restricted by an agreement between it and the Government. There are 2 Government representatives on the company's board of directors.
Honey—In 1981 a major restructuring of the honey-marketing system was initiated. Previously, the statutory Honey Marketing Authority had exercised control over the export of honey. By industry decision, the authority has now wound up its activities, and the exporting of honey is being opened to all parties.
A New Zealand honey co-operative has been formed and has acquired the assets of the former Honey Marketing Authority.
A hive levy, payable by all producers who own 50 or more honey-producing hives, is administered by the National Beekeepers Association for the benefit of the industry generally. The rate of the levy is determined annually—currently it is 17.5c per hive.
TRANSPORT AND OVERSEAS MARKETS—Farm products form the bulk of New Zealand's exports. They come to hand for shipment in seasonal cycles. These are most pronounced for lamb, apples and pears, and horticultural products like kiwi fruit, but apply also to a marked extent to mutton, beef, wool, and related produce. Butter, cheese and other dairy produce are available throughout the' year, but production is considerably higher between October to March than in the remainder of the year. The peak season for all the animal products is much the same, being roughly November to May, while there is a shorter concentrated season for fruit in March, April and May.
The seasonality presents shipping and air cargo problems in the marketing process. In addition, the bulk of the commodities are perishable and require continuous refrigeration throughout the period of at least 2 to 3 months between production and consumption. The demand for shipping space lags a little behind the season, generally building up in January and declining in June. A realisation of the demands that increased production was making on transport, storage, handling, and shipping services led in 1964 to the setting up of an Exports and Shipping Council, an independent body whose main purpose is to improve the efficiency and economy of New Zealand trade as it relates to transport services. Shipping receives special attention as shipping costs absorb a substantial portion of market realisations. Airfreight is also beginning to receive similar attention as New Zealand's horticultural trade expands and pressure mounts for more air cargo space. The council serves as a forum for discussion between its members and advises the New Zealand Government of the collective views of the industry on policy issues.
The council is representative of producer boards, freezing companies, New Zealand Railways Corporation, road transport operators, shipping operators, harbour boards, the New Zealand Chambers of Commerce, the Manufacturers Federation, forestry, fishing and horticultural industries. The New Zealand Ports Authority, Department of Trade and Industry, and the Ministry of Transport have observer status. The council has been successful in bringing into effect many of the recommendations of the streamlining report on port, shipping, transport, and other services produced as a result of consultations between the producer boards and the main shipping lines, and it continues its efforts to improve the efficiency and economy of transporting goods in and out of New Zealand.
PRICES FOR FARM PRODUCTS: Wool—The New Zealand Wool Board and the Wool Marketing Corporation were amalgamated under the Wool Industry Act on 7 February 1978. One of the main activities of the new board is the continuance of the corporation's minimum or floor price plan, and its market intervention and strata price control schemes.
The floor price plan was introduced in 1952 by the corporation's predecessor, the New Zealand Wool Commission. It guarantees wool growers a minimum income from the wool they sell. The board prepares a table of minimum prices for all types of wool (there are almost 2000) before the start of a new selling season. The prices are fixed in agreement with the Minister of Agriculture, and are not altered during the season. If wool is sold either to commercial buyers or to the board, at a price below the appropriate minimum, the board makes a supplementary payment to the grower up to the floor level. Supplementary payments are made from the board's Wool Income Stabilisation Account. The account is funded by a 1 percent levy on the returns for wool sold for the first time at above minimum prices.
The minimum price per kilogram greasy weight for the 1983–84 season was 250 cents.
The floor price plan applies to all grower-owned scoured and greasy wool sold for the first time at auction in New Zealand and Britain. There are also procedures to protect greasy wool sold privately in New Zealand.
The board can buy wool at any price under its market intervention policy. It will do this to prevent lots being sold significantly below the market, and to cushion declines in the price. Intervention levels can be set above, at, or below, floor prices. Levels can be changed at any time by the board's directors, although their aim is to set levels which can be held for some time. The board will bid at auction if prices drop to intervention levels. If the commercial benches do not raise the price, the board buys.
When prices are above intervention levels, the board operates its “strata price control”. It bids when necessary to prevent prices falling more than a set percentage on the previous day's levels.
The following table shows weight, sale value, and average value per kilogram of greasy wool sold at auction. The last column shows the average minimum price to growers set by the New Zealand Wool Board.
| Season Ended June | Greasy Wool Sold at Auction | Total Sale Value | Sale Value per Kilogram | Average Minimum Price per Kilogram |
|---|---|---|---|---|
| Tonnes (000) | $ (million) | c | c | |
| 1978 | 198.61 | 378.2 | 190.43 | 150.00 |
| 1979 | 204.35 | 447.2 | 218.80 | 170.00 |
| 1980 | 235.73 | 624.9 | 265.09 | 200.00 |
| 1981 | 258.01 | 638.5 | 247.48 | 215.00 |
| 1982 | 255.91 | 654.4 | 255.70 | 250.00 |
| 1983 | 259.21 | 663.3 | 255.90 | 250.00 |
The next table shows index numbers based on prices of new clip greasy wool sold at auction in New Zealand adjusted to a clean f.o.b. New Zealand port basis. The All Wool and Each Group Index is on its own base: average over all sales of 1975–76 season (=1000).
| Season Ended June | All Wool | Fine Wools* | Medium Wools† | Coarse Wools‡ |
|---|---|---|---|---|
*28 microns and finer. †29 to 34 microns. ‡35 microns and higher. | ||||
| 1977–78 | 2,066 | 1,792 | 2,076 | 2,066 |
| 1978–79 | 2,363 | 2,003 | 2,397 | 2,367 |
| 1979–80 | 2,831 | 2,444 | 2,814 | 2,848 |
| 1980–81 | 2,672 | 2,424 | 2,617 | 2,683 |
| 1981–82 | 2,758 | 2,691 | 2,659 | 2,747 |
| 1982–83 | 2,708 | 2,772 | 2,550 | 2,698 |
| Source: Monthly Abstract of Statistics. | ||||
Dairy Produce—Basic prices (then known as guaranteed prices) were introduced in 1936 for butter and cheese. The present legislative authority for the fixing of purchase prices for all dairy produce which the Dairy Board acquires for export is the Dairy Board Act 1961, as amended by the Dairy Board Amendment Acts of 1972 and 1975.
Since the 1975–76 season, the Dairy Products Prices Authority has established separate values for the milkfat and solids-non-fat (s.n.f.) components of milk on a farm gate basis at the beginning of each season. These values are established having regard to the stability and efficiency of the dairy industry, realisations and market prospects, and the state of the Dairy Industry Account. They may normally not increase by more than 10 percent nor decrease by more than 5 percent on the previous season's values.
Using the milkfat and s.n.f. prices established by the prices authority as a base, the board, in turn, fixes the export purchase prices for the major dairy products by using New Zealand average yields and costs. The board may apply differentials between products to enable the product mix to be more closely matched with expected market requirements, but in doing so must establish purchase prices for products in such a manner that the average payment for the fat and s.n.f. components is at the level set by the prices authority.
The results of the board's export trading each season are recorded in 2 separate accounts—one for the seasons' trading in milkfat products, and the other for trading in s.n.f. products. The differences between export sales prices less selling costs and the purchase prices paid, results in a surplus or deficit in both of these accounts at the end of the year.
The board may pay up to 50 percent of any surplus in either of the trading accounts as an end-of-season distribution, provided such distribution is not considered by the Government to affect adversely the national economy and the stability of the dairy industry. Any remaining surplus, and any deficit, is then transferred to the Dairy Industry Reserve Account.
This system of purchase prices, trading, and reserve accounts, ensures that severe fluctuations in overseas prices are smoothed out when translated into the price the farmer received for his milk. In the short term, a surplus or deficit in the Reserve Account may occur, but in the longer term the account must be self-balancing from overseas revenue.
The following table gives the average value of milkfat and s.n.f. in wholemilk “at farm” as set by the Dairy Products Prices Authority plus the end-of-season distribution paid from the milkfat account.
| Season Ended 31 May | Milkfat Value | S.N.F. Value | End of Season Distribution | Total Wholemilk Value |
|---|---|---|---|---|
* Provisional. †Interim. | ||||
| (cents per kilogram of milkfat) | ||||
| 1979–80 | 131.00 | 54.00 | 23.00 | 208.00 |
| 1980–81 | 162.00 | 68.00 | 35.07 | 265.07 |
| 1981–82 | 189.00 | 79.00 | 48.00 | 316.00 |
| 1982–83* | 224.00 | 94.00 | 42.00 | 360.00 |
| 1983–84† | 240.00 | 100.00 | ||
Town Milk Supply—The objects of the New Zealand Milk Board are the provision of an adequate supply of milk of good quality for human consumption and the organisation of the town milk industry on an economic basis. The board arranges supply contracts with milk producer companies for all districts, reports to Government on the adequacy of the town milk producer price, makes recommendations as to aspects of price fixation, fixes local allowances for cartage and such special distribution allowances as may be necessary, makes financial adjustments with all those in the industry to see that they get the prices or allowances to which they are entitled, and in doing so pays out subsidy on behalf of Government.
The total Government subsidy on town milk paid during recent 12-month periods ended 31 August has been as follows: 1978–79, $44,192,130; 1979–80, $40,523,536; 1980–81, $37,791,479, 1981–82, $29,117,856 and 1982–83, $5,348,622. These figures include deferred payments.
The following table shows production and sales of town milk under the control of the New Zealand Milk Board.
| Year Ended 31 August | Production | Quantity on Which Town Milk Price Paid | Volume of Town Sales | Price per Litre Paid to Producers Finest Grade | Government Subsidy per Litre of Town Milk Sales |
|---|---|---|---|---|---|
| litres (m) | c | c | |||
| 1979 | 722.9 | 535.2 | 386.3 | 13.387 | 11.439 |
| 1980 | 723.3 | 514.2 | 382.9 | 15.127 | 10.804 |
| 1981 | 674.2 | 471.7 | 374.2 | 18.735 | 9.223 |
| 1982 | 663.0 | 437.1 | 366.1 | 22.959x | 7.595 |
| 1983 | 660.0 | 427.5 | 359.7 | 22.959 | 1.516 |
Meat—The Imported Meat Trade Association in the United Kingdom compiles weekly London wholesale meat prices, the basis of quotation being “ex-hooks to retailers at Smithfield market”. The next table gives prices for New Zealand lamb and beef at the end of the last week in March. Approximately 40 percent of the value of all New Zealand exports of frozen and chilled meat is generally accounted for by lamb, and the 8–12.5 kg and 13–16 kg P grades quoted in the table usually account for 10 to 15 percent and 35 to 40 percent respectively of all lamb carcasses exported.
| End of Last Week in March | Lamb (new seasons product) | ||||
|---|---|---|---|---|---|
| Prime Grade | Y Grade | ||||
| 8 to 12.5 kg | 13 to 16 kg | 16.5 to 19.5 kg | 8 to 12.5 kg | 13 to 16 kg | |
* At 8 April 1983. †16.5 to 20 kg. | |||||
| New pence per kilogram equivalent | |||||
| 1980 | 116.8–119.0 | 112.4–114.6 | 106.9–109.1 | 110.2–112.4 | 108.0–109.1 |
| 1981 | 125.7–126.8 | 121.3–123.5 | 114.6–117.9 | 123.5–124.6 | 121.3–123.5 |
| 1982 | 143.3–145.5 | 143.3–145.5 | 138.9–141.1 | 137.8–138.9 | 141.1–143.3 |
| 1983 | 137.1 | 135.6 | 122.4 | 135.1* | 133.4* |
| 1984 | 142.6 | 141.1 | 131.6† | 140.0 | 140.0 |
Schedule Prices—A schedule of buying prices is issued each week by the meat operators in New Zealand. The producers have a choice of how to sell their export meat. They can sell on schedule, on owner's account, on a pool account system, on the basis of prices received from a nominated ship, on the hoof, or they can sell through a producer co-operative.
The New Zealand Meat Producers Board can, by use of its statutory powers, issue its own schedule of meat export prices. It has taken this course of action in the past when it has considered that exporters were unduly pessimistic in their assessment of future overseas market prices, or when the schedule offered by exporters for lamb or mutton was below the board's minimum price. Intervention of this type by the board involves not only the setting of the schedule but also arranging for the marketing overseas of the various products on its own account.
Because of the uncertainty which existed in the outlook for lamb and mutton at the beginning of the 1982–83 season, the board with the agreement of the Meat Exporters Council and Government, issued a schedule for lamb and mutton at the supplementary minimum price level and purchased the full season's export kill.
Overseas prices for beef improved during the 1982–83 season and this, coupled with the devaluation of the New Zealand dollar in early March 1983, resulted in the schedule exceeding the supplementary minimum price levels for P1 Steer-related grades in early February and M Cow-related and Bull-grades in early March. The improvement in beef prices resulted in buffer account levies being applied from early April and applying to the P1 Steer-related and Bull-grades for much of the rest of the season.
The opening schedules for the latest 5 seasons are given below. The prices quoted are for dressed weights “on the hooks” at freezing works. The prices for lamb and mutton are for bare meat only with an additional payment being made for the wool and pelt.
| OPENING NORTH ISLAND SCHEDULE PRICES | |||||
|---|---|---|---|---|---|
| Class of Meat | 1979–80 | 1980–81 | 1981–82 | 1982–83 | 1983–84 |
* Includes early season premium of 9 cents per kilogram. †Based on Supplementary Minimum Price. ‡Prior to 1983–84 ML 22 kg and under. | |||||
| cents per kg | |||||
| Lamb— | |||||
| PL, 9.0–12.5 kg | 92.0* | 115.0 | 136.0 | 133.0 | 135.5 |
| PM, 13.0–16.0 kg | 86.0† | 114.0 | 145.0† | 148.0† | 148.5† |
| YL, 9.0–12.5 kg | 90.0* | 110.0 | 125.0 | 126.0 | 139.5 |
| Mutton— | |||||
| MX, 22 kg and under‡ | 40.0 | 56.0 | 50.0† | 50.0† | 50.5† |
| MM, 22.5–26.0 kg | 25.5 | 40.0 | 30.0 | 21.0 | 24.0 |
| Beef— | |||||
| PI—Steer, 245.5–270 kg | 128.5 | 123.0 | 143.0† | 147.5† | 184.5 |
| LI—Steer, 245.5–270 kg | 123.5 | 114.5 | 143.0 | 147.5 | 184.5 |
| M—Cow, 145.5 kg-170 kg | 106.5 | 105.0† | 125.0† | 126.0† | 132.0 |
| Bull, 220–245 kg | 129.5 | 130.0 | 143.0† | 147.5† | 178.5 |
Minimum Prices for Export Meat—The scheme which had operated since 1955 has been replaced by a more comprehensive system with 2 principal aims: first, to establish floor prices at a more realistic level and, second, to provide a mechanism which will allow for the replenishment of the funds paid out during the periods of low prices by levying farmers' receipts when prices exceed certain “trigger” levels.
Minimum prices are based on the average of the actual price for the preceding season, the estimated price for the current season (towards the end of which the determinations are made), and a forecast for the following season during which the prices will operate. The Meat Export Prices Committee will have descretion to set the minima up to 10 percent above or below the average of the 3 seasons. The committee also determines the trigger prices for each of the 5 benchmark grades of meat. A meat income stabilisation levy is imposed when schedule prices exceed the appropriate trigger price, the proceeds going into individual buffer accounts (sheep meats and beef) established at the Reserve Bank within the Meat Industry Stabilisation Account.
In general, the scheme aims at placing a floor under the prices the producers receive, financed by funds accumulated when returns are at higher levels. It is, in short, a price-smoothing scheme which, at the same time, pays necessary regard to changes in market demand. Because of the importance of meat in the national economy, it will also have the effect of softening the impact of any sharp movements in overseas prices.
The minimum and “trigger” prices for the 1983–84 meat season are shown in the following table.
| Class of Meat | Minimum Prices | Trigger Prices |
|---|---|---|
| cents per kg | ||
| Lamb— | ||
| PM-PT, 13.0 to 16.0 kg | 99 | 155 |
| Mutton— | ||
| MX, 22 kg and under | 12 | 52 |
| Beef— | ||
| PI Steer, 245.5 to 270 kg | 153 | 200 |
| M Cow, 145.5 to 170 kg | 120 | 165 |
| Bull, 220.5 to 245 kg | 150 | 195 |
These are known as the “benchmark” prices. They are the key grades for each category of meat. Other grades will be priced at appropriate differentials.
In addition to the above scheme the Government announced in the 1978 Budget the Supplementary Minimum Prices Scheme. This scheme differs from the Price Smoothing Scheme in that it offers direct price support to the producer. The minimum prices announced under this scheme for the 1983–84 season are as follows:
| Product | Supplementary Minimum Price |
|---|---|
| Lamb PM-PT (13.0–16.0 kg) | 146c/kg |
| Mutton MX (22 kg and over) | 51c/kg |
| Prime Beef PI Steer (220.5–270 kg) | 147c/kg |
| Manufacturing Beef M Cow (140 kg and over) | 125c/kg |
| Bull (220.5–245 kg) | 147c/kg |
If the weighted average schedule price for a benchmark grade falls below the supplementary minimum price, the supplementary minimum price for all the other relevant non-benchmark grades of meat will be determined and the producers will be paid accordingly. The minimum prices are set for a 2-year period but can be increased in the second year.
FARM INDUSTRY RESERVES—Farm industry reserves were built up during the Second World War when, in furtherance of the Government's stabilisation policy, farmers agreed that increases in overseas realisations for meat and dairy produce be paid into special funds for later use for the benefit of the industry concerned. The wool reserve account (later the capital funds of the Wool Marketing Corporation) arose in the main from the profits derived from the sale of wartime surplus stocks, and in part from a contributory charge levied on wool sold at that time. Much of it was used to buy in wool in 1966–67 but this was all resold by 1972. About half the meat industry reserve was used to purchase lambs in 1971–72 to provide a higher price schedule, but was recovered from the ensuing marketing of the meat. The meat industry and wool reserve accounts were both drawn on again in 1974–75. Modifications to the Wool Industry Stabilisation Scheme in 1983 led to an increase in the levy from 1 percent to 2 percent for the 1983–84 season. For 1984–85 the levy will drop back to 1 percent.
If the fund reaches 9 percent of gross shorn wool proceeds, the levy will be suspended and the New Zealand Wool Board will review the percentage applied to the general fund. Where necessary, supplementary payments back from the fund will assure growers of a minimum price.
The following table shows the balances in the various farm industry reserve and stabilisation accounts at given dates.
| Year | Wool Board Capital and Reserves at 30 June | Minimum Wool Prices Funding Account at 30 June | Meat Income Stabilisation Account at 30 Sep | Meat Industry Reserve Account at 30 Sep | Dairy Produce Account at 31 May |
|---|---|---|---|---|---|
| $(000) | |||||
| 1979 | 105,340 | 52,464* | 32,301 | 102,204 | −27,247 |
| 1980 | 127,468 | 69,540* | 22,881 | 105,284 | 34,111 |
| 1981 | 133,014 | 78,928 | −43,500 | 115,074 | 101,171 |
| 1982 | 133,612 | 81,943 | −64,608 | 129,282 | 173,991 |
| 1983 | 126,285 | 77,271 | −35,063 | 134,703 | 228,161 |
FURTHER INFORMATION—Further information on the marketing of farm produce will be found in the annual reports of the various producer boards, including the New Zealand Dairy Board, the New Zealand Meat Producers Board, the New Zealand Wool Board, and the New Zealand Milk Board. Other useful publications include the external trade publications of the Department of Statistics and the following:
Report of the Department of Trade and Industry (Parl. paper G. 14)
Export News—Department of Trade and Industry (monthly).
White Paper on the GATT Multilateral Trade Negotiations (Parl. paper G. 14A, 1979).
New Zealand and the European Community—New Zealand Planning Council (1978).
The New Zealand Meat Producer—New Zealand Meat Producers Board (monthly).
The New Zealand Dairy Exporter—New Zealand Dairy Board (monthly).
Monthly Abstract of Statistics—Department of Statistics.
Domestic trade embraces retail and wholesale trade and part of the service field. The trend of retail trade is one of the most perceptive barometers of economic activity as it constitutes a large proportion of personal expenditure on consumer goods and services.
The sixth of New Zealand's 5-yearly Censuses of Distribution, which provide the basis for the current monthly and quarterly surveys of retail and wholesale trade, was taken for the year 1977–78, and was the first fully-integrated economic census covering the activities of establishments and ancillary units predominantly engaged in wholesale or retail trade, hotels and restaurants, etc., and the supply of personal and household services.
All activities from the purchase of goods and supplies to the point at which the goods or services were sold were within the scope of the sixth census, which was for the year ended 31 March 1978 or the last accounting year prior to 31 March.
The census formed part of the department's five-yearly series of integrated economic censuses and for this reason any comparison with the censuses of distribution prior to 1977–78 should be treated with caution. A second Census of Distribution was taken in 1982–83 and the results are currently being processed.
In 1977–78 the distribution industries were reclassified under the New Zealand Standard Industrial Classification covering:
Wholesale Trade;
Retail Trade;
Restaurants and Hotels;
Personal and Household Services.
The statistical tables which follow give summaries of those four divisions. The definitions used in these tables are the same as those listed for the Census of Manufacturing statistics (see section 19), with the following exceptions.
Establishments—Productive units, usually warehouses, shops, stores, hotels, repair-workshops, etc., engaged predominantly in selling goods and services.
Ancillary Units—Servicing units, usually head offices, engaged in predominantly servicing those establishments.
(The 5 oil companies, classified as wholesalers of “petroleum products”, were not required to advise separate details of establishment/ancillary unit activities.)
The following table gives a general summary of the results from the 4 divisions and of the 1977–78 Census of Distribution as a whole.
| Item | Wholesale Trade | Retail Trade | Restaurants and Hotels | Personal and Household Services | Total |
|---|---|---|---|---|---|
| * At mid-April 1978. | |||||
| Number | |||||
| Establishments | 6,183 | 27,878 | 7,166 | 6,563 | 47,790 |
| Ancillary units | 272 | 209 | 36 | 30 | 547 |
| Persons engaged*— | |||||
| Males | 56,390 | 74,467 | 22,994 | 14,752 | 168,603 |
| Females | 20,995 | 68,382 | 32,192 | 9,721 | 131,290 |
| Total | 77 385 | 142 849 | 55 186 | 24 473 | 299 893 |
| Salaries and wages paid— | $(million) | ||||
| Males | 422 | 329 | 88 | 62 | 901 |
| Females | 105 | 221 | 91 | 28 | 446 |
| Total | 526 | 550 | 179 | 90 | 1,347 |
| Depreciation | 58 | 49 | 28 | 8 | 143 |
| Purchases and other expenses | 8,725 | 5,629 | 608 | 273 | 15,236 |
| Sales and other income | 9,776 | 6,548 | 904 | 441 | 17,668 |
| Value added | 1,287 | 1,032 | 306 | 172 | 2,797 |
| Capital expenditure, less disposals | 89 | 82 | 53 | 15 | 239 |
WHOLESALE TRADE—The following table provides a summary of wholesale trade during 1977–78 as shown by the Census of Distribution.
| WHOLESALE TRADE 1977–78 | |
|---|---|
| Number | |
| Establishments | 6,183 |
| Ancillary units | 272 |
| Persons engaged at mid-April 1978— | |
| Males | 56,390 |
| Females | 20,995 |
| Total | 77 385 |
| Salaries and wages paid— | $(thousand) |
| Males | 421,874 |
| Females | 104,600 |
| Total | 526,474 |
| Depreciation | 58,325 |
| Purchases and other expenses | 8,725,066 |
| Sales and other income | 9,775,811 |
| Value added | 1,286,572 |
| Capital expenditure, less disposals | 88,768 |
RETAIL TRADE—The following table provides a summary of retail trade during 1977–78 as shown by the Census of Distribution.
| RETAIL TRADE 1977–78 | |
|---|---|
| Number | |
| Establishments | 27,878 |
| Ancillary units | 209 |
| Persons engaged at mid-April 1978— | |
| Males | 74,467 |
| Females | 68,382 |
| Total | 142 849 |
| Salaries and wages paid— | $(thousand) |
| Males | 328,926 |
| Females | 221,374 |
| Total | 550,300 |
| Depreciation | 48,600 |
| Purchases and other expenses | 5,629,070 |
| Sales and other income | 6,547,549 |
| Value added | 1,032,333 |
| Capital expenditure, less disposals | 82,344 |
RESTAURANTS AND HOTELS—The following table provides a summary of the restaurants and hotels division during 1977–78 as shown by the Census of Distribution.
| RESTAURANTS AND HOTELS 1977–78 | |
|---|---|
| Number | |
| Establishments | 7,166 |
| Ancillary units | 36 |
| Persons engaged at mid-April 1978— | |
| Males | 22,994 |
| Females | 32,192 |
| Total | 55 186 |
| Salaries and wages paid— | $(thousand) |
| Males | 88,259 |
| Females | 91,108 |
| Total | 179,367 |
| Depreciation | 27,928 |
| Purchases and other expenses | 608,368 |
| Sales and other income | 904,065 |
| Value added | 306,118 |
| Capital expenditure, less disposals | 52,891 |
PERSONAL AND HOUSEHOLD SERVICES—The following table provides a summary of the personal and household services division during 1977–78 as shown by the Census of Distribution.
| PERSONAL AND HOUSEHOLD SERVICES 1977–78 | |
|---|---|
| Number | |
| Establishments | 6,563 |
| Ancillary units | 30 |
| Persons engaged at mid-April 1978— | |
| Males | 14,752 |
| Females | 9,721 |
| Total | 24 473 |
| Salaries and wages paid— | $(thousand) |
| Males | 61,954 |
| Females | 28,480 |
| Total | 90,434 |
| Depreciation | 8,449 |
| Purchases and other expenses | 273,180 |
| Sales and other income | 440,868 |
| Value added | 172,138 |
| Capital expenditure, less disposals | 15,260 |
QUARTERLY SURVEY OF RETAIL TRADE—A quarterly sample survey of retail trade was made by the Department of Statistics until the December quarter 1969. It was replaced by a monthly sample survey in January 1970 and the results of this sample are aggregated to obtain quarterly figures.
The present sample survey was revised in June 1982, based on 15 store-type groupings from the 1977–78 Census of Distribution. The survey coverage was extended to include three new store-type groups: automotive, fuel, and repairs; liquor including licensed accommodation; and accommodation; while restaurants and takeaways, previously part of the other food group, is now a separate store-type group. The survey now follows internationally accepted definitions as used in the New Zealand Standard Industrial Classification.
In order to provide a long-term historical series for users of the retail trade statistics, the department has recast the store-type estimates previously released to conform to the new store-type classification.
The following table gives quarterly sales and also stocks as at 31 March for store-type groups.
| Quarter Ended | Butcher | Supermarket/Grocer | Other Food | Footwear | Clothing and Textiles | Furniture | Household Appliances | Hardware | Chemist | Department and General | Automotive. Fuel and Repairs† | Restaurants and Takeaways | Liquor Incl. Licensed Accommodation | Accommodation* | Other Stores | All Stores |
|---|---|---|---|---|---|---|---|---|---|---|---|---|---|---|---|---|
* Excludes licensed accommodation. Accommodation store types do not usually hold trading stocks. †A further analysis of this category is available on request. | ||||||||||||||||
| $(million) | ||||||||||||||||
| Retail Sales | ||||||||||||||||
| 1982— | ||||||||||||||||
| Mar | 88.5 | 604.3x | 39.4 | 43.1 | 132.7 | 141.3x | 113.8x | 60.6x | 88.5 | 197.4 | 1,545.2 | 147.0 | 305.8 | 41.6x | 262.0x | 3,811.4x |
| Jun | 97.2 | 628.6x | 38.0x | 58.3 | 175.1 | 157.1x | 142.1 | 61.2 | 89.0 | 243.2 | 1,571.2 | 148.2x | 292.2 | 33.9 | 252.9 | 3,989.3x |
| Sep | 100.4 | 664.5 | 44.0 | 42.9 | 152.8 | 159.8 | 140.4 | 60.3 | 93.3 | 216.7 | 1,587.5 | 149.7 | 311.0 | 39.9 | 267.2 | 4,030.4 |
| Dec | 111.7 | 743.7 | 53.4 | 49.6 | 178.0 | 150.2 | 150.0 | 72.5 | 114.2 | 299.1 | 1,484.5 | 156.5 | 376.1 | 38.7 | 338.0 | 4,316.2 |
| 1983— | ||||||||||||||||
| Mar | 94.2 | 663.9 | 49.4 | 42.6 | 142.9 | 129.6 | 123.8 | 64.4 | 93.2 | 210.4 | 1,498.8 | 147.2 | 332.1 | 48.2 | 274.2 | 3,914.7 |
| Jun | 97.9 | 668.9 | 46.0 | 57.3 | 176.7 | 135.9 | 140.7 | 60.2 | 94.5 | 246.1 | 1,554.4 | 158.7 | 316.4 | 37.7 | 282.7 | 4,074.1 |
| Sep | 105.1 | 703.3 | 52.0 | 46.1 | 157.9 | 156.3 | 139.0 | 63.5 | 103.3 | 240.0 | 1,687.4 | 175.5 | 342.6 | 41.3 | 290.3 | 4,303.8 |
| Dec | 115.3 | 778.2 | 61.3 | 55.0 | 178.6 | 162.3 | 154.8 | 77.2 | 120.3 | 315.2 | 1,797.6 | 181.0 | 410.5 | 39.7 | 353.6 | 4,800.5 |
| Retail Stocks as at 31 March | ||||||||||||||||
| 1979 | 4.0 | 88.1 | 2.3 | 40.5 | 142.9 | 80.5 | 64.0 | 31.4 | 36.0 | 132.0 | 346.8 | 8.1 | 56.4 | – | 157.6 | 1,190.5 |
| 1980 | 5.4 | 111.4 | 2.9 | 55.2 | 159.6 | 104.9 | 76.6 | 35.5 | 40.8 | 154.6 | 419.6 | 9.8 | 63.7 | – | 185.8 | 1,425.9 |
| 1981 | 6.0 | 137.9 | 3.5 | 59.0 | 165.0 | 91.4 | 88.4 | 41.9 | 44.2 | 173.4 | 454.9 | 11.8 | 68.2 | – | 204.1 | 1,549.8 |
| 1982 | 7.8 | 156.1 | 3.9 | 66.5 | 178.1 | 111.6 | 95.1 | 45.3 | 52.3 | 194.5 | 608.5 | 14.1 | 69.8 | – | 231.9 | 1,835.6 |
| 1983 | 7.3 | 157.7 | 4.7 | 75.7 | 191.8 | 115.2 | 89.1 | 51.3 | 55.1 | 213.4 | 568.7 | 15.9 | 72.8 | – | 233.0 | 1,851.6 |
Retail Trade Statistics Adjusted for Seasonal Fluctuations and for Price and Population Changes—To facilitate direct comparisons between quarterly figures, seasonally adjusted values of retail trade sales have been prepared. To do this, seasonal adjustment factors were calculated representing, for each quarter, an average over several years of the ratio of sales in this quarter to the trend value for the quarter (the trend values being calculated as appropriately-centred moving averages).
A special price index has been prepared for the purpose of deflating the retail sales figures to give a series in dollars of constant purchasing power—i.e., the adjusted series shows the changes in the real volume of retail sales. The principal source of the prices used for this index are the commodity prices used in the Consumers Price Index. The prices have been appropriately weighted and the whole index expressed on the base: December quarter, 1980 (=1000), so that application of the index to the original figures, both before and after seasonal adjustment, gives a series in constant December quarter, 1980 dollars.
The results of these calculations and adjustments are shown in the following table for all store types.
| Quarter Ended | Total Sales or Turnover | Sales per Head of Population | |||||
|---|---|---|---|---|---|---|---|
| In Current $ | In Constant Dec Qtr 1980 $ Seasonally Adjusted | In Current $ | In Constant Dec Qtr 1980 $ | ||||
| As Recorded | Seasonally Adjusted | As Recorded | Seasonally Adjusted | Seasonally Adjusted | Percentage Change* | ||
| * Each quarter on previous quarter. | |||||||
| $(million) | $ | $ | $ | % | |||
| 1982—Mar | 3,811.4 | 4,012.8 | 3,410.7x | 1,193.7 | 1,256.8x | 1,068.2x | +1.7 |
| Jun | 3,989.3 | 4,082.8 | 3,348.0 | 1,256.7x | 1,286.2x | 1,054.8 | −1.3x |
| Sep | 4,030.4 | 4,077.2 | 3,249.8 | 1,273.7 | 1,288.5x | 1,027.0x | −2.6x |
| Dec | 316.2 | 3,951.5 | 3,102.1 | 1,348.9 | 1,234.9 | 969.5 | −5.6x |
| 1983—Mar | 3,914.7 | 4,122.1 | 3,220.4 | 1,212.0 | 1,276.2 | 997.1 | +2.8 |
| Jun | 4,074.1 | 4,170.6 | 3,227.7 | 1,266.6 | 1,296.6 | 1,003.4 | +0.6 |
| Sep | 4,303.8 | 4,326.9 | 3,303.3 | 1,340.1 | 1,347.3 | 1,028.6 | +2.5 |
| Dec | 4,800.5 | 4,502.8 | 3,398.5 | 1,479.9 | 1,388.1 | 1,047.7 | +1.9 |
The following graph shows quarterly retail sales.
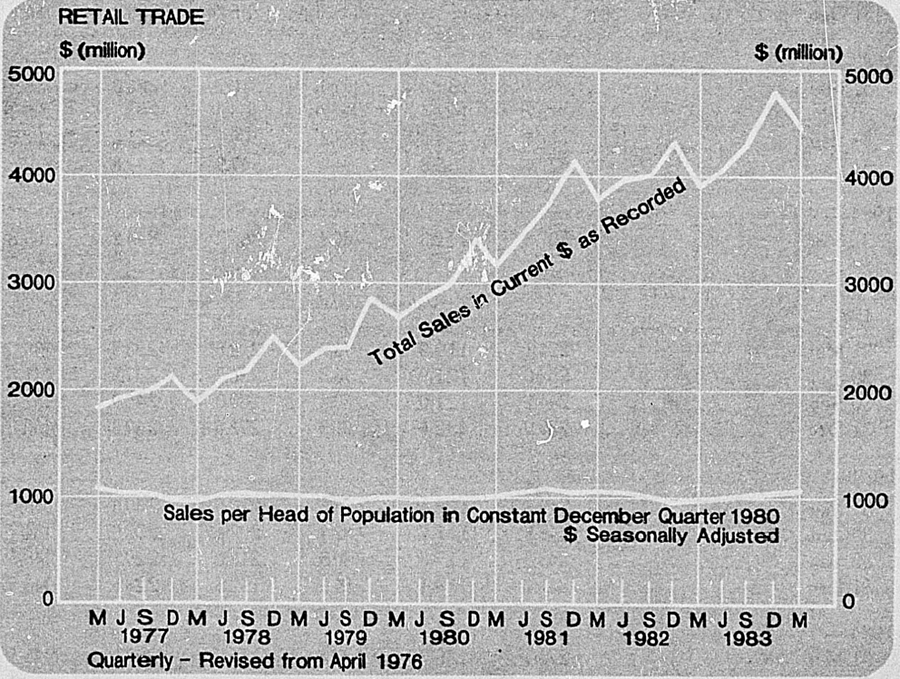
QUARTERLY SURVEY OF WHOLESALE TRADE—In this survey stores are classified by store-type group according to the predominant type of commodity sold. The store-type figures therefore do not cover only sales of goods normally associated with the type of store listed, as there are many wholesale stores which handle a wide variety of commodities.
This survey was revised in March 1977. The revised survey includes wholesalers with sales turnover in excess of $100,000 at the 1973 Census of Distribution and covers approximately 89 percent of all wholesale turnover and 87 percent of wholesale stocks at that census.
Several wholesale store-types which were included in 1973 Census of Distribution for the first time have been introduced into the quarterly survey. The major additions are timber merchants, timber products, cement and concrete stores, indent agents, exporters, manufacturers' agents, and wool, hide, and skin dealers. They have each been allocated to an appropriate survey store-type group. The revised survey also features the addition and deletion of a number of stores which were reclassified at the 1973 Census to and from wholesale, respectively, owing to changes of the proportion of wholesale trade between the 1968 and 1973 Censuses of Distribution. In addition some existing wholesale stores have moved between survey store types.
The following table shows wholesale turnover by store-type group during each quarter of the 2 latest years and wholesale stocks as at the end of each quarter of the 2 years.
| Period | Food and Drink | Apparel | Furniture | Automotive | Hardware | Chemicals |
|---|---|---|---|---|---|---|
| Quarter ended— | $(million) | |||||
| 1982— | Sales or Turnover | |||||
| 31 Mar | 611.4 | 153.8 | 70.8 | 322.2 | 292.7 | 158.7 |
| 30 Jun | 730.3x | 159.2 | 84.9 | 362.0 | 314.3 | 184.2 |
| 30 Sep | 687.7 | 173.3 | 85.5 | 345.6 | 326.3x | 180.0 |
| 31 Dec | 775.2 | 151.9 | 73.3 | 286.2 | 299.2 | 184.7 |
| 1983— | ||||||
| 31 Mar | 636.7 | 152.8 | 65.0 | 310.7 | 266.0 | 157.7 |
| 30 Jun | 748.7 | 147.4 | 90.2 | 303.8 | 293.7 | 196.5 |
| 30 Sep | 741.4 | 178.6 | 88.2 | 309.1 | 321.2 | 201.5 |
| 31 Dec | 821.4 | 156.8 | 94.0 | 347.9 | 319.8 | 219.8 |
| 1984— | ||||||
| 31 Mar | 707.8 | 171.3 | 84.7 | 361.7 | 314.2 | 205.8 |
| As at— | ||||||
| 1982— | ||||||
| Value of Wholesalers' Stocks | ||||||
| 31 Mar | 234.1 | 119.0 | 73.7 | 212.6 | 223.3 | 138.0 |
| 30 Jun | 252.0 | 121.9 | 76.3 | 236.2 | 237.6 | 141.8 |
| 30 Sep | 244.2 | 121.0 | 80.8 | 280.3 | 245.9 | 157.0 |
| 31 Dec | 239.9 | 132.6 | 91.3 | 272.5 | 249.3 | 150.3 |
| 1983— | ||||||
| 31 Mar | 249.3 | 122.4 | 96.6 | 210.5 | 240.6 | 155.0 |
| 30 Jun | 246.8 | 117.7 | 82.4 | 202.4 | 232.0 | 134.7 |
| 30 Sep | 243.0 | 117.3 | 80.5 | 213.0 | 229.1 | 148.5 |
| 31 Dec | 241.1 | 119.1 | 84.5 | 192.6 | 228.5 | 146.8 |
| 1984— | ||||||
| 31 Mar | 273.1 | 126.3 | 87.2 | 216.7 | 237.6 | 145.5 |
| Period | General Merchants | Machinery | Electrical Supplies | Paper and Stationery | Miscellaneous | Total | |
|---|---|---|---|---|---|---|---|
| Actual | Seasonally Corrected | ||||||
| Quarter ended— | $(million) | ||||||
| 1982— | |||||||
| Sales or Turnover | |||||||
| 31 Mar | 156.9 | 132.2 | 50.6 | 67.8 | 395.0 | 2,412.0 | 2,538.0 |
| 30 Jun | 160.9 | 135.3 | 63.1 | 74.3 | 405.2 | 2,673.7 | 2,689.1 |
| 30 Sep | 174.5 | 144.2 | 64.4 | 79.4 | 384.2 | 2,645.1 | 2,625.4 |
| 31 Dec | 174.5 | 123.2 | 58.4 | 75.8 | 388.6 | 2,591.0 | 2,474.3 |
| 1983— | |||||||
| 31 Mar | 153.3 | 129.6 | 52.6 | 71.1 | 412.6 | 2,408.0 | 2,541.0 |
| 30 Jun | 162.6 | 124.7 | 62.8 | 72.4 | 425.3 | 2,628.1 | 2,635.1 |
| 30 Sep | 177.9 | 144.2 | 66.3 | 86.7 | 385.2 | 2,700.2 | 2,652.7 |
| 31 Dec | 177.1 | 135.1 | 62.6 | 86.6 | 443.1 | 2,864.3 | 2,738.0 |
| 1984— | |||||||
| 31 Mar | 170.7 | 151.3 | 63.8 | 89.3 | 501.5 | 2,822.1 | 3,007.0 |
| As at— | |||||||
| 1982— | |||||||
| Value of Wholesalers' Stocks | |||||||
| 31 Mar | 89.6 | 155.2 | 49.8x | 43.6 | 202.0 | 1,540.9 | |
| 30 Jun | 97.2 | 159.3 | 52.8 | 45.0x | 209.7 | 1,629.7 | |
| 30 Sep | 101.1 | 166.7 | 56.9 | 49.2 | 207.1x | 1,710.0 | |
| 31 Dec | 99.4 | 167.5 | 56.4 | 49.1 | 208.5 | 1,717.0 | |
| 1983— | |||||||
| 31 Mar | 98.2 | 158.7 | 55.5 | 43.5 | 211.7 | 1,641.9 | |
| 30 Jun | 96.4 | 153.2 | 54.7 | 42.1 | 202.9 | 1,565.3 | |
| 30 Sep | 99.6 | 152.1 | 53.4 | 40.5 | 206.0 | 1,583.0 | |
| 31 Dec | 92.8 | 154.9 | 51.8 | 40.7 | 203.8 | 1,556.6 | |
| 1984— | |||||||
| 31 Mar | 92.5 | 151.8 | 53.2 | 46.6 | 237.1 | 1,667.5 | |
INSTALMENT CREDIT TRADING—Instalment credit trading in New Zealand has been growing steadily in recent years in common with other developed countries. This growth generally is explained by common causes, including an increasing social acceptance and the development of borrowing facilities. There is an increasing tendency for consumer durables to be purchased on credit. Instalment credit allows high-priced goods to be acquired as opportunity or desire dictates, with less reference to the immediate cash position. Some people welcome the discipline of monthly credit repayments as a means of saving. Consumer credit is provided either by retailers or finance companies. A major activity of the finance companies is the financing of motor vehicles on hire-purchase; the Reserve Bank collects statistics in this field. A report by the Tariff and Development Board on instalment credit trading, published as parliamentary paper H.49, 1968, is a useful reference.
The Hire Purchase Act 1971 is the governing legislation in New Zealand.
Regulations to control hire-purchase trade have existed since 22 July 1955. Goods coming into the category “Other consumer goods” were exempted from hire-purchase restrictions from 29 October 1977, and, from 3 February 1978, new regulations covering hire-purchase sales of new cars were introduced. These allowed for a minimum deposit of 60 percent, with a maximum repayment period of 12 months. For used cars the repayment was extended once more to 18 months. With effect from 19 April 1978 hire-purchase sales and credit sales of colour television sets, together with the conditions applying to the hire of television sets, were no longer regulated. The maximum period of credit on new motor cycles was extended to 18 months, and on secondhand motor cycles to 24 months, while the minimum deposit for the latter was reduced to 33⅓ percent.
The quarterly survey of hire-purchase advances made by the Department of Statistics was revised for the June 1980 quarter and the revisions made retrospective to the June 1977 quarter to enable comparisons to be made. For the revised survey the list of businesses surveyed was updated to include large finance companies not previously covered and retail stores whose sales on hire purchase exceeded $0.5 million during the year ended March 1978.
Sales on hire purchase by businesses covered by the revised survey represented some 92 percent of total hire-purchase sales in 1977–78 as recorded in the 1978 Census of Distribution.
Only sales covered by the regulations governing hire purchase are included in the survey. Credit sales, charge accounts, laybys, and other forms of instalment or credit selling covered by the Census of Distribution are not included in the quarterly figures.
The following table shows the value of advances as recorded by the surveyed businesses.
| Quarter Ended | Motor Buses, Trucks, and Tractors | Cars, Motor Cycles, Caravans, etc. | Plant and Machinery | Household and Personal Goods, incl. TV Sets | Total Advance Under H.P. Agreements | Total Owing Under H.P. Agreements | Percentage of Payments Overdue | ||||
|---|---|---|---|---|---|---|---|---|---|---|---|
| Advances on H.P. | Advances as % of Cash Value | Advances on H.P. | Advances as % of Cash Value | Advances on H.P. | Advances as % of Cash Value | Advances on H.P. | Advances as % of Cash Value | ||||
| $(m) | $(m) | $(m) | $(m) | $(m) | $(m) | ||||||
| 1982— | |||||||||||
| Mar | 41.9 | 73 | 60.5x | 44 | 22.6 | 64 | 59.9 | 83 | 184.9x | 918.4x | 2.1 |
| Jun | 53.6 | 71 | 65.3x | 47 | 17.4 | 63 | 69.3 | 83 | 205.6x | 978.2x | 2.0 |
| Sep | 54.7 | 68 | 61.7x | 46 | 18.8 | 63 | 66.9 | 84 | 202.2x | 1,027.4x | 1.8 |
| Dec | 53.6 | 69 | 63.8x | 47 | 20.2 | 72 | 71.4 | 79 | 209.0x | 1,055.6x | 1.9 |
| 1983— | |||||||||||
| Mar | 47.0 | 69 | 61.8 | 47 | 17.1 | 74 | 58.7 | 83 | 184.5 | 1,073.0 | 2.3 |
| Jun | 55.4 | 69 | 60.6 | 45 | 17.7 | 73 | 61.2 | 80 | 194.8 | 1,080.9 | 2.2 |
| Sep | 57.4 | 72 | 80.6 | 53 | 16.9 | 77 | 68.9 | 84 | 223.8 | 1,099.4 | 2.3 |
| Dec | 58.0 | 72 | 154.3 | 59 | 28.0 | 79 | 71.4 | 78 | 311.7 | 1,229.2 | 1.9 |
| 1984— | |||||||||||
| Mar | 46.5 | 67 | 134.4 | 61 | 30.0 | 71 | 70.8 | 84 | 281.7 | 1,340.7 | 1.9 |
CREDIT CARD SALES—A form of short-term credit trading which has grown rapidly during the past 3 years is the use of credit cards as a substitute for cash. This has largely been the result of the introduction of bank credit cards by the 4 trading banks. On 1 July 1983 bank credit became available at Post Office Savings Banks. The following table gives the value of sales by trading bank cards, Trustee bank Visa, American Express and Diners Club.
| Year | Total Advances Outstanding* | Billings | ||
|---|---|---|---|---|
| N.Z. Cardholders Spending in New Zealand | N.Z. Cardholders Spending Overseas | Total | ||
| * As at December. | ||||
| $(million) | ||||
| 1981 | 153.3 | 428.7 | 135.3 | 564.2 |
| 1982 | 230.4 | 608.0x | 157.1 | 766.0x |
| 1983 | 316.9 | 850.2 | 181.1 | 1,031.3 |
| Source: Reserve Bank Bulletin. | ||||
CONTROLS ON COMMERCIAL PRACTICES—The Commerce Act 1975 is concerned with the effective development of industry and commerce through the encouragement of competition and to prevent anomalies arising from monopolies, mergers, takeovers and trade practices. The Commerce Amendment Act 1983 came into force on 1 April 1984, and has as its main objects changes in the operation of the Commerce Commission from a basically judicial approach to a more administrative one, and greater involvement of the commission in vetting merger and takeover proposals. The emphasis is on greater informality and expedition.
Trade Practices—Part II of the Commerce Act is designed to secure competition through the prevention of restrictive trade practices. Some of these practices, for example, collective tendering, are prohibited. Collective pricing agreements and individual resale price maintenance arrangements require prior approval of the Commerce Commission in terms of defined public interest criteria. Specific product distribution and market allocation practices do not require prior approval but can be subject to order if the commission feels it is contrary to the public interest.
Monopolies—Monopolies and oligopolies are subject to investigation in accordance with public interest criteria.
Mergers and Takeovers—Certain classes of mergers and takeovers, involving total assets exceeding $20 million or certain defined industries, must be notified to the Commerce Commission for prior approval.
The first economic Census of Services formed part of the series of integrated economic censuses of business activities in New Zealand being carried out by the Department of Statistics over a five-year period. The census covers the following activities of the New Zealand Standard Industrial Classification for the year ended 31 March 1981:
Real Estate and Business Services.
Sanitary and Similar Services.
Social and Related Services.
Recreational and Cultural Services.
| Census Coverage | No. | |
|---|---|---|
| Establishments and ancillary units | 20,110 | |
| Paid employees, and working proprietors/partners | 237,572 | |
| Census Values in Accounting Terms— | ||
| Expenditure— | $(000) | |
| Purchases, including fuel and power | 500,890 | |
| Levies and duty | 49,147 | |
| Employer contributions | 46,769 | |
| Salaries and wages | 2,310,933 | |
| Depreciation | 73,081 | |
| Indirect taxes | 13,095 | |
| Insurances | 17,234 | |
| Interest, etc. | 103,574 | |
| Other expenses | 721,897 | |
| Total expenditure | 3,836,621 | |
| Stocks— | $(000) | |
| Closing stocks | 72,943 | |
| Less opening stocks | 60,964 | |
| 11,979 | ||
| Income— | ||
| Interest, etc. | 50,189 | |
| Subsidies | 13,303 | |
| Rents, etc. | 12,876 | |
| Other | 4,194,957 | |
| Total income | 4,283,303 | |
| Net Profit— | ||
| Total income adjusted for stocks | 4,283,303 | |
| Less total expenditure | 3,836,621 | |
| 446,682 | ||
| Less salaries of working proprietors or partners | 136,438 | |
| Net profit | 310,244 | |
| Census Values in Economic Terms— | ||
| Operating surplus— | ||
| Total income, adjusted for change in stocks | 4,283,303 | |
| Less interest, etc., received | 50,189 | 4,233,115 |
| Total expenditure | 3,836,621 | |
| Less interest, etc., paid | 103,574 | |
| 3,733,047 | ||
| Operating surplus | 500,068 | |
| Value added— | ||
| Operating surplus | 500,068 | |
| Levies and duty | 49,147 | |
| Salaries and wages | 2,310,933 | |
| Employer contributions | 46,769 | |
| Depreciation | 73,081 | |
| Indirect taxes | 13,095 | |
| 2,993,093 | ||
| Plus capitalised salaries and wages | 1,279 | 2,994,372 |
| Less subsidies | 13,303 | |
| Value added | 2,981,069 | |
In the following 2 tables statistics are given at industry level for activities covered in the census.
| Service | Enterprise Groups | Enterprises | Operating Units | Persons Engaged at End of February | Salaries and Wages Paid to Employees | |
|---|---|---|---|---|---|---|
| Establishments | Ancillary Units | |||||
| Real Estate and Business Services— | Number | $(000) | ||||
| Land and estate agents | 709 | 765 | 1,081 | 5 | 4,536 | 48,368 |
| Real estate valuing and appraising | 87 | 87 | 93 | – | 305 | 1,089 |
| Total real estate | 796 | 852 | 1,174 | 5 | 4,841 | 49,456 |
| Legal services | 900 | 902 | 1,030 | – | 9,647 | 61,320 |
| Accounting, auditing, and bookkeeping services | 1,167 | 1,223 | 1,305 | 1 | 9,992 | 65,407 |
| Data processing and tabulating services | 139 | 149 | 193 | – | 3,458 | 38,652 |
| Architects | 332 | 333 | 358 | – | 1,408 | 8,967 |
| Consulting engineers | 207 | 208 | 281 | 2 | 2,134 | 21,707 |
| Land surveyors | 132 | 132 | 167 | – | 1,530 | 15,791 |
| Quantity surveyors | 47 | 47 | 66 | – | 384 | 2,850 |
| Town planning consultant services | 11 | 11 | 13 | – | 39 | 148 |
| Engineering, architectural, and technical services, n.e.c. | 215 | 218 | 268 | 3 | 1,386 | 13,836 |
| Total engineering, architectural, and technical services | 938 | 947 | 1,153 | 5 | 6,881 | 63,299 |
| Advertising agencies | 99 | 102 | 134 | 1 | 1,531 | 18,633 |
| Commercial artists and display specialists | 217 | 217 | 220 | 1 | 678 | 3,542 |
| Market research agencies | 23 | 25 | 29 | 2 | 535 | 2,567 |
| Public relations consultant services | 53 | 54 | 54 | – | 183 | 1,198 |
| Advertising services, n.e.c. | 76 | 77 | 88 | – | 342 | 2,004 |
| Total advertising services | 465 | 474 | 525 | 4 | 3,269 | 27,943 |
| Security services | 47 | 48 | 75 | – | 1,469 | 13,177 |
| Debt collecting and credit rating services | 29 | 33 | 58 | – | 469 | 3,450 |
| Typing, duplicating, and other office services | 89 | 89 | 96 | – | 215 | 789 |
| Contract packing services | 21 | 21 | 23 | – | 284 | 2,652 |
| Mailing and delivery services | 12 | 12 | 12 | – | 186 | 436 |
| Management consultant services | 90 | 95 | 107 | – | 390 | 2,832 |
| Business services, n.e.c. | 365 | 373 | 435 | 4 | 2,825 | 18,971 |
| Total business services, n.e.c. (except rental and leasing) | 644 | 671 | 806 | 4 | 5,838 | 42,308 |
| Total business services | 4,230 | 4,365 | 5,012 | 14 | 39,085 | 298,928 |
| Machinery and equipment rental and leasing | 180 | 182 | 227 | 6 | 1,164 | 9,381 |
| Total, real estate and business services | 5,196 | 5,395 | 6,413 | 25 | 45,090 | 357,765 |
| Sanitary Services— | ||||||
| Collection and disposal of refuse | 331 | 332 | 338 | 1 | 1,227 | 9,499 |
| Sewerage and urban drainage | 251 | 251 | 256 | 3 | 1,451 | 14,633 |
| Total sanitary and garbage disposal services | 387 | 388 | 594 | 4 | 2,678 | 24,132 |
| Cleaning services | 701 | 710 | 791 | 15 | 13,023 | 49,289 |
| Fumigation and pest control services | 29 | 29 | 29 | – | 89 | 372 |
| Total sanitary and similar services | 1,115 | 1,127 | 1,414 | 19 | 15,790 | 73,793 |
| Social and Related Community Services— | ||||||
| Pre-school education | 169 | 276 | 1,478 | 54 | 2,815 | 16,116 |
| Primary education | 269 | 269 | 2,513 | 1 | 31,512 | 373,920 |
| Secondary education | 265 | 265 | 361 | – | 20,659 | 319,563 |
| Tertiary education | 34 | 34 | 44 | 1 | 15,891 | 197,433 |
| Other education services | 461 | 524 | 608 | 2 | 2,627 | 19,929 |
| Ancillary units servicing education | 7 | 7 | – | 8 | 47 | 714 |
| Total education services | 1,185 | 1,332 | 5,004 | 66 | 73,551 | 927,675 |
| General practitioners | 1,687 | 1,687 | 1,708 | – | 5,343 | 22,425 |
| Private medical specialists | 522 | 522 | 523 | – | 1,282 | 4,142 |
| Private dental practices | 765 | 768 | 789 | – | 2,599 | 11,908 |
| Optometrists and dispensing opticians | 156 | 158 | 182 | – | 596 | 3,188 |
| Physiotherapists | 133 | 133 | 143 | 1 | 355 | 1,277 |
| Chiropractors | 77 | 77 | 80 | – | 209 | 612 |
| Public and private hospitals | 143 | 152 | 356 | 22 | 63,610 | 700,239 |
| Other health services | 159 | 295 | 403 | 14 | 4,717 | 43,619 |
| Medical, dental, and other health services | 3,635 | 3,786 | 4,184 | 37 | 78,711 | 787,409 |
| Medical laboratories | 18 | 18 | 64 | 62 | 1,144 | 10,075 |
| Dental laboratories | 133 | 133 | 136 | 1 | 328 | 1,252 |
| Radiologists in private practice | 29 | 29 | 37 | – | 263 | 1,848 |
| Medical and dental laboratories and radiologists | 180 | 180 | 237 | 63 | 1,735 | 13,175 |
| Private veterinary practices | 181 | 182 | 219 | 3 | 936 | 4,971 |
| Other veterinary practices, incl. clubs | 44 | 44 | 75 | – | 357 | 5,099 |
| Boarding kennels and catteries, etc. | 71 | 71 | 71 | – | 140 | 90 |
| Veterinary services, boarding kennels, and catteries, etc. | 296 | 297 | 365 | 3 | 1,433 | 10,160 |
| Ancillary units servicing medical, dental, other health, and veterinary services | 10 | 10 | 18 | 1,373 | 17,041 | |
| Total medical, dental, other health and vet. services | 4,111 | 4,263 | 4,786 | 121 | 83,252 | 827,786 |
| Licensed Old People's Rest Homes | 318 | 324 | 392 | 17 | 5,536 | 26,012 |
| Total social and related community services | 5,597 | 5,907 | 10,182 | 204 | 162,339 | 1,781,473 |
| Recreational and Cultural Services— | ||||||
| Motion picture production | 47 | 49 | 50 | 1 | 373 | 3,825 |
| Motion picture distribution and projection | 81 | 86 | 181 | 70 | 1,766 | 9,426 |
| Radio and television broadcasting | 13 | 13 | 45 | 10 | 4,297 | 66,756 |
| Total motion picture and other entertainment services | 139 | 147 | 276 | 81 | 6,436 | 80,008 |
| Racing and trotting clubs | 156 | 156 | 157 | – | 3,507 | 5,743 |
| Self-employed jockeys, horse trainers and TAB | 990 | 990 | 1,339 | – | 4,410 | 13,430 |
| Total amusement and recreational services, n.e.c. | 1,146 | 1,146 | 1,496 | – | 7,917 | 19,173 |
| Total recreational and cultural services | 1,285 | 1,293 | 1,772 | 81 | 14,353 | 99,181 |
| Total services | 13,179 | 13,717 | 19,781 | 329 | 237,572 | 2,312,212 |
| Service | Purchases and Operating Expenses | Total Sales and other Income | Value Added | Net Capital Additions |
|---|---|---|---|---|
| Real Estate and Business Services— | $(000) | |||
| Land and estate agents | 76,208 | 100,268 | 74,676 | 4,131 |
| Real estate valuing and appraising | 2,891 | 6,270 | 4,737 | 225 |
| Total real estate | 79,099 | 106,538 | 79,412 | 4,356 |
| Legal services | 120,076 | 207,931 | 156,315 | 3,901 |
| Accounting, auditing, and bookkeeping services | 117,770 | 190,388 | 145,781 | 3,021 |
| Data processing and tabulating services | 102,930 | 113,900 | 65,361 | 26,468 |
| Architects | 23,264 | 35,924 | 22,775 | 382 |
| Consulting engineers | 43,680 | 58,388 | 38,334 | 1,121 |
| Land surveyors | 22,796 | 26,392 | 20,299 | 1,200 |
| Quantity surveyors | 5,584 | 9,549 | 7,050 | 110 |
| Town planning consultant services | 508 | 790 | 467 | 33 |
| Engineering, architectural, and technical services, n.e.c. | 27,634 | 32,984 | 20,360 | 820 |
| Total engineering, architectural, and technical services | 123,466 | 164,027 | 109,286 | 3,666 |
| Advertising agencies | 159,746 | 168,448 | 29,974 | 1,559 |
| Commercial artists and display specialists | 12,081 | 15,845 | 7,970 | 601 |
| Market research agencies | 6,467 | 7,091 | 3,414 | 199 |
| Public relations consultant services | 3,004 | 3,769 | 2,097 | 105 |
| Advertising services, n.e.c. | 7,107 | 8,076 | 3,452 | 200 |
| Total advertising services | 188,404 | 203,230 | 46,907 | 2,665 |
| Security services | 22,360 | 23,958 | 16,030 | 1,095 |
| Debt collecting and credit rating services | 10,992 | 11,218 | 4,016 | 168 |
| Typing, duplicating, and other office services | 2,248 | 2,698 | 1,447 | 121 |
| Contract packing services | 12,590 | 13,120 | 4,115 | 822 |
| Mailing and delivery services | 1,944 | 2,167 | 720 | 25 |
| Management consultant services | 7,602 | 10,009 | 5,390 | 275 |
| Business services, n.e.c. | 44,644 | 51,733 | 28,562 | 1,564 |
| Total business services, n.e.c. (except rental and leasing) | 102,380 | 114,904 | 60,280 | 4,070 |
| Total business services | 755,026 | 994,379 | 583,930 | 43,790 |
| Machinery and equipment rental and leasing | 56,605 | 63,159 | 21,571 | 5,514 |
| Total real estate and business services | 890,730 | 1,164,076 | 684,913 | 53,660 |
| Sanitary Services— | ||||
| Collection and disposal of refuse | 42,675 | 45,334 | 15,684 | 1,691 |
| Sewerage and urban drainage | 58,964 | 59,487 | 34,081 | 3,091 |
| Total sanitary and garbage disposal services | 101,640 | 104,821 | 49,766 | 4,782 |
| Cleaning services | 66,624 | 75,223 | 60,100 | 1,606 |
| Fumigation and pest control services | 1,566 | 2,107 | 1,064 | 79 |
| Total sanitary and similar services | 169,830 | 182,150 | 110,930 | 6,467 |
| Social and Related Community Services*— | ||||
| Pre-school education | 21,358 | 21,811 | 14,438 | 1,061 |
| Primary education | 427,582 | 431,263 | 382,063 | 43,435 |
| Secondary education | 368,532 | 372,637 | 328,359 | 42,367 |
| Tertiary education | 258,004 | 259,904 | 195,631 | 21,080 |
| Other education services | 30,425 | 31,960 | 20,605 | 1,424 |
| Ancillary units servicing education | 1,430 | 1,173 | 696 | 10 |
| Total education services | 1,107,331 | 1,118,748 | 941,792 | 109,377 |
| Social and Related Community Services— | ||||
| General practitioners | 53,604 | 104,651 | 75,912 | 2,756 |
| Private medical specialists | 13,740 | 28,508 | 19,334 | 736 |
| Private dental practices | 33,445 | 57,209 | 37,599 | 586 |
| Optometrists and dispensing opticians | 17,042 | 23,920 | 11,032 | 575 |
| Physiotherapists | 3,171 | 5,848 | 4,288 | 96 |
| Chiropractors | 2,126 | 3,860 | 2,512 | 82 |
| Public and private hospitals | 946,852 | 931,634 | 760,502 | 89,076 |
| Other health services | 58,062 | 59,613 | 46,861 | 1,869 |
| Medical, dental, and other health services | 1,128,043 | 1,215,244 | 958,039 | 95,777 |
| Medical laboratories | 18,012 | 23,267 | 15,909 | 201 |
| Dental laboratories | 3,734 | 6,467 | 4,220 | 153 |
| Radiologists in private practice | 4,063 | 6,678 | 4,623 | 164 |
| Medical and dental laboratories and radiologists | 25,809 | 36,412 | 24,752 | 518 |
| Private veterinary practices | 23,301 | 30,794 | 13,687 | 1,129 |
| Other veterinary practices, including clubs | 19,790 | 20,465 | 6,776 | 117 |
| Boarding kennels and catteries, etc. | 1,074 | 1,320 | 537 | 96 |
| Veterinary services, boarding kennels and catteries, etc. | 44,165 | 52,580 | 21,000 | 1,342 |
| Ancillary units servicing medical, dental, other health and veterinary services | 65,783 | 64,749 | 18,911 | 2,112 |
| Total medical, dental, other health and veterinary services | 1,263,800 | 1,368,984 | 1,022,703 | 99,749 |
| Licensed Old People's Rest Homes | 47,223 | 51,318 | 32,158 | 9,310 |
| Total social and related community services | 2,418,354 | 2,539,049 | 1,996,653 | 218,437 |
| Recreational and Cultural Services— | ||||
| Motion picture production | 14,213 | 15,559 | 6,282 | 1,224 |
| Motion picture distribution and projection | 41,052 | 46,601 | 17,907 | 116 |
| Radio and television broadcasting | 149,119 | 145,957 | 83,269 | 8,187 |
| Total motion picture and other entertainment services | 204,384 | 208,117 | 107,458 | 9,527 |
| Racing and trotting clubs | 75,392 | 76,419 | 33,154 | 2,232 |
| Self-employed jockeys, horse trainers, and TAB | 77,932 | 101,513 | 47,962 | 2,055 |
| Total amusement and recreational services, n.e.c. | 153,324 | 177,933 | 81,116 | 4,286 |
| Total recreational and cultural services | 357,708 | 386,049 | 188,574 | 13,814 |
| Total services | 3,836,621 | 4,271,325 | 2,981,069 | 292,377 |
The two following tables show regional summaries of the census by statistical areas.
| Services | Enterprise Groups | Enterprises | Operating Units | Persons Engaged at End of February | Salaries and Wages Paid to Employees | Purchases and Operating Expenses | Sales and Other Income | Value Added | Net Capital Additions | |
|---|---|---|---|---|---|---|---|---|---|---|
| Establishments | Ancillary Units | |||||||||
| * For further information on health, education, and recreational and cultural services refer to Sections 5, 7A, and 8 of this Yearbook. | ||||||||||
| Real Estate and Business Services— | Number | $(000) | ||||||||
| Northland | 152 | 155 | 174 | 1 | 953 | 6,474 | 12,367 | 18,651 | 13,965 | 337 |
| Central Auckland | 1,871 | 1,928 | 2,159 | 12 | 15,311 | 128,415 | 356,965 | 443,093 | 234,945 | 16,605 |
| South Auckland–Bay of Plenty | 739 | 750 | 854 | 3 | 5,341 | 39,222 | 88,449 | 125,609 | 80,008 | 4,443 |
| East Coast | 45 | 45 | 46 | – | 462 | 3,720 | 6,151 | 8,832 | 7,190 | 304 |
| Hawke's Bay | 189 | 195 | 215 | – | 1,759 | 12,243 | 24,185 | 35,349 | 25,012 | 863 |
| Taranaki | 133 | 134 | 147 | – | 994 | 7,421 | 13,621 | 20,943 | 15,341 | 1,309 |
| Wellington | 1,187 | 1,220 | 1,375 | 6 | 10,820 | 94,666 | 242,565 | 305,717 | 175,229 | 23,594 |
| Total, North Island | 4,060 | 4,201 | 4,970 | 22 | 35,640 | 292,162 | 744,303 | 958,195 | 551,689 | 47,456 |
| Marlborough | 46 | 46 | 51 | – | 281 | 1,980 | 3,476 | 5,378 | 4,026 | 34 |
| Nelson | 108 | 112 | 123 | – | 689 | 4,754 | 8,923 | 12,932 | 9,551 | 679 |
| Westland | 34 | 34 | 36 | – | 170 | 1,180 | 2,246 | 3,049 | 2,249 | 71 |
| Canterbury | 709 | 729 | 776 | 3 | 5,319 | 35,718 | 85,421 | 117,853 | 72,343 | 3,523 |
| Otago | 262 | 267 | 313 | – | 1,870 | 13,831 | 30,159 | 43,032 | 28,149 | 953 |
| Southland | 126 | 129 | 144 | – | 1,121 | 8,140 | 16,201 | 23,637 | 16,904 | 945 |
| Total, South Island | 1,215 | 1,261 | 1,443 | 3 | 9,450 | 65,603 | 146,426 | 205,881 | 133,224 | 6,205 |
| Total, New Zealand | 5 196 | 5 395 | 6 413 | 25 | 45 090 | 357,765 | 890,730 | 1,164,076 | 684,913 | 53,660 |
| Sanitary and Similar Services— | ||||||||||
| Northland | 33 | 33 | 48 | 1 | 476 | 3,193 | 6,017 | 6,543 | 4,197 | 274 |
| Central Auckland | 272 | 278 | 319 | 4 | 3,385 | 18,264 | 56,302 | 59,260 | 32,179 | 1,016 |
| South Auckland Bay of Plenty | 162 | 163 | 208 | 3 | 1,882 | 9,151 | 22,924 | 24,875 | 15,111 | 443 |
| East Coast | 15 | 15 | 19 | – | 89 | 346 | 913 | 1,100 | 651 | 20 |
| Hawke's Bay | 58 | 58 | 68 | 1 | 521 | 2,586 | 7,108 | 7,827 | 5,069 | 227 |
| Taranaki | 36 | 37 | 49 | – | 475 | 2,152 | 3,954 | 4,493 | 2,837 | 58 |
| Wellington | 230 | 235 | 279 | 6 | 4,102 | 17,287 | 33,614 | 36,521 | 23,152 | 640 |
| Total, North Island | 790 | 800 | 990 | 15 | 10,930 | 52,979 | 130,832 | 140,619 | 83,197 | 2,679 |
| Marlborough | 18 | 18 | 22 | – | 216 | 931 | 1,580 | 1,818 | 1,149 | 66 |
| Nelson | 30 | 30 | 39 | – | 208 | 1,233 | 2,691 | 2,780 | 1,804 | 11 |
| Westland | 11 | 11 | 15 | – | – | 146 | 958 | 1,345 | 1,398 | 1,168 |
| Canterbury | 178 | 180 | 209 | 3 | 2,680 | 10,018 | 17,838 | 18,813 | 12,628 | 713 |
| Otago | 65 | 67 | 91 | 1 | 916 | 4,220 | 10,108 | 10,589 | 6,697 | 2,944 |
| Southland | 39 | 39 | 48 | – | 694 | 3,455 | 5,436 | 6,133 | 4,287 | 53 |
| Total, South Island | 328 | 332 | 424 | 4 | 4,860 | 20,814 | 38,998 | 41,531 | 27,733 | 3,787 |
| Total, New Zealand | 1 115 | 1 127 | 1 414 | 19 | 15 790 | 73,793 | 169,830 | 182,150 | 110,930 | 6,467 |
| Social and Related Community Services*— | ||||||||||
| Northland | 182 | 190 | 417 | 5 | 4,116 | 47,813 | 65,921 | 69,334 | 53,735 | 6,369 |
| Central Auckland | 1,657 | 1,700 | 2,493 | 64 | 40,326 | 461,605 | 623,248 | 661,183 | 521,077 | 51,464 |
| South Auckland-Bay of Plenty | 791 | 834 | 1,555 | 30 | 22,477 | 256,071 | 346,392 | 365,024 | 289,682 | 29,057 |
| East Coast | 89 | 90 | 184 | 2 | 2,154 | 23,951 | 31,453 | 32,871 | 26,678 | 984 |
| Hawke's Bay | 259 | 272 | 488 | 9 | 6,568 | 72,719 | 96,709 | 101,887 | 81,171 | 5,711 |
| Taranaki | 210 | 219 | 396 | 3 | 5,336 | 52,123 | 67,106 | 70,578 | 57,139 | 6,094 |
| Wellington | 1,074 | 1,130 | 1,838 | 37 | 33,822 | 363,558 | 500,602 | 519,922 | 405,618 | 57,876 |
| Total, North Island | 4,167 | 4,376 | 7,371 | 150 | 114,799 | 1,277,840 | 1,731,430 | 1,820,799 | 1,435,101 | 157,554 |
| Marlborough | 59 | 62 | 114 | 2 | 1,457 | 17,178 | 22,175 | 22,906 | 18,865 | 1,071 |
| Nelson | 144 | 151 | 257 | 5 | 4,361 | 46,537 | 59,492 | 62,022 | 51,175 | 3,642 |
| Westland | 38 | 39 | 98 | 1 | 1,446 | 14,612 | 19,855 | 20,054 | 15,689 | 2,508 |
| Canterbury | 807 | 838 | 1,366 | 21 | 23,399 | 245,166 | 338,069 | 354,039 | 272,098 | 27,328 |
| Otago | 336 | 354 | 633 | 19 | 11,851 | 133,242 | 182,318 | 190,861 | 151,953 | 21,796 |
| Southland | 148 | 153 | 343 | 6 | 5,026 | 46,898 | 65,016 | 68,368 | 51,773 | 4,537 |
| Total, South Island | 1,461 | 1,553 | 2,811 | 54 | 47,540 | 503,632 | 686,924 | 718,251 | 561,552 | 60,882 |
| Total, New Zealand | 5 597 | 5 907 | 10 182 | 204 | 162 339 | 1,781,473 | 2,418,354 | 2,539,049 | 1,996,653 | 218,437 |
| Recreational and Cultural Services— | ||||||||||
| Northland | 21 | 21 | 35 | 1 | 213 | 974 | 5,164 | 6,086 | 2,892 | 54 |
| Central Auckland | 266 | 268 | 361 | 16 | 3,583 | 29,819 | 99,963 | 114,662 | 51,277 | 4,250 |
| South Auckland-Bay of Plenty | 255 | 256 | 319 | 7 | 1,965 | 9,175 | 38,128 | 45,453 | 22,303 | 1,738 |
| East Coast | 10 | 10 | 14 | 2 | 158 | 806 | 4,291 | 5,052 | 2,315 | 74 |
| Hawke's Bay | 54 | 54 | 73 | 5 | 644 | 2,180 | 11,441 | 13,428 | 6,372 | 247 |
| Taranaki | 50 | 50 | 67 | 2 | 687 | 1,482 | 7,177 | 8,570 | 3,979 | 132 |
| Wellington | 199 | 204 | 291 | 20 | 3,582 | 36,176 | 115,455 | 108,140 | 59,496 | 5,200 |
| Total, North Island | 827 | 835 | 1,160 | 53 | 10,832 | 80,612 | 281,618 | 301,391 | 148,633 | 11,695 |
| Marlborough | 12 | 12 | 14 | 1 | 46 | 220 | 1,197 | 1,566 | 608 | 41 |
| Nelson | 28 | 28 | 38 | 3 | 252 | 970 | 4,573 | 5,422 | 2,811 | 55 |
| Westland | 11 | 11 | 15 | 1 | 162 | 617 | 3,942 | 4,449 | 2,015 | 233 |
| Canterbury | 262 | 262 | 323 | 13 | 1,717 | 9,564 | 38,575 | 43,110 | 20,147 | 1,014 |
| Otago | 77 | 77 | 109 | 6 | 835 | 5,692 | 19,516 | 20,333 | 10,206 | 575 |
| Southland | 93 | 93 | 113 | 4 | 509 | 1,505 | 8,287 | 9,778 | 4,155 | 200 |
| Total, South Island | 465 | 465 | 612 | 28 | 3,521 | 18,569 | 76,090 | 84,658 | 39,941 | 2,118 |
| Total, New Zealand | 1 285 | 1 293 | 1 772 | 81 | 14 353 | 99,181 | 357,708 | 386,049 | 188,574 | 13,814 |
| Total Services— | ||||||||||
| Northland | 388 | 399 | 674 | 8 | 5,758 | 58,454 | 89,467 | 100,614 | 74,789 | 7,034 |
| Central Auckland | 4,060 | 4,172 | 5,332 | 96 | 62,605 | 638,102 | 1,136,479 | 1,278,198 | 839,479 | 73,334 |
| South Auckland-Bay of Plenty | 1,944 | 2,003 | 2,936 | 43 | 31,665 | 313,619 | 495,892 | 560,961 | 407,103 | 35,681 |
| East Coast | 159 | 160 | 263 | 4 | 2,863 | 28,823 | 42,808 | 47,855 | 36,833 | 1,383 |
| Hawke's Bay | 560 | 579 | 844 | 15 | 9,492 | 89,729 | 139,443 | 158,491 | 117,625 | 7,048 |
| Taranaki | 429 | 440 | 659 | 5 | 7,492 | 63,177 | 91,858 | 104,584 | 79,296 | 7,594 |
| Wellington | 2,684 | 2,787 | 3,783 | 69 | 52,326 | 511,687 | 892,236 | 970,300 | 663,494 | 87,310 |
| Total. North Island | 9,833 | 10,209 | 14,491 | 240 | 172,201 | 1,703,593 | 2,888,183 | 3,221,003 | 2,218,619 | 219,385 |
| Marlborough | 134 | 138 | 201 | 3 | 2,000 | 20,309 | 28,427 | 31,669 | 24,647 | 1,212 |
| Nelson | 310 | 321 | 457 | 8 | 5,510 | 53,494 | 75,679 | 83,156 | 65,341 | 4,386 |
| Westland | 94 | 95 | 164 | 2 | 1,924 | 17,367 | 27,388 | 28,950 | 21,121 | 2,813 |
| Canterbury | 1,952 | 2,008 | 2,674 | 40 | 33,115 | 300,466 | 479,903 | 533,816 | 377,216 | 32,578 |
| Otago | 738 | 764 | 1,146 | 26 | 15,472 | 156,985 | 242,101 | 264,815 | 197,005 | 26,268 |
| Southland | 403 | 413 | 648 | 10 | 7,350 | 59,999 | 94,940 | 107,916 | 77,119 | 5,736 |
| Total, South Island | 3,463 | 3,608 | 5,290 | 89 | 65,371 | 608,619 | 948,438 | 1,050,321 | 762,450 | 72,992 |
| Total, New Zealand | 13 179 | 13 717 | 19 781 | 329 | 237 572 | 2,312,212 | 3,836,621 | 4,271,325 | 2,981,069 | 292,377 |
FURTHER INFORMATION—Further information on domestic trade will be found in the following publications.
Census of Distribution 1977–78—Department of Statistics (bulletins and volume).
Monthly Abstract of Statistics—Department of Statistics.
Report of the Department of Trade and Industry (Parl. Paper G. 14).
Additional information on the 1977–78 Census of Distribution is available from the Department of Statistics, Auckland.
New Zealand has always been heavily dependent on overseas trade for its development and progress. In the early days of colonisation the infant farming industry found a ready market in Australia for basic foodstuffs such as potatoes, grain, butter, and cheese. Timber and gold temporarily constituted a sizeable proportion of exports, but the most consistent export was wool, which made up 22 percent of the value of exports in 1853, when statistics were first compiled. In the 1870s it accounted for over half the value; from 1880 to 1898 its share was from 40 percent to 50 percent. From 1899 to 1964 wool consistently earned one-third of New Zealand's export receipts. Since then the proportion has declined, and in the year ended June 1983 wool made up only 13 percent of exports by value.
Real and lasting diversification of the exports of farm products was made possible by the introduction of refrigerated ships in 1882. This accentuated the development of New Zealand's economy as a complement to the British economy, to the benefit of both. The proportion of New Zealand's total exports going to Britain grew from 70 percent in 1860 to 77 percent in 1900, and reached 88 percent in 1940. At first, exports of frozen meat increased more rapidly than those of butter and cheese; the early emphasis was on frozen mutton and lamb, with beef and veal becoming more significant later. The great expansion of exports of dairy produce occurred after 1900, and was encouraged by the centralised factory production of butter. From 1913 until recent years, meat, dairy products, and wool accounted for over 60 percent of total exports of New Zealand goods.
New Zealand's heavy dependence on the British market continued into the post-Second World War era. From about the beginning of the 1960s the increasing emphasis on diversification away from this dependence has been reflected in the growth of beef exports to the United States, of cheese and forest products exports to Japan, and of lamb exports to the Middle East, the United States, and Canada; the establishment of a growing trade in meat and dairy produce with the developing countries of South-east Asia, the Middle East, and Latin America; the growth in exports to the USSR; the expansion of trade with Australia under NAFTA and with other South Pacific countries; and the export of an increasing range of manufactured goods to supplement agriculture as a source of export earnings.
Britain's entry into the European Community in 1973 gave added impetus to New Zealand's efforts to diversify its market for agricultural products. The enlarged Community, despite its restrictions on imports of agricultural products, remains New Zealand's largest single trading partner, accounting for 21 percent of New Zealand's exports and 19 percent of New Zealand's imports during the year ended June 1983.
New Zealand's principal exports to the Community are wool, lamb and butter. Special terms of access to the Community market have been negotiated for the latter two products. When the Community introduced a common marketing regime for sheepmeats in 1980, New Zealand entered into a voluntary restraint agreement whereby New Zealand has undertaken to limit exports of sheepmeat to the Community to 245 500 tonnes annually in return for a reduction in the EC import tariff. The special arrangement for butter dates from Britian's accession to the Community and represents its acknowledgment of New Zealand's dependence on access to the British market for substantial quantities of butter. The annual quantities which New Zealand was permitted to supply to the British market during 1981 (94 000 tonnes) and 1982 (92 000 tonnes) were agreed in April 1981. The quantity for 1983 (87 000 tonnes) was subsequently approved. A long-term arrangement is under negotiation for the post-1983 period.
Access into the North American market is vitally important. New Zealand's trade with the United States is circumscribed by various quantitative restrictions imposed on beef, mutton, veal, and dairy products. Beef and veal exports can be subject to quotas under the terms of the Meat Import Act of 1979, and during 1983 import restrictions were imposed under this law. Dairy Products (except casein) are subject to fixed quotas. Dairy products exported to Canada are also subject to quantitative restrictions and quotas may be applied to restrict beef imports.
New Zealand and Japan have continued to develop closer economic and trade relations, with Japan becoming New Zealand's third largest overall trading partner for the year ended June 1983. During this period overall bilateral trade has continued to increase in value by 21 percent. Close contact has been maintained with regular consultations between the two Governments at Ministerial and official level. Continued efforts have been made to improve access for New Zealand agricultural exports, particularly dairy products, beef, leather, selected fruits, squid, and radiata pine.
The newly-independent nations of the Pacific have attracted particular attention since the formation in 1971 of the South Pacific Forum. There is now much more awareness of the scope for closer trade relations with and between the islands. Australia and New Zealand concluded a trade and economic co-operation agreement with the Forum Island countries in 1980.
At the same time our diplomatic and trading links with China. Korea, and the ASEAN countries, have been extended and a significant volume of trade has developed.
Australia has been New Zealand's most important export market in recent years. Between 1966 and 1982 trade between the 2 countries was governed by the New Zealand - Australia Free Trade Agreement (NAFTA). This was replaced from 1 January 1983 by a more broadly based trading arrangement, establishing a closer economic relationship between the two countries that will ultimately result in the removal of all restrictions on trans-Tasman trade.
New Zealand's trade with the USSR has grown substantially in recent years. Our exports are dominated by dairy products, wool, sheepmeats and animal products, while imports from the USSR and other Eastern European Socialist countries include rail, marine and motor vehicles, a range of manufactured goods, and fertilisers.
Trade with Middle East countries has expanded despite the decrease in New Zealand exports to Iraq, and decreasing revenues of the oil exporting states. The main trade commodities are the traditional ones for each country—meat, dairy products and wool from New Zealand, and petroleum products from the Middle East. Iran remains particularly important as New Zealand's second market for lamb, and New Zealand's fifth biggest export market overall.
The pattern of New Zealand's export commodities is changing. Whereas, in the year ended June 1973 meat, dairy products, and wool earned 75 percent of New Zealand's export income (Reserve Bank figures) in the year ended June 1983 they earned 59 percent of the total export income. Over this 10-year period earnings from exports of manufactured goods, including forest products, rose from 13 percent to 27 percent of total export income.
The following table shows the changing pattern of external trade by countries of destination and origin. The percentages are based on value data, exports f.o.b. and imports c.d.v. (v.f.d. in 1980, 1982, and 1983).
| December Year | Britain | Australia | Japan | United States | Other Countries |
|---|---|---|---|---|---|
| Exports | |||||
| percent | |||||
| 1920 | 74 | 5 | 16 | 5 | |
| 1930 | 80 | 3 | 5 | 12 | |
| 1940 | 88 | 3 | 4 | 5 | |
| 1950 | 66 | 3 | 10 | 21 | |
| 1960 | 53 | 4 | 13 | 30 | |
| June | |||||
| Year | |||||
| 1970 | 36 | 8 | 10 | 16 | 30 |
| 1975 | 22 | 12 | 12 | 12 | 42 |
| 1980 | 14 | 12 | 13 | 14 | 47 |
| 1981 | 13 | 14 | 13 | 13 | 47 |
| 1982 | 14 | 15 | 13 | 14 | 44 |
| 1983 | 13 | 12 | 14 | 15 | 54 |
| December Year | Britain | Australia | Japan | United States | Other Countries |
| Imports | |||||
| percent | |||||
| 1920 | 48 | 17 | 18 | 17 | |
| 1930 | 47 | 8 | 18 | 27 | |
| 1940 | 47 | 16 | 12 | 25 | |
| 1950 | 60 | 12 | 7 | 21 | |
| 1960 | 43 | 18 | 10 | 29 | |
| June | |||||
| Year | |||||
| 1970 | 30 | 21 | 8 | 13 | 28 |
| 1975 | 19 | 20 | 14 | 13 | 34 |
| 1980 | 15 | 19 | 13 | 14 | 39 |
| 1981 | 11 | 19 | 15 | 18 | 37 |
| 1982 | 9 | 20 | 17 | 16 | 37x |
| 1983 | 9 | 20 | 17 | 17 | 37 |
TRADE RELATIONS: United Kingdom—The preceding table shows that while the United Kingdom has remained an important market for New Zealand's exports, it is no longer our predominant trading partner for either exports or imports. The British consumer for a long time enjoyed virtually unrestricted
availability of New Zealand butter, cheese, and lamb as a result of trading arrangements reflecting traditional economic, political, and cultural bonds between the people and governments of the two countries.
In return for providing an assured market for this New Zealand produce. Britain obtained an assured source of reasonably priced food in war and peace, valuable preferences in the sale of manufactured goods in the New Zealand market, and considerable earnings from the provision of shipping, insurance, and other services related to the two-way trade between the countries.
In recent years the United Kingdom's share of New Zealand's export trade has gradually declined. This decline was given impetus by New Zealand's increased efforts to diversify her export products and markets in view of British moves towards joining the European Community Thus in 1950 the United Kingdom took 66 percent of New Zealand's exports, but by the year ended June 1983 its share had fallen to 13 percent. However, the United Kingdom is still New Zealand's single largest market for butter and lamb exports, taking 53 percent and 39 percent respectively by volume in the 1982–83 season.
Entry into the EC, involving the assumption of obligations under the community's Common Agricultural Policy, required Britain to terminate the 1959 and 1966 trade agreements with New Zealand on 31 January 1973, and to begin to phase in the common customs tariff and other EC policies affecting the import of goods from those countries. New Zealand phased out by 1 July 1977 the tariff preferences previously given to imports from Britain, with the exception of certain automotive products.
North America—The United States was New Zealand's largest export market in the 1982–83 trade year, having taken exports worth $1,153 million. It is our major market for beef and veal, which in 1982–83 accounted for some 52 percent by value of total exports to the United States. However, this trade has been circumscribed since 1964 by the imposition of quantitative restrictions. A new Meat Import Act was passed in 1979 so that these import controls now include a countercyclical formula under which the level of beef imports increases when United States domestic production is low and vice versa. In 1983, New Zealand was obliged to conclude an informal “Voluntary Restraint Agreement” with the United States, under which New Zealand beef, veal, mutton and goat exports to the United States in 1983 were restricted to 364.5 million pounds. New Zealand entered into this agreement (as did Australia and Canada, the other major suppliers, which came to separate agreements with the United States) in order that total United States imports of these meats would not trigger the imposition of more severe restraints in the form of quotas under the United States Meat Import Act of 1979. Other main exports to the United States are lamb, wool, casein (the United States is our largest market for casein), fish, hides and skins and a growing range of manufactured items. Since the 1950s, an array of import quota controls has been applied to dairy products, especially butter, cheese, and milk powder. These controls have severely limited New Zealand's ability to expand its sales of dairy products to the United States, although with the loss of the traditional British market it is now New Zealand's largest cheese market in value and volume terms.
Canada is New Zealand's eighth largest export market, having taken exports of $162 million in 1982–83. Beef and veal are again our main exports to Canada, followed by lamb and mutton, wool, sausage casings, apparel and clothing manufactures, cheese and casein. The Canadian Meat Import Act of 1981 permits the Canadian Government to restrict beef imports although no restrictions have been imposed since the Act came into force.
A Trade and Economic Agreement between Canada and New Zealand provides a framework for bilateral trade. The agreement provides for preferential duty rates and compensation should tariff rates be increased or quantitative restrictions intensified.
South Pacific—In 1971 New Zealand and Australia with the Cooks Islands, Fiji, Nauru, Tonga, and Western Samoa formed the South Pacific Forum. Since then Papua New Guinea, Kiribati, Niue, Solomon Islands, Tuvalu, and Vanuatu have become full members. The forum has initiated a regional shipping line, and studies into market expansion for island products. The signing of the South Pacific Regional Trade and Economic Co-operation Agreement (SPARTECA) by the Forum Island countries, which came into force on 1 January 1981, marked a major step towards economic development of the region. This Agreement provides that Australia and New Zealand grant non-reciprocal duty-free and unrestricted access for most of the products exported by Forum Island countries. It also recognises that the full potential of the access provisions can be achieved only through closer economic co-operation and development assistance aimed at enhancing the export capabilities of the island countries. New Zealand officials have visited most of the islands to publicise the benefits of the Agreement, and to discuss with individual businessmen opportunities for the export of their products to the New Zealand market.
Japan—Exports to Japan have increased from $25.5 million in 1963 to $1,060 million in the year ended June 1983. Major exports are aluminium (24.4 percent), dairy products (18.4 percent), wool (10.5 percent), forestry products (13.4 percent), meat (8.1 percent), fish (8.1 percent), fruit and vegetables (5.8 percent), ironsands (3.2 percent), and hides and skins (2.8 percent). Japanese imports of beef, butter, skim milk powder, processed cheese, semi-processed leather, and some fish, fruit and vegetables are subject to global import quotas.
ASEAN Countries—The member countries of the Association of South East Asian Nations (Indonesia, Malaysia, the Philippines, Singapore, Thailand, and since 1 January 1984, Brunei) are an increasingly important market to New Zealand for agricultural, forestry, and manufactured exports. New Zealand's exports to the ASEAN group have increased substantially over the last six years to reach NZ$456.5 million f.o.b. (or 5.9 percent of total exports) in the latest trade year 1982–83. New Zealand's trade relations with ASEAN are governed by the ASEAN/New Zealand Joint Trade Study Group (established in 1976) which meets periodically to review trade developments. New Zealand also continues to place a strong emphasis on bilateral relations with each individual country and now has a Trade Agreement with each ASEAN member (except Singapore and Brunei, with which New Zealand has a Scientific, Industrial and Technological Agreement).
China—Trade between New Zealand and China has expanded substantially since the normalisation of relations between the two countries in 1972. New Zealand exports to China increased from $1.7 million in 1971–72 to $173.7 million in 1982–83 (or 2.2 percent of total exports). In recent years China has become a major market for wool and in 1982–83 was the single largest buyer with record sales of $116.5 million (over 31 000 tonnes). Other significant export items over recent years include leather, hides and skins, tallow, iron and steel, aluminium and dairy products. China's exports to New Zealand have increased at a much slower rate to reach $48.8 million in 1982–83. Agricultural development is an important part of China's modernisation programme and in recent years New Zealand has participated in some livestock and pasture development projects in this sector. Prospects for co-operative manufacturing ventures in light industry have already been realised in some cases and further growth and diversification in the sale of goods and services is expected. A Joint Trade Commission meets annually to review developments in bilateral trade.
Korea—Exports to the Republic of Korea increased from $1.6 million in 1970–71 to $102.7 million for the year ended June 1983. Major exports are: wool, 25.1 percent; forest products, 16.9 percent; hides and skins, 15.6 percent; tallow, 8.1 percent; and beef, 7.7 percent. Korean imports of agricultural products are subject to severe import restrictions.
Latin America—Peru, Mexico, and Venezuela have become useful markets for New Zealand dairy products, especially for milk powder and anhydrous milk fat (AMF). Total New Zealand exports (including dairy products) to these countries in 1981–82 were $53 million to Peru, $45 million to Mexico, and $36 million to Venezuela, and $13 million to Mexico. A New Zealand/Mexico Scientific and Technological Agreement (STC) was signed in Mexico in August 1983.
Eastern Europe—New Zealand's exports to Eastern Europe, including the Soviet Union, reached a peak of $386 million in the 1982–83 year. The Soviet Union is by far the most important market in the region, accounting for $344 million. This makes the Soviet Union our sixth largest export market, and one of our major markets for dairy products, wool, and mutton.
New Zealand's exports to the region reflect the Eastern European need to meet occasional shortfalls in domestic production of food (dairy products and mutton), and the requirement for raw materials for manufacturing (wool, tallow, and hides). Emphasis is being placed on diversification from the narrow range of traditional exports, and newer products exported to Eastern Europe include breeding sheep, seeds, milking equipment, animal identification ear tags, and pharmaceutical raw materials.
New Zealand imports from Eastern Europe dropped from $12 million to $6 million in 1982–83. Goods imported were chemicals, machinery, textiles, glassware, fertilisers, rail and motor vehicles.
Middle East—Exports to this region rose from $3 million in 1970–71 to a record $606 million in 1982–83. Iran, which took $356 million of New Zealand goods, was the most valuable market; followed by Saudi Arabia ($75 million); and Algeria ($34 million).
A move to domestic fuel production, plus an increase in imports from other sources, caused a further drop in New Zealand's imports of Middle East oil. As a result, the figures for total imports from the region decreased from $459 million in 1981–82 to $213 million the following year. Imports from Kuwait, Qatar and Saudi Arabia are also down.
The 4-year long term agreement for meat supply to Iran has now expired, although a major single year sale for 1984 was successfully concluded. During 1984 a 5-year “evergreen” dairy products agreement with Iraq was negotiated.
Australia—Between 1966 and 1982 the New Zealand Australia Free Trade Agreement (NAFTA) governed trans-Tasman trade. Under NAFTA there was a very substantial increase in 2-way trade particularly in manufactured goods. Between 1964–65 and 1981–82 New Zealand exports to Australia increased from NZ$34 million to NZ$1,029 million, while imports from Australia rose from NZ$128 million to NZ$1,365 million.
The central element of NAFTA was Schedule A whirl provided for the elimination of duties on goods included in the schedule. The agreement also contained a number of other arrangements which promoted reciprocal trade.
In spite of NAFTA's success in fostering a rapid expansion of trans-Tasman trade, by the late 1970s both New Zealand and Australia felt that NAFTA no longer provided the most appropriate framework for promoting trade between the two countries. It did not provide any automatic mechanism for improving access conditions by the removal of quantitative restrictions, nor did it guarantee that existing conditions of access would be maintained for those products not covered by NAFTA arrangements.
Closer Economic Relationship—Following negotiations during 1980–82 the CER Heads of Agreement was signed on 14 December 1982, and the agreement came into effect on 1 January 1983. The formal trade agreement, the Australia - New Zealand Closer Economic Relation's Trade Agreement, was signed on 28 March 1983.
In general, the agreement provides for the phased removal of duty rates by 1 January 1988 at the latest, and the progressive liberalisation of all remaining quantitative restrictions on trans-Tasman trade, with all such restrictions being eliminated by 1995. Factors creating inequality of trading opportunity are to be equalised, and to that end, all performance-based export incentives are to be removed by 1987. The agreement applies to all goods, although certain products and industry groups have been subject to modified programmes of trade liberalisation which take into account their special adjustment needs.
Provisions of the agreement cover agricultural support and stabilisation measures; the treatment of agricultural and horticultural products subject to monopoly import arrangements in New Zealand; Government purchasing regimes; rules of origin; antidumping and countervailing action; action that can be taken during the transition period to free trade to deal with cases of severe material injury or the demonstrable threat of injury to an industry as a result of trade liberalisation; situations where producers in one country might be able to source intermediate goods from third countries on a more favourable basis and so obtain significant advantanges over their competitors in the partner country; and other trade distorting factors such as differences in standards, labelling requirements and technical specifications and technical procedures. These provisions are intended to enable trans-Tasman trade to be conducted on the basis of equality of opportunity and of fair competition. The new agreement also provides for consultation on the operation of any aspect of CER, for an annual Ministerial review and for a general review of the agreement in its sixth year.
Trans-Tasman trade statistics are given in the following table.
| June Year | New Zealand Imports from Australia* | New Zealand Exports to Australia† | Visible Balance of Trade with Australia | Ratio of Imbalance in Australia's Favour |
|---|---|---|---|---|
* Value for duty (v.f.d.). †Includes re-exports (f.o.b.). ‡Valuation for 1979 is current domestic value (c.d.v.). | ||||
| NZ$(million) | ||||
| 1979 | 798.5‡ | 499.5 | −299.0 | 1:1.60 |
| 1980 | 891.3 | 631.5 | −259.8 | 1:1.41 |
| 1981 | 1,043.6 | 814.7 | −228.9 | 1:1.28 |
| 1982 | 1,367.4 | 1,025.2 | −342.2 | 1:1.33 |
| 1983 | 1,345.1 | 949.0 | −396.1 | 1:1.42 |
Developing Countries Liaison Unit—The unit is located in the Trade Policy Division of the Department of Trade and Industry, and was set up in 1977 to help developing country exporters find markets for their products in New Zealand. The assistance is available to 161 countries which are classified as developing countries in the New Zealand Customs Tariff.
The unit provides information on the New Zealand market for a wide range of products and puts developing country exporters in touch with potential New Zealand buyers. In addition, it assists visiting businessmen and trade missions from developing countries, and helps organise trade exhibitions in New Zealand.
TRADE PER HEAD—Trade per head of population is affected, not only by the volume of trade but also by the value, i.e., the prices received for exports and the cost of imports.
The following table shows the value, per head of mean population, of New Zealand's trade over the last 5 years.
| Year Ended 30 June | Exports (f.o.b.) | Imports (c.i.f.) | Total Trade |
|---|---|---|---|
| $ | |||
| 1979 | 1,299.89 | 1,227.39 | 2,527.28 |
| 1980 | 1,648.29 | 1,654.81 | 3,303.10 |
| 1981 | 1,925.85 | 1,912.63 | 3,838.48 |
| 1982x | 2,125.16 | 2,398.66 | 4,523.82 |
| 1983 | 2,402.37 | 2,371.62 | 4,773.99 |
VISIBLE BALANCE OF MERCHANDISE TRADE—
| Year Ended 30 June | Total Exports (f.o.b.) | Total Imports (c.i.f.) | Excess Exports (+)or Imports (–) |
|---|---|---|---|
| $(000) | $(000) | ||
| 1982 | 6,733,791 | 7,600,402 | −866,611 |
| 1983 | 7,694,319 | 7,595,828 | +98,491 |
Visible trade is not the only factor to be taken into account in considering the balance of payments between countries (see Section 26B). A statement of New Zealand's overseas exchange transactions is given in Section 30, Banking and Currency.
TRADE STATISTICS—Provisional trade data are published in the Monthly Abstract of Statistics soon after the period to which they relate.
Annual volumes containing comprehensive surveys of final data are also published by the Department of Statistics.
New Zealand has used the Standard International Trade Classification (Revised) as from 1 July 1962, for classifying external trade for statistical purposes. Since 1 July 1978 the classification has been in accordance with the Standard International Trade Classification (Revision 2).
Final monthly values of imports and exports are set out in the following table.
| Net Month | 1980–81 | 1981–82 | 1982–83 | ||||||
|---|---|---|---|---|---|---|---|---|---|
| Exports (including Re-exports) f.o.b.* | Imports | Exports (including Re-exports) f.o.b. | Imports | Exports (including Re-exports) f.o.b. | Imports | ||||
| v.f.d. Value* | c.i.f. Value* | v.f.d. Value* | c.i.f. Value* | v.f.d. Value | c.i.f. Value | ||||
| * Provisional net month figures. | |||||||||
| $(million) | |||||||||
| July | 480.9 | 470.6 | 509.6 | 522.4 | 516.6 | 558.0 | 665.4 | 634.5 | 688.4 |
| August | 381.8 | 392.5 | 427.9 | 462.0 | 533.8 | 574.5 | 489.5 | 700.0 | 755.5 |
| September | 445.3 | 492.3 | 528.6 | 476.3 | 566.5 | 606.5 | 571.2 | 587.6 | 646.5 |
| October | 414.6 | 425.6 | 472.4 | 493.6 | 551.2 | 600.9 | 569.5 | 545.1 | 600.1 |
| November | 492.6 | 438.0 | 468.6 | 560.1 | 556.9 | 597.2 | 659.0 | 566.7 | 623.6 |
| December | 519.9 | 480.8 | 513.1 | 556.4 | 597.0 | 642.4 | 712.2 | 548.3 | 602.4 |
| January | 381.3 | 394.4 | 416.5 | 497.5 | 453.0 | 494.5 | 494.1 | 514.3 | 561.8 |
| February | 507.5 | 352.4 | 382.2 | 607.6 | 561.8 | 603.5 | 639.7 | 507.3 | 562.0 |
| March | 660.4 | 479.3 | 525.6 | 629.5 | 645.1 | 690.2 | 808.3 | 611.5 | 674.9 |
| April | 547.6 | 409.0 | 445.9 | 552.5 | 633.0 | 689.3 | 576.2 | 484.4 | 530.9 |
| May | 576.2 | 626.5 | 672.9 | 729.6 | 623.7 | 677.3 | 745.7 | 639.6 | 700.6 |
| June | 627.1 | 580.9 | 613.0 | 646.3 | 669.0 | 729.0 | 763.6 | 589.0 | 649.3 |
Source of Data—Import and export statistics are compiled by the Department of Statistics using data from copies of entries submitted by the importers/exporters and their agents via the Customs Department.
Basis of Valuation—All values shown are in terms of New Zealand currency. Exports are shown on an f.o.b. (free on board) valuation basis. In some cases however, goods are sent on consignment and the selling prices are not known until goods are disposed of at their destination. In these cases f.o.b. values are assessed on the basis of prices current at the time of export. Goods of foreign origin previously imported into New Zealand are valued in the same way as goods of New Zealand origin, irrespective of whether the goods exported are exempt from import duty, exported ex-warehouse, or exported under drawback.
Two values are given for imports. The v.f.d. (value for duty) on which customs duty is based, equates approximately with the f.o.b. cost of the goods in the exporting country though the former often excludes special export packaging and other costs incidental to delivering the goods on board ship. Further differences may arise from price fluctuations between the purchase date and the date of shipment, and from different export and domestic price levels. The other valuation is the c.i.f. (cost including insurance and freight) which represents the cost to the importer of buying the goods and bringing them to this country to the wharfside.
Annual Statistics—Trade statistics are based on a June year.
The following table shows for the June year 1983 the values of merchandise exports to, and imports from, each of the countries trading with New Zealand.
| TRADE BY COUNTRIES. YEAR ENDED JUNE 1983 | |||
|---|---|---|---|
| Country | Exports f.o.b. | Imports v.f.d. | |
| New Zealand Produce | Total* | By Country of Origin | |
| * Including re-exports. | |||
| $(000) | |||
| O.E.C.D. Countries— | |||
| E.E.C. Countries— | |||
| Belgium | 71,575 | 71,710 | 32,516 |
| Denmark | 11,745 | 11,975 | 24,724 |
| Destination unknown—E.E.C. | 21,577 | 21,577 | |
| France | 113,086 | 143,036 | 96,397 |
| Germany, Federal Republic of | 133,782 | 135,319 | 307,404 |
| Greece | 50,935 | 50,935 | 3,317 |
| Greenland | 14 | 14 | – |
| Ireland | 8,542 | 8,859 | 15,326 |
| Italy | 119,140 | 119,762 | 105,761 |
| Luxembourg | – | – | 617 |
| Monaco | – | – | 23 |
| Netherlands | 93,726 | 94,169 | 95,225 |
| United Kingdom | 983,538 | 990,143 | 637,759 |
| Vatican City State | – | – | – |
| Total, E.E.C. Countries | 1,607,660 | 1,647,501 | 1,319,070 |
| Other O.E.C.D. Countries— | |||
| Australia | 910,867 | 953,207 | 1,367,934 |
| Austria | 6,021 | 6,129 | 14,358 |
| Canada | 162,491 | 163,334 | 168,416 |
| Finland | 3,828 | 3,836 | 10,603 |
| Iceland | 196 | 196 | 194 |
| Japan | 1,060,561 | 1,062,423 | 1,165,997 |
| Liechtenstein | – | – | 28 |
| New Zealand (reimports) | 14,029 | ||
| Norway | 2,932 | 2,957 | 17,201 |
| Portugal | 5,264 | 5,349 | 4,241 |
| Spain | 24,996 | 25,010 | 17,059 |
| Sweden | 5,724 | 6,159 | 52,069 |
| Switzerland | 10,342 | 10,879 | 51,978 |
| Turkey | 2,694 | 2,694 | 659 |
| United States of America | 1,056,231 | 1,170,415 | 1,168,548 |
| Total, O.E.C.D. Countries | 4,859,806 | 5,060,088 | 5,372,383 |
| China— | |||
| People's Republic of China | 176,954 | 177,178 | 48,863 |
| Province of Taiwan | 124,927 | 126,143 | 77,839 |
| Asia— | |||
| Afghanistan | 2 | 7 | 113 |
| Bangladesh | 1,108 | 1,110 | 4,440 |
| Brunei | 815 | 892 | 14 |
| Burma | 11 | 11 | 177 |
| Hong Kong | 91,102 | 92,322 | 97,097 |
| India | 44,855 | 45,611 | 29,567 |
| Indonesia | 99,479 | 99,608 | 271,546 |
| Korea, Dem. Peoples Republic | – | – | – |
| Korea, Republic of | 102,732 | 102,802 | 100,594 |
| Macau | 355 | 355 | 357 |
| Malaysia | 112,186 | 113,202 | 34,049 |
| Maldives | – | – | – |
| Mongolia | – | – | 15 |
| Nepal | 386 | 387 | 96 |
| Pakistan | 37,788 | 37,796 | 4,520 |
| Philippines | 90,014 | 90,318 | 9,676 |
| Singapore | 109,874 | 138,522 | 395,062 |
| Sri Lanka | 12,862 | 12,922 | 8,234 |
| Thailand | 44,939 | 45,070 | 12,726 |
| Viet Nam, Socialist Republic of | 598 | 598 | 49 |
| Oceania— | |||
| Cook Islands | 14,756 | 17,822 | 5,093 |
| Fiji | 92,415 | 103,863 | 29,687 |
| French Polynesia | 37,111 | 37,844 | 266 |
| Kiribati | 3,002 | 3,198 | 7 |
| Nauru | 881 | 900 | 35,083 |
| New Caledonia | 18,880 | 19,539 | 145 |
| Niue | 2,413 | 2,708 | 546 |
| Papua New Guinea | 68,947 | 79,286 | 7,230 |
| Pitcairn Islands | 326 | 474 | – |
| Samoa, Western | 15,838 | 17,092 | 4,151 |
| Solomon Islands | 6,269 | 7,111 | 1,024 |
| Tokelau | 28 | 28 | 3 |
| Tonga | 16,881 | 18,114 | 2,849 |
| Tuvalu | 362 | 418 | 3 |
| Vanuatu | 5,601 | 6,150 | 4 |
| Wallis and Futuna Islands | 332 | 335 | – |
| Latin America-Caribbean— | |||
| Antigua and Barbuda | 81 | 81 | 1 |
| Argentina | 2,249 | 2,517 | 2,321 |
| Bahamas | 1,356 | 1,356 | 3,028 |
| Barbados | 6,047 | 6,080 | 121 |
| Belize | 144 | 144 | – |
| Bermuda | 4,959 | 4,959 | 2 |
| Bolivia | – | – | 2 |
| Brazil | 62 | 70 | 31,903 |
| British Virgin Islands | 98 | 98 | – |
| Cayman Islands | 54 | 54 | – |
| Chile | 1,873 | 2,096 | 600 |
| Colombia | 660 | 660 | 263 |
| Costa Rica | 55 | 56 | 213 |
| Cuba | – | – | 9 |
| Dominica | 79 | 79 | – |
| Dominican Republic | 5,399 | 5,399 | 8 |
| Ecuador | 1,700 | 1,700 | 9,087 |
| El Salvador | 1,138 | 1,137 | 143 |
| Falkland Islands | 5 | 5 | – |
| French Guiana | 68 | 68 | – |
| Grenada | 73 | 73 | – |
| Guadeloupe | 2,951 | 2,952 | – |
| Guatemala | 100 | 100 | 164 |
| Guyana | 18 | 18 | 358 |
| Haiti | 911 | 911 | 11 |
| Honduras | – | – | – |
| Jamaica | 6,430 | 6,438 | 5,907 |
| Martinique | 1,855 | 1,861 | – |
| Mexico | 13,549 | 13,557 | 4,947 |
| Montserrat | 4 | 4 | – |
| Netherlands Antilles | 1,526 | 1,526 | 2,871 |
| Nicaragua | – | – | 207 |
| Panama | 6,946 | 6,946 | 28 |
| Paraguay | 3 | 3 | – |
| Peru | 42,405 | 42,408 | 232 |
| St. Vincent and the Grenadines | 27 | 27 | 1 |
| St Kitts–Nevis | 8 | 8 | – |
| St. Lucia | 336 | 336 | – |
| Suriname | 258 | 258 | – |
| Trinidad and Tobago | 22,501 | 22,520 | 106 |
| Uruguay | 54 | 54 | 51 |
| Venezuela | 41,346 | 41,348 | 14,059 |
| Middle East— | |||
| Bahrain | 14,294 | 14,296 | 23,787 |
| Egypt | 12,228 | 12,260 | 39 |
| Iran | 355,999 | 355,999 | 213 |
| Iraq | 29,461 | 29,461 | 1,102 |
| Israel | 767 | 806 | 9,304 |
| Jordan | 5,315 | 5,315 | – |
| Kuwait | 22,765 | 22,765 | 34,438 |
| Lebanon | 208 | 208 | 1 |
| Libyan Arab Republic | – | – | – |
| Oman | 13,026 | 13,051 | – |
| Qatar | 3,707 | 3,709 | 160 |
| Saudi Arabia | 75,020 | 75,081 | 142,140 |
| Syrian Arab Republic | 3,380 | 3,380 | – |
| United Arab Emirates | 23,479 | 23,518 | 1,152 |
| Yemen Arab Republic | 1,155 | 1,407 | – |
| Yemen Peoples Democratic Republic | 12 | 12 | – |
| Eastern Europe— | |||
| Albania | – | – | 3 |
| Bulgaria | 953 | 953 | 88 |
| Czechoslovakia | 13,242 | 13,242 | 4,113 |
| German Democratic Republic | 5,314 | 5,460 | 1,464 |
| Hungary | 2,042 | 2,042 | 14,354 |
| Poland | 12,688 | 12,688 | 1,478 |
| Romania | – | – | 946 |
| U.S.S.R. | 344,763 | 344,763 | 9,023 |
| Yugoslavia | 7,454 | 7,454 | 14,348 |
| Africa— | |||
| Algeria | 37,445 | 37,445 | – |
| Angola | 16 | 17 | – |
| Botswana | 173 | 173 | 1 |
| Burundi | – | – | – |
| Cameroon | – | – | 68 |
| Central African Republic | – | – | – |
| Ethiopia | 25 | 25 | 80 |
| Gabon | 166 | 166 | – |
| Gambia | 4 | 4 | – |
| Ghana | 16 | 16 | 12,645 |
| Ivory Coast | 258 | 258 | 658 |
| Kenya | 632 | 633 | 2,152 |
| Lesotho | 761 | 761 | – |
| Liberia | 22 | 22 | – |
| Madagascar | – | – | 102 |
| Malawi | 2,615 | 2,623 | 1,038 |
| Mauritania | 3 | 3 | – |
| Mauritius | 15,474 | 15,477 | 237 |
| Morocco | 2,052 | 2,052 | 146 |
| Mozambique | 2,350 | 2,354 | – |
| Namibia | – | – | – |
| Niger | – | – | – |
| Nigeria | 15,256 | 15,260 | 10 |
| Reunion | 638 | 638 | 1 |
| Rwanda | 6 | 6 | – |
| Senegal | 4 | 5 | – |
| Seychelles | 7 | 7 | – |
| Somalia | 2 | 2 | – |
| South Africa | 24,097 | 24,505 | 15,868 |
| Sudan | 1,366 | 1,367 | 7 |
| Swaziland | 18 | 19 | 580 |
| Tanzania | 1,002 | 1,002 | 1,810 |
| Togo | – | – | – |
| Tunisia | 1,576 | 1,576 | 17 |
| Uganda | – | – | 893 |
| Western Sahara | 8 | 8 | – |
| Zaire | 6 | 6 | 52 |
| Zambia | 60 | 61 | 105 |
| Zimbabwe | 913 | 923 | 3,244 |
| Other countries— | |||
| Antarctic stations (U.S.A.) | 115 | 115 | – |
| Antarctic regions (foreign) | – | – | – |
| Cyprus | 4,325 | 4,325 | 12 |
| Destination unknown—Other | 4,834 | 4,834 | |
| Gibraltar | 126 | 126 | – |
| Malta | 1,833 | 1,833 | 211 |
| St Pierre and Miquelon | 66 | 66 | – |
| Total, Merchandise Trade | 7,427,708 | 7,694,319 | 6,928,240 |
VOLUME INDEX OF EXTERNAL TRADE—For the index of the volume of external trade, both the import and the export series are linked chain series with changing (price) weighting patterns, each year being calculated on base previous year and then linked on.
Exports—Base: Year Ended June 1982 (=1000) for each commodity or class of commodities.
| Year Ended 30 June | Butter | Cheese | Dairy Produce | Meat | Wool | Meat, Wool, and By-products | All Pastoral and Dairy Produce |
|---|---|---|---|---|---|---|---|
| 1979 | 996 | 780 | 878 | 1,024 | 913 | 977 | 945 |
| 1980 | 1,161 | 849 | 1,039 | 911 | 1,013 | 934 | 955 |
| 1981 | 1,024 | 992 | 999 | 1,050 | 1,010 | 1,024 | 1,011 |
| 1982 | 1,000 | 1,000 | 1,000 | 1,000 | 1,000 | 1,000 | 1,000 |
| 1983 | 1,123 | 941 | 1,056 | 1,158 | 1,139 | 1,151 | 1,124 |
| Year Ended 30 June | Food, Beverages, and Tobacco | Manufactured Goods Other Than Food | Crude Materials Other Than Fuels | All Groups |
|---|---|---|---|---|
| 1979 | 926 | 846 | 976 | 925 |
| 1980 | 942 | 927 | 1,030 | 967 |
| 1981 | 1,003 | 1,003 | 1,042 | 1,013 |
| 1982 | 1,000 | 1,000 | 1,000 | 1,000 |
| 1983 | 1,116 | 971 | 1,084 | 1,077 |
Imports—Base: Year Ended June 1982 (=1000) for each commodity or class of commodities.
| Year Ended 30 June | Petroleum and Products | Textile Yarn, Fabrics, etc. | Iron and Steel | Machinery Other than Electric | Electric Machinery and Apparatus | Transport Equipment |
|---|---|---|---|---|---|---|
| 1979 | 1,265 | 876 | 870 | 703 | 694 | 763 |
| 1980 | 1,270 | 956 | 842 | 854 | 753 | 812 |
| 1981 | 1,198 | 811 | 695 | 847 | 743 | 1,095 |
| 1982 | 1,000 | 1,000 | 1,000 | 1,000 | 1,000 | 1,000 |
| 1983 | 974 | 898 | 840 | 1,097 | 1,126 | 620 |
| Year Ended 30 June | Food, Live Animals, Beverages, and Tobacco | Manufactured Goods Other Than Food | Crude Materials Other Than Fuels | Mineral Fuels, Lubricants, and Related Materials | All Groups |
|---|---|---|---|---|---|
| 1979 | 614 | 804 | 1,076 | 1,264 | 879 |
| 1980 | 732 | 856 | 1,000 | 1,267 | 926 |
| 1981 | 664 | 851 | 972 | 1,195 | 903 |
| 1982 | 1,000 | 1,000 | 1,000 | 1,000 | 1,000 |
| 1983 | 814 | 901 | 950 | 973 | 914 |
IMPORT LICENSING—Import licensing for private imports was first introduced in December 1938, and has continued in varying degrees of intensity since that date. The objectives of import licensing have been diverse, but have included ensuring a stable market for industry, utilising domestic resources to the fullest extent, encouraging investment and productivity, and helping to protect the balance of payments.
There was some movement away from import licensing controls during the early 1950s. Then in 1957 the prices for our agricultural exports fell sharply, and the government of the day reimposed import licensing on virtually all commodities.
Since 1960 there has been a steady pattern of exemptions from licensing, especially for raw materials and those finished goods, such as machinery and equipment vital to our primary and secondary industries, and other finished goods not provided in New Zealand. In 1982 some 78 percent of all private imports were exempt from licensing. Those remaining under control included many of the wide range of consumer goods made in this country.
The main policies which are being continued in the 1983–84 licensing period are:
An Excessive Price/Quality Differentials Policy, which permits manufacturers to import plant and equipment, components and parts when it can be established that the prices of the New Zealand-made equivalents are manifestly excessive, or that their technology or quality is significantly deficient;
An Export Production Assistance Scheme, introduced specifically to facilitate export competitiveness;
An Import Licence Tendering, under which import licences are allocated by competitive bidding. Tendering is used both as an allocative mechanism and to provide information on the appropriateness of existing levels of duty, so that these can be reviewed as part of a gradual move towards a tariff-based regime of protection.
ADMINISTRATION—Before 1975 the administration of import licensing policy was the joint responsibility of the Customs Department and the Department of Trade and Industry. In 1973, the Department of Trade and Industry assumed sole responsibility for licensing administration. The Customs Department, however, retains an important role, particularly in the receipt of applications, the issue of licences, and the administration of certain policies delegated to it.
Import provisions are published in an annual Import Licensing Schedule. The policies followed by the Government for individual products, and a number of general licensing policies, published for the first time in 1981–82, were again published in the 1982–83 licensing period.
INDUSTRIES DEVELOPMENT COMMISSION—The Industries Development Commission operates under the Industries Development Commission Act 1961. The Commission superseded the Tariff and Development Board on 19 September 1975. The Industries Development Commission Act 1961 differs only in minor respects from the Tariff and Development Board Act. The Act was amended in 1979 to allow for the appointment of associate members with expertise in those industries under study.
The commission's functions are as set out in section 7 of the Act and are to inquire into and report on matters relating to industrial development and protection at the frontier when requested by the Minister of Customs, the Minister of Trade and Industry or the Minister of Overseas Trade.
At present the emphasis is on the commission's development function. Its current commitments include studies of the motor vehicles and electronics industries, and a review of the textile industry plan.
During 1983 the commission completed studies of the motor vehicle assembly, electronic and carpet industries and the first part of the review of the Textile Development Plan.
In addition the commission presented a report on the writing instruments industry, as a statutory requirement following the Government's acceptance of a report by the Emergency Protection Authority.
EMERGENCY PROTECTION AUTHORITY—The Emergency Protection Authority operates under section 10A to 10E of the Industries Development Commission Act 1961 and Section 4 of the 1979 Industries Development Commission Amendment Act. It was set up under an amendment to the Tariff and Development Board Act 1961 of 22 November 1967. Its function is to advise, when requested by the Minister of Customs, the Minister of Trade and Industry, or the Minister of Overseas Trade, whether urgent action is necessary to protect New Zealand industry In relation to the importation of any goods and if so the nature of such action.
TRADE COMMISSIONER SERVICE—The Department of Trade and Industry assists in promoting overseas trade through its Trade Commissioner service. The Trade Commissioners' primary function is to protect and promote New Zealand's economic and commercial interests in general and its export interests in particular. There are currently Trade Commissioners at posts located in Athens, Baghdad, Bahrain, Bangkok, Bonn, Beijing, Brisbane, Brussels, Canberra, The Hague, Hong Kong, Jakarta, Kuala Lumpur, Lima, London, Los Angeles, Manila, Melbourne, Moscow, New York, Noumea, Ottawa, Paris, Perth, Port Moresby, Rome, San Francisco, Seoul, Singapore, Suva, Sydney, Tehran, Tokyo, Vancouver, Vienna, and Washington. There are marketing officers in Santiago and Mexico and in addition there is a Trade Correspondent each in Tahiti and Hawaii. Trade Correspondents are normally appointed from Air New Zealand staff overseas and undertake trade work in addition to their Air New Zealand duties. A full list of the overseas representatives and their addresses is listed in Section 39, Official.
Trade Commissioners can help new exporters get established and established exporters expand and diversify their sales. They can help by reporting on market prospects for particular products; supplying information on access conditions (customs duty, sales tax, quotas) as well as other market requirements such as packaging, labelling, phytosanitary and veterinary health requirements, and by providing commercial intelligence and advice. Trade Commissioner reports can analyse the market conditions and recommend the most appropriate marketing methods. New Zealand businessmen and women may be saved much time and trouble by enlisting in advance the services of the Trade Commissioner, whose in-depth knowledge of local conditions and whose close connections with business and Government officials ensures that valuable advice is available.
In addition Trade Commissioners monitor the overall pattern of New Zealand trade with their territory and report on any significant developments such as changes in legislation or regulations which could affect New Zealand exports. They also help ensure that the Government officials and influential people in their territory are aware of New Zealand's export interests. From time to time they are required to make official representations to the government concerned, as well as representing New Zealand at international conferences.
Business people may write direct to the New Zealand Trade Commissioner in the country concerned. However, where possible, it is preferred that requests be made though the Department of Trade and Industry in New Zealand, where preliminary advice and assistance is available.
EXPORT AWARDS—When the Trade Promotion Council was abolished in February 1983 the council's Export Award Scheme and the Governor General's. Award for Exporting were continued under the auspices of the Department of Trade and Industry.
The Export Award Scheme affords recognition to individuals, companies and organisations which have made significant contributions to the expansion of New Zealand's export trade. Since the scheme was introduced in 1965, 134 New Zealand exporters have been granted an export award.
There is also the Governor General's Award for exceptional export performance, which is open only to winners of the Export Award who have had at least a further 5 years exporting with exceptional sustained export performance. Ten companies have been granted the Governor General's Award since its inception in 1974.
EXPORT CREDIT INSURANCE—The Export Guarantee Office (EXGO) operates in accordance with the Export Guarantee Act 1964. The office's function is to promote export trade by providing insurance against commercial and political risks arising from the export of goods or services. It also provides guarantees to lending institutions for amounts advanced to exporters of goods or services which are covered by a contract of insurance issued by EXGO. The Export Guarantee Office can provide a wide range of policies sufficient to meet most requirements.
NEW ZEALAND EXPORT-IMPORT CORPORATION—The New Zealand Export-Import Corporation was established under the New Zealand Export-Import Corporation Act 1974 with the objective of promoting and encouraging the development of New Zealand's overseas trade. The corporation operates as a commercial enterprise. It may act either on its own account or on behalf of manufacturers, producers, exporters or importers as required. The corporation is also entitled to act as a purchasing and selling agent for the Government and to undertake trade transactions on behalf of the Government.
The affairs of the corporation are managed by a board of directors comprising businessmen with wide commercial experience and 2 Government representatives, 1 each from the Department of Trade and Industry and the Ministry of Foreign Affairs.
The corporation currently maintains a Trade Centre in Sydney, which assists member New Zealand exporters selling in Australia. It has representatives based in Caracas, Venezuela and Kuala Lumpur, Malaysia, and it holds the New Zealand interest in the Bahrain—New Zealand Cold Storage and Warehousing Company (BANZ) which operates a port and storage facility in Bahrain.
The growth and diversification of the New Zealand economy are heavily dependent on increasing exports to pay for rising imports of goods and services and the overseas investment needed by industry and a growing population. Overseas trade is the lifeblood of the economy. New Zealand's export trade has become more diversified in recent years, as regards both products and markets. While the traditional export commodities—dairy products, meat, and wool—remain the backbone of the export trade, new commodities such as wood pulp, paper, and other products of our forest industries, and manufactured goods, are of growing importance.
In New Zealand copies of export entries are forwarded to the Department of Statistics for processing and analysis and the regular publication of export statistics. Exports are valued in New Zealand currency “free on board at the port of shipment”. Where goods are not sold till arrival at their destination, values are assessed at current prices at time of shipment. Meat and dairy produce exports are valued like other commodities, on the basis of overseas realisation, not on the basis of the prices payable to producers under the internal purchasing procedures.
The ultimate destination of the goods is distinguished as far as practicable, but it is impossible to discover what proportion of the exports is intended for home consumption in the country of destination. A distinction is made between exports of New Zealand produce and re-exports of imported goods.
Since July 1962, the Standard International Trade Classification has been used in classifying export trade. Currently, goods are classified according to the Standard International Trade Classification (Revision 2).
MAIN EXPORTS—The following table gives total exports of New Zealand produce and re-exports (excluding gold and current coin) for the lastest 5 June years by the main commodity groups.
| Year Ended June | Meat and Meat Preparations | Dairy Products | Hides, Skins, and Pelts | Wool | |||
|---|---|---|---|---|---|---|---|
| Milk, Cream | Butter | Cheese | Casein | ||||
| f.o.b. value $(million) | |||||||
| 1979 | 1,094.0 | 130.3 | 277.2 | 75.5 | 62.3 | 181.8 | 683.3 |
| 1980 | 1,192.3 | 219.5 | 360.6 | 105.9 | 112.5 | 180.1 | 930.8 |
| 1981 | 1,520.9 | 315.2 | 398.0 | 137.7 | 117.2 | 129.9 | 892.6 |
| 1982 | 1,564.1 | 408.5 | 556.4 | 181.5 | 142.0 | 152.9 | 918.8 |
| 1983 | 1,870.7 | 436.3 | 657.7 | 193.5 | 199.0 | 185.2 | 1,017.1 |
| Year Ended June | Fish* | Sausage Casings | Tallow | Fruit and Vegetables | Pulp, Paper, and Paper-board | Total† | Re-exports | Total Exports |
|---|---|---|---|---|---|---|---|---|
* Chilled or frozen. Includes crayfish. †Including commodities not listed. | ||||||||
| f.o.b. value $(million) | ||||||||
| 1979 | 57.9 | 30.2 | 42.4 | 103.8 | 179.3 | 3,946.0 | 121.4 | 4,067.4 |
| 1980 | 90.6 | 33.5 | 43.4 | 128.7 | 247.7 | 5,012.5 | 139.8 | 5,152.2 |
| 1981 | 132.6 | 46.8 | 47.7 | 170.0 | 312.9 | 5,830.0 | 235.2 | 6,065.3 |
| 1982 | 153.0 | 48.6 | 53.2 | 215.1 | 346.7 | 6,527.8 | 206.0 | 6,733.8 |
| 1983 | 194.8 | 50.5 | 58.2 | 261.6 | 305.7 | 7,427.7 | 266.6 | 7,694.3 |
For the year ended June 1983 the commodity groups shown above account for more than 70 percent of the total value of merchandise exports. In recent years, however, manufactured goods have come to play an increasingly important part in New Zealand's export trade.
The relative importance of dairy produce, meat, and wool as the main individual constituents of New Zealand's export trade have varied considerably, as is seen from the figures in the preceding table. The preceding subsection includes a table of volume index numbers for these commodities and for manufactured goods and other commodities. A table showing the export price index numbers and terms of trade is given in Section 24, Prices, Household Expenditure, and Consumer Affairs.
The value of total exports and of exports of some of the principal pastoral products is illustrated in the following graph.
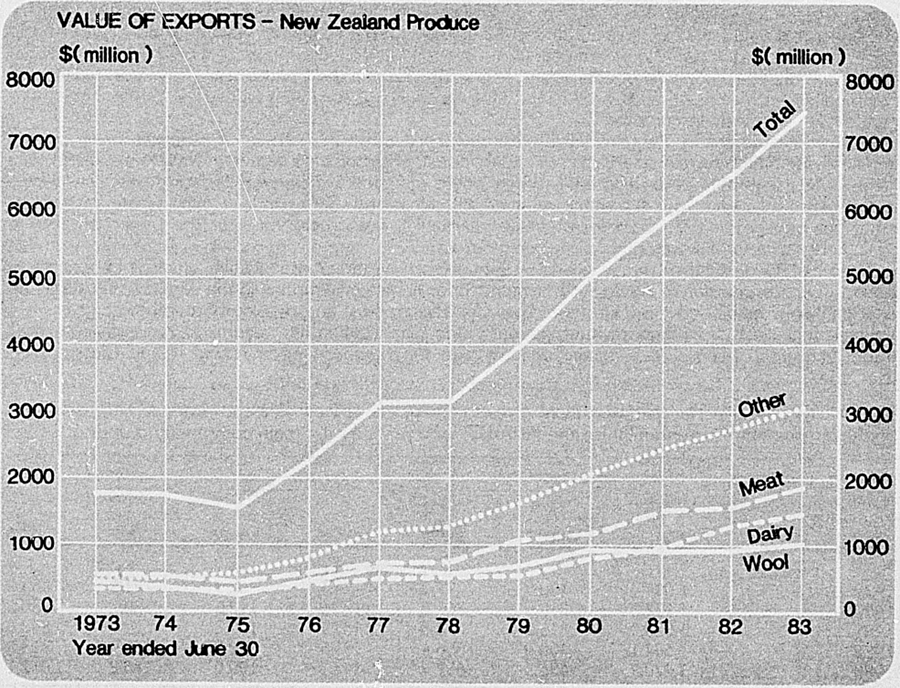
The following graph illustrating the volume of exports is based on the table on page 618 of the preceding section.
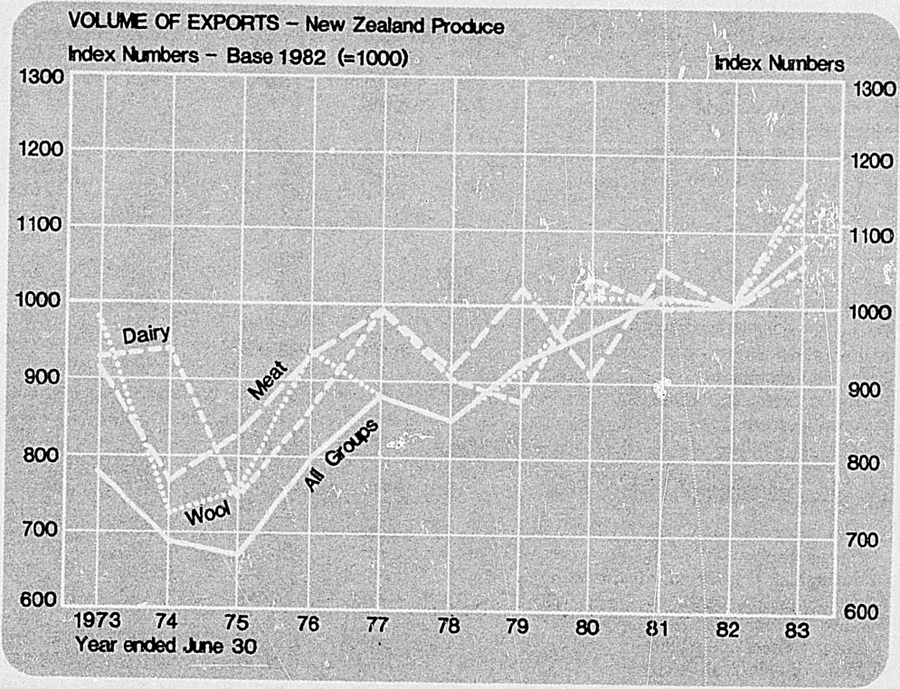
For many years exports of wool, meat, and dairy produce averaged over 70 percent (by value) of New Zealand's export trade. During the June years 1982 and 1983, exports of these products have reduced to 56 percent of the total value of exports, which indicates the growing importance of manufactured goods, fish, forest products, and horticultural products.
Other principal exports during June years 1982 and 1983 were: fresh, chilled, or frozen fish, including crayfish ($153.0m and $194.8m); fresh apples ($52.0m and 59.3m); fresh kiwifruit ($52.7m and $86.8m), sawn timber ($48.0m and $46.4m); wood pulp ($155.7m and $161.4m); newsprint ($110.6m and $61.2m); carpets ($55.0m and $59.5m); and unwrought aluminium ($182.3m and $275.3m).
The volume of exports of the principal items of New Zealand produce during the 3 latest years are shown in the following table. The Statistical Summary, towards the end of this Yearbook, shows the figures for some of the more important commodities over a period of 50 years.
| Commodity (New Zealand Produce) | Unit | Year Ended June | ||
|---|---|---|---|---|
| 1981 | 1982 | 1983 | ||
* For 1982 and 1983 an imputation method has been used to convert numbers of carcasses to tonne equivalents. †For 1981, weights are accumulated, six months net weight and six months gross weight (which was introduced for cargo data). While this should be noted, some analyses have shown insignificant variations in the respective weights. | ||||
| Racehorses | No. | 2,294 | 2,346 | 2,030 |
| Meat, fresh, chilled or frozen— | ||||
| Beef— | ||||
| Bone in | tonne | 6,887 | 6,322 | 7,967 |
| Boneless | tonne | 217,810 | 220,148 | 248,105 |
| Veal | tonne | 6,880 | 7,004 | 7,621 |
| Lamb— | ||||
| Carcasses* | tonne (000) | 24,797 | 332,334 | 355,244 |
| Boneless or cuts | tonne | 70,615 | 64,794 | 76,903 |
| Mutton† | tonne | 91,603 | 119,752 | 73,505 |
| Other meat and edible offals | tonne | 46,651 | 53,871 | 56,655 |
| Milk and cream— | ||||
| Condensed and evaporated | tonne | 1,540 | 1,031 | 890 |
| Skimmed milk powder | tonne | 163,433 | 135,032 | 144,183 |
| Other dried | tonne | 92,043 | 117,903 | 117,523 |
| Other kinds | litre (000) | 8,952 | 10,309 | 9,576 |
| Butter | tonne | 203,058 | 199,617 | 227,766 |
| Cheese | tonne | 80,480 | 81,048 | 75,439 |
| Fish, fresh, chilled or frozen | tonne | 85,576 | 79,436 | 80,931 |
| Crayfish, fresh and simply preserved | tonne | 2,527 | 2,375 | 2,585 |
| Barley, unmilled | tonne | 51,559 | 22,523 | 17,200 |
| Maize, unmilled | tonne | 22,472 | 9,780 | 54,132 |
| Fruit and vegetables— | ||||
| Apples, fresh, whole fruit | tonne | 99,530 | 96,435 | 91,636 |
| Kiwifruit, fresh | tonne | 17,895 | 20,221 | 29,366 |
| Potatoes, fresh | tonne | 12,459 | 13,692 | 12,877 |
| Peas— | ||||
| Dry, including split | tonne | 35,771 | 26,231 | 32,294 |
| For sowing | tonne | 10,208 | 8,649 | 8,016 |
| Frozen | tonne | 11,826 | 13,890 | 11,702 |
| Onions, fresh | tonne | 46,511 | 47,492 | 50,839 |
| Vegetables, frozen, excluding peas | tonne | 11,004 | 12,530 | 9,280 |
| Chocolate and preparations | tonne | 7,234 | 8,242 | 7,814 |
| Feeding stuff for animals— | ||||
| Lucerne meal and pellets | tonne | 15,037 | 12,737 | 250 |
| Meals of meat, fish, etc. | tonne | 60,990 | 92,153 | 98,449 |
| Poultry mash and pellets | tonne | 4,285 | 7,248 | 2,452 |
| Other kinds | tonne | 28,667 | 25,686 | 69,442 |
| Margarine and shortening | tonne | 9,620 | 9,928 | 10,260 |
| Hides, skins, and furskins, raw— | ||||
| Cattle hides | (000) | 994 | 973 | 979 |
| Calf and kip skins | (000) | 921 | 1,013 | 985 |
| Sheep and lamb skins in fleece | (000) | 3,944 | 4,595 | 3,985 |
| Lamb pelts | (000) | 23,442 | 21,910 | 24,219 |
| Sheep pelts | (000) | 7,601 | 8,651 | 8,385 |
| Oppossum skins | (000) | 2,741 | 2,032 | 1,427 |
| Sawlogs and veneer logs, conifer | cu metre | 848,112 | 433,605 | 423,639 |
| Timber, sawn, sliced, or peeled— | ||||
| Douglas fir | cu metre | 61,069 | 31,518 | 25,810 |
| Pinus radiata | cu metre | 332,598 | 333,711 | 308,007 |
| Wood pulp— | ||||
| Mechanical | tonne | 288,388 | 194,325 | 238,110 |
| Sulphate, not dissolving grades | tonne | 226,768 | 227,280 | 213,097 |
| Wool†— | ||||
| Greasy | tonne | 134,357 | 125,431 | 147,247 |
| Slipe | tonne | 18,975 | 18,893 | 24,075 |
| Scoured | tonne | 136,156 | 137,244 | 150,889 |
| Iron ore and concentrates | tonne (000) | 2,820 | 2,706 | 2,355 |
| Sausage casings, natural | hank (000) | 7,800 | 7,873 | 8,759 |
| Clover and grass seeds | tonne | 6,618 | 6,923 | 8,764 |
| Petroleum products— | ||||
| Distillate fuel | litre (000) | 51,658 | 23 | 109 |
| Residual fuel oil | litre (000) | 202,661 | – | – |
| Tallow, inedible | tonne | 104,679 | 105,352 | 113,080 |
| Casein | tonne | 42,617 | 44,626 | 45,476 |
| Caseinates | tonne | 4,859 | 6,248 | 8,424 |
| Newsprint | tonne | 230,974 | 199,000 | 116,075 |
| Kraft paper and kraft cardboard | tonne | 85,290 | 95,805 | 104,379 |
| Yarn of wool or hair | tonne | 5,781 | 5,342 | 4,518 |
| Carpets and carpeting | sq m (000) | 2,444 | 2,724 | 3,068 |
| Iron or steel— | ||||
| Bars, rods, angles, etc. | tonne | 30,922 | 9,926 | 7,937 |
| Universals, plates and sheets | tonne | 33,543 | 28,073 | 20,553 |
| Aluminium, unwrought | tonne | 135,283 | 115,066 | 162,613 |
| Finished structural parts and structures, n.e.s., of metal | tonne | 4,517 | 3,960 | 5,026 |
| Domestic electric refrigerators and freezers | No. | 88,107 | 84,008 | 59,152 |
The values of the principal exports are given in the following table.
| Commodity (New Zealand Produce) | Year Ended June | ||
|---|---|---|---|
| 1981 | 1982 | 1983 | |
* Exports of petroleum products are largely bunkering fuels which from 1982 are categorised under non-merchandise trade. †Includes parts. n.e.s.—not elsewhere specified. | |||
| $(000) | |||
| Racehorses | 26,879 | 32,317 | 37,080 |
| Meat, fresh, chilled or frozen— | |||
| Beef— | |||
| Bone in | 2,761 | 22,630 | 31,726 |
| Boneless | 543,942 | 578,361 | 736,371 |
| Veal | 20,145 | 18,928 | 23,491 |
| Lamb— | |||
| Carcasses | 591,378 | 539,547 | 694,139 |
| Boneless or cuts | 154,763 | 170,840 | 198,139 |
| Mutton | 108,074 | 145,832 | 88,780 |
| Other meat and edible offals | 68,984 | 75,424 | 82,801 |
| Milk and cream— | |||
| Condensed and evaporated | 2,942 | 3,137 | 2,851 |
| Skimmed milk powder | 168,565 | 178,920 | 191,264 |
| Other dried | 130,945 | 211,025 | 226,030 |
| Other kinds | 9,755 | 13,341 | 14,023 |
| Butter | 398,004 | 556,423 | 657,656 |
| Cheese | 137,714 | 181,465 | 193,528 |
| Fish, fresh, chilled or frozen | 100,763 | 111,595 | 146,151 |
| Crayfish, fresh and simply preserved | 31,879 | 41,386 | 48,627 |
| Barley, unmilled | 8,771 | 4,063 | 3,182 |
| Maize, unmilled | 3,330 | 2,363 | 9,903 |
| Fruit and vegetables— | |||
| Apples, fresh, whole fruit | 47,297 | 52,021 | 59,323 |
| Kiwifruit, fresh | 41,788 | 52,712 | 86,827 |
| Potatoes, fresh | 3,124 | 3,356 | 3,268 |
| Peas— | |||
| Dry, including split | 14,169 | 14,674 | 20,444 |
| For sowing | 3,697 | 3,957 | 4,720 |
| Frozen | 6,805 | 10,807 | 10,333 |
| Onions, fresh | 15,674 | 16,560 | 7,785 |
| Vegetables, frozen, excluding peas | 8,513 | 12,658 | 10,354 |
| Chocolate and preparations | 12,666 | 18,714 | 18,796 |
| Feeding stuff for animals— | |||
| Lucerne meal and pellets | 2,462 | 1,956 | 76 |
| Meals of meat, fish, etc. | 20,254 | 28,239 | 33,346 |
| Poultry mash and pellets | 1,112 | 2,457 | 885 |
| Other kinds | 15,332 | 24,912 | 69,317 |
| Margarine and shortening | 19,135 | 23,498 | 23,662 |
| Hides, skins, and furskins, raw— | |||
| Cattle hides | 26,386 | 29,656 | 34,106 |
| Calf and kip skins | 7,229 | 10,008 | 12,112 |
| Sheep and lamb skins in fleece | 11,941 | 14,881 | 13,132 |
| Lamb pelts | 43,760 | 58,254 | 81,127 |
| Sheep pelts | 19,970 | 25,080 | 35,371 |
| Opossum skins | 19,840 | 13,907 | 7,898 |
| Sawlogs and veneer logs, conifer | 56,022 | 26,889 | 27,319 |
| Timber, sawn, sliced, or peeled— | |||
| Douglas fir | 9,061 | 5,493 | 4,906 |
| Pinus radiata | 41,766 | 42,518 | 41,449 |
| Wood pulp— | |||
| Mechanical | 55,059 | 46,826 | 66,693 |
| Sulphate, not dissolving grades | 96,200 | 108,913 | 94,734 |
| Wool— | |||
| Greasy | 362,693 | 363,572 | 415,932 |
| Slipe | 47,204 | 51,226 | 63,952 |
| Scoured | 482,705 | 504,044 | 537,218 |
| Iron ore and concentrates | 27,594 | 31,951 | 35,770 |
| Sausage casings, natural | 46,807 | 48,649 | 50,481 |
| Clover and grass seeds | 11,575 | 14,850 | 21,133 |
| Petroleum products*— | |||
| Distillate fuel | 15,933 | 43 | 92 |
| Residual fuel oil | 39,793 | – | – |
| Tallow, inedible | 46,732 | 51,716 | 56,207 |
| Plastic materials, regenerated cellulose, artificial resins | 19,096 | 24,318 | 19,080 |
| Casein | 117,235 | 141,960 | 162,102 |
| Caseinates | 16,492 | 21,464 | 32,759 |
| Leather— | |||
| Bovine and equine, including calf | 27,848 | 35,696 | 52,458 |
| Lamb skin | 19,311 | 22,620 | 35,939 |
| Furs, dressed or dressed and dyed | 6,430 | 5,636 | 5,642 |
| Woodchips, softwood | 15,979 | 19,460 | 22,098 |
| Newsprint paper | 99,242 | 110,572 | 61,228 |
| Kraft paper and kraft cardboard | 39,986 | 51,376 | 51,491 |
| Articles of pulp, paper or paperboard | 15,592 | 18,892 | 20,015 |
| Yarn of wool or hair | 41,947 | 45,327 | 41,655 |
| Carpets, carpeting and rugs | 40,480 | 55,038 | 59,498 |
| Iron or steel— | |||
| Bars, rods, angles, etc. | 11,444 | 4,514 | 3,706 |
| Universal, plates, and sheets | 15,874 | 17,355 | 14,901 |
| Aluminium, unwrought | 204,569 | 182,285 | 275,306 |
| Finished structural parts and structures, n.e.s, of metal | 10,107 | 10,867 | 15,733 |
| Tools for use in the hand or in machines | 6,285 | 9,801 | 10,331 |
| Agricultural machinery and implements† | 25,884 | 29,560 | 28,809 |
| Textile and leather machinery | 4,982 | 4,871 | 3,085 |
| Electric power machinery and switchgear | 16,913 | 18,930 | 15,364 |
| Domestic electric equipment— | |||
| Refrigerators and freezers | 20,544 | 23,071 | 18,920 |
| Other† | 13,045 | 18,579 | 17,023 |
| Road motor vehicles† | 27,340 | 28,377 | 17,819 |
| Aircraft† | 8,864 | 2,886 | 1,307 |
| Ships and boats† | 11,157 | 9,079 | 11,939 |
| Clothing, excluding fur clothing | 30,664 | 35,303 | 33,430 |
| Printed matter | 17,094 | 28,389 | 30,607 |
| Prams, toys, games, sporting goods | 6,251 | 8,964 | 9,966 |
In the following table exports (excluding re-exports) are summarised according to the sections and divisions of the Standard International Trade Classification (Revision 2). Minor changes in the way data were compiled during 1982 for non-merchanise trade for bunkering and ships stores, have resulted in some discrepancies between figures for 1982 and previous years.
| EXPORTS OF NEW ZEALAND PRODUCE | |||
|---|---|---|---|
| Section and Division | Year Ended June | ||
| 1981 | 1982 | 1983 | |
* Exports of petroleum products are largely bunkering fuels, which from 1982 are categorised under non-merchandise trade. n.e.s.—not elsewhere specified. | |||
| $(000) | |||
| 0 Food and Live Animals Chiefly for Food | |||
| 00 Live animals chiefly for food | 34,145 | 53,015 | 60,301 |
| 01 Meat and meat preparations | 1,520,865 | 1,564,137 | 1,870,711 |
| 02 Dairy products and birds' eggs | 853,468 | 1,149,835 | 1,291,015 |
| 03 Fish, crustaceans, and molluscs, and preparations thereof | 178,322 | 230,266 | 285,470 |
| 04 Cereals and cereal preparations | 20,288 | 18,385 | 33,068 |
| 05 Vegetables and fruit | 170,017 | 215,086 | 261,638 |
| 06 Sugar, sugar preparations, and honey | 12,172 | 13,513 | 12,468 |
| 07 Coffee, tea, cocoa, spices, and manufactures thereof | 14,250 | 20,388 | 20,687 |
| 08 Feeding stuff for animals (not including unmilled cereals) | 39,160 | 57,564 | 103,623 |
| 09 Miscellaneous edible products and preparations | 27,722 | 33,305 | 35,953 |
| Total, section 0 | 2,870,409 | 3,355,495 | 3,974,936 |
| 1 Beverages and Tobacco | |||
| 11 Beverages | 9,064 | 10,476 | 10,227 |
| 12 Tobacco and tobacco manufactures | 3,999 | 3,238 | 3,720 |
| Total, section 1 | 13,063 | 13,714 | 13,948 |
| 2 Crude Materials, Inedible, Except Fuels | |||
| 21 Hides, skins, and furskins, raw | 129,856 | 152,888 | 185,213 |
| 22 Oil seeds and oleaginous fruit | 341 | 398 | 294 |
| 23 Crude rubber (including synthetic and reclaimed) | 137 | 100 | 131 |
| 24 Cork and wood | 135,640 | 107,733 | 100,252 |
| 25 Pulp and waste paper | 151,819 | 156,410 | 161,728 |
| 26 Textile fibres (other than wool tops) and their wastes | 894,496 | 920,834 | 1,020,482 |
| 27 Crude fertilisers and crude minerals (excluding coal, etc.) | 2,203 | 3,187 | 4,166 |
| 28 Metalliferous ores and metal scrap | 34,430 | 37,094 | 43,361 |
| 29 Crude animal and vegetable materials, n.e.s. | 86,613 | 95,361 | 107,152 |
| Total, section 2 | 1,435,534 | 1,474,006 | 1,622,779 |
| 3 Mineral Fuels, Lubricants, and Related Materials | |||
| 32 Coal coke, and briquettes | 11,961 | 13,219 | 19,568 |
| 33 Petroleum, petroleum products, and related materials* | 58,048 | 2,023 | 2,671 |
| 34 Gas, natural and manufactured | 2 | 1 | 3 |
| Total, section 3 | 70,011 | 15,242 | 22,241 |
| 4 Animal and Vegetable Oils, Fats, and Waxes | |||
| 41 Animal oils and fats | 48,827 | 54,098 | 59,358 |
| 42 Fixed vegetable oils and fats | 468 | 709 | 889 |
| 43 Animal and vegetable oils and fats, processed, and waxes of animal or vegetable origin | 509 | 1,366 | 228 |
| Total, section 4 | 49,804 | 56,173 | 60,475 |
| 5 Chemicals and Related Products n.e.s | |||
| 51 Organic chemicals | 3,707 | 4,822 | 3,314 |
| 52 Inorganic chemicals | 1,563 | 2,062 | 3,777 |
| 53 Dyeing, tanning, and colouring materials | 7,042 | 7,776 | 9,406 |
| 54 Medicinal and pharmaceutical products | 14,145 | 22,218 | 24,949 |
| 55 Essential oils and perfumes, etc. | 13,469 | 19,246 | 25,746 |
| 56 Fertilisers, manufactured | 937 | 1,172 | 1,342 |
| 57 Explosives and pryotechnic products | 476 | 900 | 605 |
| 58 Artificial resins and plastic materials, and cellulose esters and ethers | 19,096 | 24,318 | 19,080 |
| 59 Chemical materials and products, n.e.s. | 155,900 | 192,141 | 221,371 |
| Total, section 5 | 216,337 | 274,655 | 307,589 |
| 6 Manufactured Goods Classified by Material | |||
| 61 Leather, leather manufactures, n.e.s., and dressed furskins | 56,090 | 66,247 | 96,255 |
| 62 Rubber manufactures, n.e.s. | 15,660 | 18,554 | 18,687 |
| 63 Cork and wood manufactures (excluding furniture) | 61,945 | 69,703 | 69,175 |
| 64 Paper, paperboard, and articles of paper pulp, of paper, or of paperboard | 176,706 | 209,203 | 163,960 |
| 65 Textile yarn, fabrics, made-up articles, n.e.s., and related products | 103,723 | 123,064 | 126,748 |
| 66 Non-metallic mineral manufactures, n.e.s. | 31,119 | 38,243 | 40,508 |
| 67 Iron and steel | 44,925 | 50,789 | 47,354 |
| 68 Non-ferrous metals | 226,730 | 214,736 | 302,810 |
| 69 Manufactures of metal, n.e.s. | 73,677 | 89,321 | 101,422 |
| Total, section 6 | 790,574 | 879,859 | 966,919 |
| 7 Machinery and Transport Equipment | |||
| 71 Power generating machinery and equipment | 4,303 | 4,594 | 3,983 |
| 72 Machinery specialised for particular industries | 46,839 | 56,205 | 50,750 |
| 73 Metalworking machinery | 4,894 | 4,552 | 3,717 |
| 74 General industrial machinery and equipment, n.e.s., and machine parts, n.e.s. | 37,898 | 52,924 | 53,244 |
| 75 Office machines and automatic data processing equipment | 317 | 492 | 1,097 |
| 76 Telecommunications, sound recording and reproducing apparatus and equipment | 9,628 | 13,144 | 13,891 |
| 77 Electrical machinery, apparatus and appliances, n.e.s., and parts thereof | 72,112 | 83,850 | 74,380 |
| 78 Road vehicles (including air-cushion vehicles) | 30,046 | 30,543 | 20,048 |
| 79 Other transport equipment | 20,350 | 12,092 | 13,370 |
| Total, section 7 | 226,387 | 258,395 | 234,479 |
| 8 Miscellaneous Manufactured Articles | |||
| 81 Sanitary, plumbing, heating, etc., fixtures and fittings n.e.s. | 2,128 | 3,032 | 1,973 |
| 82 Furniture and parts thereof | 21,161 | 25,892 | 23,061 |
| 83 Travel goods, handbags, and similar containers | 3,022 | 3,100 | 2,870 |
| 84 Articles of apparel and clothing accessories | 45,903 | 53,977 | 57,558 |
| 85 Footwear | 5,028 | 7,334 | 7,698 |
| 87 Professional, scientific, and controlling instruments and apparatus, n.e.s | 5,628 | 7,617 | 9,747 |
| 88 Photographic apparatus, optical goods, watches and clocks | 2,012 | 2,370 | 3,636 |
| 89 Miscellaneous manufactured articles, n.e.s. | 70,373 | 95,451 | 112,234 |
| Total, section 8 | 155,256 | 198,773 | 218,778 |
| 9 Commodities and Transactions Not Classified Elsewhere in the S.I.T.C. | |||
| 94 Live animals, n.e.s. | 146 | 286 | 444 |
| 95 Arms of war and ammunition, etc. | 27 | 110 | 35 |
| 96 Coins (other than gold coins) not being legal tender in New Zealand | – | – | – |
| 97 Gold, non-monetary | 2,483 | 1,091 | 5,085 |
| Total, section 9 | 2,656 | 1,487 | 5,564 |
| Total New Zealand produce exports | 5,830,031 | 6,527,799 | 7,427,708 |
| Re-exports | 235,245 | 205,992 | 266,611 |
| Grand total, merchandise exports | 6,065,277 | 6,733,791 | 7,694,319 |
The principal destinations of New Zealand's exports of merchandise (including re-exports) are given in the table below. It should be noted that Australia includes Cocos, Norfolk Island, and (from 1980) Christmas Island. The United States includes American Samoa, Guam, Pacific Islands Trust Territory, Panama Canal Zone (until 1980), Puerto Rico, U.S. Virgin Islands and miscellaneous U.S. Pacific Islands.
| Country | Year Ended June | |||||
|---|---|---|---|---|---|---|
| 1978 | 1979 | 1980 | 1981 | 1982 | 1983 | |
| * Including destination optional. | ||||||
| $(million) | ||||||
| Australia | 412.6 | 501.2 | 634.1 | 817.9 | 1,031.7 | 953.2 |
| Canada | 73.5 | 101.4 | 98.0 | 132.3 | 128.8 | 163.3 |
| France | 72.6 | 94.5 | 126.7 | 94.7 | 107.3 | 143.0 |
| Germany, Fed. Rep. of | 90.6 | 102.5 | 116.2 | 149.5 | 123.5 | 135.3 |
| Iran | 70.0 | 24.4 | 129.6 | 243.1 | 103.7 | 356.0 |
| Japan | 435.6 | 600.6 | 635.2 | 785.0 | 876.1 | 1,062.4 |
| Netherlands | 73.9 | 65.7 | 84.2 | 94.5 | 89.3 | 94.2 |
| United Kingdom | 595.2 | 676,7 | 714.9 | 760.2 | 962.5 | 990.1 |
| United States | 439.0 | 632.2 | 721.4 | 796.4 | 853.0 | 1,170.4 |
| U.S.S.R. | 81.0 | 129.1 | 250.9 | 225.9 | 361.7 | 344.8 |
| Other countries* | 903.3 | 1,056.9 | 1,511.2 | 1,815.6 | 2,096.0 | 2,281.6 |
| Total merchandise exports | 3,247.4 | 3,985.2 | 5,022.5 | 5,915.1 | 6,733.8 | 7,694.3 |
The statistics quoted in the foregoing table indicate the destination of New Zealand exports as recorded on the Customs documents. In some instances the ultimate destination of exports is not known at the time of export, such goods being entered as exported to the country to which they are being shipped. This applies more particularly to wool, considerable quantities of which are shipped to the United Kingdom, and subsequently re-exported to the Continent. It should be observed, however, that in all instances where the final destination is known at the time of export, the exports are credited to that destination in the New Zealand trade statistics.
ASEAN and ESCAP—In recent decades there has been a steady growth in New Zealand's relations with the countries of the Asian-Pacific area. This country enjoys a close relationship with the countries which make up the Association of South-east Asian Nations (ASEAN) and the Economic and Social Commission for Asia and the Pacific (ESCAP).
The following table shows the total value of merchandise exported to and imported from these two regions. These figures are based on the ESCAP countries, with the ASEAN member countries indicated.
| Country | Year Ended June 1982 | Year Ended June 1983 | ||||
|---|---|---|---|---|---|---|
| Exports*f.o.b. | Imports v.f.d. | Imports c.i.f. | Exports*f.o.b. | Imports v.f.d.† | Imports c.i.f. | |
* Includes re-exports. †v.f.d.—Value for Duty. ‡ASEAN member countries. | ||||||
| $(000) | ||||||
| Afghanistan | 1 | 109 | 114 | 7 | 113 | 105 |
| Australia | 1,031,743 | 1,400,519 | 1,416,924 | 953,207 | 1,367,934 | 1,483,048 |
| Bangladesh | 1,401 | 4,396 | 5,370 | 1,110 | 4,440 | 5,257 |
| Brunei | 321 | 12,774 | 12,913 | 892 | 14 | 15 |
| Burma | 2,525 | 307 | 339 | 11 | 177 | 195 |
| China, People's Rep. of | 122,397 | 48,002 | 54,538 | 177,178 | 48,863 | 54,567 |
| Cook Islands | 15,572 | 4,651 | 5,828 | 17,822 | 5,093 | 6,280 |
| Fiji | 91,715 | 22,493 | 23,668 | 103,863 | 29,687 | 30,423 |
| Kiribati | 1,846 | 28 | 28 | 3,198 | 7 | 7 |
| Hong Kong | 95,600 | 89,974 | 98,429 | 92,322 | 97,097 | 104,859 |
| India | 60,912 | 33,918 | 38,136 | 45,611 | 29,567 | 32,759 |
| Indonesia‡ | 99,282 | 303,407 | 316,267 | 99,608 | 271,546 | 282,074 |
| Iran | 103,709 | 166 | 174 | 355,999 | 213 | 221 |
| $(000) | ||||||
| Japan | 876,067 | 1,199,913 | 1,395,910 | 1,062,423 | 1,165,997 | 1,280,108 |
| Korea, Republic of | 104,080 | 53,416 | 57,056 | 102,802 | 100,594 | 111,965 |
| Malaysia‡ | 102,450 | 36,581 | 41,130 | 113,202 | 34,049 | 37,984 |
| Maldives | 142 | – | – | – | – | – |
| Mongolia | – | 9 | 10 | – | 15 | 15 |
| Nauru | 1,095 | 30,326 | 43,818 | 900 | 35,083 | 50,958 |
| Nepal | 595 | 163 | 204 | 387 | 96 | 112 |
| New Zealand (Re-imports) | 9,247 | 9,856 | 14,029 | 14,590 | ||
| Niue | 2,945 | 519 | 821 | 2,708 | 546 | 585 |
| Pacific Islands Trust Territory | 329 | – | – | 697 | – | – |
| Pakistan | 18,967 | 3,870 | 4,079 | 37,796 | 4,520 | 4,923 |
| Papua New Guinea | 70,029 | 6,442 | 7,062 | 79,286 | 7,230 | 7,610 |
| Philippines‡ | 98,886 | 8,346 | 10,198 | 90,318 | 9,676 | 11,931 |
| Samoa, Western | 20,508 | 5,286 | 6,707 | 17,092 | 4,151 | 5,271 |
| Singapore‡ | 97,319 | 278,813 | 298,599 | 138,522 | 395,062 | 418,744 |
| Solomon Islands | 6,129 | 1,561 | 1,869 | 7,111 | 1,024 | 1,235 |
| Sri Lanka | 6,181 | 6,955 | 9,402 | 12,922 | 8,234 | 9,410 |
| Thailand‡ | 45,161 | 16,477 | 17,700 | 45,070 | 12,726 | 14,500 |
| Tonga | 17,011 | 2,711 | 3,463 | 18,114 | 2,849 | 3,500 |
| Tuvalu | 1,156 | 16 | 16 | 418 | 3 | 3 |
| Vanuatu | 4,680 | 5 | 5 | 6,150 | 4 | 4 |
| Viet Nam, Socialist Rep. of | – | 46 | 52 | 598 | 49 | 55 |
| Total | 3,100,755 | 3,581,447 | 3,880,683 | 3,587,344 | 3,650,688 | 3,973.313 |
Oceania—Exports to the countries of Oceania have increased substantially in recent years. In 1975 the total was $54.0 million compared with $314.9 million in 1983. Fiji is the principal importer of New Zealand's exports to Oceania, taking over 30 percent of the total each year.
From July 1980 the Cook Islands, Niue, and Tokelau are included in Oceania. Previously, trade figures were collected separately and not included in New Zealand external trade data.
The following table shows the increase in value of total exports over the past 5 years.
| Country | Year Ended June | |||
|---|---|---|---|---|
| 1980 | 1981 | 1982 | 1983 | |
| $(000) | ||||
| Canton and Enderbury Islands | – | – | – | – |
| Cook Islands | 3,943 | 15,572 | 17,822 | |
| Fiji | 71,142 | 86,653 | 91,715 | 103,863 |
| French Polynesia | 22,130 | 27,977 | 30,515 | 37,844 |
| Kiribati | 875 | 1,086 | 1,846 | 3,198 |
| Nauru | 1,178 | 1,535 | 1,095 | 900 |
| New Caledonia | 14,620 | 18,256 | 20,427 | 19,539 |
| Niue | 3,159 | 2,945 | 2,708 | |
| Papua New Guinea | 35,914 | 57,447 | 70,029 | 79,286 |
| Pitcairn Island | 114 | 88 | 64 | 474 |
| Samoa, Western | 18,731 | 20,033 | 20,508 | 17,092 |
| Solomon Islands | 4,912 | 7,095 | 6,129 | 7,111 |
| Tokelau | 18 | 56 | 28 | |
| Tonga | 10,397 | 12,859 | 17,011 | 18,114 |
| Tuvalu | 116 | 133 | 1,156 | 418 |
| Vanuatu | 4,353 | 3,841 | 4,680 | 6,150 |
| Wallis and Futuna Islands | 126 | 228 | 184 | 335 |
| Total | 184,609 | 244,353 | 283,933 | 314,882 |
DESTINATION OF MAIN EXPORTS—The table which follows shows quantities and values of the principal exports of New Zealand produce sent to various destinations during the latest available June years. Note: Australia includes Cocos, Norfolk Island, and Christmas Island. The United States includes American Samoa, Guam, Pacific Islands Trust Territory, Puerto Rico, U.S. Virgin Islands, and U.S. miscellaneous Pacific islands.
| Country to Which Exported | June Year 1981 | June Year 1982 | June Year 1983 | |||
|---|---|---|---|---|---|---|
| Quantity | Value | Quantity | Value | Quantity | Value | |
* For 1981, weights for wool are accumulated, six months net weight and six months gross weight (which was introduced for cargo data). While this should be noted, some analyses have shown insignificant variations in the respective weights. †Excludes Province of Taiwan. | ||||||
| Wool (Greasy. Slipe. and Scoured)* | ||||||
| tonnes | $(000) | tonnes | $(000) | tonnes | $(000) | |
| Australia | 8,127 | 30,131 | 10,075 | 39,043 | 7,996 | 30,249 |
| Belgium | 8,438 | 24,515 | 9,548 | 30,420 | 12,714 | 38,190 |
| Canada | 2,280 | 7,863 | 2,280 | 8,503 | 1,890 | 6,854 |
| China† | 33,701 | 96,834 | 27,456 | 84,571 | 39,502 | 116,463 |
| China, Province of Taiwan | 2,496 | 8,946 | 4,121 | 15,370 | 6,305 | 22,142 |
| Czechoslovakia | 4,443 | 11,742 | 3,669 | 10,276 | 4,903 | 13,224 |
| Egypt | 2,742 | 8,495 | 3,446 | 11,777 | 3,329 | 11,398 |
| France | 20,655 | 56,288 | 18,825 | 54,657 | 15,658 | 45,383 |
| Germany, Democratic Republic of | 1,074 | 2,394 | 336 | 1,034 | 284 | 756 |
| Germany, Federal Republic of | 16,850 | 55,284 | 14,547 | 50,056 | 14,336 | 45,999 |
| Greece | 7,996 | 29,266 | 7,628 | 29,847 | 7,065 | 26,340 |
| Hong Kong | 2,656 | 9,962 | 3,109 | 12,745 | 3,572 | 13,494 |
| India | 1,547 | 4,508 | 2,654 | 8,568 | 3,435 | 11,946 |
| Iran | 19,082 | 70,726 | 6,365 | 24,310 | 16,982 | 68,651 |
| Ireland | 2,026 | 6,235 | 1,572 | 4,466 | 2,017 | 5,392 |
| Italy | 11,782 | 39,517 | 12,495 | 45,619 | 10,479 | 35,303 |
| Japan | 22,553 | 72,609 | 36,258 | 121,550 | 33,797 | 111,285 |
| Korea, Republic of | 4,923 | 18,709 | 7,763 | 30,179 | 6,493 | 25,836 |
| Netherlands | 19,145 | 57,846 | 18,352 | 56,083 | 22,042 | 65,544 |
| Pakistan | 3,035 | 12,150 | 2,795 | 11,349 | 8,374 | 32,108 |
| Poland | 4,574 | 11,352 | 1,807 | 5,156 | 2,967 | 8,427 |
| Portugal | 950 | 2,688 | 795 | 2,406 | 601 | 1,884 |
| Spain | 1,760 | 4,742 | 1,531 | 4,769 | 1,027 | 3,342 |
| U.S.S.R. | 33,458 | 89,134 | 31,046 | 87,702 | 34,828 | 94,547 |
| United Kingdom | 30,064 | 86,529 | 33,271 | 98,710 | 41,590 | 115,385 |
| United States of America | 10,081 | 30,788 | 9,061 | 29,576 | 9,938 | 31,398 |
| Yugoslavia | 5,238 | 15,529 | 2,715 | 8,789 | 1,782 | 5,385 |
| Other countries | 7,813 | 27,820 | 8,050 | 31,311 | 8,305 | 30,176 |
| Total | 289 488 | 892,602 | 281 568 | 918,842 | 322 211 | 1,017,101 |
| Country to Which Exported | June Year 1981 | June Year 1982 | June Year 1983 | |||
|---|---|---|---|---|---|---|
| Quantity | Value | Quantity | Value | Quantity | Value | |
| Beef and Veal (Fresh, Chilled, or Frozen) | ||||||
| tonnes | $(000) | tonnes | $(000) | tonnes | $(000) | |
| Australia | 2,252 | 7,270 | 1,881 | 6,268 | 3,846 | 13,407 |
| Bahrain | 622 | 2,668 | 744 | 3,434 | 878 | 4,554 |
| Bermuda | 627 | 2,146 | 853 | 2,908 | 681 | 2,618 |
| Canada | 26,169 | 66,959 | 23,602 | 61,565 | 28,125 | 83,952 |
| China, Province of Taiwan | 583 | 2,278 | 762 | 3,842 | 1,707 | 6,854 |
| Cyprus | 391 | 1,407 | 495 | 1,613 | 512 | 1,490 |
| Fiji | 206 | 653 | 382 | 1,260 | 236 | 1,061 |
| French Polynesia | 3,264 | 10,458 | 2,879 | 10,350 | 2,451 | 10,843 |
| Hong Kong | 2,557 | 12,576 | 2,822 | 14,672 | 2,759 | 14,775 |
| Japan | 5,580 | 19,991 | 6,085 | 21,995 | 7,765 | 31,719 |
| Jordan | 571 | 1,670 | – | – | – | – |
| Kuwait | 97 | 253 | 379 | 1,326 | 308 | 1,254 |
| Malaysia | 319 | 1,708 | 513 | 2,403 | 235 | 1,343 |
| Malta | 190 | 834 | 93 | 587 | 5 | 38 |
| New Caledonia | 400 | 1,860 | 423 | 2,237 | 393 | 2,164 |
| Papua New Guinea | 1,260 | 2,211 | 1,787 | 3,117 | 2,722 | 5,010 |
| Philippines | 563 | 2,664 | 483 | 2,646 | 507 | 3,082 |
| Saudi Arabia | 1,307 | 5,041 | 1,524 | 6,516 | 1,979 | 9,434 |
| Singapore | 2,505 | 12,072 | 3,022 | 15,143 | 3,399 | 16,415 |
| Trinidad and Tobago | 1,413 | 3,936 | 1,916 | 4,864 | 2,295 | 7,072 |
| U.S.S.R. | – | 1 | 3 | 8 | 1 | 6 |
| United Arab Emirates | 954 | 4,441 | 1,246 | 6,036 | 946 | 5,085 |
| United Kingdom | 7,361 | 21,604 | 4,453 | 13,900 | 2,173 | 6,915 |
| United States of America | 169,436 | 392,353 | 173,216 | 419,220 | 194,268 | 540,099 |
| Other countries | 2 952x | 9,793x | 3 911x | 14,010x | 5,502 | 22,398 |
| Total | 231 578 | 586,849 | 233 474 | 619,920 | 263 693 | 791,588 |
| Lamb (Fresh, Chilled or Frozen)* | ||||||
| tonnes | $(000) | tonnes† | $(000) | tonnes | $(000) | |
| Algeria | – | – | 2,060 | 4,120 | 5,248 | 11,757 |
| Belgium | 1,491 | 3,621 | 1 736x | 5,881 | 1,546 | 4,389 |
| Canada | 10,562 | 24,524 | 7,334 | 20,258 | 10,665 | 30,568 |
| Cyprus | 1,351 | 2,378 | 681x | 1,478 | 1,138 | 2,277 |
| Denmark | 995 | 2,447 | 1 297x | 3,506 | 1,263 | 3,307 |
| Fiji | 2,895 | 3,161 | 2,059 | 3,255 | 2,893 | 4,335 |
| France | 1,947 | 6,055 | 3 573x | 13,410 | 3,781 | 14,412 |
| French Polynesia | 553 | 1,415 | 545x | 1,649 | 542 | 1,610 |
| Germany, Federal Republic of | 7,026 | 15,511 | 5 346x | 14,030 | 4,594 | 13,859 |
| Greece | 9,579 | 19,635 | 7 415x | 16,533 | 8,490 | 19,954 |
| Iran | 91,506 | 168,811 | 37 677x | 76,813 | 142,380 | 286,395 |
| Iraq | 24,999 | 52,748 | 15 112x | 28,297 | 11 | 23 |
| Italy | 4,198 | 9,149 | 3 806x | 10,194 | 3,570 | 8,562 |
| Japan | 18,427 | 32,842 | 16 859x | 35,911 | 15,609 | 30,997 |
| Jordan | 2,463 | 5,361 | 2 | 9 | 2,438 | 4,943 |
| Netherlands | 628 | 1,333 | 1 773x | 4,693 | 1,937 | 4,109 |
| Oman | 1,076 | 2,101 | 1 588x | 3,716 | 1,861 | 4,331 |
| Papua New Guinea | 3,819 | 3,405 | 3 358x | 3,621 | 5,189 | 4,943 |
| Saudi Arabia | 10,403 | 20,592 | 6 809x | 14,607 | 10,417 | 22,447 |
| Singapore | 1,050 | 2,054 | 1 178x | 2,875 | 1,252 | 3,041 |
| Switzerland | 1,509 | 4,280 | 1 058x | 4,719 | 1,073 | 3,980 |
| United Arab Emirates | 1,552 | 3,261 | 1,810 | 4,023 | 1,395 | 3,264 |
| United Kingdom | 178,687 | 312,387 | 188 856x | 392,400 | 187,116 | 368,848 |
| United States of America | 13,951 | 30,978 | 9 877x | 23,779 | 7,438 | 21,323 |
| Other countries | 11 093x | 18,093x | 10 525x | 20,612x | 10,301 | 18,604 |
| Total | 401 760x | 746,140 | 332 334x | 710,387 | 432 147 | 892,278 |
| Country to Which Exported | June Year 1981 | June Year 1982 | June Year 1983 | |||
|---|---|---|---|---|---|---|
| Quantity | Value | Quantity | Value | Quantity | Value | |
* For 1981, weights for lamb and mutton are accumulated, six months net weight and six months gross weight (which was introduced for cargo data). While this should be noted, some analyses have shown insignificant variations in the respective weights. †For 1982, weights for lamb and mutton carcasses were estimated using an imputation method based on gross weights from cargo data. Since then a revised imputation method, designed to give more accurate estimates has been introduced, so the 1982 quantity values have been revised accordingly. Details of the imputation method can be obtained from the Statistical Methods Section of the Department of Statistics, Christchurch. | ||||||
| Mutton (Fresh, Chilled or Frozen)* | ||||||
| tonnes | $(000) | tonnes† | $(000) | tonnes | $(000) | |
| Belgium | 172 | 374 | 75 | 162 | 60 | 97 |
| China, Province of Taiwan | 1,248 | 1,000 | 1 039x | 1,081 | 1,401 | 1,387 |
| Egypt | 4,389 | 4,573 | 205 | 109 | 7 | 9 |
| Fiji | 230 | 264 | 576x | 738 | 204 | 267 |
| France | 83 | 151 | 114x | 240 | 84 | 146 |
| Italy | 86 | 113 | 107 | 131 | 81 | 113 |
| Jamaica | 547 | 590 | 606 | 723 | 588 | 778 |
| Japan | 23,061 | 23,741 | 28 311x | 34,625 | 13,895 | 14,578 |
| Korea, Republic of | 5,538 | 5,147 | 3 850x | 4,163 | 5,414 | 5,179 |
| Kuwait | 229 | 437 | 44 | 110 | 40 | 103 |
| Mauritius | 187 | 264 | 164 | 271 | 34 | 58 |
| Netherlands | 259 | 569 | 1,273 | 2,547 | 379 | 811 |
| Papua New Guinea | 421 | 312 | 970x | 837 | 570 | 566 |
| Peru | 817 | 1,005 | 213 | 247 | 46 | 51 |
| Saudi. Arabia | 2,316 | 3,122 | 587 | 1,394 | 413 | 1,274 |
| United Kingdom | 5,833 | 9,587 | 13 437x | 21,541 | 11,818 | 20,578 |
| U.S.S.R. | 44,144 | 53,753 | 64 220x | 70,876 | 34,040 | 34,270 |
| Other countries | 2,044 | 3,073 | 3 961x | 6,038 | 4,431 | 8,515 |
| Total | 91 603 | 108,074 | 119 752x | 145,832 | 73 505 | 88,780 |
| Other Frozen Meat | ||||||
| tonnes | $(000) | tonnes | $(000) | tonnes | $(000) | |
| Egypt | 1,999 | 1,591 | 662 | 386 | 1,000 | 425 |
| France | 3,896 | 8,398 | 4,607 | 10,067 | 4,748 | 13,933 |
| French Polynesia | 233 | 570 | 159 | 366 | 206 | 489 |
| Germany, Federal Republic of | 1,983 | 9,696 | 1,165 | 4,592 | 1,338 | 5,689 |
| Iran | 481 | 907 | 1,186 | 1,483 | – | – |
| Italy | 332 | 576 | 349 | 741 | 716 | 1,001 |
| Japan | 3,645 | 7,703 | 3,324 | 8,124 | 3,440 | 8,756 |
| Kuwait | 498 | 658 | 266 | 303 | 102 | 140 |
| Netherlands | 956 | 1,542 | 1,470 | 1,989 | 1,489 | 2,331 |
| Peru | 999 | 692 | 488 | 289 | 213 | 132 |
| Saudi Arabia | 1,208 | 1,390 | 1,145 | 1,479 | 2,189 | 3,233 |
| Switzerland | 231 | 734 | 239 | 770 | 198 | 654 |
| United Kingdom | 25,939 | 27,621 | 33,247 | 35,112 | 33,656 | 32,727 |
| United States of America | 408 | 1,077 | 317 | 1,308 | 468 | 1,779 |
| Other countries | 3,843 | 5,831 | 5,246 | 8,416 | 6,892 | 11,512 |
| Total | 46 651 | 68,984 | 53 871 | 75,424 | 56 655 | 82,801 |
| Country to Which Exported | June Year 1981 | June Year 1982 | June Year 1983 | |||
|---|---|---|---|---|---|---|
| Quantity | Value | Quantity | Value | Quantity | Value | |
| * Excludes Province of Taiwan. | ||||||
| Butter | ||||||
| tonnes | $(000) | tonnes | $(000) | tonnes | $(000) | |
| Australia | 1,872 | 2,924 | 410 | 993 | 28 | 105 |
| China, Province of Taiwan | 1,198 | 2,353 | 884 | 2,414 | 879 | 2,693 |
| Fiji | 2,374 | 5,075 | 1,220 | 3,585 | 1,373 | 4,384 |
| French Polynesia | 963 | 2,283 | 1,081 | 3,473 | 959 | 3,533 |
| Hong Kong | 2,977 | 5,617 | 2,483 | 6,559 | 2,439 | 6,430 |
| Indonesia | 10,339 | 19,135 | 6,833 | 21,011 | 6,531 | 21,165 |
| Iran | 426 | 651 | – | – | – | – |
| Iraq | 4,182 | 5,657 | 1,000 | 1,861 | 5,500 | 15,516 |
| Jamaica | 972 | 1,975 | 251 | 616 | 151 | 476 |
| Japan | 203 | 456 | 448 | 1,376 | 2,139 | 6,284 |
| Malaysia | 6,015 | 11,274 | 4,762 | 14,648 | 2,959 | 9,749 |
| Mexico | 7,419 | 15,278 | 1,706 | 5,077 | 505 | 1,503 |
| Nigeria | 1,475 | 2,801 | 1,000 | 2,621 | 376 | 1,218 |
| Oman | 862 | 1,900 | 1,213 | 3,189 | 1,088 | 3,569 |
| Panama, Republic of | 1,274 | 2,120 | 275 | 645 | 15 | 50 |
| Peru | 6,544 | 13,742 | 7,632 | 24,335 | 8,417 | 26,971 |
| Philippines | 5,524 | 10,653 | 4,135 | 12,517 | 2,915 | 9,387 |
| Poland | 3,500 | 5,854 | – | – | – | – |
| Saudi Arabia | 1,112 | 2,633 | 2,165 | 8,144 | 1,285 | 4,598 |
| Singapore | 5,141 | 10,011 | 2,469 | 6,908 | 1,903 | 5,529 |
| Thailand | 3,078 | 5,801 | 2,316 | 6,861 | 1,005 | 3,226 |
| Trinidad and Tobago | 1,048 | 2,125 | 1,218 | 3,135 | 1,325 | 4,223 |
| U.S.S.R. | 34,318 | 54,652 | 51,850 | 131,930 | 70,710 | 191,530 |
| United Arab Emirates | 2,040 | 4,860 | 1,740 | 5,498 | 1,461 | 5,141 |
| United Kingdom | 88,884 | 188,132 | 93,530 | 264,152 | 103,292 | 295,704 |
| United States of America | 1,701 | 4,729 | 1,086 | 3,469 | 947 | 4,184 |
| Other countries | 7,619 | 15,312 | 7,910 | 21,407 | 9,564 | 30,488 |
| Total | 203 058 | 398,004 | 199 617 | 556,423 | 227 766 | 657,656 |
| Cheese | ||||||
| tonnes | $(000) | tonnes† | $(000) | tonnes | $(000) | |
| Australia | 4,995 | 9,250 | 5,332 | 12,339 | 6,467 | 17,256 |
| Canada | 682 | 1,242 | 1,001 | 2,632 | 1,437 | 4,329 |
| French Polynesia | 226 | 637 | 225 | 797 | 265 | 1,050 |
| Germany, Federal Republic of | 7,224 | 11,115 | 3,677 | 9,265 | 5,545 | 12,024 |
| Hong Kong | 217 | 427 | 272 | 682 | 278 | 788 |
| Iraq | 3,801 | 5,343 | 4,106 | 6,355 | 3,000 | 8,025 |
| Jamaica | 1,580 | 3,191 | 1,106 | 2,031 | 942 | 1,852 |
| Japan | 22,558 | 35,615 | 24,062 | 49,113 | 22,623 | 48,968 |
| Malta | 826 | 1,186 | 202 | 284 | 302 | 572 |
| Netherlands | 2,971 | 3,196 | 165 | 309 | 411 | 725 |
| Panama, Republic of | 1,581 | 2,237 | 1,151 | 2,228 | 803 | 1,872 |
| Philippines | 2,271 | 3,641 | 2,748 | 5,494 | 997 | 2,207 |
| Portugal | 795 | 807 | 125 | 127 | 410 | 530 |
| Singapore | 353 | 749 | 378 | 1,153 | 285 | 903 |
| Trinidad and Tobago | 1,263 | 1,924 | 144 | 250 | 350 | 686 |
| U.S.S.R. | 4,850 | 4,632 | 4,859 | 7,576 | – | – |
| United Kingdom | 6,174 | 16,084 | 8,694 | 27,448 | 7,049 | 24,306 |
| United States of America | 13,259 | 27,456 | 17,039 | 41,169 | 17,564 | 50,849 |
| Venezuela | 992 | 1,503 | 914 | 1,710 | 128 | 253 |
| Other countries | 3 861x | 7,479x | 4 848x | 10,501x | 6,583 | 16,333x |
| Total | 80 480 | 137,714 | 81 048 | 181,465 | 75 439 | 193,528 |
| Milk (Dried, Condensed, etc.) | ||||||
| tonnes | $(000) | tonnes | $(000) | tonnes | $(000) | |
| Australia | 2,005 | 4,224 | 879 | 3,307 | 530 | 2,642 |
| Bangladesh | 466 | 672 | 198 | 377 | 69 | 147 |
| China* | 2,298 | 3,371 | 3,466 | 6,028 | 6,650 | 12,767 |
| China, Province of Taiwan | 10,223 | 12,905 | 7,435 | 12,924 | 10,243 | 16,929 |
| Dominican Republic | 4,672 | 5,668 | 512 | 675 | 2,942 | 3,745 |
| El Salvador | 2,591 | 3,498 | 103 | 202 | 362 | 886 |
| Fiji | 1,797 | 2,859 | 1,425 | 2,747 | 1,889 | 3,474 |
| Hong Kong | 1,602 | 1,880 | 2,837 | 4,380 | 2,409 | 3,835 |
| Indonesia | 39,175 | 41,173 | 25,215 | 32,671 | 27,172 | 36,118 |
| Iraq | 3,306 | 2,843 | 2,113 | 2,926 | 3,829 | 5,655 |
| Japan | 14,123 | 14,468 | 12,240 | 14,899 | 12,639 | 16,558 |
| Malaysia | 36,300 | 41,522 | 28,783 | 41,711 | 35,634 | 59,235 |
| Mauritius | 1,783 | 2,762 | 1,666 | 2,976 | 1,620 | 3,053 |
| Mexico | 10,765 | 11,512 | 17,415 | 26,011 | 6,503 | 10,056 |
| Netherlands | 2,852 | 6,594 | 904 | 2,525 | 306 | 939 |
| Nigeria | 5,017 | 6,051 | 8,621 | 14,361 | 7,935 | 13,361 |
| Pakistan | 1,521 | 2,137 | 2,049 | 3,701 | 1,617 | 2,669 |
| Peru | 19,897 | 20,120 | 20,328 | 27,770 | 11,049 | 15,102 |
| Philippines | 38,393 | 40,391 | 35,824 | 49,588 | 30,374 | 43,902 |
| Saudi Arabia | 2,033 | 2,753 | 1,007 | 1,269 | 4,315 | 5,546 |
| Singapore | 12,121 | 15,907 | 6,692 | 10,864 | 10,974 | 18,023 |
| Sri Lanka | 1,310 | 1,778 | 2,113 | 3,302 | 5,392 | 10,536 |
| Thailand | 17,567 | 18,927 | 16,277 | 23,700 | 15,142 | 22,557 |
| Trinidad and Tobago | 2,669 | 4,170 | 3,010 | 5,354 | 3,156 | 7,118 |
| U.S.S.R. | 5,000 | 6,225 | 25,002 | 42,901 | 10,199 | 17,641 |
| United Arab Emirates | 2,107 | 2,354 | 1,679 | 2,464 | 1,177 | 1,770 |
| Venezuela | 7,387 | 10,936 | 16,081 | 31,037 | 18,549 | 38,382 |
| Other countries | 13 198x | 17,736x | 13,739 | 24,460 | 33,393 | 49,664 |
| Total | 262 179 | 305,436 | 257 613 | 395,131 | 266 069 | 422,310 |
| Casein | ||||||
| tonnes | $(000) | tonnes | $(000) | tonnes | $(000) | |
| Belgium | 206 | 522 | – | – | 225 | 625 |
| Canada | 971 | 2,733 | 947 | 2,923 | 1,024 | 3,678 |
| China* | 200 | 566 | 240 | 768 | 230 | 731 |
| China, Province of Taiwan | 295 | 794 | 547 | 1,756 | 272 | 912 |
| Germany, Federal Republic of | 1,950 | 5,067 | 726 | 1,968 | 1,113 | 3,195 |
| Italy | 104 | 276 | 121 | 326 | – | – |
| Japan | 11,804 | 33,690 | 9,898 | 32,150 | 11,872 | 41,506 |
| Korea, Republic of | 339 | 928 | 480 | 1,256 | 587 | 2,047 |
| Mexico | 923 | 2,714 | 1,476 | 4,471 | 92 | 303 |
| Netherlands | 823 | 2,174 | 545 | 1,476 | 698 | 2,018 |
| South Africa | 404 | 1,063 | 345 | 1,034 | 322 | 1,075 |
| United Kingdom | 431 | 1,183 | 656 | 1,679 | 1,382 | 3,446 |
| United States of America | 23,049 | 62,905 | 27,719 | 89,551 | 25,995 | 97,585 |
| Other countries | 1 324x | 3,144x | 928 | 2,604 | 1,664 | 4,981 |
| Total | 42 823x | 117,759x | 44 626 | 141,960 | 45 476 | 162,102 |
| Inedible Tallow | ||||||
| tonnes | $(000) | tonnes | $(000) | tonnes | $(000) | |
| Bangladesh | 2,037 | 898 | 1,770 | 938 | 1,499 | 720 |
| China* | 26,036 | 12,524 | 4,690 | 2,551 | 18,716 | 9,964 |
| China, Province of Taiwan | 11,697 | 4,791 | 9,047 | 4,458 | 10,860 | 5,427 |
| Fiji | 1,765 | 852 | 1,783 | 893 | 2,187 | 1,125 |
| India | 19,455 | 8,806 | 15,511 | 7,764 | 19,590 | 9,137 |
| Kenya | 1,918 | 971 | 2,003 | 1,163 | 367 | 256 |
| Korea, Republic of | 13,208 | 5,564 | 48,343 | 22,298 | 17,448 | 8,438 |
| Malawi | 1,539 | 694 | 2,174 | 1,100 | 3,749 | 1,851 |
| Mozambique | 2,697 | 1,096 | 2,266 | 1,178 | 4,137 | 2,174 |
| Netherlands | 3,432 | 1,295 | 294 | 120 | 4,822 | 2,069 |
| Singapore | 9,614 | 4,002 | 1,671 | 849 | 1,416 | 755 |
| South Africa | 2,214 | 971 | 4,568 | 2,446 | 12,261 | 6,218 |
| Thailand | 2,356 | 1,187 | 805 | 440 | 2,161 | 1,131 |
| U.S.S.R. | – | – | 6,597 | 3,460 | – | – |
| United Kingdom | 804 | 394 | 15 | 10 | – | – |
| Other countries | 5,907 | 2,686 | 3,815 | 2,046 | 13,867 | 6,942 |
| Total | 104 679 | 46,732 | 105 352 | 51,716 | 113 080 | 56,207 |
| Kiwi Fruit | ||||||
| tonnes | $(000) | tonnes | $(000) | tonnes | $(000) | |
| Australia | 585 | 1,394 | 1,158 | 2,914 | 1,331 | 4,096 |
| Austria | 299 | 672 | 733 | 1,860 | 1,426 | 4,292 |
| Belgium | 918 | 2,102 | 964 | 2,493 | 1,287 | 3,883 |
| Canada | 298 | 656 | 427 | 1,159 | 742 | 2,028 |
| France | 610 | 1,394 | 950 | 2,400 | 1,239 | 3,699 |
| Germany, Federal Republic of | 4,980 | 11,324 | 5,913 | 14,703 | 7,470 | 21,282 |
| Italy | 321 | 817 | 88 | 231 | 419 | 1,141 |
| Japan | 4,280 | 10,412 | 5,359 | 14,956 | 6,884 | 20,859 |
| Netherlands | 2,060 | 5,081 | 1,158 | 2,900 | 1,277 | 3,877 |
| Sweden | 330 | 685 | 407 | 987 | 369 | 1,095 |
| Switzerland | 228 | 504 | 371 | 951 | 541 | 1,545 |
| United Kingdom | 509 | 1,138 | 608 | 1,519 | 658 | 1,940 |
| United States of America | 2,200 | 5,026 | 1,561 | 4,336 | 4,897 | 14,901 |
| Other countries | 278 | 584 | 524 | 1,304 | 826 | 2,189 |
| Total | 17 895 | 41,788 | 20 221 | 52,712 | 29 366 | 86,827 |
| Sheep and Lamb Pelts | ||||||
| No.(000) | $(000) | No.(000) | $(000) | No.(000) | $(000) | |
| Belgium | 3,147 | 9,017 | 3,339 | 10,369 | 4,068 | 17,463 |
| France | 5,891 | 10,966 | 4,713 | 13,591 | 5,900 | 20,686 |
| Italy | 3,068 | 5,487 | 5,131 | 13,139 | 6,223 | 19,435 |
| Netherlands | 1,035 | 3,213 | 1,140 | 3,942 | 802 | 3,630 |
| Spain | 3,809 | 5,706 | 3,122 | 5,527 | 4,013 | 10,798 |
| United Kingdom | 5,052 | 11,301 | 5,875 | 16,533 | 5,769 | 24,166 |
| United States of America | 8,118 | 16,172 | 6,720 | 18,886 | 5,608 | 19,772 |
| Other countries | 922 | 1,866 | 522 | 1,346 | 221 | 548 |
| Total | 31 043 | 63,730 | 30 562 | 83,333 | 32 604 | 116,498 |
| Sausage Casings | ||||||
| hanks | hanks | hanks | ||||
| (000) | $(000) | (000) | $(000) | (000) | $(000) | |
| Canada | 1,581 | 11,017 | 1,320 | 10,150 | 924 | 6,830 |
| Germany, Federal Republic of | 623 | 4,723 | 773 | 6,260 | 851 | 6,922 |
| Japan | 558 | 2,650 | 688 | 2,921 | 893 | 4,052 |
| Netherlands | 119 | 898 | 90 | 563 | 106 | 479 |
| Portugal | 157 | 1,140 | 218 | 1,565 | 286 | 1,935 |
| United Kingdom | 1,292 | 7,091 | 1,647 | 8,055 | 1,980 | 8,175 |
| United States of America | 2,184 | 12,508 | 1,792 | 10,350 | 2,057 | 11,617 |
| Other countries | 1,285 | 6,780 | 1,345 | 8,784 | 1,662 | 10,471 |
| Total | 7 800 | 46,807 | 7 873 | 48,649 | 8 759 | 50,481 |
| Apples (Fresh Whole Fruit) | ||||||
| tonnes | $(000) | tonnes | $(000) | tonnes | $(000) | |
| Canada | 940 | 461 | 807 | 432 | 1,081 | 701 |
| Destination unknown—EEC | 37,935 | 17,467 | 37,198 | 19,949 | 31,950 | 20,736 |
| Destination unknown—non-EEC | 11,504 | 5,284 | 8,240 | 4,454 | 7,188 | 4,663 |
| Hong Kong | 3,037 | 1,337 | 3,090 | 1,670 | 2,003 | 1,299 |
| Singapore | 6,155 | 2,916 | 3,891 | 2,103 | 4,124 | 2,675 |
| United Kingdom | 16,000 | 7,459 | 17,010 | 9,069 | 10,990 | 7,134 |
| United States of America | 14,459 | 7,736 | 14,483 | 7,836 | 18,005 | 11,673 |
| Other countries | 9,500 | 4,637 | 11,716 | 6,508 | 16,295 | 10,442 |
| Total | 99 530 | 47,297 | 96 435 | 52,021 | 91 636 | 59,323 |
| Kraft Paper and Cardboard | ||||||
| tonnes | $(000) | tonnes | $(000) | tonnes | $(000) | |
| Australia | 22,987 | 12,310 | 23,297 | 17,180 | 22,494 | 16,897 |
| China* | 5,943 | 2,570 | 7,543 | 2,863 | 11,612 | 3,456 |
| Hong Kong | 12,751 | 5,273 | 16,335 | 7,582 | 17,197 | 6,427 |
| Indonesia | 19,963 | 8,334 | 19,908 | 9,451 | 14,927 | 6,303 |
| Japan | 2,561 | 1,031 | 615 | 308 | 114 | 43 |
| Malaysia | 3,449 | 1,611 | 4,783 | 2,437 | 9,297 | 4,769 |
| Pakistan | 695 | 390 | 1,626 | 961 | 2,222 | 1,157 |
| Saudi Arabia | 6,161 | 3,389 | 3,260 | 1,922 | 5,796 | 2,970 |
| Other countries | 10,780 | 5,079 | 18,439 | 8,674 | 20,720 | 9,469 |
| Total | 85 290 | 39,986 | 95 805 | 51,376 | 104379 | 51,491 |
| Feeding Stuff for Animals | ||||||
| tonnes | $(000) | tonnes | $(000) | tonnes | $(000) | |
| China, Province of Taiwan | 2,267 | 1,177 | 11,359 | 5,723 | 20,073 | 12,136 |
| Japan | 49,461 | 14,572 | 53,748 | 19,779 | 69,563 | 46,656 |
| Malaysia | 1,544 | 1,704 | 1,728 | 2,262 | 2,287 | 2,578 |
| Philippines | 11,652 | 3,374 | 26,722 | 8,187 | 18,801 | 6,082 |
| Singapore | 4,410 | 3,059 | 2,757 | 2,375 | 4,448 | 2,710 |
| Spain | 6,482 | 1,434 | 2,920 | 2,080 | 5,505 | 4,992 |
| United Kingdom | 6,074 | 4,072 | 2,886 | 1,658 | 8,263 | 5,130 |
| United States of America | 3,702 | 2,517 | 1,923 | 1,720 | 1,940 | 2,164 |
| Other countries | 23,386 | 7,250 | 33,781 | 13,779 | 39,713 | 21,175 |
| Total | 108 979 | 39,160 | 137 825 | 57,564 | 170 593 | 103,623 |
| Wood Pulp | ||||||
| tonnes | $(000) | tonnes | $(000) | tonnes | $(000) | |
| Australia | 154,406 | 65,440 | 146,005 | 72,662 | 115,030 | 56,594 |
| China | 26,446 | 10,294 | 13,489 | 5,268 | 39,058 | 12,898 |
| China, Province of Taiwan | 6,282 | 2,669 | 10,483 | 4,364 | 10,830 | 4,135 |
| Indonesia | 3,159 | 1,390 | 6,974 | 3,416 | 16,205 | 5,170 |
| Japan | 262,612 | 50,723 | 173,083 | 42,146 | 214,093 | 61,121 |
| Korea, Republic of | 26,039 | 6,839 | 37,217 | 13,521 | 33,242 | 11,318 |
| Philippines | 21,417 | 9,418 | 15,430 | 7,364 | 16,787 | 6,967 |
| Thailand | 4,360 | 1,838 | 5,519 | 2,748 | 4,245 | 2,202 |
| Other countries | 10 435x | 2,647x | 13,405 | 4,250 | 1,717 | 1,022 |
| Total | 515 156 | 151,258 | 421 605 | 155,739 | 451 207 | 161,427 |
| Timber (Sawn Conifer) | ||||||
| cu m | $(000) | cu m | $(000) | cu m | $(000) | |
| (000) | (000) | (000) | ||||
| Australia | 185 | 38,739 | 201 | 43,712 | 155 | 35,666 |
| Japan | 266 | 29,091 | 262 | 28,488 | 256 | 29,273 |
| New Caledonia | 8 | 1,171 | 6 | 877 | 5 | 855 |
| Sudan | 11 | 1,150 | – | – | – | – |
| Tonga | 2 | 342 | 1 | 304 | 2 | 390 |
| Other countries | 38 | 6,302 | 17 | 4,134 | 12 | 4,099 |
| Total | 509 | 76,795 | 487 | 77,516 | 430 | 70,283 |
| Sawlogs and Veneer Logs (Conifer) | ||||||
| cu m | $(000) | cu m | $(000) | cu m | $(000) | |
| (000) | (000) | (000) | ||||
| China* | 44 | 2,585 | – | – | – | – |
| Japan | 757 | 50,699 | 434 | 26,878 | 352 | 22,890 |
| Korea, Republic of | 36 | 2,003 | – | – | 59 | 3,588 |
| Other countries | 11 | 736 | – | 10 | 8 | 841 |
| Total | 848 | 56,022 | 434 | 26,889 | 419 | 27,319 |
| Fish (Fresh, Chilled or Frozen) | ||||||
| tonnes | $(000) | tonnes | $(000) | tonnes | $(000) | |
| Australia | 13,065 | 25,168 | 14,391 | 35,424 | 13,264 | 40,156 |
| Germany, Federal Republic of | 2,603 | 3,587 | 170 | 343 | 79 | 233 |
| Japan | 30,939 | 37,141 | 32,143 | 41,347 | 36,745 | 54,382 |
| Korea, Republic of | 1,102 | 566 | 1,595 | 1,264 | 1,218 | 1,260 |
| Netherlands | 513 | 1,155 | 480 | 1,110 | 337 | 1,035 |
| U.S.S.R | 8,320 | 3,317 | 6,740 | 2,648 | 7,478 | 3,872 |
| United States of America | 12,255 | 16,498 | 5,361 | 10,786 | 7,303 | 23,528 |
| Other countries | 16,779 | 13,330 | 18,755 | 18,674 | 14,507 | 21,685 |
| Total | 85 576 | 100,763 | 79 436 | 111,595 | 80 931 | 146,151 |
| Newsprint | ||||||
| tonnes | $(000) | tonnes | $(000) | tonnes | $(000) | |
| Australia | 136,901 | 60,200 | 140,575 | 82,041 | 36,009 | 23,674 |
| Hong Kong | 7,503 | 3,300 | 3,583 | 2,112 | 5,348 | 2,857 |
| India | 26,597 | 10,656 | 15,165 | 8,116 | 24,290 | 14,622 |
| Indonesia | 12,062 | 5,347 | 4,588 | 2,321 | 2,995 | 1,391 |
| Malaysia | 17,413 | 7,221 | 17,416 | 8,555 | 12,516 | 6,177 |
| Singapore | 7,277 | 2,907 | 1,055 | 519 | 2,045 | 714 |
| Other countries | 23,221 | 9,612 | 16,617 | 6,907 | 32,872 | 11,441 |
| Total | 230 974 | 99,242 | 199 000 | 110,572 | 116 075 | 60,876 |
RE-EXPORTS—The forwarding trade of New Zealand is made up principally of miscellaneous stores sent to the Pacific Islands and goods returned or re-sold to Australia, the United States of America, and other countries.
The destinations of this re-export trade for the latest available June years are shown in the following table.
| Country | June Year | ||||
|---|---|---|---|---|---|
| 1979 | 1980 | 1981 | 1982 | 1983 | |
| $(000) | |||||
| Australia | 45,457 | 26,839 | 36,848 | 41,105 | 42,340 |
| Canada | 233 | 589 | 251 | 302 | 843 |
| Fiji | 5,992 | 6,997 | 9,952 | 10,014 | 11,448 |
| French Polynesia | 415 | 462 | 689 | 519 | 733 |
| Germany, Federal Republic of | 797 | 634 | 15,828 | 1,616 | 1,536 |
| Hong Kong | 512 | 1,042 | 692 | 958 | 1,220 |
| Indonesia | 56 | 51 | 55 | 248 | 129 |
| Japan | 959 | 1,262 | 1,086 | 1,681 | 1,862 |
| Malaysia | 2,079 | 449 | 691 | 510 | 1,016 |
| Netherlands | 178 | 718 | 555 | 446 | 442 |
| Papua New Guinea | 1,336 | 1,725 | 2,861 | 5,855 | 10,339 |
| Philippines | 281 | 1,729 | 335 | 80 | 304 |
| Samoa, Western | 1,234 | 1,375 | 1,499 | 1,550 | 1,254 |
| Singapore | 1,578 | 4,256 | 3,277 | 2,359 | 28,648 |
| Sweden | 147 | 122 | 172 | 312 | 434 |
| Tonga | 678 | 635 | 848 | 930 | 1,232 |
| United Kingdom | 3,160 | 5,161 | 3,301 | 5,163 | 6,605 |
| United States of America | 5,900 | 9,899 | 46,610 | 14,663 | 114,184 |
| Other countries | 5,951 | 8,369 | 12,768 | 117,681 | 42,042 |
| Total Merchandise Re-exports | 76,945 | 72,316 | 138,317 | 205,992 | 266,611 |
Statistics of imports are compiled from entries passed by the Customs and are usually quoted on the valuation basis v.f.d. (value for duty in the country of export at the time of shipment). Formerly, the valuation basis was c.d.v. (current domestic value). However, in certain tables the value c.i.f. (cost including insurance and freight) is also given. Import values are expressed in terms of New Zealand currency, and import totals do not include gold and current coin, except where expressly stated.
Reference should be made to Section 23A for details of the systems of valuation of imports as now used in these tables. Section 23A also gives a summary of import totals for recent years and index numbers of the volume of import trade, and also includes a sub-section on Import Control.
CLASSIFICATION OF IMPORTS—The following table classifies imports by sections of the Standard International Trade Classification (Revised) for years prior to 1978–79. From 1 July 1978 figures are based on S.I.T.C. (Revision 2).
| Year Ended June | Imports (v.f.d.) | |||||
|---|---|---|---|---|---|---|
| Food and Live Animals | Beverages and Tobacco | Crude Materials, Inedible, Except Fuels | Mineral Fuels, Lubricants, and Related Materials | Animal and Vegetable Oils and Fats | Chemicals | |
| $(000) | ||||||
| 1979 | 155,364 | 31,283 | 184,510 | 502,228 | 16,900 | 453,451 |
| 1980 | 201,351 | 45,515 | 204,878 | 944,182 | 20,723 | 603,339 |
| 1981 | 217,628 | 43,034 | 249,687 | 1,247,680 | 19,778 | 611,933 |
| 1982 | 351,048 | 64,879 | 320,416 | 1,285,017 | 25,198 | 828,253 |
| 1983 | 309,078 | 58,904 | 322,318 | 1,343,699 | 28,188 | 733,414 |
| Year Ended June | Imports (v.f.d.) | ||||
|---|---|---|---|---|---|
| Manufactured Goods Classified Chiefly by Material | Machinery and Transport Equipment | Miscellaneous Manufactured Articles | Commodities and Transactions not Classified According to Kind | Total Merchandise Imports | |
| $(000) | |||||
| 1979 | 785,468 | 1,155,206 | 264,093 | 25,638 | 3,574,139 |
| 1980 | 971,605 | 1,434,609 | 348,826 | 34,597 | 4,809,625 |
| 1981 | 946,517 | 1,821,464 | 399,444 | 30,158 | 5,587,323 |
| 1982 | 1,388,313 | 2,191,572 | 533,139 | 56,937 | 7,044,774 |
| 1983 | 1,285,932 | 2,215,208 | 544,397 | 87,101 | 6,928,240 |
The next table gives fuller details of imports according to sections and divisions of S.I.T.C. (Revision 2) for the latest available June years.
Division values are on the basis of v.f.d. (value for duty). Section totals are given on this basis and also c.i.f. (cost, including insurance and freight).
| Section and Division | Year Ended June | ||
|---|---|---|---|
| 1981 | 1982 | 1983 | |
| 0 Food and Live Animals Chiefly for Food | $(000) | ||
| 00 Live animals chiefly for food | 10,469 | 11,135 | 20,832 |
| 01 Meat and meat preparations | 4,680 | 7,488 | 5,040 |
| 02 Dairy products and birds' eggs | 1,420 | 86,632 | 18,606 |
| 03 Fish, crustaceans and molluscs, and preparations thereof | 18,312 | 27,114 | 23,636 |
| 04 Cereals and cereal preparations | 15,889 | 21,435 | 25,624 |
| 05 Vegetables and fruit | 54,870 | 76,672 | 79,580 |
| 06 Sugar, sugar preparations and honey | 58,239 | 62,181 | 63,835 |
| 07 Coffee, tea, cocoa, spices and manufactures thereof | 47,380 | 49,622 | 62,405 |
| 08 Feeding stuff for animals (not including unmilled cereals) | 2,127 | 3,494 | 3,269 |
| 09 Miscellaneous edible products and preparations | 4,243 | 5,276 | 6,249 |
| Total | 217,628 | 351,048 | 309,078 |
| c.i.f. | 256,036 | 400,154 | 355,696 |
| 1 Beverages and Tobacco | |||
| 11 Beverages | 27,305 | 43,799 | 36,879 |
| 12 Tobacco and tobacco manufactures | 15,729 | 21,081 | 22,025 |
| Total | 43,034 | 64,879 | 58,904 |
| c.i.f. | 49,213 | 73,287 | 66,319 |
| 2 Crude Materials, Inedible (Except Fuels) | |||
| 21 Hides, skins and furskins, raw | 3,240 | 4,331 | 3,082 |
| 22 Oil seeds and oleaginous fruit | 8,424 | 11,683 | 8,890 |
| 23 Crude rubber (including synthetic and reclaimed) | 28,441 | 32,122 | 28,392 |
| 24 Cork and wood | 10,529 | 14,050 | 13,716 |
| 25 Pulp and waste paper | 4,635 | 6,143 | 6,195 |
| 26 Textile fibres (other than wool tops) and their wastes | 20,117 | 22,114 | 18,268 |
| 27 Crude fertilisers and crude minerals (excluding coal, etc.) | 87,190 | 107,953 | 115,540 |
| 28 Metalliferous ores and metal scrap | 72,919 | 102,603 | 106,051 |
| 29 Crude animal and vegetable materials, n.e.s. | 14,193 | 19,416 | 22,184 |
| Total | 249,687 | 320,416 | 322,318 |
| c.i.f. | 320,135 | 391,254 | 401,455 |
| 3 Mineral Fuels, Lubricants and Related Materials | |||
| 32 Coal, coke and briquettes | 849 | 2,498 | 990 |
| 33 Petroleum, petroleum products, and related materials | 1,246,704 | 1,282,320 | 1,342,663 |
| 34 Gas, natural and manufactured | 127 | 199 | 45 |
| Total | 1,247,680 | 1,285,017 | 1,343,699 |
| c.i.f. | 1,332,460 | 1,369,058 | 1,423,496 |
| 4 Animal and Vegetable Oils, Fats and Waxes | |||
| 41 Animal oils and fats | 365 | 139 | 396 |
| 42 Fixed vegetable oils and fats | 17,814 | 22,443 | 24,757 |
| 43 Animal and vegetable oils and fats, processed, and waxes of animal or vegetable origin | 1,599 | 2,617 | 3,035 |
| Total | 19,778 | 25,198 | 28,188 |
| c.i.f. | 21,889 | 28,258 | 30,660 |
| 5 Chemical and Related Products, n.e.s. | |||
| 51 Organic chemicals | 104,708 | 139,472 | 119,565 |
| 52 Inorganic chemicals | 70,043 | 91,116 | 88,587 |
| 53 Dyeing, tanning and colouring materials | 27,461 | 43,379 | 35,241 |
| 54 Medicinal and pharmaceutical products | 117,925 | 146,741 | 132,390 |
| 55 Essential oils and perfumes, etc. | 21,233 | 29,105 | 28,667 |
| 56 Fertilisers, manufactured | 46,171 | 60,055 | 56,000 |
| 57 Explosives and pyrotechnic products | 4,184 | 4,142 | 3,450 |
| 58 Artificial resins and plastic materials, and cellulose esters and ethers | 159,893 | 238,077 | 193,974 |
| 59 Chemical materials and products, n.e.s. | 60,314 | 76,165 | 75,341 |
| Total | 611,933 | 828,253 | 733,414 |
| c.i.f. | 631,518 | 861,244 | 827,684 |
| 6 Manufactured Goods Classified by Material | |||
| 61 Leather, leather manufactures, n.e.s., and dressed furskins | 5,556 | 8,504 | 11,998 |
| 62 Rubber manufactures, n.e.s. | 41,082 | 52,004 | 53,892 |
| 63 Cork and wood manufactures (excluding furniture) | 9,233 | 13,259 | 13,305 |
| 64 Paper, paperboard, and articles of paper pulp, of paper, or of paperboard | 59,360 | 92,698 | 91,293 |
| 65 Textile yarn, fabrics, made-up articles, n.e.s., and related products | 309,482 | 427,823 | 411,703 |
| 66 Non-metallic mineral manufactures n.e.s. | 60,387 | 86,854 | 79,999 |
| 67 Iron and steel | 253,972 | 411,585 | 341,611 |
| 68 Non-ferrous metals | 82,782 | 122,108 | 102,024 |
| 69 Manufactures of metal, n.e.s. | 124,664 | 173,479 | 180,102 |
| Total | 946,517 | 1,388,313 | 1,285,932 |
| c.i.f. | 1,015,129 | 1,479,792 | 1,422,173 |
| 7 Machinery and Transport Equipment | |||
| 71 Power generating machinery and equipment | 133,721 | 125,616 | 138,417 |
| 72 Machinery, specialised for particular industries | 227,674 | 347,653 | 320,287 |
| 73 Metalworking machinery | 34,748 | 46,113 | 65,984 |
| 74 General industrial machinery and equipment, n.e.s., and machine parts, n.e.s. | 227,734 | 304,096 | 509,702 |
| 75 Office machines and automatic data processing equipment | 119,127 | 162,959 | 160,656 |
| 76 Telecommunication, sound recording and reproducing apparatus and equipment | 58,369 | 84,891 | 147,079 |
| 77 Electrical machinery, apparatus, and appliances, n.e.s., etc. | 176,931 | 254,783 | 250,827 |
| 78 Road vehicles (including air cushion vehicles) | 475,164 | 608,448 | 444,016 |
| 79 Other transport equipment | 367,995 | 257,013 | 178,240 |
| Total | 1,821,464 | 2,191,572 | 2,215,208 |
| c.i.f. | 1,954,152 | 2,398,320 | 2,390,084 |
| 8 Miscellaneous Manufactured Articles | |||
| 81 Sanitary, plumbing, heating, etc., fixtures and fittings, n.e.s. | 3,867 | 6,131 | 5,821 |
| 82 Furniture and parts thereof | 4,822 | 9,442 | 8,482 |
| 83 Travel goods, handbags, and similar containers | 1,312 | 1,690 | 1,715 |
| 84 Articles of apparel and clothing accessories | 15,880 | 28,121 | 30,834 |
| 85 Footwear | 9,290 | 10,855 | 13,228 |
| 87 Professional, scientific and controlling instruments and apparatus, n.e.s. | 91,658 | 118,859 | 131,228 |
| 88 Photographic apparatus, optical goods, watches, and clocks | 80,388 | 104,696 | 90,027 |
| 89 Miscellaneous manufactured articles, n.e.s | 192,228 | 253,343 | 263,063 |
| Total | 399,444 | 533,139 | 544,397 |
| c.i.f. | 412,025 | 549,916 | 589,069 |
| 9 Commodities and Transactions Not Classified Elsewhere in the S.I.T.C. | |||
| 94 Live animals, n.e.s. | 115 | 499 | 831 |
| 95 Arms of war and ammunition, etc. | 25,141 | 48,903 | 75,383 |
| 96 Coins (other than gold coins) not being legal tender in New Zealand | 2,127 | 3,107 | 1,600 |
| 97 Gold non-monetary | 2,775 | 4,428 | 9,287 |
| Total | 30,158 | 56,937 | 87,101 |
| c.i.f. | 31,071 | 58,119 | 89,192 |
| Grand total, merchandise imports | 5,587,323 | 7,044,774 | 6,928,240 |
| c.i.f. | 6,023,628 | 7,609,402 | 7,595,828 |
n.e.s.—not elsewhere specified.
DIRECTION OF IMPORT TRADE—From the eighties of the last century until the early seventies of this century, the chief source of supply of New Zealand's imports was the United Kingdom. Prior to that the main source of supply was Australia, and in the latest years, as the United Kingdom has become more closely linked to Europe, Australia has once more moved into first place. During the year ended June 1983, imports from the United Kingdom were valued at $638 million and imports from Australia at $1,368 million.
In the years following the Second World War, the proportion of the import trade received from the United Kingdom rose from 47.8 percent in 1946 to a maximum of 60.1 percent in 1950. Since 1950 there has been an overall decline, and for the June years 1982 and 1983 only 9.0 and 9.1 percent of imports came from that source. During those same June years imports from Australia made up 19.9 percent and 19.1 percent respectively of New Zealand's total imports, and imports from Japan (an increasingly important trading partner) 17.0 percent and 16.7 percent.
The principal changes in the direction of the import trade are illustrated in the table in Section 23A giving the percentage received from the various geographic areas.
The table which follows shows imports (valuation v.f.d.) during the latest 5 years from the United Kingdom, Australia, the United States, and Japan. It should be noted that Australia includes Cocos, Norfolk Island, and Christmas Island. The U.S.A. includes American Samoa, Guam, Pacific Island Trust Territory, Puerto Rico, U.S. Virgin Islands, and U.S. miscellaneous Pacific Islands.
| Year Ended June | Country of Export | Country of Origin | Total Merchandise Imports | ||||||
|---|---|---|---|---|---|---|---|---|---|
| United Kingdom | Australia | U.S.A. | Japan | United Kingdom | Australia | U.S.A. | Japan | ||
| $(million) | |||||||||
| 1979 | 550 | 896 | 435 | 482 | 543 | 799 | 490 | 495 | 3,574 |
| 1980 | 693 | 1,027 | 591 | 590 | 693 | 915 | 650 | 606 | 4,810 |
| 1981 | 579 | 1,199 | 933 | 789 | 585 | 1,074 | 986 | 834 | 5,587 |
| 1982 | 635 | 1,546 | 1,105 | 1,166 | 636 | 1,401 | 1,202 | 1,200 | 7,045 |
| 1983 | 634 | 1,562 | 1,051 | 1,136 | 638 | 1,368 | 1,169 | 1,166 | 6,928 |
ORIGIN OF PRINCIPAL IMPORTS—The table which follows shows details of principal commodity imports by principal countries of origin for years ended June 1982 and 1983. V.f.d. basis of valuation is used.
| Commodity and Countries of Origin | Value of Imports | |
|---|---|---|
| Year Ended June | ||
| 1982 | 1983 | |
| * Excludes Province of Taiwan. | ||
| $(000) | ||
| Sugar (not refined)— | ||
| Australia | 29,409 | 36,758 |
| Fiji | 17,654 | 23,952 |
| All countries | 59,256 | 60,787 |
| Coffee, raw— | ||
| India | 5,160 | 5,276 |
| Indonesia | 7,164 | 8,206 |
| Kenya | 1,048 | 1,193 |
| Papua New Guinea | 3,647 | 4,845 |
| All countries | 20,049 | 24,212 |
| Rubber (crude and synthetic)— | ||
| Australia | 2,360 | 2,198 |
| Canada | 3,630 | 2,904 |
| Japan | 7,538 | 5,527 |
| Malaysia | 8,968 | 8,802 |
| U.S.A. | 4,099 | 2,044 |
| All countries | 32,122 | 28,392 |
| Crude petroleum— | ||
| Indonesia | 292,802 | 260,042 |
| Kuwait | 13,806 | 7,770 |
| Saudi Arabia | 273,622 | 142,139 |
| United Arab Emirates | 30,037 | – |
| All countries | 644,148 | 409,951 |
| Partly refined petroleum— | ||
| Bahrain | 15,674 | – |
| Kuwait | 17,612 | 26,228 |
| Saudi Arabia | – | – |
| Singapore | 110,457 | 61,503 |
| All countries | 143,744 | 88,414 |
| Alcoholic beverages— | ||
| Australia | 9,127 | 8,213 |
| France | 6,515 | 5,500 |
| Germany, Fed. Rep. of | 1,945 | 1,647 |
| Jamaica | 2,906 | 5,841 |
| United Kingdom | 12,237 | 6,910 |
| U.S.A. | 2,992 | 2,437 |
| All countries | 43,614 | 36,638 |
| Inorganic chemicals— | ||
| Australia | 19,530 | 17,202 |
| Germany, Fed. Rep. of | 5,903 | 6,550 |
| Japan | 12,572 | 13,682 |
| United Kingdom | 19,289 | 16,316 |
| U.S.A. | 18,054 | 18,740 |
| All countries | 89,341 | 86,535 |
| Woven fabrics of synthetic fibres— | ||
| Australia | 8,073 | 6,441 |
| China* | 5,421 | 6,714 |
| Japan | 30,315 | 30,000 |
| U.S.A. | 15,680 | 9,470 |
| All countries | 105,846 | 94,262 |
| Other woven textile fabrics— | ||
| Hong Kong | 10,668 | 11,189 |
| India | 3,354 | 3,002 |
| United Kingdom | 4,310 | 4,799 |
| U.S.A. | 6,214 | 5,352 |
| All countries | 45,841 | 42,793 |
| Glass and glassware— | ||
| Australia | 9,697 | 6,917 |
| United Kingdom | 5,856 | 4,549 |
| U.S.A. | 6,098 | 5,475 |
| All countries | 37,321 | 33,106 |
| Tobacco (Unmanufactured)— | ||
| Thailand | 1,213 | 1,274 |
| U.S.A. | 12,571 | 10,433 |
| Zimbabwe | 1,964 | 3,241 |
| All countries | 19,574 | 20,766 |
| Natural calcium phosphate— | ||
| Australia | 34,495 | 23,732 |
| Nauru | 30,324 | 35,080 |
| All countries | 70,669 | 64,371 |
| Medicinal and pharmaceutical products— | ||
| Australia | 38,095 | 35,484 |
| Germany, Fed. Rep. of | 9,601 | 9,925 |
| Switzerland | 5,110 | 4,334 |
| United Kingdom | 42,212 | 27,502 |
| U.S.A. | 5,243 | 4,283 |
| All countries | 120,171 | 105,025 |
| Manufactured fertilisers— | ||
| Australia | 5,938 | 1,300 |
| Canada | 3,763 | 4,399 |
| Japan | 7,230 | 3,437 |
| U.S.A. | 30,603 | 33,608 |
| All countries | 60,055 | 56,200 |
| Motor spirit— | ||
| Australia | 101,518 | 154,809 |
| Bahrain | 54,842 | 15,621 |
| Singapore | 13,513 | 98,370 |
| All countries | 174,288 | 341,522 |
| Kerosene and white spirit— | ||
| Australia | 79,889 | 58,564 |
| Singapore | 57,757 | 94,179 |
| All countries | 138,627 | 160,044 |
| Distillate fuels— | ||
| Australia | 28,932 | 84,812 |
| Bahrain | 22,248 | 8,129 |
| Singapore | 62,405 | 100,738 |
| All countries | 114,840 | 257,738 |
| Organic chemicals— | ||
| Australia | 16,138 | 11,068 |
| Germany, Fed. Rep. of | 11,548 | 10,460 |
| Japan | 16,058 | 14,752 |
| United Kingdom | 16,948 | 12,258 |
| U.S.A. | 45,467 | 37,500 |
| All countries | 139,472 | 119,565 |
| Plastic materials, regenerated cellulose and artificial resins— | ||
| Australia | 10,224 | 9,131 |
| Germany, Fed. Rep. of | 5,549 | 4,653 |
| Japan | 8,537 | 5,766 |
| United Kingdom | 11,743 | 12,067 |
| U.S.A. | 20,053 | 13,676 |
| All countries | 67,618 | 55,348 |
| Polymerisation and copolymerisation products— | ||
| Australia | 54,641 | 37,801 |
| Germany, Fed. Rep. of | 8,262 | 8,496 |
| Japan | 26,412 | 22,270 |
| United Kingdom | 11,385 | 7,730 |
| U.S.A. | 37,770 | 36,317 |
| All countries | 170,459 | 138,626 |
| Articles of rubber— | ||
| Japan | 11,668 | 12,772 |
| United Kingdom | 5,508 | 4,170 |
| U.S.A. | 8,083 | 6,754 |
| All countries | 37,790 | 37,685 |
| Paper and paperboard— | ||
| Australia | 18,418 | 15,022 |
| Japan | 19,293 | 20,090 |
| United Kingdom | 12,336 | 12,727 |
| U.S.A. | 6,689 | 6,603 |
| All countries | 78,649 | 78,763 |
| Tubes, pipes and fittings of iron or steel— | ||
| Australia | 7,673 | 5,553 |
| Japan | 33,915 | 26,200 |
| United Kingdom | 3,540 | 3,855 |
| All countries | 59,163 | 52,016 |
| Automatic data processing machines and accessories— | ||
| Japan | 18,006 | 18,610 |
| United Kingdom | 4,497 | 4,285 |
| U.S.A. | 63,465 | 53,193 |
| All countries | 99,841 | 93,111 |
| Metalworking machinery— | ||
| Australia | 4,515 | 3,953 |
| Germany, Fed. Rep. of | 6,111 | 19,904 |
| Japan | 7,285 | 6,267 |
| United Kingdom | 5,140 | 5,763 |
| U.S.A. | 7,301 | 8,615 |
| All countries | 46,113 | 65,984 |
| Textile and leather machinery— | ||
| Germany, Fed. Rep. of | 10,020 | 8,297 |
| Japan | 8,709 | 8,869 |
| United Kingdom | 4,849 | 6,579 |
| All countries | 44,855 | 42,003 |
| Tools for hand use or in machines— | ||
| Australia | 9,225 | 7,642 |
| Japan | 7,343 | 7,466 |
| United Kingdom | 6,803 | 6,413 |
| U.S.A. | 11,647 | 10,354 |
| All countries | 50,583 | 45,836 |
| Miscellaneous manufactures of metal— | ||
| Australia | 17,814 | 15,051 |
| United Kingdom | 9,880 | 8,527 |
| U.S.A. | 7,204 | 6,705 |
| All countries | 52,671 | 47,984 |
| Internal combustion engines (not aircraft)— | ||
| Australia | 5,735 | 4,182 |
| Japan | 5,492 | 5,623 |
| United Kingdom | 4,779 | 2,565 |
| U.S.A. | 14,778 | 13,845 |
| All countries | 33,430 | 29,075 |
| Other non-electric power generating machinery— | ||
| Japan | 5,854 | 34,255 |
| United Kingdom | 10,724 | 9,548 |
| U.S.A. | 18,441 | 18,323 |
| All countries | 46,986 | 75,212 |
| Textile yarn and thread— | ||
| Australia | 11,722 | 8,266 |
| Japan | 16,653 | 17,702 |
| United Kingdom | 8,460 | 6,976 |
| U.S.A. | 11,691 | 8,695 |
| All countries | 79,550 | 77,668 |
| Cotton fabrics, woven— | ||
| China* | 9,538 | 7,746 |
| Hong Kong | 30,803 | 32,022 |
| India | 3,544 | 2,555 |
| Japan | 8,823 | 11,324 |
| United Kingdom | 3,086 | 2,450 |
| U.S.A. | 3,898 | 3,717 |
| All countries | 84,383 | 87,032 |
| Copper and copper alloys— | ||
| Australia | 35,192 | 29,925 |
| Germany, Fed. Rep. of | 2,228 | 2,778 |
| United Kingdom | 3,005 | 1,994 |
| All countries | 44,908 | 40,952 |
| Unwrought zinc— | ||
| Australia | 19,109 | 14,165 |
| Canada | 6,842 | 6,409 |
| All countries | 25,972 | 20,579 |
| Bars and rods of iron or steel— | ||
| Australia | 5,988 | 4,626 |
| Japan | 18,148 | 14,784 |
| United Kingdom | 912 | 809 |
| All countries | 28,622 | 23,060 |
| Angles, shapes and sections of iron or steel— | ||
| Australia | 15,078 | 8,959 |
| Japan | 11,028 | 14,213 |
| United Kingdom | 1,066 | 1,444 |
| All countries | 28,070 | 25,000 |
| Universals, plates and sheets of iron or steel— | ||
| Australia | 77,843 | 47,306 |
| Canada | 3,882 | 2,430 |
| Japan | 140,403 | 129,500 |
| United Kingdom | 12,440 | 9,053 |
| All countries | 243,792 | 194,973 |
| Iron and steel wire— | ||
| Australia | 5,189 | 3,793 |
| Japan | 6,855 | 6,602 |
| United Kingdom | 3,526 | 3,356 |
| All countries | 17,899 | 16,127 |
| Pumps and compressors— | ||
| Australia | 12,815x | 10,703 |
| United Kingdom | 11,808x | 12,751 |
| U.S.A. | 25,476x | 29,913 |
| All countries | 86,581x | 97,433 |
| Mechanical handling equipment— | ||
| Japan | 12,539 | 11,446 |
| United Kingdom | 6,029 | 15,646 |
| U.S.A. | 11,275 | 15,320 |
| All countries | 50,366 | 61,051 |
| Other non-electric machinery and appliances— | ||
| Australia | 25,988 | 29,647 |
| Japan | 20,474 | 92,880 |
| United Kingdom | 22,829 | 30,885 |
| U.S.A. | 43,121 | 61,762 |
| All countries | 167,149 | 351,217 |
| Parts, accessories of, tractors and motor vehicles (not motor cycles)— | ||
| Australia | 16,049 | 12,152 |
| Japan | 10,294 | 10,929 |
| Germany, Fed. Rep. of | 7,113 | 2,859 |
| United Kingdom | 17,409 | 14,208 |
| U.S.A. | 9,920 | 10,592 |
| All countries | 72,381 | 57,409 |
| Telecommunications equipment— | ||
| Japan | 48,626 | 73,849 |
| United Kingdom | 7,546 | 19,761 |
| U.S.A. | 14,518 | 14,194 |
| All countries | 84,891 | 147,079 |
| Thermionic, etc., valves and tubes— | ||
| Japan | 17,941 | 16,660 |
| Netherlands | 2,330 | 715 |
| U.S.A. | 6,586 | 5,804 |
| All countries | 35,231 | 32,327 |
| Other electrical machinery and apparatus— | ||
| Australia | 9,642 | 7,001 |
| Japan | 24,033 | 20,170 |
| United Kingdom | 10,522 | 10,357 |
| U.S.A. | 17,189 | 11,414 |
| All countries | 76,947x | 64,240 |
| Tractors— | ||
| Germany, Fed. Rep. of | 9,474 | 8,974 |
| Italy | 2,880 | 3,788 |
| Japan | 23,103 | 14,673 |
| United Kingdom | 15,245 | 18,734 |
| U.S.A. | 4,126 | 2,940 |
| All countries | 62,892 | 57,626 |
| Agricultural machinery and implements (excl. tractors)— | ||
| Germany, Fed. Rep. of | 3,060 | 5,878 |
| United Kingdom | 3,655 | 4,009 |
| U.S.A. | 4,828 | 6,335 |
| All countries | 25,765 | 32,660 |
| Electric power machinery— | ||
| Australia | 8,035 | 7,102 |
| Japan | 16,363 | 14,325 |
| United Kingdom | 6,866 | 8,680 |
| U.S.A. | 8,782 | 7,185 |
| All countries | 60,006 | 52,309 |
| Electric switchgear, etc.— | ||
| Australia | 10,468 | 8,356 |
| Japan | 13,715 | 16,425 |
| United Kingdom | 12,105 | 14,626 |
| U.S.A. | 10,900 | 10,254 |
| All countries | 64,254 | 69,329 |
| Excavating, levelling, boring, etc., machinery— | ||
| Japan | 25,507 | 21,373 |
| U.S.A. | 30,127 | 16,999 |
| All countries | 69,538 | 50,743 |
| Other machinery for special industries— | ||
| Australia | 12,564 | 10,770 |
| Germany, Fed. Rep. of | 29,349 | 24,849 |
| United Kingdom | 14,918 | 14,754 |
| U.S.A. | 34,375 | 33,892 |
| All countries | 144,604 | 137,254 |
| Railway vehicles— | ||
| Australia | 4,274 | 10,311 |
| Hungary | 24,616 | 12,207 |
| Korea, Rep. of | 3,510 | 514 |
| Japan | 9,949 | 1,750 |
| U.S.A. | 1,181 | 1,839 |
| All countries | 45,085 | 28,442 |
| Motorcars— | ||
| Australia | 64,336 | 76,082 |
| Germany, Fed. Rep. of | 6,691 | 9,253 |
| Japan | 215,703 | 112,511 |
| United Kingdom | 43,689 | 26,772 |
| All countries | 342,124 | 236,219 |
| Buses, trucks, and vans— | ||
| Australia | 36,957 | 20,836 |
| Japan | 85,365 | 60,989 |
| United Kingdom | 7,583 | 7,939 |
| All countries | 139,231 | 100,332 |
| Scientific, medical, optical, etc., instruments and apparatus— | ||
| Australia | 17,062 | 15,024 |
| Japan | 19,383 | 21,844 |
| United Kingdom | 23,703 | 21,183 |
| U.S.A. | 57,082 | 67,200 |
| All countries | 149,148 | 160,033 |
| Aircraft— | ||
| France | 3,350 | 2,112 |
| Netherlands | 10,145 | 240 |
| United Kingdom | 12,986 | 2,294 |
| U.S.A. | 128,642 | 139,403 |
| All countries | 158,267 | 147,164 |
| Photographic and cinematographic supplies— | ||
| Australia | 15,925 | 12,270 |
| Germany, Fed. Rep. of | 5,290 | 2,728 |
| Japan | 6,030 | 7,211 |
| United Kingdom | 2,912 | 1,927 |
| U.S.A. | 15,967 | 13,087 |
| All countries | 54,204 | 43,554 |
| Printed books and pamphlets— | ||
| Australia | 43,565 | 35,568 |
| United Kingdom | 35,427 | 38,400 |
| U.S.A. | 30,690 | 32,574 |
| All countries | 124,012 | 125,443 |
QUANTITIES OF PRINCIPAL ITEMS IMPORTED—The following table shows the quantities of a number of principal items imported during recent June years.
| Item | Unit of Quantity | Year Ended June | |||
|---|---|---|---|---|---|
| 1980 | 1981 | 1982 | 1983 | ||
* Al. litre—alcohol litre. †Quantity for 1980 and 1981 years recorded in proof litres. ‡For years ended June 1980 and 1981 a conversion factor of 1 tonne = 1205 litres was used. §Excludes hardboards, softboards, wallpaper, lincrusta, and window transparencies. | |||||
| Sugar, not refined | tonne | 151,310 | 119,686 | 146,968 | 156,678 |
| Coffee, raw | tonne | 7,647 | 5,996 | 7,364 | 6,833 |
| Wine of fresh grapes | litre (000) | 1,886 | 2,335 | 3,378 | 2,539 |
| Spirits, liqueurs, and other spirituous beverages over 40 percent proof | al. litre (000)* | 7 335† | 4 043† | 4,252 | 2,899 |
| Tobacco, unmanufactured | tonne | 3,506 | 3,410 | 3,555 | 3,257 |
| Crude rubber, including synthetic and reclaimed | tonne | 25,536 | 21,608 | 23,479 | 20,623 |
| Natural calcium phosphate | tonne (000) | 1,209 | 1,025 | 1,025 | 915 |
| Sulphur, other than sublimed, precipitated | tonne (000) | 249 | 248 | 179 | 210 |
| Crude petroleum | tonne (000) | 2,018 | 2,056 | 1,900 | 1,106 |
| Partly refined petroleum | tonne (000) | 625 | 620 | 358 | 201 |
| Motor spirit (in bulk)‡ | tonne (000) | 551x | 358x | 344x | 627 |
| Kerosene and white spirit (in bulk)‡ | tonne (000) | 386x | 370x | 299x | 315 |
| Distillate fuels | litre (000) | 536,949 | 440,958 | 335,563 | 697,928 |
| Aluminium oxide | tonne | 259,201 | 318,813 | 339,399 | 329,865 |
| Potassium chloride (fertiliser) | tonne | 149,752 | 198,806 | 168,381 | 123,142 |
| Rubber tyres and tubes excl. bicycle | tonne | 4,281 | 4,202 | 4,608 | 5,138 |
| Paper and paperboard§ | tonne | 43,547 | 33,988 | 45,765 | 48,873 |
| Textile yarn and thread | tonne | 10,396 | 8,770 | 11,48 | 11,765 |
| Cotton fabrics, woven, excl. tyrecord | m2(000) | 75,826 | 47,348 | 54,560 | 51,455 |
| Woven textile fabrics of synthetic fibres excl. tyrecord | m2(000) | 74,009 | 55,719 | 67,348 | 59,807 |
| Iron and steel— | |||||
| Bars and rods | tonne | 37,092 | 36,278 | 40,695 | 33,045 |
| Angles, shapes and sections | tonne | 36,630 | 41,221 | 51,962 | 50,712 |
| Universals, plates and sheets | tonne | 340,922 | 279,017 | 388,639 | 318,522 |
| Wire | tonne | 19,534 | 13,817 | 15,862 | 14,527 |
| Tubes, pipes and fittings | tonne | 20,158 | 15,075 | 39,943 | 43,952 |
| Copper and copper alloys excl. foil, powders and flakes | tonne | 12,677 | 12,205 | 15,977 | 14,386 |
| Unwrought zinc | tonne | 22,594 | 19,296 | 22,265 | 18,406 |
| Internal combustion engines (not aircraft) | no. | 149,223 | 124,446 | 113,834 | 108,794 |
| Tractors | no. | 6,343 | 5,432 | 5,201 | 4,129 |
| Metal working machinery | tonne | 3,219 | 3,604 | 3,523 | 4,962 |
| Excavating, levelling and tamping machinery, | no. | 384 | 565 | 898 | 986 |
| Lifting, handling, loading machinery telphers and conveyors | tonne | 2,141 | 1,542 | 4,195 | 6,907 |
| Electric motors | no. | 487,330 | 528,750 | 1,097,036 | 791,765 |
| Thermionic, cold cathode, photocathode valves and tubes | no. (000) | 603 | 704 | 667 | 263 |
| Railway vehicles excl. containers and parts | no. | 5 | 67 | 42 | 33 |
| Motorcars—assembled | no. | 4,977 | 4,301 | 5,051 | 5,567 |
| —unassembled | no. | 6,7,036 | 85,841 | 107,946 | 51,360 |
| Buses, trucks, vans—assembled | no. | 703 | 626 | 575 | 923 |
| —unassembled | no. | 16,962 | 20,090 | 28,619 | 15,408 |
| Aircraft, excl. parts, balloons, airships | no. | 174 | 122 | 187 | 181 |
| Ships and boats excl. those for breaking up (including buoys) | no. | 4,926 | 704 | 1,157 | 2,822 |
VALUE OF PRINCIPAL ITEMS IMPORTED—The following table shows the value of a number of principal items imported during recent June years.
| Item | Year Ended June | |||
|---|---|---|---|---|
| 1980 | 1981 | 1982 | 1983 | |
| * From 1983 only those vessels registered on the New Zealand Register of Ships are included in the import statistics. n.e.s.—not elsewhere specified. | ||||
| $(000) v.f.d. | ||||
| Sugar, not refined | 43,082 | 56,113 | 59,256 | 60,787 |
| Coffee, raw | 27,928 | 17,279 | 20,049 | 24,212 |
| Alcoholic beverages | 30,332 | 27,245 | 43,614 | 36,638 |
| Tobacco, unmanufactured | 13,524 | 14,157 | 19,574 | 20,766 |
| Crude rubber, including synthetic, reclaimed | 30,908 | 28,44: | 32,122 | 28,392 |
| Natural calcium phosphate | 47,572 | 51,822 | 70,669 | 64,371 |
| Sulphur, other than sublimed, precipitated | 11,665 | 24,666 | 23,213 | 32,714 |
| Crude petroleum | 366,163 | 548,321 | 644,148 | 409,951 |
| Partly refined petroleum | 174,091 | 210,482 | 143,744 | 88,414 |
| Motor spirit | 159,554 | 151,164 | 174,288 | 341,522 |
| Kerosene and white spirit | 94,073 | 145,119 | 138,627 | 160,044 |
| Distillate fuels | 105,650 | 130,376 | 114,840 | 257,738 |
| Organic chemicals | 112,215 | 104,708 | 139,472 | 119,565 |
| Aluminium oxide | 42,581 | 70,464 | 99,500 | 103,043 |
| Inorganic chemicals (excl. aluminium oxide) | 61,138 | 68,594 | 89,341 | 86,535 |
| Medicaments, including veterinary | 90,975 | 98,920 | 120,171 | 105,025 |
| Potassium chloride (fertiliser) | 10,103 | 20,549 | 20,710 | 13,444 |
| Polymerisation, copolymerisation products | 123,453x | 116,355x | 170,459x | 138,626 |
| Other plastic materials, regenerated cellulose, artificial resins | 51,056x | 43,538x | 67,618x | 55,348 |
| Articles of rubber, n.e.s. | 27,143 | 30,349 | 37,790 | 37,685 |
| Paper and paperboard | 50,232 | 49,612 | 78,649 | 78,763 |
| Textile yarn and thread | 50,694 | 51,661 | 79,550 | 77,668 |
| Cotton fabrics, woven | 83,703 | 61,684 | 84,383 | 87,032 |
| Woven textile fabrics of synthetic fibres | 92,851 | 81,252 | 105,846 | 94,262 |
| Other woven textile fabrics | 37,643 | 32,813 | 45,841 | 42,793 |
| Special textile fabrics and related products | 32,070 | 39,769 | 60,177 | 54,954 |
| Glass and glassware | 24,564 | 25,384 | 37,321 | 33,106 |
| Iron and steel— | ||||
| Bars and rods | 21,407 | 22,411 | 28,622 | 23,060 |
| Angles, shapes and sections | 14,557 | 19,073 | 28,070 | 25,000 |
| Universals, plates and sheets | 161,920 | 151,438 | 243,792 | 194,973 |
| Wire | 16,514 | 14,374 | 17,899 | 16,127 |
| Tubes, pipes and fittings | 21,161 | 20,926 | 59,163 | 52,016 |
| Copper and copper alloys | 36,720 | 33,839 | 44,908 | 40,952 |
| Unwrought zinc | 17,979 | 16,441 | 25,972 | 20,579 |
| Tools for hand use or in machines | 36,085 | 36,213 | 50,583 | 45,836 |
| Manufactures of metal, n.e.s. | 34,873 | 40,221 | 52,671 | 47,984 |
| Internal combustion engines (not aircraft) | 25,292 | 25,295 | 33,430 | 29,075 |
| Other non-electric power generating machinery | 92,758 | 81,711 | 46,986 | 75,212 |
| Tractors | 57,088 | 48,409 | 62,892 | 57,626 |
| Agricultural machinery and implements (not tractors) | 22,332 | 29,162 | 25,765 | 32,660 |
| Automatic data processing machines and accessories | 47,132 | 72,127 | 99,841 | 93,111 |
| Metal working machinery | 26,609 | 34,748 | 46,113 | 65,984 |
| Textile and leather machinery | 29,324 | 28,082 | 44,855 | 42,003 |
| Excavating, levelling, boring, extracting machinery, etc. | 19,251 | 35,330 | 69,538 | 50,743 |
| Other machines for special industries | 79,303 | 86,692 | 144,604 | 137,254 |
| Pumps and compressors, filtering, etc., machinery, incl. parts | 54,972x | 65,240x | 86,581x | 97,433 |
| Mechanical handling equipment | 27,240 | 24,742 | 50,366 | 61,051 |
| Other non-electric machinery and appliances, incl. parts | 111,591 | 137,752 | 167,149 | 351,217 |
| Electric power machinery | 32,080 | 36,454 | 60,006 | 52,309 |
| Electric switchgear, etc. | 40,356 | 47,155 | 64,254 | 69,329 |
| Telecommunications apparatus | 46,654 | 58,369 | 84,891 | 147,079 |
| Thermionic, etc., valves and tubes, etc. | 26,350x | 26,751x | 35,231x | 32,327 |
| Other electric machinery and apparatus, n.e.s. | 52,403 | 56,284 | 76,947 | 64,240 |
| Railway vehicles | 17,940 | 34,144 | 45,085 | 28,442 |
| Motorcars—assembled | 26,917 | 23,740 | 33,838 | 41,202 |
| —unassembled | 188,513 | 237,036 | 308,286 | 195,018 |
| Buses, trucks and vans—assembled | 4,026 | 3,402 | 6,247 | 8,200 |
| —unassembled | 86,609 | 96,851 | 132,983 | 92,132 |
| Farts, accessories of tractors and motor vehicles (not motor cycles) | 60,968 | 59,258 | 72,381 | 57,409 |
| Aircraft | 35,583 | 266,944 | 158,267 | 147,164 |
| Ships and boats | 105,591 | 66,907 | 53,662 | 2,634* |
| Scientific, medical, optical, etc., instruments and apparatus | 92,694 | 116,757 | 149,148 | 160,033 |
| Photographic and cinematographic supplies | 35,207 | 40,066 | 54,204 | 43,554 |
| Printed books and pamphlets (including maps, etc.) | 87,860 | 98,532 | 124,012 | 125,443 |
IMPORTS BY BROAD ECONOMIC CATEGORY—In the following table imports are classified by broad economic category (B.E.C.).
| Category | Year Ended June 1983 | |
|---|---|---|
| $(000) | Percent | |
| Food and Beverages— | ||
| Primary— | ||
| Mainly for industry | 97,507 | 1.28 |
| Mainly for household consumption | 99,180 | 1.31 |
| Processed— | ||
| Mainly for industry | 95,705 | 1.26 |
| Mainly for household consumption | 136,483 | 1.80 |
| Total, food and beverages | 428,875 | 5.65 |
| Industrial Supplies, n.e.s.— | ||
| Primary— | ||
| Food | 45 | – |
| Tobacco | 23,256 | 0.31 |
| Crude materials, inedible (except fuels) | 220,890 | 2.91 |
| Animal and vegetable oils, fats and waxes | 5 | – |
| Manufactured goods | 377 | – |
| Other | 18 | – |
| Processed— | ||
| Food | 3,892 | 0.05 |
| Crude materials (except fuels) | 169,917 | 2.24 |
| Petroleum products (n.e.s.) | 42,204 | 0.56 |
| Animal and vegetable oils and fats | 4,945 | 0.07 |
| Chemicals and related products, n.e.s. | 692,250 | 9.11 |
| Manufactured goods | 1,209,488 | 15.92 |
| Electrical machinery | 37,434 | 0.49 |
| Miscellaneous manufactured articles | 87,667 | 1.15 |
| Commodities, n.e.s. | 9,493 | 0.12 |
| Total, industrial supplies, n.e.s. | 2,501,881 | 32.94 |
| Fuels and Lubricants— | ||
| Primary— | ||
| Fuel wood | 1 | – |
| Coal, and coke | 249 | – |
| Petroleum | 429,632 | 5.66 |
| Natural gas | – | – |
| Processed— | ||
| Motor spirit | 358,826 | 4.72 |
| Other | 592,603 | 7.80 |
| Total, fuels and lubricants | 1,381,311 | 18.19 |
| Capital Goods and Parts and Accessories— | ||
| Capital Goods (Excludes Transport Equipment)— | ||
| Machinery | 1,116,543 | 14.70 |
| Other manufactured goods | 190,108 | 2.50 |
| Other capital goods (animals for breeding) | 213 | – |
| Parts and Accessories— | ||
| Machinery | 439,558 | 5.79 |
| Other manufactured goods | 31,083 | 0.41 |
| Total, capital goods, and parts and accessories | 1,777,505 | 23.40 |
| Transport Equipment, Parts and Accessories— | ||
| Passenger Motor Cars— | ||
| Passenger motor cars, unassembled | 213,614 | 2.81 |
| Passenger motor cars, other | 52,110 | 0.69 |
| Other— | ||
| Industrial | 276,665 | 3.64 |
| Non-industrial | 30,013 | 0.40 |
| Parts and accessories | 190,001 | 2.50 |
| Total, transport equipment, parts and accessories | 762,403 | 10.04 |
| Consumer Goods, n.e.s.— | ||
| Durable— | ||
| Manufactured goods | 15,795 | 0.21 |
| Machinery | 57,279 | 0.75 |
| Miscellaneous manufactured articles | 68,681 | 0.90 |
| Semi-durable— | ||
| Manufactured goods, n.e.s. | 74,564 | 0.98 |
| Miscellaneous manufactured articles | 124,895 | 1.64 |
| Non-durable— | ||
| Tobacco | 1,371 | 0.02 |
| Chemicals and related products | 135,433 | 1.78 |
| Manufactured goods | 20,562 | 0.27 |
| Miscellaneous manufactured articles | 164,764 | 2.17 |
| Other (cut flowers) | 702 | 0.01 |
| Total, consumer goods, n.e.s. | 664,048 | 8.74 |
| Goods, n.e.s. | 79,805 | 1.05 |
| Total, Merchandise Trade | 7,595,828 | 100.00 |
n.e.s.—not elsewhere specified.
TRADE BY PORTS BY DOLLAR VALUE—In 1983 New Zealand's export trade was loaded out through 19 ports and 5 airports, with imports landing at 17 ports and the same 5 airports. Auckland was by far the busiest port with 40 percent of the imports and 27 percent of the exports; second was Wellington with 15 percent and 16 percent respectively. Whangarei, because of the crude oil imports to the Marsden Point oil refinery, was third on 9 percent, with Otago and Tauranga exporting New Zealand products equal third on 9 percent.
Trade by air is now becoming significant with 14 percent of imports being landed at New Zealand airports, and 10 percent of exports going out by air. Over 80 percent of the imports and exports by air are handled through Auckland airport.
The following table gives figures on the value of New Zealand's export trade loaded and unloaded at ports and airports for the year ended December 1983.
| Port | Year Ended December 1983* | |||
|---|---|---|---|---|
| Loaded | Unloaded | |||
| * Provisional. | ||||
| f.o.b. value | tonnes | c.i.f. value | tonnes | |
| $(000) | (000) | $(000) | (000) | |
| Opua | 1,512 | 796 | – | – |
| Whangarei | 47,725 | 28,419 | 728,604 | 1,684,343 |
| Auckland | 2,196,148 | 1,125,125 | 3,187,465 | 1,869,550 |
| Onehunga | 56,205 | 42,049 | 2,941 | 2,914 |
| Tauranga | 752,270 | 1,560,463 | 159,179 | 554,193 |
| Taharoa | 25,203 | 1,531,343 | – | – |
| Gisborne | 11,046 | 27,648 | 59 | 21 |
| Taranaki | 285,785 | 237,201 | 387,994 | 253,085 |
| Napier | 461,514 | 612,293 | 152,631 | 307,980 |
| Waverley | 13,420 | 934,309 | – | – |
| Wanganui | – | – | – | – |
| Wellington | 1,268,670 | 488,960 | 1,181,604 | 757,854 |
| Tarakohe | 3,172 | 73,662 | 3,183 | 6,247 |
| Nelson | 120,312 | 505,131 | 31,411 | 36,362 |
| Picton | 3,842 | 10,602 | 27 | 41 |
| Westport | 1,216 | 14,730 | 10 | 3 |
| Lyttelton | 537,158 | 454,603 | 480,242 | 457,458 |
| Timaru | 208,291 | 199,907 | 64,159 | 111,226 |
| Otago | 763,278 | 432,526 | 195,795 | 149,180 |
| Bluff | 566,859 | 500,165 | 241,025 | 746,072 |
| Total, all seaports | 7,323,626 | 8 779 932 | 6,816,330 | 6 936 530 |
| Auckland Airport | 643,379 | 42,546 | 937,468 | 21,244 |
| Whenuapai Airport | 338 | 18 | – | – |
| Ohakea Airport | 1 | 1 | 1 | |
| Wellington Airport | 63,612 | 4,763 | 127,064 | 2,630 |
| Christchurch Airport | 74,039 | 5,611 | 61,592 | 1,836 |
| Total, all airports | 781,369 | 52 939 | 1,126,125 | 25 710 |
| Total, parcels post | 13,163 | 165 | 56,177 | 1 191 |
| Grand Total | 8,118,158 | 8 833 037 | 7,998,633 | 6 963 431 |
FURTHER INFORMATION—Further information on New Zealand's external trade and external economic relations in general will be found in the following publications and sections of this Yearbook.
Department of Statistics publications:
Monthly Abstract of Statistics.
Pocket Digest of Statistics (annual).
Exports: Final Statistics (annual).
Imports: Final Statistics (annual).
Report and Analysis of External Trade (annual).
Shipping and Cargo Statistics (annual bulletin).
Report of the Ministry of Foreign Affairs (Parl. paper A. 1).
Report of the Department of Trade and Industry (Parl. paper G. 14).
White Paper on the GATT Multilateral Trade Negotiations (Parl. paper G 14A 1979).
New Zealand Standard Classifications—Department of Statistics:
N.Z. Statistical Classification of Exports.
N.Z. Statistical Classification of Imports.
N.Z. Standard Country Code (NZSCC).
A number of trade agreements, conventions, exchanges of letters, etc., are published in the “A” series of parliamentary papers.
Export News—Department of Trade and Industry.
How to Export—Department of Trade and Industry.
Other Yearbook sections:
2. History, Government, and International Relations.
19. Manufacturing.
22A. Marketing of Farm Produce.
The New Zealand Customs Tariff dates back to June 1841 when the first Customs Regulation Ordinance was passed. In the latter half of the nineteenth century and the first two decades of the present century, tariff policies were unsophisticated and tended to reflect the prevailing economic philosophy, the development of the country's agricultural base, and the British preferential system. From 1921, however, tariff policies directed at encouraging and protecting manufacturing industries were given greater importance. This policy evolution received a temporary check following the Ottawa Agreement of 1932 whereby, in return for concessions from the United Kingdom related to New Zealand's agricultural products, further preferences were accorded to British goods and some constraint placed on the use of the tariff for purely protective purposes. Recently the emphasis has moved away from quantitative restrictions towards tariffs as the principal means of protection for domestic industry.
The structure of the tariff was changed from 1 July 1962 when the Standard International Trade Classification was adopted. Since 1 July 1967, however, the tariff has been based on the Customs Co-operation Council Nomenclature (CCCN).
Consequential to the United Kingdom's decision to enter the European Economic Community, preferences on goods of United Kingdom origin were phased out, the process having been completed on 1 July 1977 with the exception of certain automotive products. Commonwealth Preferential Country rates were discontinued from 1 July 1978 but the former recipients of these preferences benefited in lieu from New Zealand's extended Generalised System of Preferences favouring developing countries.
On 1 July 1978 a fully revised Customs Tariff was introduced based on the recommendation of a Tariff Review Committee which had been given a 2-year period to put forward proposals to make the tariff compatible with modern trading conditions, industrial development requirements, and administrative facility. Tariff rates were set consistent with the committee's terms of reference which required, inter alia, an assessment to be made of rates necessary to accord domestic industry a reasonable level of protection against competing imports disregarding the existence of other forms of protection.
The tariff reduced the number of individual tariff items from approximately 4700 to some 2500 and also provided for the collection of statistics on a more detailed basis.
The 1978 review also identified a number of industries where further consideration was necessary and these formed the basis of an industry study programme. These included textiles and apparel, plastics and wine. Changes were made to the tariff as a result of these studies.
A reprint of the tariff was introduced with effect from 1 January 1983, in order to implement the CER tariff phasing.
The rates of customs and excise duty enforced in New Zealand are set out in the publication entitled The Customs Tariff of New Zealand available from the Government Printer, Wellington.
OBJECTIVES OF THE TARIFF—The objectives of the Customs Tariff can be summarised as:
The development of New Zealand industries.
The implementation of New Zealand's tariff commitments in multilateral and bilateral trade agreements.
Harmonisation with New Zealand's external political objectives including the provision of assistance to developing countries.
The collection of revenue.
GENERAL AGREEMENT ON TARIFFS AND TRADE (GATT)—New Zealand was one of the original members of the General Agreement on Tariffs and Trade reached in Geneva in 1947 and has since taken an active part in the work of the GATT in attaining its general objective of reducing barriers to trade and providing a forum for the discussion and settlement of international trade problems and disputes.
The majority of the world's trading nations have now become contracting parties to the GATT and entitled to most-favoured-nation treatment. The non-discriminatory provisions within the GATT assist New Zealand to at least some degree in promoting its objective in seeking the right to trade on a multilateral basis.
The results of the tariff negotiations which took place in 1947 and on subsequent occasions are embodied in schedules to the General Agreement and are applied multilaterally so that New Zealand receives the benefit of reductions made by all participants and, conversely, accords reciprocal concessions to all other contracting parties. These concessions are of two kinds—actual reductions in duty rates and bindings on duties against increase.
Developments have, however, tended to whittle away most of the trading advantages which countries relying heavily on agricultural exports might reasonably expect to get from GATT membership. There has been a growing disparity between the benefits accruing under GATT to the industrialised nations and the far less tangible advantages it provides for primary producing countries such as New Zealand. This has been due principally to the maintenance of quantitative restrictions on agricultural products by most of the large industrialised countries as an aspect of their policies of agricultural protectionism.
The Kennedy Round of negotiations which was concluded in June 1967 did not correct this imbalance although New Zealand did obtain improved access and some tariff concessions on a limited range of products exported to some GATT countries in compensation for a reduction in rates of duty of up to 50 percent on a number of items. A new round of multilateral trade negotiations was initiated in Tokyo in September 1973. New Zealand took an active part in these negotiations whilst making it clear that the extent of its contribution to a successful outcome was dependent upon improvements in conditions of trade relating to products of principal export interest. New Zealand's global tariff offer represented a “binding” of certain tariff rates provided for by the revised tariff introduced from 1 July 1978, and covered items with a trade value of around $579 million. In addition, New Zealand made offers in the context of bilateral negotiations whereby participants exchanged requests for and offers of trading concessions on both tariff and non-tariff barriers affecting agricultural and industrial products. New Zealand also participated in a series of multilateral negotiations aimed at the formulation of codes of conduct, elaborating on or in addition to the existing GATT rules on international trade.
Useful concessions were obtained by New Zealand on tariffs and access for our major export products, particularly as the result of bilateral negotiations with the United States, the EEC, and Canada. Some benefit is also expected to derive from the multilateral arrangements negotiated on dairy and meat products, as well as the extensive tariff reductions which will be made by participating countries over the next few years on manufactured goods. A major disappointment for New Zealand was that the negotiations failed to grapple with the basic problems of agricultural protectionism and access, leaving relatively untouched the differences in rules and attitudes which exist between trade in industrial and agricultural products.
PREFERENCES AND OTHER BILATERAL TRADE AGREEMENTS: United Kingdom—A radical change in New Zealand's trade and tariff policy was necessitated by the United Kingdom's decision to enter into the European Economic Community on 1 January 1973 and the effect of this action on New Zealand's exports to that country. Consequently the New Zealand - United Kingdom Trade agreement was abrogated on 31 January 1973. The tariff preferences accorded to British goods in the New Zealand market were accordingly phased out in 4 steps which began on 1 July 1974 and were completed by 30 June 1977, except in the case of a range of automotive products.
Australia—During February 1983, the Australia - New Zealand Closer Economic Relations Trade Agreement was signed. This agreement gave effect to the understanding between Governments contained in the Heads of Agreement signed on 14 December 1982 and came into force on 1 January 1983. It replaces the 1933 Trade Agreement between Australia and New Zealand, the 1965 New Zealand-Australia Free Trade Agreement, and the 1977 Agreement on Tariff and Tariff Preferences.
The impetus behind the agreement lay in the belief that such an arrangement would bring economic and social benefits to both countries, and expand economic and trading links with other countries, particularly those of the South Pacific and South-East Asia. While the NAFTA had lead to significant growth in bilateral trade it was considered desirable that a new arrangement be entered into, based on eventual free trade of all goods which would better service the interests of Australia and New Zealand in the changing international economic environment.
The CER Agreement sets down detailed procedures for the gradual elimination of barriers to trade between Australia and New Zealand, set to an agreed timetable to minimise disruption. The liberalisation procedures will lead to the elimination of duties and quantitive restrictions on goods produced or manufactured within both countries. These procedures apply to all goods from 1 January 1983 with the exception of a limited number of product groupings such as plastics and wine, for which a modified programme for liberalisation will apply. Other products such as rubber, apparel, certain iron or steel products and motor vehicles and components have been deferred temporarily pending the completion of industry reviews and agreement between the 2 countries on how these goods can best be brought into the agreement.
Apart from provisions for the elimination of barriers to trade the agreement includes undertakings and detailed procedures in respect of such matters as dumping and countervailing action, intermediate goods issues, export incentives and safeguard measures to ensure that trade between Australia and New Zealand develops under conditions of fair competition.
Canada—On 25 September 1981 a Trade and Economic Co-operation Agreement between the Governments of New Zealand and Canada was signed. This agreement came into force on 1 January 1982 and replaced the 1932 Trade Agreement and the 1970 amending Protocol as well as the 1973 Interim Preferences Agreement. It is designed to provide a framework for the development of a broader economic relationship between the 2 countries based on the present international trading environment. The agreement provides for the encouragement of bilateral trade and the facilitation of increased economic and technological co-operation.
The agreement provides that neither country should apply against goods originating in the other country, rates of duty higher than those in force on 1 January 1982. In cases where it is proposed to increase a rate of duty or reduce a margin of preference, provision has been made for consultation to take place. Consultations must also take place in an effort to reach a satisfactory solution where it is found that goods are being imported under conditions which constitute dumping.
The agreement also sets out new rules of origin, provision to consult on non-tariff measures, e.g., import licensing, and provisions in respect of agricultural, horticultural, and forestry products.
Malaysia—A trade agreement between Malaysia and New Zealand was signed in February 1961 by which each country accords preferential rates of duty to the other. Both countries agreed to guarantee minimum margins of tariff preference which apply to certain important items in each other's trade.
Developing Countries—New Zealand responded to the recommendation of the United Nations Committee on Trade and Development (UNCTAD) that developed countries introduce Generalised Systems of Preference in favour of developing nations, and special developing country rates were incorporated in the Customs Tariff as from 1 January 1972.
When New Zealand introduced a revised Generalised System of Preference (GSP) on 1 July 1976 the new scheme was based on the negative-list concept and significantly increased the GSP coverage granted previously. Every effort was made to keep the list of exceptions to the minimum to give the greatest possible coverage to the scheme. Based on figures for the year ended 30 June 1983, total value of imports from GSP beneficiaries was $1,550 million, compared with $1,589 million for the year ended 30 June 1982.
The revised GSP was based on an intention to maintain, in terms of GSP criteria, specified margins of preference for developing countries up to a level of 20 percent. Since 17 December 1976 special provisions have been made for the duty-free importation of specified handicraft products.
Pacific Forum Islands—At the eleventh South Pacific Forum held in Kiribati in July 1980 the South Pacific Regional Trade and Economic Co-operation Agreement (SPARTECA) came into existence. Under this agreement New Zealand and Australia will provide on a non-reciprocal basis duty-free and unrestricted access into their markets for most of the products exported by the Forum Island countries.
The agreement took effect on 1 January 1981 and except for items subject to revenue duties and a few items of particular sensitivity to New Zealand the revised Customs Tariff introduced from that date reflected the duty-free access provisions of the agreement.
In New Zealand's case the preferential tariff applies only to goods of Pacific Island origin, which are either wholly obtained in the preferential area or partly manufactured in the area, where the Pacific Island and/or New Zealand content exceeds a nominated level which, except in special circumstances related to the development needs of smaller island countries, is set at 50 percent of factory cost.
OTHER TRADE OBLIGATIONS—New Zealand is also a party to certain commercial treaties, conventions, and arrangements with countries outside the Commonwealth resulting from direct negotiations with the countries concerned. In practice, some of the earlier arrangements (which generally provided for reciprocal most-favoured-nation tariff treatment) became superseded by New Zealand's accession to the General Agreement on Tariffs and Trade. Trade agreements which are still operative include those with Switzerland (1938 and since extended to Liechtenstein in 1956); the Federal Republic of Germany (1959, amended 1977); Japan (1958, amended 1962); the Union of Soviet Socialist Republics (1963, protocol 1973); the Polish People's Republic (1965); Republic of Korea (1967, amended 1976); People's Republic of Bulgaria (1968); Republic of Philippines (1968, amended 1976); Hungarian People's Republic (1970, revised and superseded 1978); The People's Republic of China (1973); Iran (1974); Socialist Federal Republic of Yugoslavia (1975); Arab Republic of Egypt (1977); German Democratic Republic (1978); Indonesia (1978); the Socialist Republic of Romania (1979); and the Republic of Iraq (1982).
ELIGIBILITY OF GOODS FOR TARIFF PREFERENTIAL RATES—In order to qualify for entry at preferential rates imported goods must meet certain origin requirements before they can be deemed to be the produce or manufacture of the countries entitled to the preferences. The provisions are contained in the Customs Regulations 1968 as amended. In general, with minor variations, they include the following:
Goods wholly the produce of such countries.
Goods wholly manufactured in such countries from unmanufactured raw materials and/or (in some instances) from 1 or more of the imported partly-manufactured materials which are enumerated in the regulations.
Goods “wholly obtained”. (This provision applies only to South Pacific Forum Island countries and Developing Country Preferences and is instead of provisions (a) and (b).)
Goods partly manufactured in such countries, provided that the final process of manufacture has been performed in such countries, and also that the expenditure in material produced in such countries and/or other items of factory or works cost incurred in such countries in respect of each article is not less than half of the factory or works cost of the article in its finished state.
EXCISE—Excise duties are levied on alcohol used in manufacturers' warehouses licensed under the Customs Act 1966, locally produced beer, potable spirits, tobacco, and cigarette papers. These are the traditional “revenue” goods of New Zealand for which the Customs Department has responsibility.
In addition to the responsibility for the collection of Excise duty, the department also has to ensure the revenue is safeguarded on alcohol distilled in New Zealand for use as fuel, as a fuel extender, or for industrial purposes.
The following table shows net revenue from Customs and Excise duties for the past 5 years.
| Year Ended 31 March | Customs and Excise Duties (Including Foreign Fishing Vessel Tax But Excluding Beer Duty) | Sales Tax (Including Travel Tax and Departure Tax) | Beer Duty | Motor Spirits Duty | Other Receipts | Total |
|---|---|---|---|---|---|---|
| $(thousand) | ||||||
| 1979 | 286,129 | 465,583 | 58,853 | 281,965 | 5,096 | 1,097,626 |
| 1980 | 331,622 | 639,693 | 58,159 | 289,377 | 8,123 | 1,326,974 |
| 1981 | 349,320 | 791,411 | 64,283 | 284,058 | 7,338 | 1,496,410 |
| 1982 | 475,091 | 1,106,917 | 74,338 | 295,390 | 8,852 | 1,960,588 |
| 1983 | 511,844 | 1,237,035 | 149,138 | 331,936 | 12,858 | 2,242,811 |
Motor spirits duty paid into the National Roads Fund has been excluded from Customs duties. Customs revenue as a proportion of taxation is discussed in Section 27, Central Government Finance.
INTERNATIONAL COMMODITY AGREEMENTS: Sugar—New Zealand's annual requirement for sugar is approximately 160 000 tonnes. From 1973 the bulk of this was imported from Australia and Fiji under long-term contracts. Additional cargoes have been purchased from Cuba, Mauritius, the Philippines and Thailand. The Australia - New Zealand Sugar Agreement expires in December 1984 and the Fiji - New Zealand Agreement which expired in 1983 has yet to be renegotiated due to adverse weather affecting the 1983 crop and planting for the 1984 season. This agreement will be renegotiated when sugar from that source becomes available again.
In an effort to exert a greater control over market forces, producers and consumers have repeatedly made efforts over the past 20 years to encourage market stability through the implementation of a number of International Sugar Agreements. These agreements incorporate mechanisms that regulate the supply and price of sugar on world markets. Under the agreements exporters undertake to regulate their sales on the free market according to agreed quotas, while importers are to restrict their purchases from non-members during times when sugar prices remain within the range specified in the agreement. New Zealand has been a member of the International Sugar Agreements in 1958, 1968, and 1978.
Coffee—New Zealand is a party to the International Coffee Agreement 1983. New Zealand was also a party to the previous 1968 and 1976 International Coffee Agreements.
Under the 1976 agreement provisions had been incorporated for adjusting basic quotas, regulating imports whenever quotas were in effect, and recording international coffee trade. As from 1 November 1930 the International Coffee Organisation has instructed importing countries to adopt the economic provisions of the International Coffee Agreement. As importers of coffee, therefore, we are required to limit our imports to a level within the global quota and to limit our annual imports from non-members to quantities established under the provisions of the Agreement.
FURTHER INFORMATION—Further information on Customs tariff and revenue and on trade agreements will be found in the following publications.
Report of the Customs Department (Parl. paper B. 24)
Report of the Department of Trade and Industry (Parl. paper G. 14)
White Paper on the GATT Multilateral Trade Negotiations (Parl. paper G. 14A 1979)
International Sugar Agreement, 1977 (Parl. paper A. 50 1979)
International Coffee Agreement, 1976 (Parl. paper A. 17 1979)
Trade agreements with individual countries are published as parliamentary papers in the “A” series.
CONTROL AND STABILISATION OF PRICES—The principal enactments affecting the control of prices of goods and services are the Commerce Act 1975 and the Economic Stabilisation Act 1948.
Under the former statute a Positive List of Controlled Goods and Services is published by the Minister of Trade and Industry. Increases in the prices of goods and services included in this list are subject to the approval of the Secretary of Trade and Industry or, in the case of specified energy products, the Secretary of Energy. Applicants for price increases who are subject to this form of control may appeal to the Commerce Commission if they are dissatisfied with the Secretary's decision. Goods and services at present on the Positive List include motor vehicles, cement, pharmaceuticals, fertilisers, canned foods, sugar, flour, butter, and soap, and freight forwarding charges.

Many domestic transport services have been subject to price control in terms of the Transport Act 1962. These provisions were subject to alteration as from 1 June 1984 with Part II of the Transport Amendment Act 1982 taking effect from that date. This left only taxi services subject to price control. Air transport charges are subject to surveillance by the Air Services Licensing Authority in accordance with the provisions of the Air Services Licensing Act 1983.
Regulations have been made from time to time under the Economic Stabilisation Act 1948 for the purpose of restraining and monitoring increases in the prices of most other goods and services which are not controlled by the direct supervision of a statutory pricing authority. The current regulations in force are the Price Freeze Regulations 1984.
The Commerce Act 1975—Part IV of the Commerce Act provides for goods and services to be placed under price control, and allows regulations to be made placing goods and services under price restraint. Decisions take the form of price orders or special approvals, and the Secretary of Trade and Industry is required on request to give the reasons for a decision to the applicant. The Commerce Commission sits as an independent judicial authority for the determination of appeals from decisions of the Secretary of Trade and Industry.
Decisions of the Secretary of Trade and Industry are made following investigations upon receipt of an application in accordance with procedures set out in the Act. Provision is also made for the Secretary to review prices on his own initiative with the consent of the Minister of Trade and Industry. Before making a determination in respect of an application or following a review on his own initiative, the Secretary is required by the Act to take certain criteria into account.
Criteria considered by the Secretary of Trade and Industry or the Commerce Commission in dealing with pricing matters include the costs of production and distribution of the goods concerned; the ability of the applicant to absorb costs; profit margins and the return on capital employed by the applicant; improvements in productivity and efficiency; and market competition.
The Ministry of Energy Act 1977 transferred to the Secretary of Energy all the functions, powers and duties conferred on the Secretary of Trade and Industry by Part IV of the Commerce Act 1975 with respect to energy products included in the Positive List.
The Price Freeze Regulations 1984—These regulations came into force on 19 July 1984, replacing the Economic Stabilisation (Prices) Regulations 1983. They expire on 19 October 1984. Together with the Professional Charges (Price Freeze) Regulations 1984, they bring into effect a freeze on prices and professional fees. Specified exceptions include cases of hardship, or where increased costs directly result from higher import prices following the devaluation of the New Zealand dollar on 18 July 1984.
The Rent-Freeze Regulations 1982 also terminated on 29 February and were replaced by the Rent Limitation Regulations 1984. These new regulations limit rent increases to 3 percent with provision for larger increases where rents have not increased since March 1981.
Consumer Affairs—Consumer legislation in New Zealand is administered by a number of Government departments. The main legislation, together with those departments responsible for them are listed below:
Department of Justice—
Sale of Goods Act
Layby Sales Act
Hire Purchase Act
Motor Vehicles Act
Contractual Remedies Act
Credit Contracts Act
Minors Contracts Act
Unsolicited Goods and Services Act
Department of Health—
Food and Drug Act Poisons and Medicines Acts
Department of Labour—
Weights and Measures Act
Department of Trade and Industry—
Consumer Information Act
Safety of Childrens Night Clothes Act
Wool Labelling Act
Door to Door Sales Act
Merchandise Marks Act
Commerce Act
Complaints relating to legislation administered by the Departments of Health, Labour, or Trade and Industry may generally be directed to the department concerned. The Department of Justice, on the other hand, has no enforcement role, and with cases involving the legislation it administers a complainant's course of action is through the courts or small claims tribunals. Since the enactment of the Small Claims Tribunals Act 1976, 18 small claims tribunals have been established throughout New Zealand.
A complaints advisory service run by the Consumers' Institute is located in each of the 4 main centres. In addition, Citizens Advice Bureaus have been set up in many places and these deal with consumer complaints. In several centres, too, voluntary Community Law Centres have been set up to provide assistance for those with legal problems.
CONSUMER COUNCIL—The Consumer Council's functions are to protect and promote the interests of consumers of goods and services and by so doing to encourage the improvement and development of industry and commerce. The council was established in 1959 and reconstituted an independent body under the Consumer Council Act 1966. The council consists of 16, 12 members appointed solely on the basis of personal qualifications by a representative Appointments Committee. The permanent heads of the Departments of Trade and Industry, Scientific and Industrial Research, Health and Education are also represented on the council.
The council has appointed District Consumer Committees in Auckland, Christchurch, and Dunedin, and supports the Dunedin Consumer Association. The Council lays down the policies to be followed by the staff of the Consumers' Institute. The institute's work includes comparative tests and surveys of consumer goods and services; research into and advice on legal, financial, and welfare matters; representations to parliamentary committees and public inquiries; consumer education; a complaints advisory service; and liaison with business, trade, and safety associations.
Citizens are encouraged to become members of Consumers' Institute at an annual subscription of $13. At the end of 1983, 120 000 members received the monthly magazine Consumer. Members are entitled to purchase other Institute publications, some of which can also be purchased from bookshops. Consumer Action is made available to schools, and information is given through the media.
Membership subscriptions and sales of publications provide about 57 percent of the institute's finance. The remainder comes from Government grants and selected non-commercial sources. While the institute liaises and co-operates with others, it maintains complete independence and impartiality.
The Consumer Council is a council and executive member of the International Organisation of Consumers Unions, and co-operates with and assists other consumer organisations throughout the world.
PRICE STATISTICS—Prices of a large number of goods and services are collected periodically by the Department of Statistics with the primary object of compiling various index number series. The fields covered are external trade (imports, exports), household expenditure (retail prices, urban house property), the Stock Exchange (shares, dividend yields), wool auction prices, farm costs, capital expenditure, and industrial production (input and output prices).
It is usually possible to subdivide an index series into component group indexes which are often more relevant to specific applications than a combined series. Component group indexes are published in the Monthly Abstract of Statistics and in the annual volume, Prices, Wages, and Labour (Part A: Prices). Subdivisions of indexes not shown in these publications may be available on request.
Price indexes are constructed from prices weighted to reflect the importance of each ratio to the sector as a whole. Changes in the importance of individual items to a sector require periodic revisions of weights.
CONSUMERS PRICE INDEX—The Consumers Price Index (CPI) measures changes in the general level of the prices of the goods and services which households purchase; it thus provides the best available measure of the effect of changes in retail prices on the average household budget. Index series of retail prices have a long history in New Zealand, starting with a food and rent index for the 4 chief centres from 1891, and increasing in comprehensiveness as to both commodity and geographical coverage over successive series since that time. The most recent revisions to the Consumers Price Index were made in 1965, 1974, 1977, 1980, and 1984.
The basic objective of the Consumers Price Index is to provide a multi-purpose indicator of retail price changes of those goods and services which are purchased by individuals living in New Zealand. The weights in the Consumers Price Index are based on the pattern of expenditure of the population and, over the full period for which the Consumers Price Index has been compiled, this has shown considerable alterations. Analysis of any long-term time series must involve consideration of the effects of such changes in the pattern of expenditure.
The salient features of the Consumers Price Index may be summarised as follows:
The basic formula used is that of Laspeyres in its aggregative form.
The number of published regimen items excluding fresh fruit and vegetables is 392.
The sources of group and commodity weights are the average expenditure per household from the Household Expenditure Survey, supplemented by cross checks from other statistical sources. Where considered appropriate, the base weights assigned to selected items represent expenditure on kindred items not selected for pricing.
Prices for most items are collected by field officers in 25 centres, including 3 combined areas. Some are obtained by mail.
Index numbers are compiled for all food and food subgroups at monthly intervals, and for all other groups and subgroups at quarterly intervals.
Index numbers are published for 7 chief market centres and 12 larger market centres individually. Combined index numbers are also published for each of these two groupings and for all centres combined. Each centre and grouping of centres is shown on its own base.
Expenditures on the following items are, for various reasons, excluded: direct taxation; purchases of shares, bonds or debentures; payments to superannuation funds and the like; savings; collectors' items; gambling; court fines; legal expenses for traffic cases, criminal and civil cases, estates, family settlements, divorces, adoptions, etc.; charitable and church donations; wages of domestic servants, home aids, home nurses, jobbing gardeners, etc.; catering and other service charges for private receptions; training, racing and stabling fees for race or trotting horses; purchase, boarding and breeding charges for animals; grazing fees and fees for pony clubs; overseas holidays (other than air fares); baby-sitting fees; life insurances other than those directly related to mortgage repayments; and interest charges on revolving credit schemes such as charge accounts and credit cards.
Full details on index methodology and changes between successive revisions are given in the publications listed under Further Information. Revisions are normally carried out every three years. The latest revision (on base December Quarter 1983 = 1000) was a limited one, mainly concerned with updating the commodity expenditure weighting pattern on which the index is based.
Changes in the expression bases do not alter percentage movements between index numbers, although some variation may be expected from the rounding of decimals.
The first Consumers Price Index table supplies all-groups index numbers and index numbers of individual groups and subgroups for 25 centres combined. The group and subgroup weights are also shown as percentages of the base expenditure.
| CONSUMERS PRICE INDEX (ALL GROUPS)—TWENTY FIVE MARKET CENTRES COMBINED | |||||||
|---|---|---|---|---|---|---|---|
| Base: Weighted average twenty-five centres, December Quarter 1983 (= 1000) | |||||||
| Period | Food | Housing | Household Operation | Apparel | Transportation | Miscellaneous | All Groups |
| Groups— | |||||||
| Percentages of base expenditure | 18.35 | 21.00 | 16.00 | 6.37 | 18.22 | 20.06 | 100.00 |
| December year annual average— | |||||||
| 1981 | 840 | 694 | 848 | 802 | 810 | 787 | 791 |
| 1982 | 944 | 866 | 963 | 898 | 934 | 914 | 919 |
| 1983 | 982 | 983 | 996 | 974 | 991 | 988 | 987 |
| Quarter ended— | |||||||
| 1983–31 Mar | 968 | 963 | 992 | 945 | 979 | 978 | 973 |
| –30 Jun | 972 | 979 | 996 | 974 | 991 | 982 | 983 |
| –30 Sep | 988 | 989 | 997 | 977 | 995 | 992 | 991 |
| –31 Dec | 1000 | 1000 | 1000 | 1000 | 1000 | 1000 | 1000 |
| 1984–31 Mar | 1001 | 1014 | 1002 | 1002 | 1014 | 1005 | 1007 |
| –30 Jun | 1024 | 1043 | 1011 | 1014 | 1034 | 1035 | 1029 |
| CONSUMERS PRICE INDEX—(ALL GROUPS)—TWENTY-FIVE MARKET CENTRES COMBINED | ||||||||
|---|---|---|---|---|---|---|---|---|
| Base: Weighted average twenty-five centres, December Quarter 1983 (=1000) | ||||||||
| Period | Food | Housing | Household Operation | |||||
| Fruit and Vegetables | Meat. Fish. and Poultry | Other Foods | Rentals | Home Ownership | Fuel and Light | Household Furnishings | Household Supplies and Services | |
| Subgroups— | ||||||||
| Percentage of base expenditure | 2.70 | 4.53 | 11.11 | 3.17 | 17.83 | 2.43 | 8.51 | 5.06 |
| December year annual average— | ||||||||
| 1981 | 809 | 816 | 855 | 785 | 679 | 856 | 851 | 839 |
| 1982 | 901 | 903 | 968 | 931 | 855 | 977 | 959 | 965 |
| 1983 | 970 | 956 | 994 | 992 | 981 | 1006 | 991 | 1000 |
| Quarter ended— | ||||||||
| 1983–31 Mar | 953 | 916 | 990 | 988 | 959 | 1010 | 983 | 999 |
| –30 Jun | 950 | 931 | 992 | 989 | 977 | 1009 | 991 | 1000 |
| –30 Sep | 978 | 975 | 993 | 992 | 988 | 1005 | 992 | 1002 |
| –31 Dec | 1346 | 1000 | 1000 | 1000 | 1000 | 1000 | 1000 | 1000 |
| 1984–31 Mar | 992 | 991 | 1008 | 1026 | 1012 | 1000 | 1003 | 1001 |
| –30 Jun | 1014 | 997 | 1037 | 1057 | 1040 | 1026 | 1008 | 1009 |
| Period | Apparel | Transportation | Miscellaneous | All Groups | ||||
|---|---|---|---|---|---|---|---|---|
| Clothing | Footwear | Public Transport | Private Transport | Tobacco and Alcohol | Other Supplies | Other Services | ||
| Subgroups— | ||||||||
| Percentage of base expenditure | 5.12 | 1.25 | 3.07 | 15.15 | 9.31 | 5.61 | 5.15 | 100.00 |
| December year annual average— | ||||||||
| 1981 | 796 | 826 | 784 | 815 | 764 | 833 | 777 | 791 |
| 1982 | 894 | 914 | 926 | 936 | 891 | 937 | 930 | 919 |
| 1983 | 972 | 979 | 997 | 990 | 981 | 997 | 991 | 987 |
| Quarter ended— | ||||||||
| 1983–31 Mar | 942 | 956 | 978 | 979 | 970 | 987 | 986 | 973 |
| –30 Jun | 972 | 980 | 1007 | 987 | 970 | 994 | 990 | 983 |
| –30 Sep | 975 | 980 | 1003 | 993 | 985 | 1005 | 989 | 991 |
| –31 Dec | 1000 | 1000 | 1000 | 1000 | 1000 | 1000 | 1000 | 1000 |
| –31 Mar | 1002 | 1001 | 1000 | 1016 | 1002 | 1003 | 1010 | 1007 |
| –30 Jun | 1012 | 1020 | 1003 | 1041 | 1017 | 1036 | 1065 | 1029 |
The following graph shows movement in the Consumers Price Index over a series of years.
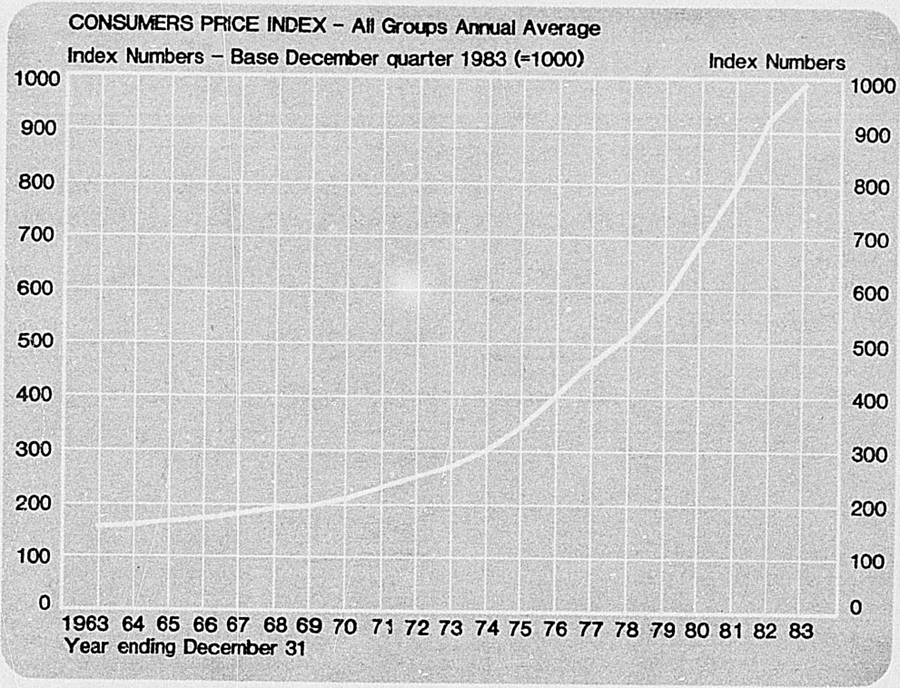
The annual average level of consumer prices rose by 16.1 percent in 1982, compared with a rise of 15.4 percent during the preceding year. Although price increases were recorded in all main groups of the index the major contributions to the overall result came from the following subgroups: home ownership, private transport, other foods, tobacco and alcoholic drinks, household furnishing, and other supplies.
The following tables distinguish individual centres and groupings of centres, but the subgroup indexes are omitted.
The index numbers are specially designed to show price movements in each centre. Changes calculated between any two index numbers for a centre can be compared to changes for the same periods in other centres. Interpretations of such comparisons should be made with the understanding that only movements in the general level of retail prices in the centres are involved. How much cheaper or dearer it is to live in one centre than another cannot be determined. The index has been designed with the assumption that expenditure patterns are the same in each centre, but in reality completely identical goods, services and shops do not occur. The index, therefore, aims at pricing the same goods and services at the same stores each period rather than attempting consistency between centres. The differences in the samples between centres prevents comparisons of price levels.
The inclusion of a table showing indexes of comparison of prices for each market centre with those for 25 market centres combined has been discontinued. Availability and consequent pricing of goods of identical specification in all centres has become an impossible objective and this index would therefore be unreliable as an inter-centre comparison of changes in price levels.
| CONSUMERS PRICE INDEX—ANNUAL AVERAGE GROUP INDEX NUMBERS FOR INDIVIDUAL CENTRES AND GROUPINGS OF CENTRES | ||||||||||||||
|---|---|---|---|---|---|---|---|---|---|---|---|---|---|---|
| Base: Weighted average each centre and grouping, separately, December Quarter 1983 (= 1000) | ||||||||||||||
| Centre | Food* | Housing*† | Household Operation* | Apparel* | Transportation* | Miscellaneous* | All Groups* | |||||||
| 1982 | 1983 | 1982 | 1983 | 1982 | 1983 | 1982 | 1983 | 1982 | 1983 | 1982 | 1983 | 1982 | 1983 | |
* Year ended 31 December. †Includes 5 smaller market centres, viz Whakatane, Taupo, Hawera, Blenheim, Ashburton, and Gore. | ||||||||||||||
| Auckland | 945 | 982 | 879 | 988 | 963 | 993 | 899 | 974 | 932 | 991 | 914 | 986 | 921 | 987 |
| Hamilton | 949 | 984 | 863 | 985 | 967 | 998 | 922 | 976 | 932 | 992 | 911 | 992 | 920 | 989 |
| Napier-Hastings | 944 | 981 | 870 | 985 | 974 | 1004 | 897 | 972 | 933 | 992 | 920 | 990 | 923 | 989 |
| Palmerston North | 940 | 981 | 863 | 981 | 974 | 999 | 903 | 980 | 937 | 989 | 911 | 988 | 919 | 986 |
| Wellington-Hutt | 947 | 984 | 856 | 979 | 955 | 995 | 859 | 968 | 936 | 991 | 906 | 989 | 912 | 986 |
| Christchurch | 936 | 973 | 873 | 985 | 967 | 997 | 906 | 970 | 937 | 992 | 919 | 990 | 922 | 985 |
| Dunedin | 936 | 980 | 885 | 986 | 958 | 999 | 917 | 978 | 933 | 991 | 926 | 991 | 925 | 988 |
| 7 chief market centres | 943 | 981 | 871 | 985 | 964 | 996 | 897 | 973 | 934 | 991 | 914 | 989 | 920 | 987 |
| Whangarei | 951 | 986 | 840 | 985 | 974 | 1002 | 902 | 978 | 934 | 991 | 910 | 987 | 916 | 989 |
| Tauranga | 948 | 985 | 875 | 997 | 965 | 997 | 886 | 965 | 932 | 991 | 914 | 990 | 921 | 990 |
| Rotorua | 945 | 983 | 841 | 970 | 955 | 995 | 900 | 971 | 931 | 991 | 914 | 988 | 912 | 984 |
| Tokoroa | 960 | 991 | 832 | 955 | 965 | 999 | 893 | 982 | 928 | 990 | 919 | 987 | 915 | 983 |
| Gisborne | 941 | 986 | 868 | 982 | 951 | 991 | 911 | 984 | 935 | 993 | 923 | 993 | 921 | 988 |
| New Plymouth | 939 | 980 | 814 | 957 | 951 | 992 | 900 | 978 | 935 | 990 | 915 | 985 | 905 | 980 |
| Wanganui | 948 | 983 | 857 | 977 | 960 | 1000 | 886 | 974 | 936 | 991 | 913 | 989 | 919 | 987 |
| Masterton | 949 | 981 | 871 | 976 | 957 | 993 | 862 | 944 | 935 | 991 | 923 | 990 | 922 | 983 |
| Nelson | 946 | 987 | 837 | 969 | 956 | 998 | 922 | 986 | 934 | 989 | 909 | 984 | 913 | 985 |
| Greymouth | 935 | 978 | 920 | 1004 | 961 | 995 | 909 | 972 | 934 | 990 | 923 | 994 | 931 | 990 |
| Timaru | 939 | 977 | 850 | 974 | 959 | 999 | 927 | 987 | 929 | 989 | 918 | 987 | 917 | 985 |
| Invercargill | 928 | 978 | 875 | 982 | 975 | 1001 | 905 | 980 | 933 | 990 | 914 | 986 | 921 | 986 |
| 12 secondary market centres | 944 | 983 | 854 | 978 | 963 | 998 | 902 | 976 | 933 | 991 | 915 | 988 | 917 | 986 |
| 25 market centres combined* | 944 | 982 | 866 | 983 | 963 | 996 | 898 | 974 | 934 | 991 | 914 | 988 | 919 | 987 |
AVERAGE RETAIL PRICES—Quarterly weighted average prices over 25 centres for the fourth quarter 1983.
| Commodity | Unit | Price |
|---|---|---|
| Apples, eating | kg | 165 |
| Bananas | kg | 148 |
| Oranges | kg | 141 |
| Cabbage | kg | 76 |
| Carrots | kg | 132 |
| Onions | kg | 82 |
| Potatoes | kg | 76 |
| Peaches, canned | 425 g tin | 87 |
| Peas, green frozen | 1 kg pkt | 180 |
| Beef, blade steak | kg | 585 |
| corned silverside | kg | 568 |
| prime rib rolled | kg | 503 |
| porterhouse steak | kg | 815 |
| rump steak | kg | 734 |
| Hogget, cut leg, | ||
| knuckle end | kg | 406 |
| forequarter | kg | 247 |
| Lamb, leg, whole | kg | 458 |
| Pork, cut leg, knuckle end | kg | 599 |
| Pork, loin chops | kg | 636 |
| Bacon, middle rashers | kg | 983 |
| Mince, beef | kg | 419 |
| Ham, cooked, pressed, sliced | kg | 1114 |
| Sausages, beef | kg | 246 |
| Fish, sole or flounder, wet | kg | 409 |
| fresh, filleted—e.g. tarakihi-groper | kg | 772 |
| Salmon, canned | 220 g | 176 |
| Chicken, deep frozen | No. 6 (Med) | 453 |
| Eggs, min. 636 g/dozen | Dozen | 167 |
| Butter | 500 g | 103 |
| Cheese, mild cheddar | kg | 383 |
| Milk, delivered | 600 ml | 30 |
| Milk powder, full cream | 400 g tin | 241 |
| Biscuits, chocolate wheaten | 200 g | 91 |
| Bread, unsliced, wrapped | 750 g | 74 |
| Cake, block, light fruit | 500 g | 244 |
| Oatmeal, fine porridge | 1.4 kg | 183 |
| Flour, white | 1.5 kg | 112 |
| Rice, long grain | 500 g | 68 |
| Breakfast flake biscuits | 750 g | 145 |
| Honey | 500 g ctn | 144 |
| Jam, apricot | 400 g tin | 114 |
| Coffee, instant | 100 g jar | 241 |
| Tea | 250 g | 126 |
| Margarine, table | 500 g | 116 |
| Cooking oil vegetable | 500 ml | 148 |
| Salt, iodised | 2 kg bag | 91 |
| Spaghetti in tomato sauce | 440 g tin | 77 |
| Soup, tomato | 450 g tin | 76 |
| Sugar, white | 1.5 kg pkt | 121 |
| Aerated waters incl. bottle | 1.25 litre | 134 |
| Ice cream, vanilla | 2 litre | 226 |
| Chocolate, block | 150 g | 129 |
| Meals, grill, steak and chips | Each | 640 |
| Meals, coffee and 2 sandwiches | Each | 138 |
| Takeaways, chicken, hot snack | Box | 242 |
| Takeaways, hamburger, hot | Each | 115 |
| Timber, dressed, 150 mm × 25 mm finishing tanalised radiata pine | Per 100 lineal metres | 195.05 |
| Concrete blocks, 390 mm × 190 mm × 140 mm | Per 100 | 101.16 |
| Paint (waterbased), high-gloss white | 4 litre tin | 33.92 |
| Coal, domestic | 255 kg | 39.38 |
| Electricity, domestic (incl. water heating)–30 days | 2520 MJ | 34.12 |
| Gas, domestic–30 days | 1100 MJ | 9.94 |
| Fuel oil, domestic heating, delivered | litre | 0.66 |
| Electric jug, chrome finish, 1500 W std element | Each | 44.59 |
| Electric range, 4 elements, automatic | Each | 871.92 |
| Refrigerator, single temp., 0.26 cu m | Each | 624.06 |
| Refrigerator, dual temp., freezer-fridge 0.32 cu m | Each | 850.32 |
| T. V. set, colour 56 cm | Each | 1199.54 |
| Lawn mower, rotary type, 2 stroke, 46 cm | Each | 592.57 |
| Venetian blind, 175 cm wide. 130 cm drop | Each | 150.57 |
| Carpet, broadloom, 80/20 wool/nylon. 950 g/m2 | Metre | 142.06 |
| Vinyl flooring, 183 cm | Metre | 32.58 |
| Pillow, dacron-filled | Each | 11.30 |
| Mixing bowl, stainless steel, 20 cm | Each | 9.81 |
| Fork, table, stainless steel, med. quality | Each | 0.77 |
| Preserving jars, glass, 1.1 litre, incl. rings and seals | Doz. | 11.43 |
| Torch battery, dry cell, 1250 | Each | 0.61 |
| Electric light bulb, 100 Watt | Each | 0.78 |
| Household cleaning powder | 500 g | 1.08 |
| Detergent, plastic container | 990 ml | 1.93 |
| Disinfectant | 560 ml | 1.10 |
| Fly spray, aerosol | 300 ml can | 2.08 |
| Shoe polish | 38 g | 0.99 |
| Soap powder | 1.10 kg | 1.73 |
| Postal letter, standard, surface | Each | 0.24 |
| Telephone rental (private), main exchange | 1 year | 199.20 |
| Drycleaning, Man's two piece suit | Each | 5.95 |
| Licence, T.V., black and white | 1 year | 27.50 |
| Licence, T.V., colour | 1 year | 45.00 |
| Singlet, athletic, man's | Each | 6.14 |
| Pantyhose, sheer, av. size, popular brand | Pair | 2.97 |
| Shorts, casual sports, boy's | Pair | 7.20 |
| Socks, ankle, girl's | Pair | 2.70 |
| Nursery squares, 76 cm × 76 cm, cotton | Doz. | 28.73 |
| Baby's vest | Each | 3.09 |
| Dress pattern | Each | 3.02 |
| Wool, hand knitting, crepe, double knitting | 50 g | 2.23 |
| Slippers, felt, man's | Pair | 11.86 |
| Shoe repairs, cemented leather half sole, size 5 woman's | Pair | 12.92 |
| Bicycle, man's 10 speed, without accessories, N.Z. manufacture | Each | 331.07 |
| Petrol, 96 octane | 10 litres | 7.10 |
| Cigarettes, filter tipped | pkt of 20 | 1.37 |
| Tobacco, cigarette | 50 g | 2.47 |
| Beer in public bar—glass | 200 ml | 0.42 |
| Wine, N.Z. sherry medium dry | 2.25 litre Flagon | 11.51 |
| Aspirin, 24 tablets | pkt | 1.37 |
| Razor blades (not bonded) | pkt of 5 | 1.58 |
| Baby talcum powder | 330 g | 2.37 |
| Toilet paper, 2 ply, 37.8 m | 4 rolls | 1.90 |
| Toilet soap | 150 g | 0.43 |
| Toothbrush | Each | 0.78 |
| Toothpaste | 100 g tube | 1.07 |
| Suitcase, large | Each | 59.44 |
| Umbrella, collapsible, woman's | Each | 9.93 |
| Envelopes, 89 mm × 146 mm gummed | pkt of 20 | 0.58 |
| Writing pad, 203 mm × 127 mm, lightweight | 80 leaf pad | 0.82 |
| Pencil, black lead | Each | 0.26 |
| Film colour slide (including processing), 35 mm, 25 ASA 20 exposures | Each | 13.01 |
| Developing and printing, 126 colour film, 12 prints, 87 mm × 90 mm | Total | 8.23 |
| Tennis balls, 2nd grade | Pair | 4.04 |
| Newspaper, delivered, daily | Each | 0.22 |
| Popular book, paperback | Each | 3.95 |
| Opticians fee, full examination and spectacles with case | Each | 93.44 |
| Dental filling, simple amalgam, one surface | Each | 12.36 |
| Dentures, full set, acrylic | Set | 379.41 |
| Football admission to ground, club game | Each | 1.49 |
| Cinema admission, adult, evenings | Seat | 3.27 |
| Rugby club subscription, per annum | Per member | 33.63 |
| Tennis club subscription, per annum | Per member | 48.63 |
| Funeral, burial ($00) | Each | 10.81 |
| cremation ($00) | Each | 9.91 |
| Hair cut, woman's wet | Each | 14.32 |
| man's dry | Each | 4.87 |
INTERNATIONAL COMPARISONS—The following tables provide a comparison of retail and wholesale prices between New Zealand and certain other countries. All the prices have been converted into New Zealand currency and the metric liquid and dry measures have been adopted as the basis for common units of quantity.
Comparisons in annual movement of Consumer Price Indexes of selected countries are given in the following table. (The base is December Quarter 1980 = 1000.)
| Year | New Zealand | Australia | Canada | France (Paris) | Japan | United Kingdom | United States |
|---|---|---|---|---|---|---|---|
| 1979 | 809 | 880 | 871 | 843 | 910 | 816 | 849 |
| 1980 | 948 | 969 | 959 | 957 | 974 | 963 | 963 |
| 1981 | 1094 | 1063 | 1079 | 1083 | 1027 | 1077 | 1062 |
| 1982 | 1270 | 1181 | 1196 | 1210 | 1055 | 1170 | 1126 |
| 1983 | 1364 | 1301 | 1264 | 1323 | 1073 | 1223 | 1160 |
| INTERNATIONAL COMPARISON OF RETAIL PRICES OF BASIC FOODSTUFFS | |||||
|---|---|---|---|---|---|
| (During the 4th quarter of 1983 in New Zealand currency) | |||||
| Item | Unit | New Zealand (Average 25 Centres)* | Australia (Sydney)† | Great Britain (200 Areas)* | Japan (Tokyo)* |
* November. †December. ‡Milk loaf, sliced. §Green tea, loose. ||Sirloin. | |||||
| cents | cents | cents | cents | ||
| Bread | 750 g | 71 | 126‡ | 92 | 184 |
| Flour | 1.5 kg | 112 | 160 | 94 | |
| Tea | 500 g | 252 | 309 | 320 | 1709§ |
| Coffee (instant) | 100 g | 240 | 318 | 255 | |
| Sugar | 1 kg | 81 | 88 | 107 | 168 |
| Milk (fresh) | 600 ml | 30 | 55 | 52 | 110 |
| Cheese | kg | 385 | 577 | 873 | |
| Butter | 500 g | 103 | 230 | 214 | 538 |
| Margarine | 500 g | 117 | 128 | 82 | 280 |
| Bacon | kg | 976 | 1170 | 617 | |
| Beef—rib roast | kg | 516 | 632 | 1419|| | 2268 |
| Lamb—leg | kg | 460 | 495 | 729 | |
| Pork—leg | kg | 601 | 617 | 524 | 1034 |
| Pork chops | kg | 636 | 694 | ||
Sources: Australia: Australian Statistician. Great Britain: Department of Employment Gazette. Japan: Bureau of Statistics.
PRODUCERS PRICE INDEX—The Producers Price Index (previously called the General Price Index) replaced and considerably extended the Wholesale Prices Index, which was discontinued from the March quarter 1978. The Producers Price Index measures quarterly price level changes commencing with the December quarter 1977. It is intended to provide a measure of average price changes over all industrial and government sectors of the economy.
Price indexes for inputs and outputs at both all-industry and group levels are contained in this index. The all-groups level of the Producers Price Index reflects price level movements as these affect the inputs and sales of business and government. Industry groups for which separate index series are available correspond with the New Zealand System of National Accounts production groups. It is conceptually impossible to calculate an output index for the non-market oriented groups of Central Government Services, Local Government Services, and Private Non-profit Services to Households. Their activities differ substantially in character from market-oriented industries in that their output is produced for free distribution or at prices which bear no relationship to the cost of production.
The use of identical industry classification in the national accounts and in the Producers Price Index is part of the Department of Statistics' long-term policy to integrate all economic statistics. With price deflation of the current value of each industry's input of goods and services and its output, it is possible to calculate the industry's real net output and contribution to the Gross Domestic Product. This will be in constant prices or, effectively, in volume terms.
The list of goods and services priced was selected on the basis of input-output commodity flows contained in the department's Inter-Industry Study for 1971–72. These were updated by comparison with data collected for other statistical series including the Farm Costs and the Wholesale Prices Index regimens, Import and Export lists, and other economic censuses recently undertaken. In selecting the goods and services to be priced, careful consideration was given to the coverage and representativeness of various commodity groups. In particular, their absolute importance to the producing industry and the whole economy was taken into account. Specifications for the commodities and services were obtained in collaboration with suppliers of the price data to ensure representativeness of priced commodities and adherence to these specifications over time.
The weight assigned to an industry to obtain the all-industry group index is based on the New Zealand System of National Accounts Production Accounts for 1975–76. Commodity weightings within each industry index are based on data from the 1971–72 Inter-Industry Study. Adjustments have been made for significant variations in relative commodity weightings occurring between the date of the study and the index expression base.
Prices for inputs are producer prices (i.e., factory door prices including commodity taxes). Separate indexes are prepared for transport and distribution charges. Where reliable unit-values are available, these have been incorporated in the relevant input indexes. It is not intended to produce separate subindexes for the imported components of each industry's input.
Industry outputs are priced at approximate basic values (i.e., before the addition of commodity taxes or deduction of subsidies). These correspond to factory door prices or as close to this level as the firm's pricing policy allows. Downstream commodity taxes are excluded. In cases where price differentiation occurs between items both consumed locally and exported, separate pricing is usually obtained.
The following table shows price indexes of inputs (i.e., current purchases of commodities and services) and of outputs by industry groups. As already stated, input prices are producers' prices and include commodity taxes paid by, and subsidies received by, the producer.
| PRODUCERS PRICE INDEX | ||||||
|---|---|---|---|---|---|---|
| Base: December Quarter 1982 (= 1000) | ||||||
| Industry Group | Quarter Ended | |||||
| 31 Dec 1982 | 31 Mar 1983 | 30 Jun 1983 | ||||
| Inputs | Outputs | Inputs | Outputs | Inputs | Outputs | |
* Includes industry groups 5 to 13. †Includes industry groups 1 to 21. | ||||||
| 1 Agriculture | 1000 | 1000 | 1002x | 1004 | 1012 | 1049x |
| 2 Fishing and hunting | 1000 | 1000 | 998 | 1000 | 1013 | 1020 |
| 3 Forestry and logging | 1000 | 1000 | 1006 | 1042 | 1026 | 1088 |
| 4 Mining and quarrying | 1000 | 1000 | 1004 | 998 | 1005 | 999 |
| 5 Food, beverages and tobacco | 1000 | 1000 | 999 | 996 | 1039 | 1013 |
| Primary food processing | 1000 | 1000 | 1000 | 994 | 1052 | 1015 |
| Other food processing | 1000 | 1000 | 996 | 1000 | 998 | 1007 |
| 6 Textiles, apparel and leather | 1000 | 1000 | 1006 | 1004 | 1029 | 1014 |
| 7 Wood and wood products | 1000 | 1000 | 1002 | 999 | 1011 | 996 |
| 8 Paper, printing and publishing | 1000 | 1000 | 1001 | 994 | 1003 | 1001 |
| 9 Chemicals, petroleum and plastics | 1000 | 1000 | 1010 | 1044 | 1008 | 1000 |
| 10 Non-metallic mineral products | 1000 | 1000 | 1018 | 1011 | 1022 | 1011 |
| 11 Basic metals | 1000 | 1000 | 1007 | 1014 | 1013 | 1021 |
| 12 Machinery and metal products | 1000 | 1000 | 1012 | 1001 | 1027 | 1011 |
| 13 Other manufacturing | 1000 | 1000 | 1009 | 1011 | 1005 | 1006 |
| 14 Electricity gas, and water | 1000 | 1000 | 1001 | 1002 | 1003 | 1004 |
| 15 Construction | 1000 | 1000 | 1001 | 1007 | 1005 | 1017 |
| 16 Trade, restaurants and hotels | 1000 | 1000 | 1001 | 1008 | 1007 | 1019 |
| Wholesale and retail trade | 1000 | 1000 | 1001 | 1009 | 1006 | 1024 |
| Hotels, restaurants, takeaways | 1000 | 1000 | 1000 | 1001 | 1005 | 1001 |
| 17 Transport and storage | 1000 | 1000 | 1003 | 1006 | 1014 | 1016 |
| Road transport | 1000 | 1000 | 1001 | 1002 | 1003 | 1003 |
| Transport and storage other than road | 1000 | 1000 | 1004 | 1009 | 1018 | 1023 |
| 18 Communication | 1000 | 1000 | 1000 | 1000 | 1009 | 1000 |
| 19 Insurance and financing | 1000 | 1000 | 1003 | 1009 | 1018 | 1027 |
| 20 Ownership of dwellings | 1000 | 1000 | 1003 | 1014 | 1006 | 1016 |
| 21 Community and personal services | 1000 | 1000 | 1002 | 1005 | 1010 | 1007 |
| 22 Central government | 1000 | 1005 | 1015 | |||
| 23 Local government | 1000 | 1014 | 1024 | |||
| 24 Private non-profit services | 1000 | 1000 | 1001 | |||
| All manufacturing groups* | 1000 | 1000 | 1005 | 1006 | 1024 | 1009 |
| All market groups† | 1000 | 1000 | 1003 | 1007 | 1017 | 1017x |
| All industry | 1000 | 1004 | 1017 | |||
| PRODUCERS PRICE INDEX | ||||
|---|---|---|---|---|
| Base: December Quarter 1982 (=1000) | ||||
| Industry Group | Quarter Ended | |||
| 30 Sep 1983 | 31 Dec 1983 | |||
| Inputs | Outputs | Inputs | Outputs | |
* Includes industry groups 5 to 13. †Includes industry groups 1 to 21. | ||||
| 1 Agriculture | 1028 | 1096 | 1033 | 1097 |
| 2 Fishing and hunting | 1014 | 1068 | 1027 | 1123 |
| 3 Forestry and logging | 1006 | 1075 | 1010 | 1072 |
| 4 Mining and quarrying | 1008 | 991 | 1012 | 985 |
| 5 Food, beverages and tobacco | 1061 | 1056 | 1068 | 1065 |
| Primary food processing | 1078 | 1073 | 1083 | 1082 |
| Other food processing | 1005 | 1012 | 1017 | 1021 |
| 6 Textiles, apparel and leather | 1044 | 1020 | 1063 | 1035 |
| 7 Wood and wood products | 1016 | 998 | 1018 | 1000 |
| 8 Paper, printing, and publishing | 1001 | 1002 | 1003 | 1006 |
| 9 Chemicals, petroleum and plastics | 1006 | 997 | 1010 | 991 |
| 10 Non-metalic mineral products | 1022 | 1016 | 1023 | 1018 |
| 11 Basic metals | 1025 | 1028 | 1022 | 1041 |
| 12 Machinery and metal products | 1042 | 1018 | 1057 | 1031 |
| 13 Other manufacturing | 1013 | 1011 | 1009 | 1008 |
| 14 Electricity, gas and water | 1003 | 1004 | 1004 | 1003 |
| 15 Construction | 1012 | 1019 | 1016 | 1025 |
| 16 Trade, restaurants and hotels | 1013 | 1029 | 1018 | 1031 |
| Wholesale and retail trade | 1009 | 1034 | 1012 | 1036 |
| Hotels, restaurants, takeaways | 1020 | 1007 | 1033 | 1014 |
| 17 Transport and storage | 1006 | 1011 | 1013 | 1011 |
| Road transport | 1004 | 1003 | 1002 | 1003 |
| Transport and storage other than road | 1006 | 1015 | 1018 | 1015 |
| 18 Communication | 1008 | 1000 | 1008 | 1000 |
| 19 Insurance and financing | 1022 | 1036 | 1019 | 1080 |
| 20 Ownership of dwellings | 1015 | 1019 | 1021 | 1029 |
| 21 Community and personal services | 1015 | 1010 | 1019 | 1018 |
| 22 Central Government | 1022 | 1027 | ||
| 23 Local Government | 1027 | 1034 | ||
| 24 Private non-profit services | 1004 | 1012 | ||
| All manufacturing groups* | 1036 | 1024 | 1044 | 1031 |
| All market groups† | 1025 | 1030 | 1031 | 1038 |
| All industry | 1025 | 1031 | ||
CAPITAL EXPENDITURE PRICE INDEX (CEPI)—A new series of price indexes, jointly called the Capital Expenditure Price Index, was released in May 1981 by the Government Statistician. These new indexes provided measures of price level changes of physical capital assets purchased by businesses and Government in New Zealand.
The concept of price employed is the “price to the final user” and does not include freight or installation costs unless these are normally included in the final price. No account can be taken of special discounts. Sales tax has been included where applicable.
Each capital expenditure asset-type index is constructed by combining the relative price changes of representative items. The importance given to each item is determined by the expenditure made on all the assets which that item represents. The relative importance of any item, vis-a-vis other price items, is known technically as the “weight” for that item.
Because expenditure on capital items tends to be irregular, the weights used in the CEPI have, in general, been based on expenditure over a two to five year period ranging from 1975–76 to 1979–80. In deriving the weighting pattern for the CEPI the Department of Statistics has primarily used statistics on external trade, manufacturing, and building. These have been supplemented with data from a diversity of sources including other Government departments, marketing and producer boards, manufacturers, wholesalers, and retailers.
The following table shows index numbers for the 4 quarters of 1983. It should be noted that the index numbers relate to the price levels ruling at the mid-point of each quarter.
| CAPITAL EXPENDITURE PRICE INDEX | ||||
|---|---|---|---|---|
| Base: December Quarter 1979 (= 1000) | ||||
| Capital Asset | Quarter Ended 1983— | |||
| Mar | Jun | Sep | Dec | |
| Residential buildings— | ||||
| Houses, flats, garages | 1668 | 1680 | 1685 | 1696 |
| Hostels | 1613 | 1641 | 1642 | 1653 |
| Non-residential buildings— | ||||
| Commercial buildings | 1597 | 1614 | 1615 | 1620 |
| Factories | 1609 | 1631 | 1635 | 1645 |
| Hospitals, rest homes | 1603 | 1624 | 1625 | 1627 |
| Educational buildings | 1604 | 1642 | 1633 | 1654 |
| Motels, hotels | 1587 | 1615 | 1625 | 1633 |
| Farm buildings | 1630 | 1632 | 1637 | 1640 |
| Other construction— | ||||
| Transport ways | 1683 | 1696 | 1688 | 1716 |
| Pipelines | 1559 | 1568 | 1572 | 1582 |
| Electrical works | 1425 | 1443 | 1445 | 1453 |
| Earthmoving and site work | 1621 | 1627 | 1632 | 1646 |
| Land improvements— | ||||
| Land clearing | 1582 | 1572 | 1578 | 1579 |
| Fencing | 1475 | 1481 | 1486 | 1487 |
| Irrigation and land drainage | 1553 | 1555 | 1564 | 1570 |
| Reclamation and river control | 1588 | 1601 | 1605 | 1619 |
| Transport vehicles— | ||||
| Cars, less than 1600 c.c. | 1380 | 1448 | 1482 | 1489 |
| Cars, 1600 c.c. and above | 1362 | 1403 | 1446 | 1468 |
| Commercial vehicles, less than 2500 kg | 1526 | 1542 | 1571 | 1613 |
| Commercial vehicles, 2500 kg and over | 1367 | 1395 | 1429 | 1480 |
| Buses | 1569 | 1613 | 1647 | 1677 |
| Trailers | 1488 | 1499 | 1517 | 1540 |
| Motor cycles | 1078 | 1120 | 1139 | 1176 |
| Fishing boats | 1688 | 1712 | 1735 | 1776 |
| Light fixed-wing aircraft | 1724 | 1920 | 1981 | 2126 |
| Helicopters | 1703 | 2213 | 2309 | 2330 |
| Plant, machinery, and equipment— | ||||
| Agricultural tractors | 1266 | 1290 | 1310 | 1309 |
| Self-propelled harvesting machinery | 1496 | 1613 | 1609 | 1605 |
| Other harvesting and mowing machinery | 1371 | 1374 | 1386 | 1386 |
| Soil preparation and cultivation machinery | 1503 | 1505 | 1526 | 1532 |
| Other agricultural machinery and equipment | 1530 | 1532 | 1545 | 1554 |
| Farm motor cycles | 1243 | 1313 | 1349 | 1352 |
| Self-propelled construction machinery | 1581 | 1655 | 1664 | 1670 |
| Non-self-propelled construction machinery, quarrying machinery | 1538 | 1557 | 1579 | 1606 |
| Food and drink processing machinery | 1501 | 1514 | 1510 | 1512 |
| Bottling and packaging machinery | 1559 | 1614 | 1615 | 1619 |
| Textile machinery | 1433 | 1497 | 1508 | 1511 |
| Woodworking machinery | 1496 | 1475 | 1475 | 1487 |
| Printing and publishing equipment | 1333 | 1435 | 1408 | 1482 |
| Metal working machinery | 1484 | 1465 | 1469 | 1480 |
| Forklifts and mobile material-handling equipment | 1389 | 1376 | 1392 | 1399 |
| Mechanical hoists, conveyors, etc. | 1759 | 1791 | 1777 | 1834 |
| Electrical distribution equipment | 1547 | 1597 | 1609 | 1637 |
| Electric motors, up to 7 kw (i-9 hp) | 1472 | 1496 | 1495 | 1495 |
| Electric motors, 7 kw and over (over 9 hp) | 1371 | 1371 | 1426 | 1426 |
| Industrial engines, non-electric | 1381 | 1403 | 1415 | 1436 |
| Airconditioning and cooling equipment | 1590 | 1584 | 1590 | 1605 |
| Refrigerating equipment | 1314 | 1328 | 1330 | 1338 |
| Industrial boilers and heating equipment | 1692 | 1715 | 1738 | 1728 |
| Pumping and compressing equipment | 1454 | 1481 | 1488 | 1485 |
| Office and shop equipment, electronic | 1048 | 1045 | 1035 | 1001 |
| Office and shop equipment, non-electronic | 1245 | 1304 | 1308 | 1307 |
| Office and shop furniture and fittings | 1617 | 1616 | 1616 | 1638 |
| Duplicating and photocopying machines | 843 | 837 | 829 | 830 |
| Scales and weighing machinery | 1138 | 1149 | 1550 | 1167 |
| Shipping and transportation containers | 1630 | 1631 | 1653 | 1635 |
| Tanks, vats, and storage units | 1549 | 1549 | 1550 | 1550 |
| Photographic and optical equipment | 1355 | 1445 | 1477 | 1460 |
| Technical and scientific equipment | 1471 | 1527 | 1530 | 1535 |
| Medical, dental, and hospital furniture and equipment | 1509 | 1525 | 1537 | 1537 |
| Stereo equipment | 923 | 866 | 905 | 935 |
| Television receivers | 1140 | 1120 | 1119 | 1092 |
| Peripheral data processing units | 1251 | 1295 | 1342 | 1292 |
| Radio-telephone and telegraphic equipment | 1377 | 1385 | 1396 | 1390 |
| Domestic-type furniture and furnishings | 1418 | 1447 | 1454 | 1477 |
| Domestic-type appliances | 1443 | 1438 | 1433 | 1447 |
| Domestic-type equipment and utensils | 1420 | 1416 | 1415 | 1416 |
| Portable power tools | 1329 | 1374 | 1398 | 1416 |
| Sport and recreation equipment | 1446 | 1453 | 1455 | 1452 |
More information on the methodology of the index is available from the Department of Statistics, to which any queries should be addressed.
AGRICULTURAL PRODUCERS PRICE INDEX—A revised series of price indexes for the agricultural industry has been developed to replace the Farming Costs Price Index series, which were discontinued from the December 1982 quarter. Six input sub-indexes have been developed for the Agricultural Producers Price Index. They relate to the following types of agriculture activity: sheep and beef farming; dairy farming; mixed cropping; horticulture; pig, poultry, and other farming; and agricultural contracting.
The Agriculture Inputs Index excludes agricultural contracting, and is published as the All Farming Inputs Price Index. The expenditure group sub-indexes for the Agriculture Inputs Index differ in coverage from those produced for the discontinued Farming Costs Price Index because they exclude expenditure on interest, central and local government charges (e.g. rates), and wages. The All Farming Inputs Price Index includes livestock purchases and a series excluding livestock purchases is also produced.
Future development of the All Farming Inputs Price Index will provide sub-indexes for expenditure on interest and central and local government charges. Both the Nominal and Prevailing Weekly Wage Rates Indexes contain wage-rate series for the agriculture industry production group. The Farming Capital Expenditure Price Index series has been replaced by the Capital Expenditure Price Index series.
The following table gives a long-term series of Farming Input Price Indexes for sheep farming, dairy farming, and all farming.
| FARMING INPUTS PRICE INDEX | |||
|---|---|---|---|
| Base: December Quarter 1982 (=1000) | |||
| Year Quarter | Sheep Farming | Dairy Farming | All Farming |
| 1971-Sep | 240 | 248 | 244 |
| Dec | 243 | 250 | 247 |
| 1972-Mar | 243 | 251 | 248 |
| Jun | 245 | 253 | 249 |
| Sep | 247 | 261 | 255 |
| Dec | 250 | 263 | 258 |
| 1973-Mar | 257 | 268 | 266 |
| Jun | 273 | 278 | 280 |
| Sep | 281 | 291 | 292 |
| Dec | 284 | 293 | 293 |
| 1974-Mar | 289 | 308 | 307 |
| Jun | 297 | 315 | 317 |
| Sep | 313 | 316 | 324 |
| Dec | 321 | 326 | 332 |
| 1975-Mar | 323 | 323 | 331 |
| Jun | 331 | 331 | 339 |
| Sep | 340 | 342 | 348 |
| Dec | 349 | 349 | 356 |
| 1976-Mar | 362 | 360 | 368 |
| Jun | 376 | 374 | 381 |
| Sep | 407 | 403 | 413 |
| Dec | 412 | 409 | 418 |
| 1977-Mar | 421 | 419 | 431 |
| Jun | 438 | 438 | 449 |
| Sep | 462 | 458 | 472 |
| Dec | 475 | 465 | 482 |
| 1978-Mar | 483 | 473 | 491 |
| Jun | 482 | 482 | 496 |
| Sep | 500 | 503 | 515 |
| Dec | 507 | 507 | 521 |
| 1979-Mar | 516 | 515 | 530 |
| Jun | 538 | 543 | 551 |
| Sep | 599 | 591 | 609 |
| Dec | 624 | 613 | 632 |
| 1980-Mar | 645 | 634 | 652 |
| Jun | 697 | 680 | 696 |
| Sep | 754 | 730 | 746 |
| Sec | 774 | 747 | 766 |
| 1981-Mar | 796 | 770 | 793 |
| Jun | 825 | 804 | 824 |
| Sep | 893 | 864 | 880 |
| Dec | 910 | 891 | 905 |
| 1982-Mar | 933 | 918 | 934 |
| Jun | 973 | 974 | 977 |
| Sep | 995 | 994 | 995 |
| Dec | 1000 | 1000 | 1000 |
| 1983-Mar | 1002 | 1002 | 1002 |
| Jun | 1007 | 1008 | 1007 |
| Sep | 1013 | 1020 | 1017 |
| Dec | 1012 | 1023 | 1017 |
Long-term series are not available for mixed cropping, horticulture or pig, poultry and other farming not elsewhere classified.
Prior to December 1982 only beef cattle held on sheep farms were included in the Sheep Farming Farm Costs Price Index. From December 1982 farms yielding income principally from beef cattle are also included.
This long-term series excludes wages and interest payments, Government charges, and livestock purchases.
The following series shows the All Farming Inputs Price Index by industry groups. These agriculture indexes are on Base: December quarter 1982 (= 1000), and will be published regularly in the Monthly Abstract of Statistics.
| FARMING INPUTS PRICE INDEX—ALL FARMING* | ||||||
|---|---|---|---|---|---|---|
| Base: December Quarter 1982 (=1000) | ||||||
| Expenditure Group | Percentage of Base Expenditure | 1982 | 1983 | |||
| Dec. | Mar. | Jun | Sep | Dec | ||
| * Excludes wages, interest payments and Government charges. | ||||||
| Administration | 3.86 | 1000 | 1005 | 1009 | 1015 | 1017 |
| Animal health and breeding | 3.88 | 1000 | 1006 | 1013 | 1021 | 1032 |
| Dairy shed expenses | 0.56 | 1000 | 1002 | 1007 | 1014 | 1021 |
| Electricity | 1.89 | 1000 | 1000 | 1000 | 1000 | 1000 |
| Feed, grazing, cultivation and harvesting | 8.20 | 1000 | 1003 | 1014 | 1015 | 1000 |
| Fertiliser, lime, and seeds | 14.47 | 1000 | 998 | 1001 | 994 | 984 |
| Freight | 5.58 | 1000 | 1000 | 1000 | 1020 | 1020 |
| Fuel | 6.17 | 1000 | 1000 | 1000 | 1005 | 1005 |
| Insurance | 0.88 | 1000 | 1013 | 1019 | 1028 | 1024 |
| Packaging costs | 1.52 | 1000 | 1010 | 1010 | 1007 | 1009 |
| Rent and hire | 1.75 | 1000 | 1000 | 1000 | 1264 | 1264 |
| Repairs, maintenance, motor vehicle repairs | 17.76 | 1000 | 1004 | 1011 | 1016 | 1028 |
| Sharemilking | 1.30 | 1000 | 1000 | 1000 | 1072 | 1072 |
| Shearing | 5.65 | 1000 | 1006 | 1008 | 1007 | 1006 |
| Weed and pest control | 3.49 | 1000 | 1004 | 1005 | 1011 | 1017 |
| Livestock purchases | 23.04 | 1000 | 1000 | 1030 | 1068 | 1089 |
| All groups excluding livestock | 76.96 | 1000 | 1002 | 1007 | 1017 | 1017 |
| All groups including livestock | 100.00 | 1000 | 1002 | 1012 | 1028 | 1033 |
EXTERNAL TRADE PRICE AND VOLUME INDEXES—A revised method of processing the external trade price and volume indexes has been employed by the Department of Statistics since the September 1982 quarter, following the completion of a review of the methods of calculating these indexes. The basic methodology of chain-linked, Fisher Ideal indexes has been retained, but improvements have been effected in timeliness of release and statistical quality of the indexes. The range of available indexes has also been extended.
Major Features of the Revision—
The valuation of commodity item unit-values on which the import price indexes are based is now cost insurance freight (CIF). Previously the current domestic value (CDV) of individual item unit values was used, with these values being rated up to CIF values. The Export Price Indexes continue to be calculated on a free on board (FOB) valuation basis.
A commodity is regarded as having sufficient importance to be included as an explicit indicator of price or volume movement in the index when it contributes more than some specified share of its classification division value. This share is based on the variability of the commodity unit value and the total value of the division. In order to qualify for inclusion previously, commodities had to have a quarterly value of more than $16,000 or a value in the index base period of more than $20,000.
Commodities for which quantity data are not available and those items unsuitable for pricing are included in the index by imputing price (unit-value) changes from other similar or related commodities. This imputation of price movements for unpriced items is now calculated at Standard International Trade Classification (SITC) group level, rather than at division level as previously.
From the 1983 June year, the annual volume index is calculated by summing the quarterly volume indexes and the annual price index is calculated by summing volume weighted quarterly price indexes. Previously, June year annual indexes were calculated from consolidated annual data, and the quarterly price and volume indexes were aligned to these annual indexes.
A large number of new indexes, at times limited to a single item, are now calculated. A number of these new indexes are classified by the New Zealand Standard Classification of Broad Economic Categories (NZSBEC). Commodities are, in general, allocated to NZSBEC on the basis of their main economic end-use.
The base of the indexes has been changed to the year ended June 1982 (=1000), except for the Terms of Trade Index, which remains on the traditional base of the calendar year 1957 (=100).
Data used in the calculation of the indexes are derived from departmental external trade statistics, which are in turn processed from import and export entry forms lodged with the Customs Department. Import and export statistical quantities and values are consolidated on a monthly, quarterly and annual basis.
The indexes cover all commodities classified as merchandise trade. These are goods which add or subtract from the stock of material resources in a country as a result of their movement into or out of the country. Consequently, the term “merchandise” is not confined to goods which are the subject of a commercial transaction, but covers all goods which meet the above criterion.
Calculation Method:Index Type, Weighting and Chain-Linking—All external trade index series are of the chain-linked Fisher Ideal type. This involves the calculation of two indexes (for both price and volume) for each current period. One (the so-called Laspeyres) uses the values of the previous year's data as weights and the other (the so-called Paasche) uses the values of the current period as weights. The averaging method known as the 'Geometric Mean' applied to these two indexes produces the index for the current period on the previous year's base. The indexes are then linked onto the previous year's indexes to provide a continuous time-series.
Annual Indexes—The annual price indexes (June, December and March years) are calculated by volume weighting the four quarterly price indexes. The annual volume indexes are the sum of the four quarterly volume indexes.
Prior to the revision, separate June year annual indexes were calculated from annual data. The quarterly indexes were aligned, so that the sum of the four quarterly volume indexes equalled the annual volume index, and the sum of the products of the price and volume indexes, divided by the annual volume index equalled the annual price index.
Quarterly Volume Indexes—The published quarterly volume indexes are expressed as annual equivalents, by multiplying each initial quarterly index by four.
| EXPORT PRICES INDEX | |||||||||||
|---|---|---|---|---|---|---|---|---|---|---|---|
| Base: Year ended June 1982 (= 1000) | |||||||||||
| Year Ended 30 June | Butter | Cheese | Dairy Produce | Meat | Wool | Meat, Wool, and By products | All Pastoral and Dairy Produce | Food, Live Animals, Beverages, and Tobacco | Manufactured Goods Other Than Food | Crude Materials Other Than Fuels | All Groups |
| 1978 | 461 | 489 | 437 | 536 | 743 | 626 | 573 | 499 | 584 | 693 | 561 |
| 1979 | 500 | 528 | 480 | 684 | 816 | 750 | 671 | 593 | 648 | 781 | 647 |
| 1980 | 558 | 678 | 574 | 838 | 1001 | 916 | 811 | 719 | 765 | 961 | 786 |
| 1981 | 699 | 765 | 743 | 927 | 962 | 931 | 877 | 851 | 866 | 932 | 873 |
| 1982 | 1000 | 1000 | 1000 | 1000 | 1000 | 1000 | 1000 | 1000 | 1000 | 1000 | 1000 |
| 1983 | 1052 | 1134 | 1063 | 1033 | 972 | 1022 | 1036 | 1059 | 1093 | 1015 | 1057 |
The next table shows Export Price Index numbers for all pastoral and dairy produce groups and for all groups combined on a long time series. Separate series are prepared for December years and years ended June, the latter relating more closely to the farming year.
| EXPORT PRICES INDEX | ||
|---|---|---|
| Base: Year Ended December or June 1982, respectively (= 1000) | ||
| Year | All Pastoral and Dairy Produce | All Groups |
| * Provisional. | ||
| 1932 | 46 | 45 |
| 1942 | 82 | 79 |
| 1952 | 193 | 185 |
| 1962 | 196 | 189 |
| 1972 | 310 | 294 |
| 1932 | 48 | 47 |
| 1942 | 82 | 79 |
| 1952 | 194 | 186 |
| 1962 | 191 | 184 |
| 1972 | 280 | 269 |
| December Year | ||
| 1973 | 410 | 377 |
| 1974 | 389 | 371 |
| 1975 | 361 | 367 |
| 1976 | 488 | 484 |
| 1977 | 570 | 556 |
| June Year | ||
| 1973 | 372 | 343 |
| 1974 | 414 | 384 |
| 1975 | 352 | 351 |
| 1976 | 430 | 431 |
| 1977 | 547 | 534 |
| 1978 | 608 | 591 |
| 1979 | 737 | 716 |
| 1980 | 841 | 827 |
| 1981 | 935 | 934 |
| 1982 | 1022 | 1032 |
| 1983* | 1058 | 1091 |
| 1978 | 573 | 561 |
| 1979 | 671 | 647 |
| 1980 | 811 | 786 |
| 1981 | 877 | 873 |
| 1982 | 1000 | 1000 |
| 1983 | 1036 | 1057 |
| IMPORT PRICES INDEX | |||||||||||
|---|---|---|---|---|---|---|---|---|---|---|---|
| Base: Year Ended June 1982 (= 1000) | |||||||||||
| Year Ended 30 June | Petroleum and Products | Textile Yarn. Fabrics, etc. | Iron and Steel | Machinery other than Electric | Electric Machinery and Apparatus | Transport Equipment | Food. Live Animals, Beverages, and Tobacco | Manufactured Goods other than Food | Crude Materials other than Fuels | Mineral Fuels, Lubricants, and Related Materials | All Groups |
| 1978 | 301 | 681 | 571 | 643 | 690 | 637 | 812 | 626 | 545 | 300 | 552 |
| 1979 | 316 | 700 | 660 | 736 | 725 | 697 | 739 | 666 | 556 | 316 | 579 |
| 1980 | 594 | 800 | 783 | 780 | 797 | 746 | 819 | 784 | 661 | 594 | 735 |
| 1981 | 820 | 899 | 899 | 887 | 938 | 842 | 971 | 891 | 838 | 820 | 878 |
| 1982 | 1000 | 1000 | 1000 | 1000 | 1000 | 1000 | 1000 | 1000 | 1000 | 1000 | 1000 |
| 1983 | 1076 | 1079 | 1053 | 1131 | 1068 | 1084 | 1105 | 1098 | 1085 | 1076 | 1094 |
The following table shows a longer time series of all groups import prices index numbers on the same expression base for years ended March, June, and December.
| IMPORT PRICES INDEX | |||
|---|---|---|---|
| Base: Year Ended June 1982 (= 1000) | |||
| Year | Year Ended | ||
| 31 March | 30 June | 31 Dec (Calendar Year) | |
| * Provisional. | |||
| 1956 | 151 | 153 | 154 |
| 1966 | 156 | 157 | 157 |
| 1976 | 427 | 457 | 494 |
| 1977 | 512 | 522 | 543 |
| 1978 | 545 | 552 | 564 |
| 1979 | 570 | 579 | 637 |
| 1980 | 684 | 735 | 823 |
| 1981 | 851 | 878 | 940 |
| 1982 | 966 | 1000 | 1045 |
| 1983 | 1068 | 1094 | 1134* |
Terms of Trade—The Terms of Trade Index conceptually provides a measure of the changing level of the volume of imports which can be purchased by a unit quantity of exports. The index is calculated as the ratio of the level of export prices to that of import prices. On expression base: calendar year 1957 (=100) the
Terms of Trade Index = All Groups Export Price Index/All Groups Import Price Index × 100/1
with both price indexes expressed on a common base. The choice of this base year was arbitrarily made at the time and does not indicate that 1957 was a normal or standard year so far as price levels or the terms of the trade are concerned.
The table below shows index numbers of import prices, export prices, and terms of trade.
| IMPORT AND EXPORT PRICES AND TERMS OF TRADE—ALL COUNTRIES | |||
|---|---|---|---|
| Base: Calendar Year 1957 (= 100) | |||
| Year Ended June | Import Price Index | Export Price Index | Terms of Trade |
| * Provisional. | |||
| 1957 | 100 | 100 | 100 |
| 1970 | 126 | 109 | 87 |
| 1971 | 134 | 112 | 83 |
| 1972 | 140 | 130 | 93 |
| 1973 | 147 | 165 | 113 |
| 1974 | 165 | 185 | 112 |
| 1975 | 218 | 169 | 78 |
| 1976 | 288 | 208 | 72 |
| 1977 | 328 | 258 | 79 |
| 1978 | 347 | 270 | 78 |
| 1979 | 364 | 312 | 86 |
| 1980 | 462 | 379 | 82 |
| 1981 | 552 | 421 | 76 |
| 1982 | 629 | 482 | 77 |
| 1983 | 688 | 510 | 74 |
| Period | Import Price Index | Export Price Index | Terms of Trade |
| Quarter— | |||
| 1980–30 Sep | 538 | 399 | 74 |
| 31 Dec | 543 | 418 | 77 |
| 1981–31 Mar | 552 | 426 | 77 |
| 30 Jun | 574 | 438 | 76 |
| 30 Sep | 609 | 460 | 76 |
| 31 Dec | 623 | 482 | 77 |
| 1982–31 Mar | 628 | 489 | 78 |
| 30 Jun | 653 | 496 | 76 |
| 30 Sep | 671x | 502 | 75x |
| 31 Dec | 680 | 505 | 74 |
| 1983–31 Mar | 689 | 498 | 72 |
| 30 Jun | 717 | 532 | 74 |
| 30 Sep* | 721 | 535 | 74 |
| 31 Dec* | 725 | 539 | 74 |
| 1984–31 Mar* | 723 | 546 | 76 |
SHARE PRICES INDEX—This index is designed to reflect changes in the aggregate value of holdings of parcels of ordinary shares in representative selections of companies listed on the New Zealand Stock Exchanges and trading in New Zealand. In selecting the companies, the frequency with which shares are traded was used as a criterion as well as the value of the New Zealand shareholding. The weights of the different companies are determined by the New Zealand shareholding, and appropriate methods take account of capital changes in the companies concerned.
Weights for representative groups are fixed and are based on the aggregate value for the month of November 1978 of the total value of shareholdings in all the exchange-listed companies which qualified for representation in the index.
| SHARE PRICES AND DIVIDEND YIELDS—ALL GROUPS INDEX NUMBERS | ||
|---|---|---|
| Base: Month of November 1978 (= 1000) | ||
| Calendar Year | Share Prices | Dividend Yields |
| 1978 | 998 | 994 |
| 1979 | 1083 | 986 |
| 1980 | 1376 | 924 |
NOTE—This index is currently being revised.
HOUSEHOLD SURVEY—The New Zealand Household Survey originated from a 1971 recommendation of the Consumers Price Index Revision Advisory Committee that an inquiry should take place into the pattern of private households' expenditure, as a source for the weighting pattern of the Consumers Price Index. The resulting Household Survey commenced on 1 July 1973, and has been conducted on an annual basis since that date. In 1975–76 the survey year was changed from a July-June year to an April-March year.
Although the survey's main objective initially was to provide statistics on the expenditure patterns of private households in New Zealand, its objectives have since extended into collecting information on the social and demographic characteristics of responding households, and on household income. As a result, the survey now provides sample-based statistics on household characteristics, household expenditure, and household income for a wide variety of uses.
A sample of approximately 4500 private households is randomly selected for the survey every third year, to provide data for the revision of the Consumers Price Index, and a smaller sample of approximately 3500 private households is selected in other years. In the 1982–83 year, 4488 private households (comprising 13 269 persons) participated in the survey, each household containing an average of 2.96 persons.
Questionnaires administered to each household include:
The Household Questionnaire—The Household Questionnaire collects information on the demographic characteristics of household members, and determines the composition of the household for subsequent survey purposes.
The Expenditure Questionnaire—The Expenditure Questionnaire collects details of expenditure and sales in areas such as housing, home maintenance, household operation, transport, holidays, health, recreation, and education. Regular household expenditure commitments, such as rates, rent, electricity, telephone rental, and television licence fees, are collected using the 'latest payment/period covered' approach, and are subsequently rated up to annual equivalents at the clerical-processing stage. Irregular household expenditure, generally for goods and services costing $ 100 or more, is collected on a 12 month recall basis.
Each household member aged 15 years or over is required to keep a diary of expenditure for a period of 14 days. All expenditure reported in diaries is deleted at the clerical-processing stage.
The Income Questionnaire—Each household member aged 15 years or over is required to complete an Income Questionnaire which is administered by a survey interviewer.
Details of employment and income are collected. Regular income is collected by means of the 'latest receipt/period covered' approach, and rated up to equivalent annual amounts at the clerical-processing stage. Irregular income is collected on a 12-month recall basis, which requires respondents to report the total gross amount received from each source of irregular income during the last 12 months.
Classification of Expenditure Data—Expenditure data collected in the survey are classified according to the Household Survey Commodity Classification, which is a structured, four-digit classification based on commodity groups of the Consumers Price Index. Household expenditure is categorised under 7 main headings:
Food—Including meals away from home;
Housing—Rent, mortgage repayments (principal and interest), property insurance, repairs and maintenance, rates and net capital costs of house sales and purchases;
Household Operation—Fuel and power, home appliances, furniture, floor coverings, utensils, Post Office services, cleansers, dry cleaning, etc.;
Apparel—Clothing and footwear;
Transportation—Public transport in New Zealand, overseas travel costs, net cost of vehicle sales and purchases, repairs and maintenance to vehicles, vehicle registration and relicensing, vehicle running costs, and driver's licence and parking fees;
Other Goods—Tobacco, alcohol, toiletries, cosmetics, medical goods, pets and pet supplies, newspapers, stationery, sports goods, leisure goods, and recreational goods.
Other Services—Medical and health services, entertainment charges, education fees, accommodation charges, personal services, club subscriptions, union dues, health insurance premiums, legal and financial services, and animal health services.
In all cases, information as reported or recorded by household members is processed without adjustment for under-reporting of income and expenditure. Overseas experience suggests that expenditure on tobacco and alcohol, on meals away from home, and on food items such as ice cream and confectionery, tends to be under-reported in household surveys. Other data sources indicate that a similar situation occurs in the New Zealand Household Survey.
In the tables which follow, the aggregate survey income/expenditure has been averaged over all households in the survey, rather than over only those households which reported income/expenditure. This averaging procedure has the effect of reducing some average income/expenditure statistics to a level below that which would normally be expected (e.g., expenditure on rent).
Household Income—The following table shows the income distributions of households which participated in the 1982–83 Household Survey.
| Annual Income | Approximate Equivalent Weekly Income | Number of Households |
|---|---|---|
| $ | $ | |
| Under 6,500 | Under 125 | 393 |
| 6,500–7,999 | 125 and under 153 | 215 |
| 8,000–9,999 | 153 and under 192 | 286 |
| 10,000–11,999 | 192 and under 230 | 309 |
| 12,000–13,999 | 230 and under 268 | 297 |
| 14,000–15,999 | 268 and under 307 | 261 |
| 16,000–19,999 | 307 and under 385 | 511 |
| 20,000–24,999 | 385 and under 480 | 630 |
| 25,000–29,999 | 480 and under 575 | 497 |
| 30,000 and over | 575 and over | 1,089 |
| 4,488 |
Household Expenditure—The table below shows average weekly expenditure per household on each expenditure group, analysed by selected family types, for the 1982–83 survey.
| Expenditure Group | Couple | Couple With 1 Child | Couple With 2 Children | Couple With 3 or more Children | Solo Parent With Child(ren) | Non-Family Households | Extended Family Households | All Households |
|---|---|---|---|---|---|---|---|---|
| Average Weekly Expenditure ($) | ||||||||
| Food | 44.67 | 60.08 | 69.97 | 80.92 | 46.85 | 31.82 | 80.94 | 54.78 |
| Housing | 47.36 | 57.31 | 81.74 | 62.21 | 30.98 | 33.56 | 63.21 | 53.08 |
| Household operation | 49.13 | 57.29 | 55.52 | 55.86 | 37.47 | 31.58 | 51.57 | 47.47 |
| Apparel | 15.64 | 22.31 | 24.97 | 29.86 | 13.98 | 11.71 | 26.69 | 19.45 |
| Transportation | 53.99 | 66.86 | 63.35 | 68.11 | 38.62 | 38.04 | 73.80 | 55.46 |
| Other goods | 31.28 | 45.28 | 42.61 | 43.48 | 25.13 | 22.00 | 47.49 | 34.85 |
| Other services | 19.18 | 25.57 | 28.42 | 30.76 | 17.02 | 14.76 | 23.46 | 22.06 |
| Total expenditure | 261.26 | 334.70 | 366.57 | 371.19 | 210.04 | 183.46 | 367.15 | 287.14 |
| Total households | 1088 | 505 | 778 | 545 | 305 | 987 | 280 | 4488 |
Comparison Between 1981–82 and 1982–83—The following table gives an analysis by commodity group and subgroup of average weekly expenditure per private household for the 1981–82 and 1982–83 Household Surveys.
| Commodity Group and Subgroup | Average Weekly Household Expenditure† | Percentage of Total Expenditure | ||
|---|---|---|---|---|
| 1981–82 | 1982–1983 | 1981–82 | 1982–83 | |
* Care should be exercised in interpreting differences between 1981–82 and 1982–83 in average weekly household expenditure at the subgroup level. Because of sampling error seemingly large differences in average weekly household expenditure between the two years may not be statistically significant. †Averages have been rounded to the nearest five cents. | ||||
| $ | $ | % | % | |
| Food— | ||||
| Fruit | 3.75 | 4.25 | 1.4 | 1.5 |
| Vegetables | 4.05 | 4.45 | 1.5 | 1.5 |
| Meat | 9.30 | 9.85 | 3.5 | 3.4 |
| Poultry | 1.30 | 1.40 | 0.5 | 0.5 |
| Fish | 1.10 | 1.20 | 0.4 | 0.4 |
| Farm products, fats, oils | 6.90 | 7.70 | 2.6 | 2.7 |
| Cereals, cereal products | 6.40 | 7.05 | 2.4 | 2.4 |
| Sugar, syrups, spreads, beverages | 6.20 | 6.65 | 2.3 | 2.3 |
| Other foodstuffs | 2.60 | 2.75 | 1.0 | 1.0 |
| Food consumed in eating places: take-away foods | 8.45 | 9.50 | 3.2 | 3.3 |
| Total, food | 50.05 | 54.80 | 18.7 | 19.1 |
| Housing— | ||||
| Rent | 8.35 | 10.25 | 3.0 | 3.6 |
| Net capital outlay | 7.40 | −2.70 | 2.8 | −1.0 |
| Property purchase and sale expenses | 2.35 | 2.10 | 0.9 | 0.7 |
| Property mortgage repayment | 14.60 | 16.80 | 5.4 | 5.8 |
| Property rates and insurance | 5.65 | 7.10 | 2.1 | 2.5 |
| Other housing costs | 21.10 | 19.60 | 7.9 | 6.8 |
| Total, housing | 59.45 | 53.10 | 22.2 | 18.5 |
| Household operation— | ||||
| Fuel and power | 6.80 | 7.90 | 2.5 | 2.8 |
| Home appliances | 10.20 | 11.95 | 3.8 | 4.2 |
| Furniture | 4.90 | 5.30 | 1.8 | 1.8 |
| Furnishings | 1.05 | 1.30 | 0.4 | 0.5 |
| Floor coverings | 2.25 | 2.75 | 0.8 | 1.0 |
| Household textiles | 2.50 | 2.90 | 0.9 | 1.0 |
| Household equipment and utensils | 3.20 | 2.95 | 1.2 | 1.0 |
| Household supplies | 4.20 | 4.35 | 1.6 | 1.5 |
| Household services | 6.65 | 8.10 | 2.5 | 2.8 |
| Total, household operation | 41.80 | 47.45 | 15.6 | 16.5 |
| Apparel— | ||||
| Men's clothing | 3.75 | 3.95 | 1.4 | 1.4 |
| Women's clothing | 6.65 | 6.80 | 2.5 | 2.4 |
| Boys', girls' and infants' clothing | 2.20 | 2.20 | 0.8 | 0.8 |
| Other clothing costs | 2.40 | 2.60 | 0.9 | 0.9 |
| Men's footwear | 0.90 | 1.00 | 0.3 | 0.3 |
| Women's footwear | 1.75 | 1.80 | 0.7 | 0.6 |
| Children's footwear and footwear costs | 0.95 | 1.15 | 0.4 | 0.4 |
| Total, apparel | 18.65 | 19.45 | 7.0 | 6.8 |
| Transportation— | ||||
| Public transport in N.Z. | 2.80 | 3.10 | 1.0 | 1.1 |
| Overseas travel | 5.40 | 5.50 | 2.0 | 1.9 |
| Purchase of vehicles | 14.65 | 18.80 | 5.5 | 6.5 |
| Fuel, oil, parts, accessories | 16.50 | 18.70 | 6.2 | 6.5 |
| Vehicle repair and maintenance | 3.95 | 4.10 | 1.5 | 1.4 |
| Vehicle insurance and fees | 2.95 | 3.85 | 1.1 | 1.3 |
| Other private transport costs | 1.25 | 1.40 | 0.5 | 0.5 |
| Total, transportation | 47.55 | 55.45 | 17.7 | 19.3 |
| Other Goods— | ||||
| Tobacco | 3.95 | 4.30 | 1.5 | 1.5 |
| Alcohol | 8.70 | 9.65 | 3.3 | 3.4 |
| Medical and health supplies | 0.85 | 0.95 | 0.3 | 0.3 |
| Toiletries and cosmetics | 2.25 | 2.45 | 0.8 | 0.8 |
| Personal supplies | 1.05 | 1.20 | 0.4 | 0.4 |
| Personal goods | 2.10 | 2.10 | 0.8 | 0.7 |
| Stationery | 1.05 | 1.15 | 0.4 | 0.4 |
| Leisure and recreational equipment, goods and supplies | 4.50 | 5.25 | 1.7 | 1.8 |
| Newspapers, magazines and books | 3.15 | 3.60 | 1.2 | 1.2 |
| New and used recreational and towed vehicles | 2.25 | 1.45 | 0.8 | 0.5 |
| Supplies not elsewhere classified | 2.25 | 2.75 | 0.8 | 1.0 |
| Total, other goods | 32.10 | 34.85 | 12.0 | 12.0 |
| Other services— | ||||
| Health services | 2.75 | 3.25 | 1.0 | 1.1 |
| Personal services* | 1.70 | 2.00 | 0.6 | 0.7 |
| Educational, cultural, leisure and recreational services | 5.20 | 6.20 | 1.9 | 2.2 |
| Accommodation services | 1.25 | 160 | 0.5 | 0.6 |
| Miscellaneous services | 7.40 | 9.05 | 2.8 | 3.2 |
| Total, other services | 18.40 | 22.05 | 6.9 | 7.7 |
| Total expenditure | 268.00 | 287.15 | 100.0 | 100.0 |
| Number of households | 3,487 | 4,488 | ||
Household Amenities—The proportions of surveyed households which owned, or had available for their use, selected household amenities are as follows:
| Amenity | Percent of All Surveyed Households |
|---|---|
| Electric range or wall oven | 93.9 |
| Coal or oil-fired range | 5.5 |
| Gas range | 6.4 |
| Washing machine | 96.9 |
| Clothes dryer | 50.6 |
| Separate refrigerator | 41.9 |
| Refrigerator/freeze combination | 62.6 |
| Separate deep-freeze unit | 60.1 |
| Dish-washing machine | 13.1 |
| Colour television (owned) | 66.0 |
| Monochrone television (owned) | 26.8 |
| Colour television (rented) | 15.8 |
| Monochrone television (rented) | 1.8 |
| Radiogram or stereo equipment | 76.7 |
| Hand-mower | 22.7 |
| Motor-mower | 73.1 |
| Electric blanket | 79.6 |
| Portable electric heater | 89.4 |
| Fixed electric heater | 36.1 |
| Portable gas heater | 1.9 |
| Fixed gas heater | 5.3 |
| Open fire | 51.7 |
| Coal/coke/wood burner | 26.8 |
| Portable kerosene heater | 13.4 |
| Oil-fired central heating | 3.8 |
| Car | 83.2 |
| Caravan | 6.7 |
| Motor-cycle | 12.8 |
| Bicycle | 34.7 |
FURTHER INFORMATION—The Household Survey is not designed to provide statistics at a subnational level or at more frequent intervals than annually. Thus only national statistics on an annual basis are available from it.
A full description of the Household Survey, including an account of the sample design, concepts, definitions and collection methodology, is published in the annual report New Zealand Household Survey which is available from the Government Bookshops.
Further information on legislation affecting prices and the consumer, price levels, the CPI, household expenditure, and other matters touched on in this section will be found in the following publications.
Report of the Department of Trade and Industry (Parl. paper G. 14).
Prices, Wages and Labour. Pt. A, Prices—Department of Statistics (Annual).
Household Survey Report—Department of Statistics (Annual).
Monthly Abstract of Statistics—Department of Statistics (Monthly).
Report of the Consumer Council (Parl. paper G. 29).
Reports of the Consumers Price Index Advisory Committees (Parl. paper G. 28A, 1978, and Parl. paper H. 40 1971).
Report of the Government Statistician (Parl. paper G. 28).
Report on Consumers Price Index Revision 1980—Department of Statistics.
Periodically, the Department of Statistics prepares statistics of the amount of food available for consumption in New Zealand, from data supplied by the Ministry of Agriculture and Fisheries and from other sources. These statistics are estimates of the total amounts of basic foodstuffs available in New Zealand for human consumption during the calendar year, making allowances for estimated quantities which are produced by households for their own consumption, including the households of commercial producers. The estimates are not of the amounts actually consumed, nor of the actual average intake of nourishment. Nor can these figures be reconciled with the figures for the average per household expenditure on food for the year recorded by the Household Survey, as the latter figures are of the expenditure on food in the form it is actually bought, often in a much more highly processed form.
Dairy Products—New Zealanders are the world's largest consumers of butter per head, but are fairly moderate consumers of cheese. The annual amounts available of the main items of dairy produce, eggs, and ice cream, estimated per head of mean population, are shown in the following table.
| Food Commodity | Unit | 1938 | 1977 | 1978 | 1979 | 1980 | 1981* |
|---|---|---|---|---|---|---|---|
* Provisional. †Includes the whole-milk equivalent of cream consumed as such. ‡Includes condensed milk, evaporated milk and cream, milk powders, and sugar of milk. | |||||||
| Fresh milk and cream† (whole milk equivalent) | litre | 129 | 167 | 166 | 163 | 157 | 154 |
| Processed milk‡ | kg | 2 | 7 | 5 | 4 | 6 | 4 |
| Cheese | kg | 2 | 8 | 8 | 4 | 5 | 5 |
| Ice cream | litre | 2 | 17 | 18 | 16 | 18 | 16 |
| Butter | kg | 19 | 14 | 13 | 12 | 13 | 16 |
| Eggs | No. | 240 | 270 | 267 | 270 | 278 | 270 |
Meat, Poultry, and Fish—Gradual changes are taking place in consumption patterns for meat, poultry, and fish, of which the most notable is the increase in the consumption of poultry. New Zealanders remain among the world's largest consumers of meat, judging from the amount available per head.
Estimates of the amounts of meat available per head are expressed on a bone-in dressed carcass basis.
Allowances have been made for non-commercial catches of fish and for home production of poultry.
Catches of fish in the Exclusive Economic Zone which are not landed in New Zealand are not taken into account as they do not contribute to the amount of fish available for consumption in New Zealand.
| Food Commodity | Unit | 1938 | 1975 | 1976 | 1977 | 1978 | 1979 | 1980 | 1981* |
|---|---|---|---|---|---|---|---|---|---|
* Provisional. †Year ended 30 September for 1938 figures. Figures for other years refer to December years. | |||||||||
| Beef† | kg | 52 | 48 | 54 | 57 | 56.4 | 49.8 | 46.2 | 46.4 |
| Veal† | kg | 4 | 4 | 4 | 3 | 3.0 | 1.7 | 1.1 | 1.3 |
| Mutton and lamb† | kg | 31 | 37 | 33 | 30 | 31.5 | 32.1 | 29.8 | 30.1 |
| Pigmeats† | kg | 12 | 12 | 11 | 13 | 12.9 | 11.6 | 11.2 | 10.4 |
| Edible offal† | kg | 4 | 6 | 6 | 5 | 5.4 | 5.0 | 5.0 | 5.3 |
| Poultry | kg | 2 | 9 | 10 | 10 | 11.2 | 11.6 | 12.1 | 13.4 |
| Fish— | |||||||||
| Fresh, frozen, smoked | kg | 5 | 2 | 2 | 5x | 5 | 4 | 6 | 6 |
| Shellfish | kg | 1 | 1 | 1 | 1 | 1 | 1 | 1 | – |
| Canned | kg | 1 | 1 | 1 | 1 | 1 | 1 | 1 | 1 |
Vegetables and Fruits—The estimates in the following table are based on commercial production plus allowances for production in home gardens and orchards. The estimates include, at fresh weights, the fruits and vegetables grown in New Zealand and either quick-frozen or canned for local consumption.
There are considerable variations from year to year for many of the commodities and these are often a reflection of a poor growing season or a bountiful one, fluctuations in the supply of imported fruit, or a change in consumption pattern.
Availability per head of mean population for individual items is estimated as follows.
| Food Commodity | 1938 | 1977 | 1978 | 1979 | 1980 | 1981* |
|---|---|---|---|---|---|---|
* Provisional. †Includes asparagus, beans, brussels sprouts, cucumber, leeks, parsnips, pumpkin, spinach, swedes, sweetcorn, etc. ‡Includes grapefruit, lemons, mandarins, tangelos, etc. §Includes nectarines, plums, grapes, pineapples, tamarillos, kiwi fruit, passionfruit, etc. | ||||||
| Fresh vegetables— | Kilograms | |||||
| Potatoes | 54 | 57 | 53 | 42 | 46 | 44 |
| Kumaras | 4 | 2 | 5 | 3 | 5 | 5 |
| Cabbages | 14 | 7 | 8 | 8 | 8 | 8 |
| Carrots | 5 | 9 | 10 | 9 | 10 | 10 |
| Cauliflower | 5 | 5 | 5 | 5 | 5 | |
| Lettuce | 4 | 5 | 4 | 5 | 5 | |
| Onions | 9 | 13 | 10 | 16 | 13 | |
| Tomatoes | 9 | 10 | 11 | 9 | 10 | 10 |
| Other vegetables† | 10 | 14 | 15 | 16 | 15 | |
| Canned and other processed vegetables | 1 | 19 | 21 | 19 | 19 | 19 |
| Quick-frozen and dried vegetables | 14 | 15 | 15 | 15 | 15 | |
| Fresh fruit— | ||||||
| Oranges | 7 | 6 | 7 | 6 | 7 | 7 |
| Other citrus fruit‡ | 3 | 4 | 5 | 5 | 7 | 7 |
| Bananas | 9 | 12 | 11 | 10 | 12 | 11 |
| Apples | 20 | 27 | 35 | 29 | 35 | 33 |
| Pears and quinces | 3 | 3 | 4 | 4 | 5 | 4 |
| Berryfruits | 2 | 2 | 2 | 2 | 2 | |
| Apricots | 2 | 2 | 2 | 2 | 2 | |
| Peaches | 7 | 5 | 5 | 5 | 5 | |
| Other fruit§ | 8 | 8 | 10 | 8 | 9 | |
| Dried fruit | 3 | 3 | 3 | 3 | 3 | |
Other Foodstuffs—Most of the foodstuffs in the following table show relatively slight fluctuations in the amounts available per head in different years.
| Food Commodity | 1938 | 1977 | 1978 | 1979 | 1980 | 1981* |
|---|---|---|---|---|---|---|
* Provisional. †Includes dried peas, beans, and lentils. ‡Includes barley, and corn used for cornflour and maize used for cornflakes only. | ||||||
| Kilograms | ||||||
| Sugar, syrups, and honey | 44 | 37 | 36 | 35 | 35 | 33 |
| Pulses† | 1 | 1 | – | 1 | 1 | 1 |
| Nuts | 2 | 2 | 2 | 3 | 2 | |
| Cocoa | 1 | 1 | 1 | 1 | 1 | 1 |
| Cereals—Wheat | 81 | 72 | 72 | 69 | 74 | 73 |
| Oats | 4 | 1 | 2 | 2 | 2 | 2 |
| Rice | 2 | 2 | 2 | 2 | 2 | 2 |
| Other‡ | 1 | |||||
| Lard, tallow, animal fats | 2 | 2 | 2 | 2 | 2 | |
| Vegetable oils and other fats | 5 | 6 | 6 | 6 | 6 | |
Non-alcoholic Beverages and Tobacco—
| 1938 | 1951 | 1961 | 1971 | 1978 | 1979 | 1980 | 1981 | |
|---|---|---|---|---|---|---|---|---|
| Kilograms | ||||||||
| Tea | 3 | 3 | 3 | 3 | 2 | 2 | 2 | 2 |
| Coffee | 1 | 2 | 2 | 2 | 2 | 2 | ||
| Tobacco | 2 | 2 | 2 | 2 | 3 | 3 | 2 | 3 |
Alcoholic Beverages—The following table shows the estimated consumption of alcoholic beverages.
| Year Ended 31 December | Total Consumption | Consumption per Head of Mean Population | ||||
|---|---|---|---|---|---|---|
| Beer | Wine | Spirits | Beer | Wine | Spirits | |
* Litres, not proof litres. †Years ended June. | ||||||
| litres (m) | litres (m) | proof litres (m) | litres | litres | proof litres | |
| 1940 | 83.3 | 1.5 | 2.0* | 50.9 | 0.9 | 1.2* |
| 1970 | 329.2 | 15.9 | 5.4 | 116.8 | 5.6 | 1.9 |
| 1975 | 389.8 | 26.3† | 9.6 | 126.3 | 8.6† | 3.1 |
| 1978 | 398.7 | 36.1† | 11.0x | 127.4 | 11.5† | 3.5 |
| 1979 | 370.1 | 35.2x† | 11.6 | 118.5 | 11.2† | 3.7 |
| 1980 | 378.7 | 41.4 | 10.8 | 120.9 | 13.3† | 3.4 |
| 1981 | 384.6 | 45.5 | 11.1 | 121.8 | 14.5† | 3.5 |
PROPORTION OF FOODSTUFFS EXPORTED—New Zealand is a major exporter of dairy produce and meat, and has a growing export trade in fruit and vegetables. The following table shows for these commodities the percentage of the New Zealand production that is exported.
| Product | 1968 | 1977 | 1978 | 1979 | 1980 | 1981* |
|---|---|---|---|---|---|---|
| * Provisional. | ||||||
| Dairy products— | Percentages exported | |||||
| Processed milk | 73 | 83 | 79 | 82 | 87 | 73 |
| Cheese | 84 | 63 | 73 | 71 | 78 | 88 |
| Butter | 80 | 75 | 79 | 86 | 80 | 77 |
| Meat, poultry, fish— | ||||||
| Beef | 61 | 67 | 68 | 68 | 69 | 69 |
| Veal | 58 | 66 | 67 | 74 | 79 | 77 |
| Pig meat | 3 | 4 | 1 | 2 | 4 | 8 |
| Mutton | 61 | 80 | 82 | 80 | 84 | 85 |
| Lamb | ||||||
| Offal | 76 | 72 | 73 | 72 | 73 | 67 |
| Other meat | 23 | 95 | 95 | 95 | 95 | 95 |
| Poultry | 1 | 1 | 1 | 1 | ||
| Fresh, smoked, or frozen fish | 25 | 41 | 52 | 70 | 46 | 60 |
| Shellfish | 52 | 46 | 68 | 40 | 60 | 100 |
| Fruit and vegetables— | ||||||
| Apples | 40 | 37 | 36 | 46 | 44 | 46 |
| Pears | 17 | 11 | 9 | 12 | 11 | 24 |
| Berryfruits | 5 | 21 | 29 | 34 | 34 | 32 |
| Potatoes | 2 | 8 | 4 | 7 | 5 | 5 |
| Onions | 35 | 56 | 41 | 59 | 41 | 54 |
| Canned vegetables | 9 | 4 | 4 | 5 | 3 | 3 |
| Quick-frozen vegetables | 30 | 27 | 28 | 33 | 32 | 33 |
| Other foodstuffs— | ||||||
| Barley | 2 | 13 | 18 | 15 | 27 | 12 |
| Honey | 4 | 16 | 17 | 34 | 26 | 17 |
| Pulses | 55 | 63 | 53 | 58 | 69 | 77 |
| Eggs | 2 | 11 | 7 | 7 | 5 | 7 |
| Tallow and animal fats | 77 | 86 | 84 | 83 | 87 | 86 |
FOOD AVAILABLE PER DAY—The following table shows by commodity group the food available for consumption in New Zealand par day, per head of mean population.
| Food Commodity | Grams Per Day | Calories Per Day | Protein Per Day (Grams) | Fat Per Day (Grams) | ||||||||
|---|---|---|---|---|---|---|---|---|---|---|---|---|
| 1977 | 1980 | 1981* | 1977 | 1980 | 1981* | 1977 | 1980 | 1981* | 1977 | 1980 | 1981* | |
| * Provisional. | ||||||||||||
| Cereals | 207 | 214 | 213 | 755 | 780 | 773 | 23 | 23 | 23 | 2 | 2 | 2 |
| Potatoes and other starchy foods | 161 | 139 | 133 | 115 | 101 | 98 | 3 | 2 | 2 | |||
| Sugar, syrups, and honey | 102 | 95 | 90 | 386 | 358 | 340 | – | – | – | – | – | – |
| Pulses and nuts | 13 | 13 | 12 | 57 | 55 | 51 | 2 | 1 | 1 | 2 | 2 | 2 |
| Vegetables | 242 | 283 | 275 | 64 | 74 | 71 | 4 | 3 | 2 | |||
| Fruits | 204 | 234 | 229 | 112 | 126 | 125 | 1 | |||||
| Meat (incl. poultry) | 324 | 290 | 294 | 681 | 606 | 609 | 42 | 36 | 38 | 56 | 50 | 49 |
| Eggs | 40 | 43 | 42 | 58 | 62 | 60 | 4 | 5 | 5 | 4 | 4 | 4 |
| Fish | 19 | 22 | 18 | 23 | 24 | 21 | 2 | 3 | 2 | 1 | 1 | 1 |
| Milk and cheese | 540 | 500 | 485 | 544 | 483 | 457 | 28 | 23 | 23 | 29 | 26 | 25 |
| Oils and fats (incl. butter) | 57 | 60 | 66 | 441 | 470 | 514 | 36 | 36 | 41 | |||
| Total | 1 909 | 1 893 | 1 857 | 3 236 | 3 139 | 3 119 | 108 | 97 | 96 | 130 | 121 | 124 |
FURTHER INFORMATION—Fuller information on food available for consumption in New Zealand is published as an appendix to the Monthly Abstract of Statistics.
Table of Contents
Table of Contents
The New Zealand System of National Accounts (NZSNA) provides a systematic analysis of the performance of the New Zealand economy. The system is based on the United Nations manuals: A System of National Accounts Studies in Methods Series. It also provides the basic framework of standard concepts, definitions and classifications for economic agents and transactions.
The Department of Statistics' economic surveys are all integrated with this system, as is the interindustry study, Inter-industry Study of the New Zealand Economy 1976–77, Department of Statistics, September 1983.
Balance of Payments statistics follow similar concepts and provide the basis of the external transactions account of the NZSNA.
The accounts and tables presented here summarise production and associated flows of income and expenditure and are only a part of the planned final system.
This section consists of 3 different sets of tables. The first includes the Consolidated Accounts of the Nation, 25 production group accounts, and detailed tables relating to gross fixed capital formation and stocks.
The second set contains data on gross domestic product in constant 1977–78 prices. These tables replace the real gross domestic product tables which were previously published as a separate section.
The third set of tables contain a detailed analysis of the Agriculture Production Account. This account has been substantially revised and was previously published in General Farming.
Tables in Section 26A refer to the 5 years ended March 1979 to 1983. The National Accounts were subjected to a major revision in 1983, which affected most tables back to 1971–72. A set of tables revised back to 1973–74, was published as an appendix to the February 1984 Monthly Abstract of Statistics, and further data is available from the Department of Statistics on request.
CONSOLIDATED ACCOUNTS OF THE NATION—The Consolidated Accounts of the Nation comprise 4 accounts:
Gross Domestic Product and Expenditure—Gross Domestic Product is a measure of the value added from all economic activity in New Zealand. The account shows the various forms of income generated by the economy and the categories of the final expenditure on the domestic product.
National Disposable Income and its Appropriation—National Disposable Income is the value of income available to New Zealanders. Consisting mainly of the incomes generated in New Zealand, adjustments are made for the income paid to and received from the rest of the world. The account also shows that part of disposable income which was spent by New Zealanders on current consumption and the portion of income which was saved.
Capital Finance—Capital expenditure is recorded in this account. The difference between the accumulation of capital assets and the sources of funds (mainly savings and the income set aside for the use of assets) gives a residual to be borrowed from (or lent to) the rest of the world.
External Transactions—This account brings together all transactions with the rest of the world. The residual “Surplus of Nation on Current Transactions” records New Zealand's net borrowing from the rest of the world.
Accounting Period—Generally financial years ending 31 March or the last accounting year prior to 31 March.
Gross Domestic Product—The total market value of goods and services produced in New Zealand after deducting the cost of goods and services utilised in the process of production, but before deducting allowances for the consumption of fixed capital.
Compensation of Employees—Payments of salaries and wages whether in cash or in kind to employees. Includes contributions paid on employees behalf to superannuation funds, private pension schemes, the Accident Compensation Corporation, casualty and life insurance schemes, etc.
Consumption of Fixed Capital—The value of depreciation at ordinary rates allowed for taxation purposes, plus an estimate for the normal rate of accidental damage based on the insurance claims by each industry group.
Indirect Taxes—Taxes which are assessed on producers in respect of the production, sale, purchase and use of goods and services, and which add to the market process of these goods and services. Includes sales tax, local authority rates, import and excise duties, and also registration fees such as motor vehicle registration which are paid by producers.
Subsidies—Grants made by Government to market-oriented producers who regard the transfers as an addition to income from current production. These grants include payments to ensure a guaranteed price or to enable market prices of goods and services to be held below the cost of production. Transfers made by local authorities out of rates receipts to finance the losses of their trading departments and deliberately incurred losses of government trading organisations are also included.
Intermediate Consumption—The value of non-durable goods and services used in production. Valuation is at purchaser's values.
Gross Output at Producer's Values—
Market Production Groups: The total market value including commodity taxes on all goods and services produced during the year including stocks of work-in-progress. Included is output produced for both sale in the market and capital formation on own account.
Non-market Production Groups: These producers may sell a proportion of their output in the market and such receipts are included in total output. However, most of the services produced represent unmarketed output and are valued at cost price. This assumption is necessary because there is no other basis for valuation.
Operating Surplus—This is a residual item, being gross output at producer's values less the sum of intermediate consumption, compensation of employees, consumption of fixed capital, and indirect taxes net of subsidies. It is approximately equal to accounting profit before the deduction of direct taxes, dividends, and bad debts and before the deduction of interest paid or the addition of interest received.
Final Consumption Expenditure—
Resident Households: All outlays on consumer goods and services including expenditure on consumer durables such as motor vehicles and furniture; included are payments made by Government on behalf of households and the imputed rent of owner-occupied dwellings.
Producers of Government Services and Private Non-Profit Services to Households: Total current expenditure by these producers less the value of any sales or own account capital formation (i.e. the total net current costs incurred in providing the services).
Increase in Stocks—The change in value of stocks of raw materials, work-in-progress, and finished goods, between the beginning and the end of the year.
Gross Fixed Capital Formation—The outlays of producers on durable real assets, such as buildings, motor vehicles, plant and machinery, hydro-electric construction, roading, and improvements to land. In measuring the outlays, sales of similar goods are deducted. Land is excluded from gross fixed capital formation. Included is the value of construction work done by a firm's own employees. The term “gross” indicates that consumption of fixed capital has not been deducted from the value of the outlays.
Statistical Discrepancy—In these accounts, the items making up Gross Domestic Product and Expenditure on Gross Domestic Product are estimated independently. Including the statistical discrepancy on the expenditure side of the first Consolidated Account is simply a convention. It does not imply that one side of this account is more accurate than the other.
PRINCIPAL AGGREGATES—The following table gives the principal aggregates of the national accounts over a 5-year period.
| Aggregates | Year Ended March | ||||
|---|---|---|---|---|---|
| 1979x | 1980x | 1981x | 1982* | 1983* | |
| * Provisional. | |||||
| $(million) | |||||
| Gross Domestic Product | 17,510 | 21,092 | 24,461 | 29,296x | 32.240 |
| Plus net factor receipts from rest of world | −409 | −460 | −511 | −615x | −860 |
| Gross National Product | 17,101 | 20,632 | 23,950 | 28,681x | 31,380 |
| Less consumption of fixed capital | −1,306 | −1,464 | −1,670 | −1,872x | −2,152 |
| National Income at Market Prices | 15,795 | 19,168 | 22,281 | 26,809x | 29,229 |
| Plus net current transfers from rest of world | −33 | 11 | 40 | 32 | 118 |
| National Disposable Income | 15,762 | 19,179 | 22,321 | 26,841x | 29,347 |
CONSOLIDATED ACCOUNTS—The first of the 4 consolidated accounts of the nation follows.
| GROSS DOMESTIC PRODUCT AND EXPENDITURE | |||||
|---|---|---|---|---|---|
| Item | Year Ended March | ||||
| 1979x | 1980x | 1981x | 1982x* | 1983* | |
| * Provisional. | |||||
| $(million) | |||||
| Compensation of employees | 9,422 | 11,005 | 13,100 | 15,778 | 17,276 |
| Operating surplus | 5,501 | 6,981 | 7,704 | 9,332 | 10,146 |
| Consumption of fixed capital | 1,306 | 1,464 | 1,670 | 1,872 | 2,152 |
| Indirect taxes | 1,725 | 1,998 | 2,343 | 2,914 | 3,435 |
| Less subsidies | −444 | −356 | −355 | −600 | −769 |
| Gross Domestic Product | 17,510 | 21,092 | 24,461 | 29,296 | 32,240 |
| Final consumption expenditure— | |||||
| General government | 2,882 | 3,322 | 4,152 | 5,022 | 5,632 |
| Private | 10,473 | 12,266 | 14,564 | 17,011 | 19,058 |
| Increase in stocks | 372 | 1,830 | 1,404 | 1,561 | 1,018 |
| Gross fixed capital formation | 3,645 | 3,833 | 4,448 | 6,216 | 7,425 |
| Statistical discrepancy | 7 | 162 | 158 | 388 | 245 |
| Gross national expenditure | 17,379 | 21,412 | 24,726 | 30,198 | 33,378 |
| Exports of goods and services | 4,771 | 5,998 | 7,024 | 8,292 | 9,116 |
| Less imports of goods and services | −4,640 | −6,318 | −7,289 | −9,194 | −10,254 |
| Expenditure on Gross Domestic Product | 17,510 | 21,092 | 24,461 | 29,296 | 32,240 |
The second of the consolidated accounts shows National Disposable Income, that is, the income available to New Zealanders, how it is spent, and how much is saved.
| NATIONAL INCOME AND OUTLAY | |||||
|---|---|---|---|---|---|
| Item | Year Ended March | ||||
| 1979x | 1980x | 1981x | 1982x* | 1983* | |
| * Provisional. | |||||
| $(million) | |||||
| Final consumption expenditure— | |||||
| Government—Central | 2,549 | 2,926 | 3,656 | 4,430 | 4,959 |
| Government—Local | 33 | 396 | 496 | 592 | 673 |
| Private—Households | 10,317 | 12,082 | 14,343 | 16,733 | 18,765 |
| Private—Non-profit organisations serving households | 156 | 184 | 221 | 278 | 293 |
| Savings | 2,407 | 3,592 | 3,605 | 4,808 | 4,657 |
| Appropriation of National Disposable Income | 15,762 | 19,179 | 22,321 | 26,841 | 29,347 |
| Compensation of employees | 9,422 | 11,005 | 13,100 | 15,778 | 17,276 |
| Compensation of employees from the rest of the world, net | |||||
| Operating surplus | 5,501 | 6,981 | 7,704 | 9,332 | 10,146 |
| Property and enterpreneurial income from the rest of the world, net. | −409 | −460 | −511 | −615 | −860 |
| Indirect taxes | 1,725 | 1,998 | 2,343 | 2,914 | 3,435 |
| Less subsidies | −444 | −356 | −355 | −600 | −769 |
| National income | 15,795 | 19,168 | 22,281 | 26,809 | 29,229 |
| Current transfers from the rest of the world, net | −33 | 11 | 40 | 32 | 118 |
| National Disposable Income | 15,762 | 19,179 | 22,321 | 26,841 | 29,347 |
The third of the consolidated accounts shows capital expenditure and how it is financed.
| CAPITAL FINANCE | |||||
|---|---|---|---|---|---|
| Item | Year Ended March | ||||
| 1979x | 1980x | 1981x | 1982x* | 1983* | |
* Provisional. †Includes all Government-owned producer enterprises. | |||||
| $(million) | |||||
| Increase in stocks | 372 | 1,830 | 1,404 | 1,561 | 1,018 |
| Gross Fixed Capital Formation— | |||||
| Private | 2,180 | 2,528 | 2,983 | 4,262 | 4,813 |
| Central Government† | 1,109 | 925 | 1,032 | 1,461 | 2,058 |
| Local Government† | 356 | 379 | 433 | 493 | 554 |
| Purchase of intangible assets from the rest of the world, net | |||||
| Net lending to the rest of the world | −311 | −769 | −736 | −1,485 | −1,880 |
| Gross Accumulation | 3,706 | 4,893 | 5,117 | 6,292 | 6,563 |
| Savings | 2,407 | 3,592 | 3,605 | 4,808 | 4,657 |
| Consumption of fixed capital | 1,306 | 1,464 | 1,670 | 1,872 | 2,152 |
| Capital transfers from the rest of the world, net | |||||
| Statistical discrepancy | −7 | −162 | −158 | −388 | −245 |
| Finance of Gross Accumulation | 3,706 | 4,893 | 5,117 | 6,292 | 6,563 |
The fourth consolidated account records all transactions with the rest of the world.
| EXTERNAL TRANSACTIONS | |||||
|---|---|---|---|---|---|
| Item | Year Ended March | ||||
| 1979x | 1980x | 1981x | 1982x* | 1983* | |
| * Provisional. | |||||
| $(million) | |||||
| Current | |||||
| Exports of goods and services | 4,771 | 5,998 | 7,024 | 8,292 | 9,116 |
| Compensation of employees from the rest of the world | |||||
| Property and enterpreneurial income from the rest of the world | 83 | 79 | 93 | 188 | 278 |
| Other current transfers from the rest of the world | 166 | 223 | 302 | 343 | 418 |
| Current receipts | 5,020 | 6,300 | 7,419 | 8,823 | 9,737 |
| Imports of goods and services | 4,640 | 6,318 | 7,289 | 9,194 | 10,254 |
| Compensation of employees to the rest of the world | |||||
| Property and enterpreneurial income to the rest of the world | 492 | 539 | 604 | 803 | 1,068 |
| Other current transfers to the rest of the world | 199 | 212 | 262 | 311 | 295 |
| Surplus of nation on current transactions | −311 | −769 | −736 | −1,485 | −1,880 |
| Current disbursements | 5,020 | 6,300 | 7,419 | 8,823 | 9,737 |
| Capital | |||||
| Surplus of nation on current transactions | −311 | −769 | −736 | −1,485 | −1,880 |
| Capital transfers from the rest of the world, net | |||||
| Net incurrence of foreign liabilities | 386 | 655 | 778 | 1,787 | 3,984 |
| Capital receipts | 75 | –114 | 42 | 302 | 2,104 |
| Purchase of intangible assets from the rest of the world, net | |||||
| Net acquisition of foreign financial assets | −228 | −75 | 17 | −4 | 1,489 |
| Statistical discrepancy | 303 | −39 | 25 | 306 | 615 |
| Capital disbursements | 75 | –114 | 42 | 302 | 2,104 |
PRODUCTION ACCOUNTS—The Production Accounts show the production of goods and services in New Zealand in each year, analysed according to economic activity. Each account measures the gross output of goods and services and the costs incurred. The classification used in establishing these groups firstly distinguishes between those producers that are market-oriented and those that produce goods and services that are not normally marketed.
Market producers are then classified according to industry based on the New Zealand Standard Industrial Classification.
Groups not normally producing for the market are subdivided into those owned by central government, by local government, and by private non-profit organisations which provide services for households.
The system explicitly recognises the Government as a producer when it carries out its conventional role of the provision of administrative, health, education, defence services, etc. Similarly, the large number of organisations which provide services on a non-profit basis—religious orders, schools, hospitals, sporting clubs, etc.—are included as a separate group in the national accounts. Also included among the non-market production groups is an account recording the wages paid by households employing domestic labour.
An additional table is provided which distinguishes market production groups according to the sector of ownership.
Two points require further clarification, the first relating to the item “imputed bank service charge”. Financial enterprises whose expenditure is largely financed out of net receipts of interest (such as trading banks and finance companies) require special treatment in the national accounts. The interest that they receive is viewed as consisting of a pure interest component and a “service charge” which is paid by the users of banking services. However, this imputed service charge has not been allocated to customers and therefore the convention is adopted that all is paid by a nominal industry which accordingly has a negative operating surplus equal to the value of the service charge. Total output is therefore zero and the effect is that a correct operating surplus figure is recorded for all market producers in aggregate.
Secondly no figure is given for the consumption of fixed capital by the producers of central and local government services. This conceptual omission is entirely due to the present inability to obtain relevant data from the cash accounts maintained by these two producers.
Gross Domestic Product (GDP) by Production Group—The following table shows Gross Domestic Product (GDP) by the kind of economic activity, i.e. by production group.
| Production Groups | Year Ended March | ||||
|---|---|---|---|---|---|
| 1979x | 1980x | 1981x | 1982x* | 1983* | |
| * Provisional. | |||||
| $(million) | |||||
| Market production groups— | |||||
| Agriculture | 1,422 | 2,139 | 2,161 | 2,248 | 2,017 |
| Fishing and hunting | 43 | 72 | 71 | 103 | 134 |
| Forestry and logging | 142 | 197 | 295 | 339 | 343 |
| Mining and quarrying | 166 | 157 | 185 | 269 | 424 |
| Food, beverages, and tobacco | 1,113 | 1,169 | 1,508 | 1,754 | 2,038 |
| Textiles, apparel, and leather | 433 | 577 | 610 | 783 | 803 |
| Manufacture of wood products | 263 | 334 | 396 | 491 | 450 |
| Manufacture of paper products, and printing | 439 | 570 | 666 | 807 | 879 |
| Manufacture of chemicals, petroleum, rubber, plastic | 381 | 573 | 525 | 645 | 671 |
| Manufacture of non-metallic mineral products | 182 | 202 | 227 | 310 | 325 |
| Basic metal industries | 140 | 188 | 181 | 221 | 266 |
| Manufacture of fabricated metal products | 1,012 | 1,237 | 1,357 | 1,846 | 1,905 |
| Other manufacturing | 49 | 54 | 62 | 91 | 78 |
| Electricity, gas, and water | 443 | 683 | 762 | 842 | 947 |
| Construction | 942 | 975 | 1,153 | 1,457 | 1,689 |
| Trade, restaurants, and hotels | 3,619 | 4,258 | 5,245 | 6,227 | 7,082 |
| Transport and storage | 991 | 1,140 | 1,252 | 1,468 | 1,665 |
| Communication | 447 | 528 | 642 | 729 | 917 |
| Financing, insurance, real estate, and business services | 1,796 | 2,034 | 2,383 | 2,938 | 3,381 |
| Ownership of owner-occupied dwellings | 710 | 753 | 831 | 1,004 | 1,181 |
| Community, social, and personal services | 651 | 747 | 861 | 1,020 | 1,124 |
| Nominal industry (bank service charge) | −376 | −421 | −532 | −687 | −823 |
| Total, market production groups | 15,009 | 18,165 | 20,841 | 24,903 | 27,495 |
| Non-market production groups— | |||||
| Central government services | 1,947 | 2,247 | 2,822 | 3,357 | 3,663 |
| Local government services | 186 | 229 | 279 | 355 | 376 |
| Private non-profit services | 166 | 197 | 236 | 271 | 274 |
| Domestic services of households | 12 | 14 | 15 | 18 | 19 |
| Total, non-market production groups | 2,311 | 2,687 | 3,352 | 4,001 | 4,332 |
| Total, all production groups | 17,320 | 20,852 | 24,193 | 28,904 | 31,827 |
| Plus import duties | 166 | 212 | 231 | 337 | 362 |
| Plus other indirect taxes | 24 | 28 | 37 | 55 | 51 |
| Gross Domestic Product | 17,510 | 21,092 | 24,461 | 29,296 | 32,240 |
The contribution of each production group to Gross Domestic Product (GDP) is shown as a percentage of the total GDP in the following table.
| Production Groups | Year Ended March | ||||
|---|---|---|---|---|---|
| 1979x | 1980x | 1981x | 1982x* | 1983* | |
| * Provisional. | |||||
| Percentage | |||||
| Agriculture | 8.1 | 10.1 | 8.8 | 7.7 | 6.3 |
| Fishing and hunting | 0.2 | 0.3 | 0.3 | 0.4 | 0.4 |
| Forestry and logging | 0.8 | 0.9 | 1.2 | 1.2 | 1.1 |
| Mining and quarrying | 0.9 | 0.7 | 0.8 | 0.9 | 1.3 |
| Food, beverages, and tobacco | 6.4 | 5.5 | 6.2 | 6.0 | 6.3 |
| Textiles, apparel, and leather | 2.5 | 2.7 | 2.5 | 2.7 | 2.5 |
| Manufacture of wood products | 1.5 | 1.6 | 1.6 | 1.7 | 1.4 |
| Manufacture of paper products, and printing | 2.5 | 2.7 | 2.7 | 2.8 | 2.7 |
| Manufacture of chemicals, petroleum, rubber, plastic | 2.2 | 2.7 | 2.1 | 2.2 | 2.1 |
| Manufacture of non-metallic mineral products | 1.0 | 1.0 | 0.9 | 1.1 | 1.0 |
| Basic metal industries | 0.8 | 0.9 | 0.7 | 0.8 | 0.8 |
| Manufacture of fabricated metal products | 5.8 | 5.9 | 5.5 | 6.3 | 5.9 |
| Other manufacturing Industries | 0.3 | 0.3 | 0.3 | 0.3 | 0.2 |
| Electricity, gas, and water | 2.5 | 3.2 | 3.1 | 2.9 | 2.9 |
| Construction | 5.4 | 4.6 | 4.7 | 5.0 | 5.2 |
| Trade, restaurants, and hotels | 20.7 | 20.2 | 21.4 | 21.3 | 22.0 |
| Transport and storage | 5.7 | 5.4 | 5.1 | 5.0 | 5.2 |
| Communication | 2.6 | 2.5 | 2.6 | 2.5 | 2.8 |
| Financing, insurance, real estate, and business services | 10.3 | 9.6 | 9.7 | 10.0 | 10.5 |
| Ownership of owner-occupied dwellings | 4.1 | 3.6 | 3.4 | 3.4 | 3.7 |
| Community, social and personal services | 3.7 | 3.5 | 3.5 | 3.5 | 3.5 |
| Central government services | 11.1 | 10.7 | 11.5 | 11.5 | 11.4 |
| Local government services | 1.1 | 1.1 | 1.1 | 1.2 | 1.2 |
| Private non-profit services | 1.0 | 0.9 | 1.0 | 0.9 | 0.9 |
| Domestic services of households | 0.1 | 0.1 | 0.1 | 0.1 | 0.1 |
| Not allocated | −1.1 | −0.9 | −1.1 | −1.0 | −1.3 |
| Total | 100.0 | 100.0 | 100.0 | 100.0 | 100.0 |
The following table shows the components of GDP by each of the 25 production groups for the latest available 5 years. The figures for 1981–82 and 1982–83 are provisional.
| Year Ended March | Components of Gross Domestic Product | Components of Industry Input | Total Industry Output | |||||
|---|---|---|---|---|---|---|---|---|
| Compensation of Employees | Operating Surplus | Consumption of Fixed Capital | Indirect Taxes | Less Subsidies | Contribution to Gross Domestic Product | Intermediate Consumption | ||
| $(million) at Producers' Values | ||||||||
| MARKET PRODUCTION GROUPS | ||||||||
| Agriculture | ||||||||
| 1978–79x | 259 | 984 | 216 | 64 | 100 | 1,422 | 1,758 | 3,180 |
| 1979–80x | 325 | 1,548 | 246 | 69 | 49 | 2,139 | 2,215 | 4,354 |
| 1930–81x | 373 | 1,450 | 290 | 81 | 33 | 2,161 | 2,388 | 4,549 |
| 1981–82x | 446 | 1,644 | 322 | 98 | 262 | 2,248 | 2,752 | 5,000 |
| 1982–83 | 469 | 1,522 | 348 | 114 | 437 | 2,017 | 2,996 | 5,013 |
| Fishing and Hunting | ||||||||
| 1978–79x | 14 | 19 | 10 | 1 | – | 43 | 49 | 92 |
| 1979–80x | 25 | 33 | 13 | 1 | 1 | 72 | 98 | 171 |
| 1980–81x | 26 | 34 | 11 | 1 | 1 | 71 | 109 | 180 |
| 1981–82x | 29 | 64 | 10 | 2 | 2 | 103 | 113 | 216 |
| 1982–83 | 31 | 91 | 11 | 2 | 1 | 134 | 118 | 252 |
| Forestry and Logging | ||||||||
| 1978–79x | 79 | 61 | 7 | 3 | 8 | 142 | 136 | 278 |
| 1979–80x | 90 | 103 | 10 | 3 | 9 | 197 | 163 | 359 |
| 1980–81x | 110 | 176 | 11 | 4 | 6 | 295 | 197 | 491 |
| 1981–82x | 136 | 195 | 12 | 4 | 10 | 339 | 233 | 572 |
| 1982–83 | 125 | 208 | 14 | 5 | 10 | 343 | 301 | 644 |
| Mining and Quarrying | ||||||||
| 1978–79x | 50 | 87 | 15 | 31 | 17 | 166 | 194 | 360 |
| 1979–80x | 46 | 69 | 26 | 20 | 5 | 157 | 150 | 307 |
| 1980–81x | 57 | 89 | 29 | 22 | 12 | 185 | 243 | 428 |
| 1981–82x | 68 | 171 | 32 | 27 | 29 | 269 | 325 | 594 |
| 1982–83 | 78 | 286 | 37 | 43 | 20 | 424 | 396 | 820 |
| Manufacture of Food, Beverages, and Tobacco | ||||||||
| 1978–79x | 674 | 228 | 86 | 185 | 60 | 1,113 | 2,293 | 3,406 |
| 1979–80x | 761 | 126 | 99 | 222 | 39 | 1,169 | 2,705 | 3,875 |
| 1980–81x | 911 | 263 | 120 | 256 | 42 | 1,508 | 3,127 | 4,635 |
| 1981–82x | 1,081 | 269 | 142 | 301 | 40 | 1,754 | 3,854 | 5,608 |
| 1982–83 | 1,211 | 355 | 163 | 344 | 36 | 2,038 | 4,318 | 6,355 |
| Textiles, Apparel, and Leather Industries | ||||||||
| 1978–79x | 302 | 106 | 22 | 4 | 1 | 433 | 748 | 1,181 |
| 1979–80x | 372 | 175 | 27 | 5 | 1 | 577 | 982 | 1,559 |
| 1980–81x | 407 | 175 | 29 | 6 | 6 | 610 | 1,038 | 1,649 |
| 1981–82x | 493 | 263 | 30 | 7 | 11 | 783 | 1,211 | 1,994 |
| 1982–83 | 513 | 257 | 35 | 8 | 10 | 803 | 1,390 | 2,192 |
| Manufacture of Wood Products | ||||||||
| 1978–79x | 167 | 76 | 19 | 2 | 1 | 263 | 427 | 690 |
| 1979–80x | 203 | 108 | 22 | 2 | 1 | 334 | 540 | 874 |
| 1980–81x | 244 | 127 | 24 | 3 | 2 | 396 | 644 | 1,040 |
| 1981–82x | 305 | 160 | 25 | 3 | 2 | 491 | 855 | 1,345 |
| 1982–83 | 314 | 106 | 27 | 4 | 2 | 450 | 872 | 1,322 |
| Manufacture of Paper Products, and Printing | ||||||||
| 1978–79x | 260 | 120 | 45 | 13 | – | 439 | 710 | 1,148 |
| 1979–80x | 316 | 188 | 52 | 16 | 2 | 570 | 868 | 1,438 |
| 1980–81x | 382 | 208 | 60 | 19 | 3 | 666 | 1,063 | 1,729 |
| 1981–82x | 461 | 258 | 66 | 23 | 2 | 807 | 1,266 | 2,073 |
| 1982–83 | 497 | 284 | 76 | 25 | 2 | 879 | 1,310 | 2,189 |
| Manufacture of Chemicals, Petroleum, Rubber, and Plastic Products | ||||||||
| 1978–79x | 242 | 151 | 38 | 26 | 75 | 381 | 854 | 1,235 |
| 1979–80x | 297 | 244 | 47 | 31 | 47 | 573 | 1,005 | 1,578 |
| 1980–81x | 333 | 148 | 49 | 36 | 40 | 525 | 1,242 | 1,767 |
| 1981–82x | 397 | 194 | 50 | 44 | 40 | 645 | 1,529 | 2,174 |
| 1982–83 | 422 | 184 | 55 | 47 | 37 | 671 | 1,618 | 2,289 |
| Manufacture of Non-metallic Mineral Products | ||||||||
| 1978–79x | 89 | 74 | 16 | 2 | – | 182 | 221 | 402 |
| 1979–80x | 106 | 78 | 16 | 2 | – | 202 | 241 | 443 |
| 1980–81x | 113 | 94 | 18 | 3 | 1 | 227 | 265 | 492 |
| 1981–82x | 136 | 152 | 20 | 4 | 1 | 310 | 346 | 656 |
| 1982–83 | 150 | 149 | 24 | 4 | 2 | 325 | 381 | 706 |
| Basic Metal Industries | ||||||||
| 1978–79x | 77 | 48 | 14 | 1 | – | 140 | 338 | 478 |
| 1979–80x | 92 | 81 | 14 | 1 | – | 188 | 378 | 566 |
| 1980–81x | 106 | 58 | 16 | 1 | – | 181 | 415 | 596 |
| 1981–82x | 132 | 72 | 16 | 2 | – | 221 | 529 | 750 |
| 1982–83 | 151 | 88 | 26 | 2 | 1 | 266 | 563 | 830 |
| Manufacture of Fabricated Metal Products | ||||||||
| 1978–79x | 668 | 240 | 50 | 55 | 2 | 1,012 | 1,637 | 2,650 |
| 1979–80x | 770 | 339 | 58 | 72 | 1 | 1,237 | 1,968 | 3,206 |
| 1980–81x | 882 | 325 | 68 | 87 | 4 | 1,357 | 2,218 | 3,575 |
| 1981–82x | 1,109 | 543 | 79 | 121 | 7 | 1,846 | 2,867 | 4,713 |
| 1982–83 | 1,234 | 458 | 88 | 131 | 6 | 1,905 | 3,143 | 5,048 |
| Other Manufacturing Industries | ||||||||
| 1978–79x | 27 | 16 | 3 | 4 | – | 49 | 61 | 110 |
| 1979–80x | 32 | 15 | 3 | 4 | – | 54 | 74 | 128 |
| 1980–81x | 36 | 18 | 3 | 5 | – | 62 | 80 | 142 |
| 1981–82x | 46 | 34 | 3 | 7 | – | 91 | 112 | 203 |
| 1982–83 | 46 | 21 | 4 | 7 | – | 78 | 140 | 218 |
| Electricity, Gas, Water | ||||||||
| 1978–79x | 146 | 230 | 68 | 3 | 5 | 443 | 464 | 906 |
| 1979–80x | 181 | 433 | 71 | 3 | 5 | 683 | 588 | 1,270 |
| 1980–81x | 213 | 466 | 85 | 4 | 6 | 762 | 679 | 1,441 |
| 1981–82x | 260 | 490 | 93 | 5 | 6 | 842 | 774 | 1,615 |
| 1982–83 | 286 | 557 | 103 | 5 | 5 | 947 | 984 | 1,931 |
| Construction | ||||||||
| 1978–79x | 624 | 270 | 50 | 12 | 14 | 942 | 2,258 | 3,200 |
| 1979–80x | 663 | 265 | 48 | 12 | 14 | 975 | 2,400 | 3,375 |
| 1980–81x | 747 | 349 | 55 | 14 | 13 | 1,153 | 2,710 | 3,863 |
| 1981–82x | 884 | 501 | 63 | 18 | 9 | 1,457 | 3,400 | 4,857 |
| 1982–83 | 992 | 606 | 75 | 21 | 6 | 1,689 | 3,823 | 5,512 |
| Trade, Restaurants, Hotels | ||||||||
| 1978–79x | 1,508 | 1,263 | 169 | 713 | 34 | 3,619 | 4,493 | 8,112 |
| 1979–80x | 1,784 | 1,501 | 187 | 822 | 36 | 4,258 | 5,592 | 9,850 |
| 1980–81x | 2,120 | 1,964 | 220 | 983 | 42 | 5,245 | 6,303 | 11,548 |
| 1981–82x | 2,558 | 2,277 | 245 | 1,174 | 26 | 6,227 | 7,499 | 13,727 |
| 1982–83 | 2,850 | 2,534 | 281 | 1,442 | 26 | 7,082 | 8,243 | 15,325 |
| Transport, Storage | ||||||||
| 1978–79x | 671 | 222 | 146 | 63 | 111 | 991 | 954 | 1,945 |
| 1979–80x | 780 | 273 | 158 | 65 | 136 | 1,140 | 1,152 | 2,291 |
| 1980–81x | 906 | 239 | 163 | 76 | 133 | 1,252 | 1,506 | 2,757 |
| 1981–82x | 1,048 | 288 | 178 | 94 | 140 | 1,468 | 1,808 | 3,276 |
| 1982–83 | 1,132 | 353 | 223 | 113 | 156 | 1,665 | 2,111 | 3,776 |
| Communication | ||||||||
| 1978–79x | 320 | 98 | 28 | 3 | 2 | 447 | 77 | 525 |
| 1979–80x | 372 | 124 | 31 | 4 | 2 | 528 | 88 | 616 |
| 1980–81x | 434 | 156 | 49 | 5 | 2 | 642 | 98 | 740 |
| 1981–82x | 520 | 153 | 53 | 7 | 3 | 729 | 117 | 846 |
| 1982–83 | 552 | 296 | 64 | 8 | 3 | 917 | 144 | 1,060 |
| Financing, Insurance, Real Estate, and Business Services | ||||||||
| 1978–79x | 656 | 853 | 142 | 154 | 8 | 1,796 | 890 | 2,686 |
| 1979–80x | 775 | 930 | 158 | 172 | 1 | 2,034 | 1,016 | 3,050 |
| 1980–81x | 946 | 1,071 | 170 | 197 | 2 | 2,383 | 1,273 | 3,656 |
| 1981–82x | 1,179 | 1,302 | 203 | 257 | 3 | 2,938 | 1,534 | 4,472 |
| 1982–83 | 1,349 | 1,494 | 233 | 306 | 2 | 3,381 | 1,826 | 5,207 |
| Ownership of Owner-occupied Dwellings | ||||||||
| 1978–79x | – | 467 | 110 | 133 | – | 710 | 374 | 1,084 |
| 1979–80x | – | 477 | 118 | 159 | – | 753 | 422 | 1,175 |
| 1980–81x | – | 507 | 135 | 189 | – | 831 | 486 | 1,317 |
| 1981–82x | – | 619 | 154 | 231 | – | 1,004 | 540 | 1,544 |
| 1982–83 | – | 721 | 178 | 282 | – | 1,181 | 656 | 1,837 |
| Community, Social, and Personal Services | ||||||||
| 1978–79x | 311 | 261 | 33 | 52 | 7 | 651 | 657 | 1,307 |
| 1979–80x | 365 | 293 | 38 | 58 | 7 | 747 | 769 | 1,516 |
| 1980–81x | 444 | 319 | 41 | 64 | 7 | 861 | 917 | 1,778 |
| 1981–82x | 538 | 369 | 49 | 72 | 9 | 1,020 | 1,138 | 2,158 |
| 1982–83 | 595 | 400 | 57 | 80 | 8 | 1,124 | 1,317 | 2,440 |
| Nominal Industry (for imputed bank service charge) | ||||||||
| 1978–79x | – | −376 | – | – | – | −376 | 376 | – |
| 1979–80x | – | −421 | – | – | – | −421 | 421 | – |
| 1980–81x | – | −532 | – | – | – | −532 | 532 | – |
| 1981–82x | – | −687 | – | – | – | −687 | 687 | – |
| 1982–83 | – | −823 | – | – | – | −823 | 823 | – |
| Total Market Production Groups | ||||||||
| 1978–79x | 7,145 | 5,501 | 1,285 | 1,522 | 444 | 15,009 | 19,967 | 34,976 |
| 1979–80x | 8,355 | 6,981 | 1,442 | 1,743 | 356 | 18,165 | 23,836 | 42,000 |
| 1980–81x | 9,791 | 7,704 | 1,645 | 2,056 | 355 | 20,841 | 27,534 | 48,374 |
| 1981–82x | 11,827 | 9,332 | 1,845 | 2,499 | 600 | 24,903 | 33,490 | 58,393 |
| 1982–83 | 12,999 | 10,146 | 2,124 | 2,995 | 769 | 27,495 | 37,470 | 64,965 |
| NON-MARKET PRODUCTION GROUPS | ||||||||
| Central Government Services | ||||||||
| 1978–79x | 1,941 | – | – | 5 | – | 1,947 | 722 | 2,668 |
| 1979–80x | 2,241 | – | – | 6 | – | 2,247 | 811 | 3,059 |
| 1980–81x | 2,814 | – | – | 8 | – | 2,822 | 1,006 | 3,829 |
| 1981–82x | 3,347 | – | – | 10 | – | 3,357 | 1,301 | 4,658 |
| 1982–83 | 3,651 | – | – | 12 | – | 3,663 | 1,577 | 5,240 |
| Local Government Services | ||||||||
| 1978–79x | 183 | – | – | 2 | – | 186 | 291 | 477 |
| 1979–80x | 226 | – | – | 3 | – | 229 | 332 | 561 |
| 1980–81x | 275 | – | – | 4 | – | 279 | 418 | 697 |
| 1981–82x | 350 | – | – | 5 | – | 355 | 473 | 828 |
| 1982–83 | 370 | – | – | 6 | – | 376 | 581 | 957 |
| Private Non-profit Services to Households | ||||||||
| 1978–79x | 140 | – | 21 | 5 | – | 166 | 140 | 306 |
| 1979–80x | 169 | – | 22 | 6 | – | 197 | 161 | 358 |
| 1980–81x | 205 | – | 25 | 7 | – | 236 | 188 | 424 |
| 1981–82x | 236 | – | 27 | 8 | – | 271 | 218 | 489 |
| 1982–83 | 237 | – | 28 | 9 | – | 274 | 245 | 520 |
| Domestic Services of Households | ||||||||
| 1978–79x | 12 | – | – | – | – | 12 | – | 12 |
| 1979–80x | 14 | – | – | – | – | 14 | – | 14 |
| 1980–81x | 15 | – | – | – | – | 15 | – | 15 |
| 1981–82x | 18 | – | – | – | – | 18 | – | 18 |
| 1982–83 | 19 | – | – | – | – | 19 | – | 19 |
| Total Non-market Production Groups | ||||||||
| 1978–79x | 2,277 | – | 21 | 13 | – | 2,311 | 1,152 | 3,463 |
| 1979–80x | 2,650 | – | 22 | 15 | – | 2,687 | 1,304 | 3,991 |
| 1980–81x | 3,309 | – | 25 | 19 | – | 3,352 | 1,613 | 4,966 |
| 1981–82x | 3,951 | – | 27 | 23 | – | 4,001 | 1,992 | 5,993 |
| 1982–83 | 4,277 | – | 28 | 28 | – | 4,332 | 2,403 | 6,735 |
| All Production Groups—Totals | ||||||||
| 1978–79x | 9,422 | 5,501 | 1,306 | 1,535 | 444 | 17,320 | 21,120 | 38,440 |
| 1979–80x | 11,005 | 6,981 | 1,464 | 1,758 | 356 | 20,852 | 25,140 | 45,992 |
| 1980–81x | 13,100 | 7,704 | 1,670 | 2,075 | 355 | 24,193 | 29,147 | 53,340 |
| 1981–82x | 15,778 | 9,332 | 1,872 | 2,522 | 600 | 28,904 | 35,482 | 64,386 |
| 1982–83 | 17,276 | 10,146 | 2,152 | 3,023 | 769 | 31,827 | 39,873 | 71,700 |
In the following table the components of GDP for the total market production groups are shown by sector of ownership. As in other tables, the 1981–82 and 1982–83 figures are provisional.
| Year Ended March | Components of Gross Domestic Product | Components of Industry Input | Total Industry Output | |||||
|---|---|---|---|---|---|---|---|---|
| Compensation of Employees | Operating Surplus | Consumption of Fixed Capital | Indirect Taxes | Less Subsidies | Contribution to Gross Domestic Product | Intermediate Consumption | ||
| $(million) at Producers' Values | ||||||||
| Private Sector | ||||||||
| 1978–79x | 5,682 | 4,939 | 1,085 | 1,468 | 278 | 12,895 | 17,915 | 30,809 |
| 1979–80x | 6,653 | 6,140 | 1,217 | 1,681 | 180 | 15,511 | 21,523 | 37,033 |
| 1980–81x | 7,791 | 6,791 | 1,389 | 1,975 | 182 | 17,764 | 24,726 | 42,490 |
| 1981–82x | 9,439 | 8,290 | 1,563 | 2,396 | 406 | 21,283 | 30,142 | 51,425 |
| 1982–83 | 10,406 | 8,864 | 1,785 | 2,874 | 573 | 23,357 | 33,379 | 56,736 |
| Central Government Sector | ||||||||
| 1978–79x | 1,205 | 452 | 150 | 43 | 135 | 1,715 | 1,404 | 3,119 |
| 1979–80x | 1,393 | 667 | 171 | 51 | 143 | 2,139 | 1,492 | 3,631 |
| 1980–81x | 1,643 | 730 | 191 | 65 | 138 | 2,492 | 1,853 | 4,344 |
| 1981–82x | 1,954 | 856 | 209 | 83 | 154 | 2,949 | 2,255 | 5,204 |
| 1982–83 | 2,107 | 1,050 | 255 | 99 | 145 | 3,367 | 2,775 | 6,142 |
| Local Government Sector | ||||||||
| 1978–79x | 258 | 110 | 51 | 11 | 31 | 399 | 649 | 1,048 |
| 1979–80x | 309 | 173 | 55 | 12 | 33 | 515 | 821 | 1,336 |
| 1980–81x | 358 | 182 | 65 | 15 | 35 | 585 | 955 | 1,540 |
| 1981–82x | 433 | 186 | 74 | 20 | 40 | 672 | 1,093 | 1,765 |
| 1982–83 | 486 | 232 | 83 | 22 | 52 | 772 | 1,316 | 2,088 |
| All Sectors—Total | ||||||||
| 1978–79x | 7,145 | 5,501 | 1,285 | 1,522 | 444 | 15,009 | 19,967 | 34,976 |
| 1979–80x | 8,355 | 6,981 | 1,442 | 1,743 | 356 | 18,165 | 23,836 | 42,000 |
| 1980–81x | 9,791 | 7,704 | 1,645 | 2,056 | 355 | 20,841 | 27,534 | 48,374 |
| 1981–82x | 11,827 | 9,332 | 1,845 | 2,499 | 600 | 24,903 | 33,490 | 58,393 |
| 1982–83 | 12,999 | 10,146 | 2,124 | 2,995 | 769 | 27,495 | 37,470 | 64,965 |
GROSS FIXED CAPITAL FORMATION—Gross Fixed Capital Formation tables record purchases of capital assets, reduced by the value of sales, plus the value of construction work done by an establishment's own employees; no deduction has been made for assets used up during the period of account. Land purchases and sales, but not land improvements, are excluded by definition.
The following table shows Gross Fixed Capital Formation by production group within each sector of ownership.
| Production Groups | Year Ended March | ||||
|---|---|---|---|---|---|
| 1979x | 1980x | 1981x | 1982x* | 1983* | |
* Provisional. †Figures from this production group have been combined for the private sector and all sector total. | |||||
| $(million) | |||||
| Market Production Group— | Private sector | ||||
| Agriculture† | 362 | 515 | 596 | 784 | 705 |
| Fishing and hunting† | |||||
| Forestry and logging | 11 | 15 | 21 | 23 | 23 |
| Mining and quarrying | 55 | 36 | 63 | −7 | 38 |
| Manufacture of food, beverages, and tobacco | 161 | 204 | 312 | 404 | 369 |
| Textiles, apparel, and leather industries | 39 | 38 | 29 | 36 | 53 |
| Manufacture of wood products | 18 | 19 | 21 | 25 | 28 |
| Manufacture of paper products, and printing | 70 | 69 | 83 | 112 | 120 |
| Manufacture of chemicals, petroleum, rubber, and plastic products | 62 | 59 | 96 | 245 | 554 |
| Manufacture of non-metallic mineral products | 16 | 17 | 17 | 51 | 56 |
| Basic metal industries | 21 | 18 | 26 | 118 | 149 |
| Manufacture of fabricated metal products | 61 | 83 | 85 | 140 | 107 |
| Other manufacturing industries | 3 | 3 | 3 | 3 | 3 |
| Electricity, gas, and water | 1 | 2 | 4 | 4 | 7 |
| Construction | −9 | 88 | 73 | 114 | 111 |
| Trade, restaurants, and hotels | 248 | 285 | 321 | 399 | 445 |
| Transport and storage | 136 | 126 | 139 | 241 | 281 |
| Communication | – | – | – | – | – |
| Financing, insurance, real estate, and business services† | 278 | 276 | 276 | 434 | 521 |
| Community, social, and personal services† | |||||
| Ownership of owner-occupied dwellings | 619 | 641 | 776 | 1,089 | 1,192 |
| Total, Market Production Groups | 2,152 | 2,494 | 2,942 | 4,215 | 4,761 |
| Non-market Production Groups— | |||||
| Central government services | – | – | – | – | – |
| Local government services | – | – | – | – | – |
| Private non-profit services | 28 | 34 | 41 | 47 | 52 |
| Domestic services of households | – | – | – | – | – |
| Total, Non-Market Production Groups | 28 | 34 | 41 | 47 | 52 |
| Total, All Production groups | 2,180 | 2,528 | 2,983 | 4,262 | 4,813 |
| Production Groups | Year Ended March | ||||
|---|---|---|---|---|---|
| 1979x | 1980x | 1981x | 1982x* | 1983* | |
* Provisional. †Figures from this production group have been combined for the private sector and all sector total. | |||||
| $(million) | |||||
| Central Government | |||||
| Market Production Groups— | |||||
| Agriculture† | 17 | 19 | 29 | 36 | 46 |
| Fishing and hunting† | – | – | – | – | – |
| Forestry and logging | 14 | 11 | 15 | 17 | 10 |
| Mining and quarrying | 71 | 41 | 35 | 52 | 87 |
| Manufacture of food, beverages, and tobacco | – | – | – | – | – |
| Textiles, apparel, and leather | – | – | – | – | – |
| Manufacture of wood products | 2 | 1 | 3 | 2 | 4 |
| Manufacture of paper products, and printing | – | 1 | 1 | 1 | – |
| Manufacture of chemicals, petroleum, rubber, and plastic products | – | 19 | 31 | 105 | 459 |
| Manufacture of non-metallic mineral products | – | – | – | – | – |
| Basic metal industries | – | – | – | – | – |
| Manufacture of fabricated metal products | 2 | 5 | 5 | 7 | 7 |
| Other manufacturing | – | – | – | – | – |
| Electricity, gas, and water | 297 | 247 | 241 | 293 | 299 |
| Construction | 9 | 4 | 4 | 8 | 10 |
| Trade, restaurants, and hotels | 3 | 3 | 2 | 3 | 4 |
| Transport and storage | 165 | 84 | 96 | 293 | 198 |
| Communication | 84 | 63 | 98 | 119 | 197 |
| Financing, insurance, real estate, and business services† | 89 | 77 | 86 | 112 | 257 |
| Ownership of owner-occupied dwellings | – | – | – | – | – |
| Community, social, and personal services† | 9 | 7 | 6 | 7 | 11 |
| Total, Market Production Groups | 762 | 582 | 650 | 1,055 | 1,590 |
| Non-Market Production Groups— | |||||
| Central government services | 347 | 344 | 383 | 406 | 468 |
| Local government services | – | – | – | – | – |
| Private non-profit services | – | – | – | – | – |
| Domestic services of households | – | – | – | – | – |
| Total, Non-Market Production Groups | 347 | 344 | 383 | 406 | 468 |
| Total. All Production Groups | 1,109 | 925 | 1,032 | 1,461 | 2,058 |
| Production Groups | Year Ended March | ||||
|---|---|---|---|---|---|
| 1979x | 1980x | 1981x | 1982x* | 1983* | |
* Provisional. †Figures from this production group have been combined for the private sector and all sector total. | |||||
| $(million) | |||||
| Market Production Groups— | Local Government | ||||
| Agriculture† | |||||
| Fishing and hunting† | – | – | – | – | – |
| Forestry and logging | 1 | 1 | 1 | 2 | 3 |
| Mining and quarrying | 1 | – | – | – | |
| Manufacture of food, beverages, and tobacco | 2 | 2 | 4 | 3 | 2 |
| Textiles, apparel, and leather | – | – | – | – | – |
| Manufacture of wood products | – | – | – | – | – |
| Manufacture of paper products, and printing | – | – | – | – | – |
| Manufacture of chemicals, petroleum, rubber, plastic | – | – | – | – | |
| Manufacture of non-metallic mineral products | – | – | |||
| Basic metal industries | – | – | – | – | – |
| Manufacture of fabricated metal products | – | – | – | – | – |
| Other manufacturing | – | – | – | – | – |
| Electricity, gas. and water | 113 | 126 | 159 | 193 | 237 |
| Construction | 1 | – | 1 | 1 | 1 |
| Trade, restaurants, and hotels | 5 | 5 | 4 | 5 | 3 |
| Transport and storage | 66 | 53 | 43 | 44 | 58 |
| Communication | – | – | – | – | – |
| Financing, insurance, real estate and business services† | 21 | 19 | 21 | 22 | 31 |
| Ownership of owner-occupied dwellings | – | – | – | – | – |
| Community, social, and personal services† | |||||
| tfn703_16 Total, Market Production Groups | 208 | 207 | 234 | 270 | 335 |
| Non-market production groups— | |||||
| Central government services | – | – | – | – | – |
| Local government services | 148 | 172 | 199 | 223 | 219 |
| Private non-profit services | – | – | – | – | – |
| Domestic services of households | – | – | – | – | – |
| Total, Non-Market Production Groups | 148 | 172 | 199 | 223 | 219 |
| Total, All Production Groups | 356 | 379 | 433 | 493 | 554 |
| Market Production Groups— | Total | ||||
| Agriculture† | 378 | 534 | 625 | 820 | 751 |
| Fishing and hunting† | |||||
| Forestry and logging | 26 | 26 | 36 | 41 | 37 |
| Mining and quarrying | 127 | 78 | 98 | 46 | 125 |
| Manufacture of food, beverages, and tobacco | 163 | 206 | 315 | 407 | 371 |
| Textiles, apparel, and leather | 39 | 38 | 29 | 36 | 53 |
| Manufacture of wood products | 20 | 21 | 24 | 27 | 32 |
| Manufacture of paper products and printing | 70 | 70 | 84 | 113 | 121 |
| Manufacture of chemicals, petroleum, rubber, plastic | 62 | 77 | 127 | 350 | 1,013 |
| Manufacture of non-metallic mineral products | 16 | 17 | 18 | 51 | 56 |
| Basic metal industries | 21 | 18 | 26 | 118 | 149 |
| Manufacture of fabricated metal products | 63 | 88 | 90 | 147 | 114 |
| Other manufacturing | 3 | 3 | 3 | 3 | 3 |
| Electricity, gas, and water | 411 | 375 | 404 | 490 | 543 |
| Construction | 1 | 92 | 78 | 123 | 122 |
| Trade, restaurants, and hotels | 255 | 294 | 328 | 406 | 453 |
| Transport and storage | 367 | 263 | 278 | 578 | 537 |
| Communication | 84 | 63 | 98 | 119 | 197 |
| Financing, insurance, real estate and business services† | 397 | 379 | 389 | 575 | 819 |
| Community, social, and personal services† | |||||
| Ownership of owner-occupied dwellings | 619 | 641 | 776 | 1,089 | 1,192 |
| Total, Market Production Groups | 3,122 | 3,283 | 3,826 | 5,540 | 6,686 |
| Non-Market Production Groups— | |||||
| Central government services | 347 | 344 | 383 | 406 | 468 |
| Local government services | 148 | 172 | 199 | 223 | 219 |
| Private non-profit services | 28 | 34 | 41 | 47 | 52 |
| Domestic services of households | – | – | – | – | – |
| Total, Non-Market Production Groups | 523 | 549 | 622 | 676 | 739 |
| Total, All Production Groups | 3,645 | 3,833 | 4,448 | 6,216 | 7,425 |
In the following table the composition of Gross Fixed Capital Formation is shown by type of capital good. The 1981–82 and 1982–83 figures are provisional.
| Year Ended March | Type of Capital Good | Total | |||||
|---|---|---|---|---|---|---|---|
| Residential Buildings | Non-Residential Buildings | Other Construction | Land Improvements | Transport Equipment | Plant, Machinery, and Other Equipment | ||
| * Provisional. | |||||||
| $(million) | |||||||
| Private Sector | |||||||
| 1978–79x | 635 | 369 | 99 | 90 | 358 | 629 | 2,180 |
| 1979–80x | 659 | 416 | 65 | 127 | 466 | 795 | 2,528 |
| 1980–81x | 799 | 451 | 99 | 172 | 518 | 945 | 2,983 |
| 1981–82x* | 1,117 | 635 | 235 | 221 | 807 | 1,246 | 4,262 |
| 1982–83* | 1,215 | 731 | 557 | 200 | 810 | 1,299 | 4,813 |
| Central Government Sector | |||||||
| 1978–79x | 49 | 350 | 246 | 12 | 165 | 287 | 1,109 |
| 1979–80x | 41 | 280 | 221 | 13 | 100 | 270 | 925 |
| 1980–81x | 41 | 298 | 235 | 22 | 102 | 335 | 1,032 |
| 1981–82x* | 29 | 328 | 445 | 29 | 287 | 343 | 1,461 |
| 1982–83* | 50 | 339 | 972 | 38 | 216 | 442 | 2,058 |
| Local Government Sector | |||||||
| 1978–79x | 16 | 42 | 201 | 24 | 33 | 40 | 356 |
| 1979–80x | 13 | 53 | 218 | 24 | 32 | 39 | 379 |
| 1980–81x | 12 | 63 | 241 | 29 | 37 | 51 | 433 |
| 1981–82x* | 10 | 68 | 285 | 34 | 35 | 61 | 493 |
| 1982–83* | 18 | 66 | 332 | 33 | 41 | 63 | 554 |
| All Sector Total | |||||||
| 1978–79x | 700 | 761 | 547 | 125 | 556 | 956 | 3,645 |
| 1979–80x | 712 | 749 | 505 | 164 | 597 | 1,104 | 3,833 |
| 1980–81x | 852 | 811 | 575 | 222 | 657 | 1,331 | 4,448 |
| 1981–82x* | 1,156 | 1,032 | 965 | 284 | 1,130 | 1,649 | 6,216 |
| 1982–83* | 1,283 | 1,137 | 1,860 | 271 | 1,068 | 1,805 | 7,425 |
STOCK CHANGE BY PRODUCTION GROUP—The following table shows increase in stocks by production group.
| Production Groups | Year Ended March | ||||
|---|---|---|---|---|---|
| 1979x | 1980x | 1981x | 1982x* | 1983* | |
| * Provisional. | |||||
| $(million) | |||||
| Market production groups— | |||||
| Agriculture | −81 | 242 | 119 | 86 | −113 |
| Fishing and hunting | – | 1 | 3 | −1 | 4 |
| Forestry and logging | 90 | 121 | 205 | 258 | 289 |
| Mining and quarrying | 5 | 5 | 4 | 11 | 1 |
| Manufacture of food, beverages, and tobacco | 73 | 99 | 99 | 97 | −12 |
| Textiles, apparel, and leather | 17 | 73 | 22 | 67 | −1 |
| Manufacture of wood products | 10 | 27 | 26 | 32 | 22 |
| Manufacture of paper products, and printing | 6 | 22 | 45 | 25 | 42 |
| Manufacture of chemicals, petroleum, rubber, and plastic | 13 | 126 | 38 | 43 | 58 |
| Manufacture of non-metallic mineral products | 6 | 14 | 5 | 15 | 7 |
| Basic metal industries | −12 | 42 | 22 | 27 | 2 |
| Manufacture of fabricated metal products | 2 | 139 | 63 | 162 | 106 |
| Other manufacturing | −2 | 7 | 3 | 8 | 6 |
| Electricity, gas, and water | 22 | 10 | 11 | 25 | 23 |
| Construction | −3 | −4 | 18 | 8 | 22 |
| Trade, restaurants, and hotels | 211 | 866 | 662 | 672 | 497 |
| Transport and storage | 7 | 15 | 18 | 3 | 18 |
| Communication | 3 | 14 | 13 | 21 | 41 |
| Financing, insurance, real estate, and business services, community, social, personal services | 2 | 3 | 7 | −1 | 1 |
| Ownership of owner-occupied dwellings | – | – | – | – | – |
| Total, market production groups | 368 | 1,823 | 1,381 | 1,558 | 1,015 |
| Non-market production groups— | |||||
| Central government services | 4 | 7 | 23 | 3 | 3 |
| Local government services | |||||
| Private non-profit services | |||||
| Domestic services of households | – | – | – | – | – |
| Total, all production groups | 372 | 1,830 | 1,404 | 1,561 | 1,018 |
The next stage in the development of the NZSNA will be the production of quarterly accounts in constant dollar terms. A detailed report explaining classifications, definitions, and concepts is available in New Zealand System of National Accounts—Concepts and Design, 1971–72 to 1980–81.
GROSS DOMESTIC PRODUCT IN CONSTANT PRICES—Gross Domestic Product in constant prices is calculated by removing the effects of price changes from the current price production accounts. The series below provide a measure of GDP divided into 21 production groups in constant 1977–78 prices.
By removing the effects of price changes, these constant price GDP statistics enable annual comparisons to be made of the relative volume of goods and services produced in the New Zealand economy. Details on industries provide information on structural changes in the economy which are not readily observed in the current price accounts.
With the constant price series it has not been possible to produce separate statistics for all 25 production groups used in the current price accounts.
The production groups which have been amalgamated are:
Manufacturing of fabricated metal products; machinery and equipment; and other manufacturing industries.
Community, social, and personal services; private non-profit services to households; and domestic services of households.
Central government services; and local government services.
The following table shows GDP for each production group in constant 1977–78 prices:
| Industrial Groups | Year Ended March | |||||
|---|---|---|---|---|---|---|
| 1978 | 1979 | 1980 | 1981 | 1982* | 1983* | |
* Provisional. †Includes other manufacturing industries. ‡Includes private non-profit services and domestic services of households. §For imputed bank service charge. | ||||||
| Agriculture | 1,340 | 1,251 | 1,424 | 1,596 | 1,559 | 1,570 |
| Fishing and hunting | 35 | 36 | 51 | 58 | 69 | 79 |
| Forestry and logging | 121 | 126 | 138 | 154 | 159 | 158 |
| Mining and quarrying | 184 | 160 | 118 | 106 | 114 | 166 |
| Food, beverages, tobacco | 862 | 906 | 868 | 906 | 921 | 968 |
| Textiles, apparel, and leather | 408 | 396 | 457 | 424 | 453 | 463 |
| Wood and wood products | 208 | 208 | 230 | 222 | 245 | 219 |
| Paper, printing, and publishing | 420 | 410 | 446 | 453 | 464 | 447 |
| Chemicals, petroleum, and plastics | 287 | 296 | 316 | 286 | 306 | 294 |
| Non-metallic mineral products | 176 | 168 | 163 | 151 | 173 | 169 |
| Basic metal industries | 130 | 133 | 136 | 121 | 133 | 137 |
| Machinery and metal products, miscellaneous† | 981 | 939 | 981 | 919 | 1,054 | 1,027 |
| Electricity, gas. water | 388 | 415 | 454 | 466 | 476 | 462 |
| Construction | 913 | 843 | 774 | 766 | 801 | 818 |
| Trade, restaurants, and hotels | 3,180 | 3,192 | 3,161 | 3,110 | 3,269 | 3,186 |
| Transport and storage | 877 | 891 | 925 | 899 | 909 | 927 |
| Communications | 376 | 387 | 402 | 436 | 472 | 502 |
| Financing, insurance, real estate and business services | 1,519 | 1,578 | 1,636 | 1,696 | 1,783 | 1,759 |
| Owner-occupied dwellings | 706 | 721 | 735 | 746 | 758 | 771 |
| Community and personal services‡ | 716 | 747 | 755 | 764 | 783 | 768 |
| General government services | 1,724 | 1,774 | 1,792 | 1,811 | 1,838 | 1,838 |
| Plus unallocated indirect taxes | 174 | 176 | 216 | 204 | 264 | 238 |
| Less nominal industry§ | −300 | −328 | −341 | −342 | −353 | −348 |
| Gross Domestic Product | 15,424 | 15,426 | 15,835 | 15,953 | 16,647 | 16,620 |
In the following table GDP is presented as an index series in constant 1977–78 prices:
| INDEX OF GROSS DOMESTIC PRODUCT | ||||||
|---|---|---|---|---|---|---|
| Base: 1977–79 (=1000) | ||||||
| Industrial Groups | Year Ended March | |||||
| 1978 | 1979 | 1980 | 1981 | 1982* | 1983* | |
* Provisional. †Includes other manufacturing industries. ‡Includes private non-profit services and domestic services of households. §For imputed bank service charge. | ||||||
| Agriculture | 1000 | 934 | 1063 | 1191 | 1164 | 1172 |
| Fishing and hunting | 1000 | 1027 | 1463 | 1667 | 1979 | 2270 |
| Forestry and logging | 1000 | 1039 | 1145 | 1276 | 1314 | 1309 |
| Mining and quarrying | 1000 | 870 | 639 | 576 | 619 | 901 |
| Food, beverages, tobacco | 1000 | 1051 | 1007 | 1051 | 1068 | 1123 |
| Textiles, apparel, and leather | 1000 | 972 | 1121 | 1041 | 1111 | 1135 |
| Wood and wood products | 1000 | 999 | 1104 | 1068 | 1176 | 1054 |
| Paper, printing, and publishing | 1000 | 976 | 1062 | 1078 | 1103 | 1063 |
| Chemicals, petroleum, and plastics | 1000 | 1033 | 1102 | 997 | 1066 | 1025 |
| Non-metallic mineral products | 1000 | 953 | 925 | 857 | 982 | 962 |
| Basic metal industries | 1000 | 1028 | 1048 | 934 | 1023 | 1054 |
| Machinery and metal products, miscellaneous† | 1000 | 957 | 1000 | 937 | 1075 | 1047 |
| Electricity, gas, water | 1000 | 1070 | 1169 | 1201 | 1226 | 1191 |
| Construction | 1000 | 923 | 848 | 839 | 877 | 896 |
| Trade, restaurants, and hotels | 1000 | 1004 | 994 | 978 | 1028 | 1002 |
| Transport and storage | 1000 | 1015 | 1054 | 1025 | 1036 | 1057 |
| Communications | 1000 | 1028 | 1069 | 1159 | 1255 | 1334 |
| Financing, insurance, real estate and business services | 1000 | 1039 | 1077 | 1117 | 1174 | 1158 |
| Owner-occupied dwellings | 1000 | 1022 | 1041 | 1057 | 1074 | 1093 |
| Community and personal services‡ | 1000 | 1044 | 1055 | 1068 | 1094 | 1074 |
| General government services | 1000 | 1029 | 1039 | 1050 | 1066 | 1066 |
| Plus unallocated indirect taxes | 1000 | 1012 | 1247 | 1177 | 1522 | 1372 |
| Less nominal industry§ | 1000 | 1094 | 1138 | 1143 | 1180 | 1162 |
| Gross Domestic Product | 1000 | 1000 | 1027 | 1034 | 1079 | 1078 |
The constant price series has been developed from 1977–78 onwards and replaces the Index of Real Gross Domestic Product published in the 1983 Yearbook.
At the industry group level it has not been possible to link the 2 series because:
The conceptual basis of the constant price series is the NZSNA. The Index of Real Gross Domestic Product was based on the 1965–66 Input-Output Study.
The industry composition of the industrial groupings is different.
The methodology used in the 2 series is different.
In order to provide a historical series, the former index has been re-expressed on a base 1977–78 (= 1000) at the 'all industry groups combined' level, and linked to the new index.
INDEX OF EMPLOYMENT—The Index of Employment is based on the number of persons in the total labour force as estimated by the Department of Labour. The total labour force consists of all persons actively engaged for 20 or more hours per week, including the armed forces and those on subsidised employment, but excluding the unemployed. During 1983 the Index of Employment was revised to make it consistent with data on the employed labour force from the 1971, 1976, and 1981 Censuses of Population.
INDEX OF GROSS DOMESTIC PRODUCT IN CONSTANT PRICES PER LABOUR FORCE MEMBER—Increases in Gross Domestic Product in constant prices are partly due to increases in the number of persons engaged in the labour force, and other factors such as greater labour effort, improved skills of the labour force, addition of productive fixed capital assets and improvements in management. While elements relating to labour inputs are relatively easy to quantify, measurement of other factors is exceedingly difficult.
The 3 indexes are compared in the following table:
| Year | G.D.P. in Constant 1977–78 Prices | Employment | Constant Price G.D.P. per Labour Force Member | |||
|---|---|---|---|---|---|---|
| Index | Annual Percentage Increase | Index | Annual Percentage Increase | Index | Annual Percentage Increase | |
| 1973–74 | 970 | 7.2 | 952 | 4.2 | 1019 | 2.9 |
| 1974–75 | 1010 | 4.1 | 984 | 3.4 | 1026 | 0.7 |
| 1975–76 | 1027 | 1.7 | 996 | 1.2 | 1031 | 0.5 |
| 1976–77 | 1028 | 0.1 | 998 | 0.2 | 1030 | −0.1 |
| 1977–78 | 1000 | −2.7 | 1000 | 0.2 | 1000 | −2.9 |
| 1978–79 | 1000 | – | 1005 | 0.5 | 995 | −0.5 |
| 1979–80 | 1027 | 2.7 | 1016 | 1.1 | 1011 | 1.6 |
| 1980–81 | 1034 | 0.7 | 1023 | 0.7 | 1001 | – |
| 1981–82 | 1079 | 4.4 | 1030 | 0.7 | 1048 | 3.7 |
| 1982–83 | 1078 | −0.1 | 1034 | 0.4 | 1043 | −0.5 |
AGRICULTURAL PRODUCTION—The Agriculture Production Account covers the activities of all market-oriented establishments classified under agricultural and livestock production or agricultural services (major groups 111 and 112 of the New Zealand Standard Industrial Classification). All types of farms are included, together with agricultural services operated by contractors, such as top-dressing, weed-spraying, harvesting, threshing, shearing, and scrub-cutting. Other services included are herd testing and artificial insemination. Farms operated as trading enterprises by the Department of Lands and Survey and the Department of Maori Affairs are included.
The account includes all income derived from the activities of the establishments covered, including their characteristically farming activities, and also their “other” productive activities. However, investment income (such as dividends and interest) accruing to the proprietors of farming establishments is excluded.
The Agriculture Production Account will be published annually as part of the National Accounts supplement to the Monthly Abstract of Statistics from 1984 onwards, and this should be consulted for further information on methodology, etc.
All Agriculture Production Account figures which appeared in the 1983 Yearbook have been revised. Figures have been revised back to 1971–72 and are available from the Department of Statistics on request.
The following table shows details of the Agriculture Production Account item, intermediate consumption.
| Item | Year Ended March | ||||
|---|---|---|---|---|---|
| 1979x | 1980x | 1981x | 1982x* | 1983* | |
* Provisional. †Up to and including 1979 animal health and breeding, and weed and pest control, are combined. ‡Up to and including 1979 fuel and power, and repairs and maintenance, are combined. | |||||
| $(million) | |||||
| Purchase of livestock | 500 | 602 | 536 | 554 | 547 |
| Feed and grazing | 117 | 132 | 150 | 180 | 218 |
| Animal health and breeding† | 105 | 85 | 96 | 114 | 131 |
| Weed and pest control† | 47 | 55 | 67 | 75 | |
| Fertiliser, lime, and seeds | 168 | 268 | 332 | 406 | 426 |
| Fuel and power‡ | 419 | 172 | 208 | 242 | 286 |
| Repairs and maintenance‡ | 355 | 410 | 490 | 534 | |
| Freight | 66 | 78 | 93 | 109 | 120 |
| Other (not elsewhere classified) | 428 | 537 | 588 | 693 | 751 |
| 1,803 | 2,276 | 2,469 | 2,855 | 3,089 | |
| Less capitalised development | −45 | −61 | −82 | −103 | −93 |
| Total, Intermediate Consumption | 1,758 | 2,215 | 2,388 | 2,752 | 2,996 |
GROSS AGRICULTURAL PRODUCTION (GROSS OUTPUT)—The following table of Gross Agricultural Production shows the value of production for March years.
| Commodity | Year Ended March | ||||
|---|---|---|---|---|---|
| 1979 | 1980 | 1981 | 1982* | 1983* | |
n.c.c.—not elsewhere classified. * Provisional. | |||||
| Wool | 581 | 823 | 811 | 803 | 750 |
| Sheep | 436 | 477 | 560 | 585 | 499 |
| Cattle | 454 | 630 | 545 | 564 | 715 |
| Pigs | 46 | 64 | 65 | 80 | 86 |
| Dairy products | 530 | 691 | 850 | 1,020 | 1,181 |
| Poultry products | 88 | 97 | 110 | 124 | 136 |
| Crops and seeds | 165 | 168 | 221 | 279 | 257 |
| Fruit, nuts, and oilseeds | 87 | 124 | 154 | 183 | 214 |
| Vegetables | 125 | 153 | 183 | 225 | 219 |
| Other horticultural products | 57 | 79 | 104 | 127 | 150 |
| Agricultural services | 193 | 223 | 261 | 295 | 295 |
| Other products, n.e.c. | 26 | 33 | 50 | 60 | 81 |
| Value of change in livestock— | |||||
| Sheep | −19 | 151 | 70 | 60 | −74 |
| Cattle | −113 | 8 | 12 | −2 | −90 |
| Pigs | −1 | −1 | −1 | −1 | – |
| Deer | 25 | 41 | 18 | 32 | 32 |
| Goats | – | – | 1 | 2 | 5 |
| Sales of live animals | 501 | 592 | 536 | 563 | 558 |
| Gross Output | 3,180 | 4,354 | 4,549 | 5,000 | 5,013 |
GROSS AGRICULTURAL PRODUCTION FOR YEARS ENDED JUNE—This index is a volume measure of commodities produced by all New Zealand farms. The index of the Volume of Gross Agricultural Production for each of the latest 5 years is shown for the component product groups, as well as for the production of the whole agricultural industry. The expression base for each product group separately, and for the agriculture industry as a whole, is the year ended June 1978 (=1000). The indexes are chain linked year-on-year.
| Commodity | Year Ended March | ||||
|---|---|---|---|---|---|
| 1979 | 1980 | 1981 | 1982* | 1983* | |
n.e.c.—not elsewhere classified. * Provisional. | |||||
| Volume Index Numbers | |||||
| Wool | 1032 | 1161 | 1247 | 1187 | 1173 |
| Sheep | 982 | 1162 | 1178 | 1153 | 1265 |
| Cattle | 966 | 980 | 958 | 1000 | 953 |
| Pigs | 896 | 878 | 865 | 878 | 885 |
| Dairy products | 1082 | 1136 | 1092 | 1088 | 1113 |
| Poultry products | 1011 | 1049 | 1120 | 1144 | 1085 |
| Crops and seeds | 1019 | 980 | 961 | 1003 | 965 |
| Fruit, nuts, and oilseeds | 1163 | 1236 | 1339 | 1638 | 1545 |
| Vegetables | 937 | 997 | 933 | 1034 | 1021 |
| Other horticultural products | 1213 | 1585 | 1782 | 1901 | 1630 |
| Other farm products, n.e.c. | 1186 | 1601 | 1847 | 2070 | 2369 |
| Total, All Farm Products | 1025 | 1115 | 1132 | 1147 | 1151 |
A country's balance of payments statement is a comprehensive account of its economic transactions with the rest of the world. The New Zealand balance of payments estimates are based on the principles set out in the Balance of Payments Manual (Fourth Edition), published by the International Monetary Fund and are in conformity with the methods used by other countries.
Annual and quarterly estimates of the New Zealand balance of payments together with the balance of payments methodology, are shown in more detail in the annual volume, Balance of Payments published by the Department of Statistics, from the Department of Statistics' Information Network for Official Statistics (INFOS), and the Monthly Abstract of Statistics.
MAJOR PRINCIPLES—The major principles used in preparing a balance of payments statement are:
Goods sold from one country to another are recorded at the time ownership changes, and other transactions are recorded at the time they occur.
Exports and imports of merchandise are valued at f.o.b. (free on board) in the exporting country.
As far as possible, all transactions are shown on a gross, rather than on a net, settlement basis.
Wherever possible, all transactions are valued at market prices.
All transactions are recorded in New Zealand dollars. Where another currency was used for the transaction the currency exchange rates ruling at the time the transaction occurred have been used to convert the transaction to New Zealand dollars.
COMPONENTS OF THE NEW ZEALAND BALANCE OF PAYMENTS—The following description refers to the summary table on a following page.
Exports/Imports (as Published in External Trade Statistics)—These are for March years and are otherwise identical with the figures published in Section 23, External Trade. Exports are valued f.o.b.; imports are valued c.i.f. (cost, insurance, and freight).
Adjustments to Balance of Payments Concepts—There are some imports and exports which are included in the balance of payments but not in external trade statistics. These include ships and aircraft purchased by New Zealand residents for use in international trade.
A considerable portion of New Zealand's exports are sold on consignment in the United Kingdom. The change of ownership occurs well after the goods have been recorded in New Zealand external trade statistics. Also, the valuation in external trade statistics is an estimate of future realisations. Adjustments to bring trade statistics to balance of payments concepts show mainly as a credit entry.
The debit entry contains the adjustment of imports from c.i.f. value to f.o.b. value.
Exports/Imports (f.o.b. Exporting Country)—New Zealand's exports and imports of merchandise on balance of payments basis.
Balance on Merchandise Trade—The surplus of exports f.o.b. over imports f.o.b.
Transportation, Travel, Insurance, Other Miscellaneous Services, and Government Transactions—The exports of services from, and imports of services to, New Zealand. The balance on services is the difference between the sum of the credit entries and the sum of the debit entries for these items.
International Investment Income—The credit entries show the income accruing to New Zealand residents from overseas investments while the debit entries show the income accruing to overseas residents from their investments in New Zealand.
Balance on Invisibles—The balance on services plus international investment income credits minus international investment income debits.
Transfers—This item provides the counter-entries for gifts of goods, services, and financial assets to and from New Zealand. Examples are immigrants' transfers, gifts and donations, foreign aid payments, and relief supplies.
Balance on Current Account—The balance on merchandise trade plus the balance on invisibles plus transfer credits minus transfer debits. It is a measure of the surplus of outflows of goods, services, and transfers from New Zealand over the inflows of goods, services, and transfers into New Zealand.
Private Overseas Direct Investment in New Zealand, New Zealand Private Direct Investment Overseas, and Other Private Long-Term Capital Movements—These items show the changes in long-term claims on the rest of the world and long-term liabilities to the rest of the world of the private sector.
Government Capital Movements—Includes all Government capital movements except movements in Government-held reserve assets and Government borrowing to maintain New Zealand's foreign exchange reserves. Direct investment transactions of Government-owned corporations are included.
Capital Movements by Monetary Institutions—This item includes those capital movements by the Reserve Bank of New Zealand and the trading banks which are not movements in reserve assets or borrowing to maintain reserves.
Residual—This is the balancing item. It is the difference between the sum of the credit column and the sum of the debit column. It covers any errors in the balance of payments estimates and all omissions. Included in the omissions are short-term private capital movements.
Balance Before Compensatory Financing—The balance on all transactions, other than reserve transactions and transactions undertaken to maintain reserves. This balance is commonly referred to as the overall balance.
Compensatory Financing—Borrowing undertaken by the Government, Reserve Bank, and other organisations for the purpose of maintaining the level of New Zealand's reserves.
Balance after Compensatory Financing—The balance on all transactions other than reserve transactions. The change in New Zealand's foreign exchange reserves due to transactions is the same in direction and magnitude as this balance.
Reserve Transactions—The movements in New Zealand's foreign exchange reserves during the year. Reserves measured in New Zealand dollars may change because transactions have occurred or because the value of the New Zealand dollar has changed relative to the currency in which the reserve asset is denominated. The presentation shows the total change in reserves and, separately, a counterpart to changes in reserves caused by exchange rate changes. The difference of these two items is equal to the change in reserves caused by transactions in reserve assets.
New Zealand's reserves may change because of an allocation of Special Drawing Rights by the International Monetary Fund. This is not regarded as a transaction and there is a counterpart item for such an allocation.
Geographic Area—The geographic area covered by New Zealand balance of payments statistics includes metropolitan New Zealand, and the Cook, Niue and Tokelau Islands, which are part of the New Zealand monetary area.
GEOGRAPHIC DIVISION—The regional break-up of the balance of payments is on a geographical (as distinct from a currency) basis. This means that it is not the currency in which any economic transaction is settled but the residence of New Zealand's immediate partner in the transaction which determines in which regional column the transaction is recorded. Any exception to this rule is due to statistical necessity—insufficiency of basic data, etc., rather than choice.
United Kingdom (including Channel Islands).
Australia (including Norfolk Island, Christmas Island, and Cocos Islands).
USA—United States of America, Puerto Rico, Virgin Islands, American Samoa, Guam, and other American islands in the Pacific.
Canada.
Japan.
Other EEC Countries—The members of the European Economic Community which form a common market; Belgium, the Netherlands, Luxembourg, France, Greece (from 1 January 1981), Italy, the Federal German Republic, Denmark and Ireland. The United Kingdom is also a member of the EEC but is shown separately.
Other OECD—Austria, Finland. Greece, Iceland, Liechtenstein, Norway, Portugal, Spain, Sweden, Switzerland, Turkey.
Asia-Oceania—Asian countries east of Iran and all Pacific countries except Australia, Japan, the Americas, and New Zealand.
Latin America-Caribbean—All the Americas except Canada and the USA.
Other Countries—All countries not included in any other group.
International Organisations—Transactions with the United Nations and its agencies, the International Monetary Fund, the International Bank for Reconstruction and Development, the International Finance Corporation, the Asian Development Bank, South Pacific Air Transport Council, and other international organisations.
ACCOUNTING SYSTEM—The system used in preparing the New Zealand balance of payments statement is by double entry. Every transaction results in a pair of equal credit and debit entries. Any entries which are not automatically paired are deliberately furnished with special off-setting entries. The sum of all the credit entries in the statement is thus in principle numerically equal to the sum of all the debit entries, with any inequality that may arise being attributable to net statistical errors and omissions. In practice, the residual item comprises short-term capital movements, data on which are not compiled, as well as errors and omissions.
Accounting Period—All estimates are for financial years ended 31 March.
Residents and Non-Residents—The balance of payments is a record of economic transactions between residents and non-residents. Residents include the general government, all individuals, private non-profit organisations, enterprises and mobile equipment, located or operating within the territory of an economy.
General Government—The general government of New Zealand includes New Zealand embassies, consulates and military establishments located abroad. Conversely the embassies and consulates, etc. of foreign governments which are located in New Zealand are not considered to be New Zealand residents.
Individuals—The concept of residence adopted for individuals is designed to encompass all persons who may be expected to consume goods and services, participate in production, or engage in other economic activities in New Zealand on other than a temporary basis.
As a general rule, persons who live, or who intend to live, in New Zealand for at least one year are considered to be residents. The exception to this are employees of foreign governments, such as diplomatic and consular representatives and personnel stationed in New Zealand. These employees are regarded as non-residents. New Zealand citizens who are employed by foreign embassies are regarded as New Zealand residents employed by foreigners.
Enterprises—Enterprises resident in New Zealand are the actual units that engage in the production of goods and services in New Zealand. Therefore subsidiaries and branches of overseas companies are treated as residents, while subsidiaries and branches of New Zealand companies operating overseas are regarded as residents of the country in which they operate.
Mobile equipment—Foreign-owned mobile equipment operating in New Zealand for more than one year is classified as being resident in New Zealand.
Ships and aircraft owned by New Zealand residents and operating in international trade are regarded as New Zealand domiciled, while foreign-owned ships and aircraft trading to New Zealand are treated as non-resident. The exception to this are foreign-owned ships and aircraft operating in international trade under a financial lease arrangement (e.g. Boeing 747s leased by Air New Zealand).
BALANCE OF PAYMENTS AND THE OVERSEAS EXCHANGE TRANSACTIONS RECORD—There are several very important differences between a Balance of Payments Statement and the Overseas Exchange Transactions Record prepared by the Reserve Bank (see Section 30, Banking and Currency). The main differences are:
The balance of payments attempts to show all economic transactions between residents of one country and residents of other countries, whereas the overseas exchange transactions record shows only transactions involving remittances.
The import and export data in the balance of payments are based on external trade statistics, which enable goods to be valued at a definite and uniform valuation boundary—viz, f.o.b. exporting country. The overseas exchange transactions record remittances for imports and exports whenever these are made and without adhering to any valuation basis (f.o.b. or c.i.f.). The result is a difference both in timing and valuation between the two statements.
Whereas the overseas exchange transactions record includes net settlements in many instances, the balance of payments shows these transactions as far as possible on a gross basis.
Other differences arise from the fact that the balance of payments statement is constructed on a basis of country of purchase for imports and country of destination for exports, country of residence of remitter or remittee, whereas the overseas exchange transactions record is based on the country of monetary settlement.
In essence, balance of payments statistics cover all of New Zealand's transactions with the rest of the world. The overseas exchange transactions record measures only transactions involving receipts and payments of foreign exchange.
BALANCE OF PAYMENTS AND THE EXTERNAL TRANSACTIONS ACCOUNT OF THE NATIONAL ACCOUNTS—As far as possible, the balance of payments statement and the external transactions account are prepared using the same principles and definitions. However, they have different uses and there are some major differences in content. The most important of these is the inclusion of the undistributed earnings of direct investment enterprises in the balance of payments. These earnings are included as a memorandum item in the external transactions account. Therefore the balance on current account (i.e. the surplus of the nation on current account) in the external transactions account is more favourable than the balance on current account as shown in the balance of payments statement.
Users Preference: Balance of Payments Vs. External Transactions Account of the National Accounts—A user who is interested in the effect of New Zealand's transactions with the rest of the world on the major economic aggregates of the economy should use the external transactions account of the National Accounts, which is an integrated system designed for this type of analysis.
A user who is interested in a close examination of New Zealand's external transactions should use the balance of payments, which offers a more detailed classification of transactions than the external transactions account.
SUMMARY TABLE—The following table presents a summary of New Zealand's transactions with other countries during the four latest available financial years.
| Item | 1979–80 | 1980–81 | 1981–82 | 1982–83 | ||||
|---|---|---|---|---|---|---|---|---|
| Credit | Debit | Credit | Debit | Credit | Debit | Credit | Debit | |
| NZ(million) | ||||||||
| Exports/imports (as published in external trade statistics) | 4,880 | 4,997 | 5,746 | 5,615 | 6,717 | 7,150 | 7,537 | 7,810 |
| Adjustments to balance of payments concepts | 1x | −400x | −54 | −428 | −96 | −515x | −353 | −469 |
| Exports/imports (f.o.b. exporting country) | 4,881x | 4,597x | 5,692 | 5,187 | 6,621 | 6,635x | 7,184 | 7,342 |
| Balance on merchandise trade | 284x | 505 | –14x | –158 | ||||
| Transportation | 656x | 660x | 746 | 828 | 896x | 975x | 1,052 | 1,168 |
| Travel | 197 | 475x | 239 | 529 | 298 | 622 | 304 | 647 |
| Insurance | 6 | −7 | 12 | 27 | 14 | 30 | 23 | 31 |
| Other miscellaneous services | 109x | 338x | 150 | 448 | 232 | 644 | 302 | 773 |
| Government transactions | 47x | 175x | 63 | 171 | 78 | 156 | 78 | 141 |
| Balance on services | –625x | –792 | –909x | –1000 | ||||
| International investment income | 128x | 636 | 166 | 758 | 285x | 1,039x | 308 | 1,292 |
| Balance on invisibles | –1,132x | –1,384 | –1,663x | –1,984 | ||||
| Transfers | 223 | 200x | 302 | 246 | 343 | 294 | 413 | 274 |
| Balance on current account | -825x | –823 | –1,628 | –2,004 | ||||
| Private overseas direct investment in N.Z. (net) | 343 | 205x | 366x | 364 | … | |||
| N.Z. private direct investment overseas (net) | 73x | 118x | 115x | 604 | ||||
| Other long-term private capital movements— | ||||||||
| Increases in assets (net) | −64x | −64 | −14 | −6 | ||||
| Increases in liabilities (net) | 42x | 66x | 169x | 1,285 | … | |||
| Government capital movements (excluding movements in Government-held reserve assets)— | ||||||||
| Increases in assets (net) | 5x | 40 | 4x | 50 | ||||
| Increases in liabilities (net) | 45x | −48x | 156x | 1,102 | … | |||
| Capital movements by monetary institutions (excluding movements in reserve assets)— | ||||||||
| Increases in assets (net) | 55x | …x | 68x | …x | −52x | −30 | ||
| Increases in liabilities (net) | –x | –x | –x | – | … | |||
| Residual (includes short-term private capital movements and errors and omissions) | 4x | −19x | −300x | −615 | … | |||
| Balance before compensatory financing | –461x | –782x | –1,291 | –485 | ||||
| Government borrowing (net) | 397 | 843x | 824 | 1,323 | … | |||
| Reserve bank borrowing (net) | 52 | −52 | 32x | 13 | … | |||
| Other official borrowing (net) | 83x | 606 | 157 | … | ||||
| IMF drawings (net) | −127 | −164 | −130 | −36 | … | |||
| Total compensatory financing (net) | 323 | 710x | 1,332x | 1,456 | … | |||
| Balance after compensatory financing | –138x | –72x | 40x | 971 | ||||
| Changes in Reserve Assets— | ||||||||
| Monetary gold | – | – | – | – | ||||
| Special drawing rights (SDRs)— | ||||||||
| Total change in holdings | −11 | 4 | −14 | −25 | ||||
| Counterpart to allocation/cancellation | 32 | 28 | – | – | ||||
| Counterpart to valuation changes | 1 | 1 | 2 | – | ||||
| Change due to transactions | −45 | −25 | −16 | −25 | ||||
| Reserve position at the IMF— | ||||||||
| Total change in holdings | −44 | 36x | −37 | – | ||||
| Counterpart to valuation changes | – | –x | 3 | – | ||||
| Change due to transactions | −44 | 36 | −39 | – | ||||
| Reserve Bank Overseas | ||||||||
| Reserves— | ||||||||
| Total change in holdings | −3x | −100x | −27x | 581 | ||||
| Counterpart to valuation changes | – | – | – | – | ||||
| Change due to transactions | −3x | −100x | −27x | 581 | ||||
| Treasury Overseas Reserves— | ||||||||
| Total change in holdings | −19x | 22x | 145x | 547 | ||||
| Counterpart to valuation changes | 28 | 5 | 22 | 133 | ||||
| Change due to transactions | −47x | 17x | 123x | 414 | ||||
| Summary of reserve transactions— | ||||||||
| Total change in reserves | −77x | −38x | 67x | 1,104 | ||||
| Counterpart to valuation changes | 61 | 34 | 27 | 133 | ||||
| Changes in reserves due to transactions | −138x | −72x | 40x | 971 | ||||
| Total reserves at 31 March (as shown in Reserve Bank Bulletin) | 532x | 495x | 563x | 1,666 | ||||
A summary of New Zealand's balance of payments transactions by regions during the years 1981–82 and 1982–83 is shown in the table on the following pages.
| REGIONAL SUMMARY 1981–82 AND 1982–83 | ||||||||||
|---|---|---|---|---|---|---|---|---|---|---|
| Item | United Kingdom | Other EEC | Australia | United States of America | Canada | |||||
| Credit | Debit | Credit | Debit | Credit | Debit | Credit | Debit | Credit | Debit | |
| NZ$(million) 1981–82 | ||||||||||
| Exports/imports (f.o.b. exporting country) | 938 | 610 | 560 | 499 | 995 | 1,483 | 861 | 1,142 | 136 | 143 |
| Balance on merchandise trade | 328 | 61 | −488 | −281 | −7 | |||||
| Services | 400 | 648 | 76 | 125 | 405 | 647 | 334 | 504 | 49 | 41 |
| International investment income | 32 | 238 | 8 | 100 | 97 | 158 | 65 | 278 | 4 | 32 |
| Balance on invisibles | −454 | −141 | −303 | −384 | −20 | |||||
| Transfers | 131 | 37 | 26 | 5 | 94 | 148 | 42 | 22 | 9 | 6 |
| Balance on current account | −32 | −60 | −845 | −645 | −23 | |||||
| Private overseas direct investment in New Zealand | 69 | 11 | 144 | 10 | 33 | |||||
| New Zealand private direct investment overseas | 17 | −7 | 23 | 33 | −8 | |||||
| Other long-term private capital movements | 116 | −10 | −1 | −1 | 58 | −8 | −14 | 6 | −2 | 1 |
| Government capital movements | 3 | −2 | −4 | – | 219 | – | −4 | – | −5 | – |
| Capital movements by monetary institutions | – | −7 | – | −27 | – | – | – | −6 | – | – |
| Residual | −1,442 | −17 | 440 | 965 | −12 | |||||
| Balance before compensatory financing | −1,285 | −36 | – | 279 | −2 | |||||
| Compensatory financing | 1,641 | 347 | 113 | 89 | – | – | 527 | 827 | – | – |
| Balance after compensatory financing | 9 | −12 | – | −21 | −2 | |||||
| Total change in reserves | 10 | −8 | 1 | −16 | 1 | |||||
| Counterpart to valuation, etc., changes | 2 | 4 | 1 | 4 | 2 | |||||
| Change due to transactions | 8 | −12 | – | −21 | −2 | |||||
| NZ$(million) 1982–83 | ||||||||||
| Exports/imports (f.o.b. exporting country) | 823 | 667 | 660 | 650 | 977 | 1,622 | 1,030 | 1,255 | 161 | 167 |
| Balance on merchandise trade | 156 | 10 | −645 | −225 | −6 | |||||
| Services | 418 | 741 | 82 | 138 | 483 | 606 | 436 | 761 | 23 | 33 |
| International investment income | 76 | 311 | 14 | 105 | 89 | 179 | 52 | 384 | 3 | 8 |
| Balance on invisibles | −558 | −147 | −212 | −658 | −15 | |||||
| Transfers | 141 | 37 | 34 | 7 | 108 | 82 | 56 | 17 | 11 | 5 |
| Balance on current account | −298 | −110 | −831 | −845 | −16 | |||||
| Private overseas direct investment in New Zealand | 143 | 15 | 189 | −41 | 14 | |||||
| New Zealand private direct investment overseas | 2 | 72 | 70 | 384 | ||||||
| Other long-term private capital movements | 325 | −1 | 20 | −2 | 106 | 35 | 611 | −51 | 88 | 3 |
| Government capital movements | 463 | −4 | −5 | 43 | −19 | – | 27 | – | 140 | 3 |
| Capital movements by monetary institutions | – | −4 | – | −17 | – | – | – | −4 | – | – |
| Residual | −708 | 429 | 663 | −240 | 164 | |||||
| Balance before compensatory financing | −68 | 325 | – | −503 | −1 | |||||
| Compensatory financing | 840 | 585 | 137 | 124 | – | – | 1,229 | 654 | – | – |
| Balance after compensatory financing | 187 | 338 | – | 72 | −1 | |||||
| Total change in reserves | 203 | 363 | 1 | 74 | 3 | |||||
| Counterpart to valuation, etc., changes | 16 | 25 | 1 | 2 | 4 | |||||
| Change due to transactions | 187 | 338 | – | 72 | −1 | |||||
| Japan | Other O.E.C.D. | Asia Oceania | Latin America Caribbean | Other Countries | International Organisation | Total | |||||||
|---|---|---|---|---|---|---|---|---|---|---|---|---|---|
| Credit | Debit | Credit | Debit | Credit | Debit | Credit | Debit | Credit | Debit | Credit | Debit | Credit | Debit |
| NZ$(million) 1981–82 | |||||||||||||
| 895 | 1,038 | 57 | 138 | 1,152 | 938 | 171 | 43 | 856 | 602 | – | – | 6,621 | 6,635 |
| −143 | −81 | 214 | 128 | 254 | – | −14 | |||||||
| 112 | 190 | 16 | 50 | 122 | 185 | −5 | 18 | 11 | 18 | – | 2 | 1,518 | 2,427 |
| 9 | 63 | 10 | 84 | 55 | 22 | – | 3 | 3 | 22 | – | 38 | 285 | 1,039 |
| −131 | −108 | −31 | −26 | −26 | −39 | −1,662 | |||||||
| 2 | 1 | 7 | 3 | 28 | 53 | 1 | – | 4 | 4 | – | 16 | 343 | 294 |
| −273 | −185 | 159 | 102 | 228 | −55 | −1,628 | |||||||
| 83 | 9 | 8 | 1 | – | – | 366 | |||||||
| – | – | 53 | 2 | 1 | – | 115 | |||||||
| −7 | – | 3 | −2 | 15 | 1 | 2 | −1 | – | – | 169 | −14 | ||
| 8 | – | −5 | – | −55 | – | – | – | – | – | −1 | 6 | 156 | 4 |
| – | – | – | – | – | – | – | −4 | – | −8 | – | – | – | −52 |
| 114 | −40 | −72 | −108 | −273 | 144 | −300 | |||||||
| −75 | −217 | −1 | −1 | −36 | 82 | −1,291 | |||||||
| 188 | 5 | 237 | 9 | – | – | – | – | 100 | 68 | – | 130 | 2,806 | 1,475 |
| 108 | 11 | −1 | −1 | −5 | −47 | 40 | |||||||
| 108 | 16 | – | −1 | −5 | −40 | 67 | |||||||
| – | 4 | 1 | – | – | 8 | 27 | |||||||
| 108 | 12 | −1 | −1 | −5 | −47 | 40 | |||||||
| NZ$(million) 1982–83 | |||||||||||||
| 1,011 | 1,182 | 66 | 150 | 1,369 | 1,243 | 191 | 61 | 895 | 344 | – | – | 7,184 | 7,342 |
| −172 | −83 | 126 | 129 | 551 | – | −158 | |||||||
| 136 | 178 | 16 | 45 | 135 | 195 | 15 | 22 | 17 | 42 | −2 | −2 | 1,759 | 2,760 |
| 17 | 103 | 11 | 118 | 28 | 31 | 13 | 2 | 2 | 23 | 4 | 28 | 308 | 1,292 |
| −127 | −135 | −63 | 3 | −46 | −26 | −1,984 | |||||||
| 6 | 3 | 9 | 2 | 43 | 57 | 1 | 1 | 6 | 4 | – | 50 | 413 | 274 |
| −296 | −211 | 49 | 133 | 506 | −85 | −2,004 | |||||||
| 24 | 14 | 6 | 1 | – | – | 364 | |||||||
| 38 | – | 3 | 44 | −8 | – | 604 | |||||||
| 131 | −1 | −13 | −1 | 19 | 18 | −15 | −1 | 8 | – | – | 1,285 | −6 | |
| 212 | – | 7 | – | 285 | 4 | – | – | – | – | −8 | 4 | 1,102 | 50 |
| – | – | – | – | – | – | – | – | – | −5 | – | – | – | −30 |
| −138 | −63 | −335 | −104 | −490 | 207 | −615 | |||||||
| −103 | −265 | – | – | 20 | 110 | −485 | |||||||
| 383 | 5 | 397 | 138 | – | – | – | – | 105 | 25 | – | 104 | 3,090 | 1,635 |
| 274 | −6 | – | – | 100 | 6 | 971 | |||||||
| 336 | 1 | – | 1 | 100 | 22 | 1,104 | |||||||
| 62 | 7 | – | 1 | – | 16 | 133 | |||||||
| 274 | −6 | – | – | 100 | 7 | 971 | |||||||
Commentary—New Zealand is a small economy dependent on overseas trade. The value of New Zealand's exports of merchandise over the 3 years 1980–81, 1981–82 and 1982–83 averaged 23 percent of its GDP, and the value of its imports of merchandise (valued f.o.b.) averaged 22 percent. The current account receipts (credits) in its balance of payments averaged 30 percent of its gross domestic product (GDP) and the current account payments (debits) averaged 35 percent.
Over these 3 years, the earnings from merchandise exports made up 76 percent of total current account credits, while the cost (f.o.b.) of imports of goods accounted for 63 percent of New Zealand's current account payments. Thus New Zealand's balance of payments is dominated by the fluctuations in the earnings from exports and in the payments for imports of goods.
The balance on merchandise trade is strongly influenced by changes in New Zealand's terms of trade (see Section 24) as well as by changes in the volumes of exports and of imports (see the export and import volume indexes, Section 23A).
The balance on current account for the 1982–83 financial year was a deficit of $2,004 million. This can be compared to a deficit of $1,628 million in 1981–82.
The $485 million overall deficit (i.e. Balance before Compensatory Financing) was more than covered by the compensatory financing transactions undertaken by the Government and the Reserve Bank. Consequently, there was an increase in New Zealand's overseas reserves of $971 million for this latest financial year. This can be compared to an increase of $40 million in New Zealand's overseas reserves in 1981–82.
There has been a long-term trend towards a more diversified pattern of trade for New Zealand. During 1959–60, 54.9 percent of New Zealand's exports were sold to the United Kingdom and 46.8 percent of imports were purchased from the United Kingdom. By 1982–83 the United Kingdom took only 11.5 percent of exports and was the source of only 9.1 percent of imports.
The table below shows New Zealand's merchandise trade with various regions during 1982–83 expressed as percentages of the total merchandise trade.
| Country or Group of Countries | Exports f.o.b. | Imports f.o.b. |
|---|---|---|
| percentage | ||
| U.K. | 11.5 | 9.1 |
| Australia | 13.6 | 22.1 |
| U.S.A. | 14.3 | 17.1 |
| Canada | 2.2 | 2.3 |
| Japan | 14.1 | 16.1 |
| Other E.E.C. | 9.2 | 8.8 |
| Other O.E.C.D. | 0.9 | 2.0 |
| Asia Oceania | 19.1 | 16.9 |
| Latin America - Caribbean | 2.7 | 0.8 |
| Other | 12.5 | 4.7 |
| Total | 100.0 | 100.0 |
SURVEY OF DIRECT INVESTMENT BY COMPANIES—The picture of international capital movements would be incomplete without the consideration of investment flows originating with private commercial firms. While such investment takes place in response to usual economic motivation, its effect on a country's balance of payments differs in no respect from other capital movements, such as Government lending or borrowing abroad, investment or repatriation of assets from abroad by private individuals, etc.
The type of investment referred to here is that defined as direct private investment. Subsidiaries (i.e., New Zealand companies under control of an overseas company), branches of overseas companies, companies where many of the shareholders reside overseas, or any other companies where overseas shareholders exercise a controlling interest, fall within this category. The question of control is decided on the strength of the parent company's holdings (a 25 percent holding of the subsidiary's ordinary share capital is deemed as the qualifying minimum). The same criteria apply for direct investment overseas by New Zealand companies and residents.
Direct investment flows assume various forms; they may be by remittances of cash, the provision of plant, machinery, or goods without corresponding payments, charging up of services rendered by the parent company, the re-investment in New Zealand of undistributed profits, or the partial remittance only of declared dividends and branch earnings.
The information tabulated in the following tables is based on an annual survey of companies with overseas affiliations in which the companies report on the distribution of paid-up capital and its changes, dividends and dividend remittances, intercompany accounts with the parent company or affiliated company, and head office accounts in the case of branches.
It should be noted that investment figures given in the following 4 tables are in terms of inflows and outflows at current prices. The total worth of direct investments assets is extremely difficult to establish in view of the fact that book values may bear little relationship to what such investments would realise on sale; a year's inflows and outflows of investment capital on the other hand are capable of precise expression, and the relationship to other capital movements can be defined precisely.
Overseas Private Direct Investment in New Zealand—The following table shows all capital transactions between the foreign direct investor (including direct investment enterprises of the investor in other countries) and the New Zealand direct investment enterprise.
| March Year | United Kingdom | Other EEC Countries* | Australia | U.S. A. and Canada | Other Countries | Total, All Countries |
|---|---|---|---|---|---|---|
| NZ$(million) | ||||||
| 1978–79 | 203.4 | 2.0 | 27.1 | 37.5 | −6.1 | 263.9 |
| 1979–80 | 136.1 | 10.7 | 99.5 | 101.5 | −5.1 | 342.7 |
| 1980–81 | 84.0 | −9.2 | 34.4 | 73.3x | 22.0x | 204.5x |
| 1981–82 | 69.0x | 10.6x | 143.6x | 43.1x | 99.6x | 365.8x |
| 1982–83 | 143.4 | 15.3 | 188.6 | −27.7 | 44.5 | 364.0 |
The following graph shows changes in overseas direct investment in New Zealand.
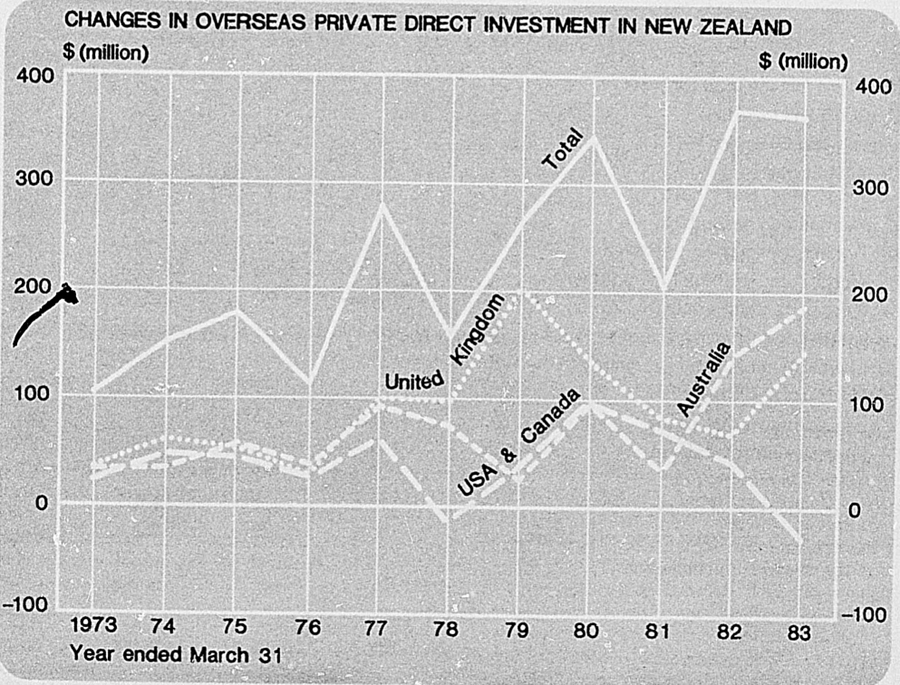
Income from Private Overseas Direct Investment in New Zealand—The following table covers income payable to other countries from investment in companies where the foreign investor holds 25 percent or more of the shares in the New Zealand company. It also includes the income from New Zealand branches of foreign firms. That portion of the undistributed profit of resident enterprises which accrues to foreign investors (who met the 25 percent condition) is also included.
| March Year | United Kingdom | Other EEC Countries* | Australia | U.S.A. and Canada | Other Countries | Total, All Countries |
|---|---|---|---|---|---|---|
| * Other than United Kingdom. | ||||||
| NZ$(million) | ||||||
| Total Income from Private Overseas Direct Investment in New Zealand | ||||||
| 1978–79 | 116.3 | 77.4 | 54.5 | 2.7 | 10.4 | 261.4 |
| 1979–80 | 49.0 | 64.5 | 46.7 | 1.2 | 9.0 | 170.4 |
| 1980–81 | 92.0 | 71.4 | 44.1 | 1.0 | 16.7 | 225.3 |
| 1981–82 | 131.7x | 126.9x | 74.8x | 2.1 | 21.2x | 356.7x |
| 1982–83 | 170.2 | 158.7 | 50.5 | 3.7 | 17.3 | 400.5 |
Industrial Classification of Overseas Private Direct Investment and Income from Private Overseas Direct Investment in New Zealand—The following table shows details of overseas direct investment and income from overseas direct investment classified by major industry groupings.
| Industry | 1979–80 | 1980–81 | 1981–82 | 1982–83 |
|---|---|---|---|---|
| NZ$(million) | ||||
| Private Direct Investment Flows into New Zealand from Overseas | ||||
| Farming, hunting, and fishing | 1.4 | 5.1 | −0.6x | −6.2 |
| Forestry and logging | ||||
| Mining and quarrying | 0.9 | 2.4x | 4.2x | −1.3 |
| Manufacturing— | ||||
| Food, drink, and tobacco | 14.6 | 15.5 | 20.3 | 14.2 |
| Meat and dairy products | −5.7 | 23.4 | −5.8 | −13.3 |
| Textiles, clothing, and footwear | 1.8 | 1.3 | −0.1x | 3.8 |
| Wood, cork, and furniture production | 0.9 | 0.4 | 17.4 | 1.4 |
| Pulp, paper, and printing | 2.3 | 5.6 | 3.5 | 7.8 |
| Leather and rubber products | 0.5 | 1.8 | 2.2 | 1.9 |
| Chemical and mineral products | 76.1 | 18.9 | 26.4x | 27.3 |
| Metal working | 10.9 | −7.0 | 58.0 | 5.2 |
| Engineering and transport equipment | 33.3 | 16.2 | 44.7x | −17.2 |
| Miscellaneous manufacturing | 15.4 | 8.1 | 52.1 | 34.9 |
| Building and construction | 2.3 | −5.4x | 3.6 | |
| Wholesale and retail trade | 113.1 | 12.6 | 132.7x | 74.7 |
| Banking, insurance, and ownership of property | 94.5 | 70.2 | 62.5x | 221.0 |
| Transport and communications | −23.6 | 0.7 | −23.8 | 0.3 |
| Services | 6.3 | 27.3x | −22.6x | 6.0 |
| Total | 342.7 | 204.5x | 365.8x | 364.0 |
| Income from Private Overseas Direct Investment in New Zealand | ||||
| Farming, hunting, and fishing | 0.3 | 2.0 | 3.0 | 1.4 |
| Forestry and logging | ||||
| Mining and quarrying | 1.0 | 1.8 | −2.6 | −0.8 |
| Manufacturing— | ||||
| Food, drink, and tobacco | 20.1 | 17.2 | 23.3 | 23.9 |
| Meat and dairy products | −9.4 | −5.8 | −4.1 | 1.6 |
| Textiles, clothing, and footwear | 2.4 | 1.0 | 3.5x | 2.2 |
| Wood, cork, and furniture production | 0.7 | – | 2.3 | 1.3 |
| Pulp, paper, and printing | 7.3 | 4.1 | 5.1 | 9.9 |
| Leather and rubber products | 1.7 | 5.1 | 3.7 | 3.4 |
| Chemical and mineral products | 19.3 | 16.1 | 29.0x | 27.5 |
| Metalworking | 5.5 | 5.9 | 11.8 | 6.9 |
| Engineering and transport equipment | 22.9 | 22.3 | 34.2x | 10.0 |
| Miscellaneous manufacturing | 22.4 | 20.8 | 50.2x | 35.1 |
| Building and construction | 2.0 | 1.7 | 1.8 | 1.5 |
| Wholesale and retail trade | 20.7 | 69.4 | 71.4x | 102.9 |
| Banking, insurance, and ownership of property | 45.0 | 56.8 | 114.2x | 159.9 |
| Transport and communications | 5.0 | 6.0 | 5.4 | 4.0 |
| Services | 3.5 | 0.9 | 4.4 | 9.7 |
| Total | 170.4 | 225.3 | 356.5x | 400.5 |
Investment by New Zealand Companies Overseas—The following table presents the converse picture of those immediately preceding viz, direct investment flows out from New Zealand and the income earned from direct investment by New Zealand companies in their overseas subsidiaries and branches.
| March Year | United Kingdom | Australia | United States and Canada | Other Countries | Total, All Countries |
|---|---|---|---|---|---|
| NZ$(million) | |||||
| Private Direct Investment flows out from New Zealand | |||||
| 1978–79 | 1.4 | 36.0x | 9.2 | 6.9 | 53.5x |
| 1979–80 | 8.9x | 36.2x | 2.2 | 26.0x | 73.3x |
| 1980–81 | −3.0 | 41.4 | 29.2 | 50.9 | 118.4 |
| 1981–82 | 16.7 | 23.0x | 25.3 | 49.6 | 114.7x |
| 1982–83 | 1.8 | 71.7 | 453.6 | 77.4 | 604.5 |
| Income for Private Direct Investment Overseas | |||||
| 1978–79 | 3.1x | 19.2 | 2.8 | 11.4 | 36.5x |
| 1979–80 | 10.9x | 25.1x | 3.5 | 12.7x | 52.1x |
| 1980–81 | 9.7 | 39.3x | 8.7 | 22.8 | 80.4 |
| 1981–82 | 11.7 | 56.1 | 15.0x | 43.7x | 126.5x |
| 1982–83 | 4.1 | 93.3 | 5.1 | 35.1 | 137.7 |
Input-output analysis, an important economic tool, was devised by Professor Leontief, a Nobel prize-winning American economist, in the 1930s to define and measure the interdependence of the different industries within the economy. For example, it provides a means by which it is possible to measure the effects of a stated increase or decrease in the demand for houses on the timber industry, the cement industry, and the industries producing glass, steel, paint, bricks, tiles, concrete blocks, nails, plumbing requisites, and all the other items that go into houses, as well as on the demand for imports and other primary inputs. Such repercussions may be direct or they may be the result of a chain of reactions through many industries. In the New Zealand context for example, the input-output tables can be used to analyse the effect of an increase in production for export of the meat freezing and preserving industry in terms of the increased supporting production required of all the other industries in the economy, whether that production goes directly to the meat export works or indirectly to them through other industries. In commodity terms, the effect of an increase in production of meat carcasses and cuts can be analysed in terms of the direct and indirect supporting production required of all other commodities in the economy.
The main objective of an inter-industry study is to provide an economic statement of the industrial structure of the economy for a given year, measuring the direct and indirect inter-relationships between industries and commodities. Aims are:
To provide an overall view of the economy, enabling planners to take a broad view, lessening the risk of important aspects being overlooked, or of sectional interests receiving undue attention.
To trace the probable effects of major rises or falls in one industry's demand throughout the economy. Input-output tables help planners foresee bottlenecks in supplies or unexpected side-effects.
To enable the effect of actual or hypothesized changes in the economy to be estimated more accurately than is otherwise possible. Examples of such changes are government policies affecting consumer prices, wages, exchange rates, etc.
To provide a measure of the relative demands of industries for imports and the contribution to exports. This demonstrates which industries are the best net earners of overseas exchange.
An inter-industry study involves 3 distinct tasks. They are:
The systematic collection, evaluation and arrangement of a vast body of statistical information on production and consumption covering, as far as possible, every area of the economy. This is the basic data on which the worth of the whole study depends.
The formulation of an appropriate theoretical scheme.
The application of theoretical methods and devices to the analysis of empirical data.
In a sense input-output analysis brings together those who, in economic research, have always tended to drift apart—the producers of elegant theories, and those engaged in empirical research and the accumulation of data. Input-output analysis gives scope to theorists but at the same time keeps them anchored firmly to the basic data, to the figures of goods poured out by factories, transported by ships, trucks and trains, and sold over shop counters.
Most developed countries regularly prepare input-output tables. The 1976–77 Inter-Industry Study of the New Zealand economy was the sixth undertaken by the Department of Statistics. The tables prepared for 1952–53 and 1954–55 were comparatively simple. The tables for 1959–60 and 1965–66, building on the pioneer work of the earlier studies, used similar methodology but were considerably more complex, involving measurement of commodity flows.
The 1971–72 and 1976–77 Inter-Industry Studies have adopted the concepts used in the United Nations System of National Accounts (1968) and these studies are conceptually reconcilable with the National Accounts. Numerical differences remain because fresh data becomes available to the National Accounts after the industry accounts in the Inter-Industry Study have been compiled. The 1976–77 Study includes, for the first time, commodity into commodity input-output tables.
The 1959–60 and 1965–66 Studies, and the 1971–72 and 1976–77 Studies are conceptually comparable, but comparisions between the 1965–66 and 1971–72 Studies should be made with considerable caution.
Work on the 1981–82 Inter-Industry Study is well advanced. It is hoped that increased computerisation of data input to this study will result in the first tables becoming available by 1986.
It is a common criticism of inter-industry studies (and not only in New Zealand) that they are invariably years out of date and therefore stale and of historical interest only. A considerable delay is inevitable with a full-scale study because of the enormous amount of preparatory investigation necessary and the fact that sometimes the detailed information required for input-output purposes is not available until a considerable time after the close of the year or other period that is the subject of the study. Consequently, the Department of Statistics updated its 25-industry 1971–72 transactions table to 1976–77 using information from the provisional National Accounts for 1976–77. Derived tables were also recalculated for 1976–77 and published together with a description of the updating methodology. Work on updating the 1976–77 Study to 1981–82 (by an improved methodology which will provide 25-category commodity into commodity and inter-industry transactions tables) will be completed by the end of 1984. The method will also facilitate the introduction of annual 25-category input-output tables.
The Structure of the Transactions Table—The input-output transactions (or flow) tables are a means of describing, for a particular period, the supply and disposition of the goods and services of an entire economic system. There are 2 basic transactions tables: the inter-industry (industry by industry) table and the commodity into commodity (commodity by commodity) table. They are both of the same size since the number of industries equals the number of commodities. A row in the inter-industry transactions table shows the disposition of output of an industry while a column shows the origin of inputs into an industry. A row in the commodity into commodity transactions table shows the disposition of output of a commodity, whereas a column shows the commodities which are input into a particular commodity. Since the output of an industry must be equal to the sum of its inputs (including operating surplus) the row total for an industry must be equal to the corresponding column total. Likewise, in the commodity into commodity table, the total supply of a commodity (row total) will equal the total usage of a commodity (column total).
The layout of the basic transactions table is as follows.
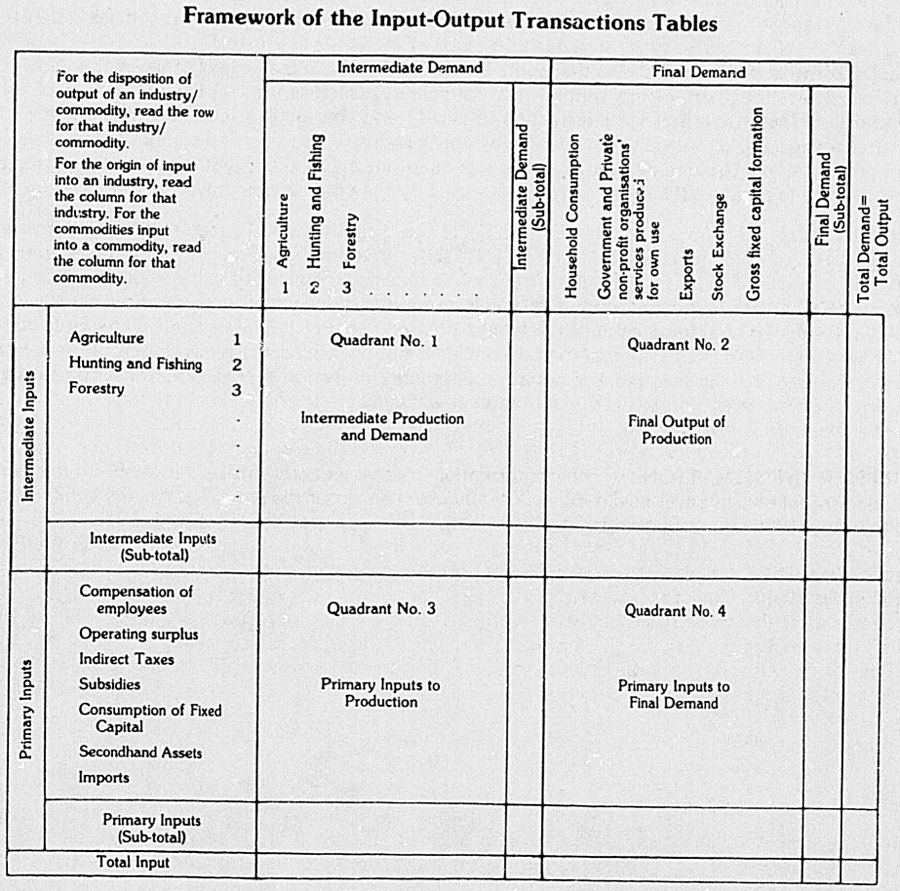
It is generally recognised that commodity into commodity tables, because of their greater homogeneity, are superior to and more useful than inter-industry tables.
Inter-industry Transactions Table—Quadrant 1 of the inter-industry transactions table is usually referred to as the inter-industry quadrant. Each column in this quadrant shows the intermediate inputs into an industry in the form of goods and services produced by other industries. Each row shows those parts of an industry's output which have been used by other industries. Thus the cell at the intersection of row (i) and column (j) shows how much output of industry (i) has been absorbed by industry (j) for current production purposes. Disposition of industries' output to categories of final demand (i.e. where commodities are not used in the economy to produce other commodites) is shown in quadrant 2. Quadrant 3 shows transactions usually referred to as primary inputs. These inputs differ from intermediate inputs in that they are regarded as coming from outside the productive system represented by the industries. They are sometimes referred to as the factors of production (labour, return to entrepreneurship, usage of capital) although not in the classic economic sense. Quadrant 4 shows the direct usage of primary inputs by final demands.
Quadrants 1 and 2 together show the total usage of the goods and services supplied by each industry. Total usage equals total supply because quadrant 2 includes stock change, which may be positive or negative. Quadrants 1 and 3 together show the inputs used to produce the total output of each industry.
The inter-industry transaction table is in essence a detailed dissection by industry of gross output and intermediate consumption in the 25 production groups of the National Accounts.
Commodity into Commodity Transactions Table—The quadrants of this table are analogous to the corresponding quadrants of the inter-industry transactions table. The total value of transactions in corresponding quadrants is the same (and quadrant 4 is identical); but values are transferred between columns in respect of quadrants 1 and 3 to reflect inputs into commodities rather than industries, and transferred between rows in respect of quadrants 1 and 2 to reflect outputs of commodities rather than industries.
Each column of quadrant 1 shows the inputs into a commodity in the form of other commodities and each row shows that part of the supply of a commodity which is used in the production of other commodities. Thus the cell at the intersection of row (i) and column (j) shows how much of the total output of commodity (i) is used to produce (in whatever industry or industries) commodity (j). Usage of commodities by final demand categories is shown in quadrant 2. Quadrant 3 shows the value of primary inputs needed to produce the commodity represented by the column concerned.
Derived Tables—If a transactions table is subjected to a mathematical process, known as inversion of the matrix, a derived table is produced. This will show on a unit basis (i.e. per $ of per $million, etc.) what will be required in additional output from every industry/commodity in the economy to support an increase of 1 unit in the final output of a selected industry/commodity. Such an account is often known as a table of total requirements (direct and indirect) per unit of final demand. The words “direct and indirect” are used to indicate that the table includes not only the direct requirements of the selected industry/commodity, but also the additional requirements of industries/commodities supplying those industries/commodities, and so on through an ever-widening circle of the economy until the economic reverberations die away.
FURTHER INFORMATION—Further information on inter-industry studies is available in the following Department of Statistics' publications, Inter-Industry Study of the New Zealand Economy (1959–60, 4 parts), (1965–66, 2 parts). (1971–72, 1 part), (1976–77 provisional bulletin), 1976–77 (1 part).
The central government is concerned with the future of the nation and therefore with the economic, social, and cultural development of the people as a whole and the quality of their environment. In New Zealand the State is fairly broadly concerned in national development and social welfare. The central government budgets for and controls expenditure on capital works such as electricity supply, land settlement, housing, public buildings, forest development, railway and road construction, and telecommunications, and other functions such as social welfare, health, education, defence, and paying interest on the public debt.
Taxing, charging, and borrowing are the 3 alternative avenues of raising revenue to meet Government expenditure. The problem of choice between these avenues can be described as the choice of the most efficient and equitable way of paying for publicly-provided services. However, the problems of finance and of raising revenue cannot be considered in isolation. In the first place some Government expenditure, such as subsidies and transfer payments (for example, pensions, superannuation payments, and family benefits), can and do alter the equity of the tax system. For instance, subsidies and monetary benefits can be regarded as refunds of tax. In the second place, it is now generally accepted that a system of raising revenue must be in accord with the general objectives of Government economic policy. In the final analysis, any system of Government finance, embracing both expenditure and the raising of revenue, must be designed to achieve the economic objectives of growth, a high level of employment, price stability and external balance of payments in an efficient manner, tempered by the prevailing views about freedom and the equitable distribution of income.
The central government, by budgeting for a surplus (revenue exceeding expenditure) or a deficit, or by varying the impact of taxation on the level of Government expenditure on certain sectors of the economy, is able to regulate internal economic activity.
STRUCTURE OF THE PUBLIC ACCOUNTS—The general structure of the public accounts is in the form established by the Public Finance Act 1977 effective from 1 April 1978. The public accounts comprise 6 accounts in place of the 7 which formerly appeared. These 6 are as follows:
Consolidated Account and National Roads Fund—Before the coming into force of the Public Finance Act 1977 there were 3 general accounts: the Consolidated Revenue Account (now renamed the Consolidated Account), the National Roads Fund (non-trading account), and the Works and Trading Account.
All taxation is credited to either the Consolidated Account or the National Roads Fund. The Consolidated Account also receives most miscellaneous revenues, and ordinary Government expenditure is debited to it. Previously the Works and Trading Account received all the trading revenues of the trading enterprises within the Public Account, met their operating costs and capital expenditure, and also met the expenditure by administrative departments on capital works such as water and soil conservation, the development of natural resources, airports, some roading, and public buildings. The funds available in the Works and Trading Account for works were supplemented by transfers from the National Development Loans Account (now the Loans Account), capital equipment credit arrangements, and contributions from the Consolidated Account.
Under the Public Finance Act 1977 the basic form of the public accounts was changed by the abolition of the Works and Trading Account. This was accomplished by providing separate bank accounts outside the Public Account for the Ministry of Energy (in respect of the trading activities of the Electricity Division and the State Coal Mines) and the Railways Department, and transferring the remaining activities to the Consolidated Account.
The National Roads Fund was retained unchanged under the restructuring. Highways taxation is credited to the National Roads Fund, which meets both capital and maintenance expenditure on roading, but a proportion of the motor spirits duty and the mileage tax is credited to the Consolidated Account.
Loans Accounts—There are 2 loan accounts, the Loans Account and the Loans Redemption Account. The Loans Account receives loan money raised for works and development. A proportion of this is transferred to the Consolidated Account, and most of the balance is advanced by way of capital to the Housing Corporation, the Post Office, New Zealand Railways, the Ministry of Energy, and other State enterprises outside the public account.
Money received into the Loans Redemption Account includes an annual contribution from the Consolidated Account towards the repayment of the public debt, the proceeds of every issue of Treasury bills, and money borrowed for the purpose of repaying or converting loans to the Crown. The main purpose of the account is the repayment or conversion of loans, but money not required for these purposes may be transferred to the Loans Account.
Reserve Account and Trust Account—Any money in the Consolidated Account regarded as surplus to the immediate requirements of the account may be transferred to the Reserve Account and invested in New Zealand or overseas. The Minister of Finance has authority to realise these investments and re-transfer the proceeds to the Consolidated Account at his discretion.
Money held in trust or awaiting disposal is paid into the Trust Account. Funds in the Trust Account may be invested in Government or other approved securities.
Suspense Account—In addition to these 6 accounts there is a Suspense Account. This is simply a holding account for receipts banked to the credit of the Public Account but not yet allocated to 1 of the 6 accounts.
Financial Year—The financial year commences on 1 April and ends on 31 March. The expenditure of public money is authorised by an annual Appropriation Act, which lapses at the end of the financial year. However, the Minister of Finance is authorised to pay money for services for a period of 3 months from the commencement of the next financial year, pending the granting of supplies by Parliament.
GOVERNMENT EXPENDITURE—The following table shows gross Government expenditure and the net amount of expenditure which requires financing from the Public Account. The functional classification is intended to focus attention on the broad areas in the economy in which there is substantial Government activity. Figures for the latest year are included in the Latest Statistical Information section at the back of the Yearbook.
It is to be remembered that the Public Account as shown in this section is prepared on a receipts and payments (cash) basis, and consequently the accounts of the operations of various departments (prepared on an accrual basis) shown in other sections will differ to some extent from those appearing here.
The functional classification of Government expenditure is shown in the following table. Fuller explanations of some items is given with the similar table in the Budget (Parl. paper B. 6).
| Item | 1980–81 | 1981–82 | 1982–83 | |||
|---|---|---|---|---|---|---|
| Cross | Net* | Gross | Net* | Gross | Net* | |
* Net expenditure is generally arrived at by deducting trading and departmental receipts from gross expenditure. †Includes increases in the imprest accounts of $15.7 million in 1 1980–81 and $12.5 million in 1981–82, and a decrease of $4.3 million in 1982–83. | ||||||
| $(million) | ||||||
| Administration— | ||||||
| General administration | 327.5 | 290.2 | 406.1 | 359.1 | 393.5 | 333.6 |
| Law and order | 251.9 | 208.8 | 303.0 | 253.5 | 325.8 | 266.3 |
| Government services | 176.1 | 136.3 | 220.0 | 162.9 | 245.3 | 195.3 |
| Miscellaneous services | 47.1 | 10.4 | 55.2 | 12.2 | 63.4 | 14.1 |
| Stabilisation | 140.1 | 140.1 | 126.5 | 126.5 | 23.2 | 23.2 |
| 942.7 | 785.8 | 1,110.8 | 914.2 | 1,051.2 | 832.5 | |
| Foreign relations— | ||||||
| Defence | 455.9 | 446.4 | 593.7 | 581.1 | 652.1 | 644.1 |
| Foreign Affairs | 135.5 | 131.5 | 142.7 | 138.8 | 169.0 | 164.1 |
| 591.4 | 577.9 | 736.4 | 719.9 | 821.1 | 808.2 | |
| Development of industry— | ||||||
| Land use | 616.7 | 362.4 | 817.3 | 531.2 | 992.8 | 687.7 |
| Fuel and power | 750.6 | 136.4 | 961.6 | 247.6 | 1,187.3 | 282.6 |
| Other industrial services | 307.7 | 298.3 | 423.8 | 404.8 | 488.9 | 459.5 |
| 1,675.0 | 797.1 | 2,202.7 | 1,183.6 | 2,669.0 | 1,429.8 | |
| Education— | ||||||
| Education | 1,302.3 | 1,292.0 | 1,503.9 | 1,493.2 | 1,652.4 | 1,638.8 |
| Social services— | ||||||
| Social Welfare | 2,540.6 | 2,524.3 | 2,991.0 | 2,972.6 | 3,700.2 | 3,673.3 |
| Other social services | 128.4 | 65.4 | 137.6 | 69.7 | 135.7 | 70.9 |
| 2.669.0 | 2.589.7 | 3,128.6 | 3,042.3 | 3,835.9 | 3,744.2 | |
| Health— | ||||||
| Health | 1,358.2 | 1,356.3 | 1,603.1 | 1,601.2 | 1,767.9 | 1,766.1 |
| Transport and communications— | ||||||
| Transport | 864.6 | 329.4 | 1,054.3 | 401.3 | 597.5 | 491.9 |
| Communications | 749.6 | 3.2 | 900.6 | 59.3 | 1,053.2 | 3.7 |
| 1,614.2 | 332.6 | 1,954.9 | 460.6 | 1,650.7 | 495.6 | |
| Debt services and miscellaneous— | ||||||
| Debt services | 896.9 | 896.9 | 1,211.0 | 1,211.0 | 1,492.6 | 1,492.6 |
| Miscellaneous investment transactions | 91.7 | 94.0† | 154.8 | 164.0† | 94.6 | 56.8† |
| Miscellaneous financing transactions | 411.1 | 411.1 | 406.5 | 406.5 | 407.9 | 407.9 |
| 1,399.7 | 1,402.0 | 1,772.3 | 1,781.5 | 1,995.1 | 1,957.3 | |
| Total | 11,552.5 | 9,133.4 | 14,012.7 | 11,196.5 | 15,443.3 | 12,672.5 |
The following table shows Government expenditure and how it is financed.
| Item | 1980–81 | 1981–82 | 1982–83 | |||
|---|---|---|---|---|---|---|
* Net expenditure as in previous table. †Includes the sale by the Reserve Bank of $9.5 million of Government securities in 1980–81, the purchase of $554.5 million of securities in 1981–82, and the sale of $480.6 million of securities in 1982–83. ‡Excludes suppliers' credit and currency realignment adjustments. | ||||||
| Expenditure*— | $(million) | |||||
| Administration | 785.8 | 914.2 | 832.5 | |||
| Foreign relations | 577.9 | 719.9 | 808.2 | |||
| Development of industry | 797.1 | 1,183.6 | 1,429.8 | |||
| Education | 1,292.0 | 1,493.2 | 1,638.8 | |||
| Social services | 2,589.7 | 3,042.3 | 3,744.2 | |||
| Health | 1,356.3 | 1,601.2 | 1,766.1 | |||
| Transport and communications | 332.6 | 460.6 | 495.6 | |||
| Debt services and miscellaneous investment transactions | 990.9 | 1,375.0 | 1,549.4 | |||
| Subtotal | 8,722.3 | 10,790.0 | 12,264.6 | |||
| Miscellaneous financing transactions | 411.1 | 406.5 | 407.9 | |||
| Total expenditure | 9,133.4 | 11,196.5 | 12,672.5 | |||
| Financed from— | ||||||
| Taxation— | ||||||
| Income tax | 5,298.9 | 6,514.7 | 7,455.5 | |||
| Customs, sales tax, and beer duty | 1,189.2 | 1,633.5 | 1,872.7 | |||
| Highways tax | 189.3 | 211.6 | 233.0 | |||
| Motor spirits tax | 139.5 | 147.2 | 184.4 | |||
| Other taxation | 233.9 | 291.0 | 351.9 | |||
| Total taxation | 7,050.8 | 8,798.0 | 10,097.5 | |||
| Interest, profits, and miscellaneous receipts | 557.7 | 580.2 | 808.1 | |||
| Total taxation, interest, etc. | 7,608.5 | 9,378.2 | 10,905.6 | |||
| Amount to be financed from borrowing | 1,524.9 | 1,818.3 | 1,766.9 | |||
| Borrowing in New Zealand† | 821.1 | 2,274.7 | 3,974.9 | |||
| Less repayments in New Zealand | 253.3 | 1,062.6x | 2,290.9 | |||
| 567.8 | 1,212.1x | 1,684.0 | ||||
| Plus sales (less purchases) of investments | +207.0 | – | −555.4 | |||
| Net borrowing in New Zealand | +774.8 | +1,212.1x | +1,128.6 | |||
| Internal surplus (+) deficit (–) | −750.1 | −606.2x | −638.3 | |||
| Borrowing overseas‡ | 1,510.5 | 2,101.4 | 2,797.5 | |||
| Less repayment overseas | 761.2 | 1,342.9x | 1,574.8 | |||
| 749.3 | 758.5x | 1,222.7 | ||||
| Plus sales (less purchases) of overseas investments | +4.5 | −149.3 | −580.9 | |||
| Net borrowing overseas | 753.8 | 609.2x | 641.8 | |||
| Cash surplus (+) deficit (–) | +3.7 | +3.0 | +3.5 | |||
The following table shows details of expenditure from the principal public account, the Consolidated Account. Most of the revenue of the Consolidated Account is derived from taxation. This is shown in detail in the next section, 27B Public Account Taxation.
| Item | Year Ended 31 March | |||
|---|---|---|---|---|
| 1980 | 1981 | 1982 | 1983 | |
* Net figure after deduction of receipts for revolving fund. †Programme V Electoral. From 1 April 1980 the cost of preparing the electoral rolls has been incorporated in the Post Office vote. Previously it was part of the Justice vote. | ||||
| Permanent appropriations— | $(thousand) | |||
| Under Special Acts, Legislature— | ||||
| Civil List | 3,336 | 4,145 | 4,787 | 4,900 |
| Debt services— | ||||
| Interest | 757,793 | 891,497 | 1,202,928 | 1,475,792 |
| Transfer to Loans Redemption Account | 60,000 | 103,464 | 116,171 | 143,814 |
| Administration and management | 7,831 | 4,904 | 8,112 | 16,822 |
| Total—Debt services | 825,624 | 999,865 | 1,327,211 | 1,636,428 |
| Superannuation | 59,511 | 75,004 | 89,583 | 68,975 |
| Miscellaneous | 77,275 | 59,792 | 51,540 | 52,001 |
| Total—Permanent appropriations | 965,746 | 1,13,806 | 1,473,121 | 1,762,304 |
| Annual appropriations— | ||||
| General Administration— | ||||
| Vote— | ||||
| Accident Compensation | 45 | 51 | 99 | 105 |
| Audit | 3,650 | 4,391 | 5,070 | 5,708 |
| Broadcasting | 131 | 134 | 155 | 180 |
| Building Performance Guarantee Corporation | 14 | 15 | 18 | 19 |
| Commission for the Environment | 628 | 750 | 995 | 1,061 |
| Customs | 16,882 | 22,474 | 26,472 | 31,015 |
| Inland Revenue | 39,135 | 49,346 | 60,752 | 67,663 |
| Internal Affairs | 57,085 | 63,710 | 75,473 | 71,641 |
| Legislative | 9,421 | 10,563 | 10,385 | 12,362 |
| Prime Minister's Department | 1,141 | 1,399 | 1,605 | 1,840 |
| Railways | – | – | – | 105 |
| State Services Commission | 52,133 | 61,492 | 82,221 | 85,039 |
| Statistics | 10,492 | 12,898 | 24,255 | 16,995 |
| Treasury | 8,738 | 10,384 | 12,135 | 12,842 |
| Valuation | 8,624 | 10,688 | 12,298 | 13,300 |
| Total—General administration | 208,119 | 248,295 | 311,933 | 319,875 |
| Law and order— | ||||
| Vote— | ||||
| Crown Law | 906 | 1,267 | 1,867 | 2,201 |
| Justice | 84,018 | 103,107 | 121,650 | 130,702 |
| Police | 110,797 | 139,400 | 169,374 | 181,223 |
| Security Intelligence Service | 2,215 | 3,341 | 3,879 | 4,426 |
| Total—Law and order | 197,936 | 247,115 | 296,770 | 318,552 |
| Government services— | ||||
| Vote— | ||||
| Government Printing Office | 28,256 | 33,171 | 35,141 | 6,545* |
| Works and Development | 114,671 | 142,884 | 179,052 | 204,130 |
| Total—Government services | 142,927 | 176,055 | 214,193 | 210,675 |
| Stabilisation— | ||||
| Vote— | ||||
| Stabilisation | 158,618 | 127,639 | 126,494 | 23,241 |
| Total—Administration | 707,600 | 799,104 | 949,390 | 872,340 |
| Foreign relations— | ||||
| Defence— | ||||
| Defence | 346,091 | 455,939 | 593,647 | 652,131 |
| Foreign Affairs— | ||||
| Foreign Affairs | 112,624 | 135,199 | 142,531 | 168,662 |
| Total—Foreign relations | 458,715 | 591,138 | 736,178 | 820,793 |
| Development of industry— | ||||
| Land use— | ||||
| Agriculture and Fisheries | 228,513 | 242,702 | 328,681 | 526,325 |
| Forest Service | 152,835 | 193,877 | 236,084 | 258,833 |
| Lands and Survey | 87,897 | 111,349 | 124,426 | 131,357 |
| Maori Affairs | 43,032 | 32,045 | 31,467 | 33,595 |
| Rural Banking and Finance Corporation | 10,037 | 11,514 | 15,547 | 14,564 |
| Total—Land use | 522,314 | 591,487 | 736,205 | 964,674 |
| Fuel and power— | ||||
| Energy | 32,143 | 102,944 | 178,508 | 188,877 |
| Other industrial services— | ||||
| Trade and Industry | 28,480 | 50,946 | 69,172 | 72,963 |
| Labour | 162,314 | 169,935 | 252,070 | 300,753 |
| Scientific and Industrial Research | 55,478 | 68,877 | 82,192 | 94,393 |
| Tourist and Publicity | 13,467 | 15,484 | 19,254 | 19,9,38 |
| Total—Other industrial services | 259,739 | 305,242 | 422,688 | 488,047 |
| Total—Development of industry | 814,196 | 999,673 | 1,337,401 | 1,641,598 |
| Education— | ||||
| Education | 1,019,475 | 1,302,324 | 1,503,860 | 1,652,373 |
| Social services— | ||||
| Housing Corporation | 63,131 | 68,137 | 73,777 | 72,737 |
| Social Welfare | 2,110,904 | 2,540,567 | 2,990,994 | 3,700,258 |
| Maori Affairs | 16,373 | 21,069 | 26,420 | 27,712 |
| Internal Affairs | 6,374 | 6,601 | 7,820 | 6,733 |
| Total—Social services | 2,196,782 | 2,636,374 | 3,099,011 | 3,807,440 |
| Health— | ||||
| Health | 1,137,536 | 1,358,026 | 1,603,118 | 1,767,751 |
| Transport and communications— | ||||
| Transport— | ||||
| Roads, etc. | 26,862 | 23,854 | 41,810 | 41,762 |
| Transport | 118,358 | 130,882 | 148,438 | 282,632 |
| Post Office† | 6,649 | 7,213 | 4,989 | |
| Total—Transport and communications | 145,220 | 161,385 | 197,461 | 329,383 |
| Total—Annual appropriations | 6,479,524 | 7,848,024 | 9,426,419 | 10,891,678 |
| Unauthorised expenditure | 3,850 | 17,323 | 50,000 | 130 |
| Transfer to Reserve Account | 80,000 | – | 100,000 | 308,500 |
| Capital losses on investments (net) | Cr.684 | – | – | |
| Exchange differences on overseas transaction | Cr. 11,004 | 74,304 | 29,711 | |
| Total payments | 7,529,120 | 8,992,465 | 11,123,844x | 12,992,323 |
LOANS ACCOUNT—Particulars of receipts and payments of the Loans Account were as follows:
| Item | Year Ended March | ||
|---|---|---|---|
| 1981 | 1982 | 1983 | |
* Includes Inflation Adjusted Savings Bonds of $148,263,000 in 1980–81, $114,114,000 in 1981–82, and $396,962,000 in 1982–83. †Includes capital equipment credit arrangements. ‡The principal features of the “tap” issue method of selling Government stock are that each issue remains open for subscription for up to 6 months, and that the issue price is adjusted monthly so that the yield reflects the period to maturity for which stock is actually held. | |||
| Receipts | $(thousand) | ||
| Loans raised— | |||
| In New Zealand* | 917,723 | 1,675,435 | 2,973,846 |
| Overseas† | 1,570,248 | 2,136,184 | 2,341,271 |
| Loans subscriptions unallocated | – | – | 211 |
| International Finance Agreements Act 1961— | |||
| Non-negotiable, non-interest-bearing stock and notes issued to international financial institutions | 174,067 | 4,410 | 51,885 |
| Premiums on “tap” issues‡ | 56 | 595 | 216 |
| Securities issued: Reserve Bank indemnity | – | 207,761 | 391,089 |
| Total receipts | 2,662,094 | 4,024,385 | 5,758,518 |
| Excess of payments over receipts | 536 | 9,302 | – |
| 2,662,630 | 4,033,687 | 5,758,518 | |
| Payments | |||
| Permanent appropriations— | |||
| Subscriptions—ADB | 944 | 1,057 | – |
| —IBRD | 50 | 321 | 370 |
| —IMF | 37,838 | – | 3 |
| Encashment of securities—ADB | 830 | 1,200 | 6,230 |
| —IBRD | 100 | 50 | 100 |
| —IMF | – | 55,000 | – |
| Charges and expenses of raising loans—new issues | 8,782 | 19,009 | 24,863 |
| —discounts on tap issues | – | 10,229 | 51,049 |
| Total, permanent appropriations | 48,544 | 86,866 | 82,615 |
| Annual appropriations— | |||
| Development of industry— | |||
| Energy | 112,071 | 168,697 | 252,842 |
| Social services— | |||
| Housing corporation | 32,500 | 29,300 | 28,400 |
| Transport and communications— | |||
| Railways | 45,313 | 76,023 | – |
| Post Office | – | 54,000 | – |
| 45,313 | 130,023 | – | |
| Miscellaneous investment and financing transactions— | |||
| Capital participation— | |||
| Air New Zealand Ltd. | 17,800 | 54,200 | – |
| Alliance Textiles Ltd. | 1,000 | – | 19,250 |
| Development Finance Corporation | 10,000 | – | – |
| Export-Import Corporation | 6,251 | – | – |
| New Zealand Steel Development Ltd. | 1,950 | 540 | 24,115 |
| Petroleum Corporation of New Zealand Ltd. | 5,316 | 17,907 | 40,775 |
| Shipping Corporation of New Zealand Ltd. | 8,000 | 7,000 | – |
| Tourist Hotel Corporation | 1,190 | 1,372 | 3,190 |
| Winstone-Samsung Industries Ltd. | – | 15,000 | – |
| Miscellaneous financing transactions— | |||
| Housing Corporation | 164,328 | 72,500 | 120,880 |
| Rural Banking and Finance Corporation | 246,800 | 334,000 | 287,000 |
| Total, annual appropriations | 652,519 | 830,539 | 776,452 |
| Loan receipts from previous year allocated | 31,455 | 16 | – |
| Capital equipment purchased under credit arrangements | 60,045 | 41,095 | 67,759 |
| Transfer to consolidated account | 956,000 | 1,281,000 | 1,500,000 |
| Transfer to loans redemption account | 740,000 | 1,582,000 | 2,880,000 |
| Reserve Bank indemnity | – | 207,761 | 391,089 |
| Security in favour of— | |||
| Asian Development Bank (ADB) | 1,362 | 1,540 | – |
| International Bank for Reconstruction and Development (IBRD) | 447 | 2,870 | 3,331 |
| International Monetary Fund (IMF) | 172,258 | – | 48,554 |
| Total payments | 2,662,630 | 4,033,687 | 5,749,800 |
| Excess of receipts over payments | – | – | 8,718 |
| 2,662,630 | 4,033,687 | 5,758,518 | |
WORKS PROGRAMME AND ROADING EXPENDITURE—Details of the works programme and roading expenditure are shown in the following table.
| Item | Year Ended 31 March | |||
|---|---|---|---|---|
| 1980 | 1981 | 1982 | 1983 | |
| * Provision mainly for Clutha Valley development for hydroelectric purposes. | ||||
| Administration— | $(million) | |||
| Works— | ||||
| National water and soil conservation | 26.8 | 40.8 | 48.2 | 52.4 |
| Development of natural resources* | 3.8 | 2.9 | 8.2 | 9.9 |
| Public buildings— | ||||
| Government services | 12.5 | 16.4 | 17.6 | 22.2 |
| Law and order | 13.4 | 15.9 | 16.8 | 19.4 |
| Miscellaneous | 12.6 | 9.5 | 11.7 | 13.6 |
| Total | 69.1 | 85.5 | 102.5 | 117.5 |
| Foreign relations— | ||||
| Defence | 9.0 | 11.3 | 15.4 | 18.8 |
| Public buildings—overseas posts | 1.3 | 1.6 | 2.3 | 3.2 |
| Total | 10.3 | 12.9 | 17.7 | 22.0 |
| Development of industry— | ||||
| Energy | 249.9 | 246.6 | 279.3x | 296.8 |
| Forestry | 10.8 | 14.9 | 19.7 | 19.8 |
| Land utilisation | 11.6 | 15.7 | 19.4 | 21.5 |
| Tourism | 2.9 | 2.4 | 2.3 | 3.8 |
| Miscellaneous | 5.8 | 7.5 | 8.7 | 11.1 |
| Total | 281.0 | 287.1 | 329.4x | 353.0 |
| Education— | ||||
| Primary, secondary, and special education— | ||||
| Buildings | 67.1 | 75.6 | 76.7 | 75.6 |
| Tertiary education— | ||||
| University buildings | 24.7 | 23.3 | 23.9 | 25.0 |
| Technical institutes | 10.3 | 12.3 | 14.6 | 18.6 |
| Teachers colleges | 3.0 | 2.2 | 2.3 | 0.8 |
| Total | 105.1 | 113.4 | 117.5 | 120.0 |
| Social services— | ||||
| Housing construction | 43.1 | 34.8 | 26.1 | 32.5 |
| Public building—social welfare | 2.7 | 2.7 | 3.4 | 2.9 |
| Total | 45.8 | 37.5 | 29.5 | 35.4 |
| Health— | ||||
| Health and hospital buildings | 7.2 | 6.8 | 7.0 | 6.7 |
| Transport and communications— | ||||
| Railways | 20.6 | 19.9 | 23.5 | 22.7 |
| Roading | 173.8 | 215.6 | 254.2 | 280.6 |
| Transport | 5.7 | 3.6 | 3.3 | 3.2 |
| Post Office | 60.5 | 65.4 | 88.9 | 128.1 |
| Broadcasting | 1.0 | 1.7 | 1.3 | 0.9 |
| Total | 261.6 | 306.2 | 371.2 | 435.5 |
| Grand total | 780.1 | 849.4 | 974.8x | 1,090.1 |
NATIONAL ROADS FUND—The National Roads Act 1953 established a National Roads Fund within the Public Account, the revenue of the fund being derived mainly from motor taxation together with an annual contribution from the Consolidated Account. Expenditure from the fund is for the purpose of developing State highways to modern standards and of subsidising the roading programmes of local authorities.
Receipts and payments of the National Roads Fund in recent years were as follows:
| Item | Year Ended 31 March | |||
|---|---|---|---|---|
| 1980 | 1981 | 1982 | 1983 | |
| $(thousand) | ||||
| Receipts | ||||
| Motor spirits duty (less refunds) | 87,771 | 120,540 | 129,000 | 132,786 |
| Road user charges | 51,234 | 68,370 | 82,533 | 96,948 |
| Other taxation, etc. | 137 | 60 | 20 | 3,223 |
| Contribution from Consolidated Account | 24,000 | 16,000 | 35,000 | 34,000 |
| Miscellaneous | 4,963 | 4,550 | 5,252 | 5,358 |
| Interest | 82 | 115 | 179 | 221 |
| Excess of payments over receipts | 3,027 | – | – | 548 |
| Total | 171,214 | 209,635 | 251,984 | 273,084 |
| Payments | ||||
| State highways maintenance | 50,892 | 68,140 | 81,356 | 95,980 |
| State highways construction | 35,686 | 40,489 | 45,498 | 43,972 |
| Subsidies to local authorities | 68,790 | 83,412 | 99,066 | 109,715 |
| Administration and general expenses | 15,841 | 16,909 | 21,713 | 23,414 |
| Unauthorised expenditure | 5 | 2 | 4 | 3 |
| Excess of receipts over payments | – | 683 | 4,347 | – |
| Total | 171,214 | 209,635 | 251,984 | 273,084 |
| Balance at end of year | 3,982 | 4,665 | 9,012 | 8,464 |
SUMMARY OF BALANCES—A summary of the balances in the Public Accounts is given in the following table.
| Account | Balance at 31 March | |||
|---|---|---|---|---|
| 1980 | 1981 | 1982 | 1983 | |
| * Cash received but not yet allocated. | ||||
| $(thousand) | ||||
| Consolidated Account | 69,446 | 71,196 | 83,621 | 104,113 |
| Loans Redemption Account | 255,150 | 129,877 | 143,571 | 999,753 |
| Loans Account | 69,151 | 68,615 | 59,313 | 68,031 |
| National Roads Fund | 3,982 | 4,665 | 9,012 | 8,464 |
| Reserve Account | 185,615 | 119,327 | 250,336 | 506,014 |
| Suspense Account* | 255 | 1 | 197 | 426 |
| Trust Account | 30,242 | 28,083 | 40,583 | 35,272 |
| Total | 613,841 | 421,764 | 586,633 | 1,722,073 |
The composition of the total balances is shown in the following table.
| Nature | At 31 March | |||
|---|---|---|---|---|
| 1980 | 1981 | 1982 | 1983 | |
| $(thousand) | ||||
| Cash | 81,329 | 85,037 | 88,050 | 91,509 |
| Imprests | 53,570 | 69,275 | 81,811 | 77,493 |
| Investments in New Zealand | 212,966 | 5,967 | 6,109 | 561,547 |
| Investments overseas | 265,976 | 261,485 | 410,663 | 991,524 |
| Total | 613,841 | 421,764 | 586,633 | 1,722,073 |
A summary of income tax revenue and total public account taxation revenue in the aggregate and per head of mean population is given for a series of years in the following table. The total taxation figures include taxation revenue paid into both the Consolidated Fund and the National Road Fund.
| Year Ended 31 March | Income Tax | Total Public Account Taxation | |||
|---|---|---|---|---|---|
| Amount | Percentage of Total Taxation (All Sources) | Amount | |||
| Total | Per Head of Mean Population | Total | Per Head of Mean Population | ||
| $(million) | $ | % | $(million) | $ | |
| 1970 | 779.2 | 279.39 | 66.0 | 1,181.0 | 423.46 |
| 1975 | 2,136.0 | 701.01 | 74.5 | 2,865.3 | 940.37 |
| 1978 | 3,482.8 | 1,113.10 | 75.3 | 4,626.3 | 1,478.57 |
| 1979 | 3,655.2 | 1,168.09 | 73.3 | 4,989.5 | 1,594.50 |
| 1980 | 4,465.6 | 1,429.10 | 74.2 | 6,020.0 | 1,926.52 |
| 1981 | 5,298.9 | 1,683.96 | 75.2 | 7,050.5 | 2,240.59 |
| 1982 | 6,514.7 | 2,060.25 | 74.0 | 8,798.0 | 2,782.33x |
| 1983 | 7,455.5 | 2,335.54 | 73.8 | 10,097.5 | 3,163.17 |
The following table shows receipts of taxation, under the various heads, during 5 recent years. Figures for the latest year are included in the Latest Statistical Information section at the back of the Yearbook.
| Item | Revenue for Year Ended 31 March | ||||
|---|---|---|---|---|---|
| 1979 | 1980 | 1981 | 1982 | 1983 | |
* Additional to portions paid into National Roads Fund. †Ceased 30 June 1979. Replaced by International Departure Tax. | |||||
| $(million) | |||||
| Consolidated Account— | |||||
| Direct taxation— | |||||
| Income tax | 3,655.2 | 4,465.6 | 5,298.9 | 6,514.7 | 7,455.5 |
| Estate and gift duty | 53.1 | 49.7 | 39.1 | 32.4 | 31.8 |
| Land tax | 9.5 | 10.7 | 11.6 | 33.8 | 34.4 |
| Property speculation tax | 0.1 | – | – | – | – |
| Total, direct taxation | 3,717.8 | 4,526.1 | 5,349.6 | 6,580.9 | 7,521.8 |
| Indirect taxation— | |||||
| Customs duty | 286.1 | 331.6 | 349.3 | 475.1 | 511.8 |
| Beer duty | 58.9 | 58.2 | 64.3 | 74.3 | 149.1 |
| Motor spirits tax (less refunds)* | 153.9 | 177.2 | 139.5 | 147.2 | 184.4 |
| Motor vehicles fees and charges | 45.7 | 45.6 | 46.5 | 46.7 | 86.1 |
| Sales tax | 449.7 | 624.1 | 775.6 | 1,084.1 | 1.211.7 |
| Film-hire tax | 1.0 | 0.7 | 0.9 | 1.1 | 1.2 |
| Mileage tax* | 0.3 | 0.4 | – | – | – |
| Racing taxation | 38.5 | 42.8 | 46.1 | 51.0 | 57.0 |
| Foreign travel tax† | 15.9 | 9.3 | – | – | – |
| International departure tax | 6.3 | 12.4 | 14.4 | 14.7 | |
| Domestic air travel tax | 3.4 | 8.5 | 10.6 | ||
| Energy resources levy | 28.9 | 18.6 | 19.6 | 24.2 | 40.2 |
| Stamp Duties— | |||||
| On instruments | 26.2 | 30.5 | 39.6 | 59.3 | 54.8 |
| On cheques, etc. | 3.5 | 3.7 | 8.3 | 13.0 | 14.0 |
| Lottery duty | 3.9 | 5.5 | 6.4 | 6.8 | 6.9 |
| Total, indirect taxation | 1,112.5 | 1,354.4 | 1,511.9 | 2,005.6 | 2,342.7 |
| Total taxation receipts to Consolidated Account | 4,830.4 | 5,880.5 | 6,861.5 | 8,586.5 | 9,864.5 |
| National Roads Fund— | |||||
| Highways revenue (less rebate) | 159.1 | 139.5 | 189.0 | 211.6 | 232.9 |
| Total public account taxation | 4,989.5 | 6,020.0 | 7,050.5 | 8,798.0 | 10,097.5 |
A comparison of public account taxation revenue and national disposable income is afforded by the following table, which also shows taxation as a percentage of national disposable income.
| Year | National Disposable Income | Public Account Taxation | |
|---|---|---|---|
| Total | Percentage of National Disposable Income | ||
| * Provisional. | |||
| $(million) | percent | ||
| 1978–79 | 15,751x | 4,989.5 | 31.7 |
| 1979–80 | 19,179x | 6,020.0 | 31.4x |
| 1980–81 | 22,214x | 7,050.5 | 31.7x |
| 1981–82 | 26,680x | 8,798.0 | 33.0x |
| 1982–83 | 29,278* | 10,097.5 | 34.5 |
CUSTOMS AND EXCISE TAXATION—Revenue under the heading of Customs does not include receipts from motor spirits tax paid into the National Roads Fund. The following table shows customs and excise revenue, for ordinary revenue purposes, for the latest available 5 years.
| Year Ended 31 March | Customs and Excise Duties* | Beer Duty | Total Customs and Excise Duties | Proportion of Total Taxation |
|---|---|---|---|---|
* Including Foreign Fishing Vessel Entry Tax but excluding Beer Duty. †Sales Tax on beer abolished and replaced with increased rates of beer duty from 5 August 1982. | ||||
| $(thousand) | percent | |||
| 1979 | 286,129 | 58,853 | 344,982 | 6.9 |
| 1980 | 331,622 | 58,159 | 389,781 | 6.5 |
| 1981 | 349,320 | 64,283 | 413,603 | 5.9 |
| 1982 | 475,091 | 74,338 | 549,429 | 6.2 |
| 1983 | 511,844 | 149,138† | 660,982 | 6.5 |
Information in regard to Customs and excise duties generally is contained in Section 23D, Customs Tariff and Revenue.
ROADS TAXATION—Prior to 31 March 1978 the National Roads Fund derived its revenues from a tax on motor spirits, heavy traffic licence fees, and a mileage tax on vehicles not using motor spirits. From 1 April 1978 Road User Charges replaced Heavy Traffic Licence Fees and Mileage Tax. Other revenues of the fund, which are not classed as taxation, consist of a Government contribution, interest earned, and miscellaneous receipts—e.g., from the sale of materials, etc. For 1968–69, tax on petrol paid to the fund was 14.8c per gallon. From 1 April 1969 the rate was increased to 17.1c per gallon by the transfer to the fund of 2.3c per gallon previously credited to the Consolidated Revenue Account, and from 1 April 1971 to 18.1c per gallon by the transfer of a further 1c a gallon. From 1 April 1978 tax paid to the fund was reduced to 4.25c per litre, this was increased to 6c per litre from 1 April 1980, and 6.4c per litre from October 1982.
The Local Government Act 1974 authorised territorial local authorities to levy a local authorities petroleum tax on motor spirits and diesel fuel. The proceeds of any tax imposed are distributed among the constituent local authorities according to their proportions of total rate revenue. This legislation was designed to spread the rating burden of taxpayers. The maximum tax rate permissible is, at present, 0.66 cents per litre on motor spirits, and 0.33 cents per litre on diesel fuel.
A tax on compressed natural gas (CNG) was imposed from 1 April 1982 initially at the rate of $1.74 per gigajoule, and later increased to $1.86 per gigajoule.
Liquefied petroleum gas (LPG) was also taxed from October 1982 at the rate of 4.93 cents per litre.
Taxation receipts for roads purposes paid into the National Roads Fund have been as follows during the latest 4 years. Refunds have been deducted.
| Year Ended 31 March | Motor Spirits Duty* | CNG/LPG | Heavy-traffic and other Fees | Road User Charges | Total |
|---|---|---|---|---|---|
| * Less rebates and collection expenses. | |||||
| $(000) | |||||
| 1980 | 87,470 | – | – | 51,234 | 138,704 |
| 1981 | 120,193 | – | – | 68,370 | 188,563 |
| 1982 | 128,535 | – | – | 82,533 | 211,068 |
| 1983 | 131,958 | 3,200 | 909 | 96,948 | 233,015 |
SYSTEM OF TAXATION—The following precis of the New Zealand tax system takes into account all relevant amending legislation effective up to the year ended 31 March 1984.
Income tax is levied under the Income Tax Act 1976.
Tax Year—The New Zealand tax year is from 1 April to 31 March.
New Zealand Residents—New Zealand residents are liable to New Zealand tax on all income including income from outside New Zealand. Credit is allowed for any overseas tax paid, but this is limited to the New Zealand tax payable on that income.
A New Zealand resident is defined for tax purposes as a person whose permanent place of abode is in New Zealand. In general where a person is present in New Zealand for a period of not less than 365 days, he or she will be classified as a New Zealand resident throughout that period. Conversely a person absent from New Zealand for a period of not less than 365 days will generally be treated as not resident during that absence.
This means that people who come to New Zealand with the intention of residing permanently or to stay more than 365 days are taxed on their total income from all sources, both inside and outside New Zealand, as from the date of arrival.
Income Tax—Income tax is chargeable on most forms of income received by individuals, companies, and estates.
Income, because of its many forms, is not exhaustively defined, but includes income from the following: property; labour or effort; pensions, estates, and trusts (pensions paid by countries with which New Zealand has a double tax agreement, are generally exempt from tax in the country of origin and subject to tax in New Zealand. If a pension is taxed in the country of origin, credit is allowed in a New Zealand income tax assessment for the overseas tax paid to the extent that it does not exceed New Zealand tax payable on that income); value of benefit allowances received in cash or kind; wages or income (earnings-related compensation) paid by the Accident Compensation Commission where a taxpayer is unable to work because of personal injury or incapacity.
Capital Gains—There is no capital gains tax but certain “gains” are deemed to be income.
These are profits on sale of patent rights, and profits on sale of property (land and buildings). Generally profits from ordinary sales of a person's private residence, business, or farm property, are exempt from tax.
Apart from ordinary sales of a person's residence, business, or farm property, profits on sale of property are subject to income tax where the owner:
—acquires the property for the purpose or intention of resale;
—deals in property;
—is a builder;
—makes a profit which is primarily due to rezoning or likely rezoning;
—subdivides the property within 10 years of purchase;
—subdivides the property more than 10 years after purchase and carries out extensive subdivisional work before selling. (Only the “development profit” is taxable in this case.);
—has been deriving income from the property and has claimed a deduction for interest and/or developmental expenditure. The amount of interest and/or development expenditure recovered on sale is treated as assessable income in the year of sale.
“Pay as You Earn” System—A “Pay as You Earn” (PAYE) system of collecting income tax is used for individuals.
How the PAYE System Works—Income for PAYE purposes falls into 2 general classes—
Salaries and wages and all other forms of remuneration. With these, PAYE tax is deducted at time of payment.
Business, farming, investment, and professional incomes. With these incomes, tax is not deducted at time of receipt but the taxpayer pays “provisional tax”, usually based on the income tax paid for the previous year.
In both cases an adjustment or “square-up” is made when the return of income for the particular year is furnished.
Tax, which is called “terminal tax”, is assessed on the basis of the annual return, and credit is allowed for the tax deductions or provisional tax paid during the year.
If there is an overpayment the taxpayer will receive a refund or credit against future tax—if insufficient tax was paid there will be further tax to pay.
The Tax Code Declaration also incorporates a Tax Deduction Certificate. This is returned to the employee on termination of employment or at the end of the financial year.
The certificate shows the total amount of income earned; tax deducted; extra pays; superannuation deducted; the period of employment; tax free allowances.
This information is used when the employee fills out a tax return at the end of the tax year.
Annual Returns of Income—Most salary and wage earners file tax returns each year and over 70 percent of these receive refunds of overpaid tax.
Refunds can arise as a result of exemptions and rebates being claimed which are not allowed for in the tax code declaration, or being employed for part of the year only.
Most salary and wage earners use the return form IR 5. It is required to be completed and sent to the Inland Revenue Department by 7 June.
Salary and wage earners are assessed on their total taxable income, less any deduction for expenses and special exemptions. Rebates and the taxes previously paid are deducted from the tax assessed to give either a refund or further tax to pay. For more about exemption and rebates see below.
All Other Individuals—Individuals who are self-employed or in partnership or who receive income from investments, pay provisional tax. Provisional tax is payable in instalments—generally in 2 payments, one in September and the other in the following March.
Provisional tax is calculated using as a base the income received during the previous financial year.
Provisional taxpayers use form IR 3 which is to be furnished by 7 September. Expenses are deducted from the gross business or investment income and tax is calculated on the net income less any special exemptions. Credit is given for the provisional tax already paid and for any rebates. If there is an overpayment the taxpayer will receive a refund or credit against future tax. If insufficient tax was paid there will be further tax to pay.
Deductions for Expenses:Persons in Business—Expenses which are incurred in producing income and relevant and incidental to deriving that income, may be claimed as a deduction from income. Expenses of a private, domestic, or capital nature are not deductible.
Salary and Wage Earners—Salary and wage earners may claim 2 percent of salary or wages up to a maximum claim of $52 without receipt. Actual and reasonable income-related expenses which are supported by receipts or other appropriate evidence, may also be claimed on (less any reimbursing allowances paid by employers).
Exempt Income—Income is exempt from tax in New Zealand only if provisions are made in the New Zealand Income Tax Act.
Some of the more common items exempt from tax are the following: maintenance or alimony payments; the first $200 of interest and dividends from all sources; Social Welfare benefits (except the National Superannuation Benefit and the unemployment benefit paid to beneficiaries who do not have a dependent child or children); war pensions and service disability pensions paid by any Government; interest on National Development Bonds (not exceeding $500 in any 1 year); income derived by charitable and certain non-profit organisations; lottery and raffle prizes.
Special Exemptions—Special exemptions are deducted from the income before tax is calculated. The following special exemptions are available for the year ended 31 March 1984.
| Exemption | Amount |
|---|---|
| Life insurance, personal accident and sickness premiums paid for self, wife, or children, and superannuation. | The amount paid or contributed up to a maximum exemption of— $1,200 if a member of an employer-subsidised superannuation fund for the whole year with proportionate increases if a member for only part of the year. |
| $1,400 in other cases. | |
| These amounts take effect from 1 April 1983. Prior to this the amounts were $800 and $1,000. | |
| NOTE: Premiums paid to overseas life insurance companies are allowable. | |
Rebates—Rebates are deducted from the total tax payable. Rebates for the year ended 31 March 1984 are shown in the following table.
| Rebate | Amount |
|---|---|
| * In order to correctly calculate both the principal income earner and family rebates where a person enters or leaves New Zealand, the income derived during that part of the year he or she was resident in New Zealand is grossed up to its full-year equivalent. | |
| Principal income earner* | Allowable to individuals other than children; spouses of principal income earners; national superannuitants; principal income earners eligible for the new family rebate. |
| Individuals whose income is— | |
| Up to (and including) $5,672, qualify for a rebate of 5.5 cents for $1 of income. | |
| Between $5,672 and $12,001, qualify for the maximum rebate of $312. | |
| Over $12,000 and up to $14,600, qualify for a rebate at 12 cents for each $1 of income in excess of $12,000. | |
| Family rebate* | Allowable to the principal income earner of a family with a child for whom the family benefit is paid. It is also available to widows, widowers and other solo parents who are in receipt of the family benefit. |
| The full rebate of $1,664 is claimable where the combined incomes of the spouses do not exceed $9,800 for the year. | |
| Where the combined income is— | |
| Over $9,800 and up to $14,000, the rebate will abate at 15 cents for each $1 of income in excess of $9,800. | |
| Over $14,000 and up to $19,160, the rebate is $1,034 less an abatement of 17.5 cents for each $1 of income in excess of $14,000. | |
| Over $19,160 the rebate is $131, and reduces by 10 cents for each $1 by which the combined incomes exceed $19,160. No rebate is payable for combined incomes of $20,470 and over. | |
| Housekeeper (under certain circumstances) | Limited to the smaller of 31 cents for each complete dollar of payment made or $310. |
| Dependent relative | Limited to the smaller of 31 cents for each complete dollar contributed to the support of a relative, or $60. |
| A maximum of 2 dependants may be claimed. | |
| Rates on owner-occupied homes | A rebate of up to $25 per annum on rates paid to a local authority in respect of an owner-occupied home. The rebate will be allowable on the principal family home only. |
| Special home, farm, or fishing-vessel ownership account | 45 cents for each $1 of annual savings increase in Special Home, or Farm Ownership or Fishing Vessel Ownership Account. |
| Maximum rebateable savings are: Home Ownership—$3,000 per year (rebate $1,350); Farm Ownership—$5,000 per year (rebate $2,250); Fishing Vessel Ownership—$5,000 per year (rebate $2,250). | |
| First home mortgage rebate | A rebate of 31 cents for each dollar of qualifying interest is allowable to first home owners who also occupy the property. The maximum rebate is $1,000 in any 1 year and the rebate is allowable in respect of the first 5 years of ownership. |
| Donations and school fees | 31 percent of all qualifying charitable donations and school fees. The maximum rebate being $200. The minimum qualifying payment for charitable donations is $5. |
Rates of Tax—The following table shows the rates of income tax payable on each dollar of taxable income for the year ending 31 March 1984.
| Taxable Income | Basic Tax Rate* | Basic Tax Rate* (with surtax where applicable) | Total* (including surtax) |
|---|---|---|---|
| * A temporary surtax of 10 percent on the basic tax rates will be applied to income over $24,000 as from 1 October 1982. | |||
| $ | |||
| 0–6,000 | 20.0 | 20.0 | 1,200.00 |
| 6,001–24,000 | 31.3 | 31.3 | 6,825.00 |
| 24,001–30,000 | 41.0 | 45.1 | 9,531.00 |
| 30,001–38,000 | 51.0 | 56.1 | 14,019.00 |
| Over 38,000 | 60.0 | 66.0 | … |
Taxes for Visitors:Who is a Visitor?—Generally a person who comes to New Zealand and intends to stay less than 12 months is taxed as a visitor or non-resident. If he/she stays for a longer period he/she is normally deemed to be a resident for tax purposes. A person not resident in New Zealand is liable to New Zealand tax on income from New Zealand but not on income from outside New Zealand.
How the Visitor is Taxed—A visitor to New Zealand is taxed on income from a New Zealand employer for personal services while in New Zealand; income from an overseas employer for personal services in New Zealand (there are certain exemption periods which are outlined in the following paragraphs); and any other income from New Zealand sources.
Income From a New Zealand Employer—The employer deducts the tax from the salary or wages of a visitor in the same way as for a resident.
Special Exemptions and Rebates Allowable in an Annual Assessment—In an assessment the visitor is allowed a proportion of the rebates allowable to the New Zealand resident. The proportion is based on the amount of time spent working in New Zealand. Visitors are not entitled to claim any special exemptions in respect of life insurance, or superannuation payments.
Income from an Overseas Resident—A visitor (other than a public entertainer) who performs personal (including professional) services in New Zealand for an overseas employer is exempt from New Zealand tax provided:
the length of the visit or visits is not more than 92 days in any income year;
the income received from the performance of those personal services in New Zealand is chargeable with tax in the country where the visitor is normally resident.
Public Entertainers—Public entertainers are subject to a withholding tax of 20 percent on the gross income derived by them. This is a final tax unless the entertainer considers that the true rate will be lower. To be taxed at a lower rate a return of the income received and expenses incurred in New Zealand must be furnished.
Visitors from “Double Tax” Countries—Agreements to avoid double taxation have been entered into between New Zealand and Australia, Belgium, Canada, Denmark, France, Federal Republic of Germany, Fiji, Japan, Malaysia, The Netherlands, Philippines, Singapore, Sweden, Switzerland, the United Kingdom, and the United States of America.
A visitor from 1 of these countries who gets income for personal services in New Zealand from an overseas employer should refer to the relevant agreement. Depending on the circumstances and the terms of the particular agreement, the exemption period of 92 days could be extended.
Non-Residents:Who is an Absentee?—An absentee is a person not resident in New Zealand during and part of the income year, but who derives income from a New Zealand source. An absentee is not entitled to any exemptions or rebates.
Withholding Tax on Non-residents—The Tax Act imposes a withholding tax on the following classes of income derived from New Zealand by non-residents—dividends, interest, and royalties as defined payments.
The rate of tax is 30 percent on the gross payments of dividends, and 15 percent on gross payments of interest and royalties. It is a final tax on dividends, cultural royalties, and on interest except where the borrower and the lender are associated persons. On other royalties, “know how” payments, and interest where the payer and payee are associated persons, it is a minimum tax. A later assessment may be made if the rate of income tax on the income is greater than the withholding tax.
These provisions may be varied by the double tax agreements and the relevant agreement should be referred to.
Capital Brought into New Zealand—Capital brought into New Zealand is free from tax. However income earned from investing that capital is taxable. There is no limit on the amount that may be brought into the country.
Taxation of Companies—Companies in New Zealand are taxed in a different way to individual taxpayers.
The main differences are that—
A company does not get any of the special exemptions or rebates which the individual taxpayer may claim.
A company does not get the interest exemptions.
Dividends received by a company incorporated in New Zealand are exempt from income tax. This exemption does not apply to life insurance companies.
The rate of income tax is different.
New Zealand Companies:Income Tax—Resident companies pay tax on their income at the flat rate of 45 cents in the dollar.
Excess Retention Tax—Privately controlled New Zealand investment companies are liable for an “excess retention tax”.
Excess retention tax is payable if the investment company does not pay a dividend equal to at least 40 percent of its tax-paid profits and 100 percent of its dividends from other companies.
The rate of excess retention tax is 35 cents in the dollar on any “insufficient distribution”.
A refund of excess retention tax paid will be made if, in a later year, the investment company declares a dividend greater than the amount needed for that year.
Special Types of Companies—Differing methods of assessment apply to overseas shipping companies, life insurance companies, and certain types of mining companies.
Non-Resident Companies—Non-resident companies are taxed in the same way as resident companies except that they pay an additional tax of 5 percent of their income on top of the 45 percent rate payable by a resident company. Dividends paid to non-residents are subject to a non-resident withholding tax of 30 percent of the gross income. A withholding tax of 15 percent is payable on interest and royalties. Both of these rates may be limited by the various double tax agreements. This is the final liability except for interest paid between associated persons and royalties (other than “cultural” royalties), when there may be an end-of-year assessment.
These provisions may be varied by a double taxation agreement and the relevant agreement should be referred to. Special concessions apply to non-resident investment companies receiving dividends or interest from approved “development investments”, and processers of minerals to the primary metal stage under a “special development project”.
Incentive Legislation—There are tax incentives to help New Zealand's export drive and to encourage agricultural development, mining, fishing, winemaking, and other industries. Full details of these are obtainable from the Inland Revenue Department.
Land Tax—Land Tax is assessed on the total “land value” of land owned at 31 March each year after allowing any special exemption. Both companies and individual taxpayers are liable to land tax which is due and payable on 7 October each year. The last day for payment is 7 November.
Various types of land, including land used solely or principally for farming or agricultural activities, and various land owners are exempt from land tax.
Special Exemption—The exemption is $175,000 reduced by $1 for every $1 by which the “land value” of the land exceeds $175,000. Thus no exemption is allowable when the “land value” exceeds $350,000.
Rates of Land Tax—Land tax is charged at a flat rate of 2 percent of the taxable land value (land value after exemptions).
Special Adjustments—There are special adjustments for absentee owners and in addition companies and estates can be subject to a special basis of assessment.
Estate Duty—Generally estate duty is a tax on the total net wealth of a deceased person.
The following reliefs have been abolished: widows; widowers; infant children; orphan infant children; and lineal ancestors or lineal descendants in the estates of deceased servicemen.
| Scale of Rates of Estate Duty | |
|---|---|
| Final Balance of Estate | Rate (Note: “Excess” means excess of the final balance in complete dollars) |
| Part A: For deaths from 21 June 1979 to 31 March 1980 | |
| $ | |
| Not exceeding 100,000 | Nil |
| 100,001–250,000 | 35 percent of excess over $100,000 |
| Exceeding 250,000 | $52,500 plus 40 percent of excess over $250,000 |
| Part B: For deaths from 1 April 1980 to 31 March 1981 | |
| Not exceeding 150,000 | Nil |
| 150,001–250,000 | 35 percent of excess over $150,000 |
| Exceeding 250,000 | $35,000 plus 40 percent of excess over $250,000 |
| Part C: For deaths on or after 1 April 1981 | |
| Not exceeding 250,000 | Nil |
| Exceeding 250,000 | 40 percent of excess over $250,000 |
| Part D: For death on or after 1 April 1982 | |
| Not exceeding 300,000 | Nil |
| Exceeding 300,000 | 40 percent of excess over $300,000 |
| Part E: For deaths on or after 1 April 1983 | |
| Not exceeding 350,000 | Nil |
| Exceeding 350,000 | 40 percent of excess over $350,000 |
| Part F: For deaths on or after 1 April 1984 | |
| Not exceeding 450,000 | Nil |
| Exceeding 450,000 | 40 percent of excess over $450,000 |
Special Exemptions from Estate Duty:Joint Family Homes—A home registered under the Joint Family Homes Act 1964 is excluded from the dutiable estate of the first spouse to die.
Matrimonial Home Allowance—Where the deceased had an interest in a matrimonial home (other than a joint family home) that interest is excluded if the home or other property of equivalent value passes to the surviving spouse.
Pensions from Superannuation Funds—These are excluded from the estate up to $2,000 per annum if payable to the deceased's spouse for the rest of his or her life or until remarriage.
Personal Chattels—The value of any furniture and personal effects passing to the surviving spouse is excluded from the dutiable estate. In addition, the first $6,000 of personal chattels passing to any other person is also excluded from the estate.
Charitable Bequests—Bequests to charities of up to $25,000 are exempt from duty.
The leaflet Estate Duty, available from the Inland Revenue Department, supplies more information.
Stamp Duty—Stamp Duty is payable on documents, executed in New Zealand or elsewhere, affecting property situated, or to be situated, in New Zealand.
The rates of duty are shown in the chart below.
| Type of Document | Rate of Duty |
|---|---|
| Transfer of— | |
| Mortgage, debenture, shares, share rights, mining rights | 40 cents for each $100 or part of $100 of the value of the property. |
| All other property, including land | 1 percent for the first $50,000 of the value of the property; 1.5 percent for the excess over $50,000 up to $100,000; 2 percent for the excess over $100,000. |
| Leases— | |
| Rentals | 40 cents for each $100 or part of $100 of 1 year's rent. |
| Deed | $10. |
| Duplicate or counterpart | $1. |
| Cheques (as from 4 July 1980) | 5 cents for each bill of exchange. |
Gift Duty—The scale of rates of gift duty is set out below. It applies to all dutiable gifts made on or after 1 April 1984.
In those cases where gifts made before 1 April 1984 aggregated with gifts made on or after that date, the duty on the gifts made prior to 1 April did not change unless the aggregated figure exceeded $27,000.
The level at which gift statements are required to be filed has been raised to $12,000.
The exemption in section 71 of the Act for small gifts made by a donor in good faith as part of the normal expenditure has increased from $1,000 to $2,000. The exemption applied to all qualifying gifts made on or after 1 April 1984.
For estate duty purposes, however, the $1,000 limit applied to gifts made at any time by any person who died on or after 21 June 1979.
| Value of Item “b” in section 62 | Rate (Note: “Excess” means excess of the value in complete dollars) |
|---|---|
| $ | |
| Not exceeding 27,000 | Nil |
| 27,001–36,000 | 5 percent on excess over $27,000 |
| 36,001–54,000 | $450 plus 10 percent of excess over $36,000 |
| 54,001–72,000 | $2,250 plus 20 percent of excess over $54,000 |
| Exceeding 72,000 | $5,850 plus 25 percent of excess over $72,000 |
The net revenue received from estate duty and gift duty during each of the latest 5 years is given below.
| Year Ended 31 March | Estate Duty | Gift Duty | Total Estate and Gift Duties |
|---|---|---|---|
| $(thousand) | |||
| 1979 | 49,320 | 3,747 | 53,067 |
| 1980 | 47,470 | 2,224 | 49,694 |
| 1981 | 37,217 | 1,787 | 39,004 |
| 1982 | 30,159 | 2,225 | 32,384 |
| 1983 | 29,918 | 1,903 | 31,820 |
Credit Card Transaction Duty—A duty of 5 cents is charged for each transaction entered into by the holders of multi-purpose credit cards. It applies to every transaction entered into on or after 10 July 1981.
Taxation Review Authority—The Inland Revenue Department Act provides for the establishment of 1 or more authorities. There are at present 2 authorities. Every authority shall consist of 1 person who is a barrister or solicitor of the High Court of not less than 7 years practice and is appointed by the Governor-General. The functions of the authority are to sit as a judicial authority for hearing and determining such objections to assessments of tax or duty or the decisions or determinations of the Commissioner as are authorised by the relevant legislation. A determination of an authority is subject to an appeal to the High Court as to any question of fact where the tax or duty exceeds $2,000 and to any question of law.
ESTATES PASSED FOR DEATH DUTY—Statistics relating to deceased persons estates certified for duty during the year ended 31 March 1982 are given in the following tables. Estates of Maoris are included, but not hereditary interests in Maori land.
| Net Value of Estate | Estates of Males | Estates of Females | Total Estates | Aggregate Net Value of Estates | Estate Duties Assessed |
|---|---|---|---|---|---|
| $(000) | No. | No. | No. | $(000) | $(000) |
| Under 4 | 230 | 225 | 455 | 1,017 | – |
| 4 and under 8 | 433 | 460 | 893 | 5,354 | – |
| 8 “ “ 12 | 451 | 410 | 861 | 8,627 | – |
| 12 “ “ 16 | 509 | 443 | 952 | 13,456 | – |
| 16 “ “ 20 | 576 | 523 | 1,099 | 19,793 | 1 |
| 20 “ “ 24 | 597 | 568 | 1,165 | 25,651 | 2 |
| 24 “ “ 30 | 791 | 728 | 1,519 | 40,827 | 1 |
| 30 “ “ 40 | 1,034 | 847 | 1,881 | 65,267 | 4 |
| 40 “ “ 50 | 714 | 562 | 1,276 | 57,098 | 9 |
| 50 “ “ 60 | 506 | 321 | 827 | 45,135 | 11 |
| 60 “ “ 70 | 326 | 246 | 572 | 36,946 | 8 |
| 70 “ “ 80 | 242 | 195 | 437 | 32,598 | 15 |
| 80 “ “ 90 | 198 | 124 | 322 | 27,237 | 17 |
| 90 “ “ 100 | 168 | 98 | 266 | 25,166 | – |
| 100 “ “ 120 | 242 | 121 | 363 | 39,650 | 26 |
| 120 “ “ 140 | 164 | 77 | 241 | 31,115 | – |
| 140 “ “ 160 | 123 | 51 | 174 | 26,001 | 27 |
| 160 “ “ 200 | 166 | 72 | 238 | 42,132 | 328 |
| 200 “ “ 260 | 124 | 44 | 168 | 37,925 | 879 |
| 260 “ “ 350 | 123 | 24 | 147 | 43,842 | 2,998 |
| 350 and over | 143 | 32 | 175 | 99,892 | 20,616 |
| Total, 1981–82 | 7 860 | 6 171 | 14 031 | 724,729 | 24,942 |
| Total, 1980–81 | 8 103 | 6 534 | 14 637 | 661 003 | 29,870 |
The average net value per estate certified during 1981–82 was $51,652. Estates of males averaged $59,768 in value and estates of females $41,313. Duty assessed on estates of males amounted to $20.6 million and on estates of females $4.3 million.
The average amount of duty assessed within each of the various estate groups is now shown. The ratios of average duty to average net value are also given.
| Net Value of Estate | Average Duty Assessed | Average Duty as Percentage of Average Net Value of Estate | ||||
|---|---|---|---|---|---|---|
| Estates of Males | Estates of Females | Combined Average | Estates of Males | Estates of Females | Combined Average | |
| $(000) | $ | $ | $ | % | % | % |
| Under 100 | 91 | 189 | 123 | 0.2 | 0.3 | 0.2 |
| 100 and under 120 | 105 | – | 70 | 0.1 | – | 0.1 |
| 120 “ “ 140 | – | – | – | – | – | – |
| 140 “ “ 160 | 202 | 46 | 156 | 0.1 | – | 0.1 |
| 160 “ “ 180 | 1,423 | 192 | 1,047 | 0.8 | 0.1 | 0.6 |
| 180 “ “ 200 | 2,165 | 1,122 | 1,853 | 1.1 | 0.6 | 1.0 |
| 200 “ “ 220 | 2,684 | 2,669 | 2,681 | 1.3 | 1.3 | 1.3 |
| 220 “ “ 240 | 5,580 | 7,532 | 6,104 | 2.4 | 3.3 | 2.7 |
| 240 “ “ 260 | 9,207 | 7,375 | 8,707 | 3.7 | 2.9 | 3.5 |
| 260 “ “ 300 | 13,332 | 16,802 | 13,975 | 4.8 | 5.9 | 5.0 |
| 300 “ “ 350 | 28,154 | 29,075 | 28,279 | 8.7 | 9.1 | 8.8 |
| 350 and over | 119,766 | 109,058 | 117,808 | 20.6 | 20.6 | 20.6 |
| All estates, 1981–82 | 2,622 | 701 | 1,777 | 4.4 | 1.7 | 3.4 |
| All estates, 1980–81 | 2,971 | 886 | 2,040 | 5.7 | 2.4 | 4.5 |
The following summary shows gross assets, notional estate, and debts and charges, classified in broad groups according to size of estate. The figures refer to estates certified for duty during the year ended 31 March 1982.
| Item | Net Value of Estate* | All Estates | |||||||
|---|---|---|---|---|---|---|---|---|---|
| Under $6,000 | $6,000 and under $10,000 | $10,000 and under $20,000 | $20,000 and under $24,000 | $24,000 and under $40,000 | $40,000 and under$100,000 | $100,000 and under $200,000 | $200,000 and over | ||
* No allowance is made for the Matrimonial Home Allowances. †Excludes any interests in Joint Family Homes. ‡Only debts allowable under the Estate and Gift Duties Act are included. | |||||||||
| Average per Estate $ | |||||||||
| Gross Assets— | |||||||||
| Cash | 2,320 | 3,753 | 13,797 | 7,708 | 27,855 | 52,692 | 22,948 | 18,264 | 149,337 |
| Average per estate | 2,577 | 4,348 | 5,525 | 6,616 | 8,192 | 14,241 | 22,586 | 37,273 | 10,643 |
| Furniture, effects, etc. | 244 | 415 | 1,680 | 854 | 3,637 | 7,811 | 3,827 | 3,359 | 21,827 |
| Average per estate | 271 | 481 | 672 | 733 | 1,069 | 2,111 | 3,766 | 6,854 | 1,555 |
| Farm stock, implements, etc. | 1 | 13 | 107 | 36 | 181 | 825 | 2,177 | 11,294 | 14,635 |
| Average per estate | 1 | 14 | 42 | 30 | 53 | 222 | 2,143 | 23,049 | 1,043 |
| Private business interests | 19 | 5 | 180 | 69 | 614 | 2,660 | 5,578 | 10,194 | 19,319 |
| Average per estate | 21 | 5 | 72 | 59 | 180 | 718 | 5,489 | 20,803 | 1,376 |
| Assurance policies— | 369 | 777 | 3,179 | 1,665 | 6,451 | 13,517 | 6,510 | 4,346 | 36,814 |
| Average per estate | 410 | 900 | 1,272 | 1,429 | 1,897 | 3,653 | 6,407 | 8,869 | 2,623 |
| Loans | 136 | 407 | 2,611 | 1,965 | 7,573 | 26,891 | 22,998 | 21,970 | 84,551 |
| Average per estate | 150 | 471 | 1,045 | 1,686 | 2,227 | 7,267 | 22,635 | 44,836 | 6,025 |
| Shares, stocks, etc. | 297 | 662 | 2,954 | 1,699 | 8,436 | 30,357 | 29,116 | 36,575 | 110,096 |
| Average per estate | 330 | 767 | 1,183 | 1,458 | 2,481 | 8,204 | 28,657 | 74,642 | 7,846 |
| Real property† | 689 | 1,335 | 14,175 | 10,919 | 47,973 | 75,013 | 33,767 | 58,712 | 242,583 |
| Average per estate | 765 | 1,547 | 5,676 | 9,372 | 14,109 | 20,273 | 33,234 | 119,819 | 17,289 |
| Other property | 206 | 258 | 1,214 | 915 | 3,557 | 8,124 | 5,277 | 7,305 | 26,855 |
| Average per estate | 228 | 299 | 486 | 785 | 1,046 | 2,195 | 5,193 | 14,907 | 1,913 |
| Notional estate | 134 | 326 | 1,956 | 1,576 | 5,391 | 13,623 | 9,114 | 9,667 | 41,787 |
| Average per estate | 149 | 377 | 783 | 1,353 | 1,585 | 3,681 | 8,970 | 19,727 | 2,978 |
| Overseas property | 18 | 24 | 226 | 129 | 417 | 2,380 | 3,495 | 10,522 | 17,211 |
| Average per estate | 19 | 27 | 90 | 110 | 122 | 643 | 3,439 | 21,474 | 1,226 |
| Debts— | |||||||||
| Unsecured | 806 | 876 | 2,570 | 1,260 | 4,001 | 5,619 | 2,971 | 6,260 | 24,363 |
| Secured | 392 | 246 | 1,350 | 624 | 1,989 | 4,093 | 2,937 | 4,288 | 15,919 |
| Total‡ | 1,198 | 1,122 | 3,920 | 1,884 | 5,990 | 9,712 | 5,908 | 10,548 | 40,282 |
| Net value—Average per estate, 1981–82 | 3,594 | 7,941 | 15,281 | 22,017 | 31,024 | 60,589 | 136,711 | 370,732 | 51,652 |
| Net value—Average per estate, 1980–81 | 3,622 | 7,993 | 15,265 | 21,983 | 31,070 | 60,815 | 137,461 | 324,379 | 45,159 |
Realty comprised 31.7 percent of gross New Zealand assets in 1981–82 while the proportion of cash was 19.5 percent. The comparable figures for 1980–81 were 31.7 and 17.2 percent.
In the following table deceased persons estates are analysed by occupations. These figures refer to the year ended 31 March 1982.
| Occupational Group | Under $6,000 | $6,000 to 9,999 | $10,000 to 19,999 | $20,000 to 23,999 | $24,000 to 39,999 | $40,000 to 99,999 | $100,000 and Over | Total |
|---|---|---|---|---|---|---|---|---|
| * Including retired persons and unpaid household workers. | ||||||||
| Number of Estates | ||||||||
| Physical life scientists, technicians, etc. | – | – | 5 | 2 | 13 | 9 | 4 | 33 |
| Architects, engineers, technicians, aircraft and ships officers | 11 | 11 | 38 | 20 | 65 | 99 | 40 | 284 |
| Medical, dental, and related workers | 1 | 4 | 13 | 15 | 29 | 39 | 34 | 135 |
| Teachers, clergy and jurists | 16 | 8 | 29 | 13 | 49 | 97 | 38 | 250 |
| Artists, authors, athletes, sportsmen and related workers | 3 | 1 | 7 | 7 | 16 | 15 | 4 | 53 |
| Administrative and managerial workers | 23 | 21 | 72 | 29 | 137 | 261 | 206 | 749 |
| Clerical and related workers | 35 | 44 | 153 | 65 | 203 | 208 | 31 | 739 |
| Transport and communication workers | 6 | 6 | 13 | 8 | 22 | 23 | 78 | |
| Sales workers | 19 | 28 | 63 | 34 | 98 | 143 | 37 | 422 |
| Protective service workers, armed forces, etc. | 7 | 4 | 17 | 4 | 28 | 31 | 4 | 95 |
| Housekeepers, cooks, waiters, maids, etc. | 7 | 1 | 29 | 6 | 29 | 29 | 14 | 115 |
| Caretakers, launderers, hairdressers, and related service workers | 9 | 7 | 27 | 14 | 36 | 19 | 1 | 113 |
| Farmers and farm managers | 24 | 35 | 100 | 50 | 184 | 437 | 490 | 1,320 |
| Agriculture, animal husbandry, and forestry workers, fishermen and hunters | 25 | 16 | 53 | 20 | 52 | 51 | 16 | 233 |
| Miners, quarrymen, well drillers, etc. | 2 | 2 | 10 | 3 | 6 | 5 | – | 28 |
| Metal and chemical processers | 4 | 3 | 11 | 12 | 10 | 14 | 2 | 56 |
| Spinners, weavers, knitters, dyers, etc. | 3 | 3 | 10 | 5 | 9 | 7 | 3 | 40 |
| Food, beverage, and tobacco processers | 21 | 10 | 35 | 22 | 47 | 54 | 8 | 197 |
| Tailors, dressmakers, etc. | 3 | 5 | 4 | 7 | 16 | 9 | 2 | 46 |
| Shoemakers and leather goods makers | 1 | 1 | 6 | 2 | 9 | 8 | 1 | 28 |
| Machinery fitters, assemblers, instrument makers, electrical fitters and related electrical and electronic workers | 28 | 15 | 106 | 54 | 124 | 117 | 25 | 469 |
| Glass formers, potters, printers, and related workers | 2 | 6 | 14 | 9 | 35 | 25 | 2 | 93 |
| Painters, bricklayers, carpenters and other related construction workers | 27 | 22 | 83 | 44 | 134 | 93 | 17 | 420 |
| Stationary engine operators, material and freight handlers, transport equipment operators | 39 | 41 | 117 | 47 | 142 | 108 | 13 | 507 |
| Labourers, and occupations not stated or not in employment* | 584 | 569 | 1,481 | 674 | 1,907 | 1,799 | 514 | 7,528 |
| Total | 900 | 363 | 2,496 | 1,166 | 3,400 | 2,700 | 1,506 | 14,031 |
RACING TAXATION—The Government taxation on totalisator turnover from 1 September 1976 is at the rate of 8.5 percent on gross on-course investments and 9.0 percent on gross off-course investments, subject to a rebate of 2½ percent on the first $100,000 of gross investments received by a club in any 1 year.
Total deductions from gross on-course investments are as follows: (a) totalisator duty, 8.5 percent; (b) club's commission, 8.5 percent in respect of win and place investments and 11.18 percent on doubles, trebles, quinellas, trifectas and jackpots; (c) 0.5 percent levy for the purpose of the Stakes Subsidy Account; (d) 0.5 percent levy for the purpose of the Amenities Account; (e) 0.5 percent for the purpose of the on-course Development Account.
Total deductions from gross off-course investments are as follows (a) totalisator duty, 9.0 percent; (b) Totalisator Agency Board's commission, 7.75 percent in respect of win and place investments and 10.43 percent on doubles, quinellas, trebles and trifectas investments; (c) 0.75 percent levy for the purpose of the Stakes Subsidy Account; (d) 0.5 percent for the purpose of the Amenities Account; (e) 0.5 percent for the purpose of the on-course Development Account.
In the case of special races, win and place investments, a commission of 8.25 percent is deducted and on special doubles and quinellas a commission of 10.93 percent is deducted. In these cases the 0.5 percent levy for the amenities account is waived.
The Racing Amendment Act 1977 came into force on 1 August 1978. It included provision for the issue of restricted totalisator licences to registered non-totalisator racing, trotting, and greyhound racing clubs. The Act also lowered the legal minimum betting age from 20 to 18 years.
A further Racing Amendment Act came into force on 27 November 1980. It provided for the installation and operation of a computerised system of on-course and off-course betting by the Totalisator Agency Board (TAB) in association with clubs; the extension of off-course betting to greyhound meetings; the representation of the Greyhound Racing Association on the TAB; a further deduction of one cent in the dollar from all betting pools (to finance the new system, to enable clubs to pay minimum dividends of $1, and to provide additional finance for administration of the 3 codes, including improvements in stakes); and the setting up of an account administered by the Racing Authority to assist projects of clubs and in each code.
The Minister of Internal Affairs granted totalisator licences for 555 days in the racing year 1982–83. Of these 555 days, 325 were allocated to racing and hunt clubs, 200 to trotting clubs, and 30 to greyhound racing clubs.
The following table gives figures of totalisator duty, and the amount of turnover retained by clubs or the Totalisator Agency Board.
| Item | Year Ended 31 July | ||||
|---|---|---|---|---|---|
| 1979 | 1980† | 1981† | 1982 | 1983 | |
* Retained by clubs and TAB. †Includes restricted on-course betting. ‡From November 1980. | |||||
| $(thousand) | |||||
| Totalisator duty | 40,821 | 44,115 | 46,953 | 53,684x | 59,627 |
| Amount of totalisator turnover retained by clubs or TAB | 41,261 | 44,564 | 48,990 | 57,259x | 64,213 |
| Unpaid fractions* | 1,638 | 1,788 | 1,882 | 2,215x | 2,298 |
| Amenities Account | 2,013 | 2,161 | 2,306 | 2,577 | 2,830 |
| Stakes Subsidy Account | 2,322 | 2,507 | 3,312 | 4,136 | 4,611 |
| On-course Development Account‡ | 1,805 | 3,062x | 3,401 | ||
Totalisator turnover for the year ended 31 July 1983 rose by 10.0 percent, from $612.4 million in the previous year to $680.1 million.
FURTHER INFORMATION—Further information on public account taxation will be found in the following publications.
The Public Accounts (Parl. paper B. 1 [Pt. I and II])
Financial Statement (“Budget”) (Parl. paper B. 6)
Report of the Inland Revenue Department (Parl. paper B. 23)
The Information Service of the Inland Revenue Department has available a range of tax guides, pamphlets, leaflets, etc., giving up-to-date information on the rights and obligations of taxpayers.
The principal legislative measure which is concerned with public indebtedness is the Public Finance Act 1977 The money comprising the public debt has been borrowed on the security of the public revenues of New Zealand. No portion of the public estate is pledged for either principal or interest.
At 31 March 1983. 41.4 percent of the public debt was owing to overseas investors, and 21.1 percent was held by Government departments or institutions such as the Post Office, the Government Superannuation Board, and the Earthquake and War Damage Commission.
Most of the present public debt was borrowed for national development. A National Development Loans Account, into which money for national development was to be paid, was established within the Public Account as from 1 April 1942. Money from this account, now renamed the Loans Account, is transferred as required to the Consolidated Fund or to accounts now outside the Public Account such as Electricity Supply or the Housing Corporation. Transfers and appropriations during the latest 3 years are given in section 27A.
MOVEMENT IN PUBLIC DEBT—The total public debt outstanding at 31 March of the 2 latest available years is shown in the following table. A 50-year summary of the public debt is included in the Statistical Summary section.
| Type and Currency | Outstanding at 31 March | Increase or Decrease | |
|---|---|---|---|
| 1982 | 1983 | ||
| * Treasury bills. | |||
| $(thousand) | |||
| External debt— | |||
| Pounds sterling | 872,597 | 1,012,187 | +139,590 |
| Deutschemarks | 984,187 | 1,228,089 | +243,902 |
| Netherlands guilders | 171,577 | 159,033 | −12,544 |
| Japanese yen | 793,162 | 1,355,986 | +562,824 |
| Swiss francs | 1,600,421 | 2,060,732 | +460,311 |
| French francs | 11,347 | 10,560 | −787 |
| Canadian dollars | 32,245 | 33,138 | +893 |
| Australian dollars | 27,595 | 19,134 | −8,461 |
| United States dollars | 1,029,922 | 1,862,023 | +832,101 |
| IBRD | 15,861 | 13,122 | −2,739 |
| Other | 10,453 | 10,718 | +265 |
| Internal debt— | |||
| Long-term | 8,294,347 | 10,230,389 | +1,936,042 |
| Floating debt* | 537,665 | 737,665 | +200,000 |
| Total | 14,381,379 | 18,732,776 | +4,351,397 |
The net increase of $4,351.4 million in the public debt during the year ended 31 March 1983 represented a 30.3 percent rise. The external debt rose by 40.0 percent and the internal debt by 24.2 percent.
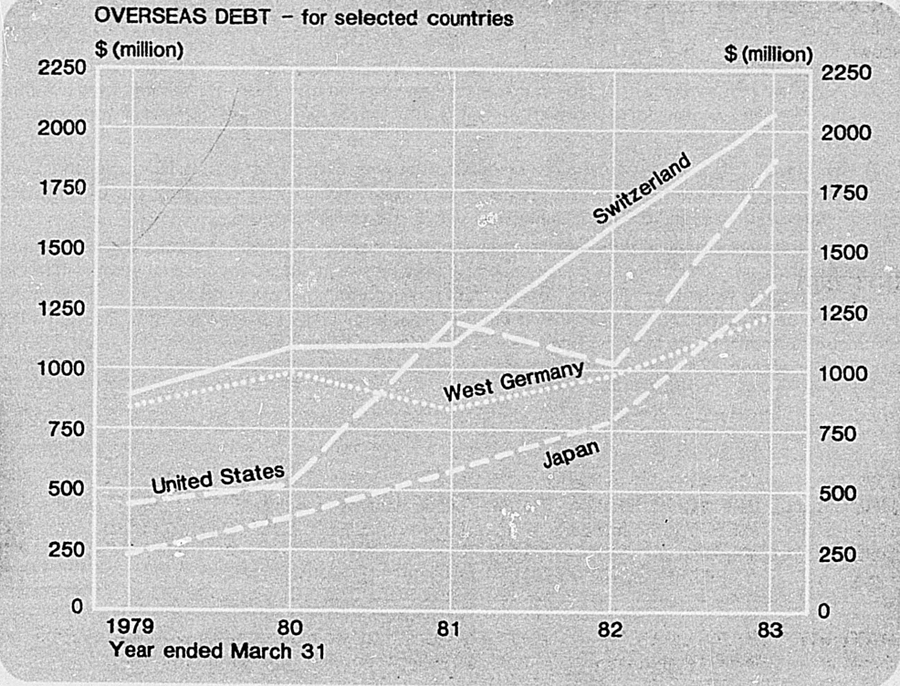
The following table shows the external and internal public debt as at 31 March over a 10-year period. A significant feature is the growth of external debt as a percentage of the total public debt.
| Outstanding at 31 March | External Debt | Internal Debt | Total Debt | |||
|---|---|---|---|---|---|---|
| Amount | Percent of Total Debt | Amount | Percent of Total Debt | Amount | Percent Increase on Previous Year | |
| $(million) | % | $(million) | % | $(million) | % | |
| 1974 | 465.2 | 12.5 | 3,269.3 | 87.5 | 3,734.5 | 6.6 |
| 1975 | 862.8 | 20.5 | 3,336.9 | 79.5 | 4,199.7 | 12.5 |
| 1976 | 1,463.2 | 26.3 | 4,094.7 | 73.7 | 5,557.9 | 32.3 |
| 1977 | 1,826.6 | 29.0 | 4,462.6 | 71.0 | 6,289.2 | 13.2 |
| 1978 | 2,446.7 | 32.7 | 5,037.1 | 67.3 | 7,483.8 | 19.0 |
| 1979 | 2,920.1 | 33.1 | 5,899.4 | 66.9 | 8,819.5 | 17.8 |
| 1980 | 3,567.5 | 34.5 | 6,778.9 | 65.5 | 10,346.4 | 17.3 |
| 1981 | 4,236.1 | 36.5 | 7,381 0 | 63.5 | 11,617.1 | 12.3 |
| 1982 | 5,549.4 | 38.6 | 8,832.0 | 61.4 | 14,381.4 | 23.8 |
| 1983 | 7,764.7 | 41.4 | 10,968.0 | 58.5 | 18,732.8 | 30.3 |
GROSS INDEBTEDNESS—The gross indebtedness of the Central Government and the amount of indebtedness per head of population are given in the following table. Figures for previous years are shown in a table in the Statistical Summary.
| As at 31 March | Amount | Per Head of Population |
|---|---|---|
| $(m) | $ | |
| 1978 | 7,484 | 2,378.91 |
| 1979 | 8,820 | 2,804.57 |
| 1980 | 10,346 | 3,286.14 |
| 1981 | 11,617 | 3,663.65 |
| 1982 | 14,381 | 4,508.13 |
| 1983 | 18,733 | 5,799.62 |
INTEREST—The following table shows the payments of interest.
| Year Ended 31 March | Interest | Interest on Overseas Debt as Percentage of Export Income | Recovery of Interest from Government Enterprises and Investments | Net Interest Cost | Net Cost as a Percentage of Total Taxation | ||
|---|---|---|---|---|---|---|---|
| Overseas | New Zealand | Total | |||||
| $(thousand) | |||||||
| 1979 | 174,243 | 415,868 | 590,111 | 4.5 | 450,295 | 139,816 | 2.8 |
| 1980 | 220,149 | 537,644 | 757,793 | 4.5 | 539,049 | 218,744 | 3.6 |
| 1981 | 256,345 | 635,152 | 891,497 | 4.4 | 597,842 | 293,655 | 4.2 |
| 1982 | 416,265 | 786,663 | 1,202,928 | 6.2 | 664,394 | 533,534 | 6.1 |
| 1983 | 514,955 | 960,837 | 1,475,792 | 6.8 | 719,563 | 756,229 | 7.5 |
MATURITY YEARS OF DEBT—The maturity years of the debt outstanding at 31 March 1983 are shown in the following statement, which distinguishes between overseas and internal debt.
| Loans Maturing in Financial Year Ended 31 March* | Due | Total Debt (Nominal Amount) | ||
|---|---|---|---|---|
| Overseas | New Zealand | |||
| Public | Departmental and Other | |||
* In respect of many of the loans the Government has the option to redeem the securities at an earlier date. †At 31 March 1983 the obligation in respect of premiums on redemptions was $190,968,891. | ||||
| $(million) | ||||
| 1984 | 544.3 | 481.4 | 202.0 | 1,227.7 |
| 1985 | 1,102.2 | 840.3 | 281.1 | 2,223.6 |
| 1986 | 1,108.4 | 988.8 | 747.1 | 2,844.4 |
| 1987 | 693.1 | 550.5 | 549.6 | 1,793.3 |
| 1988 | 1,499.1 | 602.8 | 817.7 | 2,919.7 |
| 1989 | 1,062.1 | 1,142.9 | 789.3 | 2,994.2 |
| 1990 | 506.7 | 92.3 | 58.7 | 657.7 |
| 1991 | 264.7 | 166.4 | 90.9 | 522.1 |
| 1992 | 383.6 | 128.3 | 95.8 | 607.7 |
| 1993 | 486.1 | 49.7 | 125.3 | 661.1 |
| 1994 | 89.9 | 27.0 | 78.4 | 195.4 |
| 1995 | 24.3 | – | – | 24.3 |
| Treasury Bills | 637.0 | 100.6 | 737.7 | |
| Inflation Adjusted Savings Bonds† | 936.3 | – | 936.3 | |
| Premium Stock | 281.8 | 21.9 | 303.8 | |
| Kiwi Savings Stock | 83.5 | – | 83.5 | |
| Total | 7,764.7 | 7,009.4 | 3,958.7 | 18,732.8 |
Transactions in connection with the public debt in the year ended 31 March 1933 are shown in the following table.
| Public Debt Transactions | New Zealand (Internal Debt) | External Debt | ||
|---|---|---|---|---|
| Pounds Sterling | Deutschemarks | Netherlands Guilders | ||
* Includes $391,088,878 securities issued—Reserve Bank indemnity. †Includes Treasury bills. ‡Includes $391,088,878 securities issued—Reserve Bank indemnity, and Treasury bills. | ||||
| Loans raised (gross)— | NZ$(million) | |||
| For general purposes | 3,364.9* | 354.1 | 136.9 | – |
| Capital equipment credit arrangements | – | 52.4 | – | – |
| For repayment of loans | 2,950.6† | 349.0 | – | – |
| Total loans raised | 6,315.6 | 755.5 | 136.9 | – |
| Loans repaid— | ||||
| For general repayments | 4,179.5‡ | 584.9 | 86.4 | 36.7 |
| Capital equipment credit arrangements | – | 18.3 | – | – |
| IBRD | – | – | – | – |
| Total loans repaid | 4,179.5 | 603.2 | 86.4 | 36.7 |
| Increase or decrease in debt due to— | ||||
| 1 March 1983 realignment | – | −91.7 | 71.0 | 8.5 |
| 8 March 1983 devaluation | – | 78.9 | 122.3 | 15.7 |
| Net increase or decrease during the year | 2,136.0 | 139.6 | 243.9 | −12.5 |
| Public debt at 1 April 1982 | 8,832.0 | 872.6 | 984.2 | 171.6 |
| Public debt at March 1983 | 10,968.0 | 1,012.2 | 1,228.1 | 159.0 |
A detailed allocation of the public debt as at 31 March 1983 is shown in the following table.
| Allocation | Loan Capital | Equity Capital | Total Allocations |
|---|---|---|---|
| $(thousand) | |||
| (a) Loans and investments in corporation and Government agencies— | |||
| Air New Zealand Ltd. | 9,500 | 120,000 | 129,500 |
| Alliance Textiles Ltd. | 1,000 | 1,000 | |
| Bahrain New Zealand Cold Storage and Warehousing Company | 6,277 | 1,512 | 7,789 |
| Bank of New Zealand | 31,906 | 31,906 | |
| Broadcasting Corporation of New Zealand | 38,900 | 38,900 | |
| Development Finance Corporation of N.Z. | 9,167 | 45,825 | 54,992 |
| Energy: Electricity Division | 2,296,420 | ||
| IBRD projects | 6,985 | ||
| Capital equipment credit arrangements | 139,514 | 2,442,919 | |
| Energy: Geothermal | 5,801 | 5,801 | |
| Energy: Mines Division | 222,339 | 222,339 | |
| Energy: Oil and Gas | 13,685 | 75,701 | 89,386 |
| Housing Corporation | 1,798,708 | 1,798,708 | |
| Housing Account (Housing Corporation) | 811,530 | 811,530 | |
| IBRD Harbour projects | 3,650 | 3,650 | |
| Natural Gas Corporation of N.Z. Ltd. | 4,671 | 4,671 | |
| New Zealand Export-Import Corporation | 2,000 | 2,000 | |
| New Zealand Steel Ltd. | 6,000 | 6,000 | |
| New Zealand Steel Development Ltd. | 20,605 | 6,000 | 26,605 |
| Petroleum Corporation of N.Z. Ltd. | 43,125 | 128,173 | 171,298 |
| Post Office | 562,954 | ||
| Capital equipment credit arrangements | 32,368 | 595,322 | |
| New Zealand Railways Corporation | 595,720 | ||
| IBRD projects | 2,487 | ||
| Capital equipment credit arrangements | 71,494 | 669,701 | |
| Rural Banking and Finance Corporation | 1,959,436 | 1,959,436 | |
| Shipping Corporation of N.Z. Ltd. | 37,210 | 37,210 | |
| Tourist Hotel Corporation, of New Zealand | 11,871 | 11,948 | 23,819 |
| Winstone-Samsung Industries Ltd. | 5,000 | 10,000 | 15,000 |
| 9,149,482 | |||
| External Debt | |||||||||
|---|---|---|---|---|---|---|---|---|---|
| Japanese Yen | U.S. Dollars | Swiss Francs | French Francs | IBRD | Australian Dollars | Canadian Dollars | Misc | Total External Debt | Total Public Debt |
| NZ$(million) | |||||||||
| 382.8 | 1,136.0 | 263.5 | – | – | – | – | – | 2,273.3 | 5,638.2 |
| 6.5 | 8.2 | – | – | – | – | – | 0.6 | 67.7 | 67.7 |
| – | 73.3 | 133.3 | – | – | – | – | – | 555.6 | 3,506.2 |
| 389.3 | 1.217.7 | 396.9 | – | – | – | – | 0.6 | 2,896.9 | 9,212.5 |
| 5.4 | 654.1 | 137.8 | 0.8 | – | – | – | – | 1,506.1 | 5,685.6 |
| 8.5 | 20.6 | 1.0 | 0.6 | – | 7.6 | 5.0 | 1.7 | 63.3 | 63.3 |
| – | – | – | – | 4.9 | – | – | – | 4.9 | 4.9 |
| 13.9 | 674.8 | 138.9 | 1.4 | 4.9 | 7.6 | 5.0 | 1.7 | 1,574.5 | 5,754.0 |
| 81.1 | 106.9 | 24.0 | −0.4 | 0.8 | −0.4 | 2.6 | 0.4 | 202.8 | 202.8 |
| 106.4 | 182.3 | 178.3 | 1.0 | 1.3 | −0.5 | 3.3 | 0.9 | 689.9 | 689.9 |
| 562.8 | 832.1 | 460.3 | −0.8 | −2.7 | −8.5 | 0.9 | 0.2 | 2,215.3 | 4,351.3 |
| 793.1 | 1,029.9 | 1,600.4 | 11.3 | 15.8 | 27.6 | 32.2 | 10.4 | 5,549.1 | 14,381.1 |
| 1,355.9 | 1,862.0 | 2,060.7 | 10.6 | 13.1 | 19.1 | 33.1 | 10.7 | 7,764.7 | 18,732.8 |
| Allocation | Loan Capital | Equity Capital | Total Allocations |
|---|---|---|---|
| $(thousand) | |||
| (b) Other debt formerly allocated to Works and Trading Account— | |||
| Airport development | 45,435 | ||
| Forests (State) | 233,943 | ||
| General public works | 627,990 | ||
| Land settlement | 246,293 | ||
| 1,153,661 | |||
| (c) Non-productive debt— | |||
| Capital liability remitted | 24,399 | ||
| Consolidated Account— | |||
| Transfer from Loans Account | 5,145,000 | ||
| Capital equipment credit arrangements— | |||
| Defence | 48,703 | ||
| Foreign Affairs | 5,085 | ||
| Health | 1,929 | ||
| State Services Commission | 773 | ||
| Transport | 2,388 | ||
| Currency adjustments | 1,268,451 | ||
| Subscriptions, etc. to international finance organisations | 104,416 | ||
| Loans Account | 125,153 | ||
| Loans Redemption Account | 1,703,336 | ||
| 8,429,633 | |||
| Total public debt | 18,732,776 | ||
PUBLIC DEBT HELD BY GOVERNMENT DEPARTMENTS—As shown in the preceding table a substantial proportion of the public debt is held by various Government departments and other official bodies. A summary of these holdings as at 31 March of the latest 3 years is as follows:
| As at 31 March | |||
|---|---|---|---|
| 1981 | 1982 | 1983 | |
| $(thousand) | |||
| Investments held by accounts within the Public Account | 5,967 | 5,966 | 5,872 |
| Earthquake and War Damage Commission | 438,990 | 519,607 | 698,616 |
| Government Life Insurance | 114,544 | 124,373 | 135,452 |
| Government Superannuation Fund | 686,188 | 803,632 | 921,954 |
| Maori Trustee | 1,747 | 1,742 | 1,742 |
| National Provident Fund | 73,200 | 83,450 | 102,528 |
| Post Office | 1,311,928 | 1,387,928 | 1,522,928 |
| Public Trustee | 3,863 | 2,920 | 2,518 |
| Reserve Bank | 320,658 | 875,153 | 394,567 |
| Housing Corporation | 113,674 | 86,829 | 85,266 |
| Rural Banking and Finance Corporation | 61,382 | 66,382 | 86,990 |
| State Insurance Office | 250 | 250 | 250 |
| Total | 3,132,391 | 3,958,232 | 3,958,683 |
The constitution and franchise of local authorities are described in Section 2c, Local Government.
Local government is concerned with the provision of facilities for the population of a limited area, with finances levied from that area. The major local authorities are territorial, city, borough, district, and county councils. These authorities raise money mainly by rates on property and by loans. They expend it on the provision of roads, water supply, sewerage, transport, recreational, and a wide range of other services. Electric power boards and harbour boards, among the larger of the other local authorities, collect revenue from consumers or users in payment for the facilities or services provided. Hospital boards, which supply their returns to the Department of Health, are omitted from most of the statistics contained in this section. A special note is made where they are included, while summarised data relating to hospital boards will be found in Section 5B.
In general, the local authority year ends on 31 March. Exceptions are harbour boards where the year ends on the preceding 30 September and United Councils where the year ends on the last day of February.
INCOME—Local authorities are largely dependent on revenue from rates to carry out their activities.
Rating—Rating provides a financial base which is independent of central government, is relatively cheap to administer and can be adapted to suit local circumstances. There are 3 main systems of rating:
land value;
capital value (i.e., land plus improvements);
annual (rental) value.
Most territorial authorities in New Zealand (186 of a total of 231) rate on the land value system; 24 rate on the capital value; and 10 on the annual value. A further 11 territorial authorities rate on the capital and land values in different parts of the district.
For rating on either the capital value or the land value, the rating roll is based on the district valuation roll prepared by the Valuation Department. Where the rating is on the annual value, the territorial authority generally prepares its valuation roll on the basis of the valuations made by its own valuers. Provision is made for the Valuer-General to act as a territorial authority valuer where an annual roll is to be prepared.
The Rating Act 1967 contains the machinery provisions for the making and levying of rates which are applicable to all local authorities empowered to levy rates. The individual empowering Acts for each class of local authority contain their specific rating powers. For example the Local Government Act 1974 contains the rating powers of territorial authorities.
Three broad classes of territorial authority rates are distinguished:
general—for general purposes;
separate rates—levied for a variety of purposes including works and services, fire protection, sewerage and storm water drainage and lighting;
special rates—may be imposed to secure the repayment of loan money.
A territorial authority may levy each year on each separately rateable property a uniform annual charge not exceeding $150 or a lesser amount in the case of any rating area where the levying of such a charge would exceed the maximum authorised general rate. In addition there are a wide range of services for which uniform charges may be levied instead of separate rates.
The Chatham Islands County Council Empowering Act 1980 empowers the council to reintroduce land rating in the Chatham Islands in association with the existing system of import and export dues. The council has been authorised to levy land rates since 1 April 1981 provided that the income from the combination of rates and import and export dues does not exceed the maximum permissible under a land rating system only.
GRANTS FROM CENTRAL GOVERNMENT—A substantial portion of local authority revenue is derived from grants and subsidies. In 1982–83 grants and subsidies amounted to $299.59 million. These grants and subsidies include:
Civil Defence—A dollar for dollar subsidy up to a maximum based on population figures is paid by the Ministry of Civil Defence towards civil defence expenditure such as communications and rescue equipment, alteration and construction of buildings and salaries of civil defence staff.
Community Welfare, Cultural and Recreational Facilities—Much of the $3.98 million distributed by the Department of Internal Affairs to local authorities in 1982–83 was provided for recreation and sport, community and regional service projects, and art galleries and museums.
In addition the Department of Social Welfare has funds available for any territorial authority which may wish to establish child-care schemes, rehabilitation or day-care for disabled persons, or other appropriate social welfare programmes.
Electricity—Assistance to local authorities for small hydro schemes is provided through the Committee on Local Hydro Development, while the Rural Electrical Reticulation Council provides subsidies towards the cost of rural distribution lines for power boards and territorial authorities.
Employment—A wide range of training and employment schemes are administered by the Department of Labour. These range from full subsidies for work under the Project Employment and Winter Employment Programmes to subsidies of $40 a week for additional first year apprentices and $95 a week for young people training in employment under the Young Persons Training Programme.
Forestry—The New Zealand Forest Service makes grants to local authorities undertaking commercial afforestation on land in which the authority holds in interest and may contribute towards the costs of road construction and upgrading where these are used mostly by forest generated traffic.
Historic Places—Local authorities which own or are responsible for looking after a historic place or site can apply to the Historic Places Trust for a loan or grant from that fund.
Housing—The Housing Corporation of New Zealand administers a number of schemes relating to housing and urban renewal These include a combination of loans and subsidies to meet up to the total cost of building flats for the elderly and disabled, subsidies and loans for the building of relocatable granny flats, assistance to modernise older flats and provide emergency housing, and loans to build doctor's surgeries in areas where they are needed. In 1982–83 total payments were $4.68 million.
National Roads Board—The finance available from the National Roads Board in 1982–83 was $109.72 million and represents an important source of revenue for territorial authorities. (See Section 14D).
Noxious Pests and Plants—The Minister of Agriculture may approve grants to pest destruction boards to carry out the control of pests within their districts. The Ministry of Agriculture and Fisheries also operates a dollar for dollar subsidy scheme on the cost of noxious plant control activities.
Urban Passenger Transport—The Urban Transport Council was formed in 1981 and is now the funding body for all urban transport subsidy programmes. In 1982–83 $60.67 million was expended. The budget for 1983–84 was $64.5 million. All municipal and private operators and urban services administered by the New Zealand Railways Corporation are now funded through the Urban Transport Council.
Water Supply, Sewage Disposal and Wastes Recycling—A comprehensive water and sewerage subsidy scheme is administered by the Department of Health and provides assistance towards the residential content of such works. Water and sewerage subsidies reached $22.4 million in 1982–83. In addition the Ministry of Works and Development provides subsidies towards the cost of piped water supply to rural areas and together with the Rural Banking and Finance Corporation provides for a combination of loans and grants for approved community irrigation schemes. Some finance is available from the Department of Trade and Industry for long-term waste conversion and recycling programmes.
Petroleum Tax—The Local Government Act 1974 provides for territorial authorities and united and regional councils, to receive the proceeds of a tax of 0.33 cents per litre on diesel fuel and 0.66 cents per litre on petrol. In 1982–83, $18.15 million in petroleum tax was paid to local authorities. The figure for 1981–82 was $17.89 million.
Sales of Commodities and Services—Income from the sale of commodities and services includes, for example, the sale of electricity and gas, public transport fares, and other user charges for council facilities such as libraries, swimming pools and car parking spaces. Income from licences includes dog registration fees and inspection fees.
EXPENDITURE—The purchase of commodities and services makes up over half of the expenditure of local authorities. Other substantial areas of expenditure are labour costs which are one-third of the total and interest payments. Traditional areas of local authority expenditure are roading, water supply, sewerage, drainage and refuse collection while local authority responsibilities have tended to increase in areas such as land use planning and the provision of recreation and welfare services.
The sources of revenue of all local authorities including electric power boards, are shown by broad classes in the following table.
| Year Ended 31 March | Rates, Levies, Fines, etc* | Grants from Central and Local Government | Sales of Commodities and Services incl, Water Rates | Other Receipts | Total Receipts |
|---|---|---|---|---|---|
| * Includes rates other than water rates, $461,698,487 and other taxes, fines, etc., $40,409,352 in 1981; and rates other than water rates, $560,692,327 and other taxes, fines, etc., $48,149,831 in 1982. | |||||
| $(thousand) | |||||
| 1978 | 313,288 | 116,652 | 798,618 | 57,286 | 1,285,848 |
| 1979 | 371,522 | 145,591 | 892,571 | 69,527 | 1,479,210 |
| 1980 | 422,649 | 155,789 | 1,144,729 | 90,584 | 1,813,752 |
| 1981 | 502,108 | 200,111 | 1,336,500 | 108,738 | 2,147,457 |
| 1982 | 608,844 | 250,294 | 1,506,993 | 129,537 | 2,495,668 |
Rates were equivalent to $117.98 per head of population during 1978–79, $133.95 during 1979–80, $158.33 during 1980–81, and $192.28 during 1981–82.
A fairly large proportion of the receipts of urban local authorities result from the sales of commodities or services, for instance, sales of electric power and gas, and fares collected for public transport.
The payments of all local authorities during each of the latest available 5 years has been as follows.
| Year Ended 31 March | Labour and Related Costs | Purchases of Commodities and Services | All Interest | Other Payments | Total Payments |
|---|---|---|---|---|---|
| $(thousand) | |||||
| 1978 | 346,971 | 664,078 | 71,008 | 84,654 | 1,166,710 |
| 1979 | 433,098 | 764,254 | 85,160 | 100,283 | 1,382,795 |
| 1980 | 515,908 | 933,484 | 98,994 | 114,191 | 1,662,577 |
| 1981 | 619,608 | 1,116,474 | 120,583 | 130,729 | 1,987,395 |
| 1982 | 767,966 | 1,251,488 | 139,415 | 152,909 | 2,311,778 |
Receipts and payments of various classes of local authorities for the year ended 31 March 1982 are shown below.
| Receipts | |||||
|---|---|---|---|---|---|
| Local Authority | Rites, Levies, Fines, etc. | Grants from Central and Local Government | Sales of Commodities and Services | Other Receipts | Total Receipts |
| $(thousand) | |||||
| City and borough councils | 403,142 | 82,025 | 426,807 | 57,134 | 969,108 |
| County councils | 127,104 | 80,709 | 39,315 | 11,196 | 258,325 |
| District councils | 29,511 | 14,023 | 11,597 | 2,428 | 57,559 |
| Electric power boards | 35 | 166 | 658,996 | 15,741 | 674,938 |
| Harbour boards | 819 | 306 | 156,613 | 21,406 | 179,143 |
| Regional authorities | 2,018 | 42,211 | 61,811 | 13,708 | 119,749 |
| Urban drainage boards | 18,102 | 4,409 | 1,345 | 1,219 | 25,075 |
| Catchment boards | 15,146 | 10,660 | 6,027 | 3,280 | 35,113 |
| Pest destruction boards | 4,119 | 6,656 | 267 | 360 | 11,401 |
| Urban transport board | 6,443 | 337 | 5,017 | 355 | 12,152 |
| Other local authorities | 2,404 | 8,794 | 139,200 | 2,709 | 153,104 |
| Total | 608,844 | 250,294 | 1,506,993 | 129,537 | 2,495,668 |
| Payments | |||||
|---|---|---|---|---|---|
| Local Authority | Labour and Related Costs | Interest | Purchases of Commodities and Services | Other Payments | Total Payments |
| $(thousand) | |||||
| City and borough councils | 332,680 | 52,344 | 418,920 | 61,529 | 865,474 |
| County councils | 89,683 | 11,566 | 120,108 | 12,513 | 233,869 |
| District councils | 20,757 | 3,077 | 24,366 | 1,857 | 50,056 |
| Electric power boards | 117,324 | 22,713 | 490,567 | 36,180 | 666,785 |
| Harbour boards | 78,994 | 21,384 | 51,752 | 18,563 | 170,693 |
| Regional authorities | 51,298 | 17,924 | 28,564 | 6,114 | 103,900 |
| Urban drainage boards | 8,763 | 5,142 | 5,068 | 371 | 19,344 |
| Catchment boards | 18,418 | 928 | 11,163 | 1,485 | 31,994 |
| Pest destruction boards | 6,438 | 96 | 4,030 | 402 | 10,966 |
| Urban transport board | 7,524 | 318 | 2,218 | 1,080 | 11,141 |
| Other local authorities | 36,087 | 3,920 | 94,731 | 12,816 | 147,557 |
| Total | 767,966 | 139,415 | 1,251,488 | 152,909 | 2,311,778 |
TERRITORIAL LOCAL AUTHORITIES—The following table shows total receipts and payments of territorial local authorities for the years ended 31 March 1980, 1981 and 1982.
| Item | Year Ended 31 March | ||
|---|---|---|---|
| 1980 | 1981 | 1982 | |
| Receipts | $(million) | ||
| Rates and grants in lieu | 354.7 | 425.1 | 515.2 |
| Other taxes and fines | 35.7 | 39.4 | 47.0 |
| Grants and contributions from central government | 103.5 | 134.9 | 173.1 |
| Grants and contributions from local authorities | 29.7 | 35.7 | 47.5 |
| Sales of main product | 238.3 | 279.6 | 331.4 |
| Other commodities and services | 153.1 | 186.6 | 208.3 |
| Interest | 24.4 | 30.1 | 37.1 |
| Miscellaneous current receipts | 38.0 | 43.4 | 47.4 |
| Total | 977.5 | 1,174.8 | 1,407.0 |
| Payments | |||
| Labour and related costs | 329.3 | 395.1 | 495.5 |
| Interest paid | 58.4 | 70.7 | 85.0 |
| Levies and grants to Central Government and local authorities | 34.8 | 39.0 | 46.9 |
| Bulk purchase for resale | 122.8 | 150.0 | 168.5 |
| Other commodities and services | 307.8 | 384.7 | 424.3 |
| Other current payments | 24.1 | 28.8 | 35,2 |
| Subtotal | 877.2 | 1,068.3 | 1,255.4 |
| Less capitalised payments | 37.0 | 38.0 | 44.7 |
| Total | 840.2 | 1,030.3 | 1,210.7 |
A wide variety of public utilities and amenities are provided by territorial local government, the main activities being electricity supply, water supply, roading, sewerage, drainage, and refuse collection. The table below shows the current receipts and payments for a number of selected activities for the years ended 31 March 1980, 1981, and 1982.
Excluded from the figures are sales and purchases of fixed assets and repayments of loan moneys.
| Activity | 1979–80 | 1980–81 | 1981–82 | |||
|---|---|---|---|---|---|---|
| Receipts | Payments | Receipts | Payments | Receipts | Payments | |
| $(million) | ||||||
| Electricity supply | 160.3 | 36.0 | 185.8 | 167.5 | 210.9 | 191.5 |
| Passenger transport | 47.1 | 42.7 | 50.8 | 51.4 | 59.3 | 62.4 |
| Water supply | 72.6 | 67.9 | 91.4 | 81.6 | 113.6 | 100.2 |
| Road construction and maintenance | 159.3 | 160.2 | 195.6 | 194.3 | 230.5 | 228.9 |
| Refuse, sewerage, and drainage | 82.9 | 80.0 | 102.3 | 99.9 | 119.6 | 118.4 |
| Abattoirs | 13.2 | 12.6 | 15.7 | 15.1 | 20.4 | 19.3 |
| Libraries | 21.7 | 21.1 | 28.0 | 25.9 | 33.9 | 323 |
| Parks and domains | 60.9 | 56.8 | 67.7 | 64.4 | 82.9 | 81.1 |
Many of the services provided are also trading undertakings. Generally speaking, territorial local authorities are restrained from operating trading undertakings that are particularly profitable. Public transport undertakings, which are usually a substantial burden upon ratepayers, are particularly unprofitable. The only major exception is electricity distribution, from which a few territorial local authorities make surpluses.
BORROWING—Under the Local Authorities Loans Act 1956 all loan proposals of local authorities require the sanction of the Local Authorities Loans Board. This does not apply to money borrowed in anticipation of revenue, or loans covered by the Local Authorities Exemption Order 1983.
As a general rule, local authorities may raise a loan by special order and without a poll of ratepayers, but in the case of a local authority that is a rating body, a poll of ratepayers is to be taken if—
the Local Authorities Loans Board requires a poll to be taken; or
before the date fixed for the meeting of the local authority to confirm the resolution to raise the loan not less than 5 percent of the ratepayers demand a poll; or
the local authority itself decides to take a poll.
A poll cannot be required in cases such as renewal loans, loans raised for emergency expenditure by reason of flood, storm, earthquake, etc., or loans for work of national and local importance and carried out by an agreement between the Government and a local authority.
Where a poll is required it shall be deemed to be carried if a bare majority of the valid votes recorded is in favour of the proposal. The properties and revenue of the local authority may be pledged as security for the repayment of any principal sum or interest thereon, or a special rate may be levied for the same purpose.
The borrowing activities of certain types of local authority are subject to special provisions. Under the Hospitals Act 1957 a hospital board must first obtain the approval of the Minister of Health before exercising its power to borrow. Harbour boards derive their authority to borrow for harbour works from special empowering legislation and similar authority is given for the capital works of certain other local authorities.
The Local Authorities Loans Act 1956 places the determination of rates of interest in the hands of the Local Authorities Loans Board, subject to the approval of the Minister of Finance of the maximum rate.
The interest rates current on and from 13 September 1983 are as follows: 1 and 2 years, 8.5 percent; 3, 4, and 5 years, 9.0 percent; 6 years or more, 9.5 percent.
Loans Sanctioned, Authorised, Raised, and Uplifted—The following summary of the operations of the Local Authorities Loans Board during 5 recent years shows concisely the trend of local authority borrowing during that period. Hospital boards and the Fire Service Commission are included.
| Year Ended 31 March | Value of Total Applications | Sanctioned | |
|---|---|---|---|
| New Works | Redemption Loans | ||
| $(million) | |||
| 1979 | 391.1 | 279.1 | 24.7 |
| 1980 | 298.9 | 229.8 | 21.0 |
| 1981 | 410.5 | 351.4 | 17.9 |
| 1982 | 400.6 | 311.3 | 50.4 |
| 1983 | 409.9 | 289.9 | 37.0 |
The following table shows loans authorised during the year ended March 1983, with amounts raised and uplifted to 31 March 1983 on these authorisations.
| Authority | Amounts Authorised Year Ended 31 March 1983 | Amounts Raised to 31 March 1983 | Balance Not Raised at 31 March 1983 | Amounts Uplifted to 31 March 1983 |
|---|---|---|---|---|
| $(thousand) | ||||
| Territorial Local Authority— | ||||
| Cities and boroughs | 139,871 | 64,227 | 75,644 | 57,433 |
| County councils | 28,033 | 12,567 | 15,466 | 9,391 |
| District councils | 5,251 | 3,058 | 2,193 | 2,603 |
| Regional authority | 21,215 | 3,413 | 17,802 | 3,413 |
| Town districts | 34 | 34 | – | 22 |
| United councils | 697 | – | 697 | – |
| Other Local Authority— | ||||
| Catchment districts | 11,649 | 625 | 11,024 | 625 |
| Electric power and gas boards | 66,909 | 29,628 | 37,282 | 27,158 |
| Harbour boards | 42,592 | 23,138 | 19,454 | 19,653 |
| Valley authority | 220 | 67 | 153 | 67 |
| Miscellaneous | 50 | – | 50 | – |
| Urban drainage boards | 8,155 | 2,624 | 5,531 | 2,624 |
| Land drainage boards | 175 | 175 | – | 175 |
| Central Government— | ||||
| Fire Service Commission | 7,736 | 4,086 | 3,650 | 4,086 |
| Hospital boards | 55,875 | 33,964 | 21,911 | 22,982 |
| Total | 388,462 | 177,606 | 210,857 | 150,282 |
The following table shows, per head of the population, the gross public debt of local authorities, and the annual charge thereon for the latest 5 years. This does not include hospital board debt or the Fire Service Commission debt.
| Year Ended 31 March | Gross Public Debt | Annual Loan Charge | ||
|---|---|---|---|---|
| Amount | Rate Per Head | Amount | Rate Per Head | |
| $(000) | $ | $(000) | $ | |
| 1978 | 1,138,550 | 356.4 | 127,906 | 40.0 |
| 1979 | 1,270,957 | 404.5 | 142,782 | 45.4 |
| 1980 | 1,385,349 | 440.4 | 164,112 | 52.5 |
| 1981 | 1,546,220 | 487.6 | 185,364 | 58.4 |
| 1982 | 1,672,000 | 524.8 | 209,612 | 65.8 |
In the following table gross public debt is classified by types of local authority. It should be noted that the debt of electric power districts shown in the following table does not represent the complete local authority debt on account of electric power activities, since a considerable portion of the city and borough debt, and a small part of the county and town district debt also, was incurred for that purpose.
| Year Ended 31 March | Cities, Boroughs and Town Districts | Counties | Electric Power Districts | Harbour Districts | Urban Drainage Districts | Urban Transport District | Other Districts | Total |
|---|---|---|---|---|---|---|---|---|
| $(thousand) | ||||||||
| 1978 | 459,659 | 93,275 | 151,982 | 201,098 | 46,251 | 3,642 | 182,643 | 1,138,550 |
| 1979 | 510,038 | 102,449 | 178,570 | 232,148 | 50,924 | 3,405 | 193,424 | 1,270,958 |
| 1980 | 552,835 | 107,437 | 205,166 | 243,739 | 53,856 | 3,208 | 219,108 | 1,385,349 |
| 1981 | 614,271 | 121,031 | 240,925 | 251,055 | 54,352 | 3,050 | 261,536 | 1,546,220 |
| 1982 | 663,969 | 136,091 | 301,162 | 253,839 | 53,734 | 2,490 | 260,714 | 1,672,000 |
FURTHER INFORMATION—Further information on local government, especially the financial aspects, will be found in the following publications.
Local Authority Statistics—Department of Statistics (annual).
Monthly Abstract of Statistics—Department of Statistics.
Report of the Local Authorities Loans Board—(Parl paper B. 17).
Report of the Local Government Commission (Parl paper G 9).
Report of the Valuation Department (Parl. paper G. 26).
Local Authority Finance in New Zealand—Report of the Local Authority Finance Committee (1973).
Report of the Department of Internal Affairs (Parl. paper G. 7).
Forms of Financial Assistance Available to Local Authorities—Department of Internal Affairs (1980).
Particularly in times of relatively rapid inflation, comparisons between money incomes in different years should be made with caution. To be meaningful, comparisons should be made in terms of effective or real income, i.e., money in relation to the costs of goods and services. However, it is not easy to measure these changes as there is no one index that adequately gives a measure of the changing purchasing power in all circumstances. This is because the purchasing power of money is conditional to a large extent on the patterns of expenditure out of income, and these may and do differ substantially from person to person.
The elements of individual and company income and the taxation requirements of a modern welfare state are closely related. Statistics of incomes and income tax are compiled annually by the Department of Statistics. Complete details and methods of compilations are given in the annual statistical report on Incomes and Income Tax.
INCOME TRENDS: Persons—The data required for the statistical compilation of incomes do not become available for a lengthy period after the end of the income year. This, coupled with the necessary time taken by the statistical processing, means a long time lag before final results of the compilation are available.
In the following table average and median incomes of self-employed persons in selected industries and professions have been estimated from a restricted sample on a provisional basis. The averages and medians are based on total income derived from all sources and not on income from self-employment alone. Incomes of self-employed persons include an element of return on capital invested as well as a reward for personal work effort.
| Activity of Self-Employed Income Earner | Income Year | Income Year | ||||
|---|---|---|---|---|---|---|
| 1980–81 | 1981–82 | 1982–83 | 1980–81 | 1981–82 | 1982–83 | |
| * Arithmetic mean. | ||||||
| Averages* $ | Medians $ | |||||
| Agriculture and livestock production— | ||||||
| Dairy farming | 10,100 | 11,040 | 13,650 | 8,550 | 9,570 | 11,500 |
| Sheep farming | 12,400 | 12,630 | 13,700 | 10,740 | 10,730 | 11,750 |
| Other farming | 10,120 | 10,630 | 11,950 | 8,450 | 9,110 | 9,900 |
| Manufacturing | 8,470 | 9,700 | 11,450 | 6,130 | 7,260 | 8,400 |
| Building and construction | 10,520 | 12,700 | 14,800 | 9,550 | 11,280 | 12,600 |
| Wholesale and retail trade and restaurants and hotel | 9,080 | 10,330 | 11,350 | 6,830 | 8,220 | 8,950 |
| Transport and storage | 10,190 | 11,940 | 14,150 | 8,340 | 10,480 | 11,050 |
| Business, community, social, and personal services— | ||||||
| Legal practitioners | 31,930 | 38,850 | 41,250 | 28,890 | 35,330 | 36,650 |
| Chartered accountants | 25,470 | 29,540 | 32,250 | 24,070 | 26,130 | 29,850 |
| Medical practitioners (including surgeons, specialists, and physicians) | 34,530 | 36,290 | 43,250 | 28,670 | 33,910 | 38,150 |
| Dental practitioners | 29,910 | 31,650 | 37,450 | 30,950 | 31,000 | 38,700 |
| Other services | 11,280 | 13,360 | 14,600 | 8,660 | 10,090 | 11,050 |
COMPANIES—The following table contains provisional estimates of the assessable income and tax assessed (after deduction of tax credits) of companies for the 1981–82 and 1982–83 income years. The figures are subject to revision when data from the main company income sample become available.
The calculations are based on income values from a probability sample of just under 5000 income tax returns. Where the selected sample returns are not yet finalised estimates have been made.
In general the error arising from sampling is not expected to exceed plus or minus 20 percent of the estimated values in each industry division and should not exceed plus or minus 10 percent of the estimated values for the all industry totals.
Some estimates have been marked with an asterisk. For these figures it is considered prudent to allow for a possible error from sampling of up to plus or minus 50 percent of the estimated value. These figures should be used with caution.
| Industry Division | Income Year | |||||
|---|---|---|---|---|---|---|
| 1980–81 | 1981–82 | 1982–83 | ||||
| Assessable Income | Tax Assessed | Assessable Income | Tax Assessed | Assessable Income | Tax Assessed | |
| * These figures have a large sampling error and should be treated with caution. | ||||||
| $(million) | ||||||
| Agriculture, hunting, forestry and fishing | 25.2 | 10.9 | 24.7 | 10.6 | 23.3 | 10.0 |
| Mining and quarrying | 35.3 | 13.2 | 81.4 | 34.3 | 111.9 | 49.8 |
| Manufacturing | 633.5 | 244.8 | 859.2 | 316.2 | 846.0 | 318.7 |
| Electricity, gas and water | 2.2 | 1.0 | 2.7 | 1.2 | 3.4 | 1.6 |
| Building and construction | 42.8 | 17.9 | 74.3* | 29.2* | 85.4 | 35.0* |
| Wholesale and retail trade and restaurants and hotels | 577.2 | 250.7 | 590.5 | 254.8 | 453.9 | 192.5* |
| Transport, storage and communication | 39.1 | 14.4 | 44.6* | 17.4* | 48.3* | 19.4* |
| Financing, insurance, real estate and business services | 480.3 | 182.3 | 533.4 | 200.5 | 607.8 | 228.8 |
| Community, social and personal services | 29.7 | 13.3 | 37.0 | 16.6 | 33.5 | 15.0 |
| Total | 1865.4 | 748.5 | 2247.8 | 880.7 | 2213.6 | 870.7 |
FINAL DATA ON INCOMES—As stated at the beginning of this section, final data on incomes does not become available until a considerable time after the end of the income year. The previous tables in this section are provisional estimates based on restricted samples of tax returns. The summary tables following show final figures, with 1981–82 as the latest year. Final figures are published in detail in the annual report Incomes and Income Tax, published by the Department of Statistics.
The 1978–79 statistics are based substantially on a 5 percent sample for all incomes of less than $20,000; there is a complete coverage of all incomes of $20,000 and over. For 1979–80 the sample is 4 percent with complete coverage of incomes over $30,000, increased to $40,000 for 1980–81 and 1981–82.
The broad principle adopted in calculating the assessable income is that any expenditure or loss exclusively incurred in the production of assessable income for any year may be deducted from the total income from any assessable source for that year. Depreciation is allowed, varying rates for different classes of assets being fixed. The assessable income is approximately equivalent to the net profit as determined by the normal commercial accounting systems after the deduction of special taxation incentive allowances. Before the deduction of these allowances it is, on the whole, rather higher than the commercial net profit, since certain types of expenditure which are regarded as a revenue charge in commercial accounts are not permissible deductions for income tax purposes.
Capital profits are not assessable and capital losses are not deductible.
Classes of Taxpayers—“Persons” comprise all assessments for individual persons. Partnership returns are ignored in the compilation, as the individual shares of partnership income are included in the individual tax assessments. The incomes of deceased persons' estates are not included, as the greater part of these are transferred to assessments of the beneficiaries.
The term “companies” not only covers companies incorporated under the Companies Act and other Acts relating to the formulation of companies, but also includes associations (incorporated or unincorporated), and aggregations of individuals (other than partnerships) which form separate and distinct entities for income tax purposes. Government departments which are liable to pay income tax are included, but most local and public authorities are not taxable even in respect of their trading operations, and consequently are not included in these statistics.
Summary—The following tables summarise the main items of information for income years.
| PERSONS | ||||||
|---|---|---|---|---|---|---|
| Year | Number of Returns | Total Income | Exemptions | Rebates | Taxable Income | Income Tax Assessed |
| No. | $(thousand) | |||||
| 1978–79 | 1,685,520 | 11,831,820 | 504,520 | 361,000 | 11,328,570 | 2,949,310 |
| 1979–80 | 1,715,960 | 13,788,410 | 569,180 | 232,240 | 13,221,030 | 3,483,330 |
| 1980–81 | 1,664,250 | 15,859,230 | 617,130 | 218,310 | 15,244,150 | 4,165,350 |
| 1981–82 | 1,711,900 | 19,093,200 | 687,220 | 288,760 | 18,408,530 | 5,223,390 |
| COMPANIES | |||||
|---|---|---|---|---|---|
| Year | Number of Returns | Assessable Income* | Ordinary Dividends Received† | Income Tax Assessed‡ | Tax Credits |
* In ascertaining assessable income any expenditure exclusively incurred in the production of the income for the year may be deducted. †Ordinary dividends received are exempt from tax in the hands of the receiving company and are therefore not included in “assessable income”. ‡Includes non-resident witholding tax. | |||||
| No. | $(thousand) | ||||
| 1976–77 | 80,712 | 1,233,410 | 130,952 | 511,501 | |
| 1977–78 | 80,430 | 1,036,694 | 221,476 | 452,152 | |
| 1978–79 | 81,365 | 1,330,183 | 272,304 | 577,758 | |
| 1979–80 | 80,833 | 1,464,756 | 280,793 | 630,492 | |
| 1980–81 | 80,826 | 1,865,363 | 364,773 | 748,514 | 185,547 |
A strict comparison of the figures for any year with those of another is not possible, as changes in compilation practice and numerous amendments in income tax law have affected the comparability of the figures.
The next table shows some additional data concerning companies, relating to the income year 1980–81.
| Industry Division | Stocks at End of Period | Income | Expenditure | |||||
|---|---|---|---|---|---|---|---|---|
| Sales and Services | Interest and Rents | Purchases | Salaries and Wages | Interest and Rents | Depreciation | Gross Profit | ||
| $(million) | ||||||||
| Agriculture, hunting, forestry, and fishing | 167.1 | 1,025.7 | 18.8 | 20.9 | 247.3 | 85.2 | 54.0 | 614.4 |
| Mining and quarrying | 19.2 | 381.1 | 6.9 | – | 48.3 | 85.0 | 25.8 | – |
| Manufacturing | 2,986.1 | 17,389.7 | 9.47 | 9,382 3 | 3,170.3 | 475.0 | 336.4 | 5,150.1 |
| Electricity, gas, and water | 3.5 | 67.6 | 0.3 | 48.7 | 7.1 | 0.9 | 1.7 | 17.4 |
| Buffeting and construction | 240.4 | 2,207.1 | 14.2 | 1,099.3 | 506.9 | 47.5 | 39.3 | 667.7 |
| Wholesale and retail trade and restaurants and hotels | 3,564.2 | 25,214.2 | 134.6 | 20,046.8 | 2,023.2 | 577.7 | 174.0 | 4,398.0 |
| Transport, storage, and communication | 11.7 | 2,199.1 | 23.1 | 60.7 | 550.1 | 108.4 | 101.5 | – |
| Financing, insurance, real estate, and business services | 89.7 | 2,643.5 | 2,517.6 | 163.3 | 782.2 | 1.741.3 | 112.0 | – |
| Community, social, and personal services | 40.5 | 827.2 | 14.3 | 211.1 | 306.2 | 34.0 | 22.7 | 190.2 |
| Total 1980–81 | 7,122.5 | 51,955.2 | 2,824.5 | 31,214.3 | 7,641.6 | 3,154.9 | 867.5 | 11,037.8 |
| 1979–80 | 6,222.8 | 43,475.6 | 2,342.2 | 26,569.6 | 6,525.3 | 2,517.4 | 792.6 | 8,872.1 |
| 1978–79 | 5,162.9 | 36,663.8 | 1,892.6 | 21,624.9 | 5,509.2 | 1,882.5 | 781.0 | 7,351.7 |
One point which should be noted is that the purchase figures for the Agriculture, Hunting, Forestry, and Fishing Industry Division and the Mining and Quarrying Industry Division do rot include purchases for forestry companies or for mining and quarrying companies. It was found that there was a considerable lack of uniformity in such data for that type of company. This was probably connected with differing treatments of royalty and equivalent payments.
The amount of gross profit shown in the accounts is used in there statistics, despite the wide variations in the conceptions of gross profit. No attempt has been made to secure uniformity of calculation for individual companies, but of course the total gross profit for each industry should correspond with that industry's average conception of gross profit. In some industries, such as the transport industry, it is not normal practice to calculate gross profit, and in some cases the gross profit is recorded in these statistics as nil. Estimates of the amount of gross profit were, however, made when any company did not calculate the gross profit, and it was the custom of the industry concerned to show this figure.
The abridged version of the full industry classification for which data are given in this publication does not reveal the individual industries where the gross profit is not generally calculated. Apart from “Mining and quarrying”, and “Transport, storage, and communication”, there are a number of industries included in “Community, social, and personal services” which do not show a gross profit.
Companies with Overseas Affiliations—Two types of companies operating in New Zealand but subject to some degree of overseas control have been identified. The 2 types are:
branches of overseas organisations operating in New Zealand;
New Zealand-registered companies with 25 percent or more of their equity shareholding subject to overseas control.
The second category includes not only companies in which overseas residents have a 25 percent or greater shareholding, but also companies which are subject to this degree of control without themselves having any overseas owners. For instance, if a New Zealand company was 50 percent owned by another New Zealand company, which itself was 50 percent overseas owned, the company would qualify as having 25 percent overseas control. These are generally termed “second generation” companies.
Overseas companies whose only New Zealand income is from investments, patent rights, royalties, copyrights, and the like, are not included in the 1599 companies selected, as they are not considered to be active in the New Zealand economy. Also excluded are those overseas companies such as air and shipping lines, which enjoy exemption from New Zealand income tax under the terms of double taxation agreements with their own countries.
The 25 percent minimum equity criterion used to classify a New Zealand company as subject to some degree of overseas control approximates the definition of international private direct investment used by such organisations as the International Monetary Fund. Although the measure of overseas control of New Zealand firms varies according to a great number of circumstances, a minimum holding of 25 percent does provide a consistent and practical criterion for determining its presence.
In the following table, 4 significant values for the 1599 overseas controlled companies are shown in industry groups both as absolute values, and as percentages of the totals for all companies assessed for income tax in the 1980–81 income year. The figures for assessable income indicate that overseas-affiliated companies are, on average, larger units than are wholly New Zealand controlled companies. On the other hand it must be remembered that the New Zealand companies include Government trading departments which may follow profit policies different from private sector companies and for which capital values are not included in shareholders' funds. The figures also suggest that there is some concentration of branches and subsidiaries of overseas companies in the nine manufacturing groups and mining and quarrying; these industries offer scope to large concerns with access to capital and technical expertise.
| Industry Group | Number of Returns | Assessable Income | Income Tax Assessed | Salaries and Wages | Dividends Paid | |
|---|---|---|---|---|---|---|
* Companies with overseas affiliations. †All New Zealand companies including those with overseas affiliations. ‡Percentage of companies with overseas affiliations to all New Zealand companies. | ||||||
| $(thousand) | ||||||
| Overseas* | 33 | 2,562 | 1,054 | 1,633 | 313 | |
| All N.Z.† | 7,213 | 25,248 | 10,933 | 247,254 | 8,606 | |
| Agriculture, hunting, forestry and fishing | Percent‡ | 0.5 | 10.1 | 9.6 | 0.7 | 3.6 |
| Overseas* | 34 | 4,835 | 1,988 | 4,731 | 24,698 | |
| All N.Z.† | 288 | 36,329 | 13,239 | 48,297 | 29,836 | |
| Mining and quarrying | Percent‡ | 11.8 | 13.7 | 15.0 | 9.8 | 82.8 |
| Manufacturing— | ||||||
| Food, beverages, and tobacco | Overseas* | 52 | 45,088 | 18,039 | 202,215 | 9,672 |
| All N.Z.† | 970 | 167,309 | 68,143 | 879,434 | 50,025 | |
| Percent‡ | 5.4 | 26.9 | 26.5 | 23.0 | 19.3 | |
| Overseas* | 37 | 3,371 | 1,394 | 30,871 | 2,979 | |
| Textiles, wearing apparel and leather goods | All N.Z.† | 1,291 | 41,352 | 14,849 | 367,852 | 26,120 |
| Percent‡ | 2.9 | 8.2 | 9.4 | 8.4 | 11.4 | |
| Overseas* | 7 | 8,482 | 3,337 | 15,708 | 1,043 | |
| Wood and wood products including furniture | All N.Z.† | 1,239 | 50,489 | 17,038 | 263,779 | 24,682 |
| Percent‡ | 0.6 | 16.8 | 19.6 | 6.0 | 4.2 | |
| Paper and paper products | Overseas* | 48 | 13,451 | 5,213 | 29,822 | 5,323 |
| All N.Z.† | 1,145 | 62,231 | 24,549 | 355,141 | 21,551 | |
| Percent‡ | 4.2 | 21.6 | 21.2 | 8.4 | 24.7 | |
| Overseas* | 122 | 90,514 | 36,723 | 160,507 | 22,275 | |
| Chemicals and chemical petroleum, coal, rubber, and plastic products | All N.Z.† | 713 | 114,357 | 45,903 | 302,113 | 28,575 |
| Percent‡ | 17.1 | 79.2 | 80.0 | 53.1 | 78.0 | |
| Overseas* | 21 | 18,953 | 7,405 | 37,941 | 5,585 | |
| Non-metallic mineral products, except products of petroleum and coal | All N.Z.† | 439 | 30,546 | 12,193 | 98,132 | 8,571 |
| Percent‡ | 4.8 | 62.0 | 60.7 | 38.7 | 65.2 | |
| Basic metal industries | Overseas* | 11 | 2,412 | 1,080 | 30,254 | 1,407 |
| All N.Z.† | 104 | 15,311 | 5,870 | 79,732 | 8,232 | |
| Percent‡ | 10.6 | 15.8 | 18.4 | 37.9 | 17.1 | |
| Overseas* | 187 | 59,120 | 24,012 | 235,342 | 17,634 | |
| Fabricated metal products, machinery, and equipment | All N.Z.† | 4,023 | 146,823 | 54,244 | 792,927 | 36,509 |
| Percent‡ | 4.6 | 40.3 | 44.3 | 29.7 | 48.3 | |
| Other manufacturing industries | Overseas* | 16 | 1,593 | 706 | 5,432 | 216 |
| All N.Z.† | 491 | 5,096 | 1,984 | 31,223 | 578 | |
| Percent‡ | 3.3 | 31.3 | 35.6 | 17.4 | 37.4 | |
| Electricity, gas, and water | Overseas* | 33 | 2,687 | 1,227 | 18,548 | 574 |
| All N.Z.† | 7,117 | 44,909 | 18,895 | 514,049 | 4,051 | |
| Construction | Percent‡ | 0.5 | 6.0 | 6.5 | 3.6 | 14.2 |
| Overseas* | 435 | 214,480 | 95,110 | 236,125 | 23,448 | |
| Wholesale and retail trade and restaurants and hotels | All N.Z.† | 23,895 | 577,248 | 250,660 | 2,023,161 | 104,486 |
| Percent‡ | 1.8 | 37.2 | 37.9 | 11.7 | 22.4 | |
| Overseas* | 56 | 7,215 | 2,636 | 62,569 | 3,721 | |
| Transport, storage, and communication | All N.Z.† | 2,837 | 39,125 | 14,426 | 560,101 | 20,380 |
| Percent‡ | 2.0 | 18.4 | 18.3 | 11.4 | 18.3 | |
| Overseas* | 472 | 213,142 | 83,228 | 281,671 | 54,179 | |
| Financing, insurance, real estate, and business services | All N.Z.† | 24,038 | 480,250 | 182,329 | 782,218 | 247,662 |
| Percent‡ | 2.0 | 44.5 | 45.6 | 36.0 | 21.9 | |
| Overseas* | 35 | 8,650 | 3,867 | 36,780 | 2,419 | |
| Community, social, and personal services | All N.Z.† | 5,023 | 29,741 | 13,259 | 306,196 | 5,025 |
| Percent‡ | 0.7 | 29.1 | 29.2 | 12.0 | 48.1 | |
| All industries | Overseas* | 1,599 | 696,558 | 287,019 | 1,390,148 | 175,486 |
| All N.Z.† | 80,826 | 1,865,363 | 748,514 | 7,641,607 | 624,890 | |
| Percent‡ | 2.0 | 37.3 | 38.3 | 18.2 | 28.1 | |
CENSUS OF POPULATION AND DWELLINGS 1981: Incomes of Individuals—The following statistics on incomes were compiled from the Census of Population and Dwellings taken on 24 March 1981.
Final data on incomes from the 1981 Census have been randomly rounded. All cell values including real and column totals have been rounded, using simple random rounding, to base three. In some cases, it has been necessary to add rounded figures in order to obtain the required figure. Thus individual figures may not necessarily sum to give the stated total.
The question on incomes in the 1981 Census questionnaire asked for income for the year ended 31 March 1981 from all sources except social security benefits and war pensions (these were the subject of a separate question).
The following table shows, by income group, usually-resident persons in the full-time labour force and also the total usually-resident population aged 15 years and above. Persons in the labour force but with relatively small incomes for the year ended March 1981 would include considerable numbers of school leavers who began work late in 1980 or early in 1981 as well as persons unemployed but seeking work and those assisting relatives without pay.
Over half (52 percent) of the male full-time labour force had incomes between $8,000 and $15,999, while only 41.2 percent of the female labour force had incomes in this range. The median income for males in the labour force was $11,816 and for females $7,693.
The lower number of hours worked weekly by women appears to be partly responsible for the income differential. Women made up the majority (81.6 percent) of all persons working less than 35 hours per week, and only constituted 34.2 percent of the full-time labour force.
| Income Group | Persons in Full-time Labour Force*† | Total Population Aged 15 Years and Over* | ||||
|---|---|---|---|---|---|---|
| Males | Females | Total | Males | Females | Total | |
* New Zealand residents. †Aged 15 years and over. | ||||||
| $ | ||||||
| Nil or loss | 20,040 | 16,698 | 36,738 | 110,835 | 345,225 | 456,060 |
| 1–1,999 | 25,458 | 33,768 | 59,229 | 94,674 | 213,645 | 308,319 |
| 2,000–4,999 | 42,771 | 71,487 | 114,255 | 75,114 | 144,708 | 219,822 |
| 5,000–9,999 | 209,604 | 178,830 | 388,437 | 230,637 | 209,466 | 440,106 |
| 10,000–13,999 | 239,718 | 89,466 | 329,184 | 246,192 | 96,975 | 343,170 |
| 14,000–19,999 | 176,583 | 26,160 | 202,740 | 179,982 | 29,250 | 209,238 |
| 20,000–24,999 | 55,419 | 4,506 | 59,928 | 56,604 | 5,544 | 62,148 |
| 25,000–29,999 | 20,451 | 1,347 | 21,795 | 20,943 | 1,764 | 22,707 |
| 30,000–39,999 | 16,539 | 1,074 | 17,613 | 17,019 | 1,521 | 18,543 |
| 40,000–59,999 | 9,600 | 594 | 10,197 | 9,855 | 843 | 10,698 |
| 60,000 and over | 6,216 | 351 | 6,567 | 6,357 | 483 | 6,840 |
| Not specified | 54,201 | 31,449 | 85,653 | 82,134 | 116,925 | 199,056 |
| Total | 876 606 | 455 733 | 1 332 342 | 1 130 340 | 1 166 364 | 2 296 704 |
The two following tables show 1981 Census incomes data by the sex and employment status of the recipients. They refer to persons 15 years of age and over who are usually resident in New Zealand. Income from social security benefits and war pensions is excluded.
| Income Group | Employment Status | Total Full-time Labour Force | |||||
|---|---|---|---|---|---|---|---|
| Self Employed Has Employees | Sell Employed No Employees | Wage or Salary Earner | Relative Assisting (Unpaid) | Unemployed Seeking Work | Not Specified (20 or More Hours Worked) | ||
| $ | Males | ||||||
| Nil or loss | 942 | 1,443 | – | 315 | 17,193 | 144 | 20,040 |
| 1–1,999 | 606 | 1,965 | 18,714 | 261 | 3,837 | 87 | 25,458 |
| 2,000–4,999 | 2,388 | 6,306 | 30,093 | 270 | 3,609 | 99 | 42,771 |
| 5,000–9,999 | 10,830 | 21,243 | 173,229 | 267 | 3,771 | 270 | 209,604 |
| 10,000–13,999 | 12,696 | 17,886 | 207,612 | 111 | 1,215 | 204 | 239,718 |
| 14,000–19,999 | 11,016 | 10,842 | 154,164 | 48 | 408 | 105 | 176,583 |
| 20,000–24,999 | 6,567 | 4,641 | 44,058 | 30 | 93 | 33 | 55,419 |
| 25,000–29,999 | 3,771 | 2,367 | 14,241 | 12 | 42 | 21 | 20,451 |
| 30,000–39,999 | 5,190 | 2,712 | 8,589 | 9 | 27 | 12 | 16,539 |
| 40,000–59,999 | 4,179 | 2,010 | 3,378 | 6 | 15 | 15 | 9,600 |
| 60,000 and over | 3,648 | 1,041 | 1,506 | 3 | 6 | 12 | 6,216 |
| Not specified | 2,490 | 3,384 | 41,301 | 162 | 4,278 | 2,586 | 54,201 |
| Total | 64 329 | 75 843 | 696 894 | 1 488 | 34 479 | 3 573 | 876 606 |
| $ | Females | ||||||
| Nil or loss | 513 | 738 | – | 1,770 | 13,512 | 165 | 16,698 |
| 1–1,999 | 699 | 1,746 | 26,688 | 1,023 | 3,531 | 81 | 33,768 |
| 2,000–4,999 | 2,034 | 3,822 | 62,271 | 639 | 2,622 | 102 | 71,487 |
| 5,000–9,999 | 4,347 | 5,028 | 166,749 | 450 | 2,148 | 117 | 178,830 |
| 10,000–13,999 | 2,424 | 2,151 | 84,276 | 129 | 447 | 39 | 89,466 |
| 14,000–19,999 | 1,284 | 1,263 | 23,400 | 120 | 72 | 18 | 26,160 |
| 20,000–24,999 | 651 | 600 | 3,198 | 48 | 6 | 9 | 4,506 |
| 25,000–29,999 | 309 | 330 | 678 | 27 | 3 | – | 1,347 |
| 30,000–39,999 | 372 | 294 | 363 | 33 | 6 | 6 | 1,074 |
| 40,000–59,999 | 237 | 180 | 132 | 33 | 3 | 3 | 594 |
| 60,000 and over | 207 | 66 | 66 | 12 | – | – | 351 |
| Not specified | 969 | 1,071 | 24,420 | 660 | 3,402 | 936 | 31,449 |
| Total | 14 052 | 17 289 | 392 235 | 4 941 | 25 773 | 1 446 | 455 733 |
| Income Group | Not in Full-time Labour Force | Total Population Aged 15 Years and Over* | ||||
|---|---|---|---|---|---|---|
| Retired | Full time Student | Household Duties (Unpaid) | Other | Total | ||
| * New Zealand residents. | ||||||
| $ | Males | |||||
| Nil or loss | 44,001 | 35,214 | 1,875 | 9,705 | 90,795 | 110,835 |
| 1–1,999 | 42,768 | 23,076 | 657 | 2,703 | 69,216 | 94,674 |
| 2,000–4,999 | 21,735 | 8,523 | 354 | 1,731 | 32,343 | 75,114 |
| 5,000- 9,999 | 17,082 | 1,854 | 324 | 1,773 | 21,033 | 230,637 |
| 10,000–13,999 | 5,370 | 324 | 114 | 666 | 6,474 | 246,192 |
| 14,000–19,999 | 2,946 | 93 | 54 | 300 | 3,399 | 179,982 |
| 20,000–24,999 | 1,053 | 18 | 15 | 99 | 1,185 | 56,604 |
| 25,000–29,999 | 447 | 6 | – | 33 | 492 | 20,943 |
| 30,000–39,999 | 423 | 6 | – | 51 | 480 | 17,019 |
| 40,000–59,999 | 222 | – | – | 27 | 255 | 9,855 |
| 60,000 and over | 114 | 3 | 3 | 21 | 141 | 6,357 |
| Not specified | 13,947 | 8,451 | 486 | 5,049 | 27,933 | 82,134 |
| Total | 150 111 | 77 577 | 3 888 | 22 155 | 253 734 | 1 130 340 |
| Females | ||||||
| Nil or loss | 50,202 | 37,236 | 232,773 | 8,316 | 328,527 | 345,225 |
| 1–1,999 | 43,869 | 19,062 | 112,425 | 4,524 | 179,877 | 213,645 |
| 2,000–4,999 | 14,907 | 4,953 | 50,895 | 2,472 | 73,221 | 144,708 |
| 5,000–9,999 | 6,933 | 987 | 21,438 | 1,281 | 30,636 | 209,466 |
| 10,000–13,999 | 1,716 | 177 | 5,322 | 300 | 7,509 | 96,975 |
| 14,000–19,999 | 789 | 69 | 2,142 | 102 | 3,090 | 29,250 |
| 20,000–24,999 | 255 | 6 | 753 | 21 | 1,038 | 5,544 |
| 25,000–29,999 | 99 | – | 303 | 12 | 417 | 1,764 |
| 30,000–39,999 | 108 | 3 | 324 | 9 | 447 | 1,521 |
| 40,000–59,999 | 66 | 3 | 174 | 6 | 249 | 843 |
| 60,000 and over | 30 | – | 99 | 3 | 132 | 483 |
| Not specified | 17,793 | 9,093 | 53,679 | 4,908 | 85,476 | 116,925 |
| Total | 136 770 | 71 574 | 480 321 | 21 963 | 710 631 | 1 166 364 |
Income Earners in Each Household—An analysis of income earners in each household was made from the information collected at the Census of Population in 1981. For this analysis an income earner was defined as one who received $1000 or more a year, excluding social welfare benefits and war pensions. A summary of the analysis is given in the following table.
| Number of Household Members | Number of Private Households With— | Total Households* | |||||
|---|---|---|---|---|---|---|---|
| No Income Earners | 1 Income Earner | 2 Income Earners | 3 Income Earners | 4 Income Earners | 5 or More Income Earners | ||
| * Includes a number of households where income of members was not specified. | |||||||
| 1 | 61,494 | 106,692 | – | – | – | – | 184,992 |
| 2 | 56,028 | 89,010 | 137,298 | – | – | – | 293,004 |
| 3 | 16,479 | 58,938 | 55,086 | 30,141 | – | – | 164,640 |
| 4 | 10,836 | 70,515 | 66,771 | 20,283 | 10,464 | – | 181,707 |
| 5 | 5,478 | 39,804 | 37,794 | 12,801 | 6,363 | 2,181 | 105,945 |
| 6 | 2,619 | 15,300 | 14,361 | 6,417 | 3,195 | 1,503 | 44,019 |
| 7 | 1,146 | 5,061 | 4,728 | 2,697 | 1,392 | 819 | 16,119 |
| 8 | 546 | 1,959 | 1,863 | 1,140 | 645 | 444 | 6,711 |
| 9 or more | 582 | 1,479 | 1,500 | 1,074 | 645 | 603 | 5,970 |
| Total | 155 208 | 388 758 | 319 401 | 74 556 | 22 707 | 5 550 | 1 003 113 |
Social Security Income—Some 43.2 percent (988 404 persons) of the resident population aged 15 years and over were receiving a social security benefit for all or part of the year ended March 1981.
Nearly three quarters of these people (73.9 percent) were females of whom 53 percent were receiving family benefit only. The family benefit is the smallest regular cash benefit and the following table shows that females dominate the lower end of social security income distribution.
The most common group for males was $3,000-$3,999 and for females $500-$999 per year. The median social security income for males was $3,188 and for females $959.
| Social Security Income for Year Ended 31 March 1981 | Males | Distribution* | Females | Distribution* |
|---|---|---|---|---|
* Excluding nil income. †New Zealand residents aged 15 years and over. | ||||
| $ | No. | Percent | No. | Percent |
| Nil | 867,318 | 429,222 | ||
| 1–499 | 25,512 | 10.4 | 170,961 | 24.5 |
| 500–999 | 13,953 | 5.7 | 193,008 | 27.7 |
| 1,000–1,999 | 13,596 | 5.6 | 47,367 | 6.8 |
| 2,000–2,999 | 49,626 | 20.3 | 60,972 | 8.8 |
| 3,000–3,999 | 104,244 | 42.6 | 140,157 | 20.1 |
| 4,000–4,999 | 29,244 | 12.0 | 66,702 | 9.6 |
| 5,000–5,999 | 5,841 | 2.4 | 13,701 | 2.0 |
| 6,000 and over | 2,565 | 1.0 | 3,678 | 0.5 |
| Not specified | 18,441 | 40,602 | … | |
| Total† | 1 130 340 | 1166 364 | … | |
FURTHER INFORMATION—Further information on income tax will be found in Section 27B Public Account Taxation. Other publications containing information and data on incomes and income tax include the following:
Incomes and Income Tax—Department of Statistics (annual).
Monthly Abstract of Statistics—Department of Statistics.
Report of the Inland Revenue Department (Parl. paper B. 23).
Census of Population and Dwellings 1976—Vol. 5 Incomes and Social Security Benefits.
Census of Population and Dwellings 1981—Bulletin 11 National Summary.
Census of Population and Dwellings 1981—Vol. 5 Incomes and Social Security Benefits.
The core of the New Zealand banking system comprises a central bank (the Reserve Bank of New Zealand) and 4 commercial or trading banks. There are also 12 trustee savings banks and the Post Office Savings Bank, while each trading bank has a private savings bank subsidiary. In addition, a number of trading companies, investment societies, etc., perform quasi-banking functions, accepting deposits and granting credits (short-term and long-term) to clients. In some instances deposits are repayable to the client's order at call. Particularly since the 1960s, an expansion in the size and scope of near-banks (or non-banking financial institutions) has been a feature in New Zealand as in many other countries. The Reserve Bank's publication Monetary Policy and the New Zealand Financial System (Second edition 1983) provides a general oversight of the financial system and the implementation of monetary policy in New Zealand.
RESERVE BANK OF NEW ZEALAND—The Reserve Bank of New Zealand, the central bank, was originally established in 1933 as a privately-owned institution, but became a fully State-owned institution in 1936. A brief survey of its historical development was included in this section in the 1976 and earlier Yearbooks. The 1933 Act establishing the bank was the culmination of proposals ranging back to 1886 that a central bank or a State trading bank should be set up in New Zealand. The Reserve Bank of New Zealand Act 1964 and amendments provided the Reserve Bank with powers in line with modern central banking practice and monetary policy. It provided the Government and the Reserve Bank with flexible authority to take such monetary action as might be appropriate to the times with respect to any financial institution.
Functions of the Bank—Section 8 of the Reserve Bank of New Zealand Act, as amended in 1973, states the primary functions of the bank, its basic relationships with Parliament, the Government, and the Minister of Finance, and lays down the criteria for Government monetary policy. The section reads:
The primary functions of the bank shall be—
To act as the central bank for New Zealand; and
To ensure that the availability and conditions of credit provided by financial institutions are not inconsistent with the sovereign right of the Crown to control money and credit in the public interest; and
To advise the Government on matters relating to monetary policy, banking, credit, and overseas exchange; and
Within the limits of its powers, to give effect to the monetary policy of the Government as communicated in writing to the bank under subsection (2) of this section, and to any resolution of Parliament in relation to that monetary policy.
For the purposes of this Act, the Minister may from time to time communicate to the bank the monetary policy of the Government, which shall be directed to the maintenance and promotion of economic and social welfare in New Zealand, having regard to the desirability of promoting the highest level of production and trade and full employment, and of maintaining a stable internal price level.
The bank shall, as directed by the Minister, regulate and control on behalf of the Government—
Money, banking, banking transactions, any class of transactions of financial institutions, credit, currency and the borrowing and lending of money;
Rates of interest in respect of such classes of transactions as may from time to time be prescribed;
Overseas exchange and overseas exchange transactions.
The bank shall make such loans to the Government and on such conditions as the Minister decides from time to time, in order to ensure the continuing full employment of labour and other resources of any kind.
The bank also has a number of subsidiary functions including:
Banking functions for the Government, Government trading organisations, and the primary produce marketing authorities as well as for the trading banks.
Management of the note and coin issue.
Management of public and local authority debt.
Management of foreign exchange reserves.
The administration of various acts including the Overseas Investment Act 1973, the Trustee Savings Bank Act 1948, and the Private Savings Bank Act 1964.
The administration of various regulations including the Financial Services Regulations (No. 2) 1983 and the Economic Stabilisation (Mortgage Loans) Regulations 1983 as well as regulations concerning the trustee and private savings banks and the public sector securities requirements of other financial institutions.
Maintaining relations with international organisations such as IMF, IBRD, and OECD.
Economic research.
Whilst the bank must give effect to Government monetary policy, or to resolutions of Parliament related thereto, the directors are given a fair degree of independence and responsibility in the management of the bank and the conduct of its business.
The exercise of the Reserve Bank's powers is at the discretion of the directors, but the consent of the Minister of Finance is required in certain special cases. The consent of the Governor-General in Council is required before the bank can engage in trade or have a direct interest in any commercial, industrial, or financial institution, or purchase, or lend against, the shares of a trading bank or financial institution. The Government is required to entrust to the bank, and the bank to undertake, free of charge to the Government, all Government banking transactions.
The Reserve Bank has 10 directors, comprising the Governor, the Deputy Governor, the Secretary to the Treasury, and 7 other directors appointed by the Governor-General in Council.
Bank Notes—The bank retains the sole right of issue, and has authority for the calling in, with the consent of the Minister, of any note or series of notes issued by the bank. Notes called in cease to be legal tender, but remain a liability of the bank. Provisions covering the defacing of bank notes and their reproduction or imitation without the prior consent of the bank are in the Reserve Bank Act.
Overseas Exchange—Part IV of the Reserve Bank Act 1964 deals with overseas exchange and other transactions affecting the overseas reserves of New Zealand. Relative to the New Zealand dollar the bank has the authority to fix the exchange rates used in its operations, and may also prescribe or approve the rates of exchange used by other persons in foreign exchange transactions vis-a-vis the New Zealand dollar. The Governor, with the prior consent of the Minister, may temporarily suspend dealings in foreign exchange.
Pursuant to the Act and under the Exchange Control Regulations, the bank has delegated authority from the Minister to license foreign exchange dealers on terms and conditions it considers relevant.
Since the holding of external reserves is dependent on aspects of economic policy and conditions beyond the control of the Reserve Bank, the bank's duty is defined as follows: “to endeavour, within the limit of its powers, to maintain, in addition to any holdings of gold, an adequate level of overseas reserves”. The bank keeps the Minister of Finance informed of the overseas exchange position and prospects. To assist it in carrying out this duty to hold reserves, the bank has a statutory power to require trading banks and foreign exchange dealers to sell to it their foreign exchange holdings in excess of maximum amounts prescribed by the Reserve Bank.
Comprehensive provisions for exchange control regulations are set out in Part IV of the Act, as are provisions for regulations covering dealings in gold. This part of the Act also provides for an indemnity under which changes in New Zealand currency value of the bank's overseas assets (less offsetting changes in the New Zealand currency value of its overseas liabilities) are settled between the bank and the Government.
Regulation of Banking and Credit—In Part V of the 1964 Act, trading banks are required to make monthly returns to the Reserve Bank detailing their principal liabilities and assets. Statutory authority has been provided for obtaining such subsidiary returns and other information from trading banks as the Reserve Bank may require.
This section authorises the application of reserve ratios. Subject to the approval of the Minister, the trading banks may be required to hold balances at the Reserve Bank or to hold assets of specified kinds, including balances at the Reserve Bank. The minimum requirements may be laid down as a percentage of deposit liabilities or of assets, as a percentage of parts of such deposit liabilities or assets, or as percentages of both, or in any other manner. Different percentages may be laid down for different classes of deposit liabilities or assets.
The Reserve Bank is authorised to give directions to trading banks as to the policy to be followed in relation to advances, discounts, and investments and in relation to rates of interest or discount.
The Reserve Bank of New Zealand Amendment Act 1973 extended the controls previously exercised over the trading banks to include all financial institutions. The Amendment Act provided the monetary authorities with forms of control over non-bank financial institutions including the power to make recommendations or give directives, to specify rates of interest, to require the holding of specified assets, and to inspect books and request information. Apart from these direct controls over financial institutions, the Reserve Bank may influence the financial system by buying and selling Government securities. Fuller information on instruments of monetary control and their operation is given later in this section.
Statistics collected from trading banks, finance companies, building societies, the short-term money market, the commercial bill market, life assurance companies, stock and station agents, and all savings banks appear regularly in the Reserve Bank Bulletin.
Liabilities and Assets—Details of the liabilities and assets of the Reserve Bank at the end of June for the latest 3 years, and monthly averages for calendar (December) years are shown in the following tables.
| LIABILITIES OF THE RESERVE BANK | |||||||||
|---|---|---|---|---|---|---|---|---|---|
| Year | Bank Notes | Deposits | Overseas Liabilities | Other Liabilities | Total Liabilities | ||||
| State | Marketing | Other | Short-term | Long-term | Allocation of Special Drawing Rights | ||||
| $(million) | |||||||||
| Monthly Average for Calendar Year | |||||||||
| 1981 | 588.6 | 226.0 | 79.6 | 60.3 | 187.5 | 530.4 | 191.4 | 146.8 | 2,010.5 |
| 1982 | 625.8 | 347.2 | 95.1 | 45.6 | 149.9 | 1,261.8 | 207.7 | 219.9 | 2,953.0 |
| 1983 | 633.9 | 916.7 | 179.0 | 142.7 | 71.1 | 1,337.6 | 226.9 | 211.4 | 3,719.3 |
| At End of June | |||||||||
| 1981 | 567.8 | 210.9 | 76.0 | 23.9 | 113.8 | 511.0 | 188.4 | 143.3 | 1,835.0 |
| 1982 | 627.7 | 238.1 | 83.5 | 39.1 | 340.1 | 1,125.8 | 207.2 | 171.7 | 2,833.2 |
| 1983 | 615.1 | 1,341.9 | 168.5 | 267.6 | 5.1 | 1,370.7 | 229.3 | 202.0 | 4,200.3 |
| ASSETS OF THE RESERVE BANK | ||||||||||
|---|---|---|---|---|---|---|---|---|---|---|
| Year | Gold | Overseas Assets | Investments in New Zealand | Advances and Discounts | Other | Other Assets | ||||
| Short-term | Long-term | Special Drawing | State | Marketing | Trading Banks | |||||
| $(million) | ||||||||||
| Monthly Average for Calendar Year | ||||||||||
| 1981 | 0.7 | 160.7 | 27.2 | 32.6 | 592.5 | 286.3 | 636.9 | 121.6 | 2.6 | 149.4 |
| 1982 | 0.7 | 190.6 | 19.1 | 11.2 | 1,227.0 | 80.6 | 885.5 | 165.9 | 3.6 | 368.7 |
| 1983 | 0.7 | 362.0 | 15.1 | 17.6 | 1,262.9 | 89.8 | 1,298.0 | 225.8 | 4.3 | 474.3 |
| At End of June | ||||||||||
| 1981 | 0.7 | 104.9 | 27.5 | 34.7 | 504.4 | 368.9 | 696.6 | 21.8 | 0.5 | 75.1 |
| 1982 | 0.7 | 29.3 | 17.3 | 3.9 | 1,334.5 | 42.5 | 956.1 | 45.5 | 1.3 | 402.0 |
| 1983 | 0.7 | 322.8 | 15.2 | 25.2 | 1,823.7 | 71.1 | 1,316.2 | 56.4 | 7.8 | 561.1 |
TRADING BANKS—There have been trading banks in New Zealand since the early days of settlement and they have conducted their business according to the general principles which have long been traditional in British banking institutions. With the exception of the Bank of New Zealand, which became a fully State-owned bank with the passing of the Bank of New Zealand Act 1945, the banks are owned by private shareholders. New Zealand has a branch banking system with over 1000 branches and agencies in New Zealand and a world-wide network of agents and correspondents. The general business of banking is governed by the Banking Act 1982. Part II of the Bills of Exchange Act 1908 and the Cheques Act 1960 comprise the laws relating to cheques drawn on a bank. The trading banks must also comply with the Credit Contracts Act 1981, which came into effect in June 1982.
Banks accept deposits from the public for either a fixed term or on an “on demand” basis. Fixed term or time deposits bear interest, but unlike demand deposits cannot be operated on by cheque. Cheques drawn on current accounts are efficient and widely used instruments for the settlement of commercial and private debts. Since 1979 cheques have been complemented by the introduction of bank credit cards which combine facilities for settlement of private debts and provision of credit. In general, banks concentrate their advances in such short-term areas as financing customers' current trade or seasonal requirements. The major form of bank lending to customers is still by way of overdraft but term lending, mainly for medium terms of from 2–5 years, has grown rapidly from approximately 3 percent of total bank lending in December 1971 to 43 percent in December 1983.
With the enactment of the Private Savings Banks Act 1964 the trading banks established savings banks from 1 October 1964, offering ordinary, investment, thrift club, home ownership, and special purpose accounts.
There are 4 trading banks in New Zealand, following the merger during 1982 of the Commercial Bank of Australia Limited and the Bank of New South Wales to form Westpac Banking Corporation, which is incorporated in Australia. The other 3 banks—the Bank of New Zealand, the ANZ Banking Group (New Zealand) Limited, and the National Bank of New Zealand Limited—were incorporated by special Acts of the General Assembly of New Zealand. The New Zealand activities of the ANZ Banking Group were incorporated as a subsidiary in 1979, and an offer of shares was made to the public in 1980. The 4 trading banks jointly own a computer company, Databank Systems Limited. Databank has had a national network of computer centres operating since 1969. This network handles the daily operations of the banks, including the clearing of cheques.
Bank of New Zealand—The Bank of New Zealand became a wholly State-owned trading bank on the passing of the Bank of New Zealand Act in 1945. At 31 March 1983 it had 240 branches and 144 agencies in New Zealand, a branch and a sub-branch in London, 9 branches in Australia, and 23 branches and agencies in Fiji. It also has a branch in Singapore, 1 in New York, a representative office in Japan, and an agency in Los Angeles. The bank owns 50 percent of the shareholding of the Bank of Western Samoa and 20 percent of the capital of the Bank of Tonga.
In common with other trading banks, the Bank of New Zealand operates a savings bank in New Zealand. In addition, it has a 66.8 percent shareholding in BNZ Finance Company Limited and a 50 percent interest in the Sydney-based finance company, Hunter BNZ Finance Ltd. It holds a 30 percent interest in a joint venture with Bradbury, Wilkinson and Company Ltd. of the United Kingdom in a security printing plant at Whangarei.
Trading income (including income from investments) of the Bank of New Zealand during the year ended 31 March 1983 was $285.1 million compared with $251.3 million the previous year and $186.1 million in 1980–81. Of the 1982–83 total of $285.1 million, operating expenses took $218.4 million and provision for taxation $31.7 million, leaving a net profit of $35.9 million compared with $34.6 million in the previous year and $23.1 million in 1980–81.
The total assets of the bank and its subsidiaries as at 31 March 1983 amounted to $6,305.5 million. Among the main items were advances, bills discounted, lease receivables, and sundry debts ($3,906.3 million), Government and local body securities ($1,301.3 million), and cash on hand, items in transit, and deposits with bankers ($934.5 million). Bank properties and equipment were valued at $153.3 million. The principal item of liabilities was deposits at $4,906.4 million.
Liabilities and Assets of Trading Banks—Since the Reserve Bank commenced operations the trading banks have been required to submit at monthly intervals a return of certain liabilities and assets in respect of New Zealand business. Monthly averages for the latest 5 calendar years and figures as at the last Wednesday in June are given in the next table.
| SELECTED LIABILITIES OF TRADING BANKS* | ||||||
|---|---|---|---|---|---|---|
| Year | Liabilities in New Zealand | Liabilities Outside New Zealand | Total Liabilities | Total Deposits Per Head of Mean Population | ||
| Deposits | Other Liabilities | |||||
| Demand | Time† | |||||
* Trading bank business only, excludes liabilities of savings bank subsidiaries, shareholders' funds, capital liabilities to overseas head, offices, contingencies, interbank accounts, and transit items within New Zealand. †Compensatory deposits included. | ||||||
| $(million) | ||||||
| Monthly Average for Calendar Year | ||||||
| 1979 | 1,652.0 | 2,966.9 | 78.0 | 129.6 | 4,826.5 | 1,469.5 |
| 1980 | 1,787.4 | 3,626.8 | 85.8 | 146.7 | 5,646.7 | 1,725.4 |
| 1981 | 2,040.2 | 4,235.2 | 108.2 | 173.7 | 6,557.3 | 1,994.3 |
| 1982 | 2,214.0 | 4,895.0 | 143.3 | 242.1 | 7,494.4 | 2,248.2 |
| 1983 | 2,381.6 | 5,498.6 | 125.2 | 347.4 | 8,352.8 | 2,468.6 |
| At End of June | ||||||
| 1979 | 1,667.2 | 2,737.6 | 95.5 | 122.4 | 4,622.7 | 1,401.4 |
| 1980 | 1,813.6 | 3,462.0 | 78.8 | 129.6 | 5,484.0 | 1,681.2 |
| 1981 | 2,088.5 | 4,124.5 | 75.3 | 208.3 | 6,496.6 | 1,974.4 |
| 1982 | 2,376.7 | 4,756.1 | 188.3 | 208.1 | 7,529.1 | 2,255.7 |
| 1983 | 2,308.1 | 5,152.8 | 133.4 | 328.7 | 7,923.0 | 2,337.2 |
| SELECTED ASSETS OF TRADING BANKS | |||||||||
|---|---|---|---|---|---|---|---|---|---|
| Year | Coin | Reserve Bank Notes | Demand Deposits Held in Reserve Bank | Overseas Assets | Investments | Loans* | Other Assets† | Total Selected Assets | Ratio of Loans to Total Deposits |
* Includes advances, discounts and term lending but excludes interbank lending. †Includes interbank lending, land and buildings. | |||||||||
| $(million) | |||||||||
| Monthly Average for Calendar Year | |||||||||
| 1979 | 7.0 | 66.9 | 0.2 | 326.4 | 1,180.5 | 3,321.8 | 180.3 | 5,082.9 | 71.9 |
| 1980 | 7.5 | 68.7 | 0.3 | 416.1 | 1,441.1 | 3,820.9 | 179.8 | 5,934.4 | 70.6 |
| 1981 | 7.9 | 73.8 | 1.0 | 489.1 | 1,425.7 | 4,749.5 | 221.2 | 6,968.2 | 75.7 |
| 1982 | 8.0 | 68.4 | 1.5 | 560.3 | 1,333.3 | 5,793.2 | 246.4 | 8,011.1 | 81.5 |
| 1983 | 7.8 | 65.0 | 0.2 | 618.4 | 2,183.6 | 5,913.7 | 276.0 | 9,064.7 | 75.0 |
| At End of June | |||||||||
| 1979 | 6.4 | 63.0 | – | 390.8 | 995.4 | 3,288.7 | 159.9 | 4,904.2 | 74.7 |
| 1980 | 7.2 | 66.6 | – | 440.6 | 1,436.6 | 3,714.4 | 180.7 | 5,846.1 | 70.4 |
| 1981 | 7.1 | 68.6 | – | 542.4 | 1,498.7 | 4,596.1 | 179.4 | 6,892.3 | 74.0 |
| 1982 | 7.5 | 61.9 | – | 619.1 | 1,246.0 | 5,867.8 | 254.5 | 8,056.9 | 82.3 |
| 1983 | 6.9 | 56.6 | – | 573.3 | 1,823.4 | 5,857.7 | 307.3 | 8,625.2 | 78.5 |
Interest rates on trading banks overdrafts are given in the following table.
| Rate Charged. Percent | Percentage of Total Overdrafts at Each Rate as at End of March | |||
|---|---|---|---|---|
| 1980 | 1981 | 1982 | 1983 | |
| Less than 6 | 3.7 | 3.7 | 3.8 | 4.0 |
| 6 and less than 8 | 0.6 | 0.2 | 0.3 | 0.3 |
| 8 and less than 10 | 3.2 | 0.1 | 0.2 | 0.6 |
| 10 and less than 12 | 42.9 | 7.3 | 10.2 | 6.4 |
| 12 and less than 14 | 29.7 | 48.5 | 42.6 | 40.0 |
| 14 and less than 16 | 13.5 | 24.4 | 23.9 | 24.3 |
| 16 and less than 18 | 4.9 | 10.5 | 13.1 | 14.6 |
| 18 and less than 20 | 1.2 | 4.8 | 5.5 | 8.4 |
| 20 and over | 0.1 | 0.5 | 0.5 | 1.4 |
| 100.0 | 100.0 | 100.0 | 100.0 | |
The following table gives interest rates on trading bank term loans.
| Rate Charged. Percent | Percentage of Total Term Loans at Each Rate as at End of March | |||
|---|---|---|---|---|
| 1980 | 1981 | 1982 | 1983 | |
| Less than 6 | 0.1 | 0.1 | 0.1 | – |
| 6 and less than 8 | 0.4 | 0.2 | 0.2 | 0.2 |
| 8 and less than 10 | 1.0 | 0.4 | 0.1 | – |
| 10 and less than 12 | 17.0 | 9.0 | 4.2 | 0.7 |
| 12 and less than 14 | 35.9 | 77 | 7.3 | 8.6 |
| 14 and less than 16 | 37.2 | 48.7 | 29.6 | 17.4 |
| 16 and less than 18 | 8.0 | 31.1 | 51.0 | 51.7 |
| 18 and less than 20 | 0.3 | 2.7 | 7.4 | 20.5 |
| 20 and over | 0.1 | 0.1 | 0.2 | 0.9 |
| 100.0 | 100.0 | 100.0 | 100.0 | |
An analysis of overdrafts and term lending by the New Zealand trading banks is given in the following table.
| Group | 12 March 1980 | 11 March 1981 | 10 March 1982 | 9 March 1983 | 14 March 1984 |
|---|---|---|---|---|---|
| 1. Farming, forestry, hunting, and fishing— | $(million) | ||||
| (a) Mainly dairy farming | 87.4 | 108.6 | 154.0 | 158.9 | 193.5 |
| (b) Mainly sheep farming | 114.5 | 168.1 | 225.7 | 219.6 | 253.2 |
| (c) Other farming | 146.4 | 190.1 | 277.9 | 295.8 | 359.0 |
| (d) Farm services | 31.6 | 45.3 | 49.8 | 49.8 | 63.5 |
| (e) Forestry, hunting, and fishing | 30.6 | 38.3 | 59.5 | 54.5 | 63.0 |
| Subtotal | 410.5 | 550.4 | 766.9 | 778.6 | 932.2 |
| 2. Mining and quarrying | 8.9 | 9.1 | 26.7 | 18.3 | 28.0 |
| 3. Manufacturing— | |||||
| (a) Dairy companies, factories, etc. | 50.0 | 51.4 | 60.5 | 24.6 | 95.8 |
| (b) Freezing works, meat companies, etc. | 392.7 | 402.2 | 402.2 | 366.5 | 347.5 |
| (c) Other food, beverages, and tobacco | 95.4 | 115.0 | 159.3 | 142.8 | 166.3 |
| (d) Textiles, footwear, and clothing | 92.8 | 85.2 | 99.7 | 110.4 | 129.1 |
| (e) Pulp and paper and paper products | 59.3 | 56.8 | 91.6 | 86.3 | 89.4 |
| (f) Metal products, machinery, and engineering | 199.4 | 211.9 | 246.9 | 266.6 | 254.3 |
| (g) Transport equipment | 57.8 | 88.6 | 90.6 | 76.5 | 91.9 |
| (h) Other manufacturing | 229.0 | 275.1 | 325.8 | 373.1 | 417.6 |
| Subtotal | 1,176.2 | 1,286.0 | 1,476.5 | 1,446.7 | 1,592.0 |
| 4. Construction | 153.1 | 167.2 | 191.9 | 174.8 | 197.1 |
| 5. Electricity, gas, water, and sanitary services | 6.0 | 22.8 | 27.7 | 17.1 | 28.5 |
| 6. Transport, storage, and communication | 89.6 | 133.5 | 160.0 | 205.1 | 215.7 |
| 7. Commerce, trade, and finance— | |||||
| (a) Wholesalers, mainly importers | 154.6 | 195.3 | 200.6 | 204.7 | 207.8 |
| (b) Wholesalers, other | 80.8 | 80.3 | 109.8 | 116.4 | 123.6 |
| (c) Retailers | 217.2 | 225.8 | 306.8 | 304.1 | 359.2 |
| (d) Woolbuyers | 180.4 | 159.3 | 174.1 | 150.7 | 218.5 |
| (e) Stock and station agents | 82.9 | 87.0 | 119.7 | 97.5 | 89.7 |
| (f) Finance companies (mainly merchant banks/stand-bys) | 21.6 | 22.3 | 35.1 | 20.9 | 29.9 |
| (g) Other financial institutions | 87.4 | 105.0 | 136.4 | 117.0 | 163.9 |
| Subtotal | 824.7 | 875.0 | 1,082.5 | 1,011.3 | 1,192.6 |
| 8. Local bodies, n.e.i. | 7.7 | 13.8 | 12.6 | 14.0 | 12.4 |
| 9. Services | 235.5 | 286.4 | 408.3 | 464.2 | 565.8 |
| 10. Personal— | |||||
| (a) For housing purposes | 349.5 | 400.7 | 596.1 | 697.8 | 881.7 |
| (b) Other | 322.2 | 496.8 | 675.3 | 660.5 | 839.9 |
| Subtotal | 671.6 | 897.5 | 1,271.4 | 1,358.3 | 1,721.6 |
| Total | 3,583.9 | 4,241.5 | 5,424.5 | 5,488.5 | 6,486.0 |
Trading Bank Credit Authorities—The following table shows calendar-year averages and end of June figures for unexercised overdraft and term-loan authorities, total credit limits, and the percentage utilisation of credit limits.
| Year | Unexercised Overdraft and Term Loan Authorities | Total Credit Limits | Utilisation of Credit Limits |
|---|---|---|---|
| $(m) | $(m) | % | |
| Average for Calendar Year | |||
| 1979 | 1,177.2 | 4,499.1 | 73.8 |
| 1980 | 1,372.6 | 5,193.5 | 73.6 |
| 1981 | 1,858.2 | 6,607.7 | 71.9 |
| 1982 | 2,057.7 | 7,843.6 | 73.8x |
| 1983 | 2,705.9 | 8,703.0 | 68.7 |
| At End of June | |||
| 1979 | 1,187.4 | 4,476.1 | 73.5 |
| 1980 | 1,300.1 | 5,087.3 | 74.4 |
| 1981 | 1,860.1 | 6,456.1 | 71.2 |
| 1982 | 1,974.8 | 7,854.2 | 74.9 |
| 1983 | 2,549.8 | 8,407.5 | 69.7 |
MONEY AND CREDIT AGGREGATES—The money supply and selected liquid assets of the public and claims of monetary institutions by sector as at 31 March of each of the latest 4 years are shown in the following tables. The table showing the money supply and selected liquid assets of the public sets out the deposit liabilities of the major financial institutions accepting deposits from the public. Institutions included in the table are the trading banks the Reserve Bank (currency in circulation), the private and trustee savings banks, the Post Office Bank, finance companies, stock and station agents, and the official money market dealers. The table showing the claims of monetary institutions by sector deals with the asset side of those institutions' balance sheets. The domestic breakdown of assets is according to investments with the Government (predominantly holdings of Government securities), and with the private sector (including local authority securities, loans, etc.), plus the Reserve Bank's net advances to the marketing and stabilisation sector. The sum of these 3 classifications provides a “domestic credit” aggregate which, when adjusted for institutions' net overseas assets and a residual item, can be reconciled to the money supply and selected liquid assets of the public aggregate.
Over the last 4 years the annual growth rate of the money supply and selected liquid assets of the public (M3) has fluctuated around an average rate of 14.6 percent. In December 1979 the annual growth rate of M3 was 19.1 percent, a growth rate which by the end of 1980 had fallen back to 12.5 percent. During 1981 and the first half of 1982 M3 increased at higher rates, reflecting substantial injections to the reserve base particularly from the Government sector, and the very rapid rates of credit growth. However this expansion was followed by a marked deterioration in the balance of payments position, which slowed the growth of monetary aggregates in late 1982 and early 1983 to levels below the rate of inflation. In the year to December 1982, M3 grew by 10.8 percent while the main credit aggregate, private sector credit, rose by 10.5 percent over the same period. Rapid growth in the reserves of the financial system in late 1982 and early 1983 presented a risk that money and credit aggregates could again grow at an excessive rate once demand conditions picked up. A successful public debt issue initially prevented this, but continuing large primary injections and easier credit conditions in the second half of 1983 resulted in all the major aggregates growing more rapidly by the end of 1983. The increases in M3 and private sector credit in the year to December 1983 amounted to 12.2 percent and 14.0 percent respectively, significantly faster than the inflation rate of 3.6 percent for the same period.
| Money Supply and Selected Liquid Assets of the Public | As at 31 March | |||
|---|---|---|---|---|
| 1980 | 1981 | 1982 | 1983 | |
* Notes and coin on issue from Reserve Bank minus till money of trading banks. †Trading bank demand deposits minus Government deposits and trading bank deposits held by financial institutions included in table. ‡Net of deposits of included institutions with each other. | ||||
| $(million) | ||||
| Money supply (M1)— | ||||
| Notes and coins* | 491.3 | 535.1 | 592.6 | 649.8 |
| Demand deposits† | 1,602.3 | 1,844.7 | 2,189.3 | 2,234.9 |
| Savings bank cheque accounts | 53.0 | 71.7 | 96.3 | 117.3 |
| Total | 2,146.6 | 2,451.5 | 2,878.2 | 3,002.0 |
| Annual rate of increase | 5.5% | 14.2% | 17.4% | 4.3% |
| Other demand deposits‡— | ||||
| Private savings banks | 517.8 | 547.5 | 551.1 | 445.8 |
| Trustee savings banks | 783.6 | 828.6 | 868.2 | 777.1 |
| P.O. savings bank | 980.5 | 1,029.3 | 1,065.4 | 1,014.3 |
| Stock and station agents | 76.3 | 63.2 | 85.5 | 91.8 |
| Finance companies | 120.8 | 167.2 | 256.9 | 366.6 |
| Money market | 35.0 | 35.7 | 58.2 | 35.1 |
| Total | 2,514.0 | 2,671.5 | 2,885.3 | 2,730.7 |
| Total demand deposits and money supply (M2) | 4,660.6 | 5,123.0 | 5.763.5 | 5,732.7 |
| Annual rate of increase | 3.2% | 9.9% | 12.5% | −0.5% |
| Trading banks | 3,061.0 | 3,461.3 | 4,104.8 | 4,879.6 |
| Private savings banks | 430.7 | 480.8 | 505.9 | 441.3 |
| Trustee savings banks | 777.3 | 1,047.6 | 1,327.8 | 1,725.8 |
| POSB | 708.9 | 787.0 | 864.5 | 1,056.9 |
| Stock and station agents | 55.0 | 65.5 | 68.3 | 85.2 |
| Finance companies | 1,102.3 | 1,363.0 | 1,762.7 | 2,180.0 |
| Money market | 4.2 | 8.1 | 5.4 | 5.7 |
| Total | 6,139.4 | 7,213.3 | 8,639.4 | 10,374.5 |
| Money supply and selected liquid assets of the public (M3) | 10,800.0 | 12,336.3 | 14,402.9 | 16,107.2 |
| Annual rate of increase | 15.7% | 14.2% | 16.8% | 11.8% |
| Claims of Monetary Institutions by Sector | As at 31 March | |||||||
|---|---|---|---|---|---|---|---|---|
| 1980 | 1981 | 1982 | 1983 | |||||
| $(million) (annual % changes in parentheses) | ||||||||
| Government | 4,065.7 | (5.8) | 4,377.0 | (7.7) | 4,849.8 | (10.8) | 5,440.4 | (12.2) |
| Marketing and stabilisation | 529.7 | (–1.2) | 600.1 | (13.3) | 704.8 | (174) | 1,245.0 | (76.6) |
| Private sector | 6,611.6 | (21.5) | 7,958.2 | (20.4) | 10,344.3 | (30.0) | 10,764 2 | (4.1) |
| Domestic credit | 11,207.0 | (14.1) | 12.935.3 | (15.4) | 15,898.9 | (22.9) | 17,449.6 | (9,8) |
| Overseas | −208.0 | −68.4 | −864.3 | −622.8 | ||||
| Residual | −199.0 | −530.6 | −631.7 | −719.6 | ||||
| Total | 10,800.0 | (15.7) | 12,336.3 | (14.2) | 14,402.9 | (16.8) | 16,107.2 | (11.8) |
RECENT MONETARY CONDITIONS AND POLICY—The period since the mid-1970s has been characterised by several periods of rapid monetary expansion. Consequently emphasis has been placed in recent times on developing a more active and flexible Government debt policy, both to offset fluctuations in the money supply and credit, and to finance the Government deficit in a non-inflationary manner. However especially since late 1981 this emphasis has been tempered by the Government's concern to minimise upward pressures on interest rates.
Monetary conditions in the second half of 1982 were very tight with the trading banks in particular experiencing severe and rapid losses of reserves. Over the previous 18 months credit had grown at very high rates and more rapidly than the deposit bases of the institutions. Sales of retail Government stocks and a large increase in the overseas exchange transactions deficit were probably the main causes of this slow growth of deposits and loss of reserves. Clearly, with deposit growth slowing, a sharp reduction in credit growth was inevitable, and this occurred in the second half of 1982. The growth rates for private sector credit and M3 for the 1982 calendar year were 10.8 percent and 10.5 percent respectively.
By the early months of 1983, most institutions were experiencing a resurgence in deposit growth, sourced from a more expansionary fiscal policy implemented in October 1982, a favourable turnaround in the overseas exchange transactions balance (on the current account, and more notably in the private capital account) and a large increase in Reserve Bank lending to primary producer organisations. Owing to a concern that this deposit growth could result in another period of excessive credit growth, the Government in February and March 1983 adopted a more aggressive public debt policy. The interest rates on the tap issue Government stocks and Treasury bills were increased by up to 1.5 percentage points (to give yields ranging from 12 percent for 91 days to 14 percent for 3–6 years).
Kiwi Savings Stock—A new retail instrument, Kiwi Savings Stock was launched, to replace Premium Stock. Kiwi Stock offered a 15 percent per annum interest rate and was redeemable (at an interest penalty of 2 percent per annum on any stock redeemed within 12 months of purchase date) at 7 working days notice but not transferable. This issue proved to be very successful and by the time it was withdrawn from the market on 16 June 1983 it had attracted subscriptions totalling $1,405.1 million. This caused the M3 aggregate to fall in seasonally adjusted terms in the June quarter of 1983, and slowed the annual rate of increase in M3 to 8.2 percent, the lowest annual rate of increase for several years. In September a second issue of Kiwi Stock, offering 10 percent per annum, was opened. It was not as successful as the first issue and by the time it was withdrawn from sale on 9 February 1984 it had attracted subscriptions totalling $251.8 million. Both issues were subject to fairly high rates of early redemption of stock and on 9 February 1984 only $1,046.6 million of Kiwi Stock (both issues) was still outstanding.
Tendering of Government Stock—Another change in public debt policy, was the ending of the tap issue system of selling ordinary Government stock in July 1983 and its replacement by tendering as the means of sale from September 1983. Although the first tender for a small amount was successful, difficulties were experienced in subsequent tenders in attracting sufficient bids to cover the amounts of stock available for sale at interest rates that were acceptable to the Government.
The maximum yield on conventional stocks sold by tender was restricted to 11 percent, and an effective ceiling of 6 percent was imposed on the inflation-indexed stocks introduced with the fourth tender held in December 1983. With these ceilings, large amounts of bids have been rejected, although the indexed stocks, especially those with longer maturities, have sold comparatively well.
Overall public debt policy in the second half of 1983 was not vigorous, and monetary conditions eased. At the same time, a strengthening in the demand for credit emerged and at the end of 1983, both monetary and credit aggregates were growing more rapidly. M3 growth for the 1983 calendar year was 12.2 percent, and private sector credit grew by 14.0 percent, well up on the 3.3 percent increase recorded for the 1983 June year.
For more detailed analysis of monetary conditions and policy in 1983, refer to the monthly Reserve Bank Bulletins for May, August, and December 1983, and March 1984.
Lending Growth Guidelines—As an expression of the Government's wish to see credit growth restrained in 1983–84, a lending guideline was advised to most major institutional groups in the first half of 1983. The institutions were told that the maximum rate of increase in their lending which would be acceptable to the Government was 1 percent per month on a seasonally adjusted basis. The success of the first Kiwi Stock issue in withdrawing liquidity from the financial system, together with a slack demand for credit, enabled all institutional groups to stay within the guideline until August. However in the following months the rate of growth in lending by trading banks, finance companies and building societies all exceeded the guideline rate of growth. The Government reacted by warning institutions to
reduce lending growth and increased the public sector security ratio applying to finance companies twice; lowering on 3 occasions the free reserves margin used when setting the trading bank reserve asset ratio; and increasing the ratio applied to building societies.
Trading Banks Reserve Asset Ratio—Since June 1973, trading banks have been subject to a reserve assets ratio requirement (previously a cash ratio). The ratio is expressed as a percentage of total trading bank deposits and reserve assets consisting of trading banks' holdings of notes and coins, Government securities, and the time and demand balances of the trading banks at the Reserve Bank. When setting the ratio, an allowance is made for a policy margin of free reserves. This margin is a “buffer” between the reserves requirement and actual reserve holdings. It is included to allow for unforeseen shocks to the banking system, and to give the banks some flexibility in managing their portfolios. The margin can be reduced or increased depending upon the prevailing monetary policy. The ratio is varied to take account of seasonal and random influences on bank liquidity, and to put into effect changes in credit policy in the form of changes in the free reserves margin. A bank unable to meet its reserve requirement has to borrow the shortfall from the Reserve Bank on conditions determined by the Reserve Bank. In July 1980 these conditions changed so that, rather than having to hold penal borrowings as non-interest bearing deposits, banks now hold these borrowings as deposits which bear interest at rates which may be varied by the authorities. The interest rate on these deposits will decline as the level of borrowing rises, providing a flexible and progressive extension to the penal borrowing arrangements.
The Reserve Bank lending rate and the contra-deposit rates on the first tranche of penal borrowing over recent years are set out below. The dates represent the month when the rates took effect.
Recent ratios, policy free reserve margins and outcomes are summarised below:
| Month | Requirements and Holdings Ratio | Average Requirement | Average Holdings | Free Reserves Policy Margin | Actual Free Reserves |
|---|---|---|---|---|---|
| % | $(million) | ||||
| 1983—January | 21.0 | 1,588 | 1,987 | +100 | +398 |
| February | 26.5 | 2,059 | 2,295 | +100 | +236 |
| March | 30.0 | 2,401 | 2,546 | +100 | +145 |
| April | 31.0 | 2,593 | 2,548 | +100 | −45 |
| May | 23.5 | 1,939 | 1,989 | +100 | +50 |
| June | 16.0 | 1,226 | 1,536 | +100 | +310 |
| July | 22.0 | 1,617 | 1,826 | +100 | +209 |
| August | 25.0 | 1,907 | 2,025 | +100 | +118 |
| September | 24.5 | 1,907 | 2,017 | +100 | +111 |
| October | 23.0 | 1,792 | 1,812 | +100 | +20 |
| November | 22.0 | 1,697 | 1,820 | +100 | +123 |
| December | 25.5 | 1,987 | 2,076 | +100 | +89 |
| 1984—January | 26.5 | 2,178 | 2,243 | +50 | +65 |
| February | 29.5 | 2,430 | 2,475 | – | |
| March | 32.0 | −50 | |||
Public Sector Security Ratios—Most other financial institutions are also subject to Government imposed ratio requirements specifying minimum required holdings of public sector securities. The ratios are set as a proportion of some major aggregate of the institution, generally total deposits or total lending. The different bases used to calculate ratio requirements is but 1 factor in a number of historical, political, and economic factors which account for the widely differing ratios between institutions. The ratios serve a number of purposes. They provide a compulsory contribution to financing the Government deficit, they can be seen to have a prudential aspect in that institutions are forced to hold a proportion of their funds in reasonably liquid assets, and they can be varied as tools of monetary policy to influence the lending and deposit growth of the particular institutional group.
A summary of changes to the public sector security investment ratios applied to the major groups of financial institutions is set out below.
| Period | Trustee Savings Banks | Private Savings Barks | Govt Finance Companies | Life Insurance Offices | Building Societies | Private Super Funds | Official Money Market Dealers | |||||
|---|---|---|---|---|---|---|---|---|---|---|---|---|
| Minimum Govt. | Public Sector | Minimum Govt | Public Sector | Savings Accounts | Minimum Govt. | Public Sector* | Minimum Govt. | Local Authories | ||||
* The balance of the public sector securities ratio beyond the minimum Government security ratio of 20 percent may be met by holdings of up to 11 percent in Local Authority securities and the remainder of the requirement may be held in housing and farming investments. †This change reflects the introduction of a new basis for the ratio. | ||||||||||||
| Percentage | ||||||||||||
| 1980—Feb | 38.0 | 54.0 | 22.5 | 19.0 | 29.0 | 11.0 | 15.0 | 30.0 | 20.0 | 38.0 | 60.0 | 20.0 |
| Jul | – | – | 25.0 | 20.0 | 30.0 | – | – | – | 20.0 | 40.0 | – | – |
| 1982—Jul | – | – | – | 20.0 | 31.0 | 11.0 | 16.0 | – | 20.0 | 41.0 | – | – |
| 1983—Apr | – | – | 18.0† | – | – | – | – | – | – | – | – | – |
| May | – | – | 20.0 | – | – | – | – | – | – | – | – | – |
| 1984—Feb | – | – | – | – | – | 14.0 | 19.0 | – | – | – | – | – |
| Mar | – | – | 25.0 | – | – | – | – | – | – | – | – | – |
| Apr | – | – | 30.0 | – | – | – | – | – | – | – | – | – |
NOTE—For fuller details of these ratios refer to the Reserve Bank Bulletin.
INTEREST RATE CONTROLS—As a result of interest rate pressure late in 1981 the Government in November amended the Financial Services Regulations 1979, in order to limit increases in lending interest rates. These regulations required all lenders employing funds of more than $2 million to give the Reserve Bank 14 days' notice of any proposed increases in lending interest rates. A rate increase could be implemented at the end of 14 days if the bank took no action, but if the bank raised an objection the increase could be implemented only to the extent authorised.
In June 1982, the Government broadened the coverage of interest rate controls when it introduced a freeze on wage, prices, deposit interest rates, and other fees; and tightened the controls over lending rates. Under the Financial Services Regulations (No. 2) 1982 any lender with loans outstanding of more than $10,000 now must charge an interest rate no greater than would have been charged on a loan of a similar type prior to the introduction of the regulations.
In November 1983 the Interest on Deposit Regulations were revoked. These deposit regulations were no longer considered necessary because the rates paid by most institutions had fallen below the specified maxima. As a result deposit rates were freed from direct control but remained indirectly constrained by the controls on lending rates.
On 7 December 1983, the Government introduced the Economic Stabilisation (Mortgage Loans) Regulations controlling mortgage interest rates. These regulations were backdated with effect from 10 November and replaced various other controls, which came into force at that time but which were shown to have some anomalies. These regulations effectively removed mortgage lending from the scope of the Financial Services Regulation and control it separately. As from 10 November the maximum interest rate that may be charged on any new loan secured wholly or partly over real property (i.e. land and buildings) was 11 percent per annum in the case of a first mortgage and 14 percent per annum for any second or subsequent mortgage. The regulations also prevented the rate of interest being increased on any mortgage—except where a contract entered into before 10 November provided for automatic adjustment according to some formula or index, or where the interest rate was already less than the maximum permitted rate. Any other lending remained subject to the Financial Services Regulations.
On 21 February 1984 the Financial Services Regulations were amended to bring them into line with procedures adopted under the price surveillance scheme to be used in the period of phasing out the price freeze. The regulations allowed for small increases in the prices of financial services other than interest rates after prior notification to the Reserve Bank was given.
The other major interest rate control in force was a long standing one which prohibited trading banks from paying interest on deposits for terms of less than 30 days, and savings banks from paying interest of more than 3 percent on such deposits (with exceptions for some categories of depositor, such as non-profit organisations). To support the devaluation of 18 July 1984, all controls on interest rates were revoked from that date.
Regulations revoked include: the Interest on Deposits Regulations 1984; the Economic Stabilisation (Mortgage Loans) Regulations 1983; the Economic Stabilisation (Interest Rates) Regulations 1984; and the Financial Institutions (Interest Rates) Regulations 1984. The Financial Services Regulations were also amended to exclude interest rates and discount rates. The regulations will now only cover prices of services such as banking, life insurance, guaranteeing of financial repayments, and the arranging of finance.
Finance Companies—Capital issues control on finance companies was abolished in 1962 and “voluntary” agreements on investments existed until capital issues control was reintroduced in February 1967. These controls were abolished again in June 1969. The finance companies were then required to invest a prescribed percentage of their “borrowings” in Government securities. The initial ratio of 10 percent which was to be attained by July 1970 was phased in over 4 quarters. This ratio has been varied since as a tool of monetary policy. In April 1983 a new basis for the ratio was introduced, and finance companies were required to invest a prescribed percentage of their “investments” in Government securities. On this basis the ratio was set at 18 percent. In May 1983 it was raised to 20 percent, and in December it was increased to 25 percent effective from 29 February 1984. A further increase of 5 percent took the ratio to 30 percent from 31 March 1984.
These increases were introduced following increases in lending by finance companies which exceeded limits set by the Government.
Life Insurance Companies—Between 1965 and 1969 there were several “voluntary” agreements with the insurance companies regarding investment in Government securities. In October 1969 the bases of the present controls were introduced. The insurance companies “voluntarily” agreed to invest 30 percent of their “assets” in public sector (Government and local authority) securities with a minimum of 22 1/2; percent in Government securities. By October 1973, when this arrangement was formalised, the minimum Government securities ratio had been reduced to 22 percent and it was later reduced to 19 percent with an overall ratio of 29 percent. However, in July 1980 the minimum ratio in Government securities was raised to 20 percent and the overall ratio in public sector securities to 30 percent.
In July 1982 the security requirement was increased to 31 percent. The compulsory minimum Government security requirement remained at 20 percent, and the local authority investment option increased by 1 percent to 11 percent. Life insurance companies are also required to hold 20 percent of their assets in housing and/or farming investments. This ratio has been in effect since September 1976.
Building Societies—From November 1970 the building societies were required over a 5-year transitional period to reach and maintain 5 percent of their “assets” in public sector securities (with a minimum of 3 percent in Government securities). The 1976 Budget announced the phasing-in, over a 10 year period, of a 15 percent public sector securities requirement, with a minimum of 11 percent in Government securities. The savings banks operations of authorised building societies are also required to invest a proportion of their deposits in Government securities. In July 1982 the public securities investment requirement was increased to 16 percent. The compulsory minimum Government security requirement remained at 11 percent and the local authority security option increased by 1 percent to 5 percent. In February 1984 the Public and Government Securities Investment requirements were increased to 19 and 14 percent respectively following credit expansion above limits set by the Government. The Local Authority Security option remained at 5 percent.
Private Superannuation Funds—In June 1970 the private superannuation funds were given a 5-year transitional period in which to place 30 percent of their assets in public sector securities in order to qualify for tax exemptions. This agreement was formalised in August 1975 and provision was made for the ratio to increase by 2 percent annually to 40 percent by April 1980. Up to 10 percent of the increased requirements could be met by authorised “housing” investments. In July 1982 the overall public security requirement was increased to 31 percent. The Government security requirement remained at 20 percent and the local authority security option increased by 1 percent to 11 percent.
Official Money Market Dealers—From the time of their official recognition late in 1962, dealers have been subject to deposit limits and controls on assets they can hold. Currently, dealers must hold at least 60 percent of their funds in Government Securities.
SAVINGS BANKS—Savings banks include the Post Office Savings Bank, the trustee savings banks, and the savings banks operated by the trading banks. In recent decades there have been major changes in savings bank operations. Following an amendment to the Trustee Savings Bank Act passed in 1957, the 5 trustee savings banks that had survived from the middle of the last century were joined by 8 new trustee savings banks between 1959 and 1964. In 1972, 2 of these banks merged and there are now 12 trustee savings banks. Another major change was the formation of private savings banks by the 5 trading banks, following the passing of the Private Savings Bank Act in 1964. There are now 4 trading banks following the amalgamation in October 1982 of the Bank of New South Wales and the Commercial Bank to form the Westpac Banking Corporation.
As from April 1973 trustee savings banks and the Post Office Savings Bank have been able to advance personal loans. In March 1973 the responsibilities for the administration of the trustee savings banks and the private savings banks was transferred from the Treasury to the Reserve Bank. Trustee savings banks and the Post Office Savings Bank have been allowed to offer cheque facilities since 1974.
The following table shows the total amounts of transactions in savings bank accounts, including accounts in the Post Office Savings Bank, trustee savings banks, private savings banks, National Savings accounts, and school savings bank accounts, but excluding National Savings bonds.
| Year Ended 31 March | Total Amount of Deposits | Interest | Amount of Withdrawals* | Excess of Deposits Plus Interest Over Withdrawals | Total Amount to Credit of Depositors at End of March |
|---|---|---|---|---|---|
| * Includes interest paid out on investment accounts. | |||||
| $(million) | |||||
| 1979 | 7,561.4 | 150.7 | 7,070.0 | 642.1 | 3,874.0 |
| 1980 | 10,011.2 | 202.5 | 9,836.0 | 377.7 | 4,251.7 |
| 1981 | 12,819.5 | 257.3 | 12,535.9 | 540.9 | 4,792.6 |
| 1982 | 17,251.6 | 309.6 | 17,074.5 | 486.7 | 5,279.3 |
| 1983 | 19,195.8 | 360.9 | 19,257.6 | 299.1 | 5,578.4 |
POST OFFICE SAVINGS BANK: Operation—The business of the Post Office Savings Bank started on 3 February 1867, when branches were established at Auckland, Wellington, Christchurch, Dunedin and Hokitika. At 31 March 1983 there were 1151 branches of the bank throughout New Zealand. Deposits may be made at any of these branches.
Total savings with the Post Office Savings Bank stood at $2,102.6 million at 31 March 1983, $147.2 million higher than at 31 March 1982.
Net holdings in Bonus Bonds have continued to grow and at 31 March 1983 savings held in this way totalled $339.7 million. During the 1982–83 financial year 366 474 prizes to the value of $24.3 million were distributed to prize winning bondholders.
The popularity of bonus bonds has been enhanced by increases in the value of the first prize from $50,000 to $100,000 on 10 June 1980 and to $200,000 on 12 January 1982. The weekly prize increased from $10,000 to $11,000 on 6 December 1980 and to $25,000 on 2 January 1982, and a number of $5,000 prizes were also introduced.
The abnormally high demand for housing and personal loans from the Post Office Savings Bank in 1981 affected loans granted during 1982, and it was not until August 1982 that the amount of lending could be increased.
During the 1982–83 financial year $31.4 million was advanced as second and subsequent mortgage loans. Repayments of principal made during the same period amounted to $52.1 million. The amount outstanding as at 31 March 1983 was $208.3 million. Personal loans advanced to depositors (apart from second or subsequent mortgage loans for housing purposes) during the 1982–83 financial year totalled $5.5 million. Repayments of principal and interest made in the same period amounted to $20.5 million. The amount outstanding as at 31 March 1983 was $21.9 million.
The following table covers the activities of the Post Office Savings Bank.
| Year Ended 31 March | Number of Accounts at End of March* | Total Amount of Deposits | Interest | Total Amount of Withdrawals† | Excess of Deposits, Plus Interest, Over Withdrawals | Total Amount to Credit of Depositors at End of March‡ |
|---|---|---|---|---|---|---|
* Includes Ordinary National Savings and School Saving Accounts. †Includes interest paid on investment accounts. ‡Excludes National Savings Bonds and coupons. | ||||||
| (000) | $(thousand) | |||||
| 1979 | 3,016 | 1,977,448 | 53,906 | 1,858,667 | 172,687 | 1,617,821 |
| 1980 | 3,099 | 2,543,234 | 64,592 | 2,522,783 | 85,043 | 1,702,864 |
| 1981 | 3,104 | 3,217,819 | 75,276 | 3,161,843 | 131,252 | 1,834,116 |
| 1982 | 3,178 | 4,066,242 | 85,924 | 4,031,067 | 121,099 | 1,955,215 |
| 1983 | 3,281 | 4,979,847 | 93,721 | 4,926,410 | 147,158 | 2,102,373 |
The following table shows Post Office Savings Bank assets as at 31 March, including investments in the name of the Postmaster-General.
| Asset | 1981 | 1982 | 1983 |
|---|---|---|---|
| $(thousand) | |||
| Government Stock | 1,311,928 | 1,387,928 | 1,522,928 |
| Housing Corporation of New Zealand Stock | 217,408 | 184,408 | 184,408 |
| Rural Banking and Finance Corporation of New Zealand Stock | 122,700 | 109,700 | 109,700 |
| Personal and housing loans | 165,565 | 239,491 | 230,270 |
| Total | 1,817,601 | 1,921,527 | 2,047,306 |
Depositors and bondholders balances held at 31 March are set out in the following table.
| Accounts | 1981 | 1982 | 1983 |
|---|---|---|---|
| $(thousand) | |||
| Ordinary | 942,306 | 972,627 | 931,625 |
| 6 months investment | 23,310 | 27,455 | 29,214 |
| 1 year investment | 117,085 | 144,127 | 165,689 |
| 2 year investment | 80,420 | 76,073 | 79,531 |
| 3 year investment | 202,315 | 184,452 | 168,172 |
| Term deposits | 31,827 | 39,656 | 60,496 |
| Key account | – | – | 80,860 |
| National Savings | 9,957 | 9,019 | 8,306 |
| Thrift club | 38,878 | 40,030 | 31,776 |
| Home ownership | 13,261 | 18,511 | 28,845 |
| School | 12,658 | 13,924 | 14,555 |
| Home lay-by | 179 | 173 | 154 |
| Farm ownership | 877 | 956 | 942 |
| Fishing vessel ownership | – | 1 | 2 |
| Cheque | 51,617 | 60,995 | 67,392 |
| Budget service | 177 | 195 | 215 |
| Money transfer statement | 7 | 3 | 2 |
| Bonus bonds | 239,800 | 287,661 | 339,696 |
| National Development Bonds | 11,696 | 7,632 | 5,239 |
| New Zealand Savings Certificates | 19,750 | 24,821 | 31,208 |
| Housing Bonds | 6,988 | 3,116 | 1,430 |
| Special farm ownership | 11,000 | 13,495 | 15,473 |
| Special home ownership | 18,103 | 26,901 | 41,112 |
| Special fishing vessel ownership | 53 | 88 | 83 |
| New Zealand Savings Bonds and coupons | 202 | 202 | 202 |
| Balance in transit | 1,852 | 3,303 | 356 |
| Total | 1,834,318 | 1,955,416 | 2,102,575 |
PRIVATE SAVINGS BANKS—The Private Savings Bank Act 1964 came into force on 1 October 1964. Under this Act the trading banks all formed private savings banks. These banks may transact business only in premises ordinarily occupied and used by the parent bank. In addition to ordinary deposits, these banks may accept investments similar to the trustee savings banks, by way of deposits in Home Lay-by, Investment accounts, Thrift Club, and Special Purpose accounts.
The following table relates to private savings banks.
| Year Ended 31 March | Number of Accounts at End of Year | Total Amount of Deposits During Year | Interest Credited | Total Amount of Withdrawals During Year | Excess of Deposits Plus Interest Over Withdrawals | Total Amount to Credit of Depositors at End of Year |
|---|---|---|---|---|---|---|
| (000) | $(thousand) | |||||
| 1979 | 1,335 | 1,805,629 | 42,565 | 1,667,813 | 180,381 | 853,238 |
| 1980 | 1,474 | 2,362,168 | 62,895 | 2,329,781 | 95,282 | 948,520 |
| 1981 | 1,520 | 2,622,496 | 78,858 | 2,621,526 | 79,828 | 1,028,348 |
| 1982 | 1,517 | 3,446,315 | 74,000 | 3,491,689 | 28,626 | 1,056,974 |
| 1983 | 1,424 | 3,450,164 | 76,645 | 3,696,594 | −169,785 | 887,189 |
Private savings banks assets at 31 March 1983 included $423.6 million invested in Government securities, $8.1 million in local authority securities, and $519.3 million in mortgages and other loans. Government securities must be held for amounts equal to 54 percent of deposits in ordinary and investment accounts.
TRUSTEE SAVINGS BANKS—The trustee savings bank movement is generally regarded as having originated in Scotland in 1810. The movement spread quickly, and the first such New Zealand bank was established in Wellington in 1846, 20 years before the New Zealand Post Office Savings Bank commenced business. By 1870, 9 trustee banks were in existence but 4, namely Lyttelton, Wellington, Napier, and Nelson, did not survive the turn of the century. The 5 remaining banks, Auckland (1847), New Plymouth (1850), Dunedin (1864), Southland (1864), and Hokitika (1866), grew in strength and their activities became an important factor in New Zealand's economic structure. Since 1957 a number of new trustee savings banks have been established, and the total is now 12. The legislation dealing with trustee savings banks is contained chiefly in the Trustee Savings Banks Act 1948. In February 1980 the Government Stock requirement of the trustee savings banks was reduced from 39 percent to 38 percent of total deposits in order to provide greater funds for new housing. A proportion of depositors' balances must be kept as cash in hand or on current account, namely 5 percent up to $20 million, and 2 1/2; percent of the amount in excess of $20 million. Repayment of deposits is guaranteed by the State.
In addition to ordinary deposits, trustee savings banks may accept investments similarly to the Post Office Savings Bank, by way of deposits in Investment accounts.
The following tables relate only to trustee savings banks.
| Year Ended 31 March | Number of Accounts at End of Year | Total Amount of Deposits During Year | Interest Credited | Total Amount of Withdrawals During Year | Excess of Deposits Plus Interest Over Withdrawals | Total Amount to Credit of Depositors at End of Year |
|---|---|---|---|---|---|---|
| (000) | $(thousand) | |||||
| 1979 | 2,300 | 3,778,307 | 54,731 | 3,544,013 | 289,025 | 1,402,935 |
| 1980 | 2,470 | 5,105,832 | 74,994 | 4,983,437 | 197,389 | 1,600,324 |
| 1981 | 2,664 | 6,979,186 | 103,778 | 6,753,179 | 329,785 | 1,930,109 |
| 1982 | 2,856 | 9,739,069 | 150,182 | 9,552,450 | 336,801 | 2,266,910 |
| 1983 | 3,067 | 10,813,699 | 190,100 | 10,681,856 | 321,943 | 2,588,853 |
NOTE—This statement includes National Savings Accounts.
The following table shows the results of the transactions, inclusive of National Savings accounts, of each of the trustee savings banks during 12 months ended 31 March 1983.
| Bank | Number of Accounts at End of Year | Total Amount of Deposits During Year | Interest Credited | Total Amount of Withdrawals During Year | Excess of Deposits Plus Interest Over Withdrawals | Total Amount to Credit of Depositors at End of Year |
|---|---|---|---|---|---|---|
| No. | $(thousand) | |||||
| Auckland | 1,142,252 | 3,367,373 | 59,599 | 3,332,517 | 94,455 | 875,882 |
| Waikato | 230,062 | 1,219,999 | 14,886 | 1,203,076 | 31,809 | 205,679 |
| Bay of Plenty | 143,868 | 827,598 | 9,862 | 817,155 | 20,305 | 138,434 |
| Taranaki | 132,846 | 720,444 | 8,922 | 707,624 | 21,742 | 131,958 |
| Eastern and Central | 182,035 | 795,046 | 10,332 | 791,423 | 13,955 | 139,405 |
| Wanganui | 76,072 | 209,774 | 4,452 | 203,573 | 10,653 | 62,524 |
| Wellington District | 138,875 | 513,833 | 8,066 | 513,029 | 8,870 | 93,610 |
| Westland | 35,517 | 234,241 | 2,721 | 232,425 | 4,537 | 36,656 |
| Canterbury | 587,279 | 1,731,135 | 41,263 | 1,710,751 | 61,647 | 504,764 |
| South Canterbury | 64,482 | 206,039 | 4,058 | 203,757 | 6,340 | 53,753 |
| Otago | 209,129 | 446,317 | 13,939 | 447,215 | 13,041 | 176,379 |
| Southland | 124,720 | 541,900 | 12,000 | 519,311 | 34,589 | 169,809 |
| Total | 3 067 137 | 10,813,699 | 190,100 | 10,681,856 | 321,943 | 2,588,853 |
The following table shows a summary of trustee savings banks' assets at 31 March 1983. The total assets include an amount of $117,000 securing National Savings deposits, all of which is invested in New Zealand Government securities. Under the Trustee Savings Banks Act, however, National Savings deposits are not regarded as assets of the Trustee Savings Banks, and for this reason are shown separately.
| Bank | Mortgages | New Zealand Government Securities | Local Authority Debentures | Cash in Hand and on Call at Bank | Total Assets* (Includes Other Assets but not National Savings Deposits) | National Savings Deposits | Total Held Including National Savings Deposits |
|---|---|---|---|---|---|---|---|
| * Total assets include $179 million in fixed deposits. | |||||||
| $(thousand) | |||||||
| Auckland | 442,118 | 319,136 | 13,356 | 24,479 | 904,188 | 82 | 904,270 |
| Waikato | 92,974 | 70,877 | 608 | 5,109 | 218,790 | – | 218,790 |
| Bay of Plenty | 71,096 | 49,374 | 433 | 8,078 | 137,719 | – | 137,719 |
| Taranaki | 65,607 | 48,420 | 150 | 1,431 | 134,304 | – | 134,304 |
| Eastern and Central | 72,007 | 50,172 | 102 | 2,664 | 143,087 | – | 143,087 |
| Wanganui | 32,035 | 21,060 | – | 3,836 | 64,089 | – | 64,089 |
| Wellington District | 41,568 | 35,873 | – | 1,743 | 93,238 | – | 93,238 |
| Westland | 12,444 | 13,598 | 167 | 3,449 | 33,318 | – | 33,318 |
| Canterbury | 245,022 | 187,317 | – | 656 | 502,589 | – | 502,589 |
| South Canterbury | 26,617 | 19,961 | 60 | 5,714 | 54,710 | – | 54,710 |
| Otago | 12,578 | 64,855 | 365 | 757 | 96,921 | 35 | 96,956 |
| Southland | 79,708 | 65,925 | 5,247 | 11,162 | 175,115 | – | 175,115 |
| Total | 1,193,774 | 946,568 | 20,488 | 69,078 | 2,558,068 | 117 | 2,558,185 |
STOCK AND STATION AGENTS—Many of the existing stock and station agents first commenced business as general merchants or retailers in the early days of the country's settlement. However, during the greater part of their history, the main financial operations have been in the supply of merchandise, machinery and implements, and the provision of finance to the farming community. The companies have developed a specialised banking business involving the maintenance of current accounts for farmers, the acceptance of time deposits, and the granting of secured and unsecured advances. It is a widespread practice for farmers to have current accounts with their stock and station agents to which the proceeds of the sale of livestock and produce are placed and farm and personal expenses charged. Any surplus may be left on current account or placed with the agents on fixed deposit. Stock and station agents have top-tier borrowing priority with the trading banks in order to obtain additional funds to lend for seasonal and farming development needs.
Financial data as at 30 June are given for the stock and station agents operating in New Zealand. The statistics refer to the whole of the companies' trading operations including, in some cases, activities additional to normal stock and station transactions, such as retail trading in consumer goods.
The deposit figures include only moneys received for an agreed term and rate of interest and exclude amounts secured by mortgage or debenture, and amounts in credit on current account. Secured advances to customers include those made on mortgage or chattel security. The figure for merchandise and commodity stocks includes all types of trading stock which are regarded as current assets, but excludes livestock, goods held on consignment, or motor vehicles used by the company.
The following table summarises the financial statements of 22 stock and station agents. Quarterly information, including details of interest rates, is published in the Monthly Abstract of Statistics.
| Item | At 30 June | ||||
|---|---|---|---|---|---|
| 1979 | 1980 | 1981 | 1982 | 1983 | |
| * Included in “other investments” | |||||
| $(thousand) | |||||
| Deposits held | 52,769 | 64,148 | 72,039 | 81,845 | 99,080 |
| Customers' credit balances on current account | 88,732 | 92,869 | 86,066 | 95,966 | 104,978 |
| Advances to customers— | |||||
| (a) On current account (unsecured) | 129,232 | 152,906 | 183,930 | 188,473 | 185,058 |
| (b) Other advances (secured) | 52,009 | 54,595 | 65,140 | 66,379 | 66,196 |
| Investments— | |||||
| (a) Government securities | 1,123 | 1,094 | 1,223 | 1,152 | 889 |
| (b) Fixed deposits | 9,470 | 948 | * | * | * |
| (c) Other investments | 36,892 | 33,598 | 36,275 | 15,603 | 27,682 |
| Cash balances (in hand and at bank) | 7,562 | 8,268 | 9,187 | 1,528 | 5,147 |
| Bank overdrafts outstanding | 42,964 | 62,086 | 68,723 | 84,329 | 69,593 |
| Merchandise and commodity stocks | 108,755 | 126,705 | 133,503 | 155,370 | 141,646 |
| Interest rates paid on deposit— | Percentage of Deposits | ||||
| Under 9 percent | 40.4 | 21.4 | 12.3 | 10.3 | 6.2 |
| 9 percent and under 10 percent | 9.7 | 8.5 | 8.5 | 4.3 | 2 |
| 10 percent and under 11 percent | 21.1 | 14.1 | 12.3 | 4.7 | 2.6 |
| 11 percent and under 12 percent | 12.6 | 12.2 | 9.6 | 6.5 | 14.8 |
| 12 percent and under 13 percent | 16.0 | 28.3 | 30.1 | 24.5 | 11.1 |
| 13 percent and under 14 percent | 0.2 | 11.8 | 21.0 | 25.9 | 18 |
| 14 percent and under 15 percent | – | 3.0 | 4.6 | 13.2 | 14.4 |
| 15 percent and under 16 percent | – | 0.6 | 1.5 | 8.0 | 20.8 |
| 16 percent and over | – | 0.1 | 0.1 | 2.6 | 6.4 |
FINANCE COMPANIES—In 1971 there were 27 finance companies designated “large” by the Reserve Bank for statistical purposes. Their assets amounted to 90 percent of the total assets of 526 surveyed finance companies. There has been rapid growth of these large companies in recent years as people have responded to higher interest rates on deposits and debentures and to the improved services offered. The large finance companies have developed simple and easily operated means of accepting money. Furthermore, many companies offer flexible deposit plans to depositors with large sums. In April 1977, the statistical coverage was expanded and since then 30 “large” finance companies (i.e. those with outstanding advances at that time in excess of $1 million) have been providing regular data.
Between 1977 and 1980, considerable changes have occurred in the finance company sector including several takeovers and mergers. The coverage of the survey was revised again in January 1981 to include only those companies with outstanding advances in excess of $5 million. Because of these changes, there are now only 24 companies included in the large finance companies survey.
Although the finance companies have faced increasing competition from trading banks, savings banks, and other financial institutions for deposits over the last few years, total deposits (including debentures and notes) of large finance companies have continued to grow steadily, increasing by 26 percent during the year ended 31 December 1983 to reach a total of $2,654 million.
Net outstanding loans and advances, including leasing and factoring, rose by $504 million or 24 percent in 1983, showing a higher rate of increase that in the previous year.
Finance companies' interest rates paid on secured deposits during 1983 were as high as 17.5 percent before declining after August to levels around 11 percent.
Statistics of deposits, debentures, and notes held by the large companies for which the Reserve Bank collects statistics are shown in the following table.
| Term | At 31 March | ||||
|---|---|---|---|---|---|
| 1979 | 1980 | 1981 | 1982 | 1983 | |
| $(million) | |||||
| At call | 70.1 | 71.3 | 102.3 | 159.0 | 222.7 |
| Under 3 months | 96.0 | 150.0 | 205.9 | 269.9 | 301.7 |
| 3–5 months | 80.6 | 102.5 | 158.7 | 230.9 | 415.0 |
| 6–11 months | 146.6 | 203.8 | 289.3 | 298.9 | 423.3 |
| 12–23 months | 190.6 | 289.4 | 369.6 | 378.4 | 432.0 |
| 2 years and over | 255.8 | 253.6 | 233.3 | 448.5 | 420.7 |
| Total | 839.7 | 1,070.6 | 1,359.1 | 1,785.6 | 2.215.4 |
NOTE: Owing to changes in coverage, figures are not directly comparable with those for previous years.
Gross loans and advances of these finance companies outstanding at 31 March 1982 and 1983 are shown in the following table.
| Sectoral Analysis | 1982 | 1983 |
|---|---|---|
| * Includes advances to dairy and meat processing companies. | ||
| Agricultural— | $(million) | |
| Farming/fishing | 156.1 | 167.7 |
| Forestry | 32.6 | 33.7 |
| Subtotal | 188.7 | 201.4 |
| Industrial— | ||
| Manufacturing* | 111.1 | 146.5 |
| Heavy construction, engineering, mining, and quarrying | 104.9 | 107.7 |
| Residential construction, property development | 94.7 | 124.0 |
| Subtotal | 310.7 | 378.2 |
| Distribution/Transport— | ||
| Transport, storage | 233.0 | 282.4 |
| Motorcars—retail, H.P. | 290.6 | 320.7 |
| Motorcars—wholesale, floor-plan | 114.3 | 93.2 |
| Subtotal | 637.9 | 696.3 |
| Mercantile— | (million) | |
| Wholesalers, importers | 38.5 | 45.2 |
| Exporters | 17.0 | 20.5 |
| Retailers | 120.2 | 170.2 |
| Subtotal | 175.7 | 235.9 |
| Service industries n.e.i. | 139.4 | 156.8 |
| Personal— | ||
| Housing— | ||
| New houses and flats | 81.4 | 104.9 |
| Existing houses and flats | 66.1 | 120.3 |
| Other personal | 320.3 | 352.9 |
| Subtotal | 467.8 | 578.1 |
| Other, n.e.i. | 12.9 | 36.2 |
| Total | 1,933.1 | 2,282.9 |
MERCHANT BANKS—The major expansion of merchant banking in New Zealand occurred in 197.1, when the Government allowed overseas companies to participate in their establishment. The merchant banks offer a wide range of financial services to industrial clients and also manage investment portfolios and deal in and accept commercial bills. The merchant banks engage in underwriting new share issues by companies, advise on and finance mergers and takeovers, and lend money for expansion to growing companies. The merchant banks played an important role in the expansion of the commercial bill market.
STRUCTURE OF FINANCIAL SYSTEM—The changing structure of the New Zealand financial system is shown by movements in the money supply and other major liquid assets of the public; a comparative table of selected liquid assets is now given. (Source: Reserve Bank Bulletin.)
| Deposits etc. | At 31 March | Percentage at 31 March | ||||
|---|---|---|---|---|---|---|
| 1981 | 1982 | 1983 | 1981 | 1982 | 1983 | |
| (a) On an institutional basis | $(million) | % | ||||
| Trading banks | 5,306.0 | 6,294.1 | 7,114.5 | 43.0 | 43.7 | 44.2 |
| Private savings banks | 1,028.3 | 1,057.0 | 887.1 | 8.3 | 7.3 | 5.5 |
| Subtotal | 6,334.3 | 7,351.1 | 8,001.6 | 51.3 | 51.0 | 49.7 |
| Post Office Savings Bank | 1,834.3 | 1,955.4 | 2,102.6 | 149 | 13.6 | 13.1 |
| Trustee savings banks | 1,929.9 | 2,266.8 | 2,588.8 | 15.6 | 15.7 | 16.1 |
| Stock and station agents | 128.7 | 153.8 | 177.0 | 1.0 | 1.1 | 1.1 |
| Finance companies | 1,530.2 | 2,019.6 | 2,546.6 | 12.4 | 14.0 | 15.8 |
| Official money market | 43.8 | 63.6 | 40.8 | 0.4 | 0.4 | 0.3 |
| Notes and coins | 535.1 | 592.6 | 649.8 | 4.3 | 4.1 | 4.0 |
| Total selected liquid assets | 12,336.3 | 14,402.9 | 16,107.2 | 100.0 | 100.0 | 100.0 |
| (b) On a functional basis | ||||||
| Money supply | 2,451.5 | 2,878.2 | 3,002.0 | 19.9 | 20.0 | 18.6 |
| Other demand deposits | 2,671.5 | 2,885.3 | 2,730.7 | 21.7 | 20.0 | 17.0 |
| Subtotal | 5,123.0 | 5,763.5 | 5,732.7 | 41.5 | 40.0 | 35.6 |
| Time and fixed deposits | 7,213.3 | 8,639.4 | 10,374.5 | 58.5 | 60.0 | 64.4 |
| Total selected liquid assets | 12,336.3 | 14,402.9 | 16,107.2 | 100.0 | 100.0 | 100.0 |
COINAGE AND CURRENCY: Decimal Currency—Under the Decimal Currency Act 1964 a system of decimal currency was introduced in New Zealand on 10 July 1967 with the dollar as the monetary unit. The dollar is equivalent to the previous 10 shillings. The equivalent in decimal currency of the shilling is 10c. There are coins for $1 (not in general circulation), 50c, 20c, 10c, 5c, 2c, and 1c, and Reserve Bank notes for 1, 2, 5, 10, 20, and 100 dollars. The $50 note was introduced on 2 December 1983. The coins are cupro-nickel, except for the one and two cent pieces which are bronze. Notes and coins have distinctive New Zealand designs.
Issue of Notes and Coin—Since 1 August 1934 the Reserve Bank has had the sole right to issue bank notes in New Zealand. Coin is the responsibility of the Treasury but is distributed by the Reserve Bank. Notes and coin are issued solely in response to the demands of the public. In assessing likely requirements there are seasonal factors to be considered, as well as basic economic conditions such as national income, the levels of salaries and wages, changes in price levels generally, and the total volume of money. In addition, methods and frequency of payments affect the amount to be issued.
Legal Tender—Under the Reserve Bank of New Zealand Act 1964 notes issued by the Reserve Bank are constituted legal tender for any amount. In terms of the Decimal Currency Act 1964, dollar coins are legal tender for any amount, coins of 5, 10, 20, and 50c for any amount not exceeding five dollars, and coins of 1c and 2c for any amount not exceeding 20c.
Restrictions on Export of Currency—Under the Exchange Control Regulations 1978 the taking or sending of money from New Zealand is forbidden except with the consent of the Reserve Bank. The Exchange Control Exemption Notice 1978 (Amendment No. 1) permits travellers to take out up to $100 of New Zealand money in notes or coin of any denomination. The export of any other New Zealand notes or coin or the currency of any other country requires specific consent.
NEW ZEALAND EXCHANGE RATES—The relationship between the New Zealand pound and sterling in the 1960s and earlier years was described in the 1976 and earlier Yearbooks.
During 1971 the value of the United States dollar underwent severe pressure on overseas currency markets. The United States Government reacted by suspending the gold convertibility of the dollar in August 1971. The U.S. dollar was then floated against all other currencies, against which it rapidly depreciated.
The consequent breakdown of the Bretton Woods international monetary system and the introduction of widespread floating necessitated a re-establishment by the International Monetary Fund of a system which, while being more flexible, would promote an orderly basis for conducting foreign exchange transactions. The Smithsonian Agreement of December 1971 introduced a temporary regime intended to facilitate the resumption of fixed par values and stable exchange rates on a more liberal basis. The United States dollar was devalued at this time by a change in the official price for fine gold from US$35 to US$38 per troy ounce and, at the same time, there was a general realignment of several other important currencies.
As part of the arrangements, member countries had the choice of maintaining their existing par values against gold as the basis for their exchange rates, or of establishing a “central rate” against another currency as its “official” exchange rate. To retain an existing par value resulted in a currency revaluation against the United States dollar (after the change in gold price to US$38 per ounce); New Zealand along with the United Kingdom and Australia opted for this arrangement. At the same time New Zealand, like Australia, nominated the United States dollar as its intervention currency instead of sterling as previously. This enabled New Zealand to quote fixed rates upon the United States dollar while the rates for sterling fluctuated from time to time according to the relationship between the U.S. dollar and sterling in free overseas currency markets.
In addition, the Smithsonian arrangements established wider margins within which spot exchange rates were permitted to move and New Zealand availed itself of this facility. The revised margins were 2 1/4; percent either side of parity or central rate (previously 1 percent) and, where an intervention currency was used to establish rates for other currencies, twice this margin for currencies other than the intervention currency. New Zealand established its fixed United States dollar selling rate () at the maximum permissible level below the United States dollar (US$1.2160).
It was evident soon after the Smithsonian Agreement was introduced that the arrangements made to promote exchange stability were not flexible enough to accommodate the rapidly changing economic circumstances between nations. A further breakdown occurred in 1972 when 18 currencies including sterling were floated, and the United States dollar again came under severe pressure. In February 1973 the United States dollar was devalued by 10 percent to US$42.222 per fine ounce of gold (from US$38). New Zealand maintained its gold parity, thus appreciating against the United States dollar to an equivalent par value of US$1.35111=NZ$1. The fixed telegraphic selling and buying rates NZ/USA became US$1.3207 and US$1.3337, respectively.
New Zealand's Currency Basket and Recent Exchange Changes—With the continuation of widespread floating through 1973, the New Zealand dollar, tied to the United States dollar, was experiencing a gradual depreciation against most other currencies, since most were strengthening against the United States dollar on the overseas currency markets. This depreciation was not warranted as far as New Zealand's balance of payments was concerned, and as it was inducing inflationary pressures, it was decided to terminate the fixed relationship between the New Zealand and the United States dollar.
On 9 July 1973, the New Zealand dollar was adjusted upwards by 3.24 percent relative to the United States dollar, the amount needed to restore the relationship existing in mid-February, immediately following the devaluation of the United States dollar. From that date, New Zealand's exchange rates have been calculated daily in a manner which preserves unchanged the average value of the New Zealand dollar against a “basket” comprising the currencies of New Zealand's main trading partners. Thus, from 9 July 1973 until the revaluation in September 1973, the average value of the New Zealand dollar was held at the level that existed on 15 February 1973. The average is a trade-weighted one, and thus movements in the overseas value of the currencies in the basket are reflected in alterations in their value against the New Zealand dollar according to their relative importance in New Zealand's international trade and other current overseas payments. This method of calculating New Zealand's exchange rates obviates some of the fluctuations that would occur in some rates if its currency were pegged to one particular currency. At that time New Zealand advised the IMF that it would no longer maintain a fixed relationship relative to the United States dollar.
On 21 June 1979 the New Zealand dollar was devalued by 5 percent against the basket of currencies to assist exporters to retain their profitability overseas. From this time onward, it was decided to make small adjustments to the exchange rate reflecting the rate of cost increases in New Zealand relative to the increases in the costs of its trading partners, but these adjustments were suspended in June 1982 as part of the wage and price freeze introduced at that time. Following the devaluation of the Australian dollar by 10 percent, the New Zealand dollar was devalued by 6 percent against the basket of currencies on 8 March 1983.
On 18 July 1984 the New Zealand dollar was devalued by 20 percent following a strong outflow of foreign exchange. Devaluation was regarded as being necessary to protect reserves from further depletion, to avoid additional external borrowing, and to ensure that the short-term debt did not accumulate too rapidly.
Exchange Rate Index—Following on from the devaluation of 21 June 1979, an Exchange Rate Index was introduced. This index, which measures the value of the New Zealand dollar against the basket of currencies, stood at 62.7 at the end of August 1984 compared to 78.4 at the end of June 1984. The index has a base of 100.0 at the end of June 1979.
New Zealand's exchange rates are still calculated daily employing the basket of currencies of New Zealand's main trading partners as discussed in the previous paragraphs. The currency composition of the basket is updated regularly in accordance with changing trade patterns.
A New International Exchange Rates System—During the period since the Smithsonian Agreement, extensive international discussions have taken place on aspects of international monetary reform, including the question of an agreed set of principles to replace that Agreement. These discussions resulted, inter alia, in a quite wide-ranging amendment to the International Monetary Fund's Articles of Agreement. The amendment was formally implemented on 1 April 1978. The amended Articles introduced a revised code of conduct for exchange rate policies and practices of member countries intended as a permanent international framework. Although the amended Articles allow for the reintroduction of a par value system (i.e., a fixed rate system) along the lines of the one in existence prior to 1971, it is now understood and widely accepted that a more flexible framework is required in present circumstances. Under the amended/Articles, the International Monetary Fund (IMF) has adopted a set of principles for the guidance of members, which call for countries to collaborate with the IMF and with each other in order to assure orderly exchange arrangements and to promote a stable system of exchange rates. These objectives are similar to those sought in the past, but attention is now focused more on surveillance of economic policies which have a bearing on exchange rates, rather than on the rates themselves. Thus, members are now permitted greater flexibility in altering their exchange rates consistent with the Articles, and have greater freedom to alter their exchange rate practices than existed formerly. IMF surveillance of exchange rate policies in the current international environment will be largely a judgmental matter, in which due consideration is to be paid to the social and economic circumstances of the individual countries.
The “currency basket” method used in New Zealand to determine exchange rates is in line with the amended IMF framework, and thus the introduction of the amended Articles had no implications for New Zealand's exchange rate practices.
OVERSEAS RESERVES—Statistics of New Zealand's official overseas reserves are shown in the following table and, over a longer period, in the Statistical Summary near the back of this Yearbook. The figures are as at the last Wednesday of the month. (Source: Reserve Bank of New Zealand).
| As at | Reserve Bank Overseas Reserves* | Treasury Overseas Reserves | Gold† | Reserve Position at IMF‡ | Special Drawing Rights§ | Total |
|---|---|---|---|---|---|---|
* Comprises foreign exchange and overseas investment of the Reserve Bank in respect of New Zealand business. †Cold holdings of the Reserve Bank at cost. ‡Equal to New Zealand's quota, less its New Zealand currency subscription and any Reserve tranche drawing. §Allocations less exchange transactions. | ||||||
| NZ$(million) | ||||||
| End of June | ||||||
| 1979 | 176.7 | 462.2 | 0.7 | 43.5 | 39.8 | 722.9 |
| 1980 | 76.7 | 319.7 | 0.7 | – | 23.9 | 421.0 |
| 1981 | 115.0 | 304.8 | 0.7 | 36.7 | 21.9 | 479.1 |
| 1982 | 47.3 | 549.2 | 0.7 | – | 3.4 | 600.6 |
| 1983 | 338.7 | 891.7 | 0.7 | – | 25.3 | 1,256.4 |
| End of December | ||||||
| 1979 | 170.8 | 410.1 | 0.7 | – | 13.1 | 594.7 |
| 1980 | 77.5 | 297.9 | 0.7 | 36.3 | – | 412.4 |
| 1981 | 463.0 | 320.3 | 0.7 | 38.6 | 27.7 | 850.3 |
| 1982 | 273.4 | 660.1 | 0.7 | – | 2.5 | 936.7 |
| 1983 | 252.0 | 937.7 | 0.7 | – | 49.7 | 1,240.1 |
OVERSEAS EXCHANGE TRANSACTIONS—For the year ended December 1983 a current account deficit of $894 million was recorded, a decrease of $951 million from the deficit recorded in the previous year. The deficit for the December year comprised a surplus on trade transactions of $1,277 million and a deficit of $2,171 million on “invisible” (non-merchandise) transactions.
Export receipts at $7,613 million were 11 percent higher than the $6,856 million recorded in 1982.
Total import payments, at $6,336 million for the 1983 calendar year, fell by 4 percent from the level of $6,593 million recorded in 1982.
There was only a slight deterioration in the balance on invisible transactions, with the deficit growing from $2,108 million in 1982 to $2,171 million. Payments increased by 12 percent to $4,323 million with the largest increase being recorded in the category 'Private Interest and Investment Income'. Invisible receipts increased by 23 percent to $2,153 million, with transport receipts which were up 40 percent making the largest contribution.
Capital transactions for the year resulted in a net capital inflow of $1,228 million. This inflow comprised net official receipts of $314 million and a net private capital inflow of $914 million. In 1982 the net official receipts were $983 million and the net private capital receipts $868 million. The totals given for these loans are the New Zealand dollar equivalents received at various times during the year by the New Zealand banking system, and do not take into account exchange rate changes since the date of receipt, which will affect the amount repayable in New Zealand currency terms when the loans fall due.
At the end of December 1983 official overseas reserves amounted to $1,240 million, compared with $936 million at the end of December 1982.
A full classification of overseas exchange transactions for the 5 latest December years is given in the following table.
| OVERSEAS EXCHANGE TRANSACTIONS: YEARS ENDED DECEMBER | |||||
|---|---|---|---|---|---|
| Item | 1979 | 1980 | 1981 | 1982 | 1983 |
| NZ$(million) | |||||
| Exports— | Receipts | ||||
| Meat | 1,295.5 | 1,481.4 | 1,713.2 | 1,610.9 | 1,692.5 |
| Wool | 850.6 | 995.7 | 979.5 | 951.1 | 1,105.9 |
| Butter | 230.6 | 374.1 | 502.6 | 428.0 | 480.1 |
| Cheese | 77.2 | 102.7 | 160.1 | 153.8 | 182.4 |
| Other dairy products | 325.3 | 545.4 | 653.0 | 872.7 | 996.4 |
| Other animal products | 402.2 | 401.3 | 397.9 | 440.5 | 492.9 |
| Forest products | 389.2 | 588.6 | 590.3 | 599.3 | 631.4 |
| Other primary products | 219.9 | 313.4 | 353.0 | 438.0 | 528.2 |
| Manufactured exports | 715.6 | 965.4 | 1,124.3 | 1,312.6 | 1,434.1 |
| Miscellaneous | 44.7 | 52.0 | 44.6 | 48.8 | 69.3 |
| Total export receipts | 4,550.8 | 5,819.8 | 6,518.6 | 6,855.7 | 7,613.0 |
| Other current receipts— | |||||
| Cook Islands exports | 0.8 | 0.5 | 2.6 | 0.8 | 1.4 |
| Transport | 291.3 | 353.0 | 435.9 | 495.8 | 693.9 |
| Insurance | 28.1 | 60.8 | 49.9 | 68.6 | 47.3 |
| Travel (excluding fares) | 186.4 | 219.4 | 290.3 | 299.2 | 353.2 |
| International investment income— | |||||
| Interest and dividends | 45.8 | 49.7 | 57.4 | 107.6 | 134.8 |
| Other investment income | 15.7 | 22.8 | 59.8 | 45.9 | 77.2 |
| New Zealand Government receipts and expenditure by other Governments in New Zealand | 45.3 | 55.6 | 64.5 | 73.9 | 96.4 |
| Miscellaneous— | |||||
| Commissions, royalties | 29.6 | 36.0 | 47.9 | 56.8 | 79.6 |
| Expenses of business firms | 35.9 | 39.1 | 76.0 | 128.8 | 150.2 |
| Personal receipts, legacies, and immigrants transfers | 200.6 | 284.8 | 325.3 | 393.4 | 429.2 |
| Other current transactions | 44.0 | 59.3 | 69.0 | 84.6 | 89.4 |
| Total current receipts | 5,474.1 | 7,000.7 | 7,997.3 | 8,611.1 | 9,765.6 |
| Capital transfers— | |||||
| Government borrowing | 926.3 | 833.7 | 1,789.0 | 1,115.8 | 1,827.4 |
| Other official receipts | 52.0 | 282.7 | 144.7 | 862.5 | 1.9 |
| Private | 372.2 | 475.7 | 564.7 | 1,509.7 | 1,818.9 |
| Total capital receipts | 1,350.5 | 1,592.1 | 2,498.4 | 3,488.0 | 3,648.2 |
| IMF— | |||||
| Allocations of SDRs | 29.4 | 32.4 | 31.2 | – | – |
| Total receipts | 6,854.0x | 8,625.3 | 10,526.9 | 12,099.1 | 13,413.8 |
| Payments | |||||
| Imports— | |||||
| Private | 3,652.1 | 4,729.0 | 5,451.3 | 6,277.3 | 5,998.8 |
| Government | 188.1 | 206.2 | 255.7 | 315.7 | 337.4 |
| Total import payments | 3,840.2 | 4,935.2 | 5,707.0 | 6,593.0 | 6,336.3 |
| Cook Islands imports | – | 0.1 | – | – | – |
| Transport | 535.3 | 713.3 | 897.0 | 1.046.8 | 1.205.8 |
| Insurance— | |||||
| Premiums | 27.8 | 33.4 | 42.7 | 61.7 | 72.9 |
| Claims | 4.0 | 4.8 | 4.7 | 5.3 | 12.0 |
| Other transfers | 14.1 | 13.7 | 40.6 | 25.2 | 26.0 |
| Travel (excluding fares) | 488.0 | 555.5 | 633.3 | 666.8 | 677.3 |
| International investment income— | |||||
| Private | 200.1 | 216.6 | 305.1 | 362.7 | 559.6 |
| Government interest | 268.9 | 332.8 | 430.9 | 629.0 | 687.7 |
| Government expenditure overseas | 189.3 | 215.6 | 170.6 | 202.8 | 252.9 |
| Miscellaneous— | |||||
| Commissions, royalties, and rebates | 62.5 | 72.3 | 90.3 | 118.7 | 128.9 |
| Expenses of business firms | 150.5 | 217.4 | 293.9 | 501.9 | 423.8 |
| Film hire and entertainment | 8.8 | 9.2 | 6.3 | 7.0 | 9.8 |
| Religious and charitable | 20.4 | 17.1 | 21.6 | 25.2 | 28.7 |
| Personal remittances, legacies, and emigrants transfers | 142.8 | 156.6 | 2245 | 159.9 | 160.6 |
| Transfers by temporary residents | 7.3 | 8.5 | 10.3 | 10.8 | 11.5 |
| Other current transactions | 50.8 | 47.9 | 72.1 | 39.3 | 65.8 |
| Total current payments | 6,010.9 | 7,550.1 | 8,951.0 | 10,456.1 | 10,659.5 |
| Capital transfers— | |||||
| Government debt repayments | 332.7 | 365.4 | 203.2 | 743.7 | 1,225.6 |
| Other official payments | 70.7 | 285.0 | 58.3 | 206.5 | 284.2 |
| Private | 287.8 | 421.5 | 526.5 | 641.8 | 905.2 |
| Total capital | 691.2 | 1,071.9 | 788.0 | 1,592.0 | 2,415.1 |
| IMF repurchases | 116.9 | 181.8 | 135.7 | 45.0 | 4.8 |
| Total payments | 6,819.0 | 8,803.8 | 9,874.7 | 12,093.1 | 13,079.4 |
| Surplus of receipts over payments | +35.0x | −178.5 | +652.2 | +6.0 | +334.5 |
NOTE—Minus sign (–) denotes a deficit.
The next table gives overseas exchange transactions in summary form for a number of June years, which fit more closely to the farm-production export season than do December years.
| Item | Year Ended 30 June | ||||
|---|---|---|---|---|---|
| 1979 | 1980 | 1981 | 1982 | 1983 | |
| NZ$(million) | |||||
| Exports— | Receipts | ||||
| Meat | 1,196.4 | 1.326.0 | 1,660.8 | 1,651.0 | 1,687.4 |
| Wool | 729.5 | 967.6 | 984.5 | 947.5 | 1.056.3 |
| Butter | 208.1 | 299.0 | 431.1 | 511.1 | 408.7 |
| Milk powders | 154.9 | 222.8 | 359.9 | 471.5 | 635.3 |
| Other dairy products | 236.6 | 288.8 | 382.8 | 458.7 | 519.7 |
| Forest products | 320.6 | 501.2 | 587.7 | 612.9 | 575.6 |
| Manufactured exports | 652.8 | 824.2 | 1,024.1 | 1,202.0 | 1,394.3 |
| Other | 604.6 | 715.3 | 755.6 | 875.8 | 1,002.9 |
| Total exports | 4,103.5 | 5,144.8 | 6,186.5 | 6,730.5 | 7,280.2 |
| Other current receipts | 836.2 | 1,036.1 | 1,311.2 | 1,640.1 | 1,937.0 |
| Total current receipts | 4,939.7 | 6,180.9 | 7,497.7 | 8,370.6 | 9,217.2 |
| Capital receipts— | |||||
| Government borrowing | 760.0 | 441.7 | 1.030.0 | 1,554.7 | 1,703.4 |
| Other official receipts | 96.4 | 252.5 | 223.6 | 622.3 | 243.8 |
| Private | 236.1 | 482.2 | 516.2 | 970.2 | 2,071.3 |
| Total capital receipts | 1,092.5 | 1,176.4 | 1,769.9 | 3,147.2 | 4,018.5 |
| IMF— | |||||
| Drawings | – | – | – | – | – |
| Allocation of SDRs | 29.4 | 32.4 | 31.2 | – | – |
| Total receipts | 6,061.6 | 7,389.8 | 9,298.8 | 11,517.8 | 13,235.7 |
| Imports— | Payments | ||||
| Government | 193.0 | 199.6 | 211.0 | 305.0 | 326.5 |
| Private | 3,203.5 | 4,190.1 | 5,099.0 | 6,030.9 | 5,886.3 |
| Total imports | 3,396.5 | 4,389.7 | 5,310.0 | 6,335.9 | 6,212.7 |
| Other current payments— | |||||
| Government | 439.6 | 523.8 | 560.6 | 715.9 | 921.6 |
| Private | 1,557.0 | 1,799.4 | 2,351.6 | 2,805.3 | 3,135.9 |
| Total current payments | 5,393.0 | 6,712.9 | 8,222.2 | 9,857.1 | 10,270.2 |
| Capital payments— | |||||
| Government debt repayments | 200.9 | 449.7 | 163.2 | 782.7 | 1,212.6 |
| Other official repayments | 94.9 | 99.3 | 243.8 | 135.3 | 173.3 |
| Private | 383.7 | 364.6 | 415.7 | 616.0 | 747.2 |
| Total capital payments | 679.5 | 913.6 | 822.7 | 1,534.0 | 2,133.1 |
| IMF repurchases | 67.2 | 160.1 | 168.1 | 85.0 | 24.3 |
| Total payments | 6,139.7 | 7,786.7 | 9,213.0 | 11,476.1 | 12,427.7 |
| Balance on trade transactions | +707.1 | +755.1 | +876.5 | +394.5 | +1,067.5 |
| Balance on current account “Invisible” transactions | −1.160.4 | −1,287.1 | −1,601.1 | −1,881.1 | −2,120.5 |
| Balance on current account | −453.3 | −532.0 | −724.5 | −1.486.6 | −1.053.0 |
| Balance on capital account | +413.0 | +262.8 | +947.1 | +1,613.2 | +1,885.4 |
| IMF transactions (incl. SDRs) | −37.8 | −127.7 | −136.8 | −85.0 | −24.3 |
| Change in official overseas reserves | −67.4x | −301,9x | +58.1x | +121.5x | +655.8 |
Overseas Travel Allowances—Since 1938, there have been restrictions on the amount of overseas travel funds made available. From June 1973 trading banks have been able to sell overseas exchange to travellers up to $1,000 a month with a maximum of $4,000 a year. Requests for higher amounts need to be referred to the Reserve Bank, which is prepared to approve all reasonable requests.
Exchange Control—Transactions affecting overseas exchange are governed by the Exchange Control Regulations 1978, made under the Reserve Bank of New Zealand Act 1964. An exemption in respect of dealings in foreign currencies and securities in the hands of New Zealand residents is contained in the Exchange Control Exemption Notice 1978.
Certain measures in exchange control and related fields were introduced by the Minister of Finance in the Budget of 16 June 1966, and are set out in paragraphs (a) to (d).
Overseas Securities and Currencies: The facility previously available to New Zealand residents to sell overseas sterling area securities for New Zealand currency or other assets in New Zealand was withdrawn. These securities could then be sold only for other sterling area securities or for sterling area currencies. Therefore, if a New Zealand resident sought cash in New Zealand for sterling area securities the only avenue available at law was to sell overseas and transfer the proceeds to New Zealand through the banking system.
This measure, in effect, closed the market in sterling area securities in exchange for New Zealand currency. A limited market was reopened in October 1966 (see (f) below).
In June 1972 the United Kingdom made changes in its exchange control system. As a result the sterling area and the non-sterling area were redefined. For New Zealand exchange control purposes the sterling area incorporated the United Kingdom (including the Channel Islands, the Isle of Man, and Gibraltar) and the Republic of Ireland. The non-sterling area covered all other countries outside New Zealand except Rhodesia (Zimbabwe). Exchange control transactions with Rhodesia were strictly limited because of the United Nations sanctions against that country. In 1979 the Bank of England abandoned all exchange controls but retained the concept of a sterling area as defined above. Also, in December 1979 the former sanctions against Rhodesia were revoked. The result of these 2 changes is that all currencies and securities domiciled outside New Zealand may now be dealt with freely, i.e., in the same manner as sterling area currencies and securities were previously (see also paragraph (f)).
Export and Import of New Zealand Notes: A limit was set in June 1966 on the export of notes at $10 for all travellers, regardless of destination.
The importation of New Zealand money (including postal notes, money orders, cheques, and promissory notes, but excluding travellers' cheques) was also prohibited, except that travellers to New Zealand could bring in with them up to $10 in New Zealand notes.
From June 1971 travellers from New Zealand were able to take out up to $50 (of which not more than $4 could be in coin and the denominations of the notes could not exceed $5). For travellers to New Zealand there was no restriction on bringing in notes of $1 or $2 or $5 or coin of any denomination.
In October 1979 an amendment to the Exchange Control Exemption Notice 1978 permitted travellers from New Zealand to take up to $100 in New Zealand currency which may comprise banknotes or coin of any denomination. A traveller may now bring into the country New Zealand banknotes or coin of any denomination.
Supervision of Non-Residents' Accounts in New Zealand: The Reserve Bank was given power to exercise supervision over specific accounts in New Zealand of non-residents, with banks or elsewhere.
The following accounts were initially declared to be controlled accounts:
Those of non-resident banks;
Those of non-resident travel agents;
A group of 7 individual accounts connected with international currency dealers.
A subsequent notice to banks had the effect of bringing under control any accounts for the credit to which New Zealand money was received from overseas without the consent of the Reserve Bank. No change of policy was involved, this being a technical measure to ensure that transfers of funds outside the banking system were not facilitated by the operation of New Zealand accounts.
London-domiciled New Zealand Government Stock: In 1920 provision was made for New Zealand residents to transfer holdings of London-domiciled New Zealand stock to the New Zealand register, a facility which provided a means of transferring funds to New Zealand outside the banking system. The volume of such transactions in subsequent years became excessive, and the following conditions were therefore applied to transfers to the New Zealand register on 16 June 1966:
Stock must have been registered in the applicant's name for at least 6 months;
After stock has been transferred to the New Zealand register it may not be sold for 6 months. Since 5 September 1969 the transfer to the New Zealand register has been limited to stock held on or prior to that date. Accordingly very few transfers are now being made under this provision.
Overseas Investment in New Zealand: In 1973 the Overseas Investment Act was passed to make better provision for the supervision and control of overseas investment in New Zealand. The Overseas Investment Commission established under that Act administers the Overseas Investment Regulations 1974, which came into force on 28 May 1974, to give administrative effect to the Act. The regulations were subsequently amended on 28 March 1978 and 17 December 1979. The Secretariat for the Overseas Investment Commission is provided by the Reserve Bank.
The new legislation consolidated and repeated the provisions of the Capital Issues (Overseas) Regulations 1965 and the Overseas Takeovers Regulations 1964, which formerly governed overseas investment in New Zealand.
The Overseas Investment Regulations 1974 define an “overseas person” to include an overseas resident individual, a company incorporated outside New Zealand, and a company incorporated in New Zealand, in which a total of 25 percent or more of any class of share is held by overseas persons.
Consent is required under the Overseas Investment Regulations 1974 for:
a company incorporated in New Zealand to issue or allot shares to overseas persons if the effect is that the company becomes an overseas person;
an overseas person to acquire 25 percent or more of any class of share in a New Zealand incorporated company;
an overseas person to acquire all or substantially all of the assets used in carrying on a business in New Zealand where the consideration exceeds $100,000;
an overseas person to carry on business in New Zealand;
an overseas person (together with all interconnected companies) to borrow more than $300,000 in New Zealand;
all companies incorporated in New Zealand (overseas and New Zealand-owned) to borrow overseas.
Any New Zealand incorporated company also requires prior consent from the Reserve Bank under the Exchange Control Regulations 1978 to borrow overseas or to issue or transfer shares to overseas residents.
Market in Overseas Securities: Trading in overseas securities in exchange for New Zealand currency is confined to New Zealand residents, and to securities which were registered in the names of New Zealand residents on 16 June 1966 or which devolve from such securities. All dealings must be effected through a member of a New Zealand stock exchange, and both seller and purchaser must supply details of the transaction to an approved depository, with whom the scrip must be lodged. Securities so purchased may be sold for New Zealand currency under the same conditions, or sold for overseas currency through a member of a New Zealand stock exchange, provided the proceeds are either remitted to New Zealand or reinvested in similar securities within 3 months. The new scrip must also be lodged with an approved depository. The approved depositories are the Reserve Bank in Wellington and its branches in Auckland and Christchurch.
INTERNATIONAL MONETARY FUND, INTERNATIONAL BANK FOR RECONSTRUCTION AND DEVELOPMENT, AND INTERNATIONAL FINANCE CORPORATION—New Zealand became a member of these 3 organisations on 31 August 1961 under the International Finance Agreements Act 1961. Their objectives and the implications of New Zealand membership were set out in parliamentary paper A.12, 1961. One of the purposes of the International Monetary Fund is to give confidence to members by making the fund's resources available to them under adequate safeguards, thus providing them with opportunity to correct maladjustments in their balance of payments without resorting to measures destructive of national or international prosperity. The bulk of a member's subscription, or quota, is paid in its own currency. The balance is paid in gold, foreign exchange, or Special Drawing Rights (SDRs) and constitutes the member's reserve tranche which may be drawn against automatically. Increasing conditionality applies to successive drawings under the 4 credit tranches, each equal to 25 percent of quota. In addition, drawings may be made under the fund's compensatory financing facility and the various special funding arrangements which are set up from time to time, such as the supplementary financing (Witteveen) facility which came into operation during 1979. The level of quotas is periodically reviewed as the value of world trade increases. The eighth review in 1983 agreed upon an increase of 33 percent in New Zealand's quota which was paid on 30 December 1983. To supplement international reserve assets, SDRs are allocated to members from time to time in proportion to their quotas. New Zealand has recently been allocated SDR 24.1 million ($29.4 million) at the beginning of each of the years 1979 and 1980, and SDR 23.664 million at the beginning of 1981.
New Zealand's position with the International Monetary Fund (IMF) as at the end of a number of recent years is shown in the following table.
| As at End of Year | Quota | Drawing Outstanding* | General Account Position* | Special Drawing Rights (SDRs)† | SDR Value | |||||
|---|---|---|---|---|---|---|---|---|---|---|
| Gold. Foreign Currencies and SDRs | N.Z. Currency Subscription | Reserve Tranche | Oil Facilities | Compensatory Financing | IMF Holdings of N.Z. Currency | Holdings as % of Quota | N.Z.'s Allocation | Holdings by N.Z. | ||
* Drawings are made by obtaining usable foreign exchange from the Fund in return for New Zealand currency which the Fund then holds in its General Account until drawings are repaid. †From time to time the IMF allocates SDRs to members with the objective of increasing international liquidity and promoting world trade. Holdings alter when SDRs are sold or purchased in exchange for foreign currency, or when payments in SDRs are made to the IMF in settlement of interest or other charges. ‡From 1 July 1974 the previous exchange rate of SDRs 1.12 = NZ$1 was replaced by a system of fluctuating rates determined by the IMF in consultation with participating nations. | ||||||||||
| SDR(million)‡ | NZ($) | |||||||||
| 1979 | 50.5 | 181.5 | 50.5x | 153.0 | 115.5 | 502.0 | 216 | 93.5 | 8.9 | 0.7481 |
| 1980 | 79.5 | 268.5 | 50.5 | 93.3 | 39.0 | 452.8 | 130 | 117.7 | – | 0.7545 |
| 1981 | 79.5 | 268.5 | 52.0 | 33.7 | – | 354.1 | 102 | 141.3 | 19.6 | 0.7083 |
| 1982 | 79.5 | 268.5 | 79.5 | 2.9 | – | 350.9 | 101 | 141.3 | 1.7 | 0.6623 |
| 1983 | 107.9 | 353.7 | 79.5 | – | – | 433.2 | 94 | 141.3 | 2.7 | 0.6252 |
INTERNATIONAL DEVELOPMENT ASSOCIATION—The purpose of the International Development Association (IDA) is to promote economic development in developing countries too poor to meet the costs of IBRD or other loans. Its highly concessional credits are financed by contributions from its developed country members. The IDA shares the same staff as the IBRD (and to some extent the IFC) and the 3 organisations are collectively known as the World Bank.
New Zealand joined the IDA in 1975, having earlier made a voluntary contribution of $5 million payable in instalments from 1970–71. As a member of the IDA, New Zealand has contributed to the fourth replenishment of its funds ($7.9 million in instalments from 1974–75), the fifth replenishment ($8.0 million from 1977–78), the sixth replenishment ($10.0 million from 1980–82), and will be contributing an amount yet to be finalised to the seventh replenishment from 1984–86.
The principal purpose of the International Bank for Reconstruction and Development (IBRD) is to promote the economic development of its member countries, by providing loans to governments (or loans guaranteed by governments) for development projects, and related technical assistance. The International Finance Corporation (IFC) promotes the growth of the private sector by lending or investing in business enterprises that are not guaranteed by governments. Both organisations now concentrate their efforts in the developing countries.
New Zealand has subscribed to 3019 shares in the IBRD, with a par value of US$336.46 million. Of this sum, 91.5 percent has not been called up, but, together with the uncalled subscriptions of other member countries, acts as a guarantee for the IBRD's major source of funds, namely borrowing in the financial markets. The balance has been paid in US dollars (US$3.1 million) and New Zealand currency and promissory notes (US$27.7 million). New Zealand has subscribed to 923 shares in the IFC, with a fully paid-up value of $0.9 million.
ASIAN DEVELOPMENT BANK—New Zealand is participating in the Asian Development Bank, whose main objective is to accelerate the economic development of the ESCAP region. New Zealand's initial contribution to the capital stock of the bank was US$22.56 million, half of which is callable. Of the paid-in portion, 50 percent is paid in convertible currency, a total of US$5.64 million, while the balance is paid in New Zealand currency. In 1971 the capital subscription was increased 150 percent, increasing New Zealand's contribution from US$22.56 million to US$56.4 million. Of the increase, 20 percent is paid in and 80 percent is callable, with a total of US$3.24 million to be paid in convertible currency. In 1977 the bank's capital was increased by a further 135 percent. New Zealand's shareholding increased to 13 245 shares which have a value of US$154.3 million. Of this second capital increase, 10 percent is paid in and 90 percent is callable, with a total of US$3.7 million to be paid in convertible currency. In 1983 the third general capital increase took place. New Zealand agreed to take up a further 13 916 shares of which 5.3 percent are to be paid in and 94.7 percent callable. This will require New Zealand to pay US$8.4 million over 5 years, of which 40 percent is to be in convertible currency, and 60 percent in New Zealand dollar denominated promissory notes. The payment will be in 5 equal instalments, the first of which was made in December 1983.
New Zealand also makes contributions to 2 special funds—the Technical Assistance Special Fund (TASF) and the Asian Development Fund (ADF). Between 1974–76, US$6 million was contributed to the ADF, NZ$4.1 million between 1977–80, NZ$4.1 million in 1981–82, and a further NZ$5.98 million will be contributed in equal annual instalments between 1983–85.
New Zealand has allocated a total of NZ$1,050,000 to the TASF in 4 equal annual instalments of NZ$75,000 between 1970 and 1974, NZ$375,000 in 1978–79, and 5 annual instalments of NZ$75,000 between 1979 and 1984.
Two-thirds of the contributions to ADF I were tied to the procurement of goods and services from New Zealand, but all of the contributions to subsequent replenishments to the ADF have been fully convertible. The multi-purpose Special Fund, to which New Zealand has contributed NZ$822,370, has been consolidated with the Asian Development Fund. All New Zealand's contributions to the Technical Assistance Special Fund, along with the New Zealand currency portion of the equity capital of the bank, have been non-convertible.
DEVELOPMENT FINANCE CORPORATION OF NEW ZEALAND (DFC)—This corporation is a development bank established by Act of Parliament for the purpose of encouraging investment in industry, and providing financial assistance and advisory services to industry. The share capital of the Development Finance Corporation is owned by the Crown and is vested in the Minister of Trade and Industry, who appoints a board of directors to control the corporation's business. The board consists of 6 people drawn from the private sector, together with 2 Government officials.
The corporation's principal activity is the provision of term loan finance to manufacturing, processing, technological, and service industries for the purchase of plant and equipment. Development of industries based on natural resources is increasingly receiving DFC assistance. Energy resources, forestry and wood products, horticulture, and tourism are becoming major DFC investment sectors. Other forms of financial assistance are export and regional development suspensory loans, equity participation, hire purchase and leasing, small business venture capital, commercial bill and mortgage money, underwriting, contract bonding, and foreign exchange and money market dealing. In addition, DFC's Small Business Agency offers a loan guarantee scheme to other institutions for small businesses. The DFC administers the Applied Technology Programme which supports industrial research and development and commercialisation of new technology. Corporate finance activities include the packaging and managing of larger scale facilities, such as syndicated loans.
In November 1977 an Act of Parliament established the Small Business Agency, which is operated as a division of the DFC. The Small Business Agency provides a nationwide advisory and referral service for small businesses, and limited financial support by way of guarantees.
FURTHER INFORMATION—Further information on banking and currency will be found in the books listed in the New Zealand Books section near the back of this Yearbook and also in the following publications.
Reserve Bank of New Zealand Annual Report (Parl. paper B. 16).
Report of the Bank of New Zealand (Parl. paper B. 15).
Report of the Development Finance Corporation of New Zealand (Parl. paper B. 26).
Annual Report of the Small Business Agency (Parl. paper B. 26A).
Financial Statement (“Budget”, Parl. paper B. 6).
Reserve Bank of New Zealand Bulletin—Reserve Bank (monthly).
Monetary Policy and the New Zealand Financial System—Reserve Bank (1979).
Economic Trends and Policies—Economic Monitoring Group to Planning Council (periodically).
Monthly Abstract of Statistics—Department of Statistics.
Inflation—N.Z. Monetary and Economic Council (1977).
Report of the Post Office (Parl. paper F. 1).
New Zealand News Review—Reserve Bank (four-weekly).
Daily News Summary—Reserve Bank (daily).
External Economic Structure and Policy—Reserve Bank (1981).
Table of Contents
MORTGAGE LAW—The borrowing of money on mortgage is a principal means of financing the erection or purchase of houses and commercial buildings, and the purchase of farms. Under the Land Transfer Act 1952 “mortgage” means and includes any charge on land created under the provisions of that Act for securing:
The repayment of a loan or satisfaction of an existing debt.
The repayment of future advances, or payment or satisfaction of any future or unascertained debt or liability, contingent or otherwise.
The payment to the holders for the time being of any bonds, debentures, promissory notes, or other securities, negotiable, or otherwise, made or issued by the mortgagor before or after the creation of such charge.
The payment to any person or persons by yearly or periodical payments or otherwise of an annuity, rent charge, or sum of money other than a debt.
Where the ownership of land is registered under the Land Transfer Act (as, see Section 12E, the great majority of land titles now are) mortgages on that land are granted by virtue of the provisions of that Act; they take effect as securities and do not operate as transfers of the estate or interest charged. In the case of other land or property a mortgage is granted under what is known as the deeds or deeds-registration system; the mortgage in this instance operating as a conveyance or assignment of the land or property mortgaged, for the mortgagee becomes the registered proprietor of the land, subject to the right of the mortgagor to have the property registered in his/her name on the discharge of his/her obligations under the mortgage. Although in form a mortgage under the deeds system is a conveyance, in equity it is treated as merely a charge on the land.
MORTGAGE INTEREST RATE CONTROLS—On 7 December 1983, the Government passed the Economic Stabilisation (Mortgage Loans) Regulations controlling mortgage interest rates. The new regulations replace the 1982 Financial Services Regulations, and restrict interest rates on first mortgages to 11 percent per annum, and 14 percent per annum for second or subsequent mortgages. The regulations also prevent the rate of interest being increased on any mortgage except where a contract entered into before 10 November provides for automatic adjustment according to some formula or index, or where a penalty clause is invoked for late payment, or where the interest rate is already less than the maximum permitted rate.
SUMMARY OF MORTGAGES REGISTERED—The following table shows the number of mortgages registered and amounts involved during recent years. A long-term time series showing the aggregate amount involved each year and the average rate of interest is included in the Statistical Summary near the back of this Yearbook.
| Year Ended 31 March | Mortgage Registrations | Total Area | Amount Secured | ||||
|---|---|---|---|---|---|---|---|
| Under 2 Hectares | 2 Hectares and Over | Total | Under 2 Hectares | 2 Hectares and Over | Total | ||
| No. | No. | No. | ha(000) | $(m) | $(m) | $(m) | |
| 1979 | 141,810 | 27,539 | 169,349 | 4,449 | 1,500.7 | 663.4 | 2,164.1 |
| 1980 | 135,224 | 29,772 | 164,996 | 5,186 | 1,618.6 | 848.9 | 2,467.5 |
| 1981 | 139,365 | 28,212 | 167,577 | 5,220 | 1,745.8 | 909.4 | 2,655.2 |
| 1982 | 167,256 | 33,162 | 200,418 | 5,613 | 2,289.1 | 1,256.7 | 3,545.8 |
| 1983 | 136,317 | 29,682 | 165,999 | 4,927 | 2,182.0 | 1,381.6 | 3,563.6 |
NOTE—These figures exclude certain miscellaneous registrations, but may include minor duplications.
The 165 999 mortgages in 1982–83 were in the following categories: first table, 47 159; first flat, 46 778; subsequent table, 32 335; subsequent flat, 30 817; increases in amount, 8910.
MORTGAGES REGISTERED: Value by Districts—The total amount for which mortgages were registered under the Land Transfer Act together with the number of mortgages and the area of properties involved, is shown by registration districts in the following table.
Auckland urban area, the largest centre of population in New Zealand, is in the North Auckland district.
| Land Registration District | 1981–82 | 1982–83 | ||||
|---|---|---|---|---|---|---|
| Number | Amount | Area | Number | Amount | Area | |
| $(m) | hectares (000) | $(m) | hectares (000) | |||
| North Auckland | 70,758 | 1,192.9 | 528 | 51,926 | 998.1 | 309 |
| South Auckland | 30,424 | 631.7 | 677 | 25,119 | 652.9 | 726 |
| Gisborne | 3,072 | 73.6 | 556 | 2,290 | 60.1 | 265 |
| Hawke's Bay | 8,286 | 176.1 | 350 | 6,468 | 171.4 | 273 |
| Taranaki | 5,992 | 120.6 | 265 | 4,772 | 130.7 | 194 |
| Wellington | 31,361 | 463.2 | 624 | 31,653 | 619.4 | 864 |
| Marlborough | 2,094 | 36.6 | 273 | 2,069 | 47.1 | 246 |
| Nelson | 4,686 | 76.4 | 246 | 3,878 | 68.5 | 131 |
| Westland | 1,119 | 15.4 | 102 | 969 | 19.8 | 62 |
| Canterbury | 25,139 | 445.4 | 865 | 21,702 | 468.7 | 860 |
| Otago | 10,420 | 174.2 | 638 | 8,957 | 184.6 | 617 |
| Southland | 7,067 | 139.7 | 489 | 6,196 | 142.3 | 380 |
| Total | 200 418 | 3,545.8 | 5 613 | 165 999 | 3,563.6 | 4,927 |
Classification by Amounts—The following table shows mortgages by amount groups for 1981–82 and 1982–83.
| Amount Group | 1981–82 | 1982–83 | ||||
|---|---|---|---|---|---|---|
| Number | Amount | Percentage of Total | Number | Amount | Percentage of Total | |
| $ | $(000) | % | $(000) | % | ||
| Under 6,000 | 25,525 | 95,044 | 2.7 | 18,860 | 71,646 | 2.0 |
| 6,000–9,999 | 17,620 | 132,444 | 3.7 | 13,853 | 104,281 | 2.9 |
| 10,000–14,999 | 22,110 | 256,076 | 7.2 | 17,820 | 201,726 | 5.7 |
| 15,000–19,999 | 22,858 | 383,642 | 10.8 | 14,779 | 248,769 | 6.9 |
| 20,000–24,999 | 16,858 | 364,257 | 10.4 | 12,540 | 269,350 | 7.6 |
| 25,000–34,999 | 19,744 | 547,324 | 15.4 | 19,975 | 562,245 | 15.8 |
| 35,000–49,999 | 7,904 | 313,238 | 8.8 | 8,976 | 357,481 | 10.0 |
| 50,000–99,999 | 7,835 | 512,038 | 14.5 | 8,476 | 547,666 | 15.4 |
| 100,000–199,999 | 3,598 | 458,517 | 12.9 | 3,947 | 514,255 | 14.4 |
| 200,000 and over | 1,405 | 438,239 | 13.6 | 1,857 | 686,133 | 19.3 |
| Unspecified | 54,961 | – | – | 44,916 | – | – |
Rates of Interest—The average rate of interest on new mortgages over the last 50 years is given in a table in the Statistical Summary at the end of this Yearbook.
The average rate of interest for 1982–83 was 15.16 percent. The comparable rate for 1981–82 was 14.30 percent.
An analysis showing numbers and amounts of mortgages classified by interest rate groups is given below. It should be noted that some mortgages, principally those of trading banks, do not specify the rate of interest.
| Mortgage Interest Rate | 1981–82 | 1982–83 | ||||||
|---|---|---|---|---|---|---|---|---|
| Number | Percentage | Amount | Percentage | Number | Percentage | Amount | Percentage | |
| % | % | $(m) | % | % | $(m) | % | ||
| Under 8 | 2,946 | 2.4 | 84.7 | 2.8 | 2,495 | 2.4 | 102.4 | 3.4 |
| 8–9 | 19,111 | 15.3 | 514.4 | 17.1 | 17,031 | 16.3 | 531.7 | 17.9 |
| 9–13 | 27,986 | 22.5 | 472.9 | 15.7 | 13,939 | 13.4 | 313.9 | 10.6 |
| 13–15 | 29,875 | 24.0 | 725.9 | 24.2 | 16,612 | 15.9 | 453.8 | 15.3 |
| 15–16 | 17,149 | 13.8 | 448.0 | 14.9 | 6,852 | 6.6 | 204.1 | 6.9 |
| 16–17 | 9,566 | 7.7 | 267.3 | 8.9 | 9,194 | 8.8 | 304.3 | 10.2 |
| 17 and over | 17,881 | 14.4 | 491.5 | 16.4 | 38,197 | 36.6 | 1.061.8 | 35.7 |
| Total | 124 514 | 100.0 | 3,004.7 | 100.0 | 104 320 | 100.0 | 2,972.0 | 100.0 |
| Unspecified | 75,904 | 541.1 | 61,679 | 591.6 | … | |||
| Grand Total | 200 418 | 3,545.8 | 165 999 | 3,563.6 | … | |||
Mortgages by Class—In this section mortgages are tabulated by class, i.e., as first flat subsequent flat, first table, subsequent table, and as increases on existing mortgages. The majority of housing mortgages, especially those from Government agencies, are table (or instalment) mortgages. At the 1981 Census, out of a total of 1 003 113 occupied permanent private dwellings, 423 462 were owned with mortgage, 287 343 dwellings were owned without mortgage, 253 389 were rented or leased, and the balance of the dwellings were free with job, loaned without payment, or the tenure was unspecified.
The following table shows the amounts advanced and average Interest rates of mortgages by class. Mortgages for which the interest rates are not specified are excluded from the calculations of average rates.
| Year Ended 31 March | Class of Mortgage | |||||
|---|---|---|---|---|---|---|
| First Flat | Subsequent Flat | First Table | Subsequent Table | Increase of Mortgage | Total | |
| Amount Advanced $(million) | ||||||
| 1979 | 672.8 | 287.1 | 883.5 | 223.8 | 96.9 | 2,164.1 |
| 1980 | 768.1 | 328.7 | 986.3 | 275.3 | 109.0 | 2,467.4 |
| 1981 | 795.2 | 322.3 | 1,072.1 | 334.4 | 131.2 | 2,655.2 |
| 1982 | 1,149.3 | 433.7 | 1,291.8 | 448.7 | 222.3 | 3,545.8 |
| 1983 | 1,167.9 | 583.4 | 1,116.4 | 509.6 | 186.2 | 3,563.6 |
| Average Interest Rate (percent) | ||||||
| 1979 | 11.86 | 11.78 | 9.85 | 11.18 | 9.76 | 10.86 |
| 1980 | 12.44 | 12.34 | 10.34 | 11.66 | 10.22 | 11.38 |
| 1981 | 14.22 | 13.82 | 11.82 | 13.05 | 10.79 | 12.89 |
| 1982 | 15.57 | 14.96 | 13.34 | 14.25 | 11.63 | 14.30 |
| 1983 | 16.67 | 16.60 | 13.46 | 15.22 | 11.49 | 15.16 |
SOURCES OF MORTGAGE FINANCE—The following table indicates the sources of finance for mortgages registered. Of the new mortgages registered in 1982–83, 23.11 percent of the aggregate advances were obtained from Government agencies (of which the principal one is the Housing Corporation) compared with 22.79 percent in 1981–82.
| Year Ended 31 March | Producer Enterprises* | Central Govt. | Local Govt. | Trading Banks† | Trustee Savings Banks | Building Societies | Insurance and Pension Funds | Households | Other | Total |
|---|---|---|---|---|---|---|---|---|---|---|
* Includes solicitors nominee companies. †Includes related savings banks. | ||||||||||
| $(million) | ||||||||||
| Under 2 Hectares | ||||||||||
| 1979 | 306.7 | 322.4 | 2.2 | 61.5 | 209.9 | 113.0 | 127.9 | 219.2 | 137.9 | 1,500.7 |
| 1980 | 330.9 | 383.3 | 2.2 | 50.6 | 191.9 | 129.9 | 126.7 | 225.7 | 177.4 | 1,618.6 |
| 1981 | 338.3 | 412.5 | 2.1 | 54.3 | 229.3 | 158.3 | 135.8 | 230.1 | 185.1 | 1,745.8 |
| 1982 | 522.1 | 402.7 | 3.8 | 72.3 | 313.9 | 233.2 | 170.5 | 290.4 | 280.2 | 2,289.1 |
| 1983 | 600.0 | 397.7 | 6.9 | 31.2 | 92.4 | 200.1 | 177.9 | 327.0 | 348.7 | 2,181.9 |
| 2 Hectares and Over | ||||||||||
| 1979 | 90.8 | 229.3 | 0.6 | 6.2 | 29.7 | 10.6 | 38.6 | 214.3 | 43.4 | 663.4 |
| 1980 | 129.1 | 296.0 | 0.3 | 8.1 | 28.5 | 15.2 | 69.0 | 256.5 | 46.2 | 848.9 |
| 1981 | 155.1 | 301.0 | 0.3 | 5.5 | 32.3 | 18.9 | 83.0 | 247.1 | 66.2 | 909.4 |
| 1982 | 201.9 | 405.3 | 0.1 | 8.4 | 57.8 | 26.0 | 117.9 | 315.4 | 123.9 | 1,256.7 |
| 1983 | 240.6 | 425.8 | 0.1 | 6.6 | 40.3 | 27.7 | 137.6 | 366.1 | 136.8 | 1,381.6 |
Points to note in considering statistics of mortgages by source of finance are that most trading and trustee bank mortgages specify neither interest rates nor the amounts involved; and that from 1976 the Government Life Insurance Corporation and the State Insurance Office have been included among Insurance and Pension Funds.
FURTHER INFORMATION—Monthly statistics of mortgages and an annual appendix are published in the Monthly Abstract of Statistics.
The Government first entered the field of mortgage finance in 1894 with the passing of the Government Advances to Settlers Act—the objective being to provide loans at economic interest rates and on stable terms and conditions to farmers for land development purposes. The functions of the office, later known as the State Advances Department, were subsequently enlarged to allow loans for the erection and purchase of houses, and loans to local authorities for the provision of public facilities. A public corporation was established with the passing of the Mortgage Corporation Act 1934–35—the share capital of $2,000,000 being subscribed equally by Government and public. In terms of the State Advances Corporation Act 1936, the Government acquired the privately-owned share of the Mortgage Corporation, extended its functions, and changed its name to the State Advances Corporation of New Zealand. Under the Rural Banking and Finance Corporation Act 1974 the rural lending activities of the State Advances Corporation passed to the newly-established Rural Banking and Finance Corporation from 1 April 1974.
RURAL BANKING AND FINANCE CORPORATION—The Rural Banking and Finance Corporation provides loans to individuals or organisations engaged in any type of farming, to the fishing industry, or to support industries in these areas. The corporation consists of a chairman and 4 other directors appointed by the Minster of Finance. Two of the directors are appointed after consultation with the Federated Farmers of New Zealand (Inc).
The principal functions of the Rural Bank are to carry on the business of making loans and providing other assistance in its discretion for farming, other primary industries, and related service industries. Its powers include the acquisition of land and other property by purchase or lease and the management, development, sale, or lease of such property. The Rural Bank also has powers to give guarantees and indemnities to other lenders. In the execution of its functions and powers it is required to give effect to Government policy.
Farm Purchase—Loan finance is granted by the Rural Bank for the purchase of form properties. Present policy is directed toward assisting young farmers and farm workers who to demonstrate a need for finance from the Rural Bank, and who have not previously owned an economic property. Loans may be granted for the purchase of land and improvements and for stock and plant.
There is also a special settlement scheme under which a limited number of above-average farmers can be settled each year with loans of up to 85 percent of the available security.
Farm Vendor Finance Scheme—The purpose of this scheme is to assist suitably qualified and experienced farmers to purchase their first farm by encouraging retiring farmers to invest in their industry.
Retiring farmers who leave money in farms sold to approved purchasers will be exempt from taxation on half the interest earned by that money.
Vendors have the option of a Farm Vendor Finance Bond, or a Farm Vendor Mortgage Guarantee. During 1983–84 some 15 farmers were settled under the Farm Vendor Bond scheme and bonds amounting to $2.36 million were issued. Under the Mortgage Guarantee scheme 122 mortgages were guaranteed for a total of $15.86 million.
Farm Workers Holding—These loans provide a bona fide farm worker with the opportunity to purchase a “stepping stone” unit which can be operated part time in conjunction with his/her farm employment. The farm worker is therefore assisted to accumulate experience and assets towards future farm ownership.
Farm Development—Loan policy in the area of farm development is to stimulate increased production and the intensification of small holdings, strengthen marginal farms, and provide buildings and other essential improvements. In appropriate cases, loans may be advanced on second or subsequent mortgages.
Irrigation and Rural Water Supply—Loans are available from the Rural Bank for on-farm works associated with community schemes, new private irrigation schemes, or the extension of existing schemes. In 1982 the Government announced changes to irrigation and water supply policies.
Under the new policy normal development lending criteria must be met, and the loans are available on a repayment term of up to 10 years with interest at 7 1/2; percent. No principal repayments are required during the first three years and interest charges are also deferred for the initial 3 year period and then added to the principal sum repayable.
The total amount channelled into irrigation development exceeded $37 million involving 1132 approvals and a substantial portion of this was approved under the terms outlined above.
Suspensory loans of up to 50 percent of eligible expenditure may be provided for approved West Coast drainage schemes.
Refinance—The Rural Bank has limited funds for refinancing onerous farm debts but is normally unable to provide assistance to repay existing mortgages unless the mortgagor is facing serious hardship through inability to obtain a renewal.
Loans on Stock and Plant—Loans which are essentially for the purchase of stock and plant, e.g., sharemilking propositions, are available on the security of the stock and chattels being purchased.
Sharemilkers' Suspensory Loans—Sharemilkers or other short-term lessees, purchasing their first farm, facing a tax liability through having to reduce stock may qualify for a suspensory loan if the carrying capacity of the farm they are purchasing is less than that of the property they have been farming and the stock reduction is more than 20 head. The loan is calculated on $30 per cow reduction with a maximum of $7,000 and is interest free. Subject to the borrower owning and farming the property for 10 years the suspensory loan may be written off.
Rural Resource Development Zones—This policy was introduced to assist with the intensification of agriculture, horticulture, and the further development of the fishing industry and farm services in designated zones which have scope for growth but, because of particular features, have not attained the development maturity of more established regions. The designated zones comprise parts of Northland, the East Coast of the North Island, the King Country, and the West Coast of the South Island.
The bank will consider extended financial assistance under the various forms of Rural Bank loans to eligible applicants with the aim of furthering development within the designated zones.
Co-operative Rural Intermediate Credit Associations—Loans may be granted by the Rural Bank to co-operative rural intermediate credit associations operating in terms of the Rural Intermediate Credit Act 1927 and amendments. At 31 March 1984, there were 4 co-operative rural intermediate credit associations in operation.
Farm Mortgage Guarantees—In recognition of the need for farmers to have access to more capital than the Rural Bank can make available by direct loans, the Rural Bank operates a Farm Mortgage Guarantee Scheme. Under this scheme the Rural Bank protects prudent lenders with soundly administered mortgage against loss of capital.
Forestry—Where it is considered that tree planting is the best use of the land, the Rural Bank will lend to farmers for forestry projects and associated development works.
Climatic Relief—This on-going financial facility is available to farmers as a relief measure following severe losses or damage due to adverse climatic or other conditions.
The loans can be used for purposes such as the purchase of grazing, grain, hay, and other stock feed, fertiliser, replanting or resowing of crops, orchards, etc. This can also include living expenses and normal maintenance where there has been a serious loss of income. Repayment terms are flexible and are tailored to meet the particular circumstances of the applicant.
Farm Ownership Savings—The Farm Ownership Savings Scheme, administered by the Rural Bank, allows farm workers, sharemilkers, others associated with farming, and also students the opportunity of opening savings accounts for the purpose of buying a first farm or for the purchase of stock and plant to go sharemilking or share farming for the first time. These accounts can be opened with the Post Office Savings Bank, trustee savings banks, private savings banks, and some building societies. Depositors have the option of operating one or other of the following types of accounts under the scheme:
Ordinary Farm Ownership Accounts which provide for tax free purchase grants; or
Special Farm Ownership Accounts which allow depositors tax benefits on their savings.
Industrial Lending—Loans are available to those industries in the rural sector which have export potential, which will assist regional development, or which service the primary industries. Examples include veterinary clinics, packing sheds, cool stores, grain dryers, and milk treatment plants as well as agricultural contractors.
Rural Export Suspensory Loans—To promote the export of non-traditional agricultural, horticultural and fish products. Suspensory loans of up to 40 percent of qualifying capital expenditure including plant and equipment, are available from the Rural Bank. Upon achievement of the export target, the loan is converted to a grant and written off.
Fishing Lending—Under its lending policies the Rural Bank provides financial assistance to the fishing industry. Loans are available for such purposes as vessel replacement, improvements to vessels, fishing gear and equipment, re-engining of vessels and for fish packing and processing facilities. The bank is also able to assist with finance for the development of mussel and rock oyster farms.
Commercial Lending—This is funded from moneys raised through issues of public stock. Commercial loans are available to those borrowers who would not normally qualify for assistance under the bank's standard lending policies. In 1983–84, 160 loans for $5.26 million were approved.
STANDARD AND SPECIAL LOAN AUTHORISATIONS—A summary of loans authorised by the Rural Bank during the years ended 31 March 1983 and 1984 is given in the following table.
| Loans | 1982–83 | 1983–84 | ||
|---|---|---|---|---|
| Number | Amount | Number | Amount | |
| Standard Lending— | $(m) | $(m) | ||
| Farm settlement | 895 | 118.80 | 685 | 101.19 |
| Workers holding (“stepping stone” units) | 272 | 14.90 | 240 | 14.22 |
| Additional land (strengthening existing farms) | 210 | 13.30 | 223 | 17.26 |
| Sharemilkers suspensory (farm purchase) | 153 | 0.47 | 141 | 0.40 |
| Development | 6,630 | 171.85 | 6,080 | 161.30 |
| Stock and plant loans (sharefarmers) | 1,167 | 32.69 | 1,119 | 33.19 |
| Advances to RIC associations | 47 | 1.04 | 25 | 0.60 |
| Refinance | 63 | 1.34 | 82 | 2.37 |
| Climatic relief | 369 | 5.75 | 1,351 | 26.34 |
| Estate Duty | 34 | 1.30 | 15 | 0.80 |
| Department of Lands and Survey settlement | 35 | 3.16 | 28 | 2.38 |
| Fishing industry | 109 | 7.72 | 75 | 6.76 |
| Rural industrial lending | 332 | 14.36 | 493 | 23.55 |
| 10,316 | 386.68 | 10,557 | 390.36 | |
| Special Lending— | ||||
| Livestock Incentive Scheme (loan option) | 1,204 | 16.59 | – | – |
| Land Development Encouragement | 1 | 0.74 | – | – |
| Sheepfarmers Consolidation | 1,830 | 39.61 | – | – |
| 3,035 | 56.94 | – | – | |
| Total | 13 351 | 443.62 | 10 557 | 390.36 |
| Livestock Incentive Scheme (tax option) | 40 | 0.86 | – | – |
A breakdown of rural industrial and fishing industry lending in the above table is given below.
| Item | 1982–83 | 1983–84 | ||
|---|---|---|---|---|
| Number | Amount | Number | Amount | |
| * No export suspensory loans were approved during the 1982–83 year. | ||||
| $(m) | $(m) | |||
| Rural Industrial Lending— | ||||
| Rural industries | 68 | 3.84 | 63 | 3.99 |
| Producer boards | – | – | 1 | 0.75 |
| Cool stores and packhouses | 32 | 4.72 | 82 | 10.27 |
| Agricultural plant and machinery (including special plant) | 146 | 2.95 | 268 | 5.86 |
| Agricultural contractors | 63 | 2.07 | 68 | 2.23 |
| Rural Export suspensory loan | 23 | 0.78 | 11 | 0.45 |
| Total | 332 | 14.36 | 493 | 23.55 |
| Fishing Industry Lending— | ||||
| Loans for catching | 100 | 4.77 | 60 | 3.92 |
| Loans for processing facilities | 9 | 2.95 | 11 | 2.62 |
| Rural export suspensory loans* | – | – | 4 | 0.22 |
| Total | 109 | 7.72 | 75 | 6.76 |
ADDITIONAL INFORMATION—Additional information will be found in the following official publications:
Report of the Rural Banking and Finance Corporation of New Zealand (Parl. paper B. 25).
Report of the New Zealand Fishing Industry Board (Parl. paper C. 6).
HOUSING CORPORATION OF NEW ZEALAND—Under the Housing Corporation Act 1974 the functions of the State Advances Corporation in housing were amalgamated with those previously performed by the Housing Division of the Ministry of Works and Development, to constitute the Housing Corporation of New Zealand responsible to the Minister of Housing.
Housing Loans—Up to 1 April 1979 the Housing Corporation continued to concentrate the bulk of its residential lending on the provision of loans to build or to acquire houses not previously occupied. Loans to assist home seekers purchase previously occupied houses (reinstated in 1964) were available to the extent of available funds and to applicants within strictly defined priority categories. Traditionally, successive Governments supported the building industry by encouraging loans for home building, the need to add to the building stock, and the importance of the building industry as a major employer.
From 1 April 1979 onwards, major factors influencing a decline in new house building were: a high net emigration rate, a static population, increasing unemployment, rapidly increasing building costs, and rising interest rates.
In formulating policies the Government was conscious of the need to continue to give a measure of support to the building industry but at the same time to allow home seekers on lower incomes a greater degree of choice between building a new home or buying an existing one. The Government also considered that the private lending institutions should assume a greater responsibility for residential lending.
On 1 April 1979 a change of policy was implemented. For the first time in many years, applicants seeking a first home (whether married or single with or without dependants) had the choice of building a new home or buying an existing property, provided the principal income earner's income was within the eligibility criteria and a personal deposit of at least 20 percent of the total ingoing (12 1/2 percent for married couples or sole persons with dependants who build) was contributed in cash, by Family Benefit capitalisation, or from sources such as a Post Office Home Ownership Savings Account, or any amount available to corporation tenants who qualify for a tenant's suspensory loan. From 2 August 1983 first mortgage finance became available from the Post Office. Home Ownership Account Holders whose income did not fall within specified income limits could seek first mortgage finance from the Post Office. The Housing Corporation ceased to lend to this group of applicants unless they meet the corporation's lending criteria.
The corporation specified that to qualify for a loan the total housing commitment, including rates and fire insurance, could not exceed a fixed percentage of gross income, namely 30 percent for single income families and 35 percent for dual income families.
A measure of support was given to the building industry on 1 April 1979 with the introduction of an interest-free suspensory loan of $2,500 available to applicants building a first home (whether or not loan finance was obtained from the corporation) provided the cost of the house and site was not more than $50,000. From 1 July 1980 the building suspensory loan was increased to $4,000, but was only available to first home seekers who obtained loan finance from private lending institutions (not the Housing Corporation or Maori Affairs Department) and as a guideline where the total cost of the house and land was not in excess of $70,000. The building suspensory loan was increased to $5,000 on 15 July 1982 with the same eligibility criteria applying. For the year ended 31 March 1983 there were 127 building suspensory loans of $4,000 each amounting to $0.51 million and 1118 loans of $5,000 each totalling $5.59 million. Up to 1 July 1980, applicants offered loans were required to contribute 2 percent of the amount of the loan to the corporation's general reserve fund. From that date this longstanding requirement was waived.
All Housing Corporation loans are made on the security of a first mortgage. Each case is considered on its merits, taking into account the financial position of the applicants and the cost of the proposition. Each applicant is expected to make the maximum possible contribution from available resources.
Maximum Loan—Before 1 July 1980 the maximum loan for a new house was $20,000, and for existing houses, $17,500 or 80 percent of the corporation's valuation of the property, whichever was the less. These loan limits have been increased since that date as follows.
| Date of Increase | New House | Existing House* |
|---|---|---|
| * Or 80 percent of the corporation's valuation, whichever is the less. | ||
| 1 July 1980 | $24,000 | $17,500 |
| 24 June 1981 | $25,000 | $18,500 |
| 15 July 1982 | $25,000 | $25,000 |
| 16 November 1982 | $30,000 | $25,000 |
The former limits of $25,000 for a new house and $18,500 for existing houses was retained for service-related applicants such as public servants on transfer, rehabilitation and armed forces borrowers, and applicants who have lived in accomodation provided by employers for 10 years (tied housing).
Income Limits—To keep the total of loans within the funds allocated, loans for existing houses before 1 July 1980 were restricted to applicants qualifying for interest concessions, that is, the principal earner's income at the time of application, or the weekly average over the previous 12 months, did not exceed $180 plus $10 per week for each dependent child.
On 24 June 1981, along with the increased maximum loan for new houses, the income maximum for loan eligibility was increased to $250 per week, plus $10 per week for each dependent child.
A choice between building a new house or buying an existing house was available to applicants whose income was within these limits:
| Single person without dependants | $200 per week gross. |
| Single income families or parents with dependants | $250 per week gross, plus $10 per week for each dependent child. |
As from 15 July 1982 the gross income limits were increased as follows:
| Single person without dependants | $200 per week |
| Single persons with dependants other than a child | $300 per week |
| Single persons with dependent children | $300 per week plus $25 per week for each dependent child |
| Households with at least one dependent child | $300 per week plus $25 per week for each dependent child |
| OR | |
| $400 per week provided any individual income does not exceed $200 per week. However the principal earner's income may exceed $200 per week by $25 per week for every child provided the total family income does not exceed $400 per week. |
As from 2 August 1983, a free choice between a new home or a previously occupied property continued to be available, but allowable income was increased to the following income limits.
| Single person over 26 years of age | $210 gross income per week |
| Single person with dependant(s) other than a child | $310 gross income per week |
| Single person with one or more dependent children | $310 gross income per week plus $25 per week for every child. |
| Couples with or without children | $310 gross family income per week plus $25 for every child. |
| OR | |
| $410 provided any individual income does not exceed $210 per week. However the principal earner's income may exceed $210 per week by $25 per week for every child, provided that the total income does not exceed $410. |
From August 1983 applicants for a corporation loan must use no more than 30 percent of their gross income (including couples with dual incomes) on outgoings on the home (i.e., mortgage commitments, local authority rates, and fire insurance premiums).
The maximum deposit required for building a house or buying a previously occupied dwelling was reduced from 20 percent to 12 1/2 percent of the total cost.
As from 2 November 1983, the income limits were retained but loans were only available to applicants with at least one child, who were seeking finance to build or buy a new house. Finance was not available to sole applicants, households without children, or to applicants seeking finance to buy a previously occupied property.
Interest Rates—The prime interest rate since 15 March 1979 was 9 percent, subject to review at 3 yearly intervals. Rebated interest rates of 3 percent, 5 percent, and 6 1/2 percent were also available. To qualify for a rebated-interest loan, borrowers must not have owned a property within 5 years prior to the date of the loan application, and the principal income earner's gross income (including overtime, bonus payments, and secondary employment) must not exceed certain limits: for 3 percent, $85 per week increased by $10 for each dependent child; for 5 percent, between $85 and $120; and for 6 1/2 percent, between $120 and $160, with both similarly increased by $10 for each dependent child. Loans provide for an automatic increase to the next higher rate at 3 yearly intervals.
On 15 July 1982, the prime rate of 9 percent became reviewable annually for all loans approved after that date.
The concessional interest rates were made reviewable annually after the first 3 years. Effective from 28 July 1983, the corporation's prime interest rate was reduced to 7 1/2 percent reviewable annually after the first 3 years. A concessional interest rate of 5 percent reviewable annually after the first 3 years was available if the main income earner's gross income was $160 per week, less $25 per week for each dependent child. The prime interest rate for service-related groups remained at 9 percent but reviewable annually.
Of the 9372 loans approved to build and buy houses during 1982–83 (11 302 in 1981–82), 790 loans carried interest rebates (957 in 1981–82).
Since February 1978, low-start mortgages have been available to borrowers required to pay the prime interest rate to help ease the heavy burden in the early years of home ownership, particularly when secondary borrowing was necessary. Anyone granted a loan at the prime interest rate has been able to choose between:
A standard table mortgage for 30 years;
Interest payments for 3 years, then a standard table mortgage for 30 years; or
If the loan exceeds $15,000 ($23,000 from 1 August 1983) reduced repayments at varying rates for a term of 3 years, then a 27-year table mortgage.
Low start options were taken up by 1759 low income borrowers during the year ended 31 March 1983, compared with 1822 in 1982–83.
Loans to Refinance—A scheme was introduced in the 1973 Budget to refinance existing mortgages on residential properties in circumstances where family incomes were under undue strain caused by high interest rates or onerous terms of repayments.
This policy was extended on August 1977 to provide for refinance where a mortgage had fallen due and could not be renewed or replaced within the private sector. The maximum loan limits were extended as from 2 August 1983—first mortgages from $18,500 to $25,000; second mortgages from $5,000 to $15,000. For the year ended 31 March 1983, a total of 210 loans for $2.56 million were advanced. Security may be on first and subsequent mortgages.
Home Improvement and Urban Renewal Schemes—The housing improvement loan scheme, originally introduced in 1972 and limited to improvement of inner city areas in the 4 main centres, was extended to all localities in 1975. Loans were entertained for owner-occupier or tenanted properties on subsequent mortgage. The aim was to upgrade older houses in inner city areas and help corporation mortgagors provide essential alterations and extensions to their homes, to house a dependent elderly relative, or to provide extra bedroom space for a growing family. The loan approved, plus any prior mortgage debt, had to be within 90 percent of the corporation's value of the completed property.
On 1 September 1979, alongside this scheme, the Community and Housing Improvement Programme (CHIP) came into operation.
The 2 major objectives were:
To improve the condition and utilisation of existing housing stock and urban facilities.
To ensure that residential renewal activity was fully integrated into urban development and management strategies at local, regional, and national levels.
The Community Housing Improvement Programme provided financial assistance to local authorities, builders, developers, and home owners for a much wider range of urban renewal activities, particularly within Neighbourhood Improvement Areas (NIA). The Neighbourhood Improvement Areas (NIA) replaced the Comprehensive Urban Renewal Areas (CURA) and Reclamation Areas of the former policy as areas where private and local urban renewal activities received the maximum Government assistance and support.
During 1982–83 a total of 3599 loans for $27.89 million were approved for home improvements and in the terms of the CHIP programme, compared with 3086 loans for $23.35 million in the previous year. The loan limits were $10,000, and $12,500 if the property was in a NIA. There was a considerable demand for corporation funds and a lowering of demand was considered necessary. As from 22 June 1983 home improvement loans were no longer available to absentee landlords, including those who owned property in NIAs, and sole applicants aged 25 years or less with no dependants.
On 5 September 1983 the Government decided that no new NIAs would be opened and that the CHIP programme would be phased out by 31 March 1986.
Armed Forces Housing and Furniture Loans—The Government announced a scheme in the 1978 Budget to provide housing loans to service personnel with at least 12 years' regular service with the New Zealand Armed Forces. The housing loan interest rate is 3 percent for the first 5 years and 5 percent for the remainder of the loan term provided the servicemen or women remain in the Armed Forces, or have completed 20 years service, or reach retiring age for rank, or are medically discharged.
As well, furniture loans of $1,000 were made available to regular force personnel with 12 years' service and territorial personnel with 5 successive years' satisfactory service. The loans are interest-free provided the borrower remains in the services and maintains continuous and efficient service.
The number of loans approved for the year ended 31 March 1983 are shown in the following table. The previous year's figures are shown in parentheses.
| Item | Number | Amount |
|---|---|---|
| $(m) | ||
| Houses | 149 (194) | 3.03 (3.82) |
| Furniture | 334 (442) | 0.24 (0.42) |
Tied Housing Scheme—The scheme was introduced on 1 October 1977 to enable married employees required to live in employer-provided accommodation as a condition of employment to acquire a retirement home, even though they could not live in it immediately. The original scheme required the employee to be at least 45 years of age and within 10 years of retirement. In June 1978 the age was reduced to 40 years and the requirement that the applicant be within 10 years of retiring waived.
On 30 January 1981, as a result of pressure from the rural sector, the scheme was amended again. Age and marital status no longer had any bearing on eligibility. The major criteria were changed to:
the necessity, as a condition of employment, to live in employer-provided accommodation for at least 10 years or, when occupation has not been continuous, for 10 years over the preceding 15-year period;
a need to borrow;
applicants to be first home seekers.
During the year ended 31 March 1983, 255 loans for $5.16 million were approved, compared with 372 loans for $6.90 million in the previous year.
Family Benefit Capitalisation—Applications for advances under the Family Benefits (Home Ownership) Act 1964 are received only from applicants who have already been declared eligible by the Department of Social Welfare.
As from 17 August 1982, the amount available for capitalisation was increased from $3 to $6 a week for each child. The maximum capitalisation amount increased from $3,000 to $4,000, the income limit was increased from $225 to $250 a week for a one child family, and the allowance for each additional child was increased from $10 to $25 a week. An increase in the income limit of up to $10 a week for special housing needs remained.
From 25 July 1983, the income limit for a one child family was increased to $275 per week, and increased by a further $25 per week for each subsequent child.
The maximum cash asset limit for eligibility purposes was increased from $10,000 to $20,000.
For the year ended 31 March 1983, 2451 advances totalling $7.66 million were authorised by the corporation under this agency, compared with 1850 advances totalling $4.30 million in 1981–82.
Mortgage Guarantee Scheme for Housing—The corporation has statutory authority to guarantee mortgages and operates a scheme whereby an approved lender may be guaranteed repayment of a housing loan. In 1982–83 there were 4070 guarantees involving $66.08 million, compared with 9586 guarantees for $135.43 million in 1981–82.
Loan Authorisations—A summary of loans authorised by the corporation for the latest 3 financial years ended 31 March is given in the following table.
| Class of Loan | 1980–81 | 1981–82 | 1982–83 | |||
|---|---|---|---|---|---|---|
| Number | Amount | Number | Amount | Number | Amount | |
| Housing loans— | $(m) | $(m) | $(m) | |||
| Erection | 3,977 | 88.32 | 3,253 | 81.00 | 2,064 | 55.25 |
| Purchase | 8,636 | 144.44 | 8,049 | 140.80 | 7,308 | 149.12 |
| Home improvement | 3,095 | 21.48 | 3,086 | 23.35 | 3,599 | 27.89 |
| Refinance | 120 | 1.24 | 150 | 1.59 | 210 | 2.57 |
| Other purposes | 197 | 1.68 | 558 | 5.76 | 255 | 2.24 |
| Total housing | 16 025 | 257.16 | 15 096 | 252.50 | 13 436 | 237.07 |
The above figures include rehabilitation loans to ex-servicemen and armed forces loans to service personnel for housing purposes. They do not include loans to local authorities.
A summary of the number of housing loans under administration as at 31 March of the latest 3 years is as follows:
| Loans on Mortgages* | As at 31 March | ||
|---|---|---|---|
| 1981 | 1982 | 1983 | |
| * These figures do not include loans administered by the Housing Corporation on an agency basis (e.g., hotel investment account, gas companies) or industrial loans. | |||
| Urban | 161,310 | 158 546x | 162,167 |
| Local authority | 184 | 160 | 128 |
| Urban housing | 1,371 | 1,453 | 1,530 |
| Rural housing | 924 | 986 | 1,061 |
| Total | 163 789 | 161 145x | 164 886 |
HOUSING ACT 1955—In addition to its lending activities the Housing Corporation has the function of administering the Housing Act 1955 on behalf of the Crown. The following are the main operations:
Letting and administration of corporation rental houses and flats.
Sale of corporation rental houses to tenants desiring to purchase.
Loans to local authorities for the erection of rental accommodation.
Corporation Rental Housing—The number of additional dwelling units taken over by the corporation during the year ended 31 March 1983 totalled 467. The number of tenancies administered on 31 March 1983 was 58 943.
Rent accounts in arrears at 31 March 1983 were 1.25 percent of the total compared with 1.91 percent a year earlier.
Rents received from tenancies during 1982–83 amounted to $83,835,456 compared with $78,264,873 for 1981–82. Apart from interest, the largest single item of expenditure charged against rentals was the provision for maintenance of rental houses. For the year ended 31 March 1983 this amounted to $32.7 million compared with $31.6 million for the previous year. Rates payable to local authorities showed an increase for the year ended 31 March 1983 totalling $18,723,173 compared with the previous year's figure of $16,541,573.
References to corporation housing construction are contained in Section 20, Building Construction and Housing.
Sale of Rental Houses—Rental houses are available for sale to tenants on the following terms:
Sale price to be the current market value of the property.
The minimum deposit to be 10 percent of the purchase price in all areas except Otara, Mangere, and Porirua East, where the minimum deposit is to be 5 percent.
The balance of the purchase price together with interest payable over a term of up to 30 years on an instalment table mortgage basis.
Interest at 7 1/2 percent reducible to 5 percent reviewable yearly while conditions of sale are complied with in the case of purchasers who would qualify for these rates for a corporation housing loan.
From the inception of the sale of rental houses up to 31 March 1984 the number of dwelling sales finalised amounted to 33 737 dwellings (excluding pensioner units transferred to local authorities) for a total consideration of approximately 385.59 million.
FURTHER INFORMATION—Further information will be found in the annual publication, Report of the Housing Corporation of New Zealand (Parl. paper B. 13). See also Section 20, Building Construction and Housing.
Building societies are a relatively popular means of saving and investment in New Zealand and have 674 000 members. At 1 April 1983 there were 34 building societies with total assets of more than $1,087 million. They provided finance for home ownership of $228 million in 1982. Building societies have assisted the national economy by attracting and encouraging savings. They are encouraged by legislation, as in other countries. The relevant legislation is the Building Societies Act 1965 and its amendments, the Building Societies Savings Bank Regulations 1966, and the Building Societies Regulations 1967.
The Building Societies Investment Order 1977 requires building societies to hold a percentage of their assets in qualifying public securities.
PERMANENT AND TERMINATING SOCIETIES—The Building Societies Amendment Act 1980 is expected to have a profound effect on the future development of building societies in New Zealand.
For some years concern had been expressed at some aspects of the operations of terminating societies i.e., those societies that conducted ballots and tenders for loans within contractual savings groups. In particular, concern had been expressed about the amount that members forfeited through not maintaining their contractual obligations, and in general, about the cost of operating such institutions which resulted in low returns on members' savings.
Terminating societies had long since lost favour with the public and with the authorities in other countries, and reform in New Zealand was considered long overdue, a view reinforced by the declining membership of such societies in recent years. It was considered significant that virtually all terminating societies were actively promoting an allied permanent society.
Following critical comment by both Ministers and officials the terminating societies responded with a proposed new form of product which they felt was more in keeping with the needs of savers in the 1980s. While the Amendment Act prohibits the sale of terminating group shares from 1 April 1981, societies are permitted to conduct ballots for a minor portion of their operating profit—“bonus ballots”. This type of share may be marketed by all societies as well as all societies being able to market the usual products associated with permanent societies.
The shares that were issued in terminating groups involved the member in long-term contractual savings. Generally the products offered by permanent societies are far more flexible and range from savings share accounts to fixed term shares and deposit accounts not dissimilar to those available from savings banks.
The Building Societies Act still refers to permanent and terminating societies for technical reasons but no longer restricts the activities of societies to one function or the other and so the merging of allied terminating and permanent societies was facilitated.
Largely as a consequence of the new legislation, a significant rationalisation of building societies has recently occurred, a fact indicated by the reduction in the number of societies from 53 at the beginning of 1980 to 34 on 1 April 1983.
Since all societies had from 1 April 1982 a common range of available products to market, it was logical that allied terminating and permanent societies should merge. This was effected by transferring the engagements of the permanent society to the parent terminating society. At the same time, a number of smaller societies transferred their engagements to larger and stronger units better equipped to operate on the new basis.
ACTIVITIES OF SOCIETIES—Societies do not have a common balance date. The following tables have been prepared from the annual returns of societies as at their various balance dates during the 1982 calendar year. The first of these tables gives a summary of results for the latest 3 available years.
| Item | 1980 | 1981 | 1982 |
|---|---|---|---|
| * At beginning of year. | |||
| Number of societies* | 53 | 41 | 37 |
| Paid-up capital $(000) | 595,148 | 673,154 | 790,567 |
| Number of shareholders | 547,626 | 565,810 | 674,175 |
A summary of receipts and payments of societies during 1980, 1981 and 1982 is given in the following table.
| Item | 1980 | 1981 | 1982 |
|---|---|---|---|
| * Nine societies are authorised by the Act to accept deposits on conditions substantially similar to the conditions pertaining to the Post Office, trustee, and private savings banks. | |||
| Receipts | $(thousand) | ||
| Share subscriptions (excluding subscriptions on borrowing shares) | 388,937 | 466,916 | 903,324 |
| Deposits received— | |||
| Savings* | 7,518 | 9,005 | 9,726 |
| Other | 245,138 | 272,479 | 362,137 |
| Interest and principal repaid— | |||
| Advances on mortgage (including subscriptions on borrowing shares) | 152,966 | 160,795 | 225,716 |
| Advances on shares | 14,813 | 12,732 | 9,684 |
| Investments realised | 311,546 | 432,926 | 511,815 |
| Payments | |||
| Share moneys withdrawn | 335,706 | 393,170 | 796,100 |
| Deposits and interest withdrawn— | |||
| Savings* | 7,372 | 8,165 | 8,726 |
| Other | 230,985 | 273,882 | 376,328 |
| Advanced on mortgage | 143,533 | 163,093 | 249,181 |
| Advanced on shares | 15,862 | 12,855 | 14,065 |
| Investments made | 346,126 | 472,609 | 521,400 |
A summary of income and expenditure for the financial year ended in 1982 is given in the following table.
| Item | Amount |
|---|---|
* Terminating shares only. †Mainly levies on members as provisions against losses on mortgage. | |
| Income | $(000) |
| Interest earned on— | |
| Advances | 89,554 |
| Investments | 37,983 |
| Fees, commissions and fines | 3,610 |
| Income from properties | 2,041 |
| Net credit from shares forfeited or withdrawn at a discount* | 3,220 |
| Mortgagors' contributions to reserves | 307 |
| Other† | 290 |
| Total income | 137,005 |
| Expenditure | |
| Interest incurred on borrowings | 25,831 |
| Directors' emoluments | 555 |
| Auditors' fees | 403 |
| Salaries | 16,373 |
| Other administrative expenses | 16,093 |
| Selling and establishment expenses—written off | 4,413 |
| Payments for ballot loan rights—written off* | 5,431 |
| Expenses on properties, including depreciation | 3,443 |
| Discount on shares paid in advance—written off* | 116 |
| Other | 6,213 |
| Total expenditure | 78,871 |
| Excess of income over expenditure | 58,134 |
The purposes of advances on mortgage in the 3 latest available years are shown in the following table.
| Purpose of Loan | 1980 | 1981 | 1982 |
|---|---|---|---|
| $(million) | |||
| Dwellings— | |||
| Erections | 10.2 | 12.1 | 36.6 |
| Purchases | 75.9 | 101.0 | 145.7 |
| Other purposes | 45.1 | 36.4 | 46.0 |
| Business and other properties | 12.3 | 13.6 | 21.0 |
| Total | 143.5 | 163.1 | 249.2 |
| Number of advances | 9,505 | 9,624 | 12,380 |
The following table summarises balance sheets for the financial year ended during 1982.
| Item | Value or Amount |
|---|---|
| * For definition and analysis see Parliamentary paper B. 14 Report of the Registrar of Building Societies. | |
| Assets | $(000) |
| Land and buildings | 44,401 |
| Other fixed assets | 13,820 |
| Advances on security of mortgage (less credits on borrowing shares) | 760,326 |
| Advances on security of shares | 19,235 |
| Investments | 244,955 |
| Cash and bank | 1,080 |
| Income | |
| Appropriations in trust debit balances | – |
| Other | 4,081 |
| Total assets | 1,087,898 |
| Liabilities | |
| Paid-up capital (excluding borrowing shares) | 790,567 |
| Reserves | 65,861 |
| Retained profits | 3,780 |
| 860,208 | |
| Less fictitious assets* | 3,314 |
| 856,894 | |
| Deposits— | |
| Savings | 2,969 |
| Other | 196,875 |
| Appropriations in trust credit balances | 1,161 |
| Provisions | 8,613 |
| Bank overdraft | 9,851 |
| Other | 11,535 |
| Total liabilities | 1,087,898 |
The method of carrying on business by companies is now a proved system, a system for the incorporation of persons into a separate entity for trading purposes and providing a convenient method for the investment of capital and for the limitation of liability of the people associated in the company. The incorporation of a company with limited liability provides the framework of commercial and industrial life; private companies have become a usual form of business organisation for the smaller trader.
LEGISLATION—Comprehensive legislation relating to companies is contained in the Companies Act 1955, which came into force on 1 January 1957. An important principle in the legislation is the protection of shareholders, creditors, and the general public by the requirement that there must be the fullest practicable disclosure of information concerning the activities of companies. The annual financial statements must exhibit a true and complete account of a company's affairs and transactions. A prescribed form of presentation is required, and comparative figures for the previous year must be shown.
Offers to the public require the issue of a prospectus, which must be registered with the Registrar of Companies. The Securities Act 1978 set up a Securities Commission (see below) whose responsibilities include recommending rules in this area. As a result of their recommendations, the Securities Regulations 1983 came into force in September 1983. The regulations cover restrictions and the content of registered prospectuses and advertisements.
Any number of persons from 2 to 25 may form a private company; a public company must have at least 7 members. A private company of not less than 7 members may, under certain conditions, be reregistered as a public company.
The Companies Amendment Act 1963 restricts company takeovers. The Companies Amendment Act 1966 deals with deposits and debentures, and came into force on 1 January 1967.
SECURITIES COMMISSION—The Securities Commission was established under the Securities Act 1978, and consists of 5 members and 5 alternate members appointed by the Governor-General on the recommendation of the Minister of Justice. The Chairman is Mr C. I. Patterson, a barrister and solicitor. The functions of the commission are to:
exercise jurisdiction under the Securities Act 1978 regarding public offers of securities;
keep under review the law relating to incorporated bodies, securities, and unincorporated issuers of securities, and to recommend to the Minister of Justice any changes it considers necessary;
keep under review practices relating to securities and to comment about them to any appropriate body; and
promote public understanding of the law and practice relating to securities.
The commission has completed a major work of law reform relating to public offers of securities. This came into effect on 1 September 1983 with the commencement of Part II Securities Act 1978 and the Securities Regulations 1983. These deal with the content of prospectuses and advertisements relating to offers of securities to the public. The application of the Securities Act and Regulations can be varied in appropriate circumstances, either temporarily or on a long-term basis, by the exercise of the commission's statutory power of exemption.
In October 1983 the commission published a review of the law and practice of company takeovers, including proposals for reform. After considering a number of submissions from interested parties, it will report to the Minister of Justice with proposals to reform the existing law on the subject.
The commission has also been involved in reviews of the law and practice relating to nominee shareholdings in public companies and to contributory mortgages. Its future law reform programme includes reviews of the law and practice relating to:
financial reporting;
the duties and responsibilities of officers of entities who offer securities to the public, with particular reference to the use of information relevant to the value of shares and insider trading;
secondary market operations, with particular reference to the Sharebrokers Act 1908.
COMPANY REGISTRATIONS—The following table shows, for the latest available years, the number of new companies registered, deleted from the company register, placed under receivership, and liquidated. In comparing company registration figures for one year with another, it should not be overlooked that registrations on account of reconstruction of companies, or for other reasons, are included.
| Year | New Companies Registered | Companies Dissolved or Struck Off | Companies Placed Under Receivership | Company Liquidations | Total Number of Companies | |
|---|---|---|---|---|---|---|
| Court Order | Voluntary | |||||
| 1979 | 5,778 | 4,254 | 310 | 485 | 423 | 112,224 |
| 1980 | 6,116 | 2,957 | 256 | 399 | 359 | 115,226 |
| 1981 | 6,753 | 3,027 | 222 | 323 | 380 | 117,957 |
| 1982 | 6,370 | 5,735 | 259 | 351 | 274 | 118 589x |
| 1983 | 6,967 | 2,691 | 331 | 419 | 293 | 122,892 |
ANALYSIS OF PUBLIC COMPANY FINANCIAL STATEMENTS—Since 1953 the Reserve Bank of New Zealand has undertaken an analysis of the annual financial statements of a sample of public companies in New Zealand to obtain information concerning company finance and the capital market. Almost all companies whose shares are listed on the Stock Exchange are included, together with a few others. Results of these analyses are published in an annual supplement to the Reserve Bank Bulletin.
In 1977 the coverage was extended to include non-listed and overseas companies. Overseas companies are those with 25 percent or more of their voting share capital controlled by overseas interests, and include any branch of an overseas incorporated company. Public companies (listed or non-listed) which are owned overseas but operate mainly in New Zealand, and whose income is derived largely from New Zealand sources, are included in the 'overseas company' category.
The 1982 survey analysed 931 companies during the year ended December 1982, comprising 152 listed public companies, 319 non-listed public companies, and 460 overseas companies. The 1982 survey also included a survey of current cost accounting data covering 26 companies.
The percentage distribution of sources and use of funds for the latest 2 years are shown in the following table.
| Source and Use of Funds | 1981 | 1982 |
|---|---|---|
| Source of funds— | percent | |
| Retained profits and depreciation | 33.4 | 33.7 |
| Other long-term sources | 35.0 | 36.3 |
| All long-term sources | 68.4 | 70.0 |
| Short-term sources | 31.6 | 30.0 |
| Total | 100.0 | 100.0 |
| Use of funds— | ||
| Property and plant | 29.9 | 30.5 |
| Long-term investment | 15.2 | 17.8 |
| All long-term uses | 45.1 | 48.3 |
| Stocks | 18.0 | 16.7 |
| Debtors | 30.9 | 28.3 |
| Other short-term | 6.0 | 6.7 |
| Total | 100.0 | 100.0 |
The aggregate appropriation of income for 931 New Zealand companies in the latest 2 years is shown in the following table.
| Annual Accounts | 1981 | 1982 |
|---|---|---|
| Income for year— | $(million) | |
| Trading | 1,936.7 | 2,463.2 |
| Investment | 165.4 | 232.1 |
| Other non-trading | 38.3 | 45.9 |
| Total income | 2,140.4 | 2,741.2 |
| Less— | ||
| Depreciation | 371.3 | 434.1 |
| Interest on fixed liabilities | 463.8 | 634.6 |
| Directors' fees | 8.3 | 9.9 |
| Tax on current year income | 411.7 | 520.5 |
| Minority interests | 22.6 | 33.2 |
| Total deductions | 1,277.7 | 1,632.3 |
| Net profit after tax | 862.7 | 1,108.9 |
| Previous year's adjustments— | ||
| Tax | −2.7 | −3.0 |
| Other | 61.6 | 83.9 |
| Available for appropriation | 921.6 | 1,189.9 |
| Appropriations— | ||
| Goodwill, etc., written off | 15.0 | 25.0 |
| Ordinary dividends | 307.8 | 407.0 |
| Preference dividends | 20.0 | 27.6 |
| Retained in reserves | 578.8 | 730.3 |
| Total | 921.6 | 1,189.9 |
Net Profits and Net Profit Ratios—Net profits (after tax) and net profit ratios are shown in the following table. This analysis includes annual accounts of companies balancing between June 1981 and October 1982, and mainly reflects trading conditions from January 1981 to July 1982. Of the 20 industry groups surveyed, 2 experienced a decrease in net profits and 18 experienced an increase. The decline occurred in the meat processing, drugs, and chemicals sectors, where net profits fell by 7.7 million and 2.0 million respectively. Overall net profits rose by 28.5 percent.
The return on shareholders' funds increased in 16 of the 20 sectors to stand at 13.1 percent, an increase of 0.5 percent on the previous year.
In 13 of the 20 sectors the return on total resources increased, the overall return rising by 0.3 percent to 5.1 percent.
High rates of inflation during the survey period, combined with conventional accounting procedures for profit calculation, means that recorded rates of increase or decrease in profits does not reflect real changes in corporate profitability.
| Type of Company* | Number of Companies | Net Profit | Return | ||
|---|---|---|---|---|---|
| Total | Change From Previous Year | On Shareholders Funds† | On Total Resources‡ | ||
* For note on balance dates see opening paragraphs of this subsection. †The return on shareholders' funds is net tax-paid profit expressed as a percentage of shareholders' funds. This ratio demonstrates the earning power of the funds invested in the business by the shareholders. ‡The return on total resources is an expression of the percentage of net tax-paid profit to total tangible assets. This ratio is an indicator of the earning power of the business. | |||||
| $(million) | percent | ||||
| Manufacturing | |||||
| Meat processing | 30 | 53.3 | −7.7 | 11.9 | 5.1 |
| Beverages | 8 | 38.2 | +4.3 | 8.8 | 4.6 |
| Other food | 37 | 59.0 | +12.7 | 15.6 | 9.0 |
| All food | 75 | 150.5 | +9.3 | 11.9 | 5.9 |
| Woollen mills | 7 | 34.3 | +9.2 | 16.0 | 7.6 |
| Clothing manufactures | 18 | 8.2 | +3.5 | 17.8 | 9.0 |
| Forestry and wood | 17 | 175.4 | +21.7 | 12.2 | 5.6 |
| Printing and publishing | 51 | 30.9 | +12.1 | 15.9 | 8.7 |
| Drugs and chemicals | 50 | 89.3 | −2.0 | 11.5 | 5.2 |
| Non-metallic minerals | 29 | 33.6 | +1.4 | 11.2 | 5.4 |
| Metals and machinery | 75 | 105.0 | +33.0 | 15.2 | 7.2 |
| Electric machinery and appliances | 44 | 50.1 | +24.8 | 17.7 | 8.5 |
| Other manufacturing | 67 | 62.9 | +15.4 | 14.6 | 7.8 |
| Manufacturing other than food | 358 | 589.7 | + 119.0 | 13.5 | 6.4 |
| All manufacturing | 433 | 740.3 | + 128.4 | 13.1 | 6.3 |
| Other (excluding financial) | |||||
| Construction | 15 | 4.5 | +1.6 | 8.5 | 3.3 |
| Gas | 9 | 1.8 | +0.3 | 8.4 | 4.9 |
| Mainly wholesale | 141 | 118.5 | +41.2 | 14.6 | 5.7 |
| Mainly retail | 92 | 53.9 | +137 | 14.1 | 6.4 |
| Stock and station agents | 24 | 33.9 | +6.0 | 11.5 | 4.5 |
| Transport | 44 | 47.6 | +15.4 | 18.7 | 8.7 |
| Property investors | 78 | 26.7 | +8.4 | 10.8 | 3.1 |
| Total other (excluding financial) | 403 | 287.0 | +86.8 | 13.9 | 5.5 |
| Total (excluding financial) | 836 | 1,027.3 | +215.2 | 13.3 | 6.0 |
| Financial | 95 | 81.6 | +31.0 | 11.1 | 1.7 |
| Grand Total | 931 | 1,108.9 | +246.2 | 13.1 | 5.1 |
NOTE—Totals may not add because of rounding.
The development of life assurance has gone beyond its original function of providing a source of income for old age and for dependants in case of death. In particular, it has become increasingly important as the basis of many private superannuation schemes. Whole-life assurance has been widely supplemented by endowment assurance. Under this category there are policies with titles such as “family-income”, “education”, “mortgage-protection”, or “retirement”, and persons taking out policies regard them as a means of systematic saving. Government encouragement is given by way of income-tax concessions on premiums paid, this approach being common to the governments of many countries.
The steady flow of funds to insurance companies by the payment of premiums are in the form of contractual saving, and the investment of these funds has become a major influence on the financial market. Life-assurance companies are leading lenders of long-term funds to the private sector and important investors in Government and local authority securities. Life assurance assets in 1982–83 totalled $4,736 million, of which 23.9 percent was invested in mortgages on property, 27.6 percent in Central Government and local authority securities, and 20.1 percent in company stocks, shares and debentures.
In the year 1982–83 there were 214 163 new policies issued for a total sum assured of $8,790.5 million, or approximately $2,722 per head of population. The total number of policies in force at the end of the year was 2 810 387 for a total life assurance of $39,424 million. (These totals exclude annuities.)
INTERNATIONAL COMPARISON—On the basis of the ratio of the value of life assurance in force to the national income, New Zealand is fifth to Japan, Canada, the United States, and the Netherlands as shown in the following table of selected countries. (Source: Life Insurance Fact Book, 1983, and Department of Statistics.)
| Country | 1976 | 1981 |
|---|---|---|
| percent | ||
| Canada | 151 | 169 |
| United States | 152 | 156 |
| Sweden | 128 | |
| New Zealand | 140 | 110 |
| Japan | 232 | 300 |
| Australia | 100 | 109 |
| Netherlands | 109 | 130 |
| United Kingdom | 72 | 81 |
Term life cover is believed to constitute a higher proportion of the total coverage in Canada and the United States than in New Zealand, where permanent life cover is relatively high. (Purchase of assurance for a set term provides maximum immediate cover at the lowest cost and can be used to cover mortgage repayments on a house; insurance for a short term for travel purposes is also popular in the United States and Canada.) In other countries group life plans are negotiated by groups of workers and typically provide for a death benefit equal to once or twice the total of annual earnings.
GENERAL—The statutory provisions affecting life assurance in New Zealand are in the main contained in the Life Insurance Act 1908, the Inalienable Life Annuities Act 1910. and the Government Life Insurance Act 1953.
There are 35 life-assurance offices conducting business in New Zealand at the present time. Of these, 16 are purely New Zealand institutions—namely, the Government Life Insurance Office, Capital Life Assurance Ltd., Cuna Mutual Insurance Society, National Insurance Co. of New Zealand Ltd., New Zealand Insurance Life Ltd., Metropolitan Life Assurance Co. of New Zealand Ltd., Superannuation and Mutual Savings Ltd., Primary Industries Insurance Co. Ltd., A.A. Mutual, Tasman Mutual Life Assurance Co. Ltd., Fidelity Life Assurance Co. Ltd., Marac Life Assurance Ltd., Equitable Life and General Insurance Co. Ltd., Invincible Life Assurance, Medical Life Assurance Society Ltd., and Greenwich Life Insurance Co. Ltd., whilst two, Provident Life Assurance Co., and Monarch Life Insurance Co. of new Zealand, are registered in this country. The balance dates of the offices vary between July and June of the following year, the financial year of the majority ending in December. The statistics given here relate exclusively to business transacted in New Zealand.
SUMMARY OF BUSINESS—The statistics in the following tables are compiled from annual returns furnished by the insurance companies for the period up to 30 June 1983. Five offices transact industrial assurance. This is essentially the same as ordinary assurance except that the premiums are payable at shorter intervals than three months and are usually collected personally by agents. In the following tables data referring to ordinary assurance business and industrial assurance business have been amalgamated.
The first table shows revenue and expenditure during the latest 3 years.
| Item | 1980–81 | 1981–82 | 1982–83 |
|---|---|---|---|
| * New and renewal premiums for 1981–82 were substantially influenced by a $182.9 million premium received by National Mutual Life Association of Australasia Co. Ltd., on taking over the life business of Commercial Union General Insurance Co. Ltd. | |||
| $(thousand) | |||
| Revenue | |||
| New and renewal premiums* | 445,662 | 702,897 | 580,589 |
| Interest, rents, etc. | 322,798 | 390,423 | 476,099 |
| Transfers | 5,840 | 4,540 | 2,824 |
| Total (includes other) | 864,025 | 1,221,685 | 1,175,654 |
| Expenditure | |||
| Claims | 151,035 | 179,305 | 203,845 |
| Annuities | 2,693 | 3,530 | 4,505 |
| Surrenders | 135,175 | 155,386 | 176,887 |
| Commissions | 54,205 | 64,698 | 80,247 |
| Other management expenses | 88,276 | 100,345 | 118,231 |
| Rates and taxes | 35,578 | 45,878 | 54,975 |
| Transfers | 3,247 | 3,809 | 2,343 |
| Total (includes other) | 485,922 | 564,930 | 671,015 |
The following table gives a summary of life-assurance business during the latest available 5 years. Annuity policies are excluded. Of these, 783 were issued during 1982–83, and there were 3712 annuities in force at the end of 1982–83.
| Year | New Policies Issued | Policies Discontinued | Policies in Force | |||
|---|---|---|---|---|---|---|
| Number | Sum Assured | Number | Sum Assured | Number | Sum Assured | |
* Because of changes in the accounting procedures of some companies the value of policies existing at the end of the year will not balance. †Includes companies previously not surveyed. | ||||||
| (000) | $(m) | (000) | $(m) | (000) | $(m) | |
| 1978–79 | 215 | 4,044.3 | 183 | 1,508.5 | 2,785 | 22,346.2 |
| 1979–80* | 227 | 5,229.1 | 190 | 2,025.1 | 2,822 | 25,593.0 |
| 1980–81 | 208 | 5,863.2 | 208 | 2,471.2 | 2,823 | 28,985.0 |
| 1981–82* | 212 | 7,449.6 | 215 | 2,594.4 | 2,822 | 34,065.8 |
| 1982–83† | 214 | 8,790.5 | 232 | 3,648.9 | 2,810 | 39,423.9 |
Calculated on a full year basis, existing policies' annual premiums amounted to $603.4 million for 1982–83 compared with $533.0 during 1981–82, and $460.3 million during 1980–81.
Total discontinuances include surrenders and lapses, as well as policies maturing or terminated by death.
An analysis by cause of policies discontinued during the latest 3 years is shown in the following table. Ordinary and industrial policies have been combined.
| Cause of Discontinuance | 1980–81 | 1981–82 | 1982–83 |
|---|---|---|---|
| $(million) | |||
| Death | 51.5 | 59.1 | 69.0 |
| Maturity | 88.7 | 106.7 | 144.2 |
| Surrender | 1,141.4 | 1,415.4 | 1,794.9 |
| Lapse | 546.3 | 711.0 | 967.7 |
| Other causes | 643.3 | 302.1 | 673.1 |
| Total | 2,471.2 | 2,594.3 | 3,648.9 |
A prominent feature of new insurances of recent years has been the increase in the average amount of the sum assured per policy.
| Year | Average Amount* |
|---|---|
| * Excludes annuities and industrial policies. | |
| $ | |
| 1977–78 | 17,233 |
| 1978–79 | 18,927 |
| 1979–80 | 23,195 |
| 1980–81 | 28,247 |
| 1981–82 | 35,187 |
| 1982–83 | 41,083 |
Reasons for the growth in the average amount of the sum assured per policy shown in the above table include the changing types of policies being issued, and the increasing numbers of such policies which have a high cover (for example, cover for staff superannuation purposes by business concerns, temporary insurance with a high death-risk cover, multiple death benefit and family benefit policies having a high initial cover, and “unit” policies whereby a single premium provides a high initial death cover). A further reason is the relatively high rate of inflation in recent years.
LIABILITIES AND ASSETS—The principal items in the balance sheets of life-assurance companies are summarised below for the 3 latest years. As in the previous tables the figures relate to New Zealand business only. In the case of some companies other branches of insurance business are included.
| Liabilities | 1980–81 | 1981–82 | 1982–83 |
|---|---|---|---|
| $(thousand) | |||
| Paid-up share capital | 7,831 | 6,047 | 6,794 |
| Life-assurance and annuity funds | 3,355,695 | 4,020,119 | 4,518,097 |
| Depreciation, reserves, and other special funds | 47,634 | 65,539 | 75,779 |
| Claims admitted, but not paid | 19,530 | 20,878 | 23,970 |
| Other liabilities | 70,783 | 73,452 | 111,725 |
| Total | 3,501,470 | 4,186,032 | 4,736,362 |
The assets of companies conducting business in New Zealand at the end of the 3 latest years were as follows:
| Assets | Amount | Percentage of Total | ||||
|---|---|---|---|---|---|---|
| 1980–81 | 1981–82 | 1982–83 | 1980–81 | 1981–82 | 1982–83 | |
| $(million) | percent | |||||
| Mortgages on property, etc. | 890.3 | 1,007.7 | 1,132.3 | 25.4 | 24.1 | 23.9 |
| Loans on policies | 165.7 | 194.7 | 218.9 | 4.7 | 4.6 | 4.6 |
| Central Government securities | 623.7 | 765.2 | 848.8 | 17.8 | 18.3 | 17.9 |
| Local authority securities | 321.1 | 372.9 | 457.2 | 9.2 | 8.9 | 9.6 |
| Real estate | 675.1 | 794.9 | 903.9 | 19.3 | 19.0 | 19.1 |
| Company shares and debentures | 658.4 | 843.9 | 952.5 | 18.8 | 20.2 | 20.1 |
| Outstanding premiums | 34.6 | 38.5 | 37.4 | 1.0 | 0.9 | 0.8 |
| Interest accrued, etc. | 52.9 | 62.6 | 81.4 | 1.5 | 1.5 | 1.7 |
| Cash | 40.6 | 57.2 | 45.1 | 1.2 | 1.4 | 1.0 |
| Other assets | 37.1 | 48.4 | 58.9 | 1.1 | 1.1 | 1.2 |
| Total | 3,499.4 | 4,186.0 | 4,736.4 | 100.0 | 100.0 | 100.0 |
The Government has made agreements with life-assurance companies regarding the proportion of their new funds invested in Government and local authority securities. The current ruling requires life offices to hold not less than 31 percent of gross selected assets in public sector investments, of which not less than 20 percent is to be in Government stock. In addition, life offices are required to hold 20 percent of their assets in housing and farming investments.
For 1982–83 the average rate of interest earned on the life funds of insurance companies was $13.72 percent, compared with $13.77 percent during 1981–82 and $11.97 percent during 1980–81.
In composite-insurance offices, receipts of life assurance and annuity business must be treated as a separate fund, and the interests of the policyholders are safeguarded by the fact that these funds are available only for liabilities arising from such business.
Until 1974 there were 3 principal classes of accident insurance transacted in New Zealand. These were: (a) personal, covering accidents, sickness, etc.; (b) employers' liability under statutory or common law; and (c) motor vehicle insurance. Other classes of accident insurance include the insurance of plate glass, television sets, luggage, and livestock.
The Accident Compensation Act 1972, which became effective from 1 April 1974, provided continuous cover against accidents for all persons in regular employment, whether at work or not, through an earners' scheme financed by levies averaging 1 percent of incomes payable by employers on behalf of employees. The levies replaced employers' liability premiums under the Workers Compensation Act.
Previous to 1974 there were 2 classes of motor vehicle insurance—comprehensive coverage, and compulsory third-party risks cover. Owners of motor vehicles were compelled to insure against their liability to pay damages on account of the death or bodily injury of another person caused through the car-owners' negligence. However, this compulsory scheme was replaced from 1 July 1974 by a new scheme under the Accident Compensation Act 1972. This provides financial compensation for personal injuries suffered in motor vehicle accidents irrespective of blame. It is financed by levies similar to the previous insurance premiums paid by motor vehicle owners.
The number of accident insurance offices represented in the statistics for 1982–83 was 49. The head offices of the companies concerned were in the following countries: Great Britain, 6; Australia, 10; United States of America, 3; Hong Kong, 1; and New Zealand, 29.
REVENUE AND EXPENDITURE—The following table shows the principal items of revenue and expenditure. Premiums and claims are net, i.e., after deductions for acceptances of reinsurance, whether effected locally or overseas, have been taken into account.
| Year | Number of Offices | Revenue | Expenditure | ||||||
|---|---|---|---|---|---|---|---|---|---|
| Premiums | Other Revenue | Total* | Claims | Commission | Salaries | Other Expenses | Total* | ||
| * Excluding reserve provisions. | |||||||||
| $(million) | |||||||||
| 1978–79 | 54 | 176.9 | 14.1 | 191.0 | 123.3 | 12.9 | 19.5 | 22.8 | 178.5 |
| 1979–80 | 54 | 197.8 | 16.6 | 214.4 | 130.0 | 14.3 | 23.5 | 24.9 | 192.7 |
| 1980–81 | 53 | 227.0 | 18.4 | 245.1 | 163.8 | 16.4 | 27.3 | 23.5 | 231.0 |
| 1981–82 | 51 | 299.0 | 23.0 | 322.0 | 221.0 | 21.2 | 36.4 | 34.2 | 312.8 |
| 1982–83 | 49 | 327.6 | 25.2 | 352.9 | 232.5 | 23.9 | 34.3 | 31.4 | 322.0 |
Premium receipts in 1982–83 were 9.6 percent above the 1981–82 figure, while claims had risen by 5.2 percent.
A review of the expenses incurred in transacting all accident insurance is contained in the table following. The fluctuations over a period of 5 years are shown in the form of percentages of revenue to expenditure under various heads. The percentages do not take into account reserve provisions.
| Year | Claims to Premiums | Commission to Premiums | Salaries to Premiums | Other Expenses to Premiums | Total Expenses (other than Claims) to Premiums | Total Expenditure to Premiums | Total Expenditure to Total Revenue |
|---|---|---|---|---|---|---|---|
| percent | |||||||
| 1978–79 | 69.7 | 7.3 | 11.0 | 12.9 | 31.2 | 100.9 | 93.5 |
| 1979–80 | 65.7 | 7.2 | 11.9 | 12.6 | 31.7 | 97.4 | 89.9 |
| 1980–81 | 72.2 | 7.2 | 12.0 | 10.4 | 29.6 | 101.8 | 94.1 |
| 1981–82 | 73.9 | 7.1 | 12.2 | 11.4 | 30.7 | 104.6 | 97.2 |
| 1982–83 | 70.9 | 7.3 | 10.5 | 9.6 | 27.3 | 98.3 | 91.3 |
Working expenses amounted to $64,328,000 in 1980–81, $89,074,000 in 1981–82 and $88,102,000 in 1982–83. The ratio of working expenses to premium income for each of the 3 years were respectively 28.3, 29.8, and 26.9 percent. These figures include commissions, salaries and other working expenses, however, claims and New Zealand Government taxes are excluded.
Fire is still the main cause of property damage, but today many property owners seek protection not only against fire damage, but also against a wide range of other dangers including water damage, windstorm, explosion, breakages, theft, damage from aircraft, and impact by motor vehicles. Under houseowners' and householders' comprehensive policies, which have largely superseded fire insurance policies for covering dwellings and their contents, many thousands of additional claims are now dealt with each year. Increasing numbers of commercial property owners, too, are extending their fire policies to include damage from other causes.
In 1983 there were 37 fire-insurance companies conducting business in New Zealand. Of these, the head offices of 23 were in New Zealand, 6 were in Great Britian, 5 in Australia, 2 in the United States of America, and 1 in Hong Kong. The statistics in this section relate to the latest financial year of each company. Fifteen of these closely approximate to the calendar year 1982 and 22 extend up to the following June.
SUMMARY OF BUSINESS—The statistics in the following summary relate to the business conducted with the insuring public. Reinsurance transactions are not taken into account.
| Year | Policies as at Balance Date | Gross Cover as at Balance Date | Premium Income | Gross Loss | Percentage of Claims to Premium Income |
|---|---|---|---|---|---|
| No. | $(m) | $(000) | $(000) | percent | |
| 1978–79 | 2,248,466 | 60,317.4 | 126,248 | 70,357 | 55.7 |
| 1979–80 | 2,233,498 | 68,516.0 | 192,417 | 85,248 | 44.3 |
| 1980–81 | 2,305,634 | 78,936.3 | 207,965 | 98,724 | 47.5 |
| 1981–82 | 2,267,020 | 103,505.4 | 289,436 | 134,817 | 46.6 |
| 1982–83 | 2,305,464 | 128,493.5 | 380,185 | 156,231 | 41.1 |
LIABILITIES—The following table shows whole-world liabilities of fire-insurance companies. The figures refer to all departments of business underwritten. Funds of life departments are added for completeness, but by the Life Insurance Act 1908 life funds must be accounted for separately, and form a security for life-policy holders which is not available for other classes of insurance transacted.
| Item | 1980–81 Total | 1981–82 Total | 1982–83 | ||
|---|---|---|---|---|---|
| Overseas Companies | Local Companies | Total | |||
| $(million) | |||||
| Paid-up capital | 531.8 | 585.7 | 527.2 | 81.0 | 608.2 |
| Reserves | 1,922.5 | 4,020.1 | 4,807.7 | 321.0 | 5,128.7 |
| Other liabilities | 5,269.5 | 8,346.7 | 9,003.0 | 1,208.3 | 10,211.3 |
| Total | 7,723.8 | 12,952.4 | 14,337.9 | 1,610.3 | 15,948.2 |
| Life funds | 11,907.3 | 14,362.9 | 24,899.4 | 307.6 | 25,207.0 |
| Total liabilities | 19,631.2 | 27,315.4 | 39,237.4 | 1,917.9 | 41,155.3 |
ASSETS—The following table gives the amount of assets in New Zealand as at the end of each of the latest 5 years classified under various heads. The figures given include all investments in New Zealand securities and do not relate merely to the assets held by the New Zealand branches of the companies concerned. The assets of other departments—accident, life, marine, etc.—are also included.
| Assets in New Zealand | 1978–79 | 1979–80 | 1980–81 | 1981–82 | 1982–83 |
|---|---|---|---|---|---|
| $(million) | |||||
| Real estate | 87.8 | 109.5 | 112.2 | 125.2 | 142.3 |
| Central Government securities | 31.4 | 35.7 | 36.4 | 33.3 | 40.8 |
| Local authority securities | 28.9 | 29.8 | 30.1 | 29.4 | 31.3 |
| Company shares and debentures | 160.3 | 176.0 | 205.6 | 234.0 | 272.9 |
| Mortgages, etc. | 70.6 | 73.4 | 76.1 | 83.8 | 87.1 |
| Outstanding premiums | 64.1 | 70.6 | 79.7 | 104.3 | 131.7 |
| Cash and other assets in New Zealand | 64.6 | 89.8 | 108.3 | 143.3 | 169.3 |
| Total, New Zealand assets | 507.7 | 585.0 | 648.4 | 753.4 | 875.5 |
REVENUE AND EXPENDITURE—A statement of the total revenue and expenditure, both gross and net, of all offices is now given in respect of New Zealand business. The gross figures include reinsurance business accepted, while the net figures comprise insurances with the public, plus reinsurances accepted, and less amounts reinsured with other offices.
It should be noted that at the closing date of the accounts it is customary to transfer to a reserve a proportion of the income received during the year. If the amount transferred to reserve in the latest year is greater than that transferred at the end of the previous year the net effect is equivalent to an increase in the latest year's expenditure and appears in the statement of net expenditure. Similarly, if the amount transferred in the latest year is less than in the previous year, the net effect appears in the statement of net revenue.
| Item | 1981–82 | 1982–83 | ||
|---|---|---|---|---|
| Gross | Net | Gross | Net | |
| Revenue | $(thousand) | |||
| Change in reserve provisions | 8 | 273 | ||
| Amount of fire premiums received during year | 317,597 | 228,623 | 343,935 | 249,153 |
| Interest and dividends | 24,098 | 28,541 | ||
| Rents | 3,106 | 2,656 | ||
| Other revenue | 5,470 | 3,636 | ||
| Total | 317,597 | 261,304 | 343,935 | 284,258 |
| Expenditure | ||||
| Change in reserve provisions | 49,589 | 36,706 | 28,122 | 21,654 |
| Amount of fire claims paid during year, including adjustment and other expenses of settlement, but less salvage | 160,168 | 118,556 | 169,204 | 130,287 |
| Fire Service Commission levies | 27,527 | 26,130 | 30,470 | 26,919 |
| Central Government taxes | 883 | 931 | 7,769 | 7,858 |
| Rents | 3,270 | 3,272 | 3,365 | 3,365 |
| Depreciation | 3,120 | 3,073 | 2,668 | 2,667 |
| Allowance and commissions on premiums to agents, subagents, and others | 34,005 | 17,097 | 33,403 | 16,730 |
| Salaries and wages, including commissions, on profits or bonuses | 40,041 | 39,472 | 37,633 | 37,654 |
| Other expenses of management | 23,970 | 24,392 | 22,815 | 24,267 |
| Total | 342,573 | 269,631 | 335,451 | 271,404 |
LIFE ASSURANCE—The New Zealand Government Life Insurance Office was founded in 1869 at a time when New Zealanders had comparatively poor facilities in regard to life assurance. The payment of all policies has always been guaranteed by the Government. A major change occurred in the management of the Government Life Insurance Office on 1 October 1983 when it became a corporation. The 1983 Government Life Insurance Corporation Bill provides for the appointment of a Minister in charge of the corporation, a board of 6 directors appointed by the Governor-General on the recommendation of the Minister for a term of 3 years, and a managing director who will also act as deputy chairman. One of the appointed directors will act as chairman.
From a total of 59 policies, assuring a sum of $60,005, issued during 1869–70, the business of the office has grown to a stage when, at the end of 1982, policies numbered 441 248 and the total sum assured reached $4,559 million.
Income and expenditure figures of the Government Life Insurance Office for the latest 5 years are shown in the following table.
| Year | Premium Income (Including Purchase of Annuities) | Total Income | Management Expenses and Commissions | Total Expenditure | Ratio of Management Expenses to Total Income | Ratio of Management Expenses to Premium Income |
|---|---|---|---|---|---|---|
| $(thousand) | percent | |||||
| 1978 | 52,124 | 90,071 | 10,870 | 49,704 | 12.07 | 20.85 |
| 1979 | 51,831 | 96,190 | 12,154 | 52,465 | 12.64 | 23.45 |
| 1980 | 56,463 | 112,309 | 13,922 | 59,522 | 12.40 | 24.65 |
| 1981 | 64,503 | 131,240 | 16,491 | 76,268 | 12.57 | 25.57 |
| 1982 | 66,307 | 140,346 | 18,751 | 79,338 | 13.36 | 28.28 |
During the year ended December 1982, 8184 policies became claims by death of the life assured or by maturity. The amount paid in respect of these claims was $28,073,000. A further sum of $1,218,000 was paid to annuitants, and $23,449,000 was paid to policyholders who cashed bonuses or surrendered policies.
Figures showing the progress of the office during the latest 5 years are contained in the next table. Annuities are included, but bonuses are excluded.
| Year | New Business | Policies Discontinued | Policies in Force at End of Year | ||||||
|---|---|---|---|---|---|---|---|---|---|
| Number of Policies | Sum Assured | Annual*Premiums | Number | Sum Assured | Annual Premiums | Number | Sum Assured | Annual Premiums | |
| * Excludes single premiums. | |||||||||
| $(m) | $(m) | $(m) | $(m) | $(m) | $(m) | ||||
| 1978 | 27,148 | 398.7 | 4.3 | 28,288 | 182.9 | 2.6 | 466,063 | 2,562.6 | 44.3x |
| 1979 | 30,934 | 500.1 | 5.0 | 29,783 | 201.0 | 2.6 | 467,214 | 2,861.7 | 46.7x |
| 1980 | 27,374 | 578.3 | 8.6 | 31,407 | 199.9 | 4.2 | 463,181 | 3,240.1 | 51.1x |
| 1981 | 26,734 | 750.0 | 10.0 | 36,177 | 279.8 | 5.8 | 453,738 | 3,710.3 | 55.3 |
| 1982 | 25,595 | 860.7 | 12.0 | 38,085 | 349.8 | 6.3 | 441,248 | 4,221.1 | 61.0 |
The following table shows the progress of business of the Government Life Insurance Office from the date of establishment until 31 December 1982.
| Policies* | Annuities | ||||
|---|---|---|---|---|---|
| Number | Sum Assured | Reversionary Bonuses | Annual Premiums | ||
| $(million) | $(000) | ||||
| Total issued | 1,195,974 | 6,678.6 | 531.6 | 110,838.4 | 32,884.4 |
| Total void | 754,726 | 2,457.5 | 194.0 | 49,803.6 | 24,799.0 |
| Total in force at 31 Dec 1982 | 441,248 | 4,221.1 | 337.6 | 61,034.9 | 8,085.5 |
The office's total assets at 31 December are shown by class of investment in the following table.
| Class of Investment | Amount | Percentage | ||||
|---|---|---|---|---|---|---|
| 1980 | 1981 | 1982 | 1980 | 1981 | 1982 | |
| * Mainly premiums and interest due and accrued interest. | ||||||
| $(million) | percent | |||||
| Mortgages on property | 177.9 | 182.0 | 192.6 | 29.57 | 27.68 | 27.03 |
| Loans on policies | 31.4 | 31.9 | 34.6 | 5.22 | 4.86 | 4.86 |
| Government securities | 112.8 | 129.4 | 131.0 | 18.75 | 19.68 | 18.38 |
| Local authority securities | 57.0 | 62.1 | 74.0 | 9.47 | 9.44 | 10.39 |
| Real estate | 109.3 | 136.5 | 145.3 | 18.16 | 20.76 | 20.39 |
| Company shares and debentures | 88.1 | 92.3 | 116.0 | 14.64 | 14.04 | 16.28 |
| Miscellaneous assets* | 25.2 | 23.3 | 19.0 | 4.19 | 3.54 | 2.67 |
| Total | 601.7 | 657.5 | 712.5 | 100.00 | 100.00 | 100.00 |
FIRE, ACCIDENT, AND OTHER INSURANCE—The State Insurance Office is empowered to carry on any class of insurance business other than life assurance. As the State Fire Office it commenced business in 1905. In 1925 accident business was transferred to it from the Government Life Insurance Office and since 1947 it has undertaken marine insurance.
Its growth in recent years is indicated in the following table.
| Year | Net Premiums | Claims | Working Expenses |
|---|---|---|---|
| * Includes taxation | |||
| $(thousand) | |||
| 1978 | 73,621 | 47,648 | 8,269 |
| 1979 | 80,319 | 49,426 | 16,703* |
| 1980 | 89,380 | 62,395 | 12,238 |
| 1981 | 113,081 | 79,317 | 15,229 |
| 1982 | 141,199 | 93,816 | 18,276 |
As was the case with private accident insurance companies, the main classes of accident insurance transacted by the State Insurance Office prior to 1974 were motor vehicle (comprehensive and third-party risk), employer's liability, personal accident, public risk, and plate glass. With the implementation of the Accident Compensation Act on 1 April 1974, all classes of business involving the insurance of liability for personal injury by accident ceased to be risks insured by the office. The major classes of business affected were employer's liability insurance and Transport Act insurance.
The total assets of the State Insurance Office at 31 December 1982 amounted to $191.6 million, which included $102.8 million in the form of investments ($8.2 million in Government securities, $13.0 million in local body securities), and $62.4 million in fixed assets, mainly land, buildings, and plant. Of the total liabilities, reserves amounted to $88.8 million, unexpired risks to $63.7 million, and unadjusted claims to $14.9 million.
EARTHQUAKE AND WAR DAMAGE INSURANCE—The Earthquake and War Damage Act 1944 is administered by a Commission, of which the Minister of Finance is chairman. All property insured against fire is deemed to be insured to the extent of the indemnity value against earthquake and war damage. Premiums at the rate of 5c for each $100 of insurance cover are collected by the insurance companies and paid into the Earthquake and War Damage Fund (less commission of 2 1/2 percent).
Advances may be made from the Consolidated Account if at any time the amount in the Earthquake and War Damage Fund is not sufficient to meet the claims thereon.
“Earthquake damage” is defined as damage occurring as the direct result of earthquake or of fire occasioned by or in consequence of earthquake. In 1950 an extension of the scheme was instituted to provide some measure of protection to the insured against storm and flood of an abnormal or widespread nature. In 1954 the definition of disaster damage was extended to include volcanic eruption, and authority was given to the commission to accept insurance against landslip. This latter type of cover does not apply automatically. Finance is provided by crediting 10 percent of the premiums compulsorily collected under the Act to a special Disaster Fund.
Since 1 June 1967 the commission has had power to underwrite the geothermal activity insurance on a voluntary basis.
The following is a comparative statement for the latest available 5 years of the financial operations under the Earthquake and War Damage Act.
| Item | 1978–79 | 1979–80 | 1980–81 | 1981–82 | 1982–83 |
|---|---|---|---|---|---|
* At end of each period. †Includes adjustment of the cost price of investments to nominal value. | |||||
| $(thousand) | |||||
| Income— | |||||
| Premiums— | |||||
| Earthquake and war damage | 26,786 | 30,566 | 34,523 | 44,512 | 51,348 |
| Disaster | 2,977 | 3,397 | 3,837 | 4,947 | 5,727 |
| Interest | 23,380† | 29,749 | 39,358 | 48,234 | 62,887 |
| Total | 53,143 | 63,712 | 77,718 | 97,693 | 119,962 |
| Expenditure— | |||||
| Increase in provision for unearned premium | – | 2,235 | 1,756 | 6,004 | 5,724 |
| Other adjustments on overseas investments | – | 1,098 | −908 | 1,720 | −6,273 |
| Claims— | |||||
| Earthquake and war damage | 21 | 123 | 559 | 54 | 145 |
| Disaster | 2,844 | 1,501 | 704 | 1,674 | 667 |
| Salaries and expenses of management | 111 | 125 | 170 | 227 | 235 |
| Discount to insurance offices | 746 | 850 | 958 | 1,222 | 1,486 |
| Total | 3,722 | 5,932 | 3,239 | 10,901 | 1,984 |
| Surplus | 49,421 | 57,780 | 74,480 | 86,793 | 117,978 |
| Earthquake and War Damage Fund* | 360,157 | 410,385 | 480,786 | 564,668 | 676,780 |
| Disaster Fund* | 6,109 | 6,800 | 10,272 | 13,661 | 19,528 |
For the year ended 31 March 1983 a total of 1829 claims were received, compared with 1387 for the previous year. The breakdown of claims was as follows: earthquake, 851; extraordinary disaster, 900; landslip, 78. Respective figures for the previous year were 415; 857; and 115.
Earthquake Claims—As a result of seismic activity during the year, 851 claims amounting to $145,087 were registered.
Disaster Claims—Claims totalled 900, with payments amounting to $508,670.
Landslip Claims—A total of 78 claims for this year resulted in payments of $158,528.
FURTHER INFORMATION—Further information on insurance statistics will be found in the following publications.
Insurance Statistics—Department of Statistics (annual).
Monthly Abstract of Statistics—Department of Statistics.
Annual Report of the Government Insurance Commissioner (Parl. paper B. 22).
Report of the State Insurance Office (Parl. paper B. 21).
Report of the Earthquake and War Damage Commission (Parl. paper B. 11).
LABOUR FORCE—Important factors affecting the size of the labour force in proportion to population include the age structure of the population, the usual age of completion of full-time education, the percentage of married women engaged in full-time paid employment, and net migration flow. To some extent, the fluctuations in the growth of the labour force follow those in the number of births some 15 to 20 years earlier.
The estimated annual growth of the labour force during the latest available years is shown in the following table based on Department of Labour estimates.
| As at April | Males | Females | Total | Labour Force as a Percentage of Total Population | |||
|---|---|---|---|---|---|---|---|
| Number | Annual Increase | Number | Annual Increase | Number | Annual Increase | ||
| * Labour force estimates now refer to February because of the change from a half-yearly to a quarterly employment survey. | |||||||
| (000) | percent | (000) | percent | (000) | percent | percent | |
| 1973 | 807.8 | 2.6 | 348.0 | 4.6 | 1 155.8 | 3.2 | 38.9x |
| 1974 | 830.6 | 2.8 | 373.7 | 7.4 | 1 204.3 | 4.2 | 39.6x |
| 1975 | 843.2 | 1.5 | 385.2 | 3.1 | 1 228.4 | 2.0 | 39.6x |
| 1976 | 844.1x | 0.1x | 393.8x | 2.2x | 1 237.9x | 0.8x | 39.4x |
| 1977 | 847.6x | 0.4x | 404.5x | 2.7x | 1 252.1x | 1.1x | 39.7x |
| 1978 | 856.6x | 1.1x | 409.6x | 1.3x | 1 266.2x | 1.1x | 40.1x |
| 1979 | 855.6x | 0.1x | 427.2x | 4.3x | 1 282.8x | 1.3x | 40.6x |
| 1980* | 864.2x | 1.0x | 439.1x | 2.8x | 1 303.3x | 1.6x | 41.2x |
| 1981* | 870.9x | 0.8x | 450.7x | 2.6x | 1 321.6x | 1.4x | 41.7x |
| 1982* | 879.6 | 1.0 | 460.5 | 2.2 | 1 340.1 | 1.4 | 42.0x |
The following table shows the full-time labour force by age group as recorded at the two most recent Censuses of Population and Dwellings. A new departure at the 1981 census was that overseas visitors who were in New Zealand on census night but who had not worked while in this country (and did not intend to) were asked to complete only the first 12 questions on the Personal Questionnaire. Consequently, statistics on the labour force, education, marital status, and a number of other subjects relate only to New Zealand residents. A limited selection of tables from the 1976 census (including the following) were processed on the same basis for purposes of comparison.
| Age Group (Years) | 1976 Census | 1981 Census* | ||||||
|---|---|---|---|---|---|---|---|---|
| Males | Females | Males | Females | |||||
| Number | Percent of Male Labour Force | Number | Percent of Female Labour Force | Number | Percent of Male Labour Force | Number | Percent of Female Labour Force | |
| * Final data on employment from the 1981 Census have been subject to a process of random rounding. All cell values including totals have been rounded using simple random rounding, to base three. Individual figures therefore, will not necessarily sum to give the stated totals. | ||||||||
| 15–19 | 85,786 | 10.0 | 74,700 | 18.5 | 88,791 | 10.1 | 74,139 | 16.3 |
| 20–24 | 118,484 | 13.8 | 74,070 | 18.4 | 125,079 | 14.3 | 84,228 | 18.5 |
| 25–29 | 121,098 | 14.2 | 43,957 | 10.9 | 114,540 | 13.1 | 50,715 | 11.1 |
| 30–34 | 98,193 | 11.5 | 34,743 | 8.6 | 115,950 | 13.2 | 47,358 | 10.4 |
| 35–39 | 87,540 | 10.2 | 38,619 | 9.6 | 93,645 | 10.7 | 46,974 | 10.3 |
| 40–44 | 75,851 | 8.9 | 36,028 | 8.9 | 83,016 | 9.5 | 46,077 | 10.1 |
| 45–49 | 81,321 | 9.5 | 36,384 | 9.0 | 72,726 | 8.3 | 38,325 | 8.4 |
| 50–54 | 74,056 | 8.7 | 31,198 | 7.7 | 75,351 | 8.6 | 33,243 | 7.3 |
| 55–59 | 59,489 | 6.9 | 20,196 | 5.0 | 65,034 | 7.4 | 23,148 | 5.1 |
| 60 and over | 53,901 | 6.3 | 13,488 | 3.3 | 42,471 | 4.8 | 11,529 | 2.5 |
| Total labour force | 855 719 | 100.0 | 403,383 | 100.0 | 876,606 | 100.0 | 455,736 | 100.0 |
| Percentage of labour force | 68.0 | 32.0 | 65.8 | 34.2 | … | |||
EMPLOYMENT STRUCTURE—The growth of population has been accompanied by a changing emphasis in employment. In the nineteenth century the major activities of farming, mining, and lumbering gave rise to manufacturing industries and to commercial and professional occupations. In 1881, 11.2 percent of the total population was engaged in agriculture, 13.1 percent in industries, which included mining, and 6.6 percent in commercial and professional occupations. By 1901 the proportion in tertiary activities and farming had increased, that in secondary industries had remained constant, and mining had declined relatively in importance. The proportions were then 14.5 percent in farming, 13.1 percent in secondary industry, and 11 percent in services.
The more recent rapid development of larger urban centres has been associated with a trend away from primary into secondary industries, a trend which developed noticeably after the depression of the 1930s and which was given marked impetus by the Second World War. The broad changes in the economy as indicated at recent censuses are shown in the following table. Decreases in the proportion engaged in primary production are typical of advanced economies, although it has to be noted that the farming community makes increasing use of the services sector in improving farm productivity.
| Production Group | 1971 Census | 1976 Census | 1981 Census | |||
|---|---|---|---|---|---|---|
| Persons Employed | Percentage of Labour Force | Persons Employed | Percentage of Labour Force | Persons Employed | Percentage of Labour Force | |
| Primary production | 134,159 | 12.1 | 133,959 | 10.8 | 148,914 | 11.6 |
| Secondary industry | 388,071 | 35.1 | 433,190 | 35.0 | 311,130 | 24.2 |
| Services | 582,797 | 52.7 | 670,450 | 54.2 | 826,341 | 64.2 |
| Activities not adquately defined | 13,808 | 34,734 | 45,963 | |||
| Total | 1 118 835 | 100.0 | 1 272 333 | 100.0 | 1 332 342 | 100.0 |
The following figures show the estimated size and distribution of the labour force in February 1982.
| Industrial Group | February 1982 | ||
|---|---|---|---|
| Males | Females | Total | |
| (thousand) | |||
| Primary— | |||
| Agriculture, hunting, and fishing | 103.4 | 32.2 | 135.6 |
| Forestry and logging | 1.4 | 0.1 | 1.5 |
| Mining and quarrying | 9.6 | 0.5 | 10.1 |
| Total, primary | 117.4 | 33.1 | 150.5 |
| Manufacturing— | |||
| Food, beverages, and tobacco, including seasonal | 59.3 | 15.5 | 74.8 |
| Textiles, clothing, and leather | 16.1 | 29.8 | 45.9 |
| Wood and wood products | 20.6 | 3.1 | 23.7 |
| Paper and paper products, printing and publishing | 24.4 | 9.7 | 34.1 |
| Chemicals, petroleum, rubber, and plastics | 19.0 | 7.9 | 26.9 |
| Non-metallic mineral products | 9.6 | 2.0 | 11.6 |
| Metal products and engineering | 27.2 | 4.7 | 31.9 |
| Machinery, excluding electrical | 16.3 | 2.6 | 18.9 |
| Electrical equipment | 10.6 | 5.9 | 16.5 |
| Transport equipment | 19.2 | 2.8 | 22.0 |
| Other manufacturing | 3.8 | 2.6 | 6.4 |
| Total, manufacturing | 226.1 | 86.6 | 312.7 |
| Electricity, gas, and water | 14.0 | 1.3 | 15.3 |
| Construction | 81.2 | 4.6 | 85.8 |
| Wholesale and retail trade, etc.— | |||
| Wholesale trade | 48.5 | 18.1 | 66.6 |
| Retail trade | 58.6 | 55.5 | 114.1 |
| Restaurants, hotels, etc. | 14.4 | 21.9 | 36.3 |
| Total, wholesale, retail, etc. | 121.5 | 95.5 | 217.0 |
| Transport and communication— | |||
| Transport and storage | 60.4 | 10.9 | 71.3 |
| Communications | 20.0 | 15.1 | 35.1 |
| Total, transport, etc. | 80.4 | 26.0 | 106.4 |
| Finance, insurance, etc.— | |||
| Finance | 13.4 | 16.8 | 30.2 |
| Insurance | 8.3 | 5.7 | 14.0 |
| Real estate and business services | 29.0 | 21.6 | 50.6 |
| Total, finance, etc. | 50.7 | 44.1 | 94.8 |
| Community and personal services— | |||
| Public administration, etc. | 46.4 | 21.9 | 68.3 |
| Sanitary services, etc. | 4.3 | 3.8 | 8.1 |
| Education services | 29.8 | 37.7 | 67.5 |
| Research and scientific institutes | 6.5 | 2.3 | 8.8 |
| Health services | 18.5 | 52.4 | 70.9 |
| Other community services | 8.5 | 10.7 | 19.2 |
| Recreational services | 12.9 | 7.2 | 20.1 |
| Personal and household services | 24.8 | 11.0 | 35.8 |
| Total, community and personal services | 151.7 | 147.0 | 298.7 |
| Total in industry | 843.4 | 438.5 | 1 281.9 |
| Armed forces | 10.2 | 1.1 | 11.3 |
| Registered unemployed | 26.0 | 20.9 | 46.9 |
| Estimated total labour force | 879.6 | 460.5 | 1 340.1 |
| Source: Department of Labour. | |||
LABOUR FORCE PROJECTIONS—The alternative usually-resident New Zealand full-time labour force projections for the period 1984–2016 are shown in the following table. These figures are complementary to the 31 March 1982 base population projections, included in Section 3 of this Yearbook. The same fertility, mortality and net migration assumptions apply.
The definition of “usually-resident full-time labour force” used in deriving these projections includes all persons 15 years and over who are normally resident in New Zealand, and work at least 20 hours per week, plus those who are unemployed but seeking work. Consequently, these labour force projections should be regarded as indicating the future potential supply of labour in terms of the stated assumptions.
The “changing” labour force participation assumption employed in these projections implies an increasing participation by women in most economically active age groups and a declining level of male participation in all age groups, until 1991. The assumptions continue trends in full-time labour force participation rates which have been evident during the period 1966–81.
Projections have also been derived for the usually resident part-time labour force, which comprises those who are normally employed for less than 20 hours per week.
| At 31 March | Projected New Zealand Usually Resident Full-Time Labour Force*Assuming† | |||||
|---|---|---|---|---|---|---|
| Long-term Net Annual Migration of Zero and Short-term Migration Variant Designated: | Long-term Net Annual Migration of 5 000 and Short-term Migration Variant Designated: | |||||
| Low | Medium | High | Low | Medium | High | |
* These projections have as base the estimated usually-resident, full-time labour force at 31 March 1982. The mortality, fertility and net migration assumptions on which the projections are based are the same as those for the population projections appearing in Section 3 of this Yearbook. †The projections incorporate “changing” age-sex specific labour force participation rates which assume a continuation of 1966–81 trends until 1991, after which time participation rates are assumed to remain constant. | ||||||
| 1982 | 1,352 | 1,352 | 1,352 | 1,352 | 1,352 | 1,352 |
| 1984 | 1,412 | 1,414 | 1,416 | 1,412 | 1,414 | 1,416 |
| 1985 | 1,440 | 1,445 | 1,449 | 1,440 | 1,445 | 1,449 |
| 1986 | 1,467 | 1,475 | 1,481 | 1,467 | 1,475 | 1,481 |
| 1991 | 1,588 | 1,598 | 1,610 | 1,599 | 1,607 | 1,617 |
| 1996 | 1,659 | 1,670 | 1,684 | 1,682 | 1,692 | 1,703 |
| 2001 | 1,705 | 1,718 | 1,734 | 1,744 | 1,754 | 1,767 |
| 2006 | 1,738 | 1,752 | 1,768 | 1,793 | 1,804 | 1,817 |
| 2011 | 1,749 | 1,763 | 1,780 | 1,821 | 1,832 | 1,846 |
| 2016 | 1,736 | 1,749 | 1,767 | 1,825 | 1,836 | 1,849 |
UNEMPLOYMENT—Except for occasional returns relating to State unemployment relief which were presented to Parliament from time to time, almost no direct statistical evidence as to the extent of unemployment in New Zealand prior to 1892 is available. Such information is, however, available from the Census of Population and Dwellings since 1896, and from the records of the Department of Labour since 1892. In addition, statistics of unemployment among trade unionists were collected from trade union secretaries by the Department of Statistics from 1925 to 1930. A table showing figures of unemployment from June 1931 to March 1939 will be found on page 854 of the 1940 Yearbook. Monthly average figures of registered unemployed from 1949 are given in the Statistical Summary near the back of this Yearbook.
Census Data on Unemployment—The great disadvantage of the Population Census as an indicator of the trend of unemployment is that it provides data at quinquennial intervals only. Unemployment figures from the 1971 census were 8757 males and 7411 females. Figures from the 1981 census give a total of 34 482 males and 25 776 females. Of these, 10 242 males and 12 228 females were in the 15–19 years age group.
The following table gives census data on unemployment among wage earners (New Zealand residents aged 15 years and over, working full-time in the labour force) during this century. Prior to 1951 Maoris were not included.
| Census Date | Unemployed and Seeking Work | Total Wage or Salary Earners | ||
|---|---|---|---|---|
| Males | Females | Males | Females | |
* Figures do not include Maori wage earners and unemployed. †Including men demobilised from Armed Forces not yet in employment. ‡Includes Armed Forces. | ||||
| 1906* | 8,189 | 1,372 | 203,987 | 55,491 |
| 1916* | 5,920 | 1,156 | 220,783 | 74,302 |
| 1926* | 10,694 | 2,434 | 305,120 | 96,425 |
| 1936* | 35,774 | 1,862 | 336,853 | 120,610 |
| 1945 | 5 823† | 1,090 | 359 931‡ | 148,936 |
| 1956 | 5,558 | 2,378 | 476,637 | 176,721 |
| 1966 | 5,125 | 3,982 | 610,732 | 260,081 |
| 1971 | 8,757 | 7,411 | 651,499 | 307,064 |
| 1976 | 14,392 | 11,945 | 699,327 | 363,844 |
| 1981 | 34,482 | 25,776 | 696,891 | 392,235 |
The 1936 figure includes men on rationed relief work, but excludes men (16 222) partly unemployed but not on relief work. The 1945 figure includes ex-servicemen recently returned from overseas who had not then resumed work.
The total of those who recorded themselves at the 1981 census as unemployed and seeking work was 60 255. These are shown by sex and age group in the following table. The 1976 census totals, shown for purposes of comparison, include females but (like the 1981 figures) exclude visitors to New Zealand.
A significant feature of the total of unemployed at the 1981 census is the high percentage of young people. Over 60 percent were below 25 years of age. Nearly half (47.5 percent) of the female unemployed were young women aged 15 to 19 years.
| Age Group (Years) | 1976 Census | 1981 Census | ||||||
|---|---|---|---|---|---|---|---|---|
| Total | Males | Females | Total | |||||
| No. | Percent | No. | Percent | No. | Percent | No. | Percent | |
| * New Zealand residents aged 15 years and over, involved full-time in the labour force. | ||||||||
| 15–19 | 10,148 | 39.7 | 10,242 | 29.7 | 12,234 | 47.5 | 22,473 | 37.3 |
| 20–24 | 5,801 | 22.7 | 7,935 | 23.0 | 5,751 | 22.3 | 13,683 | 22.7 |
| 25–34 | 4,433 | 17.4 | 7,770 | 22.5 | 3,702 | 14.4 | 11,475 | 19.0 |
| 35–44 | 2081 | 8.2 | 3,516 | 10.2 | 1,941 | 7.5 | 5,457 | 9.1 |
| 45 and over | 3,067 | 12.0 | 5,019 | 14.6 | 2,148 | 8.3 | 7,167 | 11.9 |
| Total* | 25 530 | 100.0 | 34 482 | 100.0 | 25 776 | 100.0 | 60 255 | 100.0 |
Unemployment Benefit—Unemployment benefits under the Social Security Act have been payable since 1 April 1939. The number in force at 31 March of each of the latest 6 years is shown in the following table.
| As at 31 March | Unemployment Benefit | As at 31 March | Unemployment Benefit |
|---|---|---|---|
| 1978 | 17 497x | 1981 | 35,666 |
| 1979 | 17,894 | 1982 | 32 590x |
| 1980 | 20,850 | 1983 | 50,744 |
Subject to the conditions set out in Section 6A, the unemployment benefit may be claimed as of right. Registration at a district office of the Department of Labour is a compulsory prerequisite to eligibility for the benefit. Hence it is considered that the great majority of workers becoming involuntarily unemployed would register for employment in order to validate a claim for the benefit.
Close liaison is maintained between the Department of Social Welfare and the Department of Labour to prevent the payment of benefits where work is available. In addition to the requirement that a benefit applicant must register for work at an employment office, all unemployment beneficiaries must report regularly at the employment office.
VACANCIES, PLACEMENTS, AND UNEMPLOYED PERSONS—In addition to the annual employment survey in February and quarterly (sample) employment surveys in May, August, and November, the Department of Labour maintains a monthly record of registered unemployment, vacancies, placements, and job creation programmes. Data on unemployment given earlier in this section were derived from this record as are the following tables.
The following table contains a summary of the numbers of notified vacancies, placements, and registered unemployed persons as recorded by the Department of Labour.
| Year | Notified Vacancies at End of Month | Placements During Month | Registered Unemployed Persons at End of Month | ||||
|---|---|---|---|---|---|---|---|
| Males | Females | Total | Males | Females | Total | ||
| Monthly Average for December Years | |||||||
| 1979 | 1,687 | 3,953 | 1,930 | 5,883 | 15,559 | 9,680 | 25,239 |
| 1980 | 1,476 | 3,366 | 1,708 | 5,074 | 22,904 | 13,596 | 36,499 |
| 1981 | 3,752 | 4,983 | 2,614 | 7,597 | 29,188 | 19,125 | 48,313 |
| 1982 | 3 681x | 5,216 | 2,784 | 8,000 | 31 134x | 20 965x | 52 099x |
| 1983 | 2,778 | 5,821 | 3,310 | 9,131 | 48,304 | 28,171 | 76,475 |
A breakdown of the monthly average numbers of registered unemployed persons is shown by occupation groups in the following table. Because of a change in the occupational classification of unemployed persons from March 1981 the monthly averages for 1981 apply to 10 months instead of the 12 months of the normal December year. Also, because of rounding, figures for individual occupations may not add exactly to the given total.
| Occupations Sought by Registered Unemployed* | 1983 | |
|---|---|---|
| Males | Females | |
| * The occupational classification of unemployed according to usual occupations ceased from March 1981. From that month classification has been according to the occupation sought by the person registered as unemployed, using a new occupation classification, the employment and vocational guidance service classification of occupations (ESCO). | ||
| Primary industries (rural, mining, etc.) | 5,560 | 2,129 |
| Professional and technical | 1,801 | 1,589 |
| Administrative and managerial | 416 | 173 |
| Clerical and sales | 4,364 | 10,458 |
| Personal and other service workers | 1,852 | 5,007 |
| Building and construction workers | 3,554 | 127 |
| Production and related workers— | ||
| Metal and electrical | 4,686 | 834 |
| Other industries | 18,800 | 5,927 |
| Transport and materials handling | 5,710 | 760 |
| Other occupations n.e.c. | 940 | 651 |
| Total | 47 683 | 27 652 |
The following table shows numbers of registered unemployed and also those employed on special work or under one of the private sector job-creation programmes set up by the Government in an attempt to alleviate unemployment.
| Period | Registered Unemployed* | Project Employment Programme | Private Sector Job Creation Programmes | |||
|---|---|---|---|---|---|---|
| Males | Females | Total | With Government Departments | Subsidised Work With Local Authorities† | ||
* Includes vacation workers. †And community organisations. | ||||||
| Monthly Average for December Year | ||||||
| 1979 | 15,559 | 9,680 | 25,239 | 9,994 | 7,137 | 7,306 |
| 1980 | 22,904 | 13,596 | 36,499 | 7,554 | 7,089 | 4,266 |
| 1981 | 29,188 | 19,125 | 48,313 | 5,193 | 9,004 | 8,891 |
| 1982 | 31 134x | 20 965x | 52 099x | 4,598 | 12,548 | 14 296x |
| 1983 | 48,304 | 28,171 | 76,475 | 4,684 | 16,895 | 17,126 |
| At End of Month | ||||||
| 1983—Jan | 44,342 | 29,711 | 74,053 | 3,930 | 13,711 | 16,115 |
| Feb | 46,040 | 30,331 | 76,371 | 4,156 | 13487 | 15,588 |
| Mar | 44,505 | 28,265 | 72,770 | 4,374 | 13,639 | 14,600 |
| Apr | 45,492 | 28,378 | 73,870 | 4,601 | 14,085 | 14,821 |
| May | 46,838 | 28,092 | 74,930 | 4,648 | 14,813 | 15,128 |
| Jun | 48,920 | 27,948 | 76,868 | 4,986 | 15,643 | 15,227 |
| Jul | 52,076 | 27,261 | 79,337 | 5,112 | 16,539 | 14,735 |
| Aug | 51,769 | 26,574 | 78,343 | 4,954 | 17,155 | 15,151 |
| Sep | 51,011 | 25,952 | 76,963 | 4,877 | 18,280 | 15,720 |
| Oct | 49,360 | 25,296 | 74,656 | 4,853 | 19,005 | 16,408 |
| Nov | 49,971 | 28,504 | 78,475 | 4,789 | 19,658 | 19,242 |
| Dec | 49,320 | 31,742 | 81,062 | 4,500 | 20,019 | 22,959 |
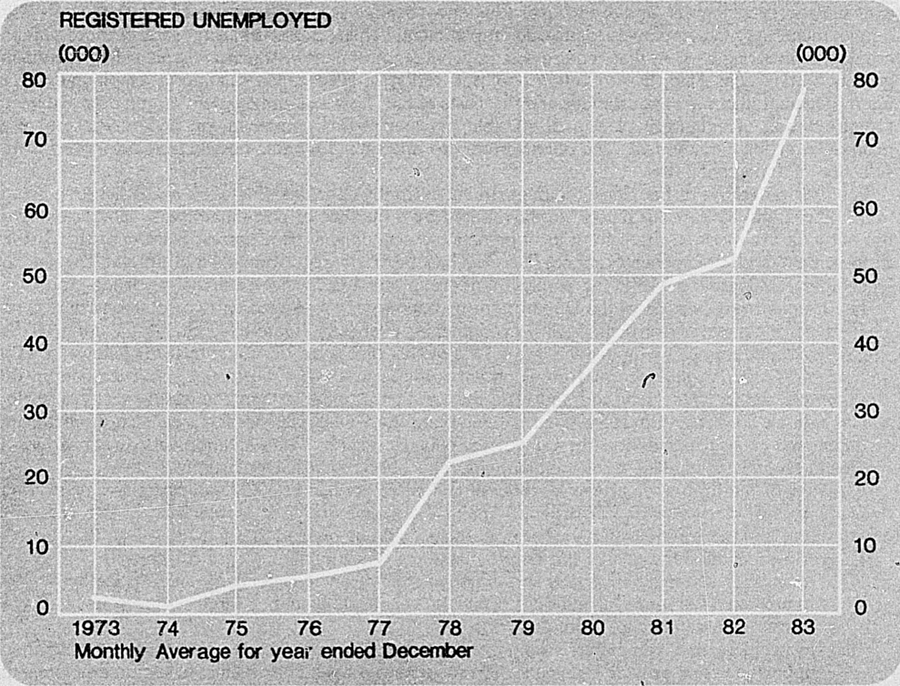
The relatively large numbers of young people included among the registered unemployed is a matter of concern, and various programmes and measures described in the following subsection have been instituted to assist young people to obtain employment, to provide vocational guidance, and to increase their skills.
The following table shows unemployed persons by sex and age group as at the end of each quarter of 1983.
| Quarter | School Leavers* | Age Group (In Years) | Total | ||||
|---|---|---|---|---|---|---|---|
| 15–19 | 20–24 | 25–29 | 30–39 | 40 and Over | |||
| * School leavers, shown separately, are not included under age groups. | |||||||
| Males | |||||||
| Mar | 3,061 | 9,793 | 12,133 | 7,039 | 6,408 | 6,071 | 44,505 |
| Jun | 2,746 | 10,235 | 13,268 | 8,209 | 7,567 | 6,895 | 48,920 |
| Sep | 2,280 | 9,892 | 13,617 | 8,746 | 8,635 | 7,841 | 51,011 |
| Dec | 3,462 | 9,726 | 11,928 | 7,583 | 7,067 | 6,530 | 46,296 |
| Females | |||||||
| Mar | 4,275 | 9,369 | 7,161 | 2,717 | 2,329 | 2,414 | 28,265 |
| Jun | 3,813 | 9,403 | 7,262 | 2,718 | 2,316 | 2,436 | 27,948 |
| Sep | 3,139 | 8,359 | 6,945 | 2,582 | 2,430 | 2,497 | 25,952 |
| Dec | 4,694 | 9,273 | 6,948 | 2,629 | 2,363 | 2,538 | 28,445 |
PROMOTION OF EMPLOYMENT—The functions and duties of the Department of Labour are set out in the Labour Department Act 1954. On the employment side the duties include the provision of a no-charge Employment and Vocational Guidance Service for the purpose of placing workers in employment, assisting employers to provide employment, helping persons to find better or more suitable employment, aiding persons who require occupational readjustment or training and providing vocational guidance and counselling; the collection and publication of information relating to employment and unemployment; the making of surveys and forecasts of the classes of employment required or available; the promotion of voluntary placing of suitable persons in such employment; and, in general, the promotion of full employment. The department also operates 3 worker hostels, and arranges for the selection of immigrants.
In order to execute its functions, the department currently operates a network of 23 district employment offices and 31 satellite offices, supplemented by a number of part-time offices. Modifications to the network are made in the light of local or national economic circumstances. Staffing of the District Employment and Vocational Guidance Service has been steadily strengthened and at the end of December 1983 totalled 648 in the employment group and 135 in the vocational guidance group.
The Employment Service of the Department of Labour was reviewed on two occasions during the 1970s following a major restructuring and strengthening exercise put into effect during the early 1970s. The restructured service was extended into all the district offices by 1976 and this was followed by the merger of vocational guidance and employment services in 1978. Substantial improvements in the employment service were achieved and resident vocational guidance and counselling services will be available in all 23 districts in 1984. This will complete the 5-year plan for the extension of vocational guidance and counselling services throughout the country, together with an improved careers advisory service in secondary schools, in consultation with school-based guidance personnel.
A review of the Employment and Vocational Guidance Service in 1980 examined and revised the overriding goals of the service in order to make them more realistic in the light of the economic environment and more practicable so that operations could be geared to achieving the goals.
The review identified the goal of the Employment and Vocational Guidance Services as—
to help job seekers obtain jobs and employers fill vacancies effectively and efficiently;
to provide a full remedial and developmental vocational guidance service to persons of all ages who are making occupational decisions; and
to promote and administer a range of measures designed to create additional employment opportunities or provide training for job seekers who have been unable to secure employment.
The Employment and Vocational Guidance Service consists of the Employment Services Division and the Vocational Guidance Division. The priorities of the Employment Services Division are to meet employer needs by filling vacancies and seeking out more vacancies, to maintain a current register of job seekers and to meet the identified need of job seekers. The Vocational Guidance Division of the Employment and Vocational Guidance Service provides counselling and career information to people of all ages and backgrounds. The division liaises with Employment Services Division staff in assisting clients, and also provides community-based services to clients not requiring assistance from the Employment Services Division. The Department of Labour offers a 3-tier service to job seekers to help meet the needs of the labour market. The “Job Self Service” system ensures a more rapid and simplified method of filling employers' vacancies with people who are appropriate and interested in the employment offered, by attracting a wider spectrum of job seekers to peruse the vacancy display boards. Associated with “Job Self Service” are career reference areas provided by Vocational Guidance, where written and audio visual careers information is available in a library-like atmosphere and where members of the public may do their own research and investigation into careers that interest them.
For those job seekers who require more advice and help, the Employment and Vocational Guidance Service offers a placement service based on the establishment of personal contacts and knowledge of the job seekers and a continued liaison with employers and other organisations. The Employment and Vocational Guidance Service's knowledge of the local labour market and the job seeker's needs ensures a greater willingness of employers to notify a wide range of vacancies, more effective interviewing of clients and their subsequent placement in employment.
During 1984 and 1985 2 newly-developed computer systems, Job Vacancy Bank (JVB) and Job Seeker Register (JSR), will be gradually introduced into all employment centres in order to provide a faster and more efficient service to job seekers and employers.
JVB, adapted from the Australian Job Bank system, is used to store, update, retrieve, and circulate vacancies. It offers employment officers quick and selective access to a wider range of vacancy information so that they can screen and match job seekers more effectively.
JSR, which has been written specifically for New Zealand conditions, will provide an accurate and up-to-date register of job seekers throughout the country. Among other things, the system will perform a broad matching function, producing a short list of job seekers who meet basic quantifiable criteria for particular vacancies which can be used by employment officers for detailed matching. In addition JSR will compile a wide range of statistical and management reports to assist with planning and forecasting activities.
There are other job seekers who are less advantageously placed to compete in the labour market who can be helped by counselling information and/or referral to training programmes. The expertise of employment officers and vocational guidance counsellors with particular skills, training and knowledge is brought together in order to help the disadvantaged overcome whatever bars exist to their obtaining and retaining employment. Wherever appropriate, there is extensive collaboration with the wide range of community organisations concerned with their problems.
EMPLOYMENT AND VOCATIONAL GUIDANCE SERVICE PROGRAMMES—The Employment and Vocational Guidance Service operates a number of programmes designed to create additional employment, training and apprenticeship opportunities, and to help disadvantaged workers obtain suitable employment. In the private sector the Private Sector Employment Incentive Scheme provides formerly unemployed persons with full-time subsidised employment where an additional job is created. Students may be placed in subsidised employment under this programme during the summer vacation. The Additional Apprentice Incentive Scheme and the Apprentice Instructor Wage Subsidy are intended to stimulate apprenticeship opportunities. The Young Persons' Training Programme provides basic institute and work-based training in occupational skills (institute based training is jointly funded with the Department of Education); the Adult Retraining Programme provides institute and work-based retraining or skills improvement programmes for workers involuntarily displaced from their employment. The School-leavers' Training and Employment Preparation Scheme (STEPS) offers general pre-employment skills to 15 and 16 year old school leavers who have left school and are unemployed.
Disabled job seekers who require training over an extended period before they become fully competitive with other workers may be assisted by a subsidy paid to the employer by the Department of Labour. This reduces as achievement increases, but enables the worker to maintain a normal standard of living. Modification grants may also be paid to employers to adjust equipment or access within the workplace to enable them to employ specific disabled job seekers.
In the public sector the Work Skills Development Programme aims to develop work habits and basic work skills. The Work Rehabilitation Programme provides employment for those who have limited prospects of unsubsidised employment and require extended rehabilitation; the Project Employment Programme is aimed at providing short-term employment for persons who are long duration unemployed or are at risk of becoming long duration unemployed, pending placement in regular employment; and the Winter Employment Programme provides for seasonal workers who are unable to find unsubsidised work in their off-season. The Project Employment Programme (Student Modification) provides subsidised employment for students during the summer vacation. The two remaining job creation programmes relate to projects in voluntary welfare agencies and to community-based activities, the latter being financed by grants from the Community Employment Initiatives Fund. Each of the public sector schemes is designed to provide short-term employment for job seekers who cannot be placed in unsubsidised employment or subsidised private sector employment, and is targeted to meet the needs of particular groups of job seekers.
As an aid to employment, the department operates three hostels and assists with accommodation for all classes of workers, workers-in-training, and job seekers, especially for young people away from home for the first time.
Finance allocated during the 1983–84 financial year for job creation and training programmes included $28,400,000 for private sector job creation, $228,199,000 for public sector job creation, $4,429,000 for the Young Persons' Training Programme, and $5,383,000 for the School-leavers' Training and Employment Preparation Scheme.
The following table gives numbers of people on job creation programmes at the end of January 1984.
| Job Creation Programme | Number |
|---|---|
| * Replaced by the Private Sector Employment Incentive Scheme in July 1983. | |
| Private Sector Job Creation— | |
| Additional Jobs Programme* | 8,545 |
| Farm Employment Scheme* | 488 |
| Private Sector Employment Incentive Scheme | 15,560 |
| Public Sector Job Creation— | |
| Project Employment Programme | 13,503 |
| Work Skill Development Programme | 6,881 |
| Winter Employment Programme | – |
| Project Employment Programme (Student Modification) | 1,726 |
| Work Rehabilitation Programme | 199 |
| Voluntary Organisation Training Programme | 1,019 |
| Temporary Wage Worker Ceiling | 205 |
Group Employment Liaison Scheme—The Group Employment Liaison Scheme (GELS) aims to help groups of unemployed people make better use of the different Government employment and training programmes. It is designed to be of particular help to those who respond better to group work or training situations.
A network of 15 field workers has been established with a small unit at the Department of Labour's Head Office. The field worker positions are located in Northland, Greater Auckland, Hamilton, Rotorua/Tauranga, Hawke's Bay, Wellington, Canterbury and Dunedin.
District Employment and Training Advisory Committees—The involvement of community interests in the development and implementation of labour market policies and programmes has been given new impetus by the progressive establishment of a network of district employment and training advisory committees.
Full committees are now operating for the Auckland region, Nelson and Christchurch, while progress towards the establishment of committees is well advanced in Hamilton, Tauranga, New Plymouth, Gisborne, Masterton, Blenheim, Timaru and Dunedin. It is intended to establish committees to cover the other districts during 1984–85.
The terms of reference and scope of responsibilities of these committees encompass all aspects of the labour market including transition from school to working life, training for employment, and job creation.
Membership of the committees comprises representation of employer, union, education, and local body sectors, the Department of Labour and up to 5 other members to reflect the particular nature of the district and its concerns.
Their role is to act as a focal point for concerns and representations on labour market issues, and to advise the Government and Department of Labour accordingly.
Small Co-operative Enterprises Scheme—The Department of Internal Affairs funds and operates the Small Co-operative Enterprises Scheme (SCOPE). SCOPE provides advisory services and financial assistance for people who are unemployed and wish to set up small-scale co-operative business ventures. Finance is available in the form of grants and loans for feasibility studies, working capital, equipment, and specialist skills. Advisory Officers are located at the Department of Internal Affairs' 5 district offices and at the Head Office (Private Bag) Wellington.
The Work Development Scheme—The Department of Internal Affairs also takes an active role in other ways. This policy provides advice, support and finance to community-based projects which are working to improve the skills and employment opportunities of young people, who for a variety of reasons have difficulty finding work and who need long-term personal help.
Finance is available for the salaries of 25 co-ordinators of projects throughout the country and for some operating costs. Eligible projects must be committed to increasing the resourcefulness of the young people and to encouraging them to join in decision making. Salary grants are provided for up to three years subject to an annual evaluation of the project's operation.
VOCATIONAL TRAINING—Meeting the employment needs of industry and commerce in order to improve productivity growth rates, and enhancing an individual's chances of contributing to his/her development and to the economy are vital functions of vocational training. The development and organisation of training within New Zealand on a national basis is the responsibility of the Vocational Training Council (VTC).
The council has the following membership, appointed jointly by the Ministers of Education and Labour: a chairman; 2 members nominated by the New Zealand Employers' Federation; 2 members nominated by the New Zealand Federation of Labour; 1 member nominated by the New Zealand Manufacturers' Federation; 1 member nominated by the Technical Institutes Association; 1 member nominated by the Authority for Advanced Vocational Awards and the New Zealand Trades Certification Board; 1 member appointed after consultation with representative groups or bodies in primary industry; and not more than 4 other members (3 appointments have so far been made under this provision).
The council has 5 additional members: the Secretary of Labour or nominee; the Director- General of Education or nominee; the Chairman of the State Services Co-ordinating Committee or nominee; the Chairman of the Combined State Unions or nominee; and the Chairman of the University Grants Committee or nominee.
Under the Vocational Training Council Act 1982 the council's functions are prescribed as advisory to Government, State departments, industry, commerce, agriculture, social welfare, and other interested organisations.
The objectives of the Vocational Training Council within the constraints of the Act are to:
co-ordinate the activities of industry training boards and provide such boards with overall guidance to assist them with the effective discharge of their functions;
identify, in association with any appropriate organisation or agency, the requirements for key skills in the workforce in New Zealand;
undertake or arrange for the undertaking of research into aspects of vocational training;
collect and disseminate information on vocational training and developments in vocational training both in New Zealand and overseas;
make such recommendations to the Government as the council considers necessary on any vocational training activity that is financed directly or indirectly by public funds;
evaluate its own effectiveness, that of industry training boards and advisory committees.
Recommendations may relate to improved training, the development of new or established facilities, the co-ordination of training schemes, levies or other methods for the financing or encouragement of training, the award of scholarships, the fostering of research, the carrying out of inquiries and investigations in any field of training, and maintenance of an adequate information service.
However, the activities of the council considerably exceed that of an advisory or recommendatory role. The council has been, and still is, deeply involved in the promotion of fully-integrated training in the majority of industries and local authorities.
The Vocational Training Council encourages a systematic approach to training at all levels in all sectors of the economy, linked to proper personnel development. Representative voluntary industrial and commercial training boards have been established for 29 industries. Boards include members from employer, employee, educational and other specialist groups. A major incentive has been an annual Government grant to encourage the appointment of executive training officers to work for industry training boards. There are now 61 equivalent positions established. Industry training boards examine existing training and assess the need for revised or new schemes. This involves both the identification of the level of skills of the person required (machine operator, graduate, tradesman, supervisor, etc.) and the numbers required at each level.
Further, the council has concerned itself with 'back-up' research and investigational studies and with promoting training programmes for particular groups within the community. This is done through a series of advisory committees. Specialists in areas such as women and employment, apprenticeship and trade training, management and supervisory training, Polynesians in the work force and training in the field of micro electronics, meet to organise projects in these areas and to make recommendations to the council.
Apprenticeships—New legislation governing apprenticeships in the form of the Apprenticeship Act 1983, came into effect on 1 November 1983. This Act differs from the former legislation in 2 major respects. Questions of who apprentices are and how one gets to be an apprentice are tightened up, and a greater degree of flexibility now applies to the type of apprenticeship which can be arranged and the administration of apprenticeship contracts generally. Much greater emphasis is now placed on the promotion of apprenticeship training and the creation of employment opportunities for apprentices.
Many of the cornerstones of the apprenticeship system remain unchanged. Orders governing apprenticeships are made by the Arbitration Court, which consists of a judge, a workers' member and an employers' member. Orders are made on the recommendation of New Zealand Apprenticeship Committees, most of which consist of 4 representatives of employers, 4 representatives of workers, a person conversant with technical education and the Commissioner of Apprenticeship (or the Commissioners' deputy) who chairs each committee ex-officio. The New Zealand committees are in effect policy-making committees. There are 36 committees, which normally meet once or twice a year. Committees covering larger industries, such as engineering, carpentry, motor, and printing meet more often.
Day-to-day administration of the Apprenticeship Act and the apprenticeship orders is carried out by District Commissioners of Apprenticeship in conjunction with local apprenticeship committees. Formerly these committees consisted of 3 employers' representatives, 3 workers' representatives, a person conversant with technical education and the District Commissioner who chaired all committees for the district. Under the new legislation, committees are seen in a more active promotional field role and membership is generally fixed at 1 employer representative, 1 worker representative and the District Commissioner of Apprenticeship although there is provision for larger committees in certain circumstances.
In the majority of industries there are provisions in apprenticeship orders for the attendance of apprentices at technical classes, both during working hours and in the evening. In most industries technical training is concentrated into an annual course of 3 or 4 weeks' duration. In some cases courses are longer with the advent of extended institute training, as in the carpentry and joinery, engineering, and aircraft engineering industries.
The general policy regarding apprentice education is determined by the New Zealand Apprenticeship Committees in cooperation with the Department of Education. That department itself operates a Technical Correspondence Institute, which provides courses of instruction for those apprentices who live too far from any school to allow them to attend evening classes.
A statutory body, the New Zealand Trades Certification Board, conducts examinations for apprentices (see Section 7A, Education). The examinations are voluntary and, except in the electrical, radio, plumbing, and gasfitting trades (where registration is required), no examination test is required for the practice of a trade. A number of trades have internal assessment conducted by technical institutes in place of the first and second qualifying examinations. There is very close liaison between New Zealand Apprenticeship Committees and the board, the Commissioner of Apprenticeship being a member of the board.
The number of apprenticeship contracts registered and the number completed during the 2 latest March years, and in force at the end of each year, are indicated in the following table.
| Industry | Contracts Entered into During the Year Ended 31 March 1983 | Contracts Completed During the Year Ended 31 March 1983 | Contracts in Force at 31 March 1983 |
|---|---|---|---|
| Aircraft | 7 | 130 | 310 |
| Baking | 93 | 93 | 281 |
| Boilermaking | 81 | 33 | 243 |
| Bricklaying | 56 | 27 | 146 |
| Carpentry | 883 | 708 | 3,178 |
| Clothing | 30 | 46 | 77 |
| Coachbuilding | 449 | 410 | 1,634 |
| Electrical | 584 | 531 | 2,111 |
| Engineering | 1,003 | 864 | 3,694 |
| Footwear repair and making | 4 | 6 | 11 |
| Footwear manufacturing | 47 | 56 | 133 |
| Furniture | 258 | 216 | 949 |
| Glazing | 58 | 46 | 147 |
| Golf courses greenkeeping | 28 | 24 | 73 |
| Hairdressing—ladies | 619 | 476 | 1,693 |
| Hairdressing—mens | 13 | 6 | 47 |
| Heating and ventilation | 19 | 29 | 85 |
| Horticulture | 91 | 88 | 321 |
| Industrial instrumentation | 20 | 11 | 71 |
| Jewellery | 35 | 55 | 161 |
| Masonry | 7 | 3 | 19 |
| Motor trades | 980 | 1,229 | 4,062 |
| Moulding | 8 | 6 | 41 |
| Painting | 226 | 159 | 672 |
| Photo-engraving | 50 | 50 | 133 |
| Piano repairing and tuning | 2 | 1 | 7 |
| Plastering | 35 | 34 | 112 |
| Plumbing | 267 | 177 | 993 |
| Printing | 214 | 248 | 727 |
| Radio | 98 | 105 | 298 |
| Refrigeration engineering | 50 | 38 | 167 |
| Retail meat industry | 340 | 377 | 1,068 |
| Saddlery, leather, and canvas goods | 27 | 26 | 95 |
| Sheetmetal working | 111 | 109 | 405 |
| Shipbuilding | 44 | 46 | 136 |
| Signwriting | 40 | 42 | 138 |
| Timber industry | 38 | 36 | 128 |
| Woollen milling industry | 4 | 3 | 10 |
| Others | 75 | 58 | 190 |
| Total | 6 994 | 6 602 | 24 766 |
| Male apprentices | 6 286 | 6 112 | 22 794 |
| Female apprentices | 708 | 490 | 1 972 |
In addition to the numbers of apprentices shown above, there were at 31 March 1983, 2687 apprenticeship contracts in force in Government departments, of which 558 were registered during the year ended 31 March 1983.
Training Courses for Maoris and Pacific Islanders—For information on vocational training courses for Maoris and Pacific Islanders, refer to Section 3B of this Yearbook.
STATISTICS OF EMPLOYMENT: Employment Surveys—Since February 1980 the Department of Labour has carried out an annual employment survey in February and quarterly sample surveys in May, August, and November. These surveys are carried out by means of inquiries to employers of labour and the results are published in the Labour and Employment Gazette. Returns are required from all establishments in which 2 or more persons are engaged on a full-time equivalent basis (2 part-time workers are regarded as equivalent to 1 full-time worker). Government and local authority employment is included. Employers in farming, hunting, trapping, fishing, waterfront work, seagoing work, private domestic service, and armed forces are not required to submit quarterly returns. The following tables are based on these surveys.
A summary of employment is given in the following table.
| Date of Survey | Full-time Employees and Working Proprietors | Part-time Workers | ||||
|---|---|---|---|---|---|---|
| Males | Females | Total | Males | Females | Total | |
| * Provisional. | ||||||
| 1982—Feb | 637,462 | 324,737 | 962,199 | 32,039 | 119,918 | 151,957 |
| May | 635,234 | 329,908 | 965,142 | 33,227 | 126,136 | 159,363 |
| Aug | 622,409 | 328,765 | 951,174 | 33,750 | 128,829 | 162,579 |
| Nov | 624,394 | 329,993 | 954,387 | 34,101 | 131,249 | 165,350 |
| 1983—Feb | 626,335 | 322,357 | 948,692 | 32,119 | 124,588 | 156,707 |
| May | 623,704 | 323,398 | 947,102 | 33,942 | 127,829 | 161,771 |
| Aug | 610,020 | 323,725 | 933,745 | 34,404 | 130,698 | 165,102 |
| Nov* | 618,165 | 328,204 | 946,369 | 35,220 | 133,660 | 168,880 |
EMPLOYMENT BY LOCAL AUTHORITIES—Employees of local authorities are principally engaged in the construction and maintenance of roads and streets, the operation and maintenance of public-utility industries (gas, electric, and water supply, and transport), and community services.
In the following table particulars are given of the number of all direct wage-earning employees who were actually in the employ of the various classes of local authorities (hospital boards excluded) at 28 February of each of the latest 3 years inclusive. Besides permanent staff, including administrative and professional employees, the statistics include part-time, casual, and temporary employees, but exclude those employed by contractors and Public Sector Job Creation Schemes.
| Local Authorities* | Employees at 28 February† | ||
|---|---|---|---|
| 1980 | 1981 | 1982 | |
* For numbers see Section 2. †At 15 April from 1980. ‡Gas board employees are included with electric power board employees. §Total includes employees of licensing trusts (3087 employees in 1980, 3310 employees in 1981, and 3300 employees in 1982) and hydatids districts (31 employees in 1980, 29 employees in 1981, and 27 employees in 1982). | |||
| Catchment boards | 1,075 | 1,145 | 1,097 |
| City and borough councils | 20,876 | 19,898 | 19,994 |
| County Councils | 5,784 | 5,446 | 5,391 |
| Crematorium board | 2 | 2 | |
| District councils | 1,411 | 1,313 | 1,303 |
| Electric power boards | 6 792‡ | 6 930‡ | 6,990 |
| Harbour boards | 3,847 | 3,887 | 3,891 |
| Harbour bridge authority | 131 | 129 | 128 |
| Land drainage boards | 36 | 36 | 30 |
| Local railway board | 9 | 9 | 9 |
| Museum authority | 141 | 144 | 142 |
| Nasselia tussock boards | 47 | 61 | 63 |
| Plantation board | 13 | 13 | 14 |
| Pest destruction boards | 679 | 640 | 527 |
| Regional authorities | 2,802 | 2,929 | 2,910 |
| River boards | 7 | 8 | 8 |
| Town boards | 18 | 19 | 20 |
| Urban drainage boards | 474 | 489 | 489 |
| Urban transport board | 472 | 467 | 490 |
| Valley authority | 47 | 47 | 63 |
| Water supply boards | 141 | 128 | 6 |
| Total | 47 922§ | 47 079§ | 46 892§ |
PUBLIC SERVICE EMPLOYMENT—Permanent staff in the Public Service as at 31 March 1983 totalled 66 102, of whom 42 315 were males and 23 787 females. In addition, the Public Service gave employment to 1388 temporary staff and 17 739 wage workers, giving a total for all employees of 85 229 (55 655 males and 29 574 females) compared with 86 045 as at 31 March 1982. These figures do not include the staffs of the Post Office, the railway service, the Police (except civilian staff), education boards, hospital boards, or universities.
STATISTICS FROM CENSUSES OF POPULATION 1976 AND 1981—Final figures of the industrial and occupational distribution of the labour force by industry major divisions and occupation major groups at the 1981 Census of Population and Dwellings are given in the 2 following tables.
Final data on the industrial and occupation distribution of the labour force from the 1981 census have been subject to a process of random rounding. All cell values, including row and column totals have been rounded, using simple random rounding, to base three. Individual figures, therefore, will not necessarily sum to give the stated totals.
The data refer to the usually resident population, i.e. they do not include overseas visitors who did not or would not work while in New Zealand. Data from the 1976 census have been reprocessed on this basis.
| Industry Major Division | Age Group (Years) | Total | ||
|---|---|---|---|---|
| 15–24 | 25–49 | 50 and Over | ||
| Number of Persons | ||||
| Agriculture, hunting, forestry, and fishing | 35,361 | 79,695 | 29,196 | 144,252 |
| Mining and quarrying | 990 | 2,592 | 1,077 | 4,659 |
| Manufacturing | 86,817 | 165,663 | 58,650 | 311,133 |
| Electricity, gas, and water | 3,486 | 8,148 | 3,486 | 15,123 |
| Construction | 21,387 | 48,981 | 15,372 | 85,737 |
| Wholesale and retail trade, restaurants, and hotels | 59,328 | 114,567 | 44,541 | 218,439 |
| Transport, storage, and communication | 24,723 | 61,533 | 21,576 | 107,826 |
| Financing, insurance, real estate, and business services | 30,489 | 46,683 | 14,463 | 91,638 |
| Community, social, and personal services | 85,905 | 164,673 | 56,997 | 307,575 |
| Activities not adequately defined | 23,748 | 16,797 | 5,418 | 45,963 |
| Total* | 372 237 | 709 329 | 250 776 | 1 332 342 |
| Occupation Major Group | Age Group (Years) | Total | ||
|---|---|---|---|---|
| 15–24 | 25–49 | 50 and Over | ||
* New Zealand residents engaged full-time in the labour force. †Includes related workers. | ||||
| Number of Persons | ||||
| Professional and technical† | 43,392 | 110,031 | 30,546 | 183,966 |
| Administrative and managerial | 1,404 | 31,659 | 12,930 | 45,993 |
| Clerical† | 74,634 | 101,976 | 38,154 | 214,761 |
| Sales workers | 26,559 | 72,024 | 28,521 | 127,101 |
| Service workers | 27,774 | 57,666 | 21,192 | 106,629 |
| Agricultural, animal husbandry, and forestry workers, fishermen, and hunters | 36,027 | 79,716 | 30,549 | 146,295 |
| Production workers†, transport equipment operators, and labourers | 137,121 | 238,188 | 82,620 | 457,935 |
| New workers seeking employment | 8,358 | 180 | 27 | 8,559 |
| Workers reporting occupation unidentifiable or inadequately described | 2,265 | 4,854 | 2,094 | 9,213 |
| Workers not reporting any occupation | 14,703 | 13,038 | 4,146 | 31,890 |
| Total* | 372 234 | 709 335 | 250 773 | 1 332 342 |
Employment Status—The following table shows the employment status of usually resident persons in the full-time labour force, and also persons not in the full-time labour force excluding children under 15 years, at the 2 latest Censuses of Population and Dwellings. Part-time workers, i.e., those working less than 20 hours per week, have been classified as “not in the full-time labour force”.
| Employment Status | 1976 Census | 1981 Census | ||||
|---|---|---|---|---|---|---|
| Males | Females | Total* | Males | Females | Total* | |
* New Zealand residents aged 15 years and over. †Equates to the status “Employer of labour” used in the 1976 and earlier censuses. ‡Equates to the status “Own account worker” used in the 1976 and earlier censuses. | ||||||
| Self employed, employing labour† | 70,431 | 12,384 | 82,815 | 64,329 | 14,052 | 78,381 |
| Self employed, not employing labour‡ | 76,370 | 14,671 | 91,041 | 75,840 | 17,289 | 93,132 |
| Wages or salary earner | 692,257 | 361,012 | 1,053,269 | 696,891 | 392,235 | 1,089,129 |
| Unemployed, seeking work | 11,539 | 25,530 | 34,482 | 25,776 | 60,255 | |
| Relative assisting, unpaid | 660 | 3,187 | 3,847 | 1,491 | 4,941 | 6,429 |
| Not specified (20 hours or more worked) | 2,010 | 590 | 2,600 | 3,573 | 1,446 | 5,019 |
| Total in the full-time labour force | 855,719 | 403,383 | 1,259,102 | 876,609 | 455,736 | 1,332,342 |
| Not in the full-time labour force | 219,456 | 697,920 | 917,376 | 253,731 | 710,628 | 964,362 |
| Grand total | 1 075 175 | 1 101 303 | 2 176 478 | 1 130 340 | 1 166 364 | 2 296 704 |
Industrial Distribution: Divisions—The industrial distribution of the usually resident labour force analysed by industrial major divisions and divisions as recorded at the 1981 Population Census is shown below. Totals for major divisions only are given from the 1976 census.
| Industrial Major Division and Division | Males | Females | Total | Percentage |
|---|---|---|---|---|
| Agriculture, hunting, forestry, and fishing— | ||||
| Agriculture and hunting | 99,282 | 30,927 | 1,209 | 9.8 |
| Forestry and logging | 9,735 | 684 | 10,419 | 0.8 |
| Fishing | 3,381 | 237 | 3,618 | 0.3 |
| Total 1981 | 112 404 | 31 851 | 144 255 | 10.8 |
| Total 1976 | 104,672 | 22,924 | 127,596 | 10.1 |
| Mining and quarrying— | ||||
| Coalmining | 1,500 | 51 | 1,551 | 0.1 |
| Crude petroleum and natural gas production | 627 | 111 | 738 | 0.1 |
| Metal-ore mining | 351 | 48 | 399 | |
| Other mining | 1,851 | 123 | 1,974 | 0.1 |
| Total 1981 | 4 329 | 330 | 4 659 | 0.3 |
| Total 1976 | 4,616 | 210 | 4,826 | 0.4 |
| Manufacturing— | ||||
| Food, beverages, and tobacco | 61,059 | 15,717 | 76,776 | 5.8 |
| Textile, wearing apparel, and leather industries | 15,909 | 29,637 | 45,546 | 3.4 |
| Wood and wood products including furniture | 19,929 | 2,910 | 22,839 | 1.7 |
| Paper and paper products, printing and publishing | 24,606 | 9,639 | 34,245 | 2.6 |
| Chemicals and chemical, petroleum, coal, rubber, and plastic products | 19,335 | 7,905 | 27,240 | 2.0 |
| Non-metallic mineral products except products of petroleum and coal | 9,186 | 1,881 | 11,067 | 0.8 |
| Basic metal industries | 6,357 | 747 | 7,104 | 0.5 |
| Fabricated metal products, machinery and equipment | 66,516 | 15,282 | 81,798 | 6.1 |
| Other manufacturing industries | 2,682 | 1,833 | 4,515 | 0.3 |
| Total 1981 | 225 579 | 85 551 | 311 130 | 23.4 |
| Total 1976 | 222,792 | 81,741 | 304,533 | 24.2 |
| Electricity, gas, and water— | ||||
| Electricity, gas, and steam | 12,837 | 1,263 | 14,100 | 1.1 |
| Waterworks and supply | 981 | 42 | 1,023 | 0.1 |
| Total 1981 | 13 821 | 1 302 | 15 123 | 1.1 |
| Total 1976 | 13,664 | 1,541 | 15,205 | 1.2 |
| Construction— | ||||
| Building and construction | 51,762 | 2,346 | 54,18 | 4.1 |
| Allied trades | 29,520 | 2,109 | 31,629 | 2 |
| Total 1981 | 81 279 | 4 458 | 85 737 | 6.4 |
| Total 1976 | 106,720 | 4,813 | 111,533 | 8.9 |
| Wholesale and retail trade and restaurants and hotels— | ||||
| Wholesale trade | 48,804 | 18,429 | 67,233 | 5.0 |
| Retail trade | 58,329 | 55,740 | 114,069 | 8.6 |
| Restaurants and hotels | 14,817 | 22,320 | 37,137 | 2.8 |
| Total 1981 | 121 947 | 96 492 | 218 439 | 16.4 |
| Total 1976 | 122,644 | 92,157 | 214,801 | 17.1 |
| Transport, storage, and communication— | ||||
| Transport and storage | 61,911 | 10,719 | 72,630 | 5.5 |
| Communication | 20,091 | 15,108 | 35,199 | 2.6 |
| Total 1981 | 82 002 | 25 827 | 107 829 | 8.1 |
| Total 1976 | 85,291 | 23,312 | 108,603 | 8.6 |
| Finance, insurance, real estate, and business services— | ||||
| Financial institutions | 13,383 | 16,185 | 29,568 | 2.2 |
| Insurance | 8,484 | 5,808 | 14,292 | 1.1 |
| Real estate and business services | 27,348 | 20,430 | 47,778 | 3.6 |
| Total 1981 | 49 215 | 42 423 | 91 638 | 6.9 |
| Total 1976 | 44,404 | 34,576 | 78,980 | 6.3 |
| Community, social, and personal services— | ||||
| Public administration and defence | 54,453 | 22,905 | 77,358 | 5.8 |
| Sanitary and similar services | 4,278 | 3,561 | 7,839 | 0.6 |
| Social and related community services | 60,540 | 104,730 | 165,270 | 12.4 |
| Recreational and cultural services | 13,086 | 6,975 | 20,061 | 1.5 |
| Personal and household services | 25,179 | 11,160 | 36,339 | 2.7 |
| International and other extra-territorial bodies | 429 | 282 | 711 | 0.1 |
| Total 1981 | 157 965 | 149 610 | 307 575 | 23.1 |
| Total 1976 | 131,238 | 129,532 | 260,770 | 20.7 |
| Activities not adequately defined— | ||||
| Total 1981 | 28 068 | 17 895 | 45 963 | 3.4 |
| Total 1976 | 19,678 | 12,577 | 32,255 | 2.6 |
| Total full-time labour force, 1981 | 876 606 | 455 733 | 1 332 342 | 100.0 |
| Total full-time labour force, 1976 | 855,719 | 403,383 | 1,259,102 | 100.0 |
Occupations—The occupational classification in major and minor groups is given for 1981 in the following table, with major group totals for 1976.
| Occupational Major Group and Minor Group | Males | Females | Total |
|---|---|---|---|
* Includes related workers. †Includes armed forces. NOTE: n.e.c. denotes—not elsewhere classified. | |||
| Professional and technical*— | |||
| Physical scientists and technicians | 2,631 | 1,119 | 3,750 |
| Architects, engineers and technicians | 25,545 | 1,410 | 26,955 |
| Aircraft and ships officers | 2,460 | 39 | 2,499 |
| Life scientists and technicians | 4,041 | 2,673 | 6,714 |
| Medical, dental, and veterinary workers* | 12,297 | 32,049 | 44,346 |
| Statisticians, mathematicians, systems analysts and technicians | 2,142 | 705 | 2,847 |
| Economists | 843 | 231 | 1,074 |
| Accountants | 9,612 | 1,131 | 10,743 |
| Jurists | 3,768 | 387 | 4,155 |
| Teachers | 22,248 | 30,273 | 52,521 |
| Workers in religion | 2,919 | 669 | 3,588 |
| Authors, journalists, and writers* | 2,139 | 1,173 | 3,312 |
| Sculptors, painters (artists), photographers | 3,285 | 1,674 | 4,959 |
| Composers and performing artists | 1,752 | 1,074 | 2,826 |
| Athletes, sportsmen/sportswomen* | 732 | 267 | 999 |
| Professional, technical n.e.c* | 6,705 | 5,970 | 12,675 |
| Total 1981 | 103 119 | 80 847 | 183 966 |
| Total 1976 | 102,833 | 73,206 | 176,039 |
| Administrators and managerial workers— | |||
| Legislative officials and government administrators | 780 | 81 | 861 |
| Managers (excluding those in wholesale and retail trade, catering and lodging services, and in farming) | 41,493 | 3,639 | 45,132 |
| Total 1981 | 42 273 | 3 720 | 45 993 |
| Total 1976 | 37,605 | 2,836 | 40,441 |
| Clerical workers— | |||
| Clerical supervisors | 5,388 | 2,478 | 7,866 |
| Government executive officials | 6,021 | 654 | 6,675 |
| Stenographers, typists, and card-and-tape punching machine operators | 636 | 34,128 | 34,764 |
| Bookkeepers, cashiers* | 14,616 | 32,067 | 46,683 |
| Computing machine operators | 1,371 | 5,796 | 7,167 |
| Transport and communications supervisors | 6,723 | 561 | 7,284 |
| Transport conductors | 552 | 33 | 585 |
| Mail distribution clerks | 2,349 | 2,331 | 4,680 |
| Telephone and telegraph operators | 1,200 | 5,610 | 6,810 |
| Clerical n.e.c* | 28,287 | 63,963 | 92,250 |
| Total 1981 | 67 143 | 147 618 | 214 761 |
| Total 1976 | 69,360 | 134,676 | 204,036 |
| Sales workers— | |||
| Managers (wholesale and retail trade) | 13,983 | 4,191 | 18,174 |
| Working proprietors (wholesale and retail trade) | 10,905 | 7,170 | 18,075 |
| Sales supervisors, and buyers | 4,395 | 1,167 | 5,562 |
| Technical sales staff, commercial travellers, and manufacturers' agents | 13,581 | 2,157 | 15,738 |
| Insurance, real estate, securities and business services salespersons, and auctioneers | 10,743 | 1,638 | 12,381 |
| Salespersons and shop assistants* | 21,501 | 35,331 | 56,832 |
| Sales workers n.e.c. | 237 | 102 | 339 |
| Total 1981 | 75 345 | 51 756 | 127 101 |
| Total 1976 | 77,199 | 47,351 | 124,550 |
| Service workers (inc. Armed Forces)— | |||
| Managers (catering and lodging services) | 2,379 | 1,701 | 4,080 |
| Working proprietors (catering and lodging services) | 3,876 | 3,342 | 7,218 |
| Housekeeping and related service supervisors | 351 | 2,349 | 2,700 |
| Cooks, waters/waitresses, bartenders* | 6,384 | 14,490 | 20,874 |
| Housestaff and related housekeeping service workers n.e.c. | 1,359 | 9,249 | 10,608 |
| Building caretakers, charworkers, and cleaners* | 6,555 | 7,533 | 14,088 |
| Launderers, drycleaners, and pressers | 1,116 | 2,463 | 3,579 |
| Hairdressers, barbers, beauticians* | 1,077 | 4,683 | 5,760 |
| Protective service workers† | 22,590 | 1,839 | 24,429 |
| Service workers n.e.c. | 4,623 | 8,673 | 13,296 |
| Total 1981 | 50 307 | 56 322 | 106 629 |
| Total 1976 | 45,579 | 49,150 | 94,729 |
| Agricultural, animal husbandry, and forestry workers, fishermen, and hunters— | |||
| Farm managers and supervisors | 3,648 | 129 | 3,777 |
| Farmers | 59,175 | 13,680 | 72,855 |
| Agricultural and animal husbandry workers | 39,267 | 15,825 | 55,092 |
| Forestry workers | 9,300 | 366 | 9,666 |
| Fishermen and hunters* | 4,701 | 207 | 4,908 |
| Total 1981 | 116 091 | 30 204 | 146 295 |
| Total 1976 | 107,843 | 21,770 | 129,613 |
| Production and related workers, transport equipment operators, and labourers— | |||
| Production supervisors, overseers and general foremen/forewomen (non-clerical) and excluding agriculture, transport, sales and service supervisors, overseers and foremen/forewomen | 16,236 | 1,824 | 18,060 |
| Miners, quarrymen, and well-drillers* | 1,896 | 6 | 1,902 |
| Metal processers | 2,805 | 168 | 2,973 |
| Wood preparation workers and paper makers | 9,426 | 513 | 9,939 |
| Chemical processers* | 1,881 | 390 | 2,271 |
| Spinners, weavers, knitters, dyers* | 3,849 | 3,003 | 6,852 |
| Tanners, fellmongers, and pelt dressers | 897 | 246 | 1,143 |
| Food and beverage processers | 39,843 | 5,154 | 44,997 |
| Tobacco preparers and tobacco product makers | 126 | 252 | 378 |
| Tailors, dressmakers, sewers, and upholsterers* | 4,695 | 18,888 | 23,583 |
| Shoemakers and leather goods makers | 1,986 | 2,673 | 4,659 |
| Cabinet makers and related woodworkers | 5,604 | 444 | 6,048 |
| Stone cutters and carvers | 189 | 9 | 198 |
| Blacksmiths, toolmakers, and machine tool operators | 7,560 | 615 | 8,175 |
| Machinery fitters, machine assemblers, and precision instrument makers (except electrical) | 50,625 | 1,563 | 52,188 |
| Electrical fitters and electrical and electronics workers | 29,673 | 3,123 | 32,796 |
| Broadcasting station and sound equipment operators and cinema projectionists | 603 | 126 | 729 |
| Plumbers, welders, sheet-metal and structural metal preparers and erectors | 23,607 | 534 | 24,141 |
| Jewellery and precious metal workers | 933 | 258 | 1,191 |
| Glass formers and potters* | 2,190 | 735 | 2,925 |
| Rubber and plastics product makers | 4,737 | 1,572 | 6,309 |
| Paper and paper-board products makers | 552 | 327 | 879 |
| Printers* | 8,079 | 3,360 | 11,439 |
| Painters | 13,380 | 396 | 13,776 |
| Production and related workers n.e.c. | 4,770 | 3,093 | 7,863 |
| Bricklayers, carpenters, and other construction workers | 40,719 | 174 | 40,893 |
| Stationary engine and related equipment operators n.e.c. | 3,219 | 15 | 3,234 |
| Material handling and related equipment operators, dockers, and freight handlers | 34,506 | 7,605 | 42,111 |
| Transport equipment operators | 37,677 | 1,836 | 39,513 |
| Labourers n.e.c. | 38,394 | 8,379 | 46,773 |
| Total 1981 | 390 660 | 67 275 | 457 935 |
| Total 1976 | 400,111 | 65,595 | 465,706 |
| Workers not classifiable by occupation— | |||
| New workers seeking employment: | |||
| 1981 | 3,795 | 4,764 | 8,559 |
| 1976 | 1,705 | 2,557 | 4,262 |
| Workers reporting occupation unidentifiable or inadequately described: | |||
| 1981 | 6,912 | 2,301 | 9,213 |
| 1976 | 12,558 | 5,639 | 18,197 |
| Workers not reporting any occupation (excluding armed forces): | |||
| 1981 | 20,964 | 10,929 | 31,893 |
| 1976 | 926 | 603 | 1,529 |
| Total in full-time labour force, 1981 | 876 606 | 455 736 | 1 332 342 |
| Total in full-time labour force, 1976 | 855 719 | 403 383 | 1 259 102 |
WOMEN IN THE LABOUR FORCE—The resident full-time labour force at the 1981 census was 1 332 342, of whom 876 606 were males and 455 736 females. Thus, women and girls formed 34.2 percent of the labour force in 1981 compared with 32.0 percent in 1976. There was an increase of 73 240 or 5.8 percent in the total labour force in 1981 as compared with the previous census in 1976, but of this increase 52 353 (71.5 percent) were females and only 20 887 were males. The more rapid
growth of the female component of the labour force as compared with male was in line with the experience of almost half a century, but the situation during the most recent intercensal period has been complicated by losses of both men and women due to migration.
The labour force is defined as consisting of persons aged 15 years and over who are resident in New Zealand and working at least 20 hours per week for financial gain, plus those unemployed and seeking work. Data on those in part-time employment for less than 20 hours a week were also collected at the 1981 census. The total number of people engaged in part-time employment was 115 140, of whom 20 013 were males and 95 127 females. Males in part-time work were mainly either relatively young (47.3 percent of them were in the 15–19 years age group) or in the 60 years and over category and so semi-retired. Female part-time workers were more evenly distributed over the age categories. Of the total of 95 127 women and girls, over three-quarters were married.
Among the 72 354 married women working part-time, 23 709 worked from 15 to 19 hours a week and 21 987 worked from 10 to 14 hours a week.
The following table, which shows the numbers of married women and total women by age groups working for financial gain, is in three parts. The first part shows women working for financial gain for at least 20 hours a week and therefore forming part of the labour force; the second part shows women in part-time employment; and the third part all women working for financial gain. There are no data regarding hours spent on housework or on unpaid community or social work.

| Employment and Marital Status | Age Group (Years) | Total | |||||
|---|---|---|---|---|---|---|---|
| 15–19 | 20–24 | 25–29 | 30–39 | 40–49 | 50 and Over | ||
| * New Zealand residents. | |||||||
| Full-time employment— | |||||||
| Married women | 2,094 | 26,223 | 28,869 | 69,654 | 66,474 | 46,683 | 240,000 |
| Other women | 72,045 | 58,005 | 21,846 | 24,681 | 17,928 | 21,237 | 215,736 |
| Total* | 74 139 | 84 228 | 50 715 | 94 335 | 84 402 | 67 920 | 455 736 |
| Percentage, married | 2.8 | 31.1 | 56.9 | 73.8 | 78.8 | 68.7 | 52.7 |
| Part-time employment— | |||||||
| Married women | 177 | 3,198 | 9,990 | 28,176 | 17,256 | 13,551 | 72,354 |
| Other women | 9,687 | 2,088 | 1,386 | 2,916 | 1,848 | 4,848 | 22,773 |
| Total* | 9 864 | 5 286 | 11 376 | 31 092 | 19 104 | 18 399 | 95 127 |
| Percentage, married | 1.8 | 60.5 | 87.8 | 90.6 | 90.3 | 73.7 | 76.1 |
| All women in employment— | |||||||
| Married women | 2,271 | 29,421 | 38,859 | 97,830 | 83,730 | 60,234 | 312,354 |
| Other women | 81,732 | 60,093 | 23,232 | 27,597 | 19,776 | 26,035 | 238,509 |
| Total* | 84 003 | 89 514 | 62 091 | 125 427 | 103 506 | 86 319 | 550 863 |
| Percentage, married | 2.7 | 32.9 | 62.6 | 78.0 | 80.9 | 69.8 | 56.7 |
NOTE: These figures have been rounded, using simple random rounding, to base three. Because of this, totals are not necessarily the exact sum of the component parts.
The percentage of married women in the full-time labour force has increased between every census since 1936, for all age groups other then the 60 years and over age groups. Between the 1976 and 1981 censuses the percentage of married women over 60 years of age who were involved in the labour force decreased.
The following table gives the percentage of married women in the full-time labour force as a percentage of all married women in the same age group.
| Age (Years) | Census | |||||
|---|---|---|---|---|---|---|
| 1936 | 1945 | 1956 | 1966 | 1976 | 1981* | |
| * New Zealand residents aged 16 years and over. | ||||||
| Percentage of Married Women in the Full-time Labour Force | ||||||
| 16–19 | 5.7 | 18.2 | 18.5 | 23.5 | 40.3 | 41.7 |
| 20–24 | 4.3 | 17.4 | 19.4 | 26.7 | 44.0 | 48.4 |
| 25–29 | 3.7 | 10.3 | 11.7 | 15.8 | 28.8 | 34.0 |
| 30–34 | 3.6 | 8.0 | 11.3 | 16.4 | 31.5 | 35.6 |
| 35–39 | 3.6 | 8.4 | 13.9 | 21.8 | 41.7 | 46.9 |
| 40–44 | 3.9 | 8.7 | 16.6 | 26.9 | 46.3 | 53.2 |
| 45–49 | 4.4 | 7.8 | 17.5 | 27.7 | 44.2 | 51.3 |
| 50–54 | 4.2 | 6.1 | 15.5 | 25.2 | 37.8 | 42.2 |
| 55–59 | 4.2 | 4.6 | 10.8 | 18.5 | 25.4 | 28.9 |
| 60–64 | 2.8 | 2.5 | 5.2 | 9.5 | 11.4 | 9.9 |
| 65+ | 1.6 | 1.0 | 1.6 | 2.1 | 2.4 | 1.9 |
| All ages— | ||||||
| 16+ | 3.7 | 7.7 | 12.9 | 19.9 | 32.6 | 35.8 |
The increasing tendency for women to continue in employment after marriage until the birth of the first child and to re-enter the labour force as family responsibilities lessen has been aided by a combination of factors, including marriage at younger ages, changing social attitudes, and a greater awareness and acceptance of family planning.
For many years the female labour force has included a higher percentage of youthful workers than has the male but this is becoming progressively less noticeable as more married women remain in (or return to) the labour force. At the 1981 census, women under 20 years of age made up 16.3 percent of the female labour force compared with 18.5 percent in 1976 and 25.9 percent twenty years earlier in 1961. Another reason for the fall in the percentage of women under 20 in the labour force is the increasing number of women and girls staying longer at school or attending tertiary education institutions as a preparation for a career. Department of Education figures for university education show that the number of internal students at 1 July 1961 in University institutions and agricultural colleges numbered 12 585 males and 3944 females. However in 1981, the number of males reported had more than doubled to 25 673, whereas the numbers of females had increased more than fourfold to 19 063. Men of below 20 years of age make up a relatively constant proportion of around 10 percent of the male labour force. (They represented 10.0 percent and 10.1 percent, respectively, at the 1976 and 1981 censuses, and 9.3 percent 20 years earlier in 1961.)
WORKING LIFE EXPECTANCIES—A table of working life displays the manner in which rates of participation in, entry to, and withdrawal from, the labour force vary with age for the given population group. Also included are expectancies of future working life and retirement life, assuming that the rates displayed in the table continue unchanged. The main applications of these tables are to economic and social studies relating to large groups of people. Individuals frequently do not conform to group patterns and, therefore, applications of any statistics from the tables must be made with caution.
Abridged tables of working life for males and females, based on labour force data from the 1976 Census of Population and Dwellings and the 1975–77 Life Tables (Total Population), are now given.
A further series of tables of working life will be produced following the 1986 Census of Population and Dwellings.
| Exact Age (Years) | Percentage of Population in Labour Force | Number in Labour Force, per 100 000 Live Births | Changes in the Labour Force in the Following 5 Years of Age. per 100 000 Live Births | Expectation of Work Life of Person in Labour Force† (years) | Expectation of Retirement Life of Person in Labour Force‡ (Years) | |
|---|---|---|---|---|---|---|
| Total Entries* | Total Withdrawals | |||||
* Entries of females into the labour force below the horizontal line are secondary entries by those who withdrew at younger ages for family formation. † The working life expectancies for females allow for the possibility of a second spell of labour force membership after a period of non-membership due to family formation. ‡Difference between life expectancy and working life expectancy. §These are withdrawals at all ages 80 and above. | ||||||
| Males | ||||||
| 15 | – | – | 83,491 | 530 | 45.7 | 10.0 |
| 20 | 85.8 | 82,961 | 9,798 | 820 | 41.1 | 10.1 |
| 25 | 96.0 | 91,939 | 2,150 | 637 | 36.5 | 10.2 |
| 30 | 98.2 | 93,452 | 301 | 657 | 31.7 | 10.2 |
| 35 | 98.6 | 93,096 | 46 | 1,055 | 26.9 | 10.3 |
| 40 | 98.5 | 92,087 | – | 1,804 | 22.2 | 10.4 |
| 45 | 98.1 | 90,283 | 3,420 | 17.6 | 10.5 | |
| 50 | 97.1 | 86,863 | – | 6,297 | 13.2 | 10.6 |
| 55 | 94.3 | 80,566 | – | 17,239 | 9.0 | 10.8 |
| 60 | 79.9 | 63,327 | – | 35,082 | 5.6 | 10.5 |
| 65 | 40.2 | 28,245 | – | 17,946 | 4.8 | 8.1 |
| 70 | 17.7 | 10,299 | – | 6,434 | 4.6 | 5.4 |
| 75 | 9.1 | 3,865 | – | 2,763 | 4.0 | 3.7 |
| 80 | 4.1 | 1,102 | – | 1 102§ | 3.3 | 2.4 |
| Females | ||||||
| 15 | – | – | 87,057 | 17,523 | 18.8 | 43.0 |
| 20 | 71.1 | 69 534* | 12,032 | 38,082 | 16.9 | 40.1 |
| 25 | 44.6 | 43,484 | 1,995 | 13,828 | 21.2 | 31.0 |
| 30 | 32.6 | 31,652 | 12,194 | 5,072 | 22.9 | 24.4 |
| 35 | 40.1 | 38,774 | 9,662 | 2,781 | 20.7 | 21.9 |
| 40 | 47.5 | 45,655 | 4,039 | 3,846 | 16.8 | 21.0 |
| 45 | 48.3 | 45,848 | 2,262 | 6,598 | 13.0 | 20.3 |
| 50 | 44.5 | 41,513 | 695 | 9,655 | 9.7 | 19.1 |
| 55 | 35.9 | 32,552 | – | 14,386 | 6.8 | 17.8 |
| 60 | 20.8 | 18,166 | – | 11,092 | 5.1 | 15.4 |
| 65 | 8.6 | 7,074 | – | 4,635 | 4.6 | 12.0 |
| 70 | 3.3 | 2,439 | – | 1,617 | 4.5 | 8.5 |
| 75 | 1.3 | 822 | – | 563 | 4.3 | 5.7 |
| 80 | 0.5 | 257 | – | 258§ | 4.0 | 3.2 |
NOTE: Because of rounding total entries and total withdrawals do not always match the numbers in the labour force at selected ages.
FURTHER INFORMATION—Further information on employment will be found in the following publications.
Report of the Department of Labour (Parl. paper G. 1).
Report of the State Services Commission (Parl. paper G. 3).
Labour and Employment Gazette—Department of Labour (quarterly).
1981 Census of Population and Dwellings: Vol. 4, Labour force—Department of Statistics.
Monthly Abstract of Statistics—Department of Statistics.
Prices, Wages, and Labour—Department of Statistics (annual).
New Zealand Tables of Working Life—Department of Statistics.
Pocket Digest of Statistics—Department of Statistics (annual).
New Zealand Standard Classifications—Department of Statistics.
New Zealand Standard Classification of Occupations (NZSCO).
New Zealand Standard Industrial Classification (NZSIC).
The Department of Labour publishes a wide range of booklets, reports, and pamphlets on topics connected with its functions and responsibilities, especially employment opportunities and vocational guidance.
The rules underlying the New Zealand system of industrial relations have traditionally been embodied in legislation. In both the private and public sectors, statutes confer bargaining rights on certain registered/recognised unions and specify various procedures for the conduct of negotiations.
In the private sector, the main body of rules covering industrial relations is contained in the Industrial Relations Act 1973. By a process of registration, unions secure bargaining rights for the class of workers they represent, and also access to various procedures for the settlement of disputes associated with the renegotiation of the collective agreement (dispute of interest) and its subsequent interpretation or application (dispute of right).
In the case of disputes of interest, the emphasis is on the parties reaching a settlement through the process of collective bargaining. The parties can agree to negotiate a voluntary settlement of the dispute. The resultant collective agreement is registered with the Arbitration Court and binds the immediate parties (usually an individual employer and employees). Alternatively, either party may apply for the dispute to proceed through the more orthodox conciliation and arbitration channels. Arbitration is neither compulsory nor inevitable. It is at the discretion of the applicant to withdraw from the arbitration proceedings. Moreover, the Arbitration Court may refuse to arbitrate if it is not satisfied that the parties have made a genuine attempt to settle. An agreement arrived at through conciliation or an award of the Court automatically binds all persons in the industry to which it relates (whether they are parties to it or not), as well as any person who subsequently becomes connected with or engaged in the industry (termed “blanket coverage”).
The emphasis in respect of disputes of right is on their peaceful resolution, and accordingly the process of arbitration is rather more in evidence. A dispute proceeds through a disputes committee chaired by an independent person who may either make a decision, or refer the matter to the Arbitration Court for a decision in the event of the parties failing to agree.
Separate enactments cover bargaining relationships in the agriculture sector, on the waterfront, and in aircrew services. In the public sector, the principal enactment covering collective bargaining is the State Services Conditions of Employment Act 1977. This Act provides for the recognition of service organisations, and specifies various procedures for the issuing of determinations prescribing conditions of employment in the State Services and for the resolution of disputes associated with the application of determinations. The procedures are essentially designed to guarantee the union bargaining rights in respect of the issue of determinations. A Police Staff Tribunal, established by the Police Act 1958, makes orders as to the remuneration and conditions of service of the members of the Police.
Pay fixing in the State Services is linked to the private sector by way of the principle of fair comparability. White collar groups move in relation to the average surveyed movement in the private sector. Blue collar groups (including trades groups) currently have their rates adjusted by the movement in the main private sector trades awards, supplemented by detailed pay research exercises.
WAGES IN THE. PRIVATE SECTOR—The following strata can be identified in the wage determination system in the private sector.
The Minimum Wage—Since 1945 the national adult minimum wage has been determined by Orders in Council. The Minimum Wage Act 1945, which authorised this process, was re-enacted in 1983 and contained similar provisions to those of its predecessor. One substantial addition insofar as the setting of the minimum wage is concerned was the requirement that the Minister review minimum rates in each year ending on 31 December. The Minister also has the power to fix minimum rates for workers of any specified age.
The minimum wage essentially affords protection to the non-unionised sector, which is relatively small and encompasses such groups as domestics, gardeners, rest home employees, etc. Earlier practice was to fix it at a level slightly below that determined by the unionised sector for an unskilled adult, having regard also to the level of the unemployment benefit. In recent years the minimum wage has only attracted general wage increases and the difference between the minimum wage and levels in the unionised sector has therefore widened considerably.
National Awards—For all intents and purposes, the legally enforceable minimum wage rate for the unionised sector is determined by the national awards. These are arrived at by way of the conciliation and arbitration system, and have the effect of automatically binding all workers and employers in the industries to which they relate. The vast majority of awards are negotiated annually. Only occasionally is the Arbitration Court called upon to exercise its arbitral function, and then only on one or two clauses in the document. Compliance with award conditions is primarily the responsibility of inspectors of awards who undertake routine inspections of factory and commercial premises, and investigate specific complaints. They also initiate enforcement and recovery actions on behalf of workers in terms of the Industrial Relations Act 1973.
National (or near-national) awards number approximately 200. They are primarily craft/occupation structured, and can extend across many different firms and industries (e.g., the Metal Trade Award, the Clerical Workers Award). Because of the structure of awards, wage rates are determined almost exclusively on the basis of historic relativity, which produces a high degree of synchronisation in the “award round”. Economic criteria such as ability to pay and productivity are difficult to accommodate in an award which covers firms and industries of quite different economic characteristics. The award movement is important in that it provides the basis for the movement in related ruling rate agreements (although it is noted that in some regions the award rate is the paid rate).
Voluntary Settlement Collective Agreements—In most of the major industries, the main awards are supplemented by what are termed voluntary settlement collective agreements. Such agreements commonly cover an individual employing unit (or group of units in a particular locality) and the workers engaged in the particular craft. Occasionally, the agreement covers a combination of crafts within the employing unit(s) and is referred to as a composite collective agreement. The latter requires the various unions within the undertaking to come together and formulate a common set of claims on the employer.
Strictly speaking, voluntary settlement collective agreements supersede the award, and in this sense prescribe the legally minimum rates of wages for the workers covered. Because they are negotiated under (and registered in terms of) the Industrial Relations Act they are enforceable in the same way as awards. Currently they number approximately 600.
Voluntary settlement collective agreements invariably provide for a margin above the award, and in this sense reflect market conditions (ability to pay, productivity, etc.). However the movement in the wage rates in many such agreements is primarily determined by the parent award and in this sense market requirements are only partially accommodated.
Informal House Agreements—These may simply be expressed in terms of a money margin above the award rate or they may prescribe a comprehensive code of employment. The latter are analogous to voluntary settlement collective agreements, but are not registered under the Industrial Relations Act and are therefore not enforceable in terms of that Act. By their nature, informal house agreements are limited to a single employing unit in an area in which market forces are producing above-award differentials. There is no precise information available as to the extent or nature of such agreements.
Other Regulations—The Wage Adjustment Regulations 1974 are still in force in a heavily amended form. Regulation 6 provides that no industrial agreement shall fix any rate of remuneration unless that rate is to continue in force for a period of at least 12 months unless there are special reasons to justify a shorter period. Part IIIA contains the redundancy provisions which are the second most important principles in the Regulations.
Amendment No. 20, which came into force on 6 July 1982, restricted the amount of redundancy compensation payable under agreements negotiated from that date to no more than 8 percent of total ordinary pay received in the 12 months prior to the redundancy, plus 4 percent of total ordinary pay for every other year of service to a maximum of 19. Such agreements may not provide for anyone who has not worked in the employment concerned for less than 12 months prior to the redundancy.
All payments made by way of redundancy compensation must, when totalled, fall within these limits. In addition, the Arbitration Court is no longer permitted to approve agreements that provide for payments that exceed the prescribed limits.
WAGE FREEZE—The freeze on wages was implemented by 2 sets of regulations. Rates of remuneration payable to statutory officers and members of statutory bodies were frozen by the Remuneration Freeze Regulations 1982, but the Wage Freeze Regulations 1982 constituted the primary mechanism for the imposition of a wage freeze. Orginally intended to expire after a 12-month period, the regulations were amended after a decision to extend the entire freeze for a further 8 months, with the new expiry date being 29 February 1984. A further decision was taken at that time to continue the wage freeze indefinitely.
In addition to restricting all rates of remuneration to the levels payable at the start of the freeze, the Wage Freeze Regulations prevented the negotiation, settlement, and implementation of any of the instruments governed by legislation in both the public and private sectors. A further amendment to the regulations prevented any increase in reimbursing payments as from 24 May 1983, and suspended for the duration of the freeze any increases in such payments that had been granted between 16 May 1983 and 23 May 1983.
Some exemptions from the wage freeze have been permitted. These included instruments that had not been renewed in the 1981–82 wage round, and instruments which applied only to workers on specified major projects. A further class of instruments was subsequently exempted, namely those covering new employment relationships which arose during the currency of the freeze, and for which no suitable instrument existed. The exemption from the freeze of the latter group of documents was dependent upon the approval of the 1-person Wage Freeze Authority of any terms relating to remuneration, reimbursement payments, or both. Once finalised, all exempted documents became subject to the freeze under the same terms as all other instruments.
A wage-fixing committee began deliberations on 20 September 1984 to discuss the mechanics of ending the wage freeze, including renegotiation of all awards and deciding when the next award round will begin. The committee comprises representatives of the Combined State Unions, the Federation of Labour, Employers Federation, Treasury, and Department of Labour
WEEKLY EARNINGS—In the past the Department of Labour has carried out half-yearly surveys of employment and wages in April and October. These surveys were replaced from the beginning of 1980 by an annual employment survey in February and quarterly sample surveys in May, August, and November. For these surveys returns have been required from all establishments in which at least 2 persons (on a full-time equivalent basis) are engaged. This includes working proprietors. Government and local authority employment is included, but not farming, hunting, fishing, waterfront and seagoing work, or domestic service in private households. The armed forces are excluded.
The following table shows the average weekly payout per person (covering males and females, adult and juvenile) derived from these surveys during recent years.
| Date of Survey | Weekly Wage Payout per Person* | |
|---|---|---|
| Average Total Weekly Earnings — All Persons | Average Ordinary Time Weekly Earnings | |
| * Including allowances and special payments (bonuses, penal and shift allowances, paid leave, and commission). | ||
| $ | $ | |
| 1981—February | 231.33 | 215.89 |
| May | 242.53 | 226.50 |
| August | 252.34 | 237.16 |
| November | 259.20 | 241.90 |
| 1982—February | 270.60 | 252.45 |
| May | 285.27 | 265.97 |
| August | 282.80 | 266.31 |
| November | 286.83 | 268.59 |
| 1983—February | 293.06 | 274.36 |
| May | 293.18 | 274.50 |
| August | 290.21 | 273.11 |
| November | 294.77 | 274.85 |
| 1984—February | 301.60 | 279.33 |
HOURLY EARNINGS—In the following table average hourly earnings from the half-yearly and later surveys are shown; estimated average ordinary time worked by full-time employees has been obtained by dividing aggregate ordinary-time hours worked during one week by the sum of full-time employees plus half of the part-time employees.
| Date | Average Hourly Earnings for All Workers Covered by Survey | Average Weekly Hours Paid For All Workers Covered by Survey | ||||
|---|---|---|---|---|---|---|
| Ordinary Time | Overtime | Ordinary Time and Overtime Combined | Ordinary Time Worked by Full-time Employees | Overtime Worked by Full-time Employees | Average Hours Paid For: Full-time and Half Part-time Employees Combined | |
| $ | $ | $ | hours | hours | hours | |
| 1981—February | 5.92 | 8.20 | 6.03 | 36.5 | 2.0 | 38.4 |
| May | 6.14 | 8.64 | 6.26 | 36.9 | 2.0 | 38.8 |
| August | 6.41 | 8.90 | 6.52 | 37.0 | 1.9 | 38.7 |
| November | 6.56 | 9.10 | 6.68 | 36.9 | 2.1 | 38.8 |
| 1982—February | 6.80 | 9.56 | 7.01 | 36.7 | 2.1 | 38.6 |
| May | 7.20 | 10.05 | 7.34 | 37.0 | 2.1 | 38.9 |
| August | 7.20 | 9.93 | 7.32 | 37.0 | 1.8 | 38.7 |
| November | 7.27 | 9.95 | 7.39 | 37.0 | 2.0 | 38.8 |
| 1983—February | 7.38 | .10.18 | 7.51 | 37.2 | 2.0 | 39.0 |
| May | 7.42 | 10.18 | 7.55 | 37.0 | 2.0 | 38.8 |
| August | 7.37 | 10.01 | 7.49 | 37.1 | 1.9 | 38.8 |
| November | 7.42 | 9.93 | 7.55 | 37.0 | 2.2 | 39.0 |
| 1984—February | 7.50 | 10.09 | 7.65 | 37.2 | 2.4 | 39.4 |
In the preceding table all industries are combined. A dissection by industry groups is available from the annual employment survey made each February, but not from the sample surveys made later in the year. The following table relates to the February 1984 survey.
| Industrial Group | Average Hourly Earnings For All Workers Covered by Annual Survey | Average Weekly Hours Paid For: All Workers Covered by Annual Survey | ||||
|---|---|---|---|---|---|---|
| Ordinary Time | Overtime | Ordinary Time and Overtime Combined | Ordinary Time: (Full-time and Half Part-time Employees) | Overtime: (Full-time Employees) | Average Hours Paid For: (Full-time and Half Part-time Employees) | |
| $ | $ | $ | hours | hours | hours | |
| Forestry and logging | 7.36 | 9.08 | 7.48 | 38.4 | 2.8 | 41.2 |
| Mining and quarrying | 8.75 | 10.57 | 9.00 | 36.2 | 5.9 | 42.0 |
| Manufacturing— | ||||||
| Seasonal food processing | 9.40 | 11.26 | 9.64 | 35.1 | 5.2 | 40.2 |
| Other food, beverages and tobacco | 6.47 | 9.27 | 6.76 | 37.2 | 4.5 | 41.4 |
| Textiles, clothing and leather | 5.82 | 8.55 | 5.97 | 37.4 | 2.2 | 39.5 |
| Wood and wood products | 6.62 | 9.57 | 6.85 | 37.9 | 3.4 | 41.2 |
| Paper and paper products, printing and publishing | 8.21 | 11.83 | 8.54 | 36.8 | 3.9 | 40.5 |
| Chemicals, petroleum, rubber, and plastics | 7.63 | 9.94 | 7.83 | 37.8 | 3.6 | 41.3 |
| Non-metallic mineral products | 7.02 | 9.88 | 7.33 | 36.9 | 4.5 | 41.3 |
| Metal products and engineering | 7.11 | 10.17 | 7.39 | 37.7 | 3.9 | 41.5 |
| Machinery (except electrical) | 7.01 | 10.03 | 7.22 | 37.9 | 3.0 | 40.8 |
| Electrical machinery and equipment | 6.60 | 9.20 | 6.76 | 38.1 | 2.5 | 40.5 |
| Transport equipment | 7.31 | 10.98 | 7.56 | 38.0 | 2.8 | 40.7 |
| Other manufacturing | 6.16 | 8.96 | 6.24 | 37.7 | 1.3 | 38.9 |
| Subtotal, manufacturing | 7.40 | 10.39 | 7.66 | 37.1 | 3.7 | 40.6 |
| Electricity, gas, and water | 8.08 | 11.56 | 8.31 | 38.3 | 2.8 | 41.0 |
| Construction | 7.19 | 9.81 | 7.44 | 38.7 | 4.1 | 42.7 |
| Wholesale, retail, etc.— | ||||||
| Wholesale trade | 7.44 | 9.36 | 7.51 | 38.1 | 1.3 | 39.4 |
| Retail trade | 5.67 | 7.89 | 5.79 | 35.9 | 2.4 | 37.8 |
| Restaurants, hotels, etc. | 5.86 | 7.93 | 5.94 | 32.7 | 2.3 | 33.9 |
| Subtotal, wholesale, retail, etc. | 6.34 | 8.30 | 6.42 | 36.0 | 2.0 | 37.6 |
| Transport and communication— | ||||||
| Transport and storage (excl. seasonal) | 7.76 | 10.73 | 8.10 | 38.3 | 5.1 | 43.2 |
| Seasonal storage and warehousing | 6.16 | 8.74 | 6.40 | 37.8 | 3.9 | 41.7 |
| Communication | 7.38 | 10.96 | 7.51 | 39.3 | 1.6 | 40.9 |
| Subtotal, transport, etc. | 7.56 | 10.73 | 7.83 | 38.7 | 3.7 | 42.2 |
| Financing, insurance, etc.— | ||||||
| Finance | 7.66 | 9.69 | 7.69 | 37.3 | 0.6 | 37.9 |
| Insurance | 8.05 | 10.78 | 8.06 | 37.7 | 0.1 | 37.8 |
| Real estate and business services | 8.13 | 10.06 | 8.17 | 36.3 | 0.8 | 37.1 |
| Subtotal, financing, etc. | 7.94 | 9.95 | 7.97 | 36.9 | 0.6 | 37.5 |
| Community and personal services— | ||||||
| Public administration and defence | 8.48 | 11.13 | 8.54 | 37.8 | 0.9 | 38.7 |
| Sanitary services, etc. | 6.10 | 9.00 | 6.21 | 31.9 | 2.8 | 33.1 |
| Education services | 9.49 | 8.42 | 9.48 | 36.9 | 0.1 | 37.0 |
| Research and scientific institutes | 10.07 | 13.55 | 10.11 | 37.6 | 0.5 | 38.1 |
| Health services | 8.20 | 10.29 | 8.24 | 38.4 | 0.8 | 39.0 |
| Other community services | 7.28 | 9.41 | 7.30 | 36.4 | 0.5 | 36.7 |
| Recreational and cultural services | 7.90 | 11.17 | 8.04 | 35.0 | 2.0 | 36.6 |
| Personal and household services | 5.83 | 8.73 | 5.95 | 37.9 | 1.7 | 39.5 |
| Subtotal, services | 8.20 | 10.10 | 8.24 | 37.4 | 0.8 | 38.1 |
| Total, all surveyed industries | 7.50 | 10.09 | 7.65 | 37.2 | 2.4 | 39.4 |
REAL DISPOSABLE INCOME MEASURES—In December 1982, 3 new series of quarterly indexes were introduced to measure the impact of changes in the levels of taxation and consumer prices on the purchasing power of various income groups.
The index series are:
Ratio of Disposable to Gross Income Index—An index which measures the changing level of average gross income remaining after personal income tax.
Average Gross Income Index—An index which measures the changing level of gross income in current dollar terms.
Real Disposable Income Index—An index which measures the changing level of after-tax income in constant dollar terms thereby measuring the ability to purchase goods and services with gross income.
The following table and graph show the effects of the August 1982 budget taxation changes on the spending power of full-time wage and salary earners in various income groups. Full-time wage and salary earners are defined as those working 30 or more hours per week, and whose total income is predominantly for wages or salary
The base of the index numbers is for the year ended March 1981 (= 1000).
| Period | Ratio of Disposable to Gross Income Index* | Annual Percentage Change | Average Gross Income Index* | Annual Percentage Change | Real Disposable Income Index†‡ | Annual Percentage Change |
|---|---|---|---|---|---|---|
* Gross income from all sources. †In dollars of constant (1980–81) purchasing power with respect to the regimen of the Consumers Price Index. ‡Balance of gross income after personal income tax liability is de ducted. §Lowest 20 percent of income distribution of full-time wage and salary earners. || Provisional. ¶Third lowest 20 percent of income distribution of full-time wage and salary earners. ** Highest 20 percent of income distribution of full-time wage and salary earners. | ||||||
| Lowest Income Groups§ | ||||||
| 1982—Mar | 979 | −2.1 | 1262 | 17.0 | 1015 | −1.2 |
| Jun | 971 | −2.4 | 1326 | 17.2 | 1008 | −2.1 |
| Sep | 973 | −1.6 | 1319 | 12.1 | 970 | −5.5 |
| Dec | 979 | −0.6 | 1338 | 10.7 | 964 | −4.6 |
| 1983—Mar | 976 | −0.3 | 1363 | 8.0 | 971 | −4.3 |
| Jun | 976 | 0.5 | 1365 | 2.9 | 964 | −4.4 |
| Sep | 977 | 0.4 | 1353 | 2.6 | 948 | −2.3 |
| Dec | 980 | 0.1 | 1374 | 2.7 | 957 | −0.7 |
| 1984—Mar|| | 977 | 0.1 | 1404 | 3.0 | 967 | −0.4 |
| Middle Income Groups¶ | ||||||
| 1982—Mar | 964 | −3.2 | 1269 | 16.9 | 1006x | −2.2 |
| Jun | 949 | −4.2 | 1337 | 17.6 | 994 | −3.7 |
| Sep | 953 | −3.0 | 1324 | 11.9 | 954 | −6.7 |
| Dec | 982 | 0.7 | 1346 | 10.7 | 973 | −3.3 |
| 1983—Mar | 979 | 1.6 | 1372 | 8.1 | 980 | −2.6 |
| Jun | 981 | 3.4 | 1371 | 2.5 | 972 | −2.2 |
| Sep | 982 | 3.0 | 1357 | 2.5 | 956 | 0.2 |
| Dec | 987 | 0.5 | 1379 | 2.5 | 967 | −0.6 |
| 1984—Mar|| | 981 | 0.2 | 1412 | 2.9 | 977 | −0.3 |
| Highest Income Groups** | ||||||
| 1982—Mar | 947 | −4.9 | 1271 | 17.3 | 989x | −3.8x |
| Jun | 930 | −5.2 | 1344 | 18.0 | 979 | −4.3 |
| Sep | 933 | −3.7 | 1332 | 12.6 | 939x | −7.1x |
| Dec | 1071 | 11.6 | 1356 | 11.3 | 1069 | 7.8 |
| 1983—Mar | 1066 | 12.6 | 1385 | 9.0 | 1077 | 8.9 |
| Jun | 1071 | 15.2 | 1382 | 2.8 | 1070 | 9.3 |
| Sep | 1074 | 15.1 | 1367 | 2.6 | 1053 | 12.1 |
| Dec | 1066 | −0.5 | 1389 | 2.4 | 1052 | −1.6 |
| 1984—Mar|| | 1060 | −0.6 | 1425 | 2.9 | 1066 | −1.0 |
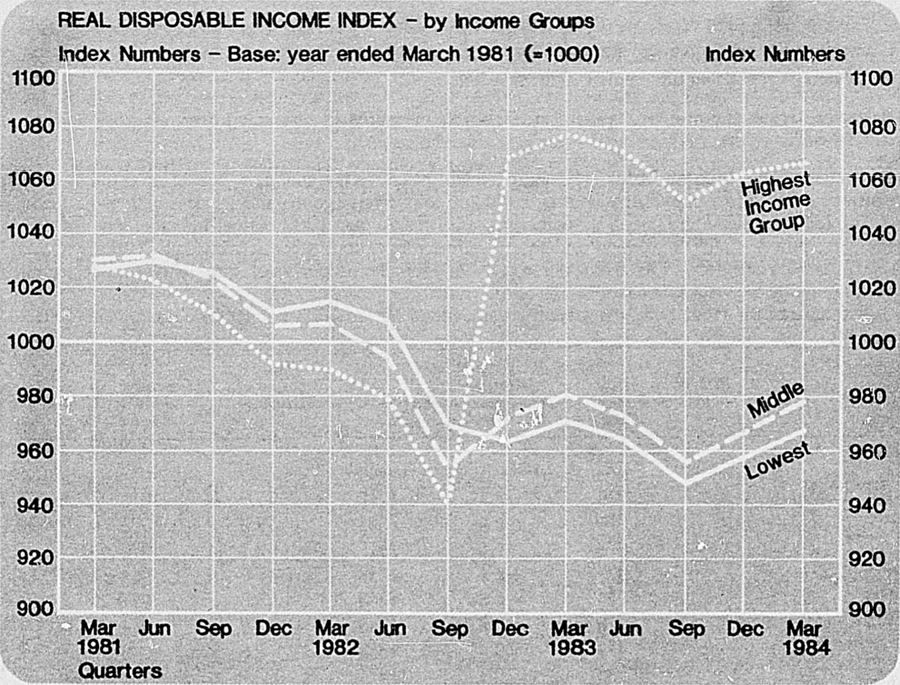
NOMINAL WEEKLY WAGE RATES INDEX—The Nominal Weekly Wage Rates Index, which is shown in the following table, represents the movements in all minimum or mandatory rates of pay fixed by, or within the jurisdiction of, the Arbitration Court, or any special industrial tribunal, or determined from time to time by some statutory authority. It covers all adult male and female employees. In selecting the occupations to be used for measuring wage and salary rate changes regard has been paid to all significant awards, agreements and determinations and the more important occupations (from the point of view of numbers employed) described by these documents. The index covers 284 awards and agreements within the jurisdiction of the Arbitration Court (Part 1 of the Index) with 461 selected occupations from these awards and agreements. For other agreements and determinations within the jurisdiction of other industrial tribunals and determining authorities (Part 2 of the Index) 210 occupations have been selected.
The awards and agreements used in Part 1 define only the legal minimum rates of pay, although in many cases, particularly with industrial agreements, these are the rates actually paid. On the other hand most of the rates used in Part 2 are normally mandatory. (A series of wage rate indexes following this Nominal Weekly Wage Rates Index is based on prevailing or actual rates of pay.)
The following factors were taken into account in selecting the representative awards and agreements:
The numbers of workers covered by the respective awards and agreements. All of the more important awards and agreements—so far as numbers of workers covered are concerned—are included in the index;
The industrial coverage. The selection of awards and agreements appropriate for the various narrowly defined industry groups ensures that each industry is represented by its own award or agreement, or that for a closely related industry; and
The geographic coverage. Not all district awards or agreements could be used but a balanced representation of the major industrial districts was obtained.
The following table shows the industry and occupation grouping of the index. The industry grouping conforms to the production groups of the New Zealand System of National Accounts, and the occupation groups are major groups of the New Zealand Standard Classification of Occupations.
The use of standard production groups means that the classification is consistent with National Accounts, the Producers Price Index, and the series of integrated economic censuses.
The index is calculated for rates effective at mid-quarter.
NOTE: Index numbers in the following table were correct at the time of entry but, because of the possible incorporation of retrospective increases in wage and salary rates in awards, collective agreements, and determinations, they may be subject to later revisions. They may be checked against the appropriate table in the latest Monthly Abstract of Statistics.
| INDEX NUMBERS OF NOMINAL WEEKLY WAGE RATES—ADULT EMPLOYEES* | ||||||
|---|---|---|---|---|---|---|
| Base: For each group, average rates ruling for December Quarter 1977 (= 1000) | ||||||
| Group | Dec Quarter 1977 | 1983 | Dec Year 1983 | |||
| Mar Quarter | Jun Quarter | Sep Quarter | Dec Quarter | |||
* Comparisons of the index numbers for one grouping of rates with those for other groupings indicate relative movements in average rates in the different groups, not relative levels of average rates of wages and salaries. Because of possible retrospective increases in the wage or salary rates in forthcoming awards, collective agreements or determinations, etc., the more recent index numbers should be treated as provisional. †These indexes measure changes in the minimum rates of wages or salaries in awards and collective agreements of the Arbitration Court (formerly the Industrial Commission). ‡Derived in each case by dividing the Nominal Weekly Wage Rates Index number by the corresponding Consumers Price Index number and multiplying by 1000. The index is designed as a measure of relevance to the wage payer, as one form of a Gross Nominal Wage Rate Index in constant dollars. | ||||||
| Part 1—Rates within the Jurisdiction of the Arbitration Court† | ||||||
| Industry Group | ||||||
| Agriculture | 1000 | 2072 | 2072 | 2072 | 2072 | 2072 |
| Fishing and hunting | 1000 | 2139 | 2139 | 2139 | 2139 | 2139 |
| Forestry and logging | 1000 | 2028 | 2028 | 2028 | 2028 | 2028 |
| Mining and quarrying | 1000 | 2021 | 2021 | 2021 | 2021 | 2021 |
| Food, beverages, and tobacco | 1000 | 2099 | 2099 | 2099 | 2099 | 2099 |
| Textiles, apparel, and leather | 1000 | 2005 | 2005 | 2005 | 2005 | 2005 |
| Wood and wood products | 1000 | 2021 | 2021 | 2021 | 2021 | 2021 |
| Paper, printing, and publishing | 1000 | 2041 | 2041 | 2041 | 2041 | 2041 |
| Chemicals, petroleum, and plastics | 1000 | 1989 | 1989 | 1989 | 1989 | 1989 |
| Non-metallic mineral products | 1000 | 2054 | 2054 | 2054 | 2054 | 2054 |
| Basic metals | 1000 | 2006 | 2006 | 2006 | 2006 | 2006 |
| Machinery and metal products | 1000 | 1936 | 1936 | 1936 | 1936 | 1936 |
| Other manufacturing | 1000 | 2200 | 2200 | 2200 | 2200 | 2200 |
| Electricity, gas, and water | 1000 | 1990 | 1990 | 1990 | 1990 | 1990 |
| Construction | 1000 | 2016 | 2016 | 2016 | 2016 | 2016 |
| Trade, restaurants, and hotels | 1000 | 2053 | 2053 | 2053 | 2053 | 2053 |
| Transport and storage | 1000 | 2066 | 2066 | 2066 | 2066 | 2066 |
| Communication | 1000 | |||||
| Insurance and financing | 1000 | 2008 | 2008 | 2008 | 2008 | 2008 |
| Community and personal services | 1000 | 1986 | 1986 | 1986 | 1986 | 1986 |
| Central Government | 1000 | 2067 | 2067 | 2067 | 2067 | 2067 |
| Local Government | 1000 | 1959 | 1959 | 1959 | 1959 | 1959 |
| Private non-profit services | 1000 | 2103 | 2103 | 2103 | 2103 | 2103 |
| All industries combined | 1000 | 2026 | 2026 | 2026 | 2026 | 2026 |
| Occupation Group | ||||||
| Professional, technical, and related workers | 1000 | 2044 | 2044 | 2044 | 2044 | 2044 |
| Administrative and managerial | 1000 | 2009 | 2009 | 2009 | 2009 | 2009 |
| Clerical and related workers | 1000 | 2043 | 2043 | 2043 | 2043 | 2043 |
| Sales workers | 1000 | 2031 | 2031 | 2031 | 2031 | 2031 |
| Service workers | 1000 | 2084 | 2084 | 2084 | 2084 | 2084 |
| Agriculture, forestry, and fishing | 1000 | 2075 | 2075 | 2075 | 2075 | 2075 |
| Production and transport | 1000 | 2007 | 2007 | 2007 | 2007 | 2007 |
| All occupations combined | 1000 | 2026 | 2026 | 2026 | 2026 | 2026 |
| Real Compensation of Employees Index‡ | 1000 | 1011 | 1011 | 993 | 984 | 997 |
| Part 2—Rates Prescribed by Other Industrial Tribunals or Determining Authorities† | ||||||
| Industry Group | ||||||
| Agriculture | 1000 | 1816 | 1816 | 1816 | 1816 | 1816 |
| Fishing and hunting | 1000 | |||||
| Forestry and logging | 1000 | 1906 | 1906 | 1906 | 1906 | 1906 |
| Mining and quarrying | 1000 | 1870 | 1870 | 1870 | 1870 | 1870 |
| Food, beverages, and tobacco | 1000 | |||||
| Textiles, apparel, and leather | 1000 | |||||
| Wood and wood products | 1000 | 1852 | 1852 | 1852 | 1852 | 1852 |
| Paper, printing, and publishing | 1000 | 1891 | 1891 | 1891 | 1891 | 1891 |
| Chemicals, petroleum, and plastics | 1000 | 1963 | 1963 | 1963 | 1963 | 1963 |
| Non-metallic mineral products | 1000 | |||||
| Basic metals | 1000 | |||||
| Machinery and metal products | 1000 | 1934 | 1934 | 1934 | 1934 | 1934 |
| Other manufacturing | 1000 | |||||
| Electricity, gas, and water | 1000 | 1874 | 1874 | 1874 | 1874 | 1874 |
| Construction | 1000 | 1901 | 1901 | 1901 | 1901 | 1901 |
| Trade, restaurants, and hotels | 1000 | 1887 | 1887 | 1887 | 1887 | 1887 |
| Transport and storage | 1000 | 1956 | 1956 | 1956 | 1956 | 1956 |
| Communication | 1000 | 1849 | 1849 | 1849 | 1849 | 1849 |
| Insurance and financing | 1000 | 1838 | 1838 | 1838 | 1838 | 1838 |
| Community and personal services | 1000 | 1861 | 1861 | 1861 | 1861 | 1861 |
| Central Government | 1000 | 1882 | 1882 | 1882 | 1882 | 1882 |
| Local Government | 1000 | |||||
| Private non-profit services | 1000 | |||||
| All industries combined | 1000 | 1885 | 1885 | 1885 | 1885 | 1885 |
| Occupation Group | ||||||
| Professional, technical, and related workers | 1000 | 1877 | 1877 | 1877 | 1877 | 1877 |
| Administrative and managerial | 1000 | 1860 | 1860 | 1860 | 1860 | 1860 |
| Clerical and related workers | 1000 | 1836 | 1836 | 1836 | 1836 | 1836 |
| Sales workers | 1000 | 1923 | 1923 | 1923 | 1923 | 1923 |
| Service workers | 1000 | 1957 | 1957 | 1957 | 1957 | 1957 |
| Agriculture, forestry, and fishing | 1000 | 1866 | 1866 | 1866 | 1866 | 1866 |
| Production and transport | 1000 | 1953 | 1953 | 1953 | 1953 | 1953 |
| All occupations combined | 1000 | 1885 | 1885 | 1885 | 1885 | 1885 |
| Real Compensation of Employees Index‡ | 1000 | 941 | 932 | 924 | 915 | 928 |
| Part 3—Rates Within the Jurisdiction of all Determining Authorities† | ||||||
| Industry Group | ||||||
| Agriculture | 1000 | 2067 | 2067 | 2067 | 2067 | 2067 |
| Fishing and hunting | 1000 | 2139 | 2139 | 2139 | 2139 | 2139 |
| Forestry and logging | 1000 | 1964 | 1964 | 1964 | 1964 | 1964 |
| Mining and quarrying | 1000 | 1939 | 1939 | 1939 | 1939 | 1939 |
| Food, beverages, and tobacco | 1000 | 2099 | 2099 | 2099 | 2099 | 2099 |
| Textiles, apparel, and leather | 1000 | 2005 | 2005 | 2005 | 2005 | 2005 |
| Wood and wood products | 1000 | 2018 | 2018 | 2018 | 2018 | 2018 |
| Paper, printing, and publishing | 1000 | 2033 | 2033 | 2033 | 2033 | 2033 |
| Chemicals, petroleum, and plastics | 1000 | 1989 | 1989 | 1989 | 1989 | 1989 |
| Non-metallic mineral products | 1000 | 2054 | 2054 | 2054 | 2054 | 2054 |
| Basic metals | 1000 | 2006 | 2006 | 2006 | 2006 | 2006 |
| Machinery and metal products | 1000 | 1936 | 1936 | 1936 | 1936 | 1936 |
| Other manufacturing | 1000 | 2200 | 2200 | 2200 | 2200 | 2200 |
| Electricity, gas, and water | 1000 | 1957 | 1957 | 1957 | 1957 | 1957 |
| Construction | 1000 | 1982 | 1982 | 1982 | 1982 | 1982 |
| Trade, restaurants, and hotels | 1000 | 2052 | 2052 | 2052 | 2052 | 2052 |
| Transport and storage | 1000 | 2015 | 2015 | 2015 | 2015 | 2015 |
| Communication | 1000 | 1849 | 1849 | 1849 | 1849 | 1849 |
| Insurance and financing | 1000 | 1968 | 1968 | 1968 | 1968 | 1968 |
| Community and personal services | 1000 | 1966 | 1966 | 1966 | 1966 | 1966 |
| Central Government | 1000 | 1892 | 1892 | 1892 | 1892 | 1892 |
| Local Government | 1000 | 1959 | 1959 | 1959 | 1959 | 1959 |
| Private non-profit services | 1000 | 2103 | 2103 | 2103 | 2103 | 2103 |
| All industries combined | 1000 | 1974 | 1974 | 1974 | 1974 | 1974 |
| Occupation Group | ||||||
| Professional, technical, and related workers | 1000 | 1899 | 1899 | 1899 | 1899 | 1899 |
| Administrative and managerial | 1000 | 1909 | 1909 | 1909 | 1909 | 1909 |
| Clerical and related workers | 1000 | 1952 | 1952 | 1952 | 1952 | 1952 |
| Sales workers | 1000 | 2027 | 2027 | 2027 | 2027 | 2027 |
| Service workers | 1000 | 2040 | 2040 | 2040 | 2040 | 2040 |
| Agriculture, forestry, and fishing | 1000 | 2038 | 2038 | 2038 | 2038 | 2038 |
| Production and transport | 1000 | 1999 | 1999 | 1999 | 1999 | 1999 |
| All occupations combined | 1000 | 1974 | 1974 | 1974 | 1974 | 1974 |
| Real Compensation of Employees Index‡ | 1000 | 985 | 976 | 968 | 959 | 972 |
PREVAILING WEEKLY WAGE RATES INDEX—A new series of wage rate indexes was released by the Department of Statistics in March 1980. Known as the Prevailing Weekly Wage Rates Index, this series measures the movements in the overall level of prevailing or actual rates of pay for all adult employees whose minimum or mandatory rates of pay are fixed by or within the jurisdiction of the Arbitration Court or any special industrial tribunal, or determined from time to time by some statutory authority, and includes house agreements registered with the Court.
This index has the same weighting pattern and coverage of awards and agreements as the Nominal Weekly Wage Rates Index (see previous pages). It is possible, therefore, to compare the 2 series so as to measure “wage drift”.
Part 2 of the Prevailing Weekly Wage Rates index is identical with part 2 of the Nominal Weekly Wage Rates Index.
The payrates surveyed for the index are those actually paid to the employees engaged in the nominated positions and are measured at the payday for the period which includes the 15th day of the mid-month of the quarter.
The Effective Prevailing Wage Rates Index (index of effective rates) adjusts the Prevailing Weekly Wage Rates Index for the movements in the consumer price levels. This index is derived by dividing the Prevailing Wage Index for each quarter by the corresponding Consumers Price Index, and multiplying by 1000.
Like the Nominal Weekly Wage Rates Index, the Prevailing Weekly Wage Rates Indexes for more recent quarters are subject to later revision resulting from any backdating of awards, agreements, and determinations.
| INDEX NUMBERS OF PREVAILING WAGE RATES—ADULT EMPLOYEES* | ||||||
|---|---|---|---|---|---|---|
| Base: For each group, average rates prevailing for December Quarter 1977 (= 1000) | ||||||
| Group | 1977 | 1983 | Dec Year 1983 | |||
| Dec Quarter | Mar Quarter | Jun Quarter | Sep Quarter | Dec Quarter | ||
* Comparisons of index numbers for one grouping of rates with those for other groupings indicate relative movements in average rates in the different groups, not relative levels of average rates of wages and salaries. Because of possible retrospective increases in wage or salary rates in forthcoming awards, collective agreements, or determinates, the more recent index numbers should be treated as provisional. †This index measures changes in the overall level of prevailing or actual rates of pay of all adult employees within the jurisdiction of all wage and salary determining authorities, and as such combines parts 1 and 2 of this table. ‡Derived in each case by dividing the Prevailing Weekly Wage Rates Index number by the Corresponding Consumers' Price Index number and multiplying by 1000. The index is designed as a measure of relevance to the wage-payer, as one form of a Gross Prevailing Wage Rates Index in constant dollars. | ||||||
| Part 1—Rates within the Jurisdiction of the Arbitration Court† | ||||||
| Industry Group | ||||||
| Agriculture | 1000 | 2123 | 2140 | 2105 | 2122 | 2122 |
| Fishing and hunting | 1000 | 2001 | 2001 | 1991 | 1991 | 1996 |
| Forestry and logging | 1000 | 2028 | 2020 | 2043 | 2042 | 2033 |
| Mining and quarrying | 1000 | 2077 | 2079 | 2077 | 2071 | 2076 |
| Food, beverages, and tobacco | 1000 | 2020 | 2019 | 2017 | 2014 | 2018 |
| Textiles, apparel, and leather | 1000 | 2030 | 2027 | 2025 | 2023 | 2026 |
| Wood and wood products | 1000 | 2047 | 2046 | 2057 | 2055 | 2051 |
| Paper, printing, and publishing | 1000 | 2079 | 2079 | 2101 | 2097 | 2089 |
| Chemicals, petroleum and plastics | 1000 | 2044 | 2044 | 2044 | 2051 | 2046 |
| Non-metallic mineral products | 1000 | 2137 | 2137 | 2137 | 2133 | 2136 |
| Basic metals | 1000 | 2065 | 2067 | 2068 | 2066 | 2066 |
| Machinery and metal products | 1000 | 2041 | 2043 | 2046 | 2044 | 2044 |
| Other manufacturing | 1000 | 2101 | 2101 | 2101 | 2095 | 2100 |
| Electricity, gas, and water | 1000 | 2005 | 2005 | 2005 | 2004 | 2005 |
| Construction | 1000 | 2068 | 2068 | 2068 | 2065 | 2067 |
| Trade, restaurants, and hotels | 1000 | 2075 | 2074 | 2075 | 2071 | 2074 |
| Transport and storage | 1000 | 2076 | 2076 | 2078 | 2074 | 2076 |
| Communication | 1000 | |||||
| Insurance and financing | 1000 | 2010 | 2016 | 2012 | 2015 | 2013 |
| Community and personal services | 1000 | 2036 | 2036 | 2034 | 2036 | 2036 |
| Central Government | 1000 | 2092 | 2092 | 2093 | 2091 | 2092 |
| Local Government | 1000 | 1963 | 1963 | 1964 | 1963 | 1963 |
| Private non-profit services | 1000 | 2143 | 2143 | 2144 | 2146 | 2144 |
| All industries combined | 1000 | 2053 | 2054 | 2054 | 2053 | 2054 |
| Occupation Group | ||||||
| Professional, technical, and related workers | 1000 | 2086 | 2093 | 2086 | 2088 | 2088 |
| Administrative and managerial | 1000 | 2025 | 2024 | 2024 | 2025 | 2024 |
| Clerical and related workers | 1000 | 2062 | 2062 | 2066 | 2058 | 2062 |
| Sales workers | 1000 | 2029 | 2026 | 2030 | 2025 | 2028 |
| Service workers | 1000 | 2110 | 2110 | 2111 | 2117 | 2112 |
| Agriculture, forestry, and fishing | 1000 | 2113 | 2129 | 2099 | 2114 | 2114 |
| Production and transport | 1000 | 2040 | 2039 | 2040 | 2039 | 2040 |
| All occupations combined | 1000 | 2053 | 2054 | 2054 | 2053 | 2054 |
| Real Compensation of Employees Index—All Groups‡ | 1000 | 1024 | 1015 | 1007 | 997 | 1011 |
| Part 2—Rates Prescribed by Other Industrial Tribunals or Determining Authorities† | ||||||
| Industry Group | ||||||
| Agriculture | 1000 | 1816 | 1816 | 1816 | 1816 | 1816 |
| Fishing and hunting | 1000 | |||||
| Forestry and logging | 1000 | 1906 | 1906 | 1906 | 1906 | 1906 |
| Mining and quarrying | 1000 | 1870 | 1870 | 1870 | 1870 | 1870 |
| Foods, beverages, and tobacco | 1000 | |||||
| Textiles, apparel, and leather | 1000 | |||||
| Wood and wood products | 1000 | 1852 | 1852 | 1852 | 1852 | 1852 |
| Paper, printing, and publishing | 1000 | 1891 | 1891 | 1891 | 1891 | 1891 |
| Chemicals, petroleum, and plastics | 1000 | 1963 | 1963 | 1963 | 1963 | 1963 |
| Non-metallic mineral products | 1000 | |||||
| Basic metals | 1000 | |||||
| Machinery and metal products | 1000 | 1934 | 1934 | 1934 | 1934 | 1934 |
| Other manufacturing | 1000 | |||||
| Electricity, gas and water | 1000 | 1874 | 1874 | 1874 | 1874 | 1874 |
| Construction | 1000 | 1901 | 1901 | 1901 | 1901 | 1901 |
| Trade, restaurants and hotels | 1000 | 1887 | 1887 | 1887 | 1887 | 1887 |
| Transport and storage | 1000 | 1956 | 1956 | 1956 | 1956 | 1956 |
| Communication | 1000 | 1849 | 1849 | 1849 | 1849 | 1849 |
| Insurance and financing | 1000 | 1838 | 1838 | 1838 | 1838 | 1838 |
| Community and personal services | 1000 | 1861 | 1861 | 1861 | 1861 | 1861 |
| Central Government | 1000 | 1882 | 1882 | 1882 | 1882 | 1882 |
| Local Government | 1000 | |||||
| Private non-profit services | 1000 | |||||
| All industries combined | 1000 | 1885 | 1885 | 1885 | 1885 | 1885 |
| Occupation Group | ||||||
| Professional, technical, and related workers | 1000 | 1877 | 1877 | 1877 | 1877 | 1877 |
| Administrative and managerial | 1000 | 1860 | 1860 | 1860 | 1860 | 1860 |
| Clerical and related workers | 1000 | 1836 | 1836 | 1836 | 1836 | 1836 |
| Sales workers | 1000 | 1923 | 1923 | 1923 | 1923 | 1923 |
| Service workers | 1000 | 1957 | 1957 | 1957 | 1957 | 1957 |
| Agriculture, forestry, and fishing | 1000 | 1866 | 1866 | 1866 | 1866 | 1866 |
| Production and transport | 1000 | 1953 | 1953 | 1953 | 1953 | 1953 |
| All occupations combined | 1000 | 1885 | 1885 | 1885 | 1885 | 1885 |
| Real Compensation of Employees Index—All Groups‡ | 1000 | 941 | 932 | 924 | 915 | 928 |
| Part 3—Rates Within the Jurisdiction of all Determining Authorities† | ||||||
| Industry Group | ||||||
| Agriculture | 1000 | 2117 | 2134 | 2100 | 2116 | 2117 |
| Fishing and hunting | 1000 | 2001 | 2001 | 1991 | 1991 | 1996 |
| Forestry and logging | 1000 | 1965 | 1961 | 1972 | 1972 | 1968 |
| Mining and quarrying | 1000 | 1967 | 1968 | 1967 | 1964 | 1966 |
| Food, beverages, and tobacco | 1000 | 2020 | 2019 | 2017 | 2014 | 2018 |
| Textiles, apparel, and leather | 1000 | 2030 | 2027 | 2025 | 2023 | 2026 |
| Wood and wood products | 1000 | 2045 | 2044 | 2055 | 2052 | 2049 |
| Paper, printing, and publishing | 1000 | 2069 | 2069 | 2090 | 2086 | 2078 |
| Chemicals, petroleum, and plastics | 1000 | 2043 | 2044 | 2044 | 2051 | 2046 |
| Non-metallic mineral products | 1000 | 2137 | 2137 | 2137 | 2133 | 2136 |
| Basic metals | 1000 | 2065 | 2067 | 2068 | 2066 | 2066 |
| Machinery and metal products | 1000 | 2034 | 2036 | 2038 | 2037 | 2036 |
| Other manufacturing | 1000 | 2101 | 2101 | 2101 | 2095 | 2100 |
| Electricity, gas, and water | 1000 | 1968 | 1968 | 1968 | 1968 | 1968 |
| Construction | 1000 | 2020 | 2020 | 2020 | 2017 | 2019 |
| Trade, restaurants, and hotels | 1000 | 2074 | 2073 | 2074 | 2070 | 2073 |
| Transport and storage | 1000 | 2021 | 2020 | 2021 | 2020 | 2020 |
| Communication | 1000 | 1849 | 1849 | 1849 | 1849 | 1849 |
| Insurance and financing | 1000 | 1971 | 1975 | 1972 | 1975 | 1973 |
| Community and personal services | 1000 | 2009 | 2010 | 2008 | 2009 | 2009 |
| Central Government | 1000 | 1894 | 1894 | 1894 | 1894 | 1894 |
| Local Government | 1000 | 1963 | 1963 | 1964 | 1963 | 1963 |
| Private non-profit services | 1000 | 2145 | 2143 | 2144 | 2146 | 2144 |
| All industries combined | 1000 | 1994 | 1994 | 1994 | 1993 | 1994 |
| Occupation Group | ||||||
| Professional, technical, and related workers | 1000 | 1905 | 1906 | 1905 | 1905 | 1905 |
| Administrative and managerial | 1000 | 1915 | 1914 | 1914 | 1915 | 1914 |
| Clerical and related workers | 1000 | 1965 | 1965 | 1968 | 1963 | 1965 |
| Sales workers | 1000 | 2025 | 2023 | 2026 | 2021 | 2024 |
| Service workers | 1000 | 2057 | 2057 | 2058 | 2062 | 2058 |
| Agriculture, forestry, and fishing | 1000 | 2072 | 2085 | 2061 | 2073 | 2073 |
| Production and transport | 1000 | 2027 | 2027 | 2028 | 2027 | 2027 |
| All occupations combined | 1000 | 1994 | 1994 | 1994 | 1993 | 1994 |
| Real Compensation of Employees Index—All Groups‡ | 1000 | 995 | 986 | 977 | 968 | 982 |
EFFECTIVE WEEKLY WAGE RATES—Except for one line, (the Index of Effective Rates), at the foot of each table, the index numbers quoted in the foregoing tables relate to nominal and prevailing weekly wage rates only. They are based on actual or equivalent money rates without any allowance being made for changes, during the period under review, in the prices of those goods and services which are purchased out of wages earned. It is obvious that this factor is of considerable importance, for a rise in wage rates may be offset by a fall in the purchasing power of the monetary unit, while, on the other hand, a fall in money wages may be offset by a rise in the purchasing power of money. Index numbers of effective (or “real”) wage rates are arrived at by dividing the index numbers of nominal or effective wage rates by the corresponding all-groups index numbers of consumer prices (both series of index numbers having first been set on a common time base) and multiplying the result by the base value of 1000.
The following table accordingly shows a comparison of nominal, prevailing, and effective weekly wage rates together with the Consumers Price Index for the year ended December.
The base of the index numbers is in each case December Quarter 1977 (= 1000).
| Year | Consumer Prices (All Groups) | Nominal Weekly Wage Rates—Adults* | Prevailing Weekly Wage Rates—Adult Employees | ||
|---|---|---|---|---|---|
| Actual | Effective | Actual | Effective | ||
| * Prior to 1978 refers to adult males only. | |||||
| 1974 | 618 | 657 | 1063 | ||
| 1975 | 708 | 747 | 1055 | ||
| 1976 | 828 | 835 | 1008 | ||
| 1977 | 947 | 949 | 1002 | ||
| 1978 | 1060 | 1077 | 1016 | 1082 | 1021 |
| 1979 | 1206 | 1246x | 1034x | 1254x | 1040x |
| 1980 | 1412 | 1474x | 1044x | 1486 | 1052 |
| 1981 | 1629 | 1760x | 1080x | 1772x | 1087x |
| 1982 | 1892 | 1968x | 1041x | 1986x | 1051 |
| 1983 | 2031 | 1974 | 972 | 1994 | 982 |
The continuous index of consumer prices required for the foregoing table has been obtained by linking together the successive series of the Consumers Price Index and converting the whole to the base: December Quarter 1977 (= 1000).
In making use of these results it should not be overlooked that the index numbers of nominal rates apply only to full-time employment at award or mandatory rates of pay. They do not take into account either, on the one hand, above-award rates or overtime earnings, or on the other, short-time deductions. The index numbers of prevailing weekly wage rates, on the other hand, are based on the actual rates of pay of employees in the nominated positions. The Consumer Prices Index numbers do not take cognisance of all classes of household expenditure. For example, income tax, charitable and other gifts, and domestic help are omitted (see section 24).
MINIMUM WAGE RATES—Enforceable minimum wage rates are determined under various statutes, the most universally applicable being the Minimum Wage Act 1945. This Act provides that workers of 20 years of age and upwards must receive not less than the rates prescribed under the Act. In the great majority of cases, however, workers are subject to wage orders, awards, or industrial agreements relating to the particular industries in which they are employed and which provide somewhat higher enforceable minimum rates.
As from 11 June 1981 the minimum rates for all workers (male or female) became $2.14 an hour if paid by the hour or on piecework, $16.86 a day if paid by the day and $84.17 plus $8 cost of living increase a week in other cases. (On and after 1 April 1977, minimum rates for female workers became the same as for males.)
FARM EMPLOYEES—The following table shows the salaries and wages of paid employees on farms during the year ended June 1982. The total of 23 374 paid permanent full-time employees was made up of 20 504 males and 2870 females. Paid permanent part-time employees consisted 3227 males and 4251 females, and paid casual employees of 5363 males and 3682 females.
| Farm Type* | Number of Permanent Full-time Employees | Number of Permanent Part-time Employees | Number of Casual Employees | Total Salaries and Wages Paid |
|---|---|---|---|---|
| At 30 June 1982 | ||||
| * For fuller definitions of farm types see footnotes to Farm Type tables in Section 15A Farming: General Survey. | ||||
| $(000) | ||||
| Dairy farming: factory supply | 2,208 | 999 | 466 | 43,251 |
| Dairy farming: town supply | 528 | 177 | 99 | 9,556 |
| Sheep farming | 4,882 | 2,043 | 2,026 | 91,937 |
| Beef farming | 363 | 230 | 106 | 6,841 |
| Pig farming | 180 | 53 | 26 | 3,062 |
| Cropping | 156 | 87 | 90 | 3,304 |
| Dairy farming with sheep | 81 | 23 | 35 | 1,824 |
| Dairy farming with beef | 176 | 99 | 36 | 2,968 |
| Dairy farming with other | 178 | 80 | 44 | 3,317 |
| Sheep farming with dairy | 65 | 6 | 8 | 980 |
| Sheep farming beef | 3,836 | 890 | 1,115 | 59,070 |
| Sheep farming with cropping | 294 | 166 | 118 | 5,718 |
| Sheep farming with other | 214 | 78 | 59 | 3,562 |
| Beef farming with dairy | 16 | 5 | 4 | 248 |
| Beef farming with sheep | 489 | 116 | 140 | 7,724 |
| Beef farming with other | 45 | 23 | 17 | 789 |
| Cropping with sheep | 211 | 105 | 104 | 3,546 |
| Cropping with other | 35 | 35 | 91 | 948 |
| Pig farming with other | 73 | 16 | 13 | 1,118 |
| Stud horse breeding | 228 | 52 | 22 | 2,953 |
| Mixed livestock | 822 | 245 | 231 | 14,692 |
| Broiler chicken production | 20 | 29 | 7 | 518 |
| Poultry farming | 341 | 383 | 82 | 6,334 |
| Deer farming | 49 | 26 | 6 | 983 |
| Bee keeping | 8 | 1 | 3 | 109 |
| Market gardening | 657 | 349 | 699 | 15,908 |
| Orchards (includes citrus) | 949 | 311 | 1,021 | 24,629 |
| Hop growing | 14 | 1 | – | 330 |
| Tobacco growing | 62 | 27 | 78 | 1,525 |
| Nurseries | 1,191 | 244 | 350 | 18,206 |
| Mushroom growing | 36 | 118 | 12 | 1,121 |
| Plantations | 3,818 | 59 | 248 | 59,777 |
| Goat farming | 6 | 4 | 4 | 88 |
| Grape growing | 352 | 103 | 582 | 5,947 |
| Berryfruit growing | 46 | 46 | 301 | 2,494 |
| Flower growing | 38 | 21 | 31 | 890 |
| Other fruit and vegetables | 380 | 121 | 572 | 7,799 |
| Other | 283 | 105 | 201 | 6,263 |
| Idle land | 44 | 2 | – | 528 |
| Total, all farm types | 23 374 | 7 478 | 9 045 | 420,857 |
FURTHER INFORMATION—Further information on wages will be found in the following publications:
Prices, Wages, and Labour: Pt. B. Wages and Labour—Department of Statistics (annual).
Monthly Abstract of Statistics—Department of Statistics.
Labour and Employment Gazette—Department of Labour (quarterly).
Report of the Department of Labour (Parl. paper G. 1).
The rules underlying the New Zealand system of industrial relations have traditionally been embodied in legislation. In the private sector, statutes confer bargaining rights on certain registered/recognised organisations and specify various procedures for the conduct of negotiations. Various institutions are also available to assist the parties in resolving their differences.
The main body of rules covering industrial relations in the private sector is contained in the Industrial Relations Act 1973. By a process of registration, unions secure bargaining rights for the class of workers they represent, and also access to various procedures for the settlement of disputes associated with the renegotiation of the collective agreement (disputes of interest) and its subsequent application (disputes of right).
In the case of disputes of interest, the emphasis is on the parties reaching a settlement through the processes of collective bargaining. The parties may agree to negotiate a voluntary settlement of the dispute. Alternatively, either party may apply for the dispute to proceed through the more orthodox conciliation and arbitration channels. It should be stressed that applicants may, at any time, withdraw their claims from conciliation. Moreover, the Arbitration Court may refuse to arbitrate (i.e., make an award) if it considers that the parties have not made a genuine attempt to settle in conciliation.
In the case of disputes of right, the emphasis is on their peaceful resolution, and accordingly the process of arbitration is rather more in evidence. The disputes proceed through a system of disputes committees chaired by an independent person who may either make a decision in the event of the parties failing to agree or refer the matter to the Arbitration Court for a decision. Personal grievance issues proceed directly to the court for a decision in the event of the parties failing to agree.
The Act provides for the registration and enforcement of collective agreements. An agreement so registered is binding on the immediate parties to it (and their members). Additionally, an agreement arrived at through the process of conciliation, or an award of the court, automatically binds any person who subsequently becomes connected with or engaged in the industry to which it relates.
Separate enactments cover bargaining relationships in the agriculture sector, on the waterfront, and in the aircrew services.
INSTITUTIONS: The Arbitration Court—The Arbitration Court has the broad responsibility for the registering of settlements as collective agreements, the making of awards, and the settlement of disputes of right referred to it under the Act.
The court attempts, by means of a common membership, to achieve consistency in the decisions of the various wage fixing tribunals, e.g., public sector, waterfront, aircrew, agricultural.
The constitution of the court varies according to the matters before it and the wishes of the parties. The full court comprises 5 persons: 1 judge and 2 sets of members, nominated by the Employers' Federation and the Federation of Labour. The full court is limited to hearing disputes of interest and then only at the request of one or both of the parties. In all other circumstances, the court comprises 3 persons: being 1 judge and 1 set of nominated members. An establishment of 3 judges (with jurisdiction over other wage fixing tribunals) together with 2 sets of nominated members creates the possibility of 2 courts and 1 tribunal (or 1 court and 2 tribunals) sitting simultaneously.
The specific functions of the Arbitration Court are to:
Hear and determine any question connected with the construction of any award or collective agreement;
Hear and determine any question connected with the construction of the Industrial Relations Act or any Act relating to industrial matters;
Make an order determining the rights of parties under any award or collective agreement;
Order compliance with any award or collective agreement;
Make an order determining the validity of any award or collective agreement (this power was not in the 1973 Act and is designed to cope with situations in which a union negotiates an agreement which covers workers who are not covered by its membership rule);
Hear and determine enforcement and recovery actions;
Hear and determine appeals from disputes committees;
Hear and determine matters referred to the court relating to the grievance procedure;
Hear and determine questions relating to the registration and jurisdiction of unions;
Inquire into and determine questions relating to disputed elections.
The Industrial Conciliation Service—The New Zealand system of industrial relations has historically been governed by a formal system of conciliation and arbitration, and the Industrial Conciliation Service has long been an integral part of that system.
The service consists of conciliators appointed by the Governor-General on the recommendation of the Minister. The conciliator acts to convene conciliation councils for the hearing of disputes of interest, and to take any other steps considered advisable in reaching fair and amicable voluntary settlements of such disputes. More specifically, a conciliator sets dates for the hearing of disputes, appoints assessors to constitute the council, and calls or strikes out parties to a dispute. He or she is also responsible for recording and reporting the procedures of a conciliation to the court and referring unsettled disputes to the court for determination.
In practice the conciliator has 2 roles. During the formal proceedings he or she chairs the meetings. That is, occasionally calling the council to order, ensuring that they stick to the topic, and suggesting the time for a break in the formal proceedings. It is during the break in formal proceedings that the conciliator acts as a link between the parties, assists them in moving to common ground, and above all, ensures that the negotiations keep going.
The Industrial Mediation Service—The mediation service is relatively new to the industrial relations scene. It was established in 1970 by an amendment to the Industrial Conciliation and Arbitration Act (forerunner to the Industrial Relations Act 1973).
The service consists of mediators appointed by the Governor-General on the recommendation of the Minister after consultation with the central organisations. A mediator acts to assist employers, unions, and workers to carry out their responsibilities to establish and maintain harmonious industrial relations. The mediator has no power to impose his or her services on the parties to a dispute and may merely offer assistance. With the agreement of the parties however he or she may decide issues referred to him or her. The mediator on no account is involved in a dispute of interest while conciliation or arbitration proceedings are in progress.
Once involved in a dispute, the mediator's approach is a flexible one. As with the conciliator, the objective is to assist the parties in arriving at a settlement themselves. This involves getting the parties talking to one another, and keeping them talking. In certain circumstances, it might be appropriate for the mediator to request that the Minister appoint a compulsory conference, perhaps chaired by the mediator with decision-making powers. At other times, it might be appropriate to get the parties together in an informal way as a prelude to more formal discussions.
The Industrial Relations Council—This is an advisory body comprising representatives at national level of employer organisations, worker organisations, and the Government, under the chairmanship of the Minister of Labour. The council provides permanent machinery for tripartite consultation on industrial affairs. Some specific matters to which the council gives consideration are: the formulation and implementation of manpower policies; the formulation of codes of practice relating to industrial relations; and ways and means of improving industrial relations, industrial organisations, and industrial welfare. Various sub-committees have been formed to consider a range of policy issues.
The council went into recess in August 1979 after the Federation of Labour withdrew in protest at the repeal of the General Wage Orders Act 1977 by the Government, and the introduction of the Remuneration Bill.
INDUSTRIAL UNIONS—The New Zealand system of conciliation and arbitration is based on the voluntary registration of industrial unions and industrial associations. The Industrial Relations Act 1973 simplified and consolidated procedures developed over the years under the former Industrial Conciliation and Arbitration Act. A sliding scale operates to determine the minimum number required to form a union depending on the number of industrial districts in which the union has coverage. A union of employers with coverage of up to 1 full industrial district is to have a minimum of 6 members or more than 75 percent of employers engaged in the industry in the area concerned who together employ more than 75 percent of the workers so engaged, with an absolute minimum of 3. A union of workers with coverage of up to 1 full industrial district is to have a minimum of 30 members or more than 50 percent of the total number of workers engaged in the industry in the area concerned, with an absolute minimum of 10 members. The prime minimum and the absolute minimum figures increase progressively
with coverage of a greater number of industrial districts. If the membership of a union falls below the minimum requirements the union may be deregistered. The great majority of unions of workers and employers in the private enterprise field are registered under the Industrial Relations Act.
Further provisions of the Industrial Relations Act 1973 operate to deter multiple unionism and simplify the procedures for amalgamation of unions. It is hoped that this will give impetus to amalgamation of unions.
Restrictions on the exercise of welfare activities by unions have been removed and unions are able, subject to membership approval, to devote any percentage of subscription to welfare activities.
Fishing Industry Union Coverage Act 1979—Special legislation governing union coverage in the fishing industry was passed in 1979. This Act excludes existing unions from the fishing industry and provides that only 1 union may be registered in respect of the industry. The consent of the Minister of Labour is required prior to registration.
UNIONS OF WORKERS—In the years subsequent to 1936, when changes in the law enabled national unions of workers to be formed and introduced compulsory membership of unions, two tendencies were visible. The first was the immediate creation of many new small unions, the number of unions jumping from 410 in 1935 to 499 in 1937, as many small groups of workers for the first time became unionised and secured an award. Later, a tendency for small unions to amalgamate into New Zealand unions became evident, so that the total number of unions declined at the same time as the number of larger unions increased. By 1942 the result of these changes was to leave the number and membership of the small unions little different from what they were in 1928, but substantially to increase the number of large unions, and to increase greatly their membership.
Compulsory Membership—Although it was possible to negotiate preference provisions for union members under the Industrial Conciliation and Arbitration Act 1894 (IC and A Act), the first express statutory provision for compulsory unionism in New Zealand appeared in the Industrial Conciliation and Arbitration Amendment Act 1936. This provision required all adult workers subject to any award or industrial agreement under the IC and A Act to be members of a union bound by the relevant document.
Compulsory unionism resulted in a great numerical strengthening of the existing unions with consequential increase in their financial strength, while the legislation enabling national unions to be formed helped to consolidate these gains: at the same time it resulted in the unionisation of many small groups of workers who were previously unorganised. Since 1962 the State has not imposed compulsory union membership.
The next legislative change occurred in 1961, when the I C and A Act 1954 was amended to substitute compulsory unionism with a union membership system based on the existence of either qualified or unqualified preference clauses in awards and agreements. If an unqualified preference clause appeared in an award or agreement, any adult worker covered by the document and who was not a member of a union at the time of engagement was required to join the union within 14 days. A qualified preference provision required an employer to give preference of employment to a member of the relevant union over a non-member, provided that there was an equally qualified member ready and willing to undertake the work required to be done. Any document made after this law was passed, and which did not include an unqualified preference clause, was required to contain a qualified preference clause.
Qualified preference was dispensed with on the passing of the Industrial Relations Amendment Act 1976.
From 1961 to 1982 the procedures through which unqualified preference clauses were inserted in awards and agreements underwent some changes. The 1961 amendment allowed an unqualified preference provision to be inserted in awards if all assessors so agreed, or if a secret ballot of the workers who would be covered yielded a majority in favour.
The Industrial Relations Act 1973 superseded the I C and A Act, and amendments in 1976 added to the procedures for the insertion of unqualified preference provisions into documents. The Minister of Labour was empowered to require a ballot to be conducted of adult workers covered by an award or agreement in order to determine whether those workers desired the insertion or retention of the provision. A 1979 amendment provided for a new rule to be inserted into the rules of every union. It contained a procedure which was to be followed every 3 years, and which required a union to give written notice to its financial members of its intention to seek the insertion of an unqualified preference provision. That intention was to be discussed at a special meeting, following which a ballot would be taken. A majority of valid votes cast was required before negotiation of the provision could be proceeded with. Finally in 1982 the requirement to conduct ballots at 3-yearly intervals was replaced by a procedure enabling a specified number of union members to apply to the Registrar of Industrial Unions for a ballot.
Voluntary Membership—The Industrial Relations Amendment Act 1983 came into force on 1 February 1984. Its purpose was to implement a system of voluntary union membership in respect of private sector workers covered by the Industrial Relations Act. Since voluntary union membership was to be implemented in all sectors of employment, the voluntary unionism provisions in the Industrial Relations Amendment Act were included in other legislation, namely the Waterfront Industry Act 1976, the Agricultural Workers Act 1977, the Aircrew Industrial Tribunal Act 1971, the State Services Conditions of Employment Act 1977, the Post Office Act 1959, the New Zealand Railways Corporation Act 1981 and the Coal Mines Act 1979. The following method of implmentation is repeated in all of the legislation mentioned:
To repeal all unqualified preference provisions as they appear in any legislation. In addition, all unqualified preference provisions and any other preference provisions in force in any documents on 1 February 1984 were nullified from that date.
To prohibit the negotiation of provisions either in formal or informal agreements which would confer preference on any worker on the basis of that worker's membership or non-membership of a union. This was effected by:
— spelling out the prohibition
— inserting a prohibition on the formalising of any document attempting to establish a system of preference based on union membership or non-membership. Any agreement contravening the provision was to be, to that extent, void and of no effect.
— ensuring that no matter relating to the compulsory membership or non-membership of unions was within the ambit of matters that may be negotiated by employers and workers.
This was supplemented by a set of remedies for discrimination on the grounds of union membership status. The remedies were to be enforceable in the Arbitration Court, and were of the nature of action for penalty for breach of awards.
Penalties could be incurred by:
Any person who exerted undue influence with intent to induce a worker to become or remain a member or non-member of a union, or to resign from employment on the grounds of membership status.
Any employer who refused or omitted to employ, or who dismissed a worker on the basis of union membership or non-membership or intentions concerning membership, or who had regard to membership status when determining redundancies. When any of these elements was established, it would be for the employer to prove that there was no such discrimination.
In such an action, the employer could claim a contribution to any penalty incurred from anyone who had abetted or incited the action complained of.
In addition to the imposition of a penalty, the plaintiff could be awarded reimbursement of wages lost, compensation, reinstatement, or any combination of these.
Any person who failed to comply with, or instigated or incited a failure to comply with an order for reinstatement.
Any person who went on strike or locked out with the intent to induce certain action on the grounds of union membership or non-membership, or to express opposition to the union membership status of employees in another enterprise. The onus of proof was again reversed in this connection.
This heading could also form the basis of a civil action in tort.
Federation of Labour—The great increases in the membership of the trade unions brought about by compulsory unionism and the formation of national unions were factors facilitating the formation of the Federation of Labour in 1937 as an organisation representative of the trade union movement as a whole on a national basis.
The supreme authority of the Federation of Labour is the annual conference of delegates representing affiliated unions. Between conferences the business of the federation is carried on by a National Executive Committee and a National Council. The executive consists of the president, vice president, secretary, and 6 members elected directly by the conference. The National Council, which meets regularly twice a year, and at other times as required, consists of members of the National Executive and is representative of each local trades council. It is the governing body of the federation between meetings of the conference. The local organs of the federation are the local trades councils, 20 in number, and 1 trade union committee, to which all local unions and branches of unions affiliated to the Federation of Labour are entitled to send representatives. The trades councils meet once a month to carry on the local business of the federation and they maintain close contact with the National Executive by means of exchange of minutes of meetings. Within each district the trades council has local autonomy, but where any matter affects other districts the National Executive or the National Council usually deals with it.
UNION OF EMPLOYERS—By registering, the employers secure all the rights of a union and can exercise them, with only minor differences, in the same manner as a union of workers.
Compulsory membership of unions does not apply to employers and in many cases their unions are maintained with a nominal membership.
Employers are more organised for negotiations with unions than figures of membership and the prevalence of local unions of employers might suggest. The New Zealand Employers Federation is the central organisation of employers and the chief co-ordinating body of employers in all matters of industrial relations and employment. It comprises 4 regional divisions (the Auckland Provincial, Wellington Regional, Canterbury, and Otago-Southland Employers Associations) plus national and North or South Island organisations that are admitted to membership of the Federation's General Council. There are nearly 70 in this latter category.
Individual company membership of the 4 regional divisions of the federation now exceeds 10 000, and these employers receive advice, assistance, and representation from the associations' specialist industrial staff. In addition to work in the negotiations and advocacy field, the Employers Federation has staff handling research and information services.
A new constitution adopted by the federation in 1971 was designed to achieve greater unity amongst employers and employer organisations associated with the federation, and greater employer sector participation has been provided in the formulation of the federation's policies.
STATISTICS: Unions of Workers—The numbers and membership of workers' unions at the end of the year according to industry groups is shown in the following table. Where the members of a union are employed in more than 1 industry they have been classified to the predominant industry for the union concerned.
| Industrial Group | 1980 | 1981 | 1982 | |||
|---|---|---|---|---|---|---|
| Unions | Members | Unions | Members | Unions | Members | |
| Agriculture, hunting, forestry, and fishing | 5 | 15,681 | 5 | 16,372 | 5 | 16,967 |
| Mining and quarrying | 3 | 364 | 3 | 381 | 3 | 324 |
| Manufacturing— | ||||||
| Food, beverages, and tobacco | 36 | 54,404 | 34 | 52,877 | 34 | 52,458 |
| Textiles, wearing apparel, leather | 20 | 25,930 | 20 | 27,519 | 19 | 25,702 |
| Wood and wood products | 8 | 17,110 | 8 | 18,030 | 8 | 18,295 |
| Paper and paper products, printing, and publishing | 7 | 17,249 | 7 | 16,213 | 7 | 18,400 |
| Chemicals, petroleum, coal, rubber and plastics | 10 | 4,128 | 10 | 4,323 | 10 | 4,096 |
| Non-metallic mineral products | 3 | 583 | 3 | 586 | 3 | 590 |
| Basic metals industries | 3 | 430 | 3 | 425 | 3 | 391 |
| Fabricated metal products, machinery and equipment | 15 | 58,568 | 14 | 58,894 | 14 | 58,652 |
| Other manufacturing industries | 4 | 352 | 4 | 311 | 5 | 325 |
| Total, manufacturing | 106 | 178,754 | 103 | 179,178 | 103 | 178,909 |
| Electricity, gas and water | 2 | 125 | 2 | 69 | 1 | 43 |
| Construction | 14 | 44,791 | 12 | 46,081 | 11 | 47,985 |
| Wholesale and retail trade, restaurants and hotels | 30 | 101,496 | 27 | 103,604 | 26 | 107,675 |
| Transport, storage, communication | 48 | 51,879 | 48 | 49,916 | 48 | 49,352 |
| Financing, insurance, real estate | 20 | 79,545 | 20 | 77,447 | 20 | 77,485 |
| Community, social and personal services— | ||||||
| Public administration | 10 | 18,917 | 10 | 19,964 | 10 | 20,445 |
| Sanitary and similar services | 5 | 11,720 | 5 | 12,439 | 5 | 13,779 |
| Social related community services | 4 | 5,061 | 5 | 6,310 | 5 | 6,868 |
| Recreational services | 11 | 4,572 | 11 | 4,522 | 11 | 4,742 |
| Personal and household services | 7 | 3,392 | 7 | 3,422 | 7 | 3,223 |
| Total, community, social and personal services | 37 | 43,662 | 38 | 46,657 | 38 | 49,057 |
| Total, all industries | 265 | 516 297 | 258 | 519 705 | 255 | 527 797 |
In the following table industrial unions of workers are classified according to membership.
| At 31 December | Under 100 | 100–199 | 200–299 | 300–499 | 500–999 | 1 000–1 999 | 2 000–2 999 | 3 000–4 999 | 5 000–9 999 | 10 000 and Over | Total |
|---|---|---|---|---|---|---|---|---|---|---|---|
| Number of Unions | |||||||||||
| 1978 | 81 | 32 | 22 | 30 | 40 | 35 | 13 | 12 | 12 | 12 | 289 |
| 1979 | 78 | 26 | 24 | 23 | 41 | 34 | 12 | 13 | 13 | 13 | 277 |
| 1980 | 70 | 29 | 19 | 24 | 38 | 32 | 15 | 9 | 16 | 13 | 265 |
| 1981 | 70 | 25 | 20 | 22 | 40 | 32 | 11 | 7 | 16 | 15 | 258 |
| 1982 | 65 | 32 | 17 | 24 | 37 | 28 | 15 | 7 | 15 | 16 | 256 |
| Membership | |||||||||||
| 1978 | 3,787 | 4,405 | 5,365 | 11,938 | 27,079 | 50,599 | 31,535 | 46,907 | 87,779 | 217,139 | 486,533 |
| 1979 | 3,682 | 3,714 | 5,775 | 8,815 | 26,888 | 47,889 | 27,838 | 50,488 | 95,614 | 236,260 | 506,963 |
| 1980 | 3,409 | 4,047 | 4,614 | 9,414 | 26,028 | 44,888 | 35,695 | 35,512 | 115,723 | 236,967 | 516,297 |
| 1981 | 3,306 | 3,419 | 4,726 | 8,393 | 28,507 | 47,327 | 26,839 | 24,374 | 112,531 | 260,283 | 519,705 |
| 1982 | 3,012 | 4,539 | 4,062 | 9,486 | 25,981 | 40,130 | 34,953 | 24,509 | 101,521 | 279,790 | 527,983 |
The total membership of industrial unions of workers at intervals since 1940 is shown in the following table. In 1936 the membership of industrial unions had more than doubled, growing from 80 929 in 1935 to 185 527 in 1936. This was a result of the 1936 amendment to the Industrial Conciliation and Arbitration Act which made union membership compulsory whenever an award or industrial agreement existed.
| As at End of Year | Number of Members |
|---|---|
| 1940 | 248,081 |
| 1945 | 229,103 |
| 1950 | 275,779 |
| 1955 | 304,520 |
| 1960 | 332,362 |
| 1965 | 353,093 |
| 1970 | 378,465 |
| 1974 | 436,623 |
| 1975 | 454,991 |
| 1976 | 464,453 |
| 1977 | 473,432 |
| 1978 | 486,533 |
| 1979 | 506,963 |
| 1980 | 516,297 |
| 1981 | 519,705 |
| 1982 | 527,797 |
Unions of Employers—The numbers and membership of registered industrial unions of employers as at the end of the year are shown in the following table according to industrial groups. Some employers belong to 2 or more unions.
| Industrial Group | 1980 | 1981 | 1982 | |||
|---|---|---|---|---|---|---|
| Unions | Members | Unions | Members | Unions | Members | |
| Agriculture, hunting, forestry and fishing | 11 | 4,148 | 11 | 5,390 | 11 | 6,787 |
| Mining and quarrying | – | – | – | – | – | – |
| Manufacturing— | ||||||
| Food, beverages, and tobacco | 21 | 429 | 21 | 409 | 26 | 393 |
| Textiles, wearing apparel, leather | 10 | 499 | 10 | 499 | 10 | 475 |
| Wood and wood products | 9 | 533 | 9 | 521 | 9 | 507 |
| Paper and paper products, printing, and publishing | 9 | 585 | 9 | 621 | 9 | 602 |
| Chemicals, petroleum, coal, rubber, and plastics | 8 | 256 | 8 | 250 | 8 | 249 |
| Non-metallic mineral products | 2 | 32 | 2 | 32 | 2 | 32 |
| Basic metals industries | – | – | – | – | – | – |
| Fabricated metal products, machinery and equipment | 8 | 1,127 | 9 | 1,644 | 9 | 1,652 |
| Other manufacturing industries | – | – | – | – | – | – |
| Total, manufacturing | 67 | 3,461 | 68 | 3,976 | 73 | 3,910 |
| Electricity, gas and water | 1 | 16 | 1 | 16 | 1 | 16 |
| Construction | 56 | 6,087 | 56 | 6,179 | 56 | 5,505 |
| Wholesale and retail trade, restaurants and hotels | 54 | 12,901 | 53 | 12,667 | 53 | 13,272 |
| Transport, storage, communication | 10 | 2,130 | 10 | 2,165 | 10 | 2,155 |
| Financing, insurance, real estate | 5 | 1,604 | 5 | 1,541 | 5 | 1,801 |
| Community, social and personal services— | ||||||
| Public Administration | 4 | 301 | 5 | 378 | 5 | 386 |
| Sanitary and similar services | 1 | 180 | 1 | 180 | 1 | 175 |
| Social related community services | 3 | 915 | 3 | 882 | 3 | 888 |
| Recreational services | 1 | 82 | 1 | 73 | 1 | 54 |
| Personal and household services | 4 | 813 | 4 | 791 | 4 | 894 |
| Total, community, social, and personal services | 13 | 2,291 | 14 | 2,304 | 14 | 2,397 |
| Total, all industries | 217 | 32 638 | 218 | 34 238 | 223 | 35 843 |
INDUSTRIAL ASSOCIATIONS—Associations of 2 or more unions in different districts in the same industry can be registered as industrial associations. As at 31 December 1982 there were 14 industrial associations of employers and 23 of workers, the former having 112 affiliated unions and the latter, 119.
PROPORTION OF UNIONISTS—The following table shows the proportion of workers belonging to registered unions to the total number of wage earners in the country. The figures for total wage earners are derived from census enumerations.
| Census Year | Total Wage Earners | End of Year Nearest to Census Date | Number of Workers on Rolls of Registered Unions* | Percentage of Wage Earners on Rolls of Registered Unions* |
|---|---|---|---|---|
| * There are a number of associations of employees not registered. These include many State servants and mine workers, chemical fertiliser workers, agriculture workers, etc. | ||||
| 1961(Apr) | 750,882 | 1960 | 332,362 | 44 |
| 1966(Mar) | 870,813 | 1965 | 353,093 | 41 |
| 1971(Mar) | 958,563 | 1970 | 378,465 | 39 |
| 1976(Mar) | 1,063,170 | 1975 | 454,991 | 43 |
| 1981(Mar) | 1,089,129 | 1980 | 516,297 | 48 |
STATISTICS OF WORK STOPPAGES—In the tables which follow, only those disputes which result in a strike or lockout or in which an organised 'go-slow', refusal to work overtime, or other passive resistance methods are clearly manifested are included. From 1980, work stoppages not directly related to terms and conditions of employment have also been included (e.g. stoppages in protest at the presence of a nuclear powered vessel or stoppages where the disagreement is with Government rather than the employer). Public sector stoppages continue to be excluded. The figures for stoppages include unauthorised stopwork meetings as well as unauthorised delays in resuming work after recognised stopwork meetings. A single stoppage may include or consist of 1 or more stoppages or stopwork meetings held at different places or at different times concerning the same issue. A long-term series of stoppages is given towards the back of this Yearbook.
The following table shows incidence rates of stoppages during recent years.
| Year | Number of Wage and Salary Earners* | Workers Involved in Stoppages as Percentage of Wage and Salary Earners | Working Days Lost per 1000 of Wage and Salary Earners |
|---|---|---|---|
| * October estimates prior to 1980. Since 1980 based on the quarterly employment survey of 15 November. | |||
| (000) | |||
| 1976 | 1 042.1 | 19.30 | 468.71 |
| 1977 | 1 044.9 | 15.26x | 418.02x |
| 1978 | 1 040.2 | 15.18 | 365.90 |
| 1979 | 1 020.5 | 15.50 | 374.24 |
| 1980 | 1 021.0 | 12.50x | 365.83x |
| 1981 | 1 033.4 | 13.06x | 375.55x |
| 1982 | 1 033.6 | 15.09x | 319.31x |
| 1983 | 1 027.6 | 13.36 | 353.78 |
Work stoppages during recent years are summarised in the following table. The totals of stoppages include lockouts (if any). Where several occasions have been grouped as 1 stoppage the largest number of workers involved on any one day have been included under the relevant headings. Workers indirectly involved have also been included. “Partial strike” indicates a reduction of the normal rate of output.
| Calendar Year | Number of Stoppages | Number of Workers Involved | Working Days Lost | Average Days Lost per Worker Involved | Approximate Loss In Wages | ||
|---|---|---|---|---|---|---|---|
| Complete Strike | Partial Strike* | Total† | |||||
* Reduction of normal rate of output. †Includes lockouts and penalties (2 lockouts in 1979, 2 lockouts in 1981, 4 lockouts in 1982, and 1 lockout in 1983). | |||||||
| (000) | (000) | $(000) | |||||
| 1979 | 507 | 14 | 523 | 158 | 382 | 2.41 | 12,698 |
| 1980 | 360x | – | 360x | 128x | 373x | 2.93x | 18,110x |
| 1981 | 283x | 6 | 291x | 135x | 388x | 2.87x | 20,411x |
| 1982 | 322x | 7 | 333x | 156x | 330x | 2.16x | 24,605x |
| 1983 | 315 | 1 | 317 | 137 | 364 | 2.65 | 25,861 |
The following graph shows work stoppages over a series of years.
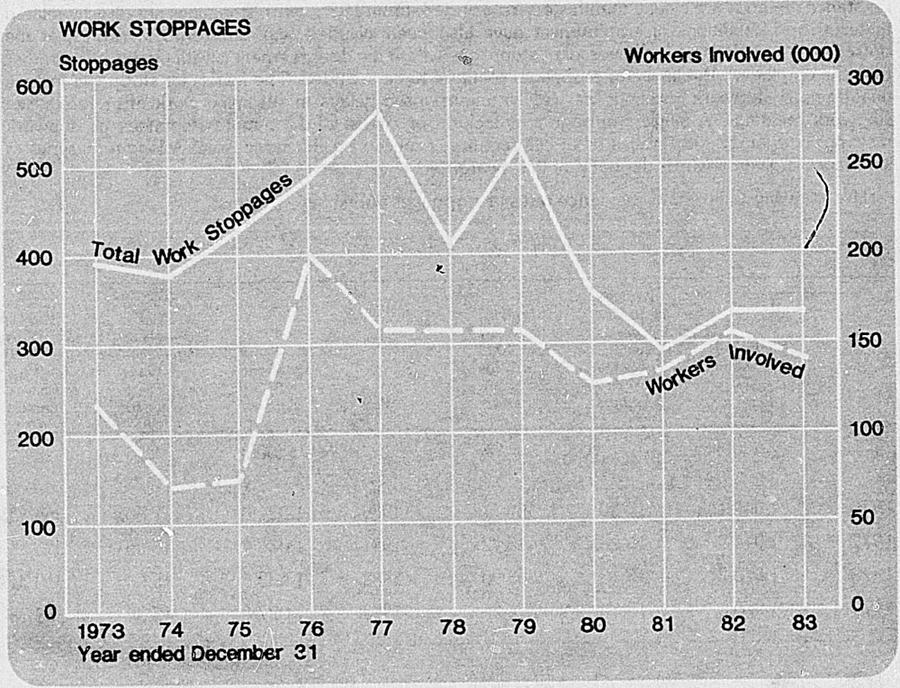
In the following table work stoppages are classified according to the industry in which they took place. The figures relate to stoppages which terminated during the 12 months ended December 1983.
| WORK STOPPAGES 1983 | ||||
|---|---|---|---|---|
| Industry | Number of Stoppages | Number of Workers Involved | Working Days Lost | Approximate Loss in Wages* |
* Individual components may not add due to rounding. †From 1976 any stoppage which involved workers in more than one industry has been counted once in each respective industry but as a single stoppage in the total of all industries. In 1983 there were 29 extra cases recorded. | ||||
| No. | $(000) | |||
| Agriculture, hunting | 2 | 33 | 116 | 5 |
| Forestry, logging | 2 | 704 | 833 | 38 |
| Mining, quarrying | 3 | 73 | 409 | 34 |
| Meat export works | 64 | 59,195 | 140,451 | 11,450 |
| Other slaughtering, preparation, and preserving meat | 4 | 860 | 1,091 | 61 |
| Dairy products; fruit, vegetable, and fish canning and preserving; vegetable oils, animal oils and fats | 11 | 2,028 | 3,462 | 187 |
| Grain milling, bakery products, sugar, confectionery, etc. | 4 | 462 | 709 | 37 |
| Beverage industries, tobacco | 4 | 819 | 3,004 | 151 |
| Textile, wearing apparel, leather goods | 5 | 993 | 1,925 | 85 |
| Wood, wood products (incl. furniture) | 3 | 1,117 | 1,628 | 71 |
| Paper, paper products; printing and publishing | 6 | 2,708 | 36,998 | 1,935 |
| Chemicals; chemical, petroleum, and coal products | 10 | 1,105 | 1,621 | 104 |
| Rubber and plastic products | 7 | 961 | 3,609 | 276 |
| Non-metallic mineral products | 10 | 2,507 | 6,778 | 319 |
| Basic metal industries | 5 | 1,784 | 9,687 | 795 |
| Metal products, machinery including electrical | 10 | 3,110 | 4,176 | 250 |
| Transport equipment | 6 | 2,740 | 5,084 | 235 |
| Professional and scientific equipment | – | – | – | – |
| Other manufacturing | – | – | – | – |
| Electricity, gas, water | 2 | 116 | 334 | 19 |
| Buildings | 3 | 137 | 93 | 4 |
| Construction other than buildings | 106 | 35,950 | 110,911 | 8,289 |
| Ancillary building and construction services | – | – | – | – |
| Wholesale trade | 4 | 322 | 486 | 25 |
| Retail trade | 1 | 1,004 | 766 | 34 |
| Restaurants and hotels | 9 | 220 | 1,822 | 77 |
| Land transport | 22 | 6,658 | 7,004 | 278 |
| Water transport | 23 | 9,319 | 11,862 | 750 |
| Air transport | 1 | 249 | 249 | 20 |
| Services allied to transport | 2 | 124 | 1,004 | 46 |
| Communication | – | – | – | – |
| Financing, insurance, real estate, etc. | – | – | – | – |
| Community, social, and personal service | 17 | 2,029 | 7,414 | 287 |
| Several industries | – | – | – | – |
| Total, all industries† | 317 | 137 327 | 363 526 | 25 861 |
The following table gives an analysis of stoppages by duration during 1983.
| Duration | Number of Stoppages | Number of Workers Involved | Number of Working Days Lost | Approximate Loss in Wages* |
|---|---|---|---|---|
* Individual components may not add due to rounding. NOTE: A week is considered to be 5 working days. | ||||
| No. | $(000) | |||
| 1 day and less | 149 | 52,206 | 23,332 | 1,871,048 |
| Over 1 day but not over 2 days | 45 | 11,199 | 15,461 | 1,030,470 |
| Over 2 days but not over 3 days | 26 | 5,916 | 12,716 | 984,546 |
| Over 3 days but less than 1 week | 24 | 5,108 | 16,764 | 1,307,527 |
| 1 week but less than 2 weeks | 37 | 14,953 | 62,342 | 5,204,638 |
| 2 weeks but less than 4 weeks | 19 | 36,613 | 70,020 | 4,979,936 |
| 4 weeks but less than 8 weeks | 13 | 9,431 | 81,080 | 5,595,641 |
| 8 weeks and over | 4 | 1,901 | 81,811 | 4,887,140 |
| Total | 317 | 137 327 | 363 526 | 25,860,946 |
The following table gives an international comparison of working days lost through work stoppages.
| Country | Working Days Lost Per 1000 Employees | ||
|---|---|---|---|
| 1981 | 1982 | 1983 | |
* Stoppage statistics for the United States are only collected for strikes involving at least 1000 persons. †Figures for total labour force used in the calculation of these figures exclude the agricultural sector. Source: Main Economic Indicators and Quarterly Labour Force Statistics, published by the OECD, Department of Economics and Statistics. | |||
| Canada | 741.2 | 481.6 | 411.2 |
| United States* | 153.3 | 81.0 | 154.2 |
| Australia | 614.4 | 309.0 | 232.7 |
| New Zealand† | 325.1 | 272.8 | |
| Finland | 255.9 | 77.8 | 279.7 |
| France | 62.1 | 96.0 | 56.8 |
| Germany | 2.1 | 0.5 | |
| Italy | 398.8 | 700.4 | 497.7 |
| United Kingdom | 159.7 | 198.8 | 134.4 |
CAUSES—In the next table the causes of stoppages occuring during 1983 are shown. A breakdown in negotiations over a range of matters rather than over any 1 or more of the other categories of cause is recorded under “General Breakdown in Negotiations”.
Under the heading “Wages” are included stoppages concerning wages, overtime, or rates of piecework. Stoppages concerning the hours of work, leave, and holidays are included under the heading “Period of Work”.
“Conditions of Work” includes safety, health and general working conditions. Such matters as supervision, work allocation, staffing levels, dismissals, redundancy, etc., are included under “Managerial Practice”.
Stoppages caused by workers striking in sympathy with demands of other workers, demarcation, victimisation, and other union matters are included under “Union Matters”.
The number of stoppages, number of workers involved, and working days lost are shown for each cause.
| Involvement | Cause of Stoppage | Total | ||||||
|---|---|---|---|---|---|---|---|---|
| General Breakdown in Negotiations | Wages | Period of Work | Conditions of Work | Managerial Practice | Union Matters*and Other Causes | Political | ||
| * Union matters: 84 stoppages; 31 896 workers involved; 37 771 working days lost. | ||||||||
| Number of— | ||||||||
| Stoppages | 6 | 62 | 12 | 50 | 112 | 89 | 2 | 333 |
| Workers involved | 2,913 | 60,481 | 1,642 | 15,199 | 24,763 | 34,368 | 1,364 | 140,730 |
| Working days lost | 92,387 | 85,707 | 2,620 | 91,675 | 58,657 | 40,139 | 589 | 371,774 |
METHODS OF SETTLEMENT—Following is a table showing the methods of settlement of disputes causing stoppages in 1983. “Private negotiations” take place when discussions have occurred between employers and workers without intervention of a third party. Third parties intervening may include the industrial mediator, conciliators, the Department of Labour, the Minister of Labour, the Federation of Labour, etc.
A settlement is classified as “Voluntary return to work” where no negotiations have taken place, no conditions are changed, and workers simply return to work or decide to drop their claims.
| Method of Settlement | Number of Stoppages | Number of Workers Involved | Number of Working Days Lost | Approximate Loss in Wages |
|---|---|---|---|---|
| $(000) | ||||
| Private negotiations | 68 | 16316 | 76,040 | 5,370 |
| Intervention of third party | 49 | 12,319 | 127,613 | 7,909 |
| Voluntary return to work | 215 | 111,825 | 167,831 | 13,302 |
| Other | 1 | 270 | 290 | 18 |
| Total | 333 | 140 730 | 371 774 | 26,599 |
WORKING CONDITIONS—A considerable proportion of the persons comprising the labour force of New Zealand have their working conditions determined either directly or indirectly by virtue of the provisions of the Aircrew Industrial Tribunal Act 1971, the Factories and Commercial Premises Act 1981, the Coal Mines Act 1979, the Shipping and Seamen Act 1952, the Agricultural Workers Act 1977, the Construction Act 1959, the Machinery Act 1950, the Disabled Persons Employment Promotion Act 1960, the Bush Workers Act 1945, the Sharemilking Agreements Act 1937, the Shearers Act 1962, or the Industrial Relations Act 1973. Legislative authority covering the working conditions of substantially the greater portion of the remaining participants in the labour force is contained in the State Services Act 1962, the State Services Conditions of Employment Act 1977, the New Zealand Railways Corporation Act 1981, the Post Office Act 1959, the Police Act 1958, the Fire Services Act 1975, the Education Act 1964, the Hospitals Act 1957, the Hospital Employment Regulations 1963, and the Waterfront Industry Act 1976.
Notes on Acts which have as their prime purpose the protection of workers from accidents in the course of their employment have been included in Section 36D, Occupational Safety.
HOURS OF WORK—Employees in most occupations have had the benefit of a 40-hour 5-day week since 1946, with the first legislation in this regard being enacted in 1936.
HOLIDAYS—The Holidays Act 1981 provides for an annual holiday of 3 weeks' duration paid at the worker's average weekly earnings during the year of entitlement, provided the average is not less than the ordinary weekly earnings being received at the date of commencing the holidays.
Public holidays include Christmas Day, Boxing Day, New Year's Day, 2 January (or a day in lieu), Waitangi Day, Good Friday, Easter Monday, Anzac Day, Labour Day, the Sovereign's Birthday, and the provincial anniversary day (or a day in lieu). Labour Day is deemed to be the fourth Monday in October. Waitangi Day is 6 February. Anzac Day (the 25th day of April) is a day of commemoration, being the anniversary of the first landing of troops in Gallipoli in 1915, and in terms of employment is observed as if it were a holiday. Observance of Waitangi Day and Anzac Day cannot be transferred to another date.
Other statutes dealing with holidays are the Anzac Day Act 1966, Sovereign's Birthday Observance Act 1952, and the Waitangi Day Act 1976.
FACTORIES AND COMMERCIAL PREMISES ACT—This Act applies to undertakings which include bakehouses, cinemas, commercial depots, factories, hotels, laundries, laboratories, mailrooms, offices, restaurants, shops, stores, theatres, telegraph offices, telex offices, and warehouses. The Act also covers places where motor vehicles are repaired, serviced, or tested for pecuniary gain, or where food is prepared or cooked and sold ready for immediate human consumption elsewhere than in that place.
Restrictions on Employment—Persons under 15 years may not be employed in any factory. Persons under 16 years of age may not be employed in any undertaking between the hours of 10 p.m. and 6 a.m.
Safety, Health and Welfare—Safety measures in the Act include requirements such as a general safety duty for both employers and workers, powers for inspectors to deal immediately with serious dangers, storage of dangerous substances and materials generally, harmful noise, means of access and safety of employment, safety in confined spaces, and requirements to train and supervise workers. The employer is required to keep a register of all accidents of which he has any knowledge and first-aid appliances must be provided and maintained. The health and welfare provisions are very extensive and
include reference to such matters as air space, cleanliness, ventilation, canteens, the care of employees, amenities, and other things to be supplied by the employer to secure employees' health or welfare. Provision is made for the making of codes of practice that may be approved by the Minister. Other aspects include the establishment of work safety and health committees and the appointment of safety representatives. Various regulations are made under the Act to ensure employees' health and safety when dealing with toxic or hazardous substances and processes involving particular risks to health and safety.
MATERNITY LEAVE—The Maternity Leave and Employment Protection Act 1980 allows women who are having babies or intending to adopt children under 5 years of age to take 26 weeks unpaid maternity leave. Entitlement to this leave depends upon a woman having worked for the same employer for a period of 18 months immediately preceding the expected date of delivery or the adoption of the child, for at least 15 hours' per week.
At the end of the 26-week period of leave, the female employee may return to her position if her employer has been able to keep it open for her. Alternatively, she is entitled during the 6 months following her maternity leave to preference over other applicants for any position which is vacant in the employer's enterprise and which is substantially similar to the position she held at the beginning of her maternity leave. The Act also provides that it is unlawful to terminate the employment of a woman because of her pregnancy or her state of health during the pregnancy. The Act contains complaint procedures for a woman to use where she believes that any of the provisions of the Act have been contravened or her rights to maternity leave have been affected to her disadvantage by her employer.
SHOP TRADING HOURS—Under the Shop Trading Hours Act 1977 shops may open at any time between 7 a.m. and 9 p.m. Mondays to Saturdays inclusive but are to be closed outside these hours and on Sundays and statutory holidays unless an extension of opening hours has been authorised by the Shop Trading Hours Commission.
The Act provides that “approved” goods may be sold at any time. Goods other than those on the “approved” list are “restricted” goods. If an occupier intends to open a shop to sell “approved” goods outside the hours mentioned above, then all “restricted” goods must be out of sight of the public or kept in a part of the shop that is closed off.
Provision is made for the granting of orders authorising a shop occupier to open at times other than those mentioned above. The majority of the shop occupiers in an “area” (which may be a street, mall, or municipality area) can also apply for such an order to cover the whole of the area.
“Approved” Goods—These are listed in a Schedule contained in an Order made under the Act. “Approved” goods include bakers' and pastrycooks' goods, building supplies and domestic repair requisites, condiments, confectionery, dairy produce, drinks, fish, frozen foods, fruit and flowers, fuels, gardening supplies, aquarium flora and fauna, miscellaneous groceries, magazines and periodicals, meats and smallgoods, medicinal and household goods, motor accessories, photographic goods, plants, prepared and cooked foods, tobacco, etc., vegetables, and a number of miscellaneous lines.
The Act makes special provision for bona fide “dairy-mixed businesses” to allow them to open on a 7-day-week basis. Dairies need only complete a simple application form which is lodged with the Shop Trading Hours Commission. The application, together with a report from an inspector, is then considered by the commission without the need for a formal hearing. If the application is granted, the dairy may open outside the hours set by the Act. If it is declined the shop must observe the legally permitted hours or, if the proprietor wants to open outside those hours, he or she must confine the display of goods to those items on the “approved” goods list.
AGRICULTURAL WORKERS ACT—Under the Agricultural Workers Act 1977 regulations have been made setting out minimum standards of accommodation to be supplied for agricultural workers.
Restrictions on Employment of Children—Under the Act no child under the age of 15 years may:
be employed in any agricultural work during such times as the child is required to attend school under the Education Act;
be required to lift any weights, or to perform any task likely to be injurious to health;
work more than 8 hours in any 1 day.
Safety and Health—The Act requires employers to take reasonable precautions for the safety and health of employees and provides for the instruction of employees as to dangers and precautions, miscellaneous protection, the provision of protective clothing or equipment as appropriate, and the moderation, insulation, or provision of protection against harmful noise.
Fixing of Wages and Conditions of Employment—The Act provides a system for fixing wages and conditions of employment somewhat akin to that which operates for workers in other industries. The emphasis is on voluntary and conciliated settlement of disputes, but in cases of no agreement a specialised Agricultural Tribunal can make an award. A significant concept is the registration of a single employers' organisation and a single employees' organisation for each class of agricultural work. The registered organisations have exclusive rights of representation for the particular class. Machinery is provided in the Act for amendment of the definitions of classes of work and for the registration of replacement organisations. This whole system has been integrated into the all-encompassing wage fixing machinery under the Arbitration Court. A judge of that Court is the President of the Agricultural Tribunal.
SHEARERS ACT—Under the Shearers Act 1962 an employer is required to provide amenities for all shearers employed. Where 5 or more shearers are to be accommodated on the farm suitable accommodation must be provided. Minimum standards of amenities and accommodation are prescribed by the Shearers Regulations 1963.
SHIPPING AND SEAMEN LEGISLATION—The general superintendence of matters relating to merchant ships and seamen in New Zealand is the responsibility of the Marine Division of the Ministry of Transport.
Competence, Safety, and Welfare Provisions—The Shipping and Seamen Act 1952 makes provision to ensure competence on the part of navigational officers, engineers, and certain crew members. Rules or regulations under that Act set out the qualifications and examination standards for persons to obtain the appropriate certificates in New Zealand, and there are provisions for the acceptance of certain certificates granted in other Commonwealth countries. The number and qualifications of persons required to man ships of various classes are set out in statutory scales.
The seaworthiness of ships is covered by annual survey for compliance as to condition and equipment, and regulations govern the day-to-day operations of ships to ensure their safe navigation and operation.
The pay and many conditions of employment are determined by industrial awards or agreements between shipowners and employee organisations. There are also legislative measures to ensure compliance with some of the international conventions or recommendations relating to the employment of seafarers.
MINING LEGISLATION—The Mines Division of the Ministry of Energy is responsible for working conditions in mines and quarries under the Mining Act 1971, the Coal Mines Act 1979, the Quarries and Tunnels Act 1982, and their attendant regulations.
Working Conditions—In the coal-mining industry working conditions are determined by agreement reached at annual conferences between the coal-mine owners and the employee organisations.
Restrictions on Employment—No person under the age of 16 years may be employed underground in any coal mine, or in any alluvial mine, or on or about any dredge. The minimum age in respect of underground work in a quartz mine is 19 years except in cases where people are required occasionally to do any class of work they normally do above ground. No youth may be employed in a mine for more than 8 hours per day or 48 hours per week except in cases of emergency.
OCCUPATIONAL SAFETY—Measures for occupational safety, involving the Machinery Act 1950, the Construction Act 1959, and a number of other Acts, are discussed in Section 36D.
WORKING CONDITIONS OF STATE SERVANTS—Apart from remuneration (which is discussed in Section 34—Wages) the working conditions of State Servants are controlled by legislation set out in the following paragraphs.
Members of the Public Service are governed by the State Services Act 1962 and the State Services Conditions of Employment Act 1977. Included in the functions of the State Services Commission are the provision of suitable office accommodation, the prescription and supervision of physical working conditions, and also the regulation of a variety of points connected with control—e.g., leave, hours of work.
The New Zealand Railways Corporation Act 1981 and the State Services Conditions of Employment Act 1977 furnish the legislative framework for determination of the working conditions of railway employees. There is a Government Railways Industrial Tribunal, the principal function of which is to adjudicate on single service conditions of work in respect of railway employees.
Working conditions for Post Office employees are determined by the administrative authority, the Postmaster-General, with the Director-General as executive head. Power is vested in the Minister by virtue of the Post Office Act 1959. There is a Post Office Staff Tribunal whose function it is to hear and determine applications referred to it in respect of conditions of employment of Post Office staff.
There are other legislative enactments which apply to the relevant sections of general Government employees. Members of the Police are governed by the Police Act 1958 and the Police Regulations 1959, while there is also a Police Staff Tribunal. The 3 armed services are controlled by the Defence Act 1971.
The Education Act 1964 and amendments authorise, either by regulation or through the agency of education boards, the employment of teachers and other members of the education service. Payment and conditions of service are covered by determinations issued under the machinery set up by the State Services Conditions of Employment Act 1977.
In the hospital service, medical officers are employed under section 52 of the Hospitals Act 1957, paramedical groups under the State Services Conditions of Employment Act 1977, and clerical, trades and other support groups under awards issued in accordance with the Industrial Relations Act.
WATERFRONT INDUSTRY—Work within the waterfront industry is governed by the Waterfront Industry Act 1976. The Act defines waterside work as the loading and unloading of ships, barges, lighters, and other vessels, together with certain other work customarily performed within wharf limits by waterside workers. Work within the waterfront industry includes waterside work and certain other work carried out within wharf limits such as the driving or operation of mechanical cargo-handling equipment, tallying, the shoring and unshoring of cargo, and the work of foremen stevedores and timekeepers. Separate bodies are empowered by the Act to carry out, on the one hand, legislative and judicial functions, and on the other administrative functions only.
Waterfront Industry Tribunal—The legislative and judicial body is the Waterfront Industry Tribunal, which consists of 2 members appointed by the Governor-General on the recommendation of the Minister and as chairman the Chief Judge of the Arbitration Court or a judge of the Arbitration Court nominated by the Chief Judge. The members are appointed for a term of 3 years. The tribunal is a Commission of Inquiry under the Commissions of Inquiry Act 1908. The functions of the tribunal are, firstly, to prescribe the terms and conditions of employment for work within the waterfront industry, and here the tribunals' procedure is similar to that followed by the Government Service Tribunal. To assist with this function, the Act also provides for the Minister of Labour to direct the establishment of conciliation councils each consisting of an independent chairman and an equal number of employers' representatives and workers' representatives. These councils conduct conciliation proceedings on any application to the tribunal which concerns 2 or more ports and the chairman is appointed by the Minister for a term not exceeding 1 year. Secondly, the tribunal is required to settle any disputes that arise in relation to work within the waterfront industry and for this function has the assistance of Port Conciliation Committees which consist of an equal number of employers' and workers' representatives with an independent chairman. Thirdly, the tribunal is a general appeal court from decisions of Port Conciliation Committees (with certain limitations) and to determine appeals from any orders or decisions of the Waterfront Industry Commission imposing levies or charges and in respect of the provision of amenities for waterside workers, as well as against refusal of the commission to register an applicant for entry on the Register of Employers of Waterside Workers.
Waterfront Industry Commission—The Waterfront Industry Commission, which is the administrative body, consists of an independent chairman, 2 members nominated by the Unions of Employers, and 2 members nominated by the New Zealand Waterside Workers' Federation. All 5 members are appointed by the Governor-General on the recommendation of the Minister of Labour for a term not exceeding 3 years. The functions of the commission are, to carry out all administrative work in connection with the engagement, employment, wage and allowances of waterside workers; guaranteed wage payments, annual and statutory holiday payments, and systems of payments by results for waterside workers; and to perform these functions for other workers in the waterfront industry if requested by the employers and workers concerned. Secondly, the commission is responsible for the provision of amenities for waterside workers and for the equipping, operation and management of these amenities which include waiting rooms or assembly halls, restaurants, canteens, and first aid rooms. The commission provides such amenities costing not more than $50,000 each at any port and approves schemes for the provision by harbour boards of amenities costing more than $50,000 each at any port.
Of the remaining functions of the commission, the main ones are the determination of the number of workers to be entered on the Bureau Register for each port so as to ensure the supply of sufficient waterside labour for its efficient working, to be the sole employer of waterside workers for the purposes of the Accident Compensation Act 1972, to train waterside workers in first aid, to publish statistical information in relation to the waterfront industry, and to register employers of waterside labour providing they meet the statutory requirements.
The industrial organisation of waterside workers is on the basis of separate port unions with one association or federation of unions. The port unions and the association are registered through the Registrar of Industrial Unions in the Department of Labour.
ADDITIONAL INFORMATION—Information on working conditions in many industries can be obtained from the appropriate Acts or awards. Many of the Acts are mentioned in this section. Further information on industrial relations, etc., can be found in the following publications.
Prices, Wages, and Labour: Pt B Wages and Labour—Department of Statistics (annual).
Monthly Abstract of Statistics—Department of Statistics.
Labour and Employment Gazette—Department of Labour (quarterly).
Report of the Department of Labour (Parl. paper G. 1).
Report of the Waterfront Industry Commission (Parl. paper G. 2).
Report of the State Services Commission (Parl. paper G. 3).
Wages, Hours, and Employment—Department of Labour (6-monthly).
Industrial Stoppages Report—Department of Labour (annual).
Table of Contents
The Accident Compensation Act 1972, which took effect from 1 April 1974, was one of the most significant developments in social welfare for many years.
The 3 main objectives of the legislation are: (a) to promote safety in every walk of life; (b) to promote the concept of prompt and effective rehabilitation of all people injured by accident so as to restore them to the fullest physical, mental, social, vocational, and economic usefulness of which they are capable; and (c) to provide prompt, fair, and reasonable compensation so that every accident victim will be treated according to his or her real needs.
Cover, embracing all 3 objectives, extends to virtually everyone in New Zealand, from the smallest child to the oldest citizen.
Accident prevention is promoted by a safety team which aims at co-ordinating existing organisations active in accident prevention, and maintaining its own advisory programme.
Similar stress is laid on rehabilitation, and a staff of field officers has been established in offices throughout the country to make personal contact with the injured persons and to ensure that all necessary rehabilitative measures are effectively undertaker.
As far as compensation is concerned, the Accident Compensation Act:
provides immediate benefits for every person who suffers personal injury by accident in New Zealand, regardless of his or her fault and wherever the accident occurred in New Zealand;
entitles the injured person to compensation both for permanent physical disability and also for loss of earnings on an income-related basis;
provides for regular adjustment in the level of payment to injured persons in accord with inflation; and
provides for everyone an effective insurance against personal injury by accident in New Zealand.
In all, New Zealand has a comprehensive system, the essence of which is that the community itself recognises its responsibility for both the accident toll and its effects, and finances and provides for the victims of all accidents however their injuries are caused.
ACCIDENT COMPENSATION CORPORATION—The Accident Compensation Act 1982, replacing the 3-person Accident Compensation Commission by the Accident Compensation Corporation, came into effect on 1 April 1933. It provided for the corporation to consist of:
not more than six members whose qualifications or experience are likely to be of assistance in carrying out the functions of the corporation, and who are to be appointed by the Governor-General on the recommendation of the Minister of Labour;
the managing director of the corporation;
the general manager of the State Insurance Office.
The members of the corporation, acting as a board of directors, are responsible for policy, whereas the managing director is the chief executive officer of the corporation and responsible for the efficient and economic administration of its functions and the supervision of its staff.
The head office of the corporation, based in Wellington, has safety, medical and rehabilitation, compensation, legal research, and corporate functions, each headed by a controller. There are regional offices in Auckland, Hamilton, Palmerston North, Wellington, Christchurch, and Dunedin; and district offices at Whangarei, Takapuna, Otahuhu, Rotorua, Tauranga, Gisborne, New Plymouth, Wanganui, Napier, Lower Hutt, Nelson, Timaru, and Invercargill.
SAFETY—By virtue of its legislative duty to take an active and co-ordinating role in the promotion of safety in all the different areas where accidents can occur, the corporation is involved in the prevention of accidents of every kind, whether they happen at work, on the roads, in the home, on the playing field, or outdoors. It has been recognised by industry that accidents have no economic boundaries, since a worker's productivity is affected equally whether he or she is injured on the job or off the job.
As accidents are reduced there is a corresponding reduction in the need for compensation and rehabilitation and a lessening of the financial drain on the whole community, of which compensation and other “direct” costs are only a portion.
The corporation's safety team comprises specialists in various aspects of accident prevention—including occupational, rural, home, and recreational safety. Education and training form the cornerstone of their activities. An extensive range of residential and in-plant training courses is available, each course tailored to meet the requirements of a different level of employee—top and middle management, safety officers and engineers, supervisors, apprentices, and the rank-and-file worker.
The safety team also assists and co-ordinates the efforts of organisations already doing valuable work in accident prevention.
REHABILITATION—Prompt and successful rehabilitation reduces the need for compensation by returning people to economic usefulness more quickly, as well as in some cases providing them with vocation and self-respect they might otherwise have lost altogether.
In many ways, however, rehabilitation goes hand in hand with compensation. By removing anxiety and economic fear, adequate compensation in itself helps to achieve rehabilitation of the injured. From the outset, earner and non-earner alike are assured of retaining a reasonable enjoyment of life and a reasonable standard of living, despite even the most severe disability.
The corporation's interests in rehabilitation extend to co-operating with existing work and to developing the whole concept in the effort to give the injured person the best possible treatment.
Rehabilitation extends to such matters as reducing the possibility of permanent disability; assisting those who are disabled to make the best possible use of what ability remains or can be developed by new training, further education, or other special help; re-establishing people in employment; modifying homes or workplaces to provide for incapacitated people; providing a wide assortment of rehabilitation aids; providing a car or adapting a car to hand-control so that transport to work is available.
To achieve these objectives, the corporation employs a field force of rehabilitation liaison officers whose function it is to counsel and advise claimants in respect of their needs and who recommend to the corporation what should be done to assist them.
Their services are readily available to all who have cover under the Act, earners and non-earners alike.
COMPENSATION—People are covered against personal injury by accident under a single comprehensive scheme. For administrative and statistical purposes the population may be categorised as:
Earners—Everyone who receives remuneration either as an employee or as a self-employed person is entitled to both earnings-related compensation and other benefits as summarised below.
Motor vehicle accident victims—Everyone injured by the use of a motor vehicle qualifies for all benefits including (if they receive earnings in New Zealand) earnings-related compensation.
All those not otherwise covered—Tourists and people not earning (housewives, children, students, and retired people), who do not normally qualify for earnings-related compensation, are eligible for all other benefits.
The Accident Compensation Act 1982 became effective from 1 April 1983 and provides the following benefits.
BENEFITS PROVIDED: Earnings-related Compensation—The scheme provides for the payment of compensation for loss of earnings at the rate of 80 percent of normal average earnings at the time of the accident, subject to a present maximum of $600 a week. No payment is made by the corporation for the first week following the accident but if it happens at work (including travel to and from work), an employer is generally required to pay an employee 80 percent of his or her normal rate of pay (including overtime) for this period.
If the injured person has more than one job he or she receives 80 percent of full pay for the first week from his or her employer on the job on which the accident occurred and the corporation pays compensation based on the amount he or she would have earned from the other jobs.
After the first week, earnings-related compensation is paid by the corporation during any period of incapacity to all earners, regardless of how or where the accident occurred.
Full compensation is paid during periods of total incapacity, and partial compensation during periods of partial incapacity.
Full-time self-employed persons also qualify for compensation for loss of earnings at the rate of 80 percent of normal average earnings at the time of the accident, but only after the first week, whether or not the accident happens at work. To protect full-time self-employed people, who may have an artificially low income, there is a minimum level of compensation and the option of electing to have assessable income based on the average ordinary-time weekly wage.
Weekly payments generally cease at the age of 65 years, but can continue until the normal retiring age for a particular job. If the accident occurs after 60 years of age, payment continues for a further 5 years; if it occurs after 65 years of age then up to the age of 70 years; and if the accident happens after the age of 70 compensation is payable for 1 year; assuming in all these cases that the injured person was an earner at the time of the accident.
Appropriate adjustments to the amount of compensation payable are made for partial incapacity. In some special circumstances compensation for loss of potential earnings may be awarded.
Earnings-related compensation constitutes taxable income, PAYE tax being deducted at source.
Other Compensation—Provision is made for a wide range of benefits, including compensation for medical and hospital expenses, cost of transport to hospital, or wages paid to an attendant or nurse, and for reasonable expenses resulting directly from the accident.
In addition, the injured person may qualify for payment of a lump sum for permanent loss or impairment of bodily function up to a maximum of $17,000; and for loss of capacity to enjoy life, for pain and mental suffering, and for disfigurement, up to a maximum of $10,000.
Fatal Claims—In the event of a fatal accident the corporation pays reasonable funeral expenses. Also, the dependent spouse of an earner who has died as a result of an accident can qualify for three-fifths of the earnings-related compensation the deceased would have received had he or she been totally incapacitated but still living. For each of up to 2 dependent children, an additional one-fifth may be paid. Thus a widow with 2 or more children could qualify for the full earnings-related compensation her husband would have received had he been totally incapacitated. In addition, a lump sum of up to $4,000 is payable to the totally dependent widow, plus up to $2,000 for each dependent child, to a maximum of $6,000 for the dependent children. Partially dependent widows and children receive a proportion of these amounts.
The same provisions apply to dependent or partially dependent widowers.
Housewives—As well as the appropriate benefits listed under “Other Compensation” and “Fatal Claims”, housewives who are injured in an accident may, if justified, qualify for the cost of home help; or, in certain circumstances, the husband may be compensated for loss of earnings while he is looking after the house until the injured wife can resume her duties.
FINANCING OF COMPENSATION—Accident compensation is a form of compulsory insurance where the community as a whole accepts responsibility for the accidents which inevitably will afflict a proportion of its members, as a consequence of the kind of life that society today demands as its right. The community pays in these ways:
Levies on employers (including the Crown) and on self employed persons. They are paid through the Inland Revenue Department (as agent for the corporation).
Levies on vehicle owners are paid to another agent for the corporation, the Post Office, to pay for motor vehicle accidents.
General taxation pays for other claims through the Consolidated Account.
The employer pays levies on a risk-related scale, ranging from 35 cents to $5 per $100 of wages paid, and he/she classifies his/her employees for the appropriate levy in accordance with the industrial activity in which he/she is engaged. There are special classes for staff on clerical-management and commercial travelling duties, so that the employer can pay for them at a lower levy rate than that for employees engaged directly in his/her industrial activity. The maximum amount on which a levy is payable is $39,000 a year for each employee.
A levy of 0.80 percent of earnings applies to self-employed people, regardless of their industrial activity but the limit of income on which the levy may be imposed is $39,000 a year. Hence, the maximum payable by any self-employed person is $312 a year.
Levies for the motor vehicle accident scheme are collected when motor vehicles are registered or reregistered.
HANDLING OF CLAIMS—The corporation itself deals with all claims in Otago. In all other areas the State Insurance Office is the claims handling agent for most cases, except New Zealand seamen, whose claims are dealt with by P. & I. Services Limited, and serious cases or cases where compensation continues to be paid after 13 weeks. These serious and long-term cases are handled directly by the corporation at its regional or district offices. Claims are made by a worker injured at his place of employment notifying his employer and filling in a claim form which the employer then forwards to the State Insurance Office or the corporation; or, in other cases, by direct notification to the State Insurance Office or the corporation. Claims need to be supported by a medical certificate.
It is intended that there should be no long delays in providing compensation. An injured worker who is hurt at work will receive pay from the employer for the first week if he or she is unable to work. If his or her incapacity continues beyond the first week, earnings-related compensation should become available promptly, so that, effectively, there is no break in the flow of income. He or she will continue to be paid locally, without delay.
The corporation's objective for the self-employed is that earnings-related payments should begin equally promptly after the first week. Difficulties often arise, however, in determining the weekly amount which on a fair and just basis truly reflects loss of earning capacity. More complex arrangements are necessary and these are set out in pamphlets available from all corporation and State Insurance offices.
Naturally, it will take time to assess permanent disability, loss of faculty, potential earnings, pain and suffering, loss of enjoyment of life, and the like, but here again it is firmly intended that delays will be minimised and early payments made once the disability has reached a stable condition.
REVIEWS AND APPEALS—Decisions by the corporation itself or by its agents are subject to a right of appeal. The claimant can first apply to the corporation for a review of the decision. This review will be conducted by the corporation itself, or by a review officer appointed by the corporation. From any decisions made on a review there is a right of appeal to an appeal authority, who has full power to confirm, modify, or reverse any decision by the corporation. There is a further right of appeal to the High Court on a question of law, a matter of general or public interest, or a matter which for any other reason should be heard by the High Court, and to the Court of Appeal on questions of law only.
CLAIMS RECEIVED—The following table sets out the number of claims received, according to the fund with which they were identified. It should be noted that not all claims result in compensation being paid—especially those made to protect the claimant's entitlement when incapacity has not yet arisen but may do in the future.
| Claims | Year Ended 31 March | ||||
|---|---|---|---|---|---|
| 1979 | 1980 | 1981 | 1982 | 1983 | |
| Earners' Fund | 105,963 | 96,745 | 96,652 | 98,866 | 107,433 |
| Motor Vehicle Fund | 11,422 | 11,150 | 11,771 | 11,830 | 12,481 |
| Supplementary Fund | 17,984 | 18,496 | 20,324 | 21,280 | 24,601 |
| Total claims | 135 369 | 126 391 | 128 747 | 131 976 | 144 515 |
INCOME AND EXPENDITURE—In the following income and expenditure table compensation paid and medical expenditure incurred are analysed according to type of expenditure and fund charged. Figures refer to the years ended 31 March 1982 and 1983. It should, however, be pointed out that in many cases compensation will continue to be paid beyond the year in which a claim is made, sometimes until the claimant is aged 65. Hence the claims shown for any given year are not identical with the claims for which compensation was paid in that year. It could therefore be misleading to attempt to match claims with compensation payments. The true cost of any year's claims is not likely to be known until many years later.
| Income, Compensation, and Medical Expenditure | Earners Compensation Fund | Motor Vehicle Compensation Fund | Supplementary Compensation Fund | |||
|---|---|---|---|---|---|---|
| 1982 | 1983 | 1982 | 1983 | 1982 | 1983 | |
| $(thousand) | ||||||
| Income— | ||||||
| Gross levy revenue | 149,318 | 171,177 | 25,650 | 25,760 | ||
| Investment income | 28,188 | 38,922 | 16,447 | 15,560 | ||
| Total income | 177,506 | 210,099 | 42,097 | 41,320 | ||
| Expenditure— | ||||||
| Earnings-related compensation | 68,952 | 94,316 | 11,139 | 14,020 | 148 | 155 |
| Dependant's allowances | 9,939 | 13,466 | 4,251 | 5,595 | – | – |
| Funeral expenses | 612 | 780 | 677 | 796 | 271 | 317 |
| Non-economic loss (i.e. lump sums) | 18,455 | 22,756 | 7,720 | 9,302 | 4,888 | 6,264 |
| Medical treatment | 13,152 | 19,246 | 1,589 | 2,302 | 12,742 | 18,871 |
| Hospital treatment | 2,911 | 5,130 | 538 | 793 | 920 | 1,580 |
| Dental treatment | 1,318 | 1,844 | 254 | 331 | 533 | 794 |
| Conveyance for medical attention | 1,493 | 1,938 | 835 | 1,072 | 802 | 1,054 |
| Rehabilitation | 317 | 308 | 229 | 245 | 87 | 132 |
| Other | 1,100 | 1,520 | 947 | 1,245 | 686 | 974 |
| Total compensation and medical expenditure | 118,249 | 161,304 | 28,179 | 35,701 | 21,077 | 30,141 |
| Safety incentive bonus | 1,076 | 1,140 | – | – | – | – |
| Financial grants | 333 | 320 | 173 | 296 | 142 | 117 |
| Levy revenue collection fee | 3,282 | 2,807 | 981 | 1,021 | – | – |
| General fund transfer | 13,827 | 15,070 | 3,485 | 3,316 | 1,566 | 1,908 |
| Total expenditure | 136,767 | 180,641 | 32,818 | 40,334 | 22,785 | 32,166 |
| Past period adjustment | −127 | +2,178 | +227 | −2,464 | +28x | +6 |
| Balance of fund | 218,226 | 250,363 | 105,227 | 103,749 | +2,029 | −5,761 |
The tables in this section cover accidents in the calendar year 1981. They are confined to claims where victims or their dependants have been compensated for 1 or more of the following:
loss of earnings beyond the sixth day after the accident;
permanent loss or impairment of bodily function;
other non-economic loss;
funeral expenses;
damage to teeth, artificial aids, or clothing;
medical treatment or transport expenses;
cost of home help;
rehabilitation costs; or
certain other unusual costs.
The tables largely exclude injuries causing less than 8 days' incapacity (for which the corporation is not required to pay compensation) and those entailing medical treatment only (for which the doctor is normally reimbursed directly). In addition, the corporation does not always receive claims in the case of non-earners who are injured, which limits the significance of the tables of non-work injuries, especially where children and elderly people are concerned.
Suicides and self-inflicted injuries are not normally compensated for. Any appearing in the tables are the results of the corporation's discretion to pay compensation under certain circumstances or of the fact that some compensation was paid before it was established that injury was self-inflicted.
In previous years' statistics any accidents that occurred while the victim was travelling between work and home were included among work accidents. Such cases, which numbered 3550 (including 52 fatalities) in 1981, are now shown as non-work. This change affects several of the following tables.
Since claims continue to be received and processed some months after the end of 1982, all figures should be treated as provisional only. All numbers and compensation amounts are as recorded at 31 May 1983.
The tables in this Yearbook do not exhaust the range of accident details recorded by the corporation, nor do they attempt to present many of those parameters in combination. The Accident Compensation Corporation is happy to respond to requests for more specific or detailed statistics required for a definite purpose by any organisation or individual.
INJURY DIAGNOSIS—Data on injuries are compiled from certificates given by medical practitioners at the time each claim is made, therefore diagnoses must be regarded as preliminary, although most will not change. Because the dividing line between an injury and a disease is uncertain, some arbitrary divisions have been made. Generally conditions which develop as a result of some clearly discernable accident or repetitive minor trauma are classified as injuries.
| Type of Injury | Site of Injury | Total | ||||||
|---|---|---|---|---|---|---|---|---|
| Head | Neck | Trunk | Upper Limb | Lower Limb | Multiple | Other | ||
| Amputation, avulsion | 548 | – | – | 440 | 41 | – | 2 | 1,031 |
| Burn | 98 | 4 | 50 | 774 | 481 | 274 | 18 | 1,699 |
| Contusion | 602 | 41 | 1,503 | 2,814 | 3,380 | 652 | 47 | 9,039 |
| Dislocation | 10 | 27 | 71 | 1,472 | 457 | 3 | 3 | 2,043 |
| Effect of foreign body | 319 | – | 21 | – | – | – | – | 340 |
| Fracture | 11,213 | 118 | 2,073 | 9,734 | 7,524 | 685 | 42 | 31,389 |
| Superficial injury | 373 | 3 | 70 | 1,270 | 788 | 496 | 70 | 3,070 |
| Injury to internal organ | 1,526 | 3 | 481 | – | – | 9 | 18 | 2,037 |
| Laceration | 1,768 | 14 | 144 | 10,657 | 3,730 | 631 | 65 | 17,009 |
| Injury to nerve, spinal cord | 18 | 61 | 217 | 229 | 30 | 2 | 7 | 564 |
| Sprain or strain | 7 | 1,726 | 13,965 | 6,313 | 12,367 | 385 | 88 | 34,851 |
| Scald | 7 | – | 38 | 137 | 247 | 115 | 6 | 550 |
| Occupational disease | – | – | – | – | – | – | 711 | 711 |
| Other, ill-defined | 4,570 | 5 | 49 | 78 | 91 | 10 | 4,641 | 9,444 |
| Total | 21 059 | 2 002 | 18 682 | 33 918 | 29 136 | 3 262 | 5 718 | 113 777 |
ENVIRONMENT—The environments in which accidents occurred are summarised in the following table, along with the result of the injury. It should be noted that work takes precedence over other environments.
| COMPENSATED ACCIDENTS 1982: ENVIRONMENT AND RESULT OF INJURY | ||||
|---|---|---|---|---|
| Environment | Fatality | Non-fatal | Total Cases | Compensation Paid* |
| * As at 31 May 1983. | ||||
| Number | $(000) | |||
| Work environment | 107 | 44,162 | 44,269 | 38,362 |
| Travelling to or from work | 72 | 3,521 | 3,593 | 4,208 |
| Not adequately described | 65 | 3,560 | 3,625 | 2,162 |
| Other environments | 928 | 61,362 | 62,290 | 44,320 |
| Total | 1 172 | 112 605 | 113 777 | 89,052 |
OCCUPATIONAL STATUS OF VICTIMS—The following table divides victims of compensated accidents into earners and non-earners, and further analyses their occupational status. “Housewife” may include males describing themselves by that term or equivalent ones.
| COMPENSATED ACCIDENTS 1982: OCCUPATIONAL STATUS OF VICTIMS | ||||
|---|---|---|---|---|
| Occupational Status | Environment | |||
| Work* | Non-work | Total | Compensation Paid† | |
* Now excludes accidents in travelling to or from work. †As at 31 May 1983. ‡Includes status and environment not reported. | ||||
| Number | $(000) | |||
| Earners— | ||||
| Employed | 39,401 | 44,930 | 84,331 | 74,003 |
| Self-employed | 4,868 | 2,519 | 7,387 | 8,216 |
| Both employed and self-employed | – | 19 | 19 | 13 |
| Unemployed | – | 136 | 136 | 116 |
| Not adequately described | – | – | – | – |
| Total earners | 44 269 | 47 604 | 91 873 | 82,348 |
| Non-earners— | ||||
| Pre-school child | – | 882 | 882 | 138 |
| School student | – | 9,053 | 9,053 | 1,114 |
| Tertiary student | – | 252 | 252 | 114 |
| Housewife | – | 3,396 | 3,396 | 1,125 |
| Unemployed | – | 687 | 687 | 383 |
| Retired | – | 3,341 | 3,341 | 1,332 |
| Invalidity beneficiary | – | 235 | 235 | 79 |
| Visitor from abroad | – | 408 | 408 | 240 |
| Other or not adequately described | – | 25 | 25 | 17 |
| Total non-earners | – | 18 279 | 18 279 | 4,542 |
| Status and environment not reported | – | – | 3,625 | 2,162 |
| Total victims‡ | 144 269 | 65 883 | 113 777 | 89,052 |
AGE AND SEX OF VICTIMS—The age and sex of accident victims are analysed in the following table. Different age groupings are chosen for earners and non-earners in order to highlight the especially vulnerable ages.
| Age (years) | Earners | ||
|---|---|---|---|
| Males | Females | Total | |
| * For an additional 3625 victims (2664 males. 961 females) the earner status was not reported. | |||
| 0–14 | 500 | 80 | 580 |
| 15–19 | 12,187 | 2,868 | 15,055 |
| 20–24 | 15,780 | 3,041 | 18,821 |
| 25–29 | 11,005 | 1,814 | 12,819 |
| 30–34 | 8,568 | 1,845 | 10,413 |
| 35–39 | 6,504 | 1,741 | 8,245 |
| 40–44 | 5,461 | 1,520 | 6,981 |
| 45–49 | 4,565 | 1,323 | 5,888 |
| 50–54 | 4,256 | 1,242 | 5,498 |
| 55–59 | 3,844 | 933 | 4,777 |
| 60–64 | 1,441 | 334 | 1,775 |
| 65 and over | 752 | 178 | 930 |
| Not stated | 69 | 22 | 91 |
| Total earners* | 74 932 | 16 941 | 91 873 |
| Age (years) | Non-earners | ||
|---|---|---|---|
| Males | Females | Total | |
| * For an additional 3625 victims (2664 males. 961 females) the earner status was not reported. | |||
| 0–4 | 577 | 420 | 997 |
| 5–9 | 1,858 | 1,107 | 2,965 |
| 10–14 | 2,646 | 1,331 | 3,977 |
| 15–19 | 1,631 | 756 | 2,387 |
| 20–29 | 577 | 871 | 1,448 |
| 30–39 | 127 | 757 | 884 |
| 40–49 | 58 | 356 | 414 |
| 50–59 | 141 | 645 | 786 |
| 60–69 | 606 | 1,100 | 1,706 |
| 70–79 | 454 | 1,284 | 1,738 |
| 80–89 | 182 | 643 | 825 |
| 90 and over | 28 | 109 | 137 |
| Not stated | 7 | 8 | 15 |
| Total non-earners* | 8 892 | 9 387 | 18 279 |
WORK ACCIDENTS—The following table analyses compensated work injuries occurring in 1982 by the industrial groups in which the victims were working, and the result of the injury. The groups are those of the New Zealand Standard Industrial Classification (NZSIC).
Because “first-week” incapacity does not usually result in a claim on the Accident Compensation Corporation, it is not possible to compile injury frequency and severity rates as in the past. However, a column is included in the table showing the labour force engaged in each industrial group according to the 1981 Census of Population. From this has been calculated an “injury rate”—that is, the number of compensated accidents per 1000 workers. Although not a comprehensive figure this rate will give a guide to the relative frequency of more serious injuries between the various industrial groups.
It is generally not feasible to make valid comparisons between the figures in the following table and those published for 1973 and earlier years by the Government Statistician. The earlier figures, being derived from claims made under the now-repealed Workers' Compensation Act, included first-week only incapacities. On the other hand, they excluded injuries to self-employed people (notably farmers), which would have particularly affected the number of fatalities shown.
| COMPENSATED ACCIDENTS 1982: WORK ACCIDENTS* BY INDUSTRIAL GROUP | ||||||
|---|---|---|---|---|---|---|
| Industrial Group | Fatal | Non-fatal | Total | Labour Force† | Injury Rate‡ | Compensation Paid§ |
* Now excludes accidents in travelling to or from work. †As recorded at 1981 Census of Population. ‡Compensated claims per 1000 of labour force. §As at 31 May 1983. n.e.c.—not elsewhere classified. | ||||||
| $(000) | ||||||
| Agriculture, hunting, forestry, and fishing— | ||||||
| Agriculture and livestock production | 21 | 3,980 | 4,001 | 113,562 | 35 | 3,876 |
| Agricultural services | 5 | 910 | 915 | 15,135 | 60 | 906 |
| Hunting, trapping, and game propagation | 1 | 47 | 48 | 1,512 | 32 | 64 |
| Forestry | – | 1,077 | 1,077 | 6,636 | 162 | 615 |
| Logging | 5 | 284 | 289 | 3,783 | 76 | 360 |
| Fishing | 8 | 211 | 219 | 3,621 | 60 | 331 |
| Total | 40 | 6 509 | 6 549 | 144 249 | 45 | 6,152 |
| Mining and quarrying— | ||||||
| Coal mining | – | 262 | 262 | 1,548 | 169 | 294 |
| Crude petroleum and natural gas production | 1 | 34 | 35 | 738 | 47 | 39 |
| Metal ore mining | – | 30 | 30 | 399 | 75 | 52 |
| Other mining | 1 | 114 | 115 | 1,971 | 58 | 122 |
| Total | 2 | 440 | 442 | 4 656 | 95 | 507 |
| Manufacturing— | ||||||
| Food | 2 | 9,692 | 9,694 | 70,230 | 138 | 6,312 |
| Beverages | – | 164 | 164 | 5,337 | 31 | 131 |
| Tobacco | – | 41 | 41 | 1,209 | 34 | 20 |
| Textiles | 2 | 380 | 382 | 14,970 | 26 | 406 |
| Wearing apparel except footwear | – | 215 | 215 | 22,344 | 10 | 157 |
| Leather and products of leather substitutes and fur (except footwear and apparel) | – | 174 | 174 | 3,534 | 49 | 132 |
| Footwear (except vulcanised or moulded rubber or plastic footwear) | – | 60 | 60 | 4,695 | 13 | 62 |
| Wood, wood and cork products (except furniture) | 3 | 1,045 | 1,048 | 14,757 | 71 | 953 |
| Furniture and fixtures (except primarily of metal) | – | 304 | 304 | 8,082 | 38 | 307 |
| Paper and paper products | 1 | 457 | 458 | 14,439 | 32 | 483 |
| Printing, publishing, and allied industries | – | 229 | 229 | 19,806 | 12 | 203 |
| Industrial chemicals | – | 183 | 183 | 6,195 | 30 | 244 |
| Other chemical products | – | 174 | 174 | 7,812 | 22 | 183 |
| Petroleum refineries | – | 32 | 32 | 759 | 42 | 58 |
| Miscellaneous products of petroleum and coal | – | 34 | 34 | 549 | 62 | 39 |
| Rubber products | – | 337 | 337 | 6,009 | 56 | 346 |
| Plastic products, n.e.c. | – | 214 | 214 | 5,919 | 36 | 154 |
| Pottery, china, and earthenware | – | 78 | 78 | 1,779 | 44 | 57 |
| Glass and glass products | – | 108 | 108 | 2,862 | 38 | 82 |
| Other non-metallic mineral products | 2 | 360 | 362 | 6,423 | 56 | 326 |
| Iron and steel basic industries | – | 270 | 270 | 4,059 | 67 | 222 |
| Non-ferrous metal basic industries | – | 209 | 209 | 3,048 | 69 | 209 |
| Fabricated metal products (except machinery and equipment) | 1 | 1,144 | 1,145 | 23,643 | 48 | 878 |
| Machinery (except electrical) | 1 | 1,156 | 1,157 | 17,985 | 64 | 1,176 |
| Electrical machinery, apparatus appliances, and supplies | 1 | 462 | 463 | 16,218 | 29 | 349 |
| Transport equipment | – | 864 | 864 | 22,563 | 38 | 595 |
| Professional and scientific equipment, measuring and controlling equipment, n.e.c, and photographic and optical goods | – | 8 | 8 | 1,389 | 6 | 10 |
| Other manufacturing industries | – | 127 | 127 | 4,515 | 28 | 83 |
| Total | 13 | 18 521 | 18 534 | 311 130 | 60 | 14,177 |
| Electricity, gas, and water— | ||||||
| Electricity, gas and steam | 3 | 800 | 803 | 14,100 | 57 | 643 |
| Waterworks and supply | – | 37 | 37 | 1,023 | 36 | 24 |
| Total | 3 | 837 | 840 | 15 123 | 56 | 667 |
| Construction— | ||||||
| Buildings | 5 | 1,591 | 1,596 | 29,298 | 54 | 1,785 |
| Other construction | 5 | 1,235 | 1,240 | 24,807 | 50 | 1,308 |
| Allied trades | 5 | 1,308 | 1,313 | 31,632 | 42 | 1,611 |
| Total | 15 | 4 134 | 4 149 | 85 737 | 48 | 4,704 |
| Wholesale and retail trade, restaurants, and hotels— | ||||||
| Wholesale trade | 2 | 819 | 821 | 67,233 | 12 | 831 |
| Retail trade | 2 | 1,394 | 1,396 | 114,072 | 12 | 1,127 |
| Restaurants, cafes, and other eating and drinking places | – | 411 | 411 | 19,383 | 21 | 349 |
| Hotels, motels, rooming houses, camps, and other lodging places | 1 | 323 | 324 | 17,751 | 18 | 235 |
| Total | 5 | 2 947 | 2 952 | 218 439 | 14 | 2,542 |
| Transport, storage, and communication— | ||||||
| Land transport | 5 | 2,068 | 2,073 | 43,008 | 48 | 2,032 |
| Water transport | 2 | 1,010 | 1,012 | 14,073 | 72 | 1,410 |
| Air transport | 4 | 173 | 177 | 9,627 | 18 | 203 |
| Services allied to transport | – | 73 | 73 | 5,922 | 12 | 51 |
| Communication | 2 | 731 | 733 | 35,199 | 21 | 497 |
| Total | 13 | 4 055 | 4 068 | 107 829 | 38 | 4,193 |
| Financing, insurance, real estate, and business services— | ||||||
| Financial institutions | – | 41 | 41 | 29,565 | 1 | 23 |
| Insurance | – | 27 | 27 | 14,292 | 2 | 31 |
| Real estate | – | 21 | 21 | 6,471 | 3 | 23 |
| Business services (except machinery and equipment rental and leasing) | 1 | 162 | 163 | 39,885 | 4 | 135 |
| Machinery and equipment rental and leasing | – | 38 | 38 | 1,425 | 27 | 45 |
| Total | 1 | 289 | 290 | 91 638 | 3 | 257 |
| Community, social, and personal services— | ||||||
| Public administration and defence | 6 | 2,744 | 2,750 | 77,358 | 36 | 2,201 |
| Sanitary and similar services | 1 | 328 | 329 | 7,842 | 42 | 273 |
| Education services | 1 | 291 | 292 | 68,376 | 4 | 183 |
| Research and scientific institutions | – | 83 | 83 | 6,990 | 12 | 71 |
| Medical, dental, and other health and veterinary services | 1 | 1,593 | 1,594 | 71,208 | 22 | 1,330 |
| Welfare institutions | – | 60 | 60 | 8,472 | 7 | 51 |
| Business, professional, and labour associations | – | 10 | 10 | 2,694 | 4 | 6 |
| Other social and related community services | – | 149 | 149 | 7,533 | 20 | 99 |
| Motion picture and other entertainment services | 1 | 42 | 43 | 7,464 | 6 | 47 |
| Libraries, museums, botanical and zoological gardens, and other cultural services, n.e.c. | – | 45 | 45 | 2,724 | 17 | 36 |
| Amusement and recreational services, n.e.c. | 3 | 372 | 375 | 9,870 | 38 | 334 |
| Repair services, n.e.c. | – | 489 | 489 | 22,734 | 22 | 416 |
| Laundries, laundry services, and cleaning and dyeing plants | – | 40 | 40 | 3,048 | 13 | 30 |
| Domestic services | – | 29 | 29 | 1,935 | 15 | 24 |
| Miscellaneous personal services | 1 | 42 | 43 | 8,619 | 5 | 31 |
| International and other extra-territorial bodies | – | – | – | 708 | – | – |
| Total | 14 | 6 317 | 6 331 | 307 575 | 21 | 5,132 |
| Not adequately described | 1 | 113 | 114 | 45,963 | 31 | |
| Total, all industries | 107 | 44 162 | 44 269 | 1 332 339 | 33 | 38,362 |
In the following table the same data on type of casualty and injury rate are shown by major occupational groups.
| Occupational Major Group | Fatal | Non-fatal | Total | Labour Force* | Injury Rate† | Compensation Paid‡ |
|---|---|---|---|---|---|---|
* As recorded at the 1981 Census of Population. †Compensated claims per 1000 of labour force. ‡As at 31 May 1983. | ||||||
| $(000) | ||||||
| Professional, technical, and related workers | 10 | 1,772 | 1,782 | 183,969 | 10 | 1,725 |
| Administrative and managerial workers | 2 | 223 | 225 | 45,993 | 5 | 317 |
| Clerical and related workers | 2 | 955 | 957 | 214,761 | 4 | 797 |
| Sales workers | 4 | 1,062 | 1,066 | 127,101 | 8 | 1,010 |
| Service workers | 5 | 2,957 | 2,962 | 106,626 | 28 | 2,528 |
| Agricultural, animal husbandry, and forest workers, fishermen, and hunters | 39 | 6,618 | 6,657 | 146,295 | 46 | 6,276 |
| Production and related workers, transport equipment operators, and labourers | 43 | 30,465 | 30,508 | 457,932 | 67 | 25,679 |
| Not adequately described | 2 | 110 | 112 | 49,662 | 30 | |
| Total | 107 | 44 162 | 44 269 | 1 332 339 | 33 | 38,362 |
MOTOR VEHICLE ACCIDENTS—Compensated accidents in which a motor vehicle was involved during 1982 numbered 14 465, or 12.7 percent of all accidents. The following table analyses these cases according to the type of motor vehicle, and whether the victim was an earner and in a work or non-work environment.
| Motor Vehicle | Earner | Non-earner | Total | Compensation Paid† | |
|---|---|---|---|---|---|
| Work* | Non-work | ||||
* Now excludes accidents in travelling to or from work. †As at 31 May 1983. ‡Includes 380 cases where the motor vehicle and status were not reported. | |||||
| $(000) | |||||
| Motorcar | 140 | 4,684 | 1,452 | 6,276 | 7,494 |
| Rental car | 2 | 10 | 4 | 16 | 11 |
| Taxi | 9 | 10 | 8 | 27 | 12 |
| Truck | 127 | 210 | 89 | 426 | 659 |
| Bus | 15 | 48 | 48 | 111 | 40 |
| Tractor | 3 | 1 | 9 | 6 | 4 |
| Motor cycle | 68 | 4,956 | 500 | 5,524 | 6,550 |
| Other | 0 | 2 | 0 | 2 | 1 |
| Not adequately described | 1,366 | 318 | 13 | 1,697 | 2,352‡ |
| Motor vehicle and status not reported | – | – | – | ||
| Total | 1 730 | 10 239 | 2 116 | 14 465 | 17,123 |
ACCIDENT SEQUENCE—Until 1 April 1980 the Accident Compensation Corporation analysed the causes of accidents using internationally recognised classifications promulgated by the International Labour Organisation and the World Health Organisation. While such classifications provided an interesting synoptic view of accidents, they proved inadequate to the needs of users researching how accidents happen and (more importantly) how they can be prevented. The corporation therefore adopted a system that records in a modular and literal form, three aspects of each accident: what the victim was doing immediately before; what went wrong; and how the injury was inflicted. These aspects have been denoted, the activity, the breakdown, and the contact. Without requiring any more information from the claimant, this system provides infinitely more detailed and specific data for users of accident statistics. Papers explaining the system, its application, and its benefits are available from the Accident-Compensation Corporation.
The following 3 tables analyse accident sequence for 1982 by activity, breakdown, and contact, along with the associated compensation. Statistics for designations having fewer than 50 cases are not shown separately, but may be obtained from the corporation.
| Activity | Cases | Compensation Paid |
|---|---|---|
| No. | $(000) | |
| Ascending (including climbing or jumping up onto)— | ||
| Stairs, steps | 691 | 498 |
| Fence, railing, wall etc. | 138 | 101 |
| Ladder (freestanding or n.o.d.) | 110 | 149 |
| Cliff, bank, mountain, rocks etc. | 84 | 73 |
| Other | 512 | 357 |
| Total | 1 535 | 1,178 |
| Boarding or alighting from (excludes jumping from)— | ||
| Car | 395 | 242 |
| Truck, tanker (not articulated) | 196 | 203 |
| Bus, trolleybus | 136 | 72 |
| Tractor (wheeled or n.o.d.) | 57 | 71 |
| Other | 360 | 342 |
| Total | 1 144 | 930 |
| Carrying— | ||
| Heavy object n.o.d. | 363 | 309 |
| Log, plank | 92 | 89 |
| Box | 70 | 61 |
| Awkward object n.o.d. | 67 | 56 |
| Bottle | 61 | 60 |
| Other | 509 | 440 |
| Total | 1 162 | 1,015 |
| Descending (includes climbing down, jumping, diving off, or landing after jumping off)— | ||
| Stairs, steps | 2,226 | 1,747 |
| Ground n.o.d. | 560 | 429 |
| Ladder (freestanding or n.o.d.) | 180 | 240 |
| Cliff, bank, mountain, rocks, etc. | 177 | 202 |
| Truck, tanker (not articulated) | 139 | 122 |
| Floor | 129 | 103 |
| Fence, railing, wall, etc. | 128 | 93 |
| Pool (man-made, includes edge) | 92 | 42 |
| Verandah, balcony, deck, etc. | 73 | 70 |
| Grass | 65 | 49 |
| Bed, bunk, cot, etc. | 60 | 36 |
| Tractor (wheeled or n.o.d.) | 55 | 48 |
| Other | 852 | 768 |
| Total | 4 736 | 3,952 |
| Occupying elevated position on— | ||
| Ladder (freestanding or n.o.d.) | 940 | 1,207 |
| Chair, stool | 399 | 259 |
| Roof | 269 | 498 |
| Truck, tanker (not articulated) | 223 | 278 |
| Scaffolding (fixed or n.o.d.) | 218 | 302 |
| Jungle gym, playground equipment | 131 | 11 |
| Verandah, balcony, deck | 129 | 175 |
| Bed, bunk, cot, etc. | 107 | 43 |
| Tree (includes branch) | 104 | 90 |
| Structure n.o.d. | 101 | 74 |
| Stepladder | 98 | 150 |
| Trailer (not caravan) | 90 | 72 |
| Fence, railing, wall, etc. | 73 | 51 |
| Log plank | 70 | 69 |
| Other | 676 | 771 |
| Total | 3 628 | 4,050 |
| Feeding or outfeeding (machine) | 102 | 66 |
| Running (n.e.c.) on— | ||
| Ground n.o.d. | 2,398 | 1,372 |
| Grass, field (not lawn) | 1,548 | 1,250 |
| Floor (bare or n.o.d.) | 548 | 330 |
| Road | 210 | 215 |
| Path, footpath (paved) | 200 | 117 |
| Other | 163 | 90 |
| Total | 5 067 | 3,374 |
| Handling n.o.d. or n.e.c. (includes throwing)— | ||
| Carcass | 776 | 495 |
| Awkward object n.o.d. | 304 | 240 |
| Heavy object n.o.d. | 240 | 224 |
| Ball | 202 | 108 |
| Log, plank | 178 | 83 |
| Equipment n.o.d. | 169 | 112 |
| Wool, pelt | 126 | 75 |
| Bottle | 122 | 56 |
| Door, gate, lid, etc. | 104 | 43 |
| Sheep | 96 | 58 |
| Sharp object n.o.d. | 85 | 46 |
| Knife | 81 | 29 |
| Box | 67 | 62 |
| Chemical n.o.d. | 66 | 67 |
| Water creature | 61 | 25 |
| Rope (includes wire rope) | 56 | 74 |
| Glass (tumbler) | 54 | 18 |
| Another person | 53 | 39 |
| Other | 1,601 | 1,074 |
| Total | 4 441 | 2,928 |
| In restricted space (includes working in n.c.c.) | 200 | 177 |
| Clearing jam or blockage of (machine or power tool) | 161 | 195 |
| Cleaning or oiling (machine or power tool) | 296 | 273 |
| Lifting or lowering— | ||
| Heavy object n.o.d. | 4,742 | 4,729 |
| Another person | 579 | 504 |
| Box | 398 | 335 |
| Log, plank | 345 | 313 |
| Carcass | 282 | 282 |
| Awkward object n.o.d. | 173 | 206 |
| Furniture n.o.d. | 126 | 101 |
| Drum | 146 | 189 |
| Door, lid, gate, etc. | 113 | 76 |
| Sheep | 103 | 142 |
| Trailer (not caravan) | 100 | 118 |
| Pipe (length of) | 92 | 97 |
| Container n.o.d. | 87 | 58 |
| Internal combustion engine (not motor vehicle) | 55 | 63 |
| Stone, rock | 51 | 38 |
| Tyre | 51 | 45 |
| Lamp-post, pole, etc. | 50 | 50 |
| Other | 1,316 | 1,118 |
| Total | 8 809 | 8,464 |
| Moving n.e.c. (simple)— | ||
| In water | 331 | 139 |
| Other | 8,623 | 6,471 |
| Total | 8 954 | 6,610 |
| Not relevant, or near (within range of)— | ||
| Another person | 772 | 310 |
| Door, gate, lid, etc. | 156 | 86 |
| Car | 86 | 42 |
| Other | 6,858 | 4,189 |
| Total | 7 872 | 4,627 |
| Operating n.e.c. or n.o.d. (machine)— | ||
| Motor mower | 350 | 274 |
| Shearing machine | 141 | 126 |
| Tractor (wheeled or n.o.d.) | 128 | 177 |
| Food cutter, slicer, slitter | 102 | 40 |
| Circular saw (wood) | 101 | 97 |
| Power press | 97 | 142 |
| Grinder (metal) | 84 | 66 |
| Overhand plane | 65 | 76 |
| Drilling machine (metal) | 55 | 33 |
| Welding machine | 55 | 26 |
| Lathe (metal) | 54 | 44 |
| Band saw (wood) | 50 | 26 |
| Other | 1,772 | 1,722 |
| Total | 3 054 | 2,849 |
| Pushing or pulling— | ||
| Door, gate, lid, etc. | 295 | 219 |
| Heavy object n.o.d. | 263 | 275 |
| Handpowered vehicle | 200 | 140 |
| Wool, pelt | 196 | 161 |
| Carcass | 179 | 143 |
| Car | 114 | 78 |
| Rope (includes wire rope) | 111 | 98 |
| Log, plank | 87 | 75 |
| Wheelbarrow | 83 | 95 |
| Awkward object n.o.d. | 60 | 45 |
| Box | 57 | 50 |
| Plant, bush | 51 | 44 |
| Trailer | 50 | 40 |
| Other | 1,025 | 816 |
| Total | 2 771 | 2,279 |
| Adjusting machine or work— | ||
| Internal combustion engine (not motor vehicle) | 164 | 98 |
| Other | 813 | 814 |
| Total | 977 | 912 |
| Riding in or on (passenger or n.o.d.)— | ||
| Car | 1,976 | 1,964 |
| Motor cycle, motor scooter | 559 | 600 |
| Truck, tanker (not articulated) | 97 | 127 |
| Van, utility | 89 | 114 |
| Bus, trolleybus | 67 | 21 |
| Other | 352 | 363 |
| Total | 3 140 | 3,189 |
| Stacking, unstacking, loading, or unloading (manual only)— | ||
| Heavy object n.o.d. | 285 | 305 |
| Box | 174 | 177 |
| Log, plank | 172 | 160 |
| Carcass | 101 | 62 |
| Other | 548 | 451 |
| Total | 1 280 | 1,155 |
| Tending (fire etc.) | 108 | 76 |
| Using (includes driving vehicle)— | ||
| Motor cycle, motor scooter | 6,999 | 7,861 |
| Knife | 4,190 | 1,788 |
| Car | 3,180 | 4,005 |
| Pedal cycle, tricycle | 2,295 | 910 |
| Horse | 887 | 710 |
| Chain saw | 820 | 639 |
| Axe, slasher, cleaver, etc. | 812 | 588 |
| Skis | 670 | 565 |
| Roller skates | 653 | 402 |
| Hammer, sledgehammer | 517 | 339 |
| Spade, shovel | 491 | 413 |
| Sporting implement (not ball) | 433 | 227 |
| Circular saw (hand-held) | 430 | 427 |
| Spanner, wrench | 398 | 169 |
| Welding (etc.) torch | 217 | 109 |
| Truck, tanker (not articulated) | 204 | 393 |
| Crowbar, lever n.e.c. | 172 | 108 |
| Skateboard | 148 | 23 |
| Drill (hand-held, powered) | 147 | 110 |
| Hose | 134 | 78 |
| Saw (hand) | 130 | 51 |
| Trampoline | 124 | 23 |
| Grinder (hand-held, powered) | 109 | 64 |
| Surfboard | 102 | 50 |
| Van, utility | 101 | 175 |
| Parachute | 83 | 112 |
| Pneumatic drill, jack hammer | 72 | 53 |
| Skates (ice) | 70 | 39 |
| Chisel | 65 | 25 |
| Saucepan, frypan (including electric) | 63 | 17 |
| Jack | 60 | 39 |
| Screwdriver | 59 | 34 |
| Other | 3,224 | 2,464 |
| Total | 28 059 | 23,009 |
| Dealing with n.e.c. (animal only, includes human)— | ||
| Another person | 453 | 319 |
| Cow | 446 | 326 |
| Sheep | 425 | 376 |
| Horse | 347 | 360 |
| Dog | 121 | 72 |
| Other | 161 | 126 |
| Total | 1 953 | 1,579 |
| Walking on (flat and level, or n.o.d.)— | ||
| Ground n.o.d. | 3,142 | 2,205 |
| Floor (bare or n.o.d.) | 2,824 | 1,975 |
| Path, footpath (paved) | 1,516 | 734 |
| Road, n.e.c. or n.o.d. | 886 | 935 |
| Undefined surface | 190 | 134 |
| Grass (includes field, excludes lawn) | 160 | 135 |
| Deck, balcony, verandah, etc. | 140 | 116 |
| Pedestrian crossing | 96 | 99 |
| Track, path (not paved) | 67 | 52 |
| Deck of ship | 67 | 95 |
| Lawn | 60 | 57 |
| Other | 585 | 595 |
| Total | 9 733 | 7,132 |
| Combating bodily— | ||
| Another person | 7,058 | 4,573 |
| Other | 5 | |
| Ill-defined | 5 480 | 3,123 |
| Other | 2 052 | 1,337 |
| Total activities | 113 777 | 89,052 |
n.o.d.—not otherwise defined. n.e.c.—not where classified. | ||
SCENE OF ACCIDENT—In the following table compensated accidents are analysed according to the surroundings where the accident occurred, and the result of the injury.
| Scene of Accident | Fatal | Non-fatal | Total Cases | Compensation Paid* |
|---|---|---|---|---|
| * As at 31 May 1983. | ||||
| Number | $(000) | |||
| Air | 21 | 75 | 96 | 311 |
| Beach or shore (not water) | 7 | 616 | 623 | 443 |
| Children's play area | 1 | 85 | 86 | 16 |
| Dwelling (victim's own) | 164 | 18,773 | 18,937 | 12,026 |
| Dwelling (not victim's) | 33 | 2,825 | 2,858 | 1,777 |
| Farm | 33 | 5,200 | 5,233 | 4,975 |
| Hospital | 39 | 1,733 | 1,772 | 1,477 |
| Learning institution, n.e.c. | 0 | 96 | 96 | 94 |
| Motel or boarding establishment | 7 | 368 | 375 | 255 |
| Office | 0 | 341 | 341 | 236 |
| Plant (factory, mill, yard, etc.) | 30 | 31,728 | 31,758 | 26,399 |
| Public building or area, n.e.c. | 12 | 1,739 | 1,751 | 1,072 |
| Railway | 10 | 649 | 659 | 554 |
| Road or street including footpath | 616 | 16,844 | 17,460 | 17,806 |
| School | 4 | 2,931 | 2,935 | 503 |
| Shop | 3 | 1,484 | 1,487 | 1,063 |
| Sports area—indoors | 0 | 2,297 | 2,297 | 1,384 |
| Sports area—outdoors | 10 | 12,315 | 12,325 | 8,884 |
| Tavern, bar | 6 | 856 | 862 | 714 |
| Underground | 0 | 197 | 197 | 208 |
| Uninhabited area | 35 | 3,012 | 3,047 | 2,549 |
| Water (sea, river, lake, etc.) | 60 | 1,194 | 1,254 | 1,359 |
| Wharf | 3 | 738 | 741 | 926 |
| Not adequately described | 75 | 5,582 | 5,657 | 3,319 |
| Other | 3 | 927 | 930 | 702 |
| Total accidents | 1 172 | 112 605 | 113 777 | 89,052 |
The preceding tables give only a very basic outline of the wide range of information on accidents available from the Accident Compensation Corporation. Those requiring fuller information are invited to contact the Chief Research Officer, Accident Compensation Corporation, Private Bag, Wellington.
While the increasing mechanisation on the 71 505 farms in 1980 is principally responsible for the high output per unit of labour engaged in farm production, it is equally responsible for the high number of accidents to persons associated with agricultural production.
Normal farm activities and the bringing into production of new land utilised in 1980 some 35 000 trucks, 49 000 disc harrows, 92 000 agricultural tractors, and 20 000 fertiliser spreaders. These have taken a high annual toll in accidents and deaths. These figures are further aggravated by the use of some 50 000 chain saws, 32 000 farm bikes, and large numbers of chemical-spraying plants.
The increasing use of chemicals in agriculture for weed control, and as pesticides and therapeutants, has added to the hazards to which those engaged in the agricultural industry are subjected. The Ministry of Agriculture and Fisheries undertakes educational activities to endeavour to reduce the accident rates.
Tables in this section present information compiled by the National Health Statistics Centre of the Department of Health on accidents and deaths sustained on farms. Domestic accidents or accidents in farm homes are excluded.
Accidents on Farms—The following table shows the number of patients discharged from or dying in public hospitals in 1982 after treatment for injuries sustained in farm accidents (excluding motor vehicle accidents). Readmissions are included.
| Cause of Accidents | Age of Patients (in Years) | Total Patients | ||||
|---|---|---|---|---|---|---|
| 0–14 | 15–24 | 25–44 | 45–64 | 65 and Over | ||
| Farm machinery | 48 | 66 | 77 | 53 | 14 | 258 |
| Falls | 43 | 28 | 50 | 37 | 7 | 165 |
| Animals | 211 | 128 | 140 | 61 | 23 | 563 |
| Accidental poisoning | 6 | 10 | 9 | 3 | – | 28 |
| Firearms | 2 | 13 | 1 | 1 | – | 17 |
| Fire and flames | 4 | 2 | 2 | 2 | – | 10 |
| Hot substances, corrosive liquids, or steam | 6 | 2 | 7 | – | – | 15 |
| Struck by falling object | 4 | 14 | 27 | 13 | 1 | 59 |
| Cutting or piercing instruments | 7 | 50 | 66 | 27 | 6 | 156 |
| Other and unspecified farm mishaps | 28 | 36 | 101 | 33 | 6 | 204 |
| Total | 359 | 349 | 480 | 230 | 57 | 1 475 |
Deaths from Accidents on Farms—Deaths from accidents on farms (excluding motor vehicle accidents) are shown by cause and age group of deceased in the following table. This refers to the years 1980 and 1981, the latest for which the data are available.
| Cause of Fatal Accident | Age of Deceased (in Years) | Total Deaths | ||||||||||
|---|---|---|---|---|---|---|---|---|---|---|---|---|
| 0–14 | 15–24 | 25–44 | 45–64 | 65 and Over | ||||||||
| 1980 | 1981 | 1980 | 1981 | 1980 | 1981 | 1980 | 1981 | 1980 | 1981 | 1980 | 1981 | |
| Farm machinery | 1 | 1 | 1 | 2 | 5 | 5 | 5 | 2 | 3 | 1 | 15 | 11 |
| Drowning or submersion | – | 7 | – | – | 1 | – | – | – | – | – | 1 | 7 |
| Electric current | – | 1 | 1 | 2 | 1 | 1 | – | – | – | 1 | 2 | 5 |
| Struck by falling object | 1 | – | 1 | 1 | 1 | 2 | – | – | – | 1 | 3 | 4 |
| Falls | – | – | 1 | 2 | – | – | – | – | 1 | – | 2 | 2 |
| Animal being ridden | – | – | 1 | 1 | 2 | – | – | – | – | – | 3 | 1 |
| Other injury by animals | – | 1 | – | – | – | – | 2 | – | 1 | – | 3 | 1 |
| Firearms | – | – | – | – | – | – | 1 | – | 1 | – | 2 | – |
| Other and unspecified | – | – | 1 | – | – | 1 | 1 | 1 | – | 1 | 2 | 3 |
| Total | 2 | 10 | 6 | 8 | 10 | 9 | 9 | 3 | 6 | 4 | 33 | 34 |
The legislation on occupational safety is principally contained in the following statutes (and the regulations made under them). The last two items were actually made under the Electricity Act 1968 but are quoted in their own right.
The Factories and Commercial Premises Act 1981 (sections 18 to 54); the Machinery Act 1950; the Bush Workers Act 1945; the Construction Act 1959; the Accident Compensation Act 1982; the Coal Mines Act 1979; the Mining Act 1971; the Explosives Act 1957; the Dangerous Goods Act 1974; the Boilers, Lifts, and Cranes Act 1950; the Shipping and Seamen Act 1952; the Quarries and Tunnels Act 1982; the Health Act 1956 in so far as it relates to occupational health (see Section 5A); the Petroleum Act 1937; the Geothermal Energy Act 1953; the Electrical Registration Act 1979; the Electric Linemen Act 1959; the Agricultural Workers Act 1977; the Electrical Wiring Regulations 1976; and the Electrical Supply Regulations 1976.
Department of Labour—This department has the largest overall responsibility for the prevention of accidents and illness in industry other than the responsibility of the Accident Compensation Corporation as outlined in section 36A of this Yearbook. The principal statutes administered by the Department of Labour are: the Factories and Commercial Premises Act 1981, which is concerned with safety, health, and welfare in factories and other defined undertakings; the Construction Act 1959, which covers safety, health, and welfare of workmen on construction work as defined in the Act; and the Machinery Act 1950, which is concerned with the inspection of all machinery (with some exceptions covered by other legislation) in work places and the safety of persons working with such machinery. The department also administers regulations under these Acts, and other statutes dealing with specific spheres of occupational safety, health, and welfare, e.g., the Bush Workers Act 1945, and the Agricultural Workers Act 1977 (section 56). In addition the department supervises more than 1518 collective agreements and awards, many of which include specific safety, health, and welfare provisions relating to particular occupations and processes.
The administration of this safety legislation is based primarily on regular inspection of work places and requisitioning for improvements, together with investigation of reported breaches of legislation by employers and workers and investigation of a large number of accidents including serious and fatal accidents in industries coming within the scope of the legislation. The department employs some 190 inspectors of factories (including 14 who specialise in bush undertakings), together with some 58 safety inspectors appointed under the Construction Act 1959, all of whom are qualified by special examination. Their work is substantially preventive. The department also engages in advisory and educational work relating to occupational safety.
A Coordinating Committee for the Development of Occupational Safety and Health, with representation from the Departments of Labour and Health, the Ministries of Energy and Transport, and the Accident Compensation Corporation, ensures that unnecessary overlapping of the functions of all Government agencies involved with occupational safety and health is avoided.
Machinery Act—The Machinery Act 1950, with certain exceptions, applies to all machinery and places an obligation on the owners of machines to securely fence moving and dangerous parts. The Act also covers amusement devices, which require a certificate from a registered engineer that the device is mechanically and structurally safe for the purpose intended. The Act also requires the testing and certification of tractor safety frames used in agricultural operations.
Construction Act—The Construction Act 1959, the provisions of which are in addition to and not in substitution for the safety provisions of any other Act, promotes the safety and welfare of persons engaged in construction work. This description covers a wide variety of work including new construction, maintenance, and demolition of buildings, roads, harbour works, railways, canals, bridges, dams, pipelines, earthworks, etc. Certificates of competency are issued after examination to scaffolders, safety supervisors, and construction blasters. A register of suitably qualified construction divers, crane operators, and construction riggers is maintained.
Explosives and Dangerous Goods Acts—These Acts are primarily concerned with the storage, carriage, and use of dangerous goods, and the import, manufacture, sale, storage, carriage, use, and disposal of explosives. The provisions relate particularly to the safety of workers as well as the general public. In most areas local authorities share with the Department of Labour the responsibility for administering parts of the Dangerous Goods Act.
Ministry of Transport:Safety of Ships—A substantial portion of the Shipping and Seamen Act 1952, administered by the Ministry of Transport, is concerned with the safety of ships and those who sail in them. This Act contains the necessary authority for implementing the provisions of the international conventions of which New Zealand is a signatory. These conventions deal principally with ships engaged on international voyages, but the Shipping and Seamen Act 1952 also contains provisions concerning the safety of all other ships plying in and about New Zealand coastal waters.
Aircraft—The Ministry of Transport is responsible for promoting the safety of aircraft and crews engaged in private and commercial carriage of the public and commercial carriage of goods, including agricultural aviation.
Boilers, Lifts, and Cranes—The Marine Division of the Ministry of Transport carries out inspections of boilers, lifts and power cranes as required by the Boilers, Lifts and Cranes Act 1950. In the calendar year 1983 there were 28 802 inspections of boilers and unfired pressure vessels, 7603 inspections of lifts, and 4222 inspections of cranes. The figures for 1982 were 27 692, 7223 and 4168 respectively. In 1983, 42 accident investigations were carried out under the Act, with 19 people suffering injuries and 3 fatalities. In 1982 there were 33 accident investigations, with 13 people suffering injuries and one fatality.
Ministry of Energy—Three Acts concerned with occupational safety are administered by Mines Division. These are:
The Mining Act 1971 which covers all underground mining other than coal mining.
The Coal Mines Act 1979 which covers all coal mining operations both underground and opencast.
The Quarries and Tunnels Act 1982 which covers opencast mining and quarrying (other than opencast coal mines) dredging and tunnelling. By definition a quarry does not include road or rail cuttings not forming part of a quarrying operation, bridge approaches, building foundations, excavations for the supply of gas, water, electricity or telecommunication facilities, or the construction of sewerage or drainage works.
The Electricity Division of the Ministry is responsible for the administration of Acts designed to ensure the safety of electrical apparatus and installments and of electrical workers.
The Petroleum Division of the Ministry is responsible for the safety of drilling for mining, transport and pipelines for petroleum and gas through the Petroleum Act 1937 and subsequent amendments.
Ministry of Works and Development—The Ministry of Works and Development has a safety management and accident prevention policy which recognises that effective management at all levels is necessary to maintain a safe working environment. To assist with implementing this policy safety officers have been appointed to provide safety management advice to managers and supervisors. Assistance is also given with on-the-job accident prevention training.
Like all employers the department must comply with various Statutory Acts such as the Construction Act 1959 and Regulations 1961, codes of practice.
Occupational Health Centres—The Department of Health provides occupational health centres at strategic points in the Whangarei, Auckland, Hutt, Christchurch, and Dunedin health districts. Attendances at occupational health centres and waterfront clinics in 1983 totalled 20 456 first attendances and 9314 re-attendances.
FURTHER INFORMATION—The Occupational Health and Toxicology Branch of the Department of Health issues a number of occupational health publications including the following:
Diseases Arising from Occupation.
Factory First Aid.
Laboratory Safety.
Motor Garage Hazards.
Plastics.
Respirators and Breathing Apparatus.
Eye Protection.
Occupational Dermatitis.
Hearing Conservation.
Notes on Occupational Health Nursing.
Poisons and Poisonings.
Agricultural Health.
Fumigation.
Occupational First Aid.
Occupational Health Services in New Zealand.
The Rubber Industry.
Isocyanates: Medical and Technical Data.
Other publications containing information on occupational safety include the following:
Safety Supervisors' Guide—Department of Labour.
The Public Health (Parl. paper E. 10).
Labour and Employment Gazette—Department of Labour (quarterly).
Report of the Department of Labour (Parl. paper G. 1).
Table of Contents
New Zealand administers 2 territories—the scattered South Pacific atolls of Tokelau, and the Ross Dependency in Antarctica. A map of Tokelau and the Ross Dependency is shown on page 3 of this Yearbook.
TOKELAU—Tokelau, a non-self-governing territory under New Zealand's administration, consists of 3 small atolls in the South Pacific with a total land area of 12 square kilometres and a population of almost 1600 (estimated) in 1983.
General Information: Geographic—The 3 atolls of Tokelau lie between latitudes 8° and 10° south and longitudes 171° and 173° west. They are Atafu, Nukunonu, and Fakaofo. The central atoll, Nukunonu, is 92 kilometres from Atafu and 64 kilometres from Fakaofo. Western Samoa, 480 kilometres to the south, is the nearest sizeable neighbour.
Topography—Each atoll consists of a number of reef-bound islets encircling a lagoon. These islets, known as motu, vary in length from 90 metres to 6 kilometres, and in width from a few metres to 200 metres. At no point do they rise higher than 5 metres above sea level.
Nukunonu, the largest atoll, is 4.7 square kilometres in area; Fakaofo is 4.0 square kilometres; and Atafu 3.5 square kilometres.
Constitutional History—The islands now known as Tokelau became a British protectorate in 1877, although it was not until 1889 that formal declarations to this effect were made. The British Government annexed the group (then known as the Union Islands) at the request of the inhabitants in 1916 and included it within the boundaries of the Gilbert and Ellice Islands colony. In 1925 administrative control of the Union Islands was transferred to the Governor-General of New Zealand, who was authorised to delegate his powers to the Administrator of Western Samoa. Formal sovereignty was transferred to New Zealand under the 1948 Tokelau Islands Act, which included Tokelau within the boundaries of New Zealand.
People—Although Tokelau lies in a border zone between Micronesia and Polynesia, its inhabitants are Polynesian. They retain linguistic, family, and cultural links with Western Samoa, which are maintained by contact between their administrations, by radio broadcasts, and by church ties. The culture of Tokelau is, however, distinctively shaped by its atoll environment, which has its closest parallel in Tuvalu, with which there are also many links.
Tokelauan is usually spoken on the atolls, but most Tokelauans speak some English, which is taught as a second language.
Population—The population of Tokelau at 1 October 1983 was estimated to be 1595. The breakdown by atolls is shown below with the November 1982 census figures in parentheses:
| Male | Female | Total | ||||
|---|---|---|---|---|---|---|
| Atafu | 300 | (279) | 294 | (295) | 594 | (574) |
| Fakaofo | 307 | (294) | 326 | (325) | 633 | (619) |
| Nukunonu | 184 | (178) | 184 | (181) | 368 | (359) |
| 791 | (751) | 804 | (801) | 1595 | (1552) | |
Administration—Overall responsibility for Tokelau lies with the Administrator of Tokelau, who is responsible to the Minister of Foreign Affairs. In practice, most of the powers of the Administrator are exercised by the Official Secretary of the Office for Tokelau Affairs, which, by agreement with the Government of Western Samoa, is based in Apia. The office co-ordinates the activities of the members of the Tokelau Public Service working on the atolls.
Each year the Administrator presents a report on the territory to the New Zealand House of Representatives.
New Zealand is committed to assisting Tokelau towards a greater degree of self-government and economic self-sufficiency. In June 1981 a mission from the United Nations Special Committee on Decolonisation visited Tokelau, at the invitation of Tokelau and New Zealand, to ascertain the wishes of the people concerning their future. The people of Tokelau informed the mission that at present they did not want to review the nature of the existing ties between New Zealand and the territory.
New Zealand has taken steps to ensure that the Tokelau Public Service is properly responsive to, and equipped to meet, Tokelau's needs and wishes. Increasingly the Administrator and the Official Secretary, in his role as the Administrator's representative, act in a supervisory capacity only with the Tokelau Public Service operating under the overall direction of the village representatives.
Considerable practical assistance is received from the Government of Western Samoa, whose officers (medical and public health officials, for example) are made available to the Tokelau Public Service on request. Moreover, Samoa has generously arranged for United Nations and other experts working in Samoa to make available their expertise to Tokelau.
Judiciary—The Tokelau Amendment Act 1970 gives the High Court of Niue civil and criminal jurisdiction in Tokelau as if that court had been established as a separate Court of Justice in Tokelau. It also gives the High Court of New Zealand concurrent jurisdiction in respect of civil matters and also criminal offences where the offender is found in New Zealand and where the offence with which he/she is charged, if committed in New Zealand, would have been an indictable offence under New Zealand law. (In addition the District Courts in New Zealand have limited jurisdiction in respect of those criminal offences for which the High Court of New Zealand has jurisdiction.) The Act further gives the High Court of New Zealand jurisdiction to determine cases stated by and appeals from final judgments of the High Court of Niue in either civil or criminal jurisdiction. Provision is also made in the Act for the appointment of Tokelauan commissioners, currently the faipule on each of the 3 atolls, who exercise a limited jurisdiction in respect of civil and criminal matters, and from whose judgments a right of appeal lies to a judge of the High Court of Niue.
Crime Prevention—There are 7 Tokelauan police officers—3 on Fakaofo, and 2 each on Atafu and Nukunonu. They are responsible to the village authorities for the enforcement of law and order and to the Tokelau Public Service for their various civil duties. There is little crime, and there are no prisons. Punishment generally takes the form of public rebukes, fines, or labour.
Public Service—At 31 March 1983, the Tokelau Public Service totalled 182. The Tokelau Public Service is almost exclusively staffed by Tokelauans and efforts are continuing to attract New Zealand-based Tokelauans with appropriate skills and qualifications to the Tokelau Public Service.
Employment in the Public Service provides the only regular source of income in Tokelau. In order to ensure that this income is distributed equitably the elders on all 3 islands agreed with the Official Secretary to begin rotating all wage-worker positions as from March 1983.
Local Government—In the villages of Nukunonu and Atafu the dominant political institution is a council of elders (taupulega), comprising the head of each family group, together with the faipule and pulenuku. In Fakaofo the taupulega is made up of the faipule, the pulenuku, and selected village elders; meetings involving all the heads of family groups are held only infrequently. The faipule represents the village at large in its dealings with the administering power and the Public Service and presides at meetings of the council and the court. The pulenuku is responsible for the administration of village affairs such as the scheduling of work, cleanliness, water supplies, and the inspection of plantations. The village clerk (failautuhi) keeps records of village meetings and transactions.
Matters concerning Tokelau as a whole are discussed at the general fono (which usually convenes at least once a year), to which each atoll sends a delegation led by its faipule.
New Zealand has been conducting a programme of political education in Tokelau with the aim of encouraging the Tokelauans to play a more active role in the running of their own affairs. A recent important development has been the forming of a budget advisory committee of the general fono, consisting of 4 elders from each atoll, in order to involve the Tokelauan leaders directly in the establishment of priorities of expenditure for Tokelau's annual budget.
Suffrage—The faipule and pulenuku are democratically elected by universal adult suffrage at 3-yearly intervals. The last election was held in January 1984.
Economic Conditions—Tokelau's size, isolation, and lack of land-based resources allow little scope for economic development. The principal revenue earners are copra, stamps, souvenir coins, and handicrafts. Money is also remitted to Tokelauan families from relatives in New Zealand.
A Community Services Levy was introduced on 1 January 1983 following passage of the Tokelau Amendment Bill in the New Zealand Parliament in December 1982. The purpose of the levy is to redistribute income more broadly within the Tokelauan community by taxing salary, wage and honoraria earners.
The revenue derived from the levy are used to subsidise copra and handicraft production, and to pay honoraria for village council members.
Tokelau has in the past had a subsistence economy, based in the main on the resources of the sea, the plant cover of the atolls (chiefly the coconut and pandanus palms and certain types of tree used for housing and canoe-making) and livestock. There has been little demand for the material standards of more developed countries, but increasing contacts with Western Samoa and New Zealand have stimulated a desire amongst the people to advance their living standards.
Public revenue is derived from an export tax of 10 percent on handicrafts, from shipping and freight charges, the sale of postage stamps and coins, from customs duties, and the return from radio and telegram services. New Zealand's budgetary aid for the year ended 31 March 1984 was $2.64 million.
Village Revenue—Village revenue is derived principally from overseas remittances—funds sent by the Tokelauan communities in New Zealand for village and church projects, for example—and from the export tax levied on copra at the rate of 10 percent ad valorem of its f.o.b. value at the port of Apia. This revenue is paid into special funds, the utilisation of which is determined by the authorities of the village. The funds attract a 2: 1 subsidy from Tokelau's general budget.
A co-operative store has been operating on each atoll since 1978.
Development Assistance—New Zealand's Bilateral Aid Programme continues to be Tokelau's main source of development assistance. Substantial assistance is provided by the South Pacific Commission, the South Pacific Bureau for Economic Co-operation, the International Labour Organisation, and the United Nations, in areas such as communications, technical training, health, fishery development, and village development.
Land Tenure and Usage—All land is held by customary title in accordance with the customs and usages of the inhabitants. The Tokelau Amendment Act 1967 provides that the people of Tokelau may dispose of their land among themselves according to their customs, but they may not alienate land by sale or gift to non-indigenous inhabitants. Land holdings pass from generation to generation within the families, being held by the head of the family group. Some land is held in common.
Principal Crops—Tokelau's soil is thin and infertile and has resisted all efforts to increase its productivity by the application of fertilisers. Apart from copra, agricultural products are of a basic subsistence nature. Food crops consist of coconuts, pulaka, breadfruit, ta'amu, pawpaw, the fruit of the edible pandanus, and bananas.
Livestock and Fisheries—Livestock comprises pigs and fowls. Ocean and lagoon fish and shellfish are available in quantity, and form a staple constituent of the diet. The most common species of fish caught are tuna, bonito, trevally, and mullet.
At the request of the general fono (the councils of the 3 atolls in joint session), New Zealand implemented Tokelau's Exclusive Economic Zone on 1 April 1980 and entered into negotiations with third countries on the declaration and licensing of the zone as appropriate. The benefits of Tokelau's 200-mile Exclusive Economic Zone will accrue to the Tokelauans.
Transport—A chartered vessel travels to Tokelau from Apia 10 to 12 times a year.
Social Conditions—Society is centred on the extended family group (kaiga). Village affairs are the prerogative of the council of elders (taupulega), which includes representatives of all the family groups.
Labour and Employment—Copra production and the manufacture of plaited ware and woodwork are the only industries of significance in Tokelau, and no supervision of employment conditions in these industries is necessary. Most labour is devoted to procuring food from lagoon, ocean, or plantation, to village maintenance, and to the production of woven mats, fans, and curios. The various public works programmes and projects also provide employment.
Health—The health authorities in Tokelau receive advice and guidance from Apia, the South Pacific Commission, and the World Health Organisation. Each atoll has its own hospital and medical staff. In addition, each atoll has an active women's committee, and to these committees much credit is due for their work in village health and sanitation. A dentist and a school dental nurse travel between all 3 islands.
Education—Each atoll has a modern and well-equipped primary school catering for children between the ages of 5 and 15. Schooling is free and attendance is close to 100 percent. Pre-school classes are also run in each village.
The New Zealand Department of Education provides advisory services to the 3 school principals and also helps with the provision of materials and equipment. The schools are usually inspected annually by a senior officer of the department.
Tokelau's teaching establishment stands at 40 qualified teachers and 15 teacher aides. The schools are equipped with radio sets, tape recorders, and slide and movie projectors. Each island has a parents' committee which helps in the raising of funds and in the organisation of school activities.
Schooling in Tokelau is aimed both at preparing children for life in Tokelau and at equipping them to pursue their studies or undertake a career in New Zealand.
Two expatriate New Zealand teachers are employed in Tokelau to assist the Director of Education in the Office for Tokelau Affairs to review school curricula, provide inservice training of teachers, and upgrade teaching standards.
ROSS DEPENDENCY—The Ross Dependency consists of the sector of the Antarctic continent between 160° east and 150° west, together with the islands between those longitudes, and above 60° south—that latitude being also the extremity of the Antarctic Treaty area. Within these bounds there are about 400 000 to 450 000 square kilometres of land and 330 000 square kilometres of permanent ice shelf. The land, apart from the mountainous regions and some coastal areas, is entirely covered by ice, and the only human populations to be found are the people involved in scientific research programmes.
Historical Notes—The territory is named after James Clark Ross, leader of a British expedition of 1839–43 which penetrated the Ross Sea and discovered the Ross Ice Shelf, McMurdo Sound, and Ross Island. The 2 main peaks of Ross Island are named after his ships Erebus and Terror. Ross's reports on his expedition were a significant factor in the development of the whaling industry in Antarctic waters, but the lack of other commercial opportunities at the time led to a decline in interest in Antarctica in the ensuing 50 years.
Between 1889 and 1917 there was a resurgence of interest, and 10 expeditions established bases on the Antarctic mainland, 7 of them in the Ross Sea area. Five were under the sponsorship of Britain, the exceptions being the Norwegian expeditions in 1910–12 and a Japanese expedition in 1911–12. Of these, the British expedition of 1898–1900, which included a New Zealander among its members, was the first to establish a base on the Antarctic continent—at Cape Adare in February 1899—and to winter-over.
Administration—Britain claimed the Ross Sea Area under the British Settlements Act 1887. Thirty-six years later, by Order in Council dated 30 July 1923, the territories of the Ross Dependency were brought within the jurisdiction of New Zealand.
Administrative powers over the territory are vested in the Governor-General, who from time to time has promulgated laws by regulation or by Order in Council. An example is the Territorial Sea and Exclusive Economic Zone Act 1977, making provision for the implementation of a 200-mile Exclusive Economic Zone in the Ross Dependency.
Since 1956 the Officer-in-charge of the New Zealand Expedition at Scott Base has been vested with the powers of Justice of the Peace and Coroner. The Officer-in-charge also has jurisdiction over all New Zealand nationals in Antarctica, as well as being responsible for carrying out the Antarctic Research Programme directed by Antarctic Division of the Department of Scientific and Industrial Research (DSIR).
At the political level, New Zealand's international relations on Antarctic affairs are conducted by the Ministry of Foreign Affairs.
New Zealand Bases—Scott Base, at Pram Point near Cape Armitage on Ross Island, was established for the first New Zealand expedition involved in the Antarctic Scientific Research Programme during the International Geophysical Year 1957. Since then this base has been continuously occupied by support staff and scientists. Other bases are Vanda Station, near the shores of Lake Vanda in the Dry Valleys region, and Cape Bird, 100 kilometres north of Scott Base on the northern tip of Ross Island—both used for only part of the year.
Scientific Programme—For the past 27 years New Zealand has been a direct participant in Antarctic scientific research. The Ross Dependency Research Committee draws up the annual scientific programme for approval by the Minister of Science and Technology; and the Antarctic Division of the
DSIR then has the responsibility for detailed planning and implementation. International co-operation is a major feature of the scientific programmes, with the main channels for scientific contact with other countries being the National Committee on Antarctic Research—a member body of the Royal Society of New Zealand.
Antarctic Treaty—In 1959 New Zealand was one of the original 12 nations to sign the Antarctic Treaty, which requires that Antarctica be used for peaceful purposes only and promotes international co-operation, freedom of scientific investigation and exchange of information and scientific personnel. The treaty specifically stipulates that there is no prejudice to existing territorial claims in Antarctica.
The Antarctic Treaty consultative parties, who now number 16 since the accession of Poland in 1977, the Federal Republic of Germany in 1981, and India and Brazil in 1983, meet regularly to consider questions of mutual interest within the treaty framework. In recent years, questions of resource management have assumed considerable significance. Several countries, almost all of them consultative parties, are catching protein-rich krill; and there is considerable interest in the hydrocarbon potential in Antarctic waters. A series of special meetings convened to discuss these issues led to the conclusion in 1980 of a Convention on the Conservation of Antarctic Marine Living Resources, which entered into force early in 1982. Discussions about Antarctic mineral resources are however continuing, and the Antarctic Treaty consultative parties held further consultations in Bonn and Washington in 1983.
The Antarctica Amendment Act 1970 provides means of enforcing certain regulations contained within the Antarctic Treaty (known as the Agreed Measures for the Conservation of Antarctic Fauna and Flora) and the prevention of pollution to the Antarctic continent and surrounding waters. The Antarctic Marine Living Resources Act 1981 provides similar powers in respect of the 1980 convention.
Table of Contents
HUMAN RIGHTS—An Act to establish a Human Rights Commission and to promote the advancement of human rights in New Zealand in general accordance with the United Nations International Covenant on Human Rights was passed by Parliament in November 1977 and came into force in September 1978.
The Human Rights Commission, established by the Act of the same name, has the general functions of promoting, encouraging, and co-ordinating programmes and activities in the field of human rights, and the specific functions of investigating alleged breaches of the wide-ranging provisions against discrimination on grounds of sex, marital status, or religious or ethical beliefs set out in Part 11 of the Act. (Part II also makes unlawful any discrimination on grounds of colour, race, or ethnic or national origin in a number of areas of activity not already covered by the Race Relations Act 1971.)
The membership of the commission consists of the Chief Human Rights Commissioner (the chairman), the Chief Ombudsman, the Race Relations Conciliator, the Proceedings Commissioner, and up to three others appointed by the Governor-General on the recommendation of the Minister of Justice.
An Equal Opportunities Tribunal was constituted under the same Act. The Tribunal consists of a chairman, who must be a barrister or solicitor of the High Court, and two other persons appointed by the chairman for the purposes of each hearing from a panel maintained by the Minister of Justice. The principal function of the Equal Opportunities Tribunal is to adjudicate in civil proceedings brought by the commission alleging discriminatory practice under Part II of the Act. There are offices for receiving complaints under the Human Rights Commission Act in Auckland, Wellington, and Christchurch.
RACE RELATIONS—The Race Relations Act. 1971 was designed to affirm and promote racial equality in New Zealand and implements the International Convention on the Elimination of All Forms of Racial Discrimination. Discrimination is unlawful on the grounds of colour, race, or ethnic or national origins for; (a) access by the public to places, vehicles, and facilities; (b) provision of goods and services; (c) employment (including employment of independent contractors); (d) land, housing, and other accommodation. It is also unlawful to publish or display any advertisement or notice which indicates an intention to commit a breach of any of these provisions.
A breach of any of the provisions may be the subject of an investigation by the Race Relations Conciliator.
The Act also makes it an offence to incite racial disharmony.
The most important role for a race relations mediator is in situations where misunderstanding due to different racial backgrounds or concepts on the part of the parties has occurred. Potential racial incidents can often be avoided by a mediator with an explanatory role. This extension of the conciliator's duties from an area confined to complaints of racial discrimination to one where discrimination may not have occurred, but where racial misunderstanding exists, is in keeping with the aims of the Act of affirming and promoting racial equality in New Zealand.
There are offices for receiving complaints under the Human Rights Commission Act and the Race Relations Act in Auckland, Wellington, and Christchurch.
METRICATION—The Metric Advisory Board was set up by the Government in 1969 to encourage, advise, and assist the progressive adoption within New Zealand of the metric system of weights and measures. The conversion to this system was substantially completed by the end of 1976.
New Zealand's decision to change to the metric system was based almost entirely on the necessity to keep in step with her overseas trading partners. The metric system is not only simpler and more efficient than the imperial system but also has the benefits of internationally agreed definitions and standardisation. The modern version of the metric system known as the “International System” (also called SI—“Systeme International d' Unites”) was adopted for use in New Zealand. This system has also been adopted by other countries that have recently changed to the metric system. A table showing the relationships between British (Imperial) units and SI (Metric) units is included in the front pages of this Yearbook.
PATENTS, DESIGNS, AND TRADE MARKS—The Patents Act 1953, The Trade Marks Act 1953, and the Designs Act 1953 are administered by the New Zealand Patent Office situated in Levin House, 330 High Street, Lower Hutt. The main function of the Patent Office is to examine patent, trade mark, and design applications to ensure that only those which comply with the requirements of the relevant Act are granted (in the case of patents) or registered (in the case of trade marks and designs).
Patents are granted for a maximum period of 16 years, provided that the appropriate renewal fees are paid at 3-yearly intervals. Trade marks may be kept on the register indefinitely as long as renewal fees are paid after an initial period of 7 years and every 14 years thereafter. Registration of designs is for an initial period of 5 years, with provision for 2 more 5-year periods (giving a maximum of 15 years).
New Zealand is a party to the International Convention for the Protection of Industrial Property (the Paris Convention). Under this convention, each member state provides the same protection to the inventions, trade marks, and registered designs of the nationals of other member states as it accords to those of its own nationals.
Details of patent, trade mark, and design applications and registrations are published in the New Zealand Patent Office Journal which is published monthly and is obtainable from the New Zealand Government Printing Office. The total number of applications for the grant of letters patent, and for the registration of designs and trade marks during the financial year 1982–83 was 8997, which was 182 more than in the previous year.
The following table shows the number of applications for patents and for the registration of trade marks and designs for March years.
| March Year | Patents | Trade Marks | Designs |
|---|---|---|---|
| 1977–78 | 3,085 | 3,779 | 451 |
| 1978–79 | 3,221 | 4,155 | 574 |
| 1979–80 | 3,250 | 4,468 | 490 |
| 1980–81 | 3,369 | 4,650 | 545 |
| 1981–82 | 3,504 | 4,725 | 586 |
| 1982–83 | 3,582 | 4,724 | 691 |
Patents—The 3582 applications received during 1982–83 were broadly classified as follows: chemistry, 1432; mechanical engineering, 738; building technology, 342; electrical engineering, 392; primary industries, 305; and home science and miscellaneous, 373.
Applications originating in New Zealand totalled 981; the United States, 1041; the United Kingdom, 452; Australia, 237; Switzerland, 141; West Germany, 201; France, 110; Japan, 105; Italy, 43; the Netherlands, 68; Sweden, 57; Canada, 31; South Africa, 20; Denmark, 17; and the balance of 78 from 18 other countries.
Trade Marks—During the year 1982–83 applications for trade marks totalled 4724. The countries from which the applications for the registration of trade marks originated were: New Zealand, 2063; United States, 986; United Kingdom, 407; Australia, 323; Germany, 117; France, 136; Japan, 228; Switzerland, 74; Italy, 48; South Africa, 48; Canada, 39; Netherlands, 51; Sweden, 37; Hong Kong, 24; Denmark, 17; and Finland, 14; with the remaining 112 distributed among 24 other countries.
Trade marks registered during 1982–83 totalled 3083. Renewal of registration of 2711 trade marks was effected during the year.
Designs—A total of 1080 industrial designs were registered during 1982–83.
Industrial Property Advisory Committee—This committee was set up in 1981 to advise the Minister of Justice on industrial property matters. It is serviced by the Patent Office.
COPYRIGHT—Under the Copyright Act 1962, copyright comes into existence automatically upon the completion of any original literary, dramatic, musical, or artistic work (including photographs). No registration is necessary (or even possible), nor is any other formality required for securing copyright protection.
Copyright also exists in New Zealand for sound recordings, cinematograph films, broadcasts, and published editions (typography) of literary, dramatic, and musical works.
Copyright in literary, dramatic, musical, and artistic works (except photographs) continues until 50 years after the author's death, if the works are published in the author's lifetime, and until 50 years after publication or 75 years after death (whichever is shorter) if they are unpublished at the death of the author. Copyright in photographs, sound recordings, cinematograph films, and broadcasts continues until 50 years after the making, and in editions until 25 years after publication.
Copyright in New Zealand in literary, dramatic, musical, and artistic works and in cinematograph films extends to all countries which are parties to the International Convention for the Protection of Literary and Artistic Works (Berne Copyright Union) and to all countries which are parties to the Universal Copyright Convention. In some cases, sound recordings, broadcasts, and published editions are also protected overseas. New Zealand is a party to both conventions. Most countries of the world have acceded to the one or the other or both conventions.
In 1976, New Zealand acceded to the Convention for the Protection of Producers of Phonograms Against Unauthorised Duplication of their Phonograms. The Convention obliges each contracting state to protect the producers of phonograms (i.e., records, cassettes, and other exclusively aural fixations of a performance or other sounds) against the unauthorised reproduction of their phonograms, and against the importation and distribution to the public of such unauthorised reproductions.
In New Zealand certain disputes relating to performing rights of copyright works, sound recordings, or films may be determined by the Copyright Tribunal.
INDUSTRIAL DESIGN COUNCIL—The New Zealand Industrial Design Council was established under the Industrial Design Act 1966 to promote the development of industrial design with the object of improving the quality, efficiency, packaging, and appearance of goods produced in New Zealand. It works closely with relevant Government departments, statutory bodies, and professional design organisations, and maintains regular contact with the manufacturers' and retailers' federations and other organisations interested in industrial design. Products which meet high standards of design and manufacture are awarded Designmark. Recipients of Designmark whose products meet a set criteria and pass a further stringent evaluation are eligible to apply for the New Zealand Design Award. The council gives assistance through its field advisory service to improve products which do not meet these standards. This can include the recommendation of designers from its designer service. Product improvement is also effected through conferences and specialised seminars. The council has established the annual Prince Philip Award for New Zealand Industrial Design with the backing of His Royal Highness to recognise and promote the best of New Zealand's well designed products.
The council maintains a reference library at its Wellington headquarters.
STANDARDS COUNCIL—The Standards Act 1965 established the Standards Council as the governing body of the Standards Association of New Zealand (SANZ). Its aims are to improve efficiency and stimulate development in industry and commerce by providing standards documents, which will also assist in promoting public and industrial welfare, health, and safety. The association administers the standard certification mark scheme, which encourages improved quality control in industry with consequent improvement in the quality of consumer goods.
It also provides a service known as Technical Help to Exporters (THE) which provides assistance to manufacturers whose products need to comply with the standards and regulations of overseas markets.
The council regards international standardisation as an important factor in facilitating international trade. The association is the New Zealand member of the International Organisation for Standardisation (ISO), the International Electrotechnical Commission (IEC), and the Pacific Area Standards Congress (PASC). For the 1983–85 term the Standards Association of New Zealand has been elected to serve as a council member of the International Organisation for Standardisation.
The SANZ library holds over 170 000 overseas or international standards. Copies of all standards, from whatever source, can be obtained from the association's sales service.
The association publishes new and revised New Zealand Standards and amendments. Details of these and of other national and international standards activities are given in a monthly publication, Standards. A catalogue, published annually, lists all the standards in use in New Zealand.
The association depends on the subscriptions of members and on sales of standards for a large proportion of its income. Sales of standards exceed $700,000 annually and the subscribing membership of the association, which includes most of the more prominent manufacturers and local authorities, totalled 1729 at 31 March 1983.
PUBLIC TRUST OFFICE—In the early years of settlement in New Zealand those who wished to make provision for the administration of their estates on their deaths often experienced difficulty in selecting a suitable person competent and willing to act as trustee. That difficulty was natural in a new country where the colonists were fully occupied with their own affairs, and were unable to give to the property or business of another the close attention that was demanded.
In these circumstances the Public Trust Office was established in 1872 (it is now constituted under the Public Trust Office Act 1957) under the administration of the Public Trustee, a corporation sole with perpetual succession and a seal of office. The main purpose of the original Act was to provide a means of overcoming the difficulties that have been mentioned and to make available to the public a trustworthy administrator of the estates of deceased persons at a reasonable cost, the integrity of the Public Trustee and his officers being guaranteed by the State. That continues to be the chief function of the Office, but since its establishment the range of services has been considerably extended. The Public Trustee now acts in many capacities, e.g., as administrator in intestate estates; executor and trustee under wills; trustee under marriage and other settlements; trustee of benefit or relief funds; agent or attorney for absentees or persons desiring to be relieved of business worries; sinking fund commissioner for local authorities; administrator of unclaimed lands and property; manager of the estates of protected patients; manager (when so appointed by the court) of the estates of aged and infirm persons unable to attend to their own affairs; and trustee of compensation moneys. The wills of persons desiring the Public Trustee to act as their executor and any subsequent will or codicil may be prepared and held in safe custody by him, free of charge. With certain qualifications the Public Trustee may act jointly with another person or persons.
In lieu of obtaining probate or other grant of administration, the Public Trustee may file in an office of the High Court an election by him to administer an estate (testate or intestate) if the gross value of the property in New Zealand is estimated not to exceed $40,000. If after the filing of the election the value of the property is found to exceed $60,000 the Public Trustee must obtain a grant of probate or administration in the ordinary way.
During the year ended 31 March 1983, 6244 estates and funds valued at $158.7 million were accepted for administration. Estates and funds under administration at 31 March 1983 numbered 36 780 and were valued at $637.6 million.
Capital moneys becoming available for investment either form part of the Common Fund of the Office or are invested in securities authorised by S. 30A of the Public Trust Office Act 1957. Testators or settlors also have the option of specifically excluding investment in the Common Fund in which case the provisions of S. 4 Trustee Act as amended by S. 3 Trustee Amendment Act 1974 apply.
Interest is allowed on moneys in the Common Fund at the rate fixed from time to time by the Governor-General in Council and is free of all commission and other charges. Both capital and interest are guaranteed by the State, thus affording the complete security that it is the object of the Office to provide. On the other hand, moneys invested pursuant to S. 30A or directed to be invested in specific securities do not carry the State guarantee and, subject to the Public Trustee's ordinary liability as a trustee any loss resulting from their investment falls upon the estate concerned. Commission is charged on the collection of the interest.
Charges and commission rates are contained in the Public Trust Office Regulations 1958.
New investments completed during the year ended 31 March 1983 totalled $16.5 million. The investments held by the Office at 31 March 1983 totalled $120.4 million. These figures relate exclusively to Common Fund investments, and do not include other special investments made on behalf of estates, or investments which constitute assets of estates when the latter came under the Public Trustee's administration and which are still held as assets of those estates.
During the year ended 31 March 1983, 27 015 wills appointing the Public Trustee executor were deposited with him for safe custody. The total number of such wills held on deposit at 31 March 1983 was 322 166. During the year ended 31 March 1983 effect was given in 12 066 cases to changes desired by testators.
BANKRUPTCY—The law relating to bankruptcy in New Zealand is contained in the main in the Insolvency Act 1967 and the Insolvency Regulations 1970. Jurisdiction in bankruptcy matters is vested in the High Court.
All proceedings in bankruptcy are commenced by a petition filed in the court. A petition may be filed either by the debtor or by a creditor. The filing of a debtor's petition is equivalent to an order of the court adjudging the debtor a bankrupt, no order being required in this case. Not less than $200 in the aggregate must be owing by the debtor to the creditor or creditors filing a petition.
The Official Assignee is empowered to sell the bankrupt's property, to claim debts due to the bankrupt estate, to carry on the business of the bankrupt so far as is necessary or expedient for its beneficial winding up, or to divide the property among the creditors. The bankrupt may be appointed by the Official Assignee to manage his estate or carry on his business on behalf of the creditors.
Creditors may accept a composition in satisfaction of the debts due to them. In such a case, after approval of the court, a deed of composition is executed and filed, and the bankruptcy annulled.
On application being made by the bankrupt, the court is empowered to grant him/her an order of discharge, either absolute, suspended, or conditional. The application may be opposed either by the Official Assignee or by any creditor who has proved his/her claim. A public examination of the bankrupt may be demanded by the assignee on a resolution by creditors. A person adjudged bankrupt is discharged three years after the date of adjudication unless discharged sooner.
Another form of financial failure is covered by private assignments, which are not included in official bankruptcy statistics. There were none in 1979 or 1980, 1 in 1981, 6 in 1982, and 19 in 1983.
Transactions in Bankruptcy—The number of transactions in bankruptcy during the last 5 years is given below. A long-term record of the more important features will be found in the Statistical Summary given later in this volume.
| Year | Bankruptcies | Court Orders for Liquidation of Companies | Total Commercial Failures | |
|---|---|---|---|---|
| Petitions by Debtors | Adjudications on Petitions by Creditors | |||
* Includes orders under Pt. IV Administration Act 1969. †Includes orders under Pt. XVII Insolvency Act 1967 and 1969. ‡Includes voluntary liquidations. §Includes annulments. | ||||
| 1979 | 302 | 194 | 336 | 834*† |
| 1980 | 355 | 250 | 367 | 975 |
| 1981 | 303 | 254 | 264‡ | 821 |
| 1982 | 324 | 244 | 312‡ | 881†§ |
| 1983 | 466 | 403 | 370‡ | 1239†§ |
In the case of a partnership, each partner is counted in the total of transactions and also the partnership. The general bankruptcy statistics do not cover assignments and compositions, but relate only to cases dealt with by official assignees.
In some cases of company liquidation, subsequent court orders are given for the winding up of companies to be transferred to private liquidators.
The table following shows for each of the last 6 years the average amount of debts proved per estate, and also the proportion of dividends, preferential claims and secured claims to debts.
| Year | Average Debts Proved per Estate | Proportion of Dividends, etc., to Debts |
|---|---|---|
| $ | percent | |
| 1978 | 22,066 | 5.2 |
| 1979 | 29,479 | 5.2 |
| 1980 | 30,228 | 3.7 |
| 1981 | 37,788 | 5.7 |
| 1982 | 35,827 | 8.1 |
| 1983 | 43,732 | 4.2 |
Apart from dividends, preferential and secured claims, and Government commission, payments made from assets realised include cost of actions, solicitors' fees, and expenses incurred in managing estates for the benefit of creditors.
In the following table bankruptcies during the last 4 years are classified according to amount groups of stated liabilities. With all partnerships the liabilities for each partner are included, but not the partnership. Company liquidations are included.
| Liabilities | 1981 | 1982 | 1983 |
|---|---|---|---|
* Excludes 1 partnership and 9 annulments. †Excludes 2 partnerships, 3 annulments. 1 order under Pt. XVII Administration Act 1967 and 2 voluntary liquidations. | |||
| Nil | 7 | 11 | 16 |
| Under $2,000 | 101 | 82 | 90 |
| $2,000 and under $5,000 | 141 | 126 | 174 |
| $5,000 and under $10,000 | 133 | 135 | 206 |
| $10,000 and under $20,000 | 122 | 135 | 173 |
| $20,000 and under $50,000 | 111 | 143 | 202 |
| $50,000 and under $100,000 | 71 | 75 | 87 |
| $100,000 and over | 54 | 57 | 110 |
| No statement of amounts received | 71 | 109 | 181 |
| Total | 811* | 873† | 1239 |
Occupational Groups of Bankrupts—All persons adjudged bankrupt (whether self-employed, employers of labour, or salary and wage earners) have been classified in the following table according to the occupation in which they were last employed.
| Occupational Group | 1980 | 1981 | 1982 | 1983 |
|---|---|---|---|---|
* Excludes partnerships as follows: 1979, 5; 1980, 1; 1981, 1; 1982, 2; and 1983, 12. †Excludes 3 annulments. ‡Excludes 9 annulments. §Excludes 2 annulments. | ||||
| Professional, technical, and related workers | 16 | 12 | 12 | 27 |
| Administrative and managerial workers | 31 | 21 | 28 | 59 |
| Clerical and related workers | 9 | 9 | 5 | 11 |
| Sales workers | 97 | 90 | 76 | 113 |
| Service workers | 52 | 54 | 30 | 44 |
| Agricultural, animal husbandry, and forestry workers, fishermen, and hunters | 78 | 56 | 81 | 117 |
| Production and related workers, transport equipment operators, and labourers | 221 | 189 | 212 | 323 |
| Not gainfully employed/actively engaged | 100 | 116 | 120 | 161 |
| Total* | 604† | 547‡ | 564‡ | 855§ |
The occupational status of individual bankrupts is given in the following table. With all partnerships the occupation of each partner is included, but not the partnership.
| Year | Occupational Status | ||||
|---|---|---|---|---|---|
| Working for Salary or Wages | Employer of Labour | Working On Own Account But Not Employing Labour | Not Gainfully Employed | Total* | |
* Excludes partnerships as follows: 1979, 5; 1980, 1; 1981, 1; 1982, 2; and 1983, 12. †Excludes 3 annulments. ‡Excludes 9 annulments. §Excludes 2 annulments. | |||||
| 1979 | 181 | 63 | 163 | 86 | 493 |
| 1980 | 158 | 102 | 239 | 105 | 604† |
| 1981 | 162 | 83 | 167 | 135 | 547‡ |
| 1982 | 160 | 103 | 170 | 131 | 564† |
| 1983 | 254 | 83 | 257 | 261 | 855§ |
GOVERNMENT SUBSIDIES—Government subsidies on food items and on services have been sharply reduced or abolished in recent years. In fact, the only food item now subsidised is milk. The average subsidy on this during the year ended 31 August 1981 was 9.223c per litre and for the year ended 31 August 1982, 7.595c per litre. A subsidy at the rate of 5c per litre on the transport of liquid petroleum gas (lpg) to the South Island was introduced in 1978.
The following table shows the total cost of subsidies paid under the Stabilisation vote. Other subsidies, involving farm incentives, etc., are included in other Government expenditure.
| Subsidy Items | Year Ended March | |||
|---|---|---|---|---|
| 1981 | 1982 | 1983 | 1984 | |
| $(thousand) | ||||
| Milk | 35,217 | 29,685 | 22,154 | 30,000 |
| Transport of lpg | 115 | 271 | 519 | 600 |
| Gas industry | 2,535 | 2,368 | 568 | |
| To meet loss on operations of Railways | 89,772 | 94,170 | ||
| Total | 127,639 | 126,494 | 23,241 | 30,600 |
Expenditure on economic stabilisation is given in the Estimates of Expenditure (Parl. paper B. 7 Pt. 1).
INTERNATIONAL INDICATORS OF STANDARDS OF LIVING—Relative standards of living cannot be compared by taking per-head incomes or expenditure alone. Environmental and other factors are being increasingly recognised as components of the quality of life, a much less easily measured concept. In assessing standards of living, consideration is now given to the development of social indicators parallel with purely economic terms of measurement. These include health and personal safety; equality of educational opportunity; employment and quality of working life; leisure satisfaction, social welfare provisions; social opportunity and quality; social, cultural, and communication capabilities; housing and community facilities; and the physical environment.
Methods of measurement of these factors are being recommended on an international basis. In these wider terms of reference New Zealand's position is appreciably improved.
Some comparative indicators related to standards of living are set out in the following table. In other sections of the Yearbook there are international comparisons on life expectancy, infant mortality, medical and dental services, energy, libraries, and newspaper circulation.
| Item | New Zealand | United States | Canada | Australia | United Kingdom | Sweden | Japan |
|---|---|---|---|---|---|---|---|
*1978. †1981. ‡EEC countries as a whole. Figures for individual member countries not available. §1980. | |||||||
| Motor vehicles in use— | |||||||
| Passenger cars (1980) 000 | 1,323 | 118,459 | 10,256 | 6 819* | 14 309* | 2 856* | 23,659 |
| Commercial vehicles (1980) 000 | 267 | 33,411 | 2,955 | 1 708* | 1 798* | 163* | 13,193 |
| Number per 1000 of population— | |||||||
| Radios (1979) | 868 | 2,040 | 1,104 | 1 039§ | 931 | 777 | |
| Television sets (1979) | 278 | 635 | 466 | 383 | 394 | 374 | 245 |
| Telephones (1982) | 588 | 787 | 647 | 525† | 507 | 828 | 510 |
| Consumption per head— | |||||||
| Coffee (1980) kg | 1.88 | 4.74 | 4.54 | 2.03 | 2.17 | 11.42 | 1.73 |
| Tea (1978–80) gm | 2,132 | 350 | 832 | 1,573 | 3,144 | 338 | 974 |
| Sugar (1981) kg | 49.3 | 38.7 | 38.9 | 53.4 | 38.8‡ | 44.1 | 23.4 |
| Steel (1980) kg | 260 | 508 | 541 | 416 | 247 | 497 | 629 |
| Industrial consumption— | |||||||
| Wool (1981) thousand metric tonnes | 19.9 | 63.0 | 4.7 | 29.5 | 90.9 | 1.2 | 100.5 |
| Cotton (1980–81) thousand metric tonnes | 1 282.7 | 59.6 | 21.7 | 47.9 | 6.5 | 709.0 | |
| Tin (1980) metric tonnes | 250 | 44,342 | 4,766 | 2,845 | 6,445 | 800 | 30,879 |
| Consumption per 1000 of population— | |||||||
| Newsprint (1980) kg | 6,063 | 49,480 | 38,353 | 38,421 | 24,583 | 35,586 | 22,224 |
| Public education expenditure as a percentage of GNP (1979) | 5.0 | 6.0 | 7.1 | 5.3 | 5.3* | 8.0 | 3.9 |
| Persons per hospital bed (1977) | 97 | 164* | 112 | 80 | 67 | 94 | |
| Source: United Nations Statistical Yearbook, UNESCO Statistical Yearbook. The World's Telephones. | |||||||
LIQUOR LICENSING—The principal source of legislation governing the sale of liquor in New Zealand is the Sale of Liquor Act 1962. As a general rule, that Act provides that no liquor may be sold without the appropriate licence or a club charter, and licences may only be authorised if it is shown that they are necessary or desirable in particular localities. The Act also serves to regulate the conduct of the licensed trade and the provision and standard of accommodation, amenities, and service provided for the public.
In 1981 that part of the Act dealing with the licensing of wine makers was transferred to a new Act, the Wine Makers Act 1981, which introduced a procedure for ensuring that wine which is to be exported is of an appropriate standard.
The Licensing Control Commission established under the Sale of Liquor Act has the following functions:
To ascertain the requirements of the public as to the provision of accommodation services and other facilities on licensed premises; to determine what new licences and club charters are necessary or desirable; and to authorise their issue. It is also the commission's function to prescribe and enforce standards of accommodation, facilities and services on licensed premises, and to hear appeals from licensing committees decisions.
There are 21 licensing committees throughout the country. These are serviced by the local District Courts. Each committee has five members, of whom four are nominated by the local authorities in the area. The chairman is a District Court judge. The functions of licensing committees are to issue licences, renew licences annually, and hear applications for the cancellation or suspension of licences on the grounds of lack of hygiene or fire safety or the failure of the licensee to conduct the premises in a proper manner.
There is a right of appeal to the Licensing Control Commission from most decisions of a licensing committee except on a matter of law or character, in which case the appeal is to the High Court. Some of the commission's decisions are themselves, subject to appeal to the High Court and an appeal may be brought in any case on a point of law. Such appeals lie with the administrative division of the High Court.
The types of licences which may be granted include hotel, tavern, and tourist house (premises and keeper's) licences, and wholesale, wine reseller's, booth, airport, ship, food and entertainment, and club licences. The food and entertainment licence and the club licence were introduced in 1980 to replace respectively the restaurant, theatre, cabaret, and caterer's licences and the general ancillary licence. Accordingly, at 1 April 1981 all existing licences of those former types converted automatically into food and entertainment or club licences. With both new types of licence the Licensing Control Commission has a discretion to fix hours (within broad statutory parameters) and conditions appropriate to the particular licensee.
A number of permits for specific purposes are also provided for under the Act. For example, a permit is available to the owners of unlicensed restaurants whereby patrons may bring their own liquor to the restaurant for consumption with their meal. In 1982 a wine distributor's licence was introduced, which authorises the holder to sell wine to other licensees only.
Licences in force at 30 June 1982 comprised 660 hotel keepers licences, 6 special hotel keepers licences, 4 extended hotel keepers licences, 380 tavern keepers licences, and 117 tourist house keepers licences. In addition there were 174 wholesale licences, 395 wine resellers licences, 130 wine makers licences, 462 food and entertainment licences, 1202 club licences, 23 ship licences, 5 airport licences, 13 limited wholesale licences and 3 wine bar licences. There were also 376 chartered clubs. A total of 693 Bring Your Own (BYO) permits and 2 vineyard bar permits were issued up to 30 June 1982.
Wine makers were formerly licensed under the Sale of Liquor Act. However, the Wine Makers Act 1981 provided for the general licensing of wine makers as from 1 April 1982.
The Sale of Liquor Act was amended in 1979 to empower a licensee or manager to refuse to admit to a public bar any person whom he has reasonable cause to believe will, if admitted to the premises, engage in violent, quarrelsome, insulting, or disorderly conduct, or provoke other persons to engage in such conduct on the premises. The Act was further amended in 1981 to allow the sale of imported wine by wine resellers.
New Licences—The Licensing Control Commission decides after a public inquiry, at which all interested parties may make representations, whether the issue of any new hotel or tavern premises licences or wholesale or wine resellers licences are necessary or desirable in particular localities. In the case of a hotel or tavern premises licence the commission prescribes the minimum standards of accommodation, services, and other facilities that must be provided. There is provision for a poll of residents to be taken to determine whether they desire that a hotel or tavern be established in their locality. If the majority of votes recorded at the poll is against the issue of the licence, the commission may not authorise such a licence unless special circumstances exist. Subject to the result of any such poll, the commission may then call for applications for the new hotel or tavern premises or wholesale licence and may grant it to the most suitable applicant. When the commission decides to issue a new wine reseller's licence, however, the matter is referred to the appropriate licensing committee, which then invites and considers applications for the licence. Applications for all other types of licences may be made at any time and are considered at public hearings in various centres throughout the country.
Hours of Sale—The Sale of Liquor Act 1962 governs the hours of sale. A special general poll was held on 23 September 1967 concerning the closing hours for the sale of liquor in hotels, taverns, and chartered club bar rooms. Since 1917 the closing hour had been 6 p.m. The proposal for later closing was carried, and the new hours of 11 a.m. to 10 p.m., came into effect from 9 October 1967. Hotels and taverns may also seek authority to open earlier than 11 a.m., but may not be open for more than 11 hours each day. The Sale of Liquor Amendment Act 1976 allowed for further extensions upon application for individual hotels or taverns. Orders may be made permitting these to remain open until 11 p.m. on Friday or Saturday or on Christmas Eve and until 12.30 a.m. on the morning of New Year's Day. Any such extension is in addition to the 11 hours per day during which liquor may normally be
sold to the public. With certain exceptions, sales from hotels and taverns are prohibited on Sundays and Christmas Day and Good Friday.
Legislation in 1960 authorised hotels to serve liquor to guests and lodgers partaking of a meal for consumption with that meal. An amendment in 1976 extended the hours, which are now from 9 a.m. on any day to 1 a.m. the following morning. A further amendment in 1980 applied these hours to those taverns which operate a dining room or restaurant facility.
Prior to the 1980 amendment, different hours were prescribed for restaurant, theatre, cabaret, and caterer's licences. With the change to the new food and entertainment licence, however, the commission is authorised to fix hours of sale between 9 a.m. on any day appropriate to the particular licensee and 3 a.m. on the following day. Different times may be fixed for different days of the week and for different periods of the year. Similarly, the hours under a club licence are set by the commission on an individual basis, but must generally be between 11 a.m. and 10 p.m. on any day. The permits for unlicensed restaurants authorise consumption by patrons of their own liquor until 11.30 p.m. on any day, and the vineyard bar permit authorises sales until 9 p.m. except on Sundays, Good Friday, or Christmas Day.
Drinking Age—The Sale of Liquor Amendment Act 1969 made provision from 24 October 1969 for the sale of liquor to persons of the age of 20 years; liquor may also be supplied to persons of 18 years of age or above if the person is accompanied by a spouse of 20 or more years of age or a parent. The 1976 amendment to the Act also provided for a family lounge permit, whereby parents may take their underage children into designated parts of hotels, taverns, or chartered clubs. The 1980 amendment replaced the word “parent” in both instances by the phrase “parent or guardian”, and further provided that a child accompanied by, and in the care of, any other adult member of his or her family may now be admitted into a family lounge bar. Liquor may be supplied to an unaccompanied person of 18 years of age or above as part of a meal provided in accordance with the provisions of the Act.
Licensing Trusts—The system of trust control in New Zealand is an alternative to the traditional means of controlling liquor outlets through privately-held licences supervised by licensing committees, and the Licensing Control Commission gives the public an indirect control over the conditions under which liquor is sold. Licensing trusts are elected by the residents and are responsible to them, similar to local bodies.
The first licensing trust in New Zealand was set up in 1944 following the carrying of restoration in the former Invercargill no-licence district. There are now eight district trusts: Ashburton, Clutha, Geraldine, Invercargill, Masterton, Mataura, Oamaru, and Porirua. In addition an increasing number of local trusts scattered throughout New Zealand are operating hotels and taverns. Because of the circumstances of the remaining no-licence districts and their relation to the metropolitan areas of Auckland and Wellington, legislation was introduced in 1963 providing a special procedure if any of those areas should carry restoration. A new form of trust control, known as suburban trusts, was introduced.
Prior to 1975, six suburban trusts had been constituted: Johnsonville; Terawhiti; Wellington South (in Wellington); and Mt Albert; Portage; and Waitakere (in Auckland). These trusts held licences under the Sale of Liquor Act and had a preferential right to all hotel, tourist house, or tavern premises licences or wholesale licences authorised by the commission in their areas. In 1975 these trusts and the Birkenhead Local Licensing Trust were converted into district trusts, which did not hold such licences and were then not subject to the jurisdiction of the Licensing Control Commission. They were also free to choose the nature of the liquor outlets and where and when they should be established.
The 1976 Amendment to the Licensing Trusts Act converted these trusts back to suburban trust status, bringing them under a degree of supervision by the Licensing Control Commission but not to the same extent as that which prevailed prior to 1975. The trusts are still free to establish what outlets they see fit without the need to hold licences under the Sale of Liquor Act, but the commission's approval must first be obtained. This allows the commission to consider the requirements of the particular area of which the suburban trust is part, as well as providing an appropriate forum in which objections to the trust's proposals may be heard. Local residents also have the right to apply to the commission for a poll to be conducted to determine if any proposed new premises should be established in their area.
There are also local licensing trusts which are established to operate a new hotel or tavern authorised by the commission. Local trusts are set up following the carrying of a poll to determine if the residents desire that a new licence be issued to a trust.
The Licensing Trusts Act was again amended in 1977, principally to permit licensing trusts to operate catering facilities on the same basis as holders of a food and entertainment licence may operate their premises under the Sale of Liquor Act.
In addition the same right to apply for later hours on Fridays, Saturdays, Christmas Eve, and New Year's Eve that private licences enjoy under the Sale of Liquor Act was conferred on licensing trusts by this amendment. The Licensing Trusts Act was further amended in 1980 to apply to licensing trusts those changes made by the Sale of Liquor Amendment Act 1980.
GENERAL ELECTION RESULTS—A general election of Parliamentary representatives was held on 14 July 1984, voting in New Zealand for both General and Maori electorates taking place on that day. The strength of the political party representation among members of Parliament after this election was Labour 56, National 37, Social Credit, 2.
The relative strengths of the political parties in Parliament following the last 8 general elections are shown in the following table.
| Political Party | 1963 | 1966 | 1969 | 1972 | 1975 | 1978 | 1981 | 1984 |
|---|---|---|---|---|---|---|---|---|
| Labour | 35 | 35 | 39 | 55 | 32 | 40 | 43 | 56 |
| National | 45 | 44 | 45 | 32 | 55 | 51 | 47 | 37 |
| Social Credit | – | 1 | – | – | – | 1 | 2 | 2 |
| Total | 80 | 80 | 84 | 87 | 87 | 92 | 92 | 95 |
The total number of electors on the master roll held on 18 June 1984 was 2 111 651. A total of 1 978 798 votes were cast; this represents 93.71 percent of electors on the master roll.
A second table shows the number of votes recorded by the main political parties, along with the percentages that the various party votes represent of the total valid votes, at the four most recent general elections.
| Political Party | Valid Votes | Percentage of Total Valid Votes | ||||||
|---|---|---|---|---|---|---|---|---|
| 1975 | 1978 | 1981 | 1984 | 1975 | 1978 | 1981 | 1984 | |
| Labour | 636,319 | 691,076 | 702,630 | 829,154 | 39.70 | 40.41 | 39.01 | 42.98 |
| National | 760,365 | 680,991 | 698,508 | 692,494 | 47.44 | 39.82 | 38.78 | 35.89 |
| N.Z. Party | 236,385 | 12.25 | ||||||
| Social Credit | 119,123 | 274,756 | 372,056 | 147,162 | 7.43 | 16.07 | 20.65 | 7.63 |
| Mana Motuhake | 8,332 | 5,989 | 0.46 | 0.31 | ||||
| Values | 83,213 | 41,220 | 3,460 | 3,826 | 5.19 | 2.41 | 0.19 | 0.20 |
| Others | 3,757 | 22,130 | 16,317 | 14,191 | 0.23 | 1.29 | 0.91 | 0.74 |
| Total valid votes | 1 602 777 | 1 710 173 | 1 801 303 | 1 929 201 | 100.00 | 100.00 | 100.00 | 100.00 |
| Informal votes | 8,243 | 11,270 | 8,998 | 7,565 | ||||
| Total votes recorded | 1 611 020 | 1 721 443 | 18 10 301 | 1 936 766 | ||||
NATIONAL LICENSING POLL—The licensing poll of 14 July 1984, held in conjunction with the parliamentary elections, was the twentieth at which the three issues—national continuance, State purchase and control, and national prohibition (without compensation)—were submitted to the electors. Official figures of the 1984 poll, together with those of five preceding polls, were as follows:
| Voting Issue | 1969 | 1972 | 1975 | 1978 | 1981 | 1984 |
|---|---|---|---|---|---|---|
| For national continuance | 903,962 | 931,778 | 1,094,445 | 1,053,268 | 1,124,258 | 1,319,518 |
| For State purchase and control | 242,499 | 244,003 | 235,374 | 252,154 | 247,217 | 222,049 |
| For national prohibition | 176,055 | 203,791 | 250,640 | 374,194 | 384,780 | 352,949 |
POLL ON TERM OF PARLIAMENT—On 23 September 1967 a special general poll was held on a proposal that the term of the House of Representatives be changed. Votes for a maximum of 3 years, as at present, totalled 678 960; votes for a maximum term of 4 years totalled 317 973.
TIME-SERVICE ARRANGEMENTS—One uniform time is kept throughout New Zealand. The New Zealand Gazette of 31 October 1868 contained a Government announcement to the effect that the time corresponding to longitude 172°30′ east of Greenwich (exactly 11½ hours in advance of Greenwich time) was to be adopted as the New Zealand Mean Time throughout the colony.
This New Zealand Mean Time, 11h 30 min. in advance of Greenwich Mean Time (G.M.T.), was observed continuously up to 1927, when on 6 November clocks were advanced 1 hour until 4 March 1928. Summer Time, with clocks advanced only 30 minutes (to 12 h ahead of G.M.T.). became standard practice in the summer months under the Summer Time Act 1929.
The Daylight Saving Emergency Regulations of 1941 provided for the continuance of Summer Time throughout that year, and its continued observance during subsequent war years was provided for by regulations made annually.
By the Standard Time Act of 1945 the time of the meridian 180° east of Greenwich (12 h in advance of G.M.T.) was adopted as the Standard Time for New Zealand. Thus, what was formerly known as “Summer Time” became “New Zealand Standard Time” as from 1 January 1946.
The Time Act of 1974 consolidated the Standard Time Act of 1945 and also enabled the Governor-General, by Order in Council, to introduce 1 hour of daylight saving for specified periods. This time is designated New Zealand Daylight Time, and is 13 h in advance of Universal Time (or Greenwich Mean Time). The first period specified for the use of New Zealand Daylight Time was from 3 November 1974 to 23 February 1975. In recent years the specified period has been from 02h New Zealand Standard Time (N.Z.S.T.) on the last Sunday in October, until 02h N.Z.S.T. on the first Sunday in March in the following year.
Time in the Chatham Islands is 45 minutes ahead of that kept in New Zealand.
The time throughout New Zealand is controlled by the New Zealand Time Service, Department of Scientific and Industrial Research, Wellington. The Observatory signal clock is checked daily against the caesium beam primary frequency standard at the Physics and Engineering Laboratory, Lower Hutt. The error is usually much less than one millisecond.
The Observatory provides a time service over stations operated by the Broadcasting Corporation of New Zealand.
BOOK PUBLISHING—The following table classifies the publications for 1982 and 1983 which have been included by the National Library of New Zealand in the New Zealand National Bibliography. Variations in statistics from year to year should not be interpreted as strictly equivalent variations in book production, but as publications for which it has been possible to prepare entries in the bibliography.
| Subject | 1982 | 1983 | ||||
|---|---|---|---|---|---|---|
| Books | Pamphlets | Total | Books | Pamphlets | Total | |
| General | 27 | 33 | 60 | 48 | 46 | 94 |
| Religion, theology, philosophy | 23 | 19 | 42 | 44 | 31 | 75 |
| Sociology, statistics | 19 | 32 | 51 | 49 | 49 | 98 |
| Political science, economics | 112 | 76 | 188 | 235 | 213 | 448 |
| Law, public administration, social welfare | 100 | 88 | 188 | 154 | 91 | 245 |
| Education | 38 | 48 | 86 | 62 | 85 | 147 |
| Trade, communications, transport | 30 | 17 | 47 | 68 | 53 | 121 |
| Linguistics, philology | 7 | 11 | 18 | 14 | 80 | 94 |
| Sciences | 78 | 95 | 173 | 106 | 128 | 234 |
| Technology and trades | 62 | 48 | 110 | 170 | 137 | 307 |
| Agriculture, forestry | 40 | 39 | 79 | 119 | 129 | 248 |
| Domestic science | 22 | 10 | 32 | 23 | 10 | 33 |
| Commercial management | 24 | 21 | 45 | 30 | 35 | 65 |
| Fine arts, etc. | 43 | 61 | 104 | 76 | 78 | 154 |
| Entertainment, sport | 60 | 30 | 90 | 83 | 43 | 126 |
| Literature | 71 | 66 | 137 | 94 | 116 | 210 |
| Geography, travel | 38 | 11 | 49 | 26 | 21 | 47 |
| History, biography | 47 | 42 | 89 | 155 | 43 | 198 |
| Total | 841 | 747 | 1 588 | 1 556 | 1 388 | 2 944 |
The New Zealand National Bibliography, which commenced publication in 1967, is issued in microfiche monthly and cumulated annually by the National Library of New Zealand. It lists works published in New Zealand and also works published overseas by authors normally resident in New Zealand, and works that deal in whole or part with New Zealand. It includes books, pamphlets, art prints, music scores, sound recordings, maps, new serials, and serials that have ceased publication.
As at 31 January 1984 there were 5 745 periodicals (other than parish and school magazines) being received regularly under the legal deposit provisions of the Copyright Act.
PUBLIC HOLIDAYS—These are listed below.
| Holiday | 1985 | 1986 | 1987 | 1988 | 1989 |
|---|---|---|---|---|---|
| * Actual date of Queen's Birthday. 21 April 1926. | |||||
| New Year's Day | 1 January | 1 January | 1 January | 1 January | 1 January |
| Waitangi Day | 6 February | 6 February | 6 February | 6 February | 6 February |
| Good Friday | 5 April | 28 March | 17 April | 1 April | 24 March |
| Easter Monday | 8 April | 31 March | 20 April | 4 April | 27 March |
| Anzac Day | 25 April | 25 April | 25 April | 25 April | 25 April |
| Queen's Birthday* | 3 June | 2 June | 1 June | 6 June | 5 June |
| Labour Day | 21 October | ||||
| Christmas Day | 25 December | 25 December | 25 December | 25 December | 25 December |
| Boxing Day | 26 December | 26 December | 26 December | 26 December | 26 December |
In addition to the above, there is in each provincial district a holiday for the provincial anniversary. The actual anniversary days are as follows: Northland, 29 January; Auckland, 29 January; Taranaki, 31 March; Hawke's Bay, 1 November; Wellington, 22 January; Marlborough, 1 November; Nelson, 1 February; Canterbury, 16 December; Westland, 1 December; Otago and Southland, 23 March. Although the Chatham Islands is not a provincial district, the Chatham Islands have their own officially recognised anniversary day which is 30 November.
When Anniversary Day falls on Friday or later, the holiday is observed on the next Monday; if earlier, it is observed on the preceding Monday. In some cases the holiday is taken on the local show day or some other day of local significance; in Taranaki it is the second Monday in March to avoid a clash with Easter observance.
NATIONAL ANTHEMS—God Defend New Zealand, the words written by Thomas Bracken and the music composed by John J. Woods, was written in the early 1870s and formally adopted as the New Zealand national hymn in 1940. In November 1977 it was announced that, with the consent of Her Majesty the Queen, the Government had decided that the national anthems of New Zealand shall be the traditional anthem, God Save the Queen and God Defend New Zealand, both being of equal status as national anthems appropriate to the occasion.
In June 1979 the Minister of Internal Affairs published a new specially-commissioned arrangement of the New Zealand anthem more suited to general or massed singing than the original score, which lent itself best to solo or choral singing. The new arrangement was published as a supplement to the New Zealand Gazette dated 31 May 1979.
Below, the five verses of the New Zealand anthem are given in English and Maori.
God of nations at Thy feet In the bonds of love we meet. Hear our voices, we entreat, God defend our Free Land. Guard Pacific's triple star From the shafts of strife and war, Make her praises heard afar. God defend New Zealand.
Men of ev'ry creed and race Gather here before Thy face, Asking Thee to bless this place, God defend our Free Land. From dissension, envy, hate, And corruption guard our State. Make our country good and great, God defend New Zealand.
Peace, not war, shall be our boast, But, should foes assail our coast, Make us then a mighty host, God defend our Free Land. Lord of battles in Thy might, Put our enemies to flight, Let our cause be just and right, God defend New Zealand.
Let our love for Thee increase. May Thy blessings never cease, Give us plenty, give us peace. God defend our Free Land. From dishonour and from shame Guard our country's spotless name. Crown her with immortal fame, God defend New Zealand.
May our mountains ever be Freedom's ramparts on the sea, Make us faithful unto Thee, God defend our Free Land. Guide her in the nation's van. Preaching love and truth to man, Working out Thy glorious plan. God defend New Zealand.
E Ihoa Atua, O nga Iwi! Matoura, Ata whaka rongona; Me aroha noa. Kia hua ko te pai; Kia tau to atawhai; Manaakitia mai Aotearoa.
Ona mano tangata Kiri whero, kiri ma, Iwi Maori Pakeha, Repeke katoa, Nei ka tono ko nga he Mau e whakaahu ke, Kia ora marire Aotearoa.
Tona mana kia tu! Tona kaha kia u; Tona rongo hei paku Ki te ao katoa Aua rawa nga whawhai, Nga tutu a tata mai; Kia tupu nui ai Aotearoa.
Waiho tona takiwa Ko te ao marama; Kia whiti tona ra Taiawhio noa. Ko te hae me te ngangau Meinga kia kore kau; Waiho i te rongo mau Aotearoa.
Tona pai me toitu; Tika rawa, pono pu; Tona noho, tana tu; Iwi no Ihoa. Kaua mona whakama; Kia hau te ingoa; Kia tu hei tauira; Aotearoa.
NEW ZEALAND FLAG—Under the Flags, Emblems, and Names Protection Act 1981 the flag hitherto known as the New Zealand Ensign was declared to be the New Zealand Flag, the national flag of New Zealand. The basis of the New Zealand Flag is the Union Jack in the upper left quarter, and on a blue ground to the right the Southern Cross is represented by four five-pointed red stars with white borders.
NEW ZEALAND COAT OF ARMS—The New Zealand Coat of Arms was pictured and described as a frontispiece in the 1969 and earlier issues of the Official Yearbook. It appears on the title page and the spine of the present volume.
FURTHER INFORMATION—Some information on the many subjects mentioned in this section will be found in the following publications.
Annual Report of the Human Rights Commission (Perl. paper E. 6).
Report of the Race Relations Conciliator (Parl. paper E. 17).
Report of the Department of Justice (Parl. paper E. 5).
Report of the New Zealand Industrial Design Council (Parl. paper G. 16).
Report of the Standards Council (Parl. paper G. 15).
Accounts and Reports of the Public Trust Office (Purl. paper B. 9).
Monthly Abstract of Statistics—Department of Statistics.
Report of the Department of Internal Affairs (Parl. paper G. 7).
Report of the Licensing Control Commission (Parl. paper E. 8).
Report of the General Election 1981 (Parl. paper E. 9, 1982).
Report of the Licensing Polls 1981 (Parl. paper E. 9B, 1982).
Report of the Trustees of the National Library of New Zealand (Parl. paper G. 13).
Table of Contents
NEW ZEALAND GOVERNMENT—Information on positions held within the New Zealand Government, Parliamentary sessions and the number of Public Acts passed during the year is now contained in Section 2B of this Yearbook.
OFFICIAL INFORMATION: Background—The Official Information Act 1982 came into effect on 1 July 1983. Its objectives are embodied in the principle of availability (Section 5) which states that information shall be made available unless there is good reason for withholding it.
The legislation is based on the recommendations of the Committee on Official Information (the Danks Committee) which was set up by the Government in May 1978. The terms of reference for this committee were “to contribute to the larger aim of freedom of information by considering the extent to which official information can be made readily available to the public”.
Nature of the Legislation—The Act establishes a flexible mechanism, capable of contributing to and being responsive to changing attitudes and circumstances, and leading to increased availability of information.
The purposes of the Act as set out in Section 4 are:
To increase progressively the availability of official information to the people of New Zealand in order—
To enable their more effective participation in the making and administration of laws and policies; and To promote the accountability of Ministers of the Crown and officials—and thereby to enhance respect for the law and to promote the good Government of New Zealand;
To provide for proper access by each person to official information relating to that person;
To protect official information to the extent consistent with the public interest and the preservation of personal privacy.
A number of key words and phrases are defined in the Act to facilitate its interpretation. Official information is defined as any information held by a department, or a Minister of the Crown in his/her official capacity, or an organisation, including information held outside New Zealand by branches or posts of those departments or organisations. The word 'information' is to be interpreted in its widest sense. Indeed the Danks Committee stated “information includes not merely recorded data but knowledge of a fact or state of affairs by officers of the agency in their official capacity, e.g., when a particular report is to be presented”.
The Act excludes certain types of information from the definition. Most significant are:
— library or museum material made or acquired and preserved solely for reference or exhibition purposes;
— material placed in the National Library of New Zealand by or on behalf of persons other than Ministers of the Crown in their official capacity or departments;
— information held by a Minister, department or organisation, solely as an agent or for safe custody;
— evidence given or submissions made to a Royal Commission of Inquiry appointed by Order in Council made the Commissions of Inquiry Act 1908 or Commission, Board, Court or Committee of Inquiry appointed, pursuant to, and not by, any provision of an Act, to inquire into a specified matter.
The word “document” has also been given the widest possible meaning. The Act makes it clear that it is intended to cover all forms of information retention including any writing on any material; any information recorded or stored by means of any tape-recorder, computer or other device, and any material subsequently derived from information so recorded or stored; any label, marking, or other writing that identifies or describes anything of which it forms part or to which it is attached by any means; any book, map, plan, graph or drawing: any photograph, film, negative, tape or other device in which one or more visual images are embodied so as to be capable (with or without the aid of some other equipment) of being reproduced.
Whilst the Act extends to cover all Government departments, with the exception of the Legislative Department, and some 140 organisations, it does not include a Court in relation to its judicial functions; a Tribunal; a Royal Commission; a Commission of Inquiry appointed by an Order in Council made under the Commissions of Inquiry Act 1908; a Commission, Board, Court or Committee of Inquiry appointed, pursuant to, and not by, any provision of an Act, to inquire into a specified matter.
The Act provides special rights of access to personal information, which means any official information held about an identifiable person. A “person” is defined as including a corporation sole and also a body of persons, whether corporate or unincorporate. Where it is necessary to make a distinction between an identifiable individual human being, and those other entities legally described as “persons”, the former is referred to as a “natural person”.
Access to Personal and Official Information—A request for personal information is a very particular form of request for official information and a legally enforceable right of access to it is conferred by the Act. It gives the right to know what information is held by an agency about an individual, the right to be able to correct that information and to know the reasons for a decision made by an agency about the individual, and the rules under which decisions are made.
Access to official information is available to a New Zealand citizen, a permanent resident of New Zealand, or a body corporate which is incorporated in New Zealand. Right of access to personal information is available to a New Zealand citizen, a permanent resident or a person who is in New Zealand, or a body corporate incorporated or carrying on business in New Zealand. The Act places an onus of responsibility on the suppliers of personal information to satisfy themselves concerning the identity of the applicant, and to ensure that it is only received by the person concerned or their authorised agent.
In legislating for increased openness in the release and dissemination of information, Parliament recognised that there may be good reasons for withholding some information. The criteria which may justify not releasing information are set down in Sections 6 to 9 of the Act. Section 6 gives the “conclusive reasons”. These cover information the release of which would be likely to prejudice:
the security, defence or international relations of New Zealand;
the entrusting of information to the Government of New Zealand on a basis of confidence by the Government or government agency of another country, or an international organisation or agency;
the maintenance of law and order;
the economic interests of New Zealand. Section 7 sets out special reasons for withholding official information related to the Cook Islands, Tokelau or Niue, or the Ross Dependency, while special reasons for withholding official information related to competitive commercial activities are stated in Section 8. Section 9 sets out other good reasons for withholding official information unless in the circumstances of the particular case the withholding of that information is outweighed by other considerations which render it desirable in the public interest to make that information available.
Applications for Access—Every request for access to information must be dealt with on its merits, and there is clearly scope for review of decisions as circumstances change. An important point to note is that political sensitivity, embarrassment or shame are not listed as possible reasons for withholding information.
Requests for information do not have to be made in any prescribed form; they may be made by telephone, in person or in writing. Requests should however provide sufficient detail to allow the relevant material or documents to be identified. Sometimes applicants will need assistance with this task and the Act makes the provision of reasonable assistance a duty. Information guides concerning access to personal and official information are available.
To facilitate the formulation and lodging of requests, reference can be made to the Official Information Directory, available at all Post Offices and Public Libraries. This gives a full list of all the organisations covered by the Act. It sets out the structure and function of every department and organisation; a general description of all kinds of documents held; a list of all manuals, and similar types of documents which contain policies, principles, rules or guidelines, in accordance with which decisions are made; and how to obtain access to information including details of contact officers.
When a request for information is received a decision must be made as soon as possible whether the request is to be granted and if so in what form and for what charge if any. (While access to personal information is free, charges are made for access to official information.) Undue delay in making official information available can be deemed a refusal to release the information and the general aim is to furnish either the information or indicate the likely response time within 7 days of a request.
Review by an Ombudsman—Information will where possible be made available in the manner preferred by the applicant. Where this is not done, or only part of the information requested is made available, the applicant will be given the reason and, if requested, the grounds in support of that reason. Where a request for information is refused, the applicant must be given the reason for the refusal and information concerning the right to seek an investigation and review of the refusal by an Ombudsman. On further request they may also obtain the grounds in support of the reason to decline access.
Complaints to an Ombudsman must be in writing. There is no charge for the service and the investigation is conducted in private.
Where an Ombudsman is of the opinion that the request should not have been refused or that the decision complained of is, for example, unreasonable or wrong then he shall report his opinion and his reasons to the appropriate department or Minister of the Crown or organisation together with such recommendations as he thinks fit. The complainant is also given a copy of his recommendations (if any) and such other information as the Ombudsman thinks proper. Where a complaint is directed against one of the departments or organisations covered by the Act, the Ombudsman is required to send a copy of his report and recommendations to either the Minister concerned or such Minister as he considers appropriate.
The Ombudsman's formal recommendations are binding unless overridden by a Minister in accordance with a formal procedure. That procedure requires that where a Minister declines to accept an Ombudsman's recommendation, the decision, the ground for it, and (except where that ground is national security), the source and purport of any advice on which it was based are to be published in the Gazette.
If an Ombudsman concludes that any complaint made under the Act cannot be sustained, he will explain his reasons to the complainant.
The Information Authority—The Danks Committee identified three distinct tasks to be carried out in opening up public and personal access to official information and adjusting the conditions and degree of access to keep in line with the changing needs and attitudes of the community. These responsibilities have been divided between 3 bodies.
Firstly a small Information Unit has been established within the State Services Commission to advise and assist Government departments and organisations in carrying out their responsibilities under the new legislation. Secondly the Office of the Ombudsman acts as the independent arbiter to deal with complaints by individuals concerning the disclosure and non-disclosure of information.
While these administrative and review mechanisms are thus provided within existing institutions, the committee also saw the need for the establishment of an independent body, the Information Authority. This is responsible for the third task of undertaking a continuing inquiry into and definition of categories of information which should be made available. The specific functions and responsibilities of the Authority are set down in the Offficial Information Act. These give it 3 broad roles: regulatory, monitoring and a particular role in the field of personal information. There are 3 members of the Authority, all appointed for 3 years in the first instance. They are Sir Alan Danks, Chairman; Mr Ian Lythgoe and Mrs Shirley Maddock. The authority itself has a life of only 5 years, until 30 June 1988, in which to carry out its task. Its first priority will be to review the protection of official information under any other legislation, to see that it is reasonable and also compatible with the Official Information Act.
PUBLIC GENERAL ACTS OF NEW ZEALAND—The following list shows the departments responsible for the administration of the Public Acts of general application in New Zealand which were in force at January 1984 or which had been passed to come into force at a later date.
The list does not include references to Acts that are spent or expired or to Amending Acts, Appropriation Acts, Finance Acts or other Acts containing miscellaneous provisions, such as Statutes Amendment Acts, Local Legislation Acts, Reserves and Other Lands Disposal Acts, and Maori Purposes Acts.
| Act | Department |
|---|---|
| Accident Compensation Act 1982 | Accident Compensation Corporation |
| Acts Interpretation Act 1924 | Justice |
| Administration Act 1969 | Justice |
| Administrator's Powers Act 1983 | Prime Minister's |
| Penal Institutions Act 1954 | Justice |
| Admiralty Act 1973 | Justice |
| Adoption Act 1955 | Justice |
| Adult Education Act 1963 | Education |
| Age of Majority Act 1970 | Justice |
| Aged and Infirm Persons Protection Act 1912 | Justice |
| Agricultural and Pastoral Societies Act 1908 | Agriculture and Fisheries |
| Agricultural Pesticides Act 1983 | Agriculture and Fisheries |
| Agricultural Pests Destruction Act 1967 | Agriculture and Fisheries |
| Agricultural Workers Act 1977 | Labour |
| Agriculture (Emergency Powers) Act 1934 | Agriculture and Fisheries |
| Agriculture (Emergency Regulations Confirmation) Acts | Agriculture and Fisheries |
| Air Services Licensing Act 1983 | Transport |
| Aircrew Industrial Tribunal Act 1971 | Labour |
| Airport Authorities Act 1966 | Transport |
| Alcoholic Liquor Advisory Council Act 1976 | Justice |
| Alcoholism and Drug Addiction Act 1966 | Health |
| Animal Remedies Act 1967 | Agriculture and Fisheries |
| Animals Act 1967 | Agriculture and Fisheries |
| Animals Protection Act 1960 | Agriculture and Fisheries |
| Antarctic Marine Living Resources Act 1981 | Foreign Affairs |
| Antarctica Act 1960 | Foreign Affairs |
| Antiquities Act 1975 | Internal Affairs |
| Anzac Day Act 1966 | Internal Affairs |
| Apiaries Act 1969 | Agriculture and Fisheries |
| Apple and Pear Marketing Act 1971 | Agriculture and Fisheries |
| Apprenticeship Act 1983 | Labour |
| Arbitration Act 1908 | Justice |
| Arbitration Clauses (Protocol) and the Arbitration (Foreign Awards) Act 1933 | Justice |
| Arbitration (Foreign Agreements and Awards) Act 1982 | Justice |
| Arbitration (International Investments Disputes) Act 1979 | Justice |
| Architects Act 1963 | Internal Affairs |
| Archives Act 1957 | Internal Affairs |
| Area Health Boards Act 1983 | Health |
| Armed Forces Canteens Act 1948 | Defence |
| Armed Forces Discipline Act 1971 | Defence |
| Arms Act 1983 | Police |
| Atomic Energy Act 1945 | Energy |
| Auckland Harbour Bridge Authority Dissolution Act 1983 | Works and Development |
| Auctioneers Act 1928 | Justice |
| Aviation Crimes Act 1972 | Justice |
| Bank of New Zealand Act 1979 | Treasury |
| Banking Act 1982 | Reserve Bank |
| Beer Duty Act 1977 | Customs |
| Berryfruit Levy Act 1967 | Agriculture and Fisheries |
| Bills of Exchange Act 1908 | Justice |
| Births and Deaths Registration Act 1951 | Justice |
| Boilers. Lifts, and Cranes Act 1950 | Transport |
| Boxing and Wrestling Act 1981 | Internal Affairs |
| Broadcasting Act 1976 | Broadcasting Corporation |
| Building Performance Guarantee Corporation Act 1977 | Building Performance Corporation |
| Building Research Levy Act 1969 | Scientific and Industrial Research |
| Building Societies Act 1965 | Treasury |
| Burial and Cremation Act 1964 | Health |
| Bush Workers Act 1945 | Labour |
| Bylaws Act 1910 | Internal Affairs |
| Canterbury Provincial Buildings Vesting Act 1928 | Lands and Survey |
| Carriage by Air Act 1967 | Transport |
| Carriage of Goods Act 1979 | Justice |
| Charitable Trusts Act 1957 | Justice |
| Chateau Companies Act 1977 | Justice |
| Chattels Transfer Act 1924 | Justice |
| Cheques Act 1960 | Justice |
| Children and Young Persons Act 1974 | Social Welfare |
| Children's Health Camps Act 1972 | Health |
| Chiropractors Act 1982 | Health |
| Citizenship Act 1977 | Internal Affairs |
| Citizenship (Western Samoa) Act 1982 | Internal Affairs |
| Civil Aviation Act 1964 | Transport |
| Civil Defence Act 1983 | Internal Affairs |
| Civil List Act 1979 | Prime Minister's |
| Clean Air Act 1972 | Health |
| Clerks of Works Act 1944 | Works and Development |
| Coal Mines Act 1979 | Energy |
| Commerce Act 1975 | Trade and Industry |
| Commissions of Inquiry Act 1908 | Internal Affairs |
| Commonwealth Countries Act 1977 | Foreign Affairs |
| Commonwealth Games Symbol Protection Act 1974 | Internal Affairs |
| Companies Act 1955 | Justice |
| Companies (Bondholders Incorporation) Act 1934–35 | Justice |
| Companies Special Investigation Act 1958 | Justice |
| Construction Act 1959 | Labour |
| Consular Privileges and immunities Act 1971 | Foreign Affairs |
| Consumer Council Act 1966 | Trade and Industry |
| Consumer Information Act 1969 | Trade and Industry |
| Continental Shelf Act 1964 | Foreign Affairs |
| Contraception. Sterilisation, and Abortion Act 1977 | Justice |
| Contracts Enforcement Act 1956 | Justice |
| Contracts (Privity) Act 1982 | Justice |
| Contractual Mistakes Act 1977 | Justice |
| Contractual Remedies Act 1979 | Justice |
| Contributory Negligence Act 1947 | Justice |
| Cook Islands Act 1915 | Foreign Affairs |
| Cook Islands Constitution Act 1964 | Foreign Affairs |
| Co-operative Companies Act 1956 | Justice |
| Co-operative Dairy Companies Act 1949 | Justice |
| Co-operative Forestry Companies Act 1978 | Justice |
| Co-operative Freezing Companies Act 1960 | Justice |
| Copyright Act 1962 | Justice |
| Cornish Companies Management Act 1974 | Justice |
| Coroners Act 1951 | Justice |
| Costs In Criminal Cases Act 1967 | Justice |
| Counties Insurance Empowering Act 1941 | Internal Affairs |
| Courts Martial Appeals Act 1953 | Defence |
| Credit Contracts Act 1981 | Justice |
| Crimes Act 1961 | Justice |
| Crimes (Internationally Protected Persons and Hostages) Act 1980 | Justice |
| Criminal Justice Act 1954 | Justice |
| Crown Grants Act 1908 | Lands and Survey |
| Crown Proceedings Act 1950 | Justice |
| Customs Act 1966 | Customs |
| Customs Law Act 1908 | Customs |
| Customs Orders Confirmation Acts | Customs |
| Dairy Board Act 1961 | Agriculture and Fisheries |
| Dairy Industry Act 1952 | Agriculture and Fisheries |
| Dangerous Goods Act 1974 | Labour |
| Deaths By Accidents Compensation Act 1952 | Justice |
| Decimal Currency Act 1964 | Treasury |
| Declaratory Judgments Act 1908 | Justice |
| Deeds Registration Act 1908 | Justice |
| Defamation Act 1954 | Justice |
| Defence Act 1971 | Defence |
| Demise of the Crown Act 1908 | Internal Affairs |
| Dental Act 1963 | Health |
| Department of Social Welfare Act 1971 | Social Welfare |
| Designs Act 1953 | Justice |
| Development Finance Corporation Act 1973 | Trade and Industry |
| Dietitians Act 1950 | Health |
| Diplomatic Privileges and Immunities Act 1968 | Foreign Affairs |
| Disabled Persons Community Welfare Act 1975 | Social Welfare |
| Disabled Persons Employment Promotion Act 1960 | Labour |
| Distillation Act 1971 | Customs |
| Distress and Replevin Act 1908 | Justice |
| District Courts Act 1947 | Justice |
| District Railways Act 1908 | Works and Development |
| Dog Control and Hydatids Act 1982 | Internal Affairs and Agriculture and Fisheries |
| Domestic Actions Act 1975 | Justice |
| Domestic Air Travel Tax Act 1980 | Customs |
| Domestic Protection Act 1982 | Justice |
| Domicile Act 1976 | Justice |
| Door To Door Sales Act 1967 | Trade and Industry |
| Earthquake and War Damage Act 1944 | Earthquake and War Damage Commission |
| Economic Stabilisation Act 1948 | Trade and Industry |
| Education Act 1964 | Education |
| Education Lands Act 1949 | Education |
| Electoral Act 1956 | Justice |
| Electric Linemen Act 1959 | Energy |
| Electric Power Boards Act 1925 | Energy |
| Electrical Registration Act 1979 | Energy |
| Electrical Supply Authorities Association Act 1930 | Energy |
| Electricity Act 1968 | Energy |
| Emergency Forces Rehabilitation Act 1953 | Social Welfare |
| Employment Agents Act 1908 | Labour |
| Enemy Property Act 1951 | Public Trust |
| Energy Resources Levy Act 1976 | Energy |
| Engineering Associates Act 1961 | Works and Development |
| Engineers Registration Act 1924 | Works and Development |
| English Laws Act 1908 | Justice |
| Equal Pay Act 1972 | Labour |
| Estate and Gift Duties Act 1968 | Inland Revenue |
| Evidence Act 1908 | Justice |
| Explosives Act 1957 | Labour |
| Export Guarantee Act 1964 | State Insurance Office |
| Extradition Act 1965 | Justice |
| Factories and Commercial Premises Act 1981 | Labour |
| Family Benefits (Home Ownership) Act 1964 | Social Welfare |
| Family Courts Act 1980 | Justice |
| Family Proceedings Act 1980 | Justice |
| Family Protection Act 1955 | Justice |
| Farm Ownership Savings Act 1974 | Rural Banking and Finance Corporation |
| Fees and Travelling Allowances Act 1951 | Treasury |
| Fencing Act 1978 | Justice |
| Fertilisers Act 1982 | Agriculture and Fisheries |
| Films Act 1983 | Internal Affairs |
| Fire Service Act 1975 | Internal Affairs |
| Fisheries Act 1983 | Agriculture and Fisheries |
| Fishing Industry Board Act 1963 | Agriculture and Fisheries |
| Fishing Industry (Union Coverage) Act 1979 | Labour |
| Fishing Vessel Ownership Savings Act 1977 | Rural Banking and Finance Corporation |
| Flags. Emblems, and Names Protection Act 1981 | Internal Affairs |
| Food Act 1981 | Health |
| Food and Drug Act 1969 | Health |
| Foreign Affairs and Overseas Service Act 1983 | Foreign Affairs |
| Forest and Rural Fires Act 1977 | Forest Service |
| Forestry Encouragement Act 1962 | Forest Service |
| Forestry Rights Registration Act 1983 | Forest Service |
| Forests Act 1949 | Forest Service |
| Franklin Manukau Pest Destruction Act 1971 | Agriculture and Fisheries |
| Friendly Societies and Credit Unions Act 1982 | Treasury |
| Frustrated Contracts Act 1944 | Justice |
| Fugitive Offenders Act 1881 (U.K.) | Justice |
| Gaming and Lotteries Act 1977 | Internal Affairs |
| Gaming Duties Act 1971 | Inland Revenue |
| Gas Act 1982 | Energy |
| General Agreement on Tariffs and Trade Act 1948 | Customs |
| Geneva Conventions Act 1958 | Foreign Affairs |
| Geothermal Energy Act 1953 | Energy |
| Government Life Insurance Corporation Act 1983 | Government Life Insurance Corporation |
| Government Service Equal Fay Act 1960 | State Service Commission |
| Government Superannuation Fund Act 1956 | Treasury |
| Guardianship Act 1968 | Justice |
| Harbours Act 1950 | Transport |
| Hauraki Gulf Maritime Park Act 1967 | Lands and Survey |
| Health Act 1956 | Health |
| Health Benefits (Reciprocity with the United Kingdom) Act 1982 | Health |
| Health Service Personnel Act 1983 | Health |
| Heavy Engineering Research Levy Act 1978 | Scientific and Industrial Research |
| Higher Salaries Commission Act 1977 | Labour |
| Hire Purchase Act 1971 | Justice |
| Historic Places Act 1980 | Internal Affairs |
| Hive Levy Act 1978 | Agriculture and Fisheries |
| Holidays Act 1081 | Labour |
| Home Ownership Savings Act 1974 | Housing Corporation |
| Hospitals Act 1957 | Health |
| Hotel Association of New Zealand Act 1969 | Justice |
| Housing Act 1955 | Housing Corporation |
| Housing Corporation Act 1974 | Housing Corporation |
| Hovercraft Act 1971 | Transport |
| Howard Estate Act 1978 | Public Trust |
| Human Rights Commission Act 1977 | Justice |
| Human Tissues Act 1964 | Health |
| Hunter Gift for the Settlement of Discharged Soldiers Act 1921 | Lands and Survey |
| Illegal Contracts Act 1970 | Justice |
| Immigration Act 1964 | Labour |
| Impounding Act 1955 | Internal Affairs |
| Imprisonment for Debt Limitation Act 1908 | Justice |
| Inalienable Life Annuities Act 1910 | Justice |
| Income Tax Act 1976 | Inland Revenue |
| Income Tax (Annual) Acts | Inland Revenue |
| Incorporated Societies Act 1908 | Justice |
| Indecent Publications Act 1963 | Justice |
| Industrial and Provident Societies Act 1908 | Justice |
| Industrial Design Act 1966 | Trade and Industry |
| Industrial Relations Act 1973 | Labour |
| Industrial and Provident Societies Act 1908 | Trade and Industry |
| Industrial Training Levies Act 1978 | Labour |
| Industries Development Commission Act 1961 | Trade and Industry |
| Infants Act 1908 | Justice |
| Inferior Courts Procedure Act 1909 | Justice |
| Inland Revenue Department Act 1974 | Inland Revenue |
| Innkeepers Act 1962 | Justice |
| Insolvency Act 1967 | Justice |
| Insurance Companies' Deposits Act 1953 | Justice |
| Insurance Law Reform Act 1977 | Justice |
| International Air Services Licensing Act 1947 | Transport |
| International Departure Tax Act 1979 | Customs |
| International Energy Agreement Act 1976 | Energy |
| International Finance Agreements Act 1961 | Treasury |
| Invercargill Licensing Trust Act 1950 | Justice |
| Iron and Steel Industry Act 1959 | Energy |
| Joint Council for Local Authorities Services Act 1977 | Internal Affairs |
| Joint Family Homes Act 1964 | Justice |
| Judicature Act 1908 | Justice |
| Juries Act 1981 | Justice |
| Justices of the Peace Act 1957 | Justice |
| Kapiti Island Public Reserves Act 1897 | Lands and Survey |
| Kermadec Island Act 1887 | Foreign Affairs |
| Kitchener Memorial Scholarship Trust Act 1941 | Education |
| Labour Department Act 1954 | Labour |
| Lake Coleridge Water Power Act 1915 | Energy |
| Lake Waikaremoana Act 1971 | Maori Affairs |
| Lake Wanaka Preservation Act 1973 | Commission for the Environment |
| Land Act 1948 | Lands and Survey |
| Land Drainage Act 1908 | Internal Affairs |
| Land Settlement. Promotion, and Land Acquisition Act 1952 | Lands and Survey |
| Land Tax Act 1976 | Inland Revenue |
| Land Transfer Act 1952 | Justice |
| Land Transfer (Hawke's Bay) Act 1931 | Justice |
| Land Valuation Proceedings Act 1948 | Justice |
| Law Practitioners Act 1982 | Justice |
| Law Reform Act 1936 | Justice |
| Law Reform Act 1944 | Justice |
| Law Reform (Testamentary Promises) Act 1949 | Justice |
| Layby Sales Act 1971 | Justice |
| Legal Aid Act 1969 | Justice |
| Legislative Council Abolition Act 1950 | Legislative |
| Legislature Act 1908 | Legislative |
| Libraries and Mechanics' Institutes Act 1908 | internal Affairs |
| Licensing Act 1908 | Justice |
| Licensing Trusts Act 1949 | Justice |
| Life Insurance Act 1908 | Justice |
| Limitation Act 1950 | Justice |
| Lincoln College Act 1961 | Education |
| Liquid Fuels Trust Act 1978 | Energy |
| Litter Act 1979 | Internal Affairs |
| Local Authorities (Employment Protection) Act 1963 | Internal Affairs |
| Local Authorities Loans Act 1956 | Treasury |
| Local Authorities (Members' Interests) Act 1968 | Internal Affairs |
| Local Elections and Polls Act 1976 | Internal Affairs |
| Local Government Act 1974 | Internal Affairs |
| Local Railways Act 1914 | Works and Development |
| Machinery Act 1950 | Labour |
| Manapouri-Te Anau Development Act 1963 | Energy |
| Maori Affairs Act 1953 | Maori Affairs |
| Maori Community Development Act 1962 | Maori Affairs |
| Maori Education Foundation Act 1961 | Education |
| Maori Housing Act 1935 | Maori Affairs |
| Maori Purposes Act 1931 | Maori Affairs |
| Maori Purposes Funds Act 1934–35 | Maori Affairs |
| Maori Reserved Land Act 1956 | Maori Affairs |
| Maori Soldiers Trust Act 1957 | Maori Affairs |
| Maori Trust Boards Act 1955 | Maori Affairs |
| Maori Trustee Act 1953 | Maori Affairs |
| Maori Vested Lands Administration Act 1954 | Maori Affairs |
| Margarine Act 1908 | Agriculture and Fisheries |
| Marine and Power Engineers' Institute Industrial Disputes Act 1974 | Labour |
| Marine Farming Act 1971 | Agriculture and Fisheries |
| Marine Insurance Act 1908 | Justice |
| Marine Mammals Protection Act 1978 | Agriculture and Fisheries |
| Marine Pollution Act 1974 | Transport |
| Marine Reserves Act 1971 | Agriculture and Fisheries |
| Marketing Act 1936 | Agriculture and Fisheries |
| Marriage Act 1955 | Justice |
| Massage Parlours Act 1978 | Justice |
| Massey University Act 1963 | University Grants Committee |
| Masterton Licensing Trust Act 1947 | Justice |
| Maternal Mortality Research Act 1968 | Health |
| Maternity Leave and Employment Protection Act 1980 | Labour |
| Matrimonial Property Act 1976 | Justice |
| Meat Act 1981 | Agriculture and Fisheries |
| Meat Export Control Act 1921–22 | Agriculture and Fisheries |
| Meat Export Prices Act 1976 | Agriculture and Fisheries |
| Medical and Dental Auxiliaries Act 1966 | Health |
| Medical Practitioners Act 1968 | Health |
| Medical Research Council Act 1950 | Health |
| Medicines Act 1981 | Health |
| Mental Health Act 1969 | Health |
| Mercantile Law Act 1908 | Justice |
| Merchandise Marks Act 1954 | Trade and Industry |
| Military Decorations and Distinctive Badges Act 1918 | Defence |
| Military Manoeuvres Act 1915 | Defence |
| Milk Act 1967 | Agriculture and Fisheries |
| Minimum Wage Act 1945 | Labour |
| Minimum Wage Act 1983 | Labour |
| Mining Act 1971 | Energy |
| Mining Tenures Registration Act 1962 | Justice |
| Ministry of Agriculture and Fisheries Act 1953 | Agriculture and Fisheries |
| Ministry of Energy Act 1977 | Energy |
| Ministry of Transport Act 1968 | Transport |
| Minors' Contracts Act 1969 | Justice |
| Misuse of Drugs Act 1975 | Health |
| Misuse of Drugs Amendment Act 1978 Pt II | Health |
| Mortgagors and Lessees Rehabilitation Act 1936 | Justice |
| Motor Spirits Distribution Act 1953 | Trade and Industry |
| Motor Spirits Duty Act 1961 | Customs |
| Motor Spirits (Regulation of Prices) Act 1933 | Energy |
| Motor Vehicle Dealers Act 1975 | Justice |
| Mount Egmont Vesting Act 1978 | Lands and Survey |
| Municipal Association Act 1939 | Internal Affairs |
| Municipal Insurance Act 1960 | Internal Affairs |
| Music Teachers Act 1981 | Education |
| Mutual Insurance Act 1955 | Justice |
| National Art Gallery, Museum, and War Memorial Act 1972 | Internal Affairs |
| National Development Act 1979 | Works and Development |
| National Expenditure Adjustment Act 1932 | Treasury |
| National Housing Commission Act 1972 | Housing Corporation |
| National Library Act 1965 | Education |
| National Parks Act 1980 | Lands and Survey |
| National Provident Fund Act 1950 | Treasury |
| National Research Advisory Council Act 1963 | State Services Commission |
| National Roads Act 1953 | Works and Development |
| Native Plants Protection Act 1934 | Lands and Survey |
| Nature Conservation Council Act 1962 | Lands and Survey |
| Naval and Victualling Stores Act 1908 | Defence |
| New Zealand Boundaries Act 1863 (U.K.) | Internal Affairs |
| New Zealand Constitution Act 1852 (U.K.) | Justice |
| New Zealand Constitution (Amendment) Act 1947 (U.K.) | Internal Affairs |
| New Zealand Constitution Amendment (Request and Consent) Act 1947 | Internal Affairs |
| New Zealand Council for Educational Research Act 1972 | Education |
| New Zealand Council for Postgraduate Medical Education Act 1978 | Health |
| New Zealand Council of Law Reporting Act 1938 | Justice |
| New Zealand Counties Association Act 1949 | Internal Affairs |
| New Zealand Debt Conversion Act 1932–33 | Treasury |
| New Zealand Export-Import Corporation Act 1974 | Trade and Industry |
| New Zealand Film Commission Act 1978 | Internal Affairs |
| New Zealand Forestry Council Act 1983 | Forest Service |
| New Zealand Geographic Board Act 1946 | Lands and Survey |
| New Zealand Government Property Corporation Act 1953 | Foreign Affairs |
| New Zealand Library Association Act 1939 | Education |
| New Zealand Maori Arts and Crafts Institute Act 1963 | Tourist and Publicity |
| New Zealand Planning Act 1982 | New Zealand Planning Council |
| New Zealand Ports Authority Act 1968 | Transport |
| New Zealand Railways Corporation Act 1981 | New Zealand Railway Corporation |
| New Zealand Register of Osteopaths Incorporated Act 1978 | Health |
| New Zealand Security Intelligence Service Act 1969 | New Zealand Security Intelligence Service |
| New Zealand Society of Accountants Act 1958 | Treasury |
| New Zealand Walkways Act 1975 | Lands and Survey |
| Newspapers and Printers Act 1955 | Justice |
| Ngarimu V. C. and 28th (Maori) Battalion Memorial Scholarship Fund Act 1945 | Education |
| Niue Act 1966 | Foreign Affairs |
| Niue Constitution Act 1974 | Foreign Affairs |
| Noise Control Act 1982 | Health |
| Noxious Plants Act 1978 | Agriculture and Fisheries |
| Nurses Act 1977 | Health |
| Oaths and Declarations Act 1957 | Justice |
| Occupational Therapy Act 1949 | Health |
| Occupiers Liability Act 1962 | Justice |
| Offenders Legal Aid Act 1954 | Justice |
| Official Appointments and Documents Act 1919 | Internal Affairs |
| Official Information Act 1982 | Justice |
| Ombudsmen Act 1975 | Justice |
| Optometrists and Dispensing Opticians Act 1976 | Health |
| Orakei Block (Vesting and Use) Act 1978 | Lands and Survey |
| Orchard Levy Act 1953 | Agriculture and Fisheries |
| Overseas Investment Act 1973 | Reserve Bank |
| Pacific Islands Polynesian Education Foundation Act 1972 | Education |
| Partnership Act 1908 | Justice |
| Passports Act 1980 | Internal Affairs |
| Patents Act 1953 | Justice |
| Patriotic and Canteen Funds Act 1947 | Internal Affairs |
| Pawnbrokers Act 1908 | Justice |
| Payment of Jurors Act 1919 | Justice |
| Penal Institutions Act 1954 | Justice |
| Perpetuities Act 1964 | Justice |
| Pesticides Act 1979 | Agriculture and Fisheries |
| Petroleum Act 1937 | Energy |
| Petroleum Demand Restraint Act 1981 | Energy |
| Pharmacy Act 1970 | Health |
| Phosphate Commission of New Zealand Act 1981 | Agriculture and Fisheries |
| Physiotherapy Act 1949 | Health |
| Plant Varieties Act 1973 | Agriculture and Fisheries |
| Plants Act 1970 | Agriculture and Fisheries |
| Plumbers Gasfitters, and Drainlayers Act 1976 | Health |
| Police Act 1958 | Police |
| Political Debilities Removal Act 1560 | Justice |
| Pork Industry Board Act 1982 | Agriculture and Fisheries |
| Post Office Act 1959 | Post Office |
| Potato Industry Act 1977 | Agriculture and Fisheries |
| Poultry Act 1980 | Agriculture and Fisheries |
| Poultry Board Act 1981 | Agriculture and Fisheries |
| Primary Products Marketing Act 1953 | Agriculture and Fisheries |
| Primary Products Marketing Regulations Confirmation Acts | Agriculture and Fisheries |
| Private Investigators and Security Guards Act 1974 | Justice |
| Private Savings Banks Act 1983 | Reserve Bank |
| Private Schools Conditional Integration Act 1975 | Education |
| Property Law Act 1952 | Justice |
| Protection of British Shipping Act 1936 | Transport |
| Psychologists Act 1981 | Health |
| Public Authorities (Party Wall) Empowering Act 1919 | Internal Affairs |
| Public Bodies' Contracts Act 1959 | Internal Affairs |
| Public Bodies' Leases Act 1969 | Internal Affairs |
| Public Bodies' Meetings Act 1962 | Internal Affairs |
| Public Contracts Act 1908 | Internal Affairs |
| Public Finance Act 1977 | Treasury |
| Public Safety Conservation Act 1932 | Justice |
| Public Service Investment Society Management Act (No. 2) 1979 | Justice |
| Public Trust Office Act 1957 | Public Trust |
| Public Works Act 1981 | Works and Development |
| Quantity Surveyors Act 1968 | Works and Development |
| Quarries and Tunnels Act 1982 | Energy |
| Queen Elizabeth The Second Arts Council of New Zealand Act 1974 | Internal Affairs |
| Queen Elizabeth The Second National Trust Act 1977 | Lands and Survey |
| Queen Elizabeth The Second Postgraduate Fellowship of New Zealand Act 1963 | Education |
| Queen Elizabeth The Second Technicians Study Award Act 1970 | Education |
| Race Relations Act 1971 | Justice |
| Racing Act 1971 | Internal Affairs |
| Radiation Protection Act 1965 | Health |
| Rangitaiki Land Drainage Act 1956 | Internal Affairs |
| Rates Rebate Act 1973 | Internal Affairs |
| Rating Act 1967 | Internal Affairs |
| Real Estate Agents Act 1976 | Justice |
| Reciprocal Enforcement of Judgments Act 1934 | Justice |
| Recreation and Sport Act 1973 | Recreation and Sport |
| Regulations Act 1936 | Justice |
| Rehabilitation Act 1941 | Social Welfare |
| Remuneration Act Repeal Act 1980 | Labour |
| Rent Appeal Act 1973 | Housing Corporation |
| Reserve Bank of New Zealand Act 1964 | Reserve Bank |
| Reserves Act 1977 | Lands and Survey |
| Restricted Drugs Act 1960 | Health |
| River Boards Act 1908 | Internal Affairs |
| Road User Charges Act 1977 | Works and Development |
| Royal New Zealand Foundation for the Blind Act 1963 | Education |
| Royal New Zealand Institute of Horticulture Act 1953 | Agriculture and Fisheries |
| Royal Powers Act 1983 | Prime Minister's |
| Royal Society of New Zealand Act 1965 | Scientific and Industrial Research |
| Royal Titles Act 1974 | Internal Affairs |
| Rural Banking and Finance Corporation Act 1974 | Rural Banking and Finance Corporation |
| Rural Housing Act 1939 | Housing Corporation |
| Rural Intermediate Credit Act 1927 | Rural Banking and Finance Corporation |
| Safety of Children's Night Clothes Act 1977 | Trade and Industry |
| Sale of Goods Act 1908 | Justice |
| Sale of Liquor Act 1962 | Justice |
| Sales Tax Act 1974 | Customs |
| Sand Drift Act 1908 | Lands and |
| Survey | |
| Scientific and Industrial Research Act 1974 | Scientific and Industrial Research |
| Sea Carriage of Goods Act 1940 | Transport |
| Seal of New Zealand Act 1977 | Internal Affairs |
| Seamen's Union Funds Act 1971 | Labour |
| Secondhand Dealers Act 1963 | Justice |
| Secret Commissions Act 1910 | Justice |
| Securities Act 1978 | Justice |
| Securities Transfer Act 1977 | Justice |
| Sharebrokers Act 1908 | Justice |
| Sharemilking Agreements Act 1937 | Labour |
| shearers Act 1962 | Labour |
| Shipping and Seamen Act 1952 | Transport |
| Shipping Corporation of New Zealand Act 1973 | Transport |
| Shop Trading Hours Act 1977 | Labour |
| Shorthand Reporters Act 1908 | Justice |
| Simultaneous Deaths Act 1958 | Justice |
| Small Claims Tribunals Act 1976 | Justice |
| Social Security Act 1964—Part 1 | Social Welfare |
| Social Security Act 1964— Part 2 | Health |
| Social Security (Reciprocity with Australia) Act 1948 | Social Welfare |
| Social Security (Reciprocity with the United Kingdom) Act 1983 | Social Welfare |
| Soil Conservation and River Control Act 1941 | Works and Development |
| Sovereign's Birthday Observance Act 1952 | Internal Affairs |
| Stamp and Cheque Duties Act 1971 | Inland Revenue |
| Standards Act 1965 | Trade and Industry |
| State Insurance Act 1963 | State Insurance Office |
| State Services Act 1962 | State Services Commission |
| State Services Conditions of Employment Act 1977 | State Services Commission |
| Statistics Act 1975 | Statistics |
| Status of Children Act 1969 | Justice |
| Statute of Westminster Adoption Act 1947 | Foreign Affairs |
| Statutes Drafting and Compilation Act 1920 | Parliamentary Counsel Office |
| Statutory Land Charges Registration Act 1928 | Justice |
| Stock Foods Act 1946 | Agriculture and Fisheries |
| Submarine Cables and Pipelines Protection Act 1966 | Transport |
| Summary Offences Act 1981 | Justice |
| Summary Proceedings Act 1957 | Justice |
| Superannuation Schemes Act 1976 | Treasury |
| Surveyors Act 1966 | Lands and Survey |
| Swamp Drainage Act 1915 | Lands and Survey |
| Synthetic Fuels Plant (Effluent Disposal) Empowering Act 1983 | Energy |
| Taranaki Harbour Act 1965 | Transport |
| Taranaki Scholarships Trust Board Act 1957. | Education |
| Taratahi Agricultural Training Centre (Wairarapa) Act 1969 | Agriculture and Fisheries |
| Tarawera Forest Act 1967 | Maori Affairs |
| Tauranga Moana Maori Trust Board Act 1981 | Maori Affairs |
| Technicians Training Act 1967 | Labour |
| Tenancy Act 1955 | Housing Corporation |
| Territorial Sea and Exclusive Economic Zone Act 1977 | Foreign Affairs |
| Testing Laboratory Registration Act 1972 | Scientific and Industrial Research |
| Timber Floating Act 1954 | Forest Service |
| Time Act 1974 | Internal Affairs |
| Tobacco Growing Industry Act 1974 | Trade and Industry |
| Tokelau Act 1948 | Foreign Affairs |
| Tokelau (Territorial Sea and Exclusive Economic Zone) Act 1977 | Foreign Affairs |
| Tourist and Health Resorts Control Act 1908 | Tourist and Publicity |
| Tourist and Publicity Department Act 1963 | Tourist and Publicity |
| Tourist Hotel Corporation Act 1974 | Tourist Hotel Corporation |
| Town and Country Planning Act 1977 | Works and Development |
| Toxic Substances Act 1979 | Health |
| Trade and Industry Act 1956 | Trade and Industry |
| Trade Unions Act 1908 | Labour |
| Trademarks Act 1953 | Justice |
| Trades Certification Act 1966 | Education |
| Tramways Act 1908 | Works and Development |
| Transport At 1982 | Transport |
| Treaty of Waitangi Act 1975 | Maori Affairs |
| Tresspass Act 1980 | Justice |
| Trustee Act 1956 | Justice |
| Trustee Banks Act 1983 | Reserve Bank |
| Trustee Companies Act 1967 | Justice |
| Trustee Companies Management Act 1975 | Justice |
| Trustee Companies Protection Act 1934–35 | Justice |
| Tuberculosis Act 1948 | Health |
| Unclaimed Money Act 1971 | Reserve Bank |
| Undesirable Immigrants Exclusion Act 1919 | Labour |
| Unit Titles Act 1972 | Justice |
| Unit Trusts Act 1960 | Justice |
| United Nations Act 1946 | Foreign Affairs |
| United Nations (Police) Act 1964 | Police |
| Universities Act 1961 | University Grants Committee |
| University of Albany Act 1972 | University Grants Committee |
| University of Auckland Act 1961 | University Grants Committee |
| University of Canterbury Act 1961 | University Grants Committee |
| University of Otago Ordinance 1869 and University of Otago Amendment Act 1961 | University Grants Committee |
| University of Waikato Act 1963 | University Grants Committee |
| Unsolicited Goods and Services Act 1975 | Justice |
| Urban Transport Act 1980 | Transport |
| Valuation of Land Act 1951 | Valuation |
| Valuers Act 1948 | Valuation |
| Vegetables Levy Act 1957 | Agriculture and Fisheries |
| Veterinary Services Act 1946 | Agriculture and Fisheries |
| Veterinary Surgeons Act 1956 | Agriculture and Fisheries |
| Victoria University of Wellington Act 1961 | University Grants Committee |
| Visiting Forces Act 1939 | Foreign Affairs |
| Vocational Awards Act 1979 | Education |
| Vocational Training Council Act 1982 | Labour |
| Volunteers Employment Protection Act 1973 | Labour |
| Wages Protection Act 1983 | Labour |
| Wages Protection and Contractors' Liens Act 1957 | Justice |
| Waikato Valley Authority Act 1956 | Works and Development |
| Waitangi Day Act 1976 | Internal Affairs |
| Waitangi Endowment Act 1932–33 | Forest Service |
| Waitangi National Trust Board Act 1932 | Lands and Survey |
| Wanganui Computer Centre Act 1976 | State Services Commission |
| War Funds Act 1915 | Internal Affairs |
| War Pensions Act 1954 | Social Welfare |
| Water and Soil Conservation Act 1967 | Works and Development |
| Waterfront Industry Act 1976 | Labour |
| Weights and Measures Act 1925 | Labour |
| Western Samoa Act 1961 | Foreign Affairs |
| Westport Harbour Act 1920 | Transport |
| Wheat Board Act 1965 | Trade and Industry |
| Wheat Levy Act 1974 | Scientific and Industrial Research |
| Wild Animal Control Act 1977 | Forest Service |
| Wildlife Act 1953 | Internal Affairs |
| Wills Act 1837 (U.K.) | Justice |
| Wine Makers Act 1981 | Justice |
| Wine Makers Levy Act 1976 | Agriculture and Fisheries |
| Winston Churchill Memorial Trust Act 1965 | Internal Affairs |
| Wool Industry Act 1977 | Agriculture and Fisheries |
| Wool Labelling Act 1949 | Trade and Industry |
| Wool Testing Authority Act 1964 | Agriculture and Fisheries |
| Workers Compensation Act 1956 | Labour |
ADMINISTRATIVE TRIBUNALS—Administrative tribunals have gradually developed over a period of more than 50 years. As a rule they are set up by Act of Parliament or under powers conferred by statute. Their growth is related to the continuing expansion of governmental activity and responsibility for the general well-being of the community. This development is common to many countries. Useful references are The Citizen and Power: Administrative Tribunals, a survey by the Department of Justice, and the reports of the Public and Administrative Law Reform Committee, published annually.
Appeals from Administrative Tribunals—An Administrative Division of the High Court (then the Supreme Court) was established by the Judicature Amendment Act 1968. The Division consists of up to 4 Judges of the High Court, who are assigned to the Division by the Chief Justice. One of the most important functions of the Division is to determine appeals from such administrative tribunals as are specified by statute. It also hears and determines applications for judicial review and for prerogative writs and other classes of applications and proceedings referred to it by the Chief Justice or specified by statute.
Judges of the Court of Appeal and High Court—
Chief Justice: Rt. Hon. Sir Ronald Davison, C.M.G., G.B.E.
Court of Appeal: Rt. Hon. Sir Ronald Davison, C.M.G., G.B.E. (ex officio); Rt. Hon. Sir Arthur Wood-house, K.B.E., D.S.C., President; Rt. Hon. Sir Robin Cooke; Rt. Hon. I. L. M. Richardson; Rt. Hon. D. W. McMullin; Rt. Hon. E. J. Somers.
High Court: Rt. Hon. Sir Ronald Davison, C.M.G., G.B.E., Hon. L. F. Moller; Hon. C. M. Roper; Hon.
J. P. Quilliam; Hon. M. F. Chilwell; Hon. M. E. Casey; Hon. J. A. Ongley; Hon. R. I. Barker; Hon. J. F. Jeffries; Hon. M. H. Vautier; Hon. J. B. Sinclair; Hon. T. M. Thorp; Hon. G. E. Bisson; Hon. A. D. Holland; Hon. L. M. Greig; Hon. J. P. Cook, O.B.E., E.D.; Hon. R. C. Savage; Hon. M. Hardie Boys; Hon. E. M. Prichard; Hon. J. T. Eichelbaum; Hon. D. L. Tompkins; Hon. P. G. Hillyer; Hon. R. G. Gallen.
| LIST OF DEPARTMENTS OF THE NEW ZEALAND GOVERNMENT, WITH TITLES AND HOLDERS OF CHIEF ADMINISTRATIVE POSITIONS | ||
|---|---|---|
| Department | Chief Administrative Positions | |
| Title | Name | |
| Agriculture and Fisheries, Ministry of | Director-General | M. L. Cameron, B.AGR.SC. |
| Audit | Controller and Auditor-General | B. H. C. Tyler, A.C.A., B.C.A. |
| Crown Law | Solicitor-General | D. P. Neazor, LL.M., Q.C. |
| Customs | Comptroller | P. J. McKone |
| Defence, Ministry of | Secretary | D. B. G. McLean, M.SC., B.A. (OXON.) |
| Chief of Defence Staff | Air Marshal D. E. Jamieson, C.B., O.B.E. | |
| Chief of Air Staff | Air Vice-Marshal D. M. Crooks | |
| Chief of General Staff | Major-General J. Mace, O.B.E. | |
| Chief of Naval Staff | Rear-Admiral C. Stewart | |
| Education | Director-General | W. L. Renwick, M.A. |
| Energy, Ministry of | Secretary | J. J. Chesterman, F.N.Z.I.E. |
| Environment, Commission for the | Commissioner | K. Piddington, M.A. |
| Foreign Affairs, Ministry of | Secretary | M. Norrish, M.A. |
| Government Life Insurance Office | Commissioner | H. D. Peacock, F.I.A. |
| Government Printing Office | Government Printer | P. D. Hasselberg, ACCTS. PROF. |
| Health | Director-General | R. A. Barker, M.B., CH.B., F.R.V.P., F.R.A.C.P. |
| Housing Corporation | Director-General | R. A. Kelly, B.A., D.P.A. |
| Inland Revenue | Commissioner | J. Simcock, A.C.A. |
| Internal Affairs | Secretary and Clerk of Writs | E. J. Babe, B.COM., A.C.A., D.P.A., DIP. R.V. |
| Justice | Secretary for Justice | S. J. Callahan, A.C.A., D.P.A. |
| Labour | Secretary of Labour | G. L. Jackson, A.C.A. |
| Lands and Survey | Director-General | P. H. C. Lucas, ACCTS. PROF. |
| Legislative | Clerk of House of Representatives | C. P. Littlejohn, LL.M. |
| Maori Affairs | Secretary and Maori Trustee | Dr T. Reedy, PH.D. |
| New Zealand Forest Service | Director-General | A. Kirkland, B.SC., DIP. FOR. (C.B.A.), M.SC. (CALIF.) |
| New Zealand Security Intelligence Service | Director of Security | Brigadier J. L. Smith, C.B.E., B.A. |
| Police | Commissioner | K. O. Thompson |
| Post Office | Director-General | F. K. McInerney |
| Prime Minister's | Permanent Head | G. C. P. Hensley, M.A. |
| Public Trust Office | Public Trustee | W. B. R. Hawkins, A.C.A. |
| Railways | General Manager | H. G. Purdy, A.N.Z.I.M., F.C.I.T. |
| Rural Banking and Finance Corporation | General Manager | R. J. Chappell, DIP.V.F.M., R.V. |
| Scientific and Industrial Research | Director-General | Dr. G. Butler, M.SC., PH.D.(SWEDEN), F.R.S.N.Z. |
| Social Welfare | Director-General | J. W. Grant |
| State Insurance Office | General Manager | J. F. Stirton, F.I.D. |
| State Services Commission | Chairman | M. C. Probine, M.SC., PHD.(LSS), F.I.P. |
| Statistics | Government Statistician | S. S. R. Kuzmicich, B.SC. |
| Tourist and Publicity | General Manager | W. N. Plimmer, M.A. |
| Trade and Industry | Secretary | J. W. H. Clark, B.A., ADMIN.PROF., D.P.A. |
| Transport, Ministry of | Secretary | D. E. Homewood, M.A. |
| Treasury | Secretary | B. V. J. Galvin, B.A., M.P.A.(HVD) |
| Valuation | Valuer-General | M. R. Mander, DIP. V.F.M., R.V. |
| Works and Development, Ministry of | Commissioner | R. Norman, B.E., M.SC., M.N.Z.I.E. |
The State services comprise all servants of the Crown other than those holding political or judicial office. They include the 34 departments of the Public Service, and the Post Office, Railways Corporation, Legislative Department, Parliamentary Counsel Office, and other State organisations such as other Government corporations and agencies, the Police, the armed forces, and the teaching and health services.
Under the State Services Conditions of Employment Act 1977, the State Services Co-ordinating Committee is constituted as the principal adviser to the Minister of State Services and the official negotiating body with service organisations on all personnel matters which in the opinion of the committee significantly affect more than one employing authority. The committee consists of the following or their representatives: Chairman of the State Services Commission; Secretary to the Treasury; Director-General of the Post Office; General Manager of Railways; Secretary of Defence; Director-General of Health; and the Director-General of Education. Other State Service employing authorities may be co-opted as members of the committee from time to time.
Apart from proposals concerning salaries and related conditions of employment, the committee discusses more general personnel matters referred to it by the Government, individual employing authorities, and employee organisations, and tries to achieve a reasonable degree of inter-service uniformity.
Brief summaries of the functions of Government departments are now given.
Agriculture and Fisheries, Ministry of—The purpose of the ministry is: to assist the farming, horticulture, and fishing industries to identify and realise their potentials; to maintain and where possible improve New Zealand's animal, fish, and plant health status; and to provide our overseas customers with an assurance of the purity and safety of the food products we produce. The ministry also advises the Government on policies which will promote the growth and development of farming, horticulture, and fishing, maintain renewable resources, and enhance the New Zealand environment.
Audit Office—The Audit Office is responsible for auditing throughout the public sector—the Public Accounts, Government departments, Government trading corporations, local authorities, and producer boards. The audit is wider than the normal company audit and encompasses the twin areas of:
Financial—independent opinion on annual financial statements produced by above bodies.
—periodic review over financial control systems not directly related to the production of external financial statements.
Value for money—periodic reviews of the systems in both Central and Local Government for ensuring the effective and efficient use of public funds.
The Auditor-General, the statutory head of the Audit Office, has an annual duty to report to Parliament on any matters arising from audits which he or she desires to bring to public attention. In recent years these reports have been concerned with many aspects of financial management and administration generally in the public sector.
Crown Law Office—The primary function of the Crown Law Office is to act as the legal adviser of, and to appear in Court for, the Government and Ministers in matters affecting the Crown and Government departments. In addition the Solicitor-General performs most of the statutory and ex-officio duties of the Attorney-General's office and is himself entrusted by statute with various specific rights, duties, and functions. In range and activity the legal work of the Crown Law Office corresponds with the activities of the Government itself.
Customs Department—The principal functions of the Customs Department are: the detection and investigation of offences against the Customs Acts; administration of Customs prohibitions and restrictions; advising the Government on matters of tariff and other means of protection for local industry; collection of indirect taxation (Customs Duty, excise duty, sales tax, beer duty, motor spirits duty, international departure tax, and domestic air travel tax); investigations into values and origins of goods; participation in the negotiation of international and bilateral trade agreements and administration of the import licence issue procedures in conjunction with the Department of Trade and Industry.
Customs responsibilities involve the entry and clearance of ships and aircraft; passenger processing, liaison with New Zealand and overseas agencies in the control of international traffic; ensuring staff are trained to a satisfactory standard; protection and assistance to domestic industry, thus allowing growth in productivity, exports and employment; collecting the optimum level of indirect taxation as set out in the relevant legislation; the facilitation of international trade to the benefit of New Zealand in accordance with the Government's policies; and the issue of import licences and control of exports from New Zealand.
Defence, Ministry of—Functions include providing the resources required to enable Defence Headquarters to undertake the central command, control, management, and administration of the defence forces and the Ministry of Defence, and also maintaining and operating the defence communications network.
Education, Department of—The primary objective of the department is to ensure that suitable education facilities and services are readily available for all children of compulsory school age (from 6 to 15 years); for children who by choice start school at the age of 5 years; for those pupils over the age of 15 who stay on at school; for suitably qualified school leavers who seek (or are required to undertake) education and training on leaving school in secondary schools, teachers colleges, or technical institutes; and for adults wishing to continue their education, whether for vocational or non-vocational purposes. Associated with this objective is the responsibility for administering government policy in the maintenance and development of pre-school education.
In carrying out these objectives the department's main activities are the provision of professional and administrative services for the support of the education system, the administration of primary and secondary education, special education, the training of teachers, technical and continuing education, and the National Library.
Energy, Ministry of—The Ministry of Energy was established to advise the Government on the formulation, implementation, co-ordination, and continuing review of effective and efficient energy policies for New Zealand. In carrying out this function the ministry must take into account energy sources and resources; exploration, assessment, research and development; production, supply, and distribution; consumption and conservation; needs of industry, commerce, transport, and domestic users; needs of regions; international responsibilities; environmental and social issues; organisational and administrative methods; and future patterns, changes, problems, and the need for planning.
The ministry incorporates a head office, comprising the Corporate Services and Planning Divisions, and three operating divisions: Oil and Gas, Electricity, and Mines. All are responsible to the Secretary of Energy.
The Oil and Gas Division is responsible for oil supply and demand, demand restraint measures, the implementation of policy relating to alternative fuels, the pricing of oil and gas, policy relating to exploration and mining, natural gas utilisation and distribution, and the use of geothermal energy.
The Planning Division is responsible for economic studies into the demand for all types of energy, formulating suitable supply strategies, promoting efficient and economic use of energy conservation incentive schemes, and investigations into the viability of adopting new energy-related technologies.
The primary purpose of the Electricity Division of the ministry is to operate and maintain the bulk electricity supply system and to extend it so that the electricity needs of New Zealand are supplied safely, continuously, and economically. A further requirement is to undertake or promote measures to achieve greater economy and efficiency in the use of electricity as a means of reducing the future rate of growth of electricity requirements.
The Mines Division is responsible for the production and marketing of coal from state coal mines and administering licensing for the prospecting and mining of coal and other minerals. This includes the regulation and inspection of mining operations to ensure acceptable safety standards.
Environment, Commission for the—The commission provides advice and administrative support to the Minister for the Environment, promotes the co-ordination of Government policies in the environmental field, and initiates new policy proposals for the consideration of the Minister and others. It also audits environmental impact reports prepared by Government departments and other organisations on proposed new major works with significant environmental consequences.
Foreign Affairs, Ministry of—The Ministry of Foreign Affairs has the primary responsibility for advising and assisting the Government on the whole range of its relations with the outside world. This includes advising foreign governments of New Zealand's policies and keeping the New Zealand Government informed of overseas developments affecting New Zealand's interests. Policy formulation is undertaken in relation to New Zealand's economic, trade, political, and security needs, with the preparation of recommendations to the Government being carried out in close association with a number of other Government departments.
Other functions include the administration of New Zealand's official programme of aid to developing countries and responsibility for all official New Zealand information and publicity activities overseas other than those relating specifically to trade promotion or tourism.
The Ministry is the agency through which other governments and their representatives in New Zealand communicate with the New Zealand Government. It also undertakes foreign affairs and defence functions for the Cook Islands and Niue after consultation with their respective heads of government. It administers Tokelau.
In addition, the Ministry is responsible for operating and administering New Zealand's official representation overseas, which comprises a network of diplomatic and consular posts. A full list of these can be found at the end of this section. These posts represent and pursue New Zealand's interests overseas through a variety of ways, including participation in international negotiations, the gathering of information, and the promotion of a favourable New Zealand image. The posts perform services overseas on behalf of all Government departments and give assistance to New Zealanders overseas, whether travelling in official or private capacities. On behalf of other Government departments, posts are responsible for the overseas issue of passports and visas.
Forest Service, New Zealand—The main functions of the Forest Service are to obtain the maximum long-term benefit to the community from the balanced use and conservation of State forest resources, to promote the development of forestry and forest industry, and to maintain and, where possible, improve the health of New Zealand's forests.
Forests, both natural and artificially created, are managed so as to provide for a multiplicity of uses, such as wood production, soil and water conservation, recreation, scientific and biological preservation and education. In managing the forest resource the Forest Service attempts to strike a balance between these often conflicting uses.
Government Life Insurance Corporation—From October 1983 the Government Life Insurance Office became the Government Life Insurance Corporation. The corporation provides all types of life insurance and superannuation schemes. It is a mutual office which actively competes with private offices, and with assets worth more than $700 million, has a massive investment programme.
Government Printing Office—The purpose of the Government Printing Office is to provide a service which meets the needs of Parliament, Government, and its departments and agencies in the fields of printing, publishing, stationery, forms supply and storage, and also to advise in all of these areas.
Health; Department of—The principal functions of the Department of Health are:
To administer all public Acts relating to the promotion or conservation of human health, including the Health Act 1956, the Hospitals Act 1957, the Area Health Boards Act 1983, the Mental Health Act 1969, Part II of the Social Security Act 1964, the Misuse of Drugs Act 1975, the Food and Drug Act 1969 (to be replaced by the Food Act 1981 and the Medicines Act 1981), the Toxic Substances Act 1979, the Clean Air Act 1972 and the Noise Control Act 1982.
To advise local authorities in matters relating to environmental health.
To prevent, limit, and suppress communicable and other diseases.
To promote or carry out research and investigation in public health fields and the prevention and treatment of disease.
To carry out inspections of factories within the meaning of section 2 of the Factories Act 1946 in relation to matters concerning the public health and the prevention or treatment of disease, and to carry out all such inspections as may be required or authorised by or under any other Act.
To publish reports, information, and advice concerning public health.
To organise and control medical, dental, and nursing services, so far as such services are paid for out of public moneys.
Generally to take all such steps as may be desirable to secure the preparation, effective carrying out, and co-ordination of measures conducive to public health.
To provide advisory information and processing services to hospital boards and various health agencies.
Housing Corporation—The Housing Corporation is the chief government agency for providing finance for home ownership. It also provides home improvement loans, mortgage guarantees, and some refinance assistance.
Its other main function is the provision of publicly-owned housing. Activities include land acquisition and development, land sales, house construction, the management of its rental houses, sale of houses, loans and subsidy for pensioner accommodation, and urban development and redevelopment.
The corporation in its own right, or as agent, provides industrial loans and agency services including: administration of the Home Ownership Savings Act 1974; advances under the Family Benefit Capitalisation scheme; rehabilitation concessions to ex-servicemen; subsidies for hostel accommodation for young people; loans for hotel/motel accommodation, private schools, medical centres, and home insulation; and loans and mortgage guarantees to provide tourist accommodation and facilities.
Inland Revenue Department—The main function of the Inland Revenue Department is to assess and collect various taxes and duties. The principal of these is income tax which is collected in part by PAYE deductions from salaries and wages, in part by the payment of provisional tax during the year of derivation of income, and in part by an end of the year assessment. Of the other revenues collected the most significant comprise stamp duty, estate and gift duties, land tax, and totalisator duty. The department also collects accident compensation levies on behalf of the Accident Compensation Corporation.
Internal Affairs, Department of—The department carries out a broad range of functions, encompassing constitutional matters, and including local government, community development, aspects of social regulation, conservation activities, common services to Government departments, and other responsibilities.
Through the Gaming, Films and Constitutional Division, the department attends to formal constitutional procedures for the summoning and prorogation of Parliament. As Clerk of the Writs the Secretary for Internal Affairs performs functions concerning the issue and return of writs for parliamentary general elections and by-elections. The department administers legislation relating to New Zealand citizenship and passports, attends to the reception of guests of Government and arrangement of State functions. It also administers the legislation relating to horse and greyhound racing, gaming and lotteries, and film censorship.
The Local Government Division is responsible for administrating legislation relating to regional and territorial local government and services Local Government Commission schemes. It also has responsibility for administering Government policies and legislation in relation to the New Zealand Fire Service, for co-ordination of Government activities for the Chatham Islands, and for the general administration of Lake Taupo.
The Ministry of Civil Defence, in addition to its operational responsibilities, implements Government policy for assistance to local territorial authorities in carrying out their civil defence obligations and for co-ordinating the planning and use of Government resources in civil defence emergencies.
The Recreation, Arts, and Youth Division, incorporating the Ministry of Recreation and Sport, is responsible for administering Government policies and legislation relating to cultural matters, the recreation and sport programme, and youth activities. It administers a large number of community funding programmes. The work of the Commonwealth Youth Programme within New Zealand is co-ordinated by the department. The New Zealand Lottery Board, the New Zealand Council for Recreation and Sport, the National Museum, the National Art Gallery, and the New Zealand Historic Places Trust are all serviced by the department. The National Archives and the Historical Publications Branch form part of the department.
The Wildlife Service, in addition to managing the wildlife resources of two acclimatisation districts, is responsible nationally for the protection of New Zealand fauna. It administers legislation on recreational fishing, game hunting, and the conservation of native birds, terrestrial and freshwater invertebrates, and other wildlife species.
The department provides a translation service for Government departments which is also available to exporters, and administers the cleaning of Government offices. It attends to administrative matters relating to the office of the Governor-General and his staff, and to offices of Ministers of the Crown and Parliamentary Under-Secretaries. Meeting the costs of commissions of inquiry and carrying out administrative functions in respect to them are other responsibilities of the department.
Justice, Department of—The functions of the department may be classified broadly under the headings of penal policy and administration; law reform; the administration of justice; commercial affairs (including the administration of the Companies and Insolvency Acts); electoral; registration work including land titles, trade marks, patents, and births, deaths, and marriages; and social measures of a preventive nature. The Family Proceedings Act 1980, Legal Aid Act 1969, the Race Relations Act 1971, and the Summary Instalment Order provisions of the Insolvency Act 1967 have taken the department further into the broad area of social administration. The department is, through its Tribunals Division, responsible for the administration of the Sale of Liquor Act 1962, the Indecent Publications Act 1963, and the Town and Country Planning Act 1977 (Appeal Board provisions), together with other various tribunals.
Labour, Department of—The principal responsibilities of the Department of Labour are to promote and maintain full employment through the provision of a complete employment and vocational guidance service, to ensure through the work of its field staff that workers are employed under safe and healthy working conditions, to assist and promote good industrial relations, and to collect and publish relevant information. In addition, it administers a complex variety of statutes; among the most important are the Industrial Relations Act, the Factories and Commercial Premises Act, the Construction Act, and those dealing with weights and measures, apprenticeship, training, immigration, dangerous goods, and explosives.
Lands and Survey, Department of—As the Government's major land administering agency, the department manages, controls, or is involved with the administration of, about 10.3 million hectares of land, approximately 38 percent of New Zealand's land area. About 5.6 million hectares of this area are Crown leasehold, 2.8 million hectares are national parks and reserves, 640 123 hectares are being developed for farming purposes while the balance falls into a variety of categories (mountain tops, vacant Crown land, lake and riverbeds, etc.).
The department is also the national survey and mapping organisation, thus providing economic and effective co-ordination of all activities. This work includes control surveys as the basis for cadastral surveys and basic topographic mapping, land title surveys, large scale topographical surveys for engineering and management purposes, land development servicing, fixing of marine and air navigation aids, aerodrome obstruction surveys, earth deformation studies, and environmental planning of land.
Maori Affairs, Department of—The functions of the Department of Maori Affairs are to assist the Maori and Pacific Island peoples, particularly in social, economic, and cultural matters. For example, Maori land owners are assisted by the way of title reform and capital advances to make full use of their resources, and through its Community Services Division, the department gives encouragement in the fields of education, employment, housing, and health.
New Zealand Police—The role of the Police is:
To protect life and property, by guarding, patrolling, and anticipating danger not only from criminal acts, but also those which are natural, accidental, or unintentional.
To safeguard the liberties of the individual and preserve the public peace, by seeking to create and maintain conditions under which people may go about their lawful affairs undisturbed and protected from harmful and dangerous conduct.
To prevent crime and to seek, identify, and eliminate the causes of crime.
To detect offenders if crime is committed.
To encourage and advise the community on how to protect their persons and property from criminal behaviour.
To provide guidance and assistance:
In helping young people to achieve social maturity.
In cases of tragedy, or family and/or other personal crisis.
Post Office—The Post Office is charged with the operation and development of postal and telecommunications systems, both internal and overseas; the Post Office Savings Bank; and with handling a wide range of payments and receipts for Government departments and other organisations.
Prime Minister's Department—The Prime Minister's Department was established as a separate department in December 1975. Within the department, the Cabinet Office is responsible for servicing Cabinet, its committees, and the Executive Council. The Press Office is responsible for news media and public information relating to the Prime Minister and the general co-ordination of ministerial publicity. The staff of the Office of the Prime Minister provides the normal ministerial services. The Advisory Group advises the Prime Minister on policy matters referred to it. The External Intelligence Bureau functions as a research organisation in the general field of international affairs, and receives direction and policy guidance from the New Zealand Intelligence Council.
Public Trust Office—The Public Trust Office provides a wide range of services as trustee, executor, manager, and attorney. It also acts as sinking fund or depreciation fund commissioner for many local authorities when so appointed, and additionally holds other funds on their behalf. It is also required to provide a number of statutory services irrespective of whether these are remunerative.
New Zealand Railways Corporation—As from 1 April 1982 the New Zealand Government Railways Department became the New Zealand Railways Corporation.
The objectives of the corporation are—
To establish, maintain, and operate, or otherwise arrange for, safe and efficient rail freight and passenger transport services within New Zealand.
To establish, maintain, and operate, or otherwise arrange for, safe and efficient road passenger and freight transport services within New Zealand.
To establish, maintain, and operate, or otherwise arrange for, a safe and efficient ferry service for freight including the carriage of passengers and vehicles between the North and South Islands.
To provide or otherwise arrange for those ancillary services which, in the opinion of the corporation, are necessary for it to efficiently carry out its functions.
To endeavour to carry on the operations of the corporation in such a way that revenue exceeds costs, including interest and depreciation; and to provide for a return on capital that may be specified from time to time by the Minister of Finance.
Rural Banking and Finance Corporation—The Rural Banking and Finance Corporation was established on 1 April 1974 with the principal function of making loans and providing other assistance for farming and other primary industries and for related service industries.
Scientific and Industrial Research, Department of—The department exercises the functions of providing background scientific research for economic development, land use, and environmental control in several major areas.
Agriculture—Agriculture is a priority area, as it is the mainstay of the country's economy. Increasing emphasis is placed on (a) new crops, including those suitable for irrigated land and mechanical harvesting, to meet the demands of the rapidly expanding food processing industry; (b) the breeding of new and better varieties of pasture, particularly for hill country farming; (c) pests and disease control; and (d) the curing, drying, storage, processing, and packaging of agricultural products.
Manufacturing—Particular emphasis is given to improved industrial liaison and advisory services, electronic and electrical work, metal cutting and forming, industrial vibration and acoustic problems, and new product development.
Minerals—Continuing emphasis is given to prospecting, finding new uses for, and testing the processing of, local raw materials with a view to substantially increasing the “added value” component before export.
Energy—Aspects of prospecting for, and storage and processing of, energy resources are investigated. Advice is given on building and maintenance of energy-generating installations and on efficiency of use and conversion of energy in building and appliances. Processes for production of motor fuels from crops, coal, and wastes are being developed and tested, including economic aspects. Emphasis is being given to investigating the extent and possible additional utilisation of indigenous energy resources such as coal, natural gas, oil, and geothermal steam.
Natural Environment—Surveys are made of geology, soils, oceanography, flora, and fauna, Studies involve the environmental impact of major development proposals, including pollution problems.
Other Scientific Services—There are increasing demands for scientific services from Department of Health (food and drug analysis), Ministry of Transport (blood alcohol analysis), and Police Department (forensic). Publications include 7 research journals for New Zealand scientists, a quality-assurance journal for industry, and information leaflets for the public.
Social Welfare, Department of—The principal functions of the Department of Social Welfare are:
To administer the Department of Social Welfare Act 1971; the Children and Young Persons Act 1974; Part I of the Social Security Act 1964; the Family Benefits Home Ownership Act 1964; and to provide for the effective administration and servicing of the War Pensions Act 1954; the Rehabilitation Act 1941; and the Disabled Persons Community Welfare Act 1975.
Advise the Minister on the development of social welfare policies.
Provide such social welfare services as the Minister may from time to time direct.
Provide for the training of persons to undertake social welfare activities.
Maintain close liaison with and encourage co-operation and co-ordination among any organisations and individuals engaged in social welfare activities.
Undertake and promote research into aspects of social welfare.
State Insurance Office—The State Insurance Office transacts all classes of fire, accident, and marine insurance in New Zealand. Its function is to maintain a competitive insurance service.
It administers the Export Guarantee Office, which provides credit insurance for exporters, and also acts as claims-handling agent for the Accident Compensation Corporation.
Statistics, Department of—The Department of Statistics has the following broad functions:
To collect, compile, analyse, abstract, and publish economic, financial, production, and social statistics, and to make estimates, forecasts, projections, and statistical models;
To advise and inform the Minister of Statistics on statistical policy matters;
To define and promote standard concepts, procedures, definitions, and classifications;
To examine all proposals by other departments for commencing or commissioning new statistical surveys, and to prepare submissions to the Minister of Statistics for approval;
To review periodically the collection, compilation, analyses, abstraction, and publication of all official statistics;
To maintain liaison with international organisations or agencies requiring or making use of New Zealand statistics.
Pay Research—The Pay Research Unit conducts pay research investigations into specified classes of work carried on in the State Services and comparable work carried on outside. The work is assigned by the Pay Research Council which comprises an equal representation of official and staff organisations.
Tourist and Publicity Department—The main functions of the Tourist and Publicity Department are to promote travel to, within, and beyond New Zealand; to develop domestic tourism and to stimulate off-season travel; to promote New Zealand overseas in the interests of tourist industry development; to administer schemes for financial assistance for the provision of accommodation and other tourist facilities and for expanding private sector marketing overseas; to undertake research into overseas tourism markets and into domestic tourism; to operate and sell tours and provide a complete travel service to assist overseas travel agents; and to provide, within New Zealand, information and publicity services for Ministers of the Crown and Government departments. In order to provide these services, the department includes the National Film Unit, the National Publicity Studios, and the Information and Publicity Services Division. It also provides research services for the Tourism Advisory Council, an advisory body established in 1977 to report and make recommendations to the Minister of Tourism on all aspects of tourism.
Trade and Industry, Department of—The principal statutory functions of the Department of Trade and Industry are to promote and encourage the improvement and development of industry and commerce within New Zealand and to promote and encourage its export trade with a view to fostering the economic welfare of the country.
Greater attention is now being focused on the general economic climate in New Zealand with the objective of ensuring that decisions relating to investment and growth are framed so that resources are allocated efficiently. This provides a framework for the future development of the manufacturing sector which will encourage appropriate industries.
The diversification of New Zealand's exports, in the sense of both markets and products, is a major concern of the department. Trade negotiations with other countries, both individually and in international forums, are of critical importance and are increasing in number and complexity as trading horizons are widened. Equally, the department is involved with an increasing number of exporters in the development of new markets in a growing list of countries and in maintaining and expanding existing moments.
The department is trying to ensure that its administration of legislation on prices, monopolies, and mergers and takeovers, while fair to the consumer, does not inhibit either industrial development or the aims of increasing production, maintaining maximum levels of employment, and raising levels of productivity and exports.
Transport, Ministry of—The ministry is responsible for providing the Government with the information and advice necessary for the development of an efficient and economic transport policy.
The principal objective of the Road Transport Division is to develop, implement, and manage a range of programmes that will achieve a safe, efficient, and economic system of road transport.
The main objective of the Marine Division is to promote the safety of shipping in and beyond New Zealand waters, to ensure the safe handling of cargo at New Zealand ports, and the safe operation of boilers, pressure vessels, cranes, and lifts throughout New Zealand.
The main objective of the Civil Aviation Division is continuation of the existing high standards of civil aircraft operation. The ministry will continue its programme of providing improved facilities associated with the safe operation of aircraft particularly in regard to navigation aids, surveillance radars, aircraft and airport security, and general aviation supervision.
The Meteorological Service is responsible for the provision of information and advice to all sections of the community on the atmosphere, environment, weather, climatic conditions, and pollution of the air, and for promoting meteorological research and advising the Government on meteorological matters.
Treasury—The role of Treasury is:
To control the receipt, custody, and payment of the Government's finances as directed by statute and Government decisions.
To keep the Government informed on the existing external and internal economic situation, the effects of existing policy and trends and prospects for the future.
To advise the Government on the level and content of its expenditure and receipts, and assess the most effective allocations of limited resources among competing expenditure proposals.
To advise on, and implement, various aspects of the Government's financial and economic policies.
These general functions involve financial and economic management and investigating divisions of Treasury in the following particular tasks: the allocation of funds to departments; the investment of public funds; the raising, repayment, and conversion of loans; the preparation and co-ordination of economic situation reports, forecasts, and policy advice; and the preparation of the Budget and the annual Estimates of Expenditure.
The following specialist functions are also carried out by Treasury:
The Superannuation Division administers the Government Superannuation Fund and the National Provident Fund. The division also operates the local authorities investment pool which involves the granting of loans to local authorities and the investment of surplus funds.
The Government Actuary's office provides specialist services for the Government Life Insurance Office and Government Superannuation, registered friendly societies, and Government departments as required. The Government Actuary is also Registrar of Building Societies.
The Government Stores Board is the central controlling agency for the purchase, custody, and disposal of Government stores.
Valuation Department—The major activity of the department is to prepare valuation rolls for all districts in New Zealand, to keep these rolls up to date with changes in property holdings, ownership, occupancy, and development, and to revise the values at not more than 5-yearly intervals. Between the 5-yearly general revaluations current market values of individual properties are assessed as required. Values set by the department are used by other authorities to levy rates, land tax, estate, stamp and gift duties and also by most Government departments and agencies involved in land transactions. The department does research work on real estate markets and compiles section and house price indexes. It provides an advisory service to local authorites on all matters relating to rating. The department's extensive property record system is used to furnish data for land use, town planning and similar surveys to both local authorities and other public sector organisations.
Works and Development, Ministry of—In addition 10 the carrying out of Government works, the ministry has responsibility under the Minister's direction for executing projects and undertakings of national significance. Its objectives include the investigation, design, construction, operation, and maintenance of these works, having due regard to standards and costs, and the best practical means whereby environmental conditions can be conserved, restored, or enhanced. In most cases, completed works are taken over for operation and maintenance by operating departments such as the Electricity Division of the Ministry of Energy, and New Zealand Railways.
Further roles of the department include the development of natural resources and the encouragement, investigation, and co-ordination of proposals for regional planning, as well as the task of assembling information on the building and construction industries, and the programming of national capital formation including Government works.
Specific statutes administered by the department include the Public Works Act (which, inter alia, provides the Crown and local authorities with land acquisition powers), the Town and Country Planning Act, the National Development Act, the National Roads Act (the department services the National Roads Board), Soil Conservation and Rivers Control Act, Water and Soil Conservation Act (which involves the department in water allocation and quality control activities), and some local Acts.
Staff of State Services—The following table shows employment levels in the public sector.
| Organisation | Staff Numbers at 31 March | ||||
|---|---|---|---|---|---|
| 1979 | 1980 | 1981 | 1982 | 1983 | |
*Source, Annual Reports; calculated on head count basis. †Includes Cook Strait ferry staff. ‡Comprises teaching, non-teaching, and ancillary staff. Calculation of the teaching staff figure is based on entitlement in full-time equivalents while non-teaching and ancillary staff are calculated on a head count basis. Figures for 1980–82 have been revised. Source: Departments of Education and University Grants Committee. 1983 figure is provisional. §Source: National Health Statistics Centre; calculated as average full-time equivalents. || Effective strength of uniformed police plus cadets, matrons, staff on retiring leave, etc. ¶Includes Legislative Department, Parliamentary Counsel Office, Queen Elizabeth II Arts Council, N.Z. Council for Education Research, Ombudsmen's Office, Privacy Commissioner's Office, Vocational Training Council, and other bodies financed by Government funds. ** Figures for 1979–82 have been revised. ††As at February for 1980, 1981 and 1982. The 1983 figure is not available. | |||||
| Public Service* | 84,516 | 84,363 | 85,666 | 86,045 | 85,229 |
| Railways*† | 22,076 | 21,794 | 21,241 | 21,610 | 20,865 |
| Post Office* | 39,395 | 39,465 | 39,639 | 39,279 | 37,979 |
| Education‡ | 58,026 | 62 033x | 61 809x | 62,038 | 62,872 |
| Hospital services§ | 48,668 | 45,532 | 49,271 | 49,024 | 48,543 |
| Armed forces* | 12,739 | 12,641 | 12,866 | 12,808 | 12,856 |
| Police|| | 4,882 | 5,088 | 5,060 | 5,085 | 5,062 |
| Other (estimated)¶ | 750 | 750 | 704 | 710 | 710 |
| Total | 271 052 | 274 666 | 276 256 | 276 599 | 274 116 |
| Percentage of total labour force** | 21.13x | 21.07x | 20.90x | 20.64 | |
| Labour force as at April††** | 1 282 800x | 1 303 300x | 1 321 600x | 1 340 100x | |
In New Zealand, with its long tradition of Government activity in many spheres, the work of the State Services covers a broad field. The Government decides when a new service is to be provided or a new function undertaken. Work loads increase as a result of such factors as legislative changes of population growth, but are offset to some extent by improvements in efficiency. Since February 1976 the total staff ceiling of the public service has been frozen, with priority demands for additional staff in departments being met from a “pool” of positions to which each department contributes a fixed percentage of its total staff ceiling. It should be noted that staff ceiling figures are calculated on full-time equivalent positions while the figures in the tables are actual head counts and also include staff appointed under the separate ceilings for training and for unemployment-related functions. Recent trends have been for more staff for research and resource development, especially development of energy projects, and expanded social services.
The consumption expenditure of Central Government and Local Government as a percentage of the appropriation of National Disposable Income is shown in the following table.
| Year Ended March | Final Consumption Expenditure of | National Disposable Income | Expenditure as Percentage of National Disposable Income | ||
|---|---|---|---|---|---|
| Central Government | Local Government | Central Government | Local Government | ||
| * Provisional. | |||||
| $(m) | $(m) | $(m) | % | % | |
| 1978–79 | 2,549x | 333 | 15,751x | 16.2x | 2.1 |
| 1979–80 | 2,926x | 396 | 19,179x | 15.3x | 2.1 |
| 1980–81 | 3,656x | 496x | 22,214x | 16.5x | 2.2 |
| 1981–82 | 4,430x | 591x | 26,680x | 16.6x | 2.2x |
| 1982–83* | 4,950 | 675 | 29,278 | 16.9 | 2.3 |
STATE SERVICES COMMISSION—In terms of the State Services Act 1962 the State Services Commission is responsible to the Government of the day for efficiency and economy in the administration of Government policies.
In its role as the central personnel authority for the Public Service, the Commission is independent of the Government of the day in making appointments and promotions and in taking disciplinary action and other personnel decisions. This independence is protected by law.
The Act provides for a State Services Commission of up to four persons appointed by the Governor-General in Council on the recommendation of the Prime Minister. The statutory functions of the Commission are set out in section 12 of the Act:
Reviewing the machinery of Government, including the allocation of functions to and between departments, the desirability of (or need for) the creation of new departments and the amalgamation or abolition of existing departments, the co-ordination of the activities of departments, and the extent and nature of controls exercised by any one department over the operations of another department;
Reviewing the efficiency and economy of each department;
The provision of suitable office accommodation and the prescription and supervision of physical working conditions of all employees in the Public Service;
Approving and reviewing establishments of staff;
Acting as the central personnel authority for the Public Service;
Prescribing basic training programmes, furnishing advice on and assisting with the training of staff, and making recommendations to the Minister on the facilities necessary for the proper training of staff;
Providing management consultation services, including advice as to efficient work and control methods and techniques, data processing equipment, and problems of organisation.
The Commission has additional functions under the State Services Conditions of Employment Act 1977. That legislation provides that the Commission is responsible for determining the salaries and conditions of employment for all employees of the Public Service and for co-ordinating the determination of pay rates and conditions of employment in all branches of the State Services (the Post Office, Railways, teaching service, hospital service, Broadcasting, Fire Service, the armed forces and the Public Service).
Computer Services—The Computer Services Division of the State Services Commission is responsible for the control, co-ordination, planning, and provision of electronic data-processing services within the Public Service, and for advising the Government on computing.
The division's head office is in Museum Street, Wellington.
It maintains 4 computer centres;
Cumberland Computer Centre, Cumberland House, for accounting and payroll applications for the majority of Government departments.
Pipitea Computer Centre, Thorndon Quay, for Valuation, Social Welfare, and Inland Revenue systems.
Trentham Computer Centre, Anzac Road, Trentham, to support bulk processing of the Customs Department and scientific users.
Wanganui Computer Centre, Wairere House, Bute Street, Wanganui, to service the Police, Transport, and Justice Departments.
An engineering and scientific computer centre in the Vogel Building, Wellington, is operated by the Ministry of Works and Development as agent for the State Services Commission.
The division also maintains 4 data preparation centres located in Blenheim, Palmerston North, Waikanae, and Upper Hutt.
THE PUBLIC SERVICE: Recruitment—The recruitment of public servants is conducted by the State Services Commission through its recruitment officers and district representatives, and by departments in collaboration with the Commission. Details of career openings in the Service are regularly supplied to schools, and career leaflets are published.
Promotion—Promotion in the Public Service is based on merit. Appointments to positions above basic level may be made either from people within the Public Service or from people outside the service. In making appointments the State Services Commission requires departments to adhere to the principle of equal employment opportunity. Accordingly, any person may apply to join the Public Service, without regard to race, colour, national or ethnic origins, sex, marital status, and religious beliefs or the absence thereof. Public servants have certain rights of appeal to the Public Service Appeal Board.
Classification and Grading—Since 1963 the Commission has prescribed occupational classes, according to the nature of the duties required to be performed. Each occupational class is graded according to relative levels of responsibility and skills required, and individual positions are allocated a grade or grades within that class.
Remuneration—Salary rates are prescribed in accordance with the State Services Conditions of Employment Act 1977 and are in general related to the levels of remuneration of persons doing comparable work in employment outside the Public Service. Adequate margins are maintained for skill and responsibility.
Efficiency and Economy—In fulfilling its responsibility for reviewing efficiency and economy in the Public Service, the Commission, in collaboration with departments, reviews and analyses systems, standards, and controls; new training methods and materials; modern technical processes and equipment; and lays down clearly defined systems of delegation of authority and of discipline.
Staff Training and Education—The Commission also advises departments on education, staff training, and development, and provides resource material and training programmes. It has a particular responsibility for the provision and delivery of middle and senior management programmes. Future staffing needs of the Public Service are studied.
Elimination of Discrimination—The Public Service has tended to be ahead of the private sector in the introduction of provisions to eliminate discrimination, e.g., equal pay, maternity and paternity leave, preferential re-entry after resigning to care for a pre-school child, and equal access to housing finance for male and female staff on transfer. The Public Service also operates affirmative action programmes for the disabled and for Maoris and Pacific Islanders.
Statistics: Staff—The detailed distribution of staff among departments in the Public Service is shown in the Commission's annual report to Parliament (Parliamentary paper G. 3). At 31 March 1983 there were 66 102 permanent officers and 1388 temporary staff (excluding casuals) employed; a year earlier the comparable figures were 66 259 and 1454 respectively. These figures do not include wage workers, who totalled 17 739 in 1983.
STATUTORY BODIES, BOARDS, AND COMMITTEES—The following is a list of the main statutory boards, bodies, and committees grouped according to the Government department responsible for the administration of the legislation or the servicing of the boards as at 1 April 1983. The order of departments is generally that followed in the Yearbook for coverage of the main subject matter.
For information on the membership of committees and boards, and rates of honoraria and fees, refer to The Register of Statutory and Allied Organisations produced by the Cabinet Office.
| Agriculture and Fisheries, Ministry of |
| Agricultural Chemicals Board. |
| Agricultural Pests Destruction Council. |
| Agricultural Seeds Advisory Committee. |
| Animal Ethical Committees (6). |
| Animal Health Advisory Committee. |
| Apiaries Advisory Committee. |
| Apple and Pear Marketing Board. |
| Beef Committee. |
| British Phosphate Commissioners. |
| Christmas Island Phosphate Commission. |
| Dairy Factory Managers' Registration Board. |
| Dairy Industry Bursary Selection Committee. |
| Dairy Industry Loans Council. |
| Dairy Products Prices Authority. |
| Fisheries Licensing Authority. |
| Fishing Industry Board. |
| Freshwater Fisheries Advisory Council. |
| Fruit Distributors' Ltd. |
| Hop Marketing Committee. |
| Horticultural Export Development Committee. |
| Interdepartmental Committee on Nassella Tussock Control. |
| Kiwifruit Marketing Licensing Authority. |
| Marine Reserves (2). |
| Market Development Committee (lamb). |
| Maximum Security Quarantine Advisory Committee. |
| Meat Export Prices Committee. |
| Milk Appeal Authority. |
| Nassella Tussock Boards (2). |
| National Fisheries Management Advisory Committee. |
| National Hydatids Council. |
| N.Z. Dairy Board. |
| N.Z. Meat Producers Board. |
| N.Z. Milk Board. |
| N.Z. Pork Industry Board. |
| N.Z. Potato Board. |
| N.Z. Poultry Board. |
| N.Z. Sheep Plan Council. |
| N.Z. Wool Board. |
| N.Z. Wool Testing Authority. |
| Noxious Plants Council. |
| Nursery Stock Research Extension Advisory Committee. |
| Pesticides Board. |
| Phosphate Commission of N.Z. |
| Plant Variety Rights (Roses) Advisory Committee. |
| Poultry Research Committee. |
| Raspberry District Committees (4) |
| Raspberry Marketing Council. |
| Seed Potato Certification Advisory Committee. |
| Tuberculosis Hardship Committee. |
| Vegetable Research Extension Advisory Committee. |
| Veterinary Services Council. |
| Veterinary Surgeons' Board. |
| Wairarapa Cadet Training Farm Trust Board. |
| Winchmore Advisory Committee. |
| Broadcasting Corporation of New Zealand |
| Broadcasting Complaints Committee. |
| Broadcasting Tribunal. |
| Customs, Department of |
| New Zealand Distillery Co. Ltd. |
| Defence, Ministry of |
| Armed Forces Canteen Council. |
| Education, Department of |
| Advisory Committee on the Teaching of the Maori Language. |
| Auckland Teachers College Council. |
| Authority for Advanced Vocational Awards. |
| Central Advisory Committee. |
| Christchurch Teachers College Council. |
| Council of Auckland University. |
| Council of Canterbury University. |
| Council of Lincoln College. |
| Council of Massey University. |
| Council of Otago University. |
| Council of Victoria University. |
| Council of Waikato University. |
| Dunedin Teachers College Council. |
| Education Boards Employment Review Committee. |
| Hamilton Teachers College Council. |
| Integration Standing Committee. |
| Maori Education Foundation. |
| Music Teachers' Registration Board. |
| National Advisory Committee on Maori Education. |
| National Council of Adult Education. |
| N.Z. Council for Educational Research. |
| N.Z. National Commission for UNESCO. |
| N.Z. Technical Correspondence Institute Council. |
| N.Z. Trades Certification Board. |
| Ngarimu V.C. and 28th (Maori) Battalion Memorial Scholarship Fund Board. |
| Otaki and Porirua Trusts Board. |
| Pacific Islands Polynesian Education Foundation. |
| Palmerston North Teachers College Council. |
| Papawai and Kaikokirikiri Trust Board. |
| Primary Teachers Appointment Appeal Board. |
| Protected Teachers Appeal Board. |
| Royal N.Z. Foundation for the Blind. |
| School Certificate Examination Board. |
| Standing Committee on Relationships in Tertiary Education. |
| Teachers Assessment and Classification Appeal Board. |
| Teachers Court of Appeal. |
| Teachers Disciplinary Board. |
| Technical Institute and Community College Boards Employment Review Committee. |
| Tertiary Assistance Grants Appeal Authority. |
| Trustees of National Library. |
| Universities Entrance Board. |
| University Grants Committee. |
| Wellington Teachers College Council. |
| Energy, Ministry of |
| Board of Examiners (2). |
| Coal Mines Council. |
| Coal Mining Industries Welfare Council. |
| Coal Supplies (Wholesale) Ltd. |
| Demand Restraint Advisory Committee— |
| Transport |
| Industrialists |
| Motorists |
| Electrical Lineman Training Committee. |
| Electrical Registration Board. |
| Electrical Wiring Regulations Committee. |
| Energy Advisory Committee. |
| Greymouth Coal Ltd. |
| Guardians of Lakes (3). |
| Liquid Fuels Trust Board. |
| Maramarua Coal Fields Ltd. |
| Natural Gas Corporation of New Zealand Ltd. |
| New Zealand Energy Research and Development Committee. |
| Offshore Mining Company Ltd. |
| Oil Stocks and Supply Advisory Committee. |
| Petroleum Corporation of New Zealand and Subsidiary Companies. |
| Roose Packaging Ltd. |
| Roosepak Distributors Ltd. |
| Rural Electrical Reticulation Council. |
| Waikato Carbonisation Ltd. |
| Foreign Affairs, Ministry of |
| Advisory Committee on External Aid and Development. |
| Government Life Insurance Corporation |
| Government Insurance Advisory Board. |
| Government Insurance Investment Board |
| Government Printing Office |
| Government Printing Office Advisory Board. |
| Health, Department of |
| Advisory Board on Health Services Computing. |
| Advisory Committee on Health Services Executive Manpower. |
| Advisory Committee on Hospital Board Funding. |
| Advisory Committee on Medical Manpower. |
| Advisory Committee on Smoking and Health. |
| Ambulance Transport Advisory Board. |
| Anaesthetic Mortality Assessment Committee. |
| Anaesthetic Technicians Training Committee. |
| Breast Milk Substitutes Committee. |
| Board of Health. |
| Central Committee on Training Orthopaedic Technicians. |
| Central Standing Committee on Health Centres. |
| Children's Health Camps Board. |
| Civil Defence Medical Planning Committee. |
| Clean Air Council. |
| Committee on Adverse Drug Reactions. |
| Committee on Drainage and Sanitary Plumbing. |
| Congenital Anomalies Advisory Committee. |
| Consultant Advisers in Pathology Committee. |
| Council of the Pharmaceutical Society. |
| Dental Benefits Central Advisory Committee. |
| Dental Council. |
| Dental Technicians Board. |
| Dietitians Board. |
| Dietitians Salaries Grading Committee. |
| Drug Assessment Advisory Committee. |
| Drugs Advisory Committee. |
| Engineers Salaries Grading Committee. |
| Fluoridation Advisory Committee. |
| Food Standards Committee. |
| Hospital Medical Officers Advisory Committee. |
| Hospital Scientific Officers Salaries Grading Advisory Committee. |
| Hospital Services Committee. |
| Hospital Works Committee. |
| Hospitals Advisory Council. |
| Inebriates Home. |
| Laboratory Officers Salaries Grading Committee. |
| Laboratory Services Advisory Committee. |
| Laboratory Services Fees Negotiating Committee. |
| Maternal Deaths Assessment Committee. |
| Maternity Benefits Negotiating Committee. |
| Medical Council of N.Z. |
| Medical Laboratory Technologists Board. |
| Medical Officers Salaries Grading Committee. |
| Medical Practitioners Disciplinary Committee. |
| Medical Radiation Technologists Board. |
| Medical Services Advisory Committee. |
| National Advisory Committee on Cancer Treatment Services. |
| National Nursing Manpower Planning Committee. |
| National Technical Committee on Standards and Quality Control in Medical Clinical Laboratories. |
| N.Z. Council for Post-Graduate Medical Education. |
| Non-Treatment Services Staff Grading Advisory Committee. |
| Northland Health Services Advisory Committee. |
| Nosocomial Infections Advisory Committee. |
| Nursing Council of N.Z. |
| Nursing Education Review Advisory Committee. |
| Nutrition Advisory Committee. |
| Occupational Health Advisory Committee. |
| Occupational Therapy Board. |
| Opticians Board. |
| Pharmaceutical Advisory Committee. |
| Pharmaceutical Benefits Negotiating Committee. |
| Pharmaceutical and Therapeutics Advisory Committee. |
| Physiotherapy Board. |
| Plumbers, Gasfitters, and Drainlayers Board. |
| Podiatrics Board. |
| Poisons Committee. |
| Psychologists Board. |
| Radiation Protection Advisory Council. |
| Radiographers' Salaries Grading Committee. |
| Radiological Services Advisory Committee. |
| Registrars' Review Panel. |
| Resident Medical Officers Establishment Committee. |
| Restricted Drugs Committee. |
| Review Committee. |
| Secretarial and Clerical Grading Officers' Grading Committee. |
| Senior Medical Officers' Overseas. |
| Study Grants Selection Committee. |
| South Auckland Plunket Child Health Committee. |
| Special Advisory Committee on Health Services Organisation. |
| Special Dentist Manpower Advisory Committee. |
| Supervising Committee, Rotorua Island. |
| Supervising Committees: the Bridge (3). |
| Technical Standing Committee on Renal Dialysis. |
| Technicians Grading Advisory Committee. |
| Toxic Substances Board. |
| Transfusion Advisory Committee. |
| Treatment and Diagnostic Staff Grading Advisory Committee. |
| Wellington Health Services Advisory Committee. |
| Housing Corporation of New Zealand |
| Housing Performance Guarantee Corporation of N.Z. |
| Housing Allocation Committees (34). |
| National Housing Commission. |
| Rent Appeal Board. |
| Rural Banking and Finance Corporation. |
| Internal Affairs, Department of |
| ANZAC Fellowship Selection Committee. |
| Architects Education and Registration Board. |
| Architects Investigation Committee. |
| Fauna Protection Advisory Council. |
| N.Z. Historic Places Trust. |
| N.Z. Lottery Board and Distribution Committees (6). |
| N.Z. Fire Service Commission. |
| N.Z. Canteen Fund Board. |
| N.Z. Patriotic Fund Board. |
| N.Z. Racing Authority. |
| Totalisator Agency Board. |
| University of Hawke's Bay Trust. |
| War Memorial Board of Trustees. |
| Winston Churchill Memorial Trust Board. |
| Arts— |
| Council for Maori and South Pacific Arts. |
| Cultural Facilities Advisory Committee. |
| Film Trade Board. |
| Films Censorship Board of Review. |
| interim Committee for Conservation of Cultural Property. |
| Literary Fund Advisory Committee. |
| Board of Trustees National Art Gallery, Museum and War Memorial. |
| Queen Elizabeth the Second Arts Council of New Zealand. |
| Regional Arts Councils (3). |
| Civil Defence— |
| National Civil Defence Committee. |
| National Civil Defence Planning Committees (11). |
| Local Government— |
| Joint Council for Local Authority Services. |
| Local Government Commission. |
| Recreation and Sport— |
| N.Z. Council for Recreation and Sport. |
| Justice, Department of |
| Abortion Supervisory Committee. |
| Accident Compensation Appeal Authority. |
| Alcoholic Liquor Advisory Committee. |
| Broadcasting Tribunal. |
| Contracts and Commercial Law Reform Committee. |
| Co-operative Dairy Companies Tribunal. |
| Copyright Tribunal. |
| Criminal Law Reform Committee. |
| Deportation Review Tribunal. |
| District Courts Rules Committee. |
| Equal Opportunities Tribunal. |
| Hotel Association of N.Z. Disciplinary Committee. |
| Hotel Investment Account Advisory Committee. |
| Human Rights Commission. |
| Indecent Publications Tribunal. |
| Land Valuation Tribunals (20). |
| Law Reform Council. |
| Legal Aid Appeal Authority. |
| Legal Aid Board. |
| Licensing Control Commission. |
| Motor Vehicle Dealers Licensing Authority. |
| Motor Vehicle Disputes Tribunals (3). |
| Motor Vehicle Salesmen Registration Board. |
| Planning Tribunals. |
| Prison Parole Board. |
| Property Law and Equity Reform Committee. |
| Public and Administrative Law Reform Committee. |
| Race Relations Conciliator. |
| Real Estate Agents Licensing Board. |
| Registrar of Private Investigators and Security Guards. |
| Release to Work Committee. |
| Representation Commission. |
| Rules Committee. |
| Securities Commission. |
| Small Claims Tribunals (13). |
| Youth Institutions Visiting Committees. |
| Labour, Department of |
| Accident Compensation Corporation. |
| Agricultural Tribunal. |
| Aircrew Industrial Tribunal. |
| Arbitration Court. |
| Building Industry Technicians' Training Council. |
| Conscientious Objection Committee. |
| Construction Act Advisory Committee. |
| Dental Technician Training Council. |
| Employment Advisory Committees (13). |
| Forklift Safety Advisory Committee. |
| Higher Salaries Commission. |
| Industrial Conciliation Service. |
| Industrial Mediation Service. |
| National Advisory Council on the Employment of Women. |
| Shop Trading Hours Commission. |
| Vocational Training Council. |
| Waterfront Industry Commission. |
| Waterfront Industry Tribunal. |
| Lands and Survey, Department of |
| Bay of Islands Maritime and Historic Park Board. |
| Hauraki Gulf Maritime Park. |
| Hunter Soldiers Assistance Trust Board. |
| Land Settlement Board. |
| Marlborough Sounds Maritime Park Board. |
| National Parks and Reserves Authority. |
| National Parks and Reserves Boards. |
| Nature Conservation Council. |
| N.Z. Geographic Board. |
| N.Z. Survey Board. |
| N.Z. Walkway Commission. |
| Queen Elizabeth the Second National Trust. |
| Maori Affairs, Department of |
| Board of Maori Affairs. |
| Maori Land Advisory Committees (10). |
| Maori Purposes Fund Board. |
| Maori Soldiers Trust Committee. |
| Maori Trust Boards (13). |
| N.Z. Forest Service |
| Indigenous Forest Timber Advisory Committee. |
| N.Z. Forestry Council. |
| State Forest Parks Advisory Committees (18). |
| State Forest Scientific Reserves Advisory Committee. |
| Timber Industry Training Centre Advisory Committee. |
| Timber Preservation Authority. |
| National Recreational Hunting Advisory Committee. |
| N.Z. Security Intelligence Service |
| Commissioner of Security Appeals. |
| Police Department |
| Police Appeal Board. |
| Police Promotion Board. |
| Post Office |
| Post Office Appeal Board. |
| Post Office Classification and Grading Committee. |
| Post Office Promotion Board. |
| Post Office Sick Benefit Fund. |
| Post Office Staff Tribunal. |
| Radio Interference Advisory Committee. |
| Railways Corporation |
| Government Railways Industrial Tribunal. |
| Grading Committee. |
| N.Z. Railways Corporation Appeal Board. |
| Scientific and Industrial Research, Department of |
| Atomic Energy Committee. |
| Building Research Association of N.Z. Inc. |
| Carter Observatory Board. |
| Cawthron Institute Trust Board. |
| Coal Research Association of N.Z. Inc. |
| Fruit Research Advisory Council. |
| Hop Research Committee. |
| Meat Industry Research Institute of N.Z. (Inc.). |
| National Research Advisory Council. |
| N.Z. Dairy Research Institute. |
| N.Z. Fertiliser Manufacturers Research Association (Inc.). |
| N.Z. Heavy Engineering Research Association (inc.). |
| N.Z. Leather and Shoe Research Association (Inc.). |
| N.Z. Logging Industry Research Association. |
| N.Z. Pottery and Ceramics Research Association (Inc.). |
| Potato Research Advisory Committee. |
| Research Institute of Textile Services. |
| Ross Dependency Research Committee. |
| Testing Laboratory Registration Council. |
| Tobacco Research Advisory Committee. |
| Wheat Research Committee. |
| Wool Research Organisation of N.Z. Inc. |
| Social Welfare, Department of |
| Advisory Council for the Community Welfare of Disabled Persons. |
| Child Care Co-ordinating Committees (2). |
| Home Budgeting Advisory Committee. |
| National Advisory Committee on the Prevention of Child Abuse. |
| Social Advisory Council. |
| Social Science Research Fund Committee. |
| Social Security Appeal Authority. |
| Social Work Training Council. |
| War Pensions Board. |
| War Pensions Appeal Board. |
| War Pensions Medical Research Trust. |
| Rehabilitation Board. |
| Rehabilitation League N.Z. (Inc.)—Board of Management. |
| N.Z. Artificial Limb Board. |
| State Insurance |
| State Insurance Investment Board. |
| State Services Commission |
| Advisory Committee on Women's Affairs (A.C.W.A.). |
| Classification and Grading Committee. |
| Government Service Tribunal. |
| Hospital Service Committee. |
| Hospital Service Tribunal. |
| Public Sector Tribunal. |
| Public Service Appeal Board. |
| Security Review Authority. |
| Special Public Service Appeal Board. |
| State Services Co-ordinating Committee. |
| Wanganui Computer Centre Management Committee. |
| Wanganui Computer Centre Policy Committee. |
| Tourist and Publicity Department |
| N.Z. Maori Arts and Crafts Institute. |
| N.Z. Tourism Council. |
| Tourist Hotel Corporation of N.Z. |
| Trade and Industry, Department of |
| Commerce Commission. |
| Consumer Council. |
| Development Finance Corporation. |
| Distribution Council. |
| Emergency Protection Authority. |
| Export Guarantee Advisory Committee. |
| Industries Development Commission. |
| Manufacturing Development Council. |
| Motor Spirits Licensing Appeal Authority. |
| Motor Spirits Licensing Authority. |
| N.Z. Export-Import Corporation. |
| N.Z. Industrial Design Council. |
| N.Z. Wheat Board. |
| Regional Development Councils (11). |
| Standards Association of N.Z. |
| Standards Council. |
| Tobacco Board. |
| Transport, Ministry of |
| Marine Council. |
| Maritime Appeal Authority. |
| New Zealand Ports Authority. |
| Regional Transport Licensing Authority. |
| Road Traffic Safety Research Council. |
| Shipping Corporation of New Zealand. |
| Shipping Industry Tribunal. |
| Transport Advisory Council. |
| Transport Charges Appeal Authority. |
| Transport Licensing Appeal Authority. |
| Transport Licensing Authorities (5). |
| Urban Transport Council. |
| Committees— |
| Small Boat Safety Committee. |
| New Zealand Committee on Pollution of the Sea by Oil. |
| New Zealand Search and Rescue Committee. |
| Safe Driving Award Scheme Committee. |
| Treasury |
| Bank of N.Z. Board of Directors. |
| Earthquake and War Damage Commission. |
| Government Stores Board. |
| Government Superannuation Board. |
| Income Tax Appeal Authorities (3). |
| Local Authorities Loans Board. |
| National Provident Fund Board. |
| National Provident Fund Investment Committee. |
| N.Z. Planning Council. |
| Overseas Investment Commission. |
| Overtime and Shift Work Recognition Authority. |
| Reserve Bank of New Zealand. |
| Trustee Savings Banks (12). |
| Taxation Review Authority. |
| Visiting Experts Advisory Committee. |
| Valuation Department |
| Valuers Registration Board. |
| Works and Development, Ministry of |
| Building Industry Advisory Council. |
| Clerks of Works Registration Board. |
| Engineering Associates Registration Board. |
| Engineers Registration Board. |
| National Roads Board. |
| National Water and Soil Conservation Authority. |
| N.Z. Planning Council. |
| Quantity Surveyors' Registration Board. |
| Soil Conservation and Rivers Control Council. |
| Water Resources Council. |
For further information on the overseas posts listed below refer to the Ministry of Foreign Affairs' publication New Zealand Government Offices Overseas.
Australia—High Commission, Commonwealth Avenue, Canberra, A.C.T. 2600.
Consulate-General, 60 Park Street (corner Park and Elizabeth Streets), Sydney, N.S.W. 2000 (G.P.O. Box 365, Sydney. N.S.W. 2001).
Government Tourist Office, 115 Pitt Street, Sydney, N.S.W., 2000 (G.P.O. Box 614, Sydney N.S.W. 2001).
Consulate-General, 330 Collins Street, Melbourne, Vic. 3000 (G.P.O. Box 2136T, Melbourne, Vic. 3001).
Government Tourist Office, 332 Collins Street, Melbourne, Vic. 3000 (G.P.O. Box 2136T, Melbourne, Vic. 3001).
Consulate, Watkins Place Building, 288 Edward Street, Brisbane, Qld. 4001 (G.P.O. Box 62).
Government Tourist Office, Watkins Place Building, 288 Edward Street, Brisbane, Qld. 4001 (G.P.O. Box 62).
Consulate, 10th Floor, St. George's Court, 16 St. George's Terrace, Perth, W.A. 6000 (G.P.O. Box X2227, Perth, W.A, 6001).
Austria—Embassy, Hollandstrasse 2/XII, Vienna (Postal address: Postfach 1471, A-1011 Vienna).
Bahrain—Consulate-General, 1st Floor, Manama Centre Building, Government Road, Manama (Postal address: P.O. Box 5881, Manama, Bahrain).
Bangladesh—High Commissioner (designate) resident in Wellington.
Barbados—High Commissioner resident in Ottawa (see under Canada).
Belgium—embassy, Boulevard du Regent 47–48, 1000 Brussels.
Brazil—Ambassador resident in Santiago (see under Chile).
Britain—High Commission, New Zealand House, Haymarket, London SW 1Y 4TQ.
Brunei—Commissioner resident in Kuala Lumpur (see under Malaysia).
Burma—Ambassador resident in Bangkok (see under Thailand).
Canada—High Commission, Suite 801, Metropolitan House, 99 Bank Street, Ottawa, Ontario K1P 6G3.
Consulate, Suite 1260–701, West Georgia Street, I.B.M. Tower, Vancouver, B.C. (P.O. Box 10071, Pacific Centre, Vancouver, B. C. V7Y 1B6).
Chile—Embassy, Avenida Isidora Goyenechea 3516 Las Condes, Santiago.
China—Embassy, Ritan Dongerjie No. 1, Chaoyang District, Peking.
Colombia—Ambassador resident in Lima (see under Peru).
Cook Islands—Office of the New Zealand Representative, 1st Floor, Philatelic Bureau Building, Takuvaine Road, Avarua, Rarotonga (P.O. Box 21, Rarotonga).
Cyprus—High Commissioner resident in Athens (see under Greece).
Czechoslovakia—Ambassador resident in Vienna (see under Austria).
Denmark—Ambassador resident in Brussels.
Ecuador—Ambassador resident in Lima (see under Peru).
Egypt—Ambassador resident in Rome (see under Italy).
European Communities—Ambassador resident in Brussels (see under Belgium).
Fiji—High Commission, Ratu Sukuna House, corner of Victoria Parade and MacArthur Street (P.O. Box 1378), Suva.
Finland—Ambassador resident in Moscow (see under U.S.S.R.).
Food and Agriculture Organisation (FAO)—See under United Nations.
France—Embassy, 7 ter, rue Leonard de Vinci, 75116 Paris.
Consulate-General, 4 Boulevard Vauban, Noumea, New Caledonia (Postal Address: Boite Postale 2219).
New Zealand Government Trade Correspondent, Air New Zealand Ltd., Vaima Centre, (B.P. 73), Papeete, Tahiti, French Polynesia.
German Democratic Republic—Ambassador resident in Vienna (see under Austria).
Germany, Federal Republic of—Embassy, Bonn Center, HI 902, Bundeskanzlerplatz, 5300 Bonn.
Government Tourist Office, Kaiserhofstrasse 7, 6000 Frankfurt, Main.
Greece—Embassy, An Tsoha 15–17, Ambelokipi, Athens, TT 618.
Guyana—High Commissioner resident in Ottawa (see under Canada).
Holy See—Ambassador resident in Paris (see under France).
Hong Kong—Commission, 3414 Connaught Centre, Connaught Road (G.P.O. Box 2790), Hong Kong.
Hungary—Ambassador resident in Vienna (see under Austria).
India—High Commissioner resident in Wellington.
Indonesia—Embassy, Jalan Diponegoro No. 41, Menteng, Jakarta. (Postal address; P.O. Box 2439 JKT).
Iran—Embassy, Avenue Mirza-ye-Shirazi, Shahid Ali-ye-Mirza Hassani Street, No. 29 (P.O. Box 128), Tehran.
Iraq—Embassy, 2D/19, Zuwiya, Jadriyah, Baghdad (near Baghdad University), c/o Department of Trade and Industry, Wellington.
Ireland—Ambassador resident in London (see under Britain).
Italy—Embassy, Via Zara 28, Rome 00198.
Jamaica—High Commissioner resident in Ottawa (see under Canada).
Japan—Embassy, 20–40 Kamiyama-cho, Shibuya-Ku, Tokyo 150.
Government Tourist Office, 5–2 Yurakucho 1-chome, Chiyoda-ku, Tokyo 100.
Kenya—High Commissioner resident in Athens (see under Greece).
Kiribati—High Commissioner resident in Suva (see under Fiji).
Korea, Republic of—Embassy, 2nd Floor, Publishers Association Building, No. 105–2, Sagan-dong, Chongro-ku (G.P.O. Box 1059), Seoul.
Laos—Ambassador resident in Bangkok (see under Thailand).
Luxembourg—Ambassador resident in Brussels (see under Belgium).
Macau—Consul-General resident in Hong Kong.
Malaysia—High Commission, 193 Jalan Tun Razak (P.O. Box 12003), Kuala Lumpur, 16–01.
Maldives—Ambassador resident in Singapore.
Malta—High Commissioner resident in Rome (see under Italy).
Mexico—Embassy, Embajada de Nueva Zelandia, Homero 229, Pi508, Mexico D.F. 11570 Mexico.
Mongolia—Ambassador resident in Moscow (see under U.S.S.R.).
Nauru—High Commissioner resident in Suva (see under Fiji).
Nepal—A non-resident ambassador is to be accredited from Wellington.
Netherlands—Embassy, Mauritskade 25, 2514 HD The Hague.
New Caledonia—See under France.
Nigeria—High Commissioner resident in London (see under Britain). New Zealand Consulate, 4 Goriola St., Victoria, 150 Lagos (P.M.B. 21079, IKEJA, Lagos).
Niue—Office of the New Zealand Representative, Tapeu, Alofi (P.O. Box 78), Niue.
Norway—Ambassador resident in The Hague (see under Netherlands).
OECD—N.Z. Permanent Delegation to the OECD is located at the N.Z. Embassy in Paris (see under France).
Pakistan—Ambassador resident in Tehran (see under Iran).
Papua New Guinea—High Commission, Port Moresby (P.O. Box 1144, Boroko, Port Moresby).
Peru—Embassy, Avenida Salaverry 3006, San Isidro, Lima 27 (Postal address; Casilla 5587), Lima 100.
Philippines—Embassy, 10th Floor, Bankmer Building, 6756 Ayala Avenue (P.O. Box 2208, Makati Commercial Centre), Makati, Metro, Manila.
Poland—Ambassador resident in Vienna (see under Austria).
Portugal—Ambassador resident in Paris (see under France).
Romania—Ambassador resident in Vienna (see under Austria).
Saudi Arabia—Ambassador resident in Rome. A resident mission will be opened during 1984.
Singapore—High Commission, 13 Nassim Road, Singapore 1025.
Solomon Islands—High Commission, Soltel House, Mendana Avenue (P.O. Box 697), Honiara.
Spain—Ambassador resident in Paris (see under France).
Sri Lanka—High Commissioner resident in Singapore.
Sweden—Ambassador resident in The Hague (see under the Netherlands).
Switzerland—Ambassador resident in Bonn.
Consulate-General, 28A Chemin du Petit-Saconnex, CH–1209 Geneva (Postal address: Case Postale 84, CH–1211 Geneva 19).
Tahiti—See under France.
Tanzania—High Commissioner resident in Athens (see under Greece).
Thailand—Embassy, 93 Wireless Road (P.O. Box 2719), Bangkok 5.
Tokelau—Office for Tokelau Affairs, Savalalo Street, Apia, Western Samoa (P.O. Box 865, Apia).
Tonga —High Commission, Tungi Arcade, Taufa'ahau Road, Nuku'alofa (P.O. Box 830).
Trinidad and Tobago—High Commission resident in Ottawa (see under Canada).
New Zealand Consulate, 69 Independence Square, Port of Spain, Trinidad W.I. (P.O. Box 118, Port of Spain).
Tuvalu—High Commissioner resident in Suva (see under Fiji).
Union of Soviet Socialist Republics—Embassy, 44 Ulitsa Vorovskovo, Moscow 121069.
United Nations—New Zealand Permanent Mission to the United Nations, One U.N. Plaza, 25th Floor, New York, N.Y. 10017.
New Zealand Permanent Mission to the Office of the United Nations in Geneva, 28A Chemin du Petit-Saconnex, CH–1209 Geneva, (Postal address; Case Postale 84, CH–1211 Geneva 19, Switzerland).
New Zealand Permanent Mission to the Office of the U.N. in Vienna, located at the N.Z. Embassy in Vienna (see under Austria).
New Zealand Permanent Delegation to the Food and Agriculture Organisation (FAO), located at the N.Z. Embassy in Rome (see under Italy).
New Zealand Permanent Delegation to the United Nations Educational, Scientific, and Cultural Organisation, located at the N.Z. Embassy in Paris (see under France).
New Zealand Permanent Delegation to the U.N. Environment Programme (U.N.E.P.) located at the N.Z. Embassy in Athens.
United States—Embassy, 37 Observatory Circle, N.W., Washington, D.C. 20008.
Consulate-General, Suite 530, 630 Fifth Avenue, New York, N.Y. 10111, U.S.A.
Consulate-General, Alcoa Building, Suite 970, Maritime Plaza, San Francisco, Ca. 94111.
Consulate-General, Suite 1530, Tishman Building, 10960 Wilshire Boulevard, Los Angeles, Ca. 90024.
New Zealand Trade Correspondent, Air New Zealand Ltd., Suite 1707, Waikiki Business Plaza, 2270 Kalakaua Avenue, Waikiki, Honolulu, Hawaii, 96815. U.S.A.
Vanuatu—High Commissioner resident in Honiara (see under Solomon Islands).
Venezuela—Ambassador resident in Lima (see under Peru).
Viet Nam—Ambassador resident in Bangkok (see under Thailand).
Western Samoa—High Commission, Beach Road (P.O. Box 208), Apia.
Yugoslavia—Ambassador resident in Rome (see under Rome).
For further information on the official overseas representation in New Zealand listed below refer to the Ministry of Foreign Affairs' publication Diplomatic Corps and Consular and Other Representatives.
Australia—Australian High Commission, 72–78 Hobson Street, Thorndon, Wellington.
Consulate-General, 8th Floor, Union House, 32–38 Quay Street, Auckland.
Austria—Ambassador resident in Canberra.
Hon. Consul, 158 The Terrace, Wellington.
Hon. Consul, 1 McColl Street, Auckland.
Bangladesh—Ambassador resident in Canberra.
Belgium—Embassy of Belgium, 1–3 Willeston Street, Wellington.
Hon. Consul, 13th Floor, Southern Cross Building, Victoria Street East, Auckland.
Hon. Consul, 10th Floor, AMP Building, 47 Cathedral Square, Christchurch.
Brazil—Ambassador resident in Canberra.
Hon. Consul, 8 Commerce Street, Auckland.
Britain—British High Commission, Reserve Bank Building, 2 The Terrace, Wellington.
Consulate-General, Norwich Union Building, Queen Street, Auckland 1.
Hon. Consul, 44B Glandovey Road, Fendalton, Christchurch.
Burma—Ambassador resident in Canberra.
Canada—Canadian High Commission, ICI House, Molesworth Street, Wellington.
Hon. Consul, 61 Wakefield Street, Auckland.
Chile—Embassy of the Republic of Chile, 12th Floor, Robert Jones House, Jervois Quay, Wellington.
Hon. Consul, 280–288, Parnell Road, Auckland.
China—Embassy of the People's Republic of China, 2–6 Glenmore Street, Wellington.
Colombia—Ambassador resident in Peking.
Hon. Consul, Charter House, 20 Northcroft Street, Takapuna, Auckland.
Cook Islands—Consular Office of the Cook Islands, 330 Parnell Rd, Parnell, Auckland.
Costa Rica—Hon. Consul-General, 2–12 Parnell Road, Auckland.
Cyprus—High Commissioner resident in Canberra.
Czechoslovakia—Embassy of the Czechoslovak Socialist Republic, 12 Anne Street, Wellington.
Denmark—Ambassador resident in Canberra.
Hon. Consul-General, 105–109, The Terrace, Wellington.
Hon. Consul-General, Princes Court, Princes Street, Auckland.
Danish Trade Representative, Princes Court, Princes Street, Auckland.
Hon. Consul, 100 Cumnor Terrace, Woolston, Christchurch.
Hon. Consul, 1220 St. Andrew Street, Dunedin.
Ecuador—Ambassador resident in Tokyo.
Hon. Consul, 2nd floor, National Mutual Building, Featherston Street, Wellington.
Egypt—Embassy of the Arab Republic of Egypt, Dalmuir House, The Terrace, Wellington.
Fiji—Fiji High Commission, 2nd Floor, Robert Jones House, Jervois Quay, Wellington.
Consulate, 3rd Floor, 47 High Street, Auckland.
Finland—Ambassador resident in Canberra.
Hon. Consul-General, 126 Wakefield Street, Wellington.
Hon. Consul, 33 Allum Street, Kohimarama, Auckland.
Hon. Consul, Durham Courts, cnr. Durham and Wordsworth Streets, Sydenham, Christchurch.
Hon. Consul, Mutual Fund Building, 11 Bond Street, Dunedin.
France—Embassy of France, 14th Floor, Robert Jones House, 1–3 Willeston Street, Wellington.
Hon. Consul, corner of Princes Street and Eden Crescent, Auckland 1.
Office of the Trade Representative for France, Wyndham Street, Auckland.
Hon. Consul, c/o Teachers College, Christchurch.
Hon. Consul, c/o University of Otago, Dunedin.
German Democratic Republic—Ambassador resident in Canberra.
Germany (West)—Embassy of the Federal Republic of Germany, 90–92 Hobson Street, Thorndon, Wellington.
Hon. Consul, 17 Albert Street, Auckland 1.
Hon. Consul, 71 Cambridge Terrace, Christchurch.
Greece—Ambassador resident in Canberra.
Hon. Consul-General, 37 Courtenay Place, Wellington.
Holy See—Apostolic Nunicature, 112 Queen's Drive, Lyall Bay, Wellington 3.
Hungary—Ambassador resident in Canberra.
Iceland—Hon. Consul-General, 88 Oriental Parade, Wellington.
India—Office of the High Commissioner for India, 180 Molesworth Street, Wellington.
Indonesia—Embassy of the Republic of Indonesia, 70 Glen Road, Kelburn, Wellington 1.
Iran—Ambassador resident in Canberra.
Iraq—Ambassador resident in Canberra.
Ireland—Ambassador resident in Canberra.
Hon. Consul, 2nd Floor, Dingwall Building, 87 Queen Street. Auckland.
Israel—Embassy of Israel, 13th Floor, Williams City Centre, Plimmer Steps, Wellington.
Italy—Embassy of Italy, 38 Grant Road, Wellington.
Hon. Consular Agent, 1 Princes Street, Auckland.
Hon. Consular Agent, 161A Eglinton Road, Mornington, Dunedin.
Japan—Embassy of Japan, 7th and 8th Floors, Norwich Insurance House, 3–11 Hunter Street, Wellington.
Consulate-General of Japan, 6th Floor, National Mutual Building, 37–45 Shortland Street, Auckland.
Consular Office of Japan, 1st Floor, General Building, 77 Hereford Street, Christchurch.
Kiribati—High Commissioner resident in Tarawa.
Hon. Consul, 33 Great South Road, Otahuhu, Auckland.
Korea—Embassy of the Republic of Korea, 12th Floor, Williams City Centre, Plimmer Steps, Wellington.
Hon. Consul, 7th Floor, A.N.Z. House, cnr Queen and Victoria Streets, Auckland.
Hon. Consul, 126 Cashel Street, Christchurch.
Laos—Ambassador resident in Canberra.
Libya—Secretary of the People's Committee resident in Canberra.
Lebanon—Ambassador resident in Canberra.
Malaysia—High Commission of Malaysia, Chase-NBA House, 163–165 The Terrace, Wellington.
Hon. Consul, 14 Hazeldean Road, Christchurch.
Mali—Ambassador resident in Peking.
Mexico—Ambassador resident in Canberra.
Hon. Consul, Tatra House, 96 Tory Street, Wellington.
Mongolia—Ambassador resident in Tokyo.
Nauru—Consulate-General of Nauru, Samoa House, Level 3, 283 Karangahape Road, Auckland.
Nepal—Ambassador resident in Tokyo.
Netherlands—Royal Netherlands Embassy, 10th Floor, Investment Centre, corner Ballance and Featherston Streets, Wellington.
Hon. Consul, 2nd Floor, National Mutual Centre, 41 Shortland Street, Auckland.
Hon. Consul, Amsterdam House. 161–163 Kilmore Street, Christchurch.
Nigeria—High Commissioner resident in Canberra.
Niue—Consular Office, 4th Floor, Samoa House, 283 Karangahape Road, Auckland.
Norway—Ambassador resident in Canberra.
Hon. Consul-General, 2nd Floor, Wool House, 10 Brandon Street, Wellington.
Hon. Consul, 13 Brighton Tce., Mairangi Bay, Auckland.
Hon. Consul, 163 Worcester Street, Christchurch.
Hon. Consul, 365 Princes Street, Dunedin.
Pakistan—Ambassador resident in Canberra.
Papua New Guinea—Papua New Guinea High Commission, 11th Floor, Princess Towers, 180 Moles-worth Street, Wellington.
Peru—Embassy of Peru, 3rd Floor, 35–37 Victoria Street, Wellington.
Hon. Consul, 79 Customs Street East, Auckland.
Philippines—Embassy of the Philippines, Level 30, Williams City Centre, Plimmer Steps, Wellington.
Hon. Consul-General, 93–97 Dominion Road, Mount Eden, Auckland 1.
Poland—Ambassador resident in Canberra.
Portugal—Ambassador resident in Canberra.
Hon. Consul, 47–51 Fort Street, Auckland.
Hon. Consul, 330 Moray Place, Dunedin.
Hon. Consul, 15th Floor, Marac House, 105–109 The Terrace, Wellington.
Romania—Embassy, 31 Doris Gordon Crescent, Crofton Downs, Wellington.
Saudi Arabia—Ambassador resident in Canberra.
Singapore—High Commission, 17 Kabul Street, Khandallah, Wellington.
Solomon Islands—High Commissioner resident in Honiara.
Spain—Ambassador resident in Canberra.
Hon. Vice-Consul, c/o Lees Industries Ltd., Papakura, Auckland.
Hon. Vice-Consul, 148 Lichfield Street, Christchurch
Sri Lanka—Ambassador resident in Canberra.
Hon. Trade Commissioner, c/o Chambers Nicholls, Williams Centre. Plimmer Steps, Wellington.
Sweden—Royal Swedish Embassy, 8th Floor, Greenock House, 39 The Terrace, Wellington.
Hon. Consul, 37 St Georges Bay Road, Parnell, Auckland.
Hon. Consul, 178 Cashel Street, Christchurch.
Hon. Vice-Consul, 40 Jetty Street, Dunedin.
Hon. Vice-Consul, The Crescent, Invercargill.
Switzerland—Embassy of Switzerland, Panama House, 22–24 Panama Street, Wellington.
Hon. Consul, 48 Carr Road, Mount Roskill, Auckland.
Thailand—Royal Thai Embassy, 2 Burnell Avenue, Wellington.
Tonga—New Zealand Agents for the Government of Tonga, cnr Church Street and Beachcroft Avenue Onehunga, Auckland 6.
Turkey—Ambassador resident in Canberra.
Hon. Consul-General, 5th Floor, 228 Queen Street, Auckland.
Tuvalu—Hon. Consul, 33 Great South Road, Otahuhu, Auckland.
Uruguay—Chargé d'affaires resident in Canberra.
U.S.A.—Embassy of the United States of America, 29 Fitzherbert Terrace, Wellington 1.
Consulate-General, cnr Shortland and O'Connell Streets, Auckland.
Consular Agent, c/o Lawrence Anderson Buddie, P.O. Box 13–250, Christchurch.
U.S.S.R.—Embassy of the Union of Soviet Socialist Republics, 57 Messines Road, Karori, Wellington.
Vanuatu—High Commissioner resident in Port Vila.
Venezuela—Ambassador resident in Canberra.
Viet Nam—Ambassador resident in Canberra.
Western Samoa—High Commission for Western Samoa, 1A Wesley Road, Kelburn Wellington.
Consulate-General, 3rd Floor, Maota Samoa, 283 Karangahape Road, Auckland.
Yugoslavia—Embassy of the Socialist Federal Republic of Yugoslavia, 24 Hatton Street, Wellington.
Hon. Consul, 4th Floor, A.M.P. Building, corner of Queen and Victoria Streets, Auckland.
| TOTAL POPULATION AND EXTERNAL MIGRATION | ||||||
|---|---|---|---|---|---|---|
| Year | Population* | Mean Population* | Natural Increase | Net Migration† | ||
| At 31 March | At 31 December | Year Ended 31 March | Year Ended 31 December | Year Ended 31 December | Year Ended 31 March | |
* Does not include armed forces personnel overseas. †Excluding through passengers, crews, and members of armed forces, etc. | ||||||
| 1931 | 1,511,700 | 1,522,762 | 1,498,416 | 1,514,215 | 15,805 | 5,109 |
| 1941 | 1,636,230 | 1,631,276 | 1,635,715 | 1,630,948 | 22,123 | 714 |
| 1951 | 1,938,032 | 1,970,522 | 1,917,934 | 1,947,529 | 30,970 | 7,522 |
| 1961 | 2,414,296 | 2,461,243 | 2,388,004 | 2,426,654 | 43,608 | 1,620 |
| 1971 | 2,861,000 | 2,895,500 | 2,831,200 | 2,864,200 | 40,151 | 7,845 |
| 1973 | 2,973,200 | 3,024,900 | 2,931,300 | 2,977,100 | 35,415 | 25,475 |
| 1974 | 3,040,600 | 3,091,900 | 2,993,600 | 3,041,800 | 34,075 | 33,167 |
| 1975 | 3,012,500 | 3,143,700 | 3,057,800 | 3,100,100 | 31,525 | 29,141 |
| 1976 | 3,140,300 | 3,163,400 | 3,111,300 | 3,131,800 | 29,648 | 5,192 |
| 1977 | 3,155,400 | 3,166,400 | 3,136,200 | 3,142,600 | 28,218 | −16 270 |
| 1978 | 3,160,200 | 3,165,200 | 3,143,500 | 3,143,500 | 26,360 | −22 156 |
| 1979 | 3,158,200 | 3,163,900 | 3,143,100 | 3,137,800 | 26,939 | −26 544 |
| 1980 | 3,161,300 | 3,176,400 | 3,138,000 | 3,144,000 | 23,866 | −21 314 |
| 1981 | 3,170,900 | 3,195,800 | 3,146,700 | 3,157,200 | 25,644 | −16 209 |
| 1982 | 3,190,100 | 3,299,800 | 3,162,100 | 3,182,900 | 24,406 | −4 743 |
| 1983 | 3,230,000 | 3,269,500 | 3,192,200 | 3,225,500 | 24,483 | 15,442 |
| 1984 | 3,265,500 | 3,234,900 | 10,425 | |||
| VITAL STATISTICS | ||||||||
|---|---|---|---|---|---|---|---|---|
| December Year | Numbers | Rates per 1000 of Mean Population | Deaths Under 1 Year per 1000 Live Births* | Marriages | ||||
| Live Births* | Deaths | Deaths Under 1 Year | Live Births* | Deaths | Number | Rate per 1000 Mean Population | ||
| * Figures have been revised to exclude registrations under Section 24 of the Births and Deaths Registration Act 1925 and Section 14 of the Births and Deaths Registration Act 1951 (late registration). | ||||||||
| 1931 | 28,867 | 13,062 | 1,077 | 19.06 | 8.63 | 37.31 | 10,254 | 6.77 |
| 1941 | 39,170 | 17,047 | 1,562 | 24.02 | 10.45 | 39.88 | 13,830 | 8.48 |
| 1951 | 49,806 | 18,836 | 1,374 | 25.57 | 9.67 | 27.59 | 16,915 | 8.69 |
| 1961 | 65,390 | 21,782 | 1,490 | 26.95 | 8.98 | 22.79 | 19,426 | 8.01 |
| 1971 | 64,460 | 24,309 | 1,066 | 22.51 | 8.49 | 16.54 | 27,199 | 9.50 |
| 1973 | 60,727 | 25,312 | 985 | 20.40 | 8.50 | 16.22 | 26,274 | 8.83 |
| 1974 | 59,336 | 25,261 | 922 | 19.51 | 8.30 | 15.54 | 25,412 | 8.35 |
| 1975 | 56,639 | 25,114 | 904 | 18.27 | 8.10 | 15.96 | 24,535 | 7.91 |
| 1976 | 55,105 | 25,457 | 766 | 17.60 | 8.13 | 13.90 | 24,154 | 7.71 |
| 1977 | 54,179 | 25,961 | 770 | 17.24 | 8.26 | 14.21 | 22,589 | 7.19 |
| 1978 | 51,029 | 24,669 | 703 | 16.23 | 7.85 | 13.78 | 22,426 | 7.13 |
| 1979 | 52,279 | 25,340 | 653 | 16.66 | 8.08 | 12.49 | 22,326 | 7.12 |
| 1980 | 50,542 | 26,676 | 650 | 16.08 | 8.48 | 12.86 | 22,981 | 7.31 |
| 1981 | 50,794 | 25,150 | 592 | 16.09 | 7.97 | 11.65 | 23,660 | 7.49 |
| 1982 | 49,938 | 25,532 | 587 | 15.69 | 8.02 | 11.75 | 25,537 | 8.02 |
| 1983 | 50,474 | 25,991 | 633 | 15.65 | 8.06 | 12.54 | 24,678 | 7.65 |
| EDUCATION | |||||||
|---|---|---|---|---|---|---|---|
| Roll Numbers at Educational Institutions | |||||||
| At 1 July | Primary | Secondary | Higher | University Institutions (Including Extramural and Part-time Students) | |||
| State Schools | Registered Private Schools | State Schools | Registered Private Schools | Technical Institutes (Full-time Students) | Teachers*Colleges | ||
* Includes kindergarten trainees. †Excludes short course enrolments counted previously. | |||||||
| 1931 | 220,976 | 26,448 | 31,053 | 4,602 | 1,165 | 5,111 | |
| 1941 | 208,595 | 27,836 | 33,253 | 6,451 | 1,503 | 5,065 | |
| 1951 | 265,230 | 37,109 | 50,682 | 11,045 | 2,704 | 10,956 | |
| 1961 | 376,475 | 54,079 | 109,632 | 20,752 | 221 | 3,814 | 16,820 |
| 1971 | 467,097 | 51,009 | 160,839 | 29,267 | 2,236 | 7,791 | 37,257 |
| 1973 | 470,273 | 50,711 | 171,978 | 30,201 | 3,378 | 7,811 | 38,995 |
| 1974 | 473,099 | 50,574 | 177,582 | 31,014 | 3,561 | 7,616 | 39,949 |
| 1975 | 474,578 | 50,745 | 187,950 | 31,804 | 3,840 | 7,211 | 42,436 |
| 1976 | 475,113 | 49,899 | 197,912 | 32,379 | 4,513 | 7 521* | 46,207 |
| 1977 | 473,621 | 49,309 | 199,734 | 32,281 | 4,946 | 6 834* | 47,706 |
| 1978 | 472,144 | 48,893 | 202,756 | 32,287 | 5,960 | 6 234* | 48,511 |
| 1979 | 467,621 | 48,355 | 198,124 | 32,004 | 6,286 | 5 820* | 49,188 |
| 1980 | 460,983 | 45,619 | 195,090 | 31,256 | 6,842 | 5 919* | 51,522 |
| 1981 | 454,859 | 38,997 | 196,946 | 27,890 | 6,915 | 5 901* | 52,988 |
| 1982 | 458,968 | 27,199 | 204,125 | 19,376 | 7,330 | 4 470* | 54 149† |
| 1983 | 465,413 | 10,670 | 220,113 | 10,635 | 7,956 | 3 436* | 56 513† |
| JUSTICE | ||||||
|---|---|---|---|---|---|---|
| Year | District Courts* | High Court* | Prisoners in Jail at End of Year (Undergoing Sentence) | |||
| Total Charge Summary Convictions† | Rate per 1000 of Mean Population | Persons Sentenced | Rate per 1000 of Mean Population | Number | Rate per 1000 of Population as at 31 Dec | |
* Previous to 1 April 1980 District Courts were known as Magistrates' Courts and the High Court as the Supreme Court. From 1 April 1981 includes District Court trial courts. †From 1977 excludes traffic offences except those resulting in deaths or injuries. Statistics prior to 1977 are not comparable with figures from 1977. ‡Known to be short-counted. | ||||||
| 1931 | 23,259 | 15.36 | 600 | 0.40 | 1,614 | 1.06 |
| 1941 | 24,529 | 15.04 | 542 | 0.33 | 988 | 0.61 |
| 1951 | 22,409 | 11.50 | 644 | 0.33 | 1,040 | 0.53 |
| 1961 | 35,318 | 14.55 | 294 | 0.12 | 1,818 | 0.75 |
| 1971 | 61,701 | 21.54 | 404 | 0.14 | 2,544 | 0.88 |
| 1973 | 68,477 | 23.06 | 479 | 0.16 | 2,370 | 0.78 |
| 1974 | 72,762 | 24.00 | 545 | 0.18 | 2,295 | 0.74 |
| 1975 | 82,655 | 26.78 | 669 | 0.22 | 2,593 | 0.82 |
| 1976 | 91,675 | 29.42 | 710 | 0.23 | 2,713 | 0.86 |
| 1977† | 91,592 | 29.28 | 687 | 0.22 | 2,711 | 0.86 |
| 1978 | 87 171‡ | 27.86 | 725 | 0.23 | 2,424 | 0.77 |
| 1979 | 76 639‡ | 24.53 | 714 | 0.23 | 2,593 | 0.82 |
| 1980 | 98,297 | 31.13 | 923 | 0.29 | 2,625 | 0.83 |
| 1981 | 93,789 | 29.71 | 1,035 | 0.33 | 2,300 | 0.72 |
| 1982 | 103,421 | 32.49 | 1,203 | 0.38 | 2,474 | 0.78 |
| SUMMARY OF PRICE MOVEMENTS (i) | |||||
|---|---|---|---|---|---|
| Base: December Quarter 1977. (= 100 for terms of trade. For all other indexes = 1000.) | |||||
| Calendar Year | Import Prices | Export Prices | Terms of Trade | Producers Prices*All Industries Inputs | |
| Pastoral and Dairy | All Exports | ||||
* Wholesale Prices Index replaced by General Price Index from December quarter 1977. This index was later renamed the Producers Price Index. †Provisional. | |||||
| 1931 | 99 | 89 | 89 | 90 | |
| 1941 | 127 | 141 | 140 | 110 | |
| 1951 | 261 | 430 | 416 | 159 | |
| 1961 | 284 | 342 | 334 | 118 | |
| 1971 | 395 | 456 | 441 | 112 | |
| 1973 | 433 | 730 | 680 | 157 | |
| 1974 | 549 | 693 | 669 | 122 | |
| 1975 | 724 | 642 | 663 | 92 | |
| 1976 | 892 | 869 | 874 | 98 | |
| 1977 | 980 | 1014 | 1003 | 102 | |
| 1978 | 1017 | 1081 | 1066 | 105 | 1072 |
| 1979 | 1149 | 1312 | 1291 | 112 | 1262 |
| 1980 | 1484 | 1497 | 1493 | 101 | 1550 |
| 1981 | 1695 | 1664 | 1685 | 99 | 1812 |
| 1982 | 1886 | 1818 | 1863 | 99 | 2085 |
| 1983 | 2047† | 1883† | 1969† | 96† | 2199 |
| SUMMARY OF PRICE MOVEMENTS (ii) | ||||||
|---|---|---|---|---|---|---|
| Base: December Quarter 1977 (= 1000) | ||||||
| Year ended 30 June | Import Prices (All Groups) | Export Prices (All Groups) | Producers Prices*All Industries Input | Consumers Prices | Share Prices (All Groups) | |
| Food | All Groups | |||||
| * See note to previous table. | ||||||
| 1940 | 134 | 135x | 140x | 276 | ||
| 1950 | 213 | 287 | 183 | 187 | 432 | |
| 1960 | 282 | 373 | 303 | 299 | 706 | |
| 1970 | 360 | 408 | 419 | 419 | 1249 | |
| 1971 | 385 | 419 | 456 | 458 | 1151 | |
| 1973 | 421 | 619 | 518 | 531 | 1303 | |
| 1974 | 473 | 693 | 588 | 583 | 1326 | |
| 1975 | 626 | 634 | 642 | 660 | 1018 | |
| 1976 | 825 | 778 | 746 | 768x | 1059 | |
| 1977 | 941 | 964 | 874x | 883 | 1097 | |
| 1978 | 996 | 1012 | 1004 | 1008 | 1044 | |
| 1979 | 1045 | 1167 | 1148 | 1124 | 1119 | 1148 |
| 1980 | 1326 | 1419 | 1406 | 1358 | 1310 | 1322 |
| 1981 | 1584 | 1576 | 1675 | 1602 | 1515 | |
| 1982 | 1804 | 1805 | 1957 | 1855 | 1758 | |
| 1983 | 1975 | 1908 | 2163 | 1989 | 1988x | |
| PRICE AND WAGE MOVEMENTS | |||||
|---|---|---|---|---|---|
| Base: December Quarter 1977 (= 1000). | |||||
| Year | Consumers' Prices | Share Prices (All Groups) | Nominal Weekly Wage Rates (Adult Employees) | ||
| Food | All Groups | Nominal | Effective* | ||
| * Index numbers of effective or “real” wage rates are obtained by dividing the index numbers of nominal wage rates by the corresponding all groups index numbers of consumer prices and multiplying by 1000. | |||||
| 1931 | 106 | 125 | 227 | 79 | 632 |
| 1941 | 138 | 148 | 282 | 98 | 662 |
| 1951 | 224 | 216 | 504 | 171 | 792 |
| 1961 | 311 | 306 | 755 | 250 | 817 |
| 1971 | 475 | 480x | 1077 | 474 | 985 |
| 1973 | 554 | 556 | 1382 | 578 | 1040 |
| 1974 | 618 | 618 | 1124 | 657 | 1063 |
| 1975 | 683 | 708 | 1037 | 747 | 1055 |
| 1976 | 810 | 828 | 1126 | 835 | 1008 |
| 1977 | 948 | 947 | 1027 | 949 | 1002 |
| 1978 | 1050x | 1060 | 1115 | 1077 | 1016 |
| 1979 | 1231 | 1206 | 1210 | 1246 | 1033 |
| 1980 | 1482x | 1412 | 1537 | 1474 | 1044 |
| 1981 | 1731 | 1629 | 1760x | 1080x | |
| 1982 | 1945 | 1893 | 1968x | 1041x | |
| 1983 | 2024 | 2032 | 1974 | 972 | |
| LABOUR FORCE, UNEMPLOYMENT, AND WORK STOPPAGES | |||||||
|---|---|---|---|---|---|---|---|
| Year | Total Labour Force* | Registered Unemployed Monthly Average† | Work Stoppages | ||||
| Males | Females | Total | Number | Workers Involved | Working Days Lost | ||
* Estimated labour force as at 15 April of each year up until 1980. From 1980 the estimates are based on an annual survey taken in February of each year. †Includes vacation workers. ‡The Department of Labour has recently revised the estimated labour force figures back to 1976 to conform with the benchmarks provided by 1976 and 1981 Census of Population data. | |||||||
| (000) | (000) | (000) | (000) | (000) | |||
| 1950 | 559.2 | 176.7 | 735.9 | 38 | 129 | 92x | 272 |
| 1960 | 660.6 | 215.0 | 875.6 | 633 | 60 | 14 | 36 |
| 1970 | 779.2 | 311.5 | 1 090.7 | 1,600 | 323 | 110 | 277 |
| 1971 | 777.5 | 326.9 | 1 104.4 | 3,115 | 313 | 86 | 163 |
| 1973 | 807.8 | 348.0 | 1 155.8 | 2,321 | 394 | 116 | 272 |
| 1974 | 830.6 | 373.7 | 1 204.3 | 955 | 380 | 71 | 184 |
| 1975 | 843.2 | 385.2 | 1 228.4 | 4,166 | 428 | 75 | 215 |
| 1976‡ | 844.1x | 393.8x | 1 237.9x | 5,356 | 487 | 201 | 488 |
| 1977 | 847.6x | 404.5x | 1 252.1x | 7,385 | 562 | 159 | 437 |
| 1978 | 856.6x | 409.6x | 1 266.2x | 22,330 | 411 | 158 | 381 |
| 1979 | 855.6x | 427.2x | 1 282.8x | 25,239 | 523 | 158 | 382 |
| 1980 | 864.2x | 439.1x | 1 303.3x | 36,499 | 360x | 128x | 373x |
| 1981 | 870.9x | 450.7x | 1 321.6x | 48,313 | 291x | 135x | 388x |
| 1982 | 879.6 | 460.5 | 1 340.1 | 52 099x | 333x | 156x | 330x |
| 1983 | 76,475 | 317 | 137 | 364 | |||
| RAILWAYS CORPORATION | ||||||
|---|---|---|---|---|---|---|
| Year Ended 31 March | Kilometres Open for Traffic | Revenue Train-Kilometres | Rail Passenger Journeys | Goods and Livestock | Revenue* | Expenditure* |
| * Figures relate to railway operation only. | ||||||
| (000) | (000) | tonnes (000) | $(000) | $(000) | ||
| 1940 | 5,456 | 21,512 | 24,454 | 7,797 | 17,524 | 15,886 |
| 1950 | 5,675 | 23,208 | 25,895 | 10,108 | 32,124 | 34,722 |
| 1960 | 5,369 | 23,303 | 26,134 | 10,712 | 60,542 | 61,516 |
| 1970 | 4,929 | 21,396 | 21,031 | 11,779 | 83,194 | 79,836 |
| 1971 | 4,847 | 21,877 | 20,784 | 12,040 | 86,999 | 96,502 |
| 1973 | 4,805 | 21,399 | 18,565 | 12,322 | 112,162 | 117,197 |
| 1974 | 4,799 | 22,447 | 18,944 | 13,378 | 125,789 | 135,363 |
| 1975 | 4,797 | 22,229 | 18,894 | 12,883 | 124,921 | 166,657 |
| 1976 | 4,797 | 22,053 | 20,035 | 13,197 | 137,287 | 194,829 |
| 1977 | 4,724 | 21,303 | 18,478 | 13,601 | 202,419 | 214,796 |
| 1978 | 4,668 | 20,073 | 16,402 | 12,577 | 212,748 | 251,863 |
| 1979 | 4,577 | 20,150 | 16,749 | 11,721 | 237,266 | 287,241 |
| 1980 | 4,516 | 18,782 | 16,011 | 11,755 | 274,369 | 331,360 |
| 1981 | 4,449 | 19,080 | 14,934 | 11,392 | 331,783 | 384,477 |
| 1982 | 4,419 | 18,844 | 14,340 | 11,520 | 399,335 | 459,300 |
| 1983 | 4,332 | 18,759 | 13,697 | 11,089 | 446,403 | 510,875 |
| AGRICULTURE | |||||||
|---|---|---|---|---|---|---|---|
| Season | Wheat for Threshing | Yield of | |||||
| Area | Yield | Yield per Hectare | Oats | Barley | Peas for Threshing | Potatoes | |
| hectares | tonnes | tonnes | tonnes | tonnes | tonnes | tonnes | |
| 1930–31 | 100,772 | 206,274 | 2.05 | 61,265 | 18,999 | 6,570 | 153,957 |
| 1940–41 | 98,418 | 226,052 | 2.30 | 56,518 | 24,186 | 20,182 | 95,634 |
| 1950–51 | 58,584 | 170,697 | 2.91 | 33,166 | 43,147 | 17,031 | 121,700 |
| 1960–61 | 75,590 | 253,357 | 3.35 | 42,627 | 77,467 | 25,331 | 193,495 |
| 1970–71 | 97,528 | 325,646 | 3.34 | 59,752 | 259,320 | 51,856 | 209,927 |
| 1972–73 | 107,690 | 376,111 | 3.49 | 44,965 | 258,261 | 59,733 | 244,211 |
| 1973–74 | 67,414 | 214,582 | 3.18 | 63,226 | 241,569 | 52,882 | 206,192 |
| 1974–75 | 57,656 | 179,874 | 3.12 | 50,219 | 262,881 | 47,522 | 225,522 |
| 1975–76 | 103,742 | 388,178 | 3.74 | 41,820 | 285,495 | 54,515 | 248,321 |
| 1976–77 | 96,236 | 354,035 | 3.68 | 57,997 | 272,096 | 45,023 | 270,497 |
| 1977–78 | 90,982 | 328,756 | 3.61 | 51,540 | 258,690 | 59,051 | 237,291 |
| 1978–79 | 87,156 | 295,028 | 3.38 | 58,249 | 263,580 | 63,407 | 203,285 |
| 1979–80 | 85,952 | 305,768 | 3.56 | 62,039 | 228,347 | 69,252 | 213,557 |
| 1980–81 | 81,451 | 326,334 | 4.01 | 45,177 | 272,683 | 54,447 | 208,775 |
| 1981–82 | 71,506 | 292,052 | 4.08 | 60,939 | 355,787 | 52,603 | 238,725 |
| LIVESTOCK | ||||||
|---|---|---|---|---|---|---|
| Year | Beef Cattle | Dairy Cows in Milk | Total Dairy Cattle | Total Cattle | Sheep | Pigs |
* Coverage to 1951 relates to holdings of 1 acre and over thereafter to 10 acres and over outside borough boundaries except that Manukau City has been included since Manukau County was absorbed by the city. †Since 1971 the coverage applies to 1 hectare and over. ‡Figures previous to 1980 are as at 31 January of year stated, except for sheep which are as at 30 June. From 1980 all figures are as at 30 June. §Provisional. | ||||||
| (000) | (000) | (000) | (000) | (000) | (000) | |
| 1931* | 1,479 | 4,044 | 29,793 | 469 | ||
| 1941* | 1,759 | 4,539 | 31,752 | 769 | ||
| 1951* | 2,149 | 1,898 | 2,911 | 5,060 | 34,786 | 564 |
| 1961* | 3,334 | 1,929 | 3,111 | 6,446 | 48,462 | 655 |
| 1971† | 5,280 | 2,239 | 3,539 | 8,819 | 58,913 | 617 |
| 1977† | 6,505 | 2,074 | 2,966 | 9,472 | 59,105 | 536 |
| 1978† | 6,197 | 2,053 | 2,932 | 9,129 | 62,163 | 539 |
| 1979† | 5,582 | 2,040 | 2,917 | 8,499 | 63,523 | 503 |
| 1980‡ | 5,162 | 1,999 | 2,969 | 8,131 | 68,772 | 434 |
| 1981‡ | 5,113 | 1,976 | 2,922 | 8,035 | 69,884 | 420 |
| 1982‡x | 4,905 | 2,005 | 3,007 | 7,912 | 70,301 | 406 |
| 1983§ | 4,503 | 2,104 | 3,119 | 7,622 | 70,173 | 408 |
| AGRICULTURAL AND PASTORAL PRODUCTION | ||||||||
|---|---|---|---|---|---|---|---|---|
| Season | Wool Production | Milkfat Production | ||||||
| Total Production*(Greasy Equivalent) | Average Price (Greasy Wool) | Total Value | Total Production | Yield per Cow in Milk† | Average Revenue per kg‡ | Sawn Timber Production§ | Meat Production | |
* Year ended 30 June. †Calculated from 1966–67 on “at factory” basis. ‡Milkfat for butter making only These figures do not include payments for nonfat solids in the whole milk delivered for butter manufacture; therefore they cannot be used as a measure of total income from milk or manufacture. §Year ended 31 March, Year ended September. ¶Provisional. | ||||||||
| tonnes (000) | c per kg | $(m) | tonnes (000) | kg | c per kg | m3(000) | tonnes (000) | |
| 1931–32 | 122 | 9.66 | 11.8 | 154 | 98 | 20.21 | 363 | |
| 1940–41 | 151 | 22.49 | 35.5 | 211 | 119 | 30.69 | 807 | |
| 1950–51 | 177 | 161.38 | 285.5 | 222 | 116 | 56.95 | 1,246 | 538 |
| 1960–61 | 267 | 74.12 | 197.7 | 249 | 128 | 61.55 | 1,687 | 770 |
| 1970–71 | 334 | 53.42 | 178.4 | 279 | 116 | 70.07 | 1,853 | 1,055 |
| 1972–73 | 309 | 143.96 | 444.5 | 280 | 122 | 76.77 | 1,787 | 1,097 |
| 1973–74 | 285 | 139.19 | 396.4 | 261 | 118 | 76.66 | 2,054 | 990 |
| 1974–75 | 294 | 91.75 | 269.8 | 273 | 128 | 80.89 | 2,086 | 1,089 |
| 1975–76 | 312 | 157.12 | 489.9 | 296 | 137 | 74.42 | 2,003 | 1,234 |
| 1976–77 | 303 | 219.58 | 664.2 | 303 | 143 | 81.86 | 2,212 | 1,152 |
| 1977–78 | 311 | 190.43 | 591.9 | 279 | 131 | 96.80 | 1,961 | 1,160 |
| 1978–79 | 321 | 218.85 | 701.5 | 301 | 142 | 1,865 | 1,119 | |
| 1979–80 | 357 | 265.09 | 945.0 | 318x | 151 | 2,010 | 1,151 | |
| 1980–81 | 381 | 247.48 | 942.2 | 308 | 147 | 2,182 | 1,207 | |
| 1981–82 | 363 | 255.72x | 928.2 | 312x | 144 | 2,270 | 1,282 | |
| 1982–83 | 371 | 255.90 | 949.1 | 315 | 143¶ | 2,136 | 1,336 | |
| MANUFACTURING | ||||||||
|---|---|---|---|---|---|---|---|---|
| Year | Establishments | Persons Engaged | Salaries and Wages Paid | Cost of Materials | Other Expenses of Production | Value of Production | Net Output (Net Value Added) | Value of Land and Buildings. Plant and Machinery |
* Figures based on Integrated Economic Census of Manufacturing (see Section 19. Manufacturing). Not directly comparable with figures for earlier years. †Includes ancillary units. ‡Purchases and other expenses. §Turnover. ||Value Added. | ||||||||
| No. | No. | $(million) | ||||||
| 1920–21 | 3,894 | 62,972 | 235 | 106.0 | 151.0 | 51.4 | ||
| 1930–31 | 5,047 | 70,625 | 27.8 | 90.6 | 16.9 | 143.4 | 37.0 | 69.0 |
| 1940–41 | 6,252 | 104,784 | 48.6 | 186.0 | 22.4 | 274.8 | 67.7 | 84.3 |
| 1950–51 | 8,113 | 138,435 | 130.0 | 533.8 | 57.7 | 760.4 | 171.6 | 175.2 |
| 1960–61 | 6,875 | 165,572 | 277.3 | 905.0 | 111.0 | 1,441.9 | 393.9 | 462.8 |
| 1970–71 | 7,600 | 229,104 | 676.0 | 2,014.6 | 306.7 | 3,407.4 | 995.7 | 1,239.3 |
| 1972–73 | 7,669 | 235,648 | 875.4 | 2,787.2 | 561.5 | 4,611.3 | 1,301.7 | 1,634.0 |
| 1973–74 | 7,690 | 244,522 | 1,042.2 | 3,112.8 | 683.7 | 5,250.9 | 1,502.4 | |
| 1974–75* | 8 883† | 292,448 | 1,389.0 | 4,664.0‡ | 6,433.0§ | 2,144.0|| | ||
| 1975–76* | 9 212† | 298,692 | 1,576.0 | 4.993.0‡ | 7,264.0§ | 2,351.0|| | ||
| 1976–77* | 9 738† | 306,177 | 1,802.0 | 6,381.0‡ | 8,987.0§ | 2,865.0|| | ||
| 1978–79* | 10 520† | 298,331 | 2,293.8 | 7,595.5‡ | 10.925.7§ | 3,478.0|| | ||
| Locations | Persons Engaged | Purchases and Operating Expenses | Sales and Other Income | Value Added | Additions to Tangible Assets | |
|---|---|---|---|---|---|---|
| ¶Changes made to census questionnaires commencing with 1981–82 Census. | ||||||
| 1981–821¶ | 110 | 296,751 | 17,576 | 18,382 | 5,879 | 1,248 |
| COAL CONSUMPTION | ||||||||
|---|---|---|---|---|---|---|---|---|
| Year | Factories | Shipping | Rail | Gas Works | Households | Public Hospitals and Central Heating | Electricity Generation | Total |
* Estimated. †For later September year figures see table in Section 18. Minerals | ||||||||
| tonnes(000) | ||||||||
| 1930 | 499 | 251 | 440 | 244 | 173 | 2,615 | ||
| 1940 | 693 | 154 | 572 | 262 | 82 | 2,540 | ||
| 1950 | 832 | 50 | 486 | 306 | 610 | 91 | 2,778 | |
| 1960 | 1,015 | 9 | 223 | 281 | 549 | 100 | 611 | 2,965 |
| 1970 | 910 | – | 10 | 154 | 345* | 163 | 542 | 2,306 |
| 1972 | 934* | – | – | 99 | 290* | 187 | 558 | 2 188* |
| 1973 | 948* | – | – | 91 | 284* | 193 | 827 | 2 461* |
| 1974 | 1 120* | – | – | 109 | 289* | 281 | 814 | 2 613* |
| 1975 | 1 077* | – | – | 89 | 234* | 244 | 844 | 2 488* |
| 1976 | 1 149* | – | – | 80 | 288* | 240 | 730 | 2 487* |
| 1977 | 1 125* | – | – | 80 | 290* | 265 | 610 | 2 370* |
| 1978 | 1 075* | – | – | 75 | 240* | 267 | 525 | 2 182* |
| 1979† | 1 050* | – | – | 79 | 220* | 230 | 530 | 2 109* |
| SUMMARY OF OVERSEAS TRADE* | ||||||
|---|---|---|---|---|---|---|
| Year | Exports (f.o.b.) | Imports (v.f.d.)† | Imports (c.i.f.)‡ | |||
| Total | Per Head of Mean Population | Total | Per Head of Mean Population | Total | Per Head of Mean Population | |
* Figures are in terms of New Zealand currency. Gold and specie excluded. †Prior to 1979 valuation was based on c.d.v. (current domestic value). ‡Previous to 1955 c.d.v. + 10 percent. | ||||||
| $(m) | $ | $(m) | $ | $(m) | $ | |
| 1940 | 143.6 | 87.70 | 89.1 | 54.41 | 98.0 | 59.84 |
| 1950 | 364.9 | 191.12 | 287.1 | 150.41 | 315.9 | 165.45 |
| 1960 | 604.6 | 254.35 | 506.2 | 212.94 | 564.5 | 237.48 |
| Year Ended June | ||||||
| 1970 | 1,086.7 | 388.3 | 944.3 | 337.4 | 1.007.2 | 359.9 |
| 1972 | 1,375.0 | 476.4 | 1,152.7 | 399.4 | 1,239.0 | 429.3 |
| 1973 | 1,792.0 | 609.3 | 1,282.2 | 436.0 | 1,374.1 | 467.3 |
| 1974 | 1,787.3 | 595.5 | 1,861.8 | 620.4 | 2,036.7 | 678.5 |
| 1975 | 1,621.5 | 529.7 | 2,492.0 | 814.0 | 2,763.1 | 902.6 |
| 1976 | 2,386.9 | 768.7 | 2,730.1 | 879.3 | 2,961.6 | 953.8 |
| 1977 | 3,228.7 | 1,033.5 | 3,244.4 | 1,038.5 | 3,538.0 | 1,132.5 |
| 1978 | 3,313.5 | 1,058.7 | 3,018.2 | 964.5 | 3,276.7 | 1,046.9 |
| 1979 | 4,067.4 | 1,299.9 | 3,574.1 | 1,142.8 | 3,840.5 | 1,227.4 |
| 1980 | 5,152.2 | 1,648.3 | 4,809.6 | 1,538.7 | 5,172.6 | 1,654.8 |
| 1981 | 6,065.3 | 1,925.9 | 5,587.3 | 1,774.1 | 6,023.6 | 1,912.6 |
| 1982 | 6,733.8 | 2,125.2 | 7.044.8 | 2,223.3 | 7,600.4 | 2,398.7 |
| 1983 | 7,427.7 | 2,402.4 | 6,928.2 | 2,163.2 | 7,595.8 | 2,371.6 |
| EXPORTS OF NEW ZEALAND PRODUCE | ||||||
|---|---|---|---|---|---|---|
| Year | Wool | |||||
| Greasy | Scoured and Washed | Total, including Slipe* | ||||
| Quantity | Value | Quantity | Value | Quantity | Value | |
| * Including fine animal hair. | ||||||
| tonnes | $(m) | tonnes | $(m) | tonnes | $(m) | |
| 1931 | 75,068 | 8.2 | 5,012 | 0.9 | 96,034 | 11.0 |
| 1941 | 73,315 | 17.4 | 11,164 | 3.7 | 97,859 | 25.2 |
| 1951 | 111,820 | 188.5 | 10,815 | 24.5 | 143,727 | 256.4 |
| 1961 | 197,367 | 152.9 | 24,338 | 24.3 | 251,723 | 200.7 |
| Year Ended June | ||||||
| 1971 | 173,926 | 100.2 | 82,225 | 65.7 | 293,499 | 187.9 |
| 1973 | 160,325 | 224.2 | 94,849 | 152.5 | 288,082 | 424.0 |
| 1974 | 120,927 | 189.3 | 66,976 | 131.3 | 213,158 | 361.6 |
| 1975 | 102,871 | 107.7 | 86,997 | 125.4 | 218,198 | 261.7 |
| 1976 | 142,605 | 220.1 | 105,432 | 197.7 | 272,369 | 456.4 |
| 1977 | 124,625 | 283.3 | 103,005 | 304.6 | 253,899 | 648.2 |
| 1978 | 111,346 | 228.7 | 106,385 | 297.9 | 242,913 | 580.0 |
| 1979 | 117,612 | 271.3 | 121,198 | 365.0 | 258,775 | 683.3 |
| 1980 | 127,501 | 366.9 | 140,756 | 516.7 | 285,043 | 930.8 |
| 1981 | 134,357 | 362.7 | 136,156 | 482.7 | 289,488 | 892.6 |
| 1982 | 125,431 | 363.6 | 137,244 | 504.0 | 281,569 | 918.8 |
| 1983 | 147,247 | 415.9 | 150,889 | 537.2 | 322,211 | 1,017.1 |
| Year | Beef and Veal | Lamb and Mutton | All Meat | |||
|---|---|---|---|---|---|---|
| Quantity | Value | Quantity | Value | Quantity | Value | |
| tonnes | $(m) | tonnes | $(m) | tonnes | $(m) | |
| 1931 | 23,942 | 1.2 | 175,931 | 15.7 | 210,261 | 17.8 |
| 1941 | 40,209 | 3.5 | 192,192 | 24.5 | 268,483 | 33.2 |
| 1951 | 43,567 | 5.8 | 212,074 | 39.6 | 278,929 | 50.7 |
| 1961 | 97,024 | 44.4 | 348,278 | 89.9 | 467,883 | 144.2 |
| Year Ended June | ||||||
| 1971 | 180,858 | 170.4 | 425,311 | 186.5 | 647,785 | 385.7 |
| 1974 | 183,326 | 235.5 | 348,950 | 256.5 | 570,406 | 529.5 |
| 1975 | 192,445 | 161.8 | 385,263 | 238.7 | 616,545 | 438.0 |
| 1976 | 228,111 | 241.4 | 397,408 | 297.4 | 674,867 | 586.2 |
| 1977 | 260,639 | 312.1 | 402,501 | 387.5 | 716,703 | 756.5 |
| 1978 | 225,776 | 313.0 | 374,888 | 389.7 | 647,057 | 756.8 |
| 1979 | 244,628 | 487.1 | 460,500 | 528.5 | 751,832 | 1,087.2 |
| 1980 | 215,624 | 528.4 | 405,695 | 583.9 | 661,518 | 1,183.6 |
| 1981 | 231,578 | 586.8 | 493,362 | 854.2 | 771,590 | 1,510.0 |
| 1982 | 233,474 | 619.9 | 516 880x | 856.2 | 804 225x | 1,550.1 |
| 1983 | 263,693 | 791.6 | 505,652 | 981.1 | 826,000 | 1,855.4 |
| Year | Butter | Cheese | Milk, Dried and Condensed* | |||
|---|---|---|---|---|---|---|
| Quantity | Value | Quantity | Value | Quantity | Value | |
| * From 1983 excludes whey. | ||||||
| tonnes | $(m) | tonnes | $(m) | tonnes | $(m) | |
| 1931 | 101,024 | 21.3 | 83,130 | 8.9 | 5,827 | 0.5 |
| 1941 | 115,007 | 31.6 | 120,211 | 19.7 | 13,445 | 1.4 |
| 1951 | 149,830 | 83.0 | 108,330 | 33.3 | 47,463 | 7.9 |
| 1961 | 167,689 | 78.8 | 89,013 | 39.8 | 51,267 | 8.4 |
| Year Ended June | ||||||
| 1971 | 194,464 | 113.9 | 92,681 | 48.0 | 160,452 | 34.1 |
| 1973 | 176,619 | 137.1 | 95,255 | 79.2 | 197,757 | 87.4 |
| 1974 | 162,146 | 109.5 | 68,481 | 61.8 | 278,333 | 130.6 |
| 1975 | 164,171 | 122.1 | 64,763 | 48.4 | 159,869 | 103.1 |
| 1976 | 206,788 | 204.2 | 80,640 | 78.0 | 147,826 | 84.6 |
| 1977 | 212,929 | 253.9 | 79,046 | 84.9 | 240,423 | 108.5 |
| 1978 | 177,265 | 240.9 | 70,154 | 76.6 | 242,041 | 129.5 |
| 1979 | 192,200 | 277.2 | 63,369 | 75.5 | 200,522 | 125.6 |
| 1980 | 231,002 | 360.6 | 69,241 | 105.9 | 268.536 | 214.3 |
| 1981 | 203,058 | 398.0 | 80,480 | 137.7 | 262,179 | 305.4 |
| 1982 | 199,617 | 556.4 | 81,048 | 181.5 | 257,613 | 395.1 |
| 1983 | 227,766 | 657.7 | 75,439 | 193.5 | 262,596 | 460.1 |
| Year | Casein | Apples and Pears* | Grass and Clover Seeds | |||
|---|---|---|---|---|---|---|
| Quantity | Value | Quantity | Value | Quantity | Value | |
| * Whole fruit only. | ||||||
| tonnes | $(m) | tonnes | $(m) | tonnes | $(m) | |
| 1941 | 630 | 0 | 193 | 4,480 | 1.1 | |
| 1951 | 5,987 | 1 | 12,675 | 1.4 | 4,492 | 2.5 |
| 1961 | 29,494 | 8 | 37,122 | 4.8 | 6,702 | 2.6 |
| Year Ended June | ||||||
| 1971 | 69,534 | 30 | 55,596 | 9.2 | 9,719 | 4.9 |
| 1973 | 27,728 | 22 | 69,569 | 13.4 | 15,954 | 6.5 |
| 1974 | 39,965 | 28.6 | 68,963 | 13.5 | 9,309 | 8.9 |
| 1975 | 17,119 | 14.7 | 81,110 | 19.7 | 11,411 | 10.0 |
| 1976 | 24,263 | 27.1 | 77,930 | 21.2 | 6,071 | 4.5 |
| 1977 | 62,384 | 59.7 | 60,669 | 16.6 | 12,396 | 10.8 |
| 1978 | 59,940 | 60.5 | 81,708 | 26.5 | 9,320 | 9.9 |
| 1979 | 52,372 | 62.3 | 85,444 | 30.4 | 9,044 | 9.8 |
| 1980 | 58,564 | 112.5 | 94,394 | 36.6 | 10,288 | 14.0 |
| 1981 | 42,617 | 117.2 | 101,939 | 48.6 | 6,618 | 11.6 |
| 1982 | 44,626 | 142.0 | 98,623 | 53.4 | 6,923 | 14.8 |
| 1983 | 45,476 | 162.1 | 93,536 | 60.7 | 8,764 | 21.1 |
| Year | Hides and Skins | Sausage Casings | Tallow* | |
|---|---|---|---|---|
| * From 1929 to 1948 figures cover only inedible tallow, and unrendered fats of bovine cattle, sheep, or goats are included in all figures. | ||||
| $(m) | $(m) | tonnes | $(m) | |
| 1941 | 8.2 | 1.6 | 39,959 | 1.6 |
| 1951 | 25.7 | 7.8 | 30,134 | 5.1 |
| 1961 | 24.3 | 7.3 | 58,649 | 6.3 |
| Year Ended June | ||||
| 1971 | 50.6 | 14.1 | 65,838 | 10.2 |
| 1973 | 95.9 | 14.2 | 72,950 | 9.7 |
| 1974 | 67.0 | 17.2 | 53,769 | 13.8 |
| 1975 | 62.7 | 18.8 | 71,637 | 16.4 |
| 1976 | 77.4 | 23.5 | 96,130 | 25.8 |
| 1977 | 128.6 | 25.8 | 95,451 | 33.0 |
| 1978 | 144.0 | 27.0 | 85,304 | 32.4 |
| 1979 | 181.8 | 30.2 | 89,599 | 42.4 |
| 1980 | 180.1 | 33.5 | 85,683 | 43.4 |
| 1981 | 129.9 | 46.8 | 106,871 | 47.7 |
| 1982 | 152.9 | 48.6 | 108,598 | 53.2 |
| 1983 | 185.2 | 50.5 | 117,716 | 58.5 |
| Year | Timber | Wood Pulp | Newsprint | ||
|---|---|---|---|---|---|
| $(m) | tonnes (000) | $(m) | tonnes (000) | $(m) | |
| 1941 | 0.4 | – | – | – | – |
| 1951 | 1.5 | – | – | – | – |
| 1961 | 4.4 | 65 | 5.0 | 47 | 5.4 |
| Year Ended June | |||||
| 1971 | 37.1 | 97 | 9.4 | 111 | 14.0 |
| 1973 | 45.6 | 142 | 14.1 | 123 | 16.2 |
| 1974 | 47.8 | 243 | 25.7 | 103 | 14.5 |
| 1975 | 28.2 | 312 | 43.5 | 121 | 20.8 |
| 1976 | 32.0 | 360 | 58.8 | 132 | 34.3 |
| 1977 | 50.4 | 420 | 70.0 | 176 | 51.8 |
| 1978 | 61.8 | 431 | 69.9 | 190 | 51.6 |
| 1979 | 78.4 | 456 | 86.2 | 203 | 55.7 |
| 1980 | 126.0 | 479 | 120.2 | 223 | 81.0 |
| 1981 | 136.6 | 515 | 151.3 | 231 | 99.2 |
| 1982 | 105.9 | 422 | 155.7 | 199 | 110.6 |
| 1983 | 99.0 | 451 | 161.4 | 116 | 61.2 |
| NEW ZEALAND'S OFFICIAL OVERSEAS RESERVES | |||||||
|---|---|---|---|---|---|---|---|
| As at Last Wednesday of Each Quarter | Reserve Bank Overseas Reserves | Treasury Overseas Reserves | Total Foreign Exchange Reserves | Gold | Reserve Position at IMF* | Special Drawing Rights (IMF*) | Total Official Reserves |
| * International Monetary Fund | |||||||
| $(million) | |||||||
| 1963—Mar | 58.4 | 70.8 | 129.2 | 0.5 | 22.5 | – | 152.2 |
| 1973—Mar | 526.9 | 257.3 | 784.2 | 0.7 | 45.1 | 52.1 | 882.1 |
| 1980—Mar | 213.5 | 280.7 | 494.2 | 0.7 | – | 37.4 | 532.3 |
| 1981—Mar | 114.0 | 302.3 | 416.3 | 0.7 | 35.9 | 41.7 | 494.6 |
| Jun | 115.0 | 304.8 | 419.8 | 0.7 | 36.7 | 21.9 | 479.1 |
| Sep | 67.4 | 291.9 | 359.3 | 0.7 | 37.4 | 27.7 | 425.1 |
| Dec | 463.0 | 320.3 | 783.3 | 0.7 | 38.6 | 27.7 | 850.3 |
| 1982—Mar | 87.0 | 447.7 | 534.7 | 0.7 | – | 27.3 | 562.7 |
| Jun | 47.3 | 549.2 | 596.5 | 0.7 | – | 3.4 | 600.6 |
| Sep | 128.6 | 626.5 | 755.1 | 0.7 | – | 2.8 | 758.6 |
| Dec | 273.4 | 660.1 | 933.5 | 0.7 | – | 2.5 | 936.7 |
| 1983—Mar | 668.4 | 994.5 | 1,662.9 | 0.7 | – | 2.6 | 1,666.2 |
| Jun | 338.7 | 891.7 | 1,230.4 | 0.7 | – | 25.3 | 1,256.4 |
| Sep | 258.5 | 893.2 | 1,151.7 | 0.7 | – | 24.9 | 1,177.3 |
| Dec | 252.0 | 937.7 | 1,189.7 | 0.7 | – | 49.7 | 1,240.1 |
| REVENUE AND EXPENDITURE OF CENTRAL GOVERNMENT | ||||||
|---|---|---|---|---|---|---|
| Year Ended 31 March | Receipts | Payments | Deficit | Surplus | ||
| From Taxation | From Other Sources | Total | ||||
* Excludes duty on motor spirits refunded under the Transport Amendment Act; $0.8 million in 1961–62. †Includes transfer from Loans Account ($956 million) in 1980–81, $1,281 million in 1981–82. $1,500 million in 1982–83, and $2,430 million in 1983–84. | ||||||
| $(million) | ||||||
| CONSOLIDATED FUND | ||||||
| 1932 | 32.4 | 13.1 | 45.4 | 49.7 | 4.3 | |
| 1942 | 70.3 | 38.7 | 109.1 | 105.8 | 3.3 | |
| 1952 | 313.9 | 47.7 | 361.6 | 336.3 | 25.3 | |
| 1962 | 508.3 | 93.0 | 601.3* | 600.6* | 0.6 | |
| CONSOLIDATED REVENUE ACCOUNT | ||||||
| 1972 | 1,617.3 | 203.4 | 1,820.7 | 1,812.3 | 8.4 | |
| CONSOLIDATED ACCOUNT | ||||||
| 1981 | 6,861.5 | 2,132.7† | 8,994.2† | 8,992.5 | 1.8 | |
| 1982 | 8,586.5 | 2,549.8† | 11,137.4† | 11,125.0 | 12.4 | |
| 1983 | 9,864.5 | 3,028.1† | 12,892.6† | 12,872.1 | 20.5 | |
| 1984 | 10,188.9 | 4.037.2† | 14,226.1† | 14,221.5 | 4.6 | |
NOTE—The figure shown in the above table are not on a comparable basis over the whole period.
| INDEBTEDNESS OF CENTRAL GOVERNMENT—AMOUNT OF DEBENTURES AND STOCK IN CIRCULATION | ||||||
|---|---|---|---|---|---|---|
| (Nominal Amounts) | ||||||
| As at 31 March | Domiciled in | Total | Per Head of Population | |||
| United States and World Bank | London and Europe, etc. | Australia | New Zealand | |||
* Provisional. †Amounts outstanding overseas other than in Europe. U.S.A., or with the World Bank. External debt is now usually shown by currencies rather than by countries (see section 27C). | ||||||
| NZ$(million) | $ | |||||
| 1932 | – | 268.9 | 7.8 | 236.8 | 511.5 | 335.30 |
| 1942 | – | 255.1 | 1.7 | 461.6 | 718.4 | 439.60 |
| 1952 | – | 155.6 | – | 1,151.8 | 1,307.3 | 658.70 |
| 1962 | 25.1 | 254.0 | – | 1,528.6 | 1,807.7 | 730.50 |
| 1972 | 159.4 | 494.1 | – | 2,533.0 | 3,186.6 | 1,096.55 |
| 1980 | 571.9 | 2,534.0 | 461.7† | 6,778.9 | 10,346.4 | 3,272.83 |
| 1981 | 1,225.8 | 2,355.9 | 654.4† | 7,381.0 | 11,617.1 | 3,663.66 |
| 1982 | 1,045.8 | 3,640.1 | 863.5† | 8,832.0 | 14,381.4 | 4,508.13 |
| 1983 | 1,875.1 | 4,470.6 | 1,418.9† | 10,968.0 | 18,732.8 | 5,799.63 |
| 1984 | 2,432.5 | 4,254.7 | 1,539.0† | 13,652.4 | 21,878.7 | 6,699.95 |
| POST OFFICE SAVINGS BANK | ||||||
|---|---|---|---|---|---|---|
| Year Ended 31 March | Number of Accounts at End of Year | Total Amount of Deposits During Year | Interest Credited to Depositors | Total Amount of Withdrawals During Year* | Excess of Deposits plus Interest over Withdrawals | Total Amount to Credit of Depositors at End of Year |
* From January 1958 includes interest paid out on investment accounts; and from October 1969 includes interest paid on National Development Bonds redeemed. †Excess of withdrawals over deposits. | ||||||
| (000) | $(million) | |||||
| 1932–33 | 797 | 33.9 | 2.9 | 39.3 | −2.4† | 84.1 |
| 1942–43 | 1,400 | 80.3 | 3.8 | 53.8 | 30.3 | 178.8 |
| 1952–53 | 1,836 | 216.9 | 11.4 | 207.6 | 20.7 | 493.3 |
| 1962–63 | 2,191 | 409.1 | 22.0 | 397.2 | 33.9 | 770.6 |
| 1972–73 | 2,838 | 782.4 | 30.5 | 736.5 | 76.3 | 1,038.7 |
| 1979–80 | 3 099x | 2,543.2 | 64.6 | 2,522.8 | 85.0 | 1,702.8 |
| 1980–81 | 3 104x | 3,217.8 | 75.3x | 3,161.8x | 131.3 | 1,834.1 |
| 1981–82 | 3 178x | 4,066.2 | 85.9x | 4,031.0x | 121.1x | 1,955.2x |
| 1982–83 | 3,281 | 4,979.8 | 93.7 | 4,926.4 | 147.2 | 2,102.3 |
| MORTGAGES AND LAND TRANSFERS | ||||
|---|---|---|---|---|
| Year Ended 31 March | Mortgages Registered | Average Rate of Interest on New Mortgages | Land Transfers | |
| Number | Consideration | |||
| * Land sales restrictions removed in 1950. | ||||
| $(m) | percent | $(m) | ||
| 1931 | 60.4 | 6.25 | 25,626 | 44.1 |
| 1941 | 32.5 | 4.69 | 28,828 | 51.5 |
| 1951* | 91.6 | 4.09 | 57,938 | 158.7 |
| 1961 | 300.8 | 5.01 | 61,412 | 375.6 |
| 1971 | 703.0 | 6.88 | 83,610 | 918.9 |
| 1981 | 2,655.2 | 12.89 | 110,282 | 4,400.3 |
| 1982 | 3,545.8 | 14.30 | 135,460 | 6,575.6 |
| 1983 | 3,563.6 | 15.16 | 99,356 | 5,712.0 |
| BANKRUPTCIES AND NEW COMPANY REGISTRATIONS | ||||
|---|---|---|---|---|
| Year | Bankruptcies | New Company Registrations* | ||
| Number of Bankruptcies | Amount Realised by Official Assignee | Amount of Debts Proved | Number | |
* Public, private, and overseas. †Since 1954 company liquidations have been included in the total. | ||||
| $(000) | $(000) | |||
| 1931 | 848 | 217.6 | 2,084.4 | 795 |
| 1941 | 165 | 70.9 | 142.0 | 288 |
| 1951 | 145 | 96.5 | 273.6 | 2,020 |
| 1961† | 425 | 303.6 | 1,415.8 | 3,567 |
| 1971 | 477 | 604.4 | 3,471.7 | 5,490 |
| 1973 | 329 | 783.0 | 2,991.0 | 8 814x |
| 1974 | 324 | 606.0 | 3,009.0 | 7 736x |
| 1975 | 487 | 1,041.0 | 9,122.0 | 8 080x |
| 1976 | 459 | 1,392.0 | 9,541.0 | 6,366 |
| 1977 | 626 | 1,564.0 | 14,314.0 | 5,292 |
| 1978 | 792 | 2,860.0 | 17,410.4 | 5,473 |
| 1979 | 834 | 2,003.5 | 24,585.8 | 5,778 |
| 1980 | 975 | 4,169.2 | 29,472.5 | 6,116 |
| 1981 | 821 | 3,449.2 | 31,024.3 | 6,753 |
| 1982 | 881 | 4,538.8 | 31,564.0 | 6,370 |
| 1983 | 1,239 | 5,846.5 | 54,183.5 | 6,967 |
Table of Contents
1642 European discovery of New Zealand by Tasman.
1769 Captain Cook's first visit to New Zealand.
1791 Discovery of Snares and Chatham Islands.
1792 First sealing gang left on New Zealand coast.
1814 Arrival of Rev. Samuel Marsden, and introduction of Christianity. Horses, cattle, sheep, and poultry first brought to New Zealand.
1820 Hongi's visit to England.
1823–28 Jurisdiction of Courts of Justice in New South Wales extended to British subjects in New Zealand.
1825 First attempt at colonisation, by an expedition under Captain Herd.
1827 Hongi's forces destroyed mission station at Whangaroa.
1831 Tory Channel whaling station established. Application of 13 chiefs for the protection of King William IV.
1833 Mr James Busby appointed British Resident at Bay of Islands.
1834 Waimate Pa, near Opunake, shelled and captured by British—first occasion on which HM troops employed in New Zealand.
1835 Declaration of independence of the whole of New Zealand as one nation, with title of “United Tribes of New Zealand”. Ngati-Awa tribes migrated to and conquered Chatham Islands.
1838 Pelorus Sound discovered.
1839 Governor of New South Wales authorised to include within the limits of that colony any territory that might be acquired in sovereignty by Her Majesty in New Zealand. Preliminary expedition of New Zealand Company under Colonel Wakefield arrived at Port Nicholson.
1840 Arrival of New Zealand Company's settlers at Port Nicholson. Treaty of Waitangi signed. British sovereignty proclaimed. Captain Hobson appointed Lieutenant-Governor, with residence at Auckland. Settlements formed at Petre (Wanganui) and Akaroa.
1841 Issue of charter of incorporation of New Zealand Company. New Zealand proclaimed independent of New South Wales. Arrival of New Plymouth settlers.
1842 Settlement founded at Nelson.
1843 Affray with Maoris at Wairau.
1844 Royal flagstaff at Kororareka cut down by Heke.
1845 Destruction of Kororareka by Heke.
1846 Arrival of first steam vessel (HMS Driver in New Zealand waters. Capture of pa at Ruapekapeka and termination of Heke's war. Maori hostilities near Wellington. Te Rauparaha captured and detained as a prisoner. New Zealand divided into 2 provinces, New Munster and New Ulster, and representative institutions conferred.
1847 Attack by Maoris on Wanganui.
1848 Suspension of that part of New Zealand Government Act which had conferred representative institutions. Otago founded.
1850 Surrender of New Zealand Company's charter, all its interests reverting to the Imperial Government. Canterbury founded.
1852 Discovery of gold at Coromandel. Constitution Act passed, granting representative institutions to New Zealand, and dividing country into 6 provinces.
1854 Opening at Auckland of first session of the General Assembly.
1855 First members elected to the House of Representatives under system of responsible Government. Very severe earthquake on both sides of Cook Strait.
1856 Appointment of first Ministry under system of responsible Government.
1857 Goldfield opened at Collingwood.
1858 New Provinces Act passed.
1860 Hostilities in Waitara district.
1861 Truce arranged with Waitara Maoris. Bank of New Zealand incorporated. Southland Province established. Gold discovery at Gabriel's Gully, Otago.
1862 Coromandel proclaimed a goldfield. Wreck of s.s. White Swan, with loss of many public records. First electric-telegraph line opened—Christchurch to Lyttelton.
1863 Wreck of HMS Orpheus on Manukau Bar, with loss of 181 lives. Control of Maori affairs transferred to Colonial Government. Commencement of Waikato War. Defeat of Maoris at Rangiriri, and occupation of Ngaruawahia. First railway in New Zealand, portion of Christchurch-Lyttelton line, opened.
1864 Severe fighting in Waikato and elsewhere, including battles of Rangiaowhia, Orakau, Gate Pa, and Te Ranga. First major discovery of gold on West Coast of South Island.
1865 Seat of Government transferred to Wellington. Further fighting, followed by proclamation of peace. Activities of Hauhau fanatics, including murders of Europeans. Rebel Maoris defeated at Wairoa.
1866 Cook Strait submarine telegraph cable laid.
1867 Opening of Thames Goldfield. Lyttelton Tunnel completed. Admission of 4 Maori members to House of Representatives as direct representatives of Maori people.
1868 Maori prisoners, under leadership of Te Kooti, seized schooner Rifleman and escaped from Chatham Islands to mainland where they massacred Europeans. Considerable fighting with these and other rebel Maoris.
1869 Continuation of fighting with rebels and pursuit of Te Kooti. Visit of H.R.H. the Duke of Edinburgh. Government Life Insurance Office established.
1870 Further fighting with Te Kooti. Last of Imperial troops left New Zealand. Commencement of San Francisco mail service. Possession taken of Bounty Island. Inauguration of Vogel public works policy. Act passed to establish the New Zealand University.
1871 Commencement of railway construction under public works policy.
1872 Resumption of friendly relations with Waitara Maoris. Appointment of Maori chiefs (two) to Legislative Council. Public Trust Office created.
1873 Establishment of New Zealand Shipping Co.
1874 In pursuance of immigration and public works policy, 31 774 assisted immigrants arrived.
1875 Resumption of amicable relations with Maori King. Establishment of Union Steam Ship Company.
1876 New Zealand connected by cable with Australia. Abolition of Provinces Act came into operation, provincial institutions being abolished and the country divided into counties and boroughs.
1877 Education Act passed, providing for free compulsory education.
1878 Completion of the Christchurch-Invercargill railway.
1879 Triennial Parliaments Act passed. Adult male suffrage introduced. Kaitangata coal mine explosion, whereby 34 lives lost.
1881 Wreck of s.s. Tarawa, with loss of 130 lives.
1882 First shipment of frozen meat from New Zealand.
1883 Direct steamer communication inaugurated between New Zealand and England.
1886 Tarawera eruption, involving loss of 101 lives and destruction of Pink and White Terraces.
1887 Annexation of Kermadec Islands.
1888 British protectorate over Cook Islands proclaimed.
1890 Great maritime strike. First election of House of Representatives under one-man-one-vote principle.
1892 Introduction of lease-in-perpetuity system of land tenure.
1893 Right Hon. R. J. Seddon, Prime Minister. Franchise extended to women. Special licensing poll introduced.
1894 Industrial Conciliation and Arbitration Act passed. Government Advances to Settlers Act passed. Wreck of s.s. Wairarapa, with loss of 135 lives.
1896 Brunner Mine explosion, causing 67 deaths. Abolition of non-residential or property qualification to vote. Government Valuation of Land Act passed.
1898 Old-age Pensions Act passed.
1899 Labour Day instituted. New Zealand contingent (the first of 10) sent to South Africa.
1901 Penny postage adopted by New Zealand. Cook and other Pacific islands annexed.
1902 Pacific cable opened. Wreck of s.s. Elingamite, with loss of 43 lives.
1903 Empire Day proclaimed. State Fire Insurance Act passed.
1905 Workers' Dwellings Act passed. Title of New Zealand's representative in London altered to “High Commissioner”.
1906 Death of Right Hon. R. J. Seddon, Premier. Advances to Workers Act passed.
1907 New Zealand constituted a Dominion. Lease-in-perpetuity system of land tenure abolished. Parliament Buildings destroyed by fire.
1908 Through railway communications established between Wellington and Auckland.
1909 S.s. Penguin wrecked in Cook Strait, with loss of 75 lives. Battle cruiser presented by New Zealand to Imperial Government. System of compulsory military training introduced.
1910 Public Debt Extinction Act and National Provident Fund Act passed.
1911 Wireless telegraphy installed in New Zealand. Widows' Pensions Act passed. First poll on national prohibition taken.
1912 Public Service placed under Commissioner Control.
1913 Extensive strikes.
1914 Western Samoa occupied by New Zealand Advance Expeditionary Force. Main Expeditionary Force left for Egypt. Huntly coal mine disaster, with loss of 43 lives.
1915 New Zealand Expeditionary Force engaged in operation on Gallipoli Peninsula. National Cabinet formed. Pensions for miners introduced.
1916 New Zealand Division transferred to Western Front, Mounted Brigade being retained in Egypt. Compulsory enrolment of men for war service introduced. Lake Coleridge electric-supply scheme opened.
1918 S.s. Wimmera sunk by enemy mine off New Zealand coast, with loss of 26 lives. Otira Tunnel pierced. End of First World War. Great influenza epidemic, causing nearly 7000 deaths.
1919 Women made eligible for seats in Parliament. New Zealand represented at Peace Conference by Right Hon. W. F. Massey, Prime Minister.
1920 Visit of H.R.H. the Prince of Wales. Railway strike. First aeroplane flight over Cook Strait. League of Nations gave New Zealand mandate to administer Western Samoa. Anzac Day constituted.
1921 Samoa Act passed, making provision for government in terms of mandate.
1922 Meat-export trade placed under control of a board.
1923 Opening of Otira Tunnel. Ross Dependency proclaimed, and placed under jurisdiction of Governor-General. Dairy Produce Export Control Act passed.
1924 Railway strike. Direct two-way radio communication effected with England. Motor Vehicles Act provided for registration and annual licensing of motor vehicles. Pensions for blind persons introduced. S.s. Ripple foundered off Cape Palliser with loss of 16 lives.
1925 Administration of Tokelau (Union) Islands transferred to New Zealand.
1926 Family Allowances Act passed.
1928 Kingsford Smith and party made first successful flight across Tasman Sea.
1929 Severe earthquake in Murchison-Karamea district caused 17 deaths.
1930 Legislation providing for relief of unemployment first passed.
1931 Worst earthquake in history of New Zealand occurred in Hawke's Bay, resulting in the loss of 256 lives. General reduction of 10 percent in wages and salaries. Parliament approved draft Statute of Westminster. Mortgagors' relief legislation passed.
1932 Industrial Conciliation and Arbitration Amendment Act made important changes in industrial legislation. National Expenditure Adjustment Act made reductions in old-age and other pensions, in salaries of State employees, and in rentals, interest rates and other fixed charges. The historic Waitangi Estate presented to the nation by Their Excellencies Lord and Lady Bledisloe. New Zealand represented at Ottawa Conference.
1933 Exchange rate raised to £125 N.Z. for £100 London (Telegraphic transfers). Sales tax instituted. Conversion of internal public debt with reduction in interest rates, and provision made for local authorities interest reduction and loans conversion. Successful experimental shipments of chilled beef to England.
1934 First official trans-Tasman airmail. Reserve Bank incorporated and commenced business. First licensed air transport service commenced operations.
1935 Rural Mortgagors' Final Adjustment Act passed, and Court of Review established. Labour Government assumed office for first of 4 successive terms.
1936 Inauguration of inter-Island trunk air services. Reserve Bank nationalised. System of basic prices for butter and cheese introduced. Forty-hour week became operative. Powers of Court of Arbitration restored.
1938 Social Security Act passed. Introduction of import selection and control.
1939 Declaration of war with Germany. Recruitment for 2nd New Zealand Expeditionary Force. Arrangements for purchase of farm products by Britain.
1940 Departure of First Echelon of 2nd New Zealand Expeditionary Force. Death of the Prime Minister, the Right Hon. M. J. Savage; succeeded in office by Hon. P. Fraser. Declaration of war with Italy, RMS Niagara sunk off New Zealand coast by enemy mine.
1941 Declaration of war with Japan. Territorial Forces mobilised.
1942 Complete mobilisation of Military Forces ordered. Introduction of control of industrial manpower. Compulsory enrolment of all male British subjects between ages of 18 and 65 inclusive, in Emergency Reserve Corps. Lend-lease reciprocal aid extended to include Australia and New Zealand. Rationing introduced. Mobilisation of women for essential work.
1943 North African campaign brought to a successful conclusion. 2nd NZEF (3rd Division) took part in action against Japanese in the Pacific Area.
1944 Australia - New Zealand Agreement 1944, providing for collaboration on matters of mutual interest.
1945 War in Europe ended (8 May). War Cabinet dissolved. War in Pacific ended. Japan formally surrendered (15 August). South Island Main Trunk Railway opened, through rail connection from Picton to Bluff established.
1946 Family benefit of $1 per week made universal as from 1 April.
1947 Local Government Commission appointed. First women Cabinet Minister in New Zealand appointed. Marketing of dairy produce taken over by Dairy Commission. Statute of Westminster adopted by New Zealand Parliament.
1948 Licensing Control Commission appointed. Adjustments of exchange rate to parity with sterling as from 20 August.
1949 Referendum agrees to compulsory military training.
1950 Control of land sales, except of farm land, lifted. Control of sterling funds and securities relaxed. Abolition of petrol and butter rationing. Legislative Council Abolition Act passed. K-force sailed from Wellington for Korea.
1951 Prolonged waterfront dispute. United States. Australia, and New Zealand signed Pacific Security Treaty.
1952 Accession of Queen Elizabeth II.
1953 Armistice agreement signed in Korea. New Zealand's worst railway disaster occurred at Tangiwai on Christmas Eve, with a death roll of 154 persons. Arrival of Her Majesty Queen Elizabeth the Second and His Royal Highness the Duke of Edinburgh, on 23 December, the first occasion on which a reigning monarch had visited these shores.
1954 The Executive Council and Cabinet held meetings at Auckland on 25 May to mark the centenary of parliamentary government in New Zealand. New Zealand signed the South- east Asia Treaty at Manila.
1955 Pulp and paper mill at Kawerau began operation. Rimutaka tunnel opened for traffic in November.
1956 Roxburgh and Whakamaru power stations in operation. Colombo Plan Conference held in Wellington.
1957 New Zealand Antarctic Expedition established Scott Base at Pram Point, McMurdo Sound. Separate Court of Appeal constituted.
1958 Import selection and exchange allocation brought into force to conserve overseas exchange. PAYE taxation on incomes introduced. Power generated from geothermal steam at Wairakei and from coal station at Mercer.
1959 Auckland Harbour Bridge opened (May). Reconstructed Wellington Airport opened for traffic (July). Twelve nations, including New Zealand, signed treaty to preserve Antarctica for peaceful scientific research for all time.
1960 Government signed agreement for company to use power from Te Anau-Manapouri Lakes system for large aluminium smelting industry. Regular television programmes began in Auckland.
1961 Tasman Empire Airways became wholly owned by New Zealand (later renamed Air New Zealand). New Zealand joined International Monetary Fund, International Bank For Reconstruction and Development, and International Finance Corporation.
1962 Cook Strait rail-ferry service commenced with Aramoana. New Tasman cable link completed as part of Commonwealth Pacific cable.
1964 Three Cook Strait cables, each of 25 miles, laid as part of inter-Island transmission project. Oil refinery opened at Whangarei.
1965 Limited free trade agreement negotiated with Australia. Cook Islands became self-governing. Auckland International Airport came into use.
1966 Labour force reached 1 000 000. Licensed television sets reached 500 000. Collier Kaitawa sank off Cape Reinga with loss of 29 lives.
1967 Matahina electric power station brought into operation. Explosion at Strongman mine caused 19 deaths. Decimal currency introduced on 10 July ($2 equal to former unit of £).
1968 T.e.v. Wahine foundered in Wellington Harbour in severe storm with loss of 51 lives. Jet planes introduced in internal air services.
1969 Electric power generated from giant Manapouri project. Construction of aluminium smelter at Invercargill commenced. First output from steel mill at Glenbrook. Oil strike offshore at Taranaki. Voting rights extended to 20-year-old persons.
1970 Natural gas from Kapuni supplied to Auckland.
1971 Negotiations by Britain with members of European Economic Community secure New Zealand's position by special arrangement for her butter and cheese exports to the United Kingdom; Britain decides to join EEC in 1973 and later signs Treaty of Accession. Major shipments of ironsand to Japan from Taranaki coast. Bluff aluminium smelter in commercial operation and first exports made. All 7 generators installed at Manapouri hydro-electric station. Natural gas reticulation to Wellington completed. Introduction of first steps of metric conversion for weights and measures.
1972 Containerised shipping service in operation from Auckland and Wellington to United Kingdom and Europe. Labour Government assumed office under Right Hon. N. E. Kirk.
1973 Britain joined European Economic Community. Wool Marketing Corporation established. Farm income equalisation scheme extended. Trade negotiations with China; embassy opened in Peking. New Zealand became member of Organisation for Economic Co- operation and Development (OECD). Agreement reached for development of Maui field of natural gas offshore from Taranaki. Timber and pulp mill opened at Whirinaki, Napier. New Zealand currency placed on “near float arrangement” of relationships with major trading partners. Colour television introduced. First step of Equal Pay Act in effect. New Zealand Shipping Corporation established. Construction of 100-megawatt Rangipo hydro- power station and 550-megawatt Huntly coal-fired power station approved.
1974 Tenth British Commonwealth Games held in Christchurch. New Plymouth thermal power station in operation. Fourth Cook Strait rail-ferry brought into service. Death of the Prime Minister, Right Hon. N. E. Kirk; succeeded in office by Right Hon. W. E. Rowling.
1975 Further Government participation in off-shore oil exploration announced. New trade deals established with Middle-East countries, Japan, and U.S.S.R. (Jul) New Zealand's terms of trade reached lowest level since the Second World War. (Oct) Permanent stabilisation scheme for meat prices announced. Conversion of New Plymouth power station from oil to natural gas under way. National Government, under Right Hon. R. D. Muldoon, assumed office.
1976 In February, cuts in subsidies on electricity, rail charges, and Post Office charges. (Apr) Subsidies on bread, eggs, butter, and flour abolished. (Jul) Wool Income Stabilisation Scheme introduced. (Aug) Price and rent freeze until end of year introduced. New Zealand - Australia Free Trade Agreement extended for further 10 years. Controversy over New Zealand's sporting links with South Africa resulted in African nations walk- out at Olympic Games in Montreal. Storm caused severe flooding in Hutt Valley.
1977 The Queen and the Duke of Edinburgh visited New Zealand in February as part of the Silver Jubilee celebrations. New national superannuation scheme came into operation. New Zealand Planning Council formed. (June) Commonwealth Heads of Government Conference sponsored Gleneagles agreement on sporting contacts with South Africa. (September) Territorial Sea and Exclusive Economic Zone Act passed, establishing 200- mile-wide economic zone around New Zealand coast. (October) Act passed establishing Ministry of Energy, combining functions of Mines Department, Electricity Department, and Ministry of Energy Resources. Difficult economic conditions, with inflation as a major problem and an increasing problem of unemployment, continued throughout year. There were also continued population losses from net migration.
1978 Merger of New Zealand Wool Board and New Zealand Wool Marketing Corporation came into effect on 7 February. National Airways Corporation merged with Air New Zealand. Government approved programme for large-scale production of methanol from Maui gas by 1985–86 to cut oil imports. (Oct) Widespread floods in Southland. (Nov) National Party retains power at General Election with greatly reduced majority. Another year of difficult economic conditions with relatively heavy unemployment and continuing population losses from net emigration.
1979 (Apr) First stage of Maui gasfield development completed. Price control phased out over a wide range of commodities and services; replaced by price surveillance scheme. Severe landslip at Abbotsford. (Sep) Plans for Maui gas, including building of methanol plant, announced by Government. (Nov) Air New Zealand D.C. 10 crash on Mount Erebus in Antarctica, killing 257 passengers and crew. 25th Commonwealth Conference held in Wellington. Another difficult year with relatively high unemployment, inflation, and population losses from net migration.
1980 (Jan) Widespread flooding in Southland. New Zealand troops included in Zimbabwe peacekeeping force. (Mar) $500 million Eurodollar loan raised to finance a hydrocracker for expansion of Marsden Point oil refinery. Petrocorp given approval to build New Zealand's first methanol plant. (Apr) $600 million expansion of New Zealand Steel Ltd. plant announced. (Oct) Remuneration Act repealed as part of 3-pronged wage policy agreement with FOL and Employers' Federation. Act passed legalising Saturday trading. Another year of relatively high unemployment and continued inflation. Population losses from net migration continued, but on a decreasing scale.
1981 (Apr) Butter deal concluded with EEC. Britain to import 94 000 tonnes of New Zealand butter in 1981, and 92 000 tonnes in 1982. (June) Government approved construction of oil pipeline between Marsden Point refinery and Auckland. Cost-of-living increase of 5 percent granted by Arbitration Court. (Jul-Aug) Controversial tour of New Zealand by South African rugby team. (Aug) N.Z. Dairy Board purchased 100 000 tonnes of surplus U.S. butter to prevent swamping of international butter market with surplus supplies. Crash of Silver Fern railcar resulted in 4 deaths and many injuries. (Oct) Major expansion of N.Z. Steel's plant approved. (Nov) General Election resulting in narrow victory for National Party. (Dec) Four-year trade deal on dairy products signed with U.S.S.R. Unemployment and inflation continued at high level.
1982 (Jan) Government departments ordered to prune 3 percent from their budgets for 1982–83 financial year. (Feb) Contract for Motunui synthetic fuel plant signed. (Apr) Increased charges for postage, telephone rentals, state coal, electricity, and road user charges. Railway Department became New Zealand Railways Corporation. (Jun) Increases in motor vehicle fees and rail charges. Twelve-month wage, price, and rent freeze imposed from midnight 22 June. (Jun-Sep) Clyde dam controversy over water rights. Continued severe drought in Canterbury and North Otago. (Oct) EEC ministers agreed in principle to import quota of 87 000 tonnes of butter from New Zealand. Because of continuing market uncertainties, N.Z. Meat Producers Board announced it would buy all export lamb and mutton for expected period of 2 years. Plans for Aramoana aluminium smelter shelved indefinitely because of world glut of aluminium. (Nov) Australia and New Zealand reached final agreement on closer economic relations (CER), scheduled to be inaugurated on 1 January 1983. (Dec) Ammonia-urea plant at Kapuni commenced production. Unemployment and inflation remained as major problems throughout the year.
1983 (Jan) First airfreight consignment of chilled New Zealand lamb sent to Britain. (Mar) Final signing of Closer Economic Relations Agreement. New Zealand dollar devalued by 6 percent against all currencies. Introduction of Kiwi Savings Stock attracting 15 percent interest per annum. (Apr) New Zealand's triple A international credit rating reduced by Standard and Poor's Corporation. (May) Wage-Price Freeze extended until 29 February 1984. (Jun) Kiwi Savings Stock closed. (Jul) Official Information Act came into force. (Aug) Lending institutions slash interest rates on overdrafts, term loans and home mortgages. Second issue of Kiwi Savings Stock with interest rate of 10 percent per annum. (Nov) Regulations limiting interest rates on first mortgages on property to 11 percent, and subsequent mortgages to 14 percent imposed. Transport Amendment Act No. 2 introduced phased deregulation of land transport, and abolition of restrictions against competition with Railways Corporation. (Dec) Agreement to supply Iran with 140 000 tonnes of New Zealand lamb finalised. EEC ministers agree to import 13 833 tonnes of New Zealand butter for January and February 1984 until a decision is reached on a longer term arrangement. Industrial Relations Amendment Act abolished unqualified preference clause and introduced voluntary unionism from February 1984.
Table of Contents
Principally compiled in the New Zealand Bibliographic Unit, National Library, Wellington
The following list of books has been compiled to give New Zealand and overseas readers a selective approach to the country's literature and sources of information. Entries are arranged alphabetically under appropriate subject headings, which are in approximate order of the Dewey Classification. This selection has covered books published in New Zealand as well as books published overseas about New Zealand. Works of less than 75 pages have been indicated by an asterisk.
The New Zealand National Bibliography is published monthly and cumulated annually in microfiche, lists books, pamphlets, music, maps, periodicals, and selected non-book materials. It is prepared in the New Zealand Bibliographic Unit, and available from the National Library of New Zealand, Private Bag, Wellington.
BAGNALL, A. G., New Zealand National Bibliography to the Year 1960. Wn, Govt. Print., 1970–80. Vol. 1, to 1889. V2–4, 1890–1960.
BATEMAN NEW ZEALAND ENCYCLOPAEDIA, editor-in-chief, G. McLauchlan. Ak, David Bateman, 1984.
DIRECTORYOF OFFICIAL INFORMATION, Wn, State Services Commission, 1983.
DUNMORE BOOKOF NEW ZEALAND RECORDS, edited by P. Dunmore, Palmerston North, Dunmore Press, 1977.
ELLIS, N., comp. New Zealand Associations, Societies & Clubs; A National Directory. 2nd ed. Wn, Victoria University Press with Price Milburn, 1979.
ENCYCLOPAEDIAOF NEW ZEALAND, edited by A. H. McLintock, Wn, Govt. Print., 3 v. (Out of print.)
FISCHER, B. Guide to New Zealand Book Collecting and Handbook of Values. Dn, City Publishers, 1977.
GILDERDALE, B. A sea change. 145 Years of New Zealand Junior Fiction. Ak, Longman Paul, 1982.
GUIDETO NEW ZEALAND INFORMATION SOURCES, Palmerston North, Massey University, 1975. Bibliographies have been published on plants and animals, farming, field and horticultural crops, education, livestock farming, fisheries, forestry, religion, and official publications.
HEINEMANN NEW ZEALAND DICTIONARY, edited by H. W. Orsman. Ak, Heinemann Educational, 1979.
* MILLETT, A. P. U. and COLE, F. T. H. Bilbiographical Work in New Zealand 1982; Work in Progress and Work Published. Hamilton, University of Waikato Library, 1982.
NATIONAL REGISTEROF ARCHIVESAND MANUSCRIPTSIN NEW ZEALAND, Wn, National Library of New Zealand, 1979.
NEW ZEALAND BOOKSIN PRINT 1982. Melbourne, Thorpe, 1982.
NEW ZEALAND LIBRARY ASSOCIATION, Bibliography of New Zealand Bibliographies. Wn, 1967.
OXFORD NEW ZEALAND ENCYCLOPAEDIA, London. O.U.P., 1965. (Out of print.)
ROBERTSON, E and HUGHES, P. H. New Zealand Royal Commissions, Commissions and Committees of Inquiry, 1864–1981: A Checklist. Wn, New Zealand Library Association, 1982.
TAYLOR, C. R. H. A Bibliography of Publications the New Zealand Maori, Oxford, Clarendon Press, 1972. —— A Pacific Bibliography. 2nd ed. Oxford, Clarendon Press, 1965. (Out of print.)
UNION LISTOF SERIALSIN NEW ZEALAND LIBRARIES, 3rd ed. Wn, National Library of New Zealand, 1969–70. 6 v. Interim edition on microfiche. 1976.
UNION LISTOF THESESOFTHE UNIVERSITYOF NEW ZEALAND, 1910–1954. Wn, New Zealand Library Association, 1956. o.p. Supplement, 1955–1962. Supplement, 1963–1967. Supplement, 1968–1971. Supplement, 1971–1975. Supplement, 1976–1978.
* WOOD, G. A. A Guide for students of New Zealand History. Dn, McIndoe, 1973.
AGEING NEW ZEALANDERS, edited by R. A. Barker, F. M. Caughey, M. W. Guthrie. Wn, Dept. of Health. 1982.
BARRINGTON, R. and GRAY. A., The Smith Women; 100 New Zealand Women Talk About Their Lives. Wn, Reed. 1981.
BEYOND NEW ZEALAND, The Foreign Policy of a Small State, edited by John Henderson, Keith Jackson, and Richard Kennaway. Ak, Methuen, 1980.
BEDGGOOD, D. Rich and Poor in New Zealand. Sydney, Allen & Unwin, 1980.
BLACKBURN, A. Race Against Time. Wn, Human Rights Commission, 1982.
BUSH, G. W. A. Local Government and Politics in New Zealand. Sydney, Allen & Unwin, 1980.
DAVIS, P. Health and Health Care in New Zealand. Ak, Longman Paul, 1981.
EASTON, B., Social Policy and the Welfare State in New Zealand. Ak, Allen & Unwin, 1980.
FAMILIESIN NEW ZEALAND SOCIETY, edited by P. G. Koopman-Boyden. Wn, Methuen New Zealand, 1978.
GEARE, A. J. The System of Industrial Relations in New Zealand. Wn, Butterworths, 1983.
GRAY, A. The Jones Men; 100 New Zealand Men Talk about their Lives. Wn, Reed, 1983.
GRIMSHAW, P. Women's Suffrage in New Zealand. Ak, Auckland U.P.: Wn, O.U.P., 1972.
GUSTAFSON, B. S. Labour's Path to Political Independence. Ak, Auckland University Press, 1980.
HANSON, E. A The Politics of Social Security. Ak, Auckland University Press, 1980.
HILL, M. et al. Shades of Deviance: A New Zealand Collection, Palmerston North, The Dunmore Press.
ISSUESIN EQUITY by Judith Davey and Peggy Koopman-Boyden. Wellington, New Zealand Planning Council, 1983.
MCGIBBON, I. C., Blue-water Rationale: The Naval Defence of New Zealand, 1914–1942. Wn, Govt. Print. 1981.
MCGILL, D. The Other New Zealanders. Wn, Mallinson Rendel, 1982.
MCGILL, J. F. Immigration and the New Zealand Economy. Wn, New Zealand Institute of Economic Research. 1981.
MASCARENHAS, R. C. (ed.) Public and Private Enterprise in New Zealand. Wellington, New Zealand, Institute of Public Administration, 1983.
MASCARENHAS, R. C. Public Enterprise in New Zealand. Wellington, New Zealand, Institute of Public Administration, 1982.
MOL, Hans. The Fixed and The Fickle: Religion and Identity in New Zealand. Dunedin, Pilgrims Southern Press, 1982.
NEW ZEALAND PLANNING COUNCIL. Who Makes Social Policy?, Wn. 1982. See also the list of N.Z. Planning Council publications on page 353.
NEW ZEALAND POPULATION: Patterns of Change. (Population Monitoring Group A Report No. 1). Wn, New Zealand Planning Council, 1984.
NEW ZEALAND, SOCIOLOGICAL PERSPECTIVES, edited by Paul Spoonley, David Pearson, Ian Shirley. Palmerston North, Dunmore, 1982.
PEARSON, D. G. Johnsonville: Continuity and Change in a New Zealand Township, Sydney, Allen and Unwin, 1980.
PEARSON, D. G. and THORNS, D. C. Eclipse of Equality. Sydney. Allen and Unwin, 1983.
THE PATHTO REFORM, edited by C. Burns. Wn, New Zealand Institute of Public Administration, 1982.
PEOPLE LIKEUS, CELEBRATING CULTURAL DIVERSITY, edited by Anthony Haas, Allison Webber, Pam Brown. Wn, Asia Pacific Books, 1982.
PALMER, G. Unbridled Power: An Interpretation of New Zealand's Constitution and Government. Wn, O.U.P., 1979.
PHILLIPS, R., Divorce in New Zealand; A Social History. Ak, O.U.P., 1981.
THE POPULATIONOF NEW ZEALAND, edited by R. J. W. Neveille and C. J. O'Neill. Ak, Longman Paul, 1979.
RELIGIONIN NEW ZEALAND SOCIETY, edited by Brian Colless and Peter Donovan. Palmerston North, Dunmore, 1980.
ROTH, B. AND HAMMOND, J. Toil and Trouble; The Struggle for a Better Life in New Zealand. Ak, Methuen New Zealand, 1981.
ROTH, B. Trade Unions in New Zealand. Wn, Reed, 1974.
SCOTT, C. D. Local and Regional Government in New Zealand: Function and Finance. Sydney, Allen & Unwin. 1979.
SOCIAL WELFAREAND NEW ZEALAND SOCIETY, edited by A. D. Trlin. Wn, Methuen, 1977.
STATE SERVANTSANDTHE PUBLICINTHE 1980s, edited by R. M. Alley, Wn, New Zealand Institute of Public Administration, 1980.
VOLUNTARY UNIONISM; PROCEEDINGSOFA SEMINAR. 5 OCTOBER 1983, edited by P. Brosnan. Wn, Industrial Relations Centre, Victoria University of Wellington, 1983.
WOMENIN NEW ZEALAND SOCIETY, edited by P. Bunkle and B. Hughes. Sydney, Allen & Unwin, 1980.
BURROWES, A. W. AND R. D. MULHOLLAND, Investing on the New Zealand Sharemarket. Ak, Macmillan, 1982.
BUTLIN, S. J. Australia and New Zealand Bank. London. Longmans, 1961.
CAMPBELL. R. and A. KIRK. After the Freeze: New Zealand Unions in the Economy. Eastbourne, Port Nicholson Press, 1983.
CHAPPELL, N. M. New Zealand Bankers' Hundred. Wn, Bank of New Zealand, 1961.
EASTON, B. H., Economics for New Zealand Social Democrats. Dn, John McIndoe Ltd, 1981.
—— Income Distribution in New Zealand. Wn, NZIER, 1983.
EASTON, B. H. AND N. J. THOMSON. An Introduction to the New Zealand Economy. Qld, St Lucia, University of Queensland Press, 1982.
EXTERNAL ECONOMIC STRUCTUREAND POLICY, AN ANALYSISOF NEW ZEALAND'S BALANCEOF PAYMENTS, edited by R. S. Deane, P. W. E. Nicholl, and M. J. Walsh. Wn, Reserve Bank of New Zealand, 1981.
GOULD, J. The Rake's Progress? The New Zealand Economy Since 1945. A. K. Hodder and Stoughton, 1983.
HAYWOOD, E., D. ROSEAND A. STROOMBERGEN, Towards 1990: Patterns of National and Sectoral Development. Wn, NZ Planning Council, 1983.
HORSFIELD. A, K. AND D. J. O'DEA. Equity Investment in New Zealand. Wn, Govt. Print., 1983.
INFLATIONAND ECONOMIC ADJUSTMENT, edited by R. A. Buckle. Wn, Dept of Economics, Victoria University of Wellington, 1983.
LODGE J., The European Community and New Zealand, London, F. Pinter 1982.
MONETARY POLICYANDTHE NEW ZEALAND FINANCIAL SYSTEM, edited by R. S. Deane, P. W. Nicholl and R. G. Smith. 2nd ed. Wn, Reserve Bank of New Zealand, 1983.
NATIONAL INCOMES POLICY. PROCEEDINGSOFA SEMINAR, edited by Pat Walsh. Wn, Industrial Relations Centre, Victoria University of Wellington, 1982.
NEW ZEALAND VALUATION DEPT. Handbook for Local Authorities. 4th ed. Wn, 1982.
PHILPOTT, B. P. The Economic Mechanism. Wn, Reed Education, 1975.
PRESTON, D. A. Government Accounting in New Zealand. Wn, Govt. Print., 1980.
SINCLAIR, K. and W. F. MANDLE. Open Account: A History of the Bank of New South Wales in New Zealand. Wn. Whitcombe and Tombs for Bank of New South Wales, 1961.
STUDIESOFTHE NEW ZEALAND LABOUR MARKET, ed B. H. Easton. Wn, NZIER, 1983.
TASK FORCEON TAX REFORM: REPORT, Chairman: P. M. McCaw. Wn, Govt. Print., 1982.
TISDALE, C. A. AND J. T. WARD. Economics in our Society. Milton, Qld, Jacaranda Press, 1981.
WARD, A. H. A Command of Co-operatives. Wn, N.Z. Dairy Board, 1975.
BULLETINOFTHE RESERVE BANKOF NEW ZEALAND. Wn, Reserve Bank (monthly)
THE FINANCIAL STATEMENT. Wn, Govt. Print. (annual).
MEDIUM TERM REVIEW. Wn, NZ Institute of Economic Research (annual).
NEW ZEALAND: OECD ECONOMIC SURVEY. Paris, OECD (about eighteen monthly).
QUARTERLY PREDICTIONS. Wn, NZ Institute of Economic Research (quarterly).
QUARTERLY SURVEYOF BUSINESS OPINION. Wn, NZ Institute of Economic Research (quarterly).
REPORTOFTHE ECONOMIC MONITORING GROUP. Wn, New Zealand Planning Council (annual).
AFFORD, J., KOS, S. AND NAPIER, B. The Law and You; A Practical Guide for New Zealanders. Wn, Reed, 1981.
BLAIR, A. P. Accident Compensation in New Zealand: the Law Relating to Compensation for Personal Injury by Accident in New Zealand. 2nd ed. Wn, Butterworths, 1983.
BROOKS, B. T. The Practice of Industrial Relations in New Zealand. Ak, Commerce Clearing House (New Zealand), 1978.
BUTTERWORTHS FAMILY LAW GUIDE. Wn, Butterworths, 1983.
CAMPBELL, L. G. The Framework of Industrial Law in New Zealand. 2nd ed. Wn, Victoria University of Wellington, Industrial Relations Centre, 1982.
DOYLE, M. W. Criminal Procedure in New Zealand. Wn, Sweet and Maxwell, 1978.
DUNCAN, P. C. The Layman and the Law in New Zealand. Ak, J. M. McGregor, 1981.
FAMILY GUIDETO NEW ZEALAND LAW. Surrey Hills, NSW. Readers Digest, 1980.
HINDE, G. W. and M. S. HINDE. New Zealand Law Dictionary. 3rd ed. Wn, Butterworth, 1979.
MCBRIDE, T. J. New Zealand Civil Rights Handbook. Wn, Price Milburn, Butterworth, 1980.
MULHOLLAND, R. D. Business Law Today. Palmerston North, Dunmore Press, 1983.
—— Consumer Law in New Zealand. Palmerston North, Dunmore, 1982.
—— Introduction to the New Zealand Legal System, 4th ed. Wn, Butterworth, 1980.
NEW ZEALAND LAWS, STATUTES, ETC. Reprint of the Statutes of New Zealand, 1908–57. Wn, Govt. Print., 1958–1961. 16 v.
NORTHEY, J. F. Index to New Zealand Legal Writing. Ak, Legal Research Foundation, 1982. Annual supplements also published.
O'KEEFE, J. A. B. The Principles and Practice of Rating and Rating Valuations in New Zealand. Auckland University, 1982.
TAPP, P. and WILSON, M. Women and the Law in New Zealand. Ak, Methuen, 1982.
WILLIAMS, D. A. R. Environmental Law in New Zealand. Wn, Butterworth, 1980.
ARTIN SCHOOLS; The New Zealand Experience. Wn, Dept. of Education, 1978.
BARRINGTON, J. M. and T. H. BEAGLEHOLE. Maori Schools in a Changing Society: An Historical Review. Wn, New Zealand Council for Educational Research, 1974.
BOSHIER, R. Adult and Continuing Education in New Zealand, 1851–1978: a Bibliography. Vancouver, Adult Education Research Centre, Faculty of Education, University of British Columbia; Toronto, International Council for Adult Education, 1979.
CAMPBELL, W. J. Realities of Teacher Development. Wn, Dept. of Education, 1977.
CUMMING, I. and A. CUMMING. History of State Education in New Zealand, 1840–1975. Wn, Pitman, 1978.
EDUCATIONANDTHE EQUALITYOFTHE SEXES: Conference on Women and Education sponsored by the Committee on Women and the Department of Education, 23–27 November 1975, Victoria University of Wellington. Wn, Dept. of Education, 1976.
EDUCATIONAL SYSTEMOF NEW ZEALAND, Washington, D.C., Government Printing Office, 1981.
FITZGERALD, T. K. Education and Identity; A Study of the New Zealand Maori Graduate. Wn, New Zealand Council for Educational Research, 1977.
FORWARDTO BASICS, edited by J. Shallcrass. Wn, New Zealand Education Institute, 1978.
GADD, D. B. H. Cultural Difference in the Classroom: The Special Needs of Maoris in Pakeha Schools. Ak, Heinemann Educational, 1976.
GUIDANCEIN NEW ZEALAND SECONDARY SCHOOLS, compiled and edited by G. Hermansson. Ak, New Zealand Counselling and Guidance Association, 1981.
MCDONALD, G. Maori Mothers and Pre-school Education. Wn, New Zealand Council for Educational Research, 1973.
MEADE, A. comp. New Zealand Early Childhood Care and Education: Bibliography, 1965–1978; with annotations. Wn, New Zealand Council for Educational Research, 1979.
NEW ZEALAND COMMITTEEON HEALTHAND SOCIAL EDUCATION. Growing, Sharing, Learning; The report of the Committee on Health and Social Education. 2nd ed. Wn, Dept. of Education, 1978.
NEW ZEALAND DEPTOF EDUCATION. Education and the Equality of the Sexes; a list of resources. Wn, Dept. of Education, 1978.
NEW ZEALAND EARLY CHILDHOOD CAREAND DEVELOPMENT CONVENTION: 2nd, University of Canterbury, 1979. Early Childhood in New Zealand: their needs, our concern. Ch, Christchurch Teachers College, 1979.
* NEW ZEALAND EDUCATIONAL DEVELOPMENT COUNCIL. Review of Educational Developments, 1974–1978: Progress on Recommendations of the Educational Development Conference. Wn, Educational Development Council, 1978.
NEW ZEALAND NATIONAL ADVISORY COMMITTEEON MAORI EDUCATION. He Huarahi. Wn, Dept of Education, 1980.
NEW ZEALAND RESEARCH COMMITTEEON OPEN PLAN SCHOOLS. Report on Open Plan Education in New Zealand Primary Schools, Wn, Dept. of Education, 1977.
PARTON, H. The University of New Zealand. Ak, Auckland University Press; Wn, C.U.P., 1979.
POLICIESOF EDUCATIONIN NEW ZEALAND, edited by M. Clark. Wn, New Zealand Council for Educational Research, 1981.
RAMSAY, P. D. K. and others. The Family and the School in New Zealand Society: an Introduction to the Sociology of New Zealand Education. Carlton, Vic., Pitman, 1975.
ROTH, H. O. A Bibliography of New Zealand Education. Wn, New Zealand Council for Educational Research, 1964.
SUTTON-SMITH, B. A History of Children's Play: New Zealand, 1840–1950. Wn, New Zealand Council for Educational Research, 1982.
WILLIAMS, B. M. Structures and Attitudes in New Zealand Adult Education, 1945–75. Wn, New Zealand Council for Educational Research, 1978.
TE AO HURIHURI: The World Moves On: Aspects of Maoritanga, edited by M. King. Wn, Hicks Smith, 1975. Reprinted 1977.
BEST, E. Games and Pastimes of the Maori. Wn, Board of Maori Ethnological Research for the Dominion Museum, 1924. Reprinted Wn, Govt. Print., 1976.
—— The Maori as He Was. Wn, Dominion Museum, 1924. Reprinted Wn, Govt. Print., 1974.
—— Maori Agriculture. Wn, Board of Maori Ethnological Research for the Dominion Museum, 1925. Reprinted Wn, Govt. Print., 1976.
BIGGS, B. The Complete English-Maori Dictionary. Ak, Auckland University Press, Wn, O.U.P. 1981.
—— Let's Learn Maori; a Guide to the Study of the Maori language. Wn, Reed, 1975.
BRAILSFORD, B. The Tatooed Land—The Southern Frontiers of the Pa Maori. Wn, Reed, 1981.
BUCK, Sir P. The Coming of the Maori. 2nd ed. Wn, Whitcombe and Tombs, 1974.
DANSEY, H. Maori Custom Today. Auckland, Shortland Publications, reprinted 1978.
DUFF, R. S. The Moa-hunter Period of Maori Culture, 3rd ed. Wn, Govt. Print., 1977.
FIRTH, R. W. Economics of the New Zealand Maori 2nd ed. Wn, Govt. Print., 1972.
HANSON, F. and L. Counterpoint in Maori, London, Routledge and Kegan Paul, 1983.
HART, R. and A. W. REED. Maori Myth and Legend. Wn, Reed, 1983.
HE MATAPUNA—SOME MAORI PERSPECTIVES, N.Z. Planning Council, Wn, 1979.
INTOTHE WORLDOF LIGHT: AN ANTHOLOGYOF MAORI WRITING, edited by Witi Ihimaera and D. S. Lang. Ak, Heinemann, 1982.
KING, M. Maori: a Photographic and Social History. A. Heinemann, 1983.
LEWIS, D. The Maori: Heirs of Tane. London, Orbis, 1982.
MAORIIS MY NAME: Historical Maori Writings in Translation, edited by John Caselberg. Dn, McIndoe, 1975.
THE MAORI PEOPLEINTHE NINETEEN SIXTIES: A Symposium edited by E. G. Schwimmer. Ak, Longman Paul, 1972.
METGE, J. The Maoris of New Zealand: Rautahi. London, Routledge, 1976.
POOL, D. I. The Maori Population of New Zealand, 1976–1971. Ak, Auckland University Press, 1977.
REED, A. W. Treasury of Maori Exploration: Legends Relating to the First Polynesian Explorers of New Zealand. Wn, Reed, 1977.
RYAN, P. M. A Dictionary of Modern Maori. Ak, Heinemann Educational, 1974.
SALMOND, A. HUI: A Study of Maori Ceremonial Gatherings. Wn, Reed, 1975.
SCHWIMMER, E. G. The World of the Maori Wn, Reed, 1974.
SELECTED READINGSIN MAORI. Edited by B. Biggs, P. Hohepa, and S. M. Mead. Wn, Reed, 1967.
SIMMONS, D. R. The Great New Zealand Myth: A Study of the Discovery and Origin Traditions of the Maori. Wn, Reed, 1976.
STIRLING, F. Eruera: The Teachings of a Maori Elder. Wn, O.U.P., 1980.
TAYLOR, C. R. H. A Bibliography of Publications on the New Zealand Maori and the Moriori of the Chatham Islands. London, Oxford, 1972.
TUHE MAURI ORA: ASPECTS OF MAORITANGA, edited by M. King. Wn, Methuen New Zealand, 1978.
WILLIAMS, H. W. A Bibliography of Printed Maori to 1900, and Supplement. Wn, Govt. Print., 1975.
WILLIAMS, W. A Dictionary of the Maori Language, H. W. Williams, Rev. and augmented by the Advisory Committee on the Teaching of the Maori Language, Department of Education. 7th ed. Wn, Govt. Print., 1975.
BIOGEOGRAPHY ECOLOGYIN NEW ZEALAND, edited by G. Kuschel. The Hague, Dr W. Juur, 1975.
DIRECTORYOF NEW ZEALAND SCIENCE. 5th ed. Wn, New Zealand Association of Scientists, 1975.
ELLIS, N. E. The New Zealand Environment: a bibliography of material available through New Zealand public libraries, including a select list of overseas publications, 1968–1974. Wn, Nature Conservation Council, 1975. Supplements also published.
ENVIRONMENTAL POLICIESIN NEW ZEALAND. Paris, O.E.C.D., 1981.
LANDSAT II OVER NEW ZEALAND: Monitoring Our Resources From Space, edited by P. J. Ellis, I. L. Thomas and M. J. McDonnell. Wn, DSIR, 1978.
NEW ZEALAND'S NATURE HERITAGE. Ak, Hamlyn, 1976.
ADKIN, G. L. and B. W. COLLINS. A Bibliography of New Zealand Geology to 1950. Wn, DSIR, 1967. (Out of print.) Index, compiled by D. L. Jenkins. Wn. DSIR, 1976.
BIBLIOGRAPHYOF NEW ZEALAND GEOLOGY, 1951–1969, compiled by Guyon Warren and others. Wn, DSIR, 1977. Updates Adkin (above).
EIBY, G. A. Earthquakes. London, Heinemann, 1980.
FLEMING, Sir C. A. The Geological History of New Zealand and its Life. Ak, Auckland University Press, 1979.
GAGE, M. Legends in the Rocks: an Outline of New Zealand Geology. Ch, Whitcoulls, 1980.
GEOCHEMISTRY, 1977: A Collection of Papers by New Zealand Geochemists in Honour of S. H. Wilson, compiled by A. J. Ellis. Wn, DSIR, 1977.
GEOLOGYOF NEW ZEALAND, chief editor, R. P. Suggate, associate editors, G. R. Stevens, M. T. Te Punga. Wn, Govt. Print., 1980. 2v.
GRINDLEY, G. W., H. J. HARRINGTON, and B. L. WOOD. The Geological Map of New Zealand, 1:2 000 000. Wn, DSIR, 1959.
HOUGHTON, B. F. Geyserland: a Guide to the Volcanoes and Geothermal Areas of Rotorua. Lower Hutt, Geological Society of New Zealand, 1982.
KINGMA, J. T. The Geological Structure of New Zealand. New York, Wiley, 1974.
LANDFORMSOF NEW ZEALAND, edited by J. M. Soons and M. J. Selby. Ak, Longman Paul, 1982.
NEW ZEALAND CAVE ATLAS, compiled by P. C. Crossley, B. P. Hurst and R. G. West. Ak, University of Auckland, Dept. of Geography 1981.
NEW ZEALAND WATERAND SOIL DIVISION. Land Use Capability Survey Handbook: A New Zealand Handbook for the Classification of Land. Rev. ed. Wn, Soil Conservation and Rivers Control Council, 1971.
SALMON, J. H. M. A History of Goldmining in New Zealand. Wn, Govt. Print., 1963.
STEVENS, G. R. Rugged Landscape: The Geology of Central New Zealand. Wn, Reed, 1974.
—— New Zealand Adrift. Wn, Reed, 1980.
TAYLOR, E. and J. COLE. Volcanic New Zealand. Ak, Oxford University Press, 1983.
AYLING, A. M. Collins Guide to the Sea Fishes of New Zealand. Ak, Collins, 1982.
BULLER, Sir W. L. Birds of New Zealand. New ed. by E. G. Turbott. Ch, Whitcombe and Tombs, 1967.
BULL, P. C. and P. D. GAZE and C. J. R. ROBERTSON. Bird Distribution in New Zealand: A Provisional Atlas, 1969–1976. Wn, Ornithological Society of New Zealand, 1978.
CHAPMAN, M. A. and M. H. LEWIS. An Introduction to the Freshwater Crustacea of New Zealand. Ak, Collins, 1976.
CUSA, N. W. and R. M. LOCKLEY. New Zealand Endangered Species. Ak, Cassell, 1980.
DOAK, W. T. Fishes of the New Zealand Region Rev. ed. Ak, Hodder and Stoughton, 1978.
FALLA, R. A., R. B. SIBSON. and E. G. TURBOTT. A New Guide to Birds of New Zealand and Outlying Islands. Rev.: ed. London: 1979.
FORSTER, R. R., and L. M. FORSTER. Small Land Animals of New Zealand. Dn, McIndoe, 1970.
FORSTER, R. R. New Zealand Spiders. Ak, Collins, 1973.
GIBBS, G. W. New Zealand Butterflies. Ak, Collins, 1980.
GUNSON, D. Collins Guide to the New Zealand Seashore. Ak, Collins, 1983.
MCDOWALL, R. M. New Zealand Freshwater Fishes: A Guide and Natural History. Ak, Heinemann Educational, 1978.
MARSHALL, J., KINSKY, F. C. and ROBERTSON, C. J. R. The Fiat Book of Common Birds in New Zealand. 3v. Wn, Reed, 1972–75.
MILLER, D. Common Insects in New Zealand. Wn, Reed, 1971.
O'BRIEN, C. A. A Book of New Zealand Wildlife. Ak, Landsdowne Press, 1981.
POWELL, A. W. B. New Zealand Mollusca: Marine, Land and Freshwater Shells. Ak, Collins, 1979.
—— Shells of New Zealand, An Illustrated Handbook, 5th ed. Ch, Whitcoulls, 1976.
RAMSAY, G. W. and SINGH, P. Guide to New Zealand Entomology. Ak, Entomological Society of New Zealand, 1982.
SHARELL, R. New Zealand Insects and Their Story. Ak, Collins, 1971.
—— The Tuatara, Lizards, and Frogs of New Zealand. London, Collins, 1966.
SIBSON, R. B. Birds at Risk: Rare or Endangered Species of New Zealand. Wn, Reed, 1982.
WILD ANIMALSIN NEW ZEALAND, compiled under the direction of A. L. Poole. Wn, Reed, 1970.
ALLISON, K. W. and J. CHILD. The Mosses of New Zealand. Dn, University of Otago Press, 1971.
CHINNOCK, R. J. and HEATH E. Common Ferns and Fern Allies. Wn, Reed, 1981.
CONNOR, H. E. The Poisonous Plants in New Zealand. 2nd ed. Wn, Govt. Print., 1977.
CROWE, A. A Field Guide to the Native Edible Plants of New Zealand. Ak, Collins, 1981.
EAGLE, A. L. Trees and Shrubs of New Zealand in Colour: 228 Botanical Paintings. Ak, Collins, 1975. Also published 1978 in 2 volumes as Eagle's 100 Trees of New Zealand, and Eagle's 100 Shrubs & Climbers of New Zealand.
FISHER, M. E. New Zealand Ferns in Your Garden. Ak, Collins, 1976.
FLORAOF NEW ZEALAND. Wn, Govt. Print., 1961–63 vol. 1 by H. H. Allan, 1961. Vol. 2 by L. B. Moore and E. Edgar, 1970. Vol. 3 by A. J. Healey and E. Edgar, 1980.
GIVEN, D. R. Rare and Endangered Plants of New Zealand. Wn, Reed, 1981.
JOHNS, J. H. and B. MOLLOY. Native Orchids of New Zealand. Wn, Reed, 1983.
LAING, R. M., and E. W. BLACKWELL. Plants of New Zealand. 7th ed. Ch, Whitcombe and Tombs, 1964.
MARK, A. F., and N. M. ADAMS. New Zealand Alpine Plants. Wn, Reed, 1973.
MATTHEWS, L. J. and Z. CARTER. South African Proteaceae in New Zealand. Manakau, Matthews Publishing, 1983.
MOORE, L. B. and J. B. IRWIN. The Oxford Book of New Zealand Plants. Wn, O.U.P., 1978.
PARHAM, B. E. V. and A. J. HEALY. Common Weeds in New Zealand: an Illustrated Guide to Their Identification. Wn, Govt. Print., 1976.
POOLE, A. L., and N. M. ADAMS. Trees and Shrubs of New Zealand. Wn, Govt. Print., 1980.
SALMON, J. T. The Native Trees of New Zealand. Wn, Reed, 1980.
TAYLOR, G. M. Mushrooms and Toadstools in New Zealand. Wn, Reed, 1981.
ATKINSON, J. D. DSIR's First fifty years. Wn, Department of Scientific and Industrial Research, 1976.
BURTON, D. TWO Hundred Years of New Zealand Food and Cookery. Wn, Reed, 1982.
CAUGHLEY, G. The Deer Wars: The Story of Deer in New Zealand. Ak, Heinemann, 1983.
THE FARMINGOF DEER, WORLD TRENDSAND MODERN TECHNIQUES, edited by David Yerex. Wn, Agricultural Promotion Associates, 1982.
FENEMORE, P. G. Plant Pests and their Control. Wn, Butterworths, 1982.
FISHER, M. E., E. SATCHELL, and J. M. WATKINS. Gardening with New Zealand Plants, Shrubs, and Trees. Rev. ed. Ak, Collins, 1975.
GIBBS, H. S. New Zealand Soils. Wn, O.U.P., 1980.
HARRISON, R. E. Handbook of Bulbs and Perennials for the Southern Hemisphere. 2nd. ed. Rev. Palmerston North, R. E. Harrison, 1971.
——- Handbook of Trees and Shrubs. New ed. Rev, Wn, Reed, 1979.
HEALY, A. J. F. Identification of Weeds and Clover. Wn, Editorial Services, 1982.
HEALY, B. A Hundred Million Trees: the Story of New Zealand Forest Products. Ak, Hodder & Stoughton, 1982.
HOLDEN P. The Wild Pig in New Zealand. Ak, Hodder & Stoughton, 1982.
LANGER, R. H. M. Pastures and Pasture Plants. Wn, Reed, 1973.
LEVY, E. B. Grasslands of New Zealand. 3rd ed. Wn, Govt. Print., 1970.
LEITCH, D. B. Railways of New Zealand. Ak, L. Fullerton: Newton Abbot, Devon, David and Charles, 1972.
MCLAUCHLAN, G. The Farming of New Zealand. Ak, Australia & New Zealand Book Company, 1981.
MCLEAN, I. The Future for New Zealand Agriculture: Economic Strategies for the 1980s. Wn, Fourth Estate Books, 1978.
MATHEWS, B. W. Gardens of New Zealand. Ak: Hamlyn, 1975.
METCALF, L. J. The Cultivation of New Zealand Trees and Shrubs. Wn, Reed, 1972.
MORTON, H. The Whale's Wake. Dn, McIndoe, 1982.
MUNRO, M. N. and J. MUNRO. A Taste of New Zealand in Food and Pictures. Wn, Reed, 1977.
NEW ZEALAND FARMERS VETERINARY GUIDE. 4th. ed. Wn, New Zealand Dairy Exporter, 1972.
NEW ZEALAND INSECT PESTS, edited by D. N. Ferro, Lincoln, Lincoln University College of Agriculture, 1976.
NEW ZEALAND MINISTRYOF AGRICULTUREAND FISHERIES. New Zealand Agriculture. Wn, Govt. Print., 1974.
NOONAN, R. J. By Design: A Brief History of the Public Works Department, Ministry of Works. Wn, Govt. Print., 1975.
PAINTER, G. The Herb Garden Displayed. Ak, Hodder and Stoughton, 1979.
PEARCE, G. L. The Pioneer Craftsmen of New Zealand. Ak, Collins, 1982.
SCHOFIELD, J. C. Materials for the New Zealand Potter. Wn, Govt. Print., 1977.
SHEEP PRODUCTION, BREEDINGAND REPRODUCTION, edited by G. A. Wickham and M. F. McDonald. Wn, New Zealand Institute of Agricultural Science, 1982.
SIMPSON, T. E. Kauri and Radiata: Origin and Expansion of the Timber Industry of New Zealand. Ak, Hodder and Stoughton, 1973.
THORNTON, G. G. New Zealand's Industrial Heritage. Wn, Reed, 1982.
TROUP, G. S. Steel Roads of New Zealand: An Illustrated Survey. Wn, Reed, 1973.
WARD, A. H. A. Command of Co-operatives: The Development of Leadership, Marketing and Price Control in the Co-operative Dairy Industry of New Zealand. Wn, New Zealand Dairy Board, 1975.
ARCHEY, Sir G. E. Whaowhia: Maori Art and its Artists. Ak, Collins, 1977.
BARROW, T. T. Decorative Art of the New Zealand Maori. 4th ed. Wn, Reed, 1975.
—— Maori Art of New Zealand. Wn, Reed: Paris, Unesco Press, 1978.
BLUMHARDT, D. and BRAKE, B. Craft New Zealand. Wn, Reed, 1981.
BRAKE, B., J. M. MCNEISH and D. SIMMONS. Art of the Pacific. Wn, O.U.P., 1979.
BROWN, G. H. and KEITH, H. An Introduction to New Zealand Painting, 1839–1980. Rev. ed. Ak, Collins, 1982.
BROWN, G. H. New Zealand Painting 1940–1960, Conformity and Dissension. Wn, Queen Elizabeth II Arts Council, 1981.
CAPE, P. I. New Zealand Painting Since 1960: a Study in Themes and Developments. Ak, Collins, 1979.
—— Please Touch: A Survey of the Three-dimensional Arts. Ak, Collins, 1980.
—— Prints and Printmakers in New Zealand. Ak, Collins, 1974.
CORRUGATED IRONIN NEW ZEALAND, G. Chapple et al. Wn, Reed, 1983.
DOCKING, G. C. TWO Hundred Years of New Zealand Painting. Wn, Reed, 1971.
DOWNES, P. E. Shadows on the Stage. Theatre in New Zealand: The First Seventy Years. Dn, McIdoe, 1975.
DOWNES, P. E. and P. HARCOURT. Voices in the Air: Radio Broadcasting in New Zealand. Wn, Methuen, 1976.
ELLIS, E. M. and D. G. ELLIS. Early Prints of New Zealand, 1642–1875. Ch. Avon Fine Prints, 1978.
FOWLER, M. and R. VAN DE VOORT. The New Zealand House. Ak, Lansdowne, 1983.
HARCOURT, P. M. A Dramatic Appearance New Zealand Theatre, 1920–1970. Wn, Methuen, 1978.
* HILL, P. M. New Zealand Architecture. Wn, Dept. of Education, 1976.
HISTORIC BUILDINGSOF NEW ZEALAND: North Island, edited by Frances Porter. Ak, Cassell New Zealand, 1979.
HISTORIC BUILDINGSOF NEW ZEALAND: South Island, edited by F. Porter. Ak, Methuen, 1983.
MCLEAN, M. E. and M. ORBELL. Traditional Songs of the Maori. Ak, Auckland University Press: Wn, Oxford University Press, 1979.
N.Z. ART & ANTIQUES YEARBOOK, 1982–83: incorporating N.Z. art auction records. Wn, Newrick Associates, 1982.
* NEW ZEALAND FOLK SONGS: Songs of a Young Country, compiled by N. Colquhon. 2nd ed. Wn, Reed, 1972.
NEW ZEALAND POSTER BOOK, 1830–1940, compiled by E. Ellis. Wn, Reed, 1977.
NEW ZEALAND POTTERS: Their Work an,' Words, edited by D. Blumhardt. Wn, Reed, 1976.
NORMAN, P. T. Bibliography of New Zealand Compositions, vol. 1. Ch, Nota Bene Music, 1982.
PERFORMANCE: A HANDBOOK OF THE PERFORMING ARTS IN NEW ZEALAND. Wn, Association of Community Theatres, 1982.
PLATTS, U. Nineteenth Century New Zealand Artists. Ch, Avon Fine Prints, 1980.
SMYTH, B. W. and HOWORTH, H. Books and Pamphlets Relating to Culture and the Arts in New Zealand: A Bibliography Including Works Published to the End of the Year 1977. Ch, Dept. of Extension Studies, University of Canterbury: Wn, New Zealand National Commission for UNESCO, 1979.
THOMPSON, F. E. LITTLEWOOD and M. NORRIS. Craft Hunter's Guide, New Zealand 1980. Ak, 1980. (Available from Pitmans.)
THOMSON, K. W. Art Galleries and Museums of New Zealand. Wn, Reed, 1981.
VIEWS/EXPOSURES: Ten Contemporary New Zealand Photographers. Wn, National Art Gallery, 1982.
AGNEW, I. J. Kiwis Can Fly. Ak, Marketforce, 1976.
ALLAN, W. J. D. Power and Sail: A Complete Guide to Yachting and Boating in New Zealand. Ak, Heinemann, 1975.
BISMAN, R. A Salute to Trotting: A History of Harness Racing in New Zealand. Ak, Moa Publications, 1983.
BRITTENDEN, R. T. The Finest Years: Twenty Years of New Zealand Cricket. Wn, Reed, 1977.
BYRNE, J. Wing Shooting in New Zealand, Pheasant, Quail, Partridge, Duck and Goose. Wn, Reed, 1982.
CHESTER, R. H. and N. A. C. McMillan. Men in Black. Rev. and updated ed. Ak, Moa publications, 1983.
COSTELLO, J. B. New Zealand Galloping Greats. Enl. ed. Ak, Moa Publications, 1977.
FORRESTER, R. and ILLINGWORTH, N. Hunting in New Zealand. New rev. ed. Wn, Reed, 1979.
GARNER, I. and WALTER, I. New Zealand Soccer: the Impossible Dream. Ak, Hodder & Stoughton, 1982.
GLENGARRY, J. The Great Decade of New Zealand Racing, 1970–1980. Ak, Collins, 1983.
HOWITT, R. J. New Zealand Rugby Greats. Ak, Moa Publications, 1982.
LOUSLEY, D. P. Guide to the Ski Fields of the South Island, New Zealand. Dn, McIndoe, 1976.
MEMORABLE MOMENTSIN NEW ZEALAND SPORT, edited by Don Cameron. Ak, Moa Publications, 1979.
NEW ZEALAND SPORTING CLUBS DIRECTORY 1980. Ak, Tasman, 1980.
RADIO NEW ZEALAND SPORTS ANNUAL. Wn, Broadcasting Corporation of New Zealand, 1982.
SCANLAN, M. The New Zealand Boating Handbook. Wn, Reed, 1980.
SPORT NEW ZEALAND. Ak, New Zealand International Publishing Group, 1982.
TODD, S. P. DB Sporting Records of New Zealand, Ak, Moa Publications, 1976.
WILSON, J. The New Zealand Fisherman's Bible. Ak, Lansdowne Press, 1981.
A BOOKOF NEW ZEALAND, edited by J. C. Reid and P. Cape. Rev. and enl. ed. Ak, Collins 1979.
MCGORMICK, E. H. New Zealand Literature: a Survey. London, O.U.P., 1959. (Out of print).
THE OXFORD BOOKOF NEW ZEALAND WRITING SINCE 1945, chosen by M. P. Jackson and V. O'Sullivan. Ak, Oxford University Press, 1983.
STEAD, C. K. In the Glass Case: Essays on New Zealand Literature. Ak, Auckland University Press and Oxford University Press, 1981.
THOMSON, J. E. P. New Zealand Literature to 1977: A Guide to Information Sources. Detroit, Gale, 1980.
WOMEN WRITERSOF NEW ZEALAND, 1932–1952: JUBILEE HISTORYAND WRITINGSOFTHE NEW ZEALAND WOMEN WRITERS' SOCIETY, edited by Margaret Hayward and Joy Cowley. Wn, Colonial Associates, 1982.
* ADCOCK, K. F. The Inner Harbour. Oxford, O.U.P., 1979.
ANTHOLOGYOF TWENTIETH CENTURY NEW ZEALAND POETRY, selected by V. O'Sullivan. 2nd ed. Wn, O.U.P., 1976.
BAXTER, J. K. Selected poems. Ak, O.U.P., 1982.
BERTRAM, J. M. Charles Brasch. Wn, O.U.P., 1976.
CAMPBELL, A. Collected Poems, 1947–1981. Maryborough, Taylor, 1981.
CURNOW, A. Selected Poems. Ak, Penguin, 1982.
EDMOND, M. End Wall. Ak, O.U.P. 1981.
FAIRBURN, A. R. D. Collected Poems. Ch, Pegasus Press, 1975.
FIFTEEN CONTEMPORARY NEW ZEALAND POETS. Dn, Pilgrims South Press, 1980.
GLOVER, D. Selected Poems. 1981. Ak, Penguin, 1981.
HULME, K. The Silences Between: Moeraki Conversations. Ak, Auckland University Press, 1982.
HUNT, S. Collected Poems, 1963–1980. Ak, Penguin, 1980.
JACKAMAN, R. Shaman and Charlatan. Ak, Cicada, 1981.
JOHNSON, L. Coming and Going. Wn, Mallinson Rendel, 1982.
MCCORMICK, G. Zephyr. Gisborne, Piano Publishing.
MANHIRE, B. Good Looks. Ak, Auckland University Press, 1982.
MITCALFE, B. Maori Poetry: The Singing Word. Wn, Price Milburn, 1974.
NGA MOTEATEA, edited by A. T. Ngata. 3v. Wn, Polynesian Society, 1959–72. Collection of Maori songs.
* NEW ZEALAND LOVE POEMS, chosen by J. Bertram. Dn, McIndoe, 1977.
OLIVER, W. H. Out of Season. Wn, O.U.P. 1980.
* O'SULLIVAN, V. G. The Rose Ballroom and Other Poems. Dn, McIndoe, 1982.
—— James K. Baxter. Wn, O.U.P., 1976.
PENGUIN BOOKOF NEW ZEALAND VERSE, edited by T. A. M. Curnow. Harmondsworth, Penguin, 1966.
SEWELL, B. Solo Flight. Dn, McIndoe, 1982.
SOUTHAM, B. The People Dance. Dn, Northcott Reeves, 1982. Hbk.
STEAD, C. K. Geographies. Ak, Auckland University Press, 1982.
THE OXFORD BOOKOF CONTEMPORARY NEW ZEALAND POETRY CHOSENBY FLEUR ADCOCK. Ak, Oxford University Press, 1982.
* THOMSON, J. E. P. Denis Glover. Wn, O.U.P., 1977.
* TUWHARE, H. No Ordinary Sun. 3rd ed. Dn, McIndoe, 1977.
WEIR, J. E. and LYON, B. A. A Preliminary Bibliography of Works by and Works About James K. Baxter. Ch, University of Canterbury, 1981.
BIRD, HAWK, Bogie: Essays on Janet Frame, edited by Jeanne Delbaere. Aarhus, Dangaroo Press, 1978.
BURNS, J. New Zealand Novels and Novelists, 1861–1979: An Annotated Bibliography. Ak, Heinemann, 1981.
COPLAND, R. A. Frank Sargeson. Wn, O.U.P., 1976.
COWLEY, C. J. The Growing Season. London, Hodder & Stoughton, 1979.
CRITICAL ESSAYSONTHE NEW ZEALAND NOVEL, edited by Cherry Hankin. Ak, Heinemann Educational, 1976.
CRITICAL ESSAYSONTHE NEW ZEALAND SHORT STORY, edited by Cherry Hankin. Ak, Heinemann, 1982.
CROSS, I. R. The God Boy. Ch, Whitcombe and Tombs, 1972.
DAVIN, D. M. Roads from Home. Ak, Auckland University Press, 1976.
DU FRESNE, Y. Farvel and Other Stories. Wn, Victoria University Press, 1980.
DUGGAN, M. Collected Stories. Ak, Auckland University Press, Oxford University Press, 1981.
EVANS, P. D. Janet Frame. Boston, Twayne, 1977.
FRAME, J. Living in the Maniototo. New York, Braziller, 1979.
—— Owls Do Cry. London, W. H. Allen. 1961.
—— A State of Siege. Ch, Pegasus Press, 1967.
—— You Are Now Entering the Human Heart: Stories. Wn, Victoria University Press, 1983.
GEE, M. Games of Choice. Wn, O.U.P., 1977.
—— Meg. London, Faber: Ak, Penguin, 1981.
—— Plumb. Wn, O.U.P.: London, Faber and Faber, 1979.
—— Sole Survivor. London, Faber: Ak, Penguin, 1983.
GIFKINS, M. After the Revolution and Other Stories. Ak, Longman Paul, 1982.
GRACE, P. F. Mutuwhenua: The Moon Sleeps. Ak, Longman Paul, 1982.
—— The Dream Sleepers and Other Stories. Ak, Longman Paul, 1980.
GROVER, R. Cork of War: Ngati Toa and the British Mission, an Historical Narrative. Dn, McIndoe. 1982.
HILLIARD, N. H. Maori Girl. London, Heinemann, 1971.
—— Send Somebody Nice. London, Hale, 1976.
HYDE, R. The Godwits Fly. 2nd ed. Ak, Auckland University Press, 1970.
IHIMAERA, W. T. The New Net Goes Fishing. Ak, Heinemann, 1977.
—— Tangi. Ak, Heinemann, 1974.
—— Whanau. Ak, Heinemann, 1974.
KIDMAN, F. A Breed of Women. Sydney, Harper & Row, 1979.
KIDMAN, F. Mrs Dixon and Friend, Short Stories. Ak, Heinemann, 1982.
LEE, J. A. Children of the Poor. Ch, Whitcombe & Tombs, 1973.
MCCAULEY, S. Other Halves. Ak, Hodder & Stoughton, 1982.
MCNEISH, J. Joy. Ak, Hodder & Stoughton, 1982.
MANDER, J. Allen Adair. Ak, Auckland University Press, 1971.
MANSFIELD, K. Complete Stories. Ak, Golden Press, 1974.
—— Selected Stories, edited with an introduction by D. M. Davin. Oxford, O.U.P., 1981.
MARSHALL, O. The Master of Big Jingles and Other Stories. Dn, McIndoe, 1982.
MORRIESON, J. R. H. Pallet on the Floor. Palmerston North, Dunmore, 1976.
—— The Scarecrow. Ak, Heinemann, 1976.
MULGAN, J. A. E. Man Alone. 2nd ed. Ak, Longman Paul, 1975.
N.Z. LISTENER SHORT STORIES, chosen by B. Manhire. 2v. Wn, Methuen New Zealand, 1977–78.
NEW ZEALAND SHORT STORIES, Wn, O.U.P., 1975. 3 series.
PICKARD, A. G. All Part of the Game: The Stories of A. P. Gaskell. Ak, Auckland University Press, 1978.
SARGESON, F. Stories. Ak, Penguin, 1982.
SHADBOLT, M. F. R. Figures in Light: Selected Stories. London, Hodder and Stoughton, 1978.
—— Strangers and Journeys. London, Hodder and Stoughton, 1972.
—— The Lovelock Version. Ak, Hodder and Stoughton, 1980.
SHIRLEY TEMPLEISA WIFEAND MOTHER: 34 Stories, edited by C. C. Catley. Whatamongo Bay, Cape Catley, 1977.
STEAD, C. K. Five for the Symbol. Ak, Longman Paul, 1981.
—— Smith's Dream. Ak, Longman Paul, 1971.
STEVENS, J. The New Zealand Novel, 1860–1965. 2nd ed. Wn, Reed, 1966.
TEMPLE, P. Beak of the Moon. Ak, Collins, 1981.
WENDT, A. Sons for the Return Home. Ak, Longman Paul, 1973.
* BAXTER, J. K. Jack Winter's Dream. Wn, Price Milburn for Victoria University Press, 1979.
CONTEMPORARY NEW ZEALAND PLAYS, selected by H. McNaughton. Wn, O.U.P., 1974.
DIRECTORYOF NEW ZEALAND PLAYSAND PLAYWRIGHTS. Rev. ed. Wn, Playmarker, 1981.
HALL, R. L. Middle-age Spread. Wn, Price Milburn, 1978.
—— Glide Time: a play in four acts set in the Public Service. Wn, Price Milburn, 1977.
MCGEE, G. Foreskin's Lament. Wn, Price Milburn and Victoria University Press, 1981.
MCNAUGHTON, H. D. New Zealand Drama: A Bibliographical Guide. Ch, Library University of Canterbury, 1974.
—— New Zealand Drama. Boston, Twayne, 1981.
MASON, B. Blood of the Lamb. Wn, Price Milburn, 1981.
ABOUT NEW ZEALAND. Wn, Ministry of Foreign Affairs, 1982.
ALEXANDER, L. Adventure Holidays in New Zealand. Wn, INL Print, 1982.
BARRIBALL, M. New Zealand, Images, Impressions. Wn, Reed, 1982.
BRAITHWAITE, E. F. New Zealand and its People. Wn, Govt. Print., 1974.
CHAVASSE, C. G. R. and J. H. JOHNS. New Zealand Forest Parks. Wn, Govt. Print., 1983.
COBB, L. and DUNCAN, J. New Zealand's National Parks. Ak, Hamlyn, 1980.
CONLON, D. Presenting New Zealand. Ak, Golden Press, 1982.
A DAYINTHE LIFEOF NEW ZEALAND; Friday, March 18th, 1983. Ak, McGregor, 1983.
FOSTER, B. and V. WRIGHT. Stockman Country: a New Zealand Mustering Adventure. Wn, Listener, 1983.
JOYCE, R. and SAUNDERS, B. Discover New Zealand, the Glorious Islands. Ak, Landsdowne, 1982.
KING, M. and BARRIBALL, M. New Zealand in Colour. Wn, Reed, 1982.
MATTHEWS, G. The Edge of the Land: the Coastline of New Zealand. Ch, Whitcoulls, 1983.
NEW ZEALAND ATLAS, edited by Ian Wards. Wn, Govt. Print., 1976.
NEW ZEALANDIN MAPS, edited by A. G. Anderson. London, Hodder and Stoughton, 1977.
NEW ZEALAND AUTOMOBILE ASSOCIATION. AA Road Atlas of New Zealand. Rev. ed. Ak, Hamlyn, 1978.
—— AA BOOKOF NEW ZEALAND WALKWAYS. Sydney, Landsdowne, 1982.
—— AA BOOKOFTHE NEW ZEALAND COUNTRYSIDE. Ak, Hamlyn, 1978.
PEAT, N. Detours, a Journey through Small-Town New Zealand. Ch, Whitcoulls, 1982.
POPE, D. and POPE, J. The Mobil Illustrated Guide to New Zealand. Wn, Reed, 1982.
POPE, D. M. and POPE, J. D. Mobil New Zealand Travel Guide, North Island. 3rd ed. Wn, Reed, 1977.
—— South Island. 3rd ed. Wn, Reed, 1978.
REED, A. W. Place Names of New Zealand. Wn, Reed, 1975. Supplement, 1979.
ROBERTS, G. and B. TURNER. New Zealand High Country. Wn, Millwood, 1983.
WILD NEW ZEALAND. Sydney, Reader's Digest, 1981.
WISES NEW ZEALAND GUIDE: A Gazetteer of New Zealand. 7th ed. Ak, Wise Publications, 1979.
ADAMS, P. W. T. Fatal Necessity: British Intervention in New Zealand, 1830–1847. Ak, Auckland University Press, 1977.
BEAGLEHOLE, J. C. The Discovery of New Zealand. 2nd ed. London, O.U.P., 1961. (Out of print).
BEGG, A. C. and N. C. BEGG. James Cook and New Zealand. Wn, Govt. Print., 1969.
BRETT, H. White Wings. Ak, Brett Printing Co., 1924–28. Reprinted Ch, Capper Press, 1976. 2 v. Also other facsimile titles by the same publisher.
COOK, J. The Journals of Captain James Cook on His Voyages of Discovery. Edited by J. C. Beaglehole. Cambridge, Hakluyt Society, 1955–5 v. to date. (Hakluyt Society. Extra series No. 34.)
COWAN, J. The New Zealand Wars. Wn, Govt. Print., 1955–1956. 2 v.
CUMBERLAND, K. B. Landmarks. Surrey Hills N.S.W., Reader's Digest, 1981.
FACSIMILESOFTHE DECLARATIONOF INDEPENDENCEANDTHE TREATYOF WAITANGI. Wn, Govt. Print., 1976.
GRANT, I. F. The Unauthorised Version: A Cartoon History of New Zealand. Ak, Cassell, 1980.
INGRAM, C. W. N. New Zealand Shipwrecks, 1795–1975. 5th ed. Wn, Reed, 1977.
JACKSON, W. K. The New Zealand Legislative Council: A Study of the Establishment, Failure, and Abolition of an Upper House. Dn, University of Otago Press, 1972.
KAY, R. and T. EDEN. Portrait of a Century: the History of the N.Z. Academy of Fine Arts, 1882–1982. Wn, Millwood, 1983.
KING, M. New Zealanders at War. Ak, Heinemann, 1981.
LISSINGTON, M. P. New Zealand and Japan, 1900–1941. Wn, Govt. Print., 1972.
—— New Zealand and the United States, 1840–1944. Wn, Govt. Print., 1972.
LOOKING BACK: A Photographic History of New Zealand, compiled by K. Sinclair & W. Harrex. Wn, O.U.P., 1978.
MCLINTOCK, A. H. Crown Colony Government in New Zealand. Wn, Govt. Print., 1958.
MCNAB, R. The Old Whaling Days: A History of Southern New Zealand from 1830 to 1840. Ak, Golden Press, 1975.
MADDOCK, S. These Antipodes: A New Zealand Album, 1814 to 1854. Ak, Collins, 1979.
MANING, F. E. Old New Zealand: A Tale of the Good Old Times and A History of the War in the North Told by an Old Chief of the Ngapuhi Tribe. Ak, Golden Press, 1973.
MORRELL, W. P. The Anglican Church in New Zealand: A History. Dn, McIndoe, 1973.
—— The Provincial System in New Zealand, 1852–76. 2nd rev. ed. Ch. Whitcombe and Tombs, 1964.
NEW ZEALAND CENTENNIAL BRANCH. Making New Zealand: Pictorial Surveys of a Century. Wn, 1939–40. 2 v. (Out of print).
NEW ZEALAND HISTORIC PLACES TRUST. Leaflets on various historic sites: booklets. See under individual authors.
NEW ZEALAND WAR HISTORY BRANCH. Documents Relating to New Zealand's Participation in the Second World War, 1939–45. Wn, 1949–63. 3 v. (Out of print).
NEW ZEALAND'S HERITAGE: The Making of a Nation. Ak, Hamlyn, 1977. 7 v. in 105 pts, issued weekly.
OLIVER, W. H. The Story of New Zealand. 2nd ed. London, Faber, 1963.
THE OXFORD HISTORYOF NEW ZEALAND, edited by W. H. Oliver with B. R. Williams. Oxford, Clarendon Press: Wn, Oxford University Press, 1981.
PASCOE, J. D. Exploration New Zealand. Wn, Reed. 1971.
SIMPSON, A. C. The Road to Erewhon. Ak, Beaux Arts, 1976.
—— The Sugarbag Years. Wn, A. Taylor, 1974.
SINCLAIR, K. A. History of New Zealand. Rev. ed. London, Lane, 1980.
—— The Origins of the Maori Wars. 2nd ed. Ak, Auckland University Press, 1974.
SUTCH, W. B. Poverty and Progress in New Zealand. A Reassessment. 2nd rev. ed. Wn, Reed, 1969.
—— The Quest for Security in New Zealand. 1840 to 1966. Wn, O.U.P., 1966.
TAYLOR, R. Te Ika a Maui, or New Zealand and its Inhabitants. Wn, Reed, 1974.
THIRTEEN FACETS: Essays to Celebrate the Silver Jubilee of Queen Elizabeth the Second, 1952–1977, edited by I. Wards. Wn, Govt. Print., 1978.
WAKEFIELD, E. J. Adventure in New Zealand. Ak, Golden Press, 1975.
WOOD, F. L. W. The Zealand People at War: Political and External Affairs. Wn, Historical Publications Branch in conjunction with Reed, 1971.
The following are representative of the many titles in this category:
ACLAND, L. G. D. The Early Canterbury Runs. 4th. ed. Ch, Whitcoulls, 1975.
ALINGTON, M. H. Unquiet Earth: A History of the Bolton Street Cemetery. Wn, Wellington City Council, Govt. Print., 1978.
ALLAN R. M. Nelson A History of Early Settlement. Wn, Reed, 1965.
ANDERSEN, J. C. Place Names of Banks Peninsula: A Topographical History. Wn, Govt. Print., 1927. Reprinted Ch, Capper Press, 1976. Also other facsimile titles by the same publisher.
BAGNALL, A. G. Wairarapa. Masterton, Hedley's Bookshop, 1976.
BARBER, L. H. The View from Pirongia: The History of Waipa County. Ak, Richards Publishing, 1978.
BEGG, A. C. and N. C. BEGG. Port Preservation. Ch, Whitcombe and Tombs, 1973.
BUCHANAN, J. D. H. The Maori History and Place Names of Hawke's Bay. Wn, Reed, 1973.
CAMPBELL, M. D. N. Story of Napier, 1874–1974. Napier. Napier City Council, 1975.
CARKEEK, W. The Kapiti Coast: Maori History and Place Names. Wn, Reed, 1966. Reprinted Ch, Capper Press, 1978.
ELDRED GRIGG, S. A New History of Canterbury. Dn, McIndoe, 1982.
FIELD, T. A. Relics of the Goldfields, Central Otago. Dn, McIndoe, 1976.
GIBBONS, P. J. Astride the River: A History of Hamilton. Ch, Whitcoulls for the Hamilton City Council, 1977.
GUTHRIE-SMITH, W. H. Tutira: The Story of a New Zealand Sheep Station. 4th ed. Wn, Reed, 1969.
HALL-JONES. Fiordland Explored: An Illustrated History. Wn, Reed, 1976.
A HISTORY OF CANTERBURY, Canterbury Centennial Historical and Literary Committee. Ch, Whicombe and Tombs, 1957–71. 3 v.
HOLCROFT, M. H. The Line of Road: A History of Manawatu County, 1876–1976. Dn, McIndoe for the Manawatu County Council, 1977.
HOWARD, B. H. Rakiura: A History of Stewart Island. Dn, Reed, 1974.
IRVINE-SMITH, F. L. The Streets of My City: Wellington, New Zealand. Wn, Reed, 1967.
LAMBERT, T. The Story of Old Wairoa and the East Coast District, North Island, New Zealand. Dn, Coulls Somerville Wilkie, 1925. Reprinted Ch, Capper Press, 1977.
MCARA, J. B. Gold Mining at Waihi, 1878–1952. Waihi, Waihi Historical Society, 1978.
MAIN, W. Auckland Through a Victorian Lens. Wn, Millwood Press, 1977.
MAY, P. R. The West Coast Gold Rushes. 2nd. Rev. ed. Ch, Pegasus, 1967.
NORDMEYER, A. Waitaki: The River and its Lakes, the Land and its People. Oamaru, Waitaki Lakes Committee, 1981.
OLIVER, W. H. Challenge and Response. A Study of the Development of the Gisborne East Coast Region. Gisborne, East Coast Development Research Association, 1971.
REED, A. H. The Story of Northland. Wn, Reed, 1975.
SMART, M. J. G. and A. P. BATES, The Wanganui Story. Wanganui Newspapers, 1972.
SMEDLEY, B. Homewood and its Families. Wn, Mallinson Rendel, 1980.
* STANDISH, M. W. The Waimate Mission Station. Wn, Govt. Print., 1962.
TULLETT, J. S. The Industrious Heart: A History of New Plymouth. New Plymouth, New Plymouth City Council, 1981.
WOODHOUSE, A. E. Blue Cliffs, the Biography of a South Canterbury Sheep Station, 1856–1970. Wn, Reed, 1982.
HONOURS, TITLES, STYLES, AND PRECEDENCEIN NEW ZEALAND, compiled and edited by P. P. O'Shea. Wn, Govt. Print., 1977. Supplement, 1980.
WHO'S WHOIN NEW ZEALAND. 11th ed., edited by J. E. Traue. Wn, Reed, 1978.
BASSET, J. Sir Harry Atkinson, 1831–1892. Ak, Auckland University Press, 1975.
BEAGLEHOLE, J. C. The Life of Captain James Cook. London, Black, 1974.
BINNEY, J. and CHAPLIN, G. and WALLACE, C. Mihaia: The Prophet Rua Kenana and His Community at Maungapohatu. Wn, O.U.P., 1979.
BURNS, P. Te Rauparaha. Wn, Reed, 1980.
CONDLIFFE, J. B. Te Rangi Hiroa: The Life of Sir Peter Buck. Ch, Whitcombe and Tombs, 1971.
CRESSWELL, W. D. The Letters of D'Arcy Cresswell. Ch, University of Canterbury, 1971.
FAIRBURN, A. R. D. The Letters of A. R. D. Fairburn, selected and edited by L. Edmond. Ak, Oxford University Press, 1981.
FINGLETON, D. Kiri Te Kanawa. London, Collins, 1982.
FRAME, J. To the Is-land: an Autobiography. London, Women's Press: Ak, Hutchinson Group, 1983.
GORDON, J. All the World's a Stage. Wn, Mallinson Rendel, 1981.
HARPER, B. Petticoat Pioneers: South Island Women of the Colonial Era. Wn, Reed, 1980.
HAYWARD, M. Diary of the Kirk Years. Wn, Reed: Queen Charlotte Sound, Cape Catley, 1981.
HENDERSON, J. M. Ratana: The Man, the Church, the Political Movement. 2nd ed. Wn, Polynesian Society, 1972.
KING, M. Te Puea. Ak, Hodder and Stoughton, 1982.
—— Whina: a Biography of Whina Cooper. Ak. Hodder and Stoughton, 1983.
LEE, J. A. The John A. Lee Diaries, 1936–40. Ch, Whitcoulls, 1981.
LUSH, V. The Waikato journals, 1864–68, 1881–82. Ch, Pegasus, 1982.
MACGREGOR, M. F. Petticoat Pioneers: North Island Women of the Colonial Era. Wn, Reed, 1973. 2 v. 1975.
MCCORMICK, E. H. Omai, Pacific Envoy. Ak, Auckland University Press, 1977.
—— Portrait of Frances Hodgkins. Ak, Auckland University Press: O.U.P., 1981.
MARSH, N. Black Beech and Honeydew: An Autobiography. Rev. and enl. ed. Ak, Collins, 1981.
MARSHALL, J. Memoirs. Volume 1. 1912 to 1960. Ak, Collins, 1983.
MEYERS, J. Katherine Mansfield: A Biography. Ak, Hodder and Stoughton, 1979. Also published London, H. Hamilton, 1978.
NOTABLE NEW ZEALANDERS, Ak, Hamlyn, 1979.
OLIVER, W. H. James K. Baxter: a Portrait. Wn, Port Nicholson Press, 1983.
OLSSEN, E. N. John A. Lee. Dn, University of Otago Press, 1977.
O'SHEA, P. P. An Unknown Few: The Story of Those Holders of the George Cross, the Empire Gallantry Medal, and the Albert Medals Associated with New Zealand. Wn, Govt. Print., 1981.
RAESIDE, J. D. Sovereign Chief: A Biography of Baron de Thierry. Ch. Caxton Press, 1977.
ROLLESTON, R. William and Mary Rolleston. Wn, Reed, 1971.
SARGESON, F. Sargeson. Ak, Penguin, 1981.
SCOTT, R. G. A Stake in the Country: Assid Abraham Corban and His Family, 1892–1977. Ak, Southern Cross Books, 1977.
SHADBOLT, M. F. R. Love and Legend: Some 20th Century New Zealanders. Ak, Hodder and Stoughton, 1976.
SINCLAIR, K. Walter Nash. Ak, Auckland University Press, 1976.
—— William Pember Reeves: New Zealand Fabian. Oxford, Clarendon Press, 1965.
STONE, R. J. C. Young Logan Campbell. Ak, Auckland University Press, 1982.
STIRLING, A. M. Amiria: The Life Story of a Maori Woman, as told to Anne Salmond. Wn, Reed, 1976.
THOMSON, J. M. A Distant Music, the Life and Times of Alfred Hill, 1870–1960. Ak, O.U.P., 1980.
TE WIATA, B. Inia Te Wiata, Most Happy Fella. Ak, Hutchinson, 1982.
WEBSTER, P. Rua and the Maori Millennium. Wn, Price Milburn for Victoria University Press, 1979.
WILSON, O. An Outsider Looks Back: Reflections on Experience. Wn, Port Nicholson Press, 1982.
BALL, M. The Cry of the Grey Ghost. Wn, INL Print, 1983.
—— Stanley. Wn, INL Print, 1982.
—— They've put custard with my bone! Wn, INL print, 1982.
BROCKIE, B. Brockie's Bones of Contention. Wn, Fourth Estate Group, 1983.
FLETCHER, D. Grasp and Co. Wn, INL Print, 1983.
GADSBY, J., D. MCPHAIL and A. K. GRANT. The McPhail & Gadsby Book. Ch, Whitcoulls, 1983.
GRANT, A. K. The Paua and the Glory: the Story of New Zealand's Rise to International Insignificance. Ak, Allen & Unwin, 1982.
HENSHAW, D. The Best of Jock. Ak, Hodder and Stoughton, 1983.
MCLEOD, R. Rosemany McLeod's Beside Book. Martinborough, Alister Taylor, 1981.
MINHINNICK. Just a Min—: Cartoons from the New Zealand Herald. Ak, Wilson & Horton, 1983.
ROBERTSON, D. A Dog's Breakfast. Ak, Lindon, 1983.
SEFTON, R. How to Use a Dead Kiwi. Ak, Lindon, 1983.
Table of Contents
New Zealand Literary Fund—This fund is financed by a yearly appropriation on the vote of the Department of Internal Affairs. Assistance from the fund is granted by the Minister for the Arts, who is advised by the Literary Fund Advisory Committee.
Scholarship in Letters—The scholarship of $12,000 is awarded annually in December to an established New Zealand writer by the Minister for the Arts, on the recommendation of the Literary Fund Advisory Committee. Applications are made to the Secretary, New Zealand Literary Fund Advisory Committee, Department of Internal Affairs, Private Bag, Wellington.
Victoria University of Wellington Writer's Fellowship—Funded jointly by the New Zealand Literary Fund and Victoria University, the fellowship is to enable a writer to work on a literary project at the university for 12 months. Details on the fellowship are available from the Registrar, Victoria University of Wellington, Private Bag, Wellington.
Robert Burns Fellowship in Literature—This fellowship in literature is tenable for 1 year, with provision for extension, at the University of Otago. The fellow shall be resident for the academic year. The fellowship is open to New Zealand writers, preferably under 40 years. Subject to the availability of funds, the fellow receives the equivalent of a lecturer's salary. Applications are made to the Registrar, University of Otago, Dunedin, by 10 August.
Maori Writers' Awards—The Maori Purposes Fund Board annually makes available one award of $1,000 for creative writing in the English language, and another of $1,000 for creative writing in the Maori language. Applications from persons of Maori descent should be sent to the Secretary of the Maori Purposes Fund Board, P.O. Box 2390, Wellington.
New Zealand Book Awards—Annual awards of $2,000 are made by the Minister for the Arts with the support of the Literary Fund and the Queen Elizabeth II Arts Council, for the best books published each year in the categories of poetry, fiction, non-fiction, and book production.
Award for Achievement—The Award for Achievement, valued at $500, recognises an individual's contribution to New Zealand literature. The award is granted each year by the Minister for the Arts. on the recommendation of the Literary Fund Advisory Committee. (Applications are not called for.)
Esther Glen Award—This award of the New Zealand Library Association is available annually to the author of the most distinguished children's book written by a New Zealander. (Applications are not called for.)
Russell Clark Award—This award of the New Zealand Library Association is available annually to the illustrator responsible for the most distinguished illustrations for a children's book. The illustrator must be a citizen or resident of New Zealand. (Applications are not called for.)
Hubert Church Prose Award—This award of PEN (New Zealand Centre) with the assistance of the New Zealand Literary Fund, is available annually for the best first book of prose writing by a New Zealand author. (Applications are not called for.)
Jessie Mackay Poetry Award—This award of PEN (New Zealand Centre) with the assistance of the New Zealand Literary Fund is available annually for the best first book of poetry written by a New Zealand author. (Applications are not called for.)
Katherine Mansfield Memorial Award—The Bank of New Zealand, in association with the New Zealand Women Writers' Society (Inc.), sponsors a biennial prestige memorial award for the short story.
Bank of New Zealand Young Writers' Awards—Concurrently with the Katherine Mansfield Memorial Award, the Bank of New Zealand sponsors 2 awards for young writers. These are the senior award, for entrants aged 24 years and under; and the junior award for secondary school students. Both awards are for short stories.
Katherine Mansfield Memorial Fellowship (Winn-Manson Menton Trust)—The fellowship is to allow a New Zealand writer to write and study at Menton in the South of France. Applicants must be serious writers who would use the fellowship to further their literary studies and endeavours. The fellow will receive not less than $4,000, return airfares, and a contribution towards living expenses. Applications should be made to the Hon. Secretary, Katherine Mansfield Memorial Fellowship, P.O. Box 10–256, Wellington, before 19 July each year.
Young Writer's Award—This award of PEN (New Zealand Centre) with the assistance of the New Zealand Literary Fund, the New Zealand Book Council, and the Department of Education, is available annually for writing by people under 20 years of age. There are categories for prose and poetry. Applications should be made to the Secretary, P.O. Box 2283, Wellington.
James Wattie Book of the Year Award—This award is made each year by Wattie Industries Limited. Full conditions of entry for the James Wattie Book of the Year Award, which is aimed mainly at encouraging the growth of publishing in New Zealand, are available from the Director, BPANZ, P.O. Box 78071, Grey Lynn, Auckland.
ICI Writers' Bursary—The bursary of $6,000 is jointly funded by ICI New Zealand Limited and the New Zealand Literary Fund. Its purpose is to enable a writer with potential, but not necessarily with an established publication record, to work full time for up to 1 year on a particular project. Applications are made to the Secretary, New Zealand Literary Fund Advisory Committee, Department of Internal Affairs, Private Bag, Wellington.
Choysa Bursary For Children's Writers—The bursary of $7,000 is jointly funded by Quality Packers Limited and the New Zealand Literary Fund. The bursary is offered annually to writers of imaginative work for children. Applications are made to the Secretary, New Zealand Literary Fund Advisory Committee, Department of internal Affairs, Private Bag, Wellington.
Canterbury University Writer-in-Residence—Funded jointly by the New Zealand Literary Fund and Canterbury University, the scheme is to enable writers to work for 9 months at the university. Details of the Writer-in-Residence scheme are available from the Registrar, Canterbury University, Christchurch.
A. W. Reed Memorial Book Award—An annual award of $5,000 is offered to the author of the best non-fiction manuscript. Inquiries to Mr Paul Bradwell, Reed Publishers, P.O. Box 14029, Kilbirnie, Wellington.
University of Auckland Literary Fellowship—The award is funded jointly by the New Zealand Literary Fund and the University of Auckland to enable a writer to work for 9 months at the university. Details from the Registrar, University of Auckland, Private Bag, Auckland.
Painting and Sculpture:Frances Hodgkins Fellowship—The fellowship is open to New Zealand painters and sculptors, preferably under 40 years. It is tenable for 1 year, with provision for extension, at the University of Otago. Subject to the availability of funds, the fellow receives the equivalent of a lecturer's salary. Applications are made to the Registrar, University of Otago, Dunedin, by 10 August.
Music:Mozart Fellowship—The fellowship is open to New Zealand musicians who are serious composers. It is tenable for 1 year, with provision for extension, at the University of Otago. Applicants should be at least 27 years old. Subject to the availability of funds, the fellow receives the equivalent of a lecturer's salary. Applications are made to the Registrar, University of Otago, Dunedin, by 10 August.
Table of Contents
Monthly Abstract of Statistics
Pocket Digest of Statistics
New Zealand Official Yearbook
New Zealand at a Glance (brochure)
Catalogue of New Zealand Statistics
Descriptive List of Publications
Can' We Help?
Agricultural Statistics
Balance of Payments
Building and Construction Statistics
External Trade
Exports (Final Statistics)
Imports (Final Statistics)
Report and Analysis
Household Survey
Incomes and Income Tax
Insurance Statistics
Justice Statistics
Local Authority Statistics
New Zealand System of National Accounts
Population and Migration
Pt. A Population
Pt. B External Migration
Prices, Wages, and Labour
Pt. A Prices
Pt. B Wages and Labour
New Zealand Employment Statistics
Shipping and Cargo Movements
Transport Statistics
Vital Statistics
Work Stoppages and Industrial Unions
| Vol. 1 Pt. A Population Size and Distribution |
| Pt. B Population Density |
| Pt. C Location and Increase of Population |
| 2 Ages, Marital Status, and Fertility |
| 3 Religious Professions |
| 4 Labour Force |
| 5 Incomes |
| 6 Education |
| 7 Birthplaces and Ethnic Origin |
| 8A Maori Population and Dwellings |
| 8B Pacific Island Polynesian Population |
| 9 Dwellings |
| 10 Households and Families |
| 11 Internal Migration |
Bulletin on Cigarette Smoking
1983 Electorate Profiles
Census of Agricultural Contracting Services
Census of Building and Construction
Census of Distribution
Census of Fishing
Census of Forestry and Logging
Census of Libraries
Census of Manufacturing
Census of Mining and Quarrying
Census of Services
Census of Transport, Storage and Communication
Inter-Industry Studies
Life Tables
Life Annuity Tables
Demographic Bulletin (6-monthly)
New Zealand Population Projections 1983–2016
Maps of Statistical Boundaries 1981
A leaflet showing further details of statistical publications can be obtained from Government Bookshops at the following addresses—
Auckland: Housing Corporation Building, Rutland Street (P.O. Box 5344). Ph. 32 919.
Hamilton: Northern Automobile Building, Alexandra Street (P.O. Box 857). Ph. 80 103.
Wellington: Head Office, Mulgrave Street (Private Bag). Ph. 737 320.
Wellington: World Trade Center, Cubacade (Private Bag). Ph. 849 572.
Christchurch: 159 Hereford Street (Private Bag). Ph. 797 142.
Dunedin: T. and G. Building, Princes Street (P.O. Box 1104). Ph. 778 294.
Table of Contents
A wide range of statistical information is published in the form of statistical bulletins, frequently before publication in an annual volume. A list of Department of Statistics' publications is published in the Monthly Abstract of Statistics and a Descriptive List of Publications is available from the Department of Statistics, Private Bag, Wellington.
Provisional and regional results of the 1981 Census of Population and Dwellings have been published in a series of bulletins before publication of the subject-matter volumes.
A list of bulletins in the Miscellaneous Series is published below, following the Census bulletins. Most of these bulletins are obtainable only from the Department of Statistics, Private Bag, Wellington.
Regional Statistics Series
Northland
Central Auckland
South Auckland - Bay of Plenty
Hawke's Bay and East Coast
Taranaki
Wellington
Marlborough, Nelson, and Westland
Canterbury
Otago and Southland
Regional Summary
National Statistics
New Zealand Males and Females: A Statistical Comparison 1945–78 (replaces previous Bulletin 1)
New Zealand Tables of Working Life
New Zealand Supreme Court Criminal Statistics: Time Series to 1976
New Zealand Supreme Court Divorce Statistics: Time Series to 1976
New Zealand Children and Young Persons Courts Statistics: Time Series to 1976
New Zealand Maori and Non-Maori Populations: Time Series
1976 Census of Population and Dwellings, The Range and Availability of National Statistics
Family Statistics in New Zealand 1978
Survey on Driving Practices and Opinions 1975
New Zealand Children 1979
New Zealand's Changing Population Structure
Survey on Housing Conditions and Internal Migration in New Zealand 1975
Health and Health Services, and Travel to Work in New Zealand
New Zealand Permanent and Long-Term Migration Time Series Statistics 1922–79
Obtainable from Department of Statistics, Private Beg. Wellington.
New Zealand Standard Classification of Occupations (NZSCO)
New Zealand Standard Country Code (NZSCC)
New Zealand Standard Industrial Classification (NZSIC)
New Zealand Standard Institutional Sector Classification (NZISC)
New Zealand Statistical Classification of Exports
New Zealand Statistical Classification of Imports
New Zealand Statistical Classification of Goods and Services.
Report of the Revision of the Consumers Price Index 1980
Merchandise Trade with Australia December Quarter 1983
Merchandise Exports March 1984
Merchandise Imports March 1984
Table of Contents
Special articles published prior to 1970 were listed in the 1982 and earlier Yearbooks.
| Subject | Yearbook |
|---|---|
| Metrication | 1970 |
| Human pressures on the natural environment | 1970 |
| Ministry of Works. 1871–1971 | 1971 |
| Evolution of social security in New Zealand | 1972 |
| Evolution of New Zealand dairy industry 1871–1971 | 1972 |
| Development of the meat industry 1922–72 | 1973 |
| New Zealand membership of the Organisation for Economic Co-operation and Development | 1973 |
| Tenth British Commonwealth Games 1974 | 1973 |
| New Zealand Ports and Shipping Developments | 1974 |
| Revision of Consumers Price Index 1974 | 1975 |
| Household Sample Survey 1973–74 | 1975 |
| Input-output analysis: an abacus for economists | 1975 |
| Tourism: the invisible export | 1976 |
| One hundred years of Lands and Survey | 1976 |
| Royal Visit 1977 | 1977 |
| New Zealand at the turning point | 1977 |
| Education in the New Zealand community | 1977 |
| Abbreviations, contractions, and acronyms | 1978 |
| General Price Index | 1978 |
| Abbreviations, contractions, and acronyms (revised) | 1979 |
| The child and learning in a multi-cultural society | 1979 |
| The New Zealand environment and changes in environmental management since 1970 | 1980 |
| Life tables: a measure of life expectancy | 1980 |
| Golden Fleece: The evolution of the New Zealand wool industry | 1981 |
| Consumers Price Index 1980 revision | 1981 |
| General Election 1981 | 1982 |
| A Century of Meat Exports | 1982 |
Photographic supplements published since 1970 are listed below. A capital C following the subject denotes a colour supplement.
| Subject | Yearbook |
|---|---|
| A Century of Public Works 1871–1971 | 1971 |
| New Zealand Environment | 1972 |
| Leisure in New Zealand | 1973 |
| Tenth British Commonwealth Games (C) | 1974 |
| Vista of Colourful New Zealand (C) | 1975 |
| Seeing New Zealand—Then and Now (C) | 1976 |
| New Zealand's Primary Industries (C) | 1977 |
| New Zealand from the air (C) | 1978 |
| New Zealand Children (C) | 1979 |
| Power for New Zealand (C) | 1980 |
| New Zealand Development Assistance (C) | 1981 |
| Antarctica (C) | 1982 |
Table of Contents
The Department of Statistics is New Zealand's largest producer and disseminator of statistical information. It provides data on many aspects of economic and social activity in our society and this information is available to people in business, central and local government, special interest groups, and the public at large. The principal method of dissemination up to now has been the publication of statistical tables and series in printed reports, bulletins, and news releases.
Technological developments in computing and the increased analytical capability of users of official statistical data has lead to demands for access to the data in machine-readable form. Many users want to be able to search for statistics of interest, to learn about the origins and relevance of these statistics, to retrieve them, and then perform statistical analyses perhaps with the addition of their own date All this can be done on INFOS (Information Network for Official Statistics), without data processing experience or skills.
Just as microfiche, microfilm, computer printouts, diskettes, and computer tapes have become essential to users of statistics, INFOS is another means of access for users of statistical data.
INFOS is a computerised information system which enables users to analyse and tabulate data through interactive access to a dedicated mainframe computer in the Department of Statistics.
The system provides access to the largest, most comprehensive collection of statistical information on-line in New Zealand and has been specifically designed for people with little or no data processing expertise.
INFOS is available to all sectors throughout New Zealand. For the first time, the private sector has access to a Government department's computing facilities and is offered direct access to data and analytical tools as part of the statistical information service of New Zealand's single largest producer of statistics.
During the 1970s the statistical databank needs of central government policy departments were met by a system called CISS (Computerised Information Storage System).
CISS was a time series database developed by the Treasury in the early 1970s, and was expanded and operated by the Department of Statistics until it was replaced by INFOS in 1982. Access was limited, by policy and by the technology then available, to the department's own staff and those of a few other Government departments. The system worked well, but by 1979 it was obvious that there needed to be a thorough evaluation of the purpose and mode of operation of CISS.
An internal study of the Department of Statistics, accompanied by some market research of potential customers, showed that there was a need to greatly extend the range of data available in CISS and to make the facilities more comprehensible to users unfamiliar with computers.
In order to provide access to all sectors of the community, while still preserving the sensitive unit record data, a separate computer for the database system was required. As a result tenders were called for and an IBM 4331/2 was installed in the department's Wellington office in December 1981. Since that time a network linking the department's offices in Auckland, Christchurch and Dunedin has been put in place. Individual links have also been made to Government computer networks and some private sector organisations.
New software was also required. The original CISS programmes were by 1981 out of date and hard to maintain. A review of overseas systems indicated no ready solutions. Some other central statistical agencies had systems running but they also suffered from many of the deficiencies of CISS. The department decided to tackle the software development on its own, building in as much externally available software as possible, provided that these products could be guaranteed for reliability, documentation, and continued support. To mark the change the new system was named INFOS.
Development of the software was started early in 1981. The major burden of the development fell on a small number of Department of Statistics' staff. Foremost amongst these was Gavin Tiplady, Senior Programmer of the INFOS project. He created largely by himself the central INFOS software product, AML (A Macrocommand Language). Procedures written in this language allow users to interrogate the database and retrieve statistical data. More sophisticated users can write their own AML procedures to perform more complicated tasks. Extensions to AML are seen as a continuing development. AML links to SAS (Statistical Analysis System), a package designed to give users the opportunity to perform complex statistical data manipulations and produce high quality colour graphics. This link is particularly important as it opens up expanding analysis and presentation routines to INFOS users. AML contains a simple set of basic procedures for users with more modest needs, including the routines used by departmental staff for keeping the data up to date.
INFOS was officially released in October 1982 with a database of 12 000 statistical series. The database has been progressively expanded since that time and by mid-1984 contained over 300 000 series. This expansion will continue for several years as users' demands are fully established.
Since the October 1982 release of INFOS a number of new facilities have been added to the system, including an interactive index, a textual documentation system giving details of the methodology and history of statistical surveys, and an option allowing users to obtain the latest copy of tables from certain departmental publications. The department has since October 1979 produced the Monthly Abstract of Statistics using the computerised database, firstly CISS and from January 1983 INFOS.
INFOS does undoubtedly reduce costs and improve productivity for some users. These are individuals who use data regularly, either in analyses of a recurrent nature or in undertakings that require trend analyses, projections or modelling. They include corporate planners, financial modellers, investment and market analysts, public and private sector economists, statisticians and researchers, as well as labour organisations and publishers of statistics.
For these people the response of the INFOS system and the accuracy and timeliness of its readily available data, serves to increase the effectiveness of their work.
Users benefit from:
The elimination of the need to gather and put data into a machine-readable form themselves;
Ready access to a wide range of unpublished but available data;
A range of edit checks which ensure reliability and accuracy;
Data being available on INFOS simultaneously with public release;
Proposed nationwide access to INFOS;
Access to current and well-known serviced software for the manipulation and presentation of data. Other software developments will be incorporated in the system as they prove useful.
INFOS can be used by people with widely varying skills and experience, from those who will operate tailor-made AML menus, through to those who wish to use the full range of SAS commands.
Full training and documentation is available to new users. The INFOS system is also backed up by an effective user liaison service, extensive training, a comprehensive Users Guide and supporting documentation.
A user-oriented language called AML, operated by either menus or simple commands, carries out data retrieval and analysis. AML makes INFOS very easy to use, and the facilities provided to users include:
Displaying and printing of data;
Simple graphics;
Commonly used transformations;
An arithmetic processor;
Menu panels to make the system easy to use;
An interactive index of statistics on the database;
Textual information on survey details and methodology of official statistical collections; (h) A private database for the storage of users' own data.
The INFOS system also provides ready access to specialised software packages for:
Statistical analysis and colour graphics through a link to SAS;
Table Production through links to TGS (the Department's own time-series Table Generating System) and the U.S. Bureau of Labour Statistics' TPL (Table Producing Language) package;
Report writing through the SCRIPT package;
A facility for producing the latest copies of tables from specific departmental publications.
Authorised users of INFOS to date include;
Government departments;
Quasi-government organisations;
Banks;
Financial institutions;
Private enterprise companies;
Research organisations;
Universities;
Libraries.
The INFOS database already contained over 300 000 statistical series in July 1984. The database will be continually expanded, until the complete range of detailed data includes:
National accounts (gross domestic product, external transactions, capital formation, etc.);
Economic indicators (retail trade, building permits, etc.);
Economic census data (manufacturing, agriculture, distribution, etc.);
Price indexes (consumers, producers, capital expenditure);
Wage indexes (nominal, prevailing);
Employment (Department of Labour's quarterly survey);
Unemployment (occupations sought, job creation programmes, etc.);
Demographic data (births, deaths, population projections, etc.);
Population data (area unit regional data from the Census of Population and Dwellings plus time-series going back to 1926 for key statistics);
External trade data (exports and imports at the seven digit SITC level by country);
Migration (arrivals and departures);
Financial indicators (exchange rates, overseas exchange transactions, money supply, source of mortgages, etc.);
Balance of payments;
Transport (freight carried, civil aviation, motor vehicle licensing, etc.);
Production (meat slaughtering, food production, textiles, timber, etc.);
Energy (electricity generation, coal, gas and petroleum production, etc.).
The 1984–85 database expansion programme includes increasing the range of detailed data from the following surveys:
Building permits;
Quarterly employment survey;
Census of Population and Dwellings electoral district statistics;
Agricultural census;
Reserve Bank surveys and OECD statistics.
The INFOS Data Directory (a hard-copy index) gives the contents of the database with detailed breakdowns of all the above categories. Copies of the Data Directory can be obtained from the Department of Statistics.
As mentioned above, a separate dedicated computer has been provided by Government for the INFOS system. The INFOS computer, an IBM 4331 with 4 megabytes of memory, is situated in Wellington and runs under VM/CMS. There are links to 2 other major networks as well as an independent network between the Department of Statistics' offices.
From the end of 1984, Christchurch users will be able to access INFOS by linking to the Christchurch office of the Department of Statistics. A similar facility for Auckland users is planned for 1985.
It is proposed to upgrade the INFOS computer in early 1985 to handle the increased demands of new and existing private and public sector users.
Access to the INFOS computer may be by either Post Office leased line or dial-up through the Datel System. Users require equipment capable of emulating the IBM 3270 full screen protocol with SNA or SDLC communications capabilities. A wide range of equipment manufacturers provide software to make this link possible.
Various line speeds can be supported with direct connections but only 2400 b.p.s. is possible with the dial-up link.
A number of personal computers and other equipment have been successfully linked to INFOS and proved capable of utilising all facilities. The Department of Statistics' systems programmers are always willing to investigate possible links to any equipment for prospective users.
Charges for use of INFOS have been designed to provide an appropriate rate of return on the government's investment in computing facilities, and are made up of the following components:
Disk storage charge per megabyte per month (a fixed charge);
Connection fee for every hour logged on;
Machine charge for the amount of CPU time used;
A royalty of 30 percent for CPU time is also charged for use made of the SAS package. This royalty is passed on to the SAS Institute.
As the range of statistical data available to users from other media is increased, perhaps by microfiche, access to microdata files, or other databases, INFOS will provide users with details on these enhancements, and it will become an increasingly important part of the New Zealand official statistical system.
As many organisations have long lead times in planning facilities, the Department of Statistics advises users and intending users of INFOS of planned development at an early stage by way of its regular INFOS Newsletters. Two such planned developments are:
A videotex-like facility, planned to be accessible to users, containing a range of up-to-the-minute analyses of key indicators, showing trends of national interest. This facility will be developed as users and departmental staff provide new analyses of wider public interest. It will contain both graphs and tables.
INFOS has recently been acquired by the Australia Bureau of Statistics, who are now sharing the future development of INFOS. It is expected that INFOS will be available on the Australian CSIRONET public network by early 1985.
INFOS users logon to the Department of Statistics INFOS computer from their terminal. The following menu panel then appears and users enter their choice:
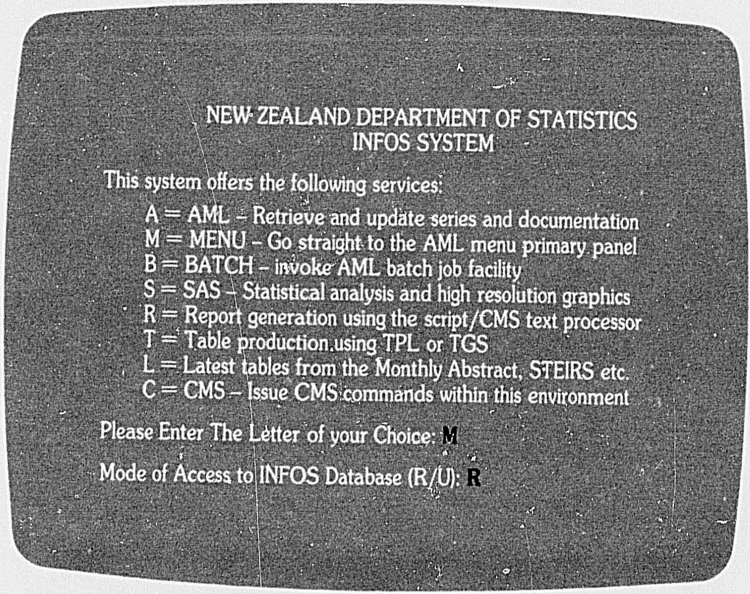
If the user enters “M” the following panel will appear:
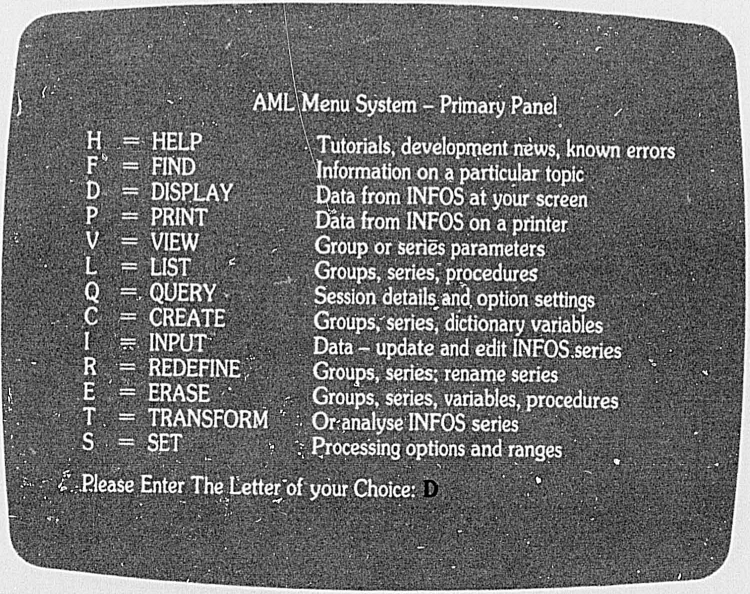
By selecting “D” the user gets another panel asking for the type of DISPLAY required:
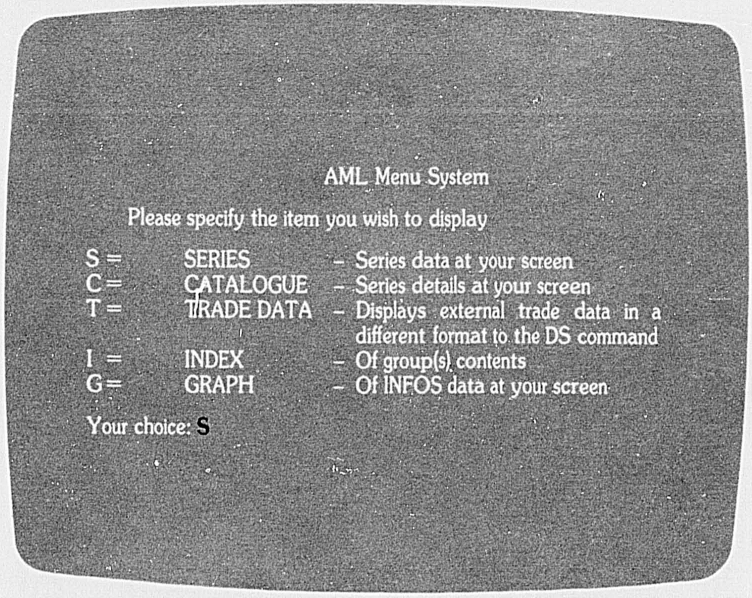
Assuming that the users know the series code they may choose “S” and a further panel will appear requesting the series code.

By entering the series code as indicated the following screen would appear:
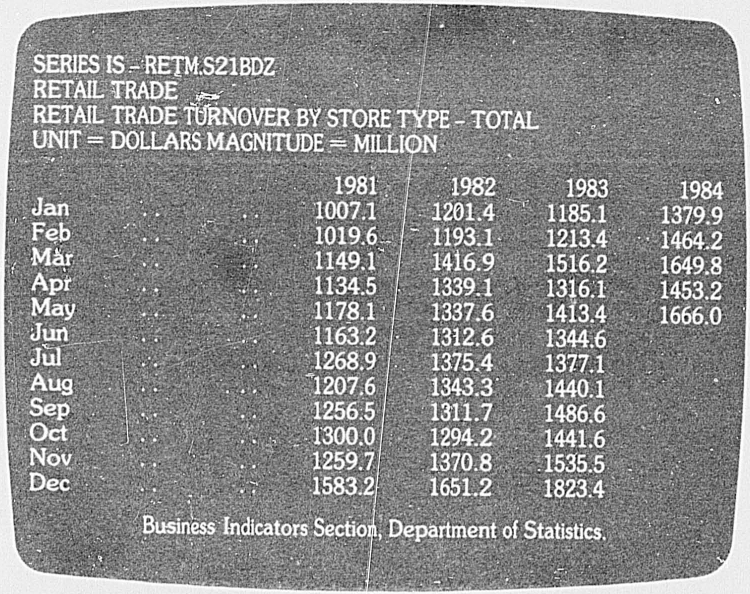
Users may perform simple transformations on the data held within the series by selecting option “T” in the AML Primary Panel. The following transformation panel would then appear:
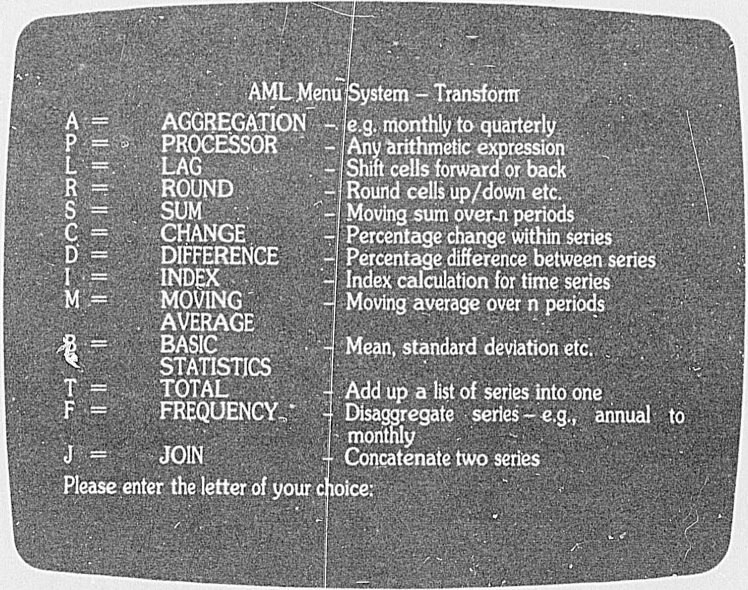
Table of Contents
Later statistical information has become available during the course of printing the Yearbook. Some of these statistics are entered in the Statistical Summary (pp. 961–974). Other information is given in the following pages. Readers are referred to the Monthly Abstract of Statistics and the frequent Information Service releases of the Department of Statistics for the most recent information on many statistical series.
Population—The following table shows the total and Maori population by sex at the end of the latest available quarters.
| Quarter Ended | Total Population | Maori Population | ||||
|---|---|---|---|---|---|---|
| Males | Females | Total | Males | Females | Total | |
| (000) | (000) | |||||
| 1983-Dec | 1 625.2 | 1 644.3 | 3 269.5 | 145.1 | 144,2 | 289.3 |
| 1984-Mar | 1 621.5 | 1 644.0 | 3 265.5 | 145.7 | 144.6 | 290,3 |
| Jun | 1 605.7 | 1 627.0 | 3 232.7 | 145.3 | 144.6 | 290.4 |
Unemployment—The following table shows the numbers of registered unemployed and those on special work during recent months.
| Period | Registered Unemployed | Employed on Special Work | Private Sector Job Creation Programme | |||
|---|---|---|---|---|---|---|
| Males | Females | Total | With Government Depts. | With Local Authorities* | ||
| * Includes community organisations. | ||||||
| End of month— | ||||||
| 1984-January | 50,561 | 33,036 | 83,597 | 3,959 | 19,574 | 24,593 |
| February | 46,727 | 30,771 | 77,498 | 3,446 | 17,928 | 19,561 |
| March | 41,264 | 26,988 | 68,252 | 3,512 | 17,941 | 17,083 |
| April | 39,701 | 25,881 | 65,582 | 3,404 | 17,530 | 17,515 |
| May | 38,535 | 24,292 | 62,827 | 3,422 | 17,790 | 18,068 |
| June | 40,967 | 24,088 | 65,055 | 3,986 | 18,822 | 18,856 |
| July | 42,060 | 23,147 | 65,207 | 3,994 | 18,868 | 18,859 |
| August | 41,593 | 21,824 | 63,417 | 3,974 | 19,276 | |
Social Welfare—The total number of social welfare cash benefits in force at 31 March 1984 was 1 097 730. Details of the types of social welfare benefits in force and expenditure on cash benefits is shown in the following table.
| Benefit | Year Ended 31 March 1984 | |
|---|---|---|
| Number in Force | Expenditure | |
* Includes special benefits. † Gross expenditure is shown for these benefits. In the year ended 31 March 1984 a total of $9.1 million was received in maintenance for deserted wives and domestic purposes beneficiaries and related emergency beneficiaries. A total of $21.2 million was collected under the Liable Parent Contribution Scheme. | ||
| No. | $(000) | |
| National superannuation | 451,128 | 2,526,031 |
| Widows* | 13,921 | 71,295 |
| Domestic purposes | 53,144 | 380,836† |
| Orphans | 384 | 1,186 |
| Family | 499,365 | 289,689 |
| Invalids | 20,187 | 87,410 |
| Miners | 13 | 78 |
| Unemployment | 50,136 | 315,849 |
| Sickness | 9,452 | 62,212 |
| Total | 1,097,730 | 3,734,586 |
The following table shows permanent and long-term arrivals and departures by occupation during the 2 latest March years.
| Occupational Division | Year Ended March 1983 | Year Ended March 1984 | ||
|---|---|---|---|---|
| Arrivals | Departures | Arrivals | Departures | |
| * Included in above. | ||||
| Professional, technical, and related workers | 961 | 1,000 | 939 | 911 |
| Administrative and managerial workers | 3,892 | 4,771 | 3,324 | 3,645 |
| Clerical and related workers | 7,908 | 7,382 | 6,797 | 6,591 |
| Sales workers | 1,351 | 1,663 | 1,164 | 1,348 |
| Agricultural, animal husbandry, and forest workers, fishermen and hunters | 1,047 | 1,139 | 937 | 975 |
| Production and related workers, transport equipment operators, and labourers | 7,730 | 8,117 | 6,364 | 5,457 |
| Service workers | 1,808 | 2,136 | 1,647 | 1,736 |
| Occupations not classifiable or unspecified | 1,305 | 1,085 | 1,328 | 825 |
| Not actively engaged | 19,852 | 15,381 | 18,205 | 12,659 |
| Total | 45,854 | 42,674 | 40,705 | 34,147 |
| Net gain | 3 180 | 6 558 | ||
| Actively Engaged* | ||||
| Total | 26,002 | 27,293 | 22,500 | 21,488 |
| Net loss | −1291 | +1012 | ||
Manufacturing Main Indicators—This series of indicators, which is published quarterly, is based on a sample survey of approximately 1500 firms. The survey was revised in June 1982.
| Year Ended March | Sales | Stocks | Additions to Fixed Assets | |
|---|---|---|---|---|
| Materials | Finished Goods* | |||
| * Includes work in progress. | ||||
| $(million) | ||||
| 1981 | 15,188.8 | 1,501.9 | 1,391.2 | 746.5 |
| 1982 | 18,936.9 | 1,716.6 | 1,595.3 | 1,383.3x |
| 1983 | 20,660.6 | 1,845.2 | 1,714.6 | 2,323.8x |
| 1984 | 21,896.4 | 1,923.1 | 1,630.6 | 2,430.0 |
| Year Ended March | Salaries and Wages | Purchases and Other Operating Expenses† | Hours Worked |
|---|---|---|---|
| †Includes all other operating expenses interest, bad debts, and donations. | |||
| $(million) | (000) | ||
| 1981 | 3,229.8 | 11,133.6 | 529,322 |
| 1982 | 3,931.7 | 13,886.5 | 540,639 |
| 1983 | 4,270.4 | 15,135.8 | 533,302 |
| 1984 | 4,179.1 | 15,872.1 | 511,055 |
Retail Trade—
Details of retail sales and retailers' stocks by store-type group are shown in the table following.
| Store-type Group | Retail Stocks | Retail Sales | ||
|---|---|---|---|---|
| As at | Quarter Ended | |||
| 31 March 1984 | 30 June 1984 | 31 March 1984 | 30 June 1984 | |
| * Includes accommodation not included under licensed accommodation, valued at $48.7m for the quarter ended 31 March 1984, and $40.2m for the quarter ended 30 June 1984. | ||||
| $(million) | ||||
| Butcher | 8.8 | 8.7 | 99.4 | 106.6 |
| Supermarket/grocer | 165.4 | 160.7 | 722.2 | 738.3 |
| Other food | 6.2 | 6.5 | 53.7 | 50.8 |
| Footwear | 79.3 | 77.4 | 48.8 | 62.3 |
| Clothing and textiles | 191.6 | 183.5 | 146.7 | 184.2 |
| Furniture | 117.3 | 119.1 | 147.9 | 159.5 |
| Household appliances | 99.0 | 111.1 | 155.2 | 164.8 |
| Hardware | 56.5 | 59.0 | 71.7 | 70.0 |
| Chemist | 62.1 | 64.7 | 104.8 | 104.5 |
| Department and general | 221.4 | 225.8 | 228.7 | 274.8 |
| Automotive, fuel and repairs | 610.5 | 625.4 | 1,819.7 | 1,867.3 |
| Restaurants and takeaways | 17.2 | 18.1 | 180.0 | 193.4 |
| Liquor including licensed accommodation | 78.4 | 81.4 | 367.5 | 367.3 |
| Other stores | 260.6 | 273.2 | 299.0 | 295.7 |
| Total, all retail stores | 1,974.2 | 2,014.6 | 4,493.9* | 4,679.7* |
| Total, seasonally adjusted | 1,972.4 | 2,024.1 | 4,665.5 | 4,775.0 |
| Wholesale Trade— | ||||||
|---|---|---|---|---|---|---|
| Period | Food and Drink | Apparel | Furniture | Automotive | Hardware | Chemicals |
| Quarter ended— | $(million) | |||||
| 1984— | Sales or Turnover | |||||
| 31 March | 707.8 | 171.3 | 84.7 | 342.6 | 314.2 | 205.8 |
| 30 June | 836.7 | 184.6 | 106.0 | 385.1 | 332.5 | 218.5 |
| As at— | ||||||
| 1984— | Value of Wholesalers' Stocks | |||||
| 31 March | 273.1 | 126.3 | 87.2 | 178.6 | 237.6 | 145.5 |
| 30 June | 275.1 | 131.1 | 88.9 | 187.3 | 243.1 | 141.4 |
| Period | General Merchants | Machinery | Electrical Supplies | Paper and Stationery | Miscellaneous | Total | |
|---|---|---|---|---|---|---|---|
| Actual | Seasonally Corrected | ||||||
| Quarter ended | $(million) | ||||||
| 1984— | Sales or Turnover | ||||||
| 31 March | 170.7 | 151.3 | 63.8 | 89.3 | 501.5 | 2,803.0 | 2,968.0 |
| 30 June | 170.3 | 154.7 | 74.4 | 88.0 | 487.1 | 3,038.0 | 3,031.9 |
| As at— | |||||||
| 1984— | Value of Wholesalers' Stocks | ||||||
| 31 March | 92.5 | 151.8 | 53.2 | 46.6 | 237.1 | 1,629.3 | |
| 30 June | 91.3 | 162.4 | 53.6 | 51.8 | 240.2 | 1,666.1 | |
Exports and Imports—The following table shows the values of exports and imports during the 3 latest June years. Exports are valued f.o.b. (free on board) and imports v.f.d. (value for duty).
| Class of Commodity | Year Ended June | |||
|---|---|---|---|---|
| 1982x | 1983 | 1984* | ||
| * Provisional. | ||||
| $(million) | ||||
| Value of Exports (f.o.b.) | ||||
| Food and live animals, beverages, and tobacco— | ||||
| Meat and meat preparations | 1,564.1 | 1,870.7x | 1,722.4 | |
| Dairy produce and eggs | 1,149.8 | 1,291.0x | 1,217.4 | |
| Total (including other commodities) | 3,369.2 | 3,988.9 | 4,046.9 | |
| Crude materials (inedible) except fuels | 1,474.0 | 1,622.8 | 1,792.5 | |
| Mineral fuels, lubricants, and related materials, animal and vegetable oils and fats | 71.4 | 82.7x | 97.9 | |
| Chemicals | 274.7 | 307.6x | 347.8 | |
| Manufactured goods classified chiefly by material | 879.9 | 966.9x | 1,253.3 | |
| Other manufactures and miscellaneous | 458.7 | 534.1x | 827.9 | |
| Total of New Zealand produce | 6,604.6x | 7,502.9x | 8,366.3 | |
| Re-exports | 335.6x | 432.5x | 257.7 | |
| Total exports | 6,940.3x | 7,935.4x | 8,624.0 | |
| Value of Imports (v.f.d.) | ||||
| Food and live animals, beverages, and tobacco | 415.9 | 366.2x | 442.1 | |
| Crude materials (inedible) except fuels; animal and vegetable oils and fats | 345.6 | 343.3x | 457.2 | |
| Mineral fuels, lubricants, and related materials | 1,285.0 | 1,343.7x | 1,214.8 | |
| Chemicals | 828.3x | 733.4x | 958.2 | |
| Machinery and electrical equipment | 1,326.1 | 1,585.9x | 1,883.9 | |
| Transport equipment | 865.5 | 548.1x | 843.1 | |
| Iron, steel, and non-ferrous metals | 533.7 | 447.7x | 572.1 | |
| Textiles, clothing, and footwear | 466.8 | 456.1x | 559.6 | |
| Other manufactures and miscellaneous | 977.9 | 971.7x | 1,255.9 | |
| Total merchandise imports | v.f.d. | 7,044.8 | 6,928.2x | 8,136.9 |
| c.i.f. | 7,600.4 | 7,595.8x | 9,008.2 | |
Principal Exports and Imports—Some of the principal exports and imports are shown by value and volume in the following table. Figures of volume are in thousand tonnes unless otherwise indicated.
| item | Year Ended June | |||
|---|---|---|---|---|
| 1983x | 1984* | |||
| Volume | Value | Volume | Value | |
* Provisional. †Number. ‡Bars. rods, plates, sheets, tubes, pipes, and all other shapes, sections, and fittings. | ||||
| tonnes(000) | $(000) | tonnes(000) | $(000) | |
| Meat, fresh, chilled, or frozen— | Exports | |||
| Beef and veal | 263.9 | 792.1 | 186.7 | 634.8 |
| Lamb | 432.1 | 904.3 | 429.1 | 869.0 |
| Mutton | 73.5 | 88.8 | 94.2 | 124.6 |
| Total, incl. other items | 1,867.8 | 1,705.0 | ||
| Meat, fresh, chilled, or frozen— | Exports | |||
| Dairy produce— | ||||
| Skimmed milk powder | 144.1 | 191.2 | 158,0 | 184.1 |
| Butter | 228.8 | 660.6 | 190.5 | 562.4 |
| Cheese | 75.6 | 193.6 | 96.3 | 235.9 |
| Total, incl. other items | 1,290.8 | 1,213.9 | ||
| Hides, skins, and furskins | 185.5 | 200.1 | ||
| Wool | 322.5 | 1,019.3 | 308.2 | 1,113.3 |
| Wood pulp | 451.6 | 161.5 | 483.9 | 188.3 |
| Other forest products | 332.6 | 343.3 | ||
| Fruit and vegetables | 261.5 | 405.2 | ||
| Casein | 55.1 | 199.2 | 58.0 | 198.5 |
| Aluminium and aluminium alloys | 171.0 | 294.9 | 235.0 | 466.8 |
| Petroleum— | Imports | |||
| Crude | 1 105.8 | 409.9 | 1 551.2 | 544.6 |
| Partly refined | 201.3 | 88.4 | 182.9 | 74.5 |
| Motorcars (unassembled)† | 48,136 | 180.9 | 86,210 | 378.5 |
| Iron and steel‡ | 444.0 | 299.3 | 548.6 | 381.7 |
Retail Prices—The following table shows monthly index numbers for the food group of the Consumers Price Index (CPI) and its subgroups. Food is the only commodity group for which prices are surveyed each month.
Prices for the full Consumers Price Index, which in addition to food covers housing, household operation, apparel, transportation, and miscellaneous items, are surveyed each quarter.
| CONSUMERS PRICE INDEX—ALL FOOD GROUP | ||||||
|---|---|---|---|---|---|---|
| Base: December Quarter 1983 (= 1000) | ||||||
| Month | Fruit and Vegetables | Meat, Fish and Poultry | Other Food | All Food | Percentage change: all food group | |
| Each Month on Previous Month | Each Month on same Month of Previous Year | |||||
| % | % | |||||
| 1983-Aug | 979 | 978 | 993 | 988 | +1.0 | +3.0 |
| Sep | 1001 | 996 | 995 | 997 | +0.9 | +3.4 |
| Oct | 986 | 999 | 998 | 998 | +0.1 | +3.8 |
| Nov | 984 | 1006 | 1000 | 1000 | +0.2 | +4.1 |
| Dec | 1030 | 994 | 1000 | 1004 | +0.4 | +4.4 |
| 1984-Jan | 1020 | 994 | 1003 | 1004 | – | +3.7 |
| Feb | 977 | 988 | 1006 | 997 | −0.7 | +2.6 |
| Mar | 979 | 992 | 1014 | 1003 | +0.6 | +4.0 |
| Apr | 1008 | 996 | 1027 | 1016 | +1.3 | +5.0 |
| May | 1025 | 997 | 1037 | 1025 | +0.9 | +5.5 |
| Jun | 1011 | 998 | 1048 | 1030 | +0.5 | +5.5 |
| Jul | 985 | 1002 | 1066 | 1038 | +0.8 | +6.2 |
| Aug | 1006 | 1025 | 1077 | 1054 | +1.5 | +6.7 |
Consumers Price Index figures for all groups for the latest available quarters are set out in the following table.
| CONSUMERS PRICE INDEX — ALL GROUPS | |||
|---|---|---|---|
| Base: Weighted average 25 centres, December Quarter 1980 (= 1000) | |||
| Group or Subgroup | December Quarter 1983 | Quarter Ended | |
| March 1984 | June 1984 | ||
| Food— | |||
| Fruits and vegetables | 1000 | 992 | 1014 |
| Meat, fish and poultry | 1000 | 991 | 997 |
| Other foods | 1000 | 1008 | 1037 |
| All foods | 1000 | 1001 | 1024 |
| Housing— | |||
| Rentals | 1000 | 1026 | 1057 |
| Home ownership | 1000 | 1012 | 1040 |
| Housing | 1000 | 1014 | 1043 |
| Household operation— | |||
| Fuel and light | 1000 | 1000 | 1026 |
| Household furnishing | 1000 | 1003 | 1008 |
| Household supplies and services | 1000 | 1001 | 1009 |
| Household operation | 1000 | 1002 | 1011 |
| Apparel— | |||
| Clothing | 1000 | 1002 | 1012 |
| Footwear | 1000 | 1001 | 1020 |
| Apparel | 1000 | 1002 | 1014 |
| Transportation— | |||
| Public transport | 1000 | 1000 | 1003 |
| Private transportation | 1000 | 1016 | 1041 |
| Transportation | 1000 | 1014 | 1034 |
| Miscellaneous— | |||
| Tobacco and alcohol | 1000 | 1002 | 1017 |
| Other supplies | 1000 | 1003 | 1036 |
| Other services | 1000 | 1010 | 1065 |
| Miscellaneous | 1000 | 1005 | 1035 |
| All groups | 1000 | 1007 | 1029 |
The level of prices as measured by the All Groups Consumers Price Index for the June 1984 quarter was 2.2 percent above that for the March 1984 quarter. This followed increases of 0.8, 0.9, and 0.7 percent for the third and fourth quarters of 1983 and the first quarter of 1984 respectively. Comparison with June quarter 1983 shows that over the year the level of consumer prices rose by 3.5 percent.
Producers Price Index—The Producers Price Index shows that the level of prices of inputs of goods and services (excluding labour) paid in June 1984 quarter by all industries in the economy was 4.0 percent higher than it was a year previously. This compares with a rise of 3.4 percent between the March quarters of 1983 and 1984. The following table shows the 2 latest quarters.
| PRODUCERS PRICE INDEX | ||||||||
|---|---|---|---|---|---|---|---|---|
| Base: December Quarter 1982 (=1000) Indexes in this series are centred on the mid-point of the period shown. | ||||||||
| Industry Group | Quarter Ended | |||||||
| 30 Sep 1983 | 31 Dec 1983 | 31 Mar 1984 | 30 Jun 1984 | |||||
| Inputs | Outputs | Inputs | Outputs | Inputs | Outputs | Inputs | Outputs | |
| Agriculture | 1028 | 1096 | 1033 | 1097 | 1048 | 1102 | 1095 | 1119 |
| Fishing and hunting | 1014 | 1068 | 1027 | 1123 | 1031 | 1131 | 1055 | 1190 |
| Forestry and logging | 1006 | 1075 | 1010 | 1072 | 1012 | 1062 | 1048 | 1224 |
| Mining and quarrying | 1008 | 991 | 1012 | 985 | 1011 | 983 | 1033 | 1007 |
| Food, beverages, and tobacco | 1061 | 1056 | 1068 | 1065 | 1082 | 1074 | 1098 | 1086 |
| Primary food processing | 1078 | 1073 | 1083 | 1082 | 1095 | 1092 | 1115 | 1102 |
| Other food processing | 1005 | 1012 | 1017 | 1021 | 1034 | 1028 | 1039 | 1045 |
| Textiles, wearing apparel, and leather industries | 1044 | 1020 | 1063 | 1035 | 1085 | 1046 | 1098 | 1069 |
| Manufacture of wood and wood products, including furniture | 1016 | 998 | 1018 | 1000 | 1014 | 1001 | 1049 | 1037 |
| Manufacture of paper and paper products, printing and publishing | 1001 | 1002 | 1003 | 1006 | 1004 | 1007 | 1016 | 1026 |
| Manufacture of chemicals and of chemical, petroleum, coal, rubber, and plastic products | 1016 | 997 | 1010 | 991 | 1012 | 1005 | 1012 | 1012 |
| Manufacture of non-metallic mineral products except products of petroleum and coal | 1022 | 1016 | 1023 | 1018 | 1022 | 1023 | 1037 | 1037 |
| Basic metal industries | 1025 | 1028 | 1022 | 1041 | 1028 | 1074 | 1051 | 1081 |
| Manufacture of fabricated metal products, machinery, and equipment | 1042 | 1018 | 1057 | 1031 | 1069 | 1045 | 1089 | 1074 |
| Other manufacturing industries | 1013 | 1011 | 1009 | 1008 | 1013 | 1010 | 1035 | 1038 |
| Electricity, gas, and water | 1003 | 1004 | 1004 | 1003 | 1005 | 1003 | 1050 | 1042 |
| Construction | 1012 | 1019 | 1016 | 1025 | 1022 | 1030 | 1039 | 1054 |
| Trade, restaurants and hotels | 1013 | 1029 | 1018 | 1031 | 1019 | 1039 | 1035 | 1072 |
| Wholesale and retail trade | 1009 | 1034 | 1012 | 1036 | 1014 | 1044 | 1033 | 1074 |
| Hotels, restaurants, and takeaways | 1020 | 1007 | 1033 | 1014 | 1033 | 1019 | 1040 | 1066 |
| Transport and storage | 1006 | 1011 | 1013 | 1011 | 1012 | 1006 | 1027 | 1017 |
| Road transport | 1004 | 1003 | 1002 | 1003 | 1000 | 1003 | 1020 | 1036 |
| Other transport | 1006 | 1015 | 1018 | 1015 | 1017 | 1008 | 1030 | 1007 |
| Communications | 1008 | 1000 | 1008 | 1000 | 1005 | 1000 | 1022 | 1000 |
| Financing, insurance, real estate, and business services | 1022 | 1036 | 1019 | 1080 | 1031 | 1095 | 1054 | 1121 |
| Ownership of owner-occupied dwellings | 1015 | 1019 | 1021 | 1029 | 1033 | 1062 | 1063 | 1099 |
| Community, social, and personal services | 1015 | 1010 | 1019 | 1018 | 1019 | 1021 | 1039 | 1066 |
| Central Government services | 1022 | 1027 | 1036 | 1063 | ||||
| Local Government services | 1027 | 1034 | 1040 | 1062 | ||||
| Private non-profit services to households | 1004 | 1012 | 1016 | 1039 | ||||
| All manufacturing | 1036 | 1024 | 1044 | 1031 | 1053 | 1042 | 1068 | 1060 |
| All marketing | 1025 | 1030 | 1031 | 1038 | 1038 | 1046 | 1058 | 1070 |
| All industry | 1025 | 1031 | 1038 | 1058 | ||||
The following table shows index numbers for the first 2 quarters of 1984. It should be noted that the index numbers relate to the price levels ruling at the mid-point of each quarter.
| CAPITAL EXPENDITURE PRICE INDEX | ||
|---|---|---|
| Base: December Quarter 1979 (= 1000) | ||
| Capital Asset | Quarter Ended | |
| Mar 1984 | Jun 1984 | |
| Residential buildings— | ||
| Houses, flats, garages | 1701 | 1762 |
| Hostels | 1657 | 1698 |
| Non-residential buildings— | ||
| Commercial buildings | 1630 | 1666 |
| Factories | 1656 | 1690 |
| Hospitals, rest homes | 1644 | 1675 |
| Educational buildings | 1648 | 1697 |
| Motels, hotels | 1639 | 1676 |
| Farm buildings | 1641 | 1647 |
| Other construction— | ||
| Transport ways | 1730 | 1781 |
| Pipelines | 1588 | 1628 |
| Electrical works | 1478 | 1507 |
| Earthmoving and site work | 1649 | 1698 |
| Land improvements— | ||
| Land clearing | 1579 | 1646 |
| Fencing | 1489 | 1490 |
| Irrigation and land drainage | 1575 | 1616 |
| Reclamation and river control | 1624 | 1694 |
| Transport vehicles— | ||
| Cars, less than 1600 c.c. | 1536 | 1590 |
| Cars, 1600 c.c. and over | 1494 | 1523 |
| Commercial vehicles, less than 2500 kg | 1629 | 1690 |
| Commercial vehicles, 2500 kg and over | 1496 | 1554 |
| Buses | 1687 | 1809 |
| Trailers | 1547 | 1613 |
| Motor cycles | 1211 | 1217 |
| Fishing boats | 1736 | 1804 |
| Fixed wing aircraft (light) | 2157 | 2320 |
| Helicopters | 2347 | 2449 |
| Plant, machinery, and equipment— | ||
| Agricultural tractors | 1355 | 1387 |
| Self-propelled harvesting machinery | 1627 | 1667 |
| Other harvesting and mowing machinery | 1420 | 1450 |
| Soil preparation and cultivation machinery | 1538 | 1578 |
| Other agricultural machinery and equipment | 1558 | 1610 |
| Farm motor cycles | 1355 | 1356 |
| Self-propelled construction machinery | 1669 | 1686 |
| Non-propelled construction machinery, quarrying machinery | 1608 | 1677 |
| Food and drink processing machinery | 1531 | 1546 |
| Bottling and packaging machinery | 1655 | 1681 |
| Textile machinery | 1525 | 1546 |
| Woodworking machinery | 1487 | 1528 |
| Printing and publishing equipment | 1435 | 1415 |
| Metal-working machinery | 1486 | 1512 |
| Forklifts and mobile material-handling equipment | 1399 | 1416 |
| Mechanical hoists, conveyors, etc. | 1834 | 1849 |
| Electrical distribution equipment | 1700 | 1733 |
| Electric motors, up to 7 kW (1–9 hp) | 1503 | 1576 |
| Electric motors, 7 kW and over (over 9 hp) | 1426 | 1512 |
| Industrial engines, non-electric | 1491 | 1535 |
| Airconditioning and cooling equipment | 1642 | 1657 |
| Refrigerating equipment | 1349 | 1403 |
| Industrial boilers and heating equipment | 1729 | 1800 |
| Pumping and compressing equipment | 1484 | 1485 |
| Office and shop equipment, electronic | 979 | 977 |
| Office and shop equipment, non-electronic | 1270 | 1251 |
| Office and shop furniture and fittings | 1633 | 1672 |
| Duplicating and photocopying machines | 800 | 800 |
| Scales and weighing machinery | 1172 | 1179 |
| Shipping and transporting containers | 1635 | 1677 |
| Tanks, vats, and storage units | 1551 | 1600 |
| Photographic and optical equipment | 1447 | 1454 |
| Technical and scientific equipment | 1533 | 1542 |
| Medical, dental, and hospital furniture and equipment | 1538 | 1591 |
| Stereo equipment | 930 | 948 |
| Television receivers | 1079 | 1115 |
| Peripheral data processing units | 1259 | 1277 |
| Radio-telephone and telegraphic equipment | 1401 | 1429 |
| Domestic-type furniture and furnishings | 1485 | 1479 |
| Domestic-type appliances | 1433 | 1455 |
| Domestic-type equipment and utensils | 1438 | 1463 |
| Portable power tools | 1421 | 1496 |
| Sport and recreation equipment | 1469 | 1520 |
More information on the methodology of the index is available from the Department of Statistics, to which any queries should be addressed.
Nominal, Prevailing, and Effective Weekly Wage Rates Index—The following table of index numbers of weekly wage rates for adult employees is calculated from all adult rates effective at mid-quarter. It represents all industry and occupation groups. There are two principal indexes of wage rates, together with indexes of effective wage rates based on each.
The Nominal Weekly Rates Index measures changes in the mandatory or, in some cases, minimum rates of wages and salaries, prescribed by wage and salary determining authorities and industrial tribunals, including the Arbitration Court.
The Prevailing Weekly Wage Rates Index refers to the same industrial and occupational groups but measures movements in the actual wages and salaries paid as compared with movements in the mandatory or legal minimum rates applying to the same groups, as measured by the nominal weekly wage rates index. The differences in movements between the nominal and prevailing indexes show “wage drift”, that is, the extent to which actual wages and salaries have risen more than the legally required rates.
An Effective Weekly Wage Index has been derived from each of these series. This effective weekly wage rates index is arrived at by dividing the nominal or the prevailing index by the corresponding consumers price index number and multiplying by 1000. Thus, it relates wages to prices.
Because of possible retrospective increases in wages or salaries in later awards, agreements, determinations, etc., the more recent index numbers should be regarded as provisional.
| NOMINAL. PREVAILING. AND EFFECTIVE WEEKLY WAGE RATES INDEXES—ADULT EMPLOYEES | ||||||
|---|---|---|---|---|---|---|
| Base: December Quarter 1977 (= 1000) | ||||||
| Period | Rates Within the Jurisdiction of the Arbitration Court | Rates Prescribed By Other Industrial Tribunals or Determining Authorities | Rates Within the Jurisdiction of All Determining Authorities | |||
| Index | Percentage Change | Index | Percentage Change | Index | Percentage Change | |
| * Formerly called Index of Effective Nominal Weekly Wages Rates. | ||||||
| Index of Nominal Weekly Wage Rates | ||||||
| December year— | ||||||
| 1981 | 1793 | 19.0 | 1705 | 20.0 | 1760 | 19.4 |
| 1982 | 2018x | 12.5 | 1884 | 10.5 | 1968 | 11.8 |
| 1983 | 2027 | 0.5 | 1885 | 0.1 | 1974 | 0.3 |
| Quarter— | ||||||
| 1984—March | 2027 | – | 1885 | – | 1974 | – |
| June | 2099 | 3.6 | 1929 | 2.3 | 2036 | 3.1 |
| Index of Real Nominal Weekly Wage Rates* | ||||||
| December year— | ||||||
| 1981 | 1100 | 3.2 | 1046 | 4.1 | 1080 | 3.5 |
| 1982 | 1068 | −3.0 | 997 | −4.7 | 1041 | −3.6 |
| 1983 | 998 | −6.5 | 928 | −6.9 | 972 | −6.7 |
| Quarter— | ||||||
| 1984—March | 977 | −0.7 | 909 | −0.7 | 952 | −0.7 |
| June | 991 | 1.4 | 910 | 0.1 | 961 | 0.9 |
| NOMINAL, PREVAILING. AND EFFECTIVE WEEKLY WAGE RATES INDEXES—ADULT EMPLOYEES | ||||||
|---|---|---|---|---|---|---|
| Base: December Quarter 1977 (= 1000) | ||||||
| Period | Rates Within the Jurisdiction of the Arbitration Court | Rates Prescribed By Other Industrial Tribunals or Determining Authorities | Rates Within the Jurisdiction of All Determining Authorities | |||
| Index | Percentage Change | Index | Percentage Change | Index | Percentage Change | |
| * Formerly called Index of Effective Prevailing Weekly Wage Rates. | ||||||
| Index of Prevailing Weekly Wage Rates | ||||||
| December year— | ||||||
| 1981 | 1809 | 18.8 | 1705 | 20.0 | 1772 | 19.2 |
| 1982 | 2042 | 12.9 | 1884 | 10.5 | 1986 | 12.1 |
| 1983 | 2054 | 0.5 | 1885 | 0.1 | 1994 | 0.4 |
| Quarter— | ||||||
| 1984— March | 2054 | – | 1885 | – | 1994 | 0.1 |
| June | 2120 | 3.2 | 1929 | 2.3 | 2052 | 2.9 |
| Index of Real Prevailing Weekly Wages Rates* | ||||||
| December year— | ||||||
| 1981 | 1110 | 2.9 | 1046 | 4.1 | 1087 | 3.4 |
| 1982 | 1080 | −2.6 | 997 | −4.7 | 1051 | −3.4 |
| 1983 | 1011 | −6.5 | 928 | −6.9 | 982 | −6.6 |
| Quarter— | ||||||
| 1983—March | 990 | −0.7 | 909 | −0.7 | 961 | −0.7 |
| June | 1000 | 1.0 | 910 | 0.1 | 968 | 0.7 |
NOTE—This table is derived from the wage rates tables in the Monthly Abstract of Statistics, which should be consulted for the latest figures or any revisions to figures.
Real Disposable Income Measures—The following table measures the impact of changes in the levels of taxation and consumer prices on the purchasing power of various income groups. For further information on Real Disposable Income Indexes refer to Section 34 of this Yearbook.
| Period | Ratio of Disposable to Gross Income Index* | Percentage Change† | Average Gross Income Index* | Percentage Change† | Real Disposable Income Index‡§ | Percentage Change† |
|---|---|---|---|---|---|---|
* Gross income from all sources. †From same quarter in previous year. ‡In dollars of constant (1980–81) purchasing power with respect to the regimen of the Consumers Prices Index. §Balance of gross income after personal income tax liability is deducted. ||Lowest 20 percent of income distribution of full-time wage and salary earners. ¶Provisional. ** Third lowest 20 percent of income distribution of full-time wage and salary earners. ††Highest 20 percent of income distribution of full-time wage and salary earners. | ||||||
| Lowest Income Group|| | ||||||
| 1984—Mar | 975 | −0.1 | 1404 | 3.0 | 966 | −0.5 |
| Jun¶ | 971 | −0.5 | 1450 | 6.2 | 973 | 0.9 |
| Middle Income Groups** | ||||||
| 1984—Mar | 981 | 0.2 | 1412 | 2.9 | 977 | −0.3 |
| June¶ | 978 | −0.3 | 1443 | 5.3 | 974 | 0.2 |
| Highest Income Group†† | ||||||
| 1984—Mar | 1060 | −0.6 | 1425 | 2.9 | 1066 | −1.0 |
| Jun¶ | 1053 | −1.2 | 1439 | 4.1 | 1052 | −1.7 |
Public Account Taxation Receipts—This table shows direct and indirect taxation and include: estimated receipts for the 1983–84 financial year.
| Item | Year Ended 31 March | |
|---|---|---|
| 1983 | 1984* | |
* Actual figures replacing estimates published in previous Yearbook. †Estimated. | ||
| Direct taxation— | $(thousand) | |
| Income tax | 7,455,520 | 7,453,307 |
| Estate and gift duty | 31,820 | 33,052 |
| Land tax | 34,442 | 36,203 |
| Property speculation tax | 6 | 3 |
| Total—Direct taxation | 7,521,788 | 7,522,565 |
| Indirect taxation— | ||
| Customs duty | 511,844 | 606,291 |
| Beer duty | 149,138 | 199,264 |
| Sales tax | 1,211,745 | 1,312,287 |
| Motor spirits duty | 184,410 | 224,068 |
| Racing duty | 57,039 | 62,599 |
| Stamp duties | 75,738 | 91,366 |
| Energy resources levy | 40,217 | 44,153 |
| Motor vehicle fees and charges | 86,123 | 97,441 |
| Mileage tax | 7 | 4 |
| Film hire tax | 1,170 | 1,664 |
| International departure tax | 14,721 | 14,703 |
| Domestic air travel tax | 10,569 | 12,515 |
| Highways taxation | 232,957 | 242,285 |
| Total—Indirect taxation | 2,575,678 | 2,908,640 |
| Total—Taxation receipts | 10,097,466x | 10,431,205 |
Consolidated Account: Expenditure—The Consolidated Account replaced the Consolidated Revenue Account in accordance with the provisions of the Public Finance Act 1977.
| Item | Year Ended 31 March | ||
|---|---|---|---|
| 1982 | 1983 | 1984 | |
| $(thousand) | |||
| Permanent appropriations— | |||
| Under Special Acts of Legislature— | |||
| Civil List | 4,787 | 4,900 | 4,983 |
| Debt services— | |||
| Interest | 1,202,928 | 1,475,792 | 2,014,875 |
| Contribution to Loans Redemption Account | 116,171 | 143,814 | 187,328 |
| Administration and management | 8,112 | 16,822 | 26,977 |
| Total—Debt services | 1,327,211 | 1,636,428 | 2,229,180 |
| Superannuation | 89,583 | 68,975 | 112,901 |
| Miscellaneous | 51,540 | 52,001 | 49,921 |
| Total—Permanent appropriations | 1,473,121 | 1,762,304 | 2,396,985 |
| Annual appropriations— | |||
| Administration— | |||
| General administration— | |||
| Accident Compensation | 99 | 105 | 105 |
| Audit | 5,070 | 5,708 | 6,033 |
| Broadcasting | 155 | 180 | 195 |
| Building Performance Guarantee Corporation | 18 | 19 | 19 |
| Commission for the Environment | 995 | 1,061 | 1,102 |
| Customs | 26,472 | 31,015 | 32,596 |
| Government Life Insurance Corporation | 10 | ||
| Inland Revenue | 60,752 | 67,663 | 68,521 |
| Internal Affairs | 75,473 | 71,641 | 64,621 |
| Legislative | 10,385 | 12,362 | 12,241 |
| Prime Minister's Department | 1,605 | 1,840 | 2,017 |
| Railways | 102 | 102 | |
| State Services Commission | 82,221 | 85,039 | 65,671 |
| Statistics | 24,255 | 16,995 | 16,944 |
| Treasury | 12,135 | 12,842 | 13,047 |
| Valuation | 12,298 | 13,300 | 13,955 |
| Total—General administration | 311,933 | 319,872 | 297,179 |
| Law and order— | |||
| Crown Law | 1,867 | 2,201 | 2,501 |
| Justice | 121,650 | 130,702 | 135,859 |
| Police | 169,374 | 181,223 | 185,703 |
| Security Intelligence Service | 3,879 | 4,426 | 4,377 |
| Total—Law and order | 296,770 | 318,552 | 328,440 |
| Government services— | |||
| Government Printing Office | 35,141 | 6,545 | 7,612 |
| Works and Development | 179,052 | 204,130 | 181,145 |
| Total—Government services | 214,193 | 210,675 | 188,757 |
| Stabilisation— | |||
| Stabilisation | 126,494 | 23,241 | 9,940 |
| Total—Administration | 949,390 | 872,340 | 824,316 |
| Foreign relations— | |||
| Defence— | |||
| Defence | 593,647 | 652,131 | 672,978 |
| Foreign Affairs— | |||
| Foreign Affairs | 142,531 | 168,662 | 174,856 |
| Total—Foreign relations | 736,178 | 820,793 | 847,834 |
| Development of industry— | |||
| Land use— | |||
| Agriculture and Fisheries | 328,681 | 526,325 | 792,957 |
| Forest Service | 236,084 | 258,833 | 281,493 |
| Lands and Survey | 124,426 | 131,357 | 143,569 |
| Maori Affairs | 31,467 | 33,595 | 36,922 |
| Rural Banking and Finance Corporation | 15,547 | 14,564 | 12,527 |
| Total—Land use | 736,205 | 964,674 | 1,267,468 |
| Fuel and power— | |||
| Energy | 178,508 | 188,877 | 277,230 |
| Other industrial services— | |||
| Labour | 252,070 | 300,753 | 393,342 |
| Scientific and Industrial Research | 82,192 | 94,393 | 99,126 |
| Tourist and Publicity | 19,254 | 19,938 | 25,992 |
| Trade and Industry | 69,172 | 72,963 | 71,604 |
| Total—Other industrial services | 422,688 | 488,047 | 590,064 |
| Total—Development of industry | 1,337,401 | 1,641,598 | 2,134,762 |
| Education— | |||
| Education | 1,503,860 | 1,652,373 | 1,690,488 |
| Social services— | |||
| Housing Corporation | 73,777 | 72,737 | 80,056 |
| Internal Affairs | 7,820 | 6,733 | 4,556 |
| Maori Affairs | 26,420 | 27,712 | 29,350 |
| Social Welfare | 2,990,994 | 3,700,258 | 4,005,658 |
| Total—Social services | 3,099,011 | 3,807,440 | 4,120,120 |
| Health— | |||
| Health | 1,603,118 | 1,767,751 | 1,807,891 |
| Transport and communications— | |||
| Transport | 148,438 | 282,632 | 270,227 |
| Works and Development | 41,810 | 41,762 | 99,548 |
| Communications | 7,213 | 4,989 | 3,989 |
| Total—Transport and communications | 197,461 | 329,383 | 373,764 |
| Total—Annual appropriations | 9,426,419 | 10,891,678 | 11,799,175 |
| Total—Ordinary payments | 10,899,540 | 12,653,982 | 14,196,160 |
| Capital losses or gains on realisation of investments (net) | 1,132 | 6,513 | 17,347 |
| Exchange differences on overseas transactions | 74,304 | 29,711 | 23,319 |
| Unauthorised expenditure | 50,000 | 130 | 88 |
| Transfer to Reserve Account | 100,000 | 308,500 | – |
| Total payments | 11,123,844 | 12,992,323 | 14,219,567 |
N.B. — More detailed notes on some items are given in similar tables in the Budget (Parl. paper B.6) and the Public Accounts (Parl. papers B. 1 Pt. I and II).
National Roads Fund Income and Expenditure—
| Item | Year Ended 31 March | ||
|---|---|---|---|
| 1982 | 1983 | 1984 | |
| * Prior to 1 April 1983 not identified separately. | |||
| $(thousand) | |||
| Income | |||
| Motor spirits duty (less refunds) | 129,000 | 132,786 | 138,720 |
| Road user charges (less refunds) | 82,533 | 96,948 | 96,600 |
| Mileage tax | 20 | 3,223 | 7 |
| Contributions from Consolidated Account | 35,000 | 34,000 | 93,000 |
| Miscellaneous including interest | 5,431 | 5,579 | 8,164 |
| Excess of payments over receipts | – | 548 | – |
| Total | 251,984 | 273,084 | 343,449 |
| Expenditure | |||
| State highways maintenance | 81,356 | 95,980 | 108,345 |
| State highways construction | 45,498 | 43,972 | 51,601 |
| Local authorities subsidised works | 99,066 | 109,715 | 144,925 |
| Purchases of land and property | 16* | ||
| Administration and general | 21,713 | 23,414 | 28,391 |
| Unauthorised | 4 | 3 | 5 |
| Excess of receipts over payments | 4,347 | 6,277 | |
| Total expenditure | 251,984 | 273,084 | 343,449 |
Current Account Summary—The following table gives a summary of the current account of the balance of payments for the two latest March years. For definitions, explanations, etc., see Section 26B.
| Item | 1982–83x | 1983–84* | ||
|---|---|---|---|---|
| Credit | Debit | Credit | Debit | |
| * Provisional. | ||||
| $(million) | ||||
| Exports/imports (as published in external trade statistics) | 7,537 | 7,810 | 8,171 | 8,521 |
| Adjustments to balance of payments concepts | −353 | −469 | +457 | −170 |
| Exports/imports (f.o.b. exporting country) | 7,184 | 7,342 | 8,628 | 8,351 |
| Balance on merchandise trade | −158 | +277 | ||
| Transportation | 1,052 | 1,168 | 1,345 | 1,343 |
| Travel | 304 | 647 | 384 | 668 |
| Insurance | 23 | 31 | 12 | 32 |
| Other miscellaneous services | 302 | 773 | 341 | 695 |
| Government current transactions | 78 | 141 | 110 | 170 |
| Exports/imports of services | 1,759 | 2,760 | 2,192 | 2,909 |
| Balance on services | −1,000 | −717 | ||
| International investment income | 285 | 1,292 | 352 | 1,629 |
| Balance on invisibles | −1,984 | −1,995 | ||
| Transfers | 413 | 274 | 455 | 321 |
| Balance on current account | −2,004 | 1,584 | ||
A Labour Government under the Rt. Hon. D. R. Lange was elected following the General Election held on 14 July 1984. The strength of political party representation in Parliament after this election was: Labour 56 seats, National 37 seats, and Social Credit 2 seats.
The following summary of the results in each electorate was prepared by the Chief Electoral Office. Total votes recorded for each party, together with the percentage of valid votes each total represents are given in Section 38.
The summary is prefaced by a key to the abbreviations used to indicate the party affiliations of the candidates.
| Political Party Designations | |
|---|---|
| A | —Apolitical |
| C | —Computer |
| CD | —Citizens Democratic |
| CFE | —Christian Free Enterprise |
| CS | —Consensus |
| CU | —Cheer Up |
| EE | —Economic Euthenics |
| ER | —Equal Rights |
| HBUF | —Home Brewers United Front |
| I | —Independent |
| ICS | —Independent Christian Socialist |
| IH | —Independent Howhow |
| IL | —Independent Labour |
| INZ | —Independent New Zealand |
| L | —Labour |
| McGS | —McGillicuddy Serious |
| MM | —Mana Motuhake |
| N | —National |
| NZ | —New Zealand |
| NZWP | —New Zealand Women's Political |
| PE | —Private Enterprise |
| PF | —People's Freedom |
| R | —Referenda |
| SC | —Social Credit |
| V | —Values |
| W | —Wizard |
| Electoral Districts, Candidates, and Party Affiliations | Votes Recorded |
|---|---|
| Ashburton | |
| Dow (SC) | 824 |
| Luck (V) | 72 |
| Simpson (NZ) | 2,294 |
| Stone (L) | 8,876 |
| Talbot (N) | 9,348 |
| Total | 21,467 |
| Informal | 53 |
| Auckland Central | |
| Andrews (SC) | 751 |
| Cotman (NZWP) | 253 |
| Cowan (V) | 208 |
| Eardley-Wilmot (N) | 3,646 |
| Prebble (L) | 12,522 |
| Sapsford (NZ) | 2,571 |
| Terreni (CU) | 95 |
| Total | 20,300 |
| Informal | 254 |
| Avon | |
| Anker (V) | 180 |
| Batchelor (L) | 11,838 |
| Cowie (N) | 4,067 |
| Groufsky (NZ) | 2,701 |
| Morgan (SC) | 941 |
| Total | 19,789 |
| Informal | 62 |
| Awarua | |
| Austin (N) | 8,605 |
| Henderson (SC) | 1,308 |
| Rait (L) | 8,221 |
| Roy (NZ) | 1,703 |
| Total | 19,899 |
| Informal | 62 |
| Bay of Islands | |
| Austin (N) | 7,211 |
| Brown (NZ) | 3,615 |
| Hunter (SC) | 3,913 |
| McIntyre(L) | 3,627 |
| McVeagh (V) | 102 |
| Total | 18,520 |
| Informal | 52 |
| Birkenhead | |
| Course (L) | 7,830 |
| McLay (N) | 9,547 |
| Pearce (NZ) | 3,761 |
| Sheppard (SC) | 648 |
| Total | 21,856 |
| Informal | 70 |
| Christchurch Central | |
| Ludemann (NZ) | 2,072 |
| Palmer (L) | 13,394 |
| Pounsford (SC) | 662 |
| Sadler (W) | 123 |
| Willy (N) | 4,886 |
| Total | 21,227 |
| Informal | 90 |
| Christchurch North | |
| Dumergue (N) | 6,622 |
| Langridge (SC) | 679 |
| McArthur (V) | 101 |
| Moore (L) | 12,350 |
| Nicholson (NZ) | 2,047 |
| Total | 21,884 |
| Informal | 85 |
| Clutha | |
| Gray (N) | 10,199 |
| McGimpsey (SC) | 658 |
| O'Malley (NZ) | 2,764 |
| Sheppard (L) | 5,677 |
| Total | 19,336 |
| Informal | 38 |
| Dunedin North | |
| Everson (W) | 151 |
| Henderson (N) | 5,835 |
| Menzies (INZ) | 58 |
| Nixon (I) | 74 |
| Paddon (SC) | 966 |
| Rodger (L) | 10,964 |
| Vandervis (NZ) | 3,010 |
| Total | 21,210 |
| Informal | 152 |
| Dunedin West | |
| Freeman (NZ) | 1,840 |
| Guise (SC) | 749 |
| MacDonnell (IL) | 3,638 |
| Matthewson (L) | 10,832 |
| Russell (N) | 4,821 |
| Total | 21,959 |
| Informal | 79 |
| East Cape | |
| Eraser (L) | 7,365 |
| Kelly (V) | 126 |
| Leeming (N) | 6,610 |
| Orr (NZ) | 3,209 |
| Tairua (SC) | 679 |
| Total | 18,067 |
| Informal | 78 |
| East Coast Bays | |
| Knapp (SC) | 10,146 |
| McCully (N) | 8,126 |
| Phillips (NZ) | 2,035 |
| Smits (I) | 17 |
| Smythe (L) | 2,081 |
| Total | 22,436 |
| Informal | 31 |
| Eastern Hutt | |
| Harvey (NZ) | 2,832 |
| Macrae (SC) | 1,005 |
| McLauchlan (N) | 4,811 |
| Young (L) | 10816 |
| Total | 19,574 |
| Informal | 110 |
| Eden | |
| Cullen (NZ) | 2,294 |
| Harris (SC) | 571 |
| Malcolm (N) | 8,800 |
| Northey (L) | 11,106 |
| Williams (V) | 96 |
| Total | 22,968 |
| Informal | 101 |
| Fendalton | |
| Burdon (N) | 10,506 |
| Dobson (L) | 9,049 |
| Ellims (C) | 22 |
| Radley (NZ) | 2,445 |
| Thomson (V) | 107 |
| Wright (SC) | 316 |
| Total | 22,570 |
| Informal | 125 |
| Franklin | |
| Birch (N) | 10,501 |
| Haines (V) | 131 |
| Haywood (L) | 5,291 |
| McGuire (NZ) | 2,880 |
| Scott (SC) | 1,600 |
| Total | 20,482 |
| Informal | 79 |
| Gisborne | |
| Bell (N) | 8,344 |
| DeZylva (NZ) | 1,574 |
| Maclean (V) | 66 |
| Smith (SC) | 670 |
| Wallbank (L) | 10,512 |
| Total | 21,214 |
| Informal | 48 |
| Glenfield— | |
| Keall (L) | 8,857 |
| Schnauer (N) | 8,048 |
| Trubshoe (SC) | 1,734 |
| West (NZ) | 2,433 |
| Total | 21,111 |
| Informal | 39 |
| Hamilton East— | |
| Coker (SC) | 669 |
| Millon (L) | 8,633 |
| Evans (NZ) | 2,467 |
| Gunn (McGS) | 32 |
| Shearer (N) | 7,533 |
| Stone (A) | 19 |
| Total | 19,465 |
| Informal | 112 |
| Hamilton West— | |
| Crosbie (SC) | 758 |
| Fisher (McGS) | 29 |
| Mallard (L) | 8,886 |
| Minogue (N) | 8,083 |
| Vorstman (NZ) | 1,747 |
| Total | 19,557 |
| Informal | 54 |
| Hastings— | |
| Brown (N) | 6,906 |
| Butcher (L) | 11,179 |
| Rabarts (SC) | 938 |
| Slavin (NZ) | 2,803 |
| Total | 21,894 |
| Informal | 68 |
| Hauraki— | |
| Donald (V) | 71 |
| Hepburn (NZ) | 1,227 |
| Lee (N) | 9,070 |
| Taylor (L) | 4,653 |
| Thompson (SC) | 5,638 |
| Total | 20,725 |
| Informal | 66 |
| Hawke's Bay | |
| Harris (SC) | 639 |
| Harrison (N) | 7,581 |
| McHardy (NZ) | 3,103 |
| Sutton (L) | 8,555 |
| Total | 19,926 |
| Informal | 48 |
| Heretaunga— | |
| Henderson (SC) | 597 |
| Jeffries (L) | 10,155 |
| MacFarlane (N) | 5,618 |
| Spence (NZ) | 3,072 |
| Total | 19,494 |
| Informal | 52 |
| Horowhenua— | |
| Holden (SC) | 985 |
| King (L) | 10,401 |
| Thompson (N) | 9,954 |
| Wiggins (NZ) | 1,772 |
| Total | 23,186 |
| Informal | 74 |
| Invercargill— | |
| Coughlan (NZ) | 1,721 |
| Gilbert (I) | 56 |
| Jones (N) | 9,805 |
| Radich (SC) | 801 |
| Soper (L) | 8,526 |
| Total | 20,979 |
| Informal | 70 |
| Island Bay— | |
| Button (NZ) | 4,048 |
| Douche (SC) | 477 |
| Kananghinis (N) | 4,488 |
| Maung Maung (I) | 89 |
| O'Flynn (L) | 10,495 |
| Symondson (V) | 220 |
| Total | 19,922 |
| Informal | 105 |
| Kaimai— | |
| Corbett (V) | 137 |
| Dickson (NZ) | 5546 |
| Haines (SC) | 1,422 |
| Townshend (N) | 9,242 |
| Tucker (L) | 5,355 |
| Total | 21,766 |
| Informal | 64 |
| Kaipara— | |
| Campbell (SC) | 4,382 |
| Corker (NZWP) | 100 |
| Hall (L) | 3,217 |
| Hughes (NZ) | 2,595 |
| Smith (N) | 9,946 |
| Total | 20,286 |
| Informal | 46 |
| Kapiti— | |
| Harris (NZ) | 3,712 |
| Manning (SC) | 632 |
| Oakley (N) | 6,584 |
| Shields (L) | 11,098 |
| Total | 22,101 |
| Informal | 75 |
| King Country— | |
| Bolger (N) | 10,040 |
| Mason (SC) | 2,027 |
| Short (NZ) | 1,580 |
| Simons (L) | 4,423 |
| Winter (V) | 139 |
| Total | 18,268 |
| Informal | 59 |
| Lyttelton— | |
| Bruce (SC) | 962 |
| Burrows (NZ) | 3,291 |
| Graham (N) | 7,031 |
| Hercus (L) | 11,994 |
| Total | 23,359 |
| Informal | 81 |
| Manawatu— | |
| Alton (L) | 8,575 |
| Cox (N) | 8,995 |
| Leamy (HBUF) | 126 |
| Pedley (SC) | 873 |
| Sowry (NZ) | 2,135 |
| Total | 20,762 |
| Informal | 58 |
| Mangere— | |
| Brooks (SC) | 584 |
| Lange (L) | 10,676 |
| Meyer (NZ) | 1,096 |
| Saunders (N) | 2,301 |
| Total | 14,784 |
| Informal | 127 |
| Manurewa— | |
| Douglas (L) | 10,157 |
| Jack (NZ) | 2,143 |
| Kilford (SC) | 909 |
| Leenstra (N) | 5,224 |
| Macmillan (V) | 72 |
| Okesene (I) | 27 |
| Watson (I) | 120 |
| Total | 18,732 |
| Informal | 80 |
| Marlborough— | |
| Bell (I) | 43 |
| Calcott (NZ) | 2,656 |
| Kidd (N) | 9,472 |
| MacDonald (L) | 8,860 |
| Smith (SC) | 1,062 |
| Yealands (I) | 87 |
| Total | 22,256 |
| Informal | 76 |
| Matamata— | |
| Clow (L) | 3,690 |
| Galvin (NZ) | 3,022 |
| Gilberd (SC) | 1,772 |
| Luxton (N) | 9,475 |
| Total | 18,034 |
| Informal | 75 |
| Miramar— | |
| Bungay (NZ) | 3,424 |
| Crosbie (N) | 7,603 |
| Kirk (I) | 43 |
| Lines (SC) | 279 |
| Moncur (PE) | 31 |
| Neilson (L) | 11,102 |
| Total | 22,582 |
| Informal | 100 |
| Mt Albert | |
| Cavanagh (N) | 6,024 |
| Clark (L) | 12,231 |
| Gonsalves (NZ) | 2,390 |
| McGee (SC) | 908 |
| Total | 21,680 |
| Informal | 127 |
| Napier | |
| Braybrook (L) | 12,085 |
| Culpitt (SC) | 673 |
| Liddell (N) | 5,686 |
| Mockford (NZ) | 2,711 |
| Total | 21,209 |
| Informal | 54 |
| Nelson | |
| Collin (SC) | 318 |
| Courtney (I) | 6,610 |
| Jimenez (NZ) | 1,348 |
| Straight (N) | 2,773 |
| Ward (V) | 219 |
| Woollaston (L) | 10,288 |
| Total | 21,613 |
| Informal | 57 |
| New Lynn | |
| Hanson (N) | 4,994 |
| Hunt (L) | 11,334 |
| James (SC) | 1,070 |
| Orr (NZ) | 2,403 |
| Total | 19,915 |
| Informal | 114 |
| New Plymouth | |
| Friedlander (N) | 9,900 |
| Gaskin (L) | 9,631 |
| Horn (NZ) | 1,656 |
| McPeak (SC) | 645 |
| Petrie (R) | 17 |
| Roborgh (V) | 154 |
| Total | 22,063 |
| Informal | 60 |
| North Shore | |
| Davies (NZ) | 3,737 |
| Gair (N) | 11,034 |
| Harris (L) | 7,324 |
| Moses (I) | 54 |
| Ryan (SC) | 1,371 |
| Total | 23,605 |
| Informal | 85 |
| Ohariu | |
| Dunne (L) | 8,282 |
| Jones (NZ) | 6,326 |
| Loncar (SC) | 275 |
| Obee (HBUF) | 42 |
| Templeton (N) | 6911 |
| Total | 21,892 |
| Informal | 56 |
| Onehunga | |
| Blakeborough (NZ) | 2,894 |
| Freeman (N) | 6,846 |
| Gerbic (L) | 11,354 |
| Lusby (CS) | 83 |
| Symons (V) | 137 |
| Terei (SC) | 841 |
| Total | 22,284 |
| Informal | 129 |
| Otago | |
| Chittack (NZ) | 1,501 |
| Cooper (N) | 8,884 |
| Poison (L) | 7,509 |
| Thompson (SC) | 3,124 |
| Total | 21,076 |
| Informal | 58 |
| Otara | |
| Davis (SC) | 839 |
| Hoera (NZ) | 1,762 |
| Moyle (L) | 10,583 |
| Tafua (N) | 4,064 |
| Tamihere (MM) | 94 |
| Total | 17,457 |
| Informal | 115 |
| Pahiatua | |
| Addis (SC) | 1,094 |
| Brazendale (L) | 4,750 |
| Cameron (NZ) | 2,874 |
| Falloon (N) | 10,228 |
| Wyn Harris (V) | 192 |
| Total | 19,203 |
| Informal | 65 |
| Pakuranga | |
| Grierson (NZ) | 3,804 |
| Hunt (N) | 8,099 |
| Marriott (I) | 39 |
| Morrison (SC) | 8,271 |
| Williams (L) | 3,101 |
| Total | 23,347 |
| Informal | 33 |
| Palmerston North | |
| Couper (NZ) | 2,123 |
| de Cleene (L) | 10,341 |
| Singleton (N) | 7,308 |
| Smith (SC) | 765 |
| Total | 20,608 |
| Informal | 71 |
| Panmure | |
| Clark (SC) | 1,402 |
| Morse (V) | 77 |
| Orme (NZ) | 2,077 |
| Tedesco (N) | 4,395 |
| Tizard (L) | 10,374 |
| Total | 18,427 |
| Informal | 102 |
| Papakura | |
| Cheeseman (SC) | 1,906 |
| John (L) | 7,012 |
| Prior (NZ) | 1,984 |
| Smith (CFE) | 28 |
| Wellington (N) | 8,459 |
| White (I) | 29 |
| Total | 19,504 |
| Informal | 86 |
| Papatoetoe | |
| Craven (NZ) | 2,479 |
| Harvey (SC) | 935 |
| Isbey (L) | 9,697 |
| O'Brien (N) | 6,701 |
| Total | 19,897 |
| Informal | 85 |
| Pencarrow | |
| Colman (L) | 10,338 |
| Cranston (N) | 4,920 |
| Lyth (SC) | 664 |
| Wickens (NZ) | 2,992 |
| Total | 18,977 |
| Informal | 63 |
| Porirua | |
| Gadsby (N) | 4,383 |
| Metekingi (MM) | 125 |
| Murrie (NZ) | 2,700 |
| Stanton (ICS) | 90 |
| Underwood (SC) | 863 |
| Wall (L) | 9,801 |
| Total | 18,095 |
| Informal | 133 |
| Raglan | |
| Holmes (L) | 6,472 |
| James (SC) | 1,443 |
| Jowsey (NZ) | 2,181 |
| Upton (N) | 8,448 |
| Total | 18,588 |
| Informal | 44 |
| Rangiora | |
| Gardner (NZ) | 2,631 |
| Gerard (N) | 8,895 |
| Moore (SC) | 820 |
| Tomlinson (L) | 8,549 |
| Total | 20,962 |
| Informal | 67 |
| Rangitikei | |
| Beetham (SC) | 7,866 |
| MacPherson (NZ) | 1,079 |
| Marshall (N) | 8,370 |
| Walpole (L) | 2,571 |
| Total | 19,919 |
| Informal | 33 |
| Remuera | |
| Graham (N) | 9,102 |
| Park (SC) | 599 |
| Sandford (NZ) | 5,619 |
| Sellwood (L) | 4914 |
| Symons (V) | 217 |
| Total | 20,538 |
| Informal | 87 |
| Rodney | |
| Dent (L) | 6,147 |
| McKinnon (N) | 10,023 |
| O'Sullivan (SC) | 3,779 |
| Thompson (NZ) | 3,244 |
| Total | 23,277 |
| Informal | 84 |
| Roskill | |
| Devcich (I) | 57 |
| Goff (L) | 11,043 |
| Knowles (N) | 6,835 |
| Lye (SC) | 789 |
| Matthews (NZ) | 2,217 |
| Ofman (V) | 34 |
| Total | 21,128 |
| Informal | 153 |
| Rotorua | |
| Arps (L) | 7,935 |
| Aubertin (NZ) | 2,094 |
| East (N) | 8,746 |
| Steele (SC) | 594 |
| Total | 19,434 |
| Informal | 65 |
| St Albans | |
| Caygill (L) | 12,208 |
| Kattell (NZ) | 2,621 |
| Manson (SC) | 990 |
| Wilson (N) | 6036 |
| Total | 21,925 |
| Informal | 70 |
| St Kilda | |
| Clark (N) | 6,049 |
| Coles (SC) | 1,215 |
| Cullen (L) | 11,643 |
| Hayes (NZ) | 2,428 |
| Morrison (I) | 151 |
| Total | 21,591 |
| Informal | 105 |
| Selwyn | |
| Gribbén (SC) | 977 |
| Macdonald (NZ) | 2,859 |
| Manning (L) | 6,247 |
| Richardson (N) | 10,076 |
| Total | 20,214 |
| Informal | 55 |
| Sydenham | |
| Anderton (L) | 11,789 |
| Bach (SC) | 2,461 |
| Blackadder (NZ) | 2,324 |
| Bonisch (N) | 4,534 |
| Hansen (EE) | 46 |
| Scholes (V) | 142 |
| Total | 21,396 |
| Informal | 100 |
| Tamaki | |
| Butler (PF) | 51 |
| Cunningham (V) | 93 |
| Hagen (SC) | 616 |
| Hall (NZWP) | 89 |
| Hodgson (NZ) | 4,545 |
| Muldoon (N) | 10,414 |
| Tulloch (L) | 6,656 |
| Total | 22,615 |
| Informal | 151 |
| Taranaki | |
| Kirk (SC) | 1,845 |
| Maxwell (N) | 10,855 |
| McCready (NZ) | 2,197 |
| Muggeridge (V) | 215 |
| Waters (L) | 4,842 |
| Total | 20,024 |
| Informal | 70 |
| Tarawera | |
| Blackley (NZ) | 2,874 |
| Blaymires (SC) | 1,054 |
| Hickson (V) | 88 |
| McLean (N) | 8,884 |
| Moore (L) | 5,507 |
| Total | 18,451 |
| Informal | 44 |
| Tasman | |
| Hayter (NZ) | 1,714 |
| Hunt (N) | 7,689 |
| King (SC) | 1,551 |
| Shirley (L) | 9,543 |
| Waldron (ER) | 74 |
| Total | 20,637 |
| Informal | 66 |
| Tauranga | |
| Hills (SC) | 3,793 |
| Howard (L) | 4,667 |
| Parlour (NZ) | 4,804 |
| Peters (N) | 9,716 |
| Total | 23,046 |
| Informal | 66 |
| Te Atatu | |
| Bassett (L) | 10,786 |
| Diment (N) | 5,795 |
| Jackson (SC) | 1,090 |
| Phillips (NZ) | 1,972 |
| Prout (I) | 126 |
| Total | 19,837 |
| Informal | 68 |
| Timaru | |
| Arthur (L) | 11,033 |
| McTigue (N) | 8,814 |
| Musgrave (NZ) | 1,855 |
| Simmons (SC) | 1,217 |
| Total | 22,979 |
| Informal | 60 |
| Tongariro | |
| Elder (SC) | 2,680 |
| Low (NZ) | 923 |
| Rangi (N) | 4,620 |
| Ridley (I) | 502 |
| Scott (L) | 8,490 |
| Total | 17,271 |
| Informal | 56 |
| Waikaremoana | |
| Alford (IH) | 40 |
| Harre (L) | 6,260 |
| McClay (N) | 7,997 |
| Plummer (NZ) | 2,653 |
| Robinson (SC) | 735 |
| Total | 17,731 |
| Informal | 46 |
| Waikato | |
| Cairns (McGS) | 117 |
| Cleave (L) | 6,379 |
| Johnstone (SC) | 1,326 |
| Storey (N) | 8,037 |
| Walker (NZ) | 2,286 |
| Total | 18,190 |
| Informal | 45 |
| Waipa | |
| Allen (L) | 3,843 |
| Griffin (NZ) | 1,713 |
| Kilbride (SC) | 3,832 |
| O'Regan (N) | 9,510 |
| Total | 18,965 |
| Informal | 67 |
| Wairarapa | |
| Biss (NZ) | 2,908 |
| Boorman (L) | 9,009 |
| Couch (N) | 8,615 |
| Jury (SC) | 819 |
| Total | 21,394 |
| Informal | 43 |
| Waitakere | |
| Holloway (I) | 85 |
| Mcintosh (N) | 5,452 |
| Marshall (NZ) | 3,224 |
| Maxwell (L) | 9,926 |
| Wojcik (SC) | 1,872 |
| Total | 20,617 |
| Informal | 58 |
| Waitaki | |
| Elworthy (N) | 8,149 |
| Gould (SC) | 637 |
| Sutton (L) | 8,710 |
| Wootton (NZ) | 1,817 |
| Total | 19,351 |
| Informal | 38 |
| Waitotara | |
| Carlsen (NZ) | 1,196 |
| Nicholls (L) | 3,554 |
| Perry (SC) | 5,642 |
| Wright (V) | 79 |
| Young (N) | 8,956 |
| Total | 19,498 |
| Informal | 71 |
| Wallace | |
| Anugs (N) | 10,034 |
| Fisher (L) | 4,371 |
| Hicks (SC) | 1,234 |
| Phillips (NZ) | 3,270 |
| Total | 18,944 |
| Informal | 35 |
| Wanganui | |
| Harrex (NZ) | 751 |
| Heffernan (SC) | 6,473 |
| Marshall (L) | 10,391 |
| Sullivan (I) | 47 |
| Westwood (N) | 4,579 |
| Total | 22,299 |
| Informal | 58 |
| Wellington Central | |
| Belchamber (SC) | 314 |
| Catford (W) | 64 |
| Feast (NZ) | 4,501 |
| Matthews (I) | 51 |
| Wilde (L) | 11,579 |
| Young-Rouse (N) | 7,463 |
| Total | 24081 |
| Informal | 109 |
| West Auckland | |
| Clews (I) | 52 |
| Elder (L) | 10,369 |
| Jones (N) | 8,140 |
| Patel (NZ) | 1,901 |
| Te Hira (MM) | 21 |
| Webber (SC) | 965 |
| Total | 21,499 |
| Informal | 51 |
| West Coast | |
| Bateman (N) | 5,769 |
| Burke (L) | 10,062 |
| Murcott (SC) | 1,788 |
| Murphy (NZ) | 1,976 |
| Steward (V) | 252 |
| Total | 19,947 |
| Informal | 100 |
| Western Hutt | |
| Coad (SC) | 407 |
| Hale (NZ) | 3,557 |
| Tanner (N) | 6,207 |
| Terris (L) | 10,555 |
| Total | 20,796 |
| Informal | 70 |
| Whangarei | |
| Banks (N) | 9,801 |
| Kroon (NZ) | 1,809 |
| Leitch (SC) | 2,553 |
| Magner (L) | 7,798 |
| Maxwell (MM) | 45 |
| Total | 22,077 |
| Informal | 71 |
| Yaldhurst | |
| Austin (L) | 11,560 |
| Bucknall (CD) | 76 |
| Davey (SC) | 597 |
| Joseph (N) | 8,590 |
| Russell (NZ) | 2,024 |
| Wilkinson (V) | 99 |
| Total | 23,020 |
| Informal | 74 |
| Eastern Maori | |
| Heremaia (NZ) | 400 |
| Kiwara (N) | 1,055 |
| McLean (MM) | 575 |
| Tapsell (L) | 12,285 |
| Te Aweawe (SC) | 277 |
| Total | 14,716 |
| Informal | 124 |
| Northern Maori | |
| Brown (NZ) | 492 |
| Gregory (L) | 10,471 |
| Henskes (N) | 949 |
| Joyce (SC) | 373 |
| Rata (MM) | 2,783 |
| Total | 15,236 |
| Informal | 168 |
| Southern Maori | |
| Amaru (NZ) | 427 |
| Aramakutu (SC) | 226 |
| Mei (N) | 982 |
| Mihaka (I) | 177 |
| Reedy (MM) | 1,297 |
| Tirikatane-Sullivan (L) | 11,792 |
| Watene (I) | 161 |
| Total | 15,210 |
| Informal | 148 |
| Western Maori | |
| Katene (N) | 1,215 |
| Rameka (NZ) | 298 |
| Rickard(MM) | 1,049 |
| Te Hira (SC) | 523 |
| Wetere (L) | 11,325 |
| Total | 14,564 |
| Informal | 154 |
NOTES:
This index is arranged alphabetically, word by word. Abbreviations are listed alphabetically as if they were words, and cross-referenced to the main entry, which gives the name or term in full.
Graphs and maps are indicated by page numbers in italic type (e.g., 247), and major references by page numbers in bold type (e.g., 248).
Cross-references are from general to more specific headings (e.g., from Courts to District Courts), and between headings covering related or overlapping topics that are similar in range (e.g., from Money supply to Monetary policy).
Names of places and geographic features are not indexed separately, but can be found on pages listed under the relevant heading, e.g., Cities; Mountains; Population. Exceptions are names of countries, and inhabited New Zealand islands.
Acts of Parliament are not indexed separately (see list pp. 931–937), and statutory bodies are indexed separately only where there is a major reference (see pp. 950–954 for a complete list).
A large number of organisations and bodies indexed by name have the prefixes 'National' or 'New Zealand'. If there is no reference under a more generally known name, they may be found under these prefixes (e.g., National Marriage Guidance Council; New Zealand Dairy Board).
A
- Abortion, 183
- Accident compensation (see also Accident Compensation Corporation), 304, 888, 889–891
- Accident Compensation Corporation, 690, 888–892, 905, 907
- Accident insurance, 822–823
- Accidents (see also Accident compensation; Accident insurance; Drowning; Safety), 892–906 air, 401
- cases of, treated in public hospitals, 183–184
- fatal, 142–145
- at level crossings, 379
- in traffic see Traffic
- Accommodation, tourist, (see also Housing), 283
- Accommodation benefit, 188, 191, 195, 205
- Accounts, National see New Zealand System of National Accounts
- Acts of Parliament see Legislation
- ADB see Asian Development Bank
- Administrative tribunals, 938
- Adoption, 129–130, 199
- Adult education (see also New Zealand Workers Educational Association), 160, 230, 245–247
- Advertising, 268, 270, 272
- Advisory Committee on Women's Affairs, 119, 120
- Aerial topdressing see Topdressing
- Africa, relations with, 33
- Age distribution of population, 89
- Agricultural contracting, 434–435, 673
- Agricultural Producers Price Index, 673–675
- Agricultural production, see Agricultural Production Account; Crops; Dairy products; Marketing; Meat; Wool
- Agricultural Production Account, 708–709
- Agricultural Training Council, 428
- Agriculture (see also Agricultural contracting; Agricultural Production Account; Agricultural Training Council; Farming; Marketing)
- and Fisheries, Ministry of see Ministry of Agriculture and Fisheries
- machinery used in, 433
- subsidies and grants to, 431–433
- Aid, overseas see Official Development Assistance Air force see Royal New Zealand Air Force
- Air freight see Aviation
- Air mail see Mail
- Air New Zealand, 396–397, 503, 731, 752
- Air pollution (see also Clean Air Council), 154–155, 335
- Air transport see Aviation
- Aircraft industry (see also Aviation), 503
- Airlines (see also Air New Zealand), 396–399
- Airports, 395–396, 399
- trade by, 653–654
- Alcohol (see also Alcoholism; Beer; Breweries; Drinking; Drunkenness; Liquor licensing; Wine),
- consumption of, 158–159, 685
- retail sales, 594
- Alcoholic Liquor Advisory Council, 158–159, 172
- Alcoholism (see also Alcohol; Drinking; Drunkenness), 158–159, 179
- Alexander Turnbull Library, 262
- Aluminium
- exports of, 623, 625, 627, 1013
- imports of, 649, 650
- industry, health hazards of, 156
- ore, 495
- smelters, 329, 502, 504
- Ambassadors see Diplomatic, consular and other representation in New Zealand; New Zealand's overseas posts
- Ambulance services, 157, 171, 174, 319
- Amenities, of dwellings (see also Appliances), 545–546, 683
- Ammonia urea plant, 502
- Animals see Livestock
- Anniversary Days see Holidays
- Antarctic (see also Ross Dependency), 315
- minerals regime for, 39
- treaty, 39, 913, 914
- Ante-natal services, 157, 167
- Antiquities, protection of, 260
- ANZUS Treaty see Australia New Zealand and United States Treaty
- Apiaries and apiculture see Bees and Beekeeping
- Apparel see Clothing; Textiles
- Appeals
- against convictions and sentences see Convictions
- against Domestic Proceedings Court decisions, 306
- Apples (see also New Zealand Apple and Pear Marketing Board), 446, 971
- Appliances (see also Amenities; Gas appliances), 683
- Applied Technology Programme, 779
- Apprentices, 241, 242, 842–843
- Aquaculture, 480–482
- Arbitration Court, 872–873
- Archaeological sites, protection of, 260
- Area of New Zealand, 3, 4, 5–6
- Armed Forces (see also New Zealand Army; Royal New Zealand Air Force; Royal New Zealand Navy)
- assistance to community, 315–316
- housing for, 810
- strength of, 317, 321
- Arrivals see Immigration
- Art galleries, 258, 260, 757
- Artificial aids (for physical disabilities), 168, 169, 170
- Arts Council see Queen Elizabeth II Arts Council
- Arts and cultural activities, 258–261
- awards in, 996–997
- Asbestos, 156, 496
- ASEAN see Association of South-east Asian Nations
- Asia, relations with (see also South-east Asia), 33–34
- Asian Development Bank (ADB), 41, 43, 712, 732, 798
- Association of South-east Asian Nations (ASEAN), 33–34, 611, 630
- Atomic energy see International Atomic Energy Agency
- Audit Office, 49, 940
- Australia (see also Australia New Zealand Closer Economic Relations Trade Agreement), relations with, 36–37, 612
- Australia New Zealand and United States Treaty (ANZUS), 37, 313
- Australia New Zealand Closer Economic Relations Trade Agreement (CER), 612, 657
- Average Gross Income Index, 861–862
- Aviation (see also Airlines), 394–396
- freight and passenger operations, 358, 360, 374, 394, 396–400
- licensing of, 395
- safety, 401, 908
- services to, 395–396
- Awards in literature and art, 996–997
B
- Bacon, 511, 517, 667, 669
- Bakeries (see also Bread), 511, 517
- Balance of payments, 718–722
- definition and principles of, 710–713
- summaries 714–718, 1022
- Balance of trade, 40
- Bananas, 437, 585, 667, 685
- Bank cards see Credit cards
- Bank notes, 771, 789–790, 796
- Bank of New Zealand, 773
- Bankruptcies, 918–920, 974
- Banks and banking (see also Asian Development Bank (ADB); Bank of New Zealand; Development Finance Corporation; Finance companies; International Bank for Reconstruction and Development; Merchant banks; Reserve Bank; Rural Banking and Finance Corporation; Savings banks; Stock and station agents; Trading banks; World Bank), 770
- regulation of, 771–772, 781–782
- Barley, 438, 966
- Basalt, 486
- Beans, 441 442, 685
- Beef (see also Cattle; Veal)
- consumption, 684
- exports, 576, 577, 582–583, 623, 625, 632, 633, 970, 1012
- prices, 589–590, 667
- production, 47, 422–423, 448–450
- Beer
- consumption, 158
- duty on, 658
- price, 668
- production, 524
- Bees and beekeeping, 454
- Benefits, social welfare (see also Accident compensation; Accommodation benefit; Death benefit; Dental benefit; Domestic Purposes benefits; Emergency benefits; Family benefits; Handicapped childs' allowance; Hospital benefits; Invalids benefits; Laboratory benefit; Maternity benefits; Medical benefits; Miners; Orphans; Pharmaceutical benefits; Physiotherapy benefits; Sickness benefits; Unemployment; War pensions and allowances; Widows), 186–196, 769, 1009
- Bentonite, 486, 495
- Betting see Gaming; Totalisator Agency Board
- Beverages (see also Alcohol; Coffee; Soft drinks), 685
- Bibliography, of select New Zealand publications, 981–995
- Birth rate, 123, 124–125, 962
- Birthplaces of population, 91
- Births, 124–131, 962
- Blind persons (see also Disabled persons), 171, 193, 196, 204, 207, 219
- Boats, 277, 285, 371, 473, 482
- Bonus Bonds, 783, 784
- Books (see also Bibliography; Publishing), 925–926
- Boroughs, 74–75
- Borstals, abolished (see also Corrective training), 297
- Bread (see also Bakeries), 438, 511, 517, 667, 669
- Breast prostheses see Artificial aids
- Breweries, 500
- Brides, see Marriages
- Bridges, 374, 380–382
- Broadcasting (see also Radio; Television), 267–268, 270
- Broadcasting Corporation of New Zealand, 267, 270, 407, 752
- Broadcasting Tribunal, 267–268, 270
- Building and construction (see also Census of Building and Construction; Housing), 528–529
- materials used, 539, 546–547
- permits and work put in place, 534–537, 537
- of rental houses, 542
- Building and Solar Energy Service, 558
- Building Industry Advisory Council, 529
- Building Performance Guarantee Corporation, 529, 548
- Building Research Association, 250, 254
- Building societies, 782, 812–815
- Buildings see Building and construction; Dwellings; New Zealand Historic Places Trust; Schools
- Bureaufax service, 405, 406
- Bursaries (see also Tertiary Study Grant; War bursaries)
- school boarding, 231
- university, 223, 235
- Buses, 386–387, 524
- school, 231
- Butter (see also Dairy products), 421–422, 635
C
- Cabinet, 48
- members of, 46, 47, 53–54
- Calves see Cattle
- Campbell Island, 6
- Canada, relations with (see also North America), 37–38
- Canned fruit and vegetables, 524, 660, 667, 684–686
- Capital expenditure see Capital Expenditure Price Index; Capital Finance Account
- Capital Expenditure Price Index, 671, 672–673, 1016–1017
- Capital Finance Account, 689–692
- Capital gains, tax on, 738
- Capitalisation of family benefit see Family benefits
- Cargo
- carried by air transport see Aviation
- handled at ports (see also Ports; Shipping) 362, 367–371
- Caribbean, relations with, 38
- Carpets and carpet yarns (see also Textile industry), 425
- Carpooling, 556
- Cars see Carpooling; Motor vehicles; Rental cars
- Casein (see also Dairy products), 421, 636
- Cassette tapes, 234, 263–264, 523, 917
- Catchment authorities, 59–60
- Cattle (see also Beet; Dairy cows), 451, 967
- Cawthron Institute, 251, 254
- CB radio see Citizen band radio
- Cement (see also Concrete), 487, 502
- Census of Agricultural Contracting Services, 434–436
- Census of Building and Construction, 530–533, 548
- Census of Cinemas, 272–274
- Census of Distribution, 591–594, 607
- Census of Fishing, 482, 485
- Census of Forestry and Logging, 470–472
- Census of Gas Industry, 569–572
- Census of Libraries, 264–266
- Census of Manufacturing, 508–523, 968
- Census of Mining and Quarrying, 496–499
- Census of Population and Dwellings, 543–548
- dwellings, 766–769
- employment, 845–851
- Census of Services, 247–248, 599–607
- Census of Transport, Storage, and Communication, 357–361, 380
- Central Government finance see New Zealand System of National Accounts
- Central Institute of Technology, 163, 165, 241, 244
- CER see Australia New Zealand Closer Economic Relations Trade Agreement
- Cereals (see also Barley; Maize; Oats; Wheat), 442, 627, 642, 681, 685–686
- Chatham Islands, 5
- Cheese (see also Dairy products), 421, 635
- Chemicals and chemical products, 501
- exports, 628
- imports, 643, 645, 646, 652
- poisonous, 156
- production, 514, 519
- Chemists see Pharmacists
- Chicken (see also Poultry), 453–454
- Child, care (see also Pre-school education), 153, 187, 198, 199
- Childbirth see Births; Birth rate; Infant mortality; Maternal deaths; Maternity benefit; Maternity hospitals and units; Maternity leave; Mothers; Still births
- Children
- custody and guardianship of, 305–306
- day and long-term care see Child care; Children's homes
- deaths of, (see also Infant mortality), 142
- disabled see Disabled children health, 153, 157–158, 162, 187
- and justice system, 198–201, 301–303, 308
- in road accidents, 390
- as state wards, 201–203
- welfare, 198–203
- Childrens and Young Persons Courts, 198–201, 301–303
- Children's health camps, 158
- Children's homes, 87, 187, 198–199
- China, earthenware and pottery (see also Clays and clay products), 514, 519
- China, relations and trade with, 611
- CHIP see Community and Housing Improvement Programme
- Chiropractors, 164, 171
- Churches see Religious professions of population
- Cigarettes see Smoking; Tobacco
- Cinemas (see also Films), 272–274
- Cities (see also Boroughs; Urban areas; Urban population; Urban renewal; Urban transport), 74–75
- Citizen band radio, 407
- Citizenship, 114, 115
- City councils see Boroughs
- Civil aviation see Aviation
- Civil defence (see also Ministry of Civil Defence), 311–312
- Civil List, 728
- Clays and clay products, 254, 486, 492, 495
- Clean Air Council, 154–155, 172, 335
- Climate, 17–23
- Clothing (see also Footwear; Skins; Textiles), 627, 679–681
- CNG see Natural gas
- Coal
- consumption, 492, 968–969
- miners of see Miners
- mining of (see also Mining; State coal mines), 486, 490, 492
- research, 250
- resources, 487–492, 488
- Coal Research Association, 250
- Coastal shipping, see Shipping
- Coastline, 6, 333, 372
- Coat of arms, 928
- Coffee, 658–659, 685
- Coins and coinage, 789–790
- Colleges, teachers' see Teachers' colleges
- Colonisation, 28–29
- Commerce Commission, 599, 660, 661
- Commercial practices (see also Commerce Commission; Consumer protection; Prices), 599
- Commission for the Environment, 323–329, 334, 335, 342, 941
- Committee on Women, 121
- Commonwealth, relations with, 32
- Commonwealth Games, 33, 275
- Commonwealth Youth Programme, 43, 276
- Communications see Census of Transport, Storage and Communication; Post Office
- Communities (see also Community councils; District community councils), 76
- Community and Housing Improvement Programme (CHIP), 542, 809–810
- Community centres, 246–247, 285, 536
- Community colleges, 99, 215–216, 219, 241–242, 264
- Community councils, 61–62
- Community housing, 542, 810
- Community service, imposed by Courts, 290
- Companies (see also Bankruptcies; Finance companies; Mergers; Overseas investment), 815–816
- incomes of, 762–763, 764–766
- profits, 818
- registrations, 974
- taxation on, 741–742
- Compensation see Accident compensation
- Compressed natural gas (CNG) see Natural gas
- Concrete (see also Cement), 250, 254
- Confectionery, 511, 517, 524
- Conservation of natural resources see Environment; International Union for Conservation of Nature and Natural Resources; National parks; National Water and Soil Conservation Authority; Nature Conservation Council; Recycling; Reserves; Soil conservation
- Consolidated Account, 725–728, 734, 735
- Consolidated Accounts of the Nation, 689–693, 1019–1022
- Constitution, 28, 44–49
- Construction see Building and construction; Housing
- Consumer Council, 622, 683
- Consumer protection (see also Consumers Institute), 661–662
- Consumers Price Index
- all groups, 25 market centres, 663–664
- basis of, 662–663, 665
- each group, for individual centres, 660–667
- international comparison, 669
- summary and latest figures, 964, 965, 1013–1014
- Consumers Institute, 556
- Contact lenses, 168
- Containerisation, 362, 364, 367
- Continuing education see Adult education
- Contraception see Family planning
- Convictions, 290
- appeals against, 291
- numbers of, 292, 294–296, 963
- sentencing on, 292, 293, 295, 297
- of prisoners, 298, 299
- Cook Islands, 363, 793
- assistance to, 42, 507
- immigration from, 114, 117, 281
- relations with, 34, 35, 36
- Cook Strait rail/ferry service, 374, 378–379
- Copper, 494
- Copyright, 916–917
- Corrective training, 290, 297–299
- Correspondence school, 225, 231
- Cost of living see New Zealand Household Survey; Prices; Standard of living
- Cotton, 647, 649, 650
- Council for Educational Research, 245
- Council for Recreation and Sport, 276, 279
- Counties, 58, 77–78
- County councils 58, 755, 844
- finances of, 757–758, 760
- Court of Appeal, 287–288, 303
- Court system (see also Convictions; Courts; Judiciary; Juries; Penal system; Sentencing), 287–289
- Courts (see also Childrens and Young Persons Courts; Court of Appeal; District Courts; Family Courts; High Court; Trial courts), 287–288, 291–296
- Cows see Cattle; Dairy cows
- CPI see Consumers Price Index
- Credit (see also Credit cards; Hire purchase), 597, 771–772
- Credit cards, 598, 663, 744, 773
- Cremation, 135
- Crime (see also Justice; Murder; Police; Rape and sexual offences; Theft), 296–297, 308–309
- Crippled children see Disabled children
- Crops (see also Fruit; Grains; Hops; Horticulture; Market gardens; Seeds; Vegetables), 437, 966
- Crown land, 335–337
- Crown Law Office, 940
- Currency (see also Exchange rates), 789–790
- Customs Department (see also Customs tariff and revenue), 387, 614, 619, 659, 676, 940
- Customs tariff and revenue, 655, 658, 736
D
- Dairy cows, 252, 421, 448, 449, 451, 967
- Dairy factories, 421–422, 492, 500, 511, 517, 557
- Dairy farming (see also Dairy cows; Dairy factories; Dairy products), 417–418, 420, 448, 673, 775, 870
- Dairy products (see also Dairy Research Institute; Milk), 511, 517
- consumption, 684
- exports, 578, 580, 608–612, 621–623, 686, 971, 1012–1013
- marketing of (see also New Zealand Dairy Board), 557–582
- prices, 587–588
- production, 421–422, 709
- Dairy Research Institute, 250, 254, 334
- Data service (Post Office), 406
- Day care see Child care
- Daylight saving, 925
- Deaf persons (see also Disabled persons; Hearing aids; Noise), 157, 223, 224, 226, 232–233, 289
- Death benefit, 197
- Death duty, estates passed for, 744–747
- Death rate, 131–132
- Deaths (see also Accidents; Infant mortality; Maternal deaths; Still births), 131–145, 185
- Debt
- private see Bankruptcies
- public see Public debt
- Decimal currency, 789, 790
- Deer farming, 452
- Defence (see also Armed Forces; Disarmament; Foreign policy), 313–316
- civil see Civil Defence
- Ministry of see Ministry of Defence
- Defence Council, 313
- Demolitions, 534
- Dental benefit, 160, 168
- Dental health (see also Dental benefit; Dental nurses; Dental research; Dentists; School Dental Service), 154, 160–161, 168, 170, 174
- Dental nurses, 153, 160
- Dental research, 161
- Dentists, 162–163, 171
- Department of Education, 230, 940–941
- Department of Health, 942
- Department of Internal Affairs, 841, 942–943
- Department of Justice, 943
- Department of Labour, 907, 943
- Department of Lands and Survey, 343, 344, 943
- Department of Maori Affairs, 943
- Department of Scientific and Industrial Research, 248–251, 944–945
- Department of Social Welfare, 186–188, 945
- Department of Statistics (see also INFOS; Pay Research Unit), 945
- publications, 998, 999
- Department of Trade and Industry, 613, 619–620, 946
- Departments, government, list of, 938–939
- Departure tax, 735, 934, 940
- Departures see Emigration
- Deportation, 118
- Design see Designs; Industrial design
- Designs, registration of, 916
- Detached youth worker scheme, 199, 276
- Detention see Imprisonment; Periodic detention
- Developing Countries Liaison Unit, 613
- Development Finance Corporation, 507, 798–799
- Diatomite, 496
- Dietitians, 164
- Diplomatic representatives overseas see New Zealand's overseas posts
- Diplomatic, consular and other representation in New Zealand, 957–960
- Disability allowance, 195
- Disabled civilians see Disabled persons
- Disabled children (see also Disabled persons; Handicapped child's allowance), 177–180, 198, 223–225
- Disabled persons (see also Artificial aids; Blind persons; Deaf persons; Disability allowance; Disabled children; Rehabilitation), 195–196, 198
- Disarmament, 39
- Diseases, 135–140, 180–183
- Displaced persons see Refugees
- Dissolution of marriage (see also Marriage), 121, 149–150, 288, 304–306
- District communities, 76, 80
- District community councils, 61, 62
- District councils, 58, 59, 757, 758, 760
- District Courts, 288, 291, 294–295
- civil cases, 303–304
- criminal cases, 292–293
- traffic offences, 295–296
- District high schools, 219
- District planning, 63–64, 326
- Districts, 75
- Divorce see Dissolution of marriage
- Doctors, 162, 163, 171
- Dolomite, 486–487, 495
- Domestic assistance, 168, 189
- Domestic Purposes Benefits, 193, 196, 305, 1009
- Domestic trade (see also Census of Distribution; Retail trade; Wholesale trade), 1011
- DPB see Domestic Purposes Benefits
- Drainage boards, 59–60, 757–758, 760, 844
- Drainlayers, 164
- Drinking, legal age for (see also Alcohol; Alcoholism; Drunkenness), 923
- Driving offences see Traffic, offences
- Drowning (see also Accidents; New Zealand Water Safety Council), 143, 144–145
- Drugs (see also Alcohol)
- legal, control of, 155
- offences involving, 308
- Drunkenness (see also Alcohol; Alcoholism; Drinking), convictions for, 296
- DSIR see Department of Scientific and Industrial Research
- Dwellings, 534, 543–548
E
- Earthenware see China, earthenware and pottery
- Earthquake and War Damage Commission, 749, 754, 827–828
- Earthquakes, 14, 16–17
- Eastern Europe, relations with, 32–33, 609, 611, 617
- Economic and Social Commission for Asia and the Pacific (ESCAP), 35, 200, 281, 630, 798
- Education (see also Examinations; Schools; Teachers; Universities), 213–214
- administration of, 214–215
- adult see Adult education
- community, 246–247
- curriculum, 230
- Education, Department of see Department of Education
- international, 247–248
- levels of, 244–245
- of Maoris see Maoris
- of Pacific Island Polynesians see Pacific Island Polynesians
- pre-school see Pre-school education
- public expenditure on, 215–218
- roll numbers 218–220, 221–222, 963
- special see Special education
- staff employed, 220–222
- technical see Technical education of women, 119
- Educational research, 245
- EEC see European Economic Community
- Eels, 482
- EEZ see Exclusive Economic Zone
- Effective Weekly Wage Rates Index (see also Real Nominal Weekly Wage Rates Index; Real Prevailing Weekly Wage Rates Index), 869–870, 915
- replaced, 1017
- Eggs (see also New Zealand Poultry Board), 453, 1012
- Elections
- general, 51–52
- 1984 results see General Election 1984
- licensing poll, 924
- local bodies, 62–63
- term of parliament poll, 925
- Electoral rolls, 51–52, 62, 63, 409
- Electorates (see also Members of Parliament) 51, 62, 409
- Electric power boards see Power boards
- Electricity
- consumption of (see also Power boards), 563
- generation of, 562–566, 568
- historical development, 560–562
- income and expenditure of supply authorities, 564, 566–568
- planning for, 563
- supply authorities, 564
- Electronics, 503
- Embassies
- of foreign countries see Diplomatic, consular and other representation in New Zealand
- New Zealand, overseas see New Zealand's overseas posts
- Emergency benefits, 187, 188, 191, 194, 195, 409
- Emergency Protection Authority, 620
- Emergency Reserve Corps Pensions, 205
- Emigration, 110, 111, 1010
- Employers, 876, 877, 878
- Employers Federation, 876
- Employment (see also Industrial relations; Labour force; Occupational groups; Occupational health; Unemployment; Working life expectancies), 832–833
- by local authorities, 844
- by Public Service, 845
- statistics on, 841–845
- surveys of, 844
- and Vocational Guidance Service, 838–840
- of women, 119, 851–854
- Energy (see also Coal; Electricity; Gas; Geothermal power; Petroleum)
- conservation, 556
- demand and supply, 549–553, 559
- Ministry of, see Ministry of Energy
- planning, 553–554, 559
- research, 249
- resources, 554–556
- Energy Advisory Committee, 553–554
- Energy Advisory Service, 557
- Engineering industry, 502–503
- Environment (see also Environmental Council; Environmental health; Land; Planning; Soil; Water)
- agencies responsible for, 328–330
- Commission for the see Commission for the Environment
- and mineral exploitation, 330
- research on, 250
- tourism and the, 282
- Environmental Council, 329–330
- Environmental health, 154–155
- Equal Opportunities Tribunal, 915
- Erosion see Soils
- ESCAP see Economic and Social Commission for Asia and the Pacific
- Estate duty, 742, 743
- Ethnic groups in population (see also Europeans; Maoris; Pacific Island Polynesians; Race relations) 89–90, 299
- Europe see Eastern Europe; European Economic Community (EEC)
- European Economic Community (EEC), 32, 656, 842
- Europeans (see also Ethnic groups in population), 27–28, 299
- Examinations, 222–223
- Excess retention tax, 741
- Exchange rates (see also Overseas exchange transactions), 710, 722, 771, 790–791
- Excise duties, 658, 736
- Exclusive Economic Zone (EEZ), 473–474, 477, 478, 479
- protection of, 315
- Executive council see Cabinet
- Ex-nuptial births, 129
- Ex-nuptial infants, 129
- Exotic forests see Forests
- Expectation of life, 133–135
- Export awards, 620
- Export Guarantee Office, 508, 621
- Export Prices Index, 675–677, 964
- Exports, 621
- to ASEAN and ESCAP countries, 630–631
- destinations, by country and commodity, 630, 632–640
- main, value of, by commodity groups, 621–622
- to Oceania, 631
- re-exports, 640
- value of, by commodity, 625–626
- value of, by SITC, 627–629
- volume of, by commodity, 623–625
- Exports and Shipping Council, 585–586
- External migration (see also Emigration; Immigration), 66–68, 109–114, 111
- External trade (see also commodities by name; Exports; Imports; Terms of Trade Index; Volume Index of External trade), 608–609, 969, 970–972, 1012–1013
- by country and region, 609–612
- annual, by country, 614–618
- monthly, 613–614
- per head, 612
- annual, by country, 614–618
- monthly, 613–614
- by ports, by value, 653–654
- annual, by country, 614–618
- monthly, 613–614
- price and volume indexes, 678
- annual, by country, 614–618
- monthly, 613–614
- statistics of, types and sources, 613–614
- annual, by country, 614–618
- monthly, 613–614
- External transactions account, definition and basis of, 689–691
- and balance of payments, 713
- values, 693
F
- Factories (see also Manufacturing), 157, 882–883
- Families and the law (see also Family benefits; Family Courts), 304–306
- Family benefits, 100, 190, 193, 1009
- capitalisation of, 193, 810
- Family Courts, 288, 289, 305–306
- Family planning, 157, 854
- FAO see Food and Agricultural Organisation (United Nations)
- Farm employees, 418, 434, 870–871, 884, 885
- Farm Employment Scheme, 840
- Farm land, 335, 336, 413–416, 459, 803–806
- Farming (see also Aquaculture; Beef; Census of Agricultural Contracting Services; Dairy farming; Deer farming; Farm employees; Farm land; Farming Costs Price Indexes; Goat farming; Irrigation; Opossums; Sheep), 413
- accidents, 905–906
- capital expenditure, 418–420, 673
- financial assistance to, 803–806
- soils for, 413–415
- types of, listed, 417
- Farming Capital Expenditure Price Index, replaced by Capital Expenditure Price Index, 673
- Farming Costs Price Indexes, replaced by Agricultural Producers Price Indexes, 673
- Fathers, 126–127
- Federated Farmers of New Zealand, 342, 803
- Federation of Labour, 841, 872, 873, 875
- Feeding stuff for animals, 448, 624, 626–627, 638, 642
- Ferries, 374, 378–379
- Fertiliser (see also Topdressing), 430–431, 432
- Fibreboard, 465, 466
- Films see Cinemas; National Film Library; National Film Unit; New Zealand Film Commission
- Finance see Banks and banking; Local government finance; Monetary policy; New Zealand System of National Accounts (NZSNA)
- Finance companies, 782, 787–789
- instalment credit trading by, 597
- money and credit aggregates of, 777–778
- overdrafts and term lending by, 775
- Fines, 289
- Fire (see also Fire insurance; New Zealand Fire Service), 310–311, 460
- Fire insurance, 823–825
- First aid, 157
- Fish
- catch, 474–475, 477
- exports, 475–476
- species, 479–482
- Fisheries (see also Aquaculture; Census of Fishing; Fish; Forum Fisheries Agency; Ministry of Agriculture and Fisheries), 465, 473
- development of, 477
- exports, 475–476
- protection of see Exclusive Economic Zone
- research, 482
- resources, 473–475
- Fishing (see also Census of Fishing; Fish; Fisheries; Fishing vessels)
- by foreign vessels, 478, 479
- industry, 476–478, 874
- permits, 477
- recreational, 276–277, 482
- Fishing vessels, 371, 477, 736
- Flag, New Zealand, 928
- Flats see Buildings; Dwellings; Rents
- Fluoridation, 161
- Food
- consumption, 684–686
- expenditure on, 681
- and nutrition, 155–156
- processing, 248–249
- Food and Agriculture Organisation (United Nations) (FAO), 40
- Food Standards Committee, 156
- Footwear
- manufacture, 501, 512, 518, 524
- trade, 629, 681
- Foreign Affairs, Ministry of see Ministry of Foreign Affairs
- Foreign policy (see also Official Development Assistance), 31
- in relation to specific countries, organisations and regions, 32–41
- Foreign trade see External trade
- Foreign travel tax, 735
- Forest parks, 285, 328, 459
- Forest products see Timber and timber products
- Forest Research Institute, 468–469
- Forest Service see New Zealand Forest Service
- Forestry (see also Census of Forestry and Logging; Environment; Forests; Logging; New Zealand Forest Service; Timber)
- employment in, 469, 470
- private, 461
- production, 461–466
- research into, 468–469
- Forests (see also Forest parks; Forestry), 455–457
- conservation and protection of, 459–460
- exotic, 455, 457, 458
- native 455, 456, 458, 466
- replanting of, 330–331
- recreation in, 459
- Forum Fisheries Agency, 36
- Freeze see Price freeze; Rent freeze; Wage freeze
- Freight (see also Aviation; Cargo; Transport), 358, 375, 399–400
- Friendly societies, 53, 197, 203, 933, 946
- Frost, 21
- Fruit, 249, 444, 585
- preservation of see Canned fruit and vegetables Fuels see Coal; Gas; Liquid fuels
- Funerals, 135
G
- Galleries see Art galleries
- Gaming, 278
- Gas (see also Census of Gas Industry; Gas appliances; Gas Council; Gasfitters; Natural gas; Liquid petroleum gas (LPG)), 552–553, 569
- Gas appliances, 570, 571
- Gas Council, 560, 562
- Gasfitters, 164
- Gasoline see Motor spirits
- GELS see Group Employment Liaison Scheme
- General Agreement on Tariffs and Trade (GATT), 40, 578, 580, 655–656, 657
- General Assembly Library, 261, 262
- General Election 1984 (see also Elections)
- results by electorate, 1023–1032
- summary of results, 924
- Generalised System of Preference, 657
- Geological Survey see New Zealand Geological Survey
- Geology of New Zealand, 12–17
- Geothermal power, 555
- Geriatric hospitals, 171, 175
- Geysers, 6
- Gift duty, 744
- Glaciers, 7–8
- Glasshouses, products grown in, 442
- Goat farming, 453
- Gold, 28, 29, 486, 493–494
- overseas reserves of see Overseas reserves
- Golden Kiwi see Lotteries
- Government departments (see also Public Service)
- functions of, 939–947
- list of, 938–939
- public debt held by, 754
- Government Life Insurance Corporation, 825–826, 942
- Government Printing Office, 942
- Government securities see Securities
- Government Superannuation Fund, 208–210
- Governor-General, 47
- Graduates, university see Universities
- Grains (see also Barley; Linseed; Maize; Oats; Peas; Seeds; Wheat), 437–438, 439–440
- Grapes (see also Wine), 442, 444
- Greenstone, 487, 495
- Greyhound racing, 278
- Grooms, see Marriages
- Gross Domestic Product, 689–691
- components of, by production group, 695–700
- composition of, by sector of ownership, 700–701
- in constant prices, 706–708
- and expenditure, 691
- by production group, 694
- production groups as percentages of, 695
- Gross Fixed Capital Formation
- by production group and sector, 701–704
- by type of capital good, 704–705
- Gross National Product, 217, 553
- Group Employment Liaison Scheme (GELS), 840
- Group-living quarters, 88
- Guardianship, 305
H
- Hail, 20
- Halloysite, 495
- Handicapped child's allowance, 195
- Handicapped children see Disabled children; Handicapped child's allowance
- Handicapped persons see Disabled persons
- Harbour boards, 59, 755, 844
- finances 212, 757–758, 759, 760
- Health (see also Department of Health; Environmental health; Health benefits; Health education; Health insurance; Hospitals; Occupational health)
- mental, 177–180
- practitioners, 163–166, 171, 242, 243
- research, 161–162
- services, 152–154
- Health benefits, 166–170
- Health camps see Children's health camps
- Health education, 158–160
- Health insurance, 197
- Hearing aids, 168
- Heavy Engineering Research Association, 250, 254
- Hides see Skins
- High Court, 288, 291–293, 303, 349, 963
- Higher School Certificate, 222, 223
- Highways (see also Motorways), 384
- Hire purchase, 597–598
- Historic places see New Zealand Historic Places Trust
- Historic reserves, 261, 339, 340, 341
- History, 27–30
- chronology of, 975–980
- Holidays, 883, 926
- Home nursing services, 168, 172
- Homes see Children's homes; Joint family homes; Old peoples' homes
- Homicide see Murder
- Honey (see also Bees and beekeeping), 585
- Hops, 447
- Horse racing, 277–278
- Horticulture (see also Crops; Market gardens; Orchards), 253, 443
- Hospital benefits, 167, 168, 170
- Hospital boards, 152, 173–174
- finances, 57, 176–177, 212, 760
- services, 167, 168, 170, 172
- Hospitals (see also Geriatric hospitals; Hospital benefits; Maternity hospitals and units; Outpatients; Private hospitals; Psychiatric hospitals; Psychopaedic hospitals), 172–173
- beds and waiting lists, 174–175
- boards of see Hospital boards
- finance, 176–177
- incomes of, 171–172
- staff, 175–176
- Hostels, 542
- Hotels, 593
- Hours of work, 882, 883
- House of Representatives see Parliament
- Household incomes, 86
- Household services, 593, 681, 848, 876, 878
- Households (see also New Zealand Household Survey), 84–87
- Houses see Buildings; Dwellings; Housing
- Housework see Household services
- Housing (see also Building; Dwellings)
- community, 542
- costs of, 539–541, 681
- loans for (see also Housing Corporation; Mortgages) 533, 539, 541–542
- Maori, 542
- rental (see also Rents), 541–543, 811–812
- rural, 541
- state services, 543
- tied, 810
- Housing Corporation, 539, 541–543, 806–812, 942
- Human Rights Commission (see also Race relations; Women), 121, 915, 928, 934
- Humidity, 21–22
- Hunting, 277
- Hydro-electric power see Electricity
I
- IAEA see International Atomic Energy Agency
- IBRD see International Bank for Reconstruction and Development
- IDA see International Development Association
- IFC see International Finance Corporation
- Ilmenite, 494
- ILO see International Labour Organisation
- IMF see International Monetary Fund
- Immigration, 110, 111, 114–118, 281, 1010
- history of, 66–68
- Immunisation, 158
- Import licensing, 619–620
- Import Prices Index, 675–676, 677, 678, 964
- Imports, 613, 614–618, 641, 969, 1012–1013
- from ASEAN AND ESCAP countries, 630–631
- by broad economic category, 652, 653
- licensing see Import licensing
- origin of, 644–649
- quantities of principal items, 649–650
- value of principal items, 650–652
- value by SITC, 641–644
- Imprisonment (see also Convictions; Prisoners; Prisons), 290–291, 297
- Income tax (see also PAYE tax; Taxation), 737, 740, 762–765
- index of, 861
- revenue from, 728, 735
- Incomes (see also Income tax; Real Disposable Income Measures; Wages), 762–769
- of companies see Companies
- of health practitioners, 171
- of households, 86, 680
- Index of Employment, 707, 708
- Index of Gross Domestic Product, 706–707
- Index of Real Gross Domestic Product, replaced, 707
- Indexes see Agricultural Producers Price Index; Capital Expenditure Price Index; Consumers Price Index; Effective Weekly Wage Rates Index; Index of Employment; Export Prices Index; Farming Costs Price Index; Index of Gross Domestic Product; Import Prices Index; Prevailing Weekly Wage Rates Index; Producers Price Index; Ratio of Disposable to Gross Income Index; Real Disposable Income Index; Reproduction Index; Terms of Trade Index; Urban Residential Property and Section Price Index; Volume Index of External Trade)
- Industrial accidents, 895–899
- Industrial chemicals see Chemicals and chemical products
- Industrial Conciliation Service, 873
- Industrial design, 916, 917
- Industrial relations, (see also Employment; State Services Commission; Trade unions; Wages; Work stoppages), 872–874, 886
- Industrial Relations Council, 873
- Industrial safety see Occupational safety
- Industrial stoppages see Work stoppages
- Industrial unions see Trade unions
- Industries Development Commission, 507, 620
- Industry see Manufacturing
- Infant mortality, 94, 140–141, 921, 962
- Inflation see Consumers Price Index
- Information Authority, 931
- INFOS (Information Network for Official Statistics), 1001–1007
- Inland Revenue Department, 942
- Insurance see Accident insurance; Earthquake and War Damage Commission; Fire insurance; Government Life Insurance Corporation; Health insurance; Life insurance; State Insurance Office
- Intellectually handicapped children see Disabled children
- Inter-industry studies, 722–724
- Interest rates, 759, 775, 787–788
- controls on, 779, 781
- mortgages, 800, 802, 809
- Intermediate schools, 228
- Internal Affairs, Department of see Department of Internal Affairs
- Internal migration, 91
- International Atomic Energy Agency (IAEA), 40, 251
- International Bank for Reconstruction and Development (IBRD), 40–41, 797
- International Development Association (IDA), 798
- International Finance Corporation (IFC), 40–41, 797
- International Labour Organisation (ILO), 40
- International Monetary Fund (IMF), 40–41, 797
- International relations see Foreign policy
- International Union for Conservation of Nature and Natural Resources, 330
- International Wool Secretariat, 584
- Invalids' benefits, 193, 1009
- Investment, 507
- overseas, see Overseas investment
- Iron (see also Ironsands; Steel), 486, 493, 1013
- Ironsands, 486, 493
- Irrigation, 253, 332–333, 431
J
- Jade see Greenstone
- Japan, trade with, 611
- Joint family homes, 543, 934
- Judges see Judiciary
- Judiciary, 48, 938
- Juries, 289
- department of see Department of Justice
- system of see Court system; Penal system
- Justice
- department of see Department of Justice
- system of see Court system; Penal system
K
- Kapuni gas field, 5
- Kermadec Islands, 549, 554, 555
- Kindergarten teachers, 226
- Kindergartens, 225–226
- Kokiri Centres, 99–100
- Kokiri Units, 103
- Korea, trade relations with, 611
- Kraft paper and cardboard
- exports of, 625, 626, 638
- production of, 463, 464
L
- Laboratories (see also Laboratory benefit), 251
- dental and medical, 602, 604
- DSIR, 250, 334
- workers and conditions in, 66, 883, 908
- Laboratory benefit, 168
- Labour, Department of see Department of Labour
- Labour force (see also Employment; Unemployment), 831, 965
- and Index of Gross Domestic Product, 707
- Maoris in, 95–96
- projections, 833–834
- women in, 851–854
- Labour Party, 30, 924, 1023–1032
- Lactose, 421
- Lakes, 10–11
- conservation of, 325, 328, 329, 331, 332, 334, 951
- recreational, 276, 482
- Lamb, 608–610, 624–625
- consumption, 684
- export prices, 585, 588, 589
- exports, 576, 577, 582, 633, 686, 970, 1012
- production, 422, 423
- retail prices, 667, 669
- Lambs see Sheep
- Land (see also Crown land; Maori land; Real estate; Surveys)
- development and settlement of (see also Land Settlement Board), 104, 323, 337, 419
- tenure of (see also Land transfers; Leasehold land), 344–348
- use of (see also Farm land; Land Use Advisory Council; Occupied land; Recreational land), 323–325, 455
- valuation of see Valuation of land
- wars over, 29
- Land Settlement Board, 335, 337
- Land tax, 348, 742
- Land transfers, 344–345, 346–347, 974
- Land Use Advisory Council, 324–325
- Lands and Survey, Department of see Department of Lands and Survey
- Latin America, relations with, 38, 611
- Law reform, 287
- Laws see Law reform; Legislation
- Lawn mowers, 523
- Lead, 154, 156, 494
- Leasehold land and leases, 336–337, 345–346, 416, 743
- Leather (see also Skins), 501, 512, 517–518, 670
- exports, 609, 611, 626–628
- imports, 643, 646, 651
- research, 250, 254, 334
- Legal aid, 304
- Legal system see Judiciary; Justice; Legislation
- Legal tender, 790
- Legislation, 287, 290
- current, listed, 931–938
- passed 1982/1983, 53
- Legislative Department, 53, 939
- Lending see Loans
- Libraries (see also School Library Service), 261–266, 982, 986
- local government, 58
- Library school, 263
- Licences (see also Licensing)
- drivers, 295, 385–386, 393
- fishing and game, 409
- radio and television, 270
- Licensing
- of air services and pilots, 619–620
- of gambling, 278
- of imports, 619–620
- of liquor see Liquor licensing
- of motor vehicles, 385–387
- of prospecting and mining, 494, 555
- of road transport, 387–388, 390
- Licensing Control Commission, 921, 922
- Licensing trusts, (see also Alcohol; Hotels; Liquor licensing), 59–60, 923–924
- Life insurance, (see also Government Life Insurance Corporation), 782, 819–822
- Life tables, 133, 134, 854–855
- Lighthouse service, 371
- Lignite (see also Coal)
- reserves, 486–487
- uses for, 490–492, 504, 558
- Lime and limestone, 13, 502
- fertiliser, 400–401, 414
- production, 486, 488, 495, 497, 499
- Liner services, 362–364
- Linseed, 442–443
- Liquid fuels (see also Liquid Fuels Trust Board; Motor spirits; Petroleum), 553–555, 556–559
- Liquid Fuels Trust Board, 553, 558–559
- Liquefied petroleum gas (LPG), 329, 383, 504, 571, 558, 737, 920
- Liquigas, 553, 569
- Liquor see Alcohol; Liquor licensing
- Liquor licensing, 294, 921–924
- Livestock (see also Cattle; Deer farming; Goat farming; Opossums; Pigs; Poultry; Sheep), 708, 806
- breeding, 253
- exports, 399–400, 625
- production, 414–420, 448–454, 967
- Loans (see also Banks and banking; Debt; Mortgages)
- by banks, regulation of, 770, 779–780, 781–782
- for disabled persons, 195, 196
- for Maoris and Polynesians, 100
- for servicemen, 207
- energy conservation, 556–558
- for disabled persons, 195, 196
- for Maoris and Polynesians, 100
- for servicemen, 207
- for farms, 432, 803–806
- for disabled persons, 195, 196
- for Maoris and Polynesians, 100
- for servicemen, 207
- fishing industry, 478
- for disabled persons, 195, 196
- for Maoris and Polynesians, 100
- for servicemen, 207
- forestry, 461
- for disabled persons, 195, 196
- for Maoris and Polynesians, 100
- for servicemen, 207
- government, 692, 718
- for disabled persons, 195, 196
- for Maoris and Polynesians, 100
- for servicemen, 207
- housing
- for disabled persons, 195, 196
- for Maoris and Polynesians, 100
- for servicemen, 207
- Loans Accounts (see also Public debt), 378, 725–726, 728, 731–732, 734, 749
- Loans Redemption Account, 726, 732, 734, 753
- Lobsters, 475, 476, 477, 480
- Local Authorities Loans Board, 57, 759–760
- Local authorities (see also Communities; Local government; Local government regions; Regional authorities; Special-purpose authorities; Territorial authorities), 56–58, 62–64
- employment, 844
- housing, 541–542
- investment and superannuation, 210–212
- loans see Local Authorities Loans Board
- roading funds for, 384
- Local government (see also Local government finance; Local authorities; Local government regions), 56–65
- Local government finance
- borrowing, 759–760
- rates, 349–350, 755
- grants, 755–757
- expenditure, 757–758
- rates, 349–350, 755
- grants, 755–757
- income
- rates, 349–350, 755
- grants, 755–757
- Local government regions (see also Boroughs; Cities; Communities; Counties; District communities; Districts; Population centres; Town districts) population of, 65–70, 73
- Local Government Commission, 64
- Lockouts see Work stoppages
- Logging (see also Census of Forestry and Logging; Forestry), 251, 254, 358–359, 456, 458, 465
- Lotteries, 278–279
- funding from, 170, 257–261, 276
- tax and, 736, 739
- Lubricants, 551, 628, 642, 652
- Lucerne, 252, 443, 624, 626
M
- Maatua Whangai, 103
- Magnesite, 487
- Mail, 402–403
- air, 396, 397, 398–399
- private sector delivery of, 601, 603
- Maize, 437, 438, 440, 443
- exports, 624, 625
- Mana Motuhake Party, 924, 1023–1032
- Manganese, 495
- Manufacturing (see also Census of Manufacturing; individual products)
- assistance to, 506–508
- historical development of, 500–504
- main indicators of, 1010
- production, 523–525
- quarterly economic survey of, 525–527
- research into, 249–250, 508
- trends, 504–505
- Manufacturing Development Council, 507
- Maori Affairs, Department of see Department of Maori Affairs
- Maori Appellate Court, 104, 288
- Maori and Pacific Island Community Officers, 103
- Maori Community Services Programme, 101, 203
- Maori Education Foundation, 97
- Maori electorates (see also Maori Members of Parliament), 51, 52
- Maori land (see also Maori Land Court), 29, 103–105, 459
- Maori Land Court, 104, 288
- Maori language, 101–102, 225, 230, 234
- Maori Members of Parliament (see also Maori electorates; Members of Parliament), 51, 53
- Maori population (see also Maoris), 93–94, 1009
- age distribution of, 95
- birth rates of, 123
- death rates of, 131–132, 133
- geographical distribution of, 94
- infant mortality in, 140–141
- life expectancies of, 134–135
- natural increase of, 123
- occupational groups in, 96–97
- sex ratio of, 95
- Maori roll see Maori electorates
- Maori Trustee, 104–105, 754
- Maori wardens, 103
- Maori Women's Welfare League, 103
- Maoris (see also Department of Maori Affairs; Maori electorates; Maori land; Maori language; Maori population)
- admissions to hospital, 177–178
- art of, 259–260
- education of, 97–100, 228, 229, 238
- history of, 27, 29
- housing and household amenities of, 100–101, 108, 542
- in labour force, 95–96, 107
- incomes of, 97
- unemployment among, 95, 100
- unlawful discrimination against, 915
- Mapping, 344, 943
- Maps, collections of, 260, 262, 264, 926
- Marine pollution, 329, 334, 372
- Marital status, 83, 148
- Maritime parks and reserves, 340–341
- Maritime planning, 326–327
- Market gardens, 415
- Marketing, of agricultural products, 251–253, 575–576
- authorities for, 582–585
- Marriage (see also Dissolution of marriage; Marriage guidance; Marriages)
- and citizenship, 115
- and the law, 304–306, 543, 743
- Marriage guidance (See also National Marriage Guidance Council), 150–151
- Marriages (see also Dissolution of marriage; Marriage; Marriage guidance; Marital status; Separation, marital), 145–151
- Marsden Point
- oil fired power stations, 486, 560, 562, 565
- oil refinery, 502, 551–552, 559
- Maternal deaths, 141
- Maternity benefits, 166, 167, 169, 189
- Maternity hospitals and units, 157, 167, 174, 175
- Maternity leave, 121, 884
- Maui gas field, 549, 562, 569
- development, 502, 552–555
- Meat and meat products (see also Beef; Chicken; Meat Industry Research Institute; New Zealand Meat Producers Board; Pigmeats; Reserve Accounts; Sheepmeats; Tallow; Veal),
- consumption, 681, 684, 686
- grants to, 432–433
- pollution by, 334
- research by, 250–254
- exports, 423–424, 582, 621–622, 622, 632–634, 686, 970, 971–972, 1012–1013
- grants to, 432–433
- pollution by, 334
- research by, 250–254
- imports, 632–634, 642
- grants to, 432–433
- pollution by, 334
- research by, 250–254
- industry
- grants to, 432–433
- pollution by, 334
- research by, 250–254
- prices, 588–590
- production, 422–424, 423, 967
- processing, 500, 511, 517
- Meat Industry Research Institute, 251
- Medical benefits, 166, 169, 187, 188
- Medical Council, 162
- Medical insurance see Health insurance
- Medical laboratory technologists, 165–166
- Medical practitioners see Doctors
- Medical radiation technologists, 165
- Medical Research Council, 162, 172, 254
- Members of Parliament, 54–56, 924, 1023–1032
- salaries and allowances, 46–47
- Mercantile marine pensions, 205
- Merchant banks, 789
- Merchant navy, 371
- Mercury, 334, 495
- Mergers, 599, 788, 799
- Metals (see also Aluminium; Copper; Gold; Iron; Lead; Manganese; Mercury; Mineral products; Platinum; Silver; Steel; Tin; Tungsten; Zinc), 486–497, 505
- Middle East, 33, 611–612
- Methanol
- plant, Taranaki, 329, 502, 504, 552
- research into, 249, 559
- Metric system, viii, 915
- Migration, external see External migration
- Mileage tax. 726, 735, 736
- Milk and milk products
- consumption, 684, 686
- exports, 624–625, 636, 686, 794, 971
- inspection and standards, 429
- marketing (see also New Zealand Milk Board; Town milk supply), 585, 587
- processing, 511, 517
- production, 421–422, 524
- retail price, 667, 669
- subsidies, 432, 920
- transport, 449
- Milkfat, 422, 433, 578–579, 967
- Mineral products, 694–695, 697, 701–704, 706–707, 766
- exports, 629
- imports 643
- value, 526–527
- Minerals (see also Liquid fuels; Mineral products; Mining)
- Antarctic, 39
- exports, 628
- imports, 642
- production, 486–487
- metallic see Metals
- non-metallic. 495–496
- Miners, 187, 189–192, 850
- benefits, 194, 1009
- Mining (see also Census of Mining and Quarrying; Minerals; Miners), 493–494, 495–496, 555
- on Crown land, 336
- and environment, 323–324, 330, 336
- laws on, 486–487
- safety and working conditions, 885, 908
- taxation and incentives, 506, 741–743, 763
- Ministers of the Crown, see Cabinet
- Ministry of Agriculture and Fisheries, 428–430, 477, 940
- research by, 251–254
- Ministry of Civil Defence, 311–312
- Ministry of Defence, (see also Armed Forces), 940
- Ministry of Energy, 553, 941
- Ministry of Foreign Affairs, 941
- overseas posts see New Zealand's overseas posts
- Ministry of Recreation and Sport, 276
- Ministry of Transport, 946
- Ministry for Women's Affairs, 54
- Ministry of Works and Development, 947
- Molybdenum, 495
- Monarchy (see also Constitution), 44, 47
- Monetary policy (see also Money supply), 770–771, 779–782
- Money see Currency; Legal tender; Monetary policy; Money market dealers; Money supply
- Money market dealers, 782
- Money orders, 403–404
- Money supply (see also Monetary policy), 777–779, 789
- Monopolies, 599
- Mortality see Deaths; Death rate; Infant mortality; Natural increase
- Mortgages (see also Housing; Housing Corporation), 539, 541, 800–803, 979
- Mothers (see also Births; Maternal deaths; Maternity benefits; Maternity hospitals and units; Maternity leave), 102, 126–127, 129, 157, 199
- Motor cycles, 386
- Motor spirits, duty on, 658, 726, 728, 733, 735, 736, 737
- Motor vehicles, 391, 409, 556, 1013
- licensing, 385–387
- Motorcars see Motor vehicles
- Motorways (see also Highways), 384
- Mountaineering, 277
- safety see New Zealand Mountain Safety Council; Search and rescue operations
- Mountains (see also Mountaineering), 6–7, 12–14, 338–339, 459
- Multiple births, 124, 126, 127
- Municipal Association of New Zealand, 64, 342
- Murder, 293, 301, 307
- Museums (see also National Museum), 234, 260
- Mussels, 474, 475, 476, 480
- Mutton
- consumption, 684
- exports, 577, 582, 588–589, 624–625, 634, 686, 970, 1012
- production, 422, 423, 423
N
- Narcotics see Drugs
- Nassella tussock boards, 59
- National Accounts, see New Zealand System of National Accounts
- National Acoustics Centre, 156, 157
- National Advisory Committee on Women and Education, 120
- National Advisory Council on the Employment of Women, 119
- National anthems, 926–927
- National Archives, 260–261
- National Art Gallery, 258, 260, 261
- National Council of Adult Education, 246
- National Disposable Income, 689–692, 736
- National Drug Intelligence Bureau, 308
- National Film Library, 234
- National Film Unit, 945
- National Health Institute, 161, 254
- National Health Statistics Centre, 132, 137, 138, 141, 161
- National Housing Commission, 529
- National Library of New Zealand, 261–263, 266
- National Licensing Poll, 925
- National Marriage Guidance Council, 150–151
- National Museum, 260, 261
- National parks (see also Forest parks; Reserves), 337–339, 341
- National Parks and Reserves Authority, 338
- National Party, 30, 45, 924, 1023–1034
- National Provident Fund, 210–212, 754
- National Radiation Laboratory, 157
- National Research Advisory Council, 254–255, 257, 468
- National Roads Board, 382, 384
- National Roads Fund, 383–385, 733–734, 737
- National Superannuation, 192, 211
- number of beneficiaries, 190, 1009
- rates of, 191
- National Trust see Queen Elizabeth II National Trust
- National Water and Soil Conservation Authority, 331
- Natural gas (see also Kapuni gas field; Maui gas field; Natural Gas Corporation), 569–572
- industrial development of, 504, 552, 555
- Natural Gas Corporation, 552, 569, 752
- Natural increase, of population, 68–69, 123, 962
- Nature Conservation Council, 330, 335
- Nature reserves, 339, 340, 341
- Navy see Royal New Zealand Navy
- New Zealand Apple and Pear Marketing Board, 584
- New Zealand Army, 318–319
- New Zealand Australia Closer Economic Relations Trade Agreement (CER) see Australia New Zealand Closer Economic Relations Trade Agreement
- New Zealand Authors' Fund, 258
- New Zealand Certificate, 165, 166, 242, 258
- New Zealand Council for Educational Research, 245
- New Zealand Council for Recreation and Sport, 276
- New Zealand Counties Association, 64
- New Zealand Dairy Board, 422, 582
- New Zealand Energy Research and Development Committee, 558
- New Zealand Export-Import Corporation, 508, 621, 752
- New Zealand Film Commission, 259, 279
- New Zealand Fire Service, 57, 310–311
- New Zealand Forest Service, 457–461, 470, 941–942
- New Zealand Geological Survey, 16, 491, 499
- New Zealand government stock, 797
- New Zealand Historic Places Trust, 258, 260, 261, 756
- New Zealand Household Survey, 679–680
- New Zealand Land Resource Inventory, 333
- New Zealand Listener, 267, 269
- New Zealand Literary Fund, 258
- New Zealand Lottery Board, 259–261, 276, 279
- New Zealand Maori Council, 101, 103, 342
- New Zealand Meat Producers Board, 424, 582–583
- New Zealand Meteorological Service, 17, 26
- New Zealand Milk Board, 422, 585
- New Zealand Mountain Safety Council, 276
- New Zealand Party, 924, 1023–1032
- New Zealand Planning Council, 203, 352–353, 590
- New Zealand Police see Police
- New Zealand Ports Authority, 362
- New Zealand Potato Board, 454, 584–585
- New Zealand Poultry Board, 585
- New Zealand Railways Corporation, 373–378, 379–380, 944, 966
- passenger services
- rail, 358, 359, 375
- road, 379–380
- revenue and expenditure, 376–378
- New Zealand Standard Industrial Classification (NZSIC), 357
- New Zealand Symphony Orchestra, 269
- New Zealand System of National Accounts (NZSNA) (see also Balance of payments; Inter-industry studies), described, 689
- domestic see Agricultural Production Account; Consolidated Accounts; Gross Domestic Product; Gross Fixed Capital Formation; Production accounts
- New Zealand Technical Correspondence Institute, 244
- New Zealand Time Service, 925
- New Zealand Walkway Commission, 343
- New Zealand Water Safety Council, 144, 276
- New Zealand Wheat Board, 438
- New Zealand Wool Board, 426–428, 584
- New Zealand Workers Educational Association (WEA), 246
- New Zealand's overseas posts, 954–957
- Newspapers, 262, 271–272, 518
- Newsprint, 463, 464, 467
- exports, 467, 623, 625, 626, 640
- Niue, 35–36, 42, 208, 268, 363–364
- immigrants from, 89, 114, 117, 118
- trade with, 610, 615, 631
- Noise, 154, 157, 329, 334, 883–884
- North America, relations with, 610
- Noxious weeds (see also Nassella tussock boards; Pest control), 432
- Nuclear energy see International Atomic Energy Agency
- Nurseries see Child care
- Nurses, 163
- Nursing (see also Home nursing services), 156
- NZSNA see New Zealand System of National Accounts
O
- OASIS see Overseas Access Service for Information Services
- Oats, 438, 966
- Occupational diseases, 156
- Occupational groups (see also Health practitioners; Self-employed; Teachers; Valuers), 845, 894, 920
- emigration and immigration by, 112–113, 115–116, 1010
- of Maoris, 96–97
- Occupational health, 156–157, 908
- Occupational safety, 164, 907–908
- in agriculture, 885–889
- in factories, 883–884
- Occupational therapy and therapists, 153, 163, 175, 241
- Occupations see Occupational groups
- Occupied land, 30, 416
- OECD see Organisation for Economic Co-operation and Development
- Official Development Assistance (ODA), 41–44
- Official information, 929–931
- Offshore mining, 552, 553
- Oil see Petroleum
- Oils, vegetable, 511, 517
- Old people (see also Age distribution of population; Geriatric hospitals; Old peoples' homes; Superannuation), 170, 541
- Old peoples' homes, 144, 171–172, 604
- Ombudsmen, 49–50, 57, 931
- Onions, 442
- Opossums
- as pests see Pest Destruction Boards
- farming of, 453, 460
- Opticians and optometrists, 164, 171
- Orchards, 444
- Orchestras, 259, 285
- Organisation for Economic Co-operation and Development (OECD), 32, 247
- Organisation of Petroleum Exporting Countries (OPEC), 33, 169
- Orphans, 189, 192
- benefits for, 193, 1009
- Orthopaedic implants, 169
- Outpatients, 167, 168
- Overseas Access Service for Information Services (OASIS), 406
- Overseas aid see Official Development Assistance
- Overseas debt see Public debt
- Overseas exchange transactions (see also Exchange rates), 613, 713, 771, 792–797
- Overseas investment (see also Overseas Investment Commission)
- by New Zealanders, 72
- in New Zealand, 505–507, 718–721, 719, 796–797
- Overseas Investment Commission, 505, 507, 796
- Overseas reserves (see also Overseas exchange transactions), 715, 718, 771, 792, 972
- Overseas securities, 797
- Overseas students, 117, 221, 239
- Overseas travel allowance, 795
- Oysters, 480–481
P
- Pacific see South Pacific
- Pacific Forum Line, 36, 362, 363, 364
- Pacific Island Polynesians, 105–109
- education, 97, 99, 248
- immigration of, 35
- non-representation in Parliament, 53
- Pacific Islands Polynesian Education Foundation, 97, 248
- Pacific Islands see Cook Islands; Niue; South Pacific; Tokelau; Western Samoa
- Pacific Islands Industrial Development Scheme (PIIDS), 507
- Paper see Pulp and paper
- Parents see Families; Fathers; Mothers; Solo parents,
- Parliament, 45–47, 52–54, 925
- members of see Members of Parliament
- Parole system, 300–301, 306
- Particle board, 465–466, 539
- Parks see National parks
- Passports, 117–118
- Patents, 916
- Patients see Hospitals
- Paua, 481
- Pay Research Unit, 945
- PAYE tax, 738–740
- Pears, 446, 971
- Peas, 439, 440, 966
- Pelts see Skins
- Penal system (see also Corrective training; Fines; Imprisonment; Parole; Periodic detention; Prisons; Probation), 289–291
- Pensions see Benefits; Superannuation
- PEP see Project Employment Programme
- People living alone, 87
- Perinatal mortality see Infant mortality
- Periodic detention, 290
- Perlite, 487, 495
- Permits, see Building; Fishing
- Personal services, 593
- Pest control see Pest Destruction Boards
- Pest Destruction Boards, 59–60, 252, 757–758
- Pesticides, 519
- Petrochemical Corporation of New Zealand Ltd. (Petrochem), 552–553
- Petroleum (see also Liquefied Petroleum Gas (LPG); Lubricants; Organisation of Petroleum Exporting Countries (OPEC), 554, 556–559
- consumption, 551–552
- drilling, 552, 555
- imports, 552, 1013
- prospecting, 555
- refinery see Marsden Point
- Pharmaceutical benefits, 166
- Pharmaceuticals, 513, 519
- Pharmacists, 165
- Phosphate, 496
- Physiotherapists, 163, 171
- Physiotherapy benefits, 168
- Pigmeats (see also Bacon; Pork Industry Council), 582, 684
- Pigs, 451–452, 967
- Pip fruit see Apples; Pears
- Planning (see also District planning; New Zealand Planning Council; Planning tribunal; Regional planning), 323–325, 352–353
- energy, 553–554
- Planning Tribunal, 57, 64, 327
- Plastics, 514, 519
- Platinum, 495
- Play centres (see also Te Kohanga Reo), 215, 218, 219, 220, 225–226
- Plumbers, 164
- Plunket Society, 157
- Plywood, 465, 466
- Podiatrists, 164
- Poisoning, (see also Accidents) 142–143
- Poisons, (see also Poisoning), 156
- Police, 307–309, 944
- Political parties, 29–30, 924, 1023–1032
- Pollution (see also Air pollution; Water), 334–335
- Population (see also Census of Population and Dwellings), 66–68, 962, 1009
- age distribution see Age distribution of population
- birthplaces see Birthplaces of population
- centres of, 78
- density of, 81
- distribution of, 70–81
- ethnic groups in see Ethnic groups in population increase of see Natural increase of population of local government regions see Local government regions
- marital status of see Marital status
- Maori see Maori population
- Polynesian see Pacific Island Polynesians
- projections of, 69–70
- religious professions of see Religious professions of population
- sex ratio in, 81, 126
- urban see Urban population
- of world see World population
- Population centres, 78
- Pork Industry Council, 454, 583
- Port Agriculture Service, 430
- Ports, 362, 365–367, 368–370, 430, 476
- trade by, 653–655
- Post Office (see also Bureaufax service; Data service; Mail; Overseas Access Service for Information Services (OASIS); Telegraph services; Telephones), 401–402, 408–409, 944
- revenue and expenditure, 407–408
- savings bank see Post Office Savings Bank
- Post Office Savings Bank, 783–784, 974
- Postal notes and orders, 404
- Potatoes, (see also New Zealand Potato Board), 441–442, 966
- Pottery see China, earthenware and pottery
- Poultry (see also Chicken; Eggs; New Zealand Poultry Board), 453
- Power boards, 59–60, 564
- Pre-release hostels, 300
- Pre-school education (see also Child care; Kindergartens; Play centres), 215, 225–226, 247–248, 602–603
- Prevailing Weekly Wage Rates Index, (see also Real Prevailing Weekly Wage Rates Index), 866–869, 965, 1017–1018
- Price control, (see also Price freeze) 577, 585–586, 660–662
- Price freeze, 408, 661, 781, 791
- Price indexes (see also Capital Expenditure Price Index; Consumers Price Index; Export Prices Index; Farming Costs Price Index; Import Prices Index; Producers Price Index; Urban Residential Property and Section Price Index), 662, 964, 1013
- external trade, revision of, 675–676
- Prices (see also Price control; Price freeze; Price indexes), 662
- energy, 555
- farm products, 586–590
- housing, 539–541
- international comparison, 669
- retail trade, 667–669
- Primary education see Primary schools
- Primary schools, 226–228, 247, 248, 602–603, 963
- Primary teachers, 232
- Prime Minister's Department, 944
- Printing, 513, 518, 818, 942
- Prisoners, 297–301, 963
- Prisons (see also Imprisonment; Prisoners), 297–299, 301
- Private hospitals, 171–172, 175
- and health benefits, 167, 170, 602, 604
- Private savings banks, 784–785
- Private schools, 215, 963
- Privy Council, 48, 288
- Probation, 289–290, 297
- Producers Price Index, 669–671
- Production accounts (see also Agricultural Production Account), 689–701
- Profits, companies, 818
- Project Employment Programme (PEP), 840
- Prostheses, see Artificial aids
- Psychiatric hospitals, 167, 173–174, 175, 177–180
- Psychological services and psychologists, 163, 299–300
- Psychopaedic hospitals, 174
- Public debt, 726, 749–754, 760, 779
- overseas, 749, 750, 751, 753, 973
- Public holidays see Holidays
- Public lands see Crown land; National Parks; Queen Elizabeth II National Trust; Reserves; Walkways
- Public Service (see also Government departments; State Services Commission), 947–948
- Public Trust Office, 917–918, 949
- Public Works (see also Ministry of Works and Development), 29–30, 325, 753
- Publishing (see also Printing), 925–926
- Pulp and paper, 463–465, 465, 467, 1013
- Pumice, 487, 495
Q
- Qualifications, 98, 228, 244–245
- Quality assurance, 250, 429
- Quarries and quarrying see Census of Mining and Quarrying; Minerals; Mining
- Quarterly Economic Survey of Manufacturing, 525–527
- Quarterly Survey of Retail Trade, 594–595
- Quarterly Survey of Wholesale Trade, 596–597
- Queen Elizabeth II Arts Council, 258–259
- Queen Elizabeth II National Trust, 341–343
R
- Rabbits, 252, 253, 429
- Race relations (see also Ethnic groups in population), 915
- Racing, 277–278, 748
- Radiation, 157
- Radio, 268, 406, 407
- Raffles see Lotteries
- Railways
- private, 379
- state see New Zealand Railways Corporation
- Rainfall, 18–19, 20
- Raoul Island, 5
- Rape and sexual offences, 293, 294, 304, 309
- Rapu Mahi programme, 100
- Rates see Local government finance
- Ratio of Disposable to Gross Income Index, 861–862
- Real Disposable Income Index, 861–862, 862
- Real Disposable Income measures, 860–862
- Real estate, 601, 603, 605
- Real Gross Domestic Product, Index of, replaced, 707
- Real Nominal Weekly Wage Rates Index, 1017
- Real Prevailing Weekly Wage Rates Index, 1017–1018
- Recreation and sport, 275–279
- Ministry of see Ministry of Recreation and Sport
- Recreation reserves, 341
- Recreational land, 327–328
- Recycling, 505–506
- Redundancy, 857
- Re-exports see Exports
- Refinery, petroleum see Marsden Point
- Refrigerators, 625, 627
- Refugees, 116–117
- Regional authorities (see also Regional councils; United Councils), 757–758, 844
- Regional Councils, 61–63, 259, 327, 756
- Regional development, 469, 506, 507
- Regional government, 60–61, 73, 983
- Regional planning, 63–64, 73, 325–326
- Regional water boards, 331–334
- Rehabilitation, 161, 171
- after accidents, 889
- of prisoners, 289
- of war veterans, 203
- Re-imports see Imports
- Religious professions of population, 88, 121, 149
- Rent freeze, 661
- Rental cars, 284, 386
- Rents, 541, 548, 661, 681, 811
- Representation Commission, 51
- Reproduction Index, 125
- Research (see also Department of Scientific and Industrial Research; National Research Advisory Council), 254–257, 331, 468–469, 508
- Reserve Accounts, 726, 730, 734
- farming industry, 587, 590
- Reserve Bank of New Zealand, 770–773
- Reserves of currency see Overseas reserves
- Reserves, land (see also Historic reserves; Maritime parks and reserves; Nature reserves; Recreation reserves; Wildlife reserves), 337, 339–340, 341
- Resource conservation see Recycling
- Rest homes see Old peoples' homes
- Restaurants, 593
- Retail prices see Prices
- Retail trade (see also Credit; Hire purchase; Prices; Shops), 593, 594–596, 595, 1011
- Rivers, 8–10, 333–334
- Road safety, 390–392
- Road transport, 358, 359, 380, 387–388
- Road user charges, 383
- Roads (see also Highways; Motorways; National Roads Fund; Road safety; Road transport), 380–385
- Rock aggregate, 487, 495
- Ross Dependency (see also Antarctic), 913–914
- Royal commissions, 50–51
- Royal New Zealand Air Force, 320–321
- Royal New Zealand Volunteer Reserve, 318
- Royal New Zealand Navy, 317–318
- Royal Society of New Zealand, 251, 338, 914
- Rubber and rubber products, 62, 514
- imports, 642–643, 645–646, 649
- Rural Banking and Finance Corporation, 803–806, 944
- Rural Electricity Reticulation Council, 564, 756
S
- Safety (see also Accidents; Fire; New Zealand Mountain Safety Council; New Zealand Water Safety Council; Occupational safety; Road safety), 889
- Salaries see Wages
- Sales tax, 556, 728, 735
- Salmon, 481
- Salt, 487, 496
- Samoans, citizenship of (see also Western Samoa), 115, 116
- Sand, 487
- Sand dunes, 458
- Sanitary services, 601, 603, 833, 860
- Satellites, 406
- Savings banks (see also Post Office Savings Bank; Private savings banks; Trustee savings banks), 782–783
- Sawmills, 512, 518
- Scallops, 481
- Scenic reserves, 340
- School Certificate, 98, 222, 223
- School Dental Service, 153, 160
- School Library Service, 230, 263
- Schools (see also Correspondence School; District high schools; Intermediate schools; Primary schools; Private schools; Secondary schools), 214–215, 218–221
- broadcasts to, 234
- buildings for, 217–218
- publications for, 234
- pupils of, numbers enrolled, 219, 221, 227, 228, 229, 963
- transport to, 231
- Science and scientific services, (see also Research), 250–251
- Scientific and Industrial Research, Department of see Department of Scientific and Industrial Research
- SCOPE see Small Co-operative Enterprises Scheme
- Search and rescue operations, 309, 315
- Secondary schools, 214, 228–229, 246, 963
- Secondary teachers, 220–221, 232–233
- Securities, overseas, 797, 816
- Securities Commission, 816
- Security Intelligence Service, 321–322
- Seeds, 442, 443, 971
- Seismic activity, 14–16
- Self-employed, 107, 196
- Sentencing, on conviction see Convictions
- Separation, marital, 83, 149–150, 304, 305–306
- Serpentine, 487, 496
- Services, census of see Census of Services
- Share Prices Index, 678, 964, 965
- Shearers, 885
- Sheep, and sheep farming, 448, 450–451, 967
- Sheepmeats (see also Lamb; Mutton), 424, 576, 577
- Shellfish, 480
- Shipping (see also Liner services; Ships), 358–365, 885, 908
- Shipping Corporation of New Zealand, 364
- Ships (see also Fishing vessels; Shipping), 371–372
- Shoes see Footwear
- Shooting, 277
- Shops, 884
- Sickness benefits, 194, 196, 409, 1009
- Silica, 487, 495
- Silver, 486, 494
- SITC see Standard Industrial Trade Classification Sixth Form Certificate, 222, 223, 245
- Skiing, 277
- Skim-milk and skim-milk powder
- production, 421, 524
- trade in, 578, 579, 611
- Skins (see also Leather) 971–972, 1013
- Small business (see also Companies), 507, 799, 841
- Small Co-operative Enterprises Scheme (SCOPE), 841
- Small Claims Tribunals, 661, 936
- Smelters see Aluminium
- Smoking (see also Tobacco), 159–160
- SMPS see Supplementary Minimum Prices Scheme
- Snow, 21
- Social Advisory Council, 353
- Social Credit Political League, 924, 1023–1032
- Social welfare
- benefits see Benefits
- Department of see Department of Social Welfare
- system, 186–190
- Social work, 103, 175, 198–199
- Social workers, voluntary, 171
- Soft drinks, 511, 517
- Soils
- conservation of, 324, 331, 333, 732
- erosion of, 323, 333, 459
- Solar energy, 558
- Solo parents, 121, 198, 739
- South-east Asia
- assistance to, 42, 247, 333–334
- defence agreements with, 314, 315, 320
- South Pacific, relations with, 34, 36, 610
- South Pacific Bureau for Economic Co-operation (SPEC), 43, 912
- South Pacific Commission, 35–36, 43
- South Pacific Forum, 35–36, 363, 609–610, 657
- South Pacific Regional Trade and Economic Co-operation Agreement (SPARTECA), 657
- Soviet Union, relations with, 32
- Special Character Zones, 326
- Special education, 223–225
- Special-purpose authorities, 59–60
- Special work, 839–841
- Spirits see Alcohol
- Sports see Recreation and sport
- Squid, 474–476, 478–479, 480–482
- exports, 609
- Stamp duty, 742
- Stamps, postal, 403
- Standard International Trade Classification (SITC), 613, 621, 627
- Standard of living, international indicators, 921
- Standard Tertiary Bursary see Tertiary Study Grants
- Standards Association of New Zealand, 507, 917
- Standards Council, 917
- State coal mines, 490, 725
- State forests see New Zealand Forest Service
- State highways see Highways
- State Insurance Office, 827
- State Services, 885–886, 947
- composition of, 939
- State Services Commission, 948–950
- State wards, 201
- Statistical areas, 71
- Statistical divisions, 71–73, 79
- Statistics, Department of see Department of Statistics
- Statutes see Legislation
- Statutory bodies, boards, and committees, listed, 950–954
- Steel, 502, 504, 514, 519
- exports, 625, 626, 629, 1013
- imports, 643, 646, 647, 649, 651
- Stewart Island, 6
- Still births, 126, 130–131
- Stock and station agents, 787
- Stock exchange, 622, 723, 797, 816
- Stone fruit, 437, 443–444
- Storage see Census of Transport, Storage and Communication
- Strikes see Work stoppages
- Students
- disabled, 223–225
- Maori, 228, 229
- overseas see Overseas students
- part-time, 220, 239, 243
- at private primary schools, 228
- probable destinations of, 229
- projected numbers of, 221–222
- school, ages of, 227, 228
- at Teachers Colleges, 232–233
- in technical education, 243
- university, 236–239
- Studentships, 233
- Subsidies, 920
- Sugar, 658
- Suicide, 137, 143, 184
- Sulphur, 487, 495
- Sunshine, 22
- Superannuation (see also Government Superannuation Fund; National Provident Fund; National Superannuation), 208
- Superphosphate, 430
- Supplementary Minimum Prices Scheme (SMPS), 428, 433
- Surveys, land, 343–344
T
- TAB see Totalisator Agency Board
- Tallow, 625, 626, 685–686
- exports, 637, 971–972
- Tanning (see also Leather), 628, 643
- Tariff see Customs tariff and revenue
- Taxation, Public Account, (see also Taxes), 735–737, 744
- Taxation Review Authority, 744
- Taxes (see also Departure tax; Estate duties; Excess retention tax; Excise tax; Gift duty; Land tax; PAYE tax; Sales tax; Stamp duty)
- for companies, 741–742
- for New Zealanders, 737
- for visitors and non-residents, 740–742
- Te Kohanga Reo programme, 101–102, 226
- Tea, 685
- Teachers, 220–221, 221
- kindergarten see Kindergarten teachers
- primary see Primary teachers
- secondary see Secondary teachers
- training of see Teachers' colleges
- Teachers' colleges, 232–233, 963
- Technical education, 223, 241–244, 963
- Technical institutes, 241–242
- Technology see Applied Technology Programme; Patents; Research
- Telecommunications (see also Post Office; Satellites), 404–407
- Telegrams see Telegraph services
- Telegraph services, 405–406, 407
- Telephones, 404, 406
- Television, 268–269
- licenses, 270
- Telex, 405, 406
- Temperature, 21
- Terms of Trade Index, 248, 678, 718, 964
- Territorial authorities (see also Boroughs; City councils; County councils; District councils; Town councils), 758–759
- Territorial Forces (Army), 318
- Territories, New Zealand, 3
- Tertiary Study Grants, 235–236
- Textiles, (see also Cotton; Wool), 503–504
- production, 512, 517, 518, 524, 526, 527
- THC see Tourist Hotel Corporation
- Theft, 293, 296, 302
- Thermal activity see Seismic activity
- Thermal generation, 550, 562
- Thunderstorms, 20
- Timber (see also Forestry; Timber Preservation Authority)
- production of, 461–463, 462, 967
- products (see also Fibreboard; Particle board; Plywood; Pulp and paper; Veneer; Wood-chips), 463–466
- exports of, 463, 466–468, 1013
- imports of, 467–468
- Timber Preservation Authority, 466
- Time, 925
- Tin, recycling of, 506
- Tobacco (see also Cigarettes; Smoking), 417, 418, 447, 511, 517,
- exports, 627
- imports, 642, 645, 649, 650, 652, 653
- Tokelau, 34, 35, 89, 910–913
- Toll calls, 405
- Tomatoes, 441, 442
- Topdressing, 400–401, 430–431
- Totalisator Agency Board (TAB), 277–278
- Tourism (see also Immigration), 280–286
- Tourist and Publicity Department, 286, 945
- Tourist Hotel Corporation, 286, 731, 752
- Town districts, 5, 76, 350–351, 760
- Town councils, 349
- Town milk supply, 417–418, 420, 422, 448, 588
- Tractors, 387, 433
- Trade and Industry, Department of see Department of Trade and Industry
- Trade
- domestic see Domestic trade
- external see External trade
- terms of see Terms of Trade Index
- Trade practices see Commercial practices
- Trade Promotion Council, 620
- Trade representatives overseas, 620, 954–957
- Trade unions, 873–875, 876–877, 878
- Trade training see Apprentices; Technical education; Trades Certification Board; Vocational Training Council
- Trades Certification Board, 242, 244, 842
- Trademarks, 916
- Trading banks, 773–777
- Traffic
- accidents, 389–390, 899
- offences, 295–296, 392–393
- safety see Road safety
- Training see Agricultural Training Council; Trade training; Vocational Training Council
- Transport
- air see Aviation
- household expenditure on, 682
- ministry of, see Ministry of Transport
- rail see Railways
- road see Road transport
- sea see Shipping
- to work (see also Carpooling), 388
- Trawling see Fishing
- Treasury, 947
- Treaties see ANZUS; Foreign policy; Treaty of Waitangi
- Treaty of Waitangi, 28, 66, 104, 737
- Trial Courts, 291–293
- Tribunals, administrative, 938
- Triplets see Multiple births
- Trout, 10, 276, 482
- Trust Account, 726, 734
- Trustee savings banks, 785–786
- Tu Tangata programme, 101
- Tungsten, 486, 494
- Tunnels, 374
- Twins see Multiple births
- Tyres and tubes see Rubber and rubber products
U
- UNCTAD see United Nations Committee on Trade and Development
- UNDP see United Nations Development Programme
- Unemployment (see also Employment; Labour force; Redundancy), 834–838, 837, 1009
- benefits, 194, 835, 1009
- UNESCO see United Nations Education, Scientific and Cultural Organisation
- Unions see Trade unions
- United Councils, 60–61, 64, 326, 755, 760
- United Kingdom, relations with, 609–610
- United Nations, New Zealand membership of, 38–41
- United Nations Committee on Trade and Development (UNCTAD), 657
- United Nations Convention on the Elimination of All Forms of Discrimination Against Women, 119
- United Nations Development Programme (UNDP), 36, 39
- United Nations Education, Scientific and Cultural Organisation (UNESCO), 40
- United Nations High Commissioner for Refugees (UNHCR), 39
- United Nations Relief and Works Agency (UNRWA), 39
- United States of America, relations with (see also North America), 37
- Universities, 234–235
- entrance examinations for see University Entrance
- extension programme, 245
- graduates from, 166, 240
- overseas see Overseas students
- scholarships and bursaries to, 235–236, 238
- staff in, 220, 240–241
- students in, 219, 236–239, 963
- University Entrance, 98, 222–223
- Uranium, 494
- Urban areas, 71–73, 79, 82, 537
- Urban drift see Urban population
- Urban population, growth of, 79–81
- Urban renewal, 809–810
- Urban Residential Property and Section Price Index, 540–541
- Urban transport, 394, 756, 757–758, 844
V
- Valuation Department, 349–351, 947
- Valuation of land, 349–351
- Valuers, registration of, 351
- Values Party, 924
- Veal
- consumption, 684
- exports, 576–577, 623, 625, 632, 633, 686, 970, 1012
- production, 422, 433
- Vegetables (see also Canned fruit and vegetables; individual vegetables; Oils), 441
- Veneer (wood), 466
- Vineyards see Winemaking
- Violent crime see Crime
- Vital statistics, 123, 125, 962
- Vocational guidance, 234, 838–840
- Vocational Training Council, 841–842
- Volcanoes, 6, 12, 14, 15, 250
- Volume Index of External Trade, 618–619
- Voluntary Agency Support Scheme (VASS), 41
- Volunteer Service Abroad, (VSA), 41
- Volunteers, social work, 171
- Voting see Elections
- VSA see Volunteer Service Abroad
W
- Wage freeze, 857–858
- Wages (see also Effective Weekly Wage Rates Index; Prevailing Weekly Wage Rates Index; Real Disposable Income measures; Wage freeze), 856–860, 870
- Waitangi, Treaty of see Treaty of Waitangi
- Walkways, 277, 343
- War bursaries, 205, 238
- War pensions and allowances, 203–207
- War veterans 197, 204, 205–206
- allowances see War pensions and allowances
- Water (see also Fluoridation; Regional water boards), 331–333
- pollution, 330, 334, 372
- safety see Drowning; New Zealand Water Safety Council
- Water Resources Council, 334
- Waterfront industry, 372, 886–887
- WEA see New Zealand Workers Educational Association
- Weather (see also Climate) 17, 23–26
- Weights and measures, viii, 915
- Welfare organisations, 171, 542
- Western Europe, relations with, 32
- Western Samoa
- immigrants from, 115–117, 281
- New Zealand's relationship with, 34–36, 42, 610
- Wetlands, 323
- Whales and whaling, 27, 913, 975, 993
- Wheat (see also New Zealand Wheat Board; Wheat Research Committee), 438, 966
- Wheat Research Committee, 438
- Whey, 421
- Whitebait, 482
- Wholesale trade (see also Retail trade), 592, 596–597, 1011
- Widows, 146, 189–191
- benefits for, 192, 1009
- Wigs, 169
- Wildlife management reserves, 341
- Wildlife refuges, 341
- Wildlife reserves, 341
- Wildlife sanctuaries, 341
- Wildlife Service see Department of Internal Affairs Winds, 17–18
- Wine (see also Grapes; Winemaking), 446
- Winemaking, 444–446, 511, 517, 649, 922
- Women (see also Abortion; Marriage; Mothers; Widows)
- depression in, 179
- charged in court, 296
- death rate of, 133
- discrimination against, 119, 915, 949
- government bodies advising on, 119–122
- incomes of, 108, 767–768
- in the labour force, 767, 851–854, 831, 834
- as local authority officials, 63
- Maori, 103
- members of Parliament, 53
- Ministry for Women's Affairs, 54
- ratio in population, 81
- smokers, 159–160
- unemployed, 834–835
- United Nations Decade for, 39
- Women's Advisory Committee of the Vocational Training Council, 120
- Women's Appointment File, 120
- Wood preservation see Timber Preservation Authority
- Wood products see Timber, products
- Wood pulp see Pulp and paper
- Wood-chips, 463
- Wool (see also International Wool Secretariat; New Zealand Wool Board; Wool Research Organisation; Wool Testing Authority), 425
- exports, 425–426, 970, 1013
- prices, 425, 428, 586–587, 967
- production, 424–425, 967
- Wool Research Organisation, 427
- Wool Testing Authority, 427
- Work stoppages, 879–882, 880, 965
- Working conditions (see also Occupational health; Working hours), 883–886
- Working hours, 883
- Working life expectancies, 854–855
- Works and Development, Ministry of see Ministry of Works and Development
- World Bank (see also International Bank for Reconstruction and Development), 40, 41, 239, 563, 798
- World Health Organisation (WHO), 40, 139, 141, 161, 899
- World population, 92
- Wrecks, 371–372
X
- X-ray services, 167
Y
- Youth hostels, 275
- Youth Initiatives Fund, 276
- Youth Services Distribution Committee, 276
Z
- Zinc, 494
- P. D. HASSELBERG, GOVERNMENT PRINTER, WELLINGTON, NEW ZEALAND—1984